FISH WASTE MANAGEMENT BY CONVERSION INTO HETEROTROPHIC BACTERIA BIOMASS

Welcome message from author
This document is posted to help you gain knowledge. Please leave a comment to let me know what you think about it! Share it to your friends and learn new things together.
Transcript
FISH WASTE MANAGEMENT BY CONVERSION
INTO HETEROTROPHIC BACTERIA BIOMASS
2
Promotor Prof. Dr. Johan A.J. Verreth Hoogleraar in de Aquacultuur en Visserij Wageningen Universiteit Co-Promotor Dr. Vicky Sereti Universitair Docent, Leerstoelgroep Aquacultuur en Visserij, Wageningen Universiteit Promotiecommissie Prof. Dr. Ir. Jules B. van Lier (Wageningen Univeristeit) Prof. Dr. Marten Scheffer (Wageningen Universiteit) Prof. Dr. Ir. Peter Bossier (Ghent University, Belgium) Prof. Dr. Dr. h.c. mult. Harald Rosenthal (Kiel University, Germany)
Dit onderzoek is uitgevoerd binnen de onderzoekschool Wageningen Institute of Animal Sciences (WIAS)
3
FISH WASTE MANAGEMENT BY CONVERSION
INTO HETEROTROPHIC BACTERIA BIOMASS
Oliver Schneider
Proefschrift
Ter verkrijging van de graad van doctor
op gezag van de rector magnificus
van Wageningen Universiteit
Prof. dr. M. J. Kropff
in het openbaar te verdedigen
op woensdag 24 mei 2006
des namiddags te vier uur in de Aula
4
Schneider, O. Fish waste management by conversion into heterotrophic bacteria biomass PhD Thesis, Wageningen University, The Netherlands With ref.- With summary in English, and Dutch ISBN: 90-8504-413-8

5
������������

6
7
Contents
CHAPTER 1 INTRODUCTION 9
CHAPTER 2 ANALYSIS OF NUTRIENT FLOWS IN INTEGRATED INTENSIVE AQUACULTURE SYSTEMS 19
CHAPTER 3 HETEROTROPHIC BACTERIA PRODUCTION UTILIZING THE DRUM FILTER EFFLUENT OF A RAS: INFLUENCE OF CARBON SUPPLEMENTATION AND HRT 39
CHAPTER 4 TAN AND NITRATE YIELD SIMILAR HETEROTROPHIC BACTERIA PRODUCTION ON SOLID FISH WASTE UNDER PRACTICAL RAS CONDITIONS 57
CHAPTER 5 MOLASSES AS C SOURCE FOR HETEROTROPHIC BACTERIA PRODUCTION ON SOLID FISH WASTE 69
CHAPTER 6 HRT AND NUTRIENTS AFFECT BACTERIAL COMMUNITIES GROWN ON RECIRCULATION AQUACULTURE SYSTEM EFFLUENTS 85
CHAPTER 7 BACTERIA OR COMMERCIAL DIET: THE PREFERENCES OF LITOPENAEUS VANNAMEI 103
CHAPTER 8 KINETICS, DESIGN AND BIOMASS PRODUCTION OF A BACTERIA REACTOR TREATING RAS EFFLUENT STREAMS 111
CHAPTER 9 DISCUSSION 129
REFERENCES 137
SUMMARY 146
SAMENVATTING 150
ACKNOWLEDGEMENTS 154
LIST OF PUBLICATIONS 156
TRAINING AND SUPERVISION PLAN 158
ABOUT THE AUTHOR 160

8
9
Chapter 1
Introduction
Wherever animals are kept, waste is produced. Waste is basically the difference
between the feed intake and weight gain plus other productions, such as milk. Waste
production depends on species, breed, animal size, feed composition, nutrient availability,
husbandry system and other factors (Kim et al., 1998; Eding and van Weerd, 1999; Lupatsch
et al., 2001; Burton and Turner, 2003, Jongbloed and Kemme, 2005; Kemme et al., 2005).
The waste, which is formed by non-retained nutrients, is excreted either as faecal or as non-
faecal losses. Faecal losses are basically the non-absorbed nutrients and non-faecal losses the
metabolites, which are excreted by the animal. The waste production can be quantified by
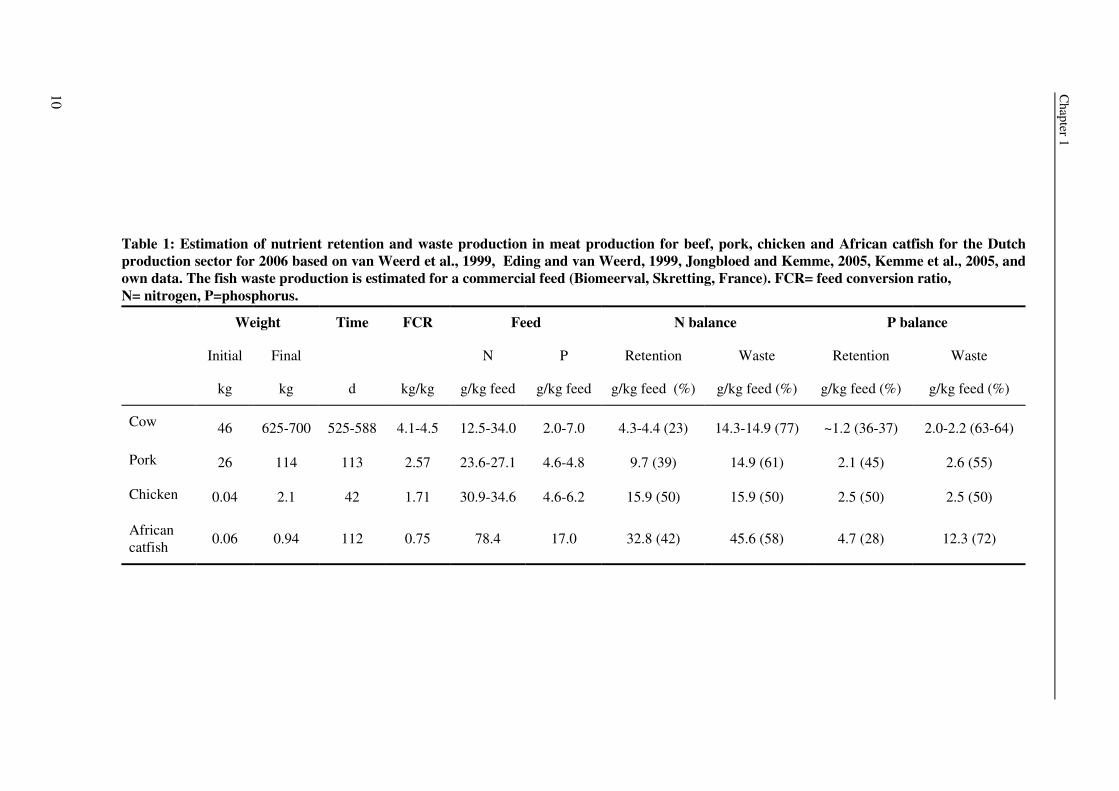
nutrient balances, which present the fractions of retained and non-retained nutrients. Table 1
gives an example for the Dutch farming industry for nitrogen (N) and phosphorus (P), which
are two important nutrients wasted by the animal. Fish, e.g. African catfish, and chicken are
more efficient in retaining N than cows and pigs. However African catfish is less effective in
P retention than pig or chicken. Other fish species, which are less efficient in N and P
retention, such as sea bream, will produce even more non-faecal losses per kg feed (Lupatsch
and Kissil, 1998; Eding and van Weerd, 1999). Such comparisons, however, are always
limited by the factors mentioned above.
Land animal’s faecal and non-faecal losses account for more than 93 Mio. MT N and
21 Mio MT P per year (Sheldrick et al., 2003). Aquaculture waste production can hardly be
estimated, because of the high variety of aquaculture systems, such as ponds, flow through
systems, cages, and recirculation aquaculture systems (RAS), and of fish species, such as
herbivore, omnivore, carnivore, and of the different types of feed used, such as natural
production, agriculture by-products, trash fish, high energy pellets, low protein feeds, and
animal or human waste. Estimations are, therefore, limited to well observed sectors, such as
the production of African catfish in the Netherlands in RAS. The waste production can be
projected with 130MT N and 36MT P for 2005 for a production of 3900MT fish and a waste
production based on Table 1.
Chapter 1
10
Waste
g/kg feed (%)
2.0-2.2 (63-64)
2.6 (55)
2.5 (50)
12.3 (72)
P balance
Retention
g/kg feed (%)
~1.2 (36-37)
2.1 (45)
2.5 (50)
4.7 (28)
Waste
g/kg feed (%)
14.3-14.9 (77)
14.9 (61)
15.9 (50)
45.6 (58)
N balance
Retention
g/kg feed (%)
4.3-4.4 (23)
9.7 (39)
15.9 (50)
32.8 (42)
P
g/kg feed
2.0-7.0
4.6-4.8
4.6-6.2
17.0
Feed
N
g/kg feed
12.5-34.0
23.6-27.1
30.9-34.6
78.4
FCR
kg/kg
4.1-4.5
2.57
1.71
0.75
Time
d
525-588
113
42
112
Final
kg
625-700
114
2.1
0.94
Weight
Initial
kg
46
26
0.04
0.06
Table 1: Estimation of nutrient retention and waste production in meat production for beef, pork, chicken and African catfish for the Dutch production sector for 2006 based on van Weerd et al., 1999, Eding and van Weerd, 1999, Jongbloed and Kemme, 2005, Kemme et al., 2005, and own data. The fish waste production is estimated for a commercial feed (Biomeerval, Skretting, France). FCR= feed conversion ratio, N= nitrogen, P=phosphorus.
Cow
Pork
Chicken
African catfish
Introduction
11
Animal waste: Hazard or valuable resource Waste produced by land animals can be divided into two classes: gaseous losses and
manure. Gaseous waste typically consists of ammonia, carbon dioxide, hydrogen sulphite,
dinitrous oxide, organic compounds, such as methane, and others emissions (Burton and
Turner, 2003). These gases are either released directly to the atmosphere or treated by e.g.
chemical scrubbing, absorption and biological methods (Melse and Mol, 2004; Sheridan et al.,
2002; Rappert and Mueller, 2005). Gaseous wastes contribute to the green house effect.
Methane emissions of ruminants and animal waste were estimated with 16-20% of the global
emission. CO2 emission of the total agricultural sector was expected to be 5% and N2O >50%
(Wuebbles and Hayhoe, 2002, Tamminga, 2003).
Manure can be subdivided into two categories: slurry (liquid manure) and solid
manure (Table 2). Slurry or liquid manure is a mixture of animal dung, urine, water and
liquids drained from the solid manure. Solid manure is typically a mixture of animal excreta
and beddings. The composition of the manure is next to animal related factors, highly
depending on the husbandry and manure collection systems and the applied bedding (Petersen
et al., 1998, Zahn et al., 2001; Burton and Turner, 2003). Similar to gaseous waste these
liquid or solid waste fractions can result in environmental damage. Solid or dissolved N, P
and potassium emissions lead to environmental pollution and eutrophication (Tamminga,
2003; Ekholm et al., 2005; Oenema et al., 2005).
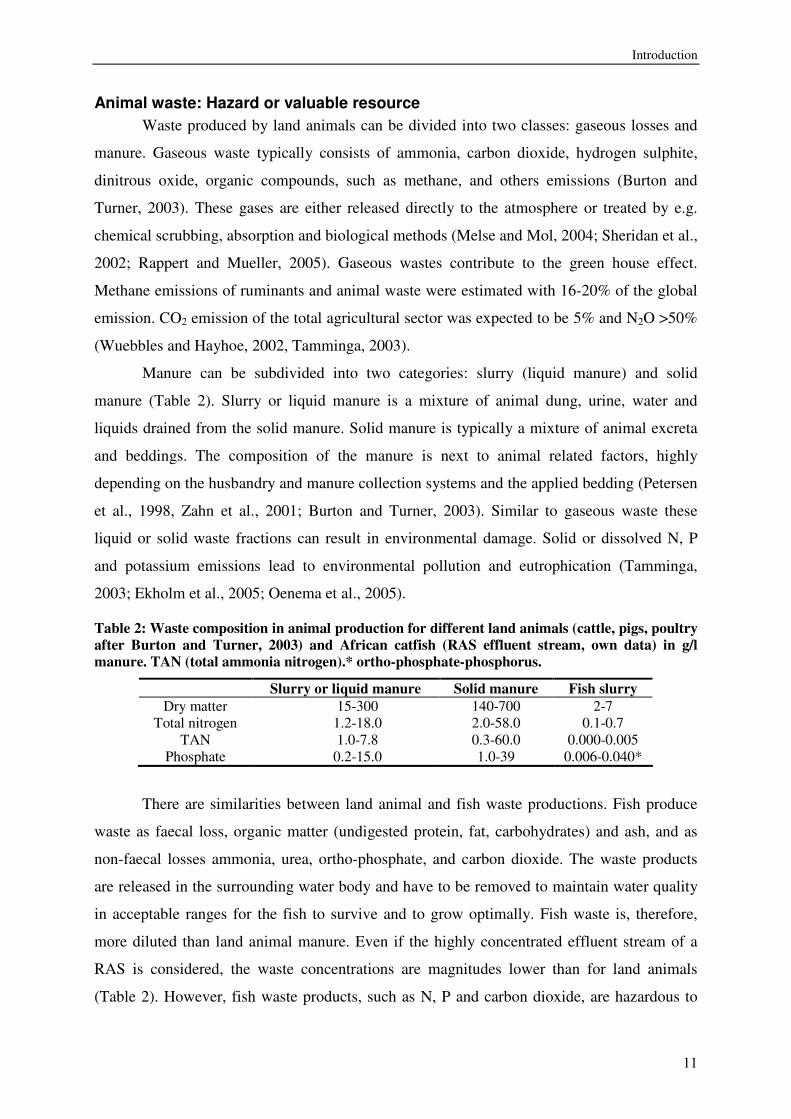
Table 2: Waste composition in animal production for different land animals (cattle, pigs, poultry after Burton and Turner, 2003) and African catfish (RAS effluent stream, own data) in g/l manure. TAN (total ammonia nitrogen).* ortho-phosphate-phosphorus.
Slurry or liquid manure Solid manure Fish slurry Dry matter 15-300 140-700 2-7
Total nitrogen 1.2-18.0 2.0-58.0 0.1-0.7 TAN 1.0-7.8 0.3-60.0 0.000-0.005
Phosphate 0.2-15.0 1.0-39 0.006-0.040*
There are similarities between land animal and fish waste productions. Fish produce
waste as faecal loss, organic matter (undigested protein, fat, carbohydrates) and ash, and as
non-faecal losses ammonia, urea, ortho-phosphate, and carbon dioxide. The waste products
are released in the surrounding water body and have to be removed to maintain water quality
in acceptable ranges for the fish to survive and to grow optimally. Fish waste is, therefore,
more diluted than land animal manure. Even if the highly concentrated effluent stream of a
RAS is considered, the waste concentrations are magnitudes lower than for land animals
(Table 2). However, fish waste products, such as N, P and carbon dioxide, are hazardous to
Chapter 1
12
the fish, if they are not removed, and a risk to the environment (eutrophication and
greenhouse effect), if they are released. There are different options to manage problems of
land animal waste production, either to limit waste production by nutritional improvements or
to manage the resulting waste. Nutritional improvements might minimize waste production
(Hof et al., 1997; Jongbloed and Lenis, 1998). These improvements are limited. Ruminants,
for example, emit about 85% of their total methane production due to their maintenance
requirements. That means not feed improvements alone, but the reduction of ruminant
numbers would lead to emission reductions (Tamminga, 2003). Waste management might
minimize waste discharge to the environment, such as manure land application as fertilizer.
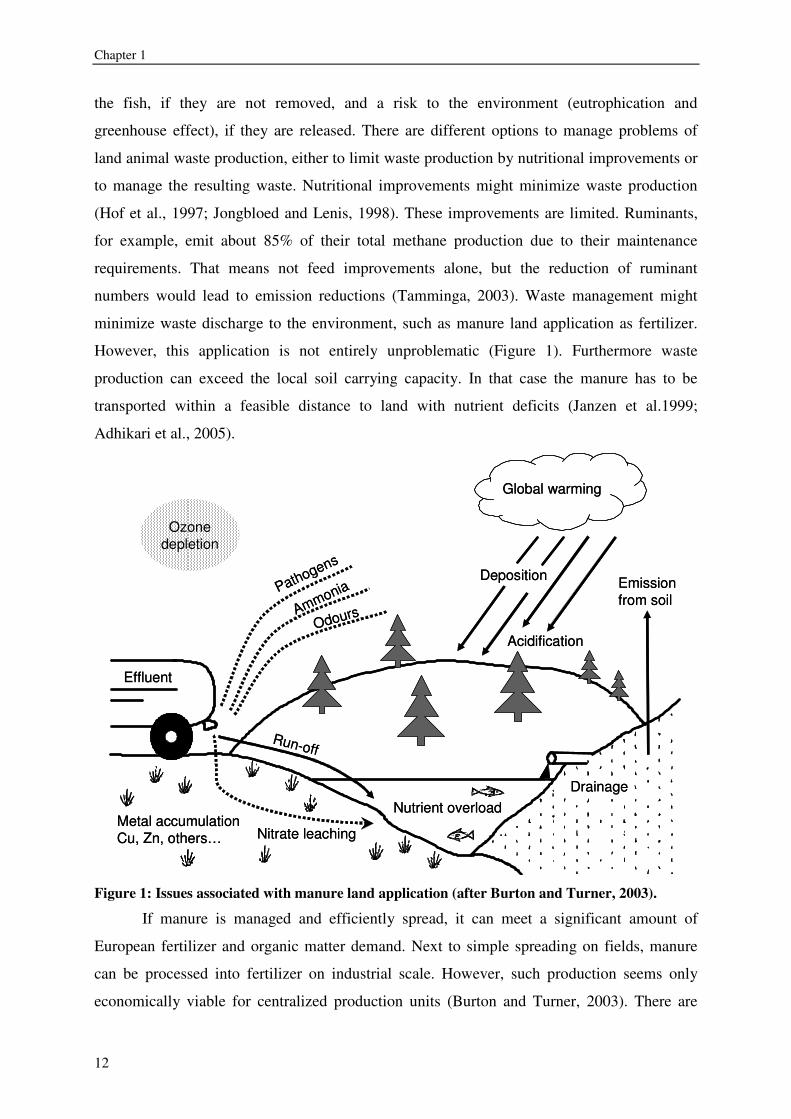
However, this application is not entirely unproblematic (Figure 1). Furthermore waste
production can exceed the local soil carrying capacity. In that case the manure has to be
transported within a feasible distance to land with nutrient deficits (Janzen et al.1999;
Adhikari et al., 2005).
Ozonedepletion
Metal accumulationCu, Zn, others… Nitrate leaching
Run-off
Nutrient overloadDrainage
Emissionfrom soil
Acidification
Deposition
Global warming
Pathogens
Ammonia
Odours
Effluent
Ozonedepletion
Metal accumulationCu, Zn, others… Nitrate leaching
Run-off
Nutrient overloadDrainage
Emissionfrom soil
Acidification
Deposition
Global warming
Pathogens
Ammonia
Odours
Effluent
Figure 1: Issues associated with manure land application (after Burton and Turner, 2003).
If manure is managed and efficiently spread, it can meet a significant amount of
European fertilizer and organic matter demand. Next to simple spreading on fields, manure
can be processed into fertilizer on industrial scale. However, such production seems only
economically viable for centralized production units (Burton and Turner, 2003). There are
Introduction
13
different possibilities to treat or manage manure: mixing (to obtain a homogenized material,
to allow for easy spreading), separation of coarse solids and liquids (to allow for a better
fermentation of the solid fraction, and an easier spreading and penetrating of the liquid
fraction during field applications), aerobic treatment (to reduce in ammonia, pathogens and
odors) or anaerobic treatment (to produce e.g. biogas) and composting (to condition soil).
Applying these methods changes manure treatment to management: from
discharge/destruction or basic applications to re-cycle and re-use.
In aquaculture, similar problems exist, nowadays, as in land animal manure
management. In the past, aquaculture waste production was not an issue. In integrated pond
culture, fish are even the final sink for waste of land animals or humans. In such systems, a
complex food web (algae, bacteria and others) is converting the fish and waste from the
outside in fish feed (Li, 1986; Edwards, 1993; Kestemont, 1995). This loop is comparable to
waste application on land as fertilizer and re-using the resulting plants as feed source.
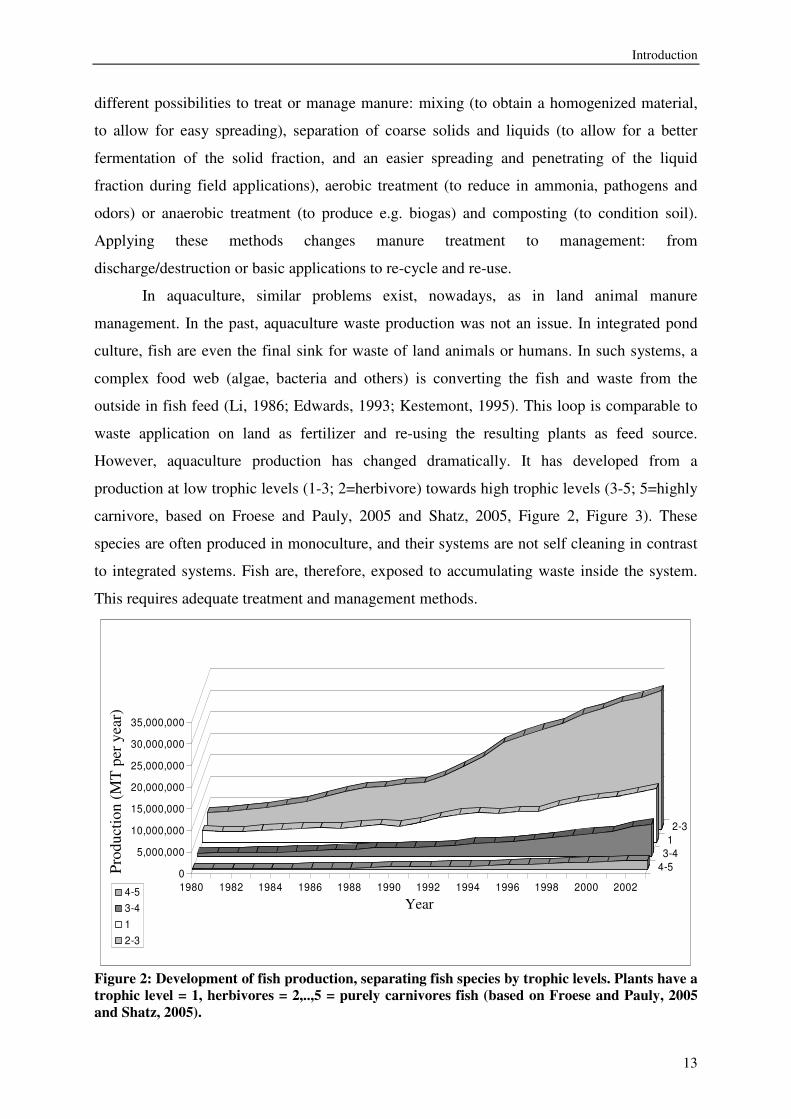
However, aquaculture production has changed dramatically. It has developed from a
production at low trophic levels (1-3; 2=herbivore) towards high trophic levels (3-5; 5=highly
carnivore, based on Froese and Pauly, 2005 and Shatz, 2005, Figure 2, Figure 3). These
species are often produced in monoculture, and their systems are not self cleaning in contrast
to integrated systems. Fish are, therefore, exposed to accumulating waste inside the system.
This requires adequate treatment and management methods.
0
5,000,000
10,000,000
15,000,000
20,000,000
25,000,000
30,000,000
35,000,000
Pro
duct
ion
(MT
per
year
)
1980 1982 1984 1986 1988 1990 1992 1994 1996 1998 2000 2002
4-53-412-3
Year4-53-412-3
Figure 2: Development of fish production, separating fish species by trophic levels. Plants have a trophic level = 1, herbivores = 2,..,5 = purely carnivores fish (based on Froese and Pauly, 2005 and Shatz, 2005).
Year
Prod
uctio
n (M
T p
er y
ear)
Chapter 1
14
52%
10%
2%
59%
14%
4%
0%
10%
20%
30%
40%
50%
60%
70%
80%
90%
100%
1980 2003
4-5
3-4
2-3
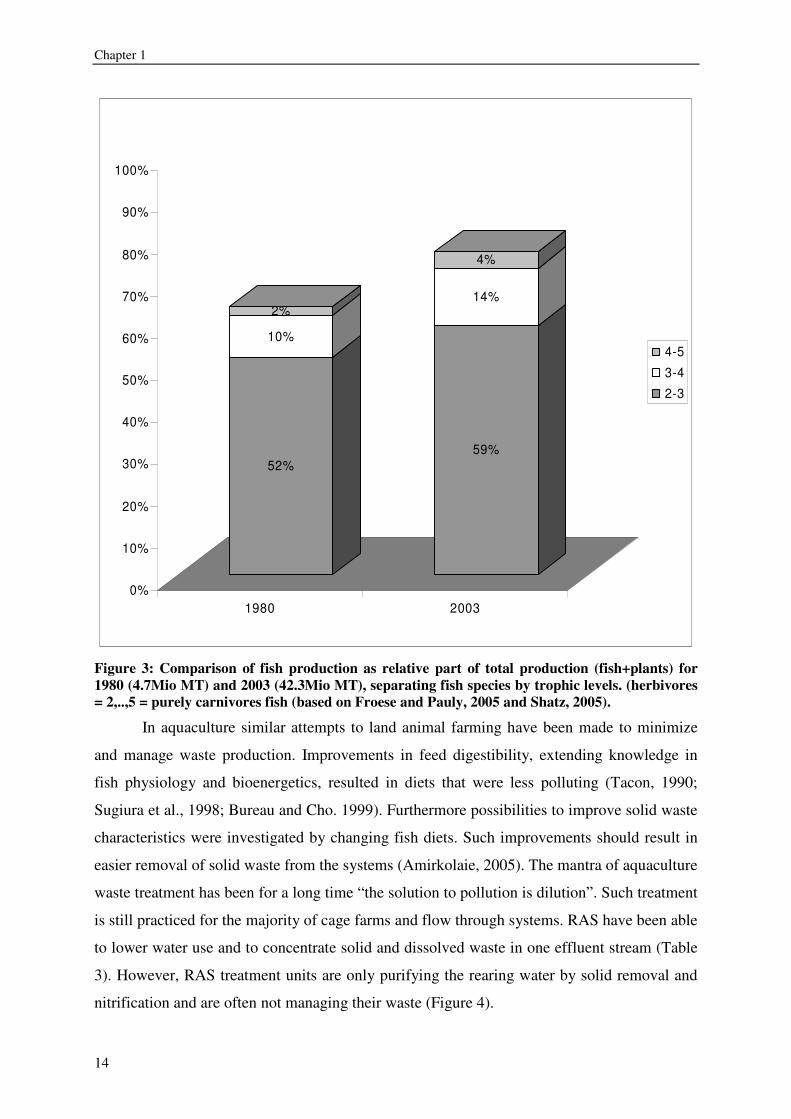
Figure 3: Comparison of fish production as relative part of total production (fish+plants) for 1980 (4.7Mio MT) and 2003 (42.3Mio MT), separating fish species by trophic levels. (herbivores = 2,..,5 = purely carnivores fish (based on Froese and Pauly, 2005 and Shatz, 2005).
In aquaculture similar attempts to land animal farming have been made to minimize
and manage waste production. Improvements in feed digestibility, extending knowledge in
fish physiology and bioenergetics, resulted in diets that were less polluting (Tacon, 1990;
Sugiura et al., 1998; Bureau and Cho. 1999). Furthermore possibilities to improve solid waste
characteristics were investigated by changing fish diets. Such improvements should result in
easier removal of solid waste from the systems (Amirkolaie, 2005). The mantra of aquaculture
waste treatment has been for a long time “the solution to pollution is dilution”. Such treatment
is still practiced for the majority of cage farms and flow through systems. RAS have been able
to lower water use and to concentrate solid and dissolved waste in one effluent stream (Table
3). However, RAS treatment units are only purifying the rearing water by solid removal and
nitrification and are often not managing their waste (Figure 4).
Introduction
15
Table 3: Water use, waste discharge, productivity and treatment approach of three different aquaculture production systems (after Verdegem et al., 1999; Schneider and Eding, 2001; Eding and Kamstra, 2002; Edwards, 2004, Verdegem et al. 2006).
System type Water use
Waste Discharge
Productivity
Treatment approach
(l/kg fish) (gCOD/kg fish) (MT/ha/year)
Pond 2000 286 10-15 Ecological
Flow-Through system
14500-210000 780 variable None
RAS 100-900 150 300-2500 Technical
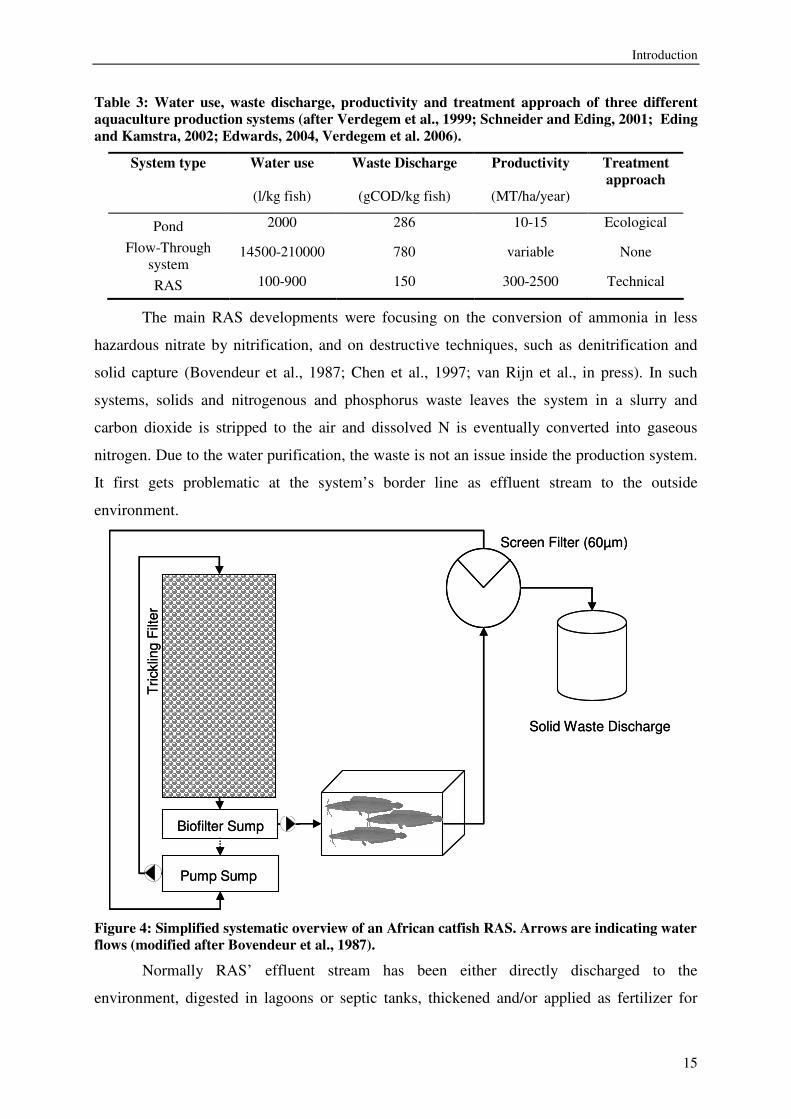
The main RAS developments were focusing on the conversion of ammonia in less
hazardous nitrate by nitrification, and on destructive techniques, such as denitrification and
solid capture (Bovendeur et al., 1987; Chen et al., 1997; van Rijn et al., in press). In such
systems, solids and nitrogenous and phosphorus waste leaves the system in a slurry and
carbon dioxide is stripped to the air and dissolved N is eventually converted into gaseous
nitrogen. Due to the water purification, the waste is not an issue inside the production system.
It first gets problematic at the system’s border line as effluent stream to the outside
environment.
Screen Filter (60µm)
Solid Waste Discharge
Pump Sump
Biofilter Sump
Tric
klin
g Fi
lter
Screen Filter (60µm)
Solid Waste Discharge
Pump Sump
Biofilter Sump
Tric
klin
g Fi
lter
Figure 4: Simplified systematic overview of an African catfish RAS. Arrows are indicating water flows (modified after Bovendeur et al., 1987).
Normally RAS’ effluent stream has been either directly discharged to the
environment, digested in lagoons or septic tanks, thickened and/or applied as fertilizer for
Chapter 1
16
land based agriculture (Chen et al., 1997; Losordo et al., 2003). These methods were
eventually combined with flocculation to minimize the waste volume (Kamstra et al., 2001;
Ebeling et al., 2003; Ebeling et al., 2005). Alternative re-use of the obtained solids, N and P,
in horticulture, for algae, or for biogas production were recently under investigation (Rakocy,
1998; Brune et al., 2003; Gebauer, 2004; Neori et al., 2004). These waste management
methods are comparable to land animal waste management. They all take place outside the
husbandry system and use partly the same methodology. However, alternatively waste cannot
only be treated but as well be managed and re-used inside the husbandry system. One method
is the waste conversion into bacteria biomass. This biomass can be reutilized as aquatic feed
source. Such processes are already applied in aquaculture, e.g. in integrated and activated
ponds, but not in RAS. In such ponds, waste conversion does not only improve pond water
quality but as well feed conversion ratios, because the produced bacteria biomass and other
phototrophic and heterotrophic proto- and metazoans contribute as food (Avnimelech et al.,
1989; Edwards, 1993; Burford et al., 2003; Hari et al., 2004). In RAS suspended bacteria
growth processes have been applied as activated sludge treatments for water purification only
(Knoesche and Tscheu, 1974; Meske, 1976). This system was not successful, since it affected
the overall RAS performance and was subsequently abandoned by the RAS industry. Yet, the
concept may still be valid if the overall RAS performance is not disturbed. If the high
productivity of a RAS, its low land and water use would be combined with waste conversion
in bacteria biomass and re-use as feed, then a system with potentially high sustainability
emerges. It is, therefore, needed to investigate bacteria production potential using RAS’
effluents as substrate. This would result in true waste management, under the condition that
the effluent stream is not only converted but the obtained bacteria biomass is re-usable as fish
feed. This would create a loop from the feed to the fish over waste and bacteria conversion
back to feed inside the culture system.
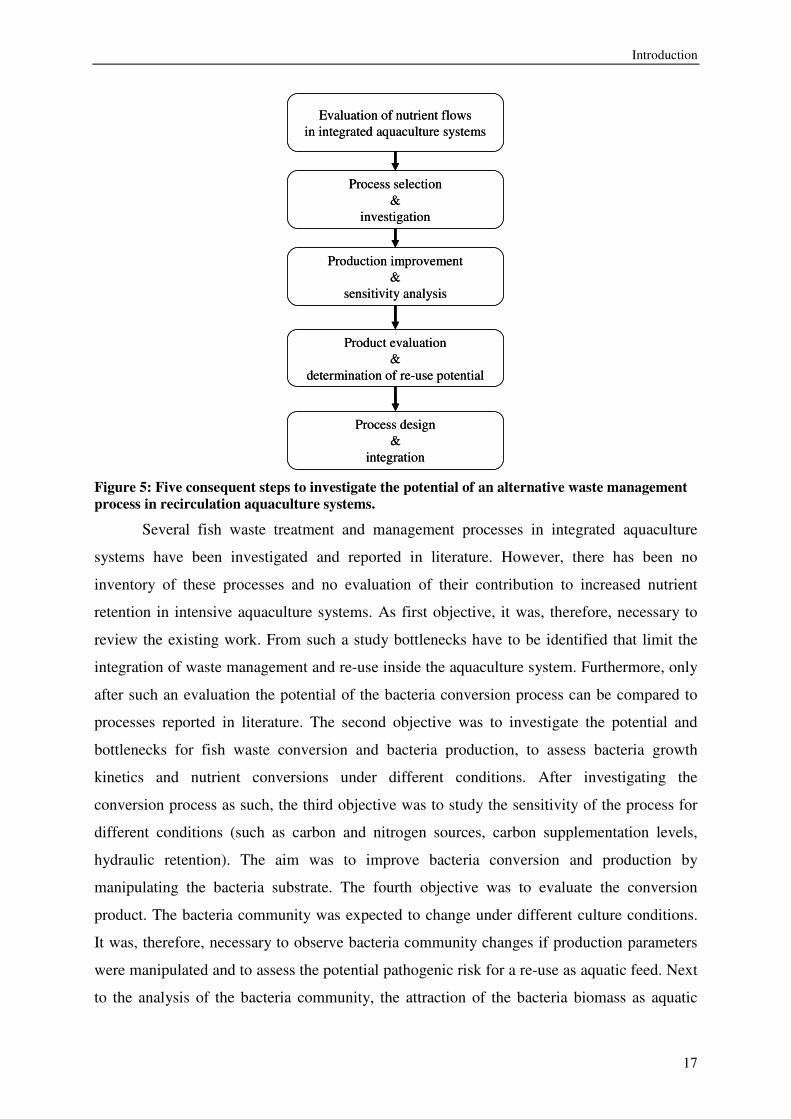
Study objectives The integration of such an alternative method to treat, manage and re-use fish waste
inside the culture system can be studied in five consequent steps (Figure 5). Based on this
procedure the study objectives were derived.
Introduction
17
Evaluation of nutrient flowsin integrated aquaculture systems
Production improvement&
sensitivity analysis
Product evaluation&
determination of re-use potential
Process design&
integration
Process selection&
investigation
Evaluation of nutrient flowsin integrated aquaculture systems
Production improvement&
sensitivity analysis
Product evaluation&
determination of re-use potential
Process design&
integration
Process selection&
investigation
Figure 5: Five consequent steps to investigate the potential of an alternative waste management process in recirculation aquaculture systems.
Several fish waste treatment and management processes in integrated aquaculture
systems have been investigated and reported in literature. However, there has been no
inventory of these processes and no evaluation of their contribution to increased nutrient
retention in intensive aquaculture systems. As first objective, it was, therefore, necessary to
review the existing work. From such a study bottlenecks have to be identified that limit the
integration of waste management and re-use inside the aquaculture system. Furthermore, only
after such an evaluation the potential of the bacteria conversion process can be compared to
processes reported in literature. The second objective was to investigate the potential and
bottlenecks for fish waste conversion and bacteria production, to assess bacteria growth
kinetics and nutrient conversions under different conditions. After investigating the
conversion process as such, the third objective was to study the sensitivity of the process for
different conditions (such as carbon and nitrogen sources, carbon supplementation levels,
hydraulic retention). The aim was to improve bacteria conversion and production by
manipulating the bacteria substrate. The fourth objective was to evaluate the conversion
product. The bacteria community was expected to change under different culture conditions.
It was, therefore, necessary to observe bacteria community changes if production parameters
were manipulated and to assess the potential pathogenic risk for a re-use as aquatic feed. Next
to the analysis of the bacteria community, the attraction of the bacteria biomass as aquatic
Chapter 1
18
feed had to be studied. If the produced biomass would have been not attractive as feed, its re-
use might be limited. The last objective focused on the integration of the experimental data
from the first four objectives to determine critical process variables and the design for a
bacteria reactor integrated in a fish farm.
Thesis Outline General study aim was to investigate the potential of heterotrophic bacteria production
integrated in a RAS to convert fish waste into bacteria biomass. This goal included that the
bacteria biomass should be re-used as aquatic feed. The study outcome should deliver
knowledge on waste conversion and management in intensive aquaculture systems in general
and specifically on the heterotrophic bacteria production, on nutrient conversion rates, on the
sensitivity of the process for various conditions, on the resulting bacteria community, on the
attractance of the bacteria as aquatic feed and on the reactor design characteristics. In chapter
2, several processes were inventoried and evaluated, which can be applied for waste
management inside intensive aquaculture systems. These processes convert waste released by
the fish into harvestable or directly re-used biomass. Nutrient conversions and system nutrient
retention were compared and the limitations of the different conversions discussed. This
discussion served as starting point for chapter 3. There, as selected conversion process
heterotrophic bacteria production was investigated for different carbon supplementation levels
and hydraulic retention times utilizing the drum filter effluent of a RAS as bacteria substrate.
To improve the obtained production rates and yields, the influence of ammonia and nitrate as
nitrogenous substrate on heterotrophic bacteria production were tested in chapter 4. To
investigate the effect of different carbon sources on bacteria production rates, in chapter 5,
experiments were reported using different molasses supplementation levels instead of the
model substance sodium acetate (chapter 3 and 4). In chapter 6 the re-use potential of the
produced bacteria biomass was investigated. The bacteria community obtained with the
reactor broth for various conditions and substrates was analyzed. In chapter 7 the re-use
potential was furthermore investigated by feeding the biomass to shrimps in a feed preference
test. In chapter 8, the reactor design for a 100MT African catfish farm and the related bacteria
kinetics were determined, based on the integration of experimental data obtained in earlier
studies.
19
Chapter 2
Analysis of nutrient flows in integrated intensive aquaculture
systems
Abstract This paper analyses nutrient conversions, which are taking place in integrated
intensive aquaculture systems. In these systems fish is cultured next to other organisms,
which are converting otherwise discharged nutrients into valuable products. These
conversions are analyzed based on nitrogen and phosphorous balances using a mass balance
approach. The analytical concept of this review comprises a hypothetical system design with
five modules: (1) the conversion of feed nutrients into fish biomass, the “Fish-Biomass-
Converter”; (2) the separation of solid and dissolved fish waste/ nutrients; the “Fish-Waste-
Processor”; (3) the conversion of dissolved fish waste/nutrients, the “Phototrophic-Herbivore-
Converter”; (4 and 5) the conversion of solid fish waste, the “Bacterial-Waste-Converter”, or
the “Detrivorous–Converter”. In the reviewed examples, fish culture alone retains 20-50%
feed N and 15-65% feed P. The combination of fish culture with phototrophic conversion
increases nutrient retention of feed nitrogen (N) by 15-50% and feed phosphorus (P) by up to
53%. If in addition herbivore consumption is included, nutrient retention decreases by 60-
85% feed N and 50-90% feed P. This is according to the general observation of nutrient losses
from one trophic level to the next. The conversion of nutrients into bacteria and detrivorous
worm biomass contributes only in smaller margins (e.g. 7% feed N and 6% feed P and 0.06%
feed N 0.03x10⁻³% feed P, respectively). All integrated modules have their specific
limitations, which are related to uptake kinetics, nutrient preference, unwanted conversion
processes and abiotic factors.
Schneider, O., V. Sereti, E. H. Eding, J. A. J. Verreth (2004). "Analysis of nutrient flows in integrated intensive aquaculture systems." Aquacultural Engineering 32(3/4): 379-401.
Chapter 2
20
Introduction Future development of the aquaculture industry is limited by resources, such as water,
land, fishmeal, and by other factors, such as environmental pollution (IWMI, 2000; Naylor et
al., 2000; Westers, 2000). Nitrogen (N) and phosphorus (P) are the two main pollutants of
intensive aquaculture (Hakanson et al., 1998; Lemarie et al., 1998). In contrast to cage, pen
and raceway systems both recirculation aquaculture systems (RAS) and integrated pond
systems allow to recycle parts of the non-retained nutrients. In RAS, these nutrients are partly
liberated from their organic matrix and either immobilized in bacterial biomass or volatized.
In integrated systems, nutrients are converted into harvestable products. These two systems
result in reduced waste discharge and resources use. RAS are mainly applied in the Western
hemisphere. They reuse water and are less competitive for land and water (Losordo, 1998).
Compared to an integrated pond system, RAS show relatively low retention of nutrients
within its production (Verdegem et al., 1999). Integrated pond systems are applied
traditionally in Asia. Their higher nutrient retention is a result of nutrient re-use by primary
and secondary producers (Liu and Cai, 1998). In an integrated pond system, however, fish
production is only 10-15 MT/ha (Edwards, 2004) compared to a RAS with a recalculated
production of 300-2500 MT/ha for turbot, eel, or African catfish (Eding and Kamstra, 2002).
Integrated pond systems and RAS comprise several nutrient conversion processes. In an
integrated pond system, waste serves as nutrient for phototrophic and
detrivorous/heterotrophic conversion into plants, bacteria, and invertebrates, on which
different fish are feeding (Li, 1986; Riise and Roose, 1997; Liu and Cai, 1998). In a RAS,
waste coming from the fish is processed into a solid and dissolved waste stream. These waste
streams are either directly discharged (solid waste flow), or converted into less harmful
products and volatilized by bacterial conversion (dissolved waste flow). The purified water is
subsequently recirculated (Bovendeur et al., 1987; Eding and van Weerd, 1999).
When the conversion processes of both systems are combined, a new intensive and
integrated production system emerges. From a theoretical point of view such intensive
integrated systems can be conceptualized as consisting of five different modules: (1) the
conversion of feed nutrient into fish biomass, the “Fish-Biomass-Converter”; (2) the
separation of solid and dissolved fish waste/nutrients; the “Fish-Waste-Processor”; (3) the
conversion of dissolved fish waste/nutrients, the “Phototrophic-Herbivore-Converter”; (4) &
(5) the conversion of solid fish waste, the “Bacterial-Waste-Converter”, or the “Detrivorous–
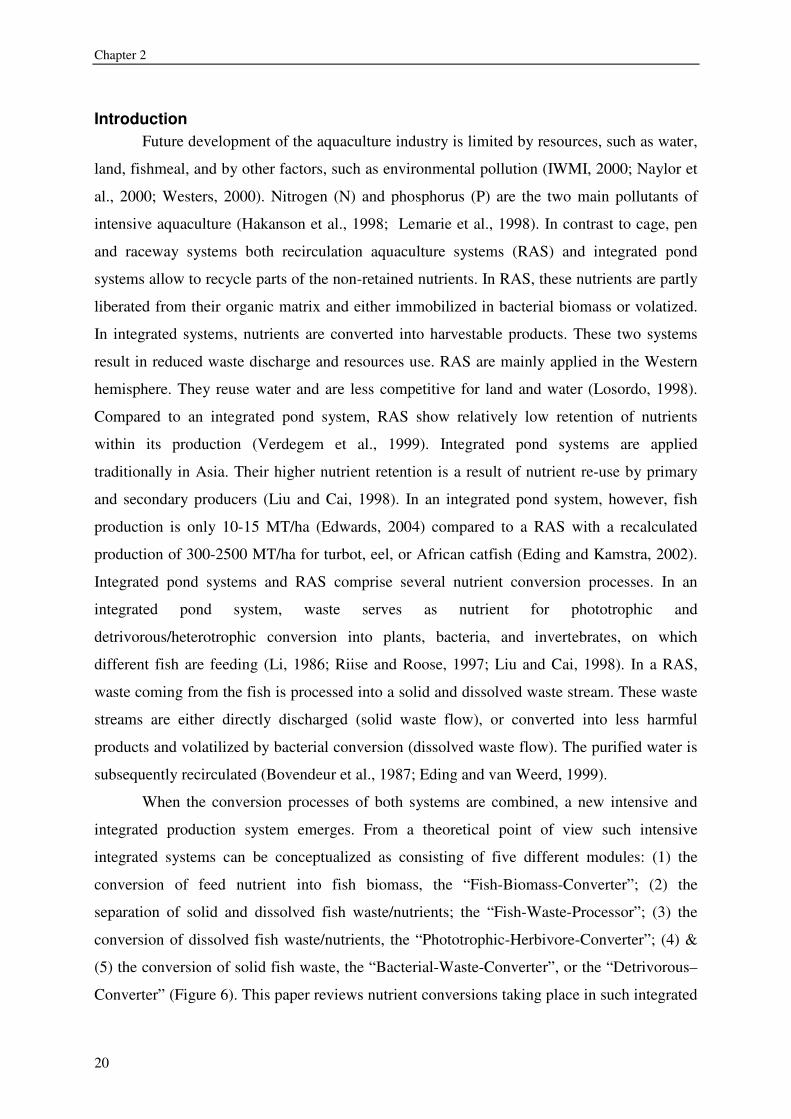
Converter” (Figure 6). This paper reviews nutrient conversions taking place in such integrated
Analysis of nutrient flows in integrated intensive aquaculture systems
21
modules for their N and P balances. It discusses furthermore constraints of intensive
integrated systems, based on the mentioned conceptual framework.
Fish-Biomass Converter
Fish-Waste Processor
Phototrophic Production
Bacteria-Waste Converter
Detrivorous Converter
Herbivore Converter
CO2
Feed
Harvest
Harvest
Fish-Biomass Converter
Fish-Waste Processor
Phototrophic Production
Bacteria-Waste Converter
Detrivorous Converter
Herbivore Converter
Fish-Biomass Converter
Fish-Waste Processor
Phototrophic Production
Bacteria-Waste Converter
Detrivorous Converter
Herbivore Converter
CO2
Feed
Harvest
Harvest
Figure 6: Simplified structure of the system concept illustrating macronutrient flows (N and P), and identifying the five modules of an integrated intensive aquaculture system. Solid lines are indicating nutrient flows in existing integrated intensive systems, dotted lines are representing potential nutrient flows in future recirculation system designs. Blocks represent processes in separate culture modules.
Methodology Existing examples of integrated intensive farming processes were analyzed in relation
to the introduced concept, which comprises five modules: Fish-Biomass-Converter, Fish-
Waste-Processor; Phototrophic-Herbivore-Converter, Bacterial-Waste-Converter, and
Detrivorous–Converter (Figure 6). The process division of an integrated intensive farming
system over these five modules allows examining each conversion process separately for its
characteristics. Furthermore, if nutrient flows are subsequently connected from one of these
modules to another one, overall system nutrient retention and balances can be estimated.
Chapter 2
22
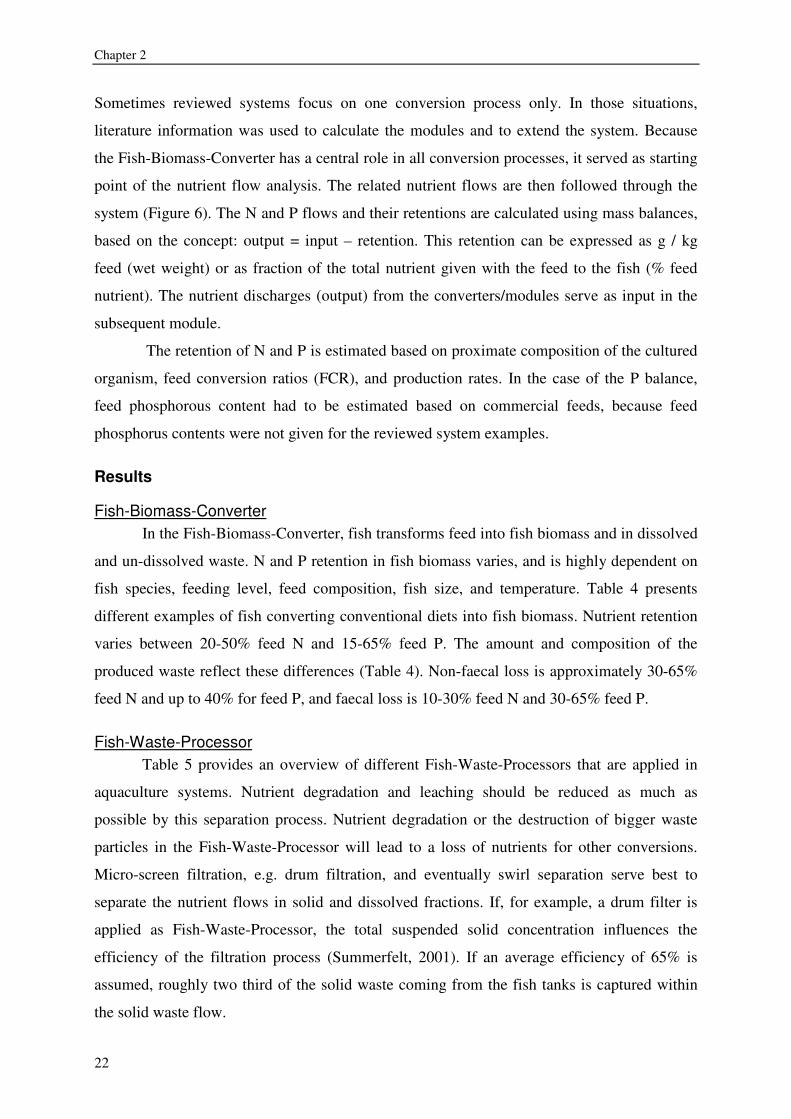
Sometimes reviewed systems focus on one conversion process only. In those situations,
literature information was used to calculate the modules and to extend the system. Because
the Fish-Biomass-Converter has a central role in all conversion processes, it served as starting
point of the nutrient flow analysis. The related nutrient flows are then followed through the
system (Figure 6). The N and P flows and their retentions are calculated using mass balances,
based on the concept: output = input – retention. This retention can be expressed as g / kg
feed (wet weight) or as fraction of the total nutrient given with the feed to the fish (% feed
nutrient). The nutrient discharges (output) from the converters/modules serve as input in the
subsequent module.
The retention of N and P is estimated based on proximate composition of the cultured
organism, feed conversion ratios (FCR), and production rates. In the case of the P balance,
feed phosphorous content had to be estimated based on commercial feeds, because feed
phosphorus contents were not given for the reviewed system examples.
Results
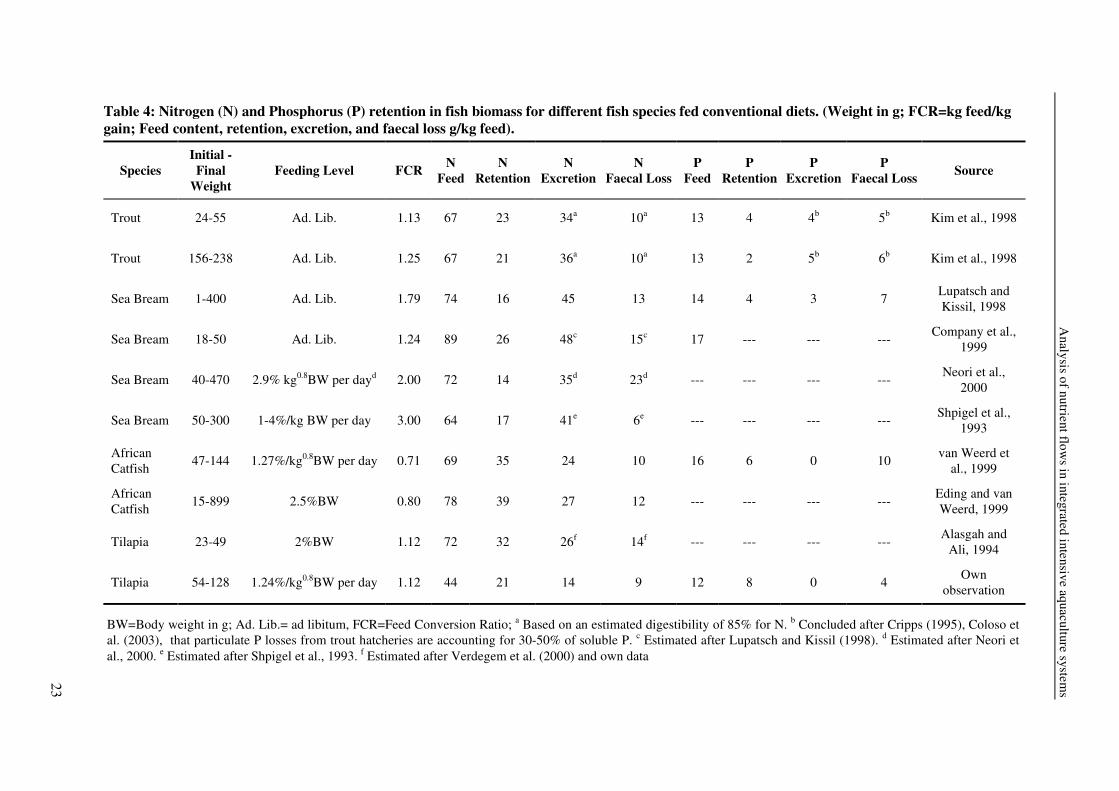
Fish-Biomass-Converter In the Fish-Biomass-Converter, fish transforms feed into fish biomass and in dissolved
and un-dissolved waste. N and P retention in fish biomass varies, and is highly dependent on
fish species, feeding level, feed composition, fish size, and temperature. Table 4 presents
different examples of fish converting conventional diets into fish biomass. Nutrient retention
varies between 20-50% feed N and 15-65% feed P. The amount and composition of the
produced waste reflect these differences (Table 4). Non-faecal loss is approximately 30-65%
feed N and up to 40% for feed P, and faecal loss is 10-30% feed N and 30-65% feed P.
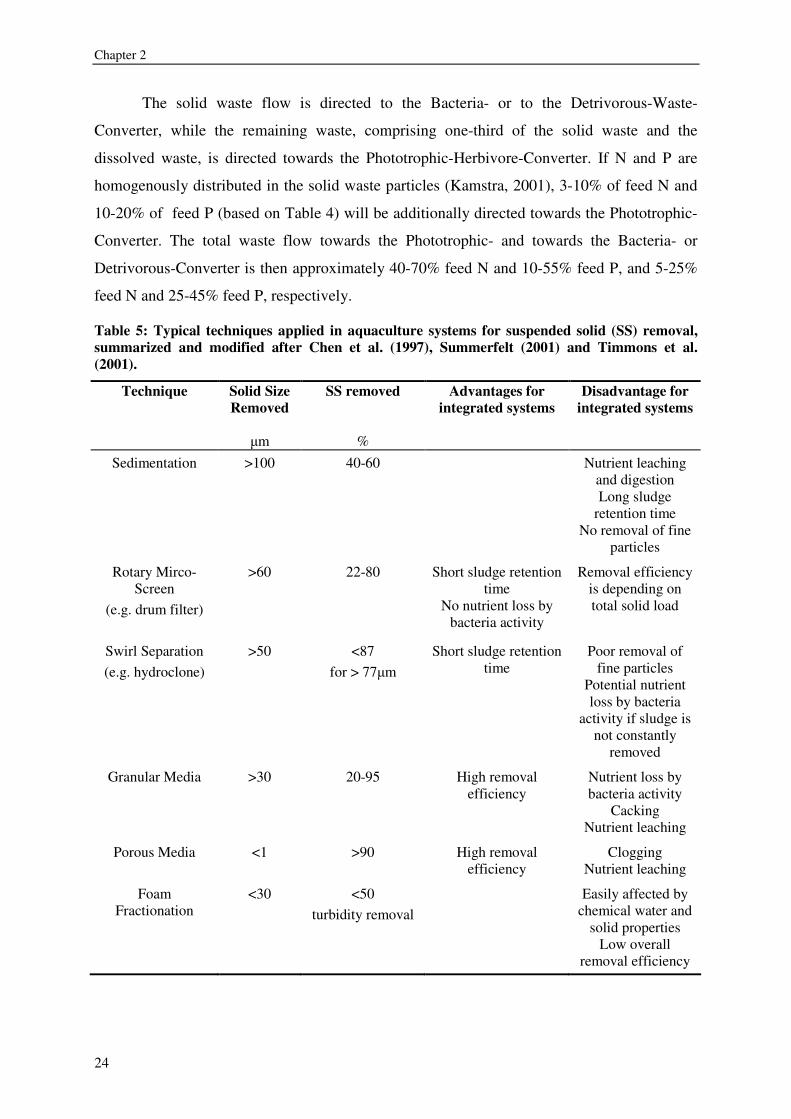
Fish-Waste-Processor Table 5 provides an overview of different Fish-Waste-Processors that are applied in
aquaculture systems. Nutrient degradation and leaching should be reduced as much as
possible by this separation process. Nutrient degradation or the destruction of bigger waste
particles in the Fish-Waste-Processor will lead to a loss of nutrients for other conversions.
Micro-screen filtration, e.g. drum filtration, and eventually swirl separation serve best to
separate the nutrient flows in solid and dissolved fractions. If, for example, a drum filter is
applied as Fish-Waste-Processor, the total suspended solid concentration influences the
efficiency of the filtration process (Summerfelt, 2001). If an average efficiency of 65% is
assumed, roughly two third of the solid waste coming from the fish tanks is captured within
the solid waste flow.
Analysis of nutrient flow
s in integrated intensive aquaculture systems
23
Source
Kim et al., 1998
Kim et al., 1998
Lupatsch and Kissil, 1998
Company et al., 1999
Neori et al., 2000
Shpigel et al., 1993
van Weerd et al., 1999
Eding and van Weerd, 1999
Alasgah and Ali, 1994
Own observation
P Faecal Loss
5b
6b
7
---
---
---
10
---
---
4
P Excretion
4b
5b
3
---
---
---
0
---
---
0
P Retention
4
2
4
---
---
---
6
---
---
8
P Feed
13
13
14
17
---
---
16
---
---
12
N Faecal Loss
10a
10a
13
15c
23d
6e
10
12
14f
9
N Excretion
34a
36a
45
48c
35d
41e
24
27
26f
14
N Retention
23
21
16
26
14
17
35
39
32
21
N Feed
67
67
74
89
72
64
69
78
72
44
FCR
1.13
1.25
1.79
1.24
2.00
3.00
0.71
0.80
1.12
1.12
Feeding Level
Ad. Lib.
Ad. Lib.
Ad. Lib.
Ad. Lib.
2.9% kg0.8BW per dayd
1-4%/kg BW per day
1.27%/kg0.8BW per day
2.5%BW
2%BW
1.24%/kg0.8BW per day
Initial - Final
Weight
24-55
156-238
1-400
18-50
40-470
50-300
47-144
15-899
23-49
54-128
Table 4: Nitrogen (N) and Phosphorus (P) retention in fish biomass for different fish species fed conventional diets. (Weight in g; FCR=kg feed/kg gain; Feed content, retention, excretion, and faecal loss g/kg feed).
Species
Trout
Trout
Sea Bream
Sea Bream
Sea Bream
Sea Bream
African Catfish
African Catfish
Tilapia
Tilapia
BW=Body weight in g; Ad. Lib.= ad libitum, FCR=Feed Conversion Ratio; a Based on an estimated digestibility of 85% for N. b Concluded after Cripps (1995), Coloso et al. (2003), that particulate P losses from trout hatcheries are accounting for 30-50% of soluble P. c Estimated after Lupatsch and Kissil (1998). d Estimated after Neori et al., 2000. e Estimated after Shpigel et al., 1993. f Estimated after Verdegem et al. (2000) and own data
Chapter 2
24
The solid waste flow is directed to the Bacteria- or to the Detrivorous-Waste-
Converter, while the remaining waste, comprising one-third of the solid waste and the
dissolved waste, is directed towards the Phototrophic-Herbivore-Converter. If N and P are
homogenously distributed in the solid waste particles (Kamstra, 2001), 3-10% of feed N and
10-20% of feed P (based on Table 4) will be additionally directed towards the Phototrophic-
Converter. The total waste flow towards the Phototrophic- and towards the Bacteria- or
Detrivorous-Converter is then approximately 40-70% feed N and 10-55% feed P, and 5-25%
feed N and 25-45% feed P, respectively.
Table 5: Typical techniques applied in aquaculture systems for suspended solid (SS) removal, summarized and modified after Chen et al. (1997), Summerfelt (2001) and Timmons et al. (2001).
Technique Solid Size Removed
SS removed
Advantages for integrated systems
Disadvantage for integrated systems
�m % Sedimentation >100 40-60 Nutrient leaching
and digestion Long sludge
retention time No removal of fine
particles
Rotary Mirco-Screen
(e.g. drum filter)
>60 22-80 Short sludge retention time
No nutrient loss by bacteria activity
Removal efficiency is depending on total solid load
Swirl Separation (e.g. hydroclone)
>50 <87 for > 77�m
Short sludge retention time
Poor removal of fine particles
Potential nutrient loss by bacteria
activity if sludge is not constantly
removed
Granular Media >30 20-95 High removal efficiency
Nutrient loss by bacteria activity
Cacking Nutrient leaching
Porous Media <1 >90 High removal efficiency
Clogging Nutrient leaching
Foam Fractionation
<30 <50 turbidity removal
Easily affected by chemical water and
solid properties Low overall
removal efficiency
Analysis of nutrient flows in integrated intensive aquaculture systems
25
Phototrophic-Herbivore-Converter The Phototrophic-Herbivore-Converter comprises two sub modules: a phototrophic
part, containing photosynthetic organisms, and an herbivore part, containing herbivorous
organisms.
Phototrophic-Converter
Phototrophic conversion can be distinguished by its focus on macroalgae, microalgae,
and macrophytes.
Macroalgae
Macroalgae culture has been integrated in intensive land-based aquaculture systems
combining fish-macroalgae (Cohen and Neori, 1991; Neori et al., 1991), fish-bivalve-
macroalgae (Shpigel and Neori, 1996), fish-macroalgae-shellfish (Neori et al., 2000,
Schuenhoff et al., 2003), and fish-microalgae-bivalves-macroalgae (Shpigel et al., 1993). An
extensive review on general aspects of seaweed biofiltration in mariculture is given elsewhere
(Neori et al., 2004). An integrated system with Ulva is able to retain between 20 and 30%
feed N (Shpigel et al., 1993; Neori et al., 2000) and potentially 1-7% feed P (Ventura et al.,
1994), if a feed phosphorous content of 0.9% (DAN-EX 2446, Danafeed, Denmark) is
assumed.
Microalgae
Aquaculture systems, such as the “partitioned aquaculture system” (PAS), integrate
microalgae culture, using high-rate algae pond culture techniques, and aquaculture production
(Brune et al., 2003). This system comprises catfish, tilapia, Scenedesmus and other green
algae. According to Brune et al. (2003) algae production in this system was 3.7g/m² per day
(1.9gC/m²/d) with a N retention of 38% feed N. The related P retention is about 30% feed P,
if the P feed content is estimated to be 0.9-1% (Cho and Lovell, 2002). Other existing systems
integrate shrimp, algae, and oyster production (Wang, 2003). In the latter study 1kg of shrimp
feed produces 0.8kg of dry weight algae, retaining 50% of feed N and 53% feed P for an
estimated feed phosphorous content of 1.8% (L. vannamei grow-out feed, VDS, Belgium) and
algae P content of 1.2% (Brune et al., 2003).
Macrophytes
Macrophytes, such as willow, hyacinth, or duckweed have been used in wastewater
treatment (Culley and Epps, 1973; Oron, 1994; Smith and Moelyowati, 2001). For the
integration with fish culture, however, water hyacinths are less favorable than duckweed due
to their intolerance to low temperatures and difficulties in harvesting and processing (Oron,
1994). Furthermore, duckweed can have a high protein content of up to 50%, a nutritionally
Chapter 2
26
valuable amino acid pattern (Mbagwu and Adeniji, 1988), and a high digestibility of about
60% dry matter (Castanares, 1990; El-Shafai, 2004). Own observations showed an increase in
nitrogen retention from 42% for tilapia alone to 57% feed N in a tilapia recirculation system
where the trickling filter was replaced by a duckweed reactor and the duckweed was
harvested. This equals an additional retention in duckweed of about 17% feed P (Table 6),
based on a P feed content of 1.56% (TI 2 Tilapia Start Pellets, Trouvit, The Netherlands).
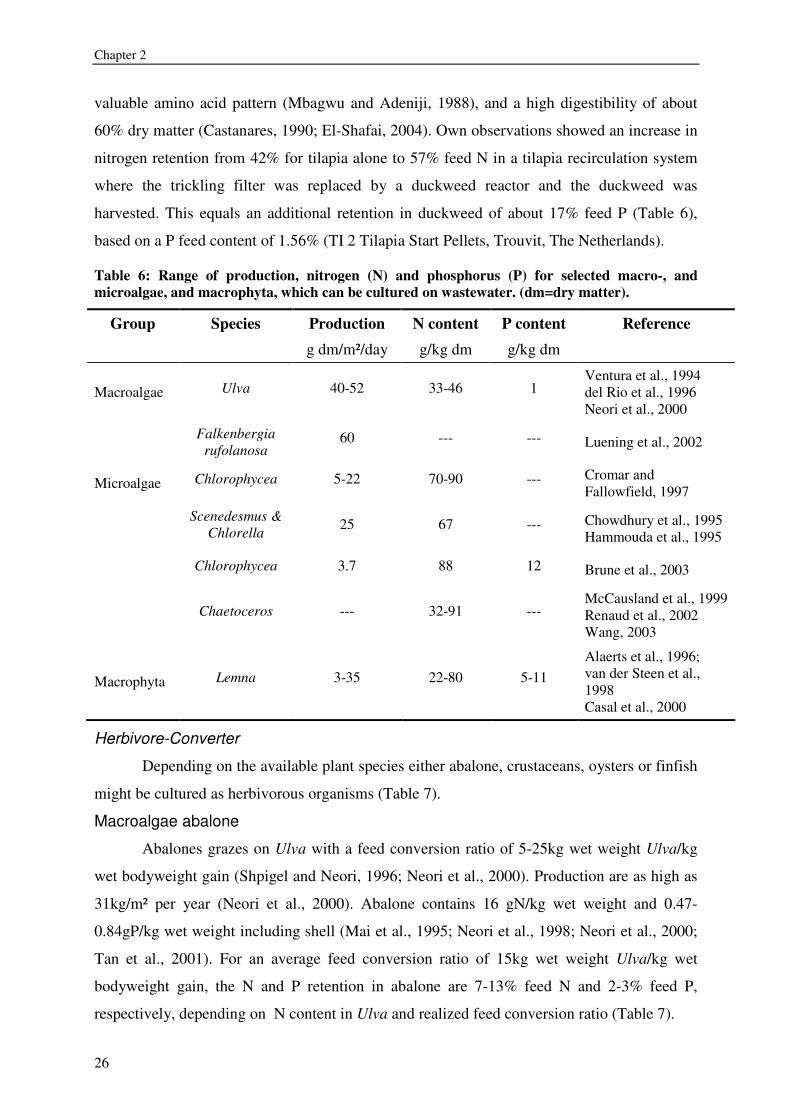
Table 6: Range of production, nitrogen (N) and phosphorus (P) for selected macro-, and microalgae, and macrophyta, which can be cultured on wastewater. (dm=dry matter).
Group Species Production N content P content Reference g dm/m²/day g/kg dm g/kg dm
Macroalgae Ulva 40-52 33-46 1 Ventura et al., 1994 del Rio et al., 1996 Neori et al., 2000
Falkenbergia rufolanosa
60 --- --- Luening et al., 2002
Microalgae Chlorophycea 5-22 70-90 --- Cromar and Fallowfield, 1997
Scenedesmus & Chlorella 25 67 --- Chowdhury et al., 1995
Hammouda et al., 1995
Chlorophycea 3.7 88 12 Brune et al., 2003
Chaetoceros --- 32-91 --- McCausland et al., 1999 Renaud et al., 2002 Wang, 2003
Macrophyta Lemna 3-35 22-80 5-11 Alaerts et al., 1996; van der Steen et al., 1998 Casal et al., 2000
Herbivore-Converter
Depending on the available plant species either abalone, crustaceans, oysters or finfish
might be cultured as herbivorous organisms (Table 7).
Macroalgae abalone
Abalones grazes on Ulva with a feed conversion ratio of 5-25kg wet weight Ulva/kg
wet bodyweight gain (Shpigel and Neori, 1996; Neori et al., 2000). Production are as high as
31kg/m² per year (Neori et al., 2000). Abalone contains 16 gN/kg wet weight and 0.47-
0.84gP/kg wet weight including shell (Mai et al., 1995; Neori et al., 1998; Neori et al., 2000;
Tan et al., 2001). For an average feed conversion ratio of 15kg wet weight Ulva/kg wet
bodyweight gain, the N and P retention in abalone are 7-13% feed N and 2-3% feed P,
respectively, depending on N content in Ulva and realized feed conversion ratio (Table 7).
Analysis of nutrient flows in integrated intensive aquaculture systems
27
Micro algae-fish/oyster/shrimps
Micro algae represent either a valuable product by themselves (Stromme et al., 2002),
or they can be fed to fish, oysters or shrimp (Shpigel et al., 1993; Brune et al., 2003; Wang,
2003). In the PAS system, algae and heterotrophic production, expressed as volatile solids
(VS), were converted into tilapia biomass with a conversion factor of 2.2kgVS/kg fish, which
comprise 60% algae and 40% bacteria biomass (Brune et al., 2003). If bacteria and algae N
content is 12 and 8.7%, respectively, and their phosphorus content is 2% and 1.2%,
respectively (Brune et al., 2003; Tchobanoglous et al., 2003), and tilapia N content is 2.6%
(van Dam and Penning de Vries, 1995; own data) and P content is 0.6% (Rectenwald and
Drenner, 2000), then N retention in fish is 9% feed N and P retention is 10% feed P. Also
oyster production can be integrated with microalgae. For a FCR of 2kg algae dry weight/kg
fresh weight oyster meat, 16% meat content, and 2.3gN/kg oyster and 0.5gP/kg oyster
(Anthony et al., 1983; Wang, 2003), 7% feed N and 7% feed P are retained in the oysters.
Algae N content was estimated here as 5% (Wang, 2003) and P content as 1.2% (Brune et al.,
2003). In a similar approach using a chain of fish-microalgae/heterotrophic production-
bivalves, 15% feed N and 22% feed P, assuming a similar oyster composition for N and P as
in the previous example, would be retained in the bivalves (Shpigel et al., 1993).
Macrophytes-fish
Duckweed can be fed as sole feed or as supplemental feed ingredient to finfish, such
as tilapia. Quantitative information on optimal feeding rates and feed conversion ratios are
scarce. Gaigher et al. (1984), Hassan and Edwards (1992) and El-Shafai (2004) reported
FCRs of 1-2.3 for feeding trials with tilapia. For 1kg of dry duckweed (30% protein) fed to
tilapia with an FCR of 2.3, a nutrient retention of 3.5% feed N and 4% feed P (Table 6; Table
7) can be obtained.
Chapter 2
28
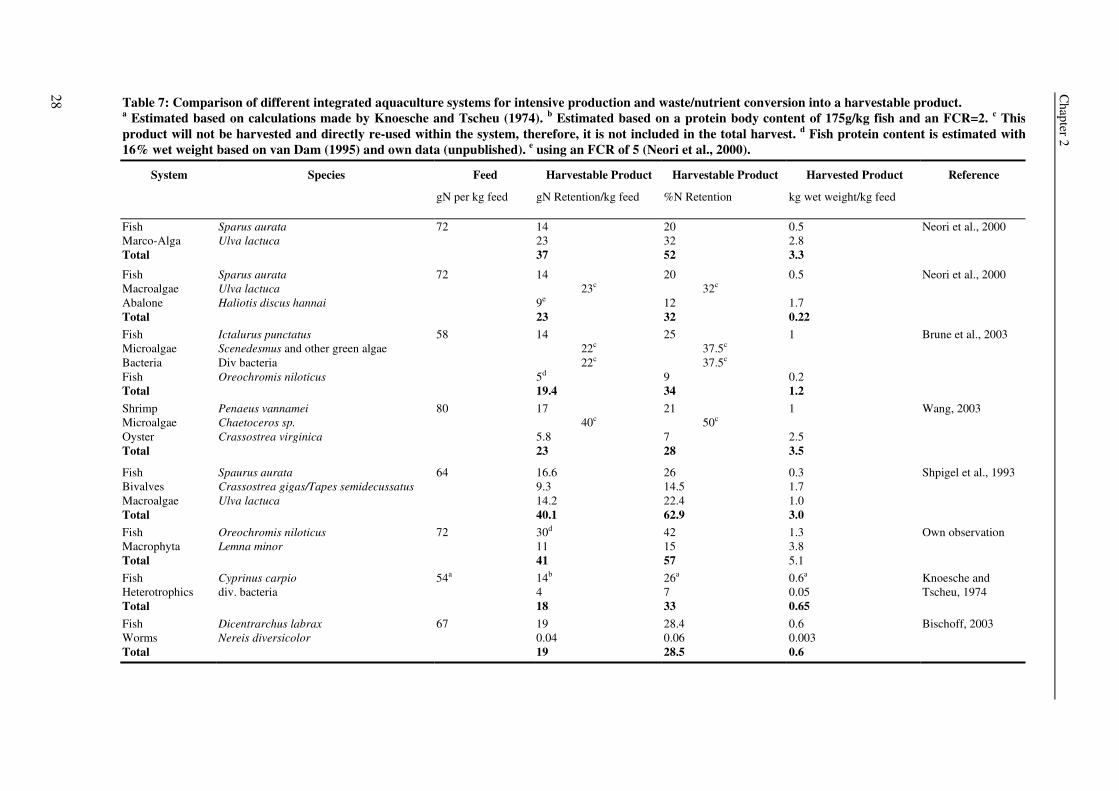
Reference
Neori et al., 2000
Neori et al., 2000
Brune et al., 2003
Wang, 2003
Shpigel et al., 1993
Own observation
Knoesche and Tscheu, 1974
Bischoff, 2003
Harvested Product
kg wet weight/kg feed
0.5 2.8 3.3
0.5 1.7 0.22 1 0.2 1.2 1 2.5 3.5
0.3 1.7 1.0 3.0 1.3 3.8 5.1 0.6a 0.05 0.65 0.6 0.003 0.6
Harvestable Product
%N Retention
20 32 52
20 32c 12 32 25 37.5c 37.5c 9 34 21 50c 7 28
26 14.5 22.4 62.9 42 15 57 26a 7 33 28.4 0.06 28.5
Harvestable Product
gN Retention/kg feed
14 23 37
14 23c
9e
23 14 22c 22c 5d 19.4 17 40c 5.8 23
16.6 9.3 14.2 40.1 30d
11 41 14b 4 18 19 0.04 19
Feed
gN per kg feed
72
72
58
80
64
72
54a
67
Species
Sparus aurata Ulva lactuca
Sparus aurata Ulva lactuca Haliotis discus hannai
Ictalurus punctatus Scenedesmus and other green algae Div bacteria Oreochromis niloticus
Penaeus vannamei Chaetoceros sp. Crassostrea virginica
Spaurus aurata Crassostrea gigas/Tapes semidecussatus Ulva lactuca
Oreochromis niloticus Lemna minor
Cyprinus carpio div. bacteria
Dicentrarchus labrax Nereis diversicolor
Table 7: Comparison of different integrated aquaculture systems for intensive production and waste/nutrient conversion into a harvestable product. a Estimated based on calculations made by Knoesche and Tscheu (1974). b Estimated based on a protein body content of 175g/kg fish and an FCR=2. c This product will not be harvested and directly re-used within the system, therefore, it is not included in the total harvest. d Fish protein content is estimated with 16% wet weight based on van Dam (1995) and own data (unpublished). e using an FCR of 5 (Neori et al., 2000).
System
Fish Marco-Alga Total
Fish Macroalgae Abalone Total Fish Microalgae Bacteria Fish Total Shrimp Microalgae Oyster Total
Fish Bivalves Macroalgae Total Fish Macrophyta Total Fish Heterotrophics Total Fish Worms Total
Analysis of nutrient flows in integrated intensive aquaculture systems
29
Bacterial-Waste-Converter In a RAS, nutrients are not re-used, they are in fact destroyed and discharged in a
harmless form by nitrification, denitrification and heterotrophic degradation (van Rijn and
Shnel, 2001; Eding et al., 2003). Although these kinds of processes successfully decrease the
amount of discharged nutrients, such systems do not increase the retention of nutrients.
Instead of destructing and or volatilizing or storing nutrients, nutrients can also be converted
into bacteria biomass and re-used as single cell protein (SCP). If carbon and N are well
balanced in the bacterial substrate, ammonia in addition to organic nitrogenous waste will be
converted into bacteria biomass (Henze et al, 1996). This conversion is an additional sink for
ammonia and contributes to dissolved waste conversion. Knoesche et al (1974) already
adopted the idea of intensive heterotrophic bacteria growth in aquaculture systems and could
retain 7% feed N (Table 7) and 6% feed P (estimated from 1% P feed, KarpiCo Supreme-7Ex,
Coppens International, The Netherlands). He used an activated sludge process to treat water in
a recirculation system, and proposed to mix produced sludge with grains for later re-use as
fish feed for carps. A comparable approach for activated sludge reuse was as well proposed
by Tacon (1979) for trout culture. In pond systems, use of bacteria production was suggested
by Avnimelech et al. (1988) and Avnimelech (1999). Tilapia showed better performance in
pond cultures, when they were fed on a low protein diet in combination with SCP produced in
the pond than tilapia, which were fed with a high protein diet. However, detailed data on the
nutrient balances for SCP/sludge consumption and its specific contribution to the nutrient
balance are not available, although SCP has frequently being tested as protein source in fish
feeds (Tacon, 1979; Oliva-Teles et al., 1998; Storebakken et al., 1998; El-Sayed, 1999,
Schneider et al., 2004).
Detrivorous-Converter In the Detrivorous-Converter, solid waste is fed to invertebrate organisms after
separation from the rearing water in the fish waste processor. Recent first trials with
integrated sea bass and Nereis diversicolor culture, showed a nutrient retention of 0.06% feed
N and 0.03 x10⁻³% feed P (Bischoff, 2003; Waller et al., 2003).
Discussion
Nutrient balance After integration of all five modules into one integrated intensive system, an overall
nutrient balance could be established. In this concept, the Fish-Biomass-Converter retains 20-
50% feed N and 15-65% feed P. This means that 50-80% feed N and 35-85% feed P are
Chapter 2
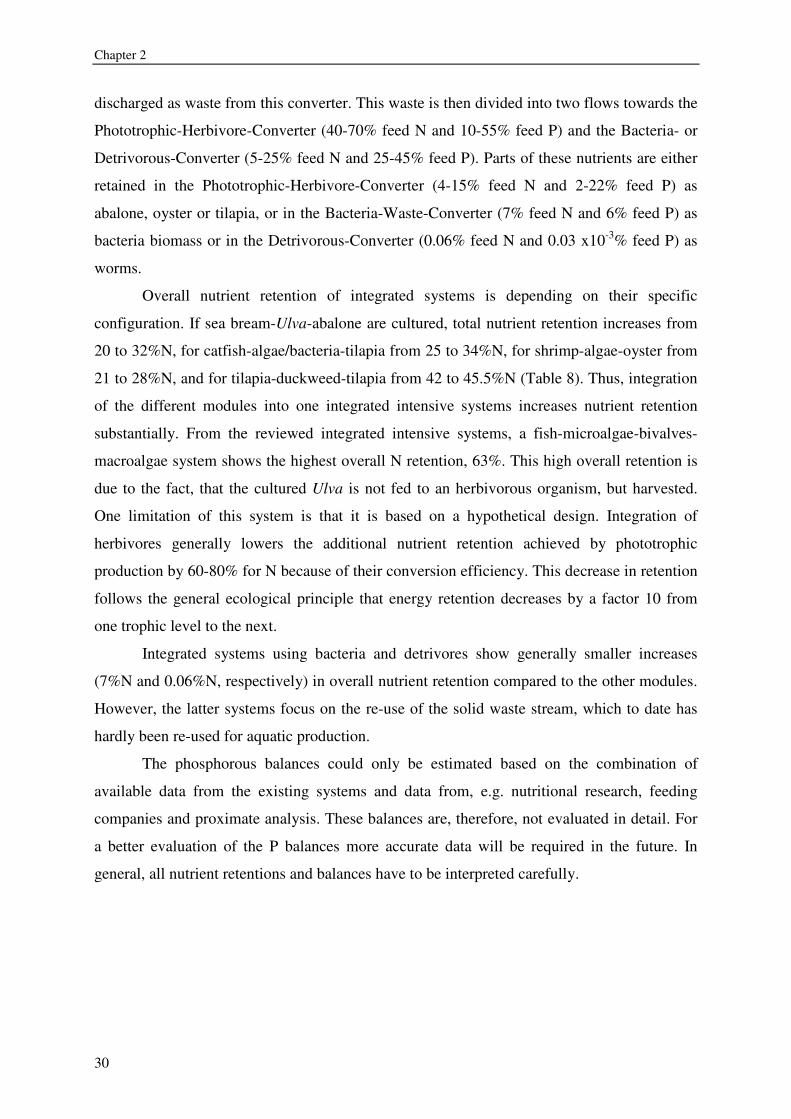
30
discharged as waste from this converter. This waste is then divided into two flows towards the
Phototrophic-Herbivore-Converter (40-70% feed N and 10-55% feed P) and the Bacteria- or
Detrivorous-Converter (5-25% feed N and 25-45% feed P). Parts of these nutrients are either
retained in the Phototrophic-Herbivore-Converter (4-15% feed N and 2-22% feed P) as
abalone, oyster or tilapia, or in the Bacteria-Waste-Converter (7% feed N and 6% feed P) as
bacteria biomass or in the Detrivorous-Converter (0.06% feed N and 0.03 x10⁻³% feed P) as
worms.
Overall nutrient retention of integrated systems is depending on their specific
configuration. If sea bream-Ulva-abalone are cultured, total nutrient retention increases from
20 to 32%N, for catfish-algae/bacteria-tilapia from 25 to 34%N, for shrimp-algae-oyster from
21 to 28%N, and for tilapia-duckweed-tilapia from 42 to 45.5%N (Table 8). Thus, integration
of the different modules into one integrated intensive systems increases nutrient retention
substantially. From the reviewed integrated intensive systems, a fish-microalgae-bivalves-
macroalgae system shows the highest overall N retention, 63%. This high overall retention is
due to the fact, that the cultured Ulva is not fed to an herbivorous organism, but harvested.
One limitation of this system is that it is based on a hypothetical design. Integration of
herbivores generally lowers the additional nutrient retention achieved by phototrophic
production by 60-80% for N because of their conversion efficiency. This decrease in retention
follows the general ecological principle that energy retention decreases by a factor 10 from
one trophic level to the next.
Integrated systems using bacteria and detrivores show generally smaller increases
(7%N and 0.06%N, respectively) in overall nutrient retention compared to the other modules.
However, the latter systems focus on the re-use of the solid waste stream, which to date has
hardly been re-used for aquatic production.
The phosphorous balances could only be estimated based on the combination of
available data from the existing systems and data from, e.g. nutritional research, feeding
companies and proximate analysis. These balances are, therefore, not evaluated in detail. For
a better evaluation of the P balances more accurate data will be required in the future. In
general, all nutrient retentions and balances have to be interpreted carefully.
Analysis of nutrient flow
s in integrated intensive aquaculture systems
31
Not retained
49 (68)
---
39 (67)
---
57 (71)
---
39.5 (55) ---
36 (67)
---
48 (72)
---
0.04 (0.06)
<0.001 (0.03 x10⁻³)
Detrivorous-Converter
Nereis diver- sicolor
22a (38)
3.6a (40)
4 (7)
0.6 (6)
Bacterial-Waste-Converter
div.
bacteria
div bacteria
9 (12)
0.2-0.3 (2-3)
5 (9)
0.9 (10)
6 (7)
1.3 (7)
2.5 (3.5)
0.6 (4)
Herbivore Converter
Haliotis discus hannai
Oreochromis
niloticus
Crassostrea gigas
Oreochromis
niloticus
23a (32)
0.1-0.6a (1-7)
22a (38)
3a (30)
40a (56)
9.5a (53)
11a (15)
2.7a (17)
Phototrophic Converter
Ulva lactuca
Scenedesmus & other green
algae
Chaetoceros spec.
Lemna minor
14 (20)
---
14 (25)
---
17 (21)
---
30 (42)
---
14 (26)
---
19 (28)
---
Fish-Biomass Converter
Sparus aurata
Ictalurus punctatus
Penaeus vannamei
Oreochromis
niloticus
Cyprinus carpio
Dicen-
trarchus labrax
72
9
58
9
80
18
72
16
54
10
67
13
Table 8: Nitrogen (N) and phosphorus (P) mass balances for selected integrated system configurations. No values for P for the Fish-Biomass-Converter were available for the selected examples. P balances remain therefore incomplete. Values are given as g/kg feed. Values are taken from Table 7 or resulting from the calculations presented in the text. Numbers in parenthesis are % of feed nutrient; a = converted nutrients are used in a subsequent converter and therefore not included in the sum of retained nutrients.
Input
N
P
N
P
N
P
N
P
N
P
N
P
Chapter 2
32
The calculations, especially of the Phototrophic-, the Bacteria-Waste-, and the
Detrivorous-Converter, are based on highly different systems. The fish species and sizes, feed
compositions, feed loads, system dimensions, related waste loads and waste/nutrient
concentrations, and environmental conditions differ between the reviewed systems. In order to
compare the system nutrient retentions and their conversion processes more accurately in the
future, it is necessary, to compare them in a hypothetical integrated system design. This
design should be based on a standardized feed composition and feed load, comparable fish
production and waste loads, and apply the related nutrient conversion kinetics.
Limitations The integration of different culture modules into one system results in higher nutrient
retention, but is limited by different factors.
Fish-Biomass-Converter
Nutrient retention and nutrient discharge from the Fish-Biomass-Converter is limited
by the nutritional value of the feed, and the specific nutritional demands of the cultured fish
species. Unbalanced fish feeds lead to higher faecal and non-faecal losses for N and P from
the fish (Brunty et al., 1997; Satoh et al., 2003). Conversion efficiencies and nutrient retention
have an impact on module’s water quality and are, thereby, indirectly affecting fish growth
and the design of all subsequent modules. To achieve an efficient nutrient retention in the
overall system, optimized nutrient loads at each module are needed. In integrated systems,
this can be partly achieved by adjusting the composition of fish feeds (Brunty et al., 1997;
Satoh et al., 2003). However, from a feed formulation point of view, such desired feed
adjustments might not be easily attainable. For example, to reduce the excessive P supply to
the system, it would be advisable to replace fishmeal by other ingredients in the diet. This is
not easy to achieve without serious economic and nutritional consequences.
Fish-Waste-Processor
The application of Fish-Waste-Processors is limited by two factors: the efficiency of
the separation process, and the prevention of nutrient degradation. Fish waste should be
separated as efficient as possible in a solid and dissolved fraction. This avoids a diminished
water quality in the modules connected to the dissolved waste stream and prevents unwanted
bacterial activity and suboptimal function of these modules. The solid waste should preferably
be transported exclusively to the Bacteria- and the Detrivorous-Waste-Converter, where solid
nutrient conversion takes place under controlled and optimal conditions. Because nutrient
degradation or digestion should be prevented, Fish-Waste-Processors with long hydraulic or
Analysis of nutrient flows in integrated intensive aquaculture systems
33
sludge retention times are not applicable. Table 5 summarizes the limitations of different
Fish-Waste-Processors. However, in alternative system designs, with limited or even without
bacteria or detrivorous conversion, these limitations could be applied in a positive way, e.g.
dissolving the available nutrients through leaching. This would reduce the nutrient loads
towards the solid waste converters in the system and increase the nutrient loads to the
phototrophic converter. Such higher loads of dissolved nutrients might be preferred, because
of the high nutrient retention in Phototrophic-Converter.
Phototrophic-Converter
Several factors, such as micro-, and macronutrient ratios, concentrations and fluxes,
preferences for N sources, light regime, hydraulic retention time, temperature, and nutrient
loss to different sinks will strongly determine the success of phototrophic production. The N/P
ratio in plant tissue shows the different requirements and retentions by phototrophic
conversion (Table 6). If N or P is offered in excess, the other macronutrient will become a
limiting production factor. The excessively available nutrient is released unconverted from the
module and accumulates in the culture system, and needs finally to be discharged into the
environment. Ammonia uptake efficiency follows a Michaelis-Menten-type saturation curve
(Cohen and Neori, 1991). TAN fluxes of 8.1g TAN/ m² per day resulted in an uptake
efficiency of 40%, while a flux of about 2.0g TAN/ m² per day resulted in an uptake
efficiency of 90%. Differences in wastewater COD (chemical oxygen demand) loading can
influence biomass composition in high rate algal ponds (HRAP). Cromar et al. (1992) found
that at low COD loadings (around 100kg COD/ha per day) green algae are dominant while
cyanobacteria become dominant at higher loadings. In intensive algae culture systems,
additional carbon dioxide might be required. An algae production of 3.7g/m²/d dry matter
algae fixates 1.8gC/m²/d (Brune et al., 2003). This amount of CO2 has to be supplied to be the
conversion module. If the supply from fish and air is not sufficient due to either high algae
productions or because pH values get unfavorable for algae growth additional carbon has to
be added (Richmond, 1986). Successful algae culture requires also the availability of micro-
nutrients in the right concentration and in the right ratio (de la Noüe and de Pauw, 1988). The
form of nitrogen, ammonia or nitrate influences phototrophic production, as the here
discussed aquatic plants prefer ammonia over nitrate (Richmond, 1986; Skillicorn et al., 1993;
Runcie et al., 2003).
Light is a key factor in phototrophic production, as light intensity and dark-light-cycle
influences production. The dependence of Ulva on light is described in different models
Chapter 2
34
(Ellner et al., 1996; Coffaro and Sfriso, 1997). In HRAP optimal mixing and flow patterns
will expose the algae to favorable sunlight conditions, maximizing algae production and
avoiding photoinhibition (Mihalyfalvy et al., 1997). Chlorella vulgaris is already inhibited at
light intensities of 200-300µE/m2/s, which occur already at 10% of full sunlight. This
inhibition can be prevented by rotating the suspended cells from the light to the dark to
recover their photosynthetic apparatus (Mihalyfalvy et al., 1997). Duckweed is photo-
inhibited at light intensities above 1200µE/m2/s (Wedge and Burris, 1982).
Hydraulic retention time is a major design factor for Phototrophic-Converters and their
integration in aquaculture systems. The relation between retention time and nutrient inflow
and nutrient uptake has been documented for Ulva biofilter systems (Cohen and Neori, 1991;
del Rio et al., 1996). In HRAPs, where retention time was increased from 4 to 7 days, a
remarkable shift in algal species composition from chlorophycea to cyanobacteria was
observed (Cromar and Fallowfield, 1997). A stable HRAP performance can be maintained at
retention times of 2-10 days depending on light, temperature, and nutrient concentrations
(Picot et al., 1992; Brune et al., 2003). Phototrophic reactor dimensions and flow rates are,
therefore, critical design criteria to meet a balance of species composition, biomass
production, nutrient conversion, and purified water volume. Temperature is another important
factor in outdoor systems. Growth variations of plants depending on temperature are reported
for HRAP, macroalgae filter, and duckweed reactors (Martínez et al., 1999; Pagand et al.,
2000; Smith and Moelyowati, 2001; Schuenhoff et al., 2003).
Nitrogen and P might be lost in aquatic plant production systems to other sinks than
algae biomass. Nitrification and denitrification are reported for almost all types of
Phototrophic-Converters (Neori, 1996; Cromar and Fallowfield, 1997; Koerner and Vermaat,
1998). Another sink is ammonia stripping and ortho-phosphate precipitation due to increasing
pH values and calcium concentrations in HRAPs (Nurdogan and Oswald, 1995). In some
HRAPs ammonia stripping is the most dominant nitrogen removal process. If pH values rise
due to bioremediation, ammonia removal by stripping becomes dominant. In a HRAP studied
by Voltolina et al. (1993) over 76% of the total removed nitrogen was stripped, while the pH
rose from 8.9 to 10.4 within 2-3 h. It is important to understand that Phototrophic-Converters
contain not only plants but also bacteria. Cromar et al. (1992) mentions that in a HRAP 60-
80% of the N was assimilated by floccular and bacterial biomass and not by algae. Similar
data have been provided for duckweed with a share of 35-46% of the total N removal due to
bacteria activity in the system (Koerner and Vermaat, 1998). Also in the PAS waste
conversion of 6.2g VS (volatile solids) /m² per day comprises two fractions: 3.67gVS algae
Analysis of nutrient flows in integrated intensive aquaculture systems
35
and 2.57gVS heterotrophic production (Brune et al., 2003). A side aspect of limits to
successful culture can be the choice for the optimal species and/or optimal system
configuration. One study focused on the integration of microalgae production with sea bass
for effluent treatment (Pagand et al., 2000). During the experiment, macroalgae out-competed
the microalgae. At the end of the experiment macroalgae production was 8.5g dry matter/m²
per day versus 0.5g dry matter/m² per day for microalgae. System configuration influences
algae production and vice versa. The occurrence and control of, e.g. epiphytes depends on
system configuration. Epiphytes are a biological threat of macroalgae production (Pickering et
al., 1993). They can over-shade their host plants and drag their currents, which can lead to
heavy production losses. Epiphytes can be reduced either mechanically, by chemicals or if N
is given in pulses and not continuously. Pulsing N results in a major system configuration
change: from continuous to fed-batch operation mode. This might result in limitations of the
desired conversion processes, because effluent streams from the fish can then not be treated
continuously anymore.
Herbivore-Converter
Conversion of produced plants by herbivore organisms is limited by the nutritional value
of the product, harvestability and potential nutrient deficiencies. Several animals are lacking
the necessary enzymes to digest the cellulose plant cell wall (Anupama and Ravindra, 2000).
Therefore, higher digestibility is achieved, if the cell wall is broken prior to digestion. The
low dry weight of fresh plant material is another issue, as roughly 20 times more material has
to be consumed by the fish compared to a commercial feed pellet for the same amount of dry
matter intake (Gaigher et al., 1984). Some algae are deficient for some nutrients. For example
C. vulgaris is Vitamin B12 deficient for Brachionus culture, if it is fed as solely feed, and has
to be enriched (Maruyama et al., 1997). Efficient harvesting of algae and aquatic plants
appears to be difficult and costly (de la Noüe and de Pauw, 1988; Poelman et al., 1997).
Direct harvesting and consumption by herbivore organisms within the same culture
module as practiced, i.e. in the PAS (Brune et al., 2003), requires an ecological balance
between nutrient input for the phototrophic production, the phototrophic production itself and
the consumption by the herbivorous fish. Another approach is to separate phototrophic and
herbivorous conversion. This separation still requires a balance between nutrient inputs and
production inside the converters; however, those separated converters might be more
controllable for nutrient inputs and production. In addition, culture conditions, such as
hydraulic retention time, reactor mixing, reactor depth can be optimized for requirements of
Chapter 2
36
the intended culture organism. A shallow HRAP of 30 cm (Picot et al., 1992), providing good
culture conditions for microalgae, might not be suitable for intensive fish production, because
fish require deeper waters. For reduced water refreshment rates, such as realized in RAS,
nutrient deficits might occur especially for shellfish production. The growth of shellfish
requires calcium and other elements, which are not scarce in open marine systems (Tan et al.,
2001). However, the availability can be depleted, if shellfish are harvested and calcium is not
replaced due to, e.g. too low water refreshment rates. One kilogram of a mollusk shell
contains 98% calcium carbonate (Tan et al., 2001). The removal of 1kg shells equals a
removal of 400g calcium, an amount that is contained in 1m3 sea water (Kennish, 1990).
Bacteria-Waste-Converter and SCP re-use
SCP production and its re-use might be limited for different factors related to the
production and to the nutritional value. SCP production is limited by nutrient ratio, oxygen
availability and problems with harvesting techniques. To optimize production and, therefore,
the retention of nutrients in bacteria biomass, a C/N ratio in the substrate of ± 15gC/gN is
required (Henze et al., 1996). Most commercial fish feeds are protein rich but relatively low
in carbohydrates. Consequently C/N ratios in the fish waste are lower than 15gC/gN
(Avnimelech, 1999). Low protein fish feeds are one possibility to achieve favorable C/N
ratios in fish waste. However, a lower dietary protein content might result in a lower fish
production. It would be a challenge to counterbalance this growth reduction by conversion of
produced SCP into fish biomass (Avnimelech, 1999). If high protein feeds are applied in the
Fish-Biomass-Converter, SCP production requires additional C sources (Schneider et al.,
2003). Endogenous SCP production inside the Fish-Biomass-Reactor is limited by oxygen
availability (Knoesche, 1994; McIntosh, 2001) and requires extensive aeration and
oxygenation. Harvesting of SCP is an additional obstacle, because of the high costs involved
(Tacon, 1979). The nutritional value of SCP is limited by a high content of nucleic acids
(Rumsey et al., 1991), possible toxins and pathogens (Tacon, 1979; Anupama and Ravindra,
2000; Tacon et al., 2002), low digestibility due to heteropolysaccharides and
exopolysaccharides (Tacon, 1979), and deficits in essential amino acids, especially
methionine and cystine (Anupama and Ravindra, 2000). Although, solid waste conversion
into SCP and its reuse might increase the overall nutrient retention in the system, the practical
integration of such a module remains difficult.
Analysis of nutrient flows in integrated intensive aquaculture systems
37
Detrivorous-Converter
Worm production per unit surface area is relatively low compared to other conversion
processes (1.1kg worms fresh weight/m2 per year, Meyering, 2003) and the nutrient retention
is less significant than for other conversion processes (Table 7), however, such worm
production systems convert otherwise discharged nutrients into a valuable product. The
microbial activity, which is enhanced by the worm’s activity, might become a drawback in
such converters (Riise and Roose, 1997) because nutrients are degraded and excluded from a
potential re-use through the worms. On the other hand, nutrients might be upgraded by this
bacteria production and, therefore, become a better food source for the worms. A balance of
constraints and perspectives of such processes is not available yet.
Conclusion The combination of fish culture with subsequent phototrophic and herbivorous
conversion increases nutrient retention in the culture system (e.g. 20-42% feed N to 29-45%
feed N). This relative small increase is due to the nutrient retention of the next higher trophic
level, the herbivores. Herbivorous conversion decreases the nutrient retention achieved by
phototrophic conversion substantially by 60-85% feed N and 50-90% feed P. Future research
will be needed focusing on factors to increase nutrient retention in those secondary production
and to re-utilize released nutrients from these conversion processes. The conversion of
nutrients into bacteria or worm biomass contributes only in smaller margins (e.g. 7% feed N
or 0.06% feed N) to the increased overall nutrient retention, however bacteria and detrivorous
conversion are hardly integrated into intensive aquaculture systems, and their potential might
be underestimated. Their converter design and conversion-processes require, therefore, more
attention in the future. A general limitation of the reviewed system examples is the scarce re-
use of nutrients, which are excreted during conversion processes, and nutrients, which could
not be retained by those processes. If, in the future, recirculation systems should be developed
without nutrient discharge, the accumulation of unconverted nutrients in the culture system
has to be avoided. The prevention of such accumulation starts again at the Fish-Biomass-
Converter, where nutritionally balanced fish feeds are required, which reduce fish waste
production and result in more favorable nutrient ratios for the Phototrophic-Converter and
Bacteria-Waste-Converter. These better nutrient ratios will lead then to a higher overall
nutrient retention in the culture system, because fewer nutrients will be discharged unused
from these converters and, therefore, accumulation will be less. A future comparison
evaluating nutrient balances of such integrated intensive systems should be based on a
Chapter 2
38
hypothetical system design, using comparable fish production and waste loads. This will
deliver a more transparent picture of nutrient retentions in different modules, their design
criteria and of modules’ limitations. A general limitation of integrated systems is the potential
nutrient accumulation of either not retained or released nutrients. These nutrients need to be
reintegrated into the nutrient cycle to increase overall nutrient retentions further. Reviewing
the calculated balances, and limitations of intensive integrated aquaculture systems, the
perspectives of such integration are very promising, as these systems require fewer nutrients
in relation to overall production, and reduce nutrient discharge by re-utilization.
39
Chapter 3
Heterotrophic bacteria production utilizing the drum filter effluent of
a RAS: Influence of carbon supplementation and HRT
Abstract The drum filter effluent from a recirculation aquaculture system was used as substrate
to produce heterotrophic bacteria in suspended growth reactors. Effects of organic carbon
supplementation (0, 3, 6, 8g/l sodium acetate) and of hydraulic retention times (11-1h) on
bacteria biomass production and nutrient conversion were investigated. Bacteria production,
expressed as volatile suspended solids (VSS) was enhanced by organic carbon
supplementation, resulting in a production of 55-125g VSS/ kg fish feed (0.2-0.5gVSS/g
carbon). Maximum observed crude protein production was ~100g protein / kg fish feed. The
metabolic maintenance costs were 0.08Cmol/Cmol h-1, and the maximum growth rate was
0.25- 0.5h-1. 90% of the inorganic nitrogenous and 80% of ortho-phosphate-phosphorus were
converted. Producing bacteria on the drum filter effluent results in additional protein retention
and lower overall nutrient discharge from RAS.
Schneider, O., V. Sereti, M. A. M. Machiels, E. H. Eding and J. A. J. Verreth (submitted). "Heterotrophic bacteria production utilizing the drum filter effluent of a RAS: Influence of carbon supplementation and HRT." Water Research.
Chapter 3
40
Introduction Reuse of fish waste inside aquaculture systems focuses on dissolved substances
(Troell et al., 1999; Neori et al., 2004). Non-dissolved waste is often discharged as sludge,
leaving a significant amount of nutrients un-used (Chen et al., 1996). These discharged
nutrients, mainly organic carbon (C), nitrogen (N), and phosphorus (P) lead to environmental
pollution. This sludge can also be digested inside the system or used for composting or
landfill (Shnel et al., 2002; Losordo et al., 2003). Inside the culture system, heterotrophic
bacteria could convert these nutrients into bacterial biomass. This biomass can potentially be
used as fish feed, thereby reducing waste discharge. Heterotrophic bacteria production, is
applied in pond aquaculture systems culturing tilapia (Avnimelech et al., 1989), shrimps
(Burford et al., 2003; Burford et al., 2004), or catfish and tilapia together (Brune et al., 2003).
To date, only one attempt is known, where bacteria grown on fish waste in recirculation
aquaculture systems (RAS) were envisaged as feed ingredient (Knoesche and Tscheu, 1974).
In the latter system, activated sludge was used to purify the water and produce bacteria
biomass. However, this system had many disadvantages and was subsequently abandoned by
the RAS industry. Yet, the idea to produce bacteria biomass using suspended growth reactors
may still be valid if the RAS performance is not disturbed. One solution is to connect the
reactor to the drum filter effluent, so that interaction with the system is avoided.
A major constraint for producing heterotrophic bacteria is the C:N ratio in fish waste.
In RAS, sludge C:N ratios are usually lower than the optimal ratios needed for bacteria
production (Lechevallier et al., 1991; Avnimelech, 1999). Theoretically, when only feces are
used, nearly the optimal C:N ratios (12-15g/g) can be obtained. However, under practical
conditions, fish feces are in contact with the system water, which contains high concentrations
of dissolved N, resulting in much lower C:N values of the slurry (2-3). Carbon
supplementation can restore a proper C:N ratio, enabling solid waste conversion into bacteria
biomass. Such effects have been achieved in activated pond systems, where organic C was
supplemented. The farmed tilapia or shrimps were growing more efficient, because they
consumed additional biomass (Avnimelech, 1999; McIntosh, 2001).
The present study focused on intensive bacteria production utilizing solid fish waste
derived from the drum filter in a RAS with African catfish. The objectives were to investigate
1) the potential for bacteria production on fish waste by using different C supplementation
levels and hydraulic retention times (HRTs) and 2) to assess bacteria growth kinetics, such as
yields and maximum growth rate, specific substrate consumption rates and metabolic
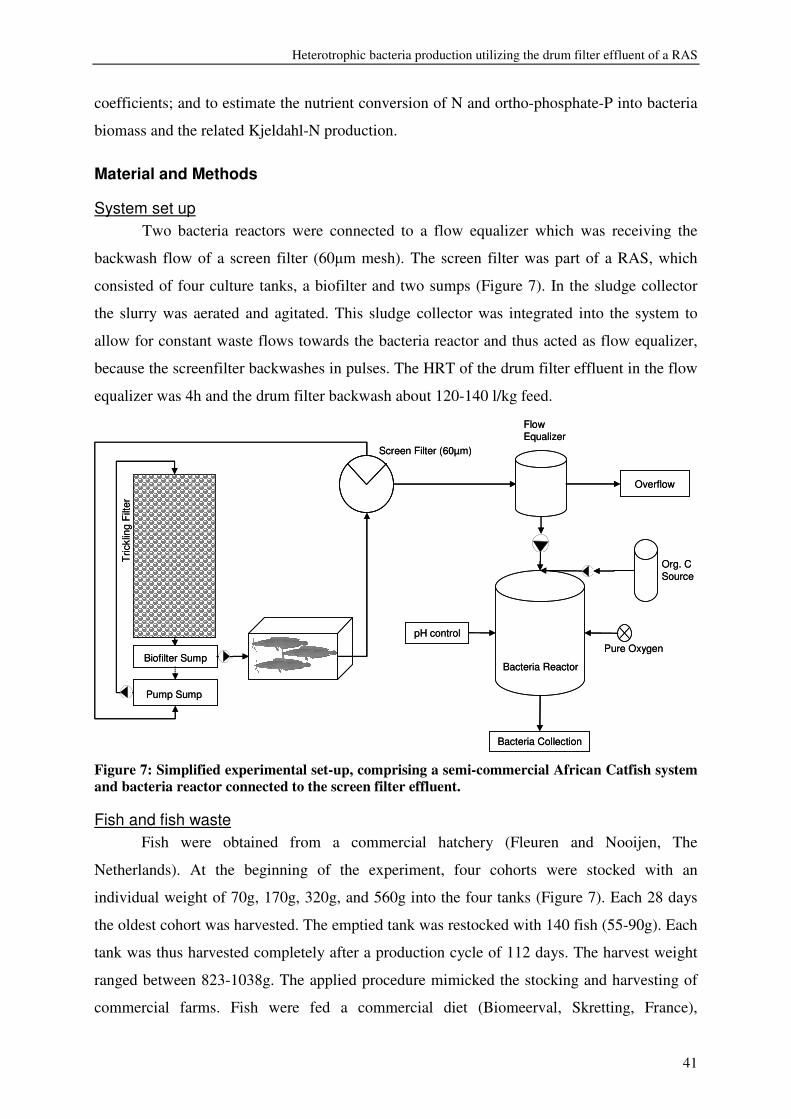
Heterotrophic bacteria production utilizing the drum filter effluent of a RAS
41
coefficients; and to estimate the nutrient conversion of N and ortho-phosphate-P into bacteria
biomass and the related Kjeldahl-N production.
Material and Methods
System set up Two bacteria reactors were connected to a flow equalizer which was receiving the
backwash flow of a screen filter (60�m mesh). The screen filter was part of a RAS, which
consisted of four culture tanks, a biofilter and two sumps (Figure 7). In the sludge collector
the slurry was aerated and agitated. This sludge collector was integrated into the system to
allow for constant waste flows towards the bacteria reactor and thus acted as flow equalizer,
because the screenfilter backwashes in pulses. The HRT of the drum filter effluent in the flow
equalizer was 4h and the drum filter backwash about 120-140 l/kg feed.
Bacteria Collection
pH control
Org. C Source
Screen Filter (60µm)
Flow Equalizer
Bacteria Reactor
Pump Sump
Biofilter Sump
Tric
klin
g Fi
lter
Pure Oxygen
Overflow
Bacteria Collection
pH control
Org. C Source
Screen Filter (60µm)
Flow Equalizer
Bacteria Reactor
Pump Sump
Biofilter Sump
Tric
klin
g Fi
lter
Pure Oxygen
Overflow
Figure 7: Simplified experimental set-up, comprising a semi-commercial African Catfish system and bacteria reactor connected to the screen filter effluent.
Fish and fish waste Fish were obtained from a commercial hatchery (Fleuren and Nooijen, The
Netherlands). At the beginning of the experiment, four cohorts were stocked with an
individual weight of 70g, 170g, 320g, and 560g into the four tanks (Figure 7). Each 28 days
the oldest cohort was harvested. The emptied tank was restocked with 140 fish (55-90g). Each
tank was thus harvested completely after a production cycle of 112 days. The harvest weight
ranged between 823-1038g. The applied procedure mimicked the stocking and harvesting of
commercial farms. Fish were fed a commercial diet (Biomeerval, Skretting, France),
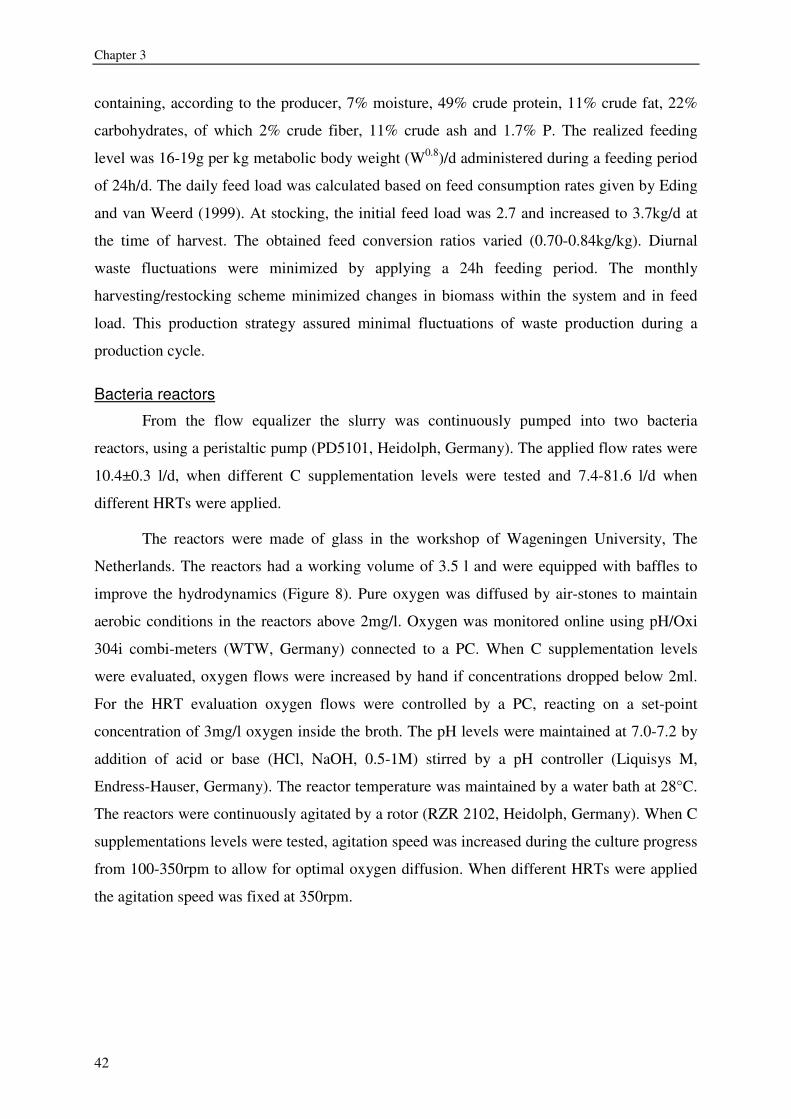
Chapter 3
42
containing, according to the producer, 7% moisture, 49% crude protein, 11% crude fat, 22%
carbohydrates, of which 2% crude fiber, 11% crude ash and 1.7% P. The realized feeding
level was 16-19g per kg metabolic body weight (W0.8)/d administered during a feeding period
of 24h/d. The daily feed load was calculated based on feed consumption rates given by Eding
and van Weerd (1999). At stocking, the initial feed load was 2.7 and increased to 3.7kg/d at
the time of harvest. The obtained feed conversion ratios varied (0.70-0.84kg/kg). Diurnal
waste fluctuations were minimized by applying a 24h feeding period. The monthly
harvesting/restocking scheme minimized changes in biomass within the system and in feed
load. This production strategy assured minimal fluctuations of waste production during a
production cycle.
Bacteria reactors
From the flow equalizer the slurry was continuously pumped into two bacteria
reactors, using a peristaltic pump (PD5101, Heidolph, Germany). The applied flow rates were
10.4±0.3 l/d, when different C supplementation levels were tested and 7.4-81.6 l/d when
different HRTs were applied.
The reactors were made of glass in the workshop of Wageningen University, The
Netherlands. The reactors had a working volume of 3.5 l and were equipped with baffles to
improve the hydrodynamics (Figure 8). Pure oxygen was diffused by air-stones to maintain
aerobic conditions in the reactors above 2mg/l. Oxygen was monitored online using pH/Oxi
304i combi-meters (WTW, Germany) connected to a PC. When C supplementation levels
were evaluated, oxygen flows were increased by hand if concentrations dropped below 2ml.
For the HRT evaluation oxygen flows were controlled by a PC, reacting on a set-point
concentration of 3mg/l oxygen inside the broth. The pH levels were maintained at 7.0-7.2 by
addition of acid or base (HCl, NaOH, 0.5-1M) stirred by a pH controller (Liquisys M,
Endress-Hauser, Germany). The reactor temperature was maintained by a water bath at 28°C.
The reactors were continuously agitated by a rotor (RZR 2102, Heidolph, Germany). When C
supplementations levels were tested, agitation speed was increased during the culture progress
from 100-350rpm to allow for optimal oxygen diffusion. When different HRTs were applied
the agitation speed was fixed at 350rpm.
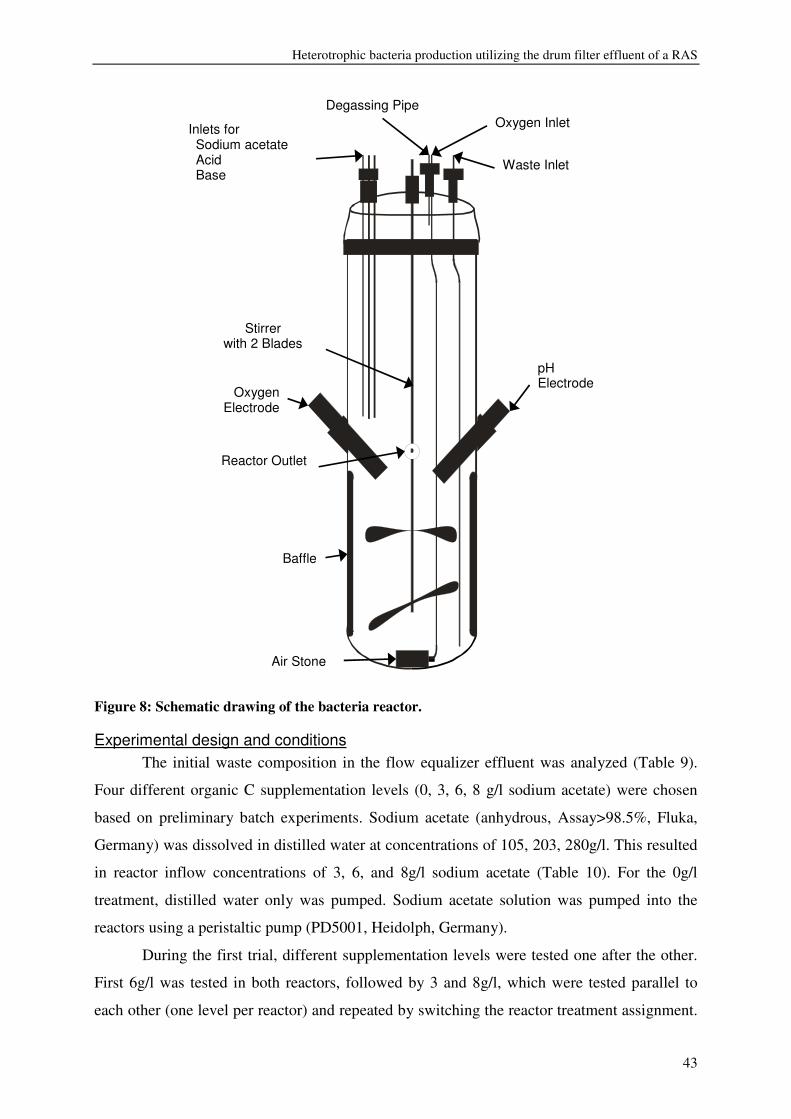
Heterotrophic bacteria production utilizing the drum filter effluent of a RAS
43
Figure 8: Schematic drawing of the bacteria reactor.
Experimental design and conditions The initial waste composition in the flow equalizer effluent was analyzed (Table 9).
Four different organic C supplementation levels (0, 3, 6, 8 g/l sodium acetate) were chosen
based on preliminary batch experiments. Sodium acetate (anhydrous, Assay>98.5%, Fluka,
Germany) was dissolved in distilled water at concentrations of 105, 203, 280g/l. This resulted
in reactor inflow concentrations of 3, 6, and 8g/l sodium acetate (Table 10). For the 0g/l
treatment, distilled water only was pumped. Sodium acetate solution was pumped into the
reactors using a peristaltic pump (PD5001, Heidolph, Germany).
During the first trial, different supplementation levels were tested one after the other.
First 6g/l was tested in both reactors, followed by 3 and 8g/l, which were tested parallel to
each other (one level per reactor) and repeated by switching the reactor treatment assignment.
Oxygen Electrode
pH Electrode
Air Stone
Stirrer with 2 Blades
Inlets for Sodium acetate Acid Base
Waste Inlet
Oxygen Inlet Degassing Pipe
Reactor Outlet
Baffle
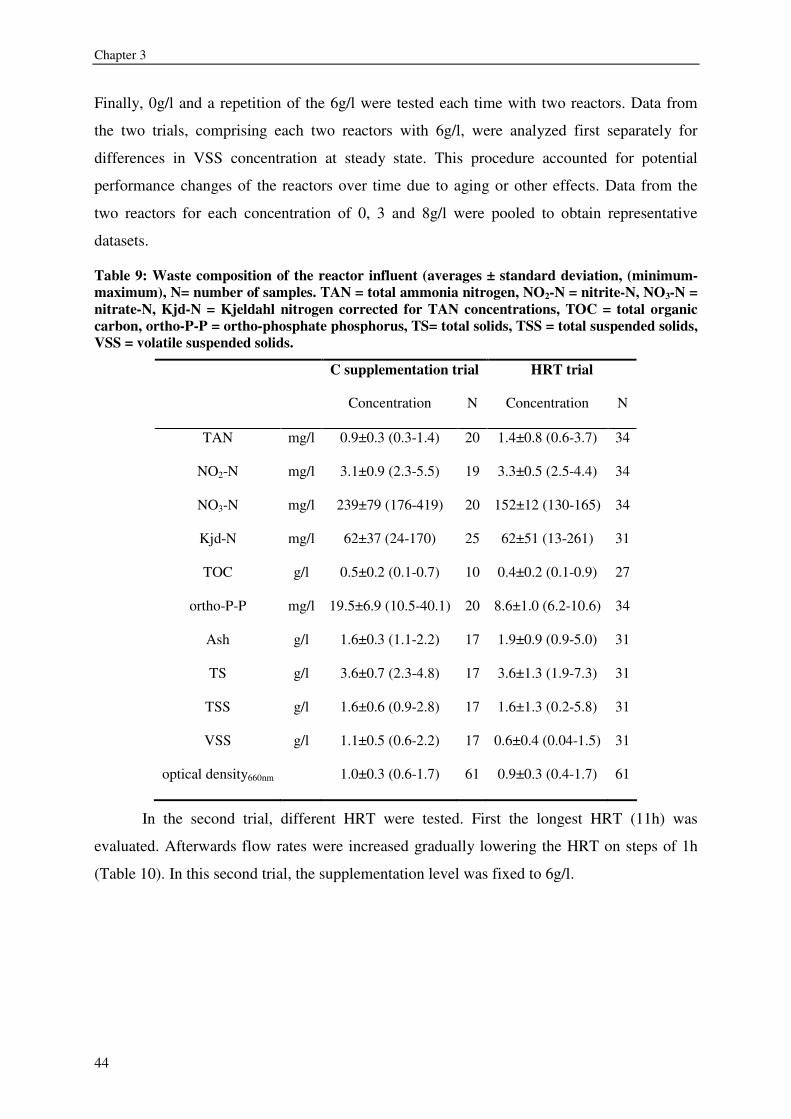
Chapter 3
44
Finally, 0g/l and a repetition of the 6g/l were tested each time with two reactors. Data from
the two trials, comprising each two reactors with 6g/l, were analyzed first separately for
differences in VSS concentration at steady state. This procedure accounted for potential
performance changes of the reactors over time due to aging or other effects. Data from the
two reactors for each concentration of 0, 3 and 8g/l were pooled to obtain representative
datasets.
Table 9: Waste composition of the reactor influent (averages ± standard deviation, (minimum-maximum), N= number of samples. TAN = total ammonia nitrogen, NO2-N = nitrite-N, NO3-N = nitrate-N, Kjd-N = Kjeldahl nitrogen corrected for TAN concentrations, TOC = total organic carbon, ortho-P-P = ortho-phosphate phosphorus, TS= total solids, TSS = total suspended solids, VSS = volatile suspended solids.
C supplementation trial HRT trial
Concentration N Concentration N
TAN
NO2-N
NO3-N
Kjd-N
mg/l
mg/l
mg/l
mg/l
0.9±0.3 (0.3-1.4)
3.1±0.9 (2.3-5.5)
239±79 (176-419)
62±37 (24-170)
20
19
20
25
1.4±0.8 (0.6-3.7)
3.3±0.5 (2.5-4.4)
152±12 (130-165)
62±51 (13-261)
34
34
34
31
TOC g/l 0.5±0.2 (0.1-0.7) 10 0.4±0.2 (0.1-0.9) 27
ortho-P-P mg/l 19.5±6.9 (10.5-40.1) 20 8.6±1.0 (6.2-10.6) 34
Ash g/l 1.6±0.3 (1.1-2.2) 17 1.9±0.9 (0.9-5.0) 31
TS g/l 3.6±0.7 (2.3-4.8) 17 3.6±1.3 (1.9-7.3) 31
TSS g/l 1.6±0.6 (0.9-2.8) 17 1.6±1.3 (0.2-5.8) 31
VSS g/l 1.1±0.5 (0.6-2.2) 17 0.6±0.4 (0.04-1.5) 31
optical density660nm 1.0±0.3 (0.6-1.7) 61 0.9±0.3 (0.4-1.7) 61
In the second trial, different HRT were tested. First the longest HRT (11h) was
evaluated. Afterwards flow rates were increased gradually lowering the HRT on steps of 1h
(Table 10). In this second trial, the supplementation level was fixed to 6g/l.
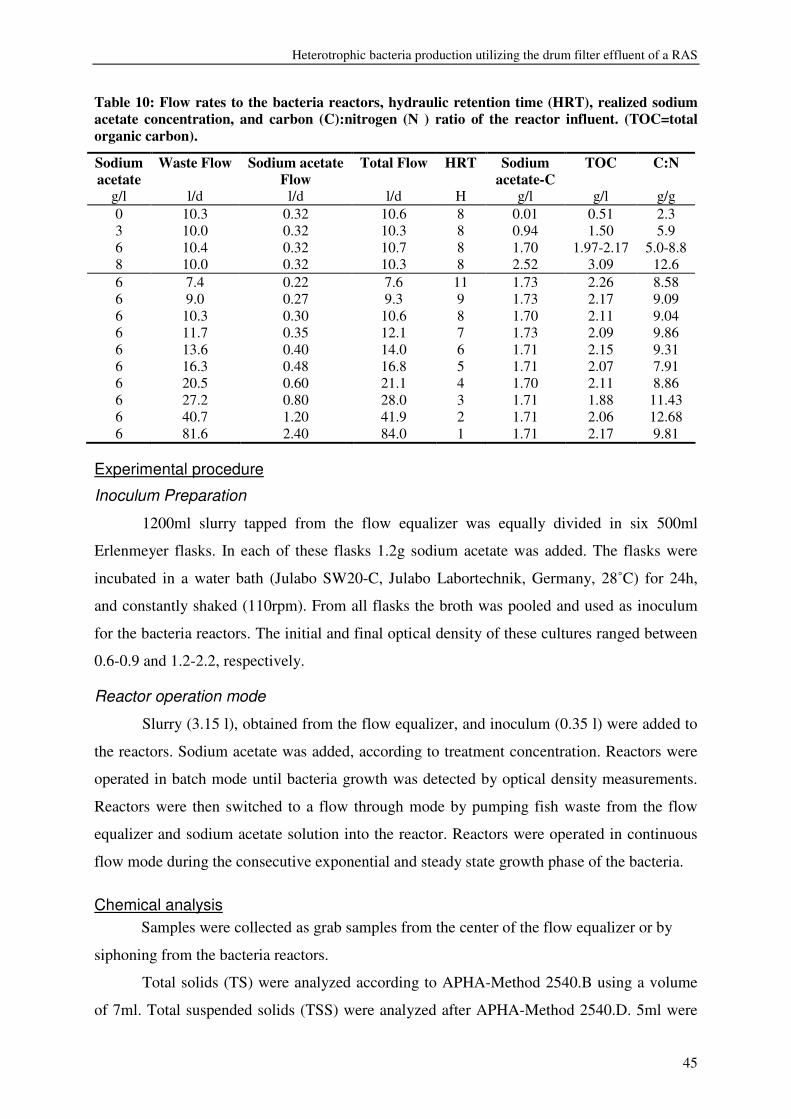
Heterotrophic bacteria production utilizing the drum filter effluent of a RAS
45
Table 10: Flow rates to the bacteria reactors, hydraulic retention time (HRT), realized sodium acetate concentration, and carbon (C):nitrogen (N ) ratio of the reactor influent. (TOC=total organic carbon).
Sodium acetate
Waste Flow Sodium acetate Flow
Total Flow HRT Sodium acetate-C
TOC C:N
g/l l/d l/d l/d H g/l g/l g/g 0 10.3 0.32 10.6 8 0.01 0.51 2.3 3 10.0 0.32 10.3 8 0.94 1.50 5.9 6 10.4 0.32 10.7 8 1.70 1.97-2.17 5.0-8.8 8 10.0 0.32 10.3 8 2.52 3.09 12.6 6 7.4 0.22 7.6 11 1.73 2.26 8.58 6 9.0 0.27 9.3 9 1.73 2.17 9.09 6 10.3 0.30 10.6 8 1.70 2.11 9.04 6 11.7 0.35 12.1 7 1.73 2.09 9.86 6 13.6 0.40 14.0 6 1.71 2.15 9.31 6 16.3 0.48 16.8 5 1.71 2.07 7.91 6 20.5 0.60 21.1 4 1.70 2.11 8.86 6 27.2 0.80 28.0 3 1.71 1.88 11.43 6 40.7 1.20 41.9 2 1.71 2.06 12.68 6 81.6 2.40 84.0 1 1.71 2.17 9.81
Experimental procedure
Inoculum Preparation
1200ml slurry tapped from the flow equalizer was equally divided in six 500ml
Erlenmeyer flasks. In each of these flasks 1.2g sodium acetate was added. The flasks were
incubated in a water bath (Julabo SW20-C, Julabo Labortechnik, Germany, 28˚C) for 24h,
and constantly shaked (110rpm). From all flasks the broth was pooled and used as inoculum
for the bacteria reactors. The initial and final optical density of these cultures ranged between
0.6-0.9 and 1.2-2.2, respectively.
Reactor operation mode
Slurry (3.15 l), obtained from the flow equalizer, and inoculum (0.35 l) were added to
the reactors. Sodium acetate was added, according to treatment concentration. Reactors were
operated in batch mode until bacteria growth was detected by optical density measurements.
Reactors were then switched to a flow through mode by pumping fish waste from the flow
equalizer and sodium acetate solution into the reactor. Reactors were operated in continuous
flow mode during the consecutive exponential and steady state growth phase of the bacteria.
Chemical analysis Samples were collected as grab samples from the center of the flow equalizer or by
siphoning from the bacteria reactors.
Total solids (TS) were analyzed according to APHA-Method 2540.B using a volume
of 7ml. Total suspended solids (TSS) were analyzed after APHA-Method 2540.D. 5ml were
Chapter 3
46
filtered through 0.45�m preweighted sodium acetate filters (Millipore, MF 0.45�m HA).
Fixed suspended solids and VSS were analyzed using APHA-Method 2540.E (Clesceri et al.,
1998). The VSS fraction is considered as a measure of bacteria concentration (Tchobanoglous
et al., 2003).
Optical density (OD) was used as a measure of bacteria concentration and correlated
linearly to VSS concentrations. OD was measured using a photometer at 660nm (cuvette-size
15mm diameter, round shape, Photometer SQ118, Merck, Germany). The obtained samples
(10ml) were diluted in case OD values exceeded 0.3.
In the C supplementation test, filtrate (0.45µm) was stored at -20˚C and later analyzed
by an autoanalyser (SAN, Skalar, The Netherlands) for total ammonia nitrogen (TAN), nitrite-
N, nitrate-N, and ortho-phosphate-P concentrations, using the methods 155-006, 461-318,
467-033, 503-317 from Skalar, dating from 1993 and 1999. In the HRT trial, a 20ml sub-
sample of a grab sample was centrifuged at 4000rpm for 10minutes and then stored at 4˚C for
further analysis as above. Kjeldahl nitrogen was determined in unfiltered grab samples which
were acidified (H2SO4) and stored at -20˚C prior to analysis using a Tecator 2020 Digestor
(400°C) for 4h and distillation by Tecator Kjeltec Autosampler system 1035 (Tecator AB,
Hoganas, Sweden) according to ISO 5983. To obtain organic N concentrations, the
measurements were corrected for TAN concentrations.
A filtrated or the supernatant of a centrifuged sample was stored at -20˚C and analyzed
for sodium acetate content using a gas chromatograph (HRGC Mega 2, Fisons, Italy, packed 6
feet column (inside diameter 2mm), Chromosorb 101 (80-100Mesh) nitrogen as carrier gas
saturated with formic acid, FID detector). The injection temperature was 185�C, the column
temperature 190�C and the detection temperature 225�C. Results were analyzed with
Chromcard 2.2 (Fisons, Italy). Total organic carbon (TOC) concentration of grab samples
from the reactor and flow equalizer were stored (-20˚C) and analyzed photometrically by
using the Dr. Lange test LCK 381 (Hach Lange, Germany).
Calculations VSS concentrations were checked for steady state by regressing measured values for
each supplementation level or HRT linear with subsequent F and t test, using SPSS 11.5
(SPSS Inc., USA). Steady state was accepted if the obtained regression was non-significantly
different from a regression with a slope of 0 (p>0.05). VSS concentrations were further
compared using ANOVA and Tukey’s post hoc test to determine differences caused by
supplementation levels or different HRTs. Furthermore a paired t-test (t<0.05) was used to
Heterotrophic bacteria production utilizing the drum filter effluent of a RAS
47
detect differences between reactors for the same HRT, in the second trial. In the C
supplementation experiment, bacteria growth was calculated using a logistic model (Brown
and Rothery, 1993). This model served to calculate yields and to compare those results with
measured yields.
) ( Steady State
1 ht k e VSS
VSS − −+=
(1)
VSS=concentration at time t (gVSS/l); VSSSteadyState=mean concentrations during steady state (gVSS/l); h= time, when 50% of VSSSteadyState is reached (h); t=time (h); k= steepness (h-1)
After VSSSteadyState, h, and k were estimated separately, the overall model was re-
estimated using the estimated values for k and h plus 10% as initial guesses, while
VSSSteadyState was constrained. The model fit was tested for each dataset obtained from a single
reactor using the Runs test to detect non-randomness (SPSS 11.5, SPSS Inc. USA, z<0.05).
Yields of bacteria production were calculated as gVSS/gCSodium acetate converted. VSS
yields for different HRTs were tested using ANOVA and Tukey’s Post Hoc test to compare
values of the same reactor and using a paired t-test to compare the performance of the two
reactors at parallel moments. Nutrient conversion and VSS production in g/kg feed at steady
state were analyzed by one-way ANOVA using SPSS 11.5. The means were compared by a
Tukey’s Post hoc test (p <0.05). In addition nutrient conversions were tested by paired t-test
to compare differences in reactor performance at the same time. The maximum yield was
estimated based on the maintenance concept (Tijhuis et al., 1993; Tijhuis et al., 1994). The
observed growth rate was calculated based on differences in VSS production over time at
steady states (equation 1). The results were applied in equation 2:
mY
qs += µ*1
max
(2)
qs=biomass-specific substrate consumption rate (gC/gVSS/h); Ymax=true biomass yield (gVSS/gC); µ=specific growth rate (h-1); m=maintenance coefficient (gC/gVSS/h)
Furthermore relations between supplementation levels and yields, and substrate flux
and specific substrate consumption rate or growth rate for different HRTs were related with
linear or non-linear regressions (NLREG 4.1, Sherrod Software, USA) or Microsoft Excel
2003 (Microsoft, USA).
Chapter 3
48
Results and Discussion
VSS concentrations and yields at steady state for different C supplementation levels No differences in steady state VSS concentrations of the two 6g/l repetitions were
observed (p=0.981), and data of these treatments were pooled. VSS steady state
concentrations showed significant differences (p<0.001) between treatments: 8g/l showed the
highest and 0g/l showed the lowest VSS concentration, even lower than the average values in
the flow equalizer (Table 11 and Figure 9). Bacteria growth was estimated using the model
(equation 1, Figure 9, Table 12). Because in the 0g/l treatment, VSS seemed degraded, no
growth model was established for this concentration. The model fit was better for 6g/l and
8g/l compared to 3g/l. The datasets for 3g/l might have been biased by the fluctuating VSS
concentrations in the flow equalizer (Table 9, Table 11). These concentrations were partly
exceeding reactor VSS concentrations. The non randomness test yielded significant results
(z=0.010) for one of the four 6g/l treatments. The means were not randomly distributed
around the model curve, but these differences between predicted and measured values can be
neglected. The difference mean was 0.08±0.05gVSS/l for the negative and ±0.1gVSS/l for the
positive values. Compared to an average concentration of 1.68gVSS/l, this difference can be
considered as very small. Yields were biased by fluctuating VSS inflow concentrations from
the flow equalizer. Therefore, besides the measured yields, also yields based on the growth
model were calculated (Table 12).
Table 11: Mean concentration and standard deviation (SD) for volatile suspended solids (VSS) inside the bacteria reactors during steady state calculated based on optical density (OD) measurements1,2. p is related to a mean comparison of VSS concentration for the different treatments (ANOVA). a-f are indicating significant differences among treatments (Tukey’s Post Hoc test, p<0.05). Differences among reactors for the same HRT were detected by paired t-test. Sod. =sodium; HRT=hydraulic retention time; N=number of sample points.
Carbon supplementation HRT Reactor 1 Reactor 2
Sod. acetate VSS (g/l) 1 N SD HRT VSS (g/l) 2 N SD VSS (g/l) 2 N SD t 0g/l 0.49a 6 0.02 11 0.66a,b 7 0.16 0.63a 7 0.09 0.312 3g/l 1.27b 32 0.13 9 1.14c 7 0.07 1.18b 7 0.08 0.375 6g/l 1.68c 29 0.13 8 1.12d,c 4 0.19 1.11b 4 0.07 0.914 8g/l 2.13d 18 0.19 7 0.94e,d,c 4 0.14 1.13b 4 0.21 0.339
6 0.87b,e,d 3 0.10 0.89c 3 0.04 0.044 5 0.93e,d,c 4 0.08 0.84c 4 0.06 0.055 4 0.82b,e 5 0.06 0.25d 5 0.07 0.000 3 0.72a,b,e 4 0.06 --- --- --- --- 2 0.55a 4 0.05 --- --- --- --- 1 0.27f 4 0.05 --- --- --- ---
p 0.000 0.000 0.000 1 VSSconcentration=0.8493*OD-0.1 (R2=0.69, n=41); 2 VSSconcentration=0.447*OD-0.1832 (R2=0.43, n=48)
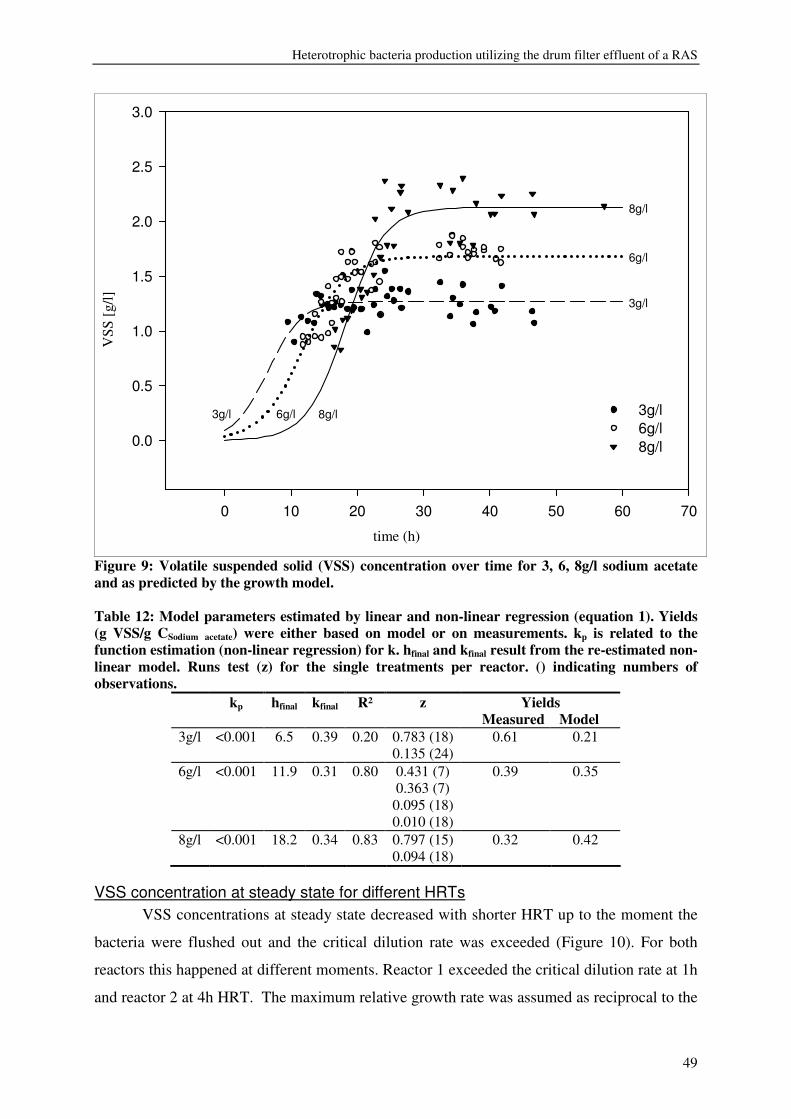
Heterotrophic bacteria production utilizing the drum filter effluent of a RAS
49
time [h]
0 10 20 30 40 50 60 70
VS
S [g
/l]
0.0
0.5
1.0
1.5
2.0
2.5
3.0
3g/l6g/l8g/l
8g/l
6g/l
3g/l
8g/l6g/l3g/l
Figure 9: Volatile suspended solid (VSS) concentration over time for 3, 6, 8g/l sodium acetate and as predicted by the growth model. Table 12: Model parameters estimated by linear and non-linear regression (equation 1). Yields (g VSS/g CSodium acetate) were either based on model or on measurements. kp is related to the function estimation (non-linear regression) for k. hfinal and kfinal result from the re-estimated non-linear model. Runs test (z) for the single treatments per reactor. () indicating numbers of observations.
kp hfinal kfinal R² z Yields Measured Model
3g/l <0.001 6.5 0.39 0.20 0.783 (18) 0.135 (24)
0.61 0.21
6g/l <0.001 11.9 0.31 0.80 0.431 (7) 0.363 (7) 0.095 (18) 0.010 (18)
0.39 0.35
8g/l <0.001 18.2 0.34 0.83 0.797 (15) 0.094 (18)
0.32 0.42
VSS concentration at steady state for different HRTs VSS concentrations at steady state decreased with shorter HRT up to the moment the
bacteria were flushed out and the critical dilution rate was exceeded (Figure 10). For both
reactors this happened at different moments. Reactor 1 exceeded the critical dilution rate at 1h
and reactor 2 at 4h HRT. The maximum relative growth rate was assumed as reciprocal to the
time (h)
VSS
[g/l]
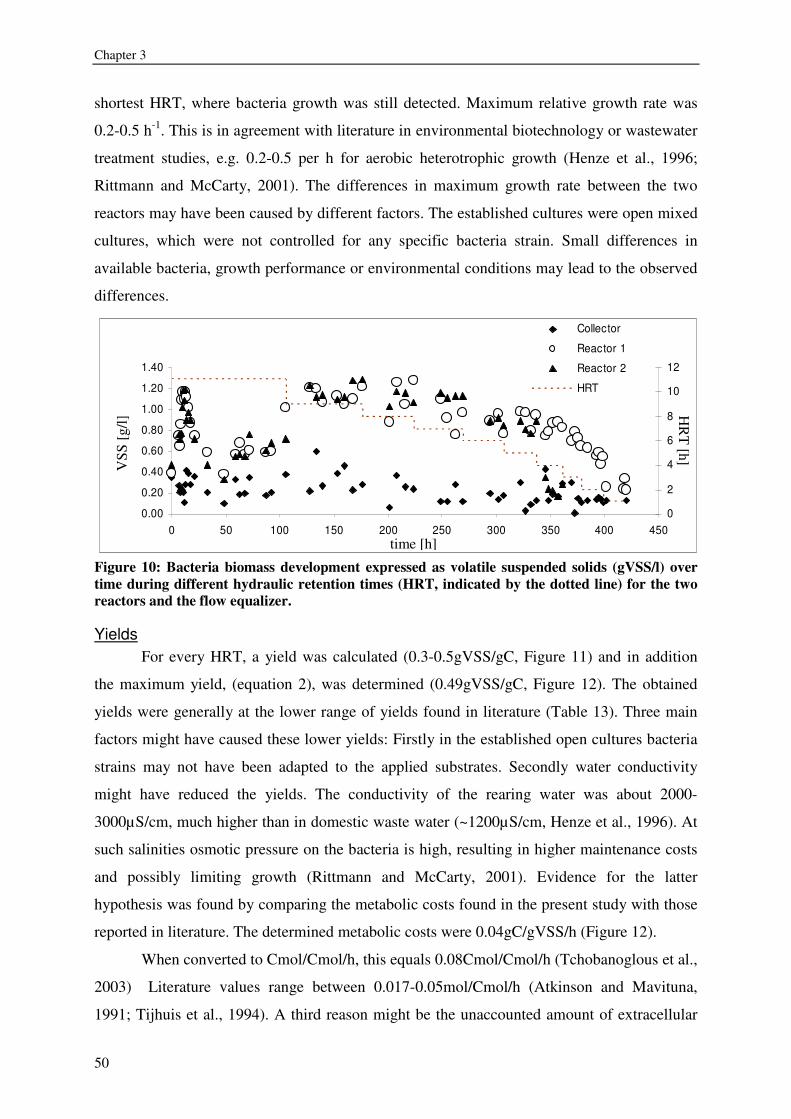
Chapter 3
50
shortest HRT, where bacteria growth was still detected. Maximum relative growth rate was
0.2-0.5 h-1. This is in agreement with literature in environmental biotechnology or wastewater
treatment studies, e.g. 0.2-0.5 per h for aerobic heterotrophic growth (Henze et al., 1996;
Rittmann and McCarty, 2001). The differences in maximum growth rate between the two
reactors may have been caused by different factors. The established cultures were open mixed
cultures, which were not controlled for any specific bacteria strain. Small differences in
available bacteria, growth performance or environmental conditions may lead to the observed
differences.
0.00
0.20
0.40
0.60
0.80
1.00
1.20
1.40
0 50 100 150 200 250 300 350 400 450tim e (h)
VS
S (
g/l)
0
2
4
6
8
10
12
HR
T (
h)
Collector
Reactor 1
Reactor 2
HRT
Figure 10: Bacteria biomass development expressed as volatile suspended solids (gVSS/l) over time during different hydraulic retention times (HRT, indicated by the dotted line) for the two reactors and the flow equalizer.
Yields For every HRT, a yield was calculated (0.3-0.5gVSS/gC, Figure 11) and in addition
the maximum yield, (equation 2), was determined (0.49gVSS/gC, Figure 12). The obtained
yields were generally at the lower range of yields found in literature (Table 13). Three main
factors might have caused these lower yields: Firstly in the established open cultures bacteria
strains may not have been adapted to the applied substrates. Secondly water conductivity
might have reduced the yields. The conductivity of the rearing water was about 2000-
3000µS/cm, much higher than in domestic waste water (~1200µS/cm, Henze et al., 1996). At
such salinities osmotic pressure on the bacteria is high, resulting in higher maintenance costs
and possibly limiting growth (Rittmann and McCarty, 2001). Evidence for the latter
hypothesis was found by comparing the metabolic costs found in the present study with those
reported in literature. The determined metabolic costs were 0.04gC/gVSS/h (Figure 12).
When converted to Cmol/Cmol/h, this equals 0.08Cmol/Cmol/h (Tchobanoglous et al.,
2003) Literature values range between 0.017-0.05mol/Cmol/h (Atkinson and Mavituna,
1991; Tijhuis et al., 1994). A third reason might be the unaccounted amount of extracellular
VSS
[g/l]
time [h]
HR
T [h]
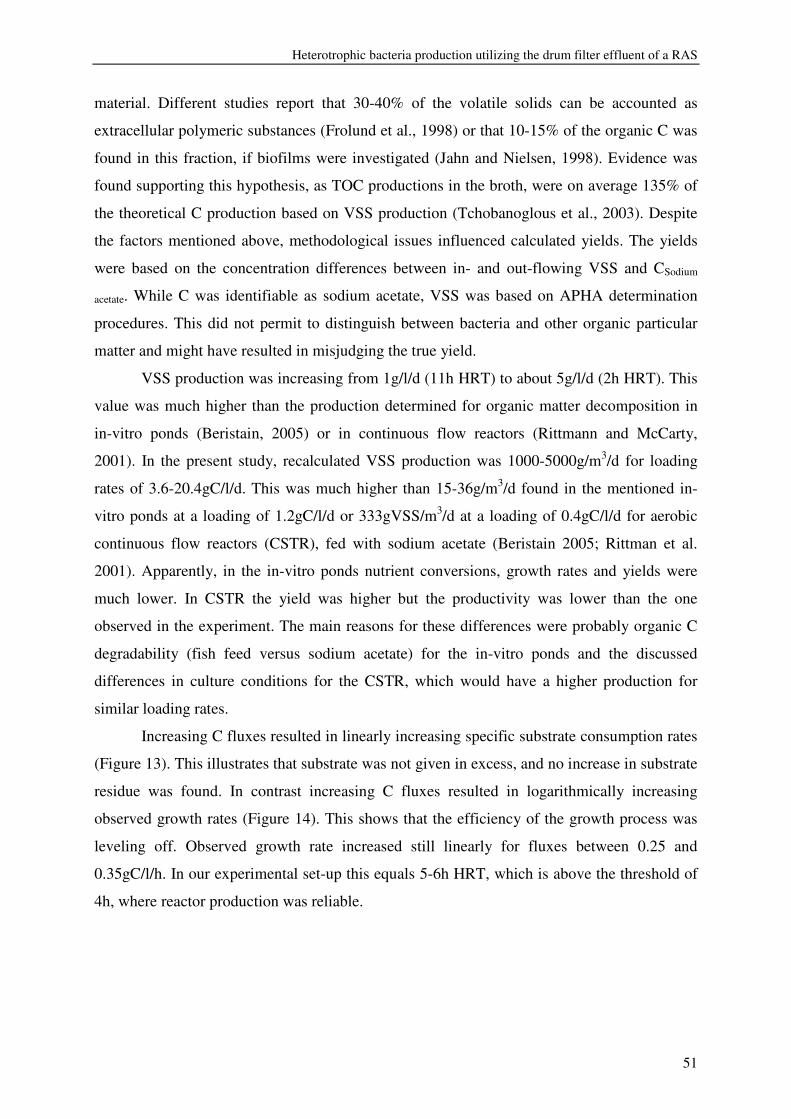
Heterotrophic bacteria production utilizing the drum filter effluent of a RAS
51
material. Different studies report that 30-40% of the volatile solids can be accounted as
extracellular polymeric substances (Frolund et al., 1998) or that 10-15% of the organic C was
found in this fraction, if biofilms were investigated (Jahn and Nielsen, 1998). Evidence was
found supporting this hypothesis, as TOC productions in the broth, were on average 135% of
the theoretical C production based on VSS production (Tchobanoglous et al., 2003). Despite
the factors mentioned above, methodological issues influenced calculated yields. The yields
were based on the concentration differences between in- and out-flowing VSS and CSodium
acetate. While C was identifiable as sodium acetate, VSS was based on APHA determination
procedures. This did not permit to distinguish between bacteria and other organic particular
matter and might have resulted in misjudging the true yield.
VSS production was increasing from 1g/l/d (11h HRT) to about 5g/l/d (2h HRT). This
value was much higher than the production determined for organic matter decomposition in
in-vitro ponds (Beristain, 2005) or in continuous flow reactors (Rittmann and McCarty,
2001). In the present study, recalculated VSS production was 1000-5000g/m3/d for loading
rates of 3.6-20.4gC/l/d. This was much higher than 15-36g/m3/d found in the mentioned in-
vitro ponds at a loading of 1.2gC/l/d or 333gVSS/m3/d at a loading of 0.4gC/l/d for aerobic
continuous flow reactors (CSTR), fed with sodium acetate (Beristain 2005; Rittman et al.
2001). Apparently, in the in-vitro ponds nutrient conversions, growth rates and yields were
much lower. In CSTR the yield was higher but the productivity was lower than the one
observed in the experiment. The main reasons for these differences were probably organic C
degradability (fish feed versus sodium acetate) for the in-vitro ponds and the discussed
differences in culture conditions for the CSTR, which would have a higher production for
similar loading rates.
Increasing C fluxes resulted in linearly increasing specific substrate consumption rates
(Figure 13). This illustrates that substrate was not given in excess, and no increase in substrate
residue was found. In contrast increasing C fluxes resulted in logarithmically increasing
observed growth rates (Figure 14). This shows that the efficiency of the growth process was
leveling off. Observed growth rate increased still linearly for fluxes between 0.25 and
0.35gC/l/h. In our experimental set-up this equals 5-6h HRT, which is above the threshold of
4h, where reactor production was reliable.
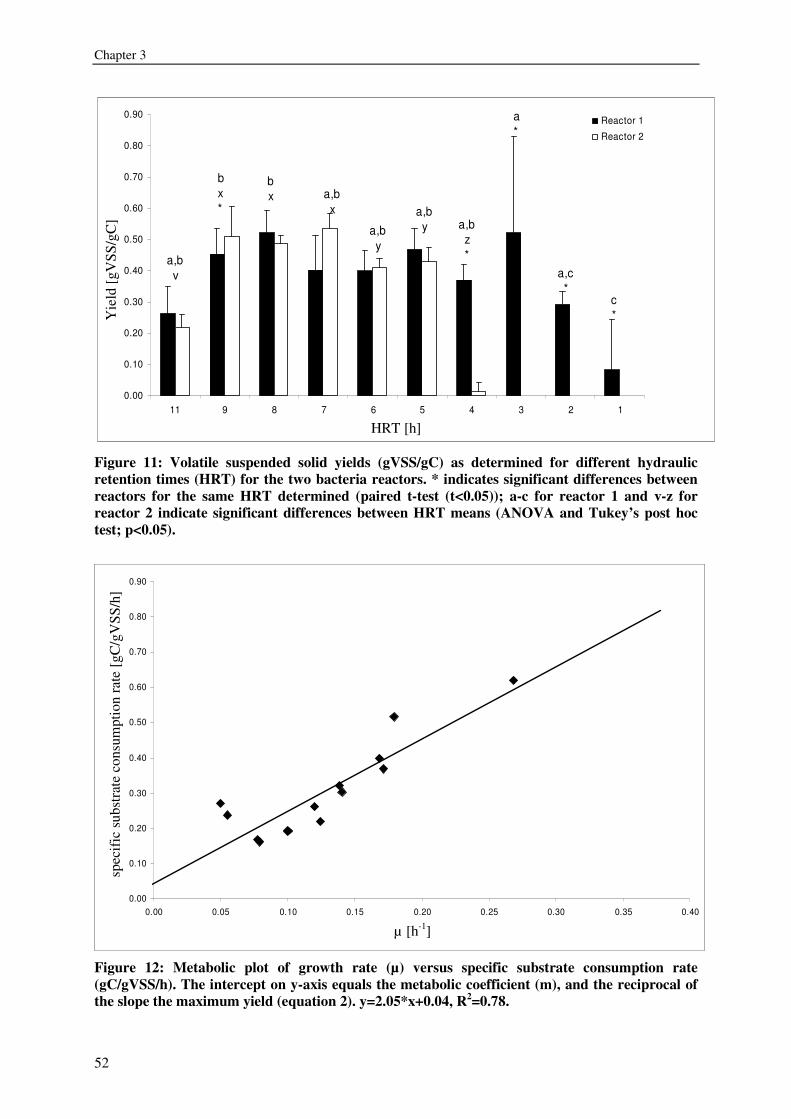
Chapter 3
52
0.00
0.10
0.20
0.30
0.40
0.50
0.60
0.70
0.80
0.90
11 9 8 7 6 5 4 3 2 1
HRT (h)
gVS
S/g
CReactor 1
Reactor 2
c*
a,c*
a*
a,bv
a,bz*
a,by
a,by
a,bx
bx
bx*
Figure 11: Volatile suspended solid yields (gVSS/gC) as determined for different hydraulic retention times (HRT) for the two bacteria reactors. * indicates significant differences between reactors for the same HRT determined (paired t-test (t<0.05)); a-c for reactor 1 and v-z for reactor 2 indicate significant differences between HRT means (ANOVA and Tukey’s post hoc test; p<0.05).
0.00
0.10
0.20
0.30
0.40
0.50
0.60
0.70
0.80
0.90
0.00 0.05 0.10 0.15 0.20 0.25 0.30 0.35 0.40
µ [h-1]
spec
ific
sub
stra
te c
onsu
mpt
ion
rat
e [g
C/ g
VS
S p
er h
]
Figure 12: Metabolic plot of growth rate (µ) versus specific substrate consumption rate (gC/gVSS/h). The intercept on y-axis equals the metabolic coefficient (m), and the reciprocal of the slope the maximum yield (equation 2). y=2.05*x+0.04, R2=0.78.
HRT [h]
Yie
ld [g
VSS
/gC
]
µ [h-1]
spec
ific
sub
stra
te c
onsu
mpt
ion
rate
[gC
/gV
SS/h
]
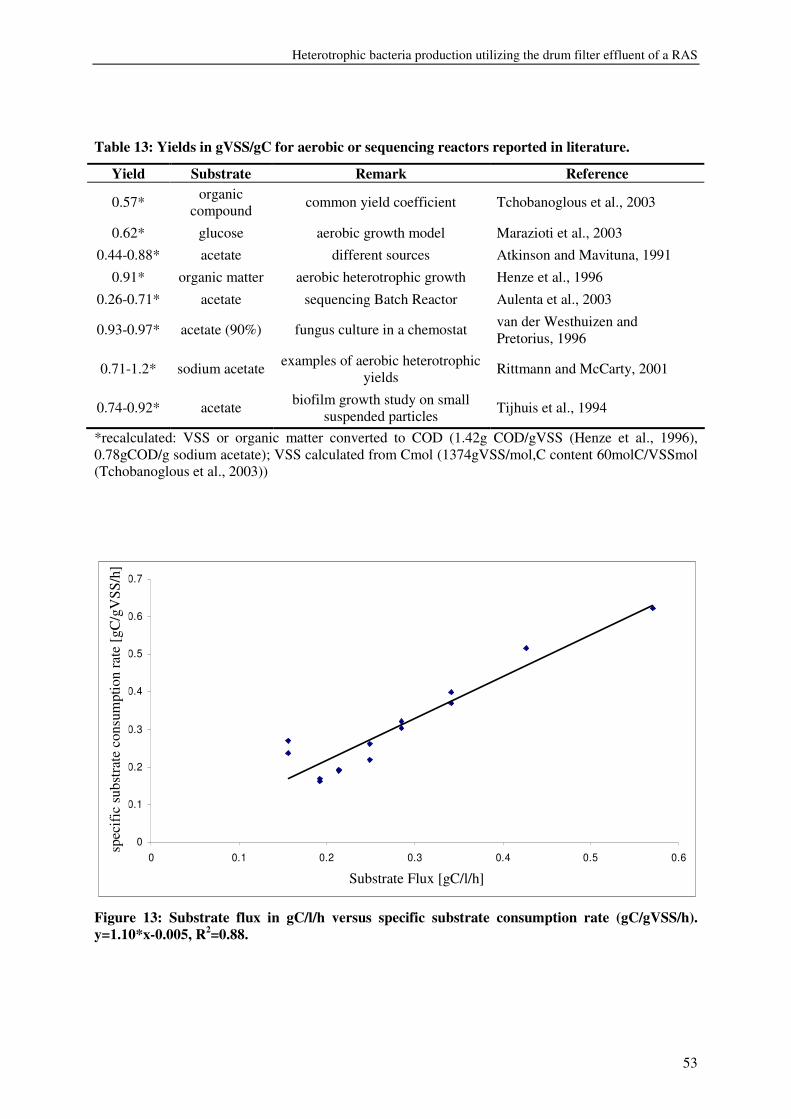
Heterotrophic bacteria production utilizing the drum filter effluent of a RAS
53
Table 13: Yields in gVSS/gC for aerobic or sequencing reactors reported in literature.
Yield Substrate Remark Reference
0.57* organic compound common yield coefficient Tchobanoglous et al., 2003
0.62* glucose aerobic growth model Marazioti et al., 2003 0.44-0.88* acetate different sources Atkinson and Mavituna, 1991
0.91* organic matter aerobic heterotrophic growth Henze et al., 1996
0.26-0.71* acetate sequencing Batch Reactor Aulenta et al., 2003
0.93-0.97* acetate (90%) fungus culture in a chemostat van der Westhuizen and Pretorius, 1996
0.71-1.2* sodium acetate examples of aerobic heterotrophic yields Rittmann and McCarty, 2001
0.74-0.92* acetate biofilm growth study on small suspended particles Tijhuis et al., 1994
*recalculated: VSS or organic matter converted to COD (1.42g COD/gVSS (Henze et al., 1996), 0.78gCOD/g sodium acetate); VSS calculated from Cmol (1374gVSS/mol,C content 60molC/VSSmol (Tchobanoglous et al., 2003))
0
0.1
0.2
0.3
0.4
0.5
0.6
0.7
0 0.1 0.2 0.3 0.4 0.5 0.6
Substrate Flux [gC/l/h]
Spe
cific
Sub
stra
te C
onsu
mpt
ion
(gC
/gV
SS
/h)
Figure 13: Substrate flux in gC/l/h versus specific substrate consumption rate (gC/gVSS/h). y=1.10*x-0.005, R2=0.88.
Substrate Flux [gC/l/h]
spec
ific
sub
stra
te c
onsu
mpt
ion
rate
[gC
/gV
SS/h
]
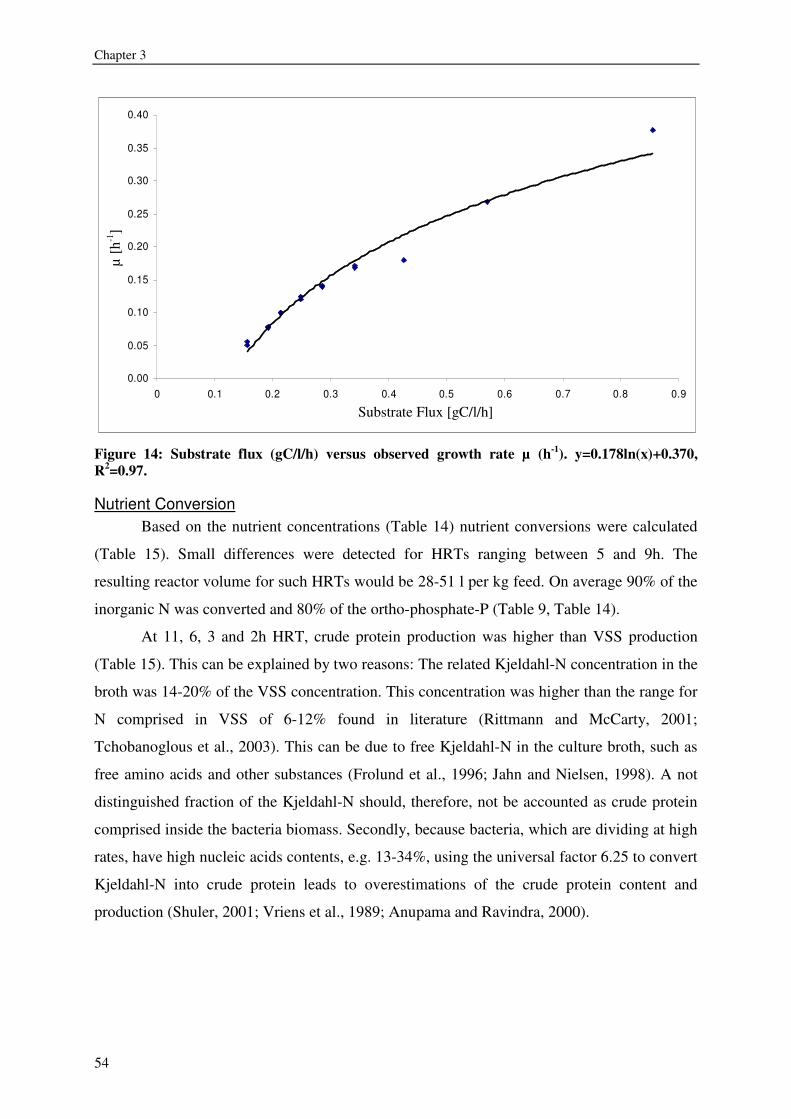
Chapter 3
54
0.00
0.05
0.10
0.15
0.20
0.25
0.30
0.35
0.40
0 0.1 0.2 0.3 0.4 0.5 0.6 0.7 0.8 0.9
Flux [gC/l/h]
µ [h
-1]
Figure 14: Substrate flux (gC/l/h) versus observed growth rate µ (h-1). y=0.178ln(x)+0.370, R2=0.97.
Nutrient Conversion Based on the nutrient concentrations (Table 14) nutrient conversions were calculated
(Table 15). Small differences were detected for HRTs ranging between 5 and 9h. The
resulting reactor volume for such HRTs would be 28-51 l per kg feed. On average 90% of the
inorganic N was converted and 80% of the ortho-phosphate-P (Table 9, Table 14).
At 11, 6, 3 and 2h HRT, crude protein production was higher than VSS production
(Table 15). This can be explained by two reasons: The related Kjeldahl-N concentration in the
broth was 14-20% of the VSS concentration. This concentration was higher than the range for
N comprised in VSS of 6-12% found in literature (Rittmann and McCarty, 2001;
Tchobanoglous et al., 2003). This can be due to free Kjeldahl-N in the culture broth, such as
free amino acids and other substances (Frolund et al., 1996; Jahn and Nielsen, 1998). A not
distinguished fraction of the Kjeldahl-N should, therefore, not be accounted as crude protein
comprised inside the bacteria biomass. Secondly, because bacteria, which are dividing at high
rates, have high nucleic acids contents, e.g. 13-34%, using the universal factor 6.25 to convert
Kjeldahl-N into crude protein leads to overestimations of the crude protein content and
production (Shuler, 2001; Vriens et al., 1989; Anupama and Ravindra, 2000).
Substrate Flux [gC/l/h]
µ [h
-1]
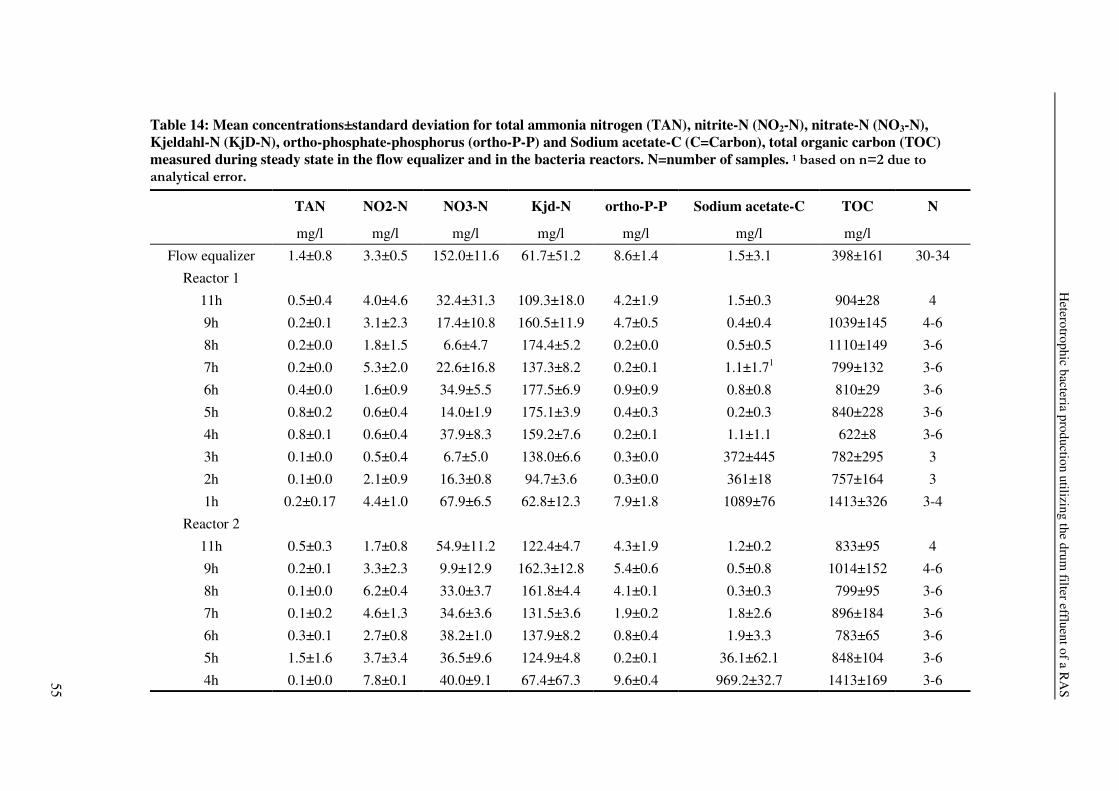
Heterotrophic bacteria production utilizing the drum
filter effluent of a RA
S
55
N
30-34
4
4-6
3-6
3-6
3-6
3-6
3-6
3
3
3-4
4
4-6
3-6
3-6
3-6
3-6
3-6
TOC
mg/l
398±161
904±28
1039±145
1110±149
799±132
810±29
840±228
622±8
782±295
757±164
1413±326
833±95
1014±152
799±95
896±184
783±65
848±104
1413±169
Sodium acetate-C
mg/l
1.5±3.1
1.5±0.3
0.4±0.4
0.5±0.5
1.1±1.71
0.8±0.8
0.2±0.3
1.1±1.1
372±445
361±18
1089±76
1.2±0.2
0.5±0.8
0.3±0.3
1.8±2.6
1.9±3.3
36.1±62.1
969.2±32.7
ortho-P-P
mg/l
8.6±1.4
4.2±1.9
4.7±0.5
0.2±0.0
0.2±0.1
0.9±0.9
0.4±0.3
0.2±0.1
0.3±0.0
0.3±0.0
7.9±1.8
4.3±1.9
5.4±0.6
4.1±0.1
1.9±0.2
0.8±0.4
0.2±0.1
9.6±0.4
Kjd-N
mg/l
61.7±51.2
109.3±18.0
160.5±11.9
174.4±5.2
137.3±8.2
177.5±6.9
175.1±3.9
159.2±7.6
138.0±6.6
94.7±3.6
62.8±12.3
122.4±4.7
162.3±12.8
161.8±4.4
131.5±3.6
137.9±8.2
124.9±4.8
67.4±67.3
NO3-N
mg/l
152.0±11.6
32.4±31.3
17.4±10.8
6.6±4.7
22.6±16.8
34.9±5.5
14.0±1.9
37.9±8.3
6.7±5.0
16.3±0.8
67.9±6.5
54.9±11.2
9.9±12.9
33.0±3.7
34.6±3.6
38.2±1.0
36.5±9.6
40.0±9.1
NO2-N
mg/l
3.3±0.5
4.0±4.6
3.1±2.3
1.8±1.5
5.3±2.0
1.6±0.9
0.6±0.4
0.6±0.4
0.5±0.4
2.1±0.9
4.4±1.0
1.7±0.8
3.3±2.3
6.2±0.4
4.6±1.3
2.7±0.8
3.7±3.4
7.8±0.1
TAN
mg/l
1.4±0.8
0.5±0.4
0.2±0.1
0.2±0.0
0.2±0.0
0.4±0.0
0.8±0.2
0.8±0.1
0.1±0.0
0.1±0.0
0.2±0.17
0.5±0.3
0.2±0.1
0.1±0.0
0.1±0.2
0.3±0.1
1.5±1.6
0.1±0.0
Table 14: Mean concentrations±standard deviation for total ammonia nitrogen (TAN), nitrite-N (NO2-N), nitrate-N (NO3-N), Kjeldahl-N (KjD-N), ortho-phosphate-phosphorus (ortho-P-P) and Sodium acetate-C (C=Carbon), total organic carbon (TOC) measured during steady state in the flow equalizer and in the bacteria reactors. N=number of samples. ���������������� ������ ������������
Flow equalizer
Reactor 1
11h
9h
8h
7h
6h
5h
4h
3h
2h
1h
Reactor 2
11h
9h
8h
7h
6h
5h
4h
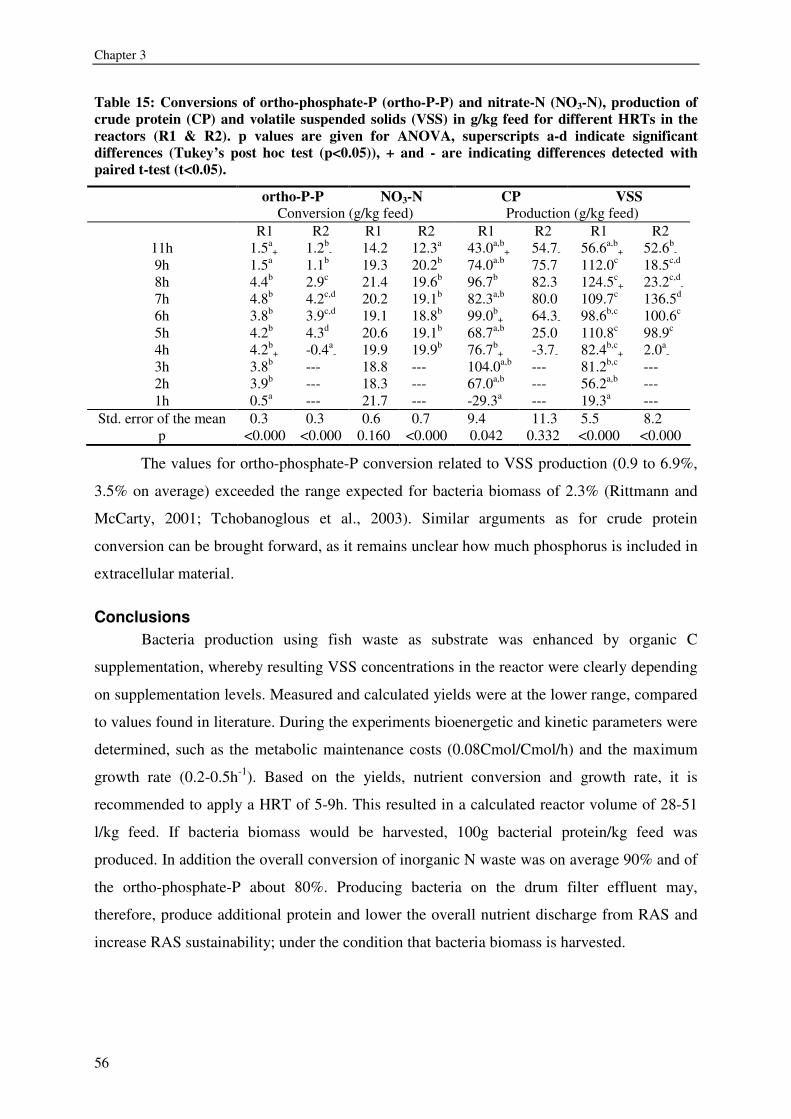
Chapter 3
56
Table 15: Conversions of ortho-phosphate-P (ortho-P-P) and nitrate-N (NO3-N), production of crude protein (CP) and volatile suspended solids (VSS) in g/kg feed for different HRTs in the reactors (R1 & R2). p values are given for ANOVA, superscripts a-d indicate significant differences (Tukey’s post hoc test (p<0.05)), + and - are indicating differences detected with paired t-test (t<0.05).
ortho-P-P NO3-N CP VSS Conversion (g/kg feed) Production (g/kg feed)
R1 R2 R1 R2 R1 R2 R1 R2 11h 1.5a
+ 1.2b- 14.2 12.3a 43.0a,b
+ 54.7- 56.6a,b+ 52.6b
-
9h 1.5a 1.1b 19.3 20.2b 74.0a.b 75.7 112.0c 18.5c,d
8h 4.4b 2.9c 21.4 19.6b 96.7b 82.3 124.5c+ 23.2c,d
-
7h 4.8b 4.2c,d 20.2 19.1b 82.3a,b 80.0 109.7c 136.5d
6h 3.8b 3.9c,d 19.1 18.8b 99.0b+ 64.3- 98.6b,c 100.6c
5h 4.2b 4.3d 20.6 19.1b 68.7a,b 25.0 110.8c 98.9c
4h 4.2b+ -0.4a
- 19.9 19.9b 76.7b+ -3.7- 82.4b,c
+ 2.0a-
3h 3.8b --- 18.8 --- 104.0a,b --- 81.2b,c --- 2h 3.9b --- 18.3 --- 67.0a,b --- 56.2a,b --- 1h 0.5a --- 21.7 --- -29.3a --- 19.3a ---
Std. error of the mean 0.3 0.3 0.6 0.7 9.4 11.3 5.5 8.2 p <0.000 <0.000 0.160 <0.000 0.042 0.332 <0.000 <0.000
The values for ortho-phosphate-P conversion related to VSS production (0.9 to 6.9%,
3.5% on average) exceeded the range expected for bacteria biomass of 2.3% (Rittmann and
McCarty, 2001; Tchobanoglous et al., 2003). Similar arguments as for crude protein
conversion can be brought forward, as it remains unclear how much phosphorus is included in
extracellular material.
Conclusions Bacteria production using fish waste as substrate was enhanced by organic C
supplementation, whereby resulting VSS concentrations in the reactor were clearly depending
on supplementation levels. Measured and calculated yields were at the lower range, compared
to values found in literature. During the experiments bioenergetic and kinetic parameters were
determined, such as the metabolic maintenance costs (0.08Cmol/Cmol/h) and the maximum
growth rate (0.2-0.5h-1). Based on the yields, nutrient conversion and growth rate, it is
recommended to apply a HRT of 5-9h. This resulted in a calculated reactor volume of 28-51
l/kg feed. If bacteria biomass would be harvested, 100g bacterial protein/kg feed was
produced. In addition the overall conversion of inorganic N waste was on average 90% and of
the ortho-phosphate-P about 80%. Producing bacteria on the drum filter effluent may,
therefore, produce additional protein and lower the overall nutrient discharge from RAS and
increase RAS sustainability; under the condition that bacteria biomass is harvested.
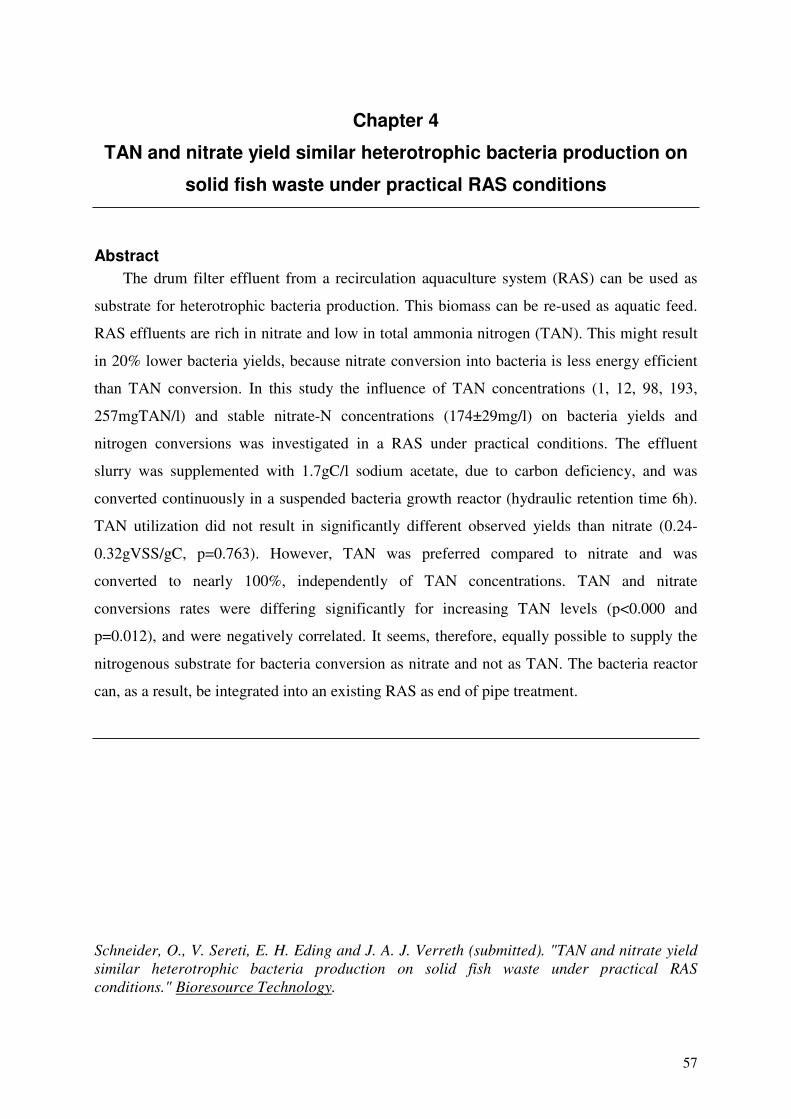
57
Chapter 4
TAN and nitrate yield similar heterotrophic bacteria production on
solid fish waste under practical RAS conditions
Abstract The drum filter effluent from a recirculation aquaculture system (RAS) can be used as
substrate for heterotrophic bacteria production. This biomass can be re-used as aquatic feed.
RAS effluents are rich in nitrate and low in total ammonia nitrogen (TAN). This might result
in 20% lower bacteria yields, because nitrate conversion into bacteria is less energy efficient
than TAN conversion. In this study the influence of TAN concentrations (1, 12, 98, 193,
257mgTAN/l) and stable nitrate-N concentrations (174±29mg/l) on bacteria yields and
nitrogen conversions was investigated in a RAS under practical conditions. The effluent
slurry was supplemented with 1.7gC/l sodium acetate, due to carbon deficiency, and was
converted continuously in a suspended bacteria growth reactor (hydraulic retention time 6h).
TAN utilization did not result in significantly different observed yields than nitrate (0.24-
0.32gVSS/gC, p=0.763). However, TAN was preferred compared to nitrate and was
converted to nearly 100%, independently of TAN concentrations. TAN and nitrate
conversions rates were differing significantly for increasing TAN levels (p<0.000 and
p=0.012), and were negatively correlated. It seems, therefore, equally possible to supply the
nitrogenous substrate for bacteria conversion as nitrate and not as TAN. The bacteria reactor
can, as a result, be integrated into an existing RAS as end of pipe treatment.
Schneider, O., V. Sereti, E. H. Eding and J. A. J. Verreth (submitted). "TAN and nitrate yield similar heterotrophic bacteria production on solid fish waste under practical RAS conditions." Bioresource Technology.
Chapter 4
58
Introduction In aquaculture systems aerobic heterotrophic bacteria convert nitrogen (N) and
phosphorous (P) originating from dissolved and solid fish waste into bacteria biomass. This
biomass can be re-utilized as aquatic feed. This re-use of otherwise wasted nutrients increases
system sustainability. This approach has been applied in intensive shrimp ponds, activated
tilapia ponds and recirculation aquaculture systems (RAS) (Knoesche and Tscheu, 1974;
Avnimelech et al., 1989; Burford et al., 2003; Hari et al., 2004). Such heterotrophic bacteria
conversion requires carbon/nitrogen (C: N) ratios of 12-15 (w/w) for optimal biomass
production (Henze et al., 1996; Lechevallier et al., 1991). In the case of RAS, where drum
filters are used to separate solid and dissolved waste, the C: N ratios of the drum filter effluent
are only 3 or lower. This is due to the high nitrate content of the slurry. Under such conditions
organic C must be supplemented if the slurry should be utilized for bacteria production. An
example of such a C donor is sodium acetate. However, earlier experiments showed bacteria
yields which were lower compared to yields reported in literature (Henze et al., 1996;
Rittmann and McCarty, 2001, Schneider et al., submitted). These lower yields can be caused
by the fact that, in RAS, N is mainly available as nitrate instead of TAN (total ammonia
nitrogen). Nitrate conversion into bacteria biomass requires more energy than TAN
conversion. In addition TAN is the preferred N source for bacteria compared to nitrate (Vriens
et al., 1989; Rittmann and McCarty, 2001). In earlier experiments, the maximum observed
yield for the conversion of fish waste utilizing nitrate and sodium acetate was about
0.5gVSS/gC. For this yield, an energy-transfer efficiency of 0.35 can be calculated as the ratio
between cell synthesis and electron-acceptance. This ratio represents the energy loss by
electron transfers. It is, therefore, a measure of bioenergetic factors limiting the bacteria
growth (Rittmann and McCarty, 2001). In a similar approach, using the same energy-transfer
efficiency of 0.35, but now replacing nitrate by TAN as N source, a yield of 0.6gVSS/gC can
be calculated. This is 20% higher than the nitrate yield:
0.125CH3COO-+0.17O2+0.016NH4+
�0.016C5H7O2N+0.059CO2+0.109HCO3-+0.109H2O
0.125CH3COO-+0.15O2+0.014NO3-+ 0.014H+
�0.014C5H7O2N+0.057CO2+0.125HCO3-+0.084H2O
This yield difference can only be utilized in a RAS, if all nitrogenous waste is provided
as TAN. To realize that goal, RAS have to de designed without a nitrifying biofilter (Figure 4,
page 15).
TAN and nitrate yield similar heterotrophic bacteria production on solid fish waste
59
Two scenarios are conceivable to design such RAS: including the bacteria reactor within
the RAS system or adding it as post treatment of the RAS effluent stream. The first design
would lead to bigger bacteria reactor volumes than the second one, as all water leaving the
fish tanks would have to be treated. In the second scenario, flows could be more concentrated
and flow rates be based on solids control. However, this results in high TAN concentrations in
the system water, which are potentially hazardous for fish. Alternatively, if the waste stream
volumes are based on non hazardous TAN concentrations, water discharge of such RAS
would be unreasonably high and the related bacteria reactor volume big. Therefore, both
alternative scenarios are considered as non prospective. The solution can be found, if the
conversion of TAN and nitrate would produce similar yields. In that case the bacteria reactor
can be inserted in the RAS system after the drum filter.
The study objectives were, therefore, to evaluate if under practical RAS conditions TAN
as nitrogenous substrate results in higher observed yields than nitrate, and furthermore to
confirm if TAN is preferred compared to nitrate as nitrogenous substrate by the bacteria.
Material and Methods
System set up In this experiment a RAS, composed of four culture tanks, a drum filter (60�m mesh
size), a biofilter and two sumps was used (Figure 4, page 15). This system was extended with
a flow equalizer and a bacteria reactor at the drum filter outlet, where normally the waste
stream is discharged. The bacteria reactor was connected to the flow equalizer which was
receiving the backwash flow of the drum filter. In the flow equalizer the slurry was aerated
and agitated. The flow equalizer was integrated into the system to allow for constant waste
flows towards the bacteria reactor. This was important because the drum filter backwashes in
pulses, depending on its automated flushing cycle. The hydraulic retention time (HRT) of the
drum filter effluent in the flow equalizer was 4h and the drum filter backwash volume was
about 136 liters per kg feed.
Fish husbandry Fish were obtained from a commercial African catfish hatchery (Fleuren and Nooijen,
The Netherlands). Fish were stocked initially in four different cohorts of 140 fish each (70g,
170g, 320g, and 560g individual average weight) into the four tanks. Every 28 days the oldest
cohort was harvested. The emptied tank was restocked with 140 fish of about 70g. The final
fish weight ranged between 917-1025g. Therefore, a complete production cycle from 70 to
about 1000g lasted 112 days. Fish were fed a commercial diet (Biomeerval, Skretting,
Chapter 4
60
France), containing 7% moisture, 49% crude protein, 11% crude fat, 22% carbohydrates, of
which 2% crude fiber, 11% crude ash and 1.7% phosphorous (based on manufacturer
information). The realized feeding level was between 16 and 19g per kg metabolic body
weight (W0.8) per day. Diurnal waste fluctuations were minimized by applying a 24h feeding
period. The monthly harvesting/restocking scheme minimized changes in biomass within the
system and then also in feed load. This stocking and feeding strategy assured minimal
fluctuations of waste production during a production cycle.
Bacteria reactor The reactor was made of glass in the workshop of Wageningen University. The reactor
had a working volume of 3.5 liters and was equipped with baffles to improve the
hydrodynamics (Figure 8, page 43). From the flow equalizer the slurry was continuously
pumped into the bacterial culture reactor at a flow rate of 13.0 l/d by a peristaltic pump
(Masterflex L/S, Masterflex, USA). The resulting HRT was 6h. Pure oxygen was diffused by
air-stones to maintain aerobic conditions in the reactor (>2mg/l). Oxygen was monitored
online using pH/Oxi 304i meters (WTW, Germany) connected to a PC. This PC controlled
then the oxygenation, reacting on a set-point concentration of 3mg/l oxygen inside the broth.
pH levels were maintained between 7.0 and 7.2 by addition of acid or base (HCl, NaOH, 0.5-
1M) stirred by a pH controller (Liquisys M, Endress-Hauser, Germany). The reactor
temperature was 28°C, fixed by a water bath. The reactor was continuously agitated by a rotor
(RZR 2102, Heidolph, Germany) and the agitation speed was fixed to 350rpm.
Initial waste composition and experimental set-up The initial waste composition in the flow equalizer effluent was analyzed (Table 16).
Five different treatments expressed as additional TAN levels were tested one after the other:
no addition of TAN or an addition of about 10, 100, 200 and 250 mg TAN/l, whereby nitrate-
N concentration remained unchanged. These levels were chosen because TAN concentrations
of up to 10mg/l and higher are common in African catfish farms. Concentrations between 100
and 250mg/l would occur if the whole nitrogen budget of the recirculation system would only
be regulated by the drum filter effluent and no nitrification would occur. Therefore, they
represent a theoretical maximum concentration for a commercial RAS without nitrification
unit. The C supplementation level of 1.7gC/l was to counteract the low C: N ratios of the
drum filter effluent. Sodium acetate (anhydrous, Assay>98.5%, Fluka, Germany) was used as
organic C source, because it is easily degradable and served already in earlier experiments as
model substrate. Sodium acetate and ammonia chloride (analytical, Merck, Germany) were
TAN and nitrate yield similar heterotrophic bacteria production on solid fish waste
61
mixed into one solution and the resulting total inflow concentrations in the reactor for TAN
were: 1.3, 12, 98, 193 and 257mg/l. The supplementation flow rate was 0.4 l/d, maintained by
a peristaltic pump (PD5001, Heidolph, Germany). This set-up was preferred above other set-
ups, in which the ratio of TAN to nitrate would be changed, but the total inorganic N content
would remain constant. Such designs would require to use either artificial waste or to
eliminate the nitrate fraction from the slurry by pre-treatment. Such waste compilation would
not reflect practical RAS conditions anymore and in addition would impair the complex waste
matrix.
Table 16: Waste composition measured in the flow equalizer. Values are given as averages ± Standard deviation, minimum and maximum in parenthesis, and N = number of samples. TAN = total ammonia nitrogen, NO2-N = nitrite-N, NO3-N = nitrate-N, Kjd-N = Kjeldahl nitrogen corrected for TAN concentrations, TOC = total organic carbon, ortho-P-P = ortho-phosphate phosphorus, TS= total solids, TSS = total suspended solids, VSS = volatile suspended solids.
Flow equalizer N TAN
NO2-N NO3-N Kjd-N
mg/l mg/l mg/l mg/l
1.7±1.0 (0.8-4.8) 2.8±0.7 (0.7-3.7) 174±29 (76-202) 47±33 (23-161)
14 14 14 14
TOC g/l 0.41±0.01 (0.37-0.47) 5 Ortho-P-P mg/l 24.1±1.7 (21.1-26.6) 14
pH 7.6-7.9 14 Ash g/l 1.7±0.6 (1.3-3.5) 15 TS g/l 3.4±0.7 (2.9-5.4) 15
TSS g/l 1.1±0.7 (0.5-3.0) 15 VSS g/l 0.5±0.2 (0.2-1.7) 15
optical density660nm* 1.0±0.6 (0.5-3.1) 15 *Samples were diluted prior measurement
The different TAN supplementation levels were tested one after the other, without
stopping the bacteria production. When the supplementation level of TAN was changed, the
reactors were not sampled for a period of 24h to allow for steady state re-establishment. The
reactor and the flow equalizer were sampled by siphoning three times from their centers for
grab samples during a period of 18h: six hours after the new steady state level was assumed,
six hours later and again six hours later at the end of the steady state period, afterwards
supplementation levels were changed.
Chapter 4
62
Experimental procedure
Inoculum Preparation
About 1 Liter slurry was tapped from the equalizer. From this three times 200ml, were
transferred in three 500ml Erlenmeyer flasks. Sodium acetate was added (1.7gC/l). The flasks
were incubated in a water bath (Julabo SW20-C, Julabo Labortechnik, Germany) at 28˚C for
24h and were continuously shaked at 110rpm. The obtained cultures from all three flasks were
pooled and used as inoculum for the bacteria reactor.
Reactor operation mode
Slurry (3.15 Liter), obtained from the equalizer, and inoculum (0.35 l) were added to
the reactor. Subsequently sodium acetate was added (1.7gC/l). The reactor was operated in
batch mode until bacteria growth was detected by observing differences in optical density.
The reactor was then switched to flow through mode by pumping fish waste from the
equalizer and sodium acetate/TAN solution into the reactor. The reactor was operated in
continuous flow mode during the consecutive exponential bacteria growth phase and the
steady states.
Chemical Analysis
Total solids, total suspended solids, VSS
Total solids (TS) were analyzed directly according to APHA-Method 2540.B using a
volume of 7ml. Total suspended solids (TSS) analysis was following APHA-Method 2540.D;
whereby a total volume of 5ml was filtered through 0.45�m filters (Millipore, MF 0.45�m
HA). Fixed and volatized suspended solids (VSS) were analyzed using APHA-Method
2540.E (Clesceri et al., 1998).
Optical density
Optical density (OD) was measured using a photometer at 660nm (cuvette-size 15mm
diameter, round shape, Photometer SQ118, Merck, Germany). The obtained samples of about
10ml were diluted in case OD values exceeded 0.3.
TAN, nitrite-N, nitrate-N, and ortho-phosphate
Samples were centrifuged at 4000rpm for 10minutes and then stored at 4 ˚C for further
analysis by an autoanalyser (SAN, Skalar, The Netherlands) for TAN, nitrite-N, nitrate-N, and
ortho-phosphate-phosphorus concentrations, using the methods 155-006, 461-318, 467-033,
503-317 from Skalar (1993 and 1999).
TAN and nitrate yield similar heterotrophic bacteria production on solid fish waste
63
Kjeldahl-N
Kjeldahl nitrogen was determined in unfiltered grab samples which were acidified
with H2SO4 and stored at -20˚C prior analysis. Samples were analyzed using a Tecator 2020
Digestor at 400°C for 4h and distillation by Tecator Kjeltec Autosampler system 1035
Analyzer (Tecator AB, Hoganas, Sweden) according to ISO 5983 procedures. The
measurements were corrected for TAN concentrations to obtain organic N concentrations.
Organic Carbon
Total organic carbon (TOC) concentration of grab samples from the reactor and flow
equalizer were stored at -20˚C and analyzed photometrically using the Dr. Lange cuvette test
LCK 381 (Dr. Lange, Hach Lange, Germany).
Sodium acetate concentration was analyzed from a sample, which was separated from
suspended solids and stored at -20˚C using a gas chromatograph (HRGC Mega 2, Fisons,
Italy, packed 6 feet column (inside diameter 2mm), Chromosorb 101 (80-100Mesh) nitrogen
as carrier gas saturated with formic acid, FID detector). The injection was automatically and
the injection temperature was 185�C, the column temperature 190�C and the detection
temperature 225�C, respectively. Results were analyzed with Chromcard 2.2 (Fisons
Instruments, Italy).
Calculations and Statistics Productions and conversions were calculated based on mass balances (In-Out), yields
based on VSS production and the amount of sodium acetate removed and fluxes based on
nutrient loads over reactor volume and time. VSS concentrations were checked for steady
state by linear regression of measured values against time, using SPSS 11.5 (SPSS Inc.,
USA). Steady state was accepted if the slope of the regression line was not significant
different from 0 (p>0.05). Means were compared using one-way ANOVA (SPSS 11.5) and
subsequent Tukey’s post hoc test (p<0.05). Linear regressions of fluxes versus various
parameters were executed using Microsoft Excel (version 2003, Microsoft, USA).
Results Mean VSS concentrations and means of dissolved inorganic nutrients, Kjeldahl-N and
TOC at steady state are presented in Table 17. Significant differences have been detected for
VSS, TAN, nitrate and ortho-phosphate concentrations. No significant differences were
detected for VSS production and VSS yields. Therefore, TAN and nitrate based effluents
produce similar yields.
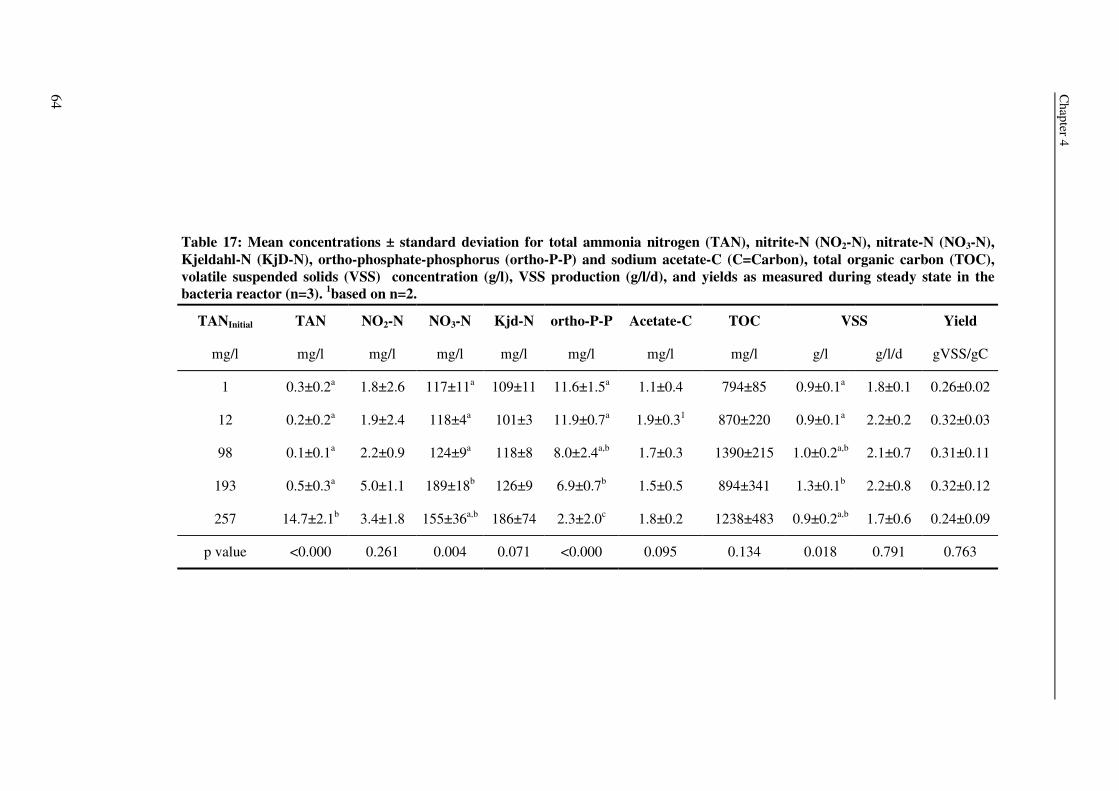
Chapter 4
64
Yield
gVSS/gC
0.26±0.02
0.32±0.03
0.31±0.11
0.32±0.12
0.24±0.09
0.763
g/l/d
1.8±0.1
2.2±0.2
2.1±0.7
2.2±0.8
1.7±0.6
0.791
VSS
g/l
0.9±0.1a
0.9±0.1a
1.0±0.2a,b
1.3±0.1b
0.9±0.2a,b
0.018
TOC
mg/l
794±85
870±220
1390±215
894±341
1238±483
0.134
Acetate-C
mg/l
1.1±0.4
1.9±0.31
1.7±0.3
1.5±0.5
1.8±0.2
0.095
ortho-P-P
mg/l
11.6±1.5a
11.9±0.7a
8.0±2.4a,b
6.9±0.7b
2.3±2.0c
<0.000
Kjd-N
mg/l
109±11
101±3
118±8
126±9
186±74
0.071
NO3-N
mg/l
117±11a
118±4a
124±9a
189±18b
155±36a,b
0.004
NO2-N
mg/l
1.8±2.6
1.9±2.4
2.2±0.9
5.0±1.1
3.4±1.8
0.261
TAN
mg/l
0.3±0.2a
0.2±0.2a
0.1±0.1a
0.5±0.3a
14.7±2.1b
<0.000
Table 17: Mean concentrations ± standard deviation for total ammonia nitrogen (TAN), nitrite-N (NO2-N), nitrate-N (NO3-N), Kjeldahl-N (KjD-N), ortho-phosphate-phosphorus (ortho-P-P) and sodium acetate-C (C=Carbon), total organic carbon (TOC), volatile suspended solids (VSS) concentration (g/l), VSS production (g/l/d), and yields as measured during steady state in the bacteria reactor (n=3). 1based on n=2.
TANInitial
mg/l
1
12
98
193
257
p value
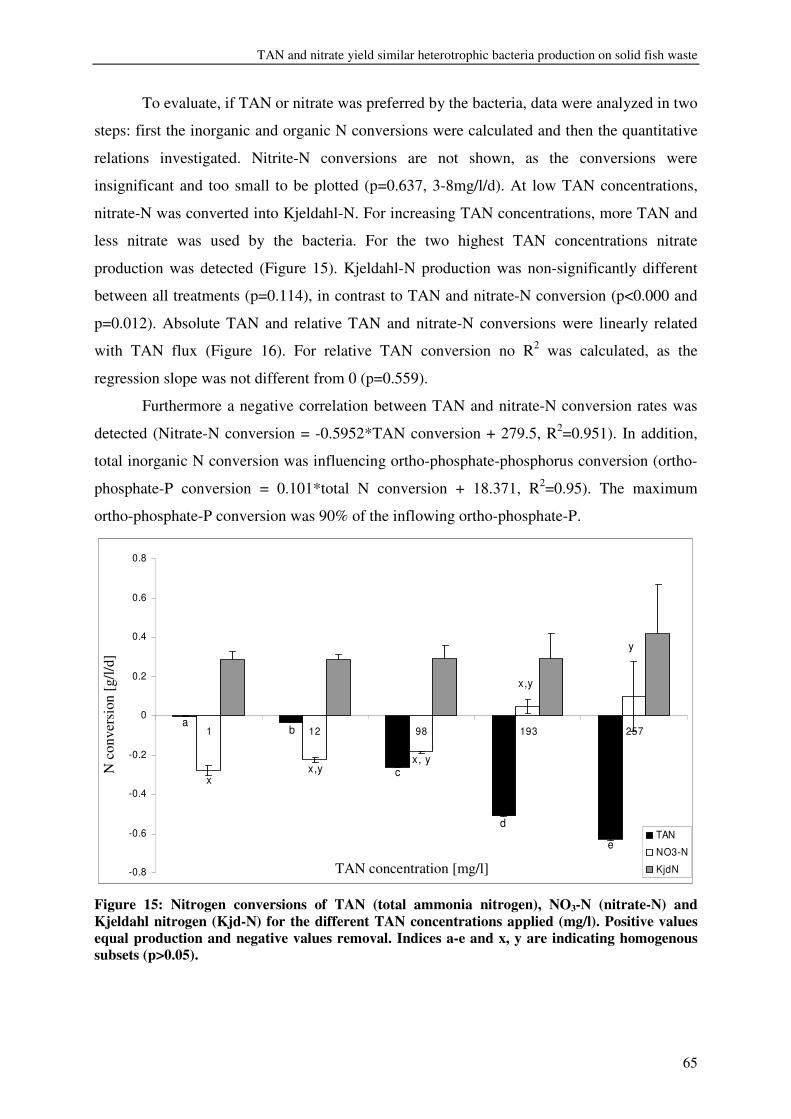
TAN and nitrate yield similar heterotrophic bacteria production on solid fish waste
65
To evaluate, if TAN or nitrate was preferred by the bacteria, data were analyzed in two
steps: first the inorganic and organic N conversions were calculated and then the quantitative
relations investigated. Nitrite-N conversions are not shown, as the conversions were
insignificant and too small to be plotted (p=0.637, 3-8mg/l/d). At low TAN concentrations,
nitrate-N was converted into Kjeldahl-N. For increasing TAN concentrations, more TAN and
less nitrate was used by the bacteria. For the two highest TAN concentrations nitrate
production was detected (Figure 15). Kjeldahl-N production was non-significantly different
between all treatments (p=0.114), in contrast to TAN and nitrate-N conversion (p<0.000 and
p=0.012). Absolute TAN and relative TAN and nitrate-N conversions were linearly related
with TAN flux (Figure 16). For relative TAN conversion no R2 was calculated, as the
regression slope was not different from 0 (p=0.559).
Furthermore a negative correlation between TAN and nitrate-N conversion rates was
detected (Nitrate-N conversion = -0.5952*TAN conversion + 279.5, R2=0.951). In addition,
total inorganic N conversion was influencing ortho-phosphate-phosphorus conversion (ortho-
phosphate-P conversion = 0.101*total N conversion + 18.371, R2=0.95). The maximum
ortho-phosphate-P conversion was 90% of the inflowing ortho-phosphate-P.
-0.8
-0.6
-0.4
-0.2
0
0.2
0.4
0.6
0.8
1 12 98 193 257
TAN concentration (mg/l)
N C
onve
rsio
n (g
/l/d)
TAN
NO3-N
KjdN
ab
c
d
e
xx,y
x, y
x,y
y
Figure 15: Nitrogen conversions of TAN (total ammonia nitrogen), NO3-N (nitrate-N) and Kjeldahl nitrogen (Kjd-N) for the different TAN concentrations applied (mg/l). Positive values equal production and negative values removal. Indices a-e and x, y are indicating homogenous subsets (p>0.05).
TAN concentration [mg/l]
N c
onve
rsio
n [g
/l/d]
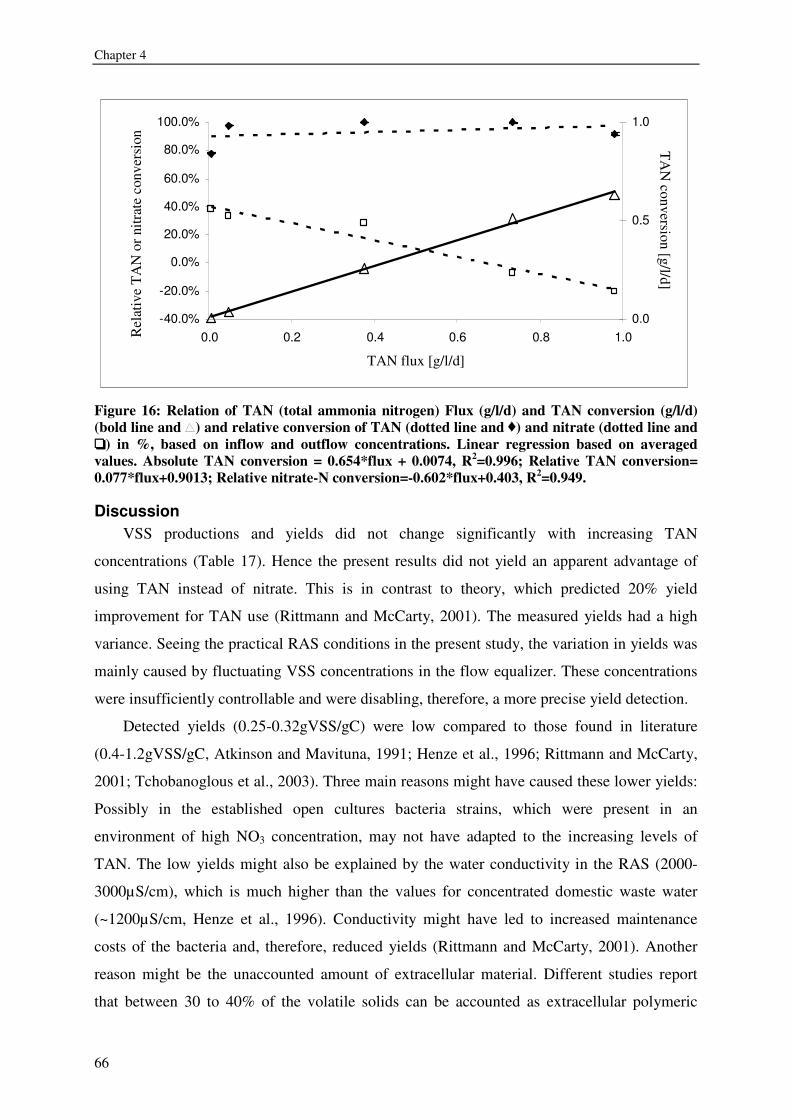
Chapter 4
66
-40.0%
-20.0%
0.0%
20.0%
40.0%
60.0%
80.0%
100.0%
0.0 0.2 0.4 0.6 0.8 1.0
TAN Flux (g/l/d)
Rel
ativ
e T
AN
or
nitr
ate
con
vers
ion
0.0
0.5
1.0
TA
N c
on
vers
ion
(g/
l/d)
Figure 16: Relation of TAN (total ammonia nitrogen) Flux (g/l/d) and TAN conversion (g/l/d) (bold line and ) and relative conversion of TAN (dotted line and ) and nitrate (dotted line and oooo) in %, based on inflow and outflow concentrations. Linear regression based on averaged values. Absolute TAN conversion = 0.654*flux + 0.0074, R2=0.996; Relative TAN conversion= 0.077*flux+0.9013; Relative nitrate-N conversion=-0.602*flux+0.403, R2=0.949.
Discussion VSS productions and yields did not change significantly with increasing TAN
concentrations (Table 17). Hence the present results did not yield an apparent advantage of
using TAN instead of nitrate. This is in contrast to theory, which predicted 20% yield
improvement for TAN use (Rittmann and McCarty, 2001). The measured yields had a high
variance. Seeing the practical RAS conditions in the present study, the variation in yields was
mainly caused by fluctuating VSS concentrations in the flow equalizer. These concentrations
were insufficiently controllable and were disabling, therefore, a more precise yield detection.
Detected yields (0.25-0.32gVSS/gC) were low compared to those found in literature
(0.4-1.2gVSS/gC, Atkinson and Mavituna, 1991; Henze et al., 1996; Rittmann and McCarty,
2001; Tchobanoglous et al., 2003). Three main reasons might have caused these lower yields:
Possibly in the established open cultures bacteria strains, which were present in an
environment of high NO3 concentration, may not have adapted to the increasing levels of
TAN. The low yields might also be explained by the water conductivity in the RAS (2000-
3000µS/cm), which is much higher than the values for concentrated domestic waste water
(~1200µS/cm, Henze et al., 1996). Conductivity might have led to increased maintenance
costs of the bacteria and, therefore, reduced yields (Rittmann and McCarty, 2001). Another
reason might be the unaccounted amount of extracellular material. Different studies report
that between 30 to 40% of the volatile solids can be accounted as extracellular polymeric
TAN flux [g/l/d]
Rel
ativ
e T
AN
or n
itra t
e co
nver
sion T
AN
conversion [g/l/d]
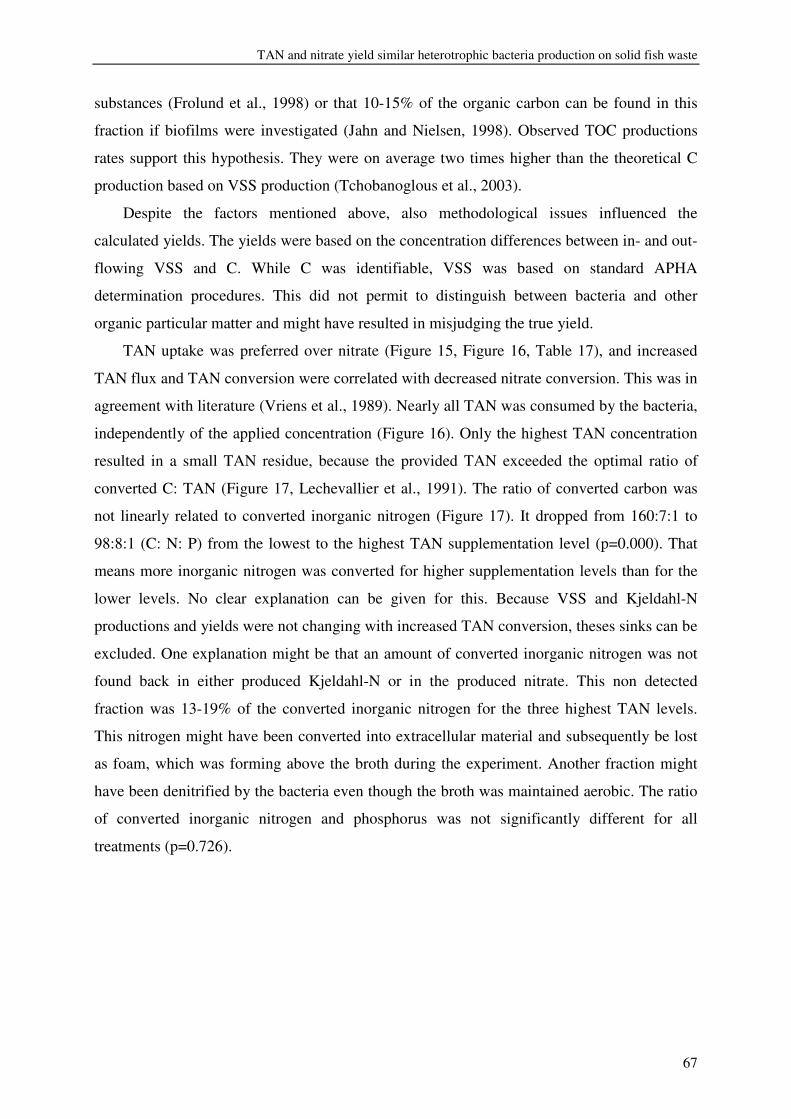
TAN and nitrate yield similar heterotrophic bacteria production on solid fish waste
67
substances (Frolund et al., 1998) or that 10-15% of the organic carbon can be found in this
fraction if biofilms were investigated (Jahn and Nielsen, 1998). Observed TOC productions
rates support this hypothesis. They were on average two times higher than the theoretical C
production based on VSS production (Tchobanoglous et al., 2003).
Despite the factors mentioned above, also methodological issues influenced the
calculated yields. The yields were based on the concentration differences between in- and out-
flowing VSS and C. While C was identifiable, VSS was based on standard APHA
determination procedures. This did not permit to distinguish between bacteria and other
organic particular matter and might have resulted in misjudging the true yield.
TAN uptake was preferred over nitrate (Figure 15, Figure 16, Table 17), and increased
TAN flux and TAN conversion were correlated with decreased nitrate conversion. This was in
agreement with literature (Vriens et al., 1989). Nearly all TAN was consumed by the bacteria,
independently of the applied concentration (Figure 16). Only the highest TAN concentration
resulted in a small TAN residue, because the provided TAN exceeded the optimal ratio of
converted C: TAN (Figure 17, Lechevallier et al., 1991). The ratio of converted carbon was
not linearly related to converted inorganic nitrogen (Figure 17). It dropped from 160:7:1 to
98:8:1 (C: N: P) from the lowest to the highest TAN supplementation level (p=0.000). That
means more inorganic nitrogen was converted for higher supplementation levels than for the
lower levels. No clear explanation can be given for this. Because VSS and Kjeldahl-N
productions and yields were not changing with increased TAN conversion, theses sinks can be
excluded. One explanation might be that an amount of converted inorganic nitrogen was not
found back in either produced Kjeldahl-N or in the produced nitrate. This non detected
fraction was 13-19% of the converted inorganic nitrogen for the three highest TAN levels.
This nitrogen might have been converted into extracellular material and subsequently be lost
as foam, which was forming above the broth during the experiment. Another fraction might
have been denitrified by the bacteria even though the broth was maintained aerobic. The ratio
of converted inorganic nitrogen and phosphorus was not significantly different for all
treatments (p=0.726).
Chapter 4
68
0
20
40
60
80
100
120
140
160
180
200
1 12 98 193 257
TAN concentration (mg/l)
Rat
io (
g) f
or
phos
pho
rus
=1g
a
a
bb b
Figure 17: Ratio of carbon to nitrogen to phosphorus converted (C: N: P) on weight/ weight basis, relatively calculated to the base of 1g converted for phosphorus. C in white blocks, N in black blocks, P is not shown as it is the base of all values and equals, therefore, constantly 1. TAN= total ammonia nitrogen
Conclusion The increase in TAN conversion compared to nitrate when TAN was used as the main
nitrogenous substrate for heterotrophic bacteria did not result in a detectable higher VSS
production and higher yields under practical RAS conditions. This is in contrast to one of the
major hypothesis of this study. Even though this hypothesis could not be validated, the
preference of TAN over nitrate by the bacteria was confirmed. TAN flux was linearly related
to TAN conversion and increasing TAN conversions resulted in negatively correlated nitrate-
N conversions.
Seen the insignificant changes in VSS production and yields, it seems equally possible to
supply the nitrogenous substrate for bacteria conversion as nitrate and not as TAN. This
allows integrating the conversion process into an existing RAS as end of pipe treatment,
thereby converting the solid effluent stream utilizing nitrate, ortho-phosphate and solid waste.
If the produced bacteria biomass is then subsequently re-used as fish feed, RAS sustainability
would be increased.
TAN concentration [mg/l]
Rat
io [g
:g] c
ompa
red
to p
hosp
horu
s [1
g]
69
Chapter 5
Molasses as C source for heterotrophic bacteria production on
solid fish waste
Abstract The drum filter effluent from a recirculation aquaculture system (RAS) can be used as
substrate for heterotrophic bacteria production. This biomass can be re-used as aquatic feed.
In this experiment, the solid waste produced in a pilot RAS with African catfish was used as
substrate for growing heterotrophic bacteria. One bacteria growth reactor (3.5 l) was
connected to the drum filter (filter mesh size 60µm) outlet of a recirculation system in a
continuous flow. The hydraulic retention time in the bacteria reactor was 6h. Because fish
waste was organic carbon deficient due to nitrogen accumulation in the system, different
supplementation levels of molasses were tested, equivalent to carbon fluxes of 0.0, 3.2, 5.8,
7.8, 9.7gC/l/d (C: N ratios: 3.4, 6.4, 9.4, 13.0 and 16.5). For the maximum flux, the VSS and
crude protein production were about 168gVSS and 95g crude protein per kg feed. The
maximum conversion of nitrate and ortho-phosphate was 24g NO3-N and 4gP/kg feed, a
conversion of 90% of the inorganic nitrogenous waste and 98% of the ortho-phosphate-P.
Furthermore the maximum substrate removal rate and the Ks were determined (1.62gC/l/h and
0.097gC/l respectively). The maximum specific removal rate was 0.31gC/gVSS/h and the
related half saturation constant was 0.008gC/l. The observed growth rate reached a maximum
for C fluxes higher than 8g/l/d. The present integration of heterotrophic bacteria production in
RAS represents, therefore, an innovative option to reduce waste discharge and to increase
system’s ecological sustainability.
Schneider, O., V. Sereti, E. H. Eding and J. A. J. Verreth (submitted). "Molasses as C source for heterotrophic bacteria production on solid fish waste." Aquaculture.
Chapter 5
70
Introduction Conversion of fish waste into heterotrophic bacteria biomass is highly depending on
carbon (C): nitrogen (N) ratios. Optimal C: N ratios for heterotrophic bacteria production are
about 12-15g:1g (Lechevallier et al., 1991; Henze et al., 1996; Avnimelech, 1999). In that
respect, fish, which are receiving high protein diets, are producing C deficient waste due to
high levels of excreted N. For example, the faecal loss of African catfish has a C: N ratio of
approximately 12-13: 1 (g/g) under commercial conditions. As consequence of nitrate
accumulation in the system water, this ratio drops in recirculation aquaculture systems (RAS)
to only 3:1. For other fish species that are less effective in their N retention than African
catfish, this ratio can be even lower. In earlier experiments a RAS effluent stream was
supplemented with sodium acetate as an easily degradable model substrate. The bacteria
production, expressed as volatile suspended solids (VSS) was 100gVSS per kg feed and
18g/kg fish feed of nitrogenous waste and 4.8g/kg fish feed of ortho-phosphate-phosphorus
(P) were converted (Schneider et al., submitted).
Even though sodium acetate is widely used as model substrate for bacteria production,
under practical conditions adding sodium acetate may economically not be interesting.
Sodium acetate costs about 1.5$ per kg or 4.8$ per kg C (Jarchem Industries, USA, pers.
com., 2005). Molasses might serve as alternative C source. It costs only about 0.3$ per kg,
1.3$ per kg C (NASS, 2005). It has widely been used as C source for denitrification,
anaerobic fermentation, aerobic conversion and been applied in aquaculture (Kargi et al.,
1980; Burford et al., 2003; Jimenez et al., 2004; Quan et al., 2005). The composition of
molasses is favorable because it hardly contains any N, ash and fiber (Curtin, 1993, Ugalde
and Castrillo, 2002).
Using RAS as a system model, the present study tried to verify that heterotrophic bacteria
production rates and resulting yields and nutrient conversion rates, obtained with molasses,
were comparable to those obtained with sodium acetate. C: N ratio would then be the major
factor influencing bacteria production and not the C source. Furthermore, determining
microbiological kinetics would provide additional knowledge on activated ponds, where
bacteria production rates have hardly been quantified.
Material and Methods
System set up In this experiment a recirculation aquaculture system, which consists of four culture
tanks, a drum filter (60�m mesh size), a biofilter and two sumps was used (Figure 7, page 41
Molasses as C source for heterotrophic bacteria production on solid fish waste
71
and Figure 8, page 43). This system was extended with one bacteria reactor and a flow
equalizer at the drum filter outlet. The bacteria reactor was connected to the flow equalizer
which was receiving the backwash flow of the drum filter. In the flow equalizer the slurry was
aerated and agitated. The flow equalizer was integrated into the system to allow for constant
waste flows towards the bacteria reactor, because the drum filter backwashes in pulses,
depending on its automated flushing cycle. The hydraulic retention time (HRT) of the drum
filter effluent in the flow equalizer was 4h and the drum filter backwash volume was about
136 l per kg feed.
Fish husbandry Fish were obtained from a commercial African catfish hatchery (Fleuren and Nooijen,
The Netherlands). Fish were stocked initially in four different cohorts of 140 fish each (70g,
170g, 320g, and 560g individual average weight) into the four tanks. Every 28 days the oldest
cohort was harvested. The emptied tank was restocked with 140 fish of about 70g. The final
fish weight ranged between 917-1025g. Therefore a complete production cycle from 70 to
about 1000g lasted 112 days. Fish were fed a commercial diet (Biomeerval, Skretting,
France), containing 7% moisture, 49% crude protein, 11% crude fat, 22% carbohydrates, of
which 2% crude fiber, 11% crude ash and 1.7% phosphorous (based on manufacturer
information). The realized feeding level was between 16 and 19g per kg metabolic body
weight (W0.8) per day. Diurnal waste fluctuations were minimized by applying a 24h feeding
period. The monthly harvesting/restocking scheme minimized changes in biomass within the
system and thus also in feed load. As a consequence waste production showed minimal
fluctuations during the experiment.
Bacteria reactor The reactor was made of glass in the workshop of Wageningen University, The
Netherlands. The reactor had a working volume of 3.5 l and was equipped with baffles to
improve the hydrodynamics (Figure 7, page 41 and Figure 8, page 43). From the flow
equalizer the slurry was continuously pumped into the bacteria reactor at a flow rate of 13.0
l/d by a peristaltic pump (Masterflex L/S, Masterflex, USA). The resulting HRT was 6h. Pure
oxygen was diffused by air-stones to maintain aerobic conditions in the reactor above 2mg/l.
Oxygen was monitored online using pH/Oxi 304i meters (WTW, Germany) connected to a
PC. This PC controlled then the oxygenation, reacting on a set-point concentration of 3mg/l
oxygen inside the broth. pH levels were maintained between 7.0 and 7.2 by addition of acid or
base (HCl, NaOH, 0.5-1M) stirred by a pH controller (Liquisys M, Endress-Hauser,
Chapter 5
72
Germany). The reactor temperature was 28°C, fixed by a water bath. The reactors were
continuously agitated by a rotor (RZR 2102, Heidolph, Germany) and agitation speed was
350rpm.
Initial waste composition, experimental design and sampling The initial waste composition was analyzed in the flow equalizer (Table 18). Five
different organic C supplementation levels of 0, 0.8, 1.5, 2.1 and 2.5gC/l were chosen based
on earlier experiments with sodium acetate (Schneider et al., submitted). To obtain those
concentrations, molasses (bulk product, Research Diet Services, Netherlands) was diluted
with distilled water. Molasses solution was pumped into the reactor at a flow rate of 0.4 l/d
(PD5001, Heidolph, Germany). When the supplementation level was changed, the reactor was
not sampled for a period of 24h to allow re-establishment of steady state. The treatment tested
first was 1.5gC/l, then 2.1, 2.5, 0.8 and last 0gC/l. This equals C: N ratios of, 9.4, 13.0, 16.5,
6.4 and 3.4 respectively. The reactor and the flow equalizer were sampled by siphoning three
times from their centers for grab samples during a period of 18h: six hours after the new
steady state level was assumed, six hours later and again six hours later, afterwards
supplementation levels were changed.
Experimental procedure
Inoculum Preparation
About 1 l slurry was tapped from the equalizer. From this, three times 200ml were
transferred in three 500ml Erlenmeyer flasks. Molasses were added, until a concentration of
1.5gC/l was reached. The flasks were incubated in a water bath (Julabo SW20-C, Julabo
Labortechnik, Germany) at 28˚C for 24h and were permanently shaked at 110rpm. The
obtained cultures from all three flasks were pooled and used as inoculum for the bacteria
reactor.
Reactor operation mode
Slurry (3.15 l), obtained from the flow equalizer, and inoculum (0.35 l) were added to
the reactor. Molasses were added, until a concentration of 1.5gC/l was reached. The reactor
was operated in batch mode until bacteria growth was detected by observing differences in
optical density. The reactor was then switched to flow through mode by pumping fish waste
from the equalizer and molasses solution into the reactor. The reactor was operated in
continuous flow mode during the consecutive exponential bacteria growth phase and the
steady states.
Molasses as C source for heterotrophic bacteria production on solid fish waste
73
Acetate control treatment
A control reactor, similar to the molasses reactor was started at the same moment and
connected to the same system in a similar experimental set-up using the same flow rates and
equipment as the molasses reactor. The reactor was inoculated, handled and sampled in the
same way as the molasses reactor with the exception that the inoculum was prepared and the
reactor was fed by using sodium acetate (1.7gC/l, anhydrous, Assay>98.5%, Fluka, Germany)
as substrate. The reactor was sampled during the first supplementation period of the molasses
trial.
Chemical Analysis
Total solids, total suspended solids, VSS
Total solids were analyzed directly according to APHA-Method 2540.B using a
volume of 7ml. Total suspended solids analysis was following APHA-Method 2540.D;
whereby a total volume of 5ml was filtered through 0.45�m filters (Millipore, MF 0.45�m
HA). Fixed and volatized suspended solids (VSS) were analyzed using APHA-Method
2540.E (Clesceri et al., 1998).
Optical density
Optical density (OD) was measured using a photometer at 660nm (cuvette-size 15mm
diameter, round shape, Photometer SQ118, Merck, Germany). The obtained samples of about
10ml were diluted in case OD values exceeded 0.3.
TAN, nitrite-N, nitrate-N, and ortho-phosphate
Samples were centrifuged at 4000rpm for 10minutes and then stored at 4 ˚C for further
analysis by an autoanalyser (SAN, Skalar, The Netherlands) for total ammonia nitrogen
(TAN), nitrite-N, nitrate-N, and ortho-phosphate-phosphorus concentrations, using the
methods 155-006, 461-318, 467-033, 503-317 from Skalar, dating from 1993 and 1999.
Kjeldahl-N
Kjeldahl N was determined in unfiltered grab samples which were acidified with
H2SO4 and stored at -20˚C prior analysis. Analysis was done using a Tecator 2020 Digestor at
400°C for 4h and distillation by Tecator Kjeltec Autosampler system 1035 Analyzer (Tecator
AB, Hoganas, Sweden) according to ISO 5983 procedures. The measurements were corrected
for TAN concentrations to obtain organic N concentrations.
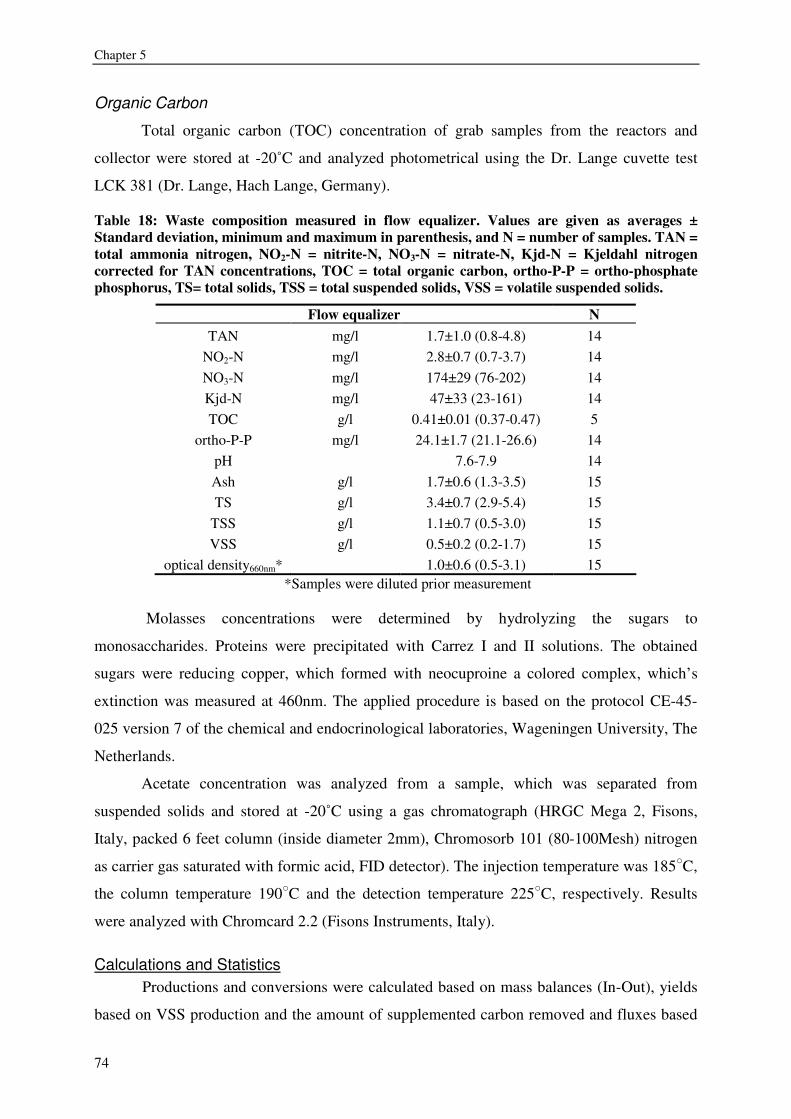
Chapter 5
74
Organic Carbon
Total organic carbon (TOC) concentration of grab samples from the reactors and
collector were stored at -20˚C and analyzed photometrical using the Dr. Lange cuvette test
LCK 381 (Dr. Lange, Hach Lange, Germany).
Table 18: Waste composition measured in flow equalizer. Values are given as averages ± Standard deviation, minimum and maximum in parenthesis, and N = number of samples. TAN = total ammonia nitrogen, NO2-N = nitrite-N, NO3-N = nitrate-N, Kjd-N = Kjeldahl nitrogen corrected for TAN concentrations, TOC = total organic carbon, ortho-P-P = ortho-phosphate phosphorus, TS= total solids, TSS = total suspended solids, VSS = volatile suspended solids.
Flow equalizer N TAN
NO2-N NO3-N Kjd-N
mg/l mg/l mg/l mg/l
1.7±1.0 (0.8-4.8) 2.8±0.7 (0.7-3.7) 174±29 (76-202) 47±33 (23-161)
14 14 14 14
TOC g/l 0.41±0.01 (0.37-0.47) 5 ortho-P-P mg/l 24.1±1.7 (21.1-26.6) 14
pH 7.6-7.9 14 Ash g/l 1.7±0.6 (1.3-3.5) 15 TS g/l 3.4±0.7 (2.9-5.4) 15
TSS g/l 1.1±0.7 (0.5-3.0) 15 VSS g/l 0.5±0.2 (0.2-1.7) 15
optical density660nm* 1.0±0.6 (0.5-3.1) 15 *Samples were diluted prior measurement
Molasses concentrations were determined by hydrolyzing the sugars to
monosaccharides. Proteins were precipitated with Carrez I and II solutions. The obtained
sugars were reducing copper, which formed with neocuproine a colored complex, which’s
extinction was measured at 460nm. The applied procedure is based on the protocol CE-45-
025 version 7 of the chemical and endocrinological laboratories, Wageningen University, The
Netherlands.
Acetate concentration was analyzed from a sample, which was separated from
suspended solids and stored at -20˚C using a gas chromatograph (HRGC Mega 2, Fisons,
Italy, packed 6 feet column (inside diameter 2mm), Chromosorb 101 (80-100Mesh) nitrogen
as carrier gas saturated with formic acid, FID detector). The injection temperature was 185�C,
the column temperature 190�C and the detection temperature 225�C, respectively. Results
were analyzed with Chromcard 2.2 (Fisons Instruments, Italy).
Calculations and Statistics Productions and conversions were calculated based on mass balances (In-Out), yields
based on VSS production and the amount of supplemented carbon removed and fluxes based
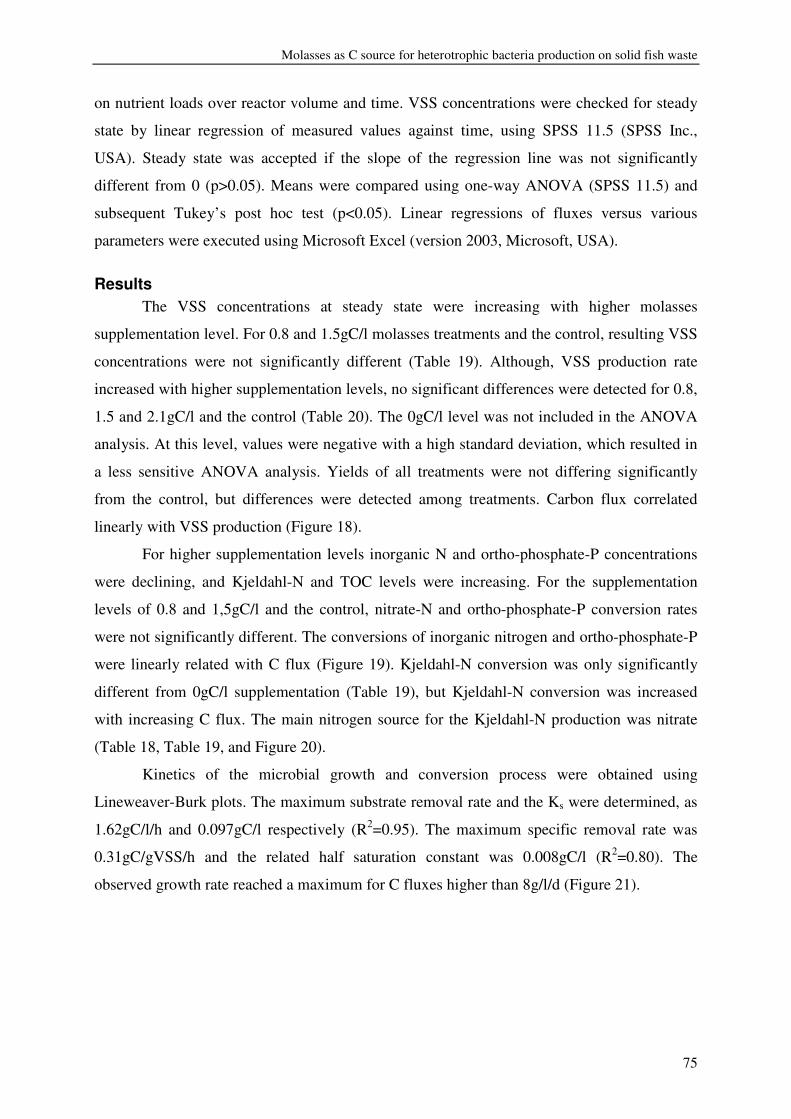
Molasses as C source for heterotrophic bacteria production on solid fish waste
75
on nutrient loads over reactor volume and time. VSS concentrations were checked for steady
state by linear regression of measured values against time, using SPSS 11.5 (SPSS Inc.,
USA). Steady state was accepted if the slope of the regression line was not significantly
different from 0 (p>0.05). Means were compared using one-way ANOVA (SPSS 11.5) and
subsequent Tukey’s post hoc test (p<0.05). Linear regressions of fluxes versus various
parameters were executed using Microsoft Excel (version 2003, Microsoft, USA).
Results The VSS concentrations at steady state were increasing with higher molasses
supplementation level. For 0.8 and 1.5gC/l molasses treatments and the control, resulting VSS
concentrations were not significantly different (Table 19). Although, VSS production rate
increased with higher supplementation levels, no significant differences were detected for 0.8,
1.5 and 2.1gC/l and the control (Table 20). The 0gC/l level was not included in the ANOVA
analysis. At this level, values were negative with a high standard deviation, which resulted in
a less sensitive ANOVA analysis. Yields of all treatments were not differing significantly
from the control, but differences were detected among treatments. Carbon flux correlated
linearly with VSS production (Figure 18).
For higher supplementation levels inorganic N and ortho-phosphate-P concentrations
were declining, and Kjeldahl-N and TOC levels were increasing. For the supplementation
levels of 0.8 and 1,5gC/l and the control, nitrate-N and ortho-phosphate-P conversion rates
were not significantly different. The conversions of inorganic nitrogen and ortho-phosphate-P
were linearly related with C flux (Figure 19). Kjeldahl-N conversion was only significantly
different from 0gC/l supplementation (Table 19), but Kjeldahl-N conversion was increased
with increasing C flux. The main nitrogen source for the Kjeldahl-N production was nitrate
(Table 18, Table 19, and Figure 20).
Kinetics of the microbial growth and conversion process were obtained using
Lineweaver-Burk plots. The maximum substrate removal rate and the Ks were determined, as
1.62gC/l/h and 0.097gC/l respectively (R2=0.95). The maximum specific removal rate was
0.31gC/gVSS/h and the related half saturation constant was 0.008gC/l (R2=0.80). The
observed growth rate reached a maximum for C fluxes higher than 8g/l/d (Figure 21).
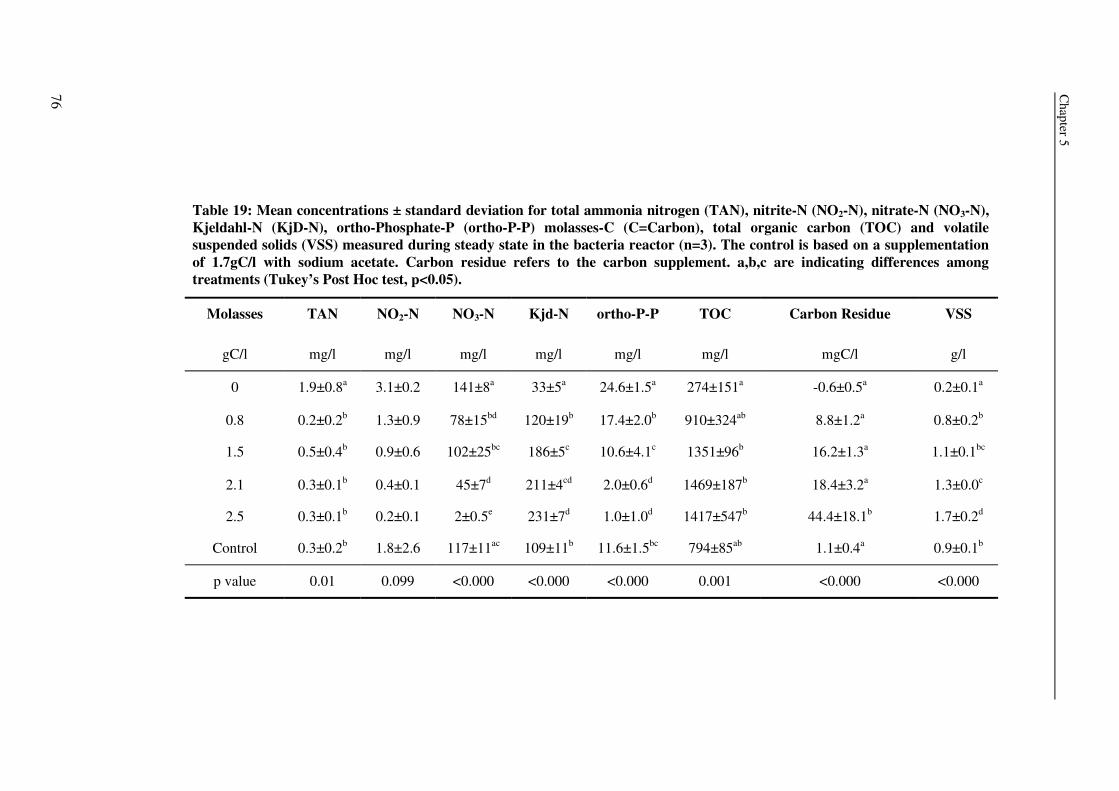
Chapter 5
76
VSS
g/l
0.2±0.1a
0.8±0.2b
1.1±0.1bc
1.3±0.0c
1.7±0.2d
0.9±0.1b
<0.000
Carbon Residue
mgC/l
-0.6±0.5a
8.8±1.2a
16.2±1.3a
18.4±3.2a
44.4±18.1b
1.1±0.4a
<0.000
TOC
mg/l
274±151a
910±324ab
1351±96b
1469±187b
1417±547b
794±85ab
0.001
ortho-P-P
mg/l
24.6±1.5a
17.4±2.0b
10.6±4.1c
2.0±0.6d
1.0±1.0d
11.6±1.5bc
<0.000
Kjd-N
mg/l
33±5a
120±19b
186±5c
211±4cd
231±7d
109±11b
<0.000
NO3-N
mg/l
141±8a
78±15bd
102±25bc
45±7d
2±0.5e
117±11ac
<0.000
NO2-N
mg/l
3.1±0.2
1.3±0.9
0.9±0.6
0.4±0.1
0.2±0.1
1.8±2.6
0.099
TAN
mg/l
1.9±0.8a
0.2±0.2b
0.5±0.4b
0.3±0.1b
0.3±0.1b
0.3±0.2b
0.01
Table 19: Mean concentrations ± standard deviation for total ammonia nitrogen (TAN), nitrite-N (NO2-N), nitrate-N (NO3-N), Kjeldahl-N (KjD-N), ortho-Phosphate-P (ortho-P-P) molasses-C (C=Carbon), total organic carbon (TOC) and volatile suspended solids (VSS) measured during steady state in the bacteria reactor (n=3). The control is based on a supplementation of 1.7gC/l with sodium acetate. Carbon residue refers to the carbon supplement. a,b,c are indicating differences among treatments (Tukey’s Post Hoc test, p<0.05).
Molasses
gC/l
0
0.8
1.5
2.1
2.5
Control
p value
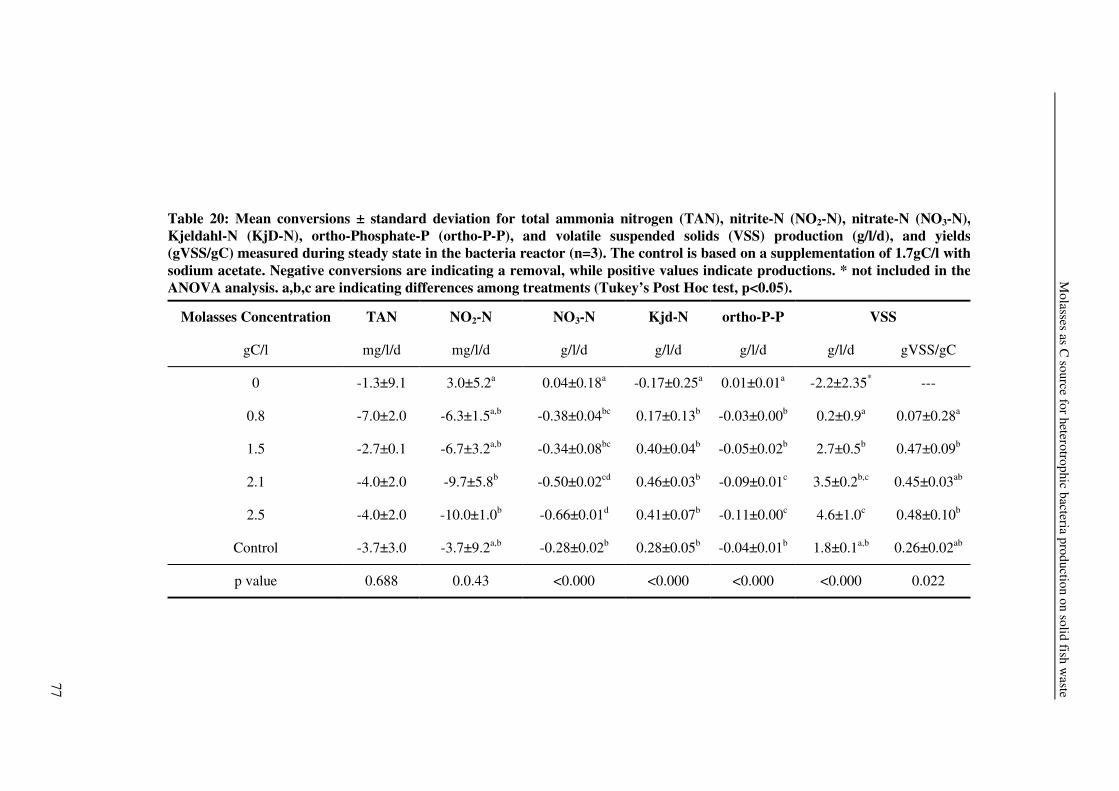
Molasses as C
source for heterotrophic bacteria production on solid fish waste
77
gVSS/gC
---
0.07±0.28a
0.47±0.09b
0.45±0.03ab
0.48±0.10b
0.26±0.02ab
0.022
VSS
g/l/d
-2.2±2.35*
0.2±0.9a
2.7±0.5b
3.5±0.2b,c
4.6±1.0c
1.8±0.1a,b
<0.000
ortho-P-P
g/l/d
0.01±0.01a
-0.03±0.00b
-0.05±0.02b
-0.09±0.01c
-0.11±0.00c
-0.04±0.01b
<0.000
Kjd-N
g/l/d
-0.17±0.25a
0.17±0.13b
0.40±0.04b
0.46±0.03b
0.41±0.07b
0.28±0.05b
<0.000
NO3-N
g/l/d
0.04±0.18a
-0.38±0.04bc
-0.34±0.08bc
-0.50±0.02cd
-0.66±0.01d
-0.28±0.02b
<0.000
NO2-N
mg/l/d
3.0±5.2a
-6.3±1.5a,b
-6.7±3.2a,b
-9.7±5.8b
-10.0±1.0b
-3.7±9.2a,b
0.0.43
TAN
mg/l/d
-1.3±9.1
-7.0±2.0
-2.7±0.1
-4.0±2.0
-4.0±2.0
-3.7±3.0
0.688
Table 20: Mean conversions ± standard deviation for total ammonia nitrogen (TAN), nitrite-N (NO2-N), nitrate-N (NO3-N), Kjeldahl-N (KjD-N), ortho-Phosphate-P (ortho-P-P), and volatile suspended solids (VSS) production (g/l/d), and yields (gVSS/gC) measured during steady state in the bacteria reactor (n=3). The control is based on a supplementation of 1.7gC/l with sodium acetate. Negative conversions are indicating a removal, while positive values indicate productions. * not included in the ANOVA analysis. a,b,c are indicating differences among treatments (Tukey’s Post Hoc test, p<0.05).
Molasses Concentration
gC/l
0
0.8
1.5
2.1
2.5
Control
p value
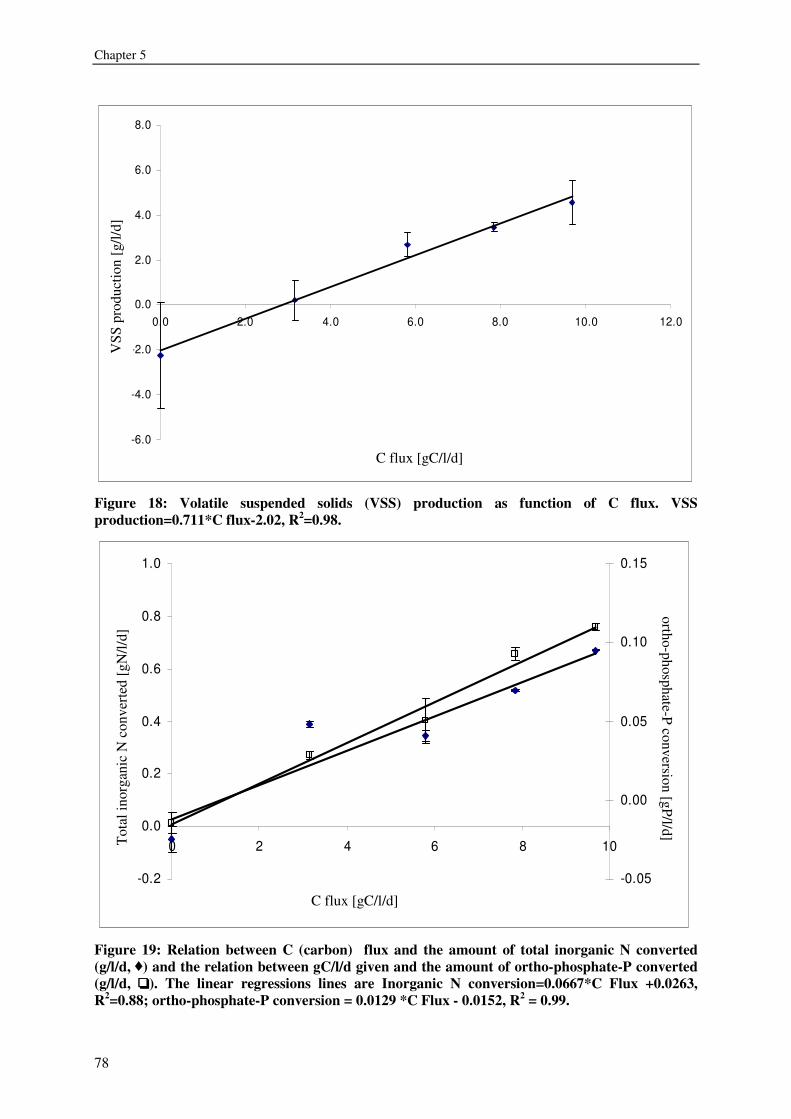
Chapter 5
78
-6.0
-4.0
-2.0
0.0
2.0
4.0
6.0
8.0
0.0 2.0 4.0 6.0 8.0 10.0 12.0
C Flux (g/l/d)
VS
S P
rodu
ctio
n (g
/l/d)
Figure 18: Volatile suspended solids (VSS) production as function of C flux. VSS production=0.711*C flux-2.02, R2=0.98.
-0.2
0.0
0.2
0.4
0.6
0.8
1.0
0 2 4 6 8 10
C Flux (gC/l/d)
Tota
l ino
rgan
ic N
con
vert
ed (g
/l/d)
-0.05
0.00
0.05
0.10
0.15
orth
o-P
hosp
hate
-P (
g/l/d
)
Figure 19: Relation between C (carbon) flux and the amount of total inorganic N converted (g/l/d, ) and the relation between gC/l/d given and the amount of ortho-phosphate-P converted (g/l/d, oooo). The linear regressions lines are Inorganic N conversion=0.0667*C Flux +0.0263, R2=0.88; ortho-phosphate-P conversion = 0.0129 *C Flux - 0.0152, R2 = 0.99.
C flux [gC/l/d]
VSS
pro
duct
ion
[g/l/
d]
C flux [gC/l/d]
Tot
al in
orga
nic
N c
onve
rted
[gN
/l/d]
ortho-phosphate-P conversion [gP/l/d]
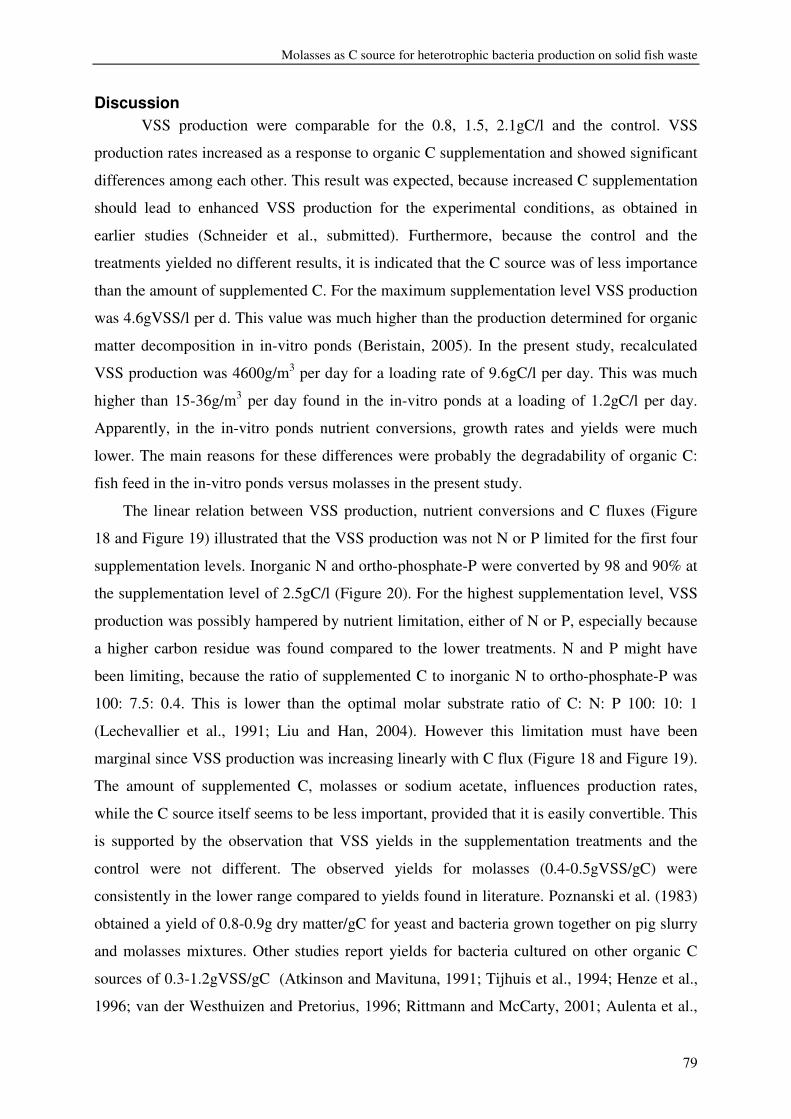
Molasses as C source for heterotrophic bacteria production on solid fish waste
79
Discussion VSS production were comparable for the 0.8, 1.5, 2.1gC/l and the control. VSS
production rates increased as a response to organic C supplementation and showed significant
differences among each other. This result was expected, because increased C supplementation
should lead to enhanced VSS production for the experimental conditions, as obtained in
earlier studies (Schneider et al., submitted). Furthermore, because the control and the
treatments yielded no different results, it is indicated that the C source was of less importance
than the amount of supplemented C. For the maximum supplementation level VSS production
was 4.6gVSS/l per d. This value was much higher than the production determined for organic
matter decomposition in in-vitro ponds (Beristain, 2005). In the present study, recalculated
VSS production was 4600g/m3 per day for a loading rate of 9.6gC/l per day. This was much
higher than 15-36g/m3 per day found in the in-vitro ponds at a loading of 1.2gC/l per day.
Apparently, in the in-vitro ponds nutrient conversions, growth rates and yields were much
lower. The main reasons for these differences were probably the degradability of organic C:
fish feed in the in-vitro ponds versus molasses in the present study.
The linear relation between VSS production, nutrient conversions and C fluxes (Figure
18 and Figure 19) illustrated that the VSS production was not N or P limited for the first four
supplementation levels. Inorganic N and ortho-phosphate-P were converted by 98 and 90% at
the supplementation level of 2.5gC/l (Figure 20). For the highest supplementation level, VSS
production was possibly hampered by nutrient limitation, either of N or P, especially because
a higher carbon residue was found compared to the lower treatments. N and P might have
been limiting, because the ratio of supplemented C to inorganic N to ortho-phosphate-P was
100: 7.5: 0.4. This is lower than the optimal molar substrate ratio of C: N: P 100: 10: 1
(Lechevallier et al., 1991; Liu and Han, 2004). However this limitation must have been
marginal since VSS production was increasing linearly with C flux (Figure 18 and Figure 19).
The amount of supplemented C, molasses or sodium acetate, influences production rates,
while the C source itself seems to be less important, provided that it is easily convertible. This
is supported by the observation that VSS yields in the supplementation treatments and the
control were not different. The observed yields for molasses (0.4-0.5gVSS/gC) were
consistently in the lower range compared to yields found in literature. Poznanski et al. (1983)
obtained a yield of 0.8-0.9g dry matter/gC for yeast and bacteria grown together on pig slurry
and molasses mixtures. Other studies report yields for bacteria cultured on other organic C
sources of 0.3-1.2gVSS/gC (Atkinson and Mavituna, 1991; Tijhuis et al., 1994; Henze et al.,
1996; van der Westhuizen and Pretorius, 1996; Rittmann and McCarty, 2001; Aulenta et al.,
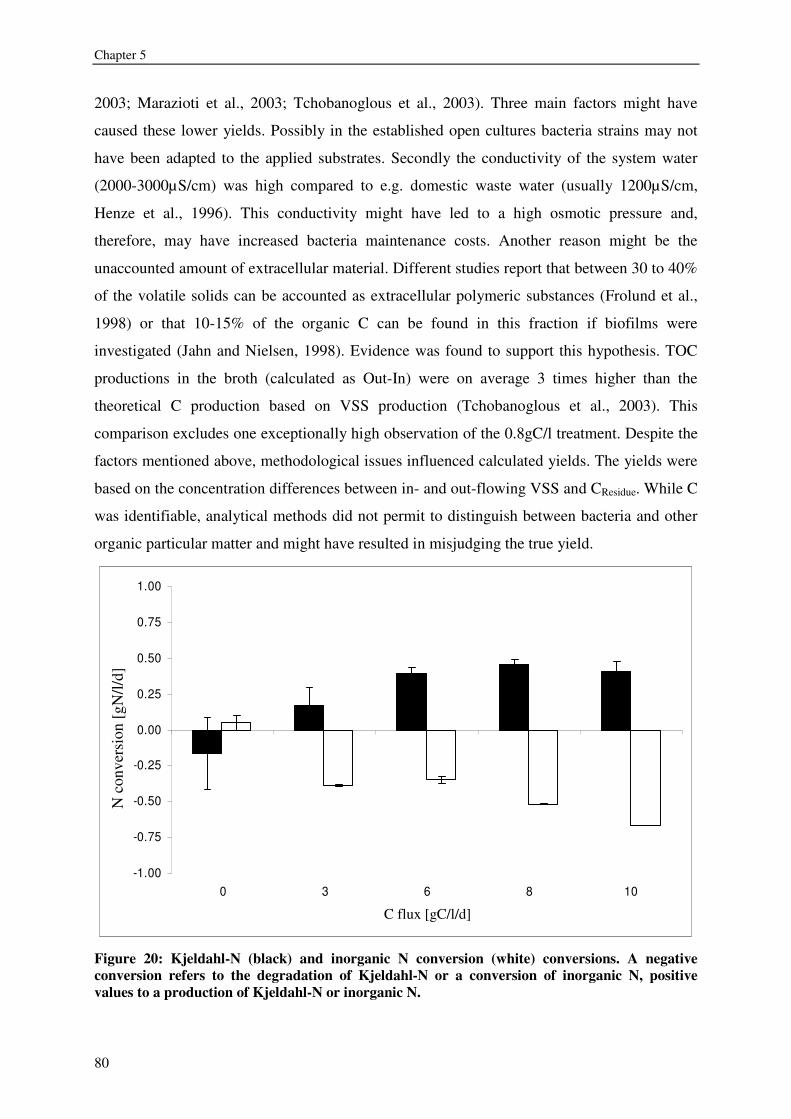
Chapter 5
80
2003; Marazioti et al., 2003; Tchobanoglous et al., 2003). Three main factors might have
caused these lower yields. Possibly in the established open cultures bacteria strains may not
have been adapted to the applied substrates. Secondly the conductivity of the system water
(2000-3000µS/cm) was high compared to e.g. domestic waste water (usually 1200µS/cm,
Henze et al., 1996). This conductivity might have led to a high osmotic pressure and,
therefore, may have increased bacteria maintenance costs. Another reason might be the
unaccounted amount of extracellular material. Different studies report that between 30 to 40%
of the volatile solids can be accounted as extracellular polymeric substances (Frolund et al.,
1998) or that 10-15% of the organic C can be found in this fraction if biofilms were
investigated (Jahn and Nielsen, 1998). Evidence was found to support this hypothesis. TOC
productions in the broth (calculated as Out-In) were on average 3 times higher than the
theoretical C production based on VSS production (Tchobanoglous et al., 2003). This
comparison excludes one exceptionally high observation of the 0.8gC/l treatment. Despite the
factors mentioned above, methodological issues influenced calculated yields. The yields were
based on the concentration differences between in- and out-flowing VSS and CResidue. While C
was identifiable, analytical methods did not permit to distinguish between bacteria and other
organic particular matter and might have resulted in misjudging the true yield.
-1.00
-0.75
-0.50
-0.25
0.00
0.25
0.50
0.75
1.00
0 3 6 8 10
C flux (gC/l/d)
N c
onve
rsio
n (g
N/l/
d)
Figure 20: Kjeldahl-N (black) and inorganic N conversion (white) conversions. A negative conversion refers to the degradation of Kjeldahl-N or a conversion of inorganic N, positive values to a production of Kjeldahl-N or inorganic N.
C flux [gC/l/d]
N c
onve
rsio
n [g
N/l/
d]
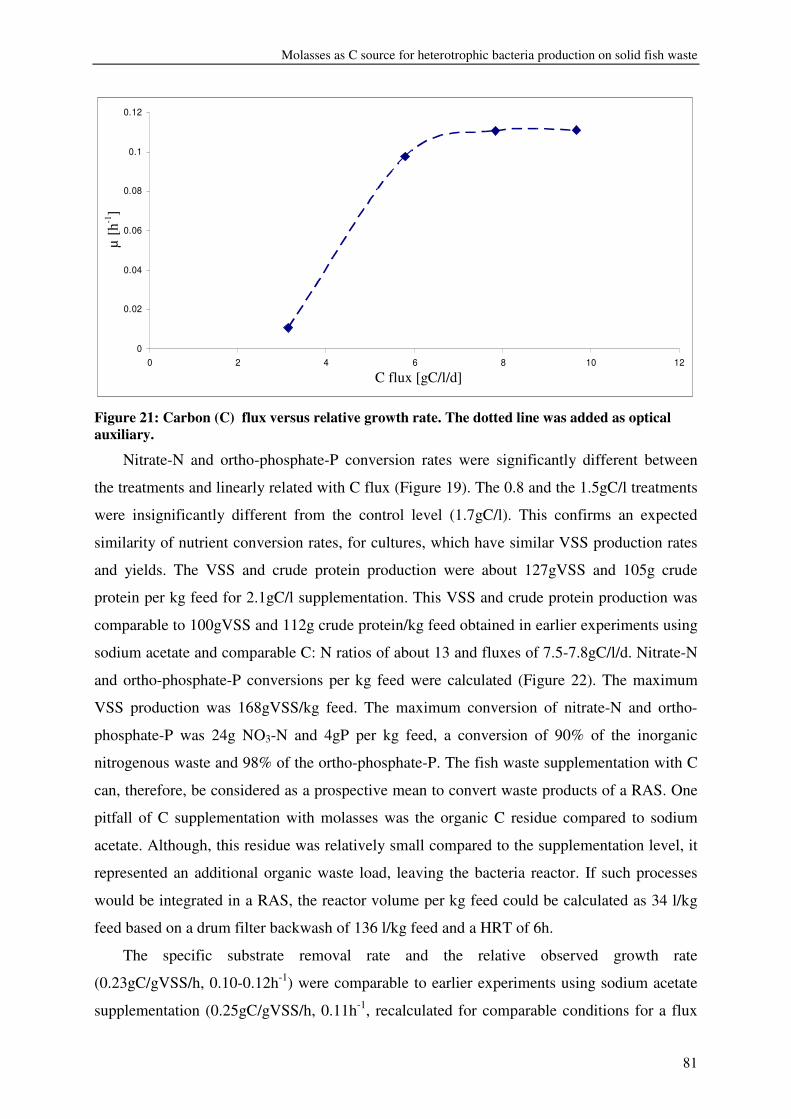
Molasses as C source for heterotrophic bacteria production on solid fish waste
81
0
0.02
0.04
0.06
0.08
0.1
0.12
0 2 4 6 8 10 12
C-Flux (g/l/d)
µ (1
/h)
Figure 21: Carbon (C) flux versus relative growth rate. The dotted line was added as optical auxiliary.
Nitrate-N and ortho-phosphate-P conversion rates were significantly different between
the treatments and linearly related with C flux (Figure 19). The 0.8 and the 1.5gC/l treatments
were insignificantly different from the control level (1.7gC/l). This confirms an expected
similarity of nutrient conversion rates, for cultures, which have similar VSS production rates
and yields. The VSS and crude protein production were about 127gVSS and 105g crude
protein per kg feed for 2.1gC/l supplementation. This VSS and crude protein production was
comparable to 100gVSS and 112g crude protein/kg feed obtained in earlier experiments using
sodium acetate and comparable C: N ratios of about 13 and fluxes of 7.5-7.8gC/l/d. Nitrate-N
and ortho-phosphate-P conversions per kg feed were calculated (Figure 22). The maximum
VSS production was 168gVSS/kg feed. The maximum conversion of nitrate-N and ortho-
phosphate-P was 24g NO3-N and 4gP per kg feed, a conversion of 90% of the inorganic
nitrogenous waste and 98% of the ortho-phosphate-P. The fish waste supplementation with C
can, therefore, be considered as a prospective mean to convert waste products of a RAS. One
pitfall of C supplementation with molasses was the organic C residue compared to sodium
acetate. Although, this residue was relatively small compared to the supplementation level, it
represented an additional organic waste load, leaving the bacteria reactor. If such processes
would be integrated in a RAS, the reactor volume per kg feed could be calculated as 34 l/kg
feed based on a drum filter backwash of 136 l/kg feed and a HRT of 6h.
The specific substrate removal rate and the relative observed growth rate
(0.23gC/gVSS/h, 0.10-0.12h-1) were comparable to earlier experiments using sodium acetate
supplementation (0.25gC/gVSS/h, 0.11h-1, recalculated for comparable conditions for a flux
C flux [gC/l/d]
µ [h
-1]
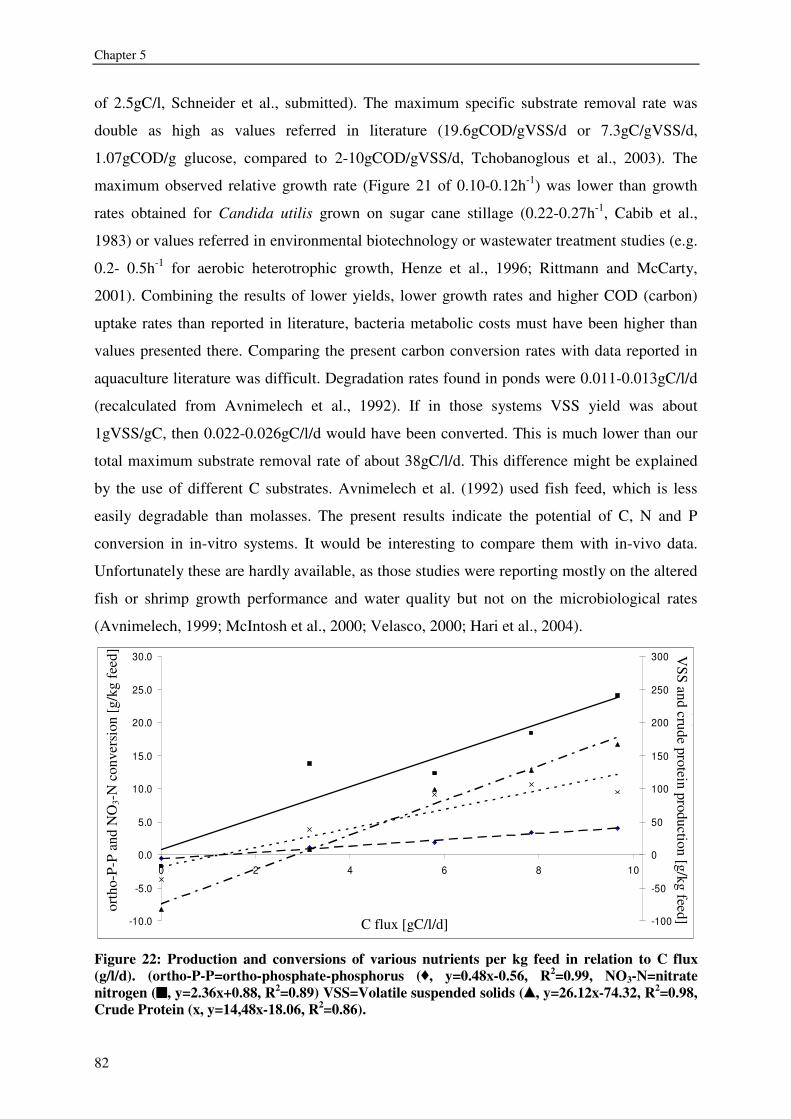
Chapter 5
82
of 2.5gC/l, Schneider et al., submitted). The maximum specific substrate removal rate was
double as high as values referred in literature (19.6gCOD/gVSS/d or 7.3gC/gVSS/d,
1.07gCOD/g glucose, compared to 2-10gCOD/gVSS/d, Tchobanoglous et al., 2003). The
maximum observed relative growth rate (Figure 21 of 0.10-0.12h-1) was lower than growth
rates obtained for Candida utilis grown on sugar cane stillage (0.22-0.27h-1, Cabib et al.,
1983) or values referred in environmental biotechnology or wastewater treatment studies (e.g.
0.2- 0.5h-1 for aerobic heterotrophic growth, Henze et al., 1996; Rittmann and McCarty,
2001). Combining the results of lower yields, lower growth rates and higher COD (carbon)
uptake rates than reported in literature, bacteria metabolic costs must have been higher than
values presented there. Comparing the present carbon conversion rates with data reported in
aquaculture literature was difficult. Degradation rates found in ponds were 0.011-0.013gC/l/d
(recalculated from Avnimelech et al., 1992). If in those systems VSS yield was about
1gVSS/gC, then 0.022-0.026gC/l/d would have been converted. This is much lower than our
total maximum substrate removal rate of about 38gC/l/d. This difference might be explained
by the use of different C substrates. Avnimelech et al. (1992) used fish feed, which is less
easily degradable than molasses. The present results indicate the potential of C, N and P
conversion in in-vitro systems. It would be interesting to compare them with in-vivo data.
Unfortunately these are hardly available, as those studies were reporting mostly on the altered
fish or shrimp growth performance and water quality but not on the microbiological rates
(Avnimelech, 1999; McIntosh et al., 2000; Velasco, 2000; Hari et al., 2004).
-10.0
-5.0
0.0
5.0
10.0
15.0
20.0
25.0
30.0
0 2 4 6 8 10
C flux (g/l/d)
orth
o-P
hosp
hate
-P o
r N
O3-
Nco
nver
sion
(g/k
g fe
ed)
-100
-50
0
50
100
150
200
250
300
VS
S o
r C
rude
Pro
tein
Pro
duct
ion
(g/k
g fe
ed)
Figure 22: Production and conversions of various nutrients per kg feed in relation to C flux (g/l/d). (ortho-P-P=ortho-phosphate-phosphorus ( , y=0.48x-0.56, R2=0.99, NO3-N=nitrate nitrogen (nnnn, y=2.36x+0.88, R2=0.89) VSS=Volatile suspended solids ( , y=26.12x-74.32, R2=0.98, Crude Protein (x, y=14,48x-18.06, R2=0.86).
C flux [gC/l/d]
orth
o-P-
P an
d N
O3-
N c
onve
rsio
n [g
/kg
feed
] VSS and crude protein production [g/kg feed]
Molasses as C source for heterotrophic bacteria production on solid fish waste
83
Conclusions The present study showed that molasses can serve as C source to produce
heterotrophic bacteria in suspended growth reactors with a production of up to 168gVSS per
kg feed. Strong linear relations have been found for the conversion of inorganic N and ortho-
phosphate-P with C fluxes. Inorganic nitrogenous waste and ortho-phosphate were eliminated
from the waste stream with an efficiency of 90 and 98%, respectively. Conversions, growth
rates and kinetics were comparable to those obtained for sodium acetate in this study and in
earlier experiments. Production rates were generally lower than values referred in literature
for waste water treatment. It is inferred that increased metabolic costs could explain this.
Based on the comparison between molasses and acetate, it is concluded that the production of
heterotrophic bacteria biomass on C supplemented fish waste is more dependent on C
supplementation levels and resulting nutrient ratios than on the C source. Using RAS as a
model system and molasses as easily degradable carbon source, bacteria production rates,
nutrient conversions, and related bacteria kinetics could be determined in contrast to pond
research, where often only fish or shrimp yield are investigated. Furthermore the present
integration of heterotrophic bacteria production in RAS represents an innovative option to
reduce waste discharge and to increase system’s ecological sustainability. But ecological
sustainability will only be achieved if the bacteria biomass is harvested and reused, which will
require more attention in the future.

84
85
Chapter 6
HRT and nutrients affect bacterial communities grown on
Recirculation Aquaculture System effluents
Abstract In a recirculation aquaculture system the drumfilter separates the solid waste from the
system water. Its effluent can be used as substrate for heterotrophic bacterial production,
which can be recycled as aquatic feed. Because the produced bacterial biomass might contain
pathogens, which could reduce its suitability as feed, it is important to characterize the
obtained communities. Bacteria biomass was produced in bacteria growth reactors under
different conditions, which affected its composition: 7h hydraulic retention time versus 2h,
sodium acetate versus molasses (organic carbon supplement), and ammonia versus nitrate
(nitrogen donor). Samples were analyzed by standard biochemical tests, by 16sRNA
ribotyping and ribosomal RNA gene-targeted PCR-DGGE fingerprinting combined with
clone library analysis. The community of the drumfilter effluent was different from the
communities found in the reactors. However, all major community components were present
in the effluent and reactor broths. Hydraulic retention times (7h versus 2h, HRT) influenced
bacteria community resulting in a more abundant fraction of alpha proteobacterium Bioluz/
Acinetobacter at 2h HRT compared to 7h HRT (Rhizobium/ Mezorhizobium). The use of
molasses instead of sodium acetate changed the bacteria community from Rhizobium/
Mesorhizobium to Aquaspirillum as major component. Providing TAN (total ammonia
nitrogen) in addition to nitrate as nitrogenous substrate led to the occurrence of bacteria close
to Sphaerotilus, Sphingobacterium and Jonesia. It was concluded from those results that a
reactor operation regime of 6-7h HRT is recommended, and that the type of substrate (sodium
acetate or molasses, TAN or nitrate) is less important, and results in communities with a
comparable low pathogenic risk.
Schneider, O., M. Chabrillon-Popelka, H. Smidt, O. Haenen, V. Sereti, E. H. Eding and J. A. J. Verreth (submitted). "HRT and nutrients affect bacterial communities grown on Recirculation Aquaculture System effluents." FEMS Microbial Ecology.
Chapter 6
86
Introduction In recirculation aquaculture systems (RAS), feed is converted into fish and faecal and
non faecal loss. These two waste sources comprise mainly of solid waste, and dissolved
waste: ammonia and phosphate. The waste is treated by mechanical filtration to remove the
solids and by biofiltration to nitrify ammonia to less hazardous nitrate. The effluent from the
mechanical filter is the major discharge of such systems. It comprises solid and dissolved
waste. The RAS’ effluent is either directly discharged to the environment, or digested in
lagoons or septic tanks, or thickened and/or applied as fertilizer for land based agriculture
(Chen et al., 1997; Losordo et al., 2003). A possible alternative approach is to convert the
waste into heterotrophic bacterial biomass. This biomass can be reutilized as aquatic feed.
Such processes are already applied in integrated and activated ponds. In such ponds, waste
conversion does not only improve water quality but also feed conversion ratios, because the
produced bacteria biomass may be consumed by the fish (Avnimelech et al., 1989; Edwards,
1993; Burford et al., 2003; Hari et al., 2004). To produce bacterial biomass utilizing the
effluent stream of the drum filter, a bacterial reactor has to be integrated after the drum filter
(Figure 7, page 41). The nutrient ratios in the slurry coming from the filter are normally not
ideal for bacteria production. Optimal C: N ratios for heterotrophic bacteria production are
about 12-15g:1g (Lechevallier et al., 1991; Henze et al., 1996; Avnimelech, 1999). Fish,
which are receiving high protein diets, are producing carbon deficient waste. This is due to the
amount of nitrogen, which accumulates in the RAS system water. The resulting C: N ratio in
the effluent is 2-3g:1g (Table 21). Therefore, the slurry requires organic carbon
supplementation. Sources and levels of carbon supplementation, sludge composition (total
ammonia nitrogen (TAN) or nitrate) and sludge and hydraulic retention time (SRT, HRT) are
all factors influencing the bacteria community forming the produced biomass. Furthermore,
the community composition depends also on the natural autochthonous microbiota from the
sludge and system water. If the produced community is re-used as aquatic feed, it is important
to evaluate the biomass for potential bacteria pathogens. The first study objective was to
characterize the bacterial community in the system water, in the slurry coming from the flow
equalizer, and of the produced bacterial biomass in the reactor by standard biochemical tests,
by 16sRNA ribotyping and ribosomal RNA gene-targeted PCR-DGGE fingerprinting
combined with clone library analysis The effect of different hydraulic retention times and the
influence of different carbon and nitrogen sources were evaluated. The second objective was
to assess if the produced bacteria biomass contains pathogens, which could reduce its
HRT and nutrients affect bacterial communities grown on Recirculation Aquaculture System effluents
87
suitability as feed by comparing determined bacteria strains through comparison with those
reported in literature as pathogenic.
Material and Methods
System set up Two bacteria growth reactors were connected in parallel to a flow equalizer which
received the effluent of a screen filter (60�m mesh size, Figure 7, page 41). The screen filter
was part of a RAS, which was composed of four culture tanks, a biofilter and two sumps. In
the equalizer the slurry was aerated and agitated. The equalizer was integrated into the system
to allow for constant waste flows towards the bacteria reactor, because the screenfilter
backwashes in pulses, depending on its automated flushing cycle. The HRT of the drum filter
effluent in the equalizer was 4h and the drum filter backwash volume about 120-140 l per kg
feed.
Fish husbandry Fish were obtained from a commercial African catfish hatchery (Fleuren and Nooijen,
The Netherlands). Fish were stocked initially in four different cohorts of 140 fish each (70g,
170g, 320g, and 560g individual average weight) into the four tanks. Every 28 days the oldest
cohort was harvested. The emptied tank was restocked with 140 fish of about 70g. The final
fish weight ranged between 823-1038g. Therefore a complete production cycle from 70 to
about 1000g lasted 112 days. Fish were fed with commercial feed (Biomeerval, Skretting,
France), containing 7% moisture, 49% crude protein, 11% crude fat, 22% carbohydrates, of
which 2% crude fiber, 11% crude ash and 1.7% phosphorous (based on manufacturer
information). The realized feeding level was between 16 and 19g per kg metabolic body
weight (W0.8) per day. Diurnal waste fluctuations were minimized by applying a 24h feeding
regime. The monthly harvesting/restocking scheme minimized changes in both biomass
within the system and in feed load. This stocking and feeding strategy assured minimal
fluctuations of waste production during a production cycle.
Bacteria reactors The reactors were made of glass in the workshop of Wageningen University. The
reactors had a working volume of 3.5 liter and were equipped with baffles to improve the
hydrodynamics (Figure 8, page 43). From the flow equalizer the slurry was continuously
pumped into the bacterial culture reactor by a peristaltic pump (Masterflex L/S, Masterflex,
USA). The SRT was equal to the HRT as no sludge was returned. Pure oxygen was diffused
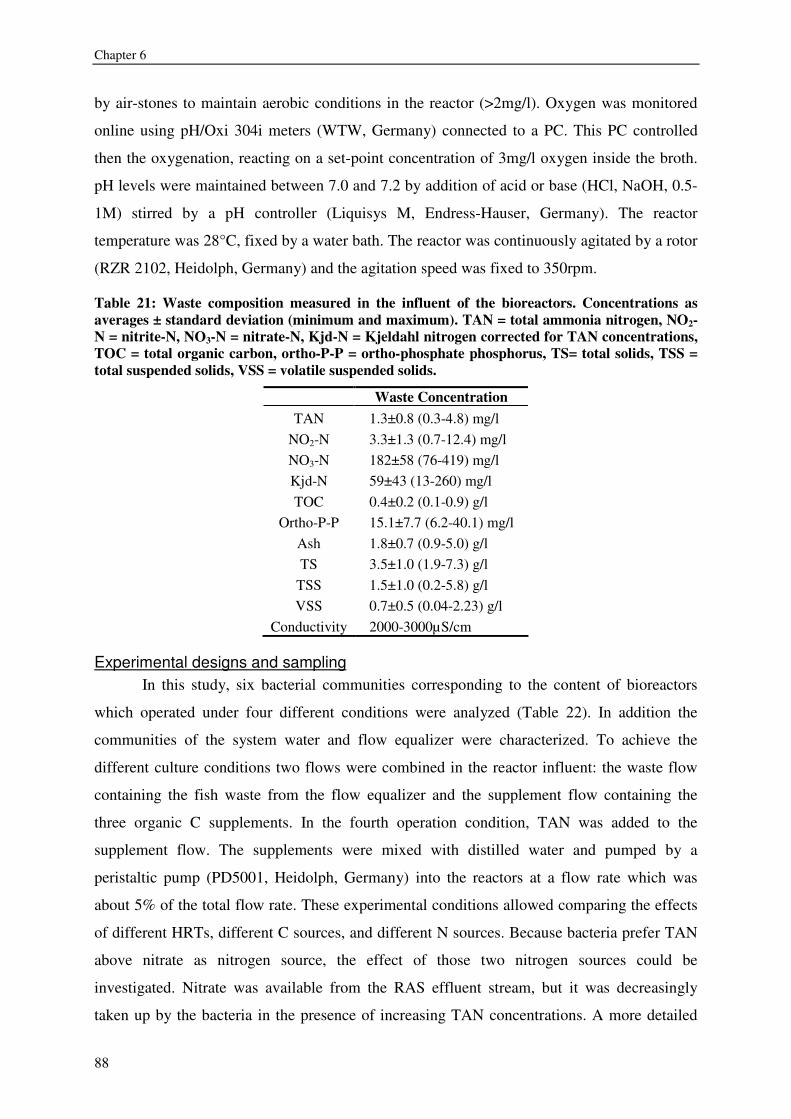
Chapter 6
88
by air-stones to maintain aerobic conditions in the reactor (>2mg/l). Oxygen was monitored
online using pH/Oxi 304i meters (WTW, Germany) connected to a PC. This PC controlled
then the oxygenation, reacting on a set-point concentration of 3mg/l oxygen inside the broth.
pH levels were maintained between 7.0 and 7.2 by addition of acid or base (HCl, NaOH, 0.5-
1M) stirred by a pH controller (Liquisys M, Endress-Hauser, Germany). The reactor
temperature was 28°C, fixed by a water bath. The reactor was continuously agitated by a rotor
(RZR 2102, Heidolph, Germany) and the agitation speed was fixed to 350rpm.
Table 21: Waste composition measured in the influent of the bioreactors. Concentrations as averages ± standard deviation (minimum and maximum). TAN = total ammonia nitrogen, NO2-N = nitrite-N, NO3-N = nitrate-N, Kjd-N = Kjeldahl nitrogen corrected for TAN concentrations, TOC = total organic carbon, ortho-P-P = ortho-phosphate phosphorus, TS= total solids, TSS = total suspended solids, VSS = volatile suspended solids.
Waste Concentration TAN
NO2-N NO3-N Kjd-N
1.3±0.8 (0.3-4.8) mg/l 3.3±1.3 (0.7-12.4) mg/l 182±58 (76-419) mg/l 59±43 (13-260) mg/l
TOC 0.4±0.2 (0.1-0.9) g/l Ortho-P-P 15.1±7.7 (6.2-40.1) mg/l
Ash 1.8±0.7 (0.9-5.0) g/l TS 3.5±1.0 (1.9-7.3) g/l
TSS 1.5±1.0 (0.2-5.8) g/l VSS 0.7±0.5 (0.04-2.23) g/l
Conductivity 2000-3000µS/cm
Experimental designs and sampling In this study, six bacterial communities corresponding to the content of bioreactors
which operated under four different conditions were analyzed (Table 22). In addition the
communities of the system water and flow equalizer were characterized. To achieve the
different culture conditions two flows were combined in the reactor influent: the waste flow
containing the fish waste from the flow equalizer and the supplement flow containing the
three organic C supplements. In the fourth operation condition, TAN was added to the
supplement flow. The supplements were mixed with distilled water and pumped by a
peristaltic pump (PD5001, Heidolph, Germany) into the reactors at a flow rate which was
about 5% of the total flow rate. These experimental conditions allowed comparing the effects
of different HRTs, different C sources, and different N sources. Because bacteria prefer TAN
above nitrate as nitrogen source, the effect of those two nitrogen sources could be
investigated. Nitrate was available from the RAS effluent stream, but it was decreasingly
taken up by the bacteria in the presence of increasing TAN concentrations. A more detailed
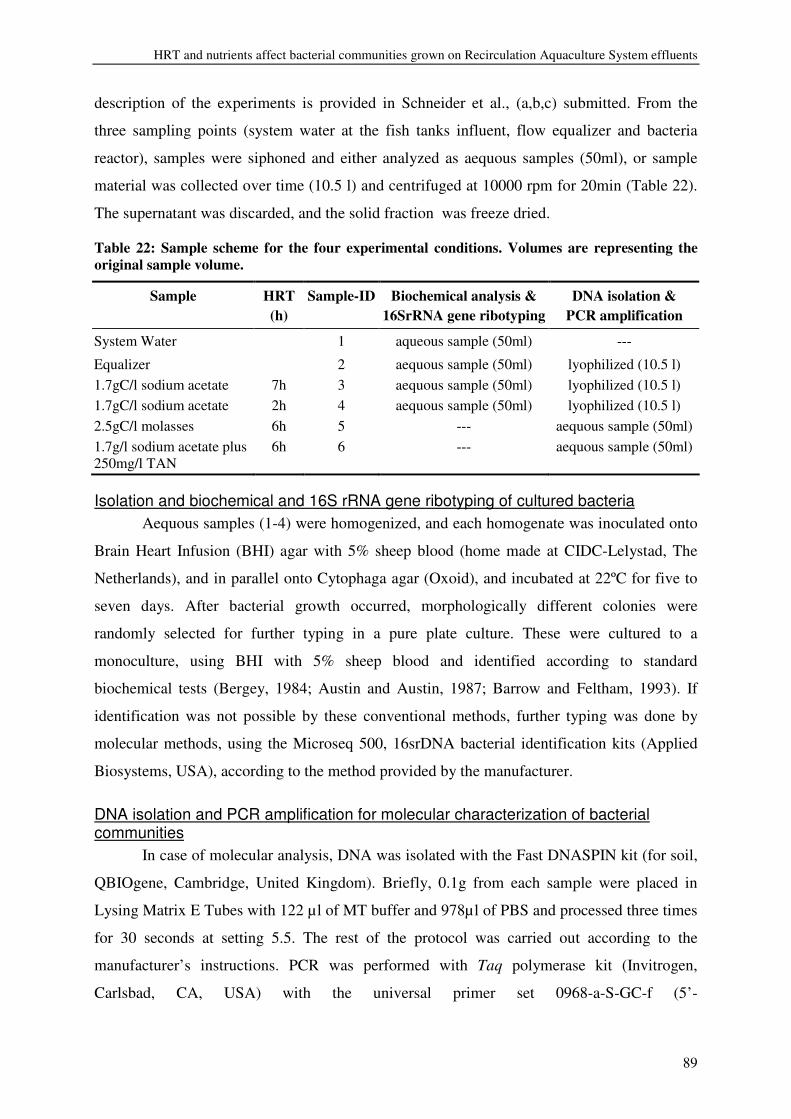
HRT and nutrients affect bacterial communities grown on Recirculation Aquaculture System effluents
89
description of the experiments is provided in Schneider et al., (a,b,c) submitted. From the
three sampling points (system water at the fish tanks influent, flow equalizer and bacteria
reactor), samples were siphoned and either analyzed as aequous samples (50ml), or sample
material was collected over time (10.5 l) and centrifuged at 10000 rpm for 20min (Table 22).
The supernatant was discarded, and the solid fraction was freeze dried.
Table 22: Sample scheme for the four experimental conditions. Volumes are representing the original sample volume.
Sample HRT (h)
Sample-ID Biochemical analysis & 16SrRNA gene ribotyping
DNA isolation & PCR amplification
System Water 1 aqueous sample (50ml) ---
Equalizer 2 aequous sample (50ml) lyophilized (10.5 l) 1.7gC/l sodium acetate 7h 3 aequous sample (50ml) lyophilized (10.5 l) 1.7gC/l sodium acetate 2h 4 aequous sample (50ml) lyophilized (10.5 l) 2.5gC/l molasses 6h 5 --- aequous sample (50ml) 1.7g/l sodium acetate plus 250mg/l TAN
6h 6 --- aequous sample (50ml)
Isolation and biochemical and 16S rRNA gene ribotyping of cultured bacteria Aequous samples (1-4) were homogenized, and each homogenate was inoculated onto
Brain Heart Infusion (BHI) agar with 5% sheep blood (home made at CIDC-Lelystad, The
Netherlands), and in parallel onto Cytophaga agar (Oxoid), and incubated at 22ºC for five to
seven days. After bacterial growth occurred, morphologically different colonies were
randomly selected for further typing in a pure plate culture. These were cultured to a
monoculture, using BHI with 5% sheep blood and identified according to standard
biochemical tests (Bergey, 1984; Austin and Austin, 1987; Barrow and Feltham, 1993). If
identification was not possible by these conventional methods, further typing was done by
molecular methods, using the Microseq 500, 16srDNA bacterial identification kits (Applied
Biosystems, USA), according to the method provided by the manufacturer.
DNA isolation and PCR amplification for molecular characterization of bacterial communities
In case of molecular analysis, DNA was isolated with the Fast DNASPIN kit (for soil,
QBIOgene, Cambridge, United Kingdom). Briefly, 0.1g from each sample were placed in
Lysing Matrix E Tubes with 122 µl of MT buffer and 978µl of PBS and processed three times
for 30 seconds at setting 5.5. The rest of the protocol was carried out according to the
manufacturer’s instructions. PCR was performed with Taq polymerase kit (Invitrogen,
Carlsbad, CA, USA) with the universal primer set 0968-a-S-GC-f (5’-
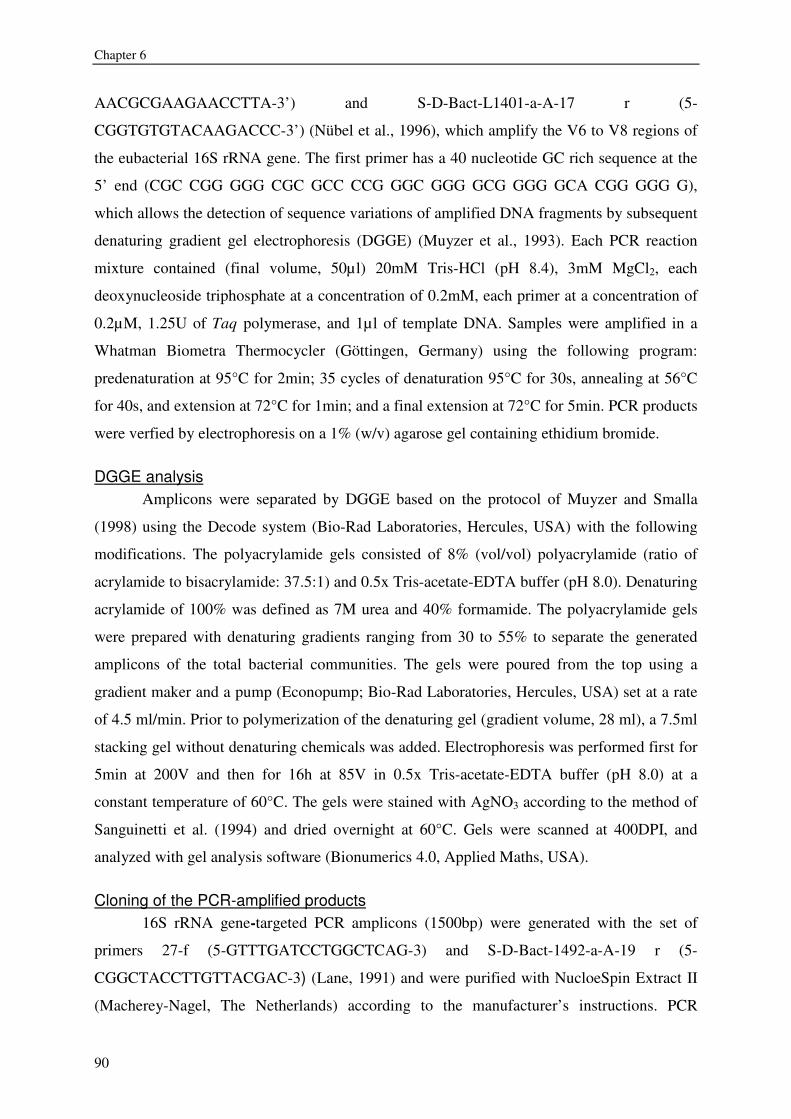
Chapter 6
90
AACGCGAAGAACCTTA-3’) and S-D-Bact-L1401-a-A-17 r (5-
CGGTGTGTACAAGACCC-3’) (Nübel et al., 1996), which amplify the V6 to V8 regions of
the eubacterial 16S rRNA gene. The first primer has a 40 nucleotide GC rich sequence at the
5’ end (CGC CGG GGG CGC GCC CCG GGC GGG GCG GGG GCA CGG GGG G),
which allows the detection of sequence variations of amplified DNA fragments by subsequent
denaturing gradient gel electrophoresis (DGGE) (Muyzer et al., 1993). Each PCR reaction
mixture contained (final volume, 50µl) 20mM Tris-HCl (pH 8.4), 3mM MgCl2, each
deoxynucleoside triphosphate at a concentration of 0.2mM, each primer at a concentration of
0.2µM, 1.25U of Taq polymerase, and 1µl of template DNA. Samples were amplified in a
Whatman Biometra Thermocycler (Göttingen, Germany) using the following program:
predenaturation at 95°C for 2min; 35 cycles of denaturation 95°C for 30s, annealing at 56°C
for 40s, and extension at 72°C for 1min; and a final extension at 72°C for 5min. PCR products
were verfied by electrophoresis on a 1% (w/v) agarose gel containing ethidium bromide.
DGGE analysis Amplicons were separated by DGGE based on the protocol of Muyzer and Smalla
(1998) using the Decode system (Bio-Rad Laboratories, Hercules, USA) with the following
modifications. The polyacrylamide gels consisted of 8% (vol/vol) polyacrylamide (ratio of
acrylamide to bisacrylamide: 37.5:1) and 0.5x Tris-acetate-EDTA buffer (pH 8.0). Denaturing
acrylamide of 100% was defined as 7M urea and 40% formamide. The polyacrylamide gels
were prepared with denaturing gradients ranging from 30 to 55% to separate the generated
amplicons of the total bacterial communities. The gels were poured from the top using a
gradient maker and a pump (Econopump; Bio-Rad Laboratories, Hercules, USA) set at a rate
of 4.5 ml/min. Prior to polymerization of the denaturing gel (gradient volume, 28 ml), a 7.5ml
stacking gel without denaturing chemicals was added. Electrophoresis was performed first for
5min at 200V and then for 16h at 85V in 0.5x Tris-acetate-EDTA buffer (pH 8.0) at a
constant temperature of 60°C. The gels were stained with AgNO3 according to the method of
Sanguinetti et al. (1994) and dried overnight at 60°C. Gels were scanned at 400DPI, and
analyzed with gel analysis software (Bionumerics 4.0, Applied Maths, USA).
Cloning of the PCR-amplified products 16S rRNA gene-targeted PCR amplicons (1500bp) were generated with the set of
primers 27-f (5-GTTTGATCCTGGCTCAG-3) and S-D-Bact-1492-a-A-19 r (5-
CGGCTACCTTGTTACGAC-3) (Lane, 1991) and were purified with NucloeSpin Extract II
(Macherey-Nagel, The Netherlands) according to the manufacturer’s instructions. PCR
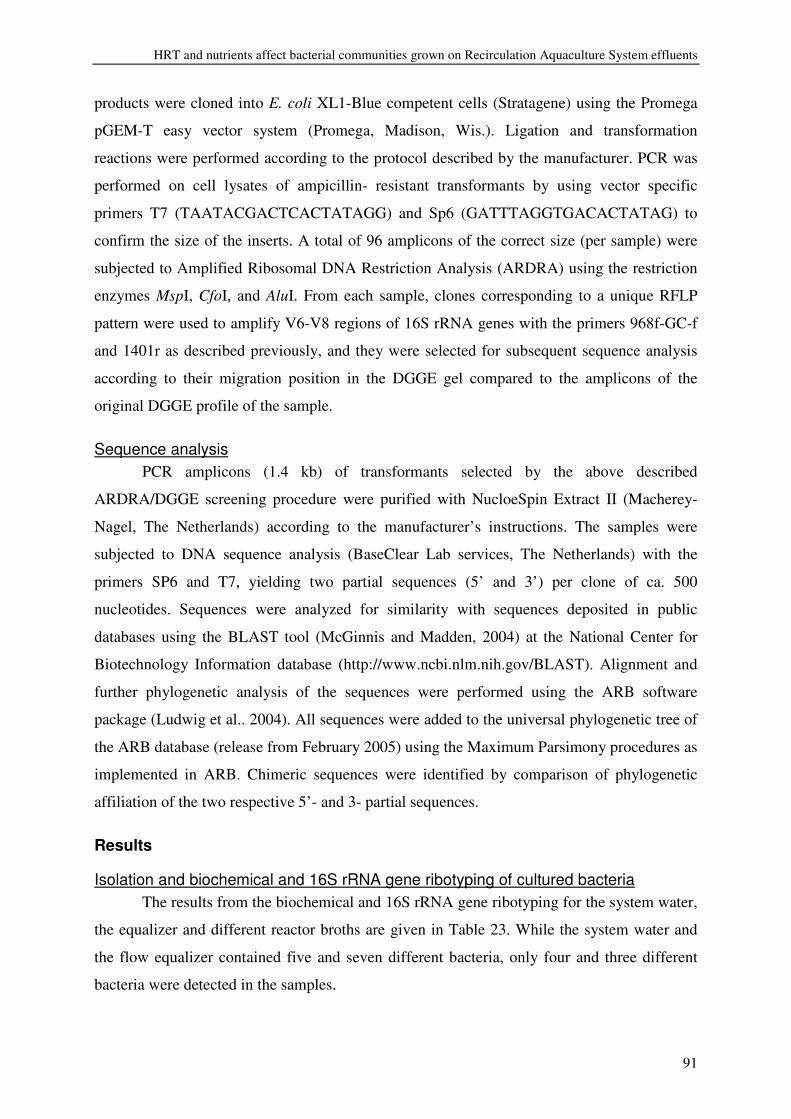
HRT and nutrients affect bacterial communities grown on Recirculation Aquaculture System effluents
91
products were cloned into E. coli XL1-Blue competent cells (Stratagene) using the Promega
pGEM-T easy vector system (Promega, Madison, Wis.). Ligation and transformation
reactions were performed according to the protocol described by the manufacturer. PCR was
performed on cell lysates of ampicillin- resistant transformants by using vector specific
primers T7 (TAATACGACTCACTATAGG) and Sp6 (GATTTAGGTGACACTATAG) to
confirm the size of the inserts. A total of 96 amplicons of the correct size (per sample) were
subjected to Amplified Ribosomal DNA Restriction Analysis (ARDRA) using the restriction
enzymes MspI, CfoI, and AluI. From each sample, clones corresponding to a unique RFLP
pattern were used to amplify V6-V8 regions of 16S rRNA genes with the primers 968f-GC-f
and 1401r as described previously, and they were selected for subsequent sequence analysis
according to their migration position in the DGGE gel compared to the amplicons of the
original DGGE profile of the sample.
Sequence analysis PCR amplicons (1.4 kb) of transformants selected by the above described
ARDRA/DGGE screening procedure were purified with NucloeSpin Extract II (Macherey-
Nagel, The Netherlands) according to the manufacturer’s instructions. The samples were
subjected to DNA sequence analysis (BaseClear Lab services, The Netherlands) with the
primers SP6 and T7, yielding two partial sequences (5’ and 3’) per clone of ca. 500
nucleotides. Sequences were analyzed for similarity with sequences deposited in public
databases using the BLAST tool (McGinnis and Madden, 2004) at the National Center for
Biotechnology Information database (http://www.ncbi.nlm.nih.gov/BLAST). Alignment and
further phylogenetic analysis of the sequences were performed using the ARB software
package (Ludwig et al.. 2004). All sequences were added to the universal phylogenetic tree of
the ARB database (release from February 2005) using the Maximum Parsimony procedures as
implemented in ARB. Chimeric sequences were identified by comparison of phylogenetic
affiliation of the two respective 5’- and 3- partial sequences.
Results
Isolation and biochemical and 16S rRNA gene ribotyping of cultured bacteria The results from the biochemical and 16S rRNA gene ribotyping for the system water,
the equalizer and different reactor broths are given in Table 23. While the system water and
the flow equalizer contained five and seven different bacteria, only four and three different
bacteria were detected in the samples.
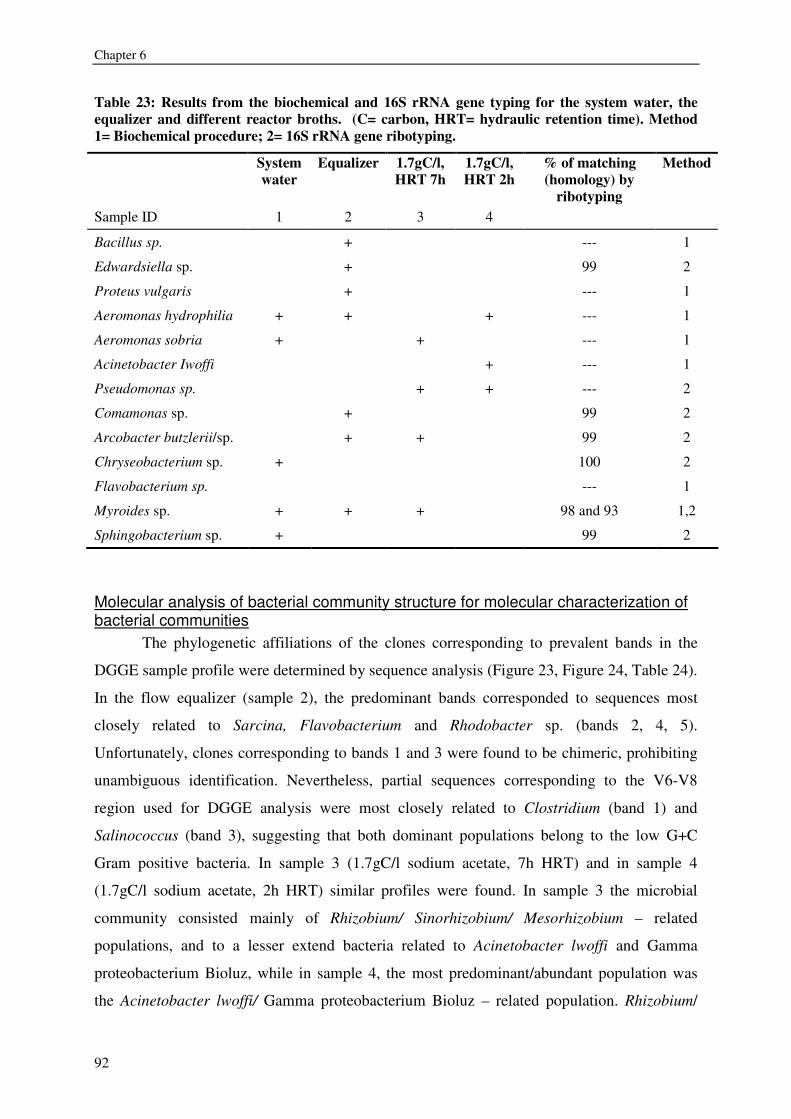
Chapter 6
92
Table 23: Results from the biochemical and 16S rRNA gene typing for the system water, the equalizer and different reactor broths. (C= carbon, HRT= hydraulic retention time). Method 1= Biochemical procedure; 2= 16S rRNA gene ribotyping.
System water
Equalizer
1.7gC/l, HRT 7h
1.7gC/l, HRT 2h
% of matching (homology) by
ribotyping
Method
Sample ID 1 2 3 4
Bacillus sp. + --- 1
Edwardsiella sp. + 99 2
Proteus vulgaris + --- 1
Aeromonas hydrophilia + + + --- 1
Aeromonas sobria + + --- 1
Acinetobacter Iwoffi + --- 1
Pseudomonas sp. + + --- 2
Comamonas sp. + 99 2
Arcobacter butzlerii/sp. + + 99 2
Chryseobacterium sp. + 100 2
Flavobacterium sp. --- 1
Myroides sp. + + + 98 and 93 1,2
Sphingobacterium sp. + 99 2
Molecular analysis of bacterial community structure for molecular characterization of bacterial communities
The phylogenetic affiliations of the clones corresponding to prevalent bands in the
DGGE sample profile were determined by sequence analysis (Figure 23, Figure 24, Table 24).
In the flow equalizer (sample 2), the predominant bands corresponded to sequences most
closely related to Sarcina, Flavobacterium and Rhodobacter sp. (bands 2, 4, 5).
Unfortunately, clones corresponding to bands 1 and 3 were found to be chimeric, prohibiting
unambiguous identification. Nevertheless, partial sequences corresponding to the V6-V8
region used for DGGE analysis were most closely related to Clostridium (band 1) and
Salinococcus (band 3), suggesting that both dominant populations belong to the low G+C
Gram positive bacteria. In sample 3 (1.7gC/l sodium acetate, 7h HRT) and in sample 4
(1.7gC/l sodium acetate, 2h HRT) similar profiles were found. In sample 3 the microbial
community consisted mainly of Rhizobium/ Sinorhizobium/ Mesorhizobium – related
populations, and to a lesser extend bacteria related to Acinetobacter lwoffi and Gamma
proteobacterium Bioluz, while in sample 4, the most predominant/abundant population was
the Acinetobacter lwoffi/ Gamma proteobacterium Bioluz – related population. Rhizobium/
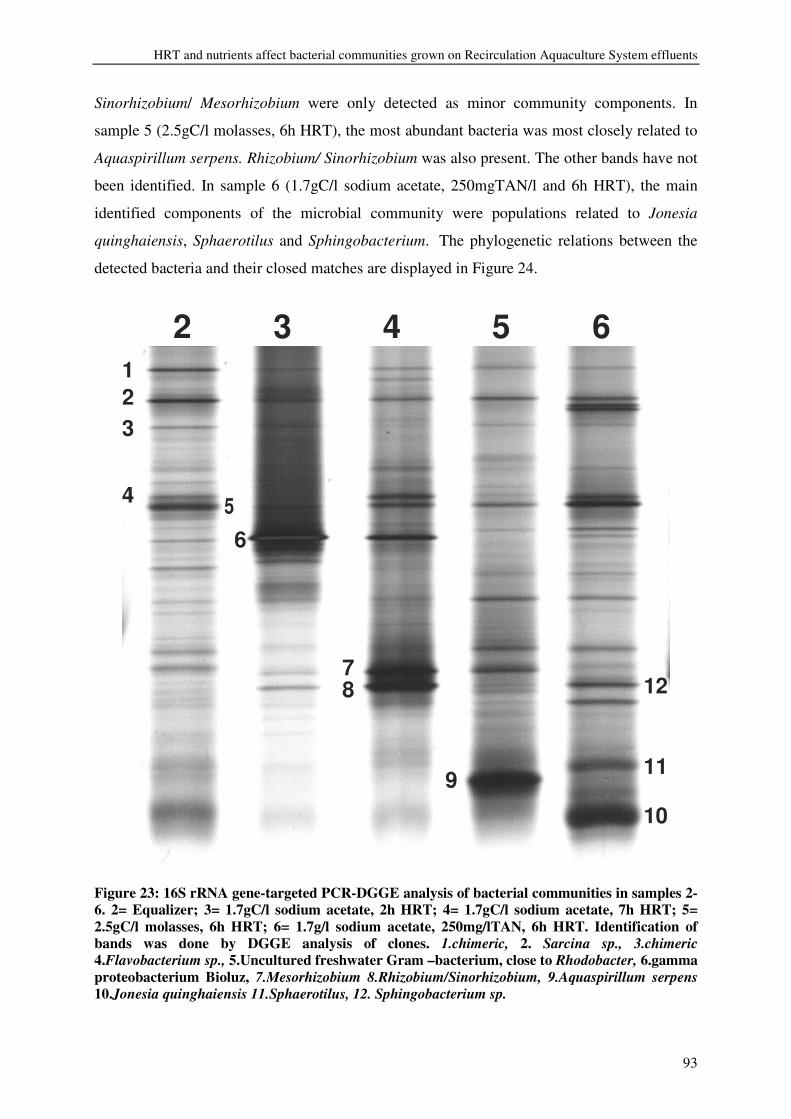
HRT and nutrients affect bacterial communities grown on Recirculation Aquaculture System effluents
93
Sinorhizobium/ Mesorhizobium were only detected as minor community components. In
sample 5 (2.5gC/l molasses, 6h HRT), the most abundant bacteria was most closely related to
Aquaspirillum serpens. Rhizobium/ Sinorhizobium was also present. The other bands have not
been identified. In sample 6 (1.7gC/l sodium acetate, 250mgTAN/l and 6h HRT), the main
identified components of the microbial community were populations related to Jonesia
quinghaiensis, Sphaerotilus and Sphingobacterium. The phylogenetic relations between the
detected bacteria and their closed matches are displayed in Figure 24.
2 3 4 5 612
4
712
3
56
8
9 11
10
Figure 23: 16S rRNA gene-targeted PCR-DGGE analysis of bacterial communities in samples 2-6. 2= Equalizer; 3= 1.7gC/l sodium acetate, 2h HRT; 4= 1.7gC/l sodium acetate, 7h HRT; 5= 2.5gC/l molasses, 6h HRT; 6= 1.7g/l sodium acetate, 250mg/lTAN, 6h HRT. Identification of bands was done by DGGE analysis of clones. 1.chimeric, 2. Sarcina sp., 3.chimeric 4.Flavobacterium sp., 5.Uncultured freshwater Gram –bacterium, close to Rhodobacter, 6.gamma proteobacterium Bioluz, 7.Mesorhizobium 8.Rhizobium/Sinorhizobium, 9.Aquaspirillum serpens 10.Jonesia quinghaiensis 11.Sphaerotilus, 12. Sphingobacterium sp.
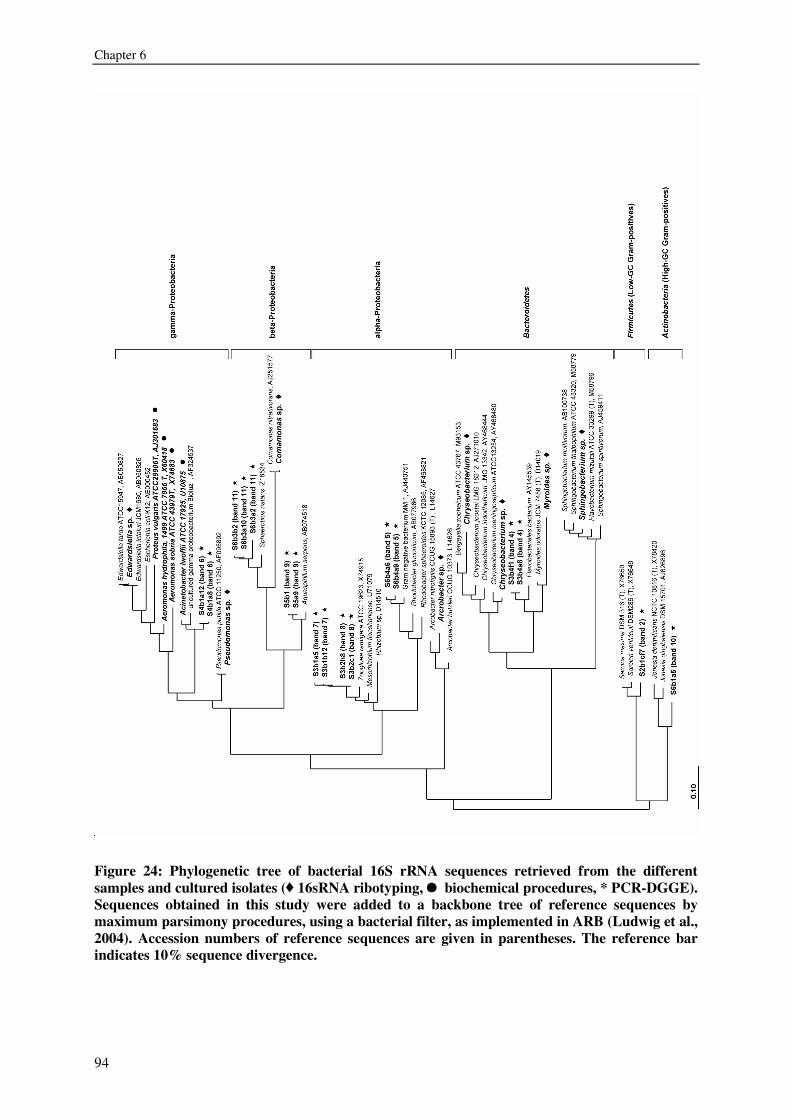
Chapter 6
94
Figure 24: Phylogenetic tree of bacterial 16S rRNA sequences retrieved from the different samples and cultured isolates ( 16sRNA ribotyping, biochemical procedures, * PCR-DGGE). Sequences obtained in this study were added to a backbone tree of reference sequences by maximum parsimony procedures, using a bacterial filter, as implemented in ARB (Ludwig et al., 2004). Accession numbers of reference sequences are given in parentheses. The reference bar indicates 10% sequence divergence.
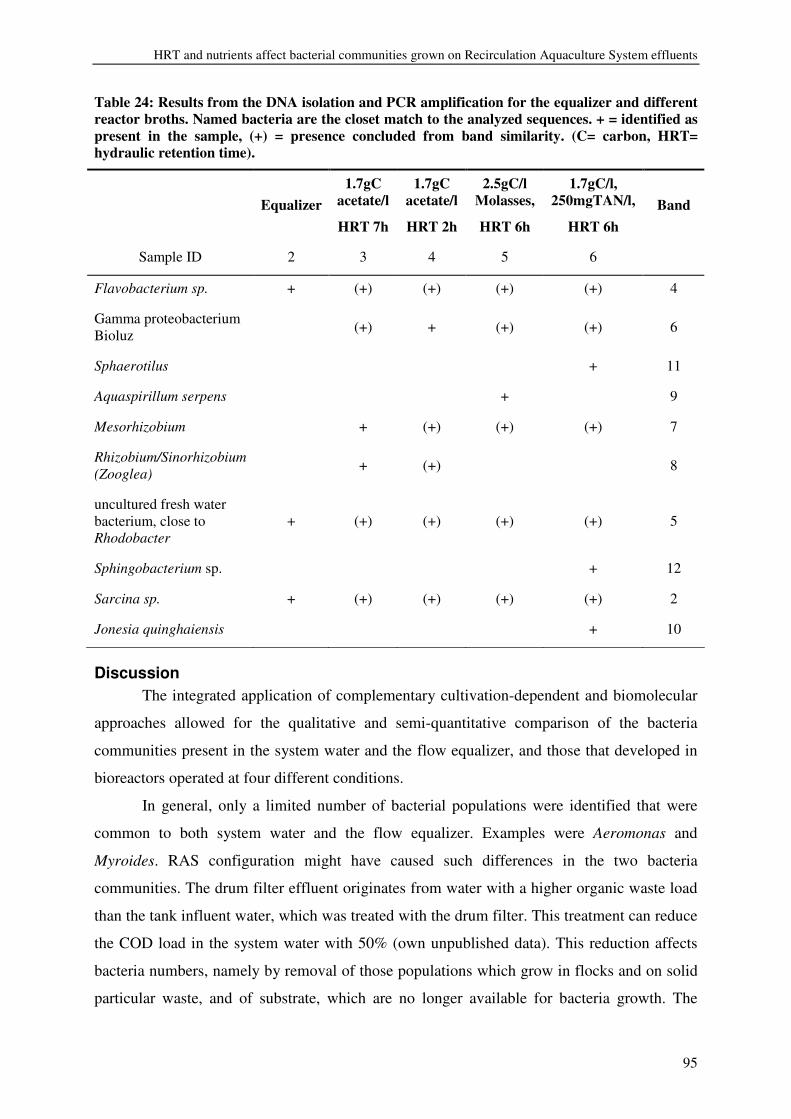
HRT and nutrients affect bacterial communities grown on Recirculation Aquaculture System effluents
95
Table 24: Results from the DNA isolation and PCR amplification for the equalizer and different reactor broths. Named bacteria are the closet match to the analyzed sequences. + = identified as present in the sample, (+) = presence concluded from band similarity. (C= carbon, HRT= hydraulic retention time).
Equalizer 1.7gC
acetate/l
HRT 7h
1.7gC acetate/l
HRT 2h
2.5gC/l Molasses,
HRT 6h
1.7gC/l, 250mgTAN/l,
HRT 6h Band
Sample ID 2 3 4 5 6
Flavobacterium sp. + (+) (+) (+) (+) 4
Gamma proteobacterium Bioluz (+) + (+) (+) 6
Sphaerotilus + 11
Aquaspirillum serpens + 9
Mesorhizobium + (+) (+) (+) 7
Rhizobium/Sinorhizobium (Zooglea) + (+) 8
uncultured fresh water bacterium, close to Rhodobacter
+ (+) (+) (+) (+) 5
Sphingobacterium sp. + 12
Sarcina sp. + (+) (+) (+) (+) 2
Jonesia quinghaiensis + 10
Discussion The integrated application of complementary cultivation-dependent and biomolecular
approaches allowed for the qualitative and semi-quantitative comparison of the bacteria
communities present in the system water and the flow equalizer, and those that developed in
bioreactors operated at four different conditions.
In general, only a limited number of bacterial populations were identified that were
common to both system water and the flow equalizer. Examples were Aeromonas and
Myroides. RAS configuration might have caused such differences in the two bacteria
communities. The drum filter effluent originates from water with a higher organic waste load
than the tank influent water, which was treated with the drum filter. This treatment can reduce
the COD load in the system water with 50% (own unpublished data). This reduction affects
bacteria numbers, namely by removal of those populations which grow in flocks and on solid
particular waste, and of substrate, which are no longer available for bacteria growth. The
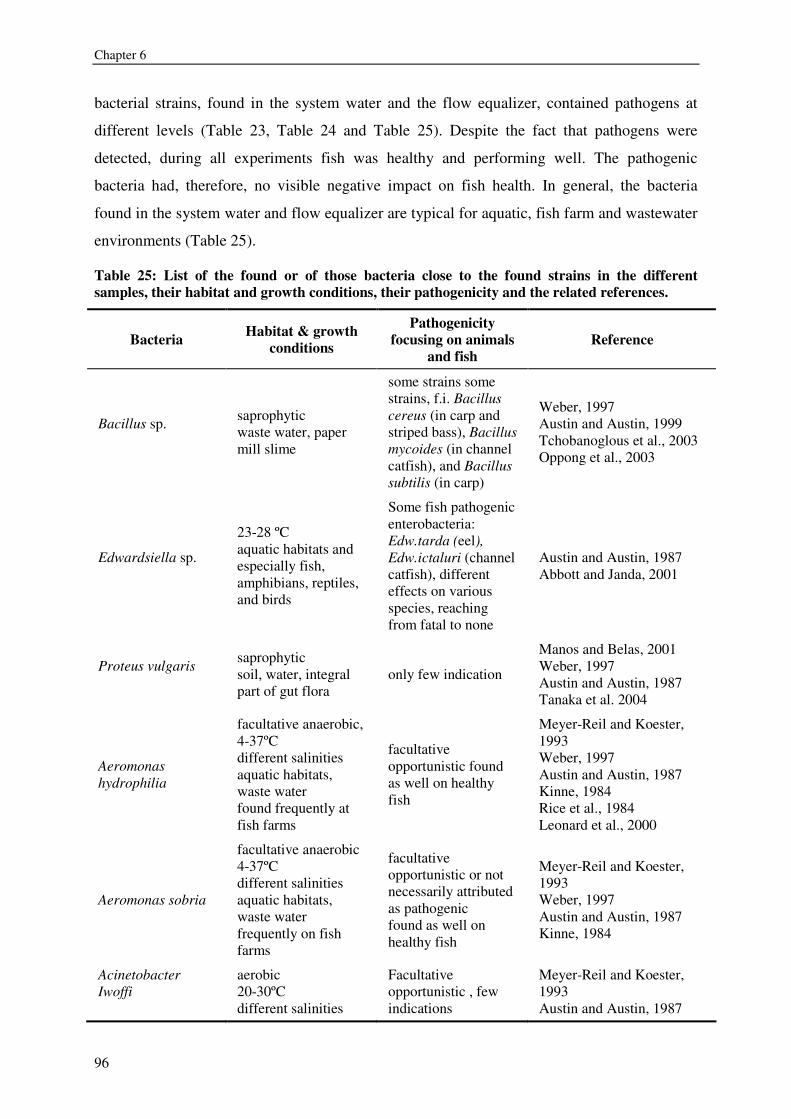
Chapter 6
96
bacterial strains, found in the system water and the flow equalizer, contained pathogens at
different levels (Table 23, Table 24 and Table 25). Despite the fact that pathogens were
detected, during all experiments fish was healthy and performing well. The pathogenic
bacteria had, therefore, no visible negative impact on fish health. In general, the bacteria
found in the system water and flow equalizer are typical for aquatic, fish farm and wastewater
environments (Table 25).
Table 25: List of the found or of those bacteria close to the found strains in the different samples, their habitat and growth conditions, their pathogenicity and the related references.
Bacteria Habitat & growth conditions
Pathogenicity focusing on animals
and fish Reference
Bacillus sp.
saprophytic waste water, paper mill slime
some strains some strains, f.i. Bacillus cereus (in carp and striped bass), Bacillus mycoides (in channel catfish), and Bacillus subtilis (in carp)
Weber, 1997 Austin and Austin, 1999 Tchobanoglous et al., 2003 Oppong et al., 2003
Edwardsiella sp.
23-28 ºC aquatic habitats and especially fish, amphibians, reptiles, and birds
Some fish pathogenic enterobacteria: Edw.tarda (eel), Edw.ictaluri (channel catfish), different effects on various species, reaching from fatal to none
Austin and Austin, 1987 Abbott and Janda, 2001
Proteus vulgaris
saprophytic soil, water, integral part of gut flora
only few indication
Manos and Belas, 2001 Weber, 1997 Austin and Austin, 1987 Tanaka et al. 2004
Aeromonas hydrophilia
facultative anaerobic, 4-37ºC different salinities aquatic habitats, waste water found frequently at fish farms
facultative opportunistic found as well on healthy fish
Meyer-Reil and Koester, 1993 Weber, 1997 Austin and Austin, 1987 Kinne, 1984 Rice et al., 1984 Leonard et al., 2000
Aeromonas sobria
facultative anaerobic 4-37ºC different salinities aquatic habitats, waste water frequently on fish farms
facultative opportunistic or not necessarily attributed as pathogenic found as well on healthy fish
Meyer-Reil and Koester, 1993 Weber, 1997 Austin and Austin, 1987 Kinne, 1984
Acinetobacter Iwoffi
aerobic 20-30ºC different salinities
Facultative opportunistic , few indications
Meyer-Reil and Koester, 1993 Austin and Austin, 1987
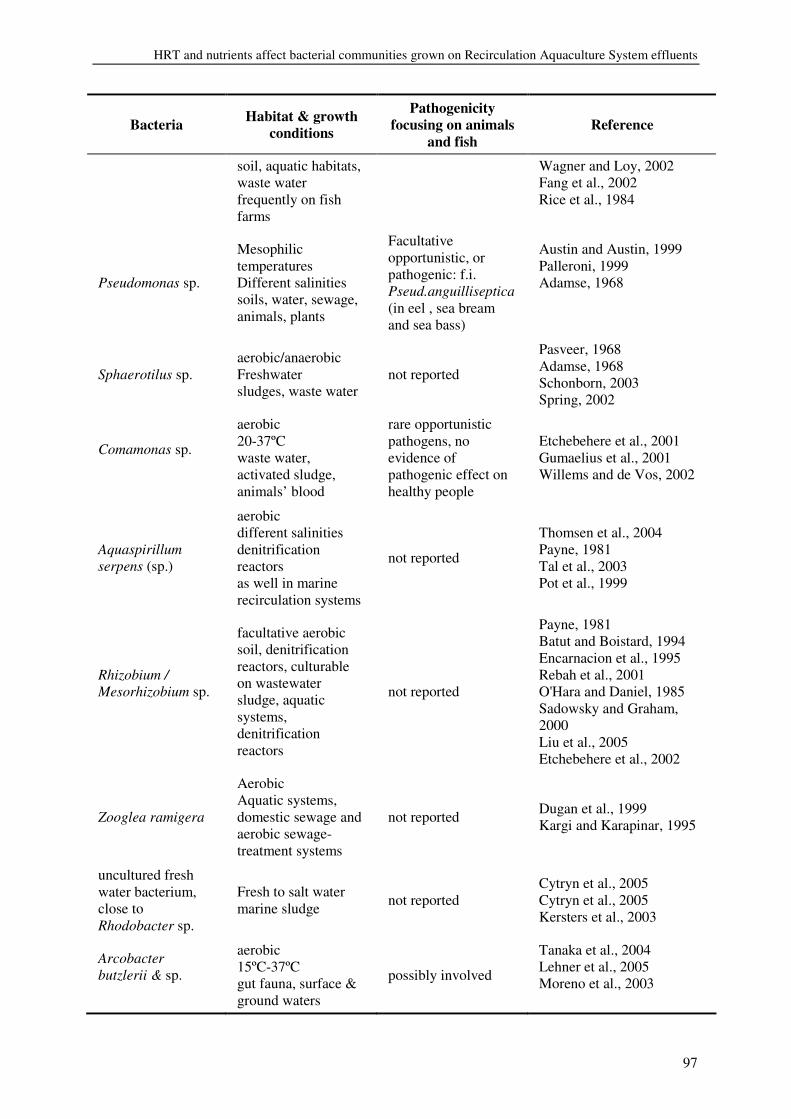
HRT and nutrients affect bacterial communities grown on Recirculation Aquaculture System effluents
97
Bacteria Habitat & growth conditions
Pathogenicity focusing on animals
and fish Reference
soil, aquatic habitats, waste water frequently on fish farms
Wagner and Loy, 2002 Fang et al., 2002 Rice et al., 1984
Pseudomonas sp.
Mesophilic temperatures Different salinities soils, water, sewage, animals, plants
Facultative opportunistic, or pathogenic: f.i. Pseud.anguilliseptica (in eel , sea bream and sea bass)
Austin and Austin, 1999 Palleroni, 1999 Adamse, 1968
Sphaerotilus sp. aerobic/anaerobic Freshwater sludges, waste water
not reported
Pasveer, 1968 Adamse, 1968 Schonborn, 2003 Spring, 2002
Comamonas sp.
aerobic 20-37ºC waste water, activated sludge, animals’ blood
rare opportunistic pathogens, no evidence of pathogenic effect on healthy people
Etchebehere et al., 2001 Gumaelius et al., 2001 Willems and de Vos, 2002
Aquaspirillum serpens (sp.)
aerobic different salinities denitrification reactors as well in marine recirculation systems
not reported
Thomsen et al., 2004 Payne, 1981 Tal et al., 2003 Pot et al., 1999
Rhizobium / Mesorhizobium sp.
facultative aerobic soil, denitrification reactors, culturable on wastewater sludge, aquatic systems, denitrification reactors
not reported
Payne, 1981 Batut and Boistard, 1994 Encarnacion et al., 1995 Rebah et al., 2001 O'Hara and Daniel, 1985 Sadowsky and Graham, 2000 Liu et al., 2005 Etchebehere et al., 2002
Zooglea ramigera
Aerobic Aquatic systems, domestic sewage and aerobic sewage-treatment systems
not reported Dugan et al., 1999 Kargi and Karapinar, 1995
uncultured fresh water bacterium, close to Rhodobacter sp.
Fresh to salt water marine sludge not reported
Cytryn et al., 2005 Cytryn et al., 2005 Kersters et al., 2003
Arcobacter butzlerii & sp.
aerobic 15ºC-37ºC gut fauna, surface & ground waters
possibly involved
Tanaka et al., 2004 Lehner et al., 2005 Moreno et al., 2003
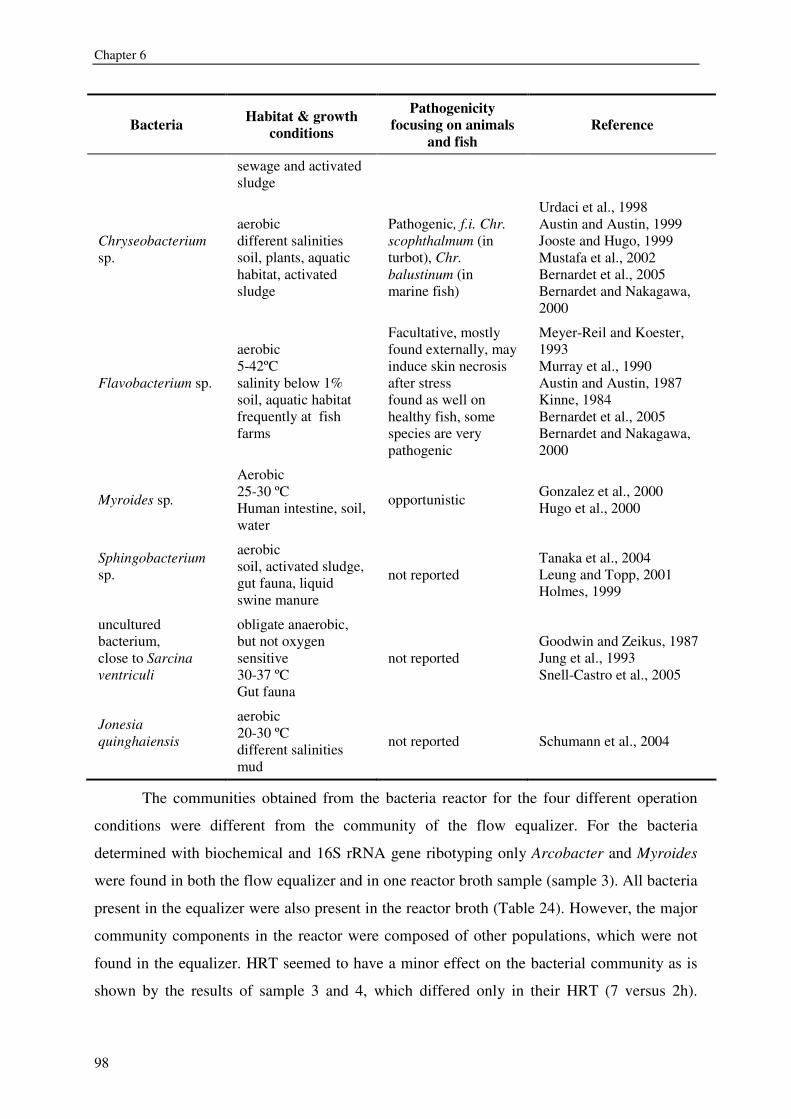
Chapter 6
98
Bacteria Habitat & growth conditions
Pathogenicity focusing on animals
and fish Reference
sewage and activated sludge
Chryseobacterium sp.
aerobic different salinities soil, plants, aquatic habitat, activated sludge
Pathogenic, f.i. Chr. scophthalmum (in turbot), Chr. balustinum (in marine fish)
Urdaci et al., 1998 Austin and Austin, 1999 Jooste and Hugo, 1999 Mustafa et al., 2002 Bernardet et al., 2005 Bernardet and Nakagawa, 2000
Flavobacterium sp.
aerobic 5-42ºC salinity below 1% soil, aquatic habitat frequently at fish farms
Facultative, mostly found externally, may induce skin necrosis after stress found as well on healthy fish, some species are very pathogenic
Meyer-Reil and Koester, 1993 Murray et al., 1990 Austin and Austin, 1987 Kinne, 1984 Bernardet et al., 2005 Bernardet and Nakagawa, 2000
Myroides sp.
Aerobic 25-30 ºC Human intestine, soil, water
opportunistic Gonzalez et al., 2000 Hugo et al., 2000
Sphingobacterium sp.
aerobic soil, activated sludge, gut fauna, liquid swine manure
not reported Tanaka et al., 2004 Leung and Topp, 2001 Holmes, 1999
uncultured bacterium, close to Sarcina ventriculi
obligate anaerobic, but not oxygen sensitive 30-37 ºC Gut fauna
not reported Goodwin and Zeikus, 1987 Jung et al., 1993 Snell-Castro et al., 2005
Jonesia quinghaiensis
aerobic 20-30 ºC different salinities mud
not reported Schumann et al., 2004
The communities obtained from the bacteria reactor for the four different operation
conditions were different from the community of the flow equalizer. For the bacteria
determined with biochemical and 16S rRNA gene ribotyping only Arcobacter and Myroides
were found in both the flow equalizer and in one reactor broth sample (sample 3). All bacteria
present in the equalizer were also present in the reactor broth (Table 24). However, the major
community components in the reactor were composed of other populations, which were not
found in the equalizer. HRT seemed to have a minor effect on the bacterial community as is
shown by the results of sample 3 and 4, which differed only in their HRT (7 versus 2h).
HRT and nutrients affect bacterial communities grown on Recirculation Aquaculture System effluents
99
However, in sample 3, alpha-proteobacterial populations close to Rhizobium/ Mesorhizobium/
Sinorhizobium and Zooglea were the major community components. In sample 4 (2h HRT)
the gamma proteobacterium Bioluz/ Acinetobacter-relative was the major component. This
suggests that Rhizobium/ Mesorhizobium/ Sinorhizobium and Zooglea were out-competed at
this low HRT. This corroborates data from Singleton et al. (1982), who reported growth rates
for Rhizobium as 0.7-0.2 h-1 and 0.4–0.2 h-1 for water conductivities of 1200 and 6000µS/cm,
respectively. The experimental conditions were in between this range (2000-3000µS/cm). In
contrast, Acinetobacter grown on sodium acetate has higher growth rates of 0.2 to 0.8 h-1 at
25ºC compared to the high conductivity conditions (Oerther et al., 2002). Unfortunately water
conductivity was not reported. To grow at a HRT of 2h a growth rate of at least 0.5h-1 is
required, which is out of range for Rhizobium at high conductivities. Shorter HRT (e.g. 2h
compared to 7h) might therefore bear the risk to culture mainly potentially pathogenic
bacteria. A similar community as for sodium acetate (sample 3) was obtained for the reactor
using molasses as substrate (sample 5). The major difference was a community shift from
strains close to Rhizobium/ Mesorhizobium to those close to Aquaspirillum serpens, which
was not detected as major component in sample 3. Such changes can occur, because both
bacteria are utilizing similar substrates and can grow under similar conditions (Table 25).
Furthermore was the molasses not sterile and bacteria other than those existing in the system
environment might have been introduced. Whether the bacteria, close to Aquaspirillum, were
superior to Rhizobium/Mesorhizobium in cultures with molasses as C donor as indicated by
our results, has nevertheless not been reported elsewhere. When TAN was applied in addition
to sodium acetate, the bacteria community changed significantly (sample 3 and 6). Nearly all
bacteria, which were detected in sample 3 were also present in sample 6, but another three
were also found in sample 6. These bacteria were close to Sphaerotilus, Sphingobacterium
and Jonesia (Figure 24). For these three bacteria no pathogenicity has been reported (Table
25). Sphingobacterium grows well on swine manure, where TAN is a major N source (Leung
and Topp, 2001). Furthermore, Sphaerotilus and Jonesia-related populations have been found
in wastewater and mud (Table 25). All three might be then superior to Rhizobium/
Mesorhizobium in the utilization of TAN, resulting in higher growth rates.
Given the pathogenic risk associated with short HRTs, it is advisable to choose for
HRTs of 6 to 7h. The choice of organic C donor seems of less importance, as the obtained
communities in the presence of sodium acetate or molasses, respectively, did not change in
their pathogenicity. Moreover, the addition of TAN did not increase the risk of potentially
pathogenic populations, as revealed by the comparison of samples 3 and 6. Two
Chapter 6
100
considerations have to be made: The “native” N source comprised in the RAS effluent stream
is nitrate. To utilize this N species, the system design did not change and the reactor can easily
be installed after the drum filter. If TAN should be used, the system would have to be
modified to eliminate nitrification. The only advantage to use TAN might then be caused by a
potentially higher nutritional value of the obtained bacteria biomass. This advantage would
have to be confirmed by additional experiments. Generally, the pathogenic risk and nutritional
value of all obtained bacterial material has to be further investigated in feeding trials, if the
bacteria biomass should be used as aquatic feed. To compare the occurrence of bacteria found
in the system water, the flow equalizer and in the bacteria reactor with bacteria found in RAS
in general is difficult, because literature data is scarce. Because no biofilter material was
investigated in this study, bacteria belonging to the nitrifying community were not identified.
Those bacteria have been found in other studies, focusing on the system as a whole by
investigating its components (Tal et al., 2003, Cytryn et al., 2005). Investigations of
heterotrophic bacteria communities yielded some similar results, for e.g. Pseudomonas,
Aeromonas, Aquaspirillum and others (Leonard et al., 2000; Tal et al. 2003). Anyway, it is
unlikely to find complete identical bacteria communities in RAS, because of differences in
their environmental conditions (marine versus freshwater), configurations (e.g. presence of
UV, foam fractionators), and in the cultured animals.
Conclusion The bacteria community found in the system water and in the flow equalizer contained
some possible opportunistic pathogens, but did not result in severe disease symptoms or
production losses during the fish culture operation. The community of the flow equalizer was
semi-quantitatively different from the communities found in the bacteria reactors. However,
all major community components were present in both equalizer slurry and reactor broths.
Hydraulic retention times (7h versus 2h) influenced bacteria community resulting in a more
abundant fraction of the potentially pathogenic alpha proteobacterium Bioluz/ Acinetobacter
at 2h HRT compared to 7h HRT. At 7h bacteria close to Rhizobium/ Mezorhizobium were
forming the major components of the community. The use of molasses instead of sodium
acetate changed the bacteria community from Rhizobium/ Mesorhizobium to Aquaspirillum as
major component. Providing TAN in addition to nitrate as nitrogenous substrate led to the
occurrence of bacteria close to Sphaerotilus, Sphingobacterium and Jonesia. It was concluded
from those results that a reactor operation regime of 6-7h HRT is recommended, and that the
type of substrate (sodium acetate or molasses, TAN or nitrate) is less important. Considering
HRT and nutrients affect bacterial communities grown on Recirculation Aquaculture System effluents
101
conventional RAS configurations, nitrate might be preferred over TAN. However for all the
obtained bacteria communities, additional tests are required to investigate their pathogenic
risk and nutritional values as aquatic feed in more detail.

102
103
Chapter 7
Bacteria or commercial diet: The preferences of Litopenaeus
vannamei
Abstract In this study, the produced bacteria biomass was fed to shrimps (Litopenaeus
vannamei). In total three different diets were used in a variance of a T-maze test: a
commercial shrimp feed, the bacteria biomass, which was produced in the suspended growth
reactors on C supplemented fish waste under conditions, comparable to those reported in
chapter 3, and slurry, which was anaerobically produced in a denitrification reactor. If the
bacteria products would be attractive as diet, the nutrient retention of the RAS would be
improved, resulting in a system, combining fish, bacteria and shrimp. The diet preference was
interpreted as an expression of diet attractiveness. As a first result, shrimp were moving from
an equal distribution before feeding (+/-50%, -2min), towards the feeding places (>50%, 2, 5,
and 10 minutes after feeding). It was, therefore, reasoned, that all bacteria biomass and
commercial feed combinations were basically attractive for the shrimp. This response was
continuing and not limited to an instantaneous reaction. After feeding (2min) more than 80%
of the shrimp were present at the feeding places and showed a significant preference for the
commercial feed compared to the aerobically produced bacteria slurry. For the other diet
combinations no significant differences could be detected for 2min. For 5 and 10min after
feeding, shrimp behavior changed from the commercial feed to the aerobically and
anaerobically produced bacteria biomass segments. It was concluded from this study that the
bacteria slurries had attracted the shrimps, that the commercial diet was preferred above the
aerobic slurry. There was no unambiguous conclusion to be made regarding the preference for
aerobic or anaerobic produced slurry.
Schneider, O., T. L. Cong, V. Sereti, J. W. Schrama, E. H. Eding and J. A. J. Verreth (2006). "Bacteria or commercial diet: The preferences of Litopenaeus vannamei." Aquaculture Research 37: 204-207.Short Communication
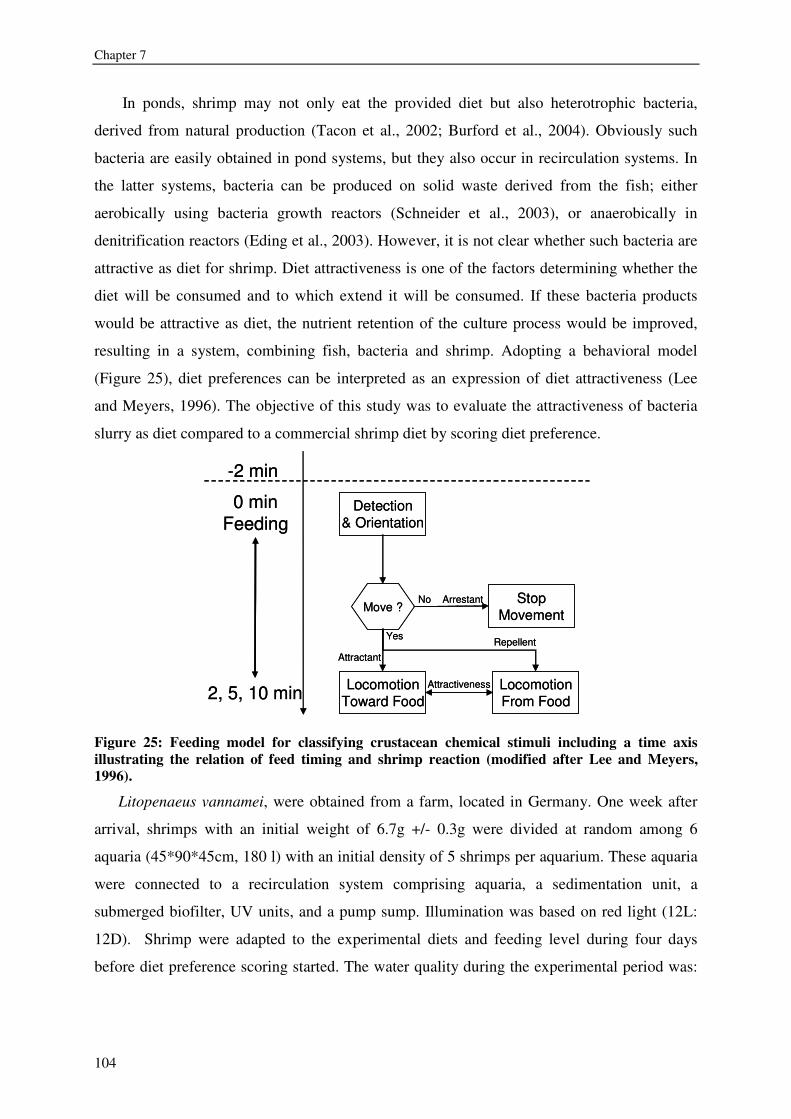
Chapter 7
104
In ponds, shrimp may not only eat the provided diet but also heterotrophic bacteria,
derived from natural production (Tacon et al., 2002; Burford et al., 2004). Obviously such
bacteria are easily obtained in pond systems, but they also occur in recirculation systems. In
the latter systems, bacteria can be produced on solid waste derived from the fish; either
aerobically using bacteria growth reactors (Schneider et al., 2003), or anaerobically in
denitrification reactors (Eding et al., 2003). However, it is not clear whether such bacteria are
attractive as diet for shrimp. Diet attractiveness is one of the factors determining whether the
diet will be consumed and to which extend it will be consumed. If these bacteria products
would be attractive as diet, the nutrient retention of the culture process would be improved,
resulting in a system, combining fish, bacteria and shrimp. Adopting a behavioral model
(Figure 25), diet preferences can be interpreted as an expression of diet attractiveness (Lee
and Meyers, 1996). The objective of this study was to evaluate the attractiveness of bacteria
slurry as diet compared to a commercial shrimp diet by scoring diet preference.
Detection& Orientation
LocomotionToward Food
-2 min
0 minFeeding
2, 5, 10 min
Attractant
Move ?
LocomotionFrom Food
StopMovement
No Arrestant
YesRepellent
Attractiveness
Detection& Orientation
LocomotionToward Food
-2 min
0 minFeeding
2, 5, 10 min
Attractant
Move ?
LocomotionFrom Food
StopMovement
No Arrestant
YesRepellent
Attractiveness
Figure 25: Feeding model for classifying crustacean chemical stimuli including a time axis illustrating the relation of feed timing and shrimp reaction (modified after Lee and Meyers, 1996).
Litopenaeus vannamei, were obtained from a farm, located in Germany. One week after
arrival, shrimps with an initial weight of 6.7g +/- 0.3g were divided at random among 6
aquaria (45*90*45cm, 180 l) with an initial density of 5 shrimps per aquarium. These aquaria
were connected to a recirculation system comprising aquaria, a sedimentation unit, a
submerged biofilter, UV units, and a pump sump. Illumination was based on red light (12L:
12D). Shrimp were adapted to the experimental diets and feeding level during four days
before diet preference scoring started. The water quality during the experimental period was:
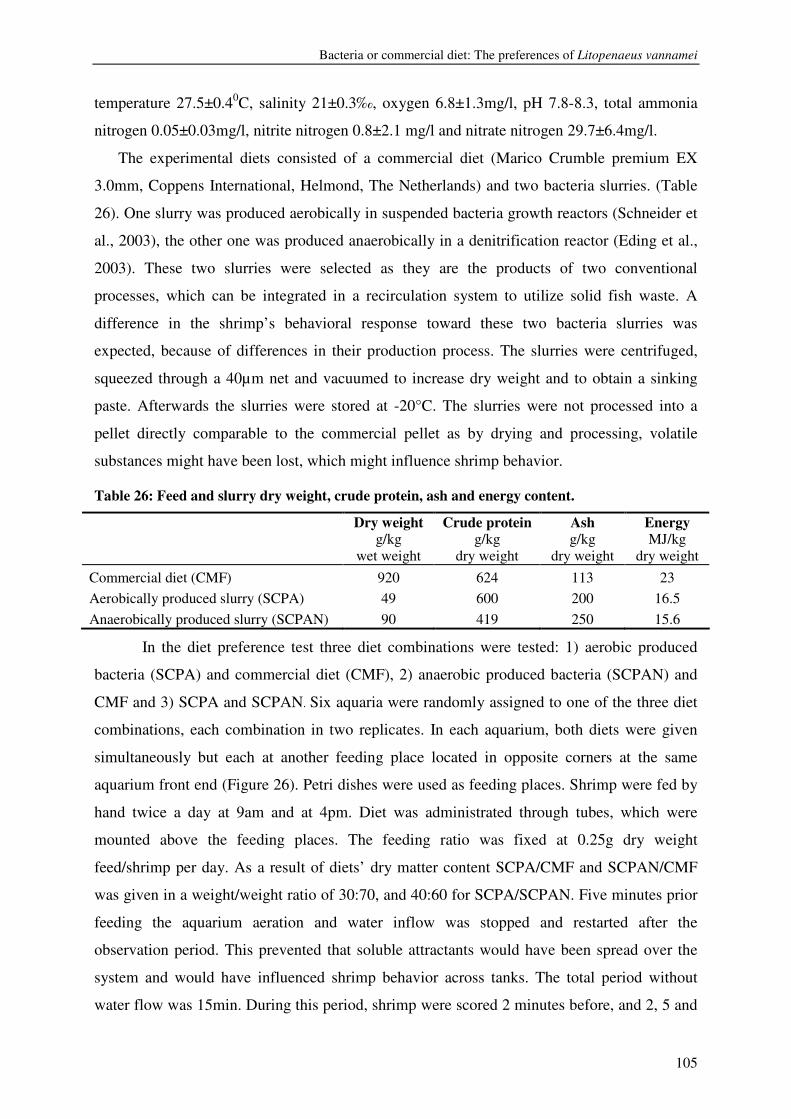
Bacteria or commercial diet: The preferences of Litopenaeus vannamei
105
temperature 27.5±0.40C, salinity 21±0.3‰, oxygen 6.8±1.3mg/l, pH 7.8-8.3, total ammonia
nitrogen 0.05±0.03mg/l, nitrite nitrogen 0.8±2.1 mg/l and nitrate nitrogen 29.7±6.4mg/l.
The experimental diets consisted of a commercial diet (Marico Crumble premium EX
3.0mm, Coppens International, Helmond, The Netherlands) and two bacteria slurries. (Table
26). One slurry was produced aerobically in suspended bacteria growth reactors (Schneider et
al., 2003), the other one was produced anaerobically in a denitrification reactor (Eding et al.,
2003). These two slurries were selected as they are the products of two conventional
processes, which can be integrated in a recirculation system to utilize solid fish waste. A
difference in the shrimp’s behavioral response toward these two bacteria slurries was
expected, because of differences in their production process. The slurries were centrifuged,
squeezed through a 40µm net and vacuumed to increase dry weight and to obtain a sinking
paste. Afterwards the slurries were stored at -20°C. The slurries were not processed into a
pellet directly comparable to the commercial pellet as by drying and processing, volatile
substances might have been lost, which might influence shrimp behavior.
Table 26: Feed and slurry dry weight, crude protein, ash and energy content.
Dry weight Crude protein Ash Energy g/kg
wet weight g/kg
dry weight g/kg
dry weight MJ/kg
dry weight Commercial diet (CMF) 920 624 113 23 Aerobically produced slurry (SCPA) 49 600 200 16.5 Anaerobically produced slurry (SCPAN) 90 419 250 15.6
In the diet preference test three diet combinations were tested: 1) aerobic produced
bacteria (SCPA) and commercial diet (CMF), 2) anaerobic produced bacteria (SCPAN) and
CMF and 3) SCPA and SCPAN. Six aquaria were randomly assigned to one of the three diet
combinations, each combination in two replicates. In each aquarium, both diets were given
simultaneously but each at another feeding place located in opposite corners at the same
aquarium front end (Figure 26). Petri dishes were used as feeding places. Shrimp were fed by
hand twice a day at 9am and at 4pm. Diet was administrated through tubes, which were
mounted above the feeding places. The feeding ratio was fixed at 0.25g dry weight
feed/shrimp per day. As a result of diets’ dry matter content SCPA/CMF and SCPAN/CMF
was given in a weight/weight ratio of 30:70, and 40:60 for SCPA/SCPAN. Five minutes prior
feeding the aquarium aeration and water inflow was stopped and restarted after the
observation period. This prevented that soluble attractants would have been spread over the
system and would have influenced shrimp behavior across tanks. The total period without
water flow was 15min. During this period, shrimp were scored 2 minutes before, and 2, 5 and
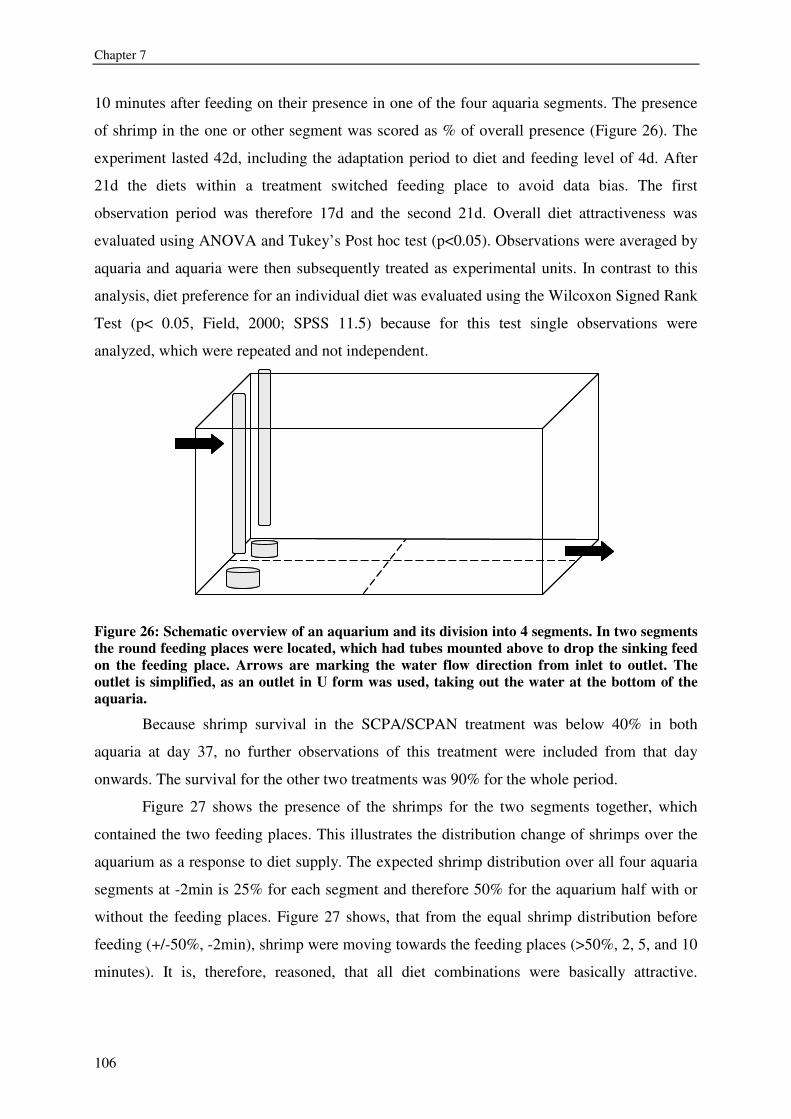
Chapter 7
106
10 minutes after feeding on their presence in one of the four aquaria segments. The presence
of shrimp in the one or other segment was scored as % of overall presence (Figure 26). The
experiment lasted 42d, including the adaptation period to diet and feeding level of 4d. After
21d the diets within a treatment switched feeding place to avoid data bias. The first
observation period was therefore 17d and the second 21d. Overall diet attractiveness was
evaluated using ANOVA and Tukey’s Post hoc test (p<0.05). Observations were averaged by
aquaria and aquaria were then subsequently treated as experimental units. In contrast to this
analysis, diet preference for an individual diet was evaluated using the Wilcoxon Signed Rank
Test (p< 0.05, Field, 2000; SPSS 11.5) because for this test single observations were
analyzed, which were repeated and not independent.
Figure 26: Schematic overview of an aquarium and its division into 4 segments. In two segments the round feeding places were located, which had tubes mounted above to drop the sinking feed on the feeding place. Arrows are marking the water flow direction from inlet to outlet. The outlet is simplified, as an outlet in U form was used, taking out the water at the bottom of the aquaria.
Because shrimp survival in the SCPA/SCPAN treatment was below 40% in both
aquaria at day 37, no further observations of this treatment were included from that day
onwards. The survival for the other two treatments was 90% for the whole period.
Figure 27 shows the presence of the shrimps for the two segments together, which
contained the two feeding places. This illustrates the distribution change of shrimps over the
aquarium as a response to diet supply. The expected shrimp distribution over all four aquaria
segments at -2min is 25% for each segment and therefore 50% for the aquarium half with or
without the feeding places. Figure 27 shows, that from the equal shrimp distribution before
feeding (+/-50%, -2min), shrimp were moving towards the feeding places (>50%, 2, 5, and 10
minutes). It is, therefore, reasoned, that all diet combinations were basically attractive.
Bacteria or commercial diet: The preferences of Litopenaeus vannamei
107
Moreover shrimp presence at 2, 5, and 10min at the feeding places remained above 50%. This
suggested that the response was continuing and not limited to an instantaneous reaction.
0
25
50
75
100
-2 2 5 10
Minutes after Feeding [min]
Pre
senc
e [%
]
SCPA/CMF
SCPAN/CMF
SCPA/SCPAN
a
b b c c
Figure 27: Presence of shrimps expressed as percentage of all shrimps present in the aquaria in the two segments containing the feeding places 2 minutes before, 2, 5 and 10 minutes after feeding, including standard deviation. a, b and c are indicating significant differences (ANOVA & Tukey’s Post hoc test, p<0.05).
To evaluate shrimp preference in detail, the behavioral model of Lee and Meyers
(1996) was adopted (Figure 25). The behavioral model was limited to observations of
locomotion towards and from feeding places. In Figure 28, Figure 29 and Figure 30 the
specific diet preference for the one or other diet is specified. At -2min preference for the
segments, where the slurry was fed, was significantly higher than for the commercial diet
segments and higher for SCPAN compared to SCPA for unknown reasons. After feeding
(2min) more than 80% of the shrimp were present at the feeding places and showed a
significant preference for CMF over SCPA (Figure 28). Following the behavior model of Lee
and Meyers, (1996), the shrimps passed after detection and orientation, through a locomotion
phase for the preferred diets. For the other diet combinations no significant differences could
be detected for 2min. For 5 and 10min after feeding, shrimp behavior changed again. They
changed from CMF to SCPA and SCPAN segments, resulting in a higher presence. This
might be due to the fact that after 2min the CMF feed pellets were claimed by few shrimps
and SCPA and SCPAN were still available.
Minutes after feeding [min]
Pres
ence
[%]
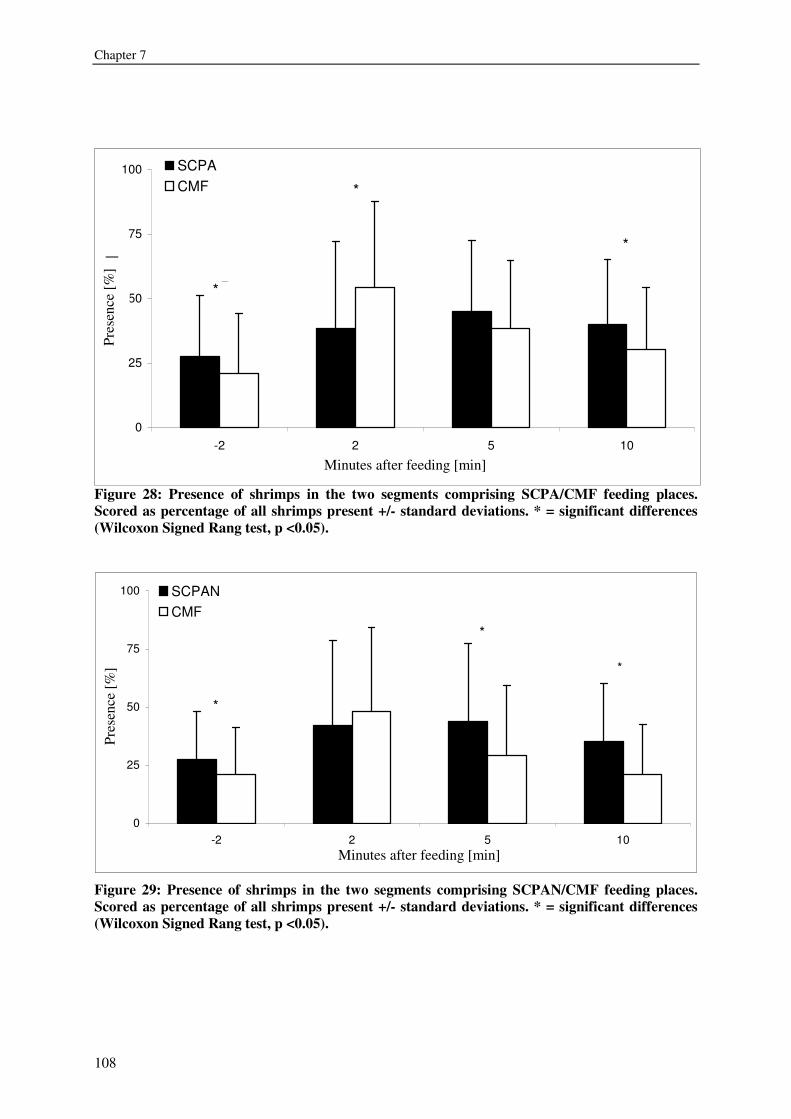
Chapter 7
108
0
25
50
75
100
-2 2 5 10
Minutes after Feeding [min]
Pre
senc
e [%
]
SCPACMF
******
*
*
*
Figure 28: Presence of shrimps in the two segments comprising SCPA/CMF feeding places. Scored as percentage of all shrimps present +/- standard deviations. * = significant differences (Wilcoxon Signed Rang test, p <0.05).
0
25
50
75
100
-2 2 5 10Minutes after Feeding [min]
Pre
senc
e [%
]
SCPANCMF
*
*
*
Figure 29: Presence of shrimps in the two segments comprising SCPAN/CMF feeding places. Scored as percentage of all shrimps present +/- standard deviations. * = significant differences (Wilcoxon Signed Rang test, p <0.05).
Minutes after feeding [min]
Pres
ence
[%]
Minutes after feeding [min]
Pres
ence
[%]
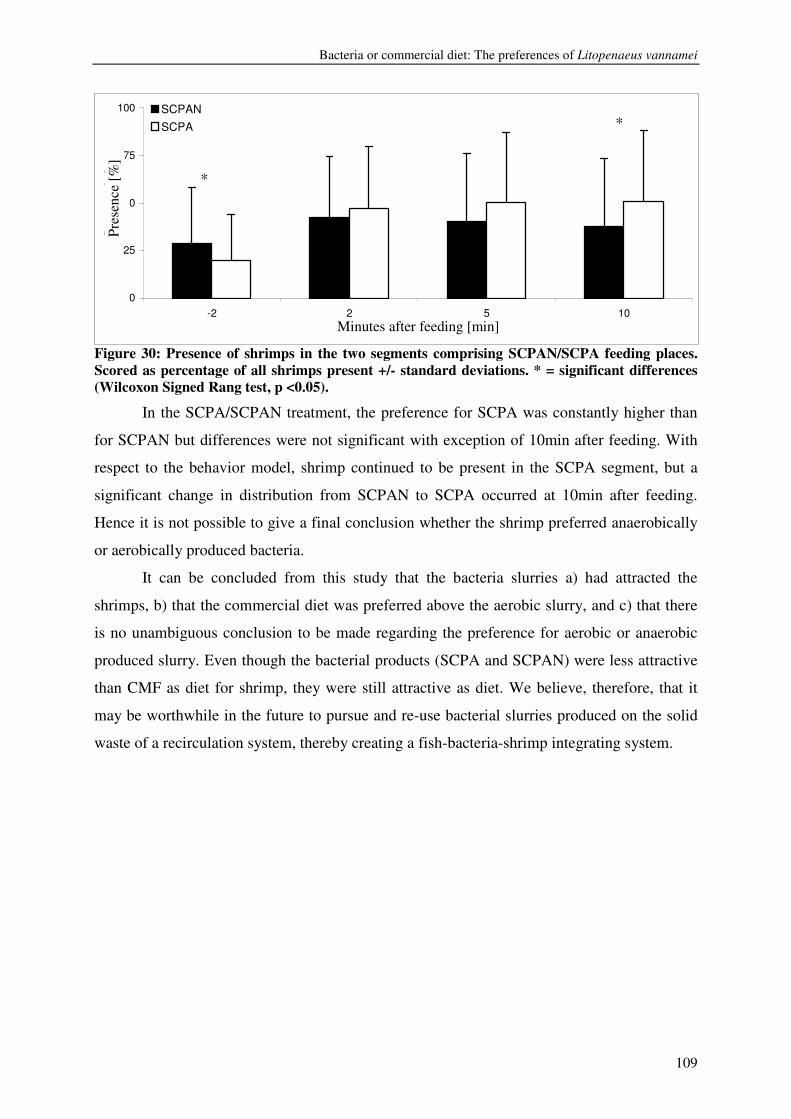
Bacteria or commercial diet: The preferences of Litopenaeus vannamei
109
0
25
50
75
100
-2 2 5 10Minutes after Feeding [min]
Pre
senc
e [%
]SCPANSCPA
*
*
Figure 30: Presence of shrimps in the two segments comprising SCPAN/SCPA feeding places. Scored as percentage of all shrimps present +/- standard deviations. * = significant differences (Wilcoxon Signed Rang test, p <0.05).
In the SCPA/SCPAN treatment, the preference for SCPA was constantly higher than
for SCPAN but differences were not significant with exception of 10min after feeding. With
respect to the behavior model, shrimp continued to be present in the SCPA segment, but a
significant change in distribution from SCPAN to SCPA occurred at 10min after feeding.
Hence it is not possible to give a final conclusion whether the shrimp preferred anaerobically
or aerobically produced bacteria.
It can be concluded from this study that the bacteria slurries a) had attracted the
shrimps, b) that the commercial diet was preferred above the aerobic slurry, and c) that there
is no unambiguous conclusion to be made regarding the preference for aerobic or anaerobic
produced slurry. Even though the bacterial products (SCPA and SCPAN) were less attractive
than CMF as diet for shrimp, they were still attractive as diet. We believe, therefore, that it
may be worthwhile in the future to pursue and re-use bacterial slurries produced on the solid
waste of a recirculation system, thereby creating a fish-bacteria-shrimp integrating system.
Minutes after feeding [min]
Pres
ence
[%]
*
*

110
111
Chapter 8
Kinetics, design and biomass production of a bacteria reactor
treating RAS effluent streams
Abstract The kinetics and design of a suspended bacteria growth reactor, which can be
integrated in a 100MT African catfish farm, were determined. Such a reactor converted
nitrogen (N) and phosphorus (P) from RAS effluents into heterotrophic bacteria biomass. The
determined kinetics were: Yield=0.537 gVSS/gC; endogenous decay coefficient=0.033h-1;
maximum specific growth rate=0.217h-1; half-velocity constant=0.025g/l; and maximum rate
of substrate utilization=0.404gC/gVSS*h. A reactor integrated in a 100MT farming facility
would have a volume of 11m3, based on a minimum HRT of 6h. The kinetics and reactor
design were integrated in a model to predict the VSS production (volatile suspended solids as
measure of bacteria biomass) and nutrient conversions. The VSS production was on average
187±2gVSS/kg feed and the inorganic nutrients (N and P) were removed with an efficiency of
85±3.0% and 95±2.5% respectively. A carbon (C) supplementation level of 455gC/kg feed
was required to ensure optimal C:N ratios for heterotrophic bacteria production. The
production of heterotrophic bacteria biomass is, therefore, a prospective tool to lower nutrient
discharge and to increase nutrient retention and sustainability of RAS in the future.
Schneider, O., V. Sereti, E. H. Eding, J. A. J. Verreth and A. Klapwijk (submitted). "Kinetics, design and biomass production of a bacteria reactor treating RAS effluent streams." Aquacultural Engineering.
Chapter 8
112
Introduction In recirculation aquaculture systems (RAS) inorganic nitrogen (N) and phosphorus (P)
are immobilized in bacterial biomass or volatized and/or discharged in a less hazardous form.
The majority of the organic and inorganic waste is discharged though the effluent. This waste
stream can be treated in lagoons, septic tanks, wetlands, and/or be used as fertilizer (Chen et
al., 1987; Losordo et al., 2003). This waste management represents nutrient sinks outside the
RAS. However, waste or nutrient management is also possible inside RAS. In contrast to the
outside sinks, in RAS nutrients are converted into heterotrophic bacteria biomass, provided
that the fish waste is supplemented with organic carbon (Schneider et al., submitted). This
biomass can be re-utilized as an extra source of aquatic feed. Such an approach increases
overall RAS nutrient retention. This philosophy has already been applied in activated pond
culture. In these ponds, the produced bacteria biomass is consumed by fish or shrimp. As a
result improved feed conversion ratios and water quality were observed (Avnimelech et al.,
1989; Brune et al., 2003; Burford et al., 2004; Hari et al., 2004).
The objective of the present study was to design a bacteria reactor integrated in a
100MT African catfish farm. In this reactor, N and P nutrients from the RAS effluent should
be converted by heterotrophic bacteria into biomass. This procedure required knowledge of
bacteria growth kinetics on fish waste. Up to now only experimental data were available,
which focused on the influence of carbon (C) supplementation levels and hydraulic retention
times (HRT) on bacteria production, but not on the related kinetics (Schneider et al.,
submitted). It was, therefore, necessary to evaluate those experimental data and to calculate
the kinetics (yield, endogenous decay coefficient, maximum specific growth rate, half-
velocity constant and maximum rate of substrate utilization) to enable and design the reactor.
Material and Methods To design an integrated heterotrophic bacteria reactor treating effluents of a 100MT
African catfish RAS, the feed load, RAS effluent characteristics, and the bacteria kinetics
have to be determined. The resulting values and parameters were applied to design the
bacteria reactor. This procedure followed design philosophies which have been commonly
used in wastewater treatment (Tchobanoglous et al., 2003).
Feed load and effluent characteristics A commercial 100MT RAS for African catfish production is composed of fish tanks, a
drum filter for solids removal, screen mesh size 60�m, a nitrifying biofilter and a two sumps
(Figure 4, page 15). For an annual 100MT African catfish production under commercial
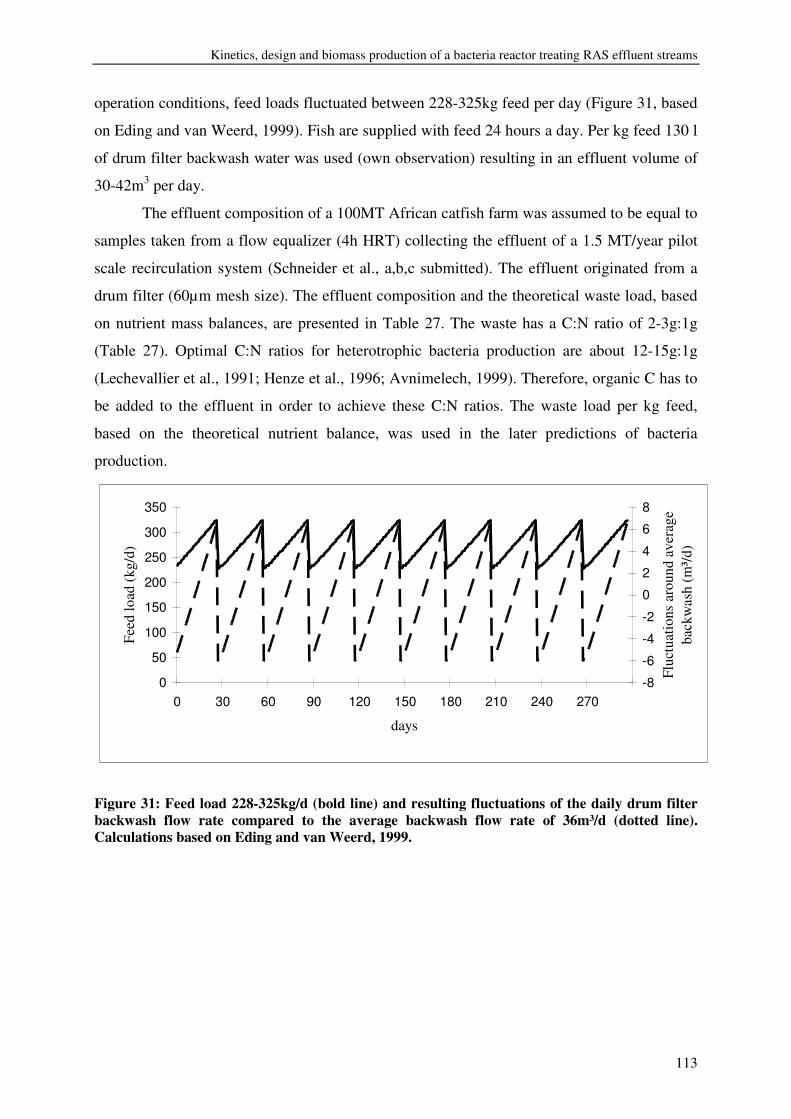
Kinetics, design and biomass production of a bacteria reactor treating RAS effluent streams
113
operation conditions, feed loads fluctuated between 228-325kg feed per day (Figure 31, based
on Eding and van Weerd, 1999). Fish are supplied with feed 24 hours a day. Per kg feed 130 l
of drum filter backwash water was used (own observation) resulting in an effluent volume of
30-42m3 per day.
The effluent composition of a 100MT African catfish farm was assumed to be equal to
samples taken from a flow equalizer (4h HRT) collecting the effluent of a 1.5 MT/year pilot
scale recirculation system (Schneider et al., a,b,c submitted). The effluent originated from a
drum filter (60µm mesh size). The effluent composition and the theoretical waste load, based
on nutrient mass balances, are presented in Table 27. The waste has a C:N ratio of 2-3g:1g
(Table 27). Optimal C:N ratios for heterotrophic bacteria production are about 12-15g:1g
(Lechevallier et al., 1991; Henze et al., 1996; Avnimelech, 1999). Therefore, organic C has to
be added to the effluent in order to achieve these C:N ratios. The waste load per kg feed,
based on the theoretical nutrient balance, was used in the later predictions of bacteria
production.
0
50
100
150
200
250
300
350
0 30 60 90 120 150 180 210 240 270
days
Feed
load
(kg/
d)
-8
-6
-4
-2
0
2
4
6
8
Fluc
tuat
ions
aro
und
aver
age
back
was
h (m
³/d)
Figure 31: Feed load 228-325kg/d (bold line) and resulting fluctuations of the daily drum filter backwash flow rate compared to the average backwash flow rate of 36m³/d (dotted line). Calculations based on Eding and van Weerd, 1999.
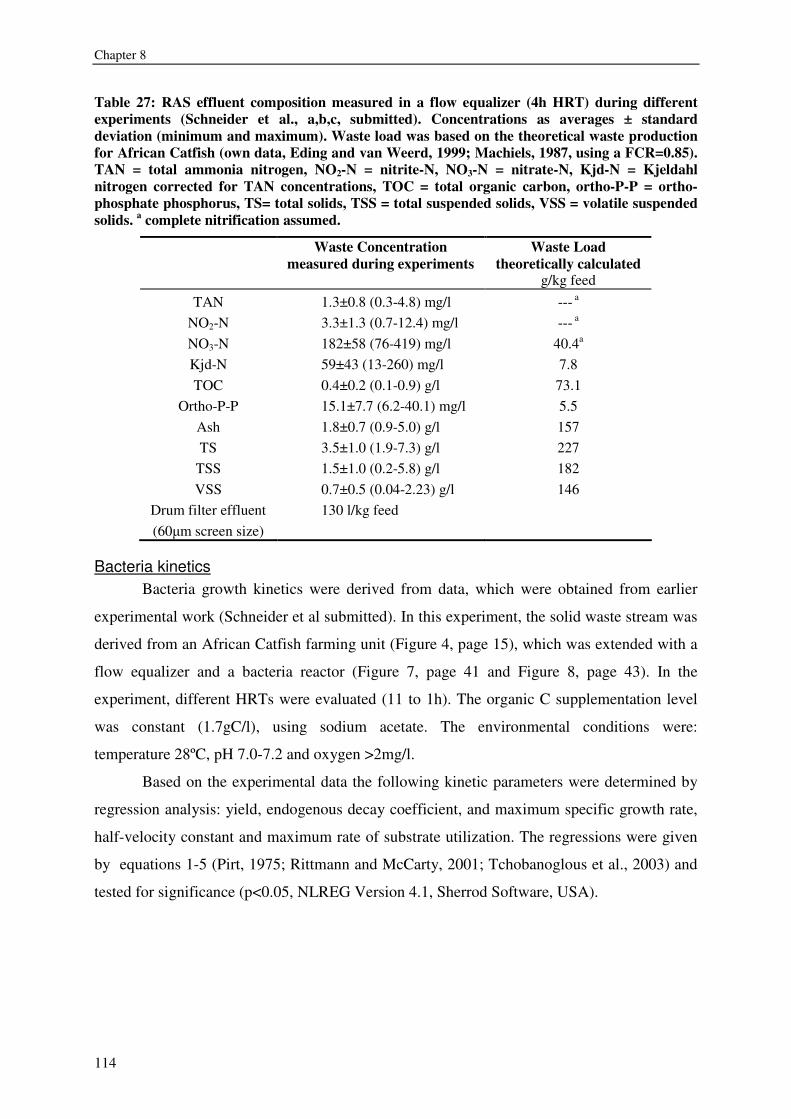
Chapter 8
114
Table 27: RAS effluent composition measured in a flow equalizer (4h HRT) during different experiments (Schneider et al., a,b,c, submitted). Concentrations as averages ± standard deviation (minimum and maximum). Waste load was based on the theoretical waste production for African Catfish (own data, Eding and van Weerd, 1999; Machiels, 1987, using a FCR=0.85). TAN = total ammonia nitrogen, NO2-N = nitrite-N, NO3-N = nitrate-N, Kjd-N = Kjeldahl nitrogen corrected for TAN concentrations, TOC = total organic carbon, ortho-P-P = ortho-phosphate phosphorus, TS= total solids, TSS = total suspended solids, VSS = volatile suspended solids. a complete nitrification assumed.
Waste Concentration measured during experiments
Waste Load theoretically calculated
g/kg feed
TAN NO2-N NO3-N Kjd-N
1.3±0.8 (0.3-4.8) mg/l 3.3±1.3 (0.7-12.4) mg/l 182±58 (76-419) mg/l 59±43 (13-260) mg/l
--- a --- a
40.4a 7.8
TOC 0.4±0.2 (0.1-0.9) g/l 73.1 Ortho-P-P 15.1±7.7 (6.2-40.1) mg/l 5.5
Ash 1.8±0.7 (0.9-5.0) g/l 157 TS 3.5±1.0 (1.9-7.3) g/l 227
TSS 1.5±1.0 (0.2-5.8) g/l 182 VSS 0.7±0.5 (0.04-2.23) g/l 146
Drum filter effluent (60�m screen size)
130 l/kg feed
Bacteria kinetics Bacteria growth kinetics were derived from data, which were obtained from earlier
experimental work (Schneider et al submitted). In this experiment, the solid waste stream was
derived from an African Catfish farming unit (Figure 4, page 15), which was extended with a
flow equalizer and a bacteria reactor (Figure 7, page 41 and Figure 8, page 43). In the
experiment, different HRTs were evaluated (11 to 1h). The organic C supplementation level
was constant (1.7gC/l), using sodium acetate. The environmental conditions were:
temperature 28ºC, pH 7.0-7.2 and oxygen >2mg/l.
Based on the experimental data the following kinetic parameters were determined by
regression analysis: yield, endogenous decay coefficient, and maximum specific growth rate,
half-velocity constant and maximum rate of substrate utilization. The regressions were given
by equations 1-5 (Pirt, 1975; Rittmann and McCarty, 2001; Tchobanoglous et al., 2003) and
tested for significance (p<0.05, NLREG Version 4.1, Sherrod Software, USA).
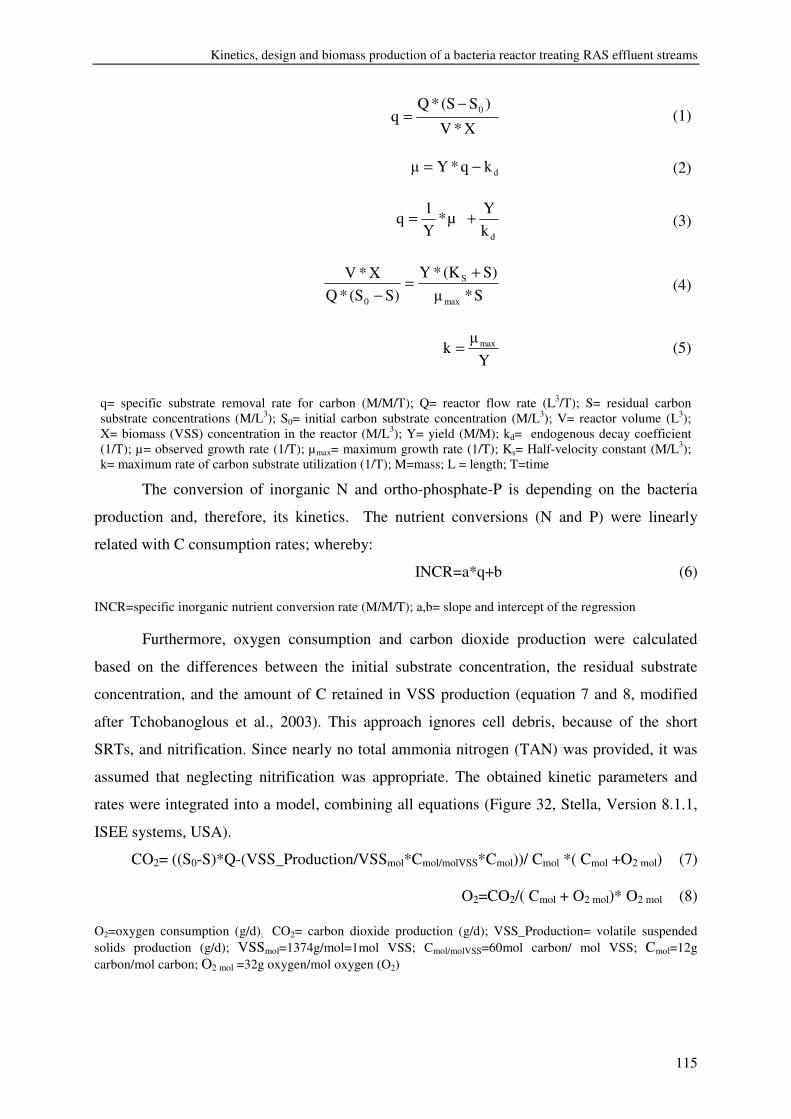
Kinetics, design and biomass production of a bacteria reactor treating RAS effluent streams
115
X*V
)S(S*Qq 0−
= (1)
dkq*Y� −= (2)
dkY
µ*Y1
q += (3)
S*�
S)(K*YS)(S*Q
X*V
max
S
0
+=
− (4)
Y�
k max= (5)
q= specific substrate removal rate for carbon (M/M/T); Q= reactor flow rate (L3/T); S= residual carbon substrate concentrations (M/L3); S0= initial carbon substrate concentration (M/L3); V= reactor volume (L3); X= biomass (VSS) concentration in the reactor (M/L3); Y= yield (M/M); kd= endogenous decay coefficient (1/T); µ= observed growth rate (1/T); µmax= maximum growth rate (1/T); Ks= Half-velocity constant (M/L3); k= maximum rate of carbon substrate utilization (1/T); M=mass; L = length; T=time
The conversion of inorganic N and ortho-phosphate-P is depending on the bacteria
production and, therefore, its kinetics. The nutrient conversions (N and P) were linearly
related with C consumption rates; whereby:
INCR=a*q+b (6)
INCR=specific inorganic nutrient conversion rate (M/M/T); a,b= slope and intercept of the regression
Furthermore, oxygen consumption and carbon dioxide production were calculated
based on the differences between the initial substrate concentration, the residual substrate
concentration, and the amount of C retained in VSS production (equation 7 and 8, modified
after Tchobanoglous et al., 2003). This approach ignores cell debris, because of the short
SRTs, and nitrification. Since nearly no total ammonia nitrogen (TAN) was provided, it was
assumed that neglecting nitrification was appropriate. The obtained kinetic parameters and
rates were integrated into a model, combining all equations (Figure 32, Stella, Version 8.1.1,
ISEE systems, USA).
CO2= ((S0-S)*Q-(VSS_Production/VSSmol*Cmol/molVSS*Cmol))/ Cmol *( Cmol +O2 mol) (7)
O2=CO2/( Cmol + O2 mol)* O2 mol (8)
O2=oxygen consumption (g/d); CO2= carbon dioxide production (g/d); VSS_Production= volatile suspended solids production (g/d); VSSmol=1374g/mol=1mol VSS; Cmol/molVSS=60mol carbon/ mol VSS; Cmol=12g carbon/mol carbon; O2 mol =32g oxygen/mol oxygen (O2)
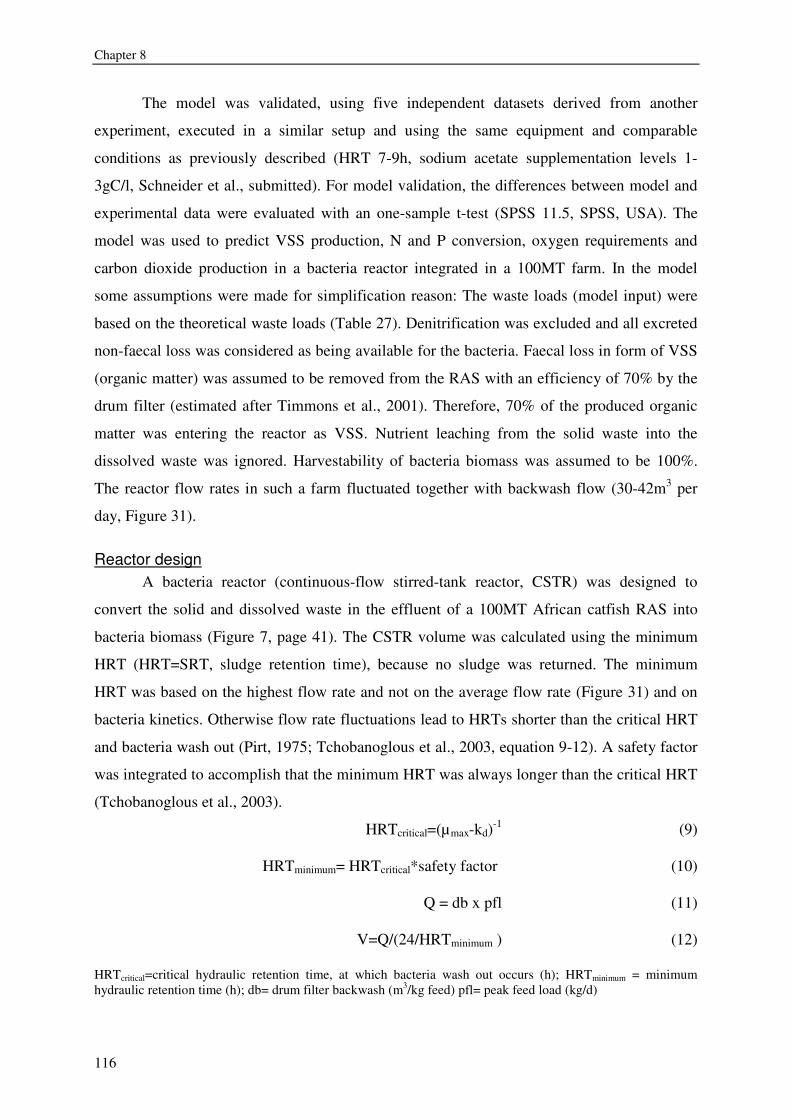
Chapter 8
116
The model was validated, using five independent datasets derived from another
experiment, executed in a similar setup and using the same equipment and comparable
conditions as previously described (HRT 7-9h, sodium acetate supplementation levels 1-
3gC/l, Schneider et al., submitted). For model validation, the differences between model and
experimental data were evaluated with an one-sample t-test (SPSS 11.5, SPSS, USA). The
model was used to predict VSS production, N and P conversion, oxygen requirements and
carbon dioxide production in a bacteria reactor integrated in a 100MT farm. In the model
some assumptions were made for simplification reason: The waste loads (model input) were
based on the theoretical waste loads (Table 27). Denitrification was excluded and all excreted
non-faecal loss was considered as being available for the bacteria. Faecal loss in form of VSS
(organic matter) was assumed to be removed from the RAS with an efficiency of 70% by the
drum filter (estimated after Timmons et al., 2001). Therefore, 70% of the produced organic
matter was entering the reactor as VSS. Nutrient leaching from the solid waste into the
dissolved waste was ignored. Harvestability of bacteria biomass was assumed to be 100%.
The reactor flow rates in such a farm fluctuated together with backwash flow (30-42m3 per
day, Figure 31).
Reactor design A bacteria reactor (continuous-flow stirred-tank reactor, CSTR) was designed to
convert the solid and dissolved waste in the effluent of a 100MT African catfish RAS into
bacteria biomass (Figure 7, page 41). The CSTR volume was calculated using the minimum
HRT (HRT=SRT, sludge retention time), because no sludge was returned. The minimum
HRT was based on the highest flow rate and not on the average flow rate (Figure 31) and on
bacteria kinetics. Otherwise flow rate fluctuations lead to HRTs shorter than the critical HRT
and bacteria wash out (Pirt, 1975; Tchobanoglous et al., 2003, equation 9-12). A safety factor
was integrated to accomplish that the minimum HRT was always longer than the critical HRT
(Tchobanoglous et al., 2003).
HRTcritical=(µmax-kd)-1 (9)
HRTminimum= HRTcritical*safety factor (10)
Q = db x pfl (11)
V=Q/(24/HRTminimum ) (12)
HRTcritical=critical hydraulic retention time, at which bacteria wash out occurs (h); HRTminimum = minimum hydraulic retention time (h); db= drum filter backwash (m3/kg feed) pfl= peak feed load (kg/d)
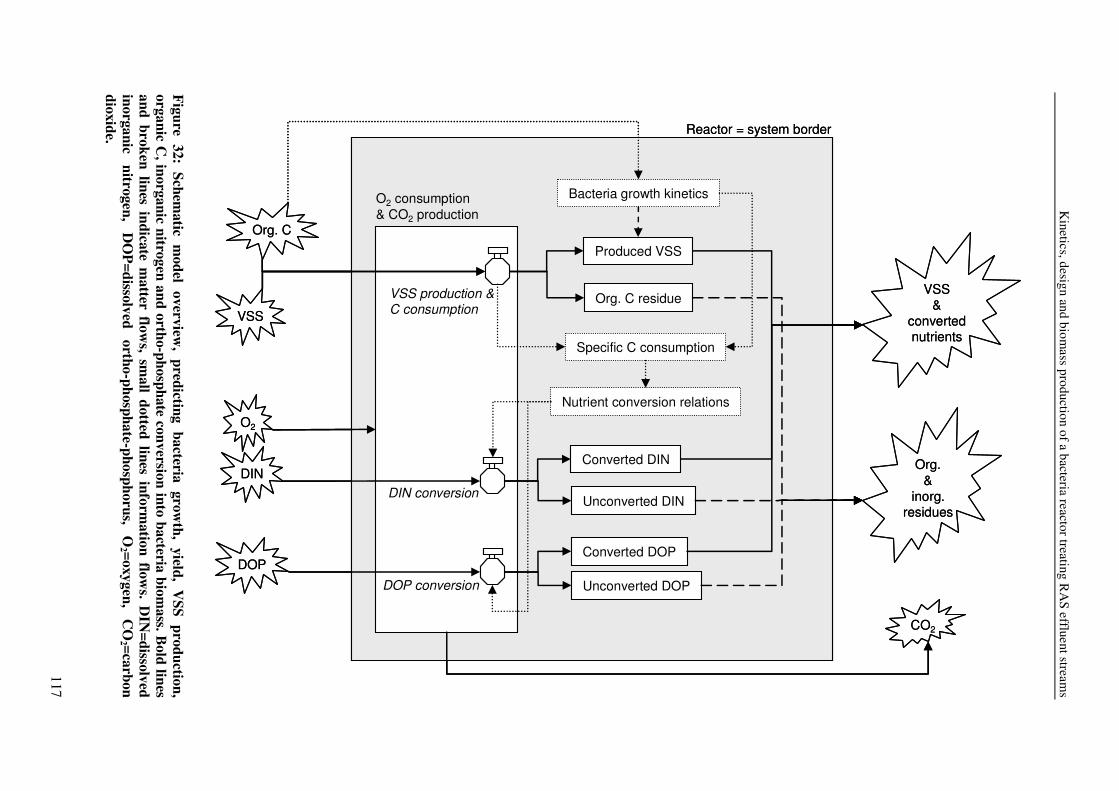
Kinetics, design and biom
ass production of a bacteria reactor treating RA
S effluent streams
117
Figure 32: Schem
atic model overview
, predicting bacteria growth, yield, V
SS production, organic C
, inorganic nitrogen and ortho-phosphate conversion into bacteria biomass. B
old lines and broken lines indicate m
atter flows, sm
all dotted lines information flow
s. DIN
=dissolved inorganic
nitrogen, D
OP=dissolved
ortho-phosphate-phosphorus, O
2 =oxygen, C
O2 =carbon
dioxide.
z
VSS production &C consumption
Reactor = system border
VSS
DIN
DOP
Produced VSS
Bacteria growth kinetics
Nutrient conversion relations
Org. C
Specific C consumption
Org. C residue
Converted DIN
Converted DOP
O2
DIN conversion
DOP conversion
Unconverted DIN
Unconverted DOP
VSS&
convertednutrients
Org.&
inorg.residues
CO2
O2 consumption& CO2 production
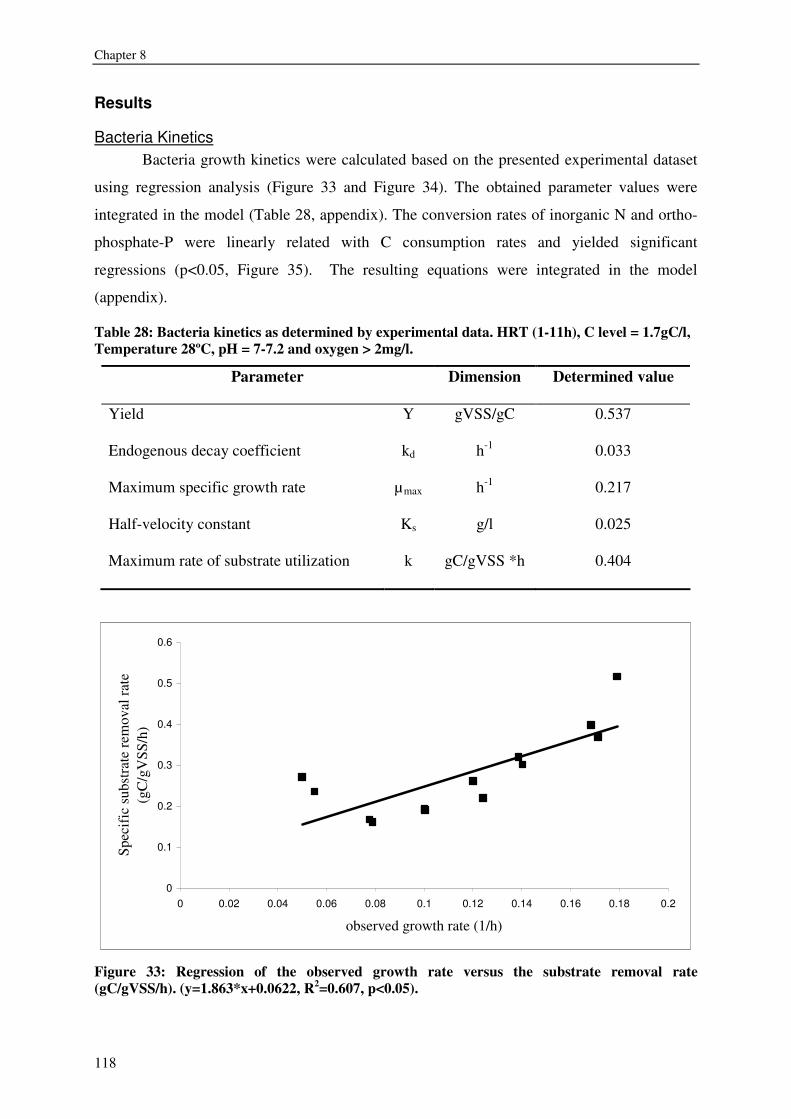
Chapter 8
118
Results
Bacteria Kinetics Bacteria growth kinetics were calculated based on the presented experimental dataset
using regression analysis (Figure 33 and Figure 34). The obtained parameter values were
integrated in the model (Table 28, appendix). The conversion rates of inorganic N and ortho-
phosphate-P were linearly related with C consumption rates and yielded significant
regressions (p<0.05, Figure 35). The resulting equations were integrated in the model
(appendix).
Table 28: Bacteria kinetics as determined by experimental data. HRT (1-11h), C level = 1.7gC/l, Temperature 28ºC, pH = 7-7.2 and oxygen > 2mg/l.
Parameter Dimension Determined value
Yield Y gVSS/gC 0.537
Endogenous decay coefficient kd h-1 0.033
Maximum specific growth rate µmax h-1 0.217
Half-velocity constant Ks g/l 0.025
Maximum rate of substrate utilization k gC/gVSS *h 0.404
0
0.1
0.2
0.3
0.4
0.5
0.6
0 0.02 0.04 0.06 0.08 0.1 0.12 0.14 0.16 0.18 0.2
observed growth rate (1/h)
Spec
ific
sub
stra
te re
mov
al ra
te
(gC
/gV
SS/h
)
Figure 33: Regression of the observed growth rate versus the substrate removal rate (gC/gVSS/h). (y=1.863*x+0.0622, R2=0.607, p<0.05).
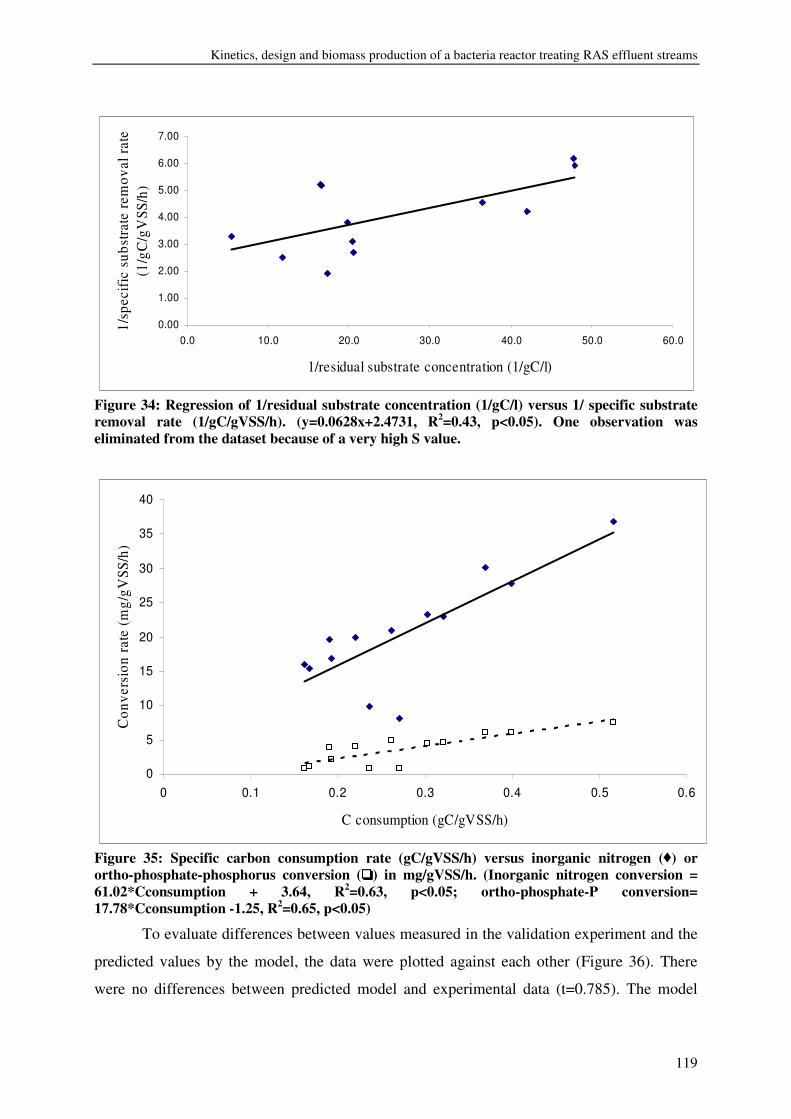
Kinetics, design and biomass production of a bacteria reactor treating RAS effluent streams
119
0.00
1.00
2.00
3.00
4.00
5.00
6.00
7.00
0.0 10.0 20.0 30.0 40.0 50.0 60.0
1/residual substrate concentration (1/gC/l)
1/sp
ecifi
c su
bstra
te re
mov
al ra
te
(1/g
C/g
VSS
/h)
Figure 34: Regression of 1/residual substrate concentration (1/gC/l) versus 1/ specific substrate removal rate (1/gC/gVSS/h). (y=0.0628x+2.4731, R2=0.43, p<0.05). One observation was eliminated from the dataset because of a very high S value.
0
5
10
15
20
25
30
35
40
0 0.1 0.2 0.3 0.4 0.5 0.6
C consumption (gC/gVSS/h)
Con
vers
ion
rate
(m
g/gV
SS/h
)
Figure 35: Specific carbon consumption rate (gC/gVSS/h) versus inorganic nitrogen ( ) or ortho-phosphate-phosphorus conversion (oooo) in mg/gVSS/h. (Inorganic nitrogen conversion = 61.02*Cconsumption + 3.64, R2=0.63, p<0.05; ortho-phosphate-P conversion= 17.78*Cconsumption -1.25, R2=0.65, p<0.05)
To evaluate differences between values measured in the validation experiment and the
predicted values by the model, the data were plotted against each other (Figure 36). There
were no differences between predicted model and experimental data (t=0.785). The model
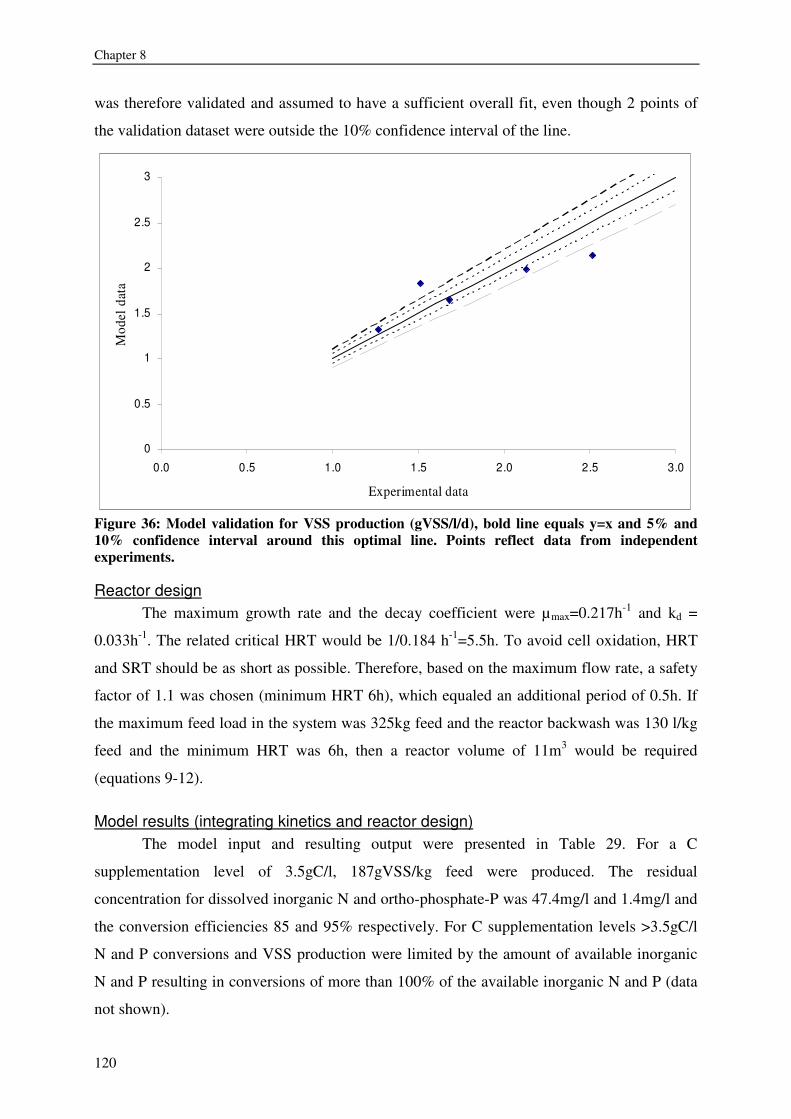
Chapter 8
120
was therefore validated and assumed to have a sufficient overall fit, even though 2 points of
the validation dataset were outside the 10% confidence interval of the line.
0
0.5
1
1.5
2
2.5
3
0.0 0.5 1.0 1.5 2.0 2.5 3.0
Experimental data
Mod
el d
ata
Figure 36: Model validation for VSS production (gVSS/l/d), bold line equals y=x and 5% and 10% confidence interval around this optimal line. Points reflect data from independent experiments.
Reactor design The maximum growth rate and the decay coefficient were µmax=0.217h-1 and kd =
0.033h-1. The related critical HRT would be 1/0.184 h-1=5.5h. To avoid cell oxidation, HRT
and SRT should be as short as possible. Therefore, based on the maximum flow rate, a safety
factor of 1.1 was chosen (minimum HRT 6h), which equaled an additional period of 0.5h. If
the maximum feed load in the system was 325kg feed and the reactor backwash was 130 l/kg
feed and the minimum HRT was 6h, then a reactor volume of 11m3 would be required
(equations 9-12).
Model results (integrating kinetics and reactor design) The model input and resulting output were presented in Table 29. For a C
supplementation level of 3.5gC/l, 187gVSS/kg feed were produced. The residual
concentration for dissolved inorganic N and ortho-phosphate-P was 47.4mg/l and 1.4mg/l and
the conversion efficiencies 85 and 95% respectively. For C supplementation levels >3.5gC/l
N and P conversions and VSS production were limited by the amount of available inorganic
N and P resulting in conversions of more than 100% of the available inorganic N and P (data
not shown).
Kinetics, design and biomass production of a bacteria reactor treating RAS effluent streams
121
Discussion
Reactor type and its position in the system The selection of the CSTR depended on different aspects, such as bacteria kinetics,
waste load, SRT and HRT (Tchobanoglous et al., 2003). The position of the bacteria reactor
in the RAS had to ensure that the solid waste and the non-retained inorganic N and ortho-
phosphate-P were accessible for conversion. Furthermore, no interferences with other RAS
processes should occur and a continuous bacteria harvest was required, without stopping the
system operation. Furthermore, no sludge should be returned into the reactor from its effluent,
a contrast to activated sludge systems. This avoided unnecessary cell oxidation by long SRTs
(Pirt, 1975; Henze et al., 1996; Tchobanoglous et al., 2003). Because of these considerations a
CSTR with suspended growth and no sludge return was selected and integrated at the drum
filter effluent (Figure 7, page 41 and Figure 8, page 43).
This reactor allowed for stable and reliable production of bacteria during several
experiments without interfering with the normal system processes. The solid and dissolved
waste discharged from the RAS were available without system disturbance (Schneider et al.,
a,b,c, submitted). This was an advantage compared to earlier systems (Knoesche and Tscheu.,
1974, Meske, 1976), which applied heterotrophic bacteria production inside RAS’ water flow.
Those configurations were problematic, since these systems affected the overall RAS
performance. The present design and operational conditions allowed harvesting the produced
biomass with the effluent flow by collection. Nutrient concentrations in the drum filter
effluent are relatively high (185mgN/l and 15mgP/l). For high nutrient concentrations, high
bacteria biomass concentrations can be expected in a CSTR and therefore it is not necessary
to use a CSTR with sludge recycle. Furthermore, the reactor operated at short SRTs, which
equaled HRT (4-11h). This modus operandi was in contrast to activated sludge systems,
which have a sludge return and do not aim for bacteria biomass production (Tchobanoglous et
al., 2003). The reactor was inoculated with bacteria coming from the system’s own micro
fauna through the drum filter effluent. This practice is comparable with activated sludge
systems or the conversion of nutrients by heterotrophic bacteria in aquaculture ponds, which
were using open and mixed cultures and were not inoculated with specific bacteria strains
(Avnimelech et al., 1989; Brune et al., 2003; Burford et al., 2004; Hari et al., 2004).
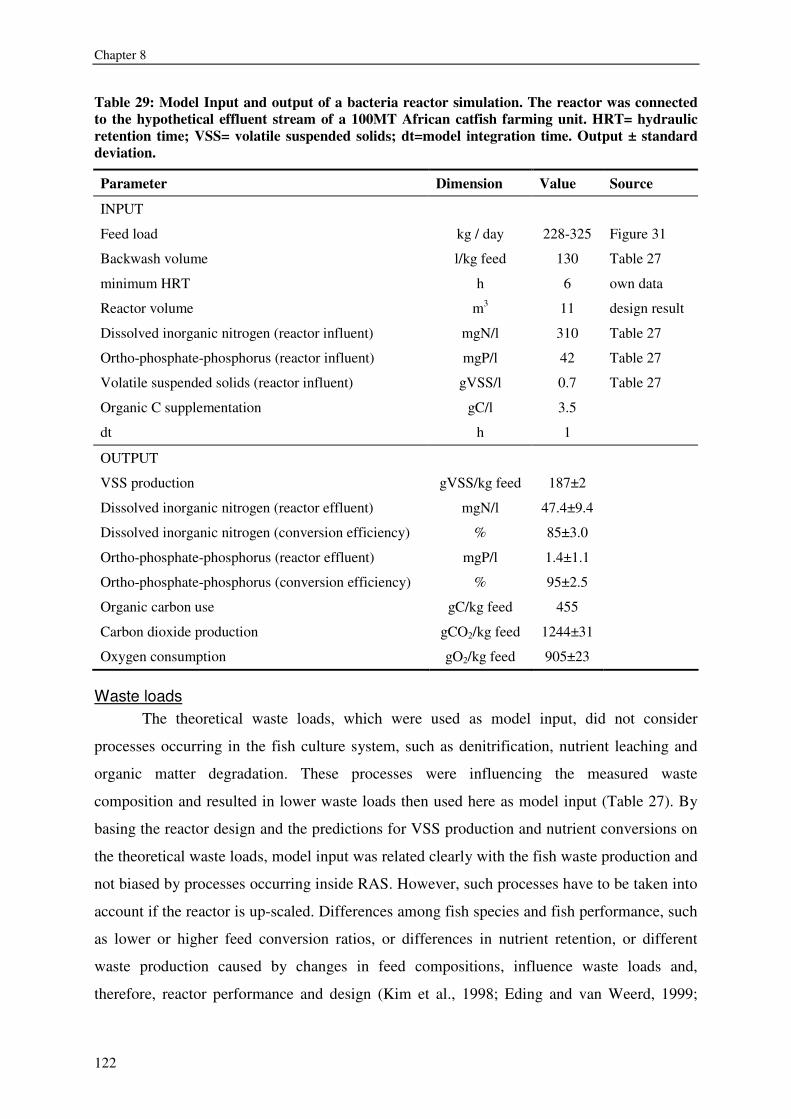
Chapter 8
122
Table 29: Model Input and output of a bacteria reactor simulation. The reactor was connected to the hypothetical effluent stream of a 100MT African catfish farming unit. HRT= hydraulic retention time; VSS= volatile suspended solids; dt=model integration time. Output ± standard deviation.
Parameter Dimension Value Source
INPUT
Feed load kg / day 228-325 Figure 31
Backwash volume l/kg feed 130 Table 27
minimum HRT h 6 own data
Reactor volume m3 11 design result
Dissolved inorganic nitrogen (reactor influent) mgN/l 310 Table 27
Ortho-phosphate-phosphorus (reactor influent) mgP/l 42 Table 27
Volatile suspended solids (reactor influent) gVSS/l 0.7 Table 27
Organic C supplementation gC/l 3.5
dt h 1
OUTPUT
VSS production gVSS/kg feed 187±2
Dissolved inorganic nitrogen (reactor effluent) mgN/l 47.4±9.4
Dissolved inorganic nitrogen (conversion efficiency) % 85±3.0
Ortho-phosphate-phosphorus (reactor effluent) mgP/l 1.4±1.1
Ortho-phosphate-phosphorus (conversion efficiency) % 95±2.5
Organic carbon use gC/kg feed 455
Carbon dioxide production gCO2/kg feed 1244±31
Oxygen consumption gO2/kg feed 905±23
Waste loads The theoretical waste loads, which were used as model input, did not consider
processes occurring in the fish culture system, such as denitrification, nutrient leaching and
organic matter degradation. These processes were influencing the measured waste
composition and resulted in lower waste loads then used here as model input (Table 27). By
basing the reactor design and the predictions for VSS production and nutrient conversions on
the theoretical waste loads, model input was related clearly with the fish waste production and
not biased by processes occurring inside RAS. However, such processes have to be taken into
account if the reactor is up-scaled. Differences among fish species and fish performance, such
as lower or higher feed conversion ratios, or differences in nutrient retention, or different
waste production caused by changes in feed compositions, influence waste loads and,
therefore, reactor performance and design (Kim et al., 1998; Eding and van Weerd, 1999;
Kinetics, design and biomass production of a bacteria reactor treating RAS effluent streams
123
Lupatsch et al., 2001, Tchobanoglous et al., 2003). If the reactor would be up-scaled, process
fine tuning will be required according to the local conditions and loading rates. It has to be
noted that the model was established and validated based on reactor experiments using a
reactor volume of 3.5 l. The results obtained from the model have, therefore, to be treated
carefully.
Kinetic parameters Kinetic parameters (yield, endogenous decay coefficient, maximum specific growth
rate, half-velocity constant and maximum rate of substrate utilization) were determined. The
calculated yield (0.5gVSS/gC) and bacteria growth rates were in the lower range compared to
those reported in literature (0.3-1.0gVSS/gC, Atkinson and Mavituna, 1991; Tijhuis et al.,
1994; Henze et al., 1996; van der Westhuizen and Pretorius, 1996; Rittmann and McCarty,
2001; Aulenta et al., 2003; Marazioti et al., 2003; Tchobanoglous et al., 2003). Three factors
might have caused the low yields: insufficient adaptation of the bacteria strains to the
substrate, differences in water conductivity, and the non-accounted amount of produced
extracellular material (Schneider et al, submitted). The maximum relative growth rate
(µmax=0.22 h-1) was in the lower range of values referred in environmental biotechnology or
wastewater treatment studies, e.g. 0.2-0.5 per h for aerobic heterotrophic growth (Henze et al.,
1996; Rittmann and McCarty, 2001). This supported the hypothesis that increased metabolic
costs due to high water conductivity caused the lower growth rates and yields. The inorganic
nutrient conversion rates were related linearly with C consumption rates in a ratio of C: N: P
100g:7g:2g. This equals a C: N ratio of 14g:1g, which is in the range of the expected ratio for
optimal bacteria growth (12-15g:1g, Lechevallier et al., 1991; Henze et al., 1996;
Avnimelech, 1999).
The predicted residual C substrate concentration was on average 0.12±0.07gC/l and
even 0.3gC/l for 6h HRT. This was higher than the measured concentration in the experiment
delivering the data for kinetic determination (0.05±0.04gC/l, 4-11h HRT, Schneider et al.,
submitted). However, the estimate of oxygen consumption and carbon dioxide production is
still acceptable, if the initial substrate concentration (3.5gC/l) and the high removal (~3.4gC/l)
were considered. The average oxygen consumption was 905gO2/kg feed and the carbon
dioxide production 1244gCO2/kg feed, respectively (Table 29). The model input parameters
require fine-tuning to predict the oxygen requirements and carbon dioxide production more
accurately.
Chapter 8
124
HRT, SRT and reactor volume The minimum HRT included a safety factor of 1.1 (5.5h*1.1�6h). Higher factors, such
as 1.3-2, are applied in activated sludge systems, which do not aim for biomass production
(Tchobanoglous et al., 2003). A safety factor of 30min was, furthermore, sufficient, because
the realized HRTs (�6h) would never be shorter than the minimum HRT (6h) or the critical
HRT (<5.5h). Feed load fluctuations increased the realized HRT to an average of 7.2h +/-
0.8h. Using such a design prevented, therefore, bacteria wash out.
VSS production and organic C requirements VSS production was 187gVSS/kg feed, applying a acetate-C supplementation level of
455 gC/kg feed This is lower but still comparable to the VSS production obtained in similar
systems using molasses as C donor (228gVSS/kg feed, calculated after Schneider et al.,
submitted).
Reactor effluent characteristics and nutrient conversion efficiencies The reactor effluent might be re-used as system water, considering the low residual
concentrations for inorganic N and P (47.4 and 1.4mg/l respectively, Table 29). The N
conversion efficiency equaled a maximum conversion rate of 1gN/l/d. This was comparable to
average conversion rates given by van Rijn et al. (in press) for aquaculture recirculation
systems of about 0.9g/l/d. However, the carbon consumption per g inorganic N removed was
much higher for the present heterotrophic conversion than for denitrification (13gC/gN versus
2gC/gN, Henze et al., 1999). The P conversion efficiency was slightly higher than expected,
as normally 2.3% P are contained in 1gVSS (Rittmann and McCarty, 2001; Tchobanoglous et
al., 2003). In the present study 2.8% were retained in VSS production. However, it remains
unclear how much of this P is included in extracellular material. The low residual
concentrations and high conversion efficiencies for inorganic N and ortho-phosphate-P
reflected the potential of heterotrophic bacteria conversion to retain inorganic nutrients in
bacteria biomass.
Harvestability An important aspect has not been included in this study: The harvestability and re-
utilization of the bacteria as feed. Only if the bacteria biomass can be harvested efficiently
from the reactor effluent, inorganic and organic waste are not only converted, but truly
removed. If harvestability is efficient (100%), then 85 and 95% of the inorganic N and ortho-
phosphate-P can be removed from the RAS effluent stream and low residual concentrations
would remain. Possible harvest techniques, which still have to be tested, are: mechanical or
Kinetics, design and biomass production of a bacteria reactor treating RAS effluent streams
125
membrane filtration, sedimentation, centrifugation, flocculation, foam fractionation,
evaporation or electrokinetic methods (Atkinson and Mavituna, 1991; Rittmann and McCarty,
2001). By these methods, the bacteria biomass must be made available for culture organisms
as feed. It might as well be possible to feed the obtained bacteria biomass directly to
filterfeeders, such as tilapia or shrimp (Avnimelech et al. 1989; McIntosh, 2001; Turker et al.,
2003; Brune et al., 2003).
Conclusion This study delivered the design of a reactor for the heterotrophic conversion of N and
P nutrients from the effluent into bacteria of a 100MT African catfish RAS. The HRT of the
CSTR would be 6h based on the kinetic parameters resulting in a volume of 11m3. For this
conversion process the related kinetics and design were determined (Yield: 0.537gVSS/gC;
endogenous decay coefficient: 0.033h-1; maximum specific growth rate: 0.217h-1; half-
velocity constant: 0.025g/l; maximum rate of substrate utilization: 0.404 gC/gVSS*h). The
kinetics and design were integrated together with nutrient conversion rates into a model, to
calculate the VSS production (187gVSS/kg feed) and nutrient conversion efficiencies from
the effluent (inorganic N 85%; ortho-phosphate-P 95%). The applied organic C
supplementation level was 3.5gC/l or 455gC/ kg feed.
The production and potential re-use of heterotrophic bacteria biomass is, therefore, a
prospective tool to lower nutrient discharge and to increase nutrient retention and
sustainability of RAS in the future.
Appendix (Model Code) Inputs k = 0.404351
kd = 0.033387
Ks = 0.025393
N_rsu_intercept = 3.6408
N_rsu_slope = 61.017
P_rsu_intercept = -1.2481
P_rsu_slope = 17.776
S0 = 3.5
u_max = 0.217043
X_in = 0.7
Y = 0.5367
design_HRT = 6
Chapter 8
126
design_kg_feed_per_day = 325
Feed_load_fluctuating = GRAPH(timer)
DIN_Drumfilter_Effluent = 310
DOP_Drumfilter_Effluent = 42
feed_switch = 1
design_drum_filter_backwash_per_kg_feed = 130
Auxiliary calculations
SRT = HRT
timer = time
kg_feed = if feed_switch =0 then 325 else Feed_load_fluctuating*24
design_backwash_volume_per_day =
design_drum_filter_backwash_per_kg_feed*design_kg_feed_per_day
design_Reactor_Volume = design_backwash_volume_per_day/(24/design_HRT)
Q = (design_drum_filter_backwash_per_kg_feed*kg_feed)/24
HRT = 24/(design_drum_filter_backwash_per_kg_feed*kg_feed/design_Reactor_Volume)
VSS_production_per_kg_feed = VSS_Production/(kg_feed/24)
DIN_concentration = DIN_reactor/design_Reactor_Volume
DIN_efficiency = (DIN_Reactor_Influent-DIN_Reactor_Effluent)/DIN_Reactor_Influent*100
DOP_Concentration = DOP_reactor/design_Reactor_Volume
DOP_efficiency = (DOP_Reactor_Influent-DOP_Reactor_Effluent)/DOP_Reactor_Influent*100
rg = Y*(k*X*S)/(Ks+S)-kd*X
rsu = u_max*X*S/(Y*(Ks+S))
S = (Ks*(1+kd*SRT))/(SRT*(Y*k-kd)-1)
u = rg/X_plus_Xin
X = Y*(S0-S)/(1+kd*SRT)
X_plus_Xin = VSS_Reactor/design_Reactor_Volume
observed_rsu = rsu/X_plus_Xin
observed_yield = VSS_Production/((S0-S)*Q)
inroganic_N_conversion__per_X_plus_Xin = N_rsu_slope*observed_rsu+N_rsu_intercept
orthoPP_conversion_per_X_plus_X_in = P_rsu_slope*observed_rsu+P_rsu_intercept
CO2_production = (((S0-S)*Q*24
(VSS_production_per_kg_feed*kg_feed/1374*60*12))/12*(12+32))/kg_feed
O2_consumption = CO2_production/(12+32)*32
Kinetics, design and biomass production of a bacteria reactor treating RAS effluent streams
127
Rates and States
DIN_reactor(t) = DIN_reactor(t - dt) + (DIN_Reactor_Influent - DIN_Reactor_Effluent -
DIN_Uptake_by_VSS) * dt
INIT DIN_reactor = design_Reactor_Volume*DIN_Drumfilter_Effluent
INFLOWS:
DIN_Reactor_Influent = DIN_Drumfilter_Effluent*Q
OUTFLOWS:
DIN_Reactor_Effluent = DIN_reactor/design_Reactor_Volume*Q
DIN_Uptake_by_VSS = inroganic_N_conversion__per_X_plus_Xin*VSS_Reactor
DOP_reactor(t) = DOP_reactor(t - dt) + (DOP_Reactor_Influent - DOP_Reactor_Effluent -
DOP_Uptake_VSS) * dt
INIT DOP_reactor = DOP_Drumfilter_Effluent*design_Reactor_Volume
INFLOWS:
DOP_Reactor_Influent = DOP_Drumfilter_Effluent*Q
OUTFLOWS:
DOP_Reactor_Effluent = DOP_reactor/design_Reactor_Volume*Q
DOP_Uptake_VSS = orthoPP_conversion_per_X_plus_X_in*VSS_Reactor
VSS_Reactor(t) = VSS_Reactor(t - dt) + (VSS_Reactor_influent + VSS_Production -
VSS_Reactor_Effluent) * dt
INIT VSS_Reactor = IF X_in*design_Reactor_Volume = 0 then 0.000000000000001 else
X_in*design_Reactor_Volume
INFLOWS:
VSS_Reactor_influent = Q*X_in
VSS_Production = rg*design_Reactor_Volume
OUTFLOWS:
VSS_Reactor_Effluent = VSS_Reactor/design_Reactor_Volume*Q

128
129
Chapter 9
Discussion
In recirculation aquaculture systems (RAS), treatment units are only purifying the
rearing water by solids removal and by nitrification but are not managing the fish waste. Even
in advanced RAS, solids and nitrogenous and phosphorous wastes leave the system as slurry.
Carbon dioxide is stripped to the air and dissolved nitrogen (N) may eventually be converted
into gaseous N (Bovendeur et al., 1987; van Rijn et al., in press). Due to water treatment and
purification, the waste is not an issue inside the production system anymore, but it is on the
outside as effluent. It is, therefore, needed to apply waste management in RAS. Comparable
to terrestrial husbandry systems, waste can be managed outside the system boundaries. For
this purpose, digestion, re-use as fertilizer and other techniques have been applied (Burton and
Turner, 2003). However, waste can be managed also inside RAS. In the latter case, processes
have to be selected to convert the waste into a re-usable product. In the present study, the
scheme, presented in chapter 1 was followed: first an evaluation was made of nutrient flows
and conversion processes in integrated aquaculture systems, second a specific conversion
process was selected and studied, third options for process improvements and factors
influencing the process sensitivity were investigated, fourth product suitability was evaluated,
and fifth the design criteria were developed and the integration possibilities into RAS were
studied.
Evaluation of nutrient flows in integrated aquaculture systems In chapter 2, nutrient flows in integrated aquaculture systems were evaluated. In those
systems different processes can convert aquaculture waste inside the aquatic system into a
valuable product. In literature two possible routes for within-system treatment are reported:
waste conversion by phototrophic and waste conversion by heterotrophic organisms. Directly
harvestable products were found in both pathways: e.g. plants that are of direct use for the
pharmaceutical industry (Luening et al., 2003) or e.g. worms, which can be utilized as baits or
aquatic feed in other systems (Olive, 1999). This direct use of the primary conversion product
ensures the highest increase in nutrient retention. Feeding the conversion product to other
animals reduced the overall nutrient retention. For example, in a phototrophic-herbivorous
chain, the gained nutrient retention decreased by 60-85% feed N and 50-90% feed phosphorus
(P) compared to a setup, in which only fish and phototrophic production would be integrated
Chapter 9
130
and the plants harvested. In a chain shrimp-algae-oyster, the N and P retention in oysters is
only 6gN and 1.3gP, while in the consumed algae 40gN and 9.5gP were retained.
Phototrophic-herbivore chains have been reported repeatedly in literature and more
often than the heterotrophic-bacterivore chain (chapter 2). However, issues related with
phototrophic production justify a more detailed investigation of the heterotrophic conversion
process. Such issues in phototrophic conversion are: excessive surface requirements, need for
balanced supply of micro- and macronutrient, maintaining optimal water temperatures,
providing sufficient light, but at the same moment avoiding photoinhibition, stabilizing pH,
preserving culture purity, and ensuring algae harvestability. These difficulties were reported
by various authors and evaluated in chapter 2. There are also disadvantages of heterotrophic
conversions. The contribution of heterotrophic bacteria to overall system nutrient retention is
low (7% of feed N, recalculated after Knoesche and Tscheu, 1974). The waste conversion by
bacteria is limited by the amount of available organic carbon (C), by availability of oxygen,
and by the nutritional value of the obtained bacteria biomass. Worms were also only
contributing marginally to the overall system nutrient retention (0.06% feed N, chapter 2,
Bischoff, 2003).
Despite the reported disadvantages of heterotrophic bacteria, it is still believed that
they may offer a perspective tool for conversion of fish waste into a reusable product. In that
case the design, integration, and operation of the bacterial reactor have to be handled
differently from the past. To overcome problems from the past, the following points should be
taken into account: (1) reactor size can be small, if HRTs are in the range of hours (Pirt, 1975;
Rittmann and McCarty, 2001); (2) the process must be developed in such a way that it ensures
easy control; (3) activated sludge processes and activated ponds constitute good examples
where such processes occur (Avnimelech et al. 1989; Henze et al., 1996; Brune et al., 2003;
Burford et al., 2003; Tchobanoglous et al., 2003; Hari et al., 2004) and (4) the feasibility of
re-using the biomass as aquatic feed was demonstrated in several studies (Tacon, 1979, Perera
et al., 1995; Schneider et al., 2004). Furthermore, the conversion process is light independent,
which allows designing deeper reactors with smaller surfaces than required for phototrophic
conversion (chapter 2).
Process selection and investigation RAS offer a unique possibility to manage solid and dissolved waste streams together,
when the bacteria reactor is integrated after the drum filter. Therefore, in the present study
RAS design was conserved and, due to the position of the bacterial reactor in the drum filter
Discussion
131
effluent, no interferences with other processes inside the system occurred. This was an
advantage compared to earlier systems, which integrated the heterotrophic bacteria production
inside the RAS. Those systems were not successful and were abandoned by the RAS industry
(Knoesche et al., 1974, Meske, 1976). The example of activated sludge reactors and activated
pond aquaculture (Avnimelech et al. 1989; Rittmann and McCarty, 2001; Brune et al., 2003;
Burford et al., 2003; Tchobanoglous et al., 2003) gave the inspiration to focus on suspended
bacteria growth processes. Therefore, as reactor type, a continuous-flow stirred-tank reactor
(CSTR), allowing for waste conversion by suspended bacteria growth, was chosen.
Investigations of the fish slurry composition revealed that RAS effluents are deficient
in organic C to allow good heterotrophic bacteria production due to N accumulation in the
system water (2-3g:1g C:N). It was, therefore, necessary to enrich the fish waste with C,
thereby providing optimal C: N ratios (12-15g:1g) for heterotrophic bacteria production
(Lechevallier et al., 1991; Henze et al., 1996; Avnimelech, 1999). The effect of C
supplementation levels (sodium acetate or molasses) on bacteria production was investigated
in chapter 3 and chapter 4. Bacteria production rates increased in response to increased C
supplementation levels. In chapter 3, also the effect of a decreasing HRT was evaluated. This
was necessary to calculate kinetic parameters, which were used to design a reactor in chapter
8. The calculated yield (0.4-0.5gVSS/gC; VSS=volatile suspended solids) was lower than
most of the ones reported in literature (0.3-1.2gVSS/gC, Atkinson and Mavituna, 1991;
Tijhuis et al., 1994; Henze et al., 1996; van der Westhuizen and Pretorius, 1996; Rittmann and
McCarty, 2001; Aulenta et al., 2003; Marazioti et al., 2003; Tchobanoglous et al., 2003).
Three factors might have caused these low yields: high water conductivity and, therefore,
increased metabolic costs; non sufficient adaptation of the bacteria to the substrate; and the
non-accounted amount of produced extracellular material. Future investigations of these
factors might result in yield improvements.
Production improvement and sensitivity Production improvements and sensitivity of the conversion process were evaluated for
different HRTs and for different C and N sources. In chapter 3, the sensitivity of bacteria
waste conversion in response to decreasing HRTs was evaluated. Nearly no yield differences
were detected unless the critical HRT was approached, and bacteria wash out occurred.
Therefore, it can be concluded that HRT (11-2h) were not very important for bacteria yields
However, at short HRTs (close to the critical HRT) the highest growth rates (0.2-0.5h-1) were
observed which allowed to produce bacteria in small reactor volumes (Pirt, 1975). Because
Chapter 9
132
yields were rather low compared to values reported in literature, the effect of different N
sources on bacteria yields was investigated. Theoretically, 20% yield improvement should
occur if nitrate is replaced by total ammonia nitrogen (TAN) as N source (Rittmann and
McCarty, 2002 and chapter 3). However, the experiments did not show differences in yields
and VSS production. Only a preference for TAN over nitrate was detected, which is in
agreement with literature (Vriens et al., 1989; Rittmann and McCarty, 2001). This result has
significant consequences. In case replacement of nitrate by TAN would have improved yields,
RAS design and reactor position would have had to be changed, eliminating nitrification.
However, the present results suggest that the common RAS design can be maintained and that
the reactor position after the drum filter is acceptable. A comparison of sodium acetate and
molasses at comparable culture conditions showed no differences in yields and productions
(chapter 5). Only the levels of C supplementation yielded a sensitive response in bacteria
production, and the effect was similar for both C sources. It is, therefore, possible, to replace
sodium acetate by other C sources, such as molasses, as long as C degradability is similar.
During the experiments several factors were fixed which may influence the conversion
process. Those factors were the oxygen concentration in the broth (>2mg/l), the pH (7.0-7.2),
the agitation speed (350rpm) and temperature 28°C. Those factors influence culture
conditions and affect VSS production rates and yields (Pirt, 1975; Rittmann and McCarty,
2001; Tchobanoglous et al., 2003). Their influence on waste conversion in heterotrophic
bacteria remains unclear in this study.
Product evaluation and determination of re-use potential The composition of the bacteria community, which was produced in the reactors, was
influenced by the culture conditions (chapter 6). Although nearly all bacteria in the flow
equalizer were also found in the reactor broth, the community forming these broths differed in
its major components, both qualitatively and quantitatively. The most important bacteria
were not pathogenic (HRT 6-7h). When HRTs were shorter a more abundant fraction of the
potentially pathogenic alpha proteobacterium Bioluz/ Acinetobacter appeared. At 7h, bacteria
close to Rhizobium/ Mezorhizobium were forming the major components of the community.
The use of molasses instead of sodium acetate changed the bacteria community from
Rhizobium/ Mesorhizobium to Aquaspirillum. Providing TAN in addition to nitrate as
nitrogenous substrate led to the occurrence of bacteria close to Sphaerotilus,
Sphingobacterium and Jonesia. Because the major community components were associated
with no pathogenic risks, bacteria biomass was evaluated in a nutritional study (chapter 7).
Discussion
133
The results of the study revealed that even though the slurry was less attractive than the tested
commercial feed for shrimp, it was still attractive enough for consumption.
The produced bacteria biomass was collected, and analyzed for its proximate
composition (chapter 7). The material obtained from the broth had a higher ash (20% versus
13%) and a lower dry matter content (49% versus 93%) than a commercial African catfish
diet (Biomeerval, Skretting, France). The crude protein content was higher (60% versus 52%)
and the energy content (17 versus 20 MJ/kg) was comparable to this feed. The high water and
ash content, however, might reduce the suitability of the bacteria biomass as feed. Parts of the
slurry composition remained unanalyzed, such as nucleic acids, and they may have great
influence on the nutritional value (Tacon, 1979). Furthermore, fatty acids and amino acid
profiles, vitamins and other micronutrients were not analyzed yet and this information is also
needed to make a full appraisal of the nutritional quality of the product.
If the determined bacteria composition and production (chapter 7 and 8) was
considered then ~140g crude protein/kg feed were produced:
ProteinProduction(g/kg feed)=ProteinBiomass(g/kg dm)/(1000g-AshBiomass(g/kg dm))*187gVSS/kg feed
Protein=crude protein; Dm=dry matter
In chapter 8, the conversion efficiency of inorganic N was 85% for 455gC/kg feed. If
all N would have been converted into crude protein, then ~210g crude protein per kg feed
would have been produced (40.4g/kg feed of inorganic N not retained in the fish*0.85*6.25g
crude protein/gN). This means 140-210g crude protein/kg feed would have been made
available as aquatic feed from converted waste. If this biomass would be fed to tilapia (40%
assumed protein efficiency, Schneider et al., 2004) then ~55-85g crude protein would be
retained in fish biomass. This, theoretically, results in a weight gain of ~350-530g per kg feed
and improves FCR by ~0.4-0.5. This would increase the N retention of the RAS by ~30-40%
(from ~30gN/kg feed for African catfish alone to ~39-43gN/ kg feed for African catfish and
tilapia together). These assumptions, however, require direct bacteria harvesting (100%
efficiency) and bacteria consumption by the fish. The calculated FCR improvement agrees
with results reported for shrimps or tilapia which grew more efficiently if the heterotrophic
production inside the pond or aquarium was stimulated and consumed (Avnimelech, 1999;
Velasco, 2000). In the future, a more detailed evaluation of the bacteria biomass is required,
to characterize the nutritional value in vitro and in vivo.
Chapter 9
134
Process design characterization and integration In chapter 8, the design of a bacteria reactor integrated in a 100MT African catfish
farm was calculated. This required combining fish production data, the effluent characteristics
and the bacteria kinetics. Experimental data from chapter 3 were used to determine the
relevant kinetic parameters and conversion rates (yield, endogenous decay coefficient, and
maximum specific growth rate, half-velocity constant and maximum rate of substrate
utilization, nutrient conversion rates, oxygen consumption, and carbon dioxide production).
The kinetics and rates were integrated into a model. This validated model was used to predict
bacteria production and nutrient conversion in the designed reactor. Based on the simulation
the inorganic nutrient (N and P) removal efficiencies and the C supplementation level were
determined. Fish waste was converted with an efficiency of 85 and 95% for N and P,
respectively, into bacteria biomass (187gVSS/kg feed) in a reactor volume of 11m3 (HRT 6-
9h, 455gC/kg feed). In the designed CSTR, sludge was not returned and sludge retention time
equaled HRT to prevent unnecessary cell oxidation (Pirt, 1975). This modus operandi was in
contrast to activated sludge systems, which have a sludge return and do not aim for biomass
productions (Tchobanoglous et al., 2003).
RAS design had not to be changed and no interferences with other processes inside the
system occurred. This was in contrast to earlier systems as described before (Knoesche and
Tscheu., 1974, Meske, 1976). The designed reactor was efficient in inorganic nitrogen
removal similar to denitrification reactors with about 1gN/l/d (van Rijn et al., in press).
However, the carbon consumption per g inorganic N removed was much higher for the
present heterotrophic conversion than for denitrification (13gC/gN versus 2gC/gN, Henze et
al., 1999).
In conventional RAS designs all nutrients that are not retained by the fish are
transferred or lost to the outside environment. The solid waste is treated outside the system
boundaries with long SRTs or HRTs, such as in septic tanks or lagoons (HRT ~15d, Chen et
al., 1997). Alternatively, when composting and/or anaerobic fermentation would be applied, it
would lead to a net loss of nutrients due to bacteria activity and would result in odor and
greenhouse gas emissions (Chen et al., 1997, Burton and Turner, 2003). When the solid waste
would be treated as terrestrial waste (manure) and destined as fertilizer for agricultural land, it
can result into long transport distances, due to limitations in soil carrying capacity around the
fish farm (Janzen et al.1999; Adhikari et al., 2005). The present approach avoids or reduces
these negative impacts. Furthermore, nutrients were made available for re-use inside the
aquatic system. All this makes the proposed heterotrophic bacteria reactor an interesting
Discussion
135
alternative for current solid waste treatment systems in RAS. A concern, however, is the
required organic C supplementation to provide optimal C: N ratios (455gC/kg feed, chapter
8). Furthermore, it is unclear, to which extent the converted nutrients will be really retained in
a bacterivore organism. Other aspects, which have not been covered in this study, have to be
investigated in the future. These aspects concern the chain feed-fish-waste-bacteria, the
harvestability and the up scaling of the reactor to farm size. In the present study only one fish
species, fed with a specific commercial diet, was used as waste producer. However, fish waste
composition is highly depending on fish species, fish size, environmental conditions and feed
type. If only one of these factors is changed, the starting values of the conversion process
change. Analytical issues made it difficult to determine exactly how much of the waste VSS
entering the reactor was converted into bacteria biomass. To obtain more precise data,
alternative analytical methods must be applied. If the exact fractions of converted and
unconverted VSS are known, the conversion process can be optimized and fine-tuned to
decrease the fraction of unconverted VSS.
In the future, harvest techniques must be evaluated, such as mechanical or membrane
filtration, sedimentation, centrifugation, flocculation, foam fractionation, evaporation or
electrokinetic methods (Atkinson and Mavituna, 1991; Rittmann and McCarty, 2001). By
these methods, the bacteria biomass can be made available for culture organisms as feed. It
might also be possible to feed the obtained bacteria biomass directly to filter feeders, such as
tilapia or shrimp (Avnimelech et al. 1989; McIntosh, 2001; Turker et al., 2003; Brune et al.,
2003).
Reactor up-scaling will impact the reactor’s hydrodynamics, the oxygenation design,
the agitation requirements, the pH management, the C supplementation and the harvest
techniques. Based on the experiments with a small-scale reactor, it is recommended to follow
a two step approach in the future, (1) integrating a reactor on semi-farm level (1.5MT
fish/production per year) to investigate the influence of reactor volume (from 3.5 l to about
110 l) on the conversion process, to fine tune the kinetic parameters and to evaluate the
feasibility to feed the bacteria biomass to shrimp or fish; (2) up-scaling to full farm level and
to set-up a pilot system, integrating fish-bacteria and a secondary crop, such as shrimp or
tilapia.
Conclusions From this study the following conclusions have been drawn: Fish waste management
inside a RAS is an alternative mean to waste management outside RAS. Waste can be
Chapter 9
136
converted into heterotrophic bacteria biomass inside RAS in a specifically designed reactor.
This conversion is less sensitive for changes in hydraulic retention time (11-2h) than for
organic C supplementation levels (0-3.5gC/l). The organic C source (sodium acetate or
molasses) has thereby no detectable effect, provided that it is easily degradable. The form of
nitrogenous waste (TAN or nitrate) had no effect on bacteria yields either. Furthermore,
bacteria kinetics were derived from the conducted experiments (yield: 0.537gVSS/gC;
endogenous decay coefficient: 0.033h-1; maximum specific growth rate: 0.217h-1; half-
velocity constant: 0.025g/l; and maximum rate of substrate utilization: 0.404 gC/gVSS*h). By
applying these kinetics in a model, the bacteria production of a reactor integrated in a 100MT
African catfish farm was calculated (187gVSS/kg feed). The removal efficiency of dissolved
inorganic N and P was 85 and 95% respectively, assuming a bacteria harvestability of 100%.
The produced bacteria, mainly Rhizobium and Mezorhizobium strains, could not be associated
with a pathogenic risk. The biomass, however, was less preferred by shrimps than a
commercial feed but accepted as diet. If the bacteria biomass would have been fed to tilapia, a
theoretical maximum improvement of 0.4 to 0.5 in FCR could be obtained which equaled an
increased N retention of 30-40% in the RAS. The integration of heterotrophic bacteria
conversion to manage the waste effluent of a RAS together with the integration of a
bacterivore secondary crop is, therefore, a prospective tool to increase RAS sustainability in
the future.
137
References
Abbott, S. L. and J. M. Janda (2001). The Genus Edwardsiella The Prokaryotes: An Evolving Electronic Resource for
the Microbiological Community. M. Dworkin, S. Falkow, E. Rosenberg, K.-H. Schleifer and E. Stackebrandt, Springer.
Adamse, A. D. (1968). "Bulking of dairy waste activated sludge." Water Research 2(10): 715-720. Adamse, A. D. (1968). "Formation and final composition of the bacterial flora of a dairy waste activated sludge." 2(9):
665-671. Adhikari, M., K. P. Paudel, J. Martin, Neil R. and W. M. Gauthier (2005). "Economics of dairy waste use as fertilizer
in central Texas." Waste Management 25(10): 1067-1074. Alaerts, G. J., R. Mahbubar and P. Kelderman (1996). "Performance analysis of a full-scale duckweed-covered sewage
lagoon." Water Research 30(4): 843-852. Alasgah, N. A. and A. Ali (1994). "Feeding of Various Carbohydrate Sources on the Growth- Performance and
Nutrient Utilization in Oreochromis niloticus." Agribiological Research-Zeitschrift Fur Agrarbiologie Agrikulturchemie Okologie 47(1): 1-12.
Amirkolaie, A. K. (2005). "Dietary carbohydrate and faecal waste in the Nile tilapia (Oreochromis niloticus L.)." Animal Sciences: 143pp.
Anthony, J. E., P. N. Hadgis, R. S. Milam, G. A. Herzfeld, L. J. Taper and S. J. Ritchey (1983). "Yields, Proximate Compositions and Mineral Content of Finfish and Shellfish." Journal of Food Science 48(1): 313-314.
Anupama and P. Ravindra (2000). "Value-added food: single cell protein." Biotechnology Advances 18(6): 459-479. Atkinson, B. and F. Mavituna (1991). Biochemical engineering and biotechnology handbook. Hampshire, UK,
MacMillan LTD. Aulenta, F., D. Dionisi, M. Majone, A. Parisi, R. Ramadori and V. Tandoi (2003). "Effect of periodic feeding in
sequencing batch reactor on substrate uptake and storage rates by a pure culture of Amaricoccus kaplicensis." Water Research 37(11): 2764-2772.
Austin, B. and D. A. Austin (1987). Bacterial Fish Pathogens: Disease in Farmed and Wild Fish. Chichester, West Sussex, Ellis Horwood limited.
Austin, B. and D. A. Austin (1999). Bacterial Fish Pathogens: Disease in Farmed and Wild Fish. Chichester, West Sussex, UK.
Avnimelech, Y. (1999). "Carbon nitrogen ratio as a control element in aquaculture systems." Aquaculture 176(3-4): 227-235.
Avnimelech, Y., S. Mokady and G. L. Schroeder (1989). "Circulated ponds as efficient bioreactors for single cell protein production." Isr. J. Aquacult. Bamidgeh. 41(2): 58-66.
Avnimelech, Y., N. Mozes and B. Weber (1992). "Effects of aeration and mixing on nitrogen and organic matter transformations in simulated fish ponds." Aquacultural Engineering 11(3): 157-169.
Barrow, G. I. and R. K. A. Feltham (1993). Cowan and Steel’s manual for the identification of medical bacteria, Cambridge University Press: 94-164.
Batut, J. and P. Boistard (1994). "Oxygen Control in Rhizobium." Antonie van Leeuwenhoek International Journal of general and molekular microbiology 66(1-3): 129-150.
Bergey, D. H. (1984). Bergey’s Manual of Systematic Bacteriology. Baltimore, Williams and Wilkins. Beristain, B. T. (2005). "Organic matter decomposition in simulated aquaculture ponds." Department of Animal
Sciences: 138pp. Bernardet, J. F. and Y. Nakagawa (2000). An Introduction to the Family Flavobacteriaceae. The Prokaryotes: An
Evolving Electronic Resource for the Microbiological Community. M. Dworkin, S. Falkow, E. Rosenberg, K.-H. Schleifer and E. Stackebrandt, Springer.
Bernardet, J. F., M. Vancanneyt, O. Matte-Tailliez, L. Grisez, P. Tailliez, C. Bizet, M. Nowakowski, B. Kerouault and J. Swings (2005). "Polyphasic study of Chryseobacterium strains isolated from diseased aquatic animals." Systematic and Applied Microbiology 28(7): 640-660.
Bischoff, A. A. (2003). "Growth and mortality of the polychaete Nereis diversicolor under experimental rearing conditions." Institute of Marine Research & Department of Animal Sciences, Chairgroup of Fish Culture and Fisheries: 103pp.
Bovendeur, J., E. H. Eding and A. M. Henken (1987). "Design and Performance of a Water Recirculation system for High-Density Culture of the African Catfish, Clarias gariepinus (Burchell 1822)." Aquaculture 63: 329-353.
Brown, D. and P. Rothery (1993). Models in Biology. West Sussex, England, Wiley & Sons LTD. Brune, D. E., G. Schwartz, A. G. Eversole, J. A. Collier and T. E. Schwedler (2003). "Intensification of pond
aquaculture and high rate photosynthetic systems." Aquacultural Engineering 28: 65-86. Brunty, J. L., R. A. Bucklin, J. Davis, C. D. Baird and R. A. Nordstedt (1997). "The influence of feed protein intake on
tilapia ammonia production." Aquacultural Engineering 16(3): 161-166. Bureau, D. P. and C. Y. Cho (1999). "Phosphorus utilization by rainbow trout (Oncorhynchus mykiss): estimation of
dissolved phosphorus waste output." Aquaculture 179: 127-140.
References
138
Burford, M. A., P. J. Thompson, R. P. McIntosh, R. H. Bauman and D. C. Pearson (2003). "Nutrient and microbial dynamics in high-intensity, zero-exchange shrimp ponds in Belize." Aquaculture 219(1-4): 393-411.
Burford, M. A., P. J. Thompson, R. P. McIntosh, R. H. Bauman and D. C. Pearson (2004). "The contribution of flocculated material to shrimp (Litopenaeus vannamei) nutrition in a high-intensity, zero-exchange system." Aquaculture 232(1-4): 525-537.
Burton, C. H. and C. Turner (2003). Manure Management: Treatment Strategies for Sustainable Agriculture. Bedford, UK, Silsoe Research Institute.
Cabib, G., H. J. Silva, A. Giulietti and R. Ertola (1983). "The use of sugar cane stillage for single cell protein production." Journal of Chemical Technology and Biotechnology 33B(1): 21-28.
Casal, J. A., J. E. Vermaat and F. Wiegman (2000). "A test of two methods for plant protein determination using duckweed." Aquatic Botany 67(1): 61-67.
Castanares, A. G. M. A. (1990). "Comparison of the nutritive value of azolla (Azolla pinnata var. imbricata) and duckweed (Lemna perpusilla) for nile tilapia (Oreochromis niloticus L.)." 97pp.
Chen, S., Z. Ning and R. F. Malone (1996). Aquaculture Sludge Treatment Using an Anaerobic and Facultative Lagoon System. International conference on recirculation technology, Roanoke, Virginia, Virginia-Tech.
Chen, S., D. Stechey and R. F. Malone (1997). Suspended solids control in recirculating aquaculture systems. Aquaculture Water Reuse Systems: Engineering Design and Management. M. B. Timmons and T. M. Losordo. Amsterdam, The Netherlands, Elsevier. 27: 61-100.
Chen, S. L., D. E. Coffin and R. F. Malone (1997). "Sludge production and management for recirculating aquacultural systems." Journal of the World Aquaculture Society 28(4): 303-315.
Cho, S. H. and R. T. Lovell (2002). "Variable feed allowance with constant protein input for channel catfish (Ictalurus punctatus) cultured in ponds." Aquaculture 204(1-2): 101-112.
Chowdhury, S. A., K. S. Huque and M. Khatun (1995). Algae in Animal Production. Agricultural Sciences for Biodiversity and Sustainability in Development Countries, Tune Landboskole, Denmark.
Clesceri, L. S., A. E. Greenberg and A. D. Eaton (1998). Standard methods for the examination of water and wastewater. Washington, USA, American Public Health Association.
Coffaro, G. and A. Sfriso (1997). "Simulation model of Ulva rigida growth in shallow water of the Lagoon of Venice." Ecological Modelling 102: 55-66.
Cohen, I. and A. Neori (1991). "Ulva lactuca Biofilters for Marine Fishpond Effluents .1. Ammonia Uptake Kinetics and Nitrogen-Content." Botanica Marina 34(6): 475-482.
Coloso, R. M., K. King, J. W. Fletcher, M. A. Hendrix, M. Subramanyam, P. Weis and R. P. Ferraris (2003). "Phosphorus utilization in rainbow trout (Oncorhynchus mykiss) fed practical diets and its consequences on effluent phosphorus levels." Aquaculture 220(1-4): 801-820.
Company, R., J. A. Calduch-Giner, S. Kaushik and J. Perez-Sanchez (1999). "Growth performance and adiposity in gilthead sea bream (Sparus aurata): risks and benefits of high energy diets." Aquaculture 171(3-4): 279-292.
Cripps, S. J. (1995). "Serial Particle-Size Fractionation and Characterization of an Aquacultural Effluent." Aquaculture 133(3-4): 323-339.
Cromar, N. J. and H. J. Fallowfield (1997). "Effect of nutrient loading and retention time on performance of high rate algal ponds." Journal of Applied Phycology 9(4): 301-309.
Cromar, N. J., N. J. Martin, N. Christofi, P. A. Read and H. J. Fallowfield (1992). "Determination of nitrogen and phosphorus partitioning within components of the biomass in a high rate algal pond: Significance of the coastal environment of the treated efflunet discharge." Water Science and Technology 25(12): 207-214.
Culley, D. D. and E. A. Epps (1973). "Use of Duckweed for waste treatment and animal feed." Journal WPCF 45(2): 337-347.
Curtin, L. V. (1993). Molasses - General Considerations. Molasses in Animal Nutrition. West Des Moines, USA, National Feed Ingredients Association.
Cytryn, E., D. Minz, I. Gelfand, A. Neori, A. Gieseke, D. De Beer and J. Van Rijn (2005). "Sulfide-oxidizing activity and bacterial community structure in a fluidized bed reactor from a zero-discharge mariculture system." Environmental Science & Technology 39(6): 1802-1810.
Cytryn, E., J. van Rijn, A. Schramm, A. Gieseke, D. de Beer and D. Minz (2005). "Identification of bacteria potentially responsible for oxic and anoxic sulfide oxidation in biofilters of a recirculating mariculture system." Applied and Environmental Microbiology 71(10): 6134-6141.
de la Noüe, J. and N. de Pauw (1988). "The potential of microalgal biotechnology: A review of production and uses of microalgae." Biotechnology Advances 6(4): 725-770.
del Rio, M. J., Z. Ramazanov and G. GarciaReina (1996). "Ulva rigida (Ulvales, Chlorophyta) tank culture as biofilters for dissolved inorganic nitrogen from fishpond effluents." Hydrobiologia 327: 61-66.
Dugan, P. R., D. L. Stoner and H. M. Pickrum (1999). The Genus Zooglea. The Prokaryotes: An Evolving Electronic Resource for the Microbiological Community. M. Dworkin, S. Falkow, E. Rosenberg, K.-H. Schleifer and E. Stackebrandt, Springer.
Ebeling, J. M., K. L. Rishel and P. L. Sibrell (2005). "Screening and evaluation of polymers as flocculation aids for the treatment of aquacultural effluents." Aquacultural Engineering 33(4): 235-249.
Ebeling, J. M., P. L. Sibrell, S. R. Ogden and S. T. Summerfelt (2003). "Evaluation of chemical coagulation-flocculation aids for the removal of suspended solids and phosphorus from intensive recirculating aquaculture effluent discharge." Aquacultural Engineering 29(1-2): 23-42.
References
139
Eding, E. H. and A. Kamstra (2002). "Netherlands Farms Tune Recirculation Systems to Production of Varied Species." Global Aquaculture Advocate 5(3): 52-54.
Eding, E. H., A. Klapwijk and J. A. J. Verreth (2003). Design and performance of an upflow sludge blanket reactor in a "Zero" discharge recirculation system. Beyond Monoculture, Trondheim, Norway, EAS. 172-173.
Eding, E. H. and J. H. van Weerd (1999). Grundlagen, Aufbau und Management von Kreislaufanlagen. Zucht und Produktion von Süßwasserfischen. M. Bohl. Frankfurt, Germany, DLG-Verlagsgesellschaft-GmbH: 436-491.
Edwards, P. (1993). Environmental issues in integrated agriculture-aquaculture and wastewater-fed fish culture systems. Environment and aquaculture in developing countries. R. S. V. Pullin, H. Rosenthal and J. L. Maclean. Manila, Philippines, ICLARM: 139-171.
Edwards, P. (2004). "Traditional Chinese aquaculture and its impact outside China." World Aquaculture 2004(1): 24-27.
Ekholm, P., E. Turtola, J. Gronroos, P. Seuri and K. Ylivainio (2005). "Phosphorus loss from different farming systems estimated from soil surface phosphorus balance." Agriculture, Ecosystems & Environment 110(3-4): 266-278.
El-Sayed, A. F. M. (1999). "Alternative dietary protein sources for farmed tilapia, Oreochromis spp." Aquaculture 179(1-4): 149-168.
El-Shafai, S. A. A. (2004). "Nutrients Volarisation via Duckweed-based Wastewater Treatment and Aquaculture." UNESCO-IHE: 174pp.
Ellner, S., A. Neori, M. D. Krom, K. Tsai and M. R. Easterling (1996). "Simulation model of recirculating mariculture with seaweed biofilter: development and experimental tests of the model." Aquaculture 143: 167-184.
Encarnacion, S., M. Dunn, K. Willms and J. Mora (1995). "Fermentative and Aerobic Metabolism in Rhizobium etli." Journal of Bacteriology 177(11): 3058-3066.
Etchebehere, C., M. Errazquin, P. Dabert, R. Moletta and L. Muxi (2001). "Comamonas nitrativorans sp. nov., a novel denitrifier isolated from a denitrifying reactor treating landfill leachate." Int J Syst Evol Microbiol 51(3): 977-983.
Etchebehere, C., M. I. Errazquin, P. Dabert and L. Muxi (2002). "Community analysis of a denitrifying reactor treating landfill leachate." Fems Microbiology Ecology 40(2): 97-106.
Fang, H. H. P., T. Zhang and Y. Liu (2002). "Characterization of an acetate-degrading sludge without intracellular accumulation of polyphosphate and glycogen." Water Research 36(13): 3211-3218.
Field, A. (2000). Discovering Statistics Using SPSS for Windows. London, SAGE Publications. Froese, R. and D. Pauly (2005). "Fishbase." 2005: http://www.fishbase.org. Frolund, B., R. Palmgren, K. Keiding and P. H. Nielsen (1996). "Extraction of extracellular polymers from activated
sludge using a cation exchange resin." Water Research 30(8): 1749-1758. Gaigher, I. G., D. Porath and G. Granoth (1984). "Evaluation of duckweed (Lemna gibba) as feed for tilapia
(Orechromis niloticus x O. aureus) in a recirculation unit." Aquaculture 41: 235-244. Gebauer, R. (2004). "Mesophilic anaerobic treatment of sludge from saline fish farm effluents with biogas production."
Bioresource Technology 93(2): 155-167. Gonzalez, C. J., J. A. Santos, M. L. Garcia-Lopez and A. Otero (2000). "Psychrobacters and related bacteria in
freshwater fish." Journal of Food Protection 63(3): 315-321. Goodwin, S. and J. G. Zeikus (1987). "Physiological Adaptations of Anaerobic-Bacteria to Low ph - Metabolic
Control of Proton Motive Force in Sarcina ventriculi." Journal of Bacteriology 169(5): 2150-2157. Gumaelius, L., G. Magnusson, B. Pettersson and G. Dalhammar (2001). "Comamonas denitrificans sp. nov., an
efficient denitrifying bacterium isolated from activated sludge." Int J Syst Evol Microbiol 51(3): 999-1006. Hakanson, L., L. Carlsson and T. Johansson (1998). "A new approach to calculate the phosphorus load to lakes from
fish farm emissions." Aquacultural Engineering 17(3): 149-166. Hammouda, O., A. Gaber and N. Abdel-Raouf (1995). "Microalgae and Wastewater Treatment." Ecotoxicology and
Environemntal Safety 31: 205-210. Hari, B., B. M. Kurup, J. T. Varghese, J. W. Schrama and M. C. J. Verdegem (2004). "Effects of carbohydrate addition
on production in extensive shrimp culture systems." Aquaculture 241(1-4): 179-194. Hassan, M. S. and P. Edwards (1992). "Evaluation of duckweed (Lemna perpusilla and Spirodela ployrrhiza) as feed
for Nile tilapia (Orechromis niloticus)." Aquaculture 104: 315-326. Henze, M., P. Harremoes, E. Arvin and J. Cour Jansen (1996). Waste Water Treatment. Lyngby, Springer Verlag,
Berlin Heidelberg, New York. Hof, G., M. D. Vervoorn, P. J. Lenaers and S. Tamminga (1997). "Milk Urea Nitrogen as a Tool to Monitor the Protein
Nutrition of Dairy Cows." J. Dairy Sci. 80(12): 3333-3340. Holmes, B. (1999). The Genera Flavobacterium, Sphingobacterium, and Weeksella. The Prokaryotes: An Evolving
Electronic Resource for the Microbiological Community. M. Dworkin, S. Falkow, E. Rosenberg, K.-H. Schleifer and E. Stackebrandt, Springer.
Hugo, C. J., B. Bruun and P. J. KJooste (2000). The Genus Edwardsiella The Prokaryotes: An Evolving Electronic Resource for the Microbiological Community. M. Dworkin, S. Falkow, E. Rosenberg, K.-H. Schleifer and E. Stackebrandt, Springer.
IWMI (2000). "web pages." 2000: http://www.iwmi.org. Jahn, A. and P. H. Nielsen (1998). "Cell biomass and exopolymer composition in sewer biofilms." Water Science and
Technology 37(1): 17-24.
References
140
Janzen, R. A., W. B. McGill, J. J. Leonard and S. R. Jeffrey (1999). "Manure as a resource - Ecological and economic considerations in balance." Transactions of the Asae 42(5): 1261-1273.
Jimenez, A. M., R. Borja and A. Martin (2004). "A comparative kinetic evaluation of the anaerobic digestion of untreated molasses and molasses previously fermented with Penicillium decumbens in batch reactors." Biochemical Engineering Journal 18(2): 121-132.
Jongbloed, A. W. and P. A. Kemme (2005). "De uitscheiding van stikstof en fosfor door vakens, kippen, kalkoenen, pelsdieren, eenden, konijnen en parelhoeders in 2002 en 2006." 101.
Jongbloed, A. W. and N. P. Lenis (1998). "Environmental concerns about animal manure." J. Anim Sci. 76(10): 2641-2648.
Jooste, P. J. and C. J. Hugo (1999). "The taxonomy, ecology and cultivation of bacterial genera belonging to the family Flavobacteriaceae." International Journal of Food Microbiology 53(2-3): 81-94.
Jung, S., S. E. Lowe, R. I. Hollingsworth and J. G. Zeikus (1993). "Sarcina ventriculi synthesizes very long chain dicarboxylic acids in response to different forms of environmental stress." J. Biol. Chem. 268(4): 2828-2835.
Kamstra, A. (2001). "poster presentations." 2003: http://www.hesy.com. Kamstra, A., E. H. Eding and O. Schneider (2001). "Top Eel Farm Upgrades Effluent Treatment in Netherlands."
Global Aquaculture Advocate 4(3): 37-38. Kargi, F. and I. Karapinar (1995). "Kinetics of Cod Removal from a Synthetic Waste-Water in a Continuous
Biological Fluidized-Bed." Bioprocess Engineering 13(5): 265-270. Kargi, F., M. L. Shuler, R. Vashon, H. W. Seeley, A. Henry and R. E. Austic (1980). "Continuous aerobic conversion
of poultry waste into single-cell protein using a single reactor: kinetic analysis and determination." Biotechnology and Bioengineering 22(8): 1567-1600.
Kemme, P. A., J.-H. van der Tol, G. J. F. Smolders, H. Valk and J. D. van der Kils (2005). "Schatting van de uitscheiding van stikstof en fosfor door diverse categorieen graasdieren." 55.
Kennish, M. J. (1990). CRC Practical Handbook of Marine Science. Boca Raton, CRC Press. Kersters, K., P. de Vos, M. Gillis, J. Swings, P. Vandamme and E. Stackebrandt (2003). Introduction to the
Proteobacteria The Prokaryotes: An Evolving Electronic Resource for the Microbiological Community. M. Dworkin, S. Falkow, E. Rosenberg, K.-H. Schleifer and E. Stackebrandt, Springer.
Kestemont, P. (1995). "Different systems of carp production and their impacts on the environment." Aquaculture 129(1-4): 347-372.
Kim, J. D., S. J. Kaushik and J. Breque (1998). "Nitrogen and phosphorus utilisation in rainbow trout (Oncorhynchus mykiss) fed diets with or without fish meal." Aquatic Living Resources 11(4): 261-264.
Kinne, O., Ed. (1984). Diseases of Marine Animals. Helgoland, Biologische Anstalt Helgoland. Knoesche, R. (1994). "An Effective Biofilter Type for Eel Culture in Recirculating Systems." Aquacultural
Engineering 13: 71-82. Knoesche, R. and E. Tscheu (1974). "Das Belebtschlammverfahren zur Reinigung des Abwassers aus
Fischzuchtanlagen." Zeitschrift fuer die Binnenfischerei der DDR 21: 16-23. Koerner, S. and J. E. Vermaat (1998). "The relative importance of Lemna gibba L., bacteria and algae for the nitrogen
and phosphorus removal in duckweed-covered domestic wastewater." Water Research 32(12): 3651-3661. Lane, D. J. (1991). 16S/23S rRNA sequencing. Nucleic acid techniques in bacterial systematics. E. Stackebrandt and
M. Goodfellow. Chichester, J. Wiley & Sons: 115–175. Lechevallier, M. W., W. Schulz and R. G. Lee (1991). "Bacterial Nutrients in Drinking-Water." Applied and
Environmental Microbiology 57(3): 857-862. Lee, P. G. and S. P. Meyers (1996). "Chemoattraction and feeding stimulation in crustaceans." Aquaculture Nutrition
2: 157-164. Lehner, A., T. Tasara and R. Stephan (2005). "Relevant aspects of Arcobacter spp. as potential foodborne pathogen."
International Journal of Food Microbiology 102(2): 127-135. Lemarie, G., J. L. M. Martin, G. Dutto and C. Garidou (1998). "Nitrogenous and phosphorous waste production in a
flow-through land-based farm of European seabass (Dicentrarchus labrax)." Aquatic Living Resources 11(4): 247-254.
Leonard, N., J. P. Blancheton and J. P. Guiraud (2000). "Populations of heterotrophic bacteria in an experimental recirculating aquaculture system." Aquacultural Engineering 22: 109-120.
Leung, K. and E. Topp (2001). "Bacterial community dynamics in liquid swine manure during storage: molecular analysis using DGGE/PCR of 16S rDNA." FEMS Microbiology Ecology 38(2-3): 169-177.
Li, F. (1986). On Pisciculture, Chinese Reprint. Liu, F. and W. Han (2004). "Reuse strategy of wastewater in prawn nursery by microbial remediation." Aquaculture
230(1-4): 281-296. Liu, J. X. and Q. Cai (1998). "Integrated aquaculture in Chinese lakes and paddy fields." Ecological Engineering 11:
48-59. Liu, Y., T. Zhang and H. H. P. Fang (2005). "Microbial community analysis and performance of a phosphate-removing
activated sludge." Bioresource Technology 96(11): 1205-1214. Losordo, T. M. (1998). "Recirculating Aquaculture Production Systems: The Status and Future." Aquaculture
Magazine 24(Jan./Febr.): 38-45.
References
141
Losordo, T. M., D. P. Delong and P. W. Westerman (2003). Appropiate designs for the on-site treatment und utilization of wastes in rural, farm-based, freshwater recirculating systems; an overview of critical considerations with emphasis on economic viability. Beyond Monoculture, Trondheim, Norway, EAS. 46-49.
Ludwig, W., O. Strunk, R. Westram, L. Richter, H. Meier, Yadhukumar, A. Buchner, T. Lai, S. Steppi, G. Jobb, W. Forster, I. Brettske, S. Gerber, A. W. Ginhart, O. Gross, S. Grumann, S. Hermann, R. Jost, A. Konig, T. Liss, R. Lussmann, M. May, B. Nonhoff, B. Reichel, R. Strehlow, A. Stamatakis, N. Stuckmann, A. Vilbig, M. Lenke, T. Ludwig, A. Bode and K.-H. Schleifer (2004). "ARB: a software environment for sequence data." Nucleic acids research 32(4): 1363-1371.
Luening, K., S. J. Pang, G. Garcia Reina, J. L. Pinchetti, R. Santos, I. Sousa Pinto, F. Lopez-Figueroa, P. Dion, V. Lognone, M. J. Dring, L. Brown, U. Lindequist and A. Bansemir (2002). Species Diversification and Improvement of Aquatic Production in Seaweeds Purifying Effluents From Integrated Fish Farms (Eu Project SEAPURA 2001-2004). Beyond Monoculture, Trondheim, Norway, EAS.
Lupatsch, I. and G. W. Kissil (1998). "Predicting aquaculture waste from gilthead seabream (Sparus aurata) culture using a nutritional approach." Aquatic Living Resources 11(4): 265-268.
Lupatsch, I., G. W. Kissil and D. Sklan (2001). "Optimization of feeding regimes for European sea bass Dicentrarchus labrax: a factorial approach." Aquaculture 202(3-4): 289-302.
Machiels, M. A. M. (1987). "A dynamic Simulation Model for Growth of the African Catfish, Clarias gariepinus (Burchell 1822) IV: The Effect of Feed Formulation on Growth and Feed Utilization." Aquaculture 64: 305-323.
Mai, K., J. P. Mercer and J. Donlon (1995). "Comparative studies on the nutrition of two species of abalone, Haliotis tuberculata L. and Haliotis discus hannai Ino. IV. Optimum dietary protein level for growth." Aquaculture 136(1-2): 165-180.
Manos, J. and R. Belas (2001). The Genera Proteus, Providencia and Morganella The Prokaryotes: An Evolving Electronic Resource for the Microbiological Community. M. Dworkin, S. Falkow, E. Rosenberg, K.-H. Schleifer and E. Stackebrandt, Springer.
Marazioti, C., M. Kornaros and G. Lyberatos (2003). "Kinetic modeling of a mixed culture of Pseudomonas denitrificans and Bacillus subtilis under aerobic and anoxic operating conditions." Water Research 37(6): 1239-1251.
Martínez, M. E., J. M. Jiménez and F. E. Yousfib (1999). "Influence of phosphorus concentration and temperature on growth and phosphorus uptake by the microalga Scenedesmus obliquus." Bioresource Technology 67: 233-240.
Maruyama, I., T. Nakao, I. Shigeno, Y. Ando and K. Hirayama (1997). "Application of unicellular algae Chlorella vulgaris for the mass-culture of marine rotifer Brachionus." Hydrobiologia 358: 133-138.
Mbagwu, I. G. and H. A. Adeniji (1988). "The Nutritional Content of Duckweed (Lemna paucicostata Hegelm) in the Kainji Lake Area, Nigeria." Aquatic Botany 29(4): 357-366.
McCausland, M. A., M. R. Brown, S. M. Barrett, J. A. Diemar and M. P. Heasman (1999). "Evaluation of live microalgae and microalgal pastes as supplementary food for juvenile Pacific oysters (Crassostrea gigas)." Aquaculture 174(3-4): 323-342.
McGinnis, S. and T. L. Madden (2004). "BLAST: at the core of a powerful and diverse set of sequence analysis tools." Nucl. Acids. Res. 32(suppl_2): W20-25.
McIntosh, D., T. M. Samocha, E. R. Jones, A. L. Lawrence, D. A. McKee, S. Horowitz and A. Horowitz (2000). "The effect of a commercial bacterial supplement on the high- density culturing of Litopenaeus vannamei with a low-protein diet in an outdoor tank system and no water exchange." Aquacultural Engineering 21(3): 215-227.
McIntosh, R. P. (2001). High rate bacterial systems for culturing shrimps. Aquacultural Engineering Society's 2001 Issues Forum, Shepherdstown, USA, Aquacultural Egineering Society. 117-129.
Melse, R. W. and G. Mol (2004). "Odour and ammonia removal from pig house exhaust air using a biotrickling filter." Water Science and Technology 50(4): 275-282.
Meske, C. (1976). Fish Culture in a Recirculating System with Water Treatment by Activated Sludge. FAO Technical Conference, Kyoto, Japan, FAO. 527-531.
Meyer-Reil, L. A. and M. Koester (1993). Mikrobiologie des Meeresbodens. Jena, Fischer Verlag. Meyering, B. (2003). "Topsy Baits web page." 2003: http://www.topsybaits.nl. Mihalyfalvy, E., H. T. Johnston, M. K. Garrett, H. J. Fallowfield and N. J. Cromar (1997). "Improved mixing of high
rate algal ponds." Water Research 32(4): 1334-1337. Moreno, Y., S. Botella, J. L. Alonso, M. A. Ferrus, M. Hernandez and J. Hernandez (2003). "Specific Detection of
Arcobacter and Campylobacter Strains in Water and Sewage by PCR and Fluorescent In Situ Hybridization." Appl. Environ. Microbiol. 69(2): 1181-1186.
Murray, K. R., W. L. Drew, G. S. Kobayashi and J. H. Thompson (1990). Medical Microbiology, Wolfe, ISE. Mustafa, N., M. Thorn and F. Sorensson (2002). "Inhibition of bacterial alpha-glucosidases by castanospermine in pure
cultures and activated sludge." Applied Microbiology and Biotechnology 59(1): 68-71. Muyzer, G., E. C. de Waal and G. A. Uitterlinden (1993). "Profiling of complex populations by denaturing gradient gel
electrophoresis analysis of polymerase chain reaction-amplified genes coding for 16S rRNA." Applied and Environmental Microbiology 59: 695-700.
References
142
Muyzer, G. and K. Smalla (1998). "Application of denaturing gradient gel electrophoresis (DGGE) and temperature gradient gel electrophoresis (TGGE) in microbial ecology." Antonie van Leeuwenhoek 73: 127-141.
NASS (2005). "Agricultural Prices, 2004 Summary." Naylor, R. L., R. J. Goldburg, J. H. Primavera, N. Kautsky, M. C. M. Beveridge, J. Clay, C. Folke, J. Lubchenco, H.
Mooney and M. Troell (2000). "Effect of Aquaculture on world fish supplies." Nature 405(29): 1017-1024. Neori, A. (1996). "The Type of N-Supply (Ammonia or Nitrate) determines the performance of Seaweed Biofilters
integrated with intensive Fish Culture." The Israeli Journal of Aquaculture Bamidgeh 48(1): 19-27. Neori, A., T. Chopin, M. Troell, A. H. Buschmann, G. P. Kraemer, C. Halling, M. Shpigel and C. Yarish (2004).
"Integrated aquaculture: rationale, evolution and state of the art emphasizing seaweed biofiltration in modern mariculture." Aquaculture 231(1-4): 361-391.
Neori, A., I. Cohen and H. Gordin (1991). "Ulva lactuca Biofilters for Marine Fishpond Effluents 2. Growth-Rate, Yield and C-N Ratio." Botanica Marina 34(6): 483-489.
Neori, A., N. L. C. Ragg and M. Shpigel (1998). "The integrated culture of seaweed, abalone, fish and clams in modular intensive land-based systems: II. Performance and nitrogen partitioning within an abalone (Haliotis tuberculata) and macroalgae culture system." Aquacultural Engineering 17(4): 215-239.
Neori, A., M. Shpigel and D. Ben-Ezra (2000). "A sustainable integrated system for culture of fish, seaweed and abalone." Aquaculture 186(3-4): 279-291.
Nübel, U., B. Engelen, A. Felske, J. Snaidr, A. Wieshuber, R. I. Amann, W. Ludwig and H. Backhaus (1996). "Sequence heterogeneities of genes encoding 16S rRNA in Paenibacillus polymixa detected by temperature gradient gel electrophoresis." Journal of Bacteriology 178: 5636-5643.
Nurdogan, Y. and W. J. Oswald (1995). "Enhanced Nutrient Removal in High-Rate Ponds." Water Science and Technology 31(12): 33-43.
O'Hara, G. W. and R. M. Daniel (1985). "Rhizobial Denitrification: A review." Soil Biol. Biochem 17(1): 1-9. Oenema, O., L. van Liere and O. Schoumans (2005). "Effects of lowering nitrogen and phosphorus surpluses in
agriculture on the quality of groundwater and surface water in the Netherlands." Journal of Hydrology 304(1-4): 289-301.
Oerther, D. B., M. C. M. van Loosdrecht and L. Raskin (2002). "Quantifying the impact of wastewater micronutrient composition on in situ growth activity of Acinetobacter spp." Water Science & Technology 46(1-2): 443-447.
Oliva-Teles, A., J. P. Pereira, A. Gouveia and E. Gomes (1998). "Utilisation of diets supplemented with microbial phytase by seabass (Dicentrarchus labrax) juveniles." Aquatic Living Resources 11(4): 255-259.
Olive, P. J. W. (1999). "Polychaete aquaculture and polychaete science: a mutual synergism." Hydrobiologia 402: 175-183.
Oppong, D., V. M. King and J. A. Bowen (2003). "Isolation and characterization of filamentous bacteria from paper mill slimes." International Biodeterioration & Biodegradation 52(2): 53-62.
Oron, G. (1994). "Duckweed Culture for Waste-Water Renovation and Biomass Production." Agricultural Water Management 26(1-2): 27-40.
Pagand, P., J. P. Blancheton, J. Lemoalle and C. Casellas (2000). "The use of high rate algae ponds for the treatment of marine effluent from a recirculating fish rearing system." Aquaculture Research 31(11): 729-736.
Palleroni, N. J. (1999). Introduction to the Family Pseudomonadaceae The Prokaryotes: An Evolving Electronic Resource for the Microbiological Community. M. Dworkin, S. Falkow, E. Rosenberg, K.-H. Schleifer and E. Stackebrandt, Springer.
Pasveer, A. (1968). "Investigations on Control of Sphaerotilus Sludge." Water Research 2(1): 78-80. Payne, W. J. (1981). Denitrification. New York, USA, John Willey &Sons, Inc. Perera, W. M. K., C. G. Carter and D. F. Houlihan (1995). "Feed Consumption, Growth and Growth Efficiency of
Rainbow-Trout (Oncorhynchus mykiss (Walbaum)) Fed on Diets Containing a Bacterial Single-Cell Protein." British Journal of Nutrition 73(4): 591-603.
Petersen, S. O., A. M. Lind and S. G. Sommer (1998). "Nitrogen and organic matter losses during storage of cattle and pig manure." Journal of Agricultural Science 130: 69-79.
Pickering, T. D., M. E. Gordon and L. J. Tong (1993). "Effect of nutrient pulse concentration and frequency on growth of Gracilaria chilensis plants and levels of epiphytic algae." Journal of Applied Phycology 5(5): 525-533.
Picot, B., A. Bahlaoui, S. Moersidik, B. Baleux and J. Bontoux (1992). "Comparison of the Purifying Efficiency of High-Rate Algal Pond with Stabilization Pond." Water Science and Technology 25(12): 197-206.
Pirt, S. J. (1975). Principles of Microbe and Cell Cultivation. Oxford, Blackwell Science Publication. Poelman, E., N. De Pauw and B. Jeurissen (1997). "Potential of electrolytic flocculation for recovery of micro-algae."
Resources, Conservation and Recycling 19(1): 1-10. Pot, B., M. Gillis and J. de Ley (1999). The Genus Aquaspirilum The Prokaryotes: An Evolving Electronic Resource
for the Microbiological Community. M. Dworkin, S. Falkow, E. Rosenberg, K.-H. Schleifer and E. Stackebrandt, Springer.
Poznanski, S., W. Bednarski, J. Leman, J. Kowalewska and M. Mieczkowski (1983). "Microbial Enrichment of the liquid fraction of slurry." Agricultural Wastes 6: 77-89.
Quan, Z.-X., Y.-S. Jin, C.-R. Yin, J. J. Lee and S.-T. Lee (2005). "Hydrolyzed molasses as an external carbon source in biological nitrogen removal." Bioresource Technology 96(15): 1690-1695.
Rakocy, E. J. (1998). Integrating Hydroponic Plant Production with Recirculating System Aquaculture: Some Factors to Consider. Recirculating Aquaculture, Roanoke, Virginia, Virginia-Tech.
References
143
Rappert, S. and R. Mueller (2005). "Odor compounds in waste gas emissions from agricultural operations and food industries." Waste Management 25(9): 887-907.
Rebah, B. F., R. D. Tyagi and D. Prevost (2001). "Acid and alkaline treatments for enhancing the growth of rhizobias in sludge." Can. J. Microbiol. 47: 467-474.
Rectenwald, L. L. and R. W. Drenner (2000). "Nutrient removal from wastewater effluent using an ecological water treatment system." Environmental Science & Technology 34(3): 522-526.
Renaud, S. M., L.-V. Thinh, G. Lambrinidis and D. L. Parry (2002). "Effect of temperature on growth, chemical composition and fatty acid composition of tropical Australian microalgae grown in batch cultures." Aquaculture 211(1-4): 195-214.
Rice, T., D. H. Biuck, R. W. Gorden and P. P. Tazik (1984). "Microbial Pathogens and Human Parasites in an Animal Waste Polyculture System." Progressive Fish-Culturist 46(4): 230-238.
Richmond, A. (1986). Handbook of Microalgae Mass Culture. Boca Raton, Florida, CRC Press Inc. Riise, J. C. and N. Roose (1997). "Benthic metabolism and the effects of bioturbation in a fertilised polyculture fish
pond in northeast Thailand." Aquaculture 150: 45-62. Rittmann, B. E. and P. L. McCarty (2001). Environmental Biotechnology: Principles and Applications. New York,
McGraw-Hill. Rumsey, G. L., J. E. Kinsella, K. J. Shetty and S. G. Hughes (1991). "Effect of high dietary concentrations of brewer's
dried yeast on growth performance and liver uricase in rainbow trout (Oncorhynchus mykiss)." Animal Feed Science and Technology 33: 177-183.
Runcie, J. W., R. J. Ritchie and A. W. D. Larkum (2003). "Uptake kinetics and assimilation of inorganic nitrogen by Catenella nipae and Ulva lactuca." Aquatic Botany 76(2): 155-174.
Sadowsky, M. J. and P. H. Graham (2000). Root and Stem Nodule Bacteria of Legumes. The Prokaryotes: An Evolving Electronic Resource for the Microbiological Community. M. Dworkin, S. Falkow, E. Rosenberg, K.-H. Schleifer and E. Stackebrandt, Springer.
Sanguinetti, C. J., E. Dias Neto and A. J. G. Simpson (1994). "Rapid silver staining and recovery of PCR products separated on polyacrylamide gels." BioTechniques 17: 915-919.
Satoh, S., A. Hernandez, T. Tokoro, Y. Morishita, V. Kiron and T. Watanabe (2003). "Comparison of phosphorus retention efficiency between rainbow trout (Oncorhynchus mykiss) fed a commercial diet and a low fish meal based diet." Aquaculture 224(1-4): 271-282.
Schneider, O., A. K. Amirkolaie, J. Vera-Cartas, E. H. Eding, J. W. Schrama and J. A. J. Verreth (2004). "Digestibility, faeces recovery, and related C, N, and P balances of five feed ingredients evaluated as fishmeal alternatives in Oreochromis niloticus L." Aquaculture Research 35(14): 1370-1379.
Schneider, O. and E. H. Eding (2001). Paling- en meevalteelt in recirculatiesystemen. Gent. Schneider, O., V. Sereti, E. H. Eding and J. A. J. Verreth (submitted). "Molasses as C source for heterotrophic bacteria
production on solid fish waste." Aquaculture. Schneider, O., V. Sereti, E. H. Eding and J. A. J. Verreth (submitted). "TAN and nitrate yield similar heterotrophic
bacteria production on solid fish waste under practical RAS conditions." Bioresource Technology. Schneider, O., V. Sereti, E. H. Eding, J. A. J. Verreth and A. Klapwijk (submitted). "Kinetics, design and biomass
production of a bacteria reactor treating RAS effluent streams." Aquacultural Engineering. Schneider, O., V. Sereti, M. A. M. Machiels, E. H. Eding and J. A. J. Verreth (submitted). "Heterotrophic bacteria
production utilizing the drum filter effluent of a RAS: Influence of carbon supplementation and HRT." Water Research.
Schneider, O., V. Sereti, M. C. J. Verdegem, E. H. Eding and J. A. J. Verreth (2003). Production of Bacterial Single Cell Protein on Carbon Supplemented Fish Waste. Beyond Monoculture, Trondheim, Norway, EAS. 67-68.
Schonborn, W. (2003). "Defensive reactions of freshwater ecosystems against external influences." Limnologica - Ecology and Management of Inland Waters 33(3): 163-189.
Schuenhoff, A., M. Shpigel, I. Lupatsch, A. Ashkenazi, F. E. Msuya and A. Neori (2003). "A semi-recirculating, integrated system for the culture of fish and seaweed." Aquaculture 221(1-4): 167-181.
Schumann, P., X. Cui, E. Stackebrandt, R. M. Kroppenstedt, L. Xu and C. Jiang (2004). "Jonesia quinghaiensis sp. nov., a new member of the suborder Micrococcineae." Int J Syst Evol Microbiol 54(6): 2181-2184.
Shatz, Y. (2000). "Fishstat +." 2005. Sheldrick, W., J. K. Syers and J. Lingard (2003). "Contribution of livestock excreta to nutrient balances." Nutrient
Cycling in Agroecosystems 66(2): 119-131. Sheridan, B., T. Curran, V. Dodd and J. Colligan (2002). "SE--Structures and Environment: Biofiltration of Odour and
Ammonia from a Pig Unit--Biofiltration of Odour and Ammonia from a Pig Unit--a pilot-scale Study." Biosystems Engineering 82(4): 441-453.
Shnel, N., Y. Barak, T. Ezer, Z. Dafni and J. van Rijn (2002). "Design and performance of a zero-discharge tilapia recirculating system." Aquacultural Engineering 26(3): 191-203.
Shpigel, M. and A. Neori (1996). "The integrated culture of seaweed, abalone, fish and clams in modular intensive land-based systems .1. Proportions of size and projected revenues." Aquacultural Engineering 15(5): 313-326.
Shpigel, M., A. Neori, D. M. Popper and H. Gordin (1993). "A proposed model for "environmentally clean" land-based culture of fish, bivalves and seaweeds." Aquaculture 117(1-2): 115-128.
References
144
Shuler, M. L. (2001). Bioprocess Engineering: Basic Concepts. USA, Prentice Hall PTR. Singleton, P. W., S. A. El Swaify and B. B. Bohlool (1982). "Effect of Salinity on Rhizobium Growth and Survival "
Appl Environ Microbiol 44(4): 884-890. Skillicorn, P., W. Spira and W. Journey (1993). "Duckweed Aquaculture: A new aquatic farming system for
developing countries." 77. Smith, M. D. and I. Moelyowati (2001). "Duckweed based wastewater treatment (DWWT): design guidelines for hot
climates." Water Science and Technology 43(11): 291-299. Snell-Castro, R., J. J. Godon, J. P. Delgenes and P. Dabert (2005). "Characterisation of the microbial diversity in a pig
manure storage pit using small subunit rDNA sequence analysis." Fems Microbiology Ecology 52(2): 229-242.
Spring, S. (2002). The Genera Leptothrix and Sphaerotilus The Prokaryotes: An Evolving Electronic Resource for the Microbiological Community. M. Dworkin, S. Falkow, E. Rosenberg, K.-H. Schleifer and E. Stackebrandt, Springer.
Storebakken, T., I. S. Kvien, K. D. Shearer, B. Grisdale-Helland, S. J. Helland and G. M. Berge (1998). "The apparent digestibility of diets containing fish meal, soybean meal or bacterial meal fed to Atlantic salmon (Salmo salar): evaluation of different faecal collection methods." Aquaculture 169(3-4): 195-210.
Stromme, M., A. Mihranyan and R. Ek (2002). "What to do with all these algae?" Material Letters 57: 569-572. Sugiura, S. H., F. M. Dong, C. K. Rathbone and R. W. Hardy (1998). "Apparent protein digestibility and mineral
availabilities in various feed ingredients for salmonid feeds." Aquaculture 159(3-4): 177-202. Summerfelt, S. T. (2001). Controlled Systems: Water Reuse and Recirculation. Fish Hatchery Managment. G.
Wedemeyer. Bethesda, MD, American FIsheries Society: 285-395. Tacon, A. G. J. (1979). The use of activated sludge - single cell protein (ASCP), derived from the treatment of
domestic sewage in trout diets. Proc. World Symp. on Finfish Nutrition and Fishfeed Technology, Berlin, Germany, Hennemen Verlags Gesellschaft. 249-267.
Tacon, A. G. J. (1990). The Essential Nutrients. Safat, Kuwait, Argent Laboratories Press. Tacon, A. G. J., J. J. Cody, L. D. Conquest, S. Divakaran, I. P. Forster and O. E. Decamp (2002). "Effect of culture
system on the nutrition and growth performance of Pacific white shrimp Litopenaeus vannamei (Boone) fed different diets." Aquaculture Nutrition 8(2): 121-137.
Tal, Y., J. E. M. Watts, S. B. Schreier, K. R. Sowers and H. J. Schreier (2003). "Characterization of the microbial community and nitrogen transformation processes associated with moving bed bioreactors in a closed recirculated mariculture system." Aquaculture 215(1-4): 187-202.
Tamminga, S. (2003). "Pollution due to nutrient losses and its control in European animal production." Livestock Production Science 84(2): 101-111.
Tan, B., K. Mai and Z. Luiufu (2001). "Response of juvenile abalone, Haliotis discus hannai, to dietary calcium, phosphorus and calcium/phosphorus ratio." Aquaculture 198(1-2): 141-158.
Tanaka, R., M. Ootsubo, T. Sawabe, Y. Ezura and K. Tajima (2004). "Biodiversity and in situ abundance of gut microflora of abalone (Haliotis discus hannai) determined by culture-independent techniques." Aquaculture 241(1-4): 453-463.
Tchobanoglous, G., F. L. Burton and H. D. Stensel (2003). Wastewater Engineering Treatment and Reuse. Boston, McGraw-HIll.
Thomsen, T. R., J. L. Nielsen, N. B. Ramsing and P. H. Nielsen (2004). "Micromanipulation and further identification of FISH-labelled microcolonies of a dominant denitrifying bacterium in activated sludge." Environmental Microbiology 6(5): 470-479.
Tijhuis, L., M. van Loosdrecht and J. J. Heijnen (1993). "A thermodynamically based correlation for maintenance Gibbs energy requierments in aerobic and anaerobic chemotrophic growth." Biotechnology and Bioengineering 42: 509-519.
Tijhuis, L., M. C. M. Vanloosdrecht and J. J. Heijnen (1994). "Formation and Growth of Heterotrophic Aerobic Biofilms on Small Suspended Particles in Airlift Reactors." Biotechnology and Bioengineering 44(5): 595-608.
Timmons, M. B., J. M. Ebeling, F. W. Wheaton, S. T. Summerfelt and B. J. Vinci (2001). Recirculating Aquaculture Systems. Ithaca, NY, USA, Cayuga Aqua Ventures.
Troell, M., P. Roennbaeck, C. Halling, N. Kautsky and A. H. Buschmann (1999). "Ecological engineering in aquaculture: the use of seaweeds for removing nutrients from intensive mariculture." Journal of Applied Phycology 11: 89-97.
Turker, H., A. G. Eversole and D. E. Brune (2003). "Filtration of green algae and cyanobacteria by Nile tilapia, Oreochromis niloticus, in the Partitioned Aquaculture System." Aquaculture 215(1-4): 93-101.
Ugalde, U. O. and J. I. Castrillo (2002). Single Cell Proteins from Fungi and Yeasts. Agriculture and Food Production. D. K. Arora and G. G. Khachatourians. Amsterdam, The Netherlands, Elsevier. 2: 360.
Urdaci, M. C., C. Chakroun, D. Faure and J.-F. Bernardet (1998). "Development of a polymerase chain reaction assay for identification and detection of the fish pathogen Flavobacterium psychrophilum." Research in Microbiology 149(7): 519-530.
van Dam, A. A. and F. W. T. Penning de Vries (1995). "Parameterization and calibration of a model to simulate effects of feeding level and feed composition on growth of Oreochromis niloticus (l.) and Oncorhynchus mykiss (Walbaum)." Aquaculture Research 26: 415-425.
References
145
van der Steen, N. P., A. Brenner and G. Oron (1998). "An integrated duckweed and algae pond system for nitrogen removal and renovation." Water Science and Technology 38(1): 335-343.
van der Westhuizen, T. H. and W. A. Pretorius (1996). "Production of valuable products from organic waste streams." Water Science and Technology 33(8): 31-38.
van Rijn, J. and N. Shnel (2001). Tilapia Recirculating systems: Design and Performance of a Zero-Discharge System. AES Special Session: International Recirculating Systems, Orlando, Florida, USA, Aquaculture Engineering Society.
van Rijn, J., Y. Tal and H. J. Schreier (in press). "Denitrification in recirculating systems: Theory and applications." Aquacultural Engineering in press.
van Weerd, J. H., K. A. Khalaf, F. J. Aartsen and P. A. T. Tijssen (1999). "Balance trials with African catfish Clarias gariepinus fed phytase-treated soybean meal-based diets." Aquaculture Nutrition 5(2): 135-142.
Velasco, M. (2000). "Recirculating and Static Shrimp Culture Systems." The Global Aquaculture Advocat 3(3): 60-61. Ventura, M. R., J. I. R. Castanon and J. M. McNab (1994). "Nutritional-Value of Seaweed (Ulva rigida) for Poultry."
Animal Feed Science and Technology 49(1-2): 87-92. Verdegem, M. C. J., R. Bosma and J. A. J. Verreth (2006). "Reducing water use for animal production through
aquaculture." Water Resources Development 22(1): 101-113. Verdegem, M. C. J., E. H. Eding, J. M. van Rooij and J. A. J. Verreth (1999). "Comparison of Effluents from Pond and
Recirculating Production Systems receiving Formulated Diets." World Aquaculture 30(4): 28-36. Verdegem, S. C. J., A. A. Dam van, A. A. Cabarcas-Nunez and L. Opera (2000). Bio-energetic modeling of growth
and waste production of Nile Tilapia (Orechromis niloticus L.) in recirculation systems. Tilapia Aquaculture in the 21st century. 5th International Symposium on Tilapia in Aquaculture, Rio de Janeiro, Brazil.
Voltolina, D., B. Cordero, M. V. Nieves and L. P. Soto (1999). "Growth of Scenedesmus sp. in artificial wastewater." Bioresource Technology 68(3): 265-268.
Vriens, L., R. Nihoul and H. Verachtert (1989). "Activated Sludges as Animal Feed: A Review." Biological Wastes 27: 161-207.
Wagner, M. and A. Loy (2002). "Bacterial community composition and function in sewage treatment systems." Current Opinion in Biotechnology 13(3): 218-227.
Waller, U., A. Bischoff, J. Orellana, M. Sander and B. Wecker (2003). An advanced technology for clear water aquaculture recirculation systems: Results from a pilot producion of sea bass and hints towards "Zero discharge". Beyond Monoculture, Trondheim, Norway, EAS. 356-357.
Wang, J. K. (2003). "Conceptual design of a microalgae-based recirculating oyster and shrimp system." Aquacultural Engineering 28(1-2): 37-46.
Weber, H., Ed. (1997). Woerterbuch der Mikrobiologie. Jena, Fischer Verlag. Wedge, R. M. and J. E. Burris (1982). "Effects of light and temperature on duckweed photosynthesis." Aquatic Botany
13: 133-140. Westers, H. (2000). A fourteen-year dispute about phosphorous effluent contribution and its impact on Platte Lake.
Recirculating Aquaculture, Roanoke, Virginia, Virginia-Tech. Willems, A. and P. de Vos (2002). Comamonas. The Prokaryotes: An Evolving Electronic Resource for the
Microbiological Community. M. Dworkin, S. Falkow, E. Rosenberg, K.-H. Schleifer and E. Stackebrandt, Springer.
Wuebbles, D. J. and K. Hayhoe (2002). "Atmospheric methane and global change." Earth-Science Reviews 57(3-4): 177-210.
Zahn, J. A., J. L. Hatfield, D. A. Laird, T. T. Hart, Y. S. Do and A. A. DiSpirito (2001). "Functional Classification of Swine Manure Management Systems Based on Effluent and Gas Emission Characteristics." J Environ Qual 30(2): 635-647.
146
Summary
Just as all other types of animal production, aquaculture produces waste. This waste
can be managed outside the production system, comparable to terrestrial husbandry systems.
However, particularly recirculation aquaculture systems (RAS) are suited to manage waste
within the system. In this case, processes have to be selected to convert the waste into a re-
usable product. Dissolved and solid waste conversion by heterotrophic bacteria is one of these
processes. In the present study, the potential of the latter process was investigated. An
operational scheme was followed, which contained five steps: (1) to evaluate nutrient flows in
integrated aquaculture systems, (2) to select and to investigate a conversion process, (3) to
improve the process and analyze its sensitivity, (4) to evaluate the product suitability, (5) to
derive the kinetics, reactor design, and to determine the integration possibilities into RAS.
In chapter 2 nutrient flows, conversions and waste management were evaluated, which
are taking place in integrated intensive aquaculture systems. In these systems, fish is cultured
next to other organisms, which are converting nutrients, which would be otherwise
discharged. These conversions were evaluated based on nitrogen (N) and phosphorous (P)
balances using a mass balance approach. In the reviewed examples, fish culture alone retained
20-50% feed N and 15-65% feed P. The combination of fish culture with phototrophic
conversion increased nutrient retention of feed N by 15-50% and of feed P by up to 53%. If in
addition herbivore consumption was included, then the gained nutrient retention decreased by
60-85% feed N and 50-90% feed P. The conversion of nutrients into bacteria and detrivorous
worm biomass contributed only to a smaller extent (e.g. 7% feed N and 6% feed P and 0.06%
feed N 0.03x10⁻³% feed P, respectively). All integrated modules had their specific limitations,
which were related to uptake kinetics, nutrient preference, unwanted conversion processes and
abiotic factors and implications.
Chapters 3 to 5 focused on the experimental production of heterotrophic bacteria
biomass on carbon (C) supplemented fish waste under different operational conditions. The
results covered step two and three in the operational scheme.
In chapter 3, the drum filter effluent from a RAS was used as substrate to produce
heterotrophic bacteria in suspended growth reactors. Effects of organic C supplementation (0,
0.9, 1.7, 2.5gC/l as sodium acetate) and of hydraulic retention times (HRT: 11-1h) on bacteria
biomass production and nutrient conversion were investigated. Bacteria production, expressed
Summary
147
as VSS (volatile suspended solids) was enhanced by organic C supplementation, resulting in a
production of 55-125gVSS/kg fish feed (0.2-0.5gVSS/gC). Maximum observed crude protein
production was ~100g protein/kg fish feed. The metabolic maintenance costs were
0.08Cmol/Cmol h-1, and the maximum growth rate was 0.25-0.5h-1. Approximately, 90% of
the inorganic nitrogen and 80% of ortho-phosphate-phosphorus were converted.
The influence of nitrogenous waste on bacteria yields was investigated in chapter 4. RAS
effluents are rich in nitrate and low in total ammonia nitrogen (TAN). This might result in
20% lower bacteria yields, because nitrate conversion into bacteria is less energy efficient
than TAN conversion. In this chapter, the influence of TAN concentrations (1, 12, 98, 193,
257mgTAN/l) and stable nitrate-N concentrations (174±29mg/l) on bacteria yields and N
conversions was investigated in a RAS under practical conditions. The effluent slurry was
supplemented with 1.7gC/l sodium acetate, due to C deficiency, and was converted
continuously in a suspended bacteria growth reactor (6h HRT). TAN utilization did not result
in different yields compared to those for nitrate (0.24-0.32gVSS/gC, p=0.763). However,
TAN was preferred compared to nitrate and was converted to nearly 100%, independently of
TAN concentrations. TAN and nitrate conversion rates differed significantly for increasing
TAN levels (p<0.000 and p=0.012), and were negatively correlated. It seems, therefore,
equally possible to supply the nitrogenous substrate for bacteria conversion as nitrate or as
TAN. Because in RAS, nitrate is the predominant N form in the waste, the bacteria reactor
can safely be integrated into an existing RAS as end of pipe treatment.
In chapter 5, sodium acetate, which was used in chapter 3 and 4 was replaced by
molasses as organic C supplement. The effect of molasses as alternative C source on bacteria
productions and yields was investigated. One bacteria reactor (3.5 l) was connected to the
drum filter (filter mesh size 60µm) outlet of a recirculation system in a continuous flow
(HRT: 6h). The different supplementation levels of molasses were 0.0, 3.2, 5.8, 7.8, 9.7gC/l/d.
For the maximum flux, the VSS and crude protein production were about 168gVSS and 95g
crude protein per kg feed. The maximum conversion of nitrate and ortho-phosphate was 24g
NO3-N and 4gP/kg feed, a conversion of 90% of the inorganic nitrogenous waste and 98% of
the ortho-phosphate-P. Furthermore the maximum substrate removal rate and the half
saturation constant (Ks) were determined (1.62gC/l/h and 0.097gC/l respectively). The
maximum specific removal rate was 0.31gC/gVSS/h and the related Ks was 0.008gC/l. The
observed growth rate reached a maximum for C fluxes higher than 8g/l/d.
Chapter 6 and 7 were focusing on the fourth step of the operational scheme (product
evaluation and determination of re-use potential).
Summary
148
Because the produced bacteria biomass might contain pathogens, which could reduce
its suitability as feed, it was important to characterize the obtained bacteria communities
under different conditions (chapter 3 to 5, reported in chapter 6). The operation conditions
were: 7h hydraulic retention time versus 2h, sodium acetate versus molasses (organic C
supplement), and ammonia versus nitrate (N donor). Samples were analyzed by standard
biochemical tests, by 16sRNA ribotyping and ribosomal RNA gene-targeted PCR-DGGE
fingerprinting combined with clone library analysis. The community of the drum filter
effluent was different from the communities found in the bacteria reactors. However, all
major community components were present in both the drum filter effluent and reactor broths.
HRTs (7h versus 2h) influenced bacteria community resulting in a more abundant fraction of
alpha proteobacterium Bioluz/ Acinetobacter at 2h HRT compared to 7h HRT (Rhizobium/
Mezorhizobium). The use of molasses instead of sodium acetate changed the bacteria
community from Rhizobium/ Mesorhizobium to Aquaspirillum as major component.
Providing TAN in addition to nitrate as nitrogenous substrate led to the occurrence of bacteria
close to Sphaerotilus, Sphingobacterium and Jonesia. From those results, it was concluded
that 6-7h HRT is recommended, and that the type of substrate (sodium acetate or molasses,
TAN or nitrate) is less important, and results in communities with a comparable low
pathogenic risk.
In chapter 7, the produced bacteria biomass was fed to shrimps (Litopenaeus
vannamei). In total three different diets were used in a variance of a T-maze test: a
commercial shrimp feed, the bacteria biomass, which was produced in the suspended growth
reactors on C supplemented fish waste under conditions, comparable to those reported in
chapter 3, and slurry, which was anaerobically produced in a denitrification reactor. If the
bacteria products would be attractive as diet, the nutrient retention of the RAS would be
improved, resulting in a system, combining fish, bacteria and shrimp. The diet preference was
interpreted as an expression of diet attractiveness. As a first result, shrimp were moving from
an equal distribution before feeding (+/-50%, -2min), towards the feeding places (>50%, 2, 5,
and 10 minutes after feeding). It was, therefore, inferred, that all bacteria biomass and
commercial feed combinations were basically attractive for the shrimp. This response was not
instantaneous. After feeding (2min) more than 80% of the shrimp were present at the feeding
places and showed a significant preference for the commercial feed compared to the
aerobically produced bacteria slurry. For the other diet combinations no significant
differences could be detected for 2min. For 5 and 10min after feeding, shrimp behavior
changed from the commercial feed to the aerobically and anaerobically produced bacteria
Summary
149
biomass segments. From this study it was concluded that although the commercial diet was
preferred above the aerobic slurry, the bacteria slurries had also attracted the shrimps. There
was no unambiguous conclusion to be made regarding the preference for aerobic or anaerobic
produced slurry.
In chapter 8, the design of a suspended bacteria growth reactor integrated in a 100MT
African catfish farm was determined. This study integrated results from the earlier chapters to
calculate the bacteria kinetics (yield=0.537gVSS/gC; endogenous decay coefficient=0.033h-1;
maximum specific growth rate=0.217h-1; half-velocity constant=0.025g/l; and maximum rate
of substrate utilization=0.404gC/gVSS*h). As part of the study a model was developed and
validated. This model was used to calculate the VSS production and nutrient conversion by
heterotrophic bacteria conversion for a 100MT African catfish farm. The VSS production was
187gVSS/kg feed and the inorganic nutrients (N and P) were removed with an efficiency of
85 and 95% for a C supplementation level of 3.5gC/l (455gC/kg feed). A reactor integrated in
a 100MT farming facility would have a volume of 11m3, based on a minimum HRT of 6h.
The production and potential re-use of heterotrophic bacteria biomass is, therefore, a
prospective tool to lower nutrient discharge and to increase nutrient retention and
sustainability of RAS in the future.
150
Samenvatting
Vergelijkbaar met alle andere typen van dierlijke produktie, produceert aquacultuur
afval. Dit afval kan buiten het produktiesysteem behandeld worden, zoals bij houderij-
systemen op het land. Recirculatie aquacultuur systemen (RAS) zijn echter bij uitstek geschikt
om afval in het systeem zelf te behandelen. In dit geval zullen processen aangewend moeten
worden om het afval om te zetten in een produkt dat opnieuw gebruikt kan worden. De
omzetting van opgelost en vast afval door heterotrofe bacteriën is één van deze processen. In
dit proefschrift is de potentie van dit laatstgenoemde proces onderzocht. Een operationeel
schema is gevolgd, bestaande uit vijf stappen: (1) het evalueren van nutriëntenstromen in
geïntegreerde aquacultuursystemen, (2) het kiezen en onderzoeken van een omzettingsproces,
(3) het proces verbeteren en de gevoeligheid ervan analyseren, (4) de geschiktheid van het
produkt evalueren, (5) het afleiden van de kinetiek, reaktor ontwerp, en de mogelijkheden
bepalen voor integratie in het RAS.
In hoofdstuk 2 zijn nutriëntenstromen, omzettingen en afval-management geëvalueerd
die plaatsvinden in geïntegreerde intensieve aquacultuursystemen. In deze systemen wordt vis
gekweekt naast andere organismen die nutriënten omzetten die anders afgevoerd zouden
worden. Deze omzettingen zijn geëvalueerd op basis van stikstof (N) en fosfor (P) balansen,
daarbij gebruikmakend van een massa balans benadering. In de bekeken voorbeelden werd
door viskweek alléén 20-50% voer-N en 15-65% voer-P behouden. De combinatie van
viskweek met fototrofe omzetting verhoogde het behoud van nutriënten van voer-N met 15-
50% en van voer-P tot 53%. Als hier nog herbivore consumptie aan werd toegevoegd, daalde
het toegenomen nutriëntenbehoud met 60-85% voer-N en 50-90% voer-P. De omzetting van
nutriënten in bacteriën en detrivore worm-biomassa droeg in mindere mate bij (bijv. 7% voer-
N en 6% voer-P en 0.06% voer-N en 0.03*10-3% voer-P, respectievelijk). Alle geïntegreerde
modules hadden hun specifieke beperkingen die gerelateerd waren aan opname kinetiek,
voorkeur voor nutriënten, ongewilde omzettingsprocessen en abiotische factoren en
implicaties.
Hoofdstukken 3 tot 6 gingen nader in op de experimentele produktie van heterotrofe
bacteriële biomassa op koolstof (C)-gesupplementeerd visafval onder verschillende
operationele condities. De resultaten zijn gerelateerd aan stappen twee en drie van het
operationele schema.
Samenvatting
151
In hoofdstuk 3 is het effluent van het drum filter van een RAS gebruikt als substraat
om in suspensie zijnde heterotrofe bacteriën in groei-reaktoren te produceren. De effekten van
organische C toevoeging (0, 0.9, 1.7, 2.5g C/l als natriumacetaat) en van hydraulische
retentietijden (HRT: 11-1h) op bacteriële biomassa produktie en nutriënten omzetting zijn
onderzocht. Bacteriële produktie, uitgedrukt als VSS (vluchtige opgeloste vaste stof) was
verhoogd door organische C toevoeging, resulterend in een produktie van 55-125g VSS/kg
visvoer (0.2-0.5g VSS/g C). De maximale waargenomen ruwe eiwit produktie was ongeveer
100g eiwit per kg visvoer. De metabolische onderhoudskosten waren 0.08Cmol/Cmol h-1, en
de maximale groei snelheid was 0.25-0.5h-1. Ongeveer 90% van het inorganische stikstof en
80% ortho-fosfaat-fosfor waren omgezet.
De invloed van stikstofhoudend afval op de opbrengst van bacteriën is onderzocht in
hoofdstuk 4. Effluent van RAS is rijk aan nitraat en arm aan totaal ammonia stikstof (TAN).
Dit kan resulteren in 20% lagere bacterie-opbrengst, omdat omzetting van nitraat in bacteriën
energetisch minder efficiënt is dan TAN-omzetting. In dit hoofdstuk zijn invloeden van TAN
concentraties (1, 12, 98, 193, 257 mg TAN/l) en stabiele nitraat-N concentraties (174±29
mg/l) op bacterie-opbrengsten en N-omzettingen onderzocht in een RAS onder
praktijkomstandigheden. De effluent smurrie was aangevuld met 1.7g C/l natriumacetaat,
vanwege C-deficiëntie, en werd continu omgezet in een groei reaktor met bacteriën in
suspensie (6h HRT). Vergeleken met nitraat leidde verbruik van TAN niet tot verschillende
opbrengsten (0.24-0.32gVSS/g C, p=0.763). Echter, TAN werd verkozen boven nitraat en
werd bijna 100% omgezet, onafhankelijk van TAN concentraties. De omzettingssnelheden
van TAN en nitraat verschilden significant bij toenemende TAN concentraties (p<0.000 en
p=0.012) en waren negatief gecorreleerd. Het lijkt daarom evengoed mogelijk om het
stikstofhoudend substraat voor bacterie-omzetting als nitraat of als TAN toe te voegen.
Aangezien nitraat de voornaamste N-bron in afval van RAS is, kan de bacterie-reaktor prima
in een bestaande RAS worden geïntegreerd als het einde van de behandelingsstap.
In hoofdstuk 5 is natriumacetaat, dat gebruikt is in hoofdstukken 3 en 4, vervangen
door melasse as organisch C supplement. Het effect van melasse als alternatieve C-bron op
bacteriële produktie en opbrengst is onderzocht. Een bacterie-reaktor (3.5l) was verbonden
met het afvoerkanaal van een drum filter (filter maaswijdte 60 �m) van een
recirculatiesysteem in een continue stroom (HRT: 6h). De verschillende toegevoegde melasse
concentraties waren 0.0, 3.2, 5.8, 7.8, 9.7g C/l/d. Voor de maximale flux waren de VSS en
ruwe eiwit produktie ongeveer 168g VSS en 95g ruw eiwit per kg voer. De maximale
omzetting van nitraat en ortho-fosfaat was 24g NO3-N en 4g P/kg voer, i.e. een omzetting van
Samenvatting
152
90% van het inorganische stikstofhoudende afval en 98% van het ortho-fosfaat-P. Verder zijn
de maximale snelheid van substraatverwijdering en de half-verzadigingsconstante (Ks)
bepaald (1.62g C/l/h en 0.097g C/l, respectievelijk). De maximale specifieke
verwijderingssnelheid was 0.31g C/g VSS/h en de gerelateerde Ks was 0.008g C/l. De
waargenomen groeisnelheid bereikte een maximum voor C-fluxen hoger dan 8g/l/d.
Hoofdstukken 6 en 7 gingen nader in op de vierde stap van het operationele schema
(produkt evaluatie en bepaling van het hergebruik potentieel).
Aangezien de geproduceerde bacteriële biomassa ziekteverwekkers kan bevatten die
de geschiktheid als voer kunnen verminderen, is het belangrijk om de verkregen
bacteriepopulaties onder verschillende omstandigheden te karakteriseren (hoofdstuk 3 tot 5,
weergegeven in hoofdstuk 6). De operationele condities waren: 7h hydraulische retentietijd
versus 2h, natriumacetaat versus melasse (organisch C supplement), en ammonia versus
nitraat (N donor). Monsters zijn geanalyseerd door standaard biochemische testen, met behulp
van 16sRNA ribotyping en ribosomaal RNA gene-targeted PCR-DGGE fingerprinting
gecombineerd met clone library analysis. De populatie van het drum filter-effluent verschilde
van de populaties in de bacterie-reaktors. Echter, alle belangrijke populatie-componenten
waren aanwezig in het drum filter effluent en reaktor soep. HRTs (7h versus 2h) beïnvloedden
de bacteriepopulatie, resulterend in een toegenomen fractie van alpha proteobacterium Bioluz/
Acinetobacter bij 2h HRT vergeleken met 7h HRT (Rhizobium/Mezorhizobium). Het gebruik
van melasse in plaats van natriumacetaat veranderde de bacteriepopulatie van
Rhizobium/Mezorhizobium naar Aquaspirillum als belangrijkste component. Het toevoegen
van TAN bovenop nitraat als stikstofhoudend substraat leidde tot bacteriën gerelateerd aan
Sphaerotilus, Sphingobacterium en Jonesia. Naar aanleiding van deze resultaten is
geconcludeerd dat 6-7h HRT wordt aangeraden en dat het type substraat (natriumacetaat of
melasse, TAN of nitraat) minder belangrijk is en resulteert in populaties met een vergelijkbaar
laag risico op ziekteverwekking.
In hoofdstuk 7 is de geproduceerde bacteriële biomassa gevoerd aan garnalen
(Litopenaeus vannamei). Drie verschillende voeders zijn gebruikt in een variatie op de T-
maze test: een commercieel garnalen voer, de bacteriële biomassa geproduceerd in de groei-
reaktoren op C-toegevoegd visafval onder omstandigheden vergelijkbaar als in hoofdstuk 3,
en anaëroob geproduceerde smurrie in een denitrificatie reaktor. Indien de bacterie-produkten
aantrekkelijk zouden zijn als voer, zal de nutriënten retentie van het RAS verbeterd zijn,
resulterend in een systeem dat vis, bacteriën en garnalen combineert. De voorkeur voor voer
was uitgelegd als een maat voor aantrekkelijkheid van het voer. Als eerste resultaat bewogen
Samenvatting
153
de garnalen zich vanuit een gelijke verdeling vóór het voeren (+/-50%, -2 min) naar de
voerplaatsen (>50%, 2, 5, en 10 minuten na voeren). Hieruit werd geconcludeerd dat alle
combinaties van bacteriële biomassa en commerciële voeders aantrekkelijk waren voor de
garnaal. Deze respons was niet onmiddellijk te zien. Na het voeren (2 minuten) was meer dan
80% van de garnalen aanwezig bij de voerplaatsen en lieten een significante voorkeur zien
voor het commerciële voer vergeleken met de aëroob geproduceerde bacteriële smurrie. Voor
de andere voercombinaties werden geen significante verschillen waargenomen gedurende 2
minuten. Bij 5 en 10 minuten na het voeren veranderde het gedrag van de garnalen op het
commerciële voer naar de aëroob en anaëroob geproduceerde bacteriële biomassa segmenten.
Uit dit experiment werd geconcludeerd dat ondanks het feit dat het commerciële voer
verkozen werd boven de aërobe smurrie, de bacteriële smurries ook aantrekkelijk waren voor
de garnalen. Er kon niets geconcludeerd worden met betrekking tot de voorkeur voor aëroob
of anaëroob geproduceerde smurrie.
In hoofdstuk 8 is het ontwerp van een groei reaktor met bacteriën in suspensie
geïntegreerd in een 100MT Afrikaanse meerval kwekerij bepaald. Deze studie gebruikte
resultaten van eerdere hoofdstukken om de bacteriële kinetiek te berekenen
(opbrengst=0.537g VSS/g C; endogene decay coefficiënt=0.033h-1; maximale specifiek
groeisnelheid=0.217h-1; halve-snelheidsconstante=0.025g/l; en maximale snelheid van
substraatverbruik=0.404g C/g VSS*h). Als onderdeel van deze studie is een model
ontwikkeld en gevalideerd. Dit model is gebruikt om de VSS produktie en de omzetting van
nutriënten door heterotrofe bacteriën te voorspellen voor een 100MT Afrikaanse meerval
kwekerij. De VSS produktie was 187g VSS/kg voer en de inorganische nutriënten (N en P)
werden verwijderd met een efficiëntie van 85 en 95% bij een C-supplementatie concentratie
van 3.5g C/l (455g C/kg voer). Een reaktor die geïntegreerd is een 100MT kwekerij zou een
volume hebben van 11 m3, gebaseerd op een minimum HRT van 6 uur.
De produktie en potentieel hergebruik van heterotrofe bacteriële biomassa is daarom
een te verwachten middel om de nutriënten uitstoot te verlagen en het behoud van nutriënten
en duurzaamheid van RAS voor de toekomst te verhogen.
154
Acknowledgements
It would have been impossible to begin and to finish this thesis without the help and
friendship of big number of people. I am grateful to my supervisors: Prof. Dr. Johan Verreth,
Ing. Ep Eding, Dr. Vicky Sereti and Dr. Marcel Machiels for their help, their time and their
support during the last years. Ep, especially many thanks to you! I will always remember our
discussions lasting sometimes up to five in the morning. Your advices and your helpfulness
make you a unique person.
I would like to thank all my colleagues and friends at the department, which I could
meet during the last five years: my room mates (Titu, Miriam and Beatriz), and all my fellow
colleagues and friends in the AFI group and at ZODIAC, which were always there for me:
Rodrigo, Pablo, Samad, Mohammed-Ali, Catarina, Paula, Marc, Neil, Iyob, Yonas, Harrison,
An, Patricia, Goncalo, Hanh, Hans, Karin, Rob, Bernado, Sander, Pascal, Ana, Ajay, Ekram,
Nanh, Marc, Ronald, Johan, Roel, Leo, Paul, Geertje, Bram, Jascha (Many thanks for the
Dutch translation!!), Anne, Hans, Helene, Gerrie, Netty, and Lies. It was a pleasure to work,
discuss and celebrate with you.
There are some special people, without their support this thesis would have remained
nothing but fiction: Many thanks for all their help to the AFI staff Menno, Ronald, Tino and
Rolf, to the ANU staff Saskia, Dick, and Huug, to Hetty from ATO, Sietze, Wian, Truus,
Sander and Aart from the hatchery, to Eric, Olaf, Evert and Hans from the workshops, to
Marianne from the library, to Gab and Marianne from WIAS, Peter from Repro and to Chris,
Gerald and Jeroen from IT. Furthermore there are some people that had always an open ear
for me, if I needed to discuss and was seeking information and advice. Many thanks,
therefore, to Wiebe Koops, Martin Verstegen, Thomas van der Poel, Bram Klapwijk, Eddy
Bokkers, Olga Haenen, Hauke Smidt, Mariana Chabrillon-Popelka, Jaap van Rijn, Yoram
Avnimelech and Raul Piedrahita.
Special thanks go the European Union for funding the ZAFIRA project, in which
frame my research was conducted, especially to Dr. Cornelia Nauen. Furthermore many
thanks to the whole project team (Amos Tandler, Michal Ucko, Ingrid Lupatsch, Noam
Mozes, Uwe Waller, Jaime Orellana, Wang Ji-Qiao, Liu Chang-Fa, Xue-Jun He, Si-fa Li) for
your cooperation, for a really good time and for unique impressions during my travels to you.
Acknowledgements
155
I am grateful for the contribution of five students, which I could supervise during my
research: Jordi Vera, Tuan Le Cong, Likang Deng, Adrian Bischoff, João Carvalho and Job
Munten.
Bobby Unser said once: “Success is where preparation and opportunity meet.”. I have
to thank my mentors Prof. Dr. Dr. h.c. mult. Harald Rosenthal, Prof. Dr. Hans Uhlarz, Prof.
Dr. Rainer Kollmann and Dr. Karl-Ronald Otto which did both: prepared me and gave me the
opportunity to walk my way.
But life would have been incomplete without my friends outside the workgroup:
Oliver, Arne, Liesbeth, Piter, Vincent, Eelco, Erik-Jan, Ana, Maaike, Lotte, Nienke, Juan,
Sebastien, Andreas, Margriet, Maarten, Kirsten, Maaike, Ulrich, and of course my volleyball
team mates.
This thesis is dedicated to my parents. Many thanks to you for the trust in my
decisions, the support, and for being my safe harbor when waves were pounding!
Ainhoa, my love, I do not know, how to thank you for your support and love during
the last years. You have been my sunshine, when the days were grey and my shade, when the
sun shined too much on my forehead. A big kiss!
Many thanks to all of you!
156
List of Publications
Peer-Reviewed Papers Schneider, O., A. K. Amirkolaie, J. Vera-Cartas, E. H. Eding, J. W. Schrama and J. A. J.
Verreth (2004). "Digestibility, faeces recovery, and related C, N, and P balances of five feed ingredients evaluated as fishmeal alternatives in Oreochromis niloticus L." Aquaculture Research 35(14): 1370-1379.
Schneider, O., V. Sereti, E. H. Eding and J. A. J. Verreth (2004). "Analysis of nutrient flows in integrated intensive aquaculture systems." Aquacultural Engineering 32(3/4): 379-401.
Schneider, O., T. L. Cong, V. Sereti, J. W. Schrama, E. H. Eding and J. A. J. Verreth (2006). "Bacteria or commercial diet: The preferences of Litopenaeus vannamei." Aquaculture Research 37: 204-207.
Schneider, O., M. Chabrillon-Popelka, H. Smidt, O. Haenen, V. Sereti, E. H. Eding and J. A. J. Verreth (submitted). "HRT and nutrients affect bacterial communities grown on Recirculation Aquaculture System effluents." FEMS Microbial Ecology.
Schneider, O., V. Sereti, E. H. Eding and J. A. J. Verreth (submitted). "TAN and nitrate yield similar heterotrophic bacteria production on solid fish waste under practical RAS conditions." Bioresource Technology.
Schneider, O., V. Sereti, E. H. Eding and J. A. J. Verreth (submitted). "Molasses as C source for heterotrophic bacteria production on solid fish waste." Aquaculture.
Schneider, O., V. Sereti, A. Klapwijk, E. H. Eding and J. A. J. Verreth (submitted). "Kinetics, design and biomass production of a bacteria reactor treating RAS effluent streams." Aquacultural Engineering.
Schneider, O., V. Sereti, M. A. M. Machiels, E. H. Eding and J. A. J. Verreth (submitted). "Heterotrophic bacteria production utilizing the drum filter effluent of a RAS: Influence of carbon supplementation and HRT." Water Research.
Conference Contributions Nolting, M., O. Schneider, B. Ueberschaer and H. Rosenthal (1999). FILAMAN. Towards
Predictable Quality, Trondheim, Norway, European Aquaculture Society. 278. Eding, E. H., O. Schneider, E. N. J. Ouwerkerk, A. Klapwijk, J. A. J. Verreth and A. J. A.
Aarnink (2000). The Effect of Fish Biomass and Denitrification on the Energy Balance in African Catfish Farms. Recirculating Aquaculture, Roanoke, Virginia, Virginia-Tech.
Schneider, O., J. A. J. Verreth and E. H. Eding (2001). ZAFIRA, Introduction of a framework of Zero Nutrient Discharge Aquaculture by Farming in Integrated Recirculating Systems in Asia. Aquacultural Engineering Society's 2001 Issues Forum, Shepherdstown, USA, Aquacultural Egineering Society. 305-317.
Schneider, O., J. Verreth and E. H. Eding (2002). Framework introduction of zero nutrient discharge aquaculture by farming in integrated recirculating systems in Asia: ZAFIRA. World Aquaculture 2002, Beijing, World Aquaculture Society, USA. 683.
Schneider, O., V. Sereti, M. C. J. Verdegem, E. H. Eding and J. A. J. Verreth (2003). Production of Bacterial Single Cell Protein on Carbon Supplemented Fish Waste. Beyond Monoculture, Trondheim, Norway, EAS. 67-68.
Eding, E. H., V. Sereti, O. Schneider, A. Kamstra, M. C. J. Verdegem and J. A. J. Verreth (2004). The development of low ("zero") discharge freshwater systems in a polluter pays principle environment. World Aquaculture 2004, Hawaii, USA, World Aquaculture Society.
List of Publications
157
Schneider, O., A. K. Amirkolaie, J. Vera Cartas, E. H. Eding, J. W. Schrama and J. A. J. Verreth (2004). C, N, P balances of five feed ingredients evaluated as fishmeal alternatives in tilapia diets. Biotechnologies for Quality, Barcelona, Spain, EAS. 725-726.
Schneider, O., L. T. Cong, V. Sereti, E. H. Eding, J. W. Schrama and J. A. J. Verreth (2004). Comparison of feed preference of Litopenaeus vannamei fed SCP or commercial diets. Biotechnologies for Quality, Barcelona, Spain, EAS. 727-728.
Schneider, O., V. Sereti, E. H. Eding and J. A. J. Verreth (2004). Yields and nutrient balances of bacterial production on carbon supplemented fish waste. Biotechnologies for Quality, Barcelona, Spain, EAS. 729-730.
Schneider, O., V. Sereti, E. H. Eding and J. A. J. Verreth (2005). Heterotrophic Bacteria Production On Carbon Supplemented Fish Waste. Wias Science Day, Wageningen, WAPS. 19.
Schneider, O., V. Sereti, E. H. Eding and J. A. J. Verreth (2005). Protein Production By Heterotrophic Bacteria Using Carbon Supplemented Fish Waste. World Aquaculture International Peace and Development through Aquaculture, Bali, Indonesia, World Aquaculture Society. 562.
Schneider, O., J. P. Blancheton, L. Varadi, E. H. Eding and J. A. J. Verreth (in press). Cost Price and production strategies in European Recirculation Systems. Linking Tradition & Technology Highest Quality for the Consumer, Firenze, Italy, WAS.
Schneider, O., M. Chabrillon-Popelka, H. Smidt, V. Sereti, E. H. Eding and J. A. J. Verreth (in press). Molasses as organic carbon supplement for heterotrophic bacteria production on the solid waste effluent of a RAS. Linking Tradition & Technology Highest Quality for the Consumer, Firenze, Italy, WAS.
Professional Publications Nolting, M., O. Schneider, B. Ueberschaer and H. Rosenthal (1999). FILAMAN CD-ROM,
Fishlarvae Rearing Manual). Institute of marine research, Kiel, Germany Eding, E. H. and O. Schneider (2001). "Technische en economische verglijking van de paling-
en meervalteelt." Meetjesland 5(b): 4-5. Kamstra, A., E. H. Eding and O. Schneider (2001). "Top Eel Farm Upgrades Effluent
Treatment in Netherlands." Global Aquaculture Advocate 4(3): 37-38. Schneider, O. and E. H. Eding (2001). Paling- en meevalteelt in recirculatiesystemen. Gent. Martins, C., E. H. Eding, O. Schneider and J. A. J. Verreth (2005). "Recirculation
Aquaculture Systems in Europe." CONSENSUS: 31. van der Bijl, H., O. Schneider and S. Leenstra (2006). "Geautomatisierte processveiligheid in
De Haar Vissen." Agro Informatica 18(4): 11-13.
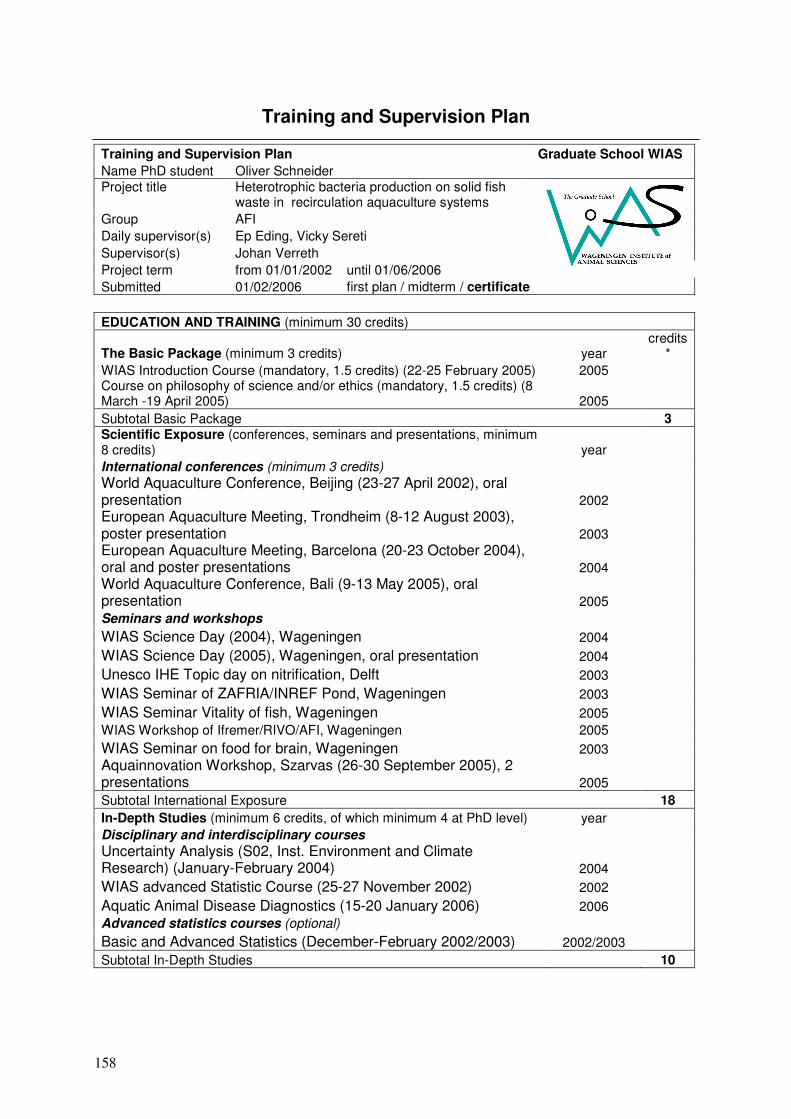
158
Training and Supervision Plan
Training and Supervision Plan Graduate School WIAS Name PhD student Oliver Schneider Project title Heterotrophic bacteria production on solid fish
waste in recirculation aquaculture systems
Group AFI Daily supervisor(s) Ep Eding, Vicky Sereti Supervisor(s) Johan Verreth Project term from 01/01/2002 until 01/06/2006
Submitted 01/02/2006 first plan / midterm / certificate
EDUCATION AND TRAINING (minimum 30 credits)
The Basic Package (minimum 3 credits) year credits
* WIAS Introduction Course (mandatory, 1.5 credits) (22-25 February 2005) 2005 Course on philosophy of science and/or ethics (mandatory, 1.5 credits) (8 March -19 April 2005) 2005 Subtotal Basic Package 3 Scientific Exposure (conferences, seminars and presentations, minimum 8 credits) year International conferences (minimum 3 credits) World Aquaculture Conference, Beijing (23-27 April 2002), oral presentation 2002 European Aquaculture Meeting, Trondheim (8-12 August 2003), poster presentation 2003 European Aquaculture Meeting, Barcelona (20-23 October 2004), oral and poster presentations 2004 World Aquaculture Conference, Bali (9-13 May 2005), oral presentation 2005 Seminars and workshops WIAS Science Day (2004), Wageningen 2004 WIAS Science Day (2005), Wageningen, oral presentation 2004 Unesco IHE Topic day on nitrification, Delft 2003 WIAS Seminar of ZAFRIA/INREF Pond, Wageningen 2003 WIAS Seminar Vitality of fish, Wageningen 2005 WIAS Workshop of Ifremer/RIVO/AFI, Wageningen 2005 WIAS Seminar on food for brain, Wageningen 2003 Aquainnovation Workshop, Szarvas (26-30 September 2005), 2 presentations 2005 Subtotal International Exposure 18 In-Depth Studies (minimum 6 credits, of which minimum 4 at PhD level) year Disciplinary and interdisciplinary courses Uncertainty Analysis (S02, Inst. Environment and Climate Research) (January-February 2004) 2004 WIAS advanced Statistic Course (25-27 November 2002) 2002 Aquatic Animal Disease Diagnostics (15-20 January 2006) 2006 Advanced statistics courses (optional) Basic and Advanced Statistics (December-February 2002/2003) 2002/2003 Subtotal In-Depth Studies 10
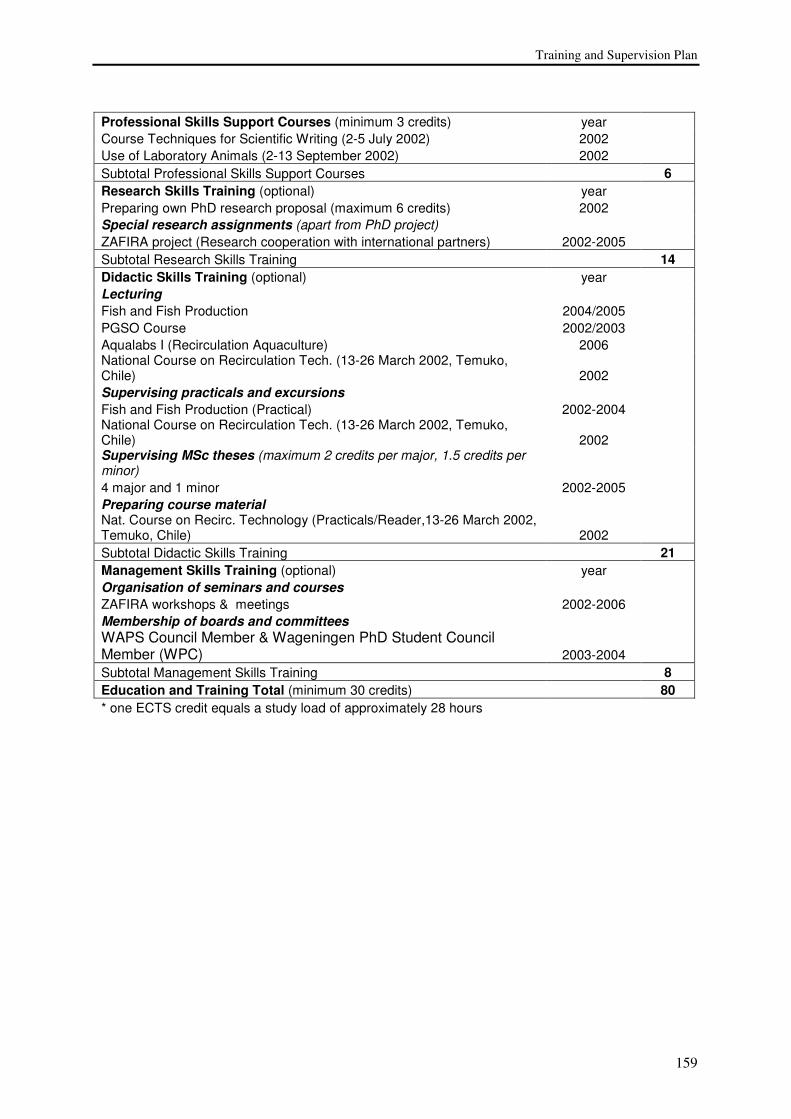
Training and Supervision Plan
159
Professional Skills Support Courses (minimum 3 credits) year Course Techniques for Scientific Writing (2-5 July 2002) 2002 Use of Laboratory Animals (2-13 September 2002) 2002 Subtotal Professional Skills Support Courses 6 Research Skills Training (optional) year Preparing own PhD research proposal (maximum 6 credits) 2002 Special research assignments (apart from PhD project) ZAFIRA project (Research cooperation with international partners) 2002-2005 Subtotal Research Skills Training 14 Didactic Skills Training (optional) year Lecturing Fish and Fish Production 2004/2005 PGSO Course 2002/2003 Aqualabs I (Recirculation Aquaculture) 2006 National Course on Recirculation Tech. (13-26 March 2002, Temuko, Chile) 2002 Supervising practicals and excursions Fish and Fish Production (Practical) 2002-2004 National Course on Recirculation Tech. (13-26 March 2002, Temuko, Chile) 2002 Supervising MSc theses (maximum 2 credits per major, 1.5 credits per minor) 4 major and 1 minor 2002-2005 Preparing course material Nat. Course on Recirc. Technology (Practicals/Reader,13-26 March 2002, Temuko, Chile) 2002 Subtotal Didactic Skills Training 21 Management Skills Training (optional) year Organisation of seminars and courses ZAFIRA workshops & meetings 2002-2006 Membership of boards and committees WAPS Council Member & Wageningen PhD Student Council Member (WPC) 2003-2004 Subtotal Management Skills Training 8 Education and Training Total (minimum 30 credits) 80 * one ECTS credit equals a study load of approximately 28 hours
160
About the author
Oliver Schneider was born on September the 17th, 1973 in Muenster, Germany. After
finishing high school and fulfilling his civil services, he studied biology at the Christian-
Albrechts-University in Kiel, Germany from 1994 to 2001. During his study he specialized in
aquaculture and fisheries, zoology, organic chemistry and marine biology. His major thesis
was investigating nutrient and energy flows in recirculation aquaculture systems. He
completed the study in 2001 with a Diploma in Biology (MSc equivalent) and obtained in
2003 the MSc in Aquaculture from Wageningen University, The Netherlands. After working
in different functions at the Aquaculture and Fisheries Group of Wageningen University
between 2000 and 2001, he carried out his PhD research within the ZAFIRA-Project (Zero
discharge Aquaculture by Farming in Integrated Recirculating Systems in Asia) in the same
chair group, since 2002. This research resulted in the present thesis. From June 2006 onwards,
Oliver Schneider is working for IMARES (Institute for Marine Resources & Ecosystem
Studies, The Netherlands).
For more information, please contact the author: [email protected]
This research was funded by the European Union in the
frame of the ZAFIRA project (Zero discharge Aquaculture by Farming in Integrated Recirculating
Systems in Asia) ICA4-CT-2001-10025
Related Documents