Fiscal Year 2020 Sustainability Performance and Metrics

Welcome message from author
This document is posted to help you gain knowledge. Please leave a comment to let me know what you think about it! Share it to your friends and learn new things together.
Transcript

Fiscal Year 2020
SustainabilityPerformance and Metrics

Contents 3 Organizational Profile
4 FY2020 Sustainability Performance and Metrics
19 Definition of Metrics
22 Report of Independent Accountants

3
Tiffany & Co.
FY2020 Sustainability Performance & Metrics
Tiffany & Co. is a global luxury jeweler
synonymous with elegance, innovative design,
fine craftsmanship and creative excellence.
Based in New York and with more than 300
retail stores worldwide and a workforce of
more than 13,000 employees, Tiffany & Co.
and its subsidiaries design, manufacture and
market jewelry, watches and luxury accessories.
Nearly 5,000 skilled artisans cut Tiffany
diamonds and craft jewelry in the Company’s
own workshops, realizing the brand’s
commitment to superlative quality.
Tiffany continues to lead the industry by
bringing a new level of transparency to
its diamond supply chain, and through its
vertical integration model, which helps uphold
standards of craftsmanship, safe and healthy
working environments, community economic
development and supply chain traceability.
The brand is unique among global luxury
jewelers in owning and operating its own
diamond polishing workshops around the
world, with such facilities in Belgium, Mauritius,
Botswana, Vietnam and Cambodia, as well as
a Tiffany Gemological Laboratory in New York
and five jewelry manufacturing workshops
in North America. Through this vertically
integrated model, Tiffany can ensure its own
high standards are met.
Tiffany & Co. has a long-standing commitment
to conducting its business responsibly,
sustaining the natural environment, prioritizing
diversity and inclusion, and positively
impacting the communities in which it
operates. To learn more about Tiffany & Co.
and its commitment to sustainability, please
visit Tiffany.com/Sustainability.
4
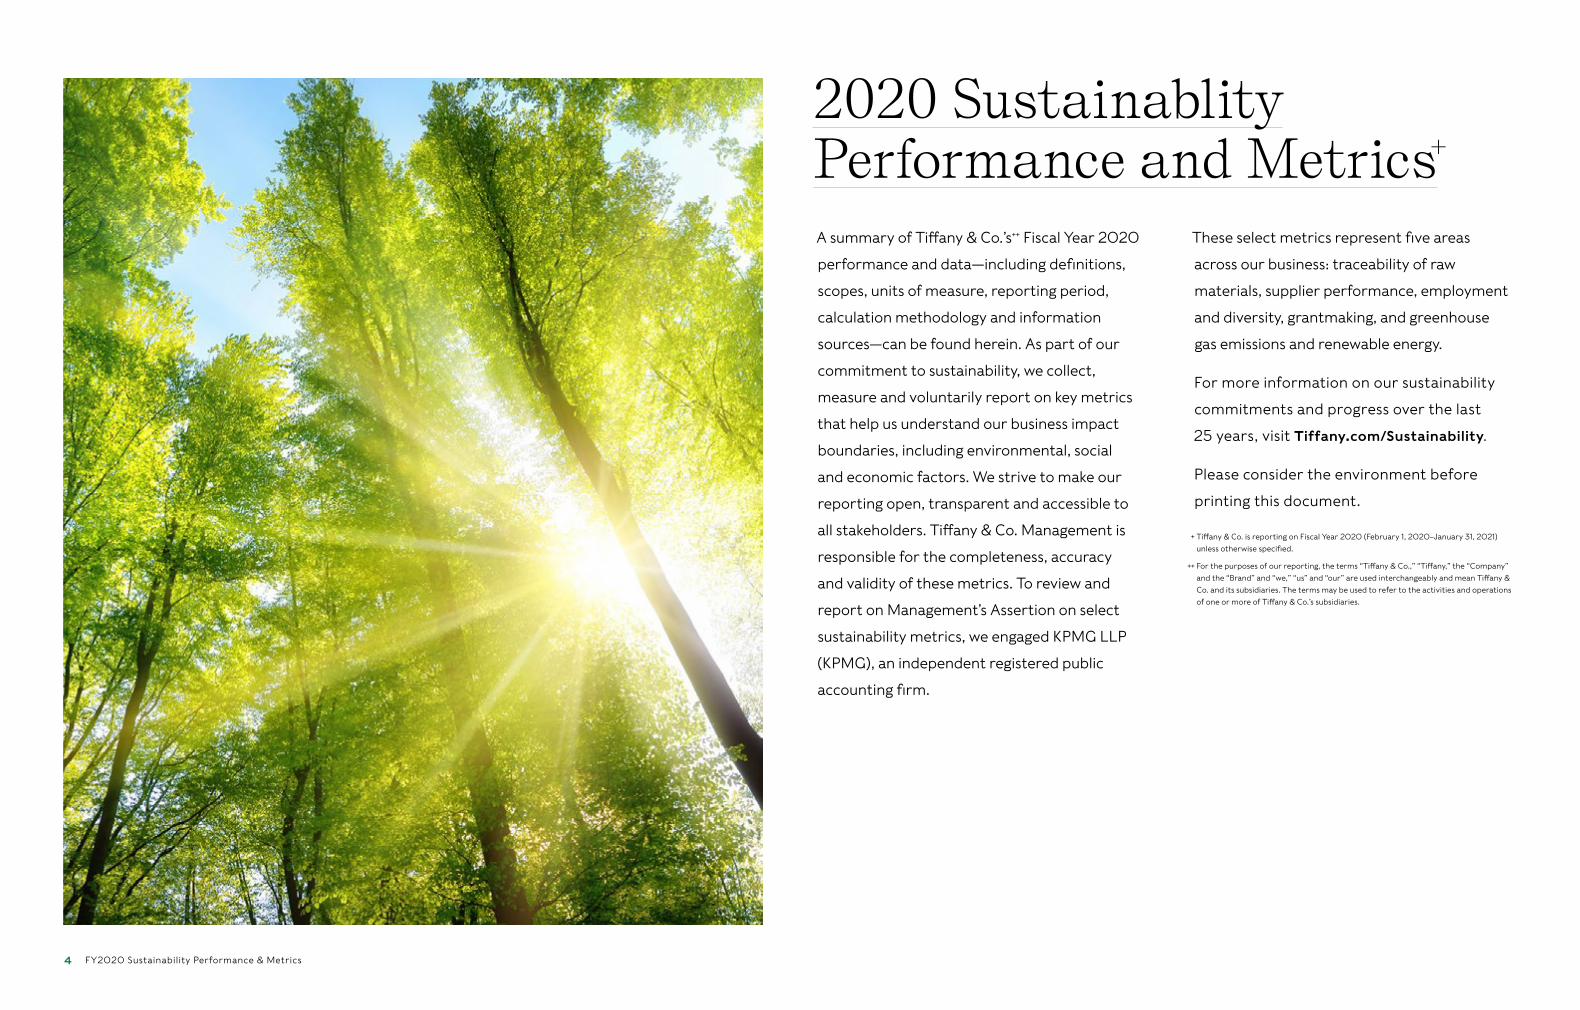
A summary of Tiffany & Co.’s++ Fiscal Year 2020
performance and data—including definitions,
scopes, units of measure, reporting period,
calculation methodology and information
sources—can be found herein. As part of our
commitment to sustainability, we collect,
measure and voluntarily report on key metrics
that help us understand our business impact
boundaries, including environmental, social
and economic factors. We strive to make our
reporting open, transparent and accessible to
all stakeholders. Tiffany & Co. Management is
responsible for the completeness, accuracy
and validity of these metrics. To review and
report on Management’s Assertion on select
sustainability metrics, we engaged KPMG LLP
(KPMG), an independent registered public
accounting firm.
These select metrics represent five areas
across our business: traceability of raw
materials, supplier performance, employment
and diversity, grantmaking, and greenhouse
gas emissions and renewable energy.
For more information on our sustainability
commitments and progress over the last
25 years, visit Tiffany.com/Sustainability.
Please consider the environment before
printing this document.
2020 Sustainablity Performance and Metrics
+ Tiffany & Co. is reporting on Fiscal Year 2020 (February 1, 2020–January 31, 2021) unless otherwise specified.
++ For the purposes of our reporting, the terms “Tiffany & Co.,” “Tiffany,” the “Company” and the “Brand” and “we,” “us” and “our” are used interchangeably and mean Tiffany & Co. and its subsidiaries. The terms may be used to refer to the activities and operations of one or more of Tiffany & Co.’s subsidiaries.
+
FY2020 Sustainability Performance & Metrics
5
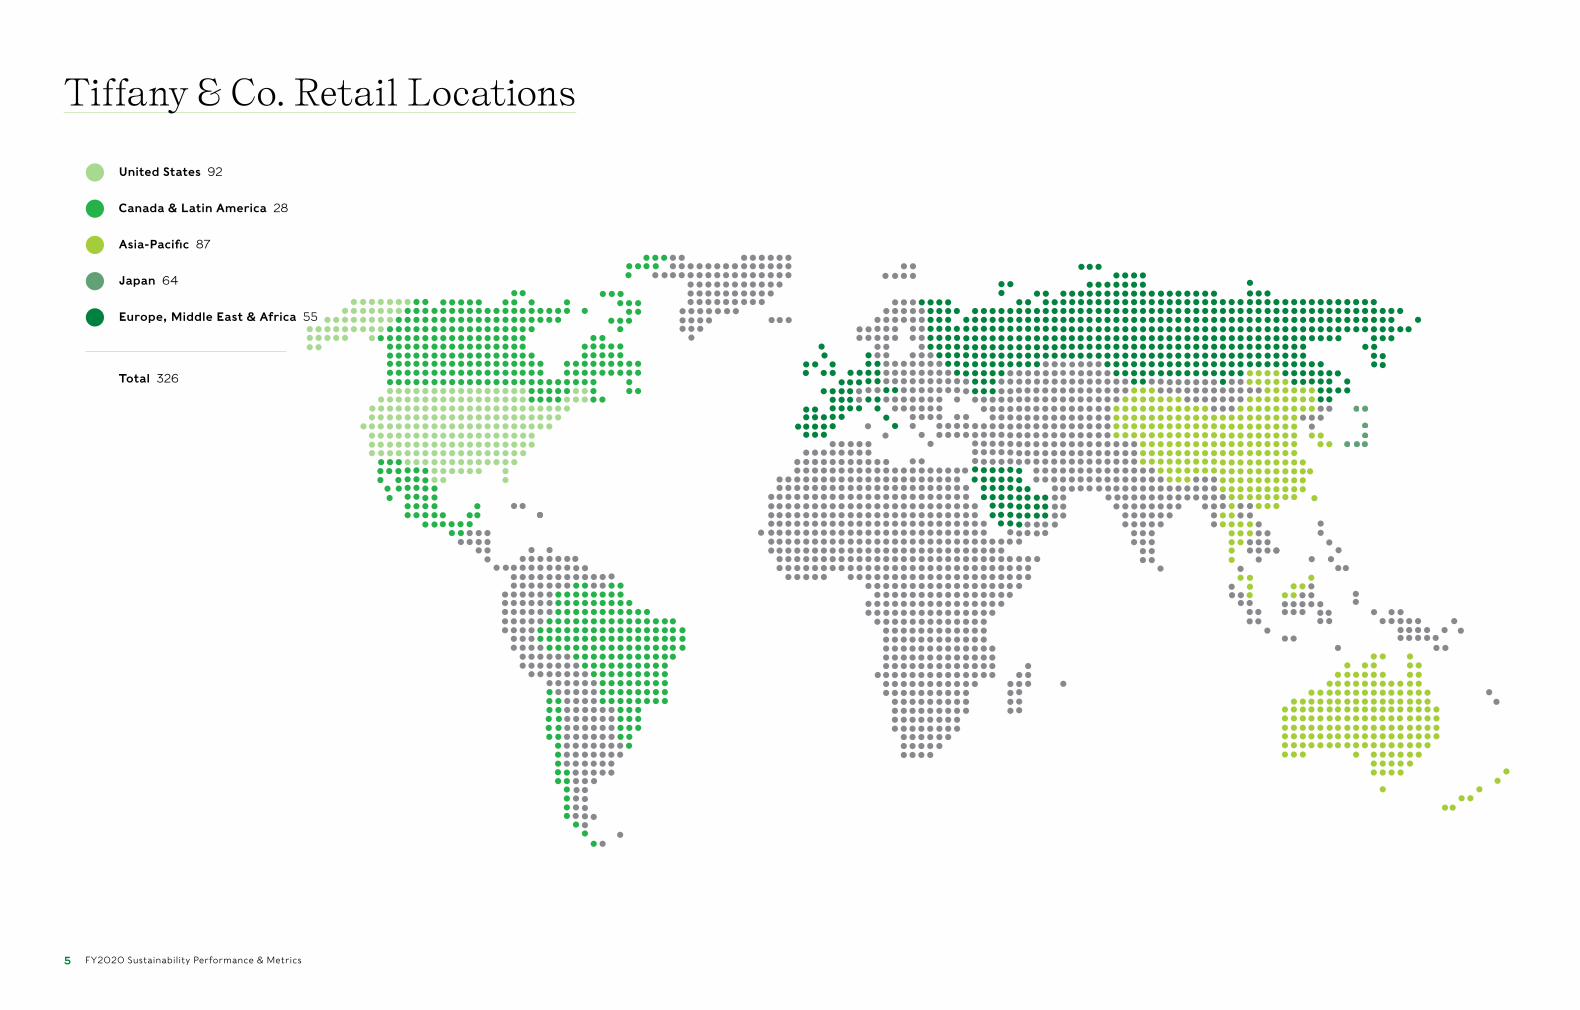
Tiffany & Co. Retail Locations
FY2020 Sustainability Performance & Metrics
United States 92
Canada & Latin America 28
Asia-Pacific 87
Japan 64
Europe, Middle East & Africa 55
Total 326

6
1 Pelham, New YorkTiffany Gemological Laboratory;
final diamond grading and inscription
2 Antwerp, BelgiumDiamond headquarters; rough sourcing, preparation, large stone cutting, polishing and engineering
3 Gaborone, BotswanaDiamond cutting and polishing, medium size
4 Rose Belle, MauritiusDiamond cutting and polishing, medium size
5 Hai Duong, VietnamDiamond preparation, cutting, polishing, grading and engineering, small size
6
7
Phnom Penh, CambodiaDiamond preparation, cutting and polishing, small size
Bangkok, ThailandGemstone grading lab and CAD operation
8 New York, New YorkJewelry making, setting, polishing and model making
9 Pelham, New YorkJewelry making, setting, polishing and model making
10 Lexington, KentuckyJewelry making, setting and polishing
11 Cumberland, Rhode IslandJewelry making, setting, polishing, casting, model making, hollowware and trophy craftwork
12 Santo Domingo, Dominican RepublicJewelry assembly and polishing
Jewelry Manufacturing
2
3
4
5
67
1
8 910
11
12
Tiffany & Co. Diamond and Jewelry Manufacturing Diamond Cutting, Polishing & Grading
FY2020 Sustainability Performance & Metrics

7
54%* Born 1981–1996
27%* Born 1965–1980
9%* Born 1964 and Prior
10%* Born 1997–Present
International Manufacturing Workforce
Employee Diversity by Generation◊
◊As self-disclosed by employees * See the Report of Independent Accountants
FY2020 Sustainability Performance & Metrics
International manufacturing locations include Vietnam, Cambodia, Botswana, Mauritius, Dominican Republic, Antwerp and Thailand.
99%* Local Employee Count
1%* Ex-pat Employee Count
8
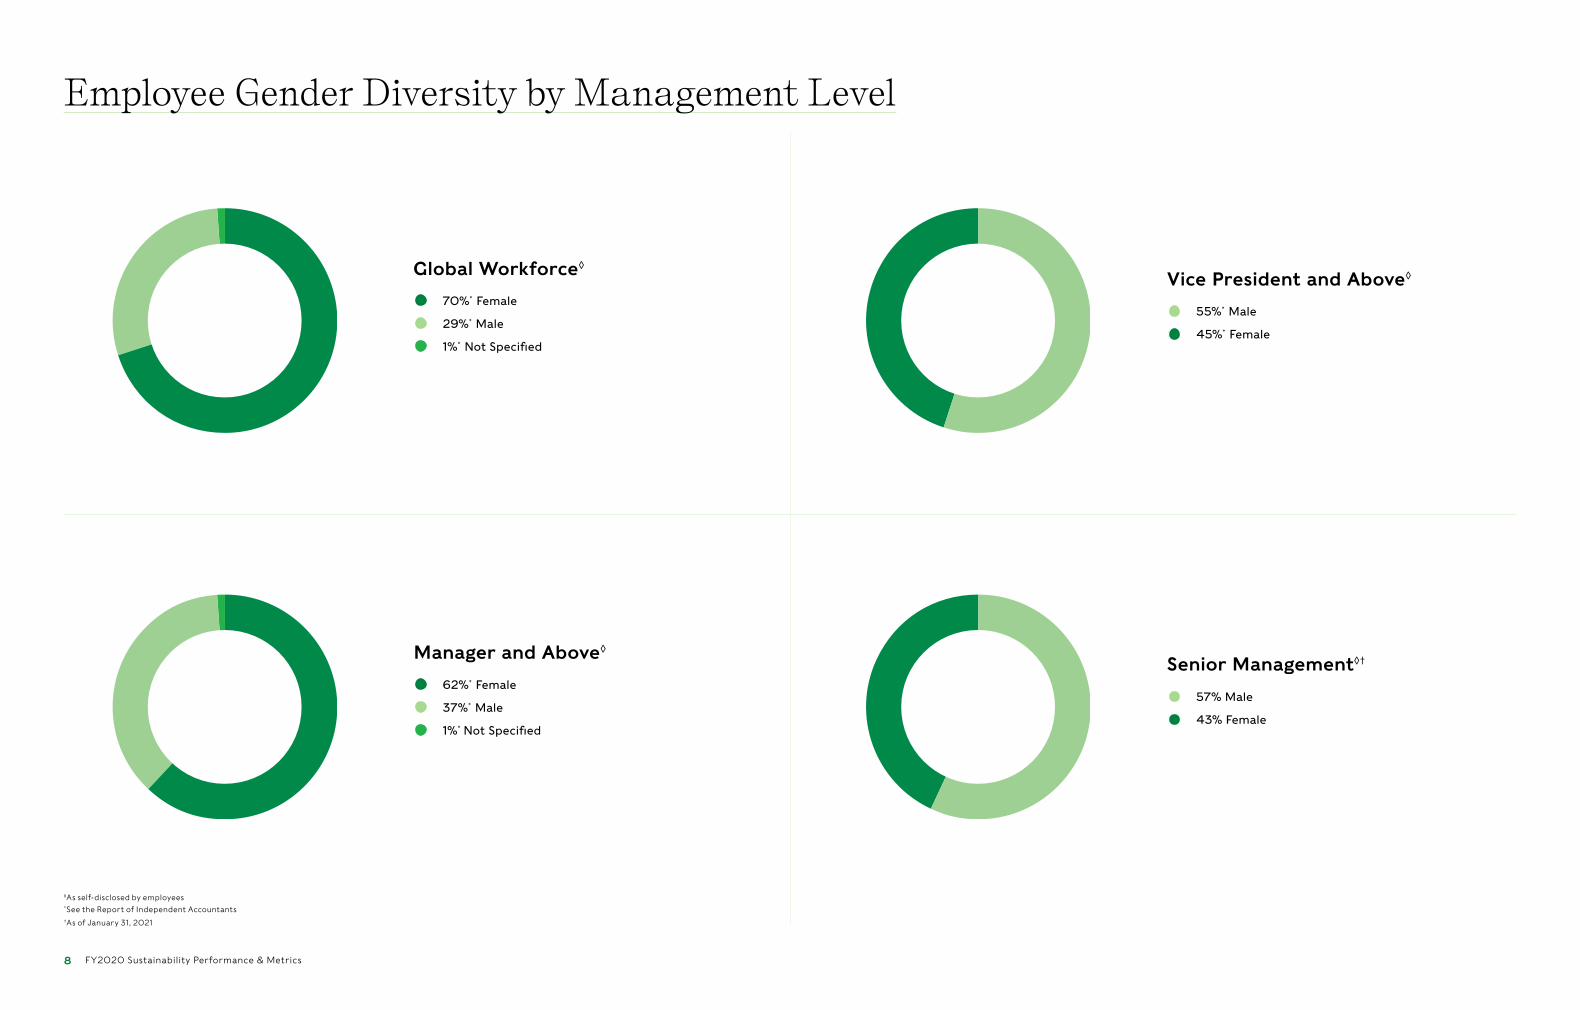
45%* Female
Employee Gender Diversity by Management Level
Global Workforce◊Vice President and Above◊
Senior Management◊†Manager and Above◊
◊As self-disclosed by employees *See the Report of Independent Accountants †As of January 31, 2021
70%* Female
29%* Male
1%* Not Specified
62%* Female
37%* Male
1%* Not Specified
FY2020 Sustainability Performance & Metrics
55%* Male
43% Female
57% Male
9
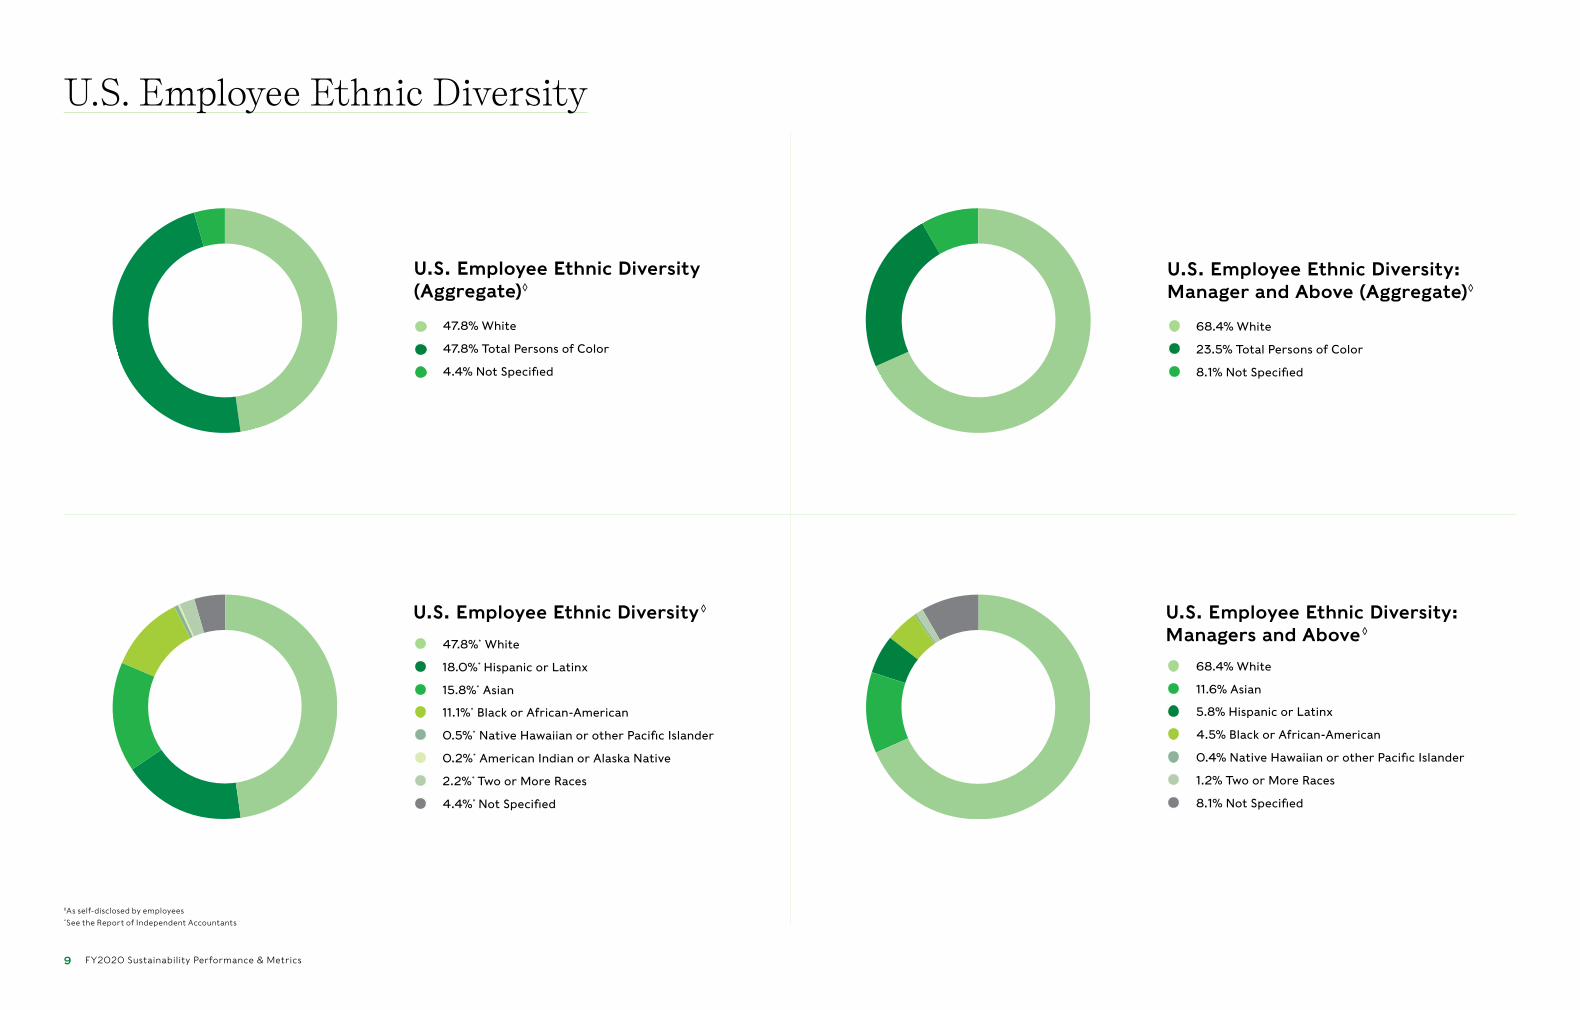
U.S. Employee Ethnic Diversity (Aggregate)◊
47.8% White
47.8% Total Persons of Color
4.4% Not Specified
U.S. Employee Ethnic Diversity: Manager and Above (Aggregate)◊
68.4% White
23.5% Total Persons of Color
8.1% Not Specified
U.S. Employee Ethnic Diversity
◊As self-disclosed by employees *See the Report of Independent Accountants
FY2020 Sustainability Performance & Metrics
U.S. Employee Ethnic Diversity◊
47.8%* White
11.1%* Black or African-American
18.0%* Hispanic or Latinx
0.5%* Native Hawaiian or other Pacific Islander
15.8%* Asian
0.2%* American Indian or Alaska Native
2.2%* Two or More Races
4.4%* Not Specified
U.S. Employee Ethnic Diversity: Managers and Above◊
5.8% Hispanic or Latinx
68.4% White
4.5% Black or African-American
11.6% Asian
0.4% Native Hawaiian or other Pacific Islander
1.2% Two or More Races
8.1% Not Specified
10
Charitable GivingAt Tiffany & Co., our approach to
philanthropic giving is comprised of three
elements—The Tiffany & Co. Foundation,
Tiffany & Co. Corporate Giving and Tiffany
Cares—that collectively allow Tiffany to
support progress on issues that matter to
our business and our stakeholders, such as
the arts, environmental conservation and
diversity and inclusion. In 2020, Tiffany
& Co.’s corporate contributions totaled
approximately USD $19.6 million.
Tiffany CaresIn 2020, our employee-driven philanthropy
program, Tiffany Cares, enabled our workforce
in the U.S., Canada, Australia, New Zealand,
United Kingdom, Ireland and Hong Kong to
take the lead in supporting the causes for
which they are most passionate.
Through Tiffany Cares, the Company matches
employee donations (dollar for dollar) and
personal volunteer hours (USD $10◊/ hour)
to eligible charitable organizations, up to
USD $1,000◊ per employee each Calendar
Year. Through Tiffany Cares, we donated
USD $319,000 in Calendar Year 2020.
Additionally, through volunteer matching,
the Company matched our employee
volunteer hours with a donation of over
USD $18,000.
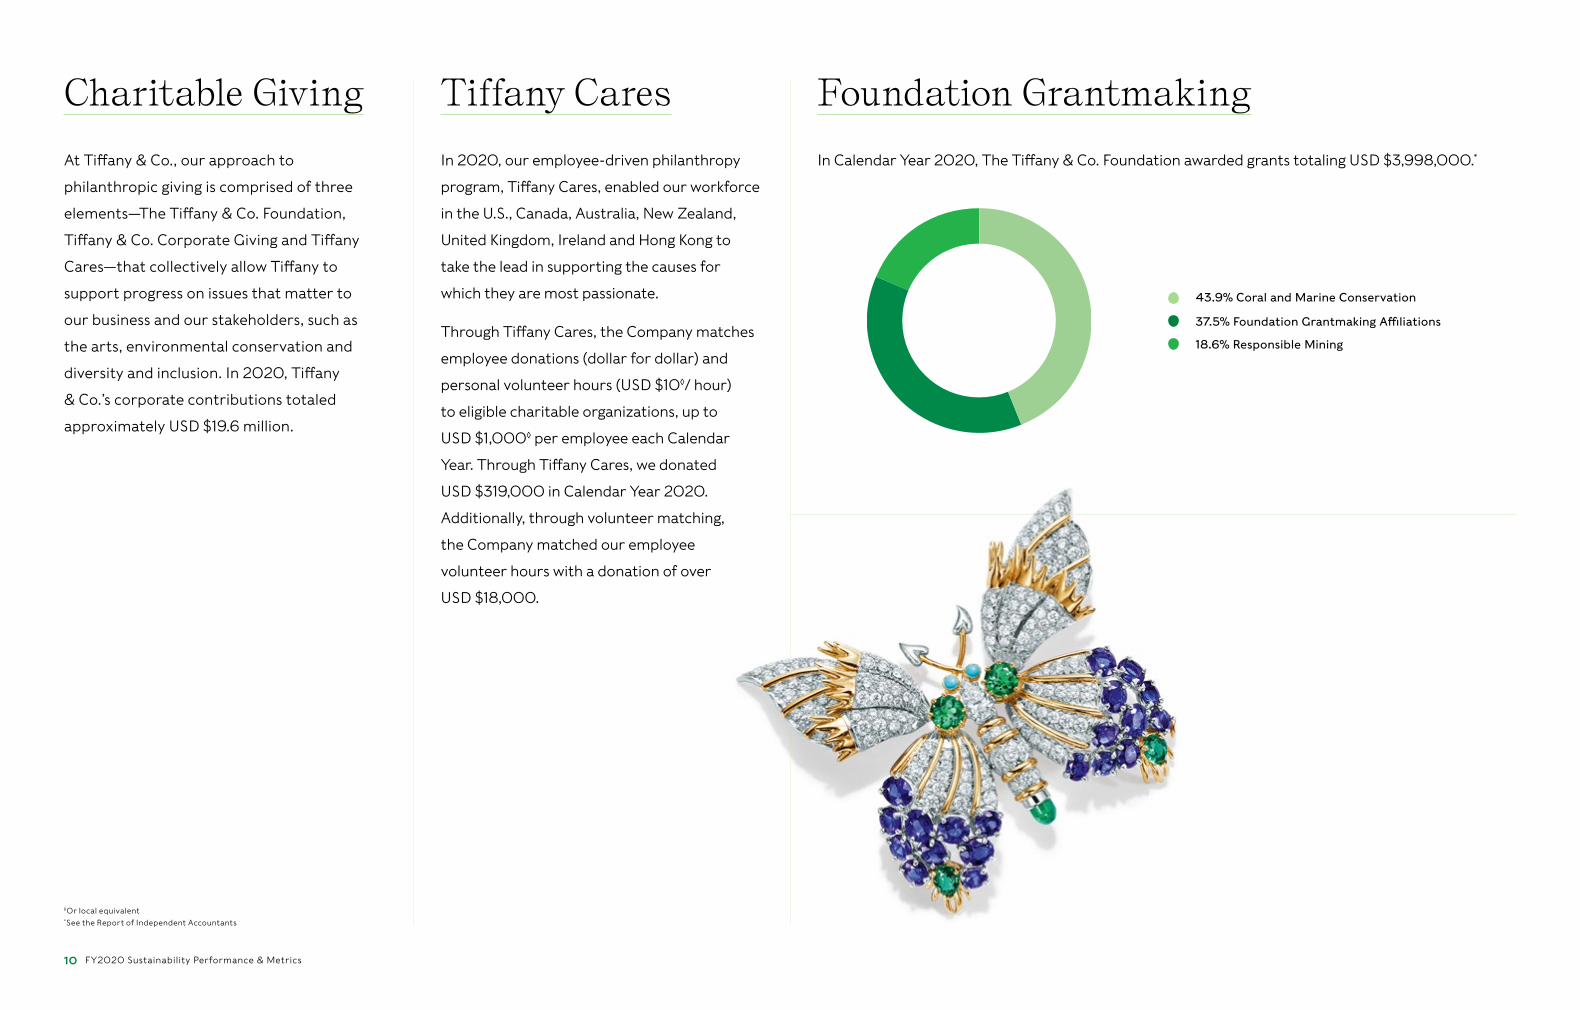
Foundation GrantmakingIn Calendar Year 2020, The Tiffany & Co. Foundation awarded grants totaling USD $3,998,000.*
43.9% Coral and Marine Conservation
37.5% Foundation Grantmaking Affiliations
18.6% Responsible Mining
FY2020 Sustainability Performance & Metrics
◊Or local equivalent *See the Report of Independent Accountants
11
Material Traceability & Manufacturing
*See the Report of Independent Accountants
FY2020 Sustainability Performance & Metrics
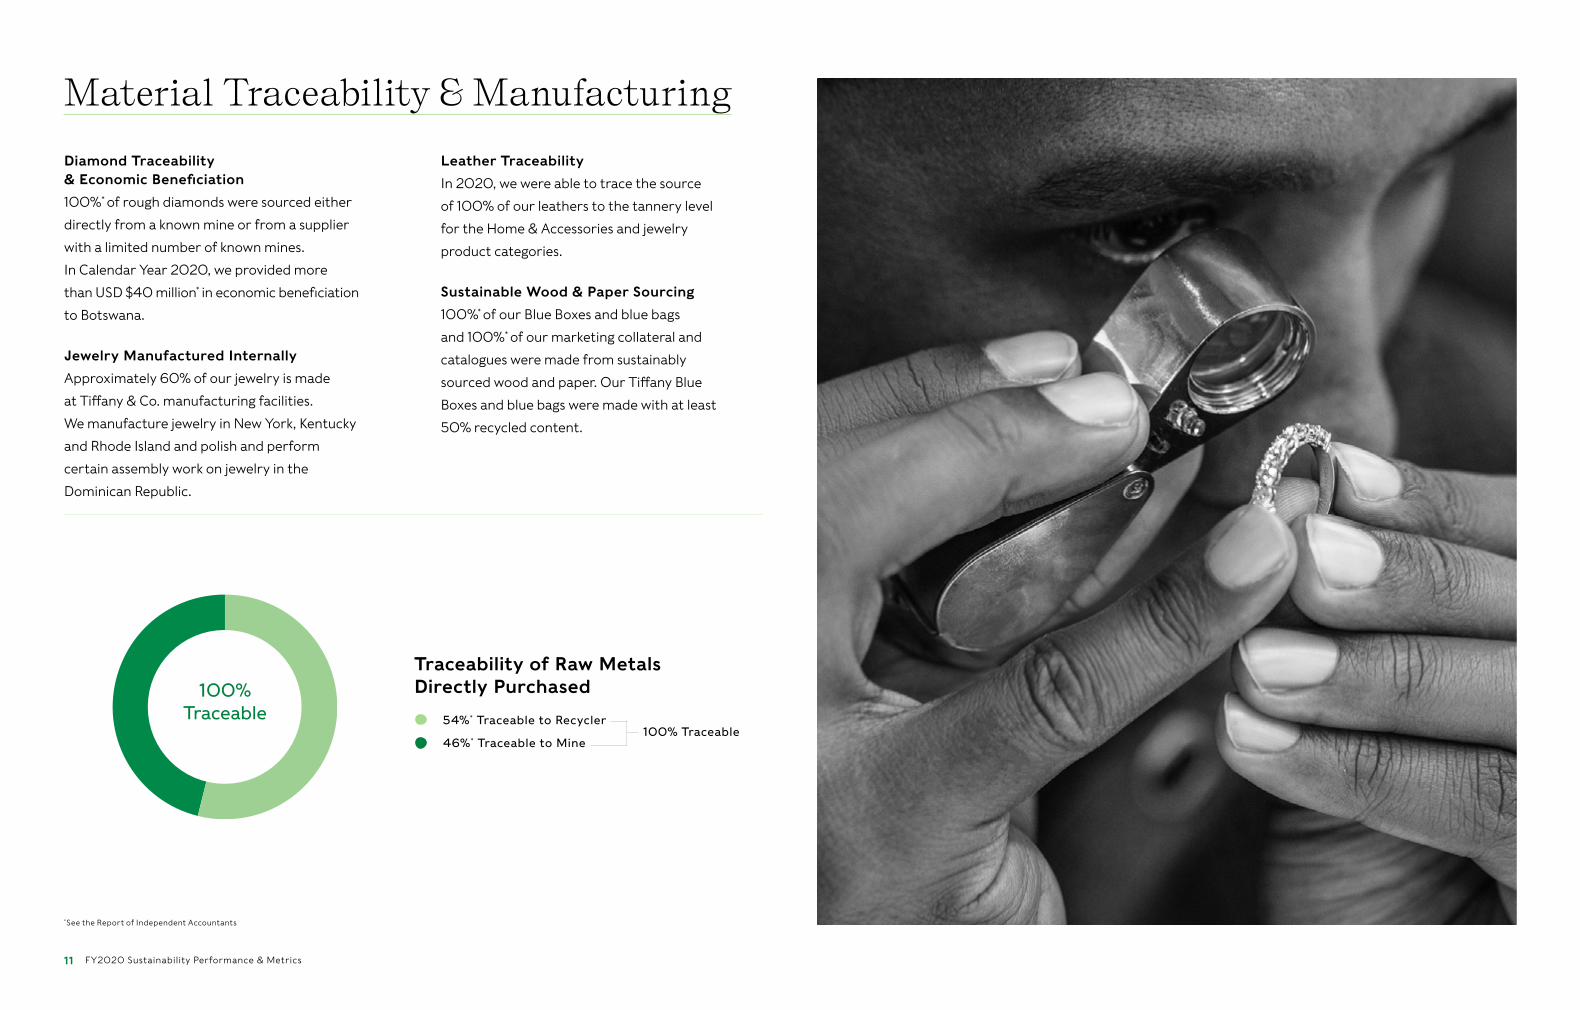
54%* Traceable to Recycler
46%* Traceable to Mine100% Traceable
Traceability of Raw Metals Directly Purchased
Diamond Traceability & Economic Beneficiation
100%* of rough diamonds were sourced either
directly from a known mine or from a supplier
with a limited number of known mines.
In Calendar Year 2020, we provided more
than USD $40 million* in economic beneficiation
to Botswana.
Jewelry Manufactured Internally
Approximately 60% of our jewelry is made
at Tiffany & Co. manufacturing facilities.
We manufacture jewelry in New York, Kentucky
and Rhode Island and polish and perform
certain assembly work on jewelry in the
Dominican Republic.
Leather Traceability
In 2020, we were able to trace the source
of 100% of our leathers to the tannery level
for the Home & Accessories and jewelry
product categories.
Sustainable Wood & Paper Sourcing
100%* of our Blue Boxes and blue bags
and 100%* of our marketing collateral and
catalogues were made from sustainably
sourced wood and paper. Our Tiffany Blue
Boxes and blue bags were made with at least
50% recycled content.
100% Traceable

12
Through our Social and Environmental
Accountability (SEA) Program, Tiffany works
with a key subset of its suppliers to regularly
review their conformance to our expectations
and help them improve their human rights
practices, fair and safe labor practices and
environmental performance.
Our 2018–19 SEA Program cycle, which
covered the period beginning on
February 1, 2018 through January 31, 2020,
included approximately 400 active suppliers
across 36 countries. These suppliers provide
us with our finished goods, components,
leather goods, polished diamonds, colored
gemstones and packaging materials, and
repair and perform new sale alterations on
Tiffany & Co. merchandise.
Tiffany’s Social and Environmental Accountability Program
Active Suppliers in Scope for SEA Program, by Country
SEA Program Supplier Onboarding and Annual Assessment Cycle
FY2020 Sustainability Performance & Metrics
Suppliers in the SEA Program are located in 36 countries—approximately one third of
which are in the U.S., followed by Switzerland, Italy, China and India, amongst others.
United States (Approx. One Third of Suppliers)
Regions with All Other Suppliers
Supplier Code of Conduct
Pre-sourcing Due Diligence
Tiffany Approved Supplier
Remediation & Continuous Improvement
Supplier Self-assessment Questionnaire
Risk RatingRisk Assessment Third-party
Audit
20% of Low Risk Audited
50% of Medium Risk Audited
100% of High Risk Audited
Additional CSR Icons
Additional CSR Icons
Pre-Sourcing Due Diligence
Additional CSR Icons
Tiffany Approved SupplierRisk Assessment
Additional CSR IconsAdditional CSR Icons
Tiffany Approved Supplier
Additional CSR Icons
Pre-Sourcing Due DiligenceRisk Assessment
Additional CSR Icons

13
Tiffany’s SEA Program Global Review of Supply ChainEach year Tiffany assesses all active supplier
locations that are in scope for our SEA Program.
Material, country and political-specific risk
factors are reviewed as part of this assessment,
along with supplier-specific factors such as
prior audit performance and participation and
performance in capability-building efforts and
the supplier’s role in relation to our business.
Assessment results are heavily impacted by
country and political-specific risk factors
noted above.
As such, a supplier with otherwise sound
business practices that is located in a higher
risk country may be viewed as comparatively
higher risk than a comparable supplier located
in a lower risk country.
The result of this assessment determines
which suppliers will be audited to ensure they
conform to Tiffany expectations, as described in
more detail on the next page. 80%* of supplier
facilities included in the SEA Program during our
last audit cycle were considered low risk.
*See the Report of Independent Accountants
Located at Tiffany Diamond Cutting & Polishing Workshop in Mauritius
FY2020 Sustainability Performance & Metrics
80%* Low Risk
11%* Medium Risk
9%* High Risk
2018–2019 Supplier Risk Assessment Results80%
Low Risk
14
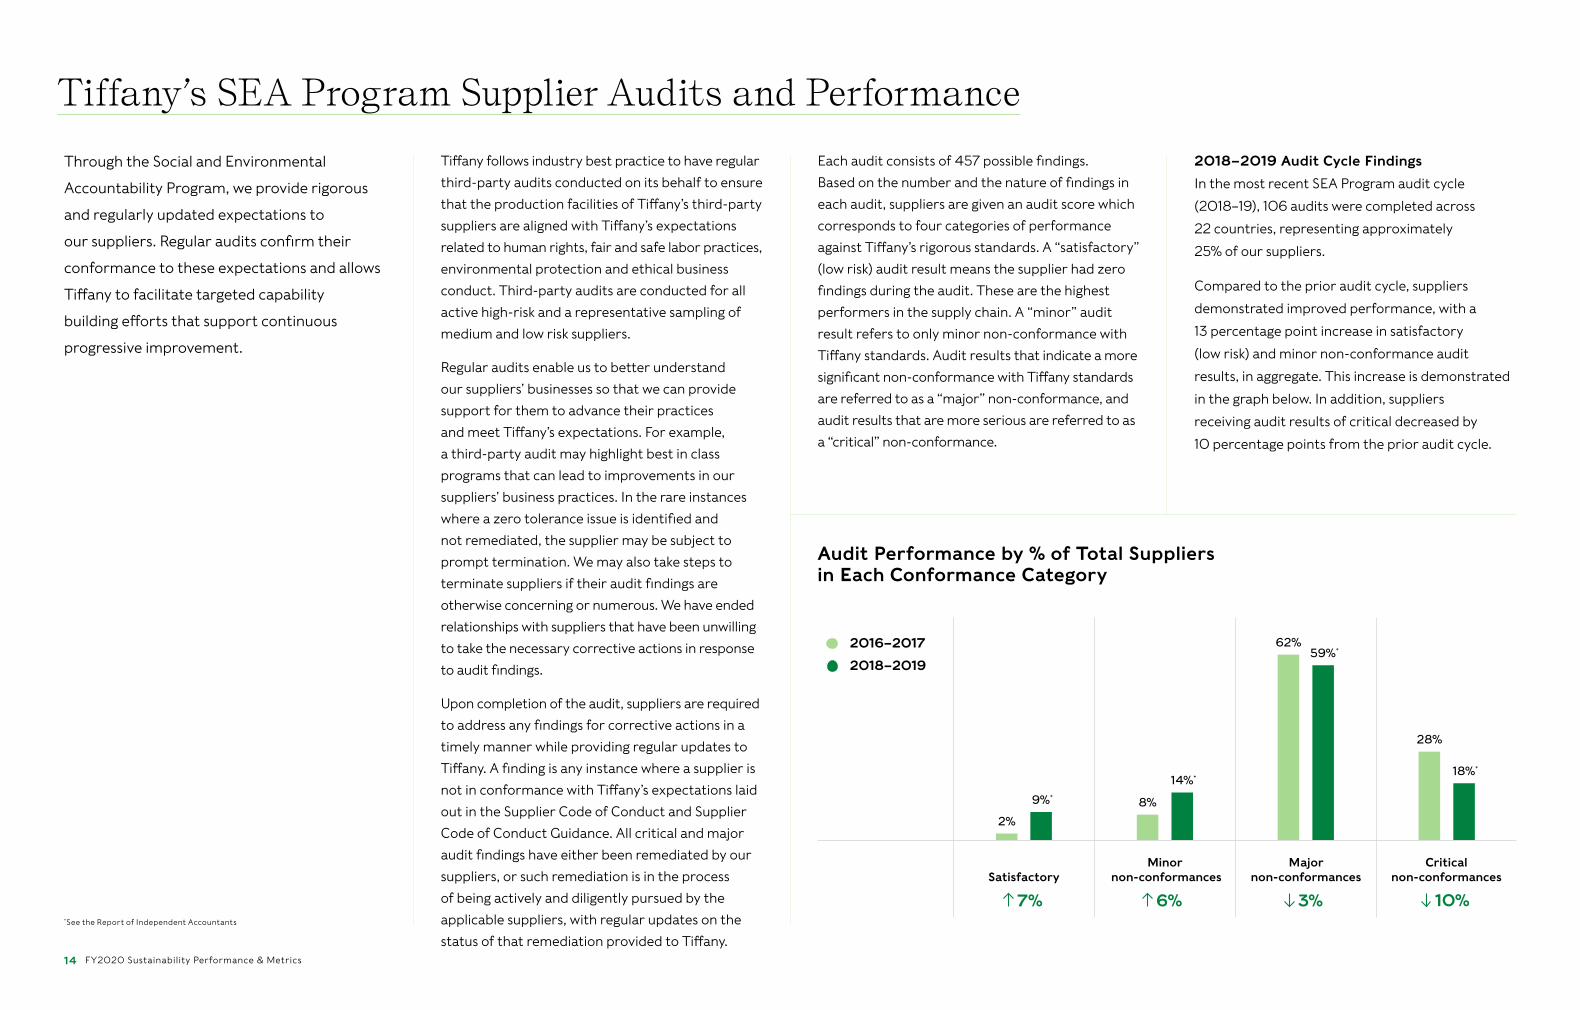
Through the Social and Environmental
Accountability Program, we provide rigorous
and regularly updated expectations to
our suppliers. Regular audits confirm their
conformance to these expectations and allows
Tiffany to facilitate targeted capability
building efforts that support continuous
progressive improvement.
Each audit consists of 457 possible findings.
Based on the number and the nature of findings in
each audit, suppliers are given an audit score which
corresponds to four categories of performance
against Tiffany’s rigorous standards. A “satisfactory”
(low risk) audit result means the supplier had zero
findings during the audit. These are the highest
performers in the supply chain. A “minor” audit
result refers to only minor non-conformance with
Tiffany standards. Audit results that indicate a more
significant non-conformance with Tiffany standards
are referred to as a “major” non-conformance, and
audit results that are more serious are referred to as
a “critical” non-conformance.
2018–2019 Audit Cycle Findings
In the most recent SEA Program audit cycle
(2018–19), 106 audits were completed across
22 countries, representing approximately
25% of our suppliers.
Compared to the prior audit cycle, suppliers
demonstrated improved performance, with a
13 percentage point increase in satisfactory
(low risk) and minor non-conformance audit
results, in aggregate. This increase is demonstrated
in the graph below. In addition, suppliers
receiving audit results of critical decreased by
10 percentage points from the prior audit cycle.
Tiffany’s SEA Program Supplier Audits and Performance
FY2020 Sustainability Performance & Metrics
*See the Report of Independent Accountants
Audit Performance by % of Total Suppliers in Each Conformance Category
59%*
14%*
9%*
2%
2018–2019
18%*
8%
62%
28%
2016–2017
6%
Minor non-conformances
3%
Major non-conformances
10%
Critical non-conformances
7%Satisfactory
Tiffany follows industry best practice to have regular
third-party audits conducted on its behalf to ensure
that the production facilities of Tiffany’s third-party
suppliers are aligned with Tiffany’s expectations
related to human rights, fair and safe labor practices,
environmental protection and ethical business
conduct. Third-party audits are conducted for all
active high-risk and a representative sampling of
medium and low risk suppliers.
Regular audits enable us to better understand
our suppliers’ businesses so that we can provide
support for them to advance their practices
and meet Tiffany’s expectations. For example,
a third-party audit may highlight best in class
programs that can lead to improvements in our
suppliers’ business practices. In the rare instances
where a zero tolerance issue is identified and
not remediated, the supplier may be subject to
prompt termination. We may also take steps to
terminate suppliers if their audit findings are
otherwise concerning or numerous. We have ended
relationships with suppliers that have been unwilling
to take the necessary corrective actions in response
to audit findings.
Upon completion of the audit, suppliers are required
to address any findings for corrective actions in a
timely manner while providing regular updates to
Tiffany. A finding is any instance where a supplier is
not in conformance with Tiffany’s expectations laid
out in the Supplier Code of Conduct and Supplier
Code of Conduct Guidance. All critical and major
audit findings have either been remediated by our
suppliers, or such remediation is in the process
of being actively and diligently pursued by the
applicable suppliers, with regular updates on the
status of that remediation provided to Tiffany.
15
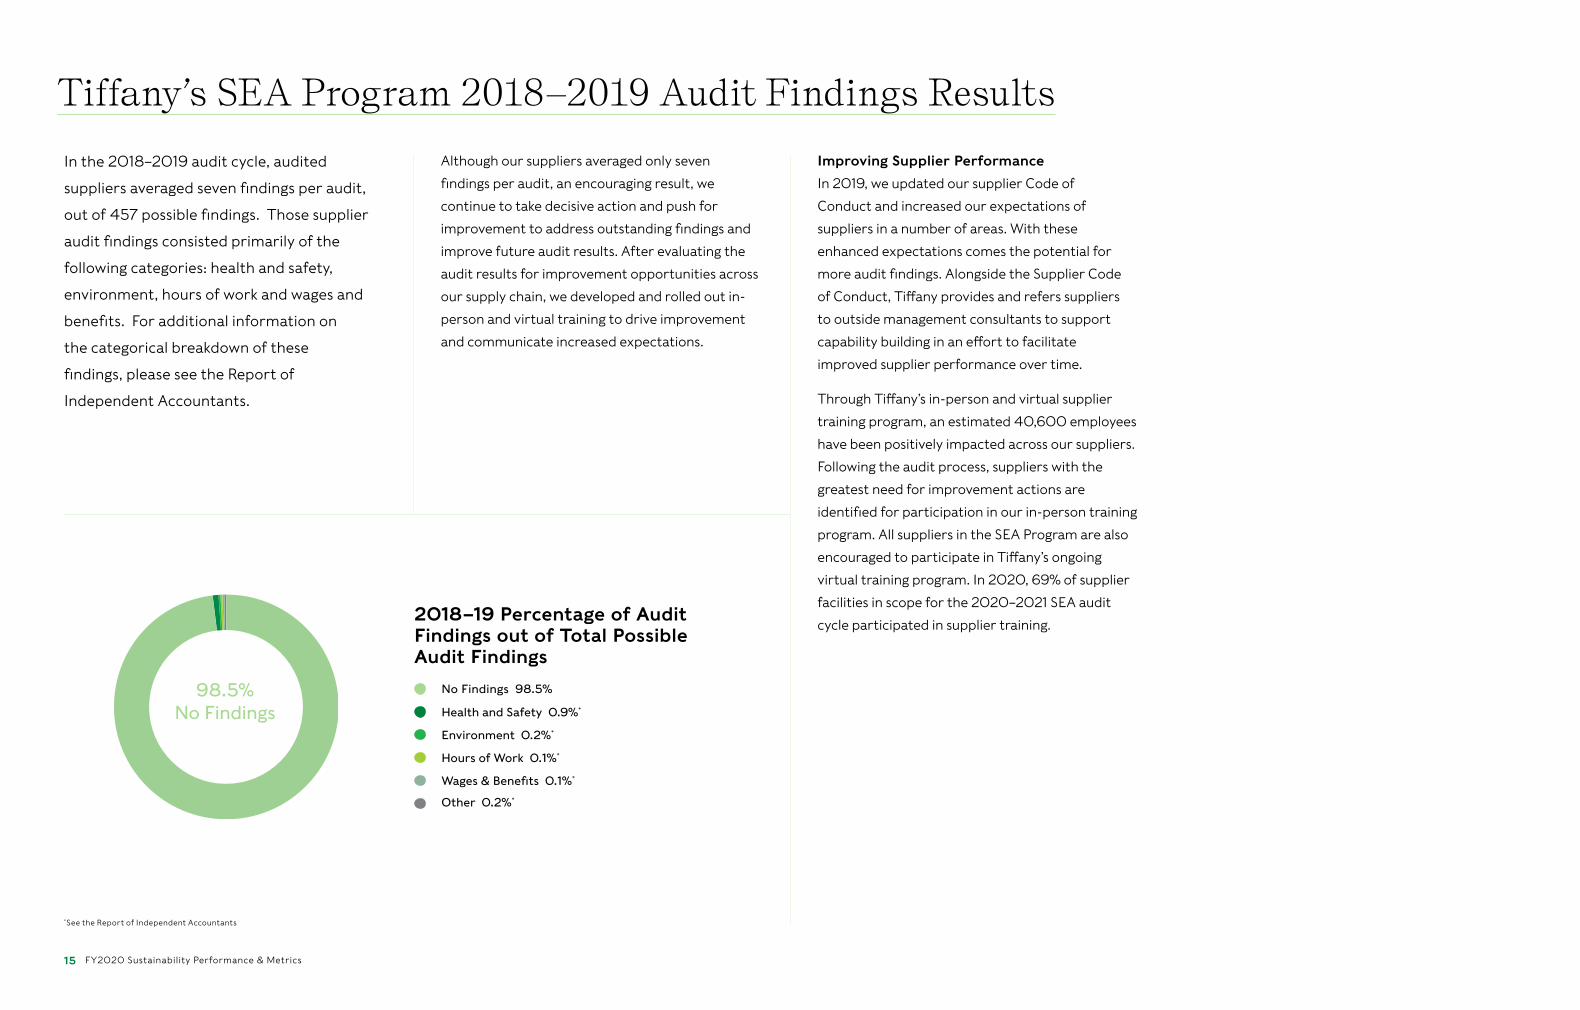
In the 2018–2019 audit cycle, audited
suppliers averaged seven findings per audit,
out of 457 possible findings. Those supplier
audit findings consisted primarily of the
following categories: health and safety,
environment, hours of work and wages and
benefits. For additional information on
the categorical breakdown of these
findings, please see the Report of
Independent Accountants.
Although our suppliers averaged only seven
findings per audit, an encouraging result, we
continue to take decisive action and push for
improvement to address outstanding findings and
improve future audit results. After evaluating the
audit results for improvement opportunities across
our supply chain, we developed and rolled out in-
person and virtual training to drive improvement
and communicate increased expectations.
Improving Supplier Performance
In 2019, we updated our supplier Code of
Conduct and increased our expectations of
suppliers in a number of areas. With these
enhanced expectations comes the potential for
more audit findings. Alongside the Supplier Code
of Conduct, Tiffany provides and refers suppliers
to outside management consultants to support
capability building in an effort to facilitate
improved supplier performance over time.
Through Tiffany’s in-person and virtual supplier
training program, an estimated 40,600 employees
have been positively impacted across our suppliers.
Following the audit process, suppliers with the
greatest need for improvement actions are
identified for participation in our in-person training
program. All suppliers in the SEA Program are also
encouraged to participate in Tiffany’s ongoing
virtual training program. In 2020, 69% of supplier
facilities in scope for the 2020–2021 SEA audit
cycle participated in supplier training.
FY2020 Sustainability Performance & Metrics
Tiffany’s SEA Program 2018–2019 Audit Findings Results
*See the Report of Independent Accountants
2018–19 Percentage of Audit Findings out of Total Possible Audit Findings
No Findings 98.5%
Health and Safety 0.9%*
Environment 0.2%*
Hours of Work 0.1%*
Other 0.2%*
Wages & Benefits 0.1%*
98.5% No Findings
16
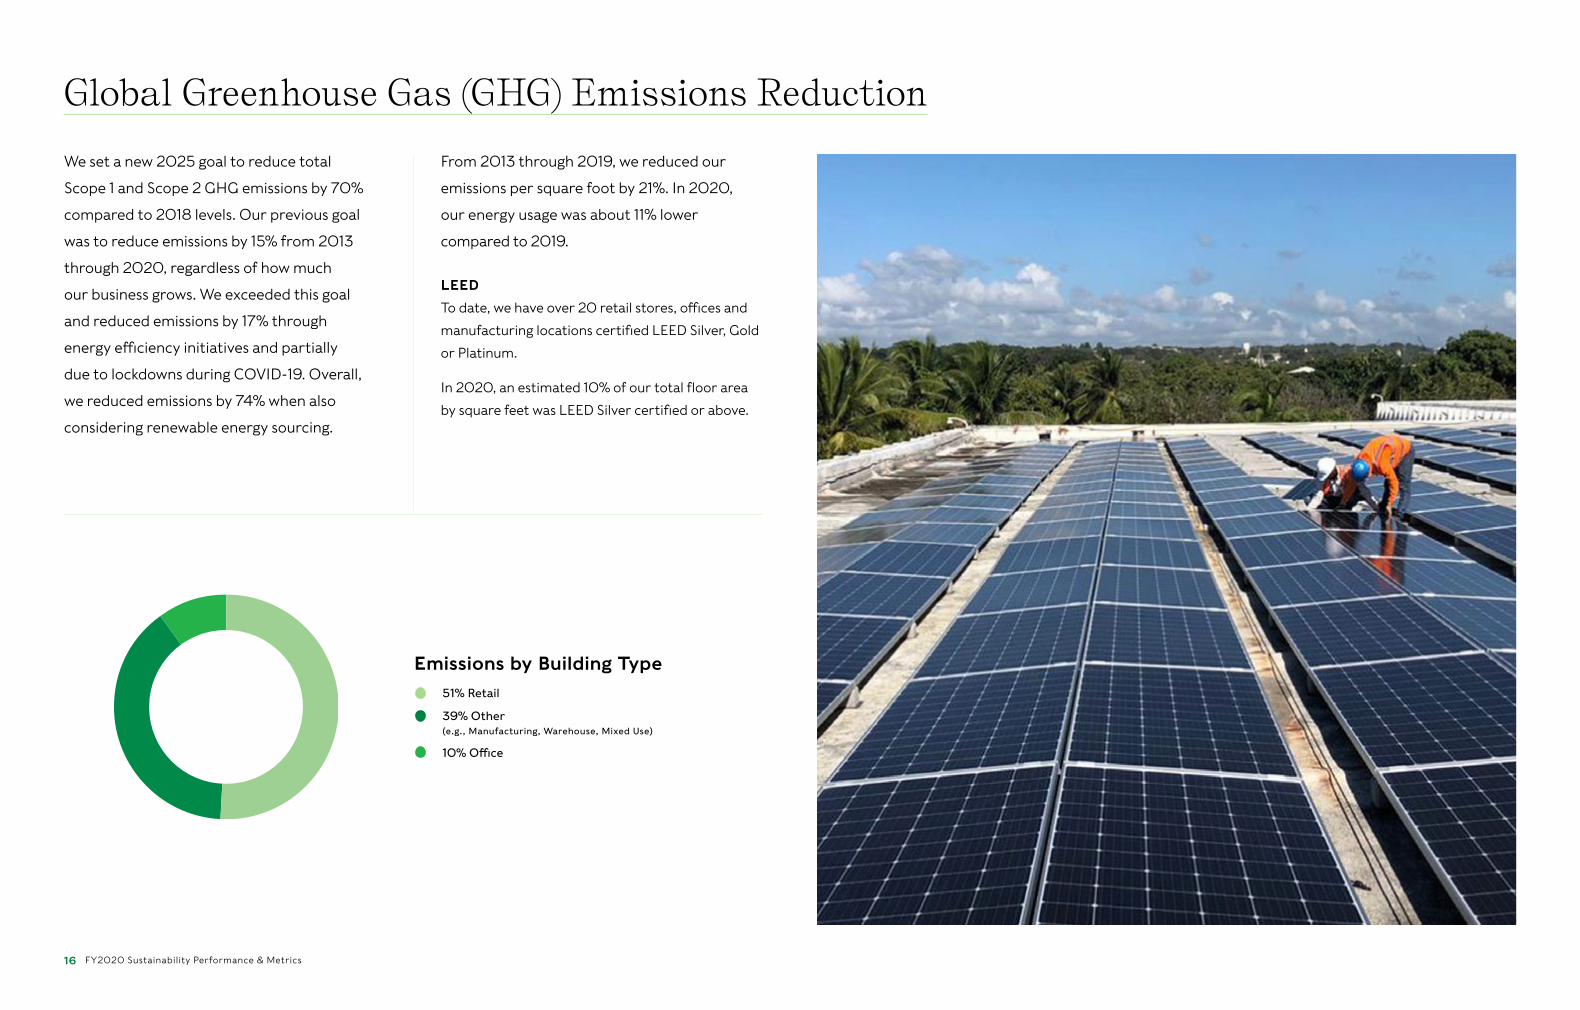
We set a new 2025 goal to reduce total
Scope 1 and Scope 2 GHG emissions by 70%
compared to 2018 levels. Our previous goal
was to reduce emissions by 15% from 2013
through 2020, regardless of how much
our business grows. We exceeded this goal
and reduced emissions by 17% through
energy efficiency initiatives and partially
due to lockdowns during COVID-19. Overall,
we reduced emissions by 74% when also
considering renewable energy sourcing.
From 2013 through 2019, we reduced our
emissions per square foot by 21%. In 2020,
our energy usage was about 11% lower
compared to 2019.
LEED
To date, we have over 20 retail stores, offices and
manufacturing locations certified LEED Silver, Gold
or Platinum.
In 2020, an estimated 10% of our total floor area
by square feet was LEED Silver certified or above.
Global Greenhouse Gas (GHG) Emissions Reduction
FY2020 Sustainability Performance & Metrics
51% Retail
39% Other
10% Office
(e.g., Manufacturing, Warehouse, Mixed Use)
Emissions by Building Type

17 FY2020 Sustainability Performance & Metrics
Scope 3 GHG Emissions
Addressing our Scope 3 value chain emissions,
which represent about 90% of our carbon
footprint, is a critical component of our climate
strategy to ensure we address the emissions of
any activities related to our business.
Of the 15 categories used to measure Scope 3
emissions, according to the Greenhouse Gas
Protocol, 11 are relevant to Tiffany’s value chain.
Purchased goods and services represent the
largest category of Scope 3 emissions for
Tiffany, as it includes Tiffany’s raw materials
procurement as well as finished goods.
Global Greenhouse Gas (GHG) Emissions Reduction
72% Purchased Goods and Services
<1% Business Travel
<1% Downstream Leased Assets
<1% Investment
Scope 3 Emissions by Category
(not included in Scope 1 or 2)
13% Upstream Transportation and Distribution
7% Downstream Transportation and Distribution
6% Employee Commuting
1% Fuel- and Energy-related Activities
1% Processing of Sold Products
(Both capital goods and waste generated in operations are included in the purchased goods and services category)

18
Base Year 2013 2018 2019 2020 Change 2013–2020
ENERGY USE
Total Energy Use (MWh) 107,936 117,856 116,424 104,657 3%
Renewable Electricity Use (Percent of Total Global Electricity) ‡ 1.2% 83% 84% 85%* 70x
EMISSIONS (Metric Tons of CO2e)
Scope 1 ‡ 2,556 3,151 2,977 2,617* 2%
Scope 2 (Location-based) ‡ 40,750 41,420 36,780 33,353* 18%
TOTAL‡ 43,306 44,571 39,757 35,790* 17%
EMISSIONS AFTER ACCOUNTING FOR TIFFANY & CO.’S RENEWABLE ENERGY PURCHASES
Scope 1 ‡ 2,556 3,151 2,977 2,617* 2%
Scope 2 (Market-based) ‡ 39,773 11,928 10,223 8,583* 78%
TOTAL‡ 42,329 14,449 13,200 11,199* 74%
EMISSIONS INTENSITY (Scope 1 and Scope 2 Location-based)
By Building Area (Pounds of CO2e/Square Foot) ‡ 34.2 30.7 26.9 24.1* 29%
Energy Intensity by Building Area (kWh/Square Foot) 38.6 36.8 35.7 31.8 18%
Electricity Intensity (kWh/Square Foot) 30.7 28.8 28.2 25.5 17%
Global Energy & Greenhouse Gas (GHG) Emissions Performance
* See the Report of Independent Accountants
‡ See the Report of Independent Accountants for historical data previously reviewed (includes Scope 1, Scope 2 Location-based and Emissions Intensity by Building Area). Scope 2 Market-based emissions were also previously assured for 2018 and 2019. Our global GHG emissions includes Scope 1 (i.e., direct emissions from sources such as onsite boilers and generators) and Scope 2 (i.e., indirect emissions primarily from electricity use).
We present Scope 2 emissions calculated before and after accounting for renewable electricity procurement. Our inventory includes more than 300 stores, as well as distribution centers, manufacturing and diamond division facilities, and domestic and international offices and repair facilities.
FY2020 Sustainability Performance & Metrics
2020 GOAL ACHIEVED
2020 GOAL ACHIEVED

19
Definition of MetricsThis table defines the sustainability metrics
reported in our sustainability reporting and
disclosures or used as a basis for the statements
made. Items with an asterisk (*) are part of
Management’s Assertion on sustainability
metrics which has been assured, as indicated
in the Report of Independent Accountants.
Term Definition
PRODUCT
Jewelry Manufactured Internally The approximate percentage, by dollar value, of jewelry sold by Tiffany & Co. that is
internally manufactured relative to all finished goods jewelry sold.
Economic Beneficiation (Botswana)* The U.S. dollar equivalent of beneficiation paid during the calendar year by Tiffany & Co.
in Botswana (a diamond-producing country whose government requires beneficiation).
This amount includes payments to domestic suppliers for rough diamonds, local partner
fees, materials and services, taxes, community donations, training and development,
income taxes and payroll and benefit costs related to the Laurelton Diamonds facility and
local employees.
ROUGH DIAMOND TRACEABILITY
Rough Diamonds Purchased The weight in carats of rough diamonds purchased by Tiffany & Co. via Laurelton
Diamonds; all rough diamonds purchased by Tiffany & Co., regardless of country of origin,
are processed through either Botswana or Belgium. Data is tracked in Botswana in the
calendar year and in Belgium in the fiscal year as evidenced by the supplier invoice.
Rough Diamonds Traceable to
Mine or Source*
The weight in carats, expressed as a percentage, of rough diamonds received by Tiffany &
Co., which were purchased directly from a supplier that sources from one mine or from a
supplier that sources from multiple known mines, but is not traceable to a specific mine. All
rough diamonds purchased by Tiffany & Co., regardless of country of origin, are processed
through either Botswana or Belgium. Data includes purchases via Laurelton Diamonds in
Botswana in the calendar year and in Belgium in the fiscal year and is indicated by either
the contractual terms with the supplier which require the diamonds to be purchased from
a specific mine(s), the details listed on the invoice received or information available on the
specific supplier’s website with respect to mining location in the purchasing year.
POLISHED DIAMOND TRACEABILITY
Polished Diamonds Purchased The weight in carats of polished diamonds purchased by Tiffany & Co. in the calendar year
as evidenced by receipts, and Laurelton Diamonds or third-party supplier invoices.
Polished Diamonds from Internally
Sourced Rough Diamonds
The percentage, by dollar value, of polished diamonds purchased by Tiffany & Co. in the
calendar year from Laurelton Diamonds as indicated by receipts and Laurelton Diamonds
invoices.
Third-Party-Sourced Polished Diamonds The percentage, by dollar value, of polished diamonds purchased by Tiffany & Co. in the
calendar year from a third-party supplier as indicated by receipts and the supplier invoice.
*See the Report of Independent Accountants * See the Report of Independent Accountants
FY2020 Sustainability Performance & Metrics

20
Term Definition
PRECIOUS METALS TRACEABILITY
Precious Metals Purchased The weight in troy ounces of silver, gold and platinum procured by Tiffany & Co. either as a direct
purchase from a mine, metal recycler or metal refiner, or included in third-party manufactured
components or finished goods.
Raw Direct Precious Metals
Traceable to Mine*
The weight in troy ounces, expressed as a percentage, of raw silver, gold and platinum procured
directly from a mine as evidenced by the contractual terms with the supplier which require the
metals to be purchased from a specific mine(s) or the details listed on the invoice received.
Raw Direct Precious Metals
Traceable to Recycler*
The weight in troy ounces, expressed as a percentage, of raw silver, gold and platinum procured
directly from a recycler as evidenced by the details listed on a chain-of-custody material
transfer document received from the supplier, or a statement on the recycler’s website stating
that the metal is 100% recycled.
Raw Direct Precious Metals
Traceable Only to Supplier
The weight in troy ounces, expressed as a percentage, of raw silver, gold and platinum that is
traceable to a supplier with mixed sources not otherwise traceable directly to a mine or a recycler.
WOOD & PAPER
Sustainably Sourced Blue Boxes,
Blue Bags, Marketing Collateral
and Catalogues*
The percentage of Tiffany Blue Boxes, blue bags (in number of cases), marketing collateral and
catalogues (by shipping weight) procured by Tiffany & Co. or on behalf of Tiffany & Co. by our
external procurement partners during fiscal year that is in alignment with either the principles of
“Best” or “Better” categories, as laid out in the Tiffany Sustainable Wood and Paper Guidance.
Recycled Content The percentage of recycled and post-consumer recycled material, as evidenced by certifications
provided on supplier invoices or supplier claims and product descriptions.
WOOD AND PAPER SOURCING GUIDELINE CATEGORIES
Best The percentage, by weight, of materials that are either: (1) FSC® certified or (2) verified as made
from 100% recycled content as evidenced by FSC® or other third-party certification claims on
supplier invoices.
Better The percentage, by weight, of materials that are either: (1) made with content a supplier has
third-party assessed to meet controlled wood standards for which Tiffany & Co. uses the FSC®
standards (FSC®-STD-40-005) to define and evaluate; (2) certified to regional PEFC standards
and originate from countries listed as “low risk” for conversion and high conservation values by
NEPCon’s Sourcing Hub (previously the Global Forest Registry); (3) content originally certified
(per FSC® standards), but not provided to Tiffany as certified by its direct supplier or (4) made
from reclaimed or repurposed wood and uncertified recycled paper, excluding any wood species
protected by CITES or listed as Near Threatened or Threatened on the IUCN Red List.
Known and Legal The percentage, by weight, of materials that are either: (1) made with content which originates
from countries listed as “low risk” for legality by NEPCon’s Sourcing Hub (previously the Global
Forest Registry) or (2) verified by a third party which provides assurance of legality.
Term Definition
LEATHER TRACEABILITY
Traceable to Farm and Tannery The quantity of each leather type purchased for products in our Home & Accessories and
jewelry categories (excludes leather types used on watch straps) that is traceable to the
farm and tannery as a percentage of overall purchases as evidenced by supplier invoices and
contractual terms.
Traceable to Tannery The quantity of each leather type purchased for products in our Home & Accessories and
jewelry categories (excludes leather types used on watch straps) that is traceable only to the
tannery as a percentage.
TIFFANY MANUFACTURING & SUPPLIER RESPONSIBILITY
Supplier Risk Assessment Results* The percentage of all active suppliers in the Social and Environmental Accountability Program
at each risk level (High, Medium, Low, Unrated) during the period covered by the last completed
audit cycle. The supplier risk assessment results are calculated through a multi-layered risk
assessment process based on the supplier’s self-assessment, industry and geographic location.
Supplier Conformance* The percentage of active supplier facilities within the Social and Environmental Accountability
Program that receive satisfactory, minor non-conformance, major non-conformance, or critical
audit results during the period of the last completed audit cycle.
Supplier Non-conformance Categories The areas of non-conformance following the most recent audit of all active suppliers within the Social
and Environmental Accountability Program during the period of the last completed audit cycle.
Audits The percentage of active suppliers in the Social and Environmental Accountability Program that
have undergone a third-party audit during the two-year audit cycle.
PLANET
Energy Use The actual and estimated energy use by Tiffany & Co., expressed in MWh, including electricity,
natural gas, diesel, steam, chilled water, propane, acetylene, wax and vehicle fuels.
Scope 1 Emissions Direct emissions from owned or controlled sources, including onsite boilers and generators (in
line with GHG Protocol Corporate Standard).
Scope 2 Emissions Indirect emissions from the generation of purchased energy, primarily from electricity use (in
line with GHG Protocol Corporate Standard).
Scope 3 Emissions All indirect emissions (not included in Scope 2) that occur in Tiffany’s value chain, including
upstream and downstream emissions (in line with GHG Protocol Corporate Standard).
Greenhouse Gas Emissions* The quantity in metric tons of carbon-dioxide-equivalent greenhouse gas emissions, including
direct (Scope 1), indirect (Scope 2 location-based or market-based) and total emissions. Direct
and indirect emissions include electricity, natural gas, diesel, steam, chilled water, propane,
acetylene, wax, vehicle fuels and refrigerants.
*See the Report of Independent Accountants * See the Report of Independent Accountants
FY2020 Sustainability Performance & Metrics

21
Term Definition
PLANET
Carbon Intensity: Building Area
(Greenhouse Gas Emissions per
Square Foot)*
The quantity in pounds of carbon-dioxide-equivalent greenhouse gas emissions per square foot
of operated space, including total direct (Scope 1) and indirect (Scope 2 location-based or market-
based) emissions.*
Energy or Electricity Intensity:
Building Area (Energy per Square Foot)
The actual and estimated energy use by Tiffany & Co. per square foot of operated space, expressed
in kWh per square foot. Energy intensity includes electricity, natural gas, diesel, steam, chilled water,
propane, acetylene, wax and vehicle fuels, while electricity intensity includes only electricity use.
Electricity from Renewable Sources* The amount of electricity from renewable sources (e.g., solar and wind), either procured from the
market or produced on site expressed in total MWh or as a percent of global electricity use.
PEOPLE
Local Employee Ratio* The diversity of the Laurelton global workforce, including temporary and seasonal employees,
according to local or expatriate status as recorded in the Company’s Human Resources records,
as of the end of the fiscal year.
Ethnic Diversity (United States)* The diversity of the Tiffany & Co. U.S. workforce, including temporary and seasonal employees,
according to ethnicity as self-reported and recorded by employees in the Company’s Human
Resources systems using data for the time period of October 1, 2020 to October 14, 2020.
Persons of Color Tiffany & Co. U.S. workforce, including temporary and seasonal employees, that self-identify as
American Indian or Alaska Native, Asian, Black or African-American, Hispanic or Latino, Native
Hawaiian or Other Pacific Islander, or Two or More Races, as self-reported and recorded by
employees in the Company’s Human Resources systems using data for the time period of
October 1, 2020 to October 14, 2020.
Gender Diversity by
Management Level*
The diversity of the Tiffany & Co. global workforce, including temporary and seasonal employees,
according to gender as self-reported and management level as recorded in the Company’s Human
Resources systems using data for the time period of October 1, 2020 to October 14, 2020.
Senior Management Senior Management is separately tracked and presented as of the end of the fiscal year.
Generation Diversity* The diversity of the Tiffany & Co. global workforce, including temporary and seasonal employees,
according to date of birth as self-reported and recorded in the Company’s Human Resources systems
as of the end of the fiscal year.
Term Definition
PHILANTHROPY
Charitable Giving Total contributions by Tiffany & Co. through our Corporate Giving program, Employee Giving and
Volunteer Matching programs and to The Tiffany & Co. Foundation endowment.
Corporate Giving Total U.S. dollar contribution by type of donation (monetary, merchandise) to charitable
organizations globally.
Employee Giving Program Total Tiffany & Co. contributions through the Employee Giving program open to U.S., Canada,
Australia, New Zealand, United Kingdom, Ireland and Hong Kong employees, tracked by the matching
monetary donations, the number of unique employees participating in the program and the number
of charities to which donations have been made.
Volunteer Matching Program Total Tiffany & Co. monetary contributions through the Volunteer Matching program made to
charities where U.S., Canada, Australia, New Zealand, United Kingdom, Ireland, and Hong Kong
employees have volunteered their personal time, tracked by the matching monetary donations, the
number of unique employees participating in the program, the number of hours volunteered and the
number of charities to which donations have been made.
Foundation Grantmaking* The U.S. dollar amount of grants that The Tiffany & Co. Foundation paid to U.S. nonprofit
organizations during the calendar year.
* See the Report of Independent Accountants * See the Report of Independent Accountants
FY2020 Sustainability Performance & Metrics

22
Report of Independent Accountants
Independent Accountants’ Review Report
The Board of Directors and ManagementTiffany & Co.:
We have reviewed the Selected Metrics identified with an asterisk (*) (the Selected Metrics) included in the accompanying Sustainability Performance and Metrics Report of Tiffany & Co. (the Company) for the fiscal year ended January 31, 2021 (the Report). The Company’s management is responsible for preparing and presenting the Selected Metrics in accordance with the corresponding reporting criteria set forth in Appendix A of the Sustainability Performance and Metrics Report (the criteria). Our responsibility is to express a conclusion on the Selected Metrics based on our review.
Our review was conducted in accordance with attestation standards established by the American Institute of Certified Public Accountants. Those standards require that we plan and perform the review to obtain limited assurance about whether any material modifications should be made to the Selected Metrics in order for it to be in accordance with the criteria. A review is substantially less in scope than an examination, the objective of which is to obtain reasonable assurance about whether the Selected Metrics is in accordance with the criteria, in all material respects, in order to express an opinion. Accordingly, we do not express such an opinion. We believe that our review provides a reasonable basis for our conclusion.
The preparation of the Selected Metrics requires management to interpret the criteria, make determinations as to the relevancy of information to be included, and make estimates and assumptions that affect reported information. The selection of different but acceptable measurement techniques can result in materially different measurements. The precision of different measurement techniques may also vary.
Based on our review, we are not aware of any material modifications that should be made to the Company’s management assertion presented in Appendix A in order for it to be fairly stated.
New York, New YorkMay 26, 2021
KPMG LLP345 Park AvenueNew York, NY 10154-0102
KPMG LLP, a Delaware limited liability partnership and a member firm of the KPMG global organization of independent member firms affiliated with KPMG International Limited, a private English company limited by guarantee.
FY2020 Sustainability Performance & Metrics

23
Metric Description Definition of Metric and Assessment Criteria Metric Quantity
Percentage raw
direct metals
traceable to mine
The weight in troy ounces, expressed as a percentage, of raw silver,
gold and platinum procured directly from a mine during the period
February 1, 2020 to January 31, 2021 by Laurelton Sourcing, LLC,
(a wholly owned subsidiary of Tiffany & Co.), for the Tiffany & Co.
manufacturing facilities. Procurement is as indicated by either (1)
the contractual terms with the supplier, which require metals to be
purchased from a specific mine(s) or if unavailable (2) the details
listed on the invoice received.
Total Raw Direct Precious Metals
Traceable to Mine – 46%
Silver – 49%
Gold – 16%
Platinum – 70%
Percentage raw
direct metals
traceable to recycler
The weight in troy ounces, expressed as a percentage, of raw silver,
gold and platinum procured directly from a precious metals refiner
whose output is recycled metal during the period February 1, 2020
to January 31, 2021 by Laurelton Sourcing, LLC (a wholly owned
subsidiary of Tiffany & Co.), for the Tiffany & Co. manufacturing
facilities. Procurement is as indicated by either (1) the details listed
on a chain of custody material transfer document received from the
supplier, or if unavailable (2) a statement on the recycler’s website
as of January 31, 2020 and January 31, 2021 stating that the metal
is 100% recycled.
Total Raw Direct Precious Metals
Traceable to Recycler – 54%
Silver – 51%
Gold – 84%
Platinum – 30%
Percentage rough
diamonds traceable
to the mine or source
The weight in carats, expressed as a percentage, of rough diamonds
received by Tiffany & Co. which were purchased directly from a
supplier that sources from one mine or from a supplier that sources
from multiple known mines, but is not traceable to a specific mine,
during the period January 1, 2020 to December 31, 2020 via
Laurelton Diamonds in Botswana, and February 1, 2020 to January
31, 2021 via Laurelton Diamonds in Belgium, as indicated by either
(1) the contractual terms with the supplier, which require the
diamonds to be purchased from a specific mine(s), or if unavailable
(2) the details listed on the invoice received, or if unavailable (3)
information available on the specific supplier’s website with respect
to mining location in the purchasing year.
100%
Economic beneficiation –
Botswana
The U.S. dollar equivalent of beneficiation paid during the period
January 1, 2020 to December 31, 2020 by Tiffany & Co. in Botswana
(a diamond-producing country whose government requires
beneficiation). This amount includes payments to domestic suppliers
for rough diamonds, local partner fees, materials and services,
income taxes and payroll, benefit costs taxes, community donations,
training and development related to the Laurelton Diamonds facility
and local employees.
$43,922,286
Appendix A
Management Assertion
Tiffany & Co. is responsible for the completeness, accuracy and validity of the
sustainability disclosures and accompanying metrics reported on Tiffany & Co.’s
Tiffany.com/Sustainability website as of or for the periods indicated. The sustainability
metrics presented include Tiffany & Co. and its subsidiary operations (hereinafter,
“Tiffany & Co.”). Data was collected for Tiffany & Co. global locations and activities
including retail stores, offices, manufacturing, distribution and warehouse locations.
With respect to the sustainability disclosures and accompanying metrics reported on
Tiffany & Co.’s Tiffany.com/Sustainability website identified and denoted by an asterisk (*),
management of Tiffany & Co. asserts that such sustainability metrics are presented in
conformity with the assessment criteria set forth below. The figures included in this report
have been rounded to the nearest whole number unless otherwise indicated. Management
of Tiffany & Co. is responsible for the selection or development of the criteria, which
management believes provide an objective basis for measuring and reporting on the
selected sustainability metrics.
The preparation of the metrics requires management to establish the criteria, make
determinations as to the relevancy of information to be included, and make assumptions
that affect reported information. The selection by management of different but
acceptable measurement techniques could result in materially different amounts or
metrics being reported.
FY2020 Sustainability Performance & Metrics

24
Metric Description Definition of Metric and Assessment Criteria Metric Quantity
Percentage of sustainably
sourced Blue Boxes, Blue Bags,
Marketing Collateral and
Catalogues
The percentage of Tiffany Blue Boxes, Blue Bags (in number
of cases), Marketing Collateral, and Catalogues (by shipping
weight) procured by Tiffany & Co. or on behalf of Tiffany & Co.
by our external procurement partners during the period of
February 1, 2020–January 31, 2021 that is in alignment with
either the principles of “Best” or “Better” categories, as laid
out in the Tiffany Sustainable Wood and Paper Guidance.
Blue Boxes – 100%
Blue Bags – 100%
Marketing Collateral – 100%
Catalogues – 100%
Percentage of suppliers
in Tiffany’s Social and
Environmental Accountability
Program at each category
of risk
The percentage of all active supplier facilities within the
Social and Environmental Accountability Program that
receive high, medium, or low risk ratings during the period
of the last completed audit cycle (February 1, 2018–
January 31, 2020).
High Risk Supplier Facilities – 9%
Medium Risk Supplier Facilities – 11%
Low Risk Supplier Facilities – 80%
Percentage of audited
suppliers in Tiffany’s Social
and Environmental
Accountability Program in
each conformance category
The percentage of active supplier facilities within the
Social and Environmental Accountability Program that
receive satisfactory, minor non-conformance, major non-
conformance, or critical audit results during the period
of the last completed audit cycle (February 1, 2018–
January 31, 2020).
Green (Satisfactory) – 9%
Yellow (Minor Non-Conformance) – 14%
Orange (Major Non-Conformance) – 59%
Red (Critical Non-conformance) – 18%
Non-conformance areas
by percentage
The areas of non-conformance following the most
recent audit of all active suppliers within the Social and
Environmental Accountability Program during the period
of the last completed audit cycle (February 1, 2018–
January 31, 2020).
Health and Safety – 61%
Environment – 13%
Hours of Work – 7%
Wages and Benefits – 6%
Other – 13%
Generation diversity The diversity of the global workforce, including temporary
and seasonal employees, according to date of birth as self-
reported and recorded in the Company’s Human Resources
systems as of January 31, 2021.
Born 1964 and Prior – 9%
Born 1965–1980 – 27%
Born 1981–1996 – 54%
Born 1997–Present – 10%
No Birthdate Listed – 0%
Generation diversity by
management level
The diversity of the global workforce, including temporary and
seasonal employees, according to the gender as self-reported
and recorded, and management level as recorded in the
Company’s Human Resources systems as of January 31, 2021.
Global Workforce
Female – 70%
Male – 29 %
Not Specified – 1%
Manager and Above
Female – 62%
Male – 37%
Not Specified – 1%
Vice President and Above
Female – 45%
Male – 55%
Not Specified – 0%
Metric Description Definition of Metric and Assessment Criteria Metric Quantity
Ethnic diversity – United States The diversity of the workforce, including temporary
and seasonal employees, employed in the United States
according to ethnicity as self-reported and recorded in
the Company’s Human Resources systems during the
time period of October 1, 2020 to October 14, 2020.
White – 47.8%
Hispanic or Latinx – 18%
Asian – 15.8 %
Black or African-American – 11.1 %
Native Hawaiian or Other Pacific Islander – .5%
American Indian or Alaska Native – .2 %
Two or More Races – 2.2 %
Not Specified – 4.4%
Local employee ratio The diversity of the Laurelton global workforce, including
temporary and seasonal employees, according to local or
expatriate status as recorded in the Company’s Human
Resources records as of January 31, 2021.
Local Headcount – 99%
Expatriate Headcount – 1%
Foundation grantmaking The U.S. dollar amount of grants that The Tiffany & Co.
Foundation paid to United States nonprofit organizations
during the period January 1, 2020 to December 31, 2020.
$3,998,000
Greenhouse gas emissions The quantity in metric tons of carbon dioxide equivalent
greenhouse gas emissions during the period February
1, 2020 to January 31, 2021. See below for additional
information on GHG emission factors and estimates.
Scope 1 – 2,617 tCO2e
Scope 2 (location-based) – 33,353 tCO2e
Scope 2 (market-based) – 8,583 tCO2e
Total (location-based) – 35,970 tCO2e
Total (market-based) – 11,199 tCO2e
Greenhouse gas emissions
per square foot
The quantity in pounds of carbon dioxide equivalent
greenhouse gas emissions per square foot of operated space
during the period February 1, 2020 to January 31, 2021.
See below for additional information on GHG emission
factors and estimates.
Total scope 1 and scope 2
(location-based) – 24.1 lbs CO2e/sq ft
Total scope 1 and scope 2
(market-based) – 7.5 lbs CO2e/sq ft
Electricity from
renewable sources
The amount of electricity that is generated and procured
from renewable sources, expressed as a percentage of total
global electricity in megawatt-hours (MWh) used during the
period February 1, 2020 to January 31, 2021 as indicated
by either (1) owned onsite system generation records, (2)
unbundled environmental attribute certificates, (3) contracts
with a renewable energy project that is not directly connected
to Tiffany operations, or (4) contracts for specific utility
products; and in all cases where Tiffany retains the exclusive
claim to the environmental attributes through proof of
generation, contractual ownership, or retirement of the
environmental attribute certificates.
Renewable Electricity – 71,872 MWh
Total Electricity – 84,062 MWh
Percentage of Electricity from
Renewable Sources – 85%
FY2020 Sustainability Performance & Metrics

25
Organizational boundaries
All impact boundaries are global and apply to Tiffany & Co. and its subsidiaries unless
otherwise stated in this document, Tiffany’s other sustainability reporting documents
or throughout Tiffany.com/Sustainability.
Social and Environmental Accountability Program Audit Cycle
Tiffany & Co.’s Social and Environmental Accountability Program follows a 2-year audit
cycle, with metrics reported at the end of the latest completed cycle. The latest completed
audit cycle is February 1, 2018-January 31, 2020.
GHG base data
In conformance with the GHG protocol, reported direct and indirect Scope 1 and
Scope 2 GHG emissions represent 100% of the emissions from the facilities where
Tiffany & Co. has operational control.
Base data utilized in the calculation of consolidated Scope 1 (direct) and Scope 2 (indirect)
GHG emissions is obtained from direct measurements, third-party invoices or estimates.
Tiffany & Co. estimates are used where measurement data is not readily available.
Estimation methodology for electricity, natural gas and other GHG emission sources
If no primary electricity, natural gas or steam usage data is available for a given month,
consumption is estimated based on the floor area occupied by Tiffany & Co. and the
Company’s regional average electricity, natural gas and steam use by building type
(Laurelton Diamonds, warehouse, manufacturing, retail, mixed use, office). The building
intensity metrics were established using 2013 data for all regions and building types.
Annual GHG emissions due to refrigerant leakage are estimated for all facilities based
on facility floor area. Emission intensity per square foot due to refrigerant leakage is
estimated based on a three-year average of actual data from 2010-2013 for all Tiffany
& Co. sites for which primary refrigerant data was available.
For each site that uses other fuels or GHG emission sources, such as acetylene, diesel, wax
or propane, annual usage is collected every three years and carried forward as estimates for
the following two years. For the current reporting year, 2019 actual data is used.
Approximately 30% of the Scope 1 and 2 (location-based) emissions are estimated for the
period February 1, 2020 to January 31, 2021.
Uncertainty
GHG quantification is subject to inherent measurement uncertainty because of such things
as GHG emissions factors that are used in mathematical models to calculate GHG emissions
and the inability of these models, due to incomplete scientific knowledge and other factors,
to accurately measure under all circumstances the relationship between various inputs and
the resultant GHG emissions. Environmental and energy use data used in GHG emissions
calculations are subject to inherent limitations, given the nature and the methods used for
measuring such data. The selection of different but acceptable measurement techniques
could result in materially different amounts of metrics being reported.
GLOBAL ESTIMATION FACTORS S
Facility TypeScope 1: Natural Gas Therms/Square Foot/Month
Scope 2: Electricity kWh/Square Foot/Month
Scope 2: Steam Lbs/Square Foot/Month
Laurelton Diamonds 0.02218 1.166 3.993
Warehouse 0.02218 1.330 3.993
Manufacturing 0.03512 1.428 3.993
Retail 0.00989 3.075 3.993
Mixed Use 0.02260 2.550 3.993
Office 0.02218 1.147 3.993
FY2020 Sustainability Performance & Metrics
26
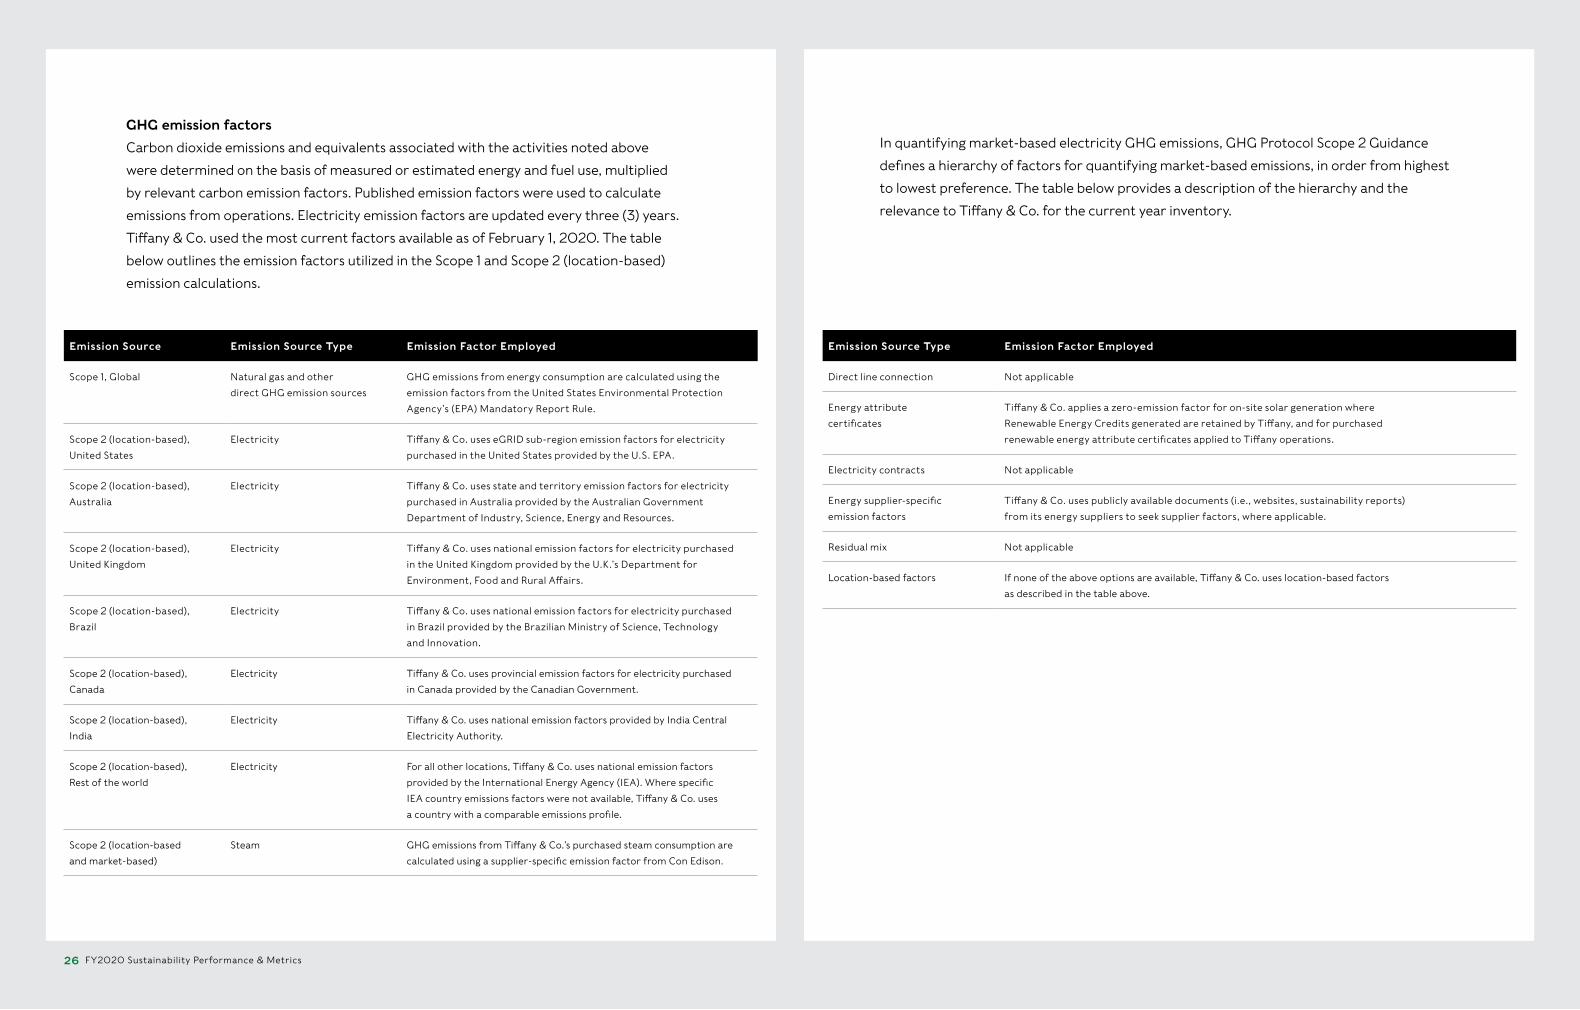
GHG emission factors
Carbon dioxide emissions and equivalents associated with the activities noted above
were determined on the basis of measured or estimated energy and fuel use, multiplied
by relevant carbon emission factors. Published emission factors were used to calculate
emissions from operations. Electricity emission factors are updated every three (3) years.
Tiffany & Co. used the most current factors available as of February 1, 2020. The table
below outlines the emission factors utilized in the Scope 1 and Scope 2 (location-based)
emission calculations.
Emission Source Emission Source Type Emission Factor Employed
Scope 1, Global Natural gas and other
direct GHG emission sources
GHG emissions from energy consumption are calculated using the
emission factors from the United States Environmental Protection
Agency’s (EPA) Mandatory Report Rule.
Scope 2 (location-based),
United States
Electricity Tiffany & Co. uses eGRID sub-region emission factors for electricity
purchased in the United States provided by the U.S. EPA.
Scope 2 (location-based),
Australia
Electricity Tiffany & Co. uses state and territory emission factors for electricity
purchased in Australia provided by the Australian Government
Department of Industry, Science, Energy and Resources.
Scope 2 (location-based),
United Kingdom
Electricity Tiffany & Co. uses national emission factors for electricity purchased
in the United Kingdom provided by the U.K.’s Department for
Environment, Food and Rural Affairs.
Scope 2 (location-based),
Brazil
Electricity Tiffany & Co. uses national emission factors for electricity purchased
in Brazil provided by the Brazilian Ministry of Science, Technology
and Innovation.
Scope 2 (location-based),
Canada
Electricity Tiffany & Co. uses provincial emission factors for electricity purchased
in Canada provided by the Canadian Government.
Scope 2 (location-based),
India
Electricity Tiffany & Co. uses national emission factors provided by India Central
Electricity Authority.
Scope 2 (location-based),
Rest of the world
Electricity For all other locations, Tiffany & Co. uses national emission factors
provided by the International Energy Agency (IEA). Where specific
IEA country emissions factors were not available, Tiffany & Co. uses
a country with a comparable emissions profile.
Scope 2 (location-based
and market-based)
Steam GHG emissions from Tiffany & Co.’s purchased steam consumption are
calculated using a supplier-specific emission factor from Con Edison.
In quantifying market-based electricity GHG emissions, GHG Protocol Scope 2 Guidance
defines a hierarchy of factors for quantifying market-based emissions, in order from highest
to lowest preference. The table below provides a description of the hierarchy and the
relevance to Tiffany & Co. for the current year inventory.
Emission Source Type Emission Factor Employed
Direct line connection Not applicable
Energy attribute
certificates
Tiffany & Co. applies a zero-emission factor for on-site solar generation where
Renewable Energy Credits generated are retained by Tiffany, and for purchased
renewable energy attribute certificates applied to Tiffany operations.
Electricity contracts Not applicable
Energy supplier-specific
emission factors
Tiffany & Co. uses publicly available documents (i.e., websites, sustainability reports)
from its energy suppliers to seek supplier factors, where applicable.
Residual mix Not applicable
Location-based factors If none of the above options are available, Tiffany & Co. uses location-based factors
as described in the table above.
FY2020 Sustainability Performance & Metrics

TIFFANY, TIFFANY & CO., T&CO., the design and word mark TIFFANY BLUE BOX and the color and word mark TIFFANY BLUE are trademarks or registered trademarks of Tiffany and Company and its affiliates, in the U.S.
and other countries. All designs copyrighted by Tiffany and Company. © 2021 T&CO.
Related Documents