OFFICE OF THE NEW YORK STATE COMPTROLLER DIVISION OF LOCAL GOVERNMENT AND SCHOOL ACCOUNTABILITY Thomas P. DiNapoli • State Comptroller Fiscal Stress Drivers and Coping Strategies ResearchBrief As New York emerges from the Great Recession, many of its local governments are still struggling with its repercussions, some more than others. 1 Numerous factors, including decreasing tax bases, growing fixed budget costs, losses in population and a deteriorating industrial sector have created chronic budget gaps and significant fiscal stress in counties, cities, towns and villages across New York. OSC’s recent fiscal profiles and reports have put a spotlight on the challenges facing the State’s cities, in particular. The challenges to local government officials in budgeting, even in good times, are multiple: how to project uncertain revenue sources and expenditure categories; how to estimate contractual step and salary increases; how to keep property taxes within acceptable boundaries; and so on. In hard economic times, when resources are more constrained, these challenges are compounded. When a local government falters in the essential task of maintaining structurally balanced budgets, the repercussions can be great. Some local governments in other states have even filed bankruptcy petitions. Although none have done so in New York, the State has had to step in to address instances of fiscal crisis in the past. The State’s response to local government fiscal crisis has historically been, and continues to be, largely ad hoc. Depending on the situation, the Legislature may take action, ranging from providing emergency one-time aid to allowing deficit financing to appointing a control board with extraordinary powers. In exchange for whatever assistance it provides, the Legislature generally imposes additional requirements on the local government. In the case of one-time aid, this may include requiring multiyear planning; in instances of deficit financing, it includes quarterly budget reporting, multiyear planning and budget oversight by the State Comptroller; and in the case of a control board, the Legislature may even invoke a fairly severe restriction of local control over certain fiscal decisions. “Fiscal stress” is a concept that seeks to measure the extent to which a local government is in danger of a fiscal crisis warranting intercession by the State, especially actions that could reduce local control. This report details some of the factors that could put a local government in greater danger of fiscal stress or even fiscal crisis, identifies which classes and types of local governments are likely to show up as having high stress levels according to each indicator, and reviews some of the steps local officials can take to escape or avoid stress. The report also identifies some of the resources the Comptroller’s Office offers to provide assistance.

Welcome message from author
This document is posted to help you gain knowledge. Please leave a comment to let me know what you think about it! Share it to your friends and learn new things together.
Transcript
O F F I C E O F T H E N E W YO R K S TAT E CO M P T R O L L E R
DIV IS ION OF LOCAL GOVERNMENT AND SCHOOL ACCOUNTABIL ITY
Thomas P. DiNapoli • State Comptroller
Fiscal Stress Drivers and Coping Strategies
ResearchBrief
As New York emerges from the Great Recession, many of its local governments are still struggling with its repercussions, some more than others.1 Numerous factors, including decreasing tax bases, growing fixed budget costs, losses in population and a deteriorating industrial sector have created chronic budget gaps and significant fiscal stress in counties, cities, towns and villages across New York. OSC’s recent fiscal profiles and reports have put a spotlight on the challenges facing the State’s cities, in particular.
The challenges to local government officials in budgeting, even in good times, are multiple: how to project uncertain revenue sources and expenditure categories; how to estimate contractual step and salary increases; how to keep property taxes within acceptable boundaries; and so on. In hard economic times, when resources are more constrained, these challenges are compounded. When a local government falters in the essential task of maintaining structurally balanced budgets, the repercussions can be great. Some local governments in other states have even filed bankruptcy petitions. Although none have done so in New York, the State has had to step in to address instances of fiscal crisis in the past.
The State’s response to local government fiscal crisis has historically been, and continues to be, largely ad hoc. Depending on the situation, the Legislature may take action, ranging from providing emergency one-time aid to allowing deficit financing to appointing a control board with extraordinary powers. In exchange for whatever assistance it provides, the Legislature generally imposes additional requirements on the local government. In the case of one-time aid, this may include requiring multiyear planning; in instances of deficit financing, it includes quarterly budget reporting, multiyear planning and budget oversight by the State Comptroller; and in the case of a control board, the Legislature may even invoke a fairly severe restriction of local control over certain fiscal decisions.
“Fiscal stress” is a concept that seeks to measure the extent to which a local government is in danger of a fiscal crisis warranting intercession by the State, especially actions that could reduce local control. This report details some of the factors that could put a local government in greater danger of fiscal stress or even fiscal crisis, identifies which classes and types of local governments are likely to show up as having high stress levels according to each indicator, and reviews some of the steps local officials can take to escape or avoid stress. The report also identifies some of the resources the Comptroller’s Office offers to provide assistance.
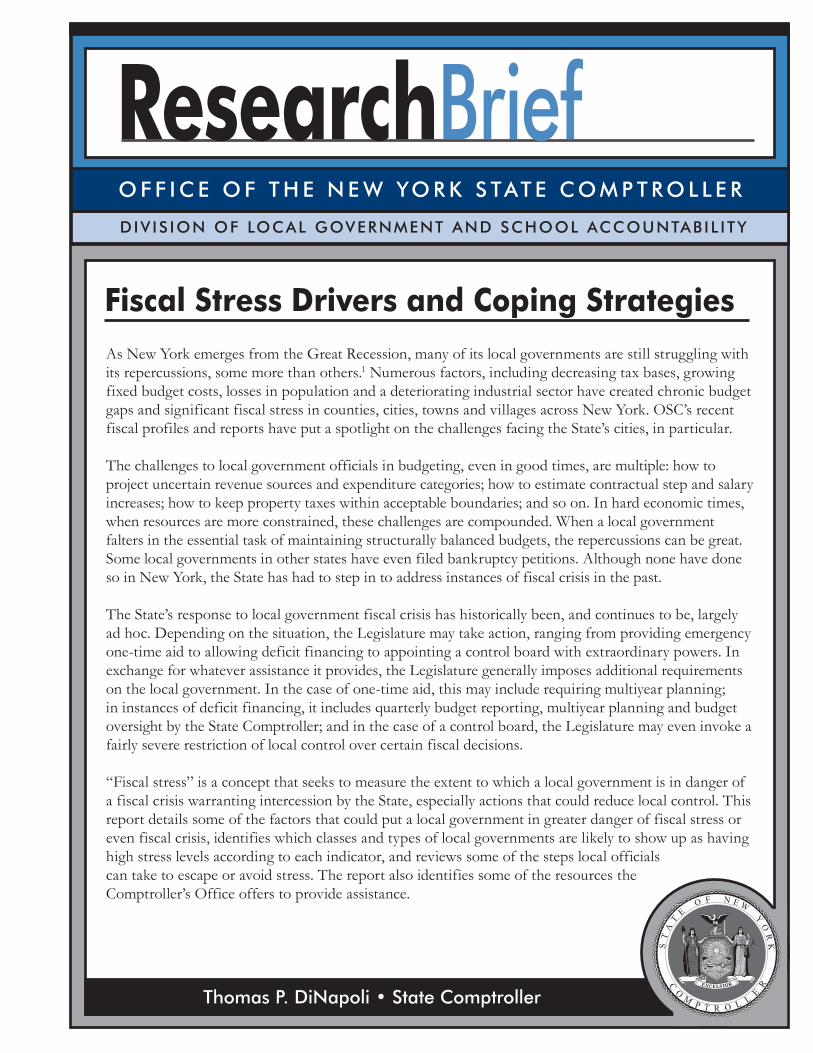
In recognition of the additional challenges most New York State cities face, the Comptroller has been issuing a series of fiscal profiles on individual cities. Although each city has its own set of unique circumstances, many share the same long-term problems.
New York’s cities have struggled for decades with population declines and stagnant or shrinking property values. Although New York City has staged a remarkable recovery since its worst fiscal troubles in the 1970s, many of the State’s other cities have not been successful in turning the tide. The total population of New York’s other cities has dropped by about 25 percent since 1950. Buffalo lost more than half its population, and Rochester and Syracuse have lost more than one third each.
The populations that have remained in cities are poorer as well, with a median household income of $38,699 compared with a State median of $56,951 and a median child poverty rate of 27 percent compared with the State’s child poverty rate of 19.9 percent. Property values are also much lower, with a city median home value of $99,700 as compared to the State’s median home value of $301,000.
2 Research Brief Office of the State Comptroller
Environmental Stressors
Local government fiscal stress can be an outcome of any number of factors, including poor economic conditions or poor fiscal management. In the case of the latter, local official training and public awareness can lead to better management practices, which can often improve the fiscal picture in a relatively short period of time. Where the local economic picture is one of long- or even short-term decline, the situation becomes more difficult. Some local governments – including many of the State’s cities – struggle with ongoing population loss and property value stagnation. And the recent recession has negatively affected all local governments in the State to one degree or another. These factors, which are outside the immediate control of local officials, make it more difficult to avoid fiscal stress.
1.6
2.8 3.0
2.2
0.00 0.50 1.00 1.50 2.00 2.50 3.00 3.50
Population of Cities in New York State (excl. New York City)
Source: U.S. Census Bureau
Mill
ions
Cities: A Case Study
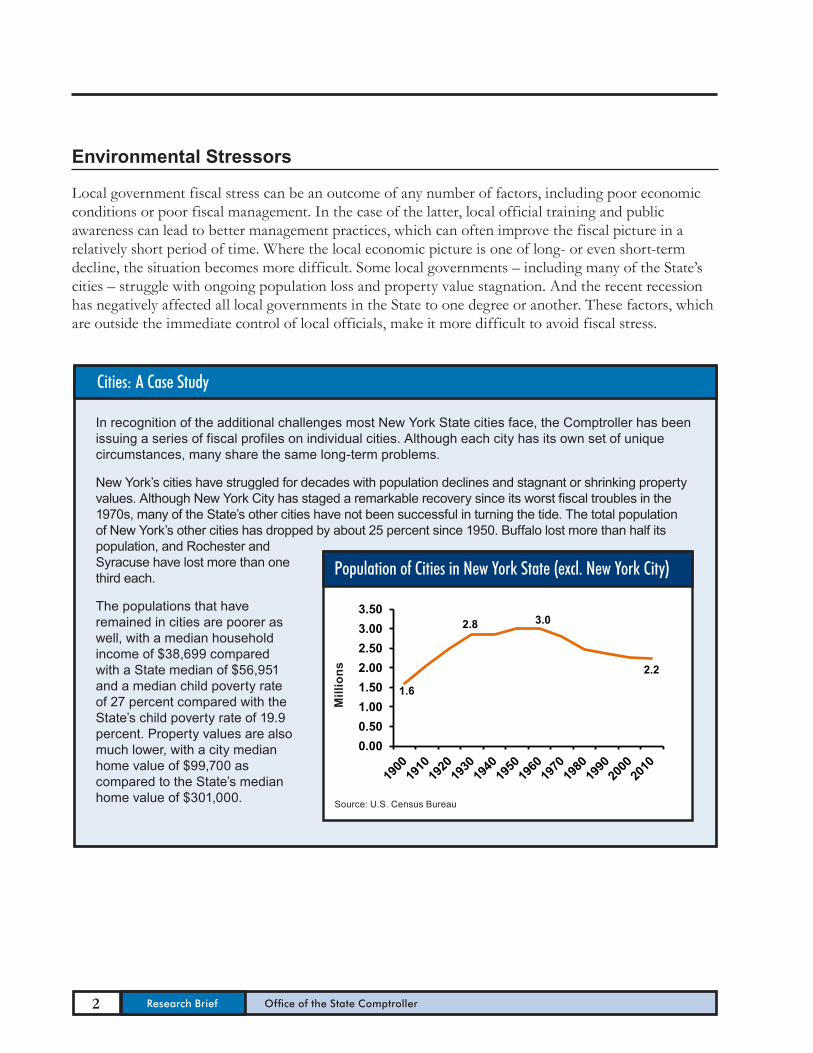
Demographic Stressors
Long-term shifts in demographics can affect both a local government’s demand for services and its ability to pay for them. Population losses can shrink sales tax and real property tax bases, while aging populations and high poverty rates can lead to increases in spending for social services. In the 20 years between 1990 and 2010, New York’s 7.7 percent growth in population lagged that of most other states. Within the State, many cities and villages experienced actual declines in population, a continuation of the long-term trend of suburbanization and deindustrialization that started in most of the State’s cities in the 1950s and 1960s (see “Cities: A Case Study,” above).
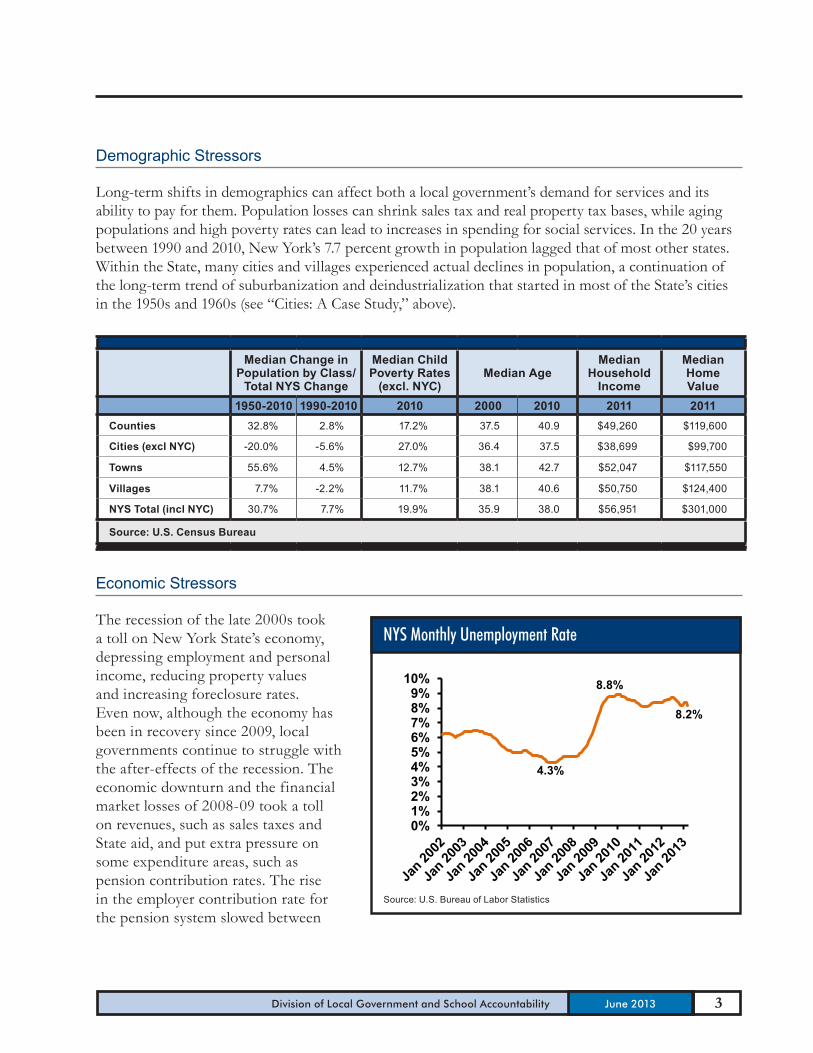
Economic Stressors
The recession of the late 2000s took a toll on New York State’s economy, depressing employment and personal income, reducing property values and increasing foreclosure rates. Even now, although the economy has been in recovery since 2009, local governments continue to struggle with the after-effects of the recession. The economic downturn and the financial market losses of 2008-09 took a toll on revenues, such as sales taxes and State aid, and put extra pressure on some expenditure areas, such as pension contribution rates. The rise in the employer contribution rate for the pension system slowed between
4.3%
8.8%
8.2%
0% 1% 2% 3% 4% 5% 6% 7% 8% 9%
10%
NYS Monthly Unemployment Rate
Source: U.S. Bureau of Labor Statistics
3 Division of Local Government and School Accountability June 2013
Median Change in Population by Class/
Total NYS Change
Median Child Poverty Rates
(excl. NYC)Median Age
Median Household
Income
Median Home Value
1950-2010 1990-2010 2010 2000 2010 2011 2011Counties 32.8% 2.8% 17.2% 37.5 40.9 $49,260 $119,600
Cities (excl NYC) -20.0% -5.6% 27.0% 36.4 37.5 $38,699 $99,700
Towns 55.6% 4.5% 12.7% 38.1 42.7 $52,047 $117,550
Villages 7.7% -2.2% 11.7% 38.1 40.6 $50,750 $124,400
NYS Total (incl NYC) 30.7% 7.7% 19.9% 35.9 38.0 $56,951 $301,000
Source: U.S. Census Bureau
$5.01
$6.62
$6.23
$7.01
$4.00
$4.50
$5.00
$5.50
$6.00
$6.50
$7.00
$7.50
County Sales Tax Collections
Source: NYS Department of Taxation and Finance
Bill
ions
5.0%
10.8%
-4.9% -6% -4% -2% 0% 2% 4% 6% 8%
10% 12%
Change Over Prior Year in Combined State and Federal Aid to Local Governments
Source: OSC; State aid component excludes Mortgage Recording Tax
Perc
enta
ge C
hang
e
4 Research Brief Office of the State Comptroller
2012-13 and 2013-14, but the stock market crash of State Fiscal Year (SFY) 2008-09 will continue to put upward pressure on rates through SFY 2014-15. Local governments remain able to amortize a portion of these increases, at their discretion, in order to smooth out the impact on their budgets. Policy changes, such as a new property tax levy limit and shifts in federal aid, have also affected the fiscal environment. The combination has been enough to push even many otherwise fiscally healthy local governments toward stress.
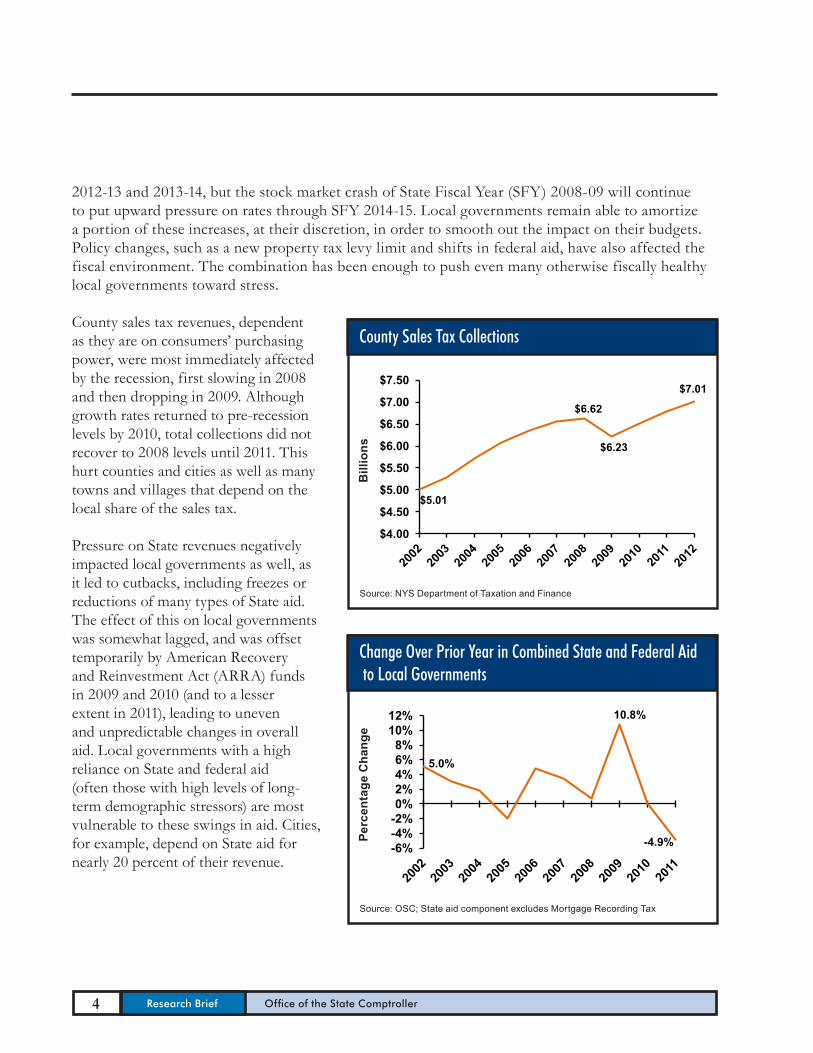
County sales tax revenues, dependent as they are on consumers’ purchasing power, were most immediately affected by the recession, first slowing in 2008 and then dropping in 2009. Although growth rates returned to pre-recession levels by 2010, total collections did not recover to 2008 levels until 2011. This hurt counties and cities as well as many towns and villages that depend on the local share of the sales tax.
Pressure on State revenues negatively impacted local governments as well, as it led to cutbacks, including freezes or reductions of many types of State aid. The effect of this on local governments was somewhat lagged, and was offset temporarily by American Recovery and Reinvestment Act (ARRA) funds in 2009 and 2010 (and to a lesser extent in 2011), leading to uneven and unpredictable changes in overall aid. Local governments with a high reliance on State and federal aid (often those with high levels of long-term demographic stressors) are most vulnerable to these swings in aid. Cities, for example, depend on State aid for nearly 20 percent of their revenue.
Financial Indicators of Stress
Fiscal stress cannot be measured by one single indicator, as some factors will have greater relevance for certain classes of local government or for certain individual local governments. Many indicators measure different aspects of the same problem: not enough revenue to cover expenses. Large or ongoing operating deficits will lead to lower fund balances, just as lower fund balances make it harder to sustain large or ongoing operating deficits. Similarly, lower fund balances – even though not budgeted for the year – reduce the amount of cash on hand on any given day, which, in turn, may lead to a need for short-term borrowing. High fixed costs indicate that local governments may have little room to maneuver in terms of limiting expenditures.
Operating Deficits
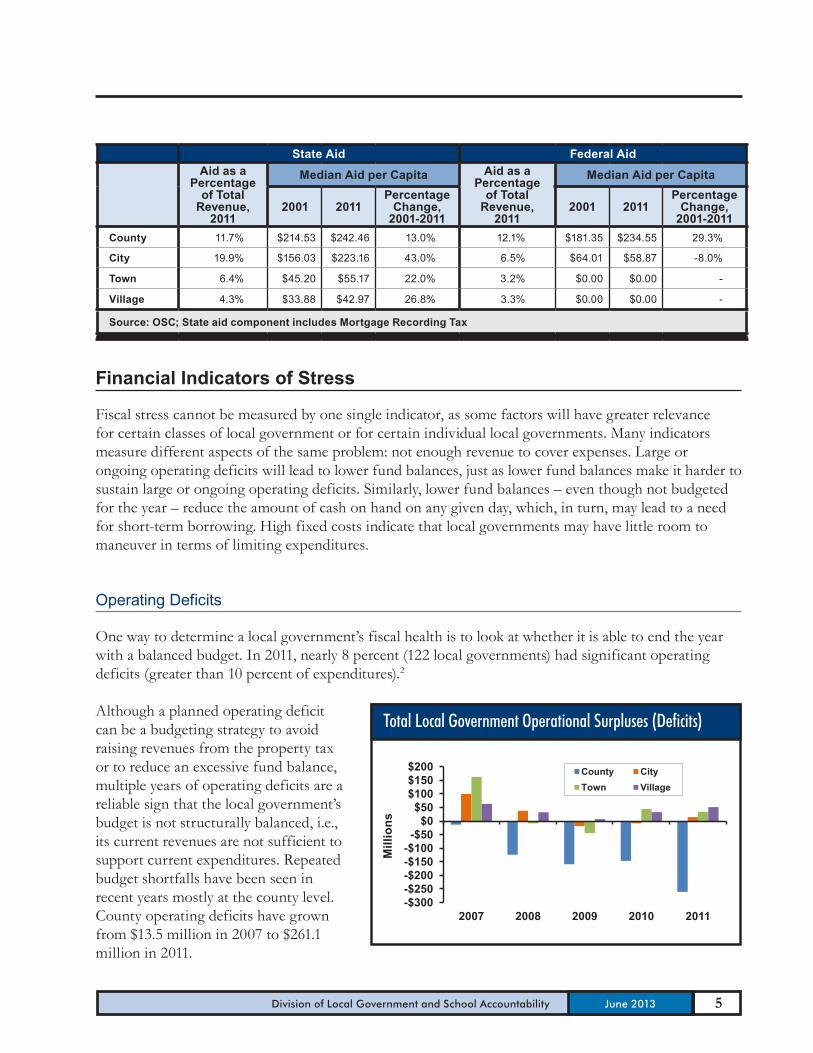
One way to determine a local government’s fiscal health is to look at whether it is able to end the year with a balanced budget. In 2011, nearly 8 percent (122 local governments) had significant operating deficits (greater than 10 percent of expenditures).2
Although a planned operating deficit can be a budgeting strategy to avoid raising revenues from the property tax or to reduce an excessive fund balance, multiple years of operating deficits are a reliable sign that the local government’s budget is not structurally balanced, i.e., its current revenues are not sufficient to support current expenditures. Repeated budget shortfalls have been seen in recent years mostly at the county level. County operating deficits have grown from $13.5 million in 2007 to $261.1 million in 2011.
-$300 -$250 -$200 -$150 -$100
-$50 $0
$50 $100 $150 $200
2007 2008 2009 2010 2011
County City Town Village
Total Local Government Operational Surpluses (Deficits)
Mill
ions
5 Division of Local Government and School Accountability June 2013
State Aid Federal AidAid as a
Percentage of Total
Revenue, 2011
Median Aid per Capita Aid as a Percentage
of Total Revenue,
2011
Median Aid per Capita
2001 2011Percentage
Change, 2001-2011
2001 2011Percentage
Change, 2001-2011
County 11.7% $214.53 $242.46 13.0% 12.1% $181.35 $234.55 29.3%
City 19.9% $156.03 $223.16 43.0% 6.5% $64.01 $58.87 -8.0%
Town 6.4% $45.20 $55.17 22.0% 3.2% $0.00 $0.00 -
Village 4.3% $33.88 $42.97 26.8% 3.3% $0.00 $0.00 -
Source: OSC; State aid component includes Mortgage Recording Tax
26.2% 21.8%
16.3% 18.9%
13.6% 7.2%
7.9% 4.7%
0%
5%
10%
15%
20%
25%
30%
2007 2008 2009 2010 2011
Town Village City County
Available Fund Balance as Percentage of Local Government Expenditures
Source: OSC
6 Research Brief Office of the State Comptroller
Fund Balance
In any given year, the amount remaining of all prior years’ operating surpluses (minus prior years’ deficits), along with the current year’s operating balance, becomes the end of year fund balance. At their discretion, local officials may choose to restrict the use of some or all of this fund balance, by setting some of it aside in reserve funds for purposes such as future capital expenditures; appropriating it for next year’s budget; or committing it to a certain purpose. Local officials may also choose to retain a portion to cover unexpected contingencies. There is no statutorily prescribed maximum percentage limiting how much local governments may keep in such an available form.3 The applicable State statutes generally require that available fund balance may not exceed a “reasonable amount,” consistent with prudent budgetary practices and taking into account certain factors.4
When managed well, fund balances can shelter a local government from having to assume short-term debt in order to cover cash flow shortfalls, as well as provide a buffer against the worst impacts of an economic downturn. However, fund balances should not grow so large as to impose an unnecessary burden on current taxpayers. For example, occasionally audits have found available fund balances amounting to over 100 percent of total budget.5
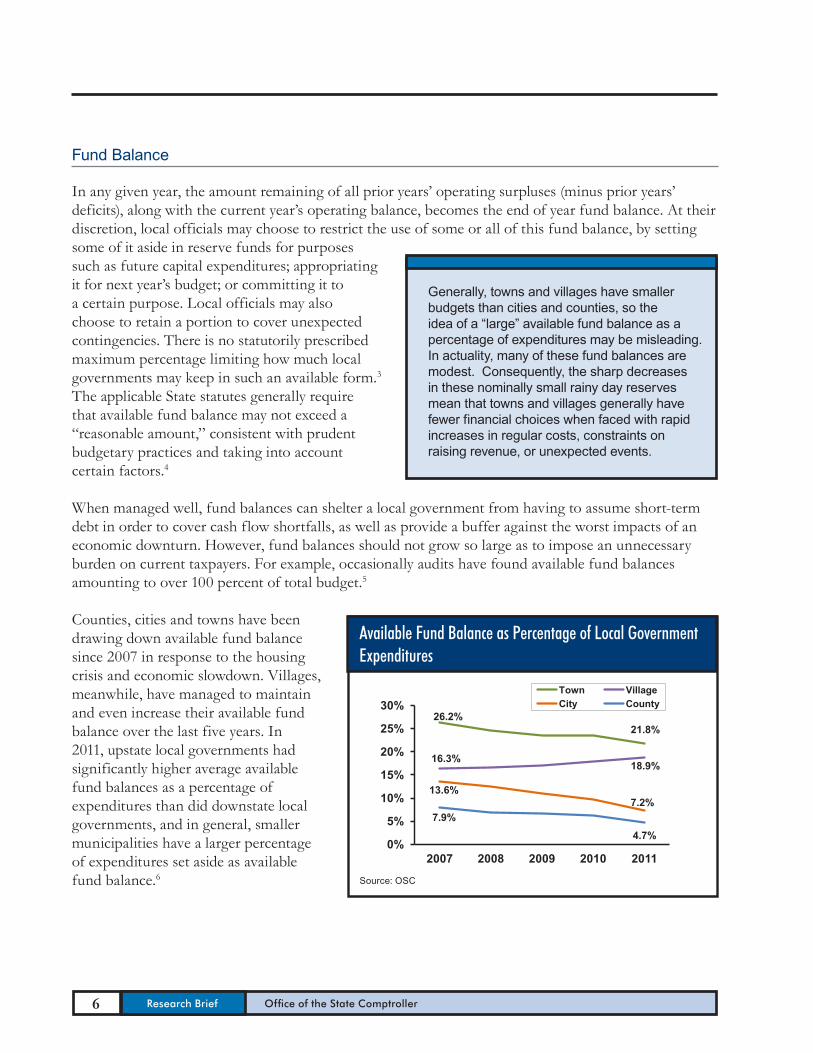
Counties, cities and towns have been drawing down available fund balance since 2007 in response to the housing crisis and economic slowdown. Villages, meanwhile, have managed to maintain and even increase their available fund balance over the last five years. In 2011, upstate local governments had significantly higher average available fund balances as a percentage of expenditures than did downstate local governments, and in general, smaller municipalities have a larger percentage of expenditures set aside as available fund balance.6
Generally, towns and villages have smaller budgets than cities and counties, so the idea of a “large” available fund balance as a percentage of expenditures may be misleading. In actuality, many of these fund balances are modest. Consequently, the sharp decreases in these nominally small rainy day reserves mean that towns and villages generally have fewer financial choices when faced with rapid increases in regular costs, constraints on raising revenue, or unexpected events.
-1.6% 3.0%
13.3% 15.6%
10.4% 9.4%
32.0% 26.8%
-5% 0% 5%
10% 15% 20% 25% 30% 35%
County City Town Village
Downstate
Upstate
Upstate vs. Downstate: 2011 Available Fund Balance as a Percentage of Local Government Expenditures
Source: OSC
7 Division of Local Government and School Accountability June 2013
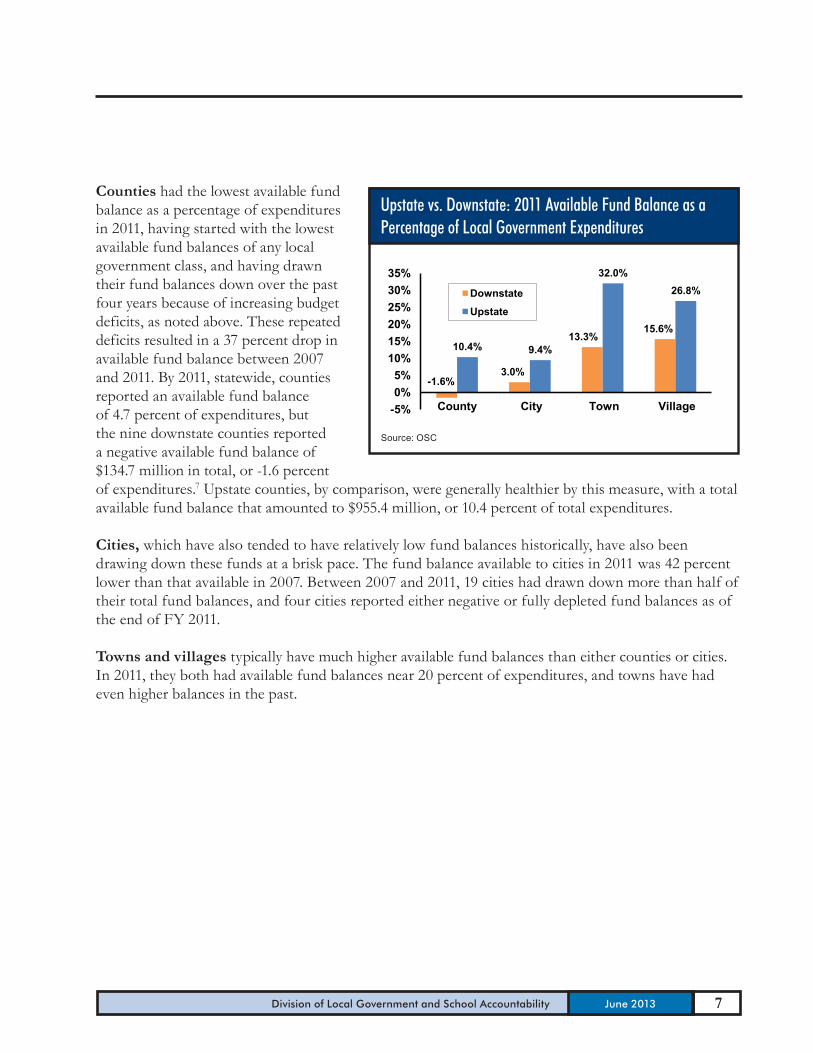
Counties had the lowest available fund balance as a percentage of expenditures in 2011, having started with the lowest available fund balances of any local government class, and having drawn their fund balances down over the past four years because of increasing budget deficits, as noted above. These repeated deficits resulted in a 37 percent drop in available fund balance between 2007 and 2011. By 2011, statewide, counties reported an available fund balance of 4.7 percent of expenditures, but the nine downstate counties reported a negative available fund balance of $134.7 million in total, or -1.6 percent of expenditures.7 Upstate counties, by comparison, were generally healthier by this measure, with a total available fund balance that amounted to $955.4 million, or 10.4 percent of total expenditures.
Cities, which have also tended to have relatively low fund balances historically, have also been drawing down these funds at a brisk pace. The fund balance available to cities in 2011 was 42 percent lower than that available in 2007. Between 2007 and 2011, 19 cities had drawn down more than half of their total fund balances, and four cities reported either negative or fully depleted fund balances as of the end of FY 2011.
Towns and villages typically have much higher available fund balances than either counties or cities. In 2011, they both had available fund balances near 20 percent of expenditures, and towns have had even higher balances in the past.
Cash Ratio
The cash ratio measures a local government’s cash and short-term investments at the end of a local government’s fiscal year, compared with current liabilities. Ideally, a local government should have 100 percent of the cash necessary to cover liabilities at any point during the year, but those in fiscal stress often are far below that level.
On average, counties held enough cash to cover about 68 percent of current liabilities in 2011, although one of every five counties did not have enough cash on hand to cover even half of their current liabilities. About one quarter of the cities in New York did not have enough cash on hand to cover current obligations in that year as well, including four of the five most populated cities outside New York City: Rochester, Syracuse, Yonkers and Albany.
Towns and villages, with average cash amounts of 4.1 and 4.8 times their current obligations in 2011 respectively, have generally had more than enough cash on hand to cover current liabilities. But not all towns and villages are in this position, and cash flow has been a serious issue for several. For example, an audit of a town highlighted an imminent cash shortfall, and a shortfall cited in another town audit drew attention to the costs of short-term borrowing due to poor cash flow maintenance.8
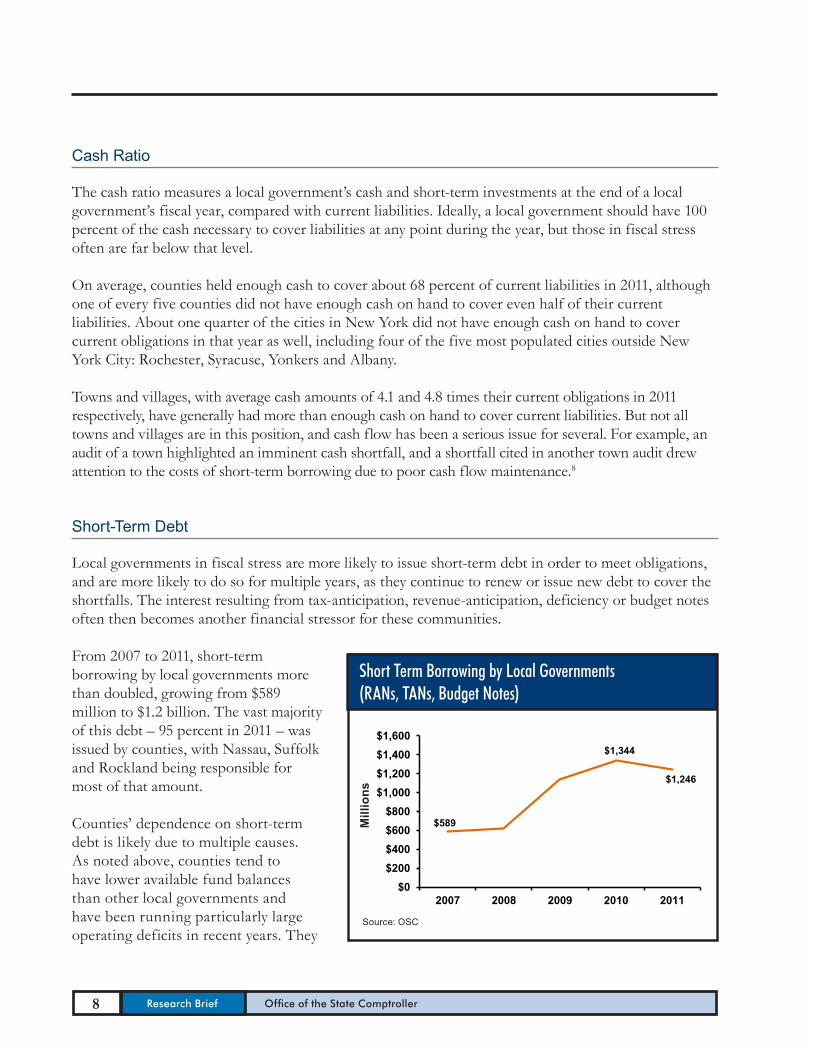
Short-Term Debt
Local governments in fiscal stress are more likely to issue short-term debt in order to meet obligations, and are more likely to do so for multiple years, as they continue to renew or issue new debt to cover the shortfalls. The interest resulting from tax-anticipation, revenue-anticipation, deficiency or budget notes often then becomes another financial stressor for these communities.
From 2007 to 2011, short-term borrowing by local governments more than doubled, growing from $589 million to $1.2 billion. The vast majority of this debt – 95 percent in 2011 – was issued by counties, with Nassau, Suffolk and Rockland being responsible for most of that amount.
Counties’ dependence on short-term debt is likely due to multiple causes. As noted above, counties tend to have lower available fund balances than other local governments and have been running particularly large operating deficits in recent years. They
$589
$1,344
$1,246
$0 $200 $400 $600 $800
$1,000 $1,200 $1,400 $1,600
2007 2008 2009 2010 2011
Short Term Borrowing by Local Governments (RANs, TANs, Budget Notes)
Mill
ions
Source: OSC
8 Research Brief Office of the State Comptroller
9 Division of Local Government and School Accountability June 2013
also depend on multiple large and volatile sources of revenue (including State sales tax distributions and State reimbursements for Medicaid and social services programs), are generally responsible for “guaranteeing” that towns and school districts receive the full amount of property tax revenue required by their budgets, and have large expenses (including tax certiorari claims, Medicaid, social service payments and sometimes subsidies to county nursing homes).9
Fixed Costs
In tough financial times, local governments are often forced to make choices between raising taxes and reducing spending. Early rounds of budget cuts often hit training and travel budgets, purchases of supplies and equipment, and larger capital projects. Although some budget cuts may lead to larger expenses later (especially deferred maintenance and delays in capital projects and equipment replacement), they can delay noticeable reductions in service in the near term.10
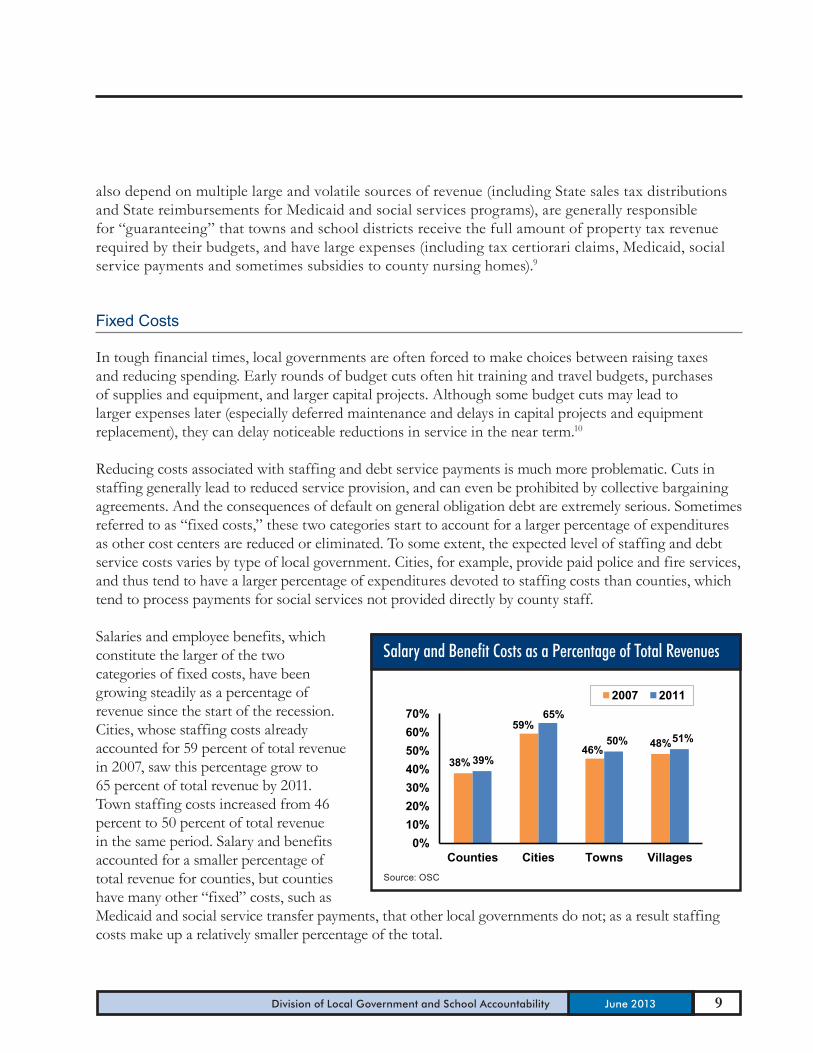
Reducing costs associated with staffing and debt service payments is much more problematic. Cuts in staffing generally lead to reduced service provision, and can even be prohibited by collective bargaining agreements. And the consequences of default on general obligation debt are extremely serious. Sometimes referred to as “fixed costs,” these two categories start to account for a larger percentage of expenditures as other cost centers are reduced or eliminated. To some extent, the expected level of staffing and debt service costs varies by type of local government. Cities, for example, provide paid police and fire services, and thus tend to have a larger percentage of expenditures devoted to staffing costs than counties, which tend to process payments for social services not provided directly by county staff.
Salaries and employee benefits, which constitute the larger of the two categories of fixed costs, have been growing steadily as a percentage of revenue since the start of the recession. Cities, whose staffing costs already accounted for 59 percent of total revenue in 2007, saw this percentage grow to 65 percent of total revenue by 2011. Town staffing costs increased from 46 percent to 50 percent of total revenue in the same period. Salary and benefits accounted for a smaller percentage of total revenue for counties, but counties have many other “fixed” costs, such as Medicaid and social service transfer payments, that other local governments do not; as a result staffing costs make up a relatively smaller percentage of the total.
38%
59%
46% 48% 39%
65%
50% 51%
0% 10% 20% 30% 40% 50% 60% 70%
Counties Cities Towns Villages
2007 2011
Salary and Benefit Costs as a Percentage of Total Revenues
Source: OSC
10 Research Brief Office of the State Comptroller
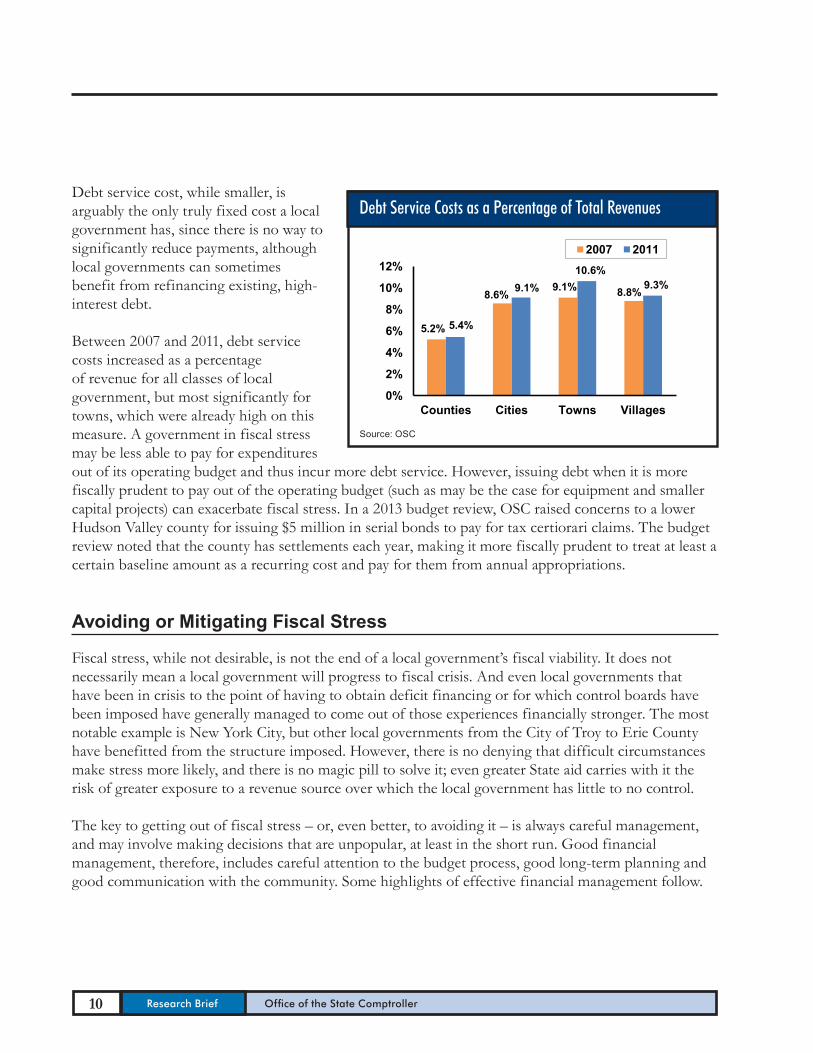
Debt service cost, while smaller, is arguably the only truly fixed cost a local government has, since there is no way to significantly reduce payments, although local governments can sometimes benefit from refinancing existing, high-interest debt.
Between 2007 and 2011, debt service costs increased as a percentage of revenue for all classes of local government, but most significantly for towns, which were already high on this measure. A government in fiscal stress may be less able to pay for expenditures out of its operating budget and thus incur more debt service. However, issuing debt when it is more fiscally prudent to pay out of the operating budget (such as may be the case for equipment and smaller capital projects) can exacerbate fiscal stress. In a 2013 budget review, OSC raised concerns to a lower Hudson Valley county for issuing $5 million in serial bonds to pay for tax certiorari claims. The budget review noted that the county has settlements each year, making it more fiscally prudent to treat at least a certain baseline amount as a recurring cost and pay for them from annual appropriations.
Avoiding or Mitigating Fiscal Stress
Fiscal stress, while not desirable, is not the end of a local government’s fiscal viability. It does not necessarily mean a local government will progress to fiscal crisis. And even local governments that have been in crisis to the point of having to obtain deficit financing or for which control boards have been imposed have generally managed to come out of those experiences financially stronger. The most notable example is New York City, but other local governments from the City of Troy to Erie County have benefitted from the structure imposed. However, there is no denying that difficult circumstances make stress more likely, and there is no magic pill to solve it; even greater State aid carries with it the risk of greater exposure to a revenue source over which the local government has little to no control.
The key to getting out of fiscal stress – or, even better, to avoiding it – is always careful management, and may involve making decisions that are unpopular, at least in the short run. Good financial management, therefore, includes careful attention to the budget process, good long-term planning and good communication with the community. Some highlights of effective financial management follow.
5.2%
8.6% 9.1% 8.8%
5.4%
9.1% 10.6%
9.3%
0%
2%
4%
6%
8%
10%
12%
Counties Cities Towns Villages
2007 2011
Debt Service Costs as a Percentage of Total Revenues
Source: OSC
11 Division of Local Government and School Accountability June 2013
Budgeting
The first step toward fiscal health is a truly balanced budget. A good budget will be structurally balanced (not dependant on fiscal gimmicks or “one-shots”) and include realistic expenditure and revenue projections.
In addition to an annual budget, a multiyear financial plan can help a local government, whether or not it is fiscally stressed, assess the extent of long-term deficits and address options for elimination.
Another element that can help keep a local government out of trouble is setting target amounts for fund balances and reserves. This helps prevent these resources from being unexpectedly depleted, and can reduce the need for short-term borrowing.
Cost-Cutting Opportunities
While certain areas of spending, such as salaries and benefits, may be difficult, undesirable, or even impossible to reduce significantly, there are still meaningful opportunities to control certain costs. Cost control starts with a good procurement policy that includes getting the best possible terms on new contracts, reviewing options before exercising renewal clauses in agreements and using competitive bidding and competitive offering processes or ordering from other government contracts available as exceptions to those requirements, such as those provided by the NYS Office of General Services (OGS) and the federal General Services Administration (GSA). Other cost saving measures include: reviewing vehicle assignments and travel policies periodically to assess appropriateness; minimizing energy consumption and managing overtime.
A long-term, big-picture outlook can help maximize the return on any investments made. A multiyear capital plan helps prioritize road and other capital work, as well as informing decisions regarding replacing or repairing equipment. It can also make sense to consider changing the way a service is provided (for example, garbage collection costs can be reduced by requiring curbside drop-off, reducing the number of garbage pick-ups per week, or even purchasing equipment to allow trucks to be operated by a single employee instead of two if consistent with collective bargaining provisions), or changing the service provider (for example, sharing services).
12 Research Brief Office of the State Comptroller
Revenue Generation
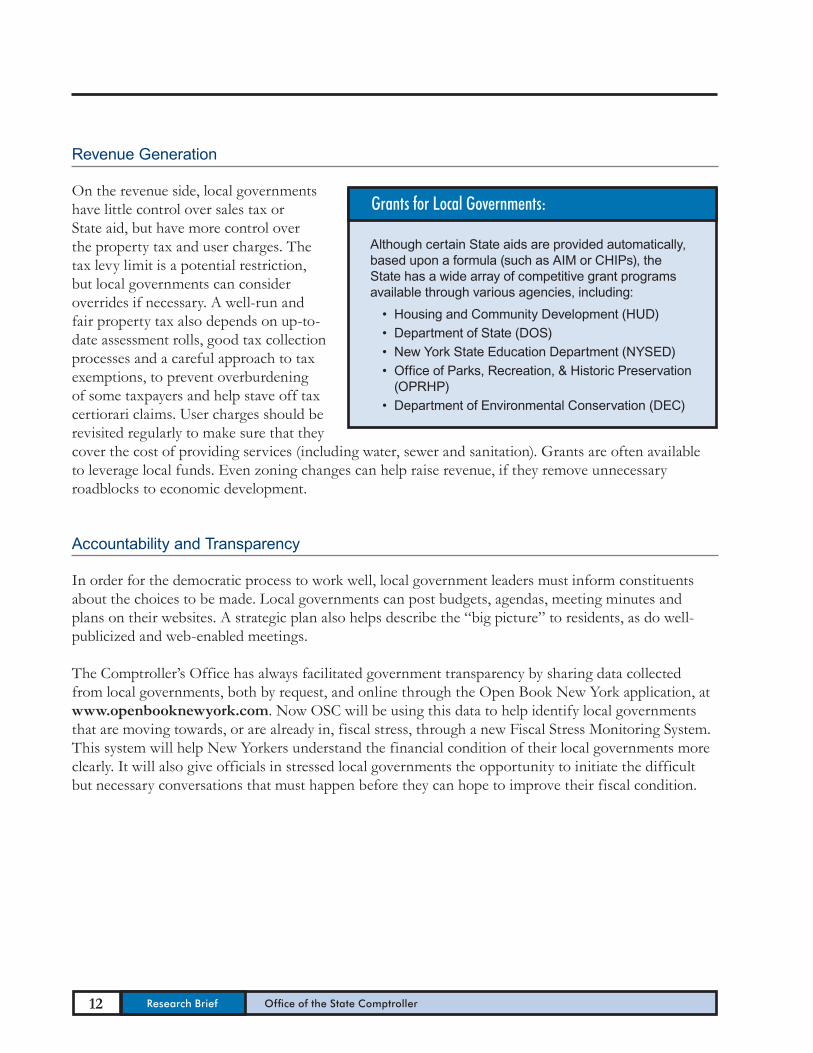
On the revenue side, local governments have little control over sales tax or State aid, but have more control over the property tax and user charges. The tax levy limit is a potential restriction, but local governments can consider overrides if necessary. A well-run and fair property tax also depends on up-to-date assessment rolls, good tax collection processes and a careful approach to tax exemptions, to prevent overburdening of some taxpayers and help stave off tax certiorari claims. User charges should be revisited regularly to make sure that they cover the cost of providing services (including water, sewer and sanitation). Grants are often available to leverage local funds. Even zoning changes can help raise revenue, if they remove unnecessary roadblocks to economic development.
Accountability and Transparency
In order for the democratic process to work well, local government leaders must inform constituents about the choices to be made. Local governments can post budgets, agendas, meeting minutes and plans on their websites. A strategic plan also helps describe the “big picture” to residents, as do well-publicized and web-enabled meetings.
The Comptroller’s Office has always facilitated government transparency by sharing data collected from local governments, both by request, and online through the Open Book New York application, at www.openbooknewyork.com. Now OSC will be using this data to help identify local governments that are moving towards, or are already in, fiscal stress, through a new Fiscal Stress Monitoring System. This system will help New Yorkers understand the financial condition of their local governments more clearly. It will also give officials in stressed local governments the opportunity to initiate the difficult but necessary conversations that must happen before they can hope to improve their fiscal condition.
Although certain State aids are provided automatically, based upon a formula (such as AIM or CHIPs), the State has a wide array of competitive grant programs available through various agencies, including:• HousingandCommunityDevelopment(HUD)• DepartmentofState(DOS)• NewYorkStateEducationDepartment(NYSED)• OfficeofParks,Recreation,&HistoricPreservation (OPRHP)• DepartmentofEnvironmentalConservation(DEC)
Grants for Local Governments:
13 Division of Local Government and School Accountability June 2013
1 “Local governments” in this report refers to counties, cities, towns and villages, generally excluding New York City unless otherwise indicated. School districts and smaller local governments, such as fire districts, are excluded as well.
2 All amounts in this section are discussed in aggregate – i.e., the total, or weighted average, for the class as a whole. For more information on how each category is measured, see OSC’s Fiscal Stress Monitoring System report. All measurements are based on data reported to OSC by local governments.
3 New GASB 54 accounting standards affect data collected for fiscal years ending June 30, 2011 and thereafter. For more information, please see OSC, Fund Balance Reporting and Governmental Fund Type Definitions, (April 2011).
4 Town Law Section 107; County Law Section 355; Village Law Section 5-506. (School districts, not included in this report, do have a statutorily-defined fund balance limit.)
5 For example: OSC, Village of Dresden Clerk-Treasurer’s Duties and Multiyear Financial Planning 2013M-3.
6 Counties, cities, and villages below the median population for each class were considered “small,” as were towns with fewer than 10,000 people as of the 2010 Census.
7 Dutchess, Nassau, Orange, Putnam, Rockland, Suffolk, Sullivan, Ulster and Westchester.
8 OSC, Town of Amity Financial Condition, 2011M-164, and Town of Colonie Financial Condition and Internal Controls Over Cash Disbursements, 2007M-278.
9 Some counties have funded nursing home operating shortfalls with short-term borrowing. For example, in a memo accompanying his proposed FY 2013 budget, the Genesee County Manager stated that he expected the county to issue a Revenue Anticipation Note (RAN) for $5 million to provide cash flow for the nursing home and an adult home on the same site.
10 OSC, Growing Cracks in the Foundation: Local Governments are Losing Ground on Addressing Vital Infrastructure Needs (12/20/12).
Notes
Mailing Address for all of the above:
Office of the State Comptroller, 110 State St., Albany, New York 12236
email: [email protected]
DirectoryCentral OfficeDivision of Local Government and School Accountability
Executive ..................................................................................................................................................................474-4037 Nathaalie N. Carey, Assistant Comptroller
Audits, Local Government Services and Professional Standards ................................................ 474-5404 (Audits, Technical Assistance, Accounting and Audit Standards)
Local Government and School Accountability Help Line ...............................(855)478-5472 or 408-4934 (Electronic Filing, Financial Reporting, Justice Courts, Training)
New York State Retirement SystemRetirement Information Services
Inquiries on Employee Benefits and Programs .................................................................474-7736
Bureau of Member Services ................................................................................................................474-1101Monthly Reporting Inquiries ...................................................................................................474-1080 Audits and Plan Changes ..........................................................................................................474-0167 All Other Employer Inquiries....................................................................................................474-6535
Division of Legal ServicesMunicipal Law Section ........................................................................................................................474-5586
Other OSC OfficesBureau of State Expenditures ..........................................................................................................486-3017
Bureau of State Contracts .................................................................................................................. 474-4622
(Area code for the following is 518 unless otherwise specified)
Andrew A. SanFilippo, Executive Deputy Comptroller
14 Research Brief Office of the State Comptroller
DirectoryRegional OfficeDivision of Local Government and School Accountability
Andrew A. SanFilippo, Executive Deputy Comptroller
Nathaalie N. Carey, Assistant Comptroller (518) 474-4037Cole H. Hickland, Director • Jack Dougherty, Director Direct Services (518) 474-5480
BINGHAMTON REGIONAL OFFICE - H. Todd Eames, Chief Examiner State Office Building, Suite 1702 • 44 Hawley Street • Binghamton, New York 13901-4417 Tel (607) 721-8306 • Fax (607) 721-8313 • Email: [email protected] Serving: Broome, Chenango, Cortland, Delaware, Otsego, Schoharie, Sullivan, Tioga, Tompkins counties
BUFFALO REGIONAL OFFICE – Robert Meller, Chief Examiner 295 Main Street, Suite 1032 • Buffalo, New York 14203-2510 Tel (716) 847-3647 • Fax (716) 847-3643 • Email: [email protected] Serving: Allegany, Cattaraugus, Chautauqua, Erie, Genesee, Niagara, Orleans, Wyoming counties
GLENS FALLS REGIONAL OFFICE - Jeffrey P. Leonard, Chief Examiner One Broad Street Plaza • Glens Falls, New York 12801-4396 Tel (518) 793-0057 • Fax (518) 793-5797 • Email: [email protected] Serving: Albany, Clinton, Essex, Franklin, Fulton, Hamilton, Montgomery, Rensselaer, Saratoga, Schenectady, Warren, Washington counties
HAUPPAUGE REGIONAL OFFICE – Ira McCracken, Chief Examiner NYS Office Building, Room 3A10 • 250 Veterans Memorial Highway • Hauppauge, New York 11788-5533 Tel (631) 952-6534 • Fax (631) 952-6530 • Email: [email protected] Serving: Nassau, Suffolk counties
NEWBURGH REGIONAL OFFICE – Tenneh Blamah, Chief Examiner 33 Airport Center Drive, Suite 103 • New Windsor, New York 12553-4725 Tel (845) 567-0858 • Fax (845) 567-0080 • Email: [email protected] Serving: Columbia, Dutchess, Greene, Orange, Putnam, Rockland, Ulster, Westchester counties
ROCHESTER REGIONAL OFFICE – Edward V. Grant Jr., Chief Examiner The Powers Building • 16 West Main Street – Suite 522 • Rochester, New York 14614-1608 Tel (585) 454-2460 • Fax (585) 454-3545 • Email: [email protected] Serving: Cayuga, Chemung, Livingston, Monroe, Ontario, Schuyler, Seneca, Steuben, Wayne, Yates counties
SYRACUSE REGIONAL OFFICE – Rebecca Wilcox, Chief Examiner State Office Building, Room 409 • 333 E. Washington Street • Syracuse, New York 13202-1428 Tel (315) 428-4192 • Fax (315) 426-2119 • Email: [email protected] Serving: Herkimer, Jefferson, Lewis, Madison, Oneida, Onondaga, Oswego, St. Lawrence counties
STATEWIDE AUDIT - Ann C. Singer, Chief Examiner State Office Building, Suite 1702 • 44 Hawley Street • Binghamton, New York 13901-4417 Tel (607) 721-8306 • Fax (607) 721-8313
15 Division of Local Government and School Accountability June 2013

New York StateOffice of the State Comptroller
Division of Local Government and School Accountability110 State Street, 12th Floor • Albany, New York 12236
June 2013
Related Documents