FISCAL NOTE STATE HUMAN RESOURCES COMMISSION PERFORMANCE MANAGEMENT RULE CONTACT PERSON: Jennifer McGinnis, [email protected] 919-733-8340 RULES: 25 NCAC 01O.0101 POLICY – Repeal 25 NCAC 01O.0102 PURPOSE – Repeal 25 NCAC 01O.0103 COMPONENTS OF A PERFORMANCE MANAGEMENT SYSTEM – Repeal 25 NCAC 01O.0104 RATING SCALE – Repeal 25 NCAC 01O.0105 DISPUTE RESOLUTION – Repeal 25 NCAC 01O.0106 MONITORING, EVALUATION, REPORTING – Repeal 25 NCAC 01O.0107 PERFORMANCE MANAGEMENT POLICY - Adopt 25 NCAC 01O.0108 PERFORMANCE MANAGEMENT COVERED EMPLOYEES – Adopt 25 NCAC 01O.0109 PERFORMANCE MANAGEMENT DEFINITIONS – Adopt 25 NCAC 01O.0110 PERFORMANCE CYCLE – Adopt 25 NCAC 01O.0111 DOCUMENTATION OF PERFORMANCE – Adopt 25 NCAC 01O.0112 PERFORMANCE MANAGEMENT RESOURCES AND TRAINING – Adopt 25 NCAC 01O.0113 CONFIDENTIALITY AND RECORDS RETENTION – Adopt 25 NCAC 01O.0114 PERFORMANCE MANAGEMENT COMPLIANCE – Adopt 25 NCAC 01O.0115 PERFORMANCE RATING DISPUTE – Adopt 25 NCAC 01O.0207 FREQUENCY OF PERFORMANCE REVIEWS – Adopt 25 NCAC 01O.0208 PERFORMANCE PLANNING – Adopt 25 NCAC 01O.0209 PERFORMANCE FEEDBACK – Adopt 25 NCAC 01O.0210 ADDRESSING POOR PERFORMANCE – Adopt 25 NCAC 01O.0211 ANNUAL PERFORMANCE EVALUATION - Adopt (See proposed rule text in Appendix.) STATUTORY AUTHORITY: G.S. 126-4; G.S. 126-3(b)(8) IMPACT SUMMARY: State Government Impact: Yes Local Government Impact: No Substantial Economic Impact: Yes Federal Government: No EFFECTIVE DATE: July 1, 2015

Welcome message from author
This document is posted to help you gain knowledge. Please leave a comment to let me know what you think about it! Share it to your friends and learn new things together.
Transcript

FISCAL NOTE STATE HUMAN RESOURCES COMMISSION
PERFORMANCE MANAGEMENT
RULE CONTACT PERSON: Jennifer McGinnis, [email protected] 919-733-8340
RULES: 25 NCAC 01O.0101 POLICY – Repeal
25 NCAC 01O.0102 PURPOSE – Repeal
25 NCAC 01O.0103 COMPONENTS OF A PERFORMANCE
MANAGEMENT SYSTEM – Repeal
25 NCAC 01O.0104 RATING SCALE – Repeal
25 NCAC 01O.0105 DISPUTE RESOLUTION – Repeal
25 NCAC 01O.0106 MONITORING, EVALUATION,
REPORTING – Repeal
25 NCAC 01O.0107 PERFORMANCE MANAGEMENT POLICY -
Adopt
25 NCAC 01O.0108 PERFORMANCE MANAGEMENT
COVERED EMPLOYEES – Adopt
25 NCAC 01O.0109 PERFORMANCE MANAGEMENT
DEFINITIONS – Adopt
25 NCAC 01O.0110 PERFORMANCE CYCLE – Adopt
25 NCAC 01O.0111 DOCUMENTATION OF PERFORMANCE –
Adopt
25 NCAC 01O.0112 PERFORMANCE MANAGEMENT
RESOURCES AND TRAINING – Adopt
25 NCAC 01O.0113 CONFIDENTIALITY AND RECORDS
RETENTION – Adopt
25 NCAC 01O.0114 PERFORMANCE MANAGEMENT
COMPLIANCE – Adopt
25 NCAC 01O.0115 PERFORMANCE RATING DISPUTE – Adopt
25 NCAC 01O.0207 FREQUENCY OF PERFORMANCE
REVIEWS – Adopt
25 NCAC 01O.0208 PERFORMANCE PLANNING – Adopt
25 NCAC 01O.0209 PERFORMANCE FEEDBACK – Adopt
25 NCAC 01O.0210 ADDRESSING POOR PERFORMANCE –
Adopt
25 NCAC 01O.0211 ANNUAL PERFORMANCE EVALUATION -
Adopt
(See proposed rule text in Appendix.)
STATUTORY AUTHORITY: G.S. 126-4; G.S. 126-3(b)(8)
IMPACT SUMMARY: State Government Impact: Yes
Local Government Impact: No
Substantial Economic Impact: Yes
Federal Government: No
EFFECTIVE DATE: July 1, 2015

2
Background/Description:
The proposed rule change sets forth requirements for the Statewide Performance Management System as
authorized in G.S. 126 and H.B. 834, which was signed into law by Governor McCrory in August 2013
(Session Law 2013-382). This policy provides a standardized approach to Performance Management,
including the establishment of a three-point rating scale, a standard performance review cycle, and
processes to address performance planning, feedback, and poor performance.
Reason for Policy/Rule Change:
The existing performance management system was not effectively increasing efficiency and performance
of the State. According to findings in an audit report compiled by the Office of the State Auditor in 2010,1
there were substantial issues, including the following:
Audited agencies “did not monitor their performance management systems, State Personnel did
not monitor how state agencies administered their performance management systems and the
Legislature did not consider the State Personnel Director’s annual report about problems with the
performance management system”;
Audited agencies “did not provide measurable performance expectations to employees, prepare
written development plans to build employee skills, or adequately document corrective action
plans for poor performers”;
“State supervisors could waste thousands of labor hours (millions of dollars in salaries) preparing
and conducting performance appraisals that do not help the State achieve its goals”;
“The (former) performance management system and the practice of legislative across-the-board
pay increases are not compatible”.
The Office of the State Auditor’s report contained recommendations, including:
“Create written monitoring procedures and monitor performance management system
administration to ensure compliance with agency policy/rules”;
“Agencies should provide an objective method to measure employee performance for key
responsibilities and results so that employees have a clear understanding of the quality and
quantity of work expected from them”;
“State…policy/rules should require, rather than recommend, written development plans”;
“State agencies should ensure that corrective action plans are properly completed for all
employees who fail to meet performance expectations”;
“Personnel should actively monitor state agency administration of the performance management
system to ensure compliance with state law and Personnel policies”;
“Personnel should identify and provide training to agencies with deficient systems”;
“The General Assembly should assess whether the current performance management system
benefits the State and consider revising or eliminating the current system”.
As a result of the State Auditor’s report and other factors, the North Carolina General Assembly repealed
the existing performance management (PM) statutes through ratification of H.B. 950 (Session Law 2012-
1 NC Office of the State Auditor. “Performance Audit: Oversight and Administration of the Performance
Management System.” August 2010. http://www.ncauditor.net/EPSWeb/Reports/performance/per-2010-7253.pdf
3
142, Section 25.2C.(b)) and ordered a comprehensive review of the public employee compensation plans
to include review of the performance management program (S.L. 2012-142 and Session Law 2011-145,
Section 29.20). The legislation required recommendations for the design of an effective employee
performance evaluation system, including the identification of effective employee performance measures
and information systems to track and monitor employee performance. The Legislative Services
Commission never awarded a contract for this comprehensive review. In the meantime, the Office of
State Human Resources (OSHR) led the effort to comply with the State Auditor’s recommendations and
received authority through passage of H.B. 834 (Session Law 2013-382) to develop criteria and standards
for performance management and employee evaluations. It was determined that the OSHR would lead the
efforts to overhaul three primary areas related to performance management:
1. Policy/Rules,
2. Process, and
3. Technology.
In early 2012, the OSHR Talent Management team conducted thorough needs assessments with the
Cabinet, Council of State, Judicial and others agencies to establish requirements for both learning and
performance technology systems. OSHR drafted the request for proposals that included the requirements
for a performance management system, and in October 2012, OSHR selected Cornerstone on Demand
from the bidding vendors. Cornerstone is Software as a Service. OSHR received the funding for
implementation and for the subscription services for both learning and performance management. OSHR
successfully implemented the Learning Management System between June 2013 and December 2013 and
to date, has had over 1,000,000 learning object completions. The Performance Management (PM)
automation is an additional functionality in the system, so OSHR placed the implementation on hold until
H.B. 834 was signed into law, then OSHR signed an agreement with the vendor to provide the
implementation of the PM component.
The technology is configured to meet the policy/rules and process needs of the State and allow both
OSHR and State agencies to monitor and report on the process and policy/rules compliance. The state-
wide PM administrator will work with the agency PM administrators to determine the agency
configurations, if appropriate. In addition, the tool can be utilized by individuals who do not have access
to computers on a daily basis.
The establishment of the Statewide Performance Management rules would provide standardization of
both rules and process, as well as pave the way for the implementation of a technology-based tool to aide
both managers and employees in the performance management process. The policy/rules would define the
performance management philosophy and provide consistent application of the process with technological
monitoring. These rules would establish standard rating scales and interface with the Employee Relations
and probationary employee rules.
To address the issues identified in the State Auditor’s report, OSHR is proposing a series of changes to
the current performance management program, as outlined in Table 1 below.

4
Table 1. Proposed Performance Management Program Changes
Current Performance Management
Program
New Performance Management Program
Each agency has a unique PM process,
form, and policy. • Standardized and automated form and rating scale
• Standardized policy and process
Each agency has a unique PM philosophy
and PM training approach.
• Standardized philosophy
• Training would be 80% standardized, with 20% agency specific
PM Training is conducted on an “as
needed” basis.
• Imbedded in manager/supervisor and individual contributor
curriculum
• Utilize varied delivery methods
• Training would be consistent and continuous
Many PM plans duplicate the job
description and do not include strategic
goals.
• Strategic goals cascaded from top of organization
• Collaboration during goal setting process
• SMART goals which move organization forward
Managers provide a rating to employees
with little or no employee input. • Continuous dialogue throughout the year
• Formal and informal coaching
• Ability for employee to provide feedback on progress
• Manager is held accountable for ensuring each employee has a
performance plan in place
Managers alone determine final
performance ratings. • Calibration sessions conducted at beginning and end of cycle
Includes only employees who are subject
to the State Human Resources Act • Includes employees at all levels of the organization, including
employees exempt from the State Human Resources Act
Summary and Impact of Proposed Rule Changes:
Benefits of Performance Management Policy, Process, and Technology Standardization
There are many benefits of a standardized performance management system. The State of North
Carolina’s performance management system was built from a combination of performance management
best practices, agency best practices (including the NC Department of Transportation, DOT, which
implemented a very similar performance management system in and around 2010), input from a
collaborative working team consisting of representatives from all Cabinet, Council of State and Judicial
areas, as well as feedback from pilot implementations within the Department of Environment and Natural
Resources (DENR), Office of Information Technology Services (ITS), and OSHR. After the pilot
implementations, a “lessons learned” exercise was conducted, which included receiving feedback from
end users at both the individual contributor and manager/supervisory level. These lessons have been
incorporated into the strategy for an enterprise rollout.
The benefits expected from this new system are presented below by affected party.
5
State Government:
1) Staff time and cost savings from:
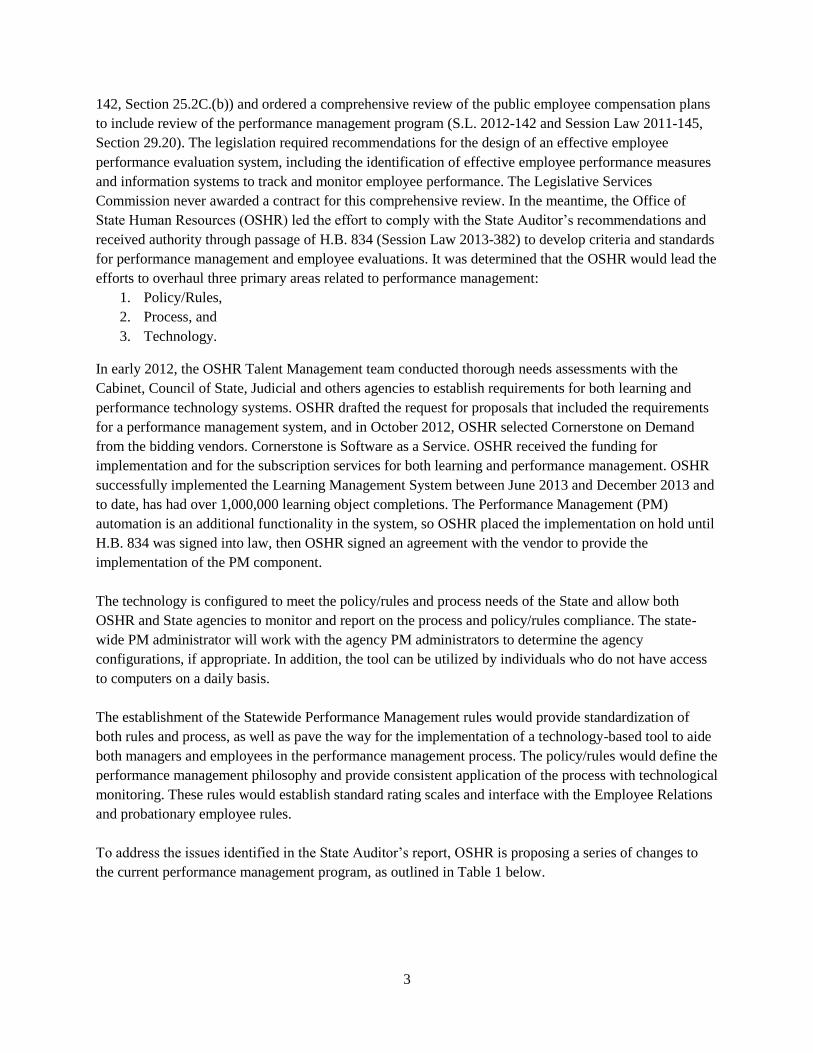
a) Eliminating agencies’ “shadow” PM processes
Under the previous policy, each agency developed its own PM process, forms, and systems,
evaluated the system every 3 years, and developed PM training, as well as defined values at the
different levels of the rating scale and converted agency-specific rating scales to the state-specific
rating scale. Based on the State Auditor’s report and needs assessment meetings with agencies,
OSHR estimates that 100 FTE working within Cabinet and Council of State Agencies as well as
the Judicial branch were providing at least 500 working hours each per year to design the
individual agency processes and then to monitor compliance with those. At an average hourly
compensation (salary plus benefits) of $38.04, the cost of the previous policy is estimated at $1.9
million. When the new PM system is implemented, PM policy, forms, and process would be
standardized and would gradually decrease the amount of time agency PM coordinators spend on
these tasks. Additionally, utilizing standardized classroom and e-learning delivery methodologies
for PM training would reduce the need for agencies to develop and revise unique training
programs related to performance management. Based on DOT’s experience with the PM system,
as well as that of agencies implementing the pilot, this analysis assumes the proposed change
would lead to an initial reduction in hours to 250 hours per employee (who are dedicated to
internal PM process/policy), and then to 100 hours, resulting in time savings of about $1.5
million per year.
b) Eliminating need for HR review of agency processes
By eliminating the agencies’ “shadow” PM processes, the change would also save State Human
Resources Commission and OSHR staff time on reviewing agency PM processes and approving
agency policies and procedures. OSHR plans to reallocate whatever time is saved on agency
reviews towards consulting with agencies’ performance management personnel and focusing on
PM strategy, calibration of goals and performance plans, and employee engagement, discipline,
and retention using the new PM system. Therefore, this analysis does not estimate either the value
of the time saved from eliminating the need for OSHR review of agencies’ performance
management processes, or the cost of staff time to establish and implement the new PM system,
since they would cancel each other out.
c) Decreasing agency administrative reporting times
The reporting time would decrease as a result of having one singular database to report on the PM
process, ratings, and system. OSHR estimates that under the prior policy, agencies needed a total
of 100 employees with the average hourly compensation (salary plus benefits) of $38 providing at
least 100 working hours each to meet the reporting requirement, for a total cost in the first year of
$380,400. When the new PM system is implemented, PM reporting would be in one central area
and would increase the reporting ability and decrease the amount of time required to collect and
report on PM data. Also, the performance ratings would be automatically sent from the PM
technology tool directly to BEACON, so the HR staff would not have to run any final reports or
manually enter the overall performance ratings into BEACON. All this would decrease by half
the reporting hours to 50 per year per those 100 employees, based on the experience of PM

6
implementation in DOT and other pilot agencies. Assuming a 1% annual wage growth (based on
recent state employee salary increases approved by the NC General Assembly), the time saving
would be close to $190,000 in the following years.
d) Automating the PM process
The change would result in a move from a manual, paper-intensive process to an electronic,
automated process that also provides electronic storage. OSHR estimates that each of the
currently 8,000 state managers spend 11 hours per employee annually on Performance
Management (1 hour on performance planning, another hour on interim reviews, about 7 hours on
related employee issues, and 2 hours for annual performance evaluations – see column 1 in Table
2). At an average manager compensation of $38/hour (salary plus benefits), the value of that time
is currently estimated at $19.5 million. With the automation of the system, it is estimated that
managers would be able to gradually decrease the amount of time spent on the process and
employee relations issues and increase the time spent on proactive coaching and development.
This analysis assumes that from FY 2016-17 and beyond, manager time spent on PM would be
reduced to 7 hours per employee annually (1 hour on performance planning, and 1 hour for the
interim review, 2 hours for coaching, close to 2 hours for related employee issues, and 1 hour for
annual performance evaluation – see column 3 in Table 2). This decrease would result in annual
savings of about $11.7 million starting in FY 2016-17, assuming a constant state employee
number of 75,000 and an annual increase in state manager salaries of 1%.
Table 2. Estimated Time Supervisors Spend Annually on PM related work, per Employee
Type of Task Current PM
System
New PM System
in FY 15-16
New PM System
after FY 15-16
Performance planning 1 3 1
Interim review 1 2 1
Employee issues/guidance 7 7 4
Performance evaluation 2 4 1
Total 11 16 7
e) Improving retention
The agency expects that hiring and training costs would decrease from potentially improved
retention of top talent as the rules lay a foundation for performance to be utilized as a component
of compensation decisions. As a result of a more transparent PM system, there is also a possibility
that the proposed change would lead to better retention of talented employees; however, there is
little information related to this causality and estimating the benefit of this transparency may be
difficult.
f) Spending less time on grievance process
The agency expects this would result from applying similar performance expectations for
employees across state government and addressing all performance that “does not meet
expectations” prior to it becoming an employee relations issue. OSHR does not track the number
of grievances that specifically originate due to performance issues, making this benefit difficult to

7
quantify. Additionally, quantification would be complicated by the fact that OSHR has anecdotal
evidence of managers inflating performance ratings to avoid the previously lengthy and time
consuming grievance process.
g) Addressing poor performance in the probationary period
This would lead to identifying the need for termination sooner, and possibly leading to cost
savings. OSHR does not have the necessary data and information to estimate this savings.
2) Increase efficiency/efficacy from:
a) Improving job and agency performance as a result of increased accountability
The authors of a 2011 study suggest that performance management can be used to drive employee
engagement.2 They believe that performance management activities, such as collaborative setting
of performance goals, providing ongoing feedback, and effective annual and interim evaluations,
can serve as a useful framework for managers to translate strategic goals into actions that increase
engagement. Other researchers have built on these results, showing that feedback has a positive
impact on employee job satisfaction and found that the implementation of a performance
management process, which facilitates communication of organizational goals to employees,
promotes motivation and dedication.3 Another survey conducted by Deloitte revealed that 56% of
responders believed that a performance management process, which relies more on goal setting,
feedback, and coaching and less on numeric ratings, positively affects employee engagement and
performance.4
The Gallup 2014 report “State of the American Workforce” estimates that close to 70% of the
workforce in North Carolina is currently disengaged.5 At a cost of about $2,400 per employee
who is disengaged (based on a $2,246 estimate from 2011 and NC inflation data),6,7 and assuming
that 70% of the state’s 75,000 employees are disengaged, the cost of disengagement to the state is
currently close to $126 million annually. OSHR believes that under the proposed changes,
engagement would be driven by the new process of collaboration and continual dialogue between
managers/supervisors and employees throughout the year; the interaction between
2 Mone, Edward et. al. “Performance Management at the Wheel: Driving Employee Engagement in Organizations.”
Journal of Business and Psychology. June 2011, Volume 26, Issue 2.
http://link.springer.com/article/10.1007/s10869-011-9222-9#page-1 3 Ángel Calderón Molina, M., Manuel, H. G., Palacios Florencio, B., & Luis Galán González, J. 2014. “Does the
balanced scorecard adoption enhance the levels of organizational climate, employees' commitment, job satisfaction
and job dedication?” Management Decision, 52(5).
http://search.proquest.com/docview/1633967226?accountid=14078 4 Parent, David, Nathan Sloan, and Akio Tsuchida. “Performance Management: The Secret Ingredient.” Global
Human Capital Trends 2015: Leading in the New World of Work, Deloitte University Press. February 2015.
http://d2mtr37y39tpbu.cloudfront.net/wp-content/uploads/2015/02/DUP_GlobalHumanCapitalTrends2015.pdf 5 Gallup. “State of the American Workplace: Employee Engagement Insights for US Business Leaders.” 2013.
http://www.gallup.com/services/178514/state-american-workplace.aspx 6 People Metrics. “Calculating the Cost of Employee Disengagement.” June 13, 2011
http://www.peoplemetrics.com/blog/calculating-the-cost-of-employee-disengagement 7 IHS Connect Regional Database. North Carolina Consumer Price Index (CPI) (1982-84=100) Forecast.

8
managers/supervisors and employees is the number one factor in driving employee engagement,
which drives discretionary efforts, and therefore, job performance.
Assuming that improved job performance would decrease the disengagement rate among state
employees to 60% in the next three years, the state could save between $6 and $18 million in the
next three years.
b) Aligning goals
Ensuring that agency goals are aligned from the top of the organization all the way to the
individual contributor would increase the probability of the agency meeting, or even exceeding,
its goals. Unfortunately, there is not enough data to quantify this benefit. DENR has started the
pilot system in early 2015, and data from the pilot has not been gathered yet. Qualitative research
(conducted with focus groups from DENR), however, indicates there has been increased dialogue
between employees and managers, employees are clearer on how their goals relate to the
organizational mission, and employees’ overall understanding of the expectations of results-based
performance has increased.
c) Increasing OSHR compliance monitoring
Automating the reporting would allow OSHR staff to more effectively and efficiently monitor
and ensure agency compliance with the process and policy, which would, in turn, increase the
availability of OSHR staff to provide consultation to agencies to sustain effective performance
management systems and increase the positive impact of those systems.
d) Fostering closer collaboration between OSHR and agency PM administrators
OSHR’s role would shift from simply “compliance monitoring” to much more of a consultative
role with a focus on the application of the performance management philosophy, process, and
technology to drive the effectiveness of the system. This would enable agencies to effectively
increase participation in the performance management process, while enhancing the quality of
performance practices for employees and managers, thus increasing engagement. OSHR can
analyze data and information to focus on increasing calibration of goals and expectations as well
as the calibration of ratings across divisions, agencies, and ultimately, State government.
State Employees:
1) Time savings and less frustration related to the grievance process as a result of similar performance
expectations and experience for employees, regardless of where they work within state government,
2) Better future compensation as the rules lay a foundation for performance to be utilized as a
component of compensation decisions,
3) Increased morale, job satisfaction, and potential retention from:
a) Calibrated ratings among employees to ensure they are held to the same standards and accurately
rated based on other employees in the same position, employees in the same agency, and
ultimately, employees across state government,
9
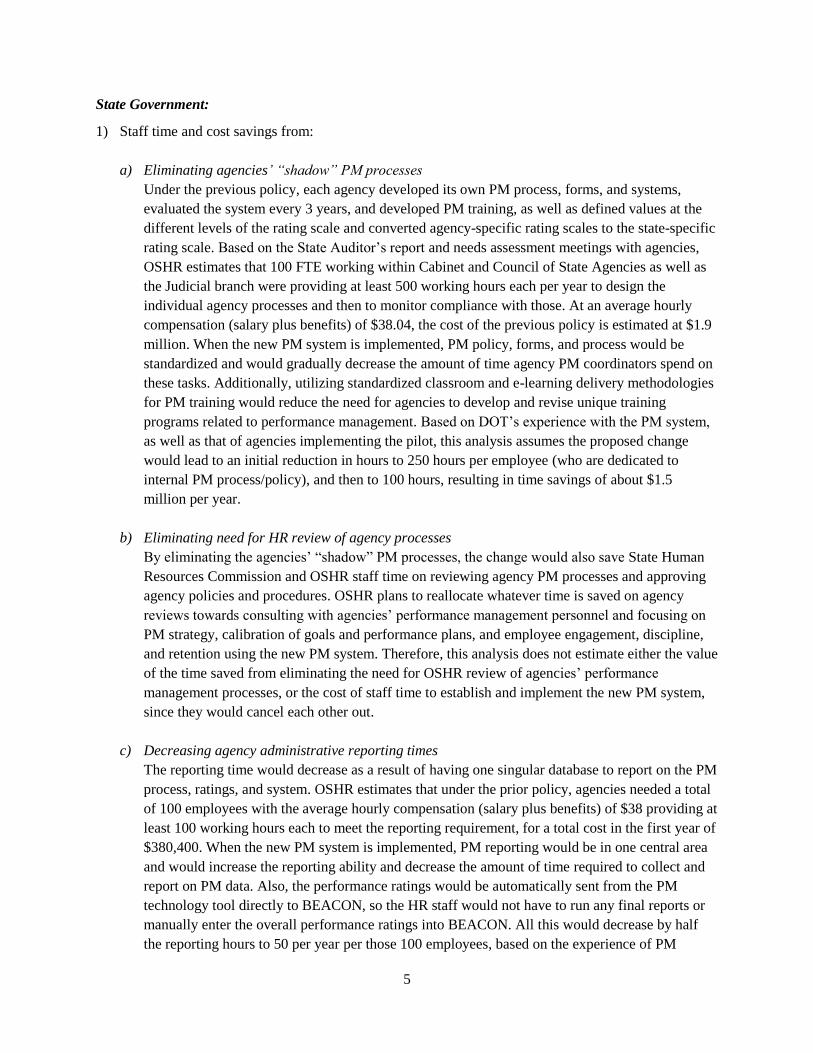
b) Increased employee engagement and ownership by having managers and employees collaborate
on setting goals and documenting achievements and performance and involving employees in all
stages of the performance process, and
c) Additional possibilities for employees to identify and pursue opportunities to achieve results and
further their own development.
OSHR does not have the necessary data to estimate the benefits to state employees.
Cost of Performance Management Policy, Process, and Technology Standardization
Administration of Performance Management System:
Under the previous policy, state government had approximately 20 full time equivalencies (FTEs) fully
dedicated to the administration of performance management. The proposed changes would require
increasing the FTEs to 40. Given the average FTE total compensation (salary plus benefits) of $63,553
and assuming a 1% annual growth (based on recent state employee salary increases approved by the NC
General Assembly), the change would result in an additional annual cost of about $1.3 million. In FY
2014-15, a total of only 30 FTEs have been needed, so the cost has been close to $636,000.
Technology:
The proposed rules require the State to invest in technology to implement the changes. The State has
identified and purchased the necessary technology. OSHR already incurred the implementation cost of
$75,000, as well as the annual subscription of about $300,000 for about 75,000 users in this fiscal year.
Given the cost of $4/user/year, which is stated in the contract with Cornerstone on Demand and includes
all maintenance and the cost of e-learning tools, the annual cost is assumed to stay close to the $300,000
estimate. The agency has not identified the need for any additional equipment. The Cornerstone on
Demand system will replace the elaborate and complex databases developed and maintained by several
agencies. OSHR does not have information regarding the current cost to those agencies for developing
these databases; therefore, this analysis does not present the net impact to the agencies.
The new technology system will require agencies to identify an individual and a back up to serve as
performance management administrators. In this capacity, they will coordinate with the statewide
performance management administrator, who works within OSHR, to create specific agency
configurations for the system, monitor policy and process compliance within the system and provide
reporting regarding performance management for agencies.
Additional Time Spent on New PM Process:
During the initial implementation of the technology, process, and policy, it is anticipated that there would
be an increased time in developing goals, inputting goals and navigating the system. As users become
increasingly familiar with the technology, process, and policy, it is anticipated that there would be
tremendous time savings for the managers. For example, the technology will have a goal bank that
provides specific examples of realistic goals for the high-volume classifications. These goals can be
modified as necessary. Goals can be dynamically assigned based on job classification, location,
department, and other areas, thus eliminating the need for managers to recreate the same information.

10
As mentioned in the benefits section above, OSHR estimates that managers spend about 11 hours per year
per employee on the current PM process. Table 2 above presents a breakout of how much time managers
spend on different performance management activities under the current PM system, and compares it to
the breakout under the proposed system. As seen from above, there would be an initial increase of 5 hours
per employee, or 375,000 hours total (= 5 hours * 75,000 employees). At a manager hourly compensation
rate of $38, this would result in an additional time cost of $14.4 million in FY 2015-16 (including the 1%
assumption in wage growth and constant number of state employees).
However, as managers gain familiarity with the new process, OSHR anticipates, as seen from Table 2, the
time spent per employee would decrease from the current 11 to an estimated 7; therefore, the time saved
annually past the year of implementation would be 300,000 hours (assuming the number of state
employees stays constant). These time savings are included in the benefits section above.
Employees would now be expected to contribute to the process of goal setting, documenting information
related to performance, providing self-evaluations and training. This expectation would result in
employees spending more time on performance management; however, this increase in employee
involvement in performance management is also expected to increase transparency, employee
engagement, and employee buy-in and involvement in the performance management process, thus
providing employees with more direct control over their performance.
Based on an estimated 5 additional hours per employee in the first year of implementation and 2
thereafter (see Table 3 for a breakdown of the increase), the opportunity costs would be about $11.7
million in the FY 2015-16 and about $4.7 million per year thereafter (assuming a $31 hourly
compensation per employee, constant number of employees, and an annual salary increase of 1%).
Table 3. Estimated Time Employees Spend Annually on PM related work, per Employee
Type of Task Current PM
System
New PM System
in FY 15-16
New PM System
after FY 15-16
Performance planning 0 1 1
Interim review 1 2 1
Employee issues/guidance 2 4 3
Performance evaluation 1 2 1
Total 4 9 6
Training in Year of Implementation:
The new policy, process, and technology will also require training for individual contributors,
managers/supervisors, HR, and executive leaders. This training is being developed and will be delivered
utilizing the enterprise wide Learning Management System (LMS). The training will be conducted
utilizing blended methodologies (both classroom and on-line training) and will be developed by OSHR
and complimented with agency specific information (such as different agency organizational values).

11
It is estimated that the average employee will receive approximately 5 hours of training during the initial
implementation year, resulting in approximately $10.5 million for employees and $1.5 million for
managers/supervisors, assuming the number of employees stays constant and the employee and manager
hourly compensation increases at a rate of 1% annually. As most employees and managers/supervisors
currently attend training related to performance management, the new training would replace the old, thus
the cost could be substantially offset. For a conservative estimate of the costs, this analysis assumes the
full opportunity cost for the training in the first year of implementation, but then assumes any training
time in the following years would be offset by time saved on training related to the old PM process.
Table 4 below summarizes the benefit and cost estimates discussed in the analysis above. It is important
to note that aside from the cost of the technology for the new PM system, which the State has already
started incurring in FY 2014-15, the remainder of the costs and benefits represent opportunity costs or
cost savings of state employee time. The agency does not expect that these impacts would result in any
additional budgetary costs.
Table 4. Estimated Costs and Benefits
FY 14-15 FY 15-16 FY 16-17 FY 17-18
Costs
PM Administration ($635,500) ($1,283,800) ($1,296,600) ($1,309,600)
Technology ($375,000) ($300,000) ($300,000) ($300,000)
Additional Time Spent by Supervisors
and Employees on New PM Process $0 ($26,133,750) ($4,743,465) ($4,790,900)
Training $0 ($12,144,291) $0 $0
Total Costs ($1,010,500) ($39,861,841) ($6,340,065) ($6,400,500)
NPV of Costs (mil.)* ($49.0)
Benefits
Elimination of Shadow PM Process $951,000 $1,536,816 $1,552,184 $1,567,706
Decreased Agency Reporting $190,200 $192,100 $194,000 $196,000
Automation of PM Process $0 $0 $11,629,140 $11,745,431
Improved Job Performance $0 $6,000,000 $12,000,000 $18,000,000
Total Benefits $1,141,200 $7,728,916 $25,375,324 $31,509,137
NPV of Benefits (mil.)* $56.2
Net Impact $130,700 ($32,132,925) $19,035,259 $25,108,638
NPV of Net Impact (mil.)* $7.2
* NPV stands for Net Present Value and is computed as of FY 2014-15 using a 7% discount rate, as required by
statute (G.S. 150B-21.4 (b1)).
12
Risk Analysis
There are uncertain future events, that should they occur, would impact or jeopardize established
assumptions. These include:
1. The lack of continued funding for the performance management technology
If this were to occur, state agencies may not be able to continue implementing the PM system,
and therefore the costs and benefits estimated might not be incurred.
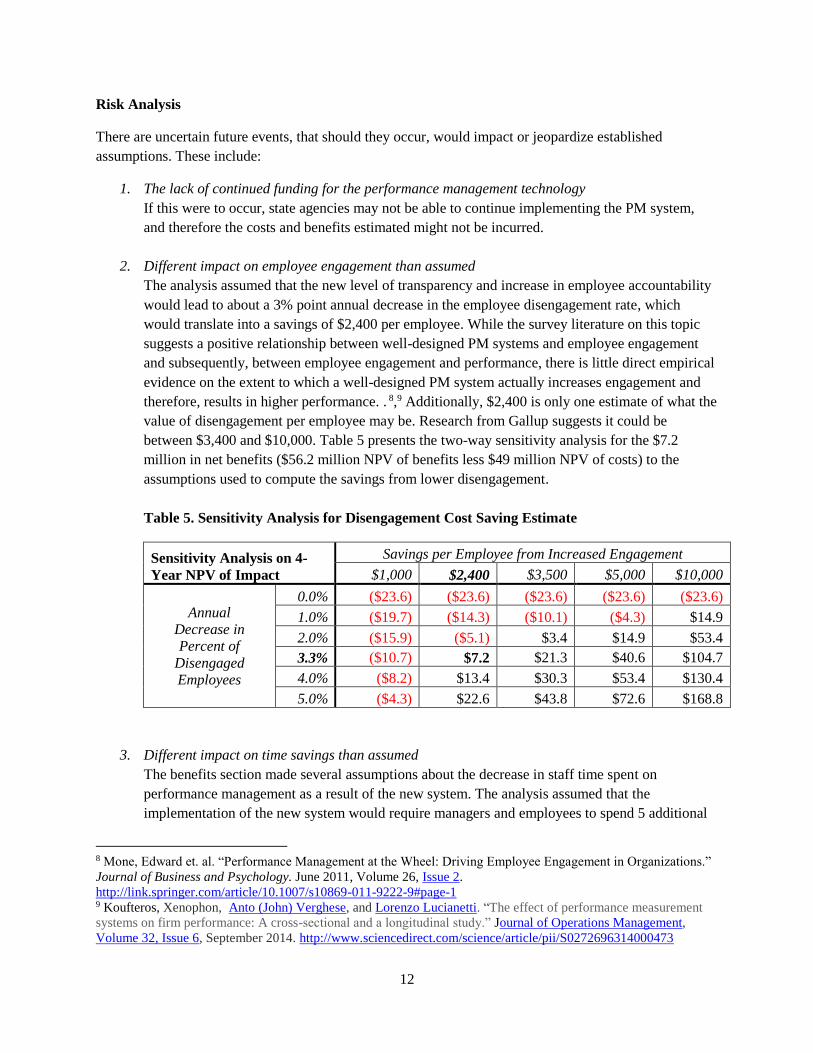
2. Different impact on employee engagement than assumed
The analysis assumed that the new level of transparency and increase in employee accountability
would lead to about a 3% point annual decrease in the employee disengagement rate, which
would translate into a savings of $2,400 per employee. While the survey literature on this topic
suggests a positive relationship between well-designed PM systems and employee engagement
and subsequently, between employee engagement and performance, there is little direct empirical
evidence on the extent to which a well-designed PM system actually increases engagement and
therefore, results in higher performance. . 8,9 Additionally, $2,400 is only one estimate of what the
value of disengagement per employee may be. Research from Gallup suggests it could be
between $3,400 and $10,000. Table 5 presents the two-way sensitivity analysis for the $7.2
million in net benefits ($56.2 million NPV of benefits less $49 million NPV of costs) to the
assumptions used to compute the savings from lower disengagement.
Table 5. Sensitivity Analysis for Disengagement Cost Saving Estimate
Sensitivity Analysis on 4-
Year NPV of Impact
Savings per Employee from Increased Engagement
$1,000 $2,400 $3,500 $5,000 $10,000
Annual
Decrease in
Percent of
Disengaged
Employees
0.0% ($23.6) ($23.6) ($23.6) ($23.6) ($23.6)
1.0% ($19.7) ($14.3) ($10.1) ($4.3) $14.9
2.0% ($15.9) ($5.1) $3.4 $14.9 $53.4
3.3% ($10.7) $7.2 $21.3 $40.6 $104.7
4.0% ($8.2) $13.4 $30.3 $53.4 $130.4
5.0% ($4.3) $22.6 $43.8 $72.6 $168.8
3. Different impact on time savings than assumed
The benefits section made several assumptions about the decrease in staff time spent on
performance management as a result of the new system. The analysis assumed that the
implementation of the new system would require managers and employees to spend 5 additional
8 Mone, Edward et. al. “Performance Management at the Wheel: Driving Employee Engagement in Organizations.”
Journal of Business and Psychology. June 2011, Volume 26, Issue 2.
http://link.springer.com/article/10.1007/s10869-011-9222-9#page-1 9 Koufteros, Xenophon, Anto (John) Verghese, and Lorenzo Lucianetti. “The effect of performance measurement
systems on firm performance: A cross-sectional and a longitudinal study.” Journal of Operations Management,
Volume 32, Issue 6, September 2014. http://www.sciencedirect.com/science/article/pii/S0272696314000473

13
hours on performance management in FY 2015-16. Due to the new level of transparency and
increased employee accountability, the new system would lead to a 4-hour decrease in the time
supervisors/managers spend per employee after the year of implementation and to an increase in 2
hours spent by each employee. Tables 6 and 7 present the sensitivity of the cost and benefit
estimates (the 4-year NPV) to these assumptions.
Table 6. Sensitivity Analysis for Time Saving Estimates during Implementation
Additional Time Spent on PM by
Managers and Employees, per Employee 4-Year NPV of Net Impact (mil.)
0 $31.6
2 $21.9
5 $7.2
7 ($2.5)
10 ($17.2)
Table 7. Sensitivity Analysis for Time Saving Estimates after Implementation
Sensitivity Analysis on 4-Year
NPV of Net Impact
Additional Time Spent by Managers after Implementation
-8 -4 -2 0 2 5
Additional Time Spent
by Employees after
Implementation
0 $35.0 $15.3 $5.4 ($4.5) ($14.3) ($29.2)
1 $31.0 $11.2 $1.4 ($8.5) ($18.4) ($33.2)
2 $27.0 $7.2 ($2.7) ($12.5) ($22.4) ($37.2)
4 $18.9 ($0.8) ($10.7) ($20.6) ($30.4) ($45.3)
5 $14.9 ($4.9) ($14.7) ($24.6) ($34.5) ($49.3)
4. The impact of the new compensation structure
OSHR is planning to roll out a new compensation structure in 2016 that could have components
of pay for performance associated with compensation. Such a component is very likely to
improve retention, especially of top employees, and thus reduce replacement costs. Gallup
estimates that a conservative replacement cost is, on average, about 50% of an employee’s annual
salary.10 Annually, cabinet and council of state agencies replace, on average, approximately 7,000
FTEs, translating into a replacement rate of about 9%. Assuming that the proposed changes
would lead to a 10% decrease in the replacement rate, and given the average state employee
salary of about $41,600, the proposal could save about $14.6 million in replacement costs
annually. Table 8 below shows how this saving is affected by the 10% decrease in the
replacement rate. Note, the federal government, which has a similar performance management
system in place as the one proposed in NC as well as pay-for-performance, has a replacement rate
of 4% in 2012 (based on a retention rate excluding retirees of 96%).11
10 Robison, Jennifer. “Turning Around Employee Turnover.” Gallup. May 8, 2008.
http://www.gallup.com/businessjournal/106912/turning-around-your-turnover-problem.aspx 11 US Government Accountability Office. “Performance and Accountability Report Fiscal Year 2012.” Table 1.
http://www.gao.gov/assets/660/650104.pdf

14
Table 8. Sensitivity Analysis for Replace Cost Saving Estimate
Decrease in
Replacement Rate
Assumption Replacement Rate Estimated Savings
30% 6.5% $43,680,000
25% 7.0% $36,400,000
20% 7.5% $29,120,000
15% 7.9% $21,840,000
10% 8.4% $14,560,000
5% 8.9% $7,280,000
1% 9.2% $1,456,000
0% 9.3% $0
5. Agency non-compliance
The estimates above assume 100% agency compliance with the new PM system and process. If
individual agencies deviate from the established standardized performance management process,
policy, and/or technology, the benefits estimates from automation and improved performance
would be smaller.
Alternatives Analysis
Before determining the appropriate approach, several alternatives were considered and the results of the
consideration are as follows:
Alternative One:
Stay with the existing performance management system, maintaining the status quo. It was determined
that this was not a viable option, as represented by the findings in the State Auditor’s report, the amount
of effort and indirect cost with the very limited return, and the challenges that agencies and managers had
identifying appropriate goals that were relevant to the organization. During the needs assessment, which
was conducted with all agencies, it was confirmed that the existing PM system was inefficient and
ineffective.
Alternative Two:
Implement a new performance management policy and process, without the utilization of technology. In
this instance, the standardization of the policy and process would have moved the state collectively in the
same direction; however, it was determined this was not a viable option due to the inability to effectively
monitor and report on agency compliance and utilization. One of the major findings of the State Auditor’s
report was a lack of monitoring and compliance within agencies. Implementing Alternative Two would
have maintained the inefficient manual process, which led to inflated ratings, misaligned goals, and
frustration from employees and managers.
15
Alternative Three:
Completely do away with any performance management system and allow managers/supervisors to
oversee the work of employees. While there are a handful of private sector entities who have stopped
utilizing a performance management system, research shows that the key components of a successful
performance management process are still being utilized in both the private and public sectors.12,13,14 In
addition, the State of North Carolina had a fairly ineffective and inconsistent process, which could not
have been utilized to build an environment of accountability. In addition, it was determined that it would
not be appropriate or feasible for a public entity to eliminate the performance management system in its
entirety, as this would raise substantial questions among taxpayers as to how employees, whom taxpayers
pay, are being held accountable.
12 The Society for Human Resources Management (SHRM) Foundation website. Executive Briefing. “Four
Questions the CEO Should Ask About Performance Management.” 2004.
http://www.shrm.org/about/foundation/products/Documents/6-10%20Perf.%20Mgmt%20Briefing-%20FINAL.pdf 13 Mercer. “2013 Global Performance Management Survey Report – Executive Summary.” 2013.
http://www.mercer.com/content/dam/mercer/attachments/global/Talent/Assess-BrochurePerfMgmt.pdf 14 Vorhauser-Smith, Sylvia. “Three Reasons Performance Management will Change in 2013.” Forbes. December
16, 2012. http://www.forbes.com/sites/sylviavorhausersmith/2012/12/16/the-new-face-of-performance-
management-trading-annual-reviews-for-agile-management/

16
APPENDIX
SECTION .0100 - GENERAL PROVISIONS
25 NCAC 01O .0101 POLICY
Each agency shall have an operative performance management system as provided in 25 NCAC 01O .0102 - .0106
and that has been approved by the State Human Resources Commission for compliance with these Rules. The State
Human Resources Director shall use the standards identified in the rules in this Section:
(1) to help agencies establish, administer and revise their performance management systems; and
(2) to review and approve any substantive changes to an agency's performance management system based on their
compliance with the rules in this Section.
History Note: Authority G.S. 126-4; 126-7;
Eff. January 1, 1990;
Amended Eff. August 1, 2007; March 1, 2005.

17
25 NCAC 01O .0102 PURPOSE
The purposes of the performance management system are to ensure that:
(1) The work performed by employees accomplishes the work of the agency;
(2) Employees have an understanding of the quality and quantity of work expected from them;
(3) Employees receive ongoing information about how effectively they are performing relative to expectations;
(4) Awards and salary increases based on employee performance are distributed accordingly;
(5) Opportunities for employee development are identified; and
(6) Employee performance that does not meet expectations is addressed
History Note: Authority G.S. 126-4; 126-7;
Eff. August 1, 2007.

18
25 NCAC 01O .0103 COMPONENTS OF A PERFORMANCE MANAGEMENT SYSTEM
An operative performance management system shall consist of:
(1) A process for communicating employee performance expectations, maintaining ongoing performance dialogue,
and conducting annual performance appraisals;
(2) A procedure for addressing employee performance that falls below expectations;
(3) A procedure for encouraging and facilitating employee development;
(4) Training in managing performance and administering the system; and
(5) A procedure for resolving performance pay disputes.
History Note Authority G.S. 126-4; 126-7;
Eff. August 1, 2007.

19
25 NCAC 01O .0104 RATING SCALE
The annual performance appraisal shall use a five-level rating scale for reporting overall performance. A rating at
the midpoint of the scale shall indicate that an employee's performance has met expectations. Alternative rating
scales are permissible provided they are convertible to a five-level scale. Performance-based awards and salary
increases shall be distributed in accordance with G.S. 126-7.
History Note: Authority G.S. 126-4; 126-7;
Eff. August 1, 2007.

20
25 NCAC 01O .0105 DISPUTE RESOLUTION
Employee disputes concerning their performance appraisal or the amount of their performance-based award shall be
addressed in accordance with 25 NCAC 01J .0900.
History Note: Authority G.S. 126-4; 126-7;
Eff. August 1, 2007.

21
25 NCAC 01O .0106 MONITORING, EVALUATING, REPORTING
(a) The Human Resources Director in each agency shall monitor the administration of the performance management
system to determine that appraisal ratings are made accurately and that performance-based salary increases and
awards are distributed based on appraisals.
(b) Each agency shall evaluate its performance management system at least every three years to determine how
effectively the system is meeting the purposes stated in 25 NCAC 01O .0102 and take actions to improve the system
if necessary. Evaluation findings and any improvement actions shall be reported to the State Human Resources
Director.
History Note: Authority G.S. 126-4; 126-7;

22
25 NCAC 01O.0107 is proposed for adoption as follows:
25 NCAC 01O.0107 PERFORMANCE MANAGEMENT POLICY
It is the policy of North Carolina State Government to provide a performance management system which evaluates
employees’ accomplishments and behaviors related to goals and organizational values to achieve organizational
mission, goals, and business objectives. An integrated performance management system enables employees to
develop and enhance individual performance while contributing to the achievement of organizational mission, goals,
and business objectives. Each agency shall implement the Performance Management Policy as approved by the State
Human Resources Commission.
Authority G.S. 126-4

23
25 NCAC 01O.0108 is proposed for adoption as follows:
25 NCAC 01O .0108 PERFORMANCE MANAGEMENT COVERED EMPLOYEES
(a) Rules in this Subchapter apply to the following:
(1) probationary, trainee, time-limited and permanent employees; and
(2) employees appointed to exempt policy-making positions, exempt managerial positions,
confidential secretary, confidential assistant, and all chief deputy positions.
(b) Rules in this subchapter do not apply to temporary employees.
Authority G.S. 126-4

24
25 NCAC 01O.0109 is proposed for adoption as follows:
25 NCAC 01O.0109 PERFORMANCE MANAGEMENT DEFINITIONS
The following definitions apply to all rules in this Subchapter:
(1) “Annual Performance Evaluation” means the comprehensive review of the employee’s
performance, relative to the goals throughout the entire performance cycle. The annual
performance evaluation contains a final overall rating.
(2) “Calibration Session” means a confidential discussion between same-level managers or
supervisors facilitated by the next-level manager, supervisor or designated Human Resources
representative, to evaluate work distribution, goal alignment, goal validity, results, and final
ratings.
(3) “Coaching Session” means either a documented formal or undocumented informal conversation
between a manager or supervisor and employee to provide feedback and reinforce desired work
actions and behavior.
(4) “Counseling Session” means a formal documented conversation between a manager or supervisor
and an employee to provide specific feedback and initiate a Performance Improvement Plan to
develop a strategy for an employee to raise his or her performance to a minimum of “Meets
Expectation.”
(5) “Goals” means organizational, division, work unit, and individual level outcomes which support
the strategic mission of the organization. All goals must be relevant to agency goals/mission.
(6) “Individual Development Plan” means the process used to identify areas of development so an
employee will have the skills, knowledge and abilities he or she needs to meet the organization’s
goals and objectives, and is given an opportunity to develop competencies that will allow him or
her to be successful in the future.
(7) “Interim Review” means a formal discussion and documentation of such at the mid-point of the
performance cycle between a manage or supervisor and an employee to review the employee’s
progress and make any necessary adjustments, including the initiation of an Individual
Development Plan or a Performance Improvement Plan if necessary.
(8) “Permanent Employee” means an employee who is in a permanent position and has attained career
status by being continuously employed by the State in a position subject to the State Human
Resources Act for the immediate 24 preceding months.
(9) “Performance Expectation(s)” means a goal, value, or both, defining outcomes and behaviors that
are documented on a performance plan to identify results to be accomplished and how the work
should be accomplished.
(10) “Performance Improvement Plan” means a written document issued to an employee by a manager
or supervisor which provides specific instructions to the employee about the action(s) the
employee shall take to improve performance or conduct deficiencies to the “Meets Expectations”
25
level of performance. A performance improvement plan is issued to an employee who maintains
employment and is issued a written warning or other progressive disciplinary action, such as
suspension without pay or demotion.
(11) “Performance Plan” means a description of the goals and values to be accomplished by the
employee within the performance cycle, with emphasis on the goals and results to be achieved and
how those results will be measured.
(12) “Position Description” means a statement or set of duties and responsibilities that represents the
major functions of a job which must be performed to meet the agency’s needs.
(13) “Probationary Employee” means an employee who is in a permanent position but has not attained
career status by being continuously employed by the State in a position subject to the State Human
Resources Act for the immediate 24 preceding months.
(14) “Satisfactory Performance” means performance for which the employee consistently meets
expectations and occasionally exceeds expectations.
(15) “Time-Limited Employee” means an employee who is in a time-limited position and is not
eligible for career status.
(16) “Values” means qualitative behavioral attributes that document how work actions should be
accomplished. Values reflect core organizational beliefs that guide and motivate actions
supporting the accomplishment of the agency mission and goals.
Authority G.S. 126-4
26
25 NCAC 01O.0110 is proposed for adoption as follows:
25 NCAC 01O.0110 PERFORMANCE CYCLE
(c) The standard State government performance cycle is from July 1 through June 30, with the exception of the
constituent institutions of the University of North Carolina who will have a standard performance cycle from
April 1 through March 31.
(d) The annual performance evaluation shall be completed, approved, discussed with employees, and entered into
the system of record within 60 calendar days of the cycle end date.
(e) The State Human Resources Director may change the dates of the standard performance cycle; however, all
covered employees shall be notified a minimum of 60 calendar days prior to the start of the new performance cycle.
Authority G.S. 126-4
27
25 NCAC 01O.0111 is proposed for adoption as follows:
25 NCAC 01O.0111 DOCUMENTATION OF PERFORMANCE
(a) The Office of State Human Resources shall provide a standard evaluation template, individual development
plan template, and Performance Improvement Plan template to be utilized by all agencies, universities and
individuals covered by this Subchapter.
(b) The State Human Resources Director shall publish and communicate the standardized templates a minimum of
90 calendar days prior to the start of the performance cycle.
Authority G.S. 126-4

28
25 NCAC 01O.0112 is proposed for adoption as follows:
25 NCAC 01O.0112 PERFORMANCE MANAGEMENT RESOURCES AND TRAINING
Each agency and university shall:
(1) designate a person as its performance management coordinator, with responsibility for coordinating
the development, implementation, and ongoing administration of performance management within
the organization.
(2) provide performance management training, made available by the Office of State Human Resources,
to all newly hired or promoted managers or supervisors, to be successfully completed within the
first three months of the manager’s or supervisor’s new role;
(3) provide annual refresher training, made available by the Office of State Human Resources, to all
employees.
Authority G.S. 126-4

29
25 NCAC 01O.0113 is proposed for adoption as follows:
25 NCAC 01O.0113 CONFIDENTIALITY AND RECORDS RETENTION
(a) Performance evaluations are confidential documents under G.S. 126-22.
(b) To promote communication and coordination, agency management may make some version of performance plans
visible internally; however, any information shared during calibration sessions shall be treated as confidential and
shall not be shared outside of the calibration session.
(c) A breach of confidentiality shall be considered personal misconduct and may result in disciplinary action up to
and including dismissal.
(d) Annual performance evaluations and supporting documentation shall be securely retained for at least three years,
and then maintained according to the applicable records retention schedule.
Authority G.S. 126-4

30
25 NCAC 01O.0114 is proposed for adoption as follows:
25 NCAC 01O.0114 PERFORMANCE MANAGEMENT COMPLIANCE
(a) The Office of State Human Resources shall monitor and evaluate performance management records and data to
ensure agency compliance.
(b) If an employee believes his or her manager or supervisor is failing to adhere to the performance management
processes, the employee should notify the next-level manager or supervisor or the agency’s Human Resources office.
(c) The failure of a manager or supervisor to carry out the performance management process in accordance with this
Subchapter shall be addressed as a performance deficiency and shall result in one or more of the following:
(1) coaching from the next-level manager or supervisor to determine the cause(s) of the deficiency and
implementation of a Performance Improvement Plan;
(2) participating in skills enhancement training;
(3) monitoring and documentation of manger or supervisor progress towards improving implementation
of performance management; or
(4) the issuing of appropriate disciplinary action, up to and including dismissal.
Authority G.S. 126-4

31
25 NCAC 01O.0115 is proposed for adoption as follows:
25 NCAC 01O.0115 PERFORMANCE RATING DISPUTE
Career State employees or former career State employees may grieve an overall performance rating of “Does Not
Meet Expectations” using the agency’s or university’s internal employee grievance process.
Authority G.S. 126-4
32
25 NCAC 01O.0207 is proposed for adoption as follows:
SECTION .0200 THE PERFORMANCE MANAGEMENT SYSTEM MANAGING AND EVALUATING
PERFORMANCE
25 NCAC 01O.0207 FREQUENCY OF PERFORMANCE REVIEWS
Performance Reviews are required in the following instances:
(1) For permanent State employees, the manager or supervisor shall establish a performance plan for
the employee during the first sixty (60) calendar days of the performance cycle. The manager or
supervisor shall conduct an interim review at the mid-point of the performance cycle and shall
conduct a final performance evaluation annually, within 60 calendar days of the end of the
performance cycle.
(2) For probationary employees, the manager or supervisor shall establish a performance plan for the
employee during the first 60 calendar days of employment. The manager or supervisor shall review
the probationary employee’s performance by conducting quarterly documented performance
feedback discussions during the first 12 months of employment. If a probationary employee, at a
minimum, “Meets Expectations” on all individual goals and individual values, at the end of the first
performance cycle, then quarterly documented performance feedback discussions are no longer
required. The manager or supervisor shall establish a performance plan for the probationary
employee during the first 60 calendar days of the next performance cycle. The manager or
supervisor shall conduct an interim review at the mid-point of the performance cycle and shall
conduct a final performance evaluation annually, within sixty 60 calendar days of the end of the
performance cycle. The probationary employee shall have been functioning under an issued
performance plan for at least six months to receive his or her first performance review.
(3) For trainee and time-limited employees, the manager or supervisor shall establish a performance
plan for the employee during the first 60 calendar days of employment. The manager or supervisor
shall review the trainee or time-limited employee’s performance by conducting quarterly
documented performance feedback discussions. The trainee or time-limited employee must have
been functioning under an issued performance plan for at least six months to receive his or her first
performance review. If the employee’s performance indicates he or she is not suited for the position
and cannot be expected to meet satisfactory performance standards, the employee shall be separated.
If he or she meets satisfactory performance standards, the manager or supervisor shall establish a
performance plan for the employee during the first 60 calendar days of the next performance cycle.
The manager or supervisor shall conduct an interim review at the mid-point of the performance
cycle and shall conduct a final performance evaluation annually, within 60 calendar days of the end
of the performance cycle.
(4) When an employee transfers to another position within state government, a performance review
shall be completed prior to the transfer. If the transfer occurs within 30 calendar days of the end of

33
the interim review or annual performance evaluation, then a copy of the completed and signed
interim review or the completed and signed annual performance evaluation shall be sent to the
receiving manager or supervisor. If the transfer occurs more than 30 calendar days prior to the
interim review or annual performance evaluation, the existing manager or supervisor shall provide
written performance information accountable for ensuring continuity of performance documentation
specific to the employee’s achievement of established goals and values to the receiving manager or
supervisor.
(5) When there is a change in manager or supervisor, the existing manager or supervisor shall provide
written performance information specific to the employee’s achievement of established goals and
values to the receiving manager or supervisor. If the change in manager or supervisor occurs within
30 calendar days of the annual performance evaluation, then the existing manager or supervisor shall
complete the formal performance evaluation.
(6) When an employee separates from state government, the manager or supervisor shall assess
performance and assign a final overall performance rating, unless the employee’s separation is due
to a documented disciplinary action, retirement, disability, illness, or death. For an employee who
is separated for any reason other than documented disciplinary action, retirement, disability, illness,
or death, any final overall performance rating of “Does Not Meet Expectations” must be approved
by the Human Resources Director or his or her designee.
Authority G.S. 126-4

34
25 NCAC 01O.0208 is proposed for adoption as follows:
25 NCAC 01O.0208 PERFORMANCE PLANNING
(a) Each employee shall have an annual Performance Plan to include at least three but not more than five
strategically aligned critical individual goals, a description of how goals will be measured, and the level of
performance required to meet expectations and values. Goals shall be written at the “Meets Expectation” level. The
agency or university shall facilitate calibration discussions to systematically assess goal validity and ensure
organizational consistency.
(b) Within 90 calendar days of the onset of a performance management cycle, the Office of State Human Resources
(OSHR) will publish and communicate two to four organizational values, which will be standard for all employees
subject to this Subchapter. Each agency or university may choose to add up to five additional organizational values,
selected from a predefined list published and communicated by OSHR within 90 calendar days of the onset of the
performance management cycle.
(c) Organizational values must be 50% of the total weight relative to overall performance. Individual agencies or
universities may determine weight of specific goals; however, goal weight shall be no more than 50% of the total
weight relative to overall performance.
(d) Managers/Supervisors shall hold a performance planning discussion with each employee and put a performance
plan in place with each employee within 60 calendar days of:
(1) the beginning of the performance management cycle;
(2) the employee’s entry into a position;
(3) a new probationary, trainee or time-limited employee’s date of employment; or
(4) any significant change to the performance expectations of the current Performance Plan.
(e) Once signed by the manager or supervisor and next-level manager or supervisor, the employee shall review,
sign, and date the performance plan. If the employee refuses to sign the performance plan, the manager or supervisor
shall document, on the performance plan, the employee’s refusal.
(f) Each employee shall have ready access to his or her performance plan either via paper or electronically.
Authority G.S. 126-4

35
25 NCAC 01O .0209 is proposed for adoption as follows:
25 NCAC 01O.0209 PERFORMANCE FEEDBACK
(a) Throughout the performance cycle, the manager or supervisor must document and validate, based on direct
observation or feedback from others, employee performance results and behaviors on a regular and consistent basis.
In addition, the manager or supervisor must provide feedback to the employee, both positive and corrective, when
appropriate. Both the manager or supervisor and employee should document activities and accomplishments related
to goals and behaviors during the performance cycle.
(b) Managers or supervisors must conduct a minimum of three formal performance discussions annually, for each
employee and timed accordingly as follows:
(1) the initial planning discussion, at the beginning of the performance cycle;
(2) an interim review at the performance cycle midpoint;
(3) the annual performance evaluation, at the end of the performance cycle.
The formal discussions provide managers/supervisors and employees with an opportunity to discuss any changes in
organizational priorities or employee development goals, review progress and, if necessary, revise performance
plans, initiate individual development plans, or address performance problems and identify steps the employee
should take to improve or adjust priorities through the remainder of the performance cycle. Additional formal and
informal discussions shall also be conducted as needed throughout the performance cycle to adjust cycle goals,
document progression, or address fluctuating business requirements.
(c) All formal coaching sessions and formal performance discussions shall be documented.
Authority: G.S. 126-4

36
25 NCAC 01O.0210 is proposed for adoption as follows:
25 NCAC 01O.0210 ADDRESSING POOR PERFORMANCE
If at any time during the performance cycle an employee is not meeting expectations, the manager or supervisor shall:
(1) Conduct a documented coaching session to
a. discuss ways to improve the employee’s performance or behavior;
b. see input from the employee about whether the performance issue can be corrected
through a process change or if the employee needs to receive additional training on
current procedures or processes;
c. outline the steps to be taken to improve performance, including the specific timeframe for
improvement;
d. identify the consequences, including progressive corrective action, of failure to improve;
and
e. define a follow up date.
If performance improves to the “Meets Expectation” level during the defined timeframe and
performance is maintained, no further action is necessary.
(2) If employee performance or behavior does not improve to the “Meets Expectation” level during
the designated timeframe discussed during the formal coaching session, the manager or supervisor
shall consult his or her Human Resources representative, prepare a Performance Improvement
Plan (PIP), and conduct and document a formal counseling session to review the PIP with the
employee. The PIP documentation shall serve as the first written warning, and shall:
a. be in writing and state that it is a warning;
b. state the specific performance or behavior problem that is the reason for the warning;
c. state the specific steps to be taken to improve performance, including the specific
timeframe for improvement;
d. state the consequences, including progressive disciplinary action, of failure to make the
required improvements or corrections;
e. define a follow-up date(s),
f. tell the employee of any appeal rights provided by State law, and
g. discuss the Employee Assistance Program (EAP) when appropriate.
(3) If performance improves to the “Meets Expectation” level during the designated timeframe and is
maintained, no further action is necessary.
(4) If performance does not improve to the “Meets Expectation” level during the designated timeframe
outlined in the PIP and discussed during the formal counseling session, or if the performance or
behavior fails to be maintained at the “Meets Expectations” level, the manager or supervisor shall
begin the formal corrective disciplinary action process as outlined in 25 NCAC 01J.0613 and contact
his or her Human Resources representative.

37
(5) If an employee receives a performance-based disciplinary action during the performance cycle,
corrects, and maintains performance at the “Meets Expectations” level, then the employee shall be
considered to have met expectations for the performance expectation(s) associated with the
disciplinary action.
(6) If an employee receives a performance-based disciplinary action during the performance cycle,
corrects, and maintains performance at the “Meets Expectations” level, the employee shall be
considered to have met expectations for the goal or organizational value associated with the
disciplinary action.
(7) If the employee receives both a “Meets Expectations” for the goal or organizational value cited in
the warning or other disciplinary action and a “Meets Expectations” in the overall performance
evaluation rating, the performance-based disciplinary action becomes inactive.
(8) If the written warning is based on the employee’s failure to complete tasks listed in the job
description or is based on the employee’s failure to respond to a direct order from the manager or
supervisor, but these warnings are not linked to the goals or organizational values of the performance
plan, then the written warning shall remain active, according to the OSHR disciplinary policy.
(9) At the conclusion of the performance cycle, if the employee has not successfully satisfied the terms
of the PIP, or has an active performance-based disciplinary action, the employee shall be considered
not to have met expectations during the current cycle for the performance expectation(s) associated
with the disciplinary action.
Authority G.S. 126-4

38
25 NCAC 01O .0211 is proposed for adoption as follows:
25 NCAC 01O .0211 ANNUAL PERFORMANCE EVALUATION
(a) At the end of the performance cycle, the manager or supervisor shall evaluate employee performance relative to
the three to five individual goals as well as the selected organizational values. Managers or supervisors shall use
quantitative and qualitative information collected throughout the cycle and documented by various sources, including
information documented by the employee, to determine the extent to which the employee’s actual performance has
met the expectations defined in the performance plan. The manager or supervisor shall evaluate performance based
on the collected performance information and assign ratings to each goal and value to determine an overall annual
performance evaluation rating. Agency or University Human Resources personnel shall facilitate calibration
discussions to systematically assess rating validity and ensure organizational consistency.
(b) Each individual goal and value shall be rated using the standardized rating scale. The standardized rating scale
will consist of three levels defined as follows:
a. “Exceeds Expectations” means performance consistently exceeds documented expectations and
measurements. The employee consistently does work going far beyond what is expected in terms
such as quantity, quality, timeliness, cost, and customer satisfaction. Performance that “Exceeds
Expectations” is due to the effort and skills of the employee. Performance is consistently
characterized by exceptionally high quality work that requires little or no improvements or
corrections. An employee at the “Exceeds Expectations” level repeatedly makes exceptional or
unique contributions to the organization that are above the requirements of his/her duties and
responsibilities. An employee performing at the “Exceeds Expectations” level should be readily
recognized by their organization as an outstanding contributor to the organization’s mission.
b. “Meets Expectations” means performance consistently meets and occasionally exceeds the
documented job expectations and measurements. The employee performs according to expectations.
The employee does the job at the level expected for this position and consistently meets what is
expected in terms such as quantity, quality, timeliness, cost and customer satisfaction. The
performance is due to the employee’s own effort and skills. An employee performing at the “Meets
Expectations” level is dependable and makes valuable contributions to the organization. His or her
judgments are sound, and he or she demonstrates knowledge and mastery of duties and
responsibilities. Most employees should meet expectations in a functional, performing work unit.
c. “Does Not Meet Expectations” means performance does not meet job expectations and
measurements and supervisory attempts to encourage performance improvement are unsuccessful.
The employee is performing the job at an unsatisfactory performance level in terms such as quantity,
quality, timeliness, cost, and customer satisfaction and performance improvement counseling by the
manager or supervisor has not resulted in adequate employee performance improvement. Manager
or supervisors are required to continue addressing performance issues with an employee with this
rating level, documenting management efforts to encourage satisfactory performance, and

39
documenting subsequent results on a Performance Improvement Plan. Failure to perform is due to
the employee’s lack of effort or skills. Performance counseling sessions shall be guided by next-
level management or Human Resources, and may result in disciplinary action for the employee who
fails to demonstrate improvement.
(c) The employee’s final overall rating shall be based on results achieved relative to his or her individual goals and
organizational values. The final overall rating must reflect both quantity and quality of job performance relative to
established goals and identified values. A final overall rating of “Exceeds Expectations” shall be supported by
appropriately documented results and accompanied by demonstrated adherence to organizational values. An employee
who does not at least “Meet Expectations” on all organizational values shall not be awarded a final overall rating of
“Exceeds Expectations,” regardless of level of results achieved on goals. An employee who receives a “Does Not
Meet” on any goal shall not be awarded an overall rating of “Exceeds Expectations,” regardless of the level of results
achieved or adherence to values.
(d) Upon completion of calibration, a final overall rating shall be assigned and entered into the appropriate system of
record. Managers or supervisors shall not submit final overall ratings for employees unless an annual performance
plan, supported by ongoing performance documentation, has been completed in compliance with this Subchapter.
Authority: G.S. 126-4
Related Documents