Fiscal decentralization and regional inequality in Brazil Jevuks Matheus de Araújo Department of Economics Federal University of Paraíba [email protected] This article analyses the relationship between fiscal decentralization and regional inequalities in Brazil. The paper utilizes aggregated data for the period from 1980 to 2014 and shows a negative correlation between the process of fiscal decentralization and regional inequalities in Brazil. The empirical estimates were made using dynamic panel data models with data for the 27 Brazilian states over a period of 20 years (1995-2014). The results show that the policy of fiscal decentralization has been an important instrument for reducing income inequality among states. We also highlight the role of educational policies as instruments to reduce inequalities. Keywords: fiscal decentralization; regional inequalities; Brazilian states. JEL: H10, H77, R11, R58 Descentralização fiscal e desigualdade regional no Brasil O objetivo do trabalho é analisar a relação entre descentralização fiscal e desigualdade regional no Brasil. Na análise de fatos estilizados foram usados dados agregados para o período de 1980 a 2014 que apresentaram uma correlação negativa entre a descentralização fiscal e as desigualdades regionais. A análise empírica estimou um modelo de dados em painel dinâmico usando dados dos 27 estados brasileiros para o período de 1995 a 2015. Os resultados mostram que a descentralização fiscal tem sido um importante instrumento para redução das desigualdades regionais. Destacamos também o importante papel da politica educacional com instrumento para redução das desigualdades. Palavras-chave: descentralização fiscal. Desigualdades regionais. Estados brasileiros. Área 5 - Economia do Setor Público

Welcome message from author
This document is posted to help you gain knowledge. Please leave a comment to let me know what you think about it! Share it to your friends and learn new things together.
Transcript

Fiscal decentralization and regional inequality in Brazil
Jevuks Matheus de Araújo Department of Economics
Federal University of Paraíba
This article analyses the relationship between fiscal decentralization and
regional inequalities in Brazil. The paper utilizes aggregated data for the
period from 1980 to 2014 and shows a negative correlation between the
process of fiscal decentralization and regional inequalities in Brazil. The
empirical estimates were made using dynamic panel data models with data
for the 27 Brazilian states over a period of 20 years (1995-2014). The
results show that the policy of fiscal decentralization has been an
important instrument for reducing income inequality among states. We
also highlight the role of educational policies as instruments to reduce
inequalities.
Keywords: fiscal decentralization; regional inequalities; Brazilian states.
JEL: H10, H77, R11, R58
Descentralização fiscal e desigualdade regional no Brasil
O objetivo do trabalho é analisar a relação entre descentralização fiscal e
desigualdade regional no Brasil. Na análise de fatos estilizados foram
usados dados agregados para o período de 1980 a 2014 que apresentaram
uma correlação negativa entre a descentralização fiscal e as desigualdades
regionais. A análise empírica estimou um modelo de dados em painel
dinâmico usando dados dos 27 estados brasileiros para o período de 1995 a
2015. Os resultados mostram que a descentralização fiscal tem sido um
importante instrumento para redução das desigualdades regionais.
Destacamos também o importante papel da politica educacional com
instrumento para redução das desigualdades.
Palavras-chave: descentralização fiscal. Desigualdades regionais. Estados
brasileiros.
Área 5 - Economia do Setor Público

Introduction
Fiscal decentralization is a recurring theme in the economic literature as a mechanism
capable of improving public sector efficiency. According to Oates (1972),
decentralization allows a better understanding of the population's preferences, allowing
a greater efficiency in the allocation of public resources. As per Tiebout (1952),
decentralization stimulates competition among federated jurisdictions, which can
generate innovations and improve the well-being of the population.
However, there are countless criticisms of decentralization, one of which
concerns the distribution of resources within the federation. Prudhomme (1995)
suggests that a stronger central government, namely, a more centralized public sector,
improves the distribution of resources among regions as it tends to channel resources
from the richer regions to the poorer regions.
Per Canaleta, Arzoz and Gárate (2004), there are two lines of argument that
guide the debate on the relations between decentralization and regional inequalities, the
first one oriented to the theory of public choices, which suggests decentralization as a
mechanism to reduce regional disparities and as another key to strengthening the central
government to reduce regional disparities. Dash (2014) points out that the relationship
between decentralization and regional inequality is an empirical question. Further, the
study states that this relationship is not direct and is associated with the specific context
of each country.
In Brazil, the fiscal decentralization occurred with the promulgation of the
Federal Constitution of 1988. The new federative pact increased the participation of
subnational governments (states and municipalities) in the distribution of resources
collected and in the incurrence of public expenditure. Among the characteristics of the
tax system and the fiscal federalism adopted in Brazil, it is noteworthy that there is a
strong fiscal imbalance vertically. This naturally induces intergovernmental transfer
mechanisms. In this federative arrangement, there is a reduction in the role played by
the States and an increase in the functional importance of the municipalities.
In the 1990s, the States experienced a severe financial crisis. Among other
factors, this crisis of the states originated in the federative redesign by the Constitution
of 1988 and from the stabilizing policies adopted by the federal government from 1995
onwards. The need for States to adapt to the new economic reality has further reduced
their managerial capacity. Between 1991 and 2000, the internal debt of the states went
from approximately 7.2% to 15% of the national GDP1.
In the 2000s there was a relative improvement in state finances, with an increase
in fiscal effort and a significant reduction in the relative debt of the states (in 2010 it
represented 11.5% of the national GDP). These results were partially due to the
imposition of new institutional arrangements, such as the Fiscal Responsibility Law
(LRF) and Law No. 9,496/97, that mandated new directions for fiscal policy in the
states. Araújo and Paes (2015) showed that the average fiscal effort of the states
increased by 32% in the period from 1995 to 2010; the authors emphasized that the
fiscal performance achieved in the 2000s was a result, among other factors, of the
institutional adjustments imposed on the states in the late 1990s.
On the other hand, we have the socioeconomic characteristics of Brazil, which
highlight the strong economic imbalance between the five regions that make up the
country. In 2014, the share of GDP by regions was 5.3%, 9.4%, 13.9%, 16.4% and
54.9% in the North, Central-West, Northeast, South and Southeast regions, respectively.
Regional inequalities have been identified by other economic and social indicators. For
example, the percentage of illiterate people (aged 15 or over) in Brazil in 2014 was

8.27%, whereas in the South region it was only 4.39% and in the Northeast region it
was 16.81%. These socioeconomic differences between regions may be reversible;
however, they are inherent to the historical process of economic formation in Brazil.
In this context, the objective of this paper is to analyse the relationship between
fiscal decentralization and regional inequalities in Brazil. Specifically, it seeks evidence
that the fiscal policy of decentralization, heavily intensified in the re-democratization of
the country, has some effects on the problem of regional inequality. To do so, we report
some stylized facts and produce some estimates. The results show that fiscal
decentralization in Brazil contributes to reducing inequalities. The paper contributes to
the empirical literature because it is a specific discussion about the Brazilian economy.
The article has the following structure: The next section provides an overview of
fiscal decentralization and regional inequality in Brazil. In the third section, we present
the data and the methodology. In the fourth section, the results are discussed, and the
fifth section provides the conclusions of the article.
Fiscal decentralization and regional inequalities in Brazil (some indicators)
Fiscal decentralization in Brazil was closely associated with the process of re-
democratization that began in the late 1970s, and both were consolidated with the
promulgation of the Federal Constitution in 1988. Among the tax changes imposed by
the new Constitution, we highlight the redistribution of fiscal control and the
strengthening of mechanisms for intergovernmental transfers. The new federative
design has given subnational governments new bases of collection; however, the
expansion of fiscal obligations has made the current growth of local governments’’ own
revenue insufficient. Thus, the changes have not corrected the fiscal imbalances;
further, the role of intergovernmental transfers has been overestimated.
Table 1 shows the change of the participation of subnational governments in
revenue collection. We highlight the strong growth of the Brazilian tax burden that
increased by approximately 37% in the period from 1980 to 2010. This growth is a
direct consequence of the tax reform mandated by the Constitution of 19882. In a little
more than thirty years, the states increased their share in the tax burden by 60% and
their total revenue by 17%. Although the share of municipalities in the tax burden is
small, it grew by 130%.
Table 1. Changes in the tax burden and share by level of government.
Description 1980 1985 1990 1995 2000 2010 2014
Tax burden (% of GDP) 24.50% 23.83% 30,50% 29.76% 32,55% 33.53% 33.47%
Federal 18.30% 17,33% 20,53% 20.01% 22,52% 23.15% 22.91%
States 5.30% 5.92% 9,02% 8.32% 9,02% 8.53% 8.48%
Municipalities 0.90% 0.58% 0,95% 1.43% 1,53% 1.85% 2.07%
Share in Total Collection
Federal 74.70% 72.74% 67,32% 66,00% 69,19% 67,45% 68,47%
States 21.60% 24.83% 29,57% 28,60% 26,54% 26,5% 25,35%
Municipalities 3.70% 2.43% 3,11% 5,40% 4,52% 6,05% 6,19%
Budget Spending (% of GDP)
States 5.34% 10,02% 14,03% 12,01% 12,84% 13,55% 12,53%
Municipalities 2.42% 3,25% 3,48% 7,67% 6,83% 5,21% 7,55%
Source: National Treasury Secretariat (STN) and Brazilian Institute of Geography and Statistics (IBGE).

In sharing the tax burden, the states were responsible for the collection of the
“Tax on the Circulation of Goods and Services” (ICMS), which is the main excise tax.
In 2014, ICMS revenue was equivalent to 6.82% of GDP and represented 82% of the
tax revenue of the states. Thus, the vertiginous growth of the role of the States in the
composition of the tax burden is reflected specifically in the collection of ICMS.
Decentralization can also be observed in the case of expenditure because of the
role played by transfers that increase the revenue available to subnational governments.
In Table 1, we observe that the participation of states and municipalities is greater in the
execution of expenses than in the collection of revenues. The major net beneficiaries of
the transfers are the municipalities. In 2014, municipalities accounted for 7.55% of GDP
whereas their tax revenue was only 2.09% of GDP.
Data from the National Treasury Secretariat (STN) show the importance of
intergovernmental transfers in the budget of subnational governments. In 1989, the tax
revenue (local revenue) of Brazilian municipalities represented approximately 9% of the
total municipal expenditure; in 2014, this percentage was approximately 27%. However,
revenues from intergovernmental transfers increased from 64% to 74% of total
municipalities' expenditure. In 1989 and 2014, state revenue accounted for 56% and
61% of total state expenditure, respectively, whereas transfer revenue rose from 14% to
22% of total state expenditure.
The data describe the fiscal decentralization that took place in Brazil, evidencing
a reduction in the participation of the Federal Government in the collection and
execution of the expenditure. Araujo and Siqueira (2016, p. 4) point out that "the
decrease is due to the loss of tax base and the strengthening of intergovernmental
transfer mechanisms instituted by the 1988 Constitution."
The tax reform implemented by the 1988 Constitution had the clear objective of
broadening the fiscal autonomy of states and municipalities by giving them new fiscal
powers. Another point highlighted was the need to correct the strong regional
disparities3. Figures 1 and 2 show the change in the value of the indicator of regional
inequalities4 for Brazil and their negative correlation with the indicator of fiscal
decentralization5, respectively.
Figure 1. Change of Regional Inequalities.
Source: Own elaboration.

Figure 2. Regional Inequalities by Regional Decentralization.
Source: Own elaboration.
In the period between 1985 and 2014, the total reduction in regional inequality
was 28%. This period presents two strong inflections: the first one between 1985 and
1991 (in this period the reduction was 10%) and the second between 2009 and 2013 (the
reduction was 9%). It is possible to gauge visually that there is an inverse relationship
between fiscal decentralization and regional inequality. The data suggest that the
reduction of regional inequality is associated with the growth of fiscal decentralization;
this understanding is consistent with the theory of public choices. However, this relation
does not take into account the influence of other variables. In the next section, we will
present our methodology and the data used in the empirical analysis.
Methodology and data
The data used in this research concern the period from 1995 to 2014. This period is
chosen due to the absence of disaggregated (reliable) data for subnational governments
for years prior to 1995. To measure the inequalities between the states of the federation,
we use the indicator of the relative per capita income (Iit)6, given by:
𝐼𝑖𝑡 = |𝑥𝑖𝑡
𝑦𝑡− 1| (1),
where xit is the per capita GDP of the ith
state of the federation in year t, and yt is
national GDP per capita in year t. This indicator captures income disparities across
states. In a scenario of perfect equality, the value of the indicator would be zero.
Fiscal decentralization (FD) is measured by the share of state spending in the
total public sector expenditure:
𝐹𝐷𝑖𝑡 = 𝑧𝑖𝑡
𝑍𝑡 (2),
where zit is the budget of the ith
state in year t and Zt is the consolidated
expenditure of the public sector.
We chose this indicator because of the importance of intergovernmental
transfers as the main fiscal decentralization mechanism in Brazil. Transfers increase the
share of state expenditure regardless of whether their own revenue increases (as
described in section 2).
The relationship between interregional inequality and fiscal decentralization will
be estimated using the panel data technique (FE, RE, FGLS, and SYS-GMM
Estimators) and the following model:
𝐼𝑖𝑡 = 𝛼 + 𝛽𝐹𝐷𝑖𝑡 + 𝛿𝑊𝑖𝑡 + 휀𝑖𝑡 𝑖 = 1, … , 𝑁; 𝑡 = 1, … , 𝑇 (3),
휀𝑖𝑡 = 𝜇𝑖 + 𝜈𝑖𝑡 (4),
where Wit is the sociodemographic variables vector. W is composed of the
following variables: inequality of human capital, size of the industrial sector, and
population. The indicator of human capital inequality is calculated by the relative
differences in the average years of education of the population (over 25 years old) in
each state. The size of the industrial sector is given by the industry share (industrial
GDP) in the total GDP of each state.
According to Mincer (1958), Schultz (1964), and Becker (1964) it is possible to
make a direct association between economic growth and human capital. Therefore, we
assume that interregional income inequalities are positively influenced by the indicator
of human capital inequalities.
In structuralist theory7, industrialization is the main means for reducing regional
inequalities. Thus, we assume that increasing industry participation in the state economy
should reduce income inequality.
Results
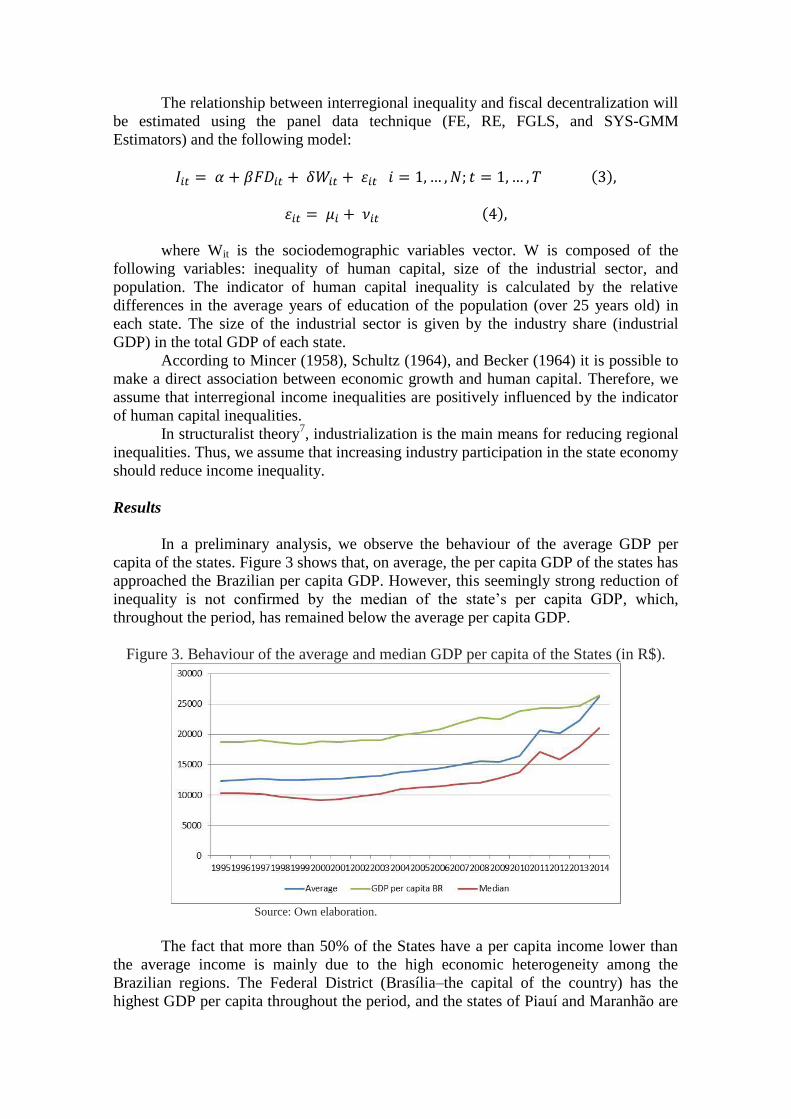
In a preliminary analysis, we observe the behaviour of the average GDP per
capita of the states. Figure 3 shows that, on average, the per capita GDP of the states has
approached the Brazilian per capita GDP. However, this seemingly strong reduction of
inequality is not confirmed by the median of the state’s per capita GDP, which,
throughout the period, has remained below the average per capita GDP.
Figure 3. Behaviour of the average and median GDP per capita of the States (in R$).
Source: Own elaboration.
The fact that more than 50% of the States have a per capita income lower than
the average income is mainly due to the high economic heterogeneity among the
Brazilian regions. The Federal District (Brasília–the capital of the country) has the
highest GDP per capita throughout the period, and the states of Piauí and Maranhão are
the poorest in terms of GDP per capita. In 2014, the per capita GDP of the Federal
District was 6 times the size of per capita GDP of the state of the poorest. Although this
difference is very large, it is 38% smaller than that observed in 1995.
Continuing with the exploratory analysis, we verify the correlation between the
variable that captures the inequality (Iit) and the variable that captures the fiscal
decentralization (FDit). We estimated the Spearman correlation coefficient and pooled
regression model using Ordinary Least Squares (OLS).
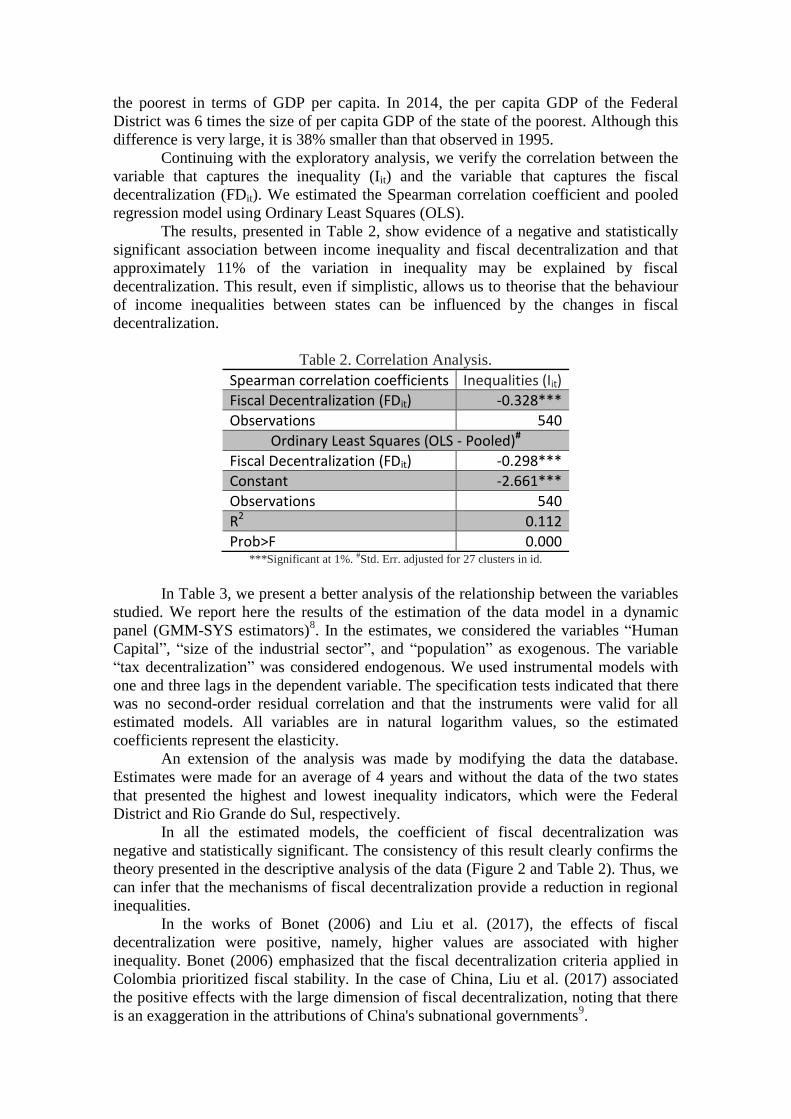
The results, presented in Table 2, show evidence of a negative and statistically
significant association between income inequality and fiscal decentralization and that
approximately 11% of the variation in inequality may be explained by fiscal
decentralization. This result, even if simplistic, allows us to theorise that the behaviour
of income inequalities between states can be influenced by the changes in fiscal
decentralization.
Table 2. Correlation Analysis.
Spearman correlation coefficients Inequalities (Iit)
Fiscal Decentralization (FDit) -0.328***
Observations 540
Ordinary Least Squares (OLS - Pooled)#
Fiscal Decentralization (FDit) -0.298***
Constant -2.661***
Observations 540
R2 0.112
Prob>F 0.000 ***Significant at 1%. #Std. Err. adjusted for 27 clusters in id.
In Table 3, we present a better analysis of the relationship between the variables
studied. We report here the results of the estimation of the data model in a dynamic
panel (GMM-SYS estimators)8. In the estimates, we considered the variables “Human
Capital”, “size of the industrial sector”, and “population” as exogenous. The variable
“tax decentralization” was considered endogenous. We used instrumental models with
one and three lags in the dependent variable. The specification tests indicated that there
was no second-order residual correlation and that the instruments were valid for all
estimated models. All variables are in natural logarithm values, so the estimated
coefficients represent the elasticity.
An extension of the analysis was made by modifying the data the database.
Estimates were made for an average of 4 years and without the data of the two states
that presented the highest and lowest inequality indicators, which were the Federal
District and Rio Grande do Sul, respectively.
In all the estimated models, the coefficient of fiscal decentralization was
negative and statistically significant. The consistency of this result clearly confirms the
theory presented in the descriptive analysis of the data (Figure 2 and Table 2). Thus, we
can infer that the mechanisms of fiscal decentralization provide a reduction in regional
inequalities.
In the works of Bonet (2006) and Liu et al. (2017), the effects of fiscal
decentralization were positive, namely, higher values are associated with higher
inequality. Bonet (2006) emphasized that the fiscal decentralization criteria applied in
Colombia prioritized fiscal stability. In the case of China, Liu et al. (2017) associated
the positive effects with the large dimension of fiscal decentralization, noting that there
is an exaggeration in the attributions of China's subnational governments9.

On the other hand, Dash (2014) and Kyriacou et al. (2016) show that fiscal
decentralization reduces regional inequality in India and in a set of countries (both
developed and developing), respectively. Dash (2014) underscores the importance of
decentralization to the poorer states of India, and Kyriacou et al. (2016) introduce the
need to incorporate the quality of each Government as a key variable in the analysis.
The relevant literature, despite the different methodological strategies, clearly
associates the effect of decentralization with the particularities of each country. As
described in Section 2, the main mechanism of fiscal decentralization in Brazil is
intergovernmental transfers. Among them, we highlight for each state the FPE
characterized as an unconditional redistributive transference. As an example, in 2015,
the amount of FPE transferred to the States was 1.02% of the Brazilian GDP, and the
North-eastern state (the poorest region) received approximately 52% of the total
resources transferred.
The control variables we used are also statistically significant. As expected,
human capital inequality has an inverse relationship with regional inequality. Many
papers use human capital as a variable to explain income inequality. Overall, the results
show an inverse relationship between inequality and human capital. In this study, we
used a different approach: we measured an indicator of relative inequality of human
capital. The result confirms the theory that relative human capital gains result in relative
income gains. Thus, greater income inequalities between states can be reduced by
implementing policies that promote the reduction of human capital inequalities.
The secondary sector participation in the economy did not present the result we
expected. Barros (2011), analysing the data on the participation of the industrial sector
in the Brazilian regions, showed that there was a “catch-up” of the industrial sector;
however regional inequalities were not reduced. The author concluded that there was no
empirical support for the ECLAC ideas that attempt to explain the regional inequalities
in Brazil. Our results confirm the non-empirical evidence of the hypotheses defended by
Furtado (1959).
Finally, we find that the coefficient of population size has an inverse relation
with the growth of regional inequalities. Although this is not a variable that presents a
clear theoretical relation to inequalities, we can assume population size as a proxy for
the size of the market. That can, within certain limits, justify its importance.

Table 3. Main Results.
Estimator: GMM-SYS
Annuals Average Annuals
Dependent Variable (Iit) (1) (2)
Four-year averages
(3)
Without the states with higher and lower
average (Iit) (4)
Independent Variables
One-year lags
Three-year lags
One-year lags
One-year lags
Inequalities (Iit-1) 0.701*** 0.700*** 0.039 0.778***
Inequalities (Iit-2) --- 0.105*** --- ---
Inequalities (Iit-3) --- -0.116*** --- ---
Fiscal Decentralization (FD) - Expenditure Total Share
-0.073*** -0.0703*** -0.114** -0.070***
Human Capital Indicator (HCI)
0.025** 0.038*** 0.059*** 0.025**
Industrial Sector Size
0.121*** 0.113*** 0.286*** 0.171***
Population -0.297*** -0.293*** -0.732*** -0.365***
Constant 3.842*** 3.842*** 9.636*** 4.980***
Observations 507 455 108 469
Sargan Test chi2 Prob>chi2
25.744 (1.000)
24.174 (1.000)
21.018 (0.136)
23.480 (1.000)
Arellano-Bond Test Order 2 Prob > z Order 3 Prob > z
1.089
(0.276) -0.907
(0.364)
-0.0345 (0.972) 1.5476 (0.121)
-1.105
(0.913) --- ---
0.554
(0.578) 0.165
(0.8687) ** Significant at 5% and ***Significant at 1%.
Checking the robustness
To check the robustness and sensitivity of the relationship between regional
inequality and fiscal decentralization, we estimate the same model by changing the
measures of inequality and decentralization.
The new measure of inequality uses Equation 1; however we use per capita
household income as a variable. Regarding the decentralization indicator, we used the
proportion of the state revenue in the total revenue. The tables below show the results of
the new estimated models.
We observed that for the alternative inequality measure, the estimated
coefficient for the decentralization indicator remains statistically significant and
preserves an inverse relation with the measure of inequality (Table 4). Thus, the

previous interpretations do not change. Estimating the model with the alternative
decentralization indicator (Table 5), we observe a change of magnitude of the
coefficient; however, the interpretations also do not change.
These results show that the estimates presented in Table 3 are consistent and not
sensitive to changes in the measure of the indicators.
Table 4. Robustness - sensitivity to inequality measure.
Estimator: GMM-SYS# Annuals
Dependent Variable (Iit Alternative)
(1)
Independent Variables One-year lags
Fiscal Decentralization (FD) - Total Expenditure Share
-0.065**
Observations 507
Sargan Test chi2 Prob>chi2
20.023 (1.000)
Arellano-Bond Test Order 2 Prob > z
1.182
(0.237) ** Significant at 5% level. #including constant and control variables (not shown).
All the variables are in logarithm values.
Table 5. Robustness - sensitivity to decentralization measurement.
Estimator: GMM-SYS# Annuals
Dependent Variable (Iit)
(1)
Independent Variables One-year lags
Fiscal Decentralization (FD) – Total Revenue Share
-0.223***
Observations 507
Sargan Test chi2 Prob>chi2
25.383 (1.000)
Arellano-Bond Test Order 2 Prob > z
1.103
(0.270) *** Significant at 1%.level. #including constant and control variables not shown.
All the variables are in logarithm values.
Conclusions
Fiscal decentralization is a relevant topic and much debated in the economics literature.
For the Brazilian economy, the political administrative structure implemented with the
Constitution of 1988 exalts the role of fiscal decentralization. This work sought to
investigate the relationship between fiscal decentralization and regional inequalities,
which is a subject rarely explored in Brazil.
The main result shows that fiscal decentralization is an important instrument for
reducing regional inequalities. Another important result is the positive relationship
between human capital inequality and regional inequalities.
These results may contribute to the debate about public policies aimed at
reducing regional inequality. Policy makers should seek to improve decentralization
mechanisms by strengthening the tax structure that prioritizes redistribution problems.
In regards to educational policy, it is not sufficient only to raise the education rates of
the poorest states, but also to promote higher educational growth rates than those of the
richer states.
Finally, there are some issues that deserve to be investigated in order to improve
the understanding of the relationship between regional inequalities and fiscal
decentralization in Brazil. First, the incorporation of new indicators and decentralization
measures associated with government quality. Poor government quality can reduce the
efficiency of redistribution mechanisms by reducing the positive effects of
decentralization. Another important issue is the simulation of the impacts of alternative
mechanisms of decentralization through transfers or expansion of the own tax base.
Further, for Brazil, it is also possible to analyse decentralization at the municipal level.

1. Central Bank of Brazil.
2. Although no new types of tax were created, there was a significant increase in rates by
allowing the creation of new tariffs and contributions that favored the growth of the tax
burden.
3. The Constitution expanded the Municipal Participation Fund (FPM) and the State
Participation Fund (FPE), which are modalities for transfers of resources from the Federal
Government to subnational governments.
4. The inequality indicator is the coefficient of variation (CV) weighted by the population.
According to Ezcurra and Pascual (2006), this measure of dispersion can be written as:
𝐶𝑉𝑡 = 1
𝜇𝑡[∑ 𝑝𝑖𝑡(𝑥𝑖𝑡 − 𝜇𝑡)2𝑛
𝑖=1 ]1
2⁄ ,
where xit and pit are the GDP per capita and the proportion of Brazil’s population in the ith unit
of the federation in year t, respectively, and mutI is defined as::
𝜇𝑡 = ∑ 𝑝𝑖𝑡𝑥𝑖𝑡
𝑛
𝑖=1
5. The indicator of fiscal decentralization is the proportion of the expenditure of the subnational
governments (states and municipalities) in the national GDP.
6. See Bonet (2006), Qiao, Martinez-Vazquez and Xu (2008), and Kyriacou et al. (2016).
7. See Furtado (1959) and Prebish (1962).
8. Estimates using FE, RE and FGLS were also performed. The results are reported in the
attached table.
9. Liu et al (2017) also show that fiscal equalization efforts reduce inequalities.

References
Araujo, J. M., & Siqueira, R. B. (2016). Demanda por gastos públicos locais: evidências
dos efeitos de ilusão fiscal no Brasil. Estudos Econômicos (São Paulo), 46(1),
189-219.
Araújo, J. M., & Paes, N. L. (2015). Os Determinantes Institucionais do Esforço Fiscal
nos Estados Brasileiros. Planejamento e Políticas Públicas, (45).
Barros, A. R. (2011). Desigualdades regionais no Brasil: natureza, causas, origens e
soluções. Elsevier, Rio de Janeiro.
Becker, G. S. (1964). Human capital theory. Columbia, New York.
Bonet, J. (2006). Fiscal decentralization and regional income disparities: evidence from
the Colombian experience. The Annals of Regional Science, 40(3), 661-676.
Canaleta, C. G., Pascual Arzoz, P., & Rapun Garate, M. (2004). Regional economic
disparities and decentralisation. Urban studies, 41(1), 71-94.
Dash, B. B. (2014). Regional Income Disparity and Government Intervention in India
Evidence from Sub-national Data. South Asia Economic Journal, 15(2), 281-
314.
Ezcurra, R., & Pascual, P. (2008). Fiscal decentralization and regional disparities:
evidence from several European Union countries. Environment and Planning
A, 40(5), 1185-1201.
Furtado, C. (1959). A operação Nordeste. Ministério da Educação e Cultura, Instituto
Superior de Estudos Brasileiros.
Mincer, J. (1958). Investment in human capital and personal income
distribution. Journal of political economy, 66(4), 281-302.
Kyriacou, A. P., Muinelo-Gallo, L., & Roca-Sagalés, O. (2016). Regional inequalities,
fiscal decentralization and government quality. Regional Studies, 1-13.
Liu, Y., Martinez-Vazquez, J. & Wu, A.M. Int Tax Public Finance (2017) 24: 248.
Prebisch, R. (1962). The economic development of Latin America and its principal
problems. Economic Bulletin for Latin America.
Prud'Homme, R. (1995). The dangers of decentralization. The world bank research
observer, 10(2), 201-220.
Oates, W. E. (1972). Fiscal federalism. Books.
Schultz, T. W. (1968). Resources for higher education: an economist's view. Journal of
Political Economy, 76(3), 327-347.
Tiebout, C. M. (1956). A pure theory of local expenditures. Journal of political
economy, 64(5), 416-424.

Appendix
Table B. Other estimators.
Dependent Variable (Iit)
Estimators
Independent Variable FEa REa FGLSb
Fiscal Decentralization (FD) - Expenditure Total Share
-0.131** -0.081 -0.044***
Human Capital Indication (HCI) -0.016 0.011 0.027**
Industrial Sector Size -0.263 -0.235 -0.110***
Population -1.055*** -0.106 -0.007
Constant 14.303*** 0.175 -1.019
Observations 533 533 533
Hausman Prob>chi2
0.000
a(Std. Err. adjusted for 27 clusters in id). b (Panels heteroskedastic and common AR(1)). ** Significant at 5% and ***Significant at 1%. All the variables are in logarithm values.
Related Documents