1 First Quarter Report For the period ended March 31, 2019

Welcome message from author
This document is posted to help you gain knowledge. Please leave a comment to let me know what you think about it! Share it to your friends and learn new things together.
Transcript

1First Quarter ReportFor the period ended March 31, 2019
PO
WE
R F
INA
NC
IAL
CO
RP
OR
AT
ION
FIR
ST
QU
AR
TE
R R
EP
OR
T 20
19


PA
RT
B
GR
EA
T-WE
ST LIFECO
INC
.P
AR
T C
IG
M FIN
AN
CIA
L INC
.P
AR
T D
PA
RG
ESA
HO
LDIN
G SA
PA
RT
AP
OW
ER FIN
AN
CIA
L CO
RP
OR
ATIO
N
POWER FINANCIAL CORPORATION
TABLE OF CONTENTS
POWER FINANCIAL CORPORATION PART A
GREAT-WEST LIFECO INC. PART B
IGM FINANCIAL INC. PART C
PARGESA HOLDING SA PART D
This document contains management’s discussion and analysis of the financial
condition, financial performance and cash flows of Power Financial Corporation (the
Corporation) for the three months ended March 31, 2019 and the unaudited interim
condensed consolidated financial statements of the Corporation as at and for the
three months ended March 31, 2019. This document has been fi led with the securities
regulatory authorities in each of the provinces and territories of Canada and mailed to
requesting shareholders of the Corporation in accordance with applicable securities laws.
POWER FINANCIAL CORPORATION�— �FIRST QUARTER REPORT 2019 1
PFC_QUAT1_Eng01_PFC_2019-05-11_v1.indd 1PFC_QUAT1_Eng01_PFC_2019-05-11_v1.indd 1 19-05-12 8:02 PM19-05-12 8:02 PM

The trademarks contained in this report are owned by Power Financial Corporation or by a Member of the
Power Corporation Group of Companies®. Trademarks that are not owned by Power Financial are used
with permission.
2 POWER FINANCIAL CORPORATION�— �FIRST QUARTER REPORT 2019�
PFC_QUAT1_Eng01_PFC_2019-05-11_v1.indd 2PFC_QUAT1_Eng01_PFC_2019-05-11_v1.indd 2 19-05-12 8:02 PM19-05-12 8:02 PM

PA
RT
AP
OW
ER FIN
AN
CIA
L CO
RP
OR
ATIO
NMANAGEMENT’S DISCUSSION AND ANALYSIS
PAG E A 2
FINANCIAL STATEMENTS AND NOTES
PAG E A 39
POWER FINANCIAL CORPORATION
PART A
POWER FINANCIAL CORPORATION�— �FIRST QUARTER REPORT 2019 A 1
PFC_QUAT1_Eng01_PFC_2019-05-11_v1.indd B1PFC_QUAT1_Eng01_PFC_2019-05-11_v1.indd B1 19-05-12 8:02 PM19-05-12 8:02 PM

PA
RT
AP
OW
ER F
INA
NC
IAL
CO
RP
OR
ATI
ON
POWER FINANCIAL CORPORATION
Management’s Discussion and Analysis
MAY 13, 2019 ALL TABULAR AMOUNTS ARE IN MILLIONS OF CANADIAN DOLLARS, UNLESS OTHERWISE NOTED.
The following presents Management’s Discussion and Analysis (MD&A) of the unaudited interim condensed consolidated financial condition and financial performance of Power Financial Corporation (Power Financial or the Corporation) (TSX: PWF), a public corporation, for the three-month period ended March 31, 2019. This MD&A should be read in conjunction with the unaudited interim condensed consolidated financial statements of Power Financial and notes thereto for the three-month period ended March 31, 2019 (the Interim Consolidated Financial Statements), the MD&A for the year ended December 31, 2018 (the 2018 Annual MD&A), and the audited consolidated financial statements and notes thereto for the year ended December 31, 2018 (the 2018 Consolidated Financial Statements). Additional information relating to Power Financial, including its Annual Information Form, may be found on the Corporation’s website at www.powerfinancial.com and on SEDAR at www.sedar.com.
FORWARD-LOOKING STATEMENTS › Certain statements in this MD&A, other than statements of historical fact, are forward-looking statements based on certain assumptions and reflect the Corporation’s current expectations, or with respect to disclosure regarding the Corporation’s public subsidiaries, reflect such subsidiaries’ disclosed current expectations. Forward-looking statements are provided for the purposes of assisting the reader in understanding the Corporation’s financial performance, financial position and cash flows as at and for the periods ended on certain dates and to present information about management’s current expectations and plans relating to the future and the reader is cautioned that such statements may not be appropriate for other purposes. These statements may include, without limitation, statements regarding the operations, business, financial condition, expected financial results, performance, prospects, opportunities, priorities, targets, goals, ongoing objectives, strategies and outlook of the Corporation and its subsidiaries including the fintech strategy, as well as the outlook for North American and international economies for the current fiscal year and subsequent periods. Forward-looking statements include statements that are predictive in nature, depend upon or refer to future events or conditions, or include words such as “expects”, “anticipates”, “plans”, “believes”, “estimates”, “seeks”, “intends”, “targets”, “projects”, “forecasts” or negative versions thereof and other similar expressions, or future or conditional verbs such as “may”, “will”, “should”, “would” and “could”. By its nature, this information is subject to inherent risks and uncertainties that may be general or specific and which give rise to the possibility that expectations, forecasts, predictions, projections or conclusions will not prove to be accurate, that assumptions may not be correct and that objectives, strategic goals and priorities will not be achieved. A variety of factors, many of which are beyond the Corporation’s and its subsidiaries’ control, affect the operations, performance and results of the Corporation and its subsidiaries and their businesses, and could cause actual results to differ materially from current expectations of estimated or anticipated events or results. These factors include, but are not limited to: the impact or unanticipated impact of general economic, political and market factors in North America and internationally, fluctuations in interest rates, inflation and foreign exchange rates, monetary policies, business investment and the health of local and global equity and capital markets, management of market liquidity and funding risks, risks related to investments in private companies and illiquid securities, risks associated with financial instruments, changes in accounting policies and methods used to report financial condition (including uncertainties associated with significant judgments, estimates and assumptions), the effect of applying future accounting changes, business competition, operational and reputational risks, technological changes, cybersecurity risks, changes in government regulation and legislation, changes in tax laws, unexpected judicial or regulatory proceedings, catastrophic events, the Corporation’s and its subsidiaries’ ability to complete strategic transactions, integrate acquisitions and implement other growth strategies, and the Corporation’s and its subsidiaries’ success in anticipating and managing the foregoing factors. The reader is cautioned to consider these and other factors, uncertainties and potential events carefully and not to put undue reliance on forward-looking statements. Information contained in forward-looking statements is based upon certain material assumptions that were applied in drawing a conclusion or making a forecast or projection, including management’s perceptions of historical trends, current conditions and expected future developments, as well as other considerations that are believed to be appropriate in the circumstances, including that the list of factors in the previous paragraph, collectively, are not expected to have a material impact on the Corporation and its subsidiaries. While the Corporation considers these assumptions to be reasonable based on information currently available to management, they may prove to be incorrect. Other than as specifically required by applicable Canadian law, the Corporation undertakes no obligation to update any forward-looking statement to reflect events or circumstances after the date on which such statement is made, or to reflect the occurrence of unanticipated events, whether as a result of new information, future events or results, or otherwise. Additional information about the risks and uncertainties of the Corporation’s business and material factors or assumptions on which information contained in forward-looking statements is based is provided in its disclosure materials, including this MD&A and its most recent Annual Information Form, filed with the securities regulatory authorities in Canada and available at www.sedar.com.
The following abbreviations are used throughout this report: adidas BME Burberry Canada Life China AMC EBR EPA GBL GEA Great-West Financial or
Great-West Life & Annuity Great-West Life IFRS IGM or IGM Financial IG Wealth Management Investment Planning Counsel Irish Life LafargeHolcim Lifeco London Life
adidas AG Madrid Stock Exchange Burberry Group plc The Canada Life Assurance Company China Asset Management Co., Ltd. Euronext Brussels Euronext Paris Groupe Bruxelles Lambert GEA Group Great-West Life & Annuity Insurance Company The Great-West Life Assurance Company International Financial Reporting Standards IGM Financial Inc. Investors Group Inc. Investment Planning Counsel Inc. Irish Life Group Limited LafargeHolcim Ltd Great-West Lifeco Inc. London Life Insurance Company
Mackenzie or Mackenzie Investments
Ontex PanAgora Pargesa Parjointco Parques Personal Capital Portag3 Power Corporation Putnam Retirement Advantage SGS SIX Sagard Holdings Total Umicore Wealthsimple XETR
Mackenzie Financial Corporation Ontex N.V. PanAgora Asset Management, Inc. Pargesa Holding SA Parjointco N.V. Parques Reunidos Servicios Centrales, S.A. Personal Capital Corporation Portag3 Ventures Limited Partnership Power Corporation of Canada Putnam Investments, LLC MGM Advantage Holdings Ltd. SGS SA Swiss Stock Exchange Sagard Holdings ULC Total SA Umicore, NV/SA Wealthsimple Financial Corp. XETRA Stock Exchange
A 2 POWER FINANCIAL CORPORATION�— �FIRST QUARTER REPORT 2019
PFC_QUAT1_Eng01_PFC_2019-05-11_v1.indd B2PFC_QUAT1_Eng01_PFC_2019-05-11_v1.indd B2 19-05-12 8:02 PM19-05-12 8:02 PM

PA
RT
AP
OW
ER FIN
AN
CIA
L CO
RP
OR
ATIO
NPPOWER FINANCIAL CORPORATION
Organization of the Interim MD&A
Page Page
Overview
Power Financial Corporation Net Asset Value
Subsequent Events Cash Flows
Lifeco Capital Management
IGM Financial Risk Management
Pargesa and GBL Financial Instruments and Other Instruments
Off-Balance Sheet Arrangements
Basis of Presentation Contingent Liabilities
IFRS Financial Measures and Presentation Commitments and Contractual Obligations
Non-IFRS Financial Measures and Presentation Income Taxes
Reconciliation of IFRS and Non-IFRS Financial Measures Transactions with Related Parties
Results of Power Financial Summary of Critical Accounting Estimates and Judgments
Consolidated Statements of Earnings Changes in Accounting Policies
Non-Consolidated Statements of Earnings Future Accounting Changes
Contribution to Net Earnings and Adjusted Net Earnings Internal Control over Financial Reporting
Financial Position Summary of Quarterly Results
Overview
POWER FINANCIAL CORPORATION Power Financial, a subsidiary of Power Corporation, is a diversified international management and holding company with interests substantially in the financial services sector in Canada, the U.S. and Europe. Founded in 1984 with the ambition of creating an integrated financial services group, Power Financial has remained committed to the growth and evolution of its primary holdings through its controlling interests in Lifeco and IGM, and in recent years implemented an active fintech strategy. Power Financial also has an investment in Pargesa, a holding company having influence through its holdings in global industrial and services companies based in Europe. Power Financial’s historic and ongoing objective is to create superior shareholder value over the long term.
Since its inception, the leadership of Power Financial has remained consistent in its approach to base decisions on what is in the best long-term interest of its operating companies and shareholders. Throughout its history, Power Financial has managed to the same basic principles:
take a long-term perspective and investment horizon;
build industry leaders with attractive growth profiles;
provide active and strong governance oversight of its companies; and
use prudence, be risk aware and maintain a strong financial position.
POWER FINANCIAL CORPORATION�— �FIRST QUARTER REPORT 2019 A 3
PFC_QUAT1_Eng01_PFC_2019-05-11_v1.indd B3PFC_QUAT1_Eng01_PFC_2019-05-11_v1.indd B3 19-05-12 8:02 PM19-05-12 8:02 PM

PA
RT
AP
OW
ER F
INA
NC
IAL
CO
RP
OR
ATI
ON
PPOWER FINANCIAL CORPORATION
Value creation Power Financial is committed to developing market-leading businesses that in turn create long-term shareholder value. Its investment approach is guided by three overriding principles, from identifying the right investment to the oversight and evaluation of each investee company:
Investment Principles Invest in companies that have a long-term perspective and investment horizon Support operating companies’ management to build industry leaders Focus on high growth and high return on equity products and market segments Perform a disciplined, fact-based analysis
Operating Principles Majority or significant level of ownership Focus on strategy, people and capital allocation Prudent, risk-aware and focus on creating and maintaining a strong balance sheet
Governance Principles Active governance model through boards of subsidiaries Board composition is a combination of Power Financial executives and external directors
Power Financial executives provide substantial industry and company knowledge External directors provide expertise and diverse perspectives
Holdings Lifeco and IGM are leaders across the insurance, asset management, and wealth and retirement business lines in their principal markets: Canada, the U.S. and Europe. Power Financial has supported them through various acquisitions and the group strategically benefits through:
group-wide distribution of products and services;
collaborative product development;
shared technologies and back-office capabilities;
scale enhancement through key relationships and aggregated purchasing power; and
collaborative approach to important industry developments.
Power Financial, in partnership with Lifeco and IGM, has been actively participating in the emerging fintech industry. The group believes that fintech will change business models in financial services, making financial advice, insurance and investment services more accessible to consumers and available to them by the means and at the time as best suits them. The fintech strategy aims at providing an attractive return on the capital invested while helping the existing financial services businesses transform their models.
The investments to date have contributed to building leading platforms that will be part of the next generation of financial services. The fintech strategy enables the group to learn from, adopt and integrate new technologies and understand how these disruptive business models will affect the current business and how to react to changes in the environment to be more effective. The fintech strategy has three objectives:
Through Portag3, create an ecosystem of early-stage investments in promising fintech companies that have potential for global impact;
Make significant investments in leading digital financial services providers including Wealthsimple, one of Canada’s largest digital financial advisors; and
Develop a fintech venture builder to support the creation of the next generation of Canadian-based global fintech companies.
Power Financial also holds jointly with the Frère Group of Belgium a controlling interest in Pargesa, a holding company which, through its subsidiary GBL, maintains a diversified high-quality portfolio composed of global companies that are leaders in their respective sector, through which it can contribute to value creation as an active professional investor. The Pargesa group has positioned its portfolio with a view to strengthening its growth profile and consequently optimizing its potential for long-term value creation. Pargesa shares the values and prudent investing approach of Power Financial. This investment provides Power Financial with a vehicle to create value in the European market and diversifies its financial services portfolio.
A 4 POWER FINANCIAL CORPORATION�— �FIRST QUARTER REPORT 2019
PFC_QUAT1_Eng01_PFC_2019-05-11_v1.indd B4PFC_QUAT1_Eng01_PFC_2019-05-11_v1.indd B4 19-05-12 8:02 PM19-05-12 8:02 PM

PA
RT
AP
OW
ER FIN
AN
CIA
L CO
RP
OR
ATIO
NPPOWER FINANCIAL CORPORATION
The Corporation and its group of companies have laid the foundation for future value creation, including:
Continued focus on long-term shareholder value creation;
Growing earnings organically by capitalizing on the scale of our leading franchises in a rapidly changing environment;
Actively seeking opportunities to deploy capital in accretive acquisitions;
Pursuing technology–enabled solutions in financial services to enhance incumbent businesses;
Rotation of GBL’s portfolio to accelerate value creation.
Organization of the MD&A The Corporation’s MD&A consists of four parts:
Part A – Power Financial, presented on a consolidated and non-consolidated basis;
Part B – Lifeco’s interim MD&A, as prepared and disclosed by Lifeco in accordance with applicable securities legislation, and which is also available either directly from SEDAR (www.sedar.com) or from Lifeco’s website (www.greatwestlifeco.com);
Part C – IGM’s interim MD&A, as prepared and disclosed by IGM in accordance with applicable securities legislation, and which is also available either directly from SEDAR (www.sedar.com) or from IGM’s website (www.igmfinancial.com);
Part D – Pargesa’s financial results, derived from publicly disclosed information, as issued by Pargesa in its first quarter press release. Further information on Pargesa’s results is available on its website (www.pargesa.ch).
Lifeco (TSX: GWO) and IGM (TSX: IGM) are public companies listed on the Toronto Stock Exchange. Pargesa is a public company listed on the Swiss Stock Exchange (SIX: PARG). Market capitalizations reported in the following sections are at March 31, 2019.
The following chart reflects the economic interest held by the Corporation in its operating subsidiaries and certain other investments at March 31, 2019.
In bold: Publicly listed holdings
Great-
Refer to the “Pargesa and GBL” section for a list of investments in public companies.
Power Financial directly holds a 63
IGM also hold interests of respectively, in Wealthsimple.
100%
50.0%
Lifeco
Power Financial
IGM Financial [1] Pargesa
Mackenzie
China AMC
IG Wealth Management
PanAgora
Great-West Financial
Putnam
Wealthsimple
Portag3
Great-West Life
London Life
Canada Life
Irish Life
GBL
POWER FINANCIAL CORPORATION�— �FIRST QUARTER REPORT 2019 A 5
PFC_QUAT1_Eng01_PFC_2019-05-11_v1.indd B5PFC_QUAT1_Eng01_PFC_2019-05-11_v1.indd B5 19-05-12 8:02 PM19-05-12 8:02 PM

PA
RT
AP
OW
ER F
INA
NC
IAL
CO
RP
OR
ATI
ON
PPOWER FINANCIAL CORPORATION
SUBSEQUENT EVENTS
Substantial Issuer Bids On April 17, 2019, Lifeco announced that it had completed a substantial issuer bid (Lifeco Offer), and purchased for cancellation 59,700,974 of its common shares at a purchase price of $33.50 per common share, for an aggregate amount of $2.0 billion. Power Financial supported Lifeco through its participation in the Lifeco Offer by tendering a significant portion of its Lifeco common shares on a proportionate basis and all remaining tendered Lifeco common shares on a non-proportionate basis. As a result of the Lifeco Offer, as of April 17, 2019, the Corporation held interest in Lifeco after giving effect to the cancellation of Lifeco common shares pursuant to the Lifeco Offer.
Power Financial used the proceeds from its participation in the Lifeco Offer to fund its own substantial issuer bid. On April 17, 2019, Power Financial completed its substantial issuer bid (PFC Offer), and purchased for cancellation 49,999,973 of its common shares, representing of the issued and outstanding common shares prior to the repurchase, at a purchase price of $33.00 per common share, for an aggregate amount of $1.65 billion. After giving effect to the purchase, the number of issued and outstanding Power Financial common shares, as of April 17, 2019, was 664,096,506 on a non-diluted basis. The substantial issuer bid allowed the Corporation to return capital to shareholders, while maintaining a strong capital position to fund future growth opportunities. Power Corporation supported the Corporation through its participation in the PFC , as of April 17, 2019, following completion of the PFC Offer.
LIFECO Great-West Lifeco Inc., TSX: GWO; market capitalization of $32.0 billion at March 31, 2019, is an international financial services holding company with interests in life insurance, health insurance, retirement and investment services, asset management and reinsurance businesses. Lifeco has operations in Canada, the United States and Europe through Great-West Life, London Life, Canada Life, Great-West Financial, Putnam and Irish Life. For reporting purposes, Lifeco has four reportable segments: Canada, the United States, Europe and Corporate, which reflect geographic lines as well as the management and corporate structure of the companies.
In Canada, through the Individual Customer and Group Customer business units, Lifeco offers a broad portfolio of financial and benefit plan solutions for individuals, families, businesses and organizations, including life, disability and critical illness insurance products as well as wealth savings and income and other speciality products. On April 3, 2019, Lifeco announced that its three Canadian life insurance companies, The Great-West Life Assurance Company, London Life Insurance Company and The Canada Life Assurance Company, are moving to one brand in Canada: Canada Life. Canada Life will become the brand under which the organization will create, deliver and communicate products and services in Canada across all of its lines of business.
The United States segment operates two business units, Financial Services and Asset Management. Its Financial Services unit, and specifically the Empower Retirement brand, serves all segments of the employer-sponsored retirement plan market and offers employer-sponsored defined contribution plans, individual retirement accounts, enrolment services, communication materials, investment options and education services as well as fund management, investment and advisory services. The Asset Management unit, Putnam, provides investment management, certain administrative functions, and distribution services as well as offers a broad range of investment products, including equity, fixed income, absolute return and alternative strategies. PanAgora, a Putnam affiliate, offers a broad range of investment solutions using sophisticated quantitative techniques.
On January 24, 2019, Lifeco announced that its subsidiary, Great-West Financial, reached an agreement to sell, via indemnity reinsurance, substantially all of its individual life insurance and annuity business to Protective Life Insurance Company (Protective Life). Lifeco estimates that this will result in an after-tax transaction value of approximately $1.6 billion (US$1.2 billion), excluding one-time expenses. Lifeco will retain a small block of participating life insurance policies which will be administered by Protective Life following the close of the transaction. The transaction is expected to close in the second quarter of 2019, subject to regulatory and customary closing conditions, and will allow Great-West Financial to focus on the defined contribution retirement market and its Empower Retirement brand.
A 6 POWER FINANCIAL CORPORATION�— �FIRST QUARTER REPORT 2019
PFC_QUAT1_Eng01_PFC_2019-05-11_v1.indd B6PFC_QUAT1_Eng01_PFC_2019-05-11_v1.indd B6 19-05-12 8:02 PM19-05-12 8:02 PM

PA
RT
AP
OW
ER FIN
AN
CIA
L CO
RP
OR
ATIO
NPPOWER FINANCIAL CORPORATION
The European segment is comprised of two distinct business units, Insurance & Annuities and Reinsurance, which offer protection and wealth management products, including payout annuity products and reinsurance products.
At March 31, 2019, Power Financial and IGM held interests of 67.8 4.0 in Lifeco’s common shares, representing approximately 65 shares. The Insurance Companies Act limits voting rights in life insurance companies to 65 As of April 17, 2019, following the Corporation’s participation in the Lifeco Offer , and IGM maintained it(refer to the section “Subsequent Events”to all outstanding Lifeco voting shares.
See Part B of this MD&A for additional information on Lifeco.
IGM FINANCIAL IGM Financial Inc., TSX: IGM; market capitalization of $8.3 billion at March 31, 2019, is a leading wealth and asset management company which serves the financial needs of Canadians through its principal subsidiaries, each operating distinctly, primarily within the advice segment of the financial services market. Its activities are carried out through its subsidiaries IG Wealth Management, Mackenzie Investments and Investment Planning Counsel.
IG Wealth Management offers an exclusive family of mutual funds and other investment vehicles, and a wide range of insurance, securities, mortgage products and other financial services. IG Wealth Management offers IG Living Plan™, a holistic, client-centric approach to financial planning that reflects the evolving needs, goals and aspirations of Canadian families and individuals. The IG Living Plan™ provides a single, integrated view of all aspects of a client’s finances, including retirement and estate planning, investments, and tax strategies, creating a truly synchronized and comprehensive plan. IG Wealth Management provides its services through its exclusive network of consultants across Canada. It strives to distinguish itself from its competition by offering comprehensive planning to its clients within the context of long-term relationships.
Mackenzie Investments is an investment management firm providing investment advisory and related services through multiple distribution channels: Retail, Strategic Alliances and Institutional. Mackenzie distributes its products and services primarily through a diversified distribution network of third-party financial advisors. Mackenzie seeks to be Canada’s preferred global asset management solutions provider and business partner.
IGM e of the first fund management companies in China, which has developed and maintained its position among the market leaders in China’s asset management industry. China AMC’s assets under management, excluding subsidiary assets under management, were RMB¥880 billion (C$175 billion) at December 31, 2018.
Corporation and IGM AMC. Power Corporation and IGM have significant influence and account for their interests as an associate using the equity method.
Investment Planning Counsel is an independent distributor of financial products, services and advice in Canada.
At March 31, 2019, Power Financial and Great-West Life, a subsidiary of Lifeco, held interests of 61.5 3.8in IGM’s common shares. See Part C of this MD&A for additional information on IGM.
POWER FINANCIAL CORPORATION�— �FIRST QUARTER REPORT 2019 A 7
PFC_QUAT1_Eng01_PFC_2019-05-11_v1.indd B7PFC_QUAT1_Eng01_PFC_2019-05-11_v1.indd B7 19-05-12 8:02 PM19-05-12 8:02 PM

PA
RT
AP
OW
ER F
INA
NC
IAL
CO
RP
OR
ATI
ON
PPOWER FINANCIAL CORPORATION
PARGESA AND GBL Power Financial Europe B.V., a wholly owned subsidiary of Power Financial, and the Frère Group Parjointco. At March 31, 2019, Parjointco held a 55.5 interest in Pargesa, representing 75.4 of the voting rights.
Pargesa, SIX: PARG; market capitalization of SF6.6 billion, is a holding company, which, at March 31, 2019in GBL, representing 51.0 of the voting rights. GBL, a Belgian holding company, is listed on the Brussels Stock Exchange.
GBL, EBR: GBLB; market capitalization of €14.0 billion, is one of the largest listed holding companies in Europe. As a holding company focused on long-term value creation, GBL relies on a stable, family shareholder base. Its portfolio is comprised of global industrial and services companies, leaders in their markets, in which GBL plays its role of professional shareholder.
At March 31, 2019, GBL’s portfolio was mainly comprised of investments in the following publicly traded companies: Imerys (EPA: NK) – mineral-based specialty solutions for
industry
adidas (XETR: ADS) – design and distribution of sportswear
Pernod Ricard (EPA: RI) – wines and spirits
SGS (SIX: SGSN) – testing, inspection and certification
LafargeHolcim (SIX: HOLN and EPA: LHN) – cement, aggregates and concrete
Umicore (EBR: UMI) – materials technology and recycling of precious metals
Total (EPA: FP) – oil, gas and chemical industries
GEA (XETR: G1A) – supplier of equipment and project management for a wide range of processing industries primarily in the food and beverage sectors
Ontex (EBR: ONTEX) – disposable hygiene products
Parques (BME: PQR) – operation of regional leisure parks
In addition, through its subsidiary Sienna Capital, GBL is developing a portfolio of private equity, debt and thematic funds.
At March 31, 2019, Pargesa’s net asset value was SF10,179 million, compared with SF8,973 million at December 31, 2018. GBL’s net asset value at March 31, 2019 was €18,483 million, compared with €16,193 million at December 31, 2018.
See Part D of this MD&A for additional information on Pargesa.
PORTAG3 AND WEALTHSIMPLE Power Financial, together with IGM and Lifeco (the group), are anchor investors in funds managed by an affiliate, Portag3 Ventures, which operates investment funds dedicated to backing innovative financial services companies that have the potential for change and global impact. Portag3 Ventures has invested in more than 30 fintech companies and investment funds. At the end of 2018, the management and operations of Portag3 Ventures were transferred under Sagard Holdings, a subsidiary of Power Corporation.
Portag3 Ventures’ first fintech fund (Portag3) held investments of $52 million at March 31, 2019 ($54 million at December 31, 2018), excluding the investment in Wealthsimple discussed below.
At March 31, 2019, Portag3, Power Financial and IGM held equity interests in Wealthsimple of 23.7 17.4 47.5respectively, representing a combined voting interest of 88.9 . Wealthsimple is one of Canada’s largest and fastest-growing technology-driven investment managers. Since its launch in 2014, Wealthsimple has grown to serve over 100,000 clients with over $4.3 billion in assets under administration at March 31, 2019 ($3.4 billion at December 31, 2018). Wealthsimple has expanded its distribution reach through its platforms offering Wealthsimple Invest, Wealthsimple Save, Wealthsimple Trade, Wealthsimple for Advisors (W4A) and Wealthsimple for Work (W4W) and serves clients across the Canadian, United States and United Kingdom markets.
During the first quarter, Power Financial and IGM invested a further $12 million and $18 million, respectively, in Wealthsimple. At March 31, 2019, the group had invested $238 million in Wealthsimple.
Portag3 Ventures II LP, Portag3 Ventures’ second fintech fund, is focused on early stage investments in the global financial technology sector. At March 31, 2019, total capital commitments were $282 million, of which Power Financial, Lifeco and IGM have each committed $33 million. The fair value of the investments held by the fund at March 31, 2019 was $84 million ($67 million at December 31, 2018).
A 8 POWER FINANCIAL CORPORATION�— �FIRST QUARTER REPORT 2019
PFC_QUAT1_Eng01_PFC_2019-05-11_v1.indd B8PFC_QUAT1_Eng01_PFC_2019-05-11_v1.indd B8 19-05-12 8:02 PM19-05-12 8:02 PM

PA
RT
AP
OW
ER FIN
AN
CIA
L CO
RP
OR
ATIO
NPPOWER FINANCIAL CORPORATION
Basis of Presentation
IFRS FINANCIAL MEASURES AND PRESENTATION The Interim Consolidated Financial Statements of the Corporation have been prepared in accordance with International Accounting Standard 34 Interim Financial Reporting (IAS 34) and are presented in Canadian dollars.
Consolidated financial statements present, as a single economic entity, the assets, liabilities, revenues, expenses and cash flows of the parent company and its subsidiaries. The consolidated financial statements present the financial results of Power Financial (parent) and Lifeco, IGM, Portag3 and Wealthsimple (Power Financial’s controlled operating subsidiaries) after the elimination of intercompany balances and transactions.
Power Financial’s investment in Pargesa is held through Parjointco. Parjointco is a holding company jointly controlled by Power Financial and the Frère Group. Power Financial’s investment in Parjointco is accounted for using the equity method, in which the investment is initially recognized at cost and adjusted thereafter for:
Power Financial’s share of: Net earnings or loss in Pargesa; Other comprehensive income or loss in Pargesa; and Pargesa’s other changes in equity.
Dividends received from Parjointco.
The following table summarizes the accounting presentation for the Corporation’s holdings: CControl AAccounting MMethod EEarnings and Other
CComprehensive Income IImpairment Testing IImpairment Reversal
Controlling interest in the entity
Consolidation Consolidated with non-controlling interests
Goodwill and indefinite life intangible assets are tested at least annually for impairment
Impairment of goodwill cannot be reversed
Impairment of intangible assets is reversed if there is evidence of recovery of value
Significant influence or joint control
Equity method Corporation’s share of earnings and other comprehensive income
Entire investment is tested for impairment
Reversed if there is evidence the investment has recovered its value
Non-controlled portfolio investments
Available for sale (AFS) Earnings consist of dividends received and gains or losses on disposals
The investments are marked to market through other comprehensive income
Earnings are reduced by impairment charges, if any
Impairment testing is done at the individual investment level
A significant or prolonged decline in the value of the investment results in an impairment charge
A share price decrease subsequent to an impairment charge leads to a further impairment
A subsequent recovery of value does not result in a reversal
POWER FINANCIAL CORPORATION�— �FIRST QUARTER REPORT 2019 A 9
PFC_QUAT1_Eng01_PFC_2019-05-11_v1.indd B9PFC_QUAT1_Eng01_PFC_2019-05-11_v1.indd B9 19-05-12 8:02 PM19-05-12 8:02 PM

PA
RT
AP
OW
ER F
INA
NC
IAL
CO
RP
OR
ATI
ON
PPOWER FINANCIAL CORPORATION
At March 31, 2019, the Corporation’s holdings were as follows: HHoldings
iinterest NNature of investment AAccounting method
Lifeco Controlling interest Consolidation IGM [3 Controlling interest Consolidation Pargesa [4 Joint control Equity method Portag3 [5 Controlling interest Consolidation Wealthsimple [6 Controlling interest Consolidation
Refer to the section “Subsequent Events”.
[ Great-West Life also holds a 3.8
[ .
[ Lifeco and IGM also hold equal interests
[ Portag3 and IGM also hold interests of 23.7 47.5 , respectively, in Wealthsimple.
At March 31, 2019, Pargesa’s publicly listed holdings were as follows: HHoldings
iinterest NNature of investment AAccounting method
GBL Controlling interest Consolidation Imerys Controlling interest Consolidation adidas Portfolio investment Available for sale Pernod Ricard Portfolio investment Available for sale SGS Portfolio investment Available for sale LafargeHolcim Portfolio investment Available for sale Umicore Portfolio investment Available for sale Total Portfolio investment Available for sale GEA Portfolio investment Available for sale Ontex Portfolio investment Available for sale Parques Significant influence Equity method Other investments Portfolio investments Available for sale
This summary of accounting presentation should be read in conjunction with the following notes to the Corporation’s 2018 Consolidated Financial Statements:
Basis of presentation and summary of significant accounting policies (Note 2);
Investments (Note 6);
Investments in jointly controlled corporations and associates (Note 8);
Goodwill and intangible assets (Note 11); and
Non-controlling interests (Note 20).
A 10 POWER FINANCIAL CORPORATION�— �FIRST QUARTER REPORT 2019
PFC_QUAT1_Eng01_PFC_2019-05-11_v1.indd B10PFC_QUAT1_Eng01_PFC_2019-05-11_v1.indd B10 19-05-12 8:02 PM19-05-12 8:02 PM

PA
RT
AP
OW
ER FIN
AN
CIA
L CO
RP
OR
ATIO
NPPOWER FINANCIAL CORPORATION
NON-IFRS FINANCIAL MEASURES AND PRESENTATION This MD&A presents and discusses financial measures which are not in accordance with IFRS. Management uses these financial measures in its presentation and analysis of the financial performance of Power Financial, and believes that they provide additional meaningful information to readers in their analysis of the results of the Corporation. The non-IFRS financial measures used in the MD&A are defined as follows:
NNon--IIFRS financial measure DDefinition PPurpose Non-consolidated basis of presentation
Power Financial’s interests in Lifeco, IGM, Portag3 and Wealthsimple are accounted for using the equity method.
Used by the Corporation to present and analyze its results, financial position and cash flows.
Presents the holding company’s (parent) results separately from the results of its consolidated operating companies.
As a holding company, management reviews and assesses the performance of each operating company’s contribution to net earnings and adjusted net earnings. This presentation is useful to the reader to assess the impact of the contribution to earnings for each subsidiary.
Adjusted net earnings
Net earnings excluding the impact of Other items.
Assists in the comparison of the current period’s results to those of previous periods as items that are not considered to be a part of ongoing operations are excluded.
Other items
After-tax impact of any item that in management’s judgment would make the period-over-period comparison of results from operations less meaningful.
Includes the Corporation’s share of items presented as other items by a subsidiary or a jointly controlled corporation.
Identifies items that are not considered part of ongoing operations. The exclusion of these items assists management and the reader in assessing current results as these items are not reflective of ongoing operations.
Adjusted net earnings per share
Earnings per share calculated using adjusted net earnings.
Adjusted net earnings divided by the weighted average number of common shares outstanding.
Assists in comparing adjusted net earnings on a per share basis.
Net asset value
Net asset value is the fair value of Power Financial’s non-consolidated assets less its net debt and preferred shares.
The investments held in public entities (Lifeco, IGM and Pargesa) are measured at their market value and investments in private entities are measured at management’s estimate of fair value.
Presents the fair value of the net assets of the holding company and is used to assist in assessing value.
This measure may be used by investors and analysts in determining or comparing the fair value of investments held by the company or its overall fair value.
Net asset value per share
Net asset value calculated on a per share basis.
Net asset value divided by the number of common shares outstanding.
Assists reader in comparing net asset value on a per share basis.
These non-IFRS financial measures do not have a standard meaning and may not be comparable to similar measures used by other entities. Reconciliations of the net asset value and the non-IFRS basis of presentation with the presentation in accordance with IFRS are included throughout this MD&A.
POWER FINANCIAL CORPORATION�— �FIRST QUARTER REPORT 2019 A 1 1
PFC_QUAT1_Eng01_PFC_2019-05-11_v1.indd B11PFC_QUAT1_Eng01_PFC_2019-05-11_v1.indd B11 19-05-12 8:02 PM19-05-12 8:02 PM

PA
RT
AP
OW
ER F
INA
NC
IAL
CO
RP
OR
ATI
ON
PPOWER FINANCIAL CORPORATION
RECONCILIATION OF IFRS AND NON-IFRS FINANCIAL MEASURES The following tables present a reconciliation of net earnings and earnings per share reported in accordance with IFRS to non-IFRS financial measures: adjusted net earnings, other items and adjusted net earnings per share. Adjusted net earnings and adjusted net earnings per share are presented in the section “Non-Consolidated Statements of Earnings”:
Three months ended March ,
December ,
March ,
Net earnings – IFRS financial measure
Share of Other items , net of tax
Pargesa )
Adjusted net earnings – Non-IFRS financial measure
Attributable to common shareholders of Power Financial.
[2 Refer to the section “Other items” for more details on Other items from Pargesa.
Three months ended March ,
December ,
March
Net earnings per share – IFRS financial measure
Share of Other items , net of tax
Pargesa )
Adjusted net earnings per share – Non-IFRS financial measure
Attributable to common shareholders of Power Financial.
Refer to the section “Other items” for more details on Other items from Pargesa.
Results of Power Financial
This section presents: the “Consolidated Statements of Earnings in accordance with IFRS”; and
the “Non-Consolidated Statements of Earnings”, which present the contributions of operating subsidiaries and Pargesa to the net earnings and adjusted net earnings of Power Financial.
Refer to the section “Non-IFRS Financial Measures and Presentation” for a description of the non-consolidated basis of presentation and a reconciliation of IFRS and non-IFRS financial measures.
DEFERRAL OF IFRS 9, FINANCIAL INSTRUMENTS (IFRS 9)
In May 2017, the IASB issued IFRS 17, Insurance Contracts, which will replace IFRS 4, Insurance Contracts and will be applied retrospectively. In November 2018, the IASB proposed an amendment to IFRS 17 providing a deferral of one year of the effective date of the standard to January 1, 2022. In addition, the IASB extended to January 1, 2022 the exemption for insurers to apply the financial instruments standard, IFRS 9, Financial Instruments, so that both IFRS 9 and IFRS 17 will have the same effective date.
IGM, a subsidiary and Pargesa, held through Parjointco, a jointly controlled corporation do not qualify for the exemption and adopted IFRS 9 on January 1, 2018. The Corporation, in accordance with the amendment of IFRS 4 to defer the adoption of IFRS 9, is permitted but not required to retain the accounting policies applied by an associate or a jointly controlled corporation which is accounted for using the equity method. The Corporation decided to continue applying accounting policies in accordance with IAS 39 to Pargesa’s results. On consolidation, the Corporation has adjusted the results of both IGM and Pargesa to be in accordance with IAS 39. Refer to the specific discussion included in the IGM and Pargesa sections “Contribution to net earnings and adjusted net earnings”.
A 12 POWER FINANCIAL CORPORATION�— �FIRST QUARTER REPORT 2019
PFC_QUAT1_Eng01_PFC_2019-05-11_v1.indd B12PFC_QUAT1_Eng01_PFC_2019-05-11_v1.indd B12 19-05-12 8:02 PM19-05-12 8:02 PM

PA
RT
AP
OW
ER FIN
AN
CIA
L CO
RP
OR
ATIO
NPPOWER FINANCIAL CORPORATION
CONSOLIDATED STATEMENTS OF EARNINGS IN ACCORDANCE WITH IFRS Power Financial’s consolidated statements of earnings for the three months ended March 31, 2019 are presented below. The Corporation’s operating segments are Lifeco, IGM and Pargesa. This table reflects the contributions from Lifeco, IGM and Pargesa to the net earnings attributable to Power Financial’s common shareholders.
Consolidated net earnings – Three months ended Lifeco IGM Pargesa Corporate Power Financial
Consolidated net earnings
March ,
December ,
March ,
RRevenues
Premium income, net )
Net investment income
Fee income )
Total revenues )
EExpenses
Total paid or credited to policyholders
Commissions )
Operating and administrative expenses
Financing charges
Total expenses Earnings before investments in jointly
controlled corporations and associates, and income taxes )
Share of earnings of investments in jointly controlled corporations and associates )
Earnings before income taxes )
Income taxes
NNet earnings ) AAttributable to
Non-controlling interests )
Perpetual preferred shareholders
Common shareholders of Power Financial ) )
Results reported by IGM are in accordance with IFRS 9. As the Corporation has not adopted IFRS 9, adjustments in accordance with IAS 39 have been recognized on consolidation and included in “Corporate”.
Results reported by Pargesa are in accordance with IFRS The Corporation’s share of earnings of Pargesa includes , including the Corporation’s share of a gain realized on the sale of an investment classified as FVOCI by Pargesa.
“Corporate” is comprised of the results of Portag3 and Wealthsimple, the Corporation’s investment activities, corporate operations and consolidation entries.
As a holding company, the Corporation evaluates the performance of each segment based on its contribution to net earnings and adjusted net earnings. A discussion of the results of Lifeco, IGM and Pargesa is provided in the “Contribution to net earnings and adjusted net earnings” section below.
POWER FINANCIAL CORPORATION�— �FIRST QUARTER REPORT 2019 A 1 3
PFC_QUAT1_Eng01_PFC_2019-05-11_v1.indd B13PFC_QUAT1_Eng01_PFC_2019-05-11_v1.indd B13 19-05-12 8:02 PM19-05-12 8:02 PM

PA
RT
AP
OW
ER F
INA
NC
IAL
CO
RP
OR
ATI
ON
PPOWER FINANCIAL CORPORATION
NON-CONSOLIDATED STATEMENTS OF EARNINGS In this section, the contributions from Lifeco and IGM to the net earnings and adjusted net earnings attributable to Power Financial’s common shareholders are accounted for using the equity method.
Three months ended March ,
December ,
March ,
AAdjusted net earnings
Lifeco
IGM
Pargesa )
Corporate operations ) ) )
Dividends on perpetual preferred shares ) ) )
AAdjusted net earnings
OOther items
Pargesa
NNet earnings EEarnings per share –– bbasic
Adjusted net earnings
Other items
Net earnings
For a reconciliation of Pargesa’s non-IFRS adjusted net earnings to its net earnings, refer to the “Contribution to net earnings and adjusted net earnings” section below.
The contributions from Lifeco and IGM include an allocation of the results of Wealthsimple and Portag3, based on their respective interest. Contributions from IGM and Pargesa reflect adjustments in accordance with IAS 39.
Attributable to common shareholders.
[ See “Other items” section below.
QQ1 2019 vs. Q1 2018 and Q4 2018
NNet earnings $536 million or $0.75 per share, compared with $586 million or $0.82 per share in the corresponding period in 2018, a decrease of 8.5on a per share basis, and $478 million or $0.67 per share in the fourth quarter of 2018.
AAdjusted net eearnings $536 million or $0.75 per share, compared with $586 million or $0.82 per share in the corresponding period in 2018, and $460 million or $0.65 per share in the fourth quarter of 2018.
CContribution to nnet earnings and aadjusted net earnings ffrom Lifeco, IGM and Pargesa Contribution to net earnings of $600 million, compared with $646 million in the corresponding period in 2018, a decrease of 7.1 and $550 million in the fourth quarter of 2018. Contribution to adjusted net earnings of $600 million, compared with $646 million in the corresponding period in 2018, and $532 million in the fourth quarter of 2018.
A discussion of the results of the Corporation is provided in the sections “Contribution to net earnings and adjusted net earnings”, “Corporate operations”, and “Other items” below.
A 14 POWER FINANCIAL CORPORATION�— �FIRST QUARTER REPORT 2019
PFC_QUAT1_Eng01_PFC_2019-05-11_v1.indd B14PFC_QUAT1_Eng01_PFC_2019-05-11_v1.indd B14 19-05-12 8:02 PM19-05-12 8:02 PM

PA
RT
AP
OW
ER FIN
AN
CIA
L CO
RP
OR
ATIO
NPPOWER FINANCIAL CORPORATION
CONTRIBUTION TO NET EARNINGS AND ADJUSTED NET EARNINGS
LIFECO
Contribution to Power Financial
Three months ended March ,
December ,
March ,
Contribution to Power Financial’s :
Net earnings and adjusted net earnings
As reported by Lifeco
Consolidation entries ) )
NNet earnings aand adjusted net earnings
The average direct ownership of Power Financial in Lifeco was 67.8 quarter ended March 31, 2019.
NNet earnings bby ssegment aas reported by Lifeco
Three months ended March ,
December ,
March ,
CCanada
Individual Customer
Group Customer
Canada Corporate )
UUnited States
Financial Services
Asset Management ) ) )
U.S. Corporate )
EEurope
Insurance and Annuities
Reinsurance
Europe Corporate ) ) )
LLifeco Corporate ) ) )
NNet earnings [
[ Attributable to Lifeco common shareholders.
QQ1 22019 vvs. Q1 2018 aand QQ4 2018
NNet earnings $657 million or $0.665 per share, compared with $731 million or $0.740 per share in the corresponding period in 2018, a decrease of 10.1on a per share basis, and $710 million or $0.719 per share in the fourth quarter of 2018.
CCANADA Net earnings for the three-month period ended March 31, 2019 decreased by $33 million to $283 million, compared with the corresponding quarter in 2018.
IIndividual Customer Net earnings for the three-month period ended March 31, 2019 decreased by $14 million to $124 million, compared with the same quarter last year. The decrease was primarily due to:
Lower net fee income and lower contributions from investment experience;
Partially offset by higher contributions from insurance contract liability basis changes.
POWER FINANCIAL CORPORATION�— �FIRST QUARTER REPORT 2019 A 1 5
PFC_QUAT1_Eng01_PFC_2019-05-11_v1.indd B15PFC_QUAT1_Eng01_PFC_2019-05-11_v1.indd B15 19-05-12 8:02 PM19-05-12 8:02 PM

PA
RT
AP
OW
ER F
INA
NC
IAL
CO
RP
OR
ATI
ON
PPOWER FINANCIAL CORPORATION
GGroup Customer Net earnings for the three-month period ended March 31, 2019 increased by $9 million to $151 million, compared with the same quarter last year. The increase was primarily due to:
Higher contributions from insurance contract liability basis changes and more favourable morbidity experience;
Partially offset by less favourable mortality experience.
UUNITED STATES Net earnings for the three-month period ended March 31, 2019, increased by $6 million to $81 million, compared with the corresponding quarter in 2018.
FFinancial Services For the three-month period ended March 31, 2019, net earnings were US$65 million (C$86 million), compared with US$72 million (C$91 million) in the same quarter last year. The decrease of US$7 million is primarily due to:
Lower contributions from investment experience;
Partially offset by more favourable mortality experience.
AAsset Management For the three-month period ended March 31, 2019, the net loss decreased by US$10 million to US$3 million (C$4 million), compared with the same quarter last year. The decrease of the net loss is primarily due to:
Higher net investment income and lower operating expenses, which included the impact of expense reduction initiatives;
Partially offset by lower fee income driven by lower average assets under management.
The net loss in the first quarter of 2019 also includes financing and other expenses after tax of US$9 million (C$12 million), a decrease of US$2 million from the corresponding quarter in 2018, due to lower net financing costs.
EEUROPE Net earnings for the three-month period ended March 31, 2019 decreased by $45 million to $299 million, compared with the corresponding quarter in 2018.
IInsurance and Annuities Net earnings for the three-month period ended March 31, 2019 decreased by $41 million to $203 million, compared with the same quarter last year. The decrease was primarily due to:
Higher claims from morbidity experience in Ireland and unfavourable impact of changes to certain tax estimates;
Partially offset by more favourable impact of new business.
RReinsurance Net earnings for the three-month period ended March 31, 2019 decreased by $7 million to $97 million, compared with the same quarter last year. The decrease was primarily due to:
Less favourable claims experience in the life and annuity business and lower contributions from insurance contract liability basis changes;
Partially offset by higher business volumes and lower impact of new business.
OOTHER ITEMS There were no Other items in the first quarter of 2019 and in the first and fourth quarters of 2018.
The information above has been derived from Lifeco’s interim MD&A; see Part B of this MD&A for additional information on Lifeco’s results.
A 16 POWER FINANCIAL CORPORATION�— �FIRST QUARTER REPORT 2019
PFC_QUAT1_Eng01_PFC_2019-05-11_v1.indd B16PFC_QUAT1_Eng01_PFC_2019-05-11_v1.indd B16 19-05-12 8:02 PM19-05-12 8:02 PM

PA
RT
AP
OW
ER FIN
AN
CIA
L CO
RP
OR
ATIO
NPPOWER FINANCIAL CORPORATION
IGM FINANCIAL
Contribution to Power Financial
Three months ended March ,
December ,
March ,
Contribution to Power Financial’s :
Net earnings and adjusted net earnings
As reported by IGM
Consolidation entries ) )
NNet earnings aand adjusted net earnings
The average direct ownership of Power Financial in IGM was 61.4 quarter ended March 31, 2019.
Contribution to Power Financial includes adjustments in accordance with IAS 39 and the allocation of the results of Wealthsimple and Portag3.
NNet earnings bby segment as rreported by IGM (in accordance with IFRS 9)
Three months ended March ,
December ,
March ,
IG Wealth Management
Mackenzie
Corporate and other
Net earnings (before interest, income taxes, preferred share dividends and other)
Interest expense, income taxes, preferred share dividends and other [ ) ) )
NNet earnings [
[ Non-IFRS financial measure described in Part C of this MD&A.
Interest expense includes interest on long-term debt and in 2019 also includes interest on leases of $1.1 million as a result of IGM's adoption of IFRS 16, Leases.
[ Available to IGM common shareholders.
QQ1 22019 vs. Q1 2018 and Q4 2018
NNet earnings $168 million or $0.70 per share, compared with $186 million or $0.77 per share in the corresponding period in 2018, a decrease of 9.1a per share basis, and $180 million or $0.75 per share in the fourth quarter of 2018.
On January 1, 2018, IGM adopted IFRS 9, Financial Instruments. Power Financial has deferred the adoption of IFRS 9 and continues to apply IAS 39, Financial Instruments: Recognition and Measurement. The contribution to Power Financial includes adjustments to reverse the impact of the application of IFRS 9 by IGM.
In January 2019, IGM invested a further $66.8 million (US$50 million) in Personal Capital which increased its voting interest to 22.7 . IGM has significant influence and accounts for its interest as an associate using the equity method. In accordance with IFRS 9, IGM previously classified its interest in Personal Capital as fair value through other comprehensive income (FVOCI), in which fair value changes remain permanently in equity. In accordance with IAS 39, the Corporation accounted for IGM’s investment in Personal Capital as available for sale. The reclassification of the investment from available for sale to an associate, under IAS 39, resulted in a gain; the contribution of IGM to Power Financial has been adjusted accordingly.
POWER FINANCIAL CORPORATION�— �FIRST QUARTER REPORT 2019 A 1 7
PFC_QUAT1_Eng01_PFC_2019-05-11_v1.indd B17PFC_QUAT1_Eng01_PFC_2019-05-11_v1.indd B17 19-05-12 8:02 PM19-05-12 8:02 PM

PA
RT
AP
OW
ER F
INA
NC
IAL
CO
RP
OR
ATI
ON
PPOWER FINANCIAL CORPORATION
The following is a summary of each segments’ net earnings:
IIG WEALTH MANAGEMENT Net earnings decreased by $20 million in the three-month period ended March 31, 2019, compared with the corresponding quarter in 2018, primarily due to:
A decrease in income from management fees of $3 million to $358 million. The decrease was primarily due to a decrease in average assets under management of 1.0 . The average management fee rate increased by 0.5 basis points to 167.1 basis points of average assets under management;
A decrease in administration fees of $4 million to $74 million. The decrease resulted primarily from the movement of assets into unbundled products which are not charged certain administration fees and changes in the composition of average assets under management;
A decrease in distribution fee income of $2 million to $41 million. The decrease was primarily due to a decrease in distribution fee income from insurance products and lower redemption fees; and
Expenses increased by $10 million to $320 million in the three-month period, mainly due to an increase in non-commission expenses, primarily due to increased technology expenses related to the migration of clients to a new dealer platform and unbundled fee arrangements, as well as continued expenses associated with IG Wealth Management’s brand relaunch. The increase of non-commission expenses was partially offset by a decrease in commission expenses due to lower mutual fund sales and lower compensation related to the distribution of insurance products.
MMAACKENZIE Net earnings decreased by $6 million in the three-month period ended March 31, 2019, compared with the corresponding quarter in 2018, due to:
A decrease in management fee revenue of $8 million to $168 million, resulting from a decline in average management fee rate, partially offset by an increase in average assets under management of 0.6 . The average management fee rate declined by 5.4 basis points to 104 basis points, mainly due to a change in the composition of assets under management; and
A decrease in administration fee revenue of $2 million to $23 million, which primarily relates to revenue from providing services to its investment funds;
Partially offset by an increase in net investment income of $4 million which primarily relates to investment returns on proprietary funds.
AASSETS AND INVESTMENTT FUND ASSETS UNDER MMANAGEMENT Total assets under management were as follows:
(In billions of dollars) March ,
December ,
March ,
December ,
IG Wealth Management
Mackenzie
Corporate and other [
Total
[ Includes Investment Planning Counsel’s assets under management less an adjustment for assets subadvised by Mackenzie on behalf of other segments.
Total average daily investment fund assets under management were as follows:
(In billions of dollars)
IG Wealth Management
Mackenzie
Corporate and other [
Total
[ Includes Investment Planning Counsel’s assets under management less an adjustment for assets subadvised by Mackenzie on behalf of other segments.
OOTHER ITEMS There were no Other items in the first quarter of 2019 and in the first and fourth quarters of 2018.
The information above has been derived from IGM’s interim MD&A; see Part C of this MD&A for more information on IGM’s results.
A 18 POWER FINANCIAL CORPORATION�— �FIRST QUARTER REPORT 2019
PFC_QUAT1_Eng01_PFC_2019-05-11_v1.indd B18PFC_QUAT1_Eng01_PFC_2019-05-11_v1.indd B18 19-05-12 8:02 PM19-05-12 8:02 PM
PA
RT
AP
OW
ER FIN
AN
CIA
L CO
RP
OR
ATIO
NPPOWER FINANCIAL CORPORATION
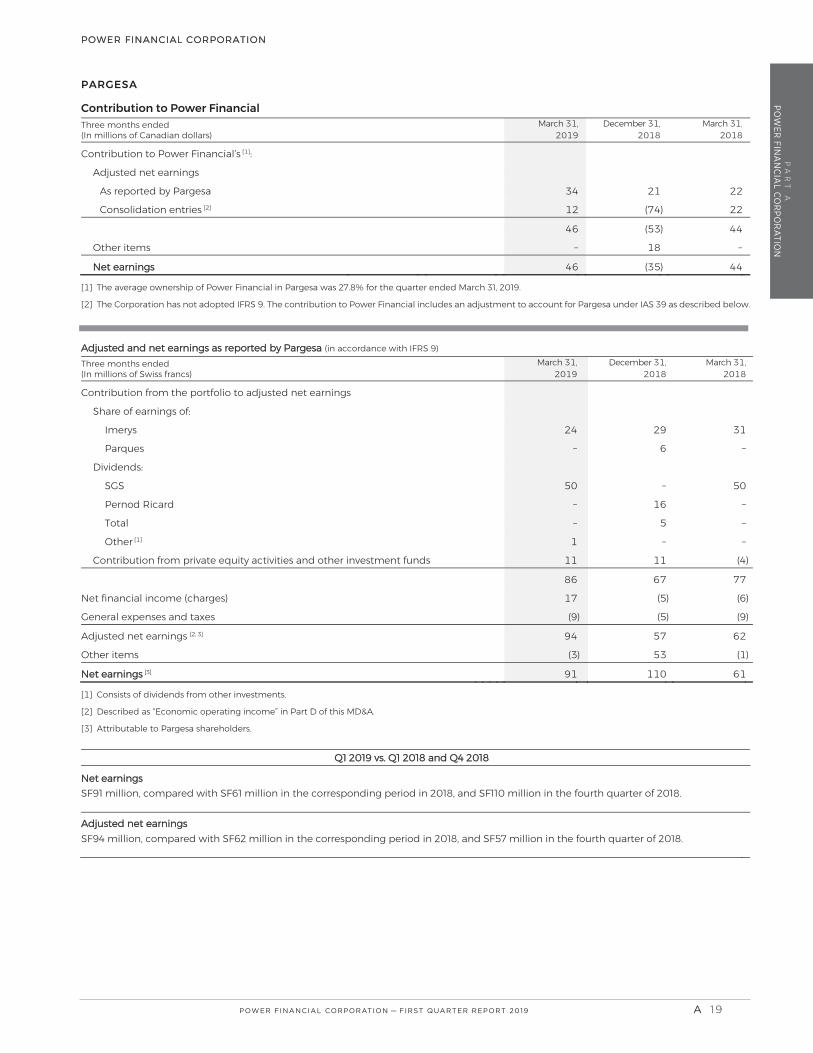
PARGESA
Contribution to Power Financial Three months ended (In millions of Canadian dollars)
March ,
December ,
March ,
Contribution to Power Financial’s :
Adjusted net earnings
As reported by Pargesa
Consolidation entries )
)
Other items
Net earnings )
The average ownership of Power Financial in Pargesa was 27.8 quarter ended March 31, 2019.
The Corporation has not adopted IFRS 9. The contribution to Power Financial includes an adjustment to account for Pargesa under IAS 39 as described below.
Adjusted and net earnings as reported by Pargesa (in accordance with IFRS 9) Three months ended (In millions of Swiss francs)
March ,
December ,
March ,
Contribution from the portfolio to adjusted net earnings
Share of earnings of:
Imerys
Parques
Dividends:
SGS
Pernod Ricard
Total
Other
Contribution from private equity activities and other investment funds )
Net financial income (charges) ) )
General expenses and taxes ) ) )
Adjusted net earnings
Other items ) )
Net earnings
Consists of dividends from other investments.
[ Described as “Economic operating income” in Part D of this MD&A.
[ Attributable to Pargesa shareholders.
Q1 2019 vs. Q1 2018 and Q4 2018
Neet earnings SF91 million, compared with SF61 million in the corresponding period in 2018, and SF110 million in the fourth quarter of 2018.
Adjusted net earnings SF94 million, compared with SF62 million in the corresponding period in 2018, and SF57 million in the fourth quarter of 2018.
POWER FINANCIAL CORPORATION�— �FIRST QUARTER REPORT 2019 A 1 9
PFC_QUAT1_Eng01_PFC_2019-05-11_v1.indd B19PFC_QUAT1_Eng01_PFC_2019-05-11_v1.indd B19 19-05-12 8:02 PM19-05-12 8:02 PM

PA
RT
AP
OW
ER F
INA
NC
IAL
CO
RP
OR
ATI
ON
PPOWER FINANCIAL CORPORATION
On January 1, 2018, Pargesa adopted IFRS 9, Financial Instruments. The majority of its investments in public entities are classified as FVOCI, an elective classification for equity instruments in which all fair value changes remain permanently in OCI.
The investments in private equity and other investment funds are classified as fair value through profit or loss (FVPL). The transition requirements of IFRS 9 required that all unrealized gains and losses at January 1, 2018 on investments previously classified as available for sale remain permanently in equity. Starting January 1, 2018, subsequent changes in fair value are recorded in earnings.
Power Financial has deferred the adoption of IFRS 9 and continues to apply IAS 39. The following table presents adjustments to the contribution of Pargesa to Power Financial’s earnings in accordance with IAS 39: Three months ended (In millions of dollars)
March ,
December ,
March ,
Partial disposal of interest in adidas
Impairment charges [ )
Disposal of private equity funds [3
Reversal of unrealized (gains) losses on private equity funds [4 ) )
Total )
[ During the first quarter of 2019, a portion of the investment in adidas was disposed of, resulting in a gain of SF49 million. This gain was not reflected in Pargesa’s earnings as it is classified as FVOCI. Power Financial’s share of the realized gain is $18 million.
Under IFRS 9, Pargesa classifies the majority of its investments in public entities as FVOCI, and as a result impairment charges are not recognized in earnings. Power Financial recognized impairment charges during the fourth quarter of 2018 of $77 million on the following investments:
GEA – The share price declined to €22.50 per share from a cost of €35.63 per share, resulting in an impairment charge of SF118 million. Power Financial’s share was $43 million;
Ontex – The share price of Ontex decreased to €17.90 per share from a previously impaired cost of €18.35 per share, which resulted in a further impairment charge. Power Financial’s share was $1 million;
LafargeHolcim – The investment in LafargeHolcim had been previously impaired, resulting in an adjusted cost of €37.10 per share. During the fourth quarter, the share price decreased to €35.83 per share, resulting in an impairment charge of SF59 million, including a foreign exchange loss. Power Financial’s share was $22 million;
Other investments – Power Financial’s share of impairment charges on other investments was $11 million.
[ During the first and fourth quarters of 2018, three investments held through private equity funds, classified as FVPL in accordance with IFRS 9, were disposed of, which resulted in gains of SF57 million and SF11 million, respectively. Realized gains of SF58 million have not been reflected in Pargesa’s earnings as the investments were reclassified from available for sale to FVPL on January 1, 2018. As described above, on transition, the related unrealized gains recorded in other comprehensive income were transferred permanently to retained earnings.
[ During the first quarter of 2019, Pargesa recognized SF14 million of net unrealized gains (SF5 million of net unrealized gains in the three-month period ended December 31, 2018 and SF3 million of net unrealized losses in the three-month period ended March 31, 2018) in earnings related to changes in fair value of its private equity funds. These gains are not recognized by Power Financial as it continues to classify these private equity funds as available for sale in accordance with IAS 39.
Other than the share of earnings of Imerys and Parques, a significant portion of Pargesa’s adjusted net earnings is composed of dividends from its non-consolidated investments, which are usually declared as follows:
LafargeHolcim (second quarter)
SGS (first quarter)
Pernod Ricard (second and fourth quarters)
Total (second, third and fourth quarters)
adidas (second quarter)
Umicore (second and third quarters)
Ontex (second quarter)
GEA (second quarter)
A 20 POWER FINANCIAL CORPORATION�— �FIRST QUARTER REPORT 2019
PFC_QUAT1_Eng01_PFC_2019-05-11_v1.indd B20PFC_QUAT1_Eng01_PFC_2019-05-11_v1.indd B20 19-05-12 8:02 PM19-05-12 8:02 PM
PA
RT
AP
OW
ER FIN
AN
CIA
L CO
RP
OR
ATIO
NPPOWER FINANCIAL CORPORATION
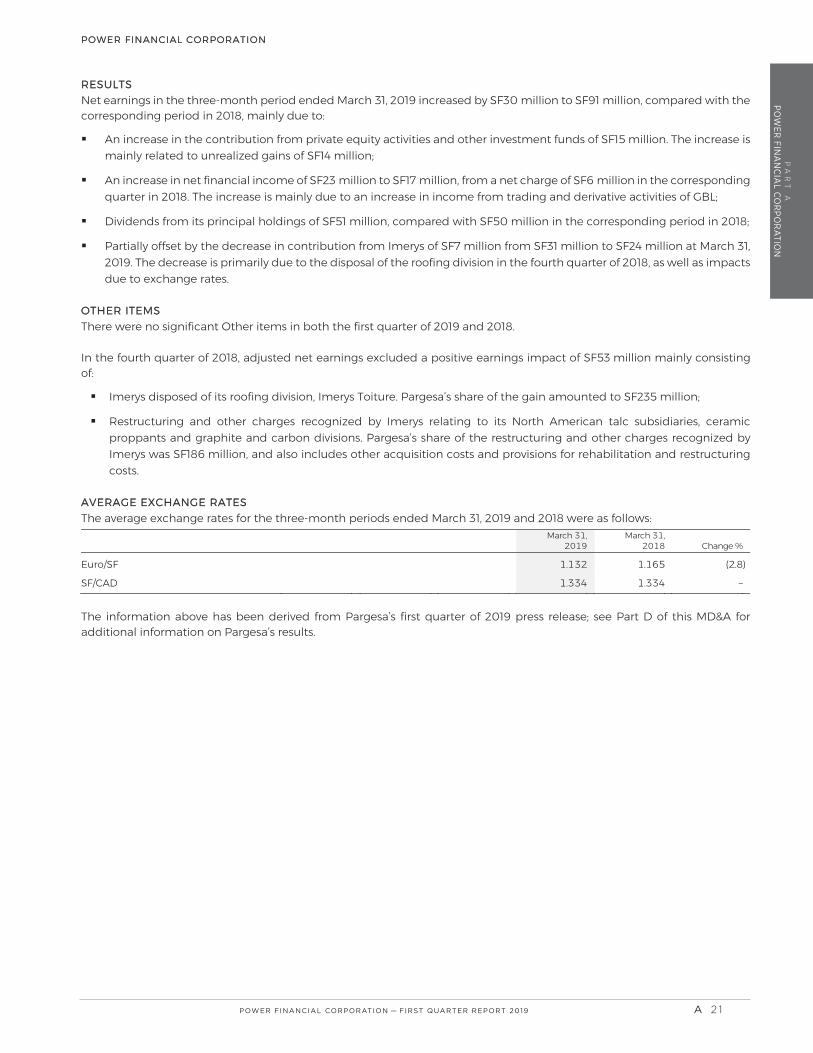
RRESULTS Net earnings in the three-month period ended March 31, 2019 increased by SF30 million to SF91 million, compared with the corresponding period in 2018, mainly due to:
An increase in the contribution from private equity activities and other investment funds of SF15 million. The increase is mainly related to unrealized gains of SF14 million;
An increase in net financial income of SF23 million to SF17 million, from a net charge of SF6 million in the corresponding quarter in 2018. The increase is mainly due to an increase in income from trading and derivative activities of GBL;
Dividends from its principal holdings of SF51 million, compared with SF50 million in the corresponding period in 2018;
Partially offset by the decrease in contribution from Imerys of SF7 million from SF31 million to SF24 million at March 31, 2019. The decrease is primarily due to the disposal of the roofing division in the fourth quarter of 2018, as well as impacts due to exchange rates.
OOTHER ITEMS There were no significant Other items in both the first quarter of 2019 and 2018.
In the fourth quarter of 2018, adjusted net earnings excluded a positive earnings impact of SF53 million mainly consisting of:
Imerys disposed of its roofing division, Imerys Toiture. Pargesa’s share of the gain amounted to SF235 million;
Restructuring and other charges recognized by Imerys relating to its North American talc subsidiaries, ceramic proppants and graphite and carbon divisions. Pargesa’s share of the restructuring and other charges recognized by Imerys was SF186 million, and also includes other acquisition costs and provisions for rehabilitation and restructuring costs.
AAVERAGE EEXCHANGE RATES The average exchange rates for the three-month periods ended March 31, 2019 and 2018 were as follows:
March ,
March ,
Euro/SF )
SF/CAD
The information above has been derived from Pargesa’s first quarter of 2019 press release; see Part D of this MD&A for additional information on Pargesa’s results.
POWER FINANCIAL CORPORATION�— �FIRST QUARTER REPORT 2019 A 2 1
PFC_QUAT1_Eng01_PFC_2019-05-11_v1.indd B21PFC_QUAT1_Eng01_PFC_2019-05-11_v1.indd B21 19-05-12 8:02 PM19-05-12 8:02 PM

PA
RT
AP
OW
ER F
INA
NC
IAL
CO
RP
OR
ATI
ON
PPOWER FINANCIAL CORPORATION
CORPORATE OPERATIONS Corporate operations include income (loss) from investments, operating expenses, financing charges, depreciation and income taxes.
Three months ended March
December
March
Income (loss) from investments ) ) )
Operating and other expenses
Operating expenses ) ) )
Financing charges ) ) )
Depreciation ) ) ) ) ) )
Corporate operations ) ) )
OTHER ITEMS (NOT INCLUDED IN ADJUSTED NET EARNINGS)
The following table presents the Corporation’s share of Other items:
Three months ended March ,
December ,
March ,
Pargesa
Imerys – Disposal of roofing activity
Imerys – Impairments, restructuring charges and other )
Lifeco and IGM did not have Other items in the first quarter of 2019 and in the first and fourth quarters of 2018. For additional information, refer to the Pargesa “Other items” section above.
A 22 POWER FINANCIAL CORPORATION�— �FIRST QUARTER REPORT 2019
PFC_QUAT1_Eng01_PFC_2019-05-11_v1.indd B22PFC_QUAT1_Eng01_PFC_2019-05-11_v1.indd B22 19-05-12 8:02 PM19-05-12 8:02 PM

PA
RT
AP
OW
ER FIN
AN
CIA
L CO
RP
OR
ATIO
NPPOWER FINANCIAL CORPORATION
Financial Position
CONSOLIDATED BALANCE SHEETS (CONDENSED) The condensed balance sheets of Lifeco and IGM, and Power Financial’s non-consolidated balance sheet are presented below. This table reconciles the non-consolidated balance sheet, which is not in accordance with IFRS, with the condensed consolidated balance sheet of the Corporation at March 31, 2019.
Power
Financial Lifeco
IGM
Consolidation
adjustmentsand other
Power Financial Consolidated balance sheets
March
December
AAssets
Cash and cash equivalents )
Investments )
Investment – Lifeco )
Investment – IGM )
Investment – Parjointco
Investments – other jointly controlled corporations and associates
Assets held for sale
Funds held by ceding insurers
Reinsurance assets
Other assets
Intangible assets
Goodwill
Investments on account of segregated fund policyholders
Investments on account of segregated fund policyholders held for sale
Total assets )
LLiabilities
Insurance and investment contract liabilities
Liabilities held for sale
Obligations to securitization entities
Debentures and other debt instruments )
Other liabilities
Insurance and investment contracts on account of segregated fund policyholders
Insurance and investment contracts on account of segregated fund policyholders held for sale
Total liabilities )
EEquity
Perpetual preferred shares )
Common shareholders’ equity )
Non-controlling interests
Total equity )
Total liabilities and equity )
Consolidation adjustments and other includes Portag3 and Wealthsimple, as well as consolidation entries.
Opening retained earnings were decreased by $80 million as a result of the adoption of IFRS 16, Leases and the application of IFRIC 23, Uncertainty over Income Tax Treatments; refer to the “Changes in Accounting Policies” section for more details.
[ Lifeco’s non-controlling interests include the Participating Account surplus in subsidiaries.
[ Non-controlling interests in consolidation adjustments represents non-controlling interests in the equity of Lifeco, IGM and Wealthsimple. POWER FINANCIAL CORPORATION�— �FIRST QUARTER REPORT 2019 A 23
PFC_QUAT1_Eng01_PFC_2019-05-11_v1.indd B23PFC_QUAT1_Eng01_PFC_2019-05-11_v1.indd B23 19-05-12 8:02 PM19-05-12 8:02 PM

PA
RT
AP
OW
ER F
INA
NC
IAL
CO
RP
OR
ATI
ON
PPOWER FINANCIAL CORPORATION
Total assets of the Corporation increased to $462.5 billion at March 31, 2019, compared with $447.1 billion at December 31, 2018, primarily due to the impact of market movement and new business growth, partially offset by the impact of currency movement.
Assets held for sale of $908 million and investments on account of segregated fund policyholders held for sale of $3,432 million at March 31, 2019 ($897 million and $3,319 million, respectively, at December 31, 2018) relate to Lifeco’s pending sale of a heritage block of policies to Scottish Friendly Assurance Society Limited (Scottish Friendly), which is expected to close in the second half of 2019. See Note 4 to the Corporation’s Interim Consolidated Financial Statements.
Liabilities increased to $427.4 billion at March 31, 2019, compared with $412.1 billion at December 31, 2018, mainly due to the following, as disclosed by Lifeco:
Insurance and investment contracts on account of segregated fund policyholders increased by $10.3 billion, primarily due to the impact of net market value gains and investment income of $13.7 billion, partially offset by the impact of currency movement of $3.2 billion and net withdrawals of $0.2 billion.
Insurance and investment contract liabilities increased by $4.1 billion, primarily due to fair value adjustments and the impact of new business, partially offset by the weakening of the euro and U.S. dollar against the Canadian dollar.
Liabilities held for sale of $908 million and insurance and investment contracts on account of segregated fund policyholders held for sale of $3,432 million at March 31, 2019 ($897 million and $3,319 million, respectively, at December 31, 2018) relate to the pending sale of a heritage block of policies to Scottish Friendly, which is expected to close in the second half of 2019. See Note 4 to the Corporation’s Interim Consolidated Financial Statements.
Parts B and C of this MD&A include a discussion of the consolidated balance sheets of Lifeco and IGM, respectively.
NON-CONSOLIDATED BALANCE SHEETS In the non-consolidated basis of presentation shown below, Lifeco and IGM are presented by the Corporation using the equity method. These non-consolidated balance sheets, which are not in accordance with IFRS, enhance the MD&A and assist the reader by identifying changes in Power Financial’s non-consolidated balance sheets.
March ,
December ,
AAssets
Cash and cash equivalents
Investments
Lifeco
IGM
Parjointco
Other
Other assets
Total assets
LLiabilities
Debentures
Other liabilities
Total liabilities
EEquity
Perpetual preferred shares
Common shareholders’ equity
Total equity
Total liabilities and equity
Cash equivalents include $294 million ($293 million at December 31, 2018) of fixed income securities with maturities of more than three months. In accordance with IFRS, these are classified as investments in the Consolidated Financial Statements.
Includes Power Financial’s investments in Portag3 and Wealthsimple presented using the equity method.
A 24 POWER FINANCIAL CORPORATION�— �FIRST QUARTER REPORT 2019
PFC_QUAT1_Eng01_PFC_2019-05-11_v1.indd B24PFC_QUAT1_Eng01_PFC_2019-05-11_v1.indd B24 19-05-12 8:02 PM19-05-12 8:02 PM

PA
RT
AP
OW
ER FIN
AN
CIA
L CO
RP
OR
ATIO
NPPOWER FINANCIAL CORPORATION
Cash and cash equivalents Cash and cash equivalents held by Power Financial amounted to $1,021 million at March 31, 2019, compared with $1,025 million at the end of December 2018. The first quarter dividends declared by the Corporation and paid on May 1, 2019 are included in other liabilities and amounted to $360 million. Dividends declared in the first quarter by IGM and received by the Corporation on April 30, 2019 are included in other assets and amounted to $83 million (see “Non-consolidated Statements of Cash Flows” below for details).
Investments in Lifeco, IGM and Parjointco The carrying value of Power Financial’s investments in Lifeco, IGM and Parjointco, accounted for using the equity method, increased to $21,314 million at March 31, 2019, compared with $21,067 million at December 31, 2018:
[ Refer to the “Changes in Accounting Policies” section for more details.
Mainly related to the effect of the share repurchase program as part of a normal course issuer bid by IGM.
EQUITY
Preferred shares Preferred shares of the Corporation consist of 11 series of Non-Cumulative Fixed Rate First Preferred Shares, two series of Non-Cumulative 5-Year Rate Reset First Preferred Shares, and two series of Floating Rate First Preferred Shares, one of which is Non-Cumulative, with an aggregate stated capital of $2,830 million at March 31, 2019 (same as at December 31, 2018). All series are perpetual preferred shares and are redeemable in whole or in part solely at the Corporation’s option from specified dates.
The terms and conditions of the outstanding First Preferred Shares are described in Note 18 to the Corporation’s 2018 Consolidated Financial Statements.
Lifeco IGM Parjointco Total
Carrying value, at the beginning of the year
Change in accounting policy ) ) )
Restated carrying value, at the beginning of the year
Share of adjusted net earnings
Share of other comprehensive income (loss) ) )
Dividends ) ) ( )
Other ) )
Carrying value, at March
POWER FINANCIAL CORPORATION�— �FIRST QUARTER REPORT 2019 A 25
PFC_QUAT1_Eng01_PFC_2019-05-11_v1.indd B25PFC_QUAT1_Eng01_PFC_2019-05-11_v1.indd B25 19-05-12 8:02 PM19-05-12 8:02 PM

PA
RT
AP
OW
ER F
INA
NC
IAL
CO
RP
OR
ATI
ON
PPOWER FINANCIAL CORPORATION
Common shareholders’ equity Common shareholders’ equity was $18,951 million at March 31, 2019, compared with $18,750 million at December 31, 2018:
Three months ended March
Common shareholders’ equity, at the beginning of the year
Change in accounting policy )
Restated common shareholders’ equity, at the beginning of the year
Changes in retained earnings
Net earnings before dividends on perpetual preferred shares
Dividends declared ) )
Effects of changes in capital and ownership of subsidiaries, and other ) )
Changes in reserves
Other comprehensive income (loss)
Foreign currency translation adjustments )
Investment revaluation and cash flow hedges )
Actuarial gains (losses) on defined benefit plans )
Share of Pargesa and other associates
Share-based compensation, including the effect of subsidiaries )
Common shareholders’ equity, at March 31
Refer to the “Changes in Accounting Policies” section for more details.
The book value per common share of the Corporation was $26.54 at March 31, 2019, compared with $26.26 at the end of 2018.
Outstanding number of common shares At the date of this MD&A, there were 664,096,506 common shares of the Corporation outstanding, compared with 714,096,479 at December 31, 2018. In April 2019, the Corporation completed its substantial issuer bid and repurchased for cancellation 49,999,973 of its common shares for an aggregate amount of $1.65 billion (refer to the section “Subsequent Events”). At the date of this MD&A, options were outstanding to purchase up to an aggregate of 13,216,070 common shares of the Corporation under the Corporation’s Employee Stock Option Plan.
A 26 POWER FINANCIAL CORPORATION�— �FIRST QUARTER REPORT 2019
PFC_QUAT1_Eng01_PFC_2019-05-11_v1.indd B26PFC_QUAT1_Eng01_PFC_2019-05-11_v1.indd B26 19-05-12 8:02 PM19-05-12 8:02 PM

PA
RT
AP
OW
ER FIN
AN
CIA
L CO
RP
OR
ATIO
NPPOWER FINANCIAL CORPORATION
Net Asset Value
Net asset value represents management’s estimate of the fair value of the common shareholders’ equity of the Corporation. Net asset value is the fair value of the assets of Power Financial’s non-consolidated balance sheet less its net debt and preferred shares. In determining the fair value of assets, investments in subsidiaries and associates are adjusted to fair value as follows:
Investments in publicly traded companies are valued at their market value, measured as the closing share price on the reporting date;
Investments in private entities are valued at fair value based on management’s estimate using consistently applied valuation models either based on a valuation multiple or discounted cash flows. Certain valuations are prepared by external valuators or subject to review by external valuators. Market-comparable transactions are generally used to corroborate the estimated fair value. The value of investments in private entities is presented net of any management incentives.
Investments in investment funds are valued at the fair value reported by the fund which is net of carried interest or other incentives.
The presentation of the investments in subsidiaries and associates at fair value is not in accordance with IFRS; net asset value is a non-IFRS financial measure.
The Corporation’s net asset value was $27.0 billion at March 31, 2019, compared with $23.5 billion at December 31, 2018, representing an increase of $3.4
March December
Non-consolidated
balance sheet Fair value
adjustment Net asset
value Non-consolidated
balance sheet Fair value
adjustment Net asset
value
AAssets
Cash and cash equivalents
Investments
Lifeco
IGM
Parjointco ) )
Other
Other assets
Total assets
LLiabilities and preferred shares
Debentures
Other liabilities
Perpetual preferred shares
Total liabilities and preferred shares NNet Value Common shareholders’ equity /
Net Asset Value
Per share
Fair value adjustment is related to Power Financial’s investments in Portag3 and Wealthsimple. Includes $83 million of dividends declared in the first quarter by IGM and received by the Corporation on April 30, 2019. Includes $360 million of dividends declared in the first quarter by the Corporation and paid on May 1, 2019.
Investments measured at market value and cash represent 98.7 l asset value at March 31, 2019 (98.6December 31, 2018).
POWER FINANCIAL CORPORATION�— �FIRST QUARTER REPORT 2019 A 27
PFC_QUAT1_Eng01_PFC_2019-05-11_v1.indd B27PFC_QUAT1_Eng01_PFC_2019-05-11_v1.indd B27 19-05-12 8:02 PM19-05-12 8:02 PM

PA
RT
AP
OW
ER F
INA
NC
IAL
CO
RP
OR
ATI
ON
PPOWER FINANCIAL CORPORATION
Cash Flows
CONSOLIDATED STATEMENTS OF CASH FLOWS (CONDENSED) The condensed cash flows of Lifeco and IGM, and Power Financial’s non-consolidated cash flows, are presented below. This table reconciles the non-consolidated statement of cash flows, which is not in accordance with IFRS, to the condensed consolidated statement of cash flows of the Corporation for the three-month period ended March 31, 2019.
Power
Financial Lifeco IGM Consolidation
adjustments and other
Power Financial
Consolidated
Three months ended March
Cash flows from:
Operating activities )
Financing activities ) ) ) )
Investing activities ) ( ) ) ( ) ) Effect of changes in exchange rates on cash and cash equivalents ) )
Increase (decrease) in cash and cash equivalents ) ) ) Cash and cash equivalents, at the beginning of the year )
Cash and cash equivalents, at March ) Consolidated cash and cash equivalents increased by $470 million in the three-month period ended March 31, 2019, compared with a decrease of $158 million in the corresponding period in 2018.
Operating activities produced a net inflow of $796 million in the three-month period ended March 31, 2019, compared with a net inflow of $1,227 million in the corresponding period in 2018.
Cash flows from financing activities, which include dividends paid on the common and preferred shares of the Corporation and dividends paid by subsidiaries to non-controlling interests, represented a net outflow of $161 million in the three-month period ended March 31, 2019, compared with a net outflow of $480 million in the corresponding period in 2018.
Cash flows from investing activities resulted in a net outflow of $117 million in the three-month period ended March 31, 2019, compared with a net outflow of $1,029 million in the corresponding period in 2018.
The Corporation increased its level of fixed income securities with maturities of more than three months, resulting in a net outflow of $1 million in the three-month period ended March 31, 2019, compared with a net outflow of $14 million in the corresponding period in 2018.
Parts B and C of this MD&A include a discussion of the cash flows of Lifeco and IGM, respectively.
A 28 POWER FINANCIAL CORPORATION�— �FIRST QUARTER REPORT 2019
PFC_QUAT1_Eng01_PFC_2019-05-11_v1.indd B28PFC_QUAT1_Eng01_PFC_2019-05-11_v1.indd B28 19-05-12 8:02 PM19-05-12 8:02 PM

PA
RT
AP
OW
ER FIN
AN
CIA
L CO
RP
OR
ATIO
NPPOWER FINANCIAL CORPORATION
NON-CONSOLIDATED STATEMENTS OF CASH FLOWS As Power Financial is a holding company, corporate cash flows are primarily comprised of dividends received from Lifeco, IGM and Parjointco and income (loss) from cash and cash equivalents, less operating expenses, financing charges, income taxes, and preferred and common share dividends.
The following non-consolidated statements of cash flows of the Corporation, which are not presented in accordance with IFRS, have been prepared to assist the reader as they isolate the cash flows of Power Financial, the parent company.
Three months ended March
OOperating activities
Dividends
Lifeco
IGM
Corporate operations, net of non-cash items ) ( )
FFinancing activities
Dividends paid on perpetual preferred shares ) ( )
Dividends paid on common shares ) ( ) ) ( )
IInvesting activities
Investments in Portag3 and Wealthsimple )
Purchase of other investments and other )
)
Decrease in cash and cash equivalents ) )
Cash and cash equivalents, at the beginning of the year
CCash and cash equivalents, at MMarch
On a non-consolidated basis, cash and cash equivalents decreased by $4 million in the three-month period ended March 31, 2019, compared with a decrease of $28 million in the corresponding period in 2018.
Operating activities resulted in a net inflow of $340 million in the three-month period ended March 31, 2019, compared with a net inflow of $324 million in the corresponding period in 2018.
Dividends paid by Lifeco on its common shares during the three-month period ended March 31, 2019 were $0.4130 per share, compared with $0.3890 in the corresponding period in 2018. In the three-month period ended March 31, 2019, the Corporation received dividends from Lifeco of $277 million, compared with $260 million in the corresponding period in 2018.
Dividends paid by IGM on its common shares during the three-month period ended March 31, 2019 were $0.5625 per share, the same as in the corresponding period in 2018. In the three-month period ended March 31, 2019, the Corporation received dividends from IGM of $83 million, the same as in the corresponding period in 2018.
Pargesa declares and pays an annual dividend in the second quarter. The Board of Directors of Pargesa approved a dividend in 2019 of SF2.56 per bearer share, compared with SF2.50 in 2018, to be paid on May 17, 2019.
The Corporation’s financing activities during the three-month period ended March 31, 2019 were a net outflow of $344 million, compared with a net outflow of $328 million in the corresponding period in 2018, and included:
Dividends paid on preferred and common shares by the Corporation of $344 million, compared with $328 million in the corresponding period in 2018. In the three-month period ended March 31, 2019, dividends paid on the Corporation’s common shares were $0.4330 per share, compared with $0.4125 per share in the corresponding period in 2018.
The Corporation’s investing activities during the three-month period ended March 31, 2019 were nil, compared with a net outflow of $24 million in the corresponding period in 2018.
POWER FINANCIAL CORPORATION�— �FIRST QUARTER REPORT 2019 A 29
PFC_QUAT1_Eng01_PFC_2019-05-11_v1.indd B29PFC_QUAT1_Eng01_PFC_2019-05-11_v1.indd B29 19-05-12 8:02 PM19-05-12 8:02 PM

PA
RT
AP
OW
ER F
INA
NC
IAL
CO
RP
OR
ATI
ON
PPOWER FINANCIAL CORPORATION
Capital Management
As a holding company, Power Financial’s objectives in managing its capital are to: provide attractive long-term returns to shareholders of the Corporation;
provide sufficient financial flexibility to pursue its growth strategy to invest on a timely basis in its operating companies and other investments as opportunities present;
maintain a capital structure that matches the long-term nature of its investments by maximizing the use of permanent capital; and
maintain an appropriate credit rating to ensure stable access to the capital markets.
The Corporation manages its capital taking into consideration the risk characteristics and liquidity of its holdings. In order to maintain or adjust its capital structure, the Corporation may adjust the amount of dividends paid to shareholders, return capital to shareholders or issue capital.
The Board of Directors of the Corporation is responsible for capital management. Management of the Corporation is responsible for establishing capital management procedures and for implementing and monitoring its capital plans. The Board of Directors of the Corporation reviews and approves capital transactions such as the issuance, redemption and repurchase of common shares, perpetual preferred shares and debentures. The boards of directors of the Corporation’s subsidiaries, as well as those of Pargesa and GBL, oversee and have the responsibility for their respective company’s capital management.
With the exception of debentures and other debt instruments, the Corporation’s capital is permanent, matching the long-term nature of its investments. The capital structure of the Corporation consists of: debentures, perpetual preferred shares, common shareholders’ equity, and non-controlling interests. The Corporation views perpetual preferred shares as a cost-effective source of permanent capital.
The Corporation’s consolidated capitalization includes the debentures, preferred shares and other debt instruments issued by its consolidated subsidiaries. Debentures and other debt instruments issued by Lifeco and IGM are non-recourse to the Corporation. The Corporation does not guarantee debt issued by its subsidiaries. Perpetual preferred shares and total equity accounted for 80 of consolidated capitalization at March 31, 2019.
March ,
December ,
DDebentures and oother ddebt instruments
Power Financial
Lifeco
IGM
Other subsidiaries and consolidation adjustments ) )
PPreferred shares
Power Financial
Lifeco
IGM
EEquity
Common shareholders’ equity
Non-controlling interests
Represents the non-controlling equity interests of the Corporation’s subsidiaries excluding Lifeco and IGM’s preferred shares, which are shown in this table as preferred shares.
A 30 POWER FINANCIAL CORPORATION�— �FIRST QUARTER REPORT 2019
PFC_QUAT1_Eng01_PFC_2019-05-11_v1.indd B30PFC_QUAT1_Eng01_PFC_2019-05-11_v1.indd B30 19-05-12 8:02 PM19-05-12 8:02 PM

PA
RT
AP
OW
ER FIN
AN
CIA
L CO
RP
OR
ATIO
NPPOWER FINANCIAL CORPORATION
Substantial Issuer Bids On April 17, 2019, the Corporation and Lifeco each completed substantial issuer bids to repurchase for cancellation $1.65 billion and $2.0 billion of their respective common shares (refer to the section “Subsequent Events”).
Power Financial The Corporation filed a short-form base shelf prospectus dated November 16, 2018, pursuant to which, for a period of
25 months thereafter, the Corporation may issue up to an aggregate of $3 billion of First Preferred Shares, common shares, subscription receipts and unsecured debt securities, or any combination thereof. This filing provides the Corporation with the flexibility to access debt and equity markets on a timely basis.
IGM On March 20, 2019, IGM issued $250 million March 21, 2050. Part of the proceeds were
used by IGM to fund the redemption of its $150 million -Cumulative First Preferred Shares, Series B on April 30, 2019.
The Corporation itself is not subject to externally imposed regulatory capital requirements; however, Lifeco and certain of its main subsidiaries, IGM’s subsidiaries and certain of the Corporation’s other subsidiaries are subject to regulatory capital requirements. Parts B and C of this MD&A further describe the capital management activities of Lifeco and IGM, respectively. See Note 21 to the Corporation’s 2018 Financial Statements for additional information.
RATINGS The current rating by Standard & Poor’s (S&P) of the Corporation’s debentures is “A+” with a stable outlook. Dominion Bond Rating Service’s (DBRS) current rating on the Corporation’s debentures is “A (High)” with a stable rating trend.
Credit ratings are intended to provide investors with an independent measure of the credit quality of the securities of a corporation and are indicators of the likelihood of payment and the capacity of a corporation to meet its obligations in accordance with the terms of each obligation. Descriptions of the rating categories for each of the agencies set forth below have been obtained from the respective rating agencies’ websites. These ratings are not a recommendation to buy, sell or hold the securities of a corporation and do not address market price or other factors that might determine suitability of a specific security for a particular investor. The ratings also may not reflect the potential impact of all risks on the value of securities and are subject to revision or withdrawal at any time by the rating organization.
The “A+” rating assigned to the Corporation’s debentures by S&P is the fifth highest of the 22 ratings used for long-term debt. A long-term debenture rated “A+” is somewhat more susceptible to the adverse effects of changes in circumstances and economic conditions than obligations in higher-rated categories; however, the obligor’s capacity to meet its financial commitment on the obligation is still strong.
The “A (High)” rating assigned to the Corporation’s debentures by DBRS is the fifth highest of the 26 ratings used for long-term debt. A long-term debenture rated “A (High)” implies that the capacity for repayment is substantial, but of lesser credit quality than AA, and may be vulnerable to future events, although qualifying negative factors are considered manageable.
POWER FINANCIAL CORPORATION�— �FIRST QUARTER REPORT 2019 A 3 1
PFC_QUAT1_Eng01_PFC_2019-05-11_v1.indd B31PFC_QUAT1_Eng01_PFC_2019-05-11_v1.indd B31 19-05-12 8:02 PM19-05-12 8:02 PM

PA
RT
AP
OW
ER F
INA
NC
IAL
CO
RP
OR
ATI
ON
PPOWER FINANCIAL CORPORATION
Risk Management
Power Financial is a diversified international management and holding company with interests in the financial services, asset management and other business sectors. Its principal holdings are a controlling interest in each of Lifeco and IGM and a joint controlling interest in Parjointco, which itself holds a controlling interest in GBL through Pargesa. As a result, the Corporation bears the risks associated with being a significant shareholder of these operating companies. A complete description of these risks is presented in their public disclosures. The respective boards of directors of Lifeco, IGM, Pargesa and GBL are responsible for the risk oversight function at their respective companies. The risk committee of the board of directors of Lifeco is responsible for its risk oversight, and the board of directors of IGM provides oversight and carries out its risk management mandate through various committees. Certain officers of the Corporation are members of these boards and committees of these boards and, consequently, in their role as directors, they participate in the risk oversight function at the operating companies. Parts B and C of this MD&A further describe risks related to Lifeco and IGM, respectively.
RISK OVERSIGHT APPROACH The Corporation believes that a prudent approach to risk is achieved through a governance model that focuses on the active oversight of its investments. The Board of Directors and executive officers of the Corporation have overall oversight and responsibility for risk management associated with the investment activities and operations of the holding company and maintain a comprehensive and appropriate set of policies and controls. The Board of Directors provides oversight and carries out its risk management mandate primarily through the following committees:
The Audit Committee addresses risks related to financial reporting and cybersecurity.
The Compensation Committee considers risks associated with the Corporation’s compensation policies and practices.
The Governance and Nominating Committee oversees the Corporation’s approach to appropriately address potential risks related to governance matters.
The Related Party and Conduct Review Committee reviews and considers for approval transactions with related parties of the Corporation.
There are certain risks inherent in an investment in the securities of the Corporation and in the activities of the Corporation, which investors should carefully consider before investing in securities of the Corporation. The 2018 Annual MD&A reviews certain risks that could impact the financial condition and financial performance, and the value of the equity of the Corporation. This description of risks does not include all possible risks, and there may be other risks of which the Corporation is not currently aware.
During the first quarter of 2019, there were no changes to the Corporation’s risk oversight approach, and the identification and management of the specific risks described in the 2018 Annual MD&A.
A 32 POWER FINANCIAL CORPORATION�— �FIRST QUARTER REPORT 2019
PFC_QUAT1_Eng01_PFC_2019-05-11_v1.indd B32PFC_QUAT1_Eng01_PFC_2019-05-11_v1.indd B32 19-05-12 8:02 PM19-05-12 8:02 PM

PA
RT
AP
OW
ER FIN
AN
CIA
L CO
RP
OR
ATIO
NPPOWER FINANCIAL CORPORATION
Financial Instruments and Other Instruments
FAIR VALUE MEASUREMENT At March 31, 2019, there had been no material changes to the carrying amounts and fair value of the Corporation and its subsidiaries’ assets and liabilities recorded at fair value from December 31, 2018. See Note 18 to the Corporation’s Interim Consolidated Financial Statements for additional disclosure of the Corporation’s fair value measurement.
DERIVATIVE FINANCIAL INSTRUMENTS In the course of their activities, the Corporation and its subsidiaries use derivative financial instruments. When using such derivatives, they only act as limited end-users and not as market makers in such derivatives.
The use of derivatives is monitored and reviewed on a regular basis by senior management of the Corporation and by senior management of its subsidiaries. The Corporation and its subsidiaries have each established operating policies, guidelines and procedures relating to the use of derivative financial instruments, which in particular focus on:
prohibiting the use of derivative instruments for speculative purposes;
documenting transactions and ensuring their consistency with risk management policies;
demonstrating the effectiveness of the hedging relationships; and
monitoring the hedging relationships.
There were no major changes to the Corporation and its subsidiaries’ policies and procedures with respect to the use of derivative instruments in the three-month period ended March 31, 2019. The following table provides a summary of the Corporation and its subsidiaries’ derivatives portfolio:
During the three-month period ended March 31, 2019, there was an increase of $2.9 billion in the notional amount of derivatives outstanding, primarily due to an increase in forward-settling mortgage-backed security transactions (“to-be-announced securities”) and regular hedging activities. The Corporation and its subsidiaries’ exposure to derivative counterparty risk (which represents the market value of instruments in a gain position) increased to $514 million at March 31, 2019 from $433 million at December 31, 2018.
Parts B and C of this MD&A provide information on the types of derivative financial instruments used by Lifeco and IGM, respectively.
See Note 26 to the Corporation’s 2018 Consolidated Financial Statements for additional information.
March December ,
Notional Maximum credit risk
Totalfair value Notional
Maximumcredit risk
Total fair value
Power Financial – )
Lifeco ) )
IGM ) )
Other subsidiaries – – – –
) )
) )
POWER FINANCIAL CORPORATION�— �FIRST QUARTER REPORT 2019 A 33
PFC_QUAT1_Eng01_PFC_2019-05-11_v1.indd B33PFC_QUAT1_Eng01_PFC_2019-05-11_v1.indd B33 19-05-12 8:02 PM19-05-12 8:02 PM

PA
RT
AP
OW
ER F
INA
NC
IAL
CO
RP
OR
ATI
ON
PPOWER FINANCIAL CORPORATION
Off-Balance Sheet Arrangements
GUARANTEES In the normal course of their operations, the Corporation and its subsidiaries may enter into certain agreements, the nature of which precludes the possibility of making a reasonable estimate of the maximum potential amount the Corporation or subsidiary could be required to pay third parties, as some of these agreements do not specify a maximum amount and the amounts are dependent on the outcome of future contingent events, the nature and likelihood of which cannot be determined.
LETTERS OF CREDIT In the normal course of its reinsurance business, Lifeco provides letters of credit to other parties or beneficiaries. A beneficiary will typically hold a letter of credit as collateral in order to secure statutory credit for insurance and investment contract liabilities ceded to or amounts due from Lifeco. Lifeco may be required to seek collateral alternatives if it is unable to renew existing letters of credit on maturity. See also Part B of this MD&A and Note 32 to the Corporation’s 2018 Consolidated Financial Statements.
Contingent Liabilities
The Corporation and its subsidiaries are from time to time subject to legal actions, including arbitrations and class actions, arising in the normal course of business. It is inherently difficult to predict the outcome of any of these proceedings with certainty, and it is possible that an adverse resolution could have a material adverse effect on the consolidated financial position of the Corporation. However, based on information presently known, it is not expected that any of the existing legal actions, either individually or in the aggregate, will have a material adverse effect on the consolidated financial position of the Corporation. See also Part B and C of this MD&A and Note 31 to the Corporation’s 2018 Consolidated Financial Statements.
Commitments and Contractual Obligations
At March 31, 2019, there have been no material changes in the contractual obligations of the Corporation and its subsidiaries from those reported in the 2018 Annual MD&A.
Income Taxes (Non-Consolidated Basis)
The Corporation had, at March 31, 2019, non-capital losses of $247 million available to reduce future taxable income (including capital gains). These losses expire during the years 2028 to 2039. In addition, the Corporation has capital losses of $84 million that can be used indefinitely to reduce future capital gains.
See also “Transactions with Related Parties” below.
A 34 POWER FINANCIAL CORPORATION�— �FIRST QUARTER REPORT 2019
PFC_QUAT1_Eng01_PFC_2019-05-11_v1.indd B34PFC_QUAT1_Eng01_PFC_2019-05-11_v1.indd B34 19-05-12 8:02 PM19-05-12 8:02 PM
PA
RT
AP
OW
ER FIN
AN
CIA
L CO
RP
OR
ATIO
NPPOWER FINANCIAL CORPORATION
Transactions with Related Parties
Power Financial has a Related Party and Conduct Review Committee composed entirely of Directors who are independent of management and independent of the Corporation’s controlling shareholder. The mandate of this Committee is to review proposed transactions with related parties of the Corporation, including its controlling shareholder, and to approve only those transactions that it deems appropriate and that are done at market terms and conditions.
In the normal course of business, Great-West Life and Putnam enter into various transactions with related companies which include providing group insurance benefits and subadvisory services to other companies within the Power Financial group of companies. Such transactions are at market terms and conditions. These transactions are reviewed by the appropriate related party and conduct review committee.
Lifeco provides asset management and administrative services for employee benefit plans relating to pension and other post-employment benefits for employees of Power Financial, and Lifeco and its subsidiaries. These transactions are at market terms and conditions and are reviewed by the appropriate related party and conduct review committee.
IGM enters into transactions with subsidiaries of Lifeco. These transactions are in the normal course of operations and include (i) providing certain administrative services, (ii) distributing insurance products and (iii) the sale of residential mortgages to Great-West Life and London Life. These transactions are at market terms and conditions and are reviewed by the appropriate related party and conduct review committee.
In October 2017, IGM obtained advance tax rulings which permitted tax loss consolidation transactions with a subsidiary of Power Corporation, whereby shares of a subsidiary that has generated tax losses may be acquired by IGM in each year up to and including 2020. The acquisitions are expected to close in the fourth quarter of each year. IGM recognizes the benefit of the tax losses realized throughout the year the shares in the subsidiary are acquired.
See Note 30 to the Corporation’s 2018 Consolidated Financial Statements for additional information.
Summary of Critical Accounting Estimates and Judgments
In the preparation of the financial statements, management of the Corporation and the managements of its subsidiaries – Lifeco and IGM – are required to make significant judgments, estimates and assumptions that affect the reported amounts of assets, liabilities, net earnings, comprehensive income and related disclosures. Key sources of estimation uncertainty and areas where significant judgments are made by the management of the Corporation and the managements of its subsidiaries include: the entities to be consolidated or accounted for using the equity method, insurance and investment contract liabilities, fair value measurements, investment impairment, goodwill and intangible assets, income taxes and employee future benefits. These are described in the Corporation’s 2018 Annual MD&A and in the notes to the Corporation’s 2018 Consolidated Financial Statements. There were no significant changes in the Corporation’s critical accounting estimates and judgments in the first quarter of 2019.
POWER FINANCIAL CORPORATION�— �FIRST QUARTER REPORT 2019 A 35
PFC_QUAT1_Eng01_PFC_2019-05-11_v1.indd B35PFC_QUAT1_Eng01_PFC_2019-05-11_v1.indd B35 19-05-12 8:02 PM19-05-12 8:02 PM

PA
RT
AP
OW
ER F
INA
NC
IAL
CO
RP
OR
ATI
ON
PPOWER FINANCIAL CORPORATION
Changes in Accounting Policies
There were no changes to the Corporation’s accounting policies from those reported at December 31, 2018, except as described below.
ADOPTION OF IFRS 16 – LEASES (IFRS 16) Effective January 1, 2019, the Corporation adopted IFRS 16, which replaces IAS 17, Leases (IAS 17) and related interpretations. The standard prescribes new guidance for identifying a lease as well as the recognition, measurement, presentation and disclosure of leases. IFRS 16 requires a lessee to recognize a right-of-use asset representing its right to use the leased asset and a corresponding lease liability representing its obligation to make lease payments for all leases. The distinction between operating and financing leases no longer applies, however an optional exemption exists for short-term and low-value leases.
Impact of transition to IFRS 16 The Corporation has elected to adopt IFRS 16 using a modified retrospective approach and accordingly the information presented for 2018 remains as previously reported under IAS 17 and related interpretations.
On initial application, the Corporation elected to measure right-of-use assets on a lease-by-lease basis at either i) an amount equal to the lease liability, adjusted by the amount of any prepaid or accrued lease payments relating to that lease recognized on the balance sheets immediately before the date of initial application; or ii) at its carrying amount, as if IFRS 16 had been applied since the commencement date but discounted using the Corporation’s incremental borrowing rate at January 1, 2019. When measuring lease liabilities, the Corporation and its subsidiaries discounted lease payments using their respective incremental borrowing rates at January 1, 2019. The weighted-January 1, 2019.
On transition, the Corporation and its subsidiaries elected to apply practical expedients including: i) to not recognize right-of-use assets and lease liabilities for leases for which the remaining lease terms end within twelve months of the date of transition; and ii) to apply a single discount rate to a portfolio of leases with reasonably similar characteristics.
Impact on the balance sheet as at January 1, 2019:
(as previously reported ) Impact of
IFRS (restated )
AAssets Investment properties
Owner-occupied properties and capital assets
LLiabilities and shareholders’ equity
Other liabilities
Deferred tax liabilities )
Retained earnings )
Non-controlling interests )
Accrued lease payments of $64 million within other liabilities on the balance sheets at December 31, 2018 were reclassified to decrease right-of-use assets.
The application of IFRS 16 did not have a material impact on the statement of earnings or the statement of cash flows for the three-month period ended March 31, 2019, except for the classification of lease payments as financing activities instead of operating activities. The adoption of IFRS 16 did not have an impact on net cash flows.
ADOPTION OF IFRIC 23 – UNCERTAINTY OVER INCOME TAX TREATMENTS (IFRIC 23) Effective January 1, 2019, the Corporation adopted IFRIC 23 which clarifies the application of the recognition and measurement requirements in IAS 12, Income Taxes, when there is uncertainty over income tax treatments. Under IFRIC 23, a provision for tax uncertainties which meets the probable threshold for recognition is measured based on the amount most likely to occur. The provision for tax uncertainties is classified as current or deferred based on how a disallowance of the underlying uncertain tax treatment would impact the tax provision accrual as of the balance sheet date. The application of the interpretation of the standard resulted in a decrease of $109 million to Lifeco’s retained earnings. The Corporation’s share of this impact is $77 million.
A 36 POWER FINANCIAL CORPORATION�— �FIRST QUARTER REPORT 2019
PFC_QUAT1_Eng01_PFC_2019-05-11_v1.indd B36PFC_QUAT1_Eng01_PFC_2019-05-11_v1.indd B36 19-05-12 8:02 PM19-05-12 8:02 PM

PA
RT
AP
OW
ER FIN
AN
CIA
L CO
RP
OR
ATIO
NPPOWER FINANCIAL CORPORATION
Future Accounting Changes
The Corporation and its subsidiaries continuously monitor the potential changes proposed by the International Accounting Standards Board (IASB) and analyze the effect that changes in the standards may have on their consolidated financial statements when they become effective. There were no changes to the future accounting policies that could impact the Corporation and its subsidiaries, in addition to the disclosure in the 2018 Annual MD&A and the 2018 Consolidated Financial Statements.
Internal Control over Financial Reporting
The Corporation’s internal control over financial reporting is designed to provide reasonable assurance regarding the reliability of financial reporting and that the preparation of financial statements for external purposes is in accordance with IFRS. The Corporation’s management, under the supervision of the Chief Executive Officer and the Chief Financial Officer, is responsible for establishing and maintaining effective internal control over financial reporting. All internal control systems have inherent limitations and may become ineffective because of changes in conditions. Therefore, even those systems determined to be effective can provide only reasonable assurance with respect to financial statement preparation and presentation.
There have been no changes in the Corporation’s internal control over financial reporting during the three-month period ended March 31, 2019 which have materially affected, or are reasonably likely to materially affect, the Corporation’s internal control over financial reporting.
POWER FINANCIAL CORPORATION�— �FIRST QUARTER REPORT 2019 A 37
PFC_QUAT1_Eng01_PFC_2019-05-11_v1.indd B37PFC_QUAT1_Eng01_PFC_2019-05-11_v1.indd B37 19-05-12 8:02 PM19-05-12 8:02 PM

PA
RT
AP
OW
ER F
INA
NC
IAL
CO
RP
OR
ATI
ON
PPOWER FINANCIAL CORPORATION
Summary of Quarterly Results
Total revenues
Net earnings (attributable to common shareholders)
per share – basic
per share – diluted
Adjusted net earnings (attributable to common shareholders)
per share – basic
Other items ) ) ) ) )
per share – basic [ ) ) ) )
[ Adjusted net earnings and adjusted net earnings per share attributable to common shareholders, and other items and other items per share are non-IFRS financial measures. For a definition of these non-IFRS financial measures, please refer to the “Non-IFRS Financial Measures and Presentation” section in this MD&A.
[ The Corporation’s share of Lifeco, IGM and Pargesa’s Other items is as follows:
Lifeco Restructuring charges ) ) ) ) Impact of U.S. tax reform )
Net charge on sale of an equity investment ) Share of IGM’s other items ) ) IGM Restructuring and other charges ) ) )
Premium paid on early redemption of debentures ) Pension plan Share of Lifeco’s other items ) ) ) Pargesa Imerys – Disposal of roofing activity
Imerys – Impairments, restructuring charges and other ) Other (charge) income ) ) ) ) ) ) )
A 38 POWER FINANCIAL CORPORATION�— �FIRST QUARTER REPORT 2019
PFC_QUAT1_Eng01_PFC_2019-05-11_v1.indd B38PFC_QUAT1_Eng01_PFC_2019-05-11_v1.indd B38 19-05-12 8:02 PM19-05-12 8:02 PM

PA
RT
AP
OW
ER FIN
AN
CIA
L CO
RP
OR
ATIO
NPOWER FINANCIAL CORPORATION
Condensed Consolidated Balance Sheets
(unaudited) [in millions of Canadian dollars]
March ,
December ,
Assets Cash and cash equivalents , , Investments [Note ]
Bonds , , Mortgage and other loans , , Shares , , Investment properties , , Loans to policyholders , ,
, , Assets held for sale [Note ] Funds held by ceding insurers , , Reinsurance assets [Note ] , , Derivative financial instruments Investments in jointly controlled corporations and associates [Note ] , , Owner-occupied properties and capital assets , , Other assets , , Deferred tax assets , Intangible assets , , Goodwill , , Investments on account of segregated fund policyholders [Note ] , , Investments on account of segregated fund policyholders held for sale [Note ] , , Total assets , ,
Liabilities Insurance contract liabilities [Note ] , , Investment contract liabilities [Note ] , , Liabilities held for sale [Note ] Obligations to securitization entities , , Debentures and other debt instruments [Note ] , , Derivative financial instruments , , Other liabilities , , Deferred tax liabilities , , Insurance and investment contracts on account of segregated fund policyholders [Note ] , , Insurance and investment contracts on account of segregated fund policyholders held for sale [Note ] , , Total liabilities , ,
Equity Stated capital [Note ]
Perpetual preferred shares , , Common shares
Retained earnings , , Reserves , , Total shareholders’ equity , , Non-controlling interests , , Total equity , , Total liabilities and equity , ,
POWER FINANCIAL CORPORATION�— �FIRST QUARTER REPORT 2019 A 39
PFC_QUAT1_Eng01_PFC_2019-05-11_v1.indd B39PFC_QUAT1_Eng01_PFC_2019-05-11_v1.indd B39 19-05-12 8:02 PM19-05-12 8:02 PM

PA
RT
AP
OW
ER F
INA
NC
IAL
CO
RP
OR
ATI
ON
POWER FINANCIAL CORPORATION
Condensed Consolidated Statements of Earnings
(unaudited) [in millions of Canadian dollars, except per share amounts]
Three months ended March ,
Revenues Premium income
Gross premiums written , , Ceded premiums ( , ) ( , )
Premium income, net , , Net investment income
Regular net investment income , , Change in fair value through profit or loss , ( , )
Net investment income , Fee income , , Total revenues , ,
Expenses Policyholder benefits
Insurance and investment contracts Gross , , Ceded ( ) ( )
Total net policyholder benefits , , Policyholder dividends and experience refunds Changes in insurance and investment contract liabilities , ( , ) Total paid or credited to policyholders , , Commissions Operating and administrative expenses , , Financing charges Total expenses , , Earnings before investments in jointly controlled corporations and associates, and income taxes Share of earnings of investments in jointly controlled corporations and associates [Note ] Earnings before income taxes , , Income taxes [Note ] Net earnings Attributable to
Non-controlling interests Perpetual preferred shareholders Common shareholders
Earnings per common share [Note ]
Net earnings attributable to common shareholders – Basic . . – Diluted . .
A 40 POWER FINANCIAL CORPORATION�— �FIRST QUARTER REPORT 2019
PFC_QUAT1_Eng01_PFC_2019-05-11_v1.indd B40PFC_QUAT1_Eng01_PFC_2019-05-11_v1.indd B40 19-05-12 8:02 PM19-05-12 8:02 PM

PA
RT
AP
OW
ER FIN
AN
CIA
L CO
RP
OR
ATIO
NPOWER FINANCIAL CORPORATION
Condensed Consolidated Statements of Comprehensive Income
(unaudited) [in millions of Canadian dollars]
Three months ended March ,
Net earnings Other comprehensive income (loss)
Items that may be reclassified subsequently to net earnings Net unrealized gains (losses) on available-for-sale investments
Unrealized gains (losses) ( ) Income tax (expense) benefit ( ) Realized (gains) losses transferred to net earnings ( ) Income tax expense (benefit) –
( ) Net unrealized gains (losses) on cash flow hedges
Unrealized gains (losses) Income tax (expense) benefit – ( ) Realized (gains) losses transferred to net earnings – Income tax expense (benefit) – ( )
Net unrealized foreign exchange gains (losses) on translation of foreign operations
Unrealized gains (losses) on translation ( ) Unrealized gains (losses) on euro debt designated as hedge of net investments
in foreign operations ( ) Income tax (expense) benefit ( )
( ) Share of other comprehensive income (losses) of investments
in jointly controlled corporations and associates Income tax (expense) benefit ( ) ( )
Total – items that may be reclassified
Items that will not be reclassified subsequently to net earnings Actuarial gains (losses) on defined benefit plans [Note ] ( ) Income tax (expense) benefit ( ) Total – items that will not be reclassified ( )
Other comprehensive income Comprehensive income , Attributable to
Non-controlling interests Perpetual preferred shareholders Common shareholders ,
,
POWER FINANCIAL CORPORATION�— �FIRST QUARTER REPORT 2019 A 41
PFC_QUAT1_Eng01_PFC_2019-05-11_v1.indd B41PFC_QUAT1_Eng01_PFC_2019-05-11_v1.indd B41 19-05-12 8:02 PM19-05-12 8:02 PM

PA
RT
AP
OW
ER F
INA
NC
IAL
CO
RP
OR
ATI
ON
POWER FINANCIAL CORPORATION
Condensed Consolidated Statements of Changes in Equity
Stated capital ReservesThree months ended March , (unaudited) [in millions of Canadian dollars]
Perpetual preferred
shares Common
shares Retained earnings
Share-based compensation
Other comprehensive
income [Note ] Total
Non-controlling
interests Total
equity Balance, beginning of year
As previously reported , , , , , , Change in accounting policies
[Note ] Impact of IFRS – – ( ) – – – ( ) ( ) Impact of IFRIC – – ( ) – – – ( ) ( )
Restated balance, beginning of year , , , , , ,
Net earnings – – – – – Other comprehensive
income (loss) – – – – ( ) Comprehensive income – – – Dividends to shareholders
Perpetual preferred shares – – ( ) – – – – ( ) Common shares – – ( ) – – – – ( )
Dividends to non-controlling interests – – – – – – ( ) ( )
Share-based compensation [Note ] – – – –
Stock options exercised – – – ( ) – ( ) – Effects of changes in capital
and ownership of subsidiaries, and other – – ( ) – ( ) ( )
Balance, end of period , , , , , ,
Stated capital ReservesThree months ended March , (unaudited) [in millions of Canadian dollars]
Perpetual preferred
shares Common
shares Retained earnings
Share-based compensation
Other comprehensive
income [Note ] Total
Non-controlling
interests Total
equity Balance, beginning of year , , , , , , Net earnings – – – – – Other comprehensive income – – – – Comprehensive income – – – , Dividends to shareholders
Perpetual preferred shares – – ( ) – – – – ( ) Common shares – – ( ) – – – – ( )
Dividends to non-controlling interests – – – – – – ( ) ( )
Share-based compensation [Note ] – – – –
Stock options exercised – – – ( ) – ( ) – Effects of changes in capital
and ownership of subsidiaries, and other – – ( ) – – – ( ) ( )
Balance, end of period , , , , , ,
A 42 POWER FINANCIAL CORPORATION�— �FIRST QUARTER REPORT 2019
PFC_QUAT1_Eng01_PFC_2019-05-11_v1.indd B42PFC_QUAT1_Eng01_PFC_2019-05-11_v1.indd B42 19-05-12 8:02 PM19-05-12 8:02 PM

PA
RT
AP
OW
ER FIN
AN
CIA
L CO
RP
OR
ATIO
NPOWER FINANCIAL CORPORATION
Condensed Consolidated Statements of Cash Flows
(unaudited) [in millions of Canadian dollars]
Three months ended March , [ ]
Operating activities Earnings before income taxes , , Income tax paid, net of refunds ( ) ( ) Adjusting items
Change in insurance and investment contract liabilities , ( ) Change in funds held by ceding insurers Change in reinsurance assets ( ) Change in fair value through profit or loss ( , ) , Other ( ) ( )
, Financing activities Dividends paid
By subsidiaries to non-controlling interests ( ) ( ) Perpetual preferred shares ( ) ( ) Common shares ( ) ( ) ( ) ( )
Issue of equity instruments by subsidiaries Repurchase of common shares by subsidiaries ( ) ( ) Issue of debentures [Note ] Redemption of debentures – ( ) Change in other debt instruments ( ) Repayment of lease liabilities ( ) – Increase in obligations to securitization entities Repayments of obligations to securitization entities and other ( ) ( ) ( ) ( ) Investment activities Bond sales and maturities , , Mortgage and other loan repayments , Sale of shares Sale of investment properties – Change in loans to policyholders Business acquisitions, net of cash and cash equivalents acquired – ( ) Investment in bonds ( , ) ( , ) Investment in mortgage and other loans ( , ) ( , ) Investment in shares ( ) ( ) Investments in jointly controlled corporations and associates [Note ] ( ) – Proceeds from assets held for sale – Change in cash and cash equivalents classified as held for sale [Note ] – Investment in investment properties and other ( ) ( ) ( ) ( , ) Effect of changes in exchange rates on cash and cash equivalents ( ) Increase (decrease) in cash and cash equivalents ( ) Cash and cash equivalents, beginning of year , , Cash and cash equivalents, end of period , , Net cash from operating activities includes Interest and dividends received , , Interest paid
[ ] The Corporation reclassified certain comparative figures to conform with the December 31, 2018 presentation. The correction in presentation is not material and has no effect on the total cash flows.
POWER FINANCIAL CORPORATION�— �FIRST QUARTER REPORT 2019 A 43
PFC_QUAT1_Eng01_PFC_2019-05-11_v1.indd B43PFC_QUAT1_Eng01_PFC_2019-05-11_v1.indd B43 19-05-12 8:02 PM19-05-12 8:02 PM

PA
RT
AP
OW
ER F
INA
NC
IAL
CO
RP
OR
ATI
ON
POWER FINANCIAL CORPORATION
Notes to the Interim Condensed Consolidated Financial Statements (unaudited)
(ALL TABULAR AMOUNTS ARE IN MILLIONS OF CANADIAN DOLLARS, UNLESS OTHERWISE NOTED.)
Note Corporate Information
Note Basis of Presentation and Summary of Significant Accounting Policies
Note Business Acquisition and Disposal
Note Assets Held for Sale
Note Investments
Note Investments in Jointly Controlled Corporations and Associates
Note Segregated Funds
Note Insurance and Investment Contract Liabilities
Note Debentures and Other Debt Instruments
Note Stated Capital
Note Share-Based Compensation
Note Capital Management
Note Risk Management
Note Pension Plans and Other Post-Employment Benefits
Note Income Taxes
Note Other Comprehensive Income
Note Earnings Per Share
Note Fair Value Measurement
Note Segmented Information
The following abbreviations are used in these Consolidated Financial Statements:
CALM Canadian Asset Liability Method
Canada Life The Canada Life Assurance Company
China AMC China Asset Management Co., Ltd.
Great-West Life The Great-West Life Assurance Company
Great-West Financial or Great-West Life & Annuity Insurance Company Great-West Life & Annuity
IFRS International Financial Reporting Standards
IGM or IGM Financial IGM Financial Inc.
IG Wealth Management Investors Group Inc.
Irish Life Irish Life Group Limited
Lifeco Great-West Lifeco Inc.
London Life London Life Insurance Company
Mackenzie or Mackenzie Financial Corporation Mackenzie Investments
Pargesa Pargesa Holding SA
Parjointco Parjointco N.V.
Portag Portag Ventures LP
Power Corporation Power Corporation of Canada
Power Financial or Power Financial Corporation the Corporation
Putnam Putnam Investments, LLC
Wealthsimple Wealthsimple Financial Corp.
NOTE 1 Corporate Information
Power Financial Corporation is a publicly listed company (TSX: PWF) incorporated and domiciled in Canada and located at 751 Victoria Square, Montréal, Québec, Canada, H2Y 2J3.
Power Financial is a diversified international management and holding company that holds interests, directly or indirectly, in companies in the financial services sector in Canada, the United States and Europe. Through its investment in Pargesa Holding SA, Power Financial also has substantial holdings in global industrial and services companies based in Europe.
The unaudited Interim Condensed Consolidated Financial Statements (financial statements) of Power Financial as at and for the three months ended March 31, 2019 were approved by its Board of Directors on May 13, 2019. The Corporation is controlled by Power Corporation of Canada.
A 44 POWER FINANCIAL CORPORATION�— �FIRST QUARTER REPORT 2019
PFC_QUAT1_Eng01_PFC_2019-05-11_v1.indd B44PFC_QUAT1_Eng01_PFC_2019-05-11_v1.indd B44 19-05-12 8:02 PM19-05-12 8:02 PM

PA
RT
AP
OW
ER FIN
AN
CIA
L CO
RP
OR
ATIO
NPOWER FINANCIAL CORPORATION
NOTE 2 Basis of Presentation and Summary of Significant Accounting Policies
B A S I S O F P R E S E N T A T I O N
The financial statements of Power Financial as at March 31, 2019 have been prepared in accordance with International Accounting Standard 34 - Interim Financial Reporting (IAS 34) using the same accounting policies, which are consistent with IFRS, as set out in Note 2 to the consolidated financial statements of the Corporation for the year ended December 31, 2018 except as described in the section Change in Accounting Policies below.
The financial statements include the accounts of Power Financial and its subsidiaries on a consolidated basis after elimination of intercompany transactions and balances.
SUBSIDIARIES Subsidiaries are entities the Corporation controls when: (i) the Corporation has power over the entity; (ii) it is exposed or has rights to variable returns from its involvement; and (iii) it has the ability to affect those returns through its use of power over the entity. Subsidiaries of the Corporation are consolidated from the date of acquisition, being the date on which the Corporation obtains control, and continue to be consolidated until the date such control ceases. The Corporation reassesses whether or not it controls an entity if facts and circumstances indicate there are changes to one or more of the elements of control listed above.
The principal operating subsidiaries of the Corporation are:
% equity interest
Corporations Primary business operation March ,
December ,
Great-West Lifeco Inc. [ ][ ] Financial services holding company with interests in insurance and wealth management companies . .
IGM Financial Inc. [ ][ ] Wealth and asset management . . Portag Ventures LP [ ] Backing of innovative financial services companies . . Wealthsimple Financial Corp. [ ] Technology-driven investment manager . .
[ ] Power Financial holds a 67.8% equity interest and IGM Financial holds a 4.0% equity interest in Lifeco (67.8% and 4.0%, respectively, at December 31, 2018). [ ] Lifeco’s principal operating subsidiary companies are Great-West Life, Great-West Financial, London Life, Canada Life, Irish Life and Putnam. [ ] Power Financial holds a 61.5% equity interest and Great-West Life holds a 3.8% equity interest in IGM Financial (61.4% and 3.8%, respectively, at December 31,
2018). [ ] IGM’s principal operating subsidiary companies are IG Wealth Management and Mackenzie. [ ] Power Financial holds a 63.0% equity interest and Lifeco and IGM Financial each hold an equity interest of 18.5% in Portag3 (same at December 31, 2018). [ ] Power Financial, Portag3 and IGM Financial hold an equity interest of 17.4%, 23.7% and 47.5%, respectively, in Wealthsimple (16.0%, 21.9% and 43.8%,
respectively, at December 31, 2018).
Subsequent event On April 17, 2019, Lifeco announced that it had completed a substantial issuer bid (the Lifeco Offer) and purchased for cancellation 59,700,974 of its common shares at a purchase price of $33.50 per common share. The Corporation supported Lifeco through its participation in the Lifeco Offer by tendering a significant portion of its Lifeco common shares on a proportionate basis and all remaining tendered Lifeco common shares on a non-proportionate basis. After giving effect to the above, as of April 17, 2019, the Corporation held an approximate 66.8% equity interest in Lifeco (excluding IGM’s 4.0% interest). The change in ownership in Lifeco will result in a gain to be recorded in the statements of changes in equity in the second quarter of 2019.
The financial statements of Power Financial include, on a consolidated basis, the results of Lifeco and IGM Financial, both public companies. The amounts shown on the consolidated balance sheets, consolidated statements of earnings, consolidated statements of comprehensive income, consolidated statements of changes in equity and consolidated statements of cash flows are mainly derived from the publicly disclosed consolidated financial statements of Lifeco and IGM Financial, all as at and for the three months ended March 31, 2019. Certain notes to Power Financial’s financial statements are derived from the notes to the financial statements of Lifeco and IGM Financial.
POWER FINANCIAL CORPORATION�— �FIRST QUARTER REPORT 2019 A 45
PFC_QUAT1_Eng01_PFC_2019-05-11_v1.indd B45PFC_QUAT1_Eng01_PFC_2019-05-11_v1.indd B45 19-05-12 8:02 PM19-05-12 8:02 PM

PA
RT
AP
OW
ER F
INA
NC
IAL
CO
RP
OR
ATI
ON
POWER FINANCIAL CORPORATION
NOTE 2 Basis of Presentation and Summary of Significant Accounting Policies (continued)
JOINTLY CONTROLLED CORPORATIONS AND ASSOCIATES Jointly controlled corporations are entities in which unanimous consent is required for decisions relating to relevant activities. Associates are entities in which the Corporation exercises significant influence over the entity’s operating and financial policies, without having control or joint control. Investments in jointly controlled corporations and associates are accounted for using the equity method. Under the equity method, the Corporation recognizes its share of net earnings (losses), other comprehensive income (loss), the changes in equity of the jointly controlled corporations and associates, and dividends received.
The principal jointly controlled corporations and associates of the Corporation are:
% equity interest
Corporations Classification Primary business operation March ,
December ,
Parjointco N.V. [ ] Joint control Holding company . . China Asset Management Co., Ltd. [ ] Associate Asset management company . .
[ ] Parjointco N.V. holds a 55.5% (same at December 31, 2018) equity interest in Pargesa Holding SA.
[ ] Held by IGM.
C H A N G E I N A C C O U N T I N G P O L I C I E S
IFRS 16 – LEASES (IFRS 16) Effective January 1, 2019, the Corporation adopted IFRS 16, which replaces IAS 17, Leases (IAS 17) and related interpretations. The standard prescribes new guidance for identifying a lease as well as the recognition, measurement, presentation and disclosure of leases. IFRS 16 requires a lessee to recognize a right-of-use asset representing its right to use the leased asset and a corresponding lease liability representing its obligation to make lease payments for all leases. The distinction between operating and financing leases no longer applies, however an optional exemption exists for short-term and low-value leases.
Accounting policies At inception of a contract, the Corporation and its subsidiaries assess whether a contract is or contains a lease. The Corporation and its subsidiaries recognize a right-of-use asset and a lease liability at the lease commencement date.
The right-of-use asset is initially measured based on the initial amount of lease liability adjusted for any lease payments made at or before the commencement date, plus any initial direct costs incurred and an estimate of costs to dismantle and remove the underlying asset or to restore the underlying asset or the site on which it is located, less any lease incentive received. The right-of-use asset is depreciated to the earlier of the end of the useful life of the right-of-use asset or the end of the lease term using the straight-line method and is included within owner-occupied properties and capital assets. Depreciation expense on right-of-use assets is included within operating and administrative expenses.
The lease liability is initially measured at the present value of the lease payments that are not paid at the commencement date, discounted using the interest rate implicit in the lease or, if that rate cannot be readily determined, the Corporation’s and its subsidiaries’ incremental borrowing rate. Generally, the incremental borrowing rate is used. The lease liability is measured at amortized cost using the effective interest method and is included within other liabilities. Interest expense on lease liabilities is included within financing charges.
The Corporation and its subsidiaries do not to recognize right-of-use assets and lease liabilities for short-term leases that have a lease term of 12 months or less and leases of low-value assets. The lease payments associated with these leases are recognized as an expense on a straight-line basis over the term within operating and administrative expenses.
A 46 POWER FINANCIAL CORPORATION�— �FIRST QUARTER REPORT 2019
PFC_QUAT1_Eng01_PFC_2019-05-11_v1.indd B46PFC_QUAT1_Eng01_PFC_2019-05-11_v1.indd B46 19-05-12 8:02 PM19-05-12 8:02 PM

PA
RT
AP
OW
ER FIN
AN
CIA
L CO
RP
OR
ATIO
NPOWER FINANCIAL CORPORATION
NOTE 2 Basis of Presentation and Summary of Significant Accounting Policies (continued)
Impact of transition to IFRS 16 The Corporation has elected to adopt IFRS 16 using a modified retrospective approach and accordingly the information presented for 2018 remains as previously reported under IAS 17 and related interpretations.
On initial application, the Corporation elected to measure right-of-use assets on a lease-by-lease basis at either i) an amount equal to the lease liability, adjusted by the amount of any prepaid or accrued lease payments relating to that lease recognized on the balance sheets immediately before the date of initial application; or ii) at its carrying amount as if IFRS 16 had been applied since the commencement date but discounted using the Corporation’s incremental borrowing rate at January 1, 2019. When measuring lease liabilities, the Corporation and its subsidiaries discounted lease payments using their respective incremental borrowing rates at January 1, 2019. The weighted-average incremental borrowing rate was 3.95% at January 1, 2019.
On transition, the Corporation and its subsidiaries elected to apply practical expedients including: i) to not recognize right-of-use assets and lease liabilities for leases for which the remaining lease terms end within twelve months of the date of transition; and ii) to apply a single discount rate to a portfolio of leases with reasonably similar characteristics.
Impact on the balance sheet as at January 1, 2019:
December ,
(as previously reported) Impact of
IFRS January ,
(restated)
Assets Investment properties , , Owner-occupied properties and capital assets , ,
Liabilities and shareholders’ equity Other liabilities [ ] , , Deferred tax liabilities , ( ) , Retained earnings , ( ) , Non-controlling interests , ( ) ,
[ ] Accrued lease payments of $64 million within other liabilities on the balance sheet at December 31, 2018 were reclassified to decrease right-of-use assets.
The following table reconciles the Corporation and its subsidiaries’ operating lease obligations at December 31, 2018, as previously disclosed in the Corporation’s consolidated financial statements, to the lease liabilities recognized on initial application of IFRS 16 at January 1, 2019:
Operating lease commitments at December , , Discounting using the incremental borrowing rate at January , ( ) Non-lease components included in operating lease commitments ( ) Leases not yet commenced at January , included in operating lease commitments ( ) Short-term leases included in operating lease commitments ( ) Low-value leases included in operating lease commitments ( ) Renewal options not included in operating lease commitments
Lease liabilities recognized at January ,
The application of IFRS 16 did not have a material impact on the statement of earnings or the statement of cash flows for the three-month period ended March 31, 2019, except for the classification of lease payments as financing activities instead of operating activities. The adoption of IFRS 16 did not have an impact on net cash flows.
IFRIC 23 – UNCERTAINTY OVER INCOME TAX TREATMENTS (IFRIC 23) Effective January 1, 2019, the Corporation adopted IFRIC 23 which clarifies the application of the recognition and measurement requirements in IAS 12, Income Taxes, when there is uncertainty over income tax treatments. Under IFRIC 23, a provision for tax uncertainties which meets the probable threshold for recognition is measured based on the amount most likely to occur. The provision for tax uncertainties is classified as current or deferred based on how a disallowance of the underlying uncertain tax treatment would impact the tax provision accrual as of the balance sheet date. The application of the interpretation of the standard resulted in a decrease of $109 million to Lifeco’s retained earnings. The Corporation’s share of this impact is $77 million.
POWER FINANCIAL CORPORATION�— �FIRST QUARTER REPORT 2019 A 47
PFC_QUAT1_Eng01_PFC_2019-05-11_v1.indd B47PFC_QUAT1_Eng01_PFC_2019-05-11_v1.indd B47 19-05-12 8:02 PM19-05-12 8:02 PM

PA
RT
AP
OW
ER F
INA
NC
IAL
CO
RP
OR
ATI
ON
POWER FINANCIAL CORPORATION
NOTE 2 Basis of Presentation and Summary of Significant Accounting Policies (continued)
U S E O F S I G N I F I C A N T J U D G M E N T S , E S T I M A T E S A N D A S S U M P T I O N S
In the preparation of the financial statements, management of the Corporation and management of its subsidiaries are required to make significant judgments, estimates and assumptions that affect the reported amounts of assets, liabilities, net earnings, comprehensive income and related disclosures. Key sources of estimation uncertainty and areas where significant judgments have been made by the management of the Corporation and the management of its subsidiaries are further described in the relevant accounting policies as described in the Corporation’s financial statements and notes thereto for the year ended December 31, 2018.
F U T U R E A C C O U N T I N G C H A N G E S
The Corporation and its subsidiaries continuously monitor the potential changes proposed by the International Accounting Standards Board (IASB) and analyze the effect that changes in the standards may have on their consolidated financial statements when they become effective. There have been no significant changes to future accounting policies that could impact the Corporation from what was disclosed in the December 31, 2018 consolidated annual financial statements.
NOTE 3 Business Acquisition and Disposal
LIFECO Invesco Ltd. (Ireland) On August 1, 2018, Lifeco, through its indirect wholly owned subsidiary Irish Life Group Limited, completed its agreement to acquire a controlling interest in Invesco Ltd. (Ireland), an independent financial consultancy firm in Ireland that specializes in employee benefit consultancy and private wealth management as well as manages and administers assets on behalf of clients. As the purchase price allocation is incomplete at March 31, 2019, the initial amount assigned to goodwill of $80 million on the date of acquisition could be adjusted pending the completion of a comprehensive valuation of the intangible assets acquired.
U.S. individual life insurance and annuity business reinsurance agreement On January 24, 2019, Great-West Financial, a wholly owned subsidiary of Lifeco, announced that it had entered into an agreement with Protective Life Insurance Company (Protective Life) to sell, via indemnity reinsurance, substantially all of its individual life insurance and annuity business. Lifeco will continue to retain the obligation to the contract holders and will recognize reinsurance assets from the agreement. Protective Life will assume the economics and risks associated with the reinsured business. In addition to recognition of reinsurance assets, Lifeco expects to recognize a loss in the statements of earnings at the closing of this transaction. The transaction is expected to close during the second quarter of 2019 subject to regulatory and customary closing conditions.
A 48 POWER FINANCIAL CORPORATION�— �FIRST QUARTER REPORT 2019
PFC_QUAT1_Eng01_PFC_2019-05-11_v1.indd B48PFC_QUAT1_Eng01_PFC_2019-05-11_v1.indd B48 19-05-12 8:02 PM19-05-12 8:02 PM

PA
RT
AP
OW
ER FIN
AN
CIA
L CO
RP
OR
ATIO
NPOWER FINANCIAL CORPORATION
NOTE 4 Assets Held for Sale
Sale of policies to Scottish Friendly Assurance Society Limited In 2018, Canada Life Limited, an indirect wholly owned subsidiary of Lifeco, announced an agreement to sell a heritage block of individual policies, composed of unit-linked policies and non-unit-linked policies, to Scottish Friendly Assurance Society Limited. The transfer of these policies is expected to occur in the second half of 2019.
The composition of the assets and liabilities of the disposal group classified as assets held for sale are as follows:
March ,
December ,
Assets Cash and cash equivalents Investments
Bonds Shares Investment properties Loans to policyholders
Assets held for sale Investments on account of segregated fund policyholders , , Total assets included in disposal group classified as held for sale , ,
Liabilities Insurance contract liabilities Investment contract liabilities Liabilities held for sale Insurance and investment contracts on account of segregated fund policyholders , , Total liabilities included in disposal group classified as held for sale , , The composition of assets and liabilities of the disposal group will be finalized after a comprehensive evaluation of the fair value of the assets and liabilities to be transferred has been completed.
Net earnings from the disposal of these policies are not expected to be material to the financial statements.
POWER FINANCIAL CORPORATION�— �FIRST QUARTER REPORT 2019 A 49
PFC_QUAT1_Eng01_PFC_2019-05-11_v1.indd B49PFC_QUAT1_Eng01_PFC_2019-05-11_v1.indd B49 19-05-12 8:02 PM19-05-12 8:02 PM

PA
RT
AP
OW
ER F
INA
NC
IAL
CO
RP
OR
ATI
ON
POWER FINANCIAL CORPORATION
NOTE 5 Investments
CARRYING VALUES AND FAIR VALUES Carrying values and estimated fair values of investments are as follows:
March , December ,
Carrying
valueFair
valueCarrying
valueFair
value
Bonds Designated as fair value through profit or loss , , , , Classified as fair value through profit or loss , , , , Available for sale , , , , Loans and receivables , , , ,
, , , , Mortgage and other loans
Loans and receivables , , , , Designated as fair value through profit or loss Classified as fair value through profit or loss
, , , , Shares
Designated as fair value through profit or loss , , , , Classified as fair value through profit or loss Available for sale [ ]
, , , , Investment properties , , , , Loans to policyholders , , , , , , , ,
[ ] Fair value of certain shares available for sale cannot be reliably measured, therefore these investments are held at cost.
A 50 POWER FINANCIAL CORPORATION�— �FIRST QUARTER REPORT 2019
PFC_QUAT1_Eng01_PFC_2019-05-11_v1.indd B50PFC_QUAT1_Eng01_PFC_2019-05-11_v1.indd B50 19-05-12 8:02 PM19-05-12 8:02 PM

PA
RT
AP
OW
ER FIN
AN
CIA
L CO
RP
OR
ATIO
NPOWER FINANCIAL CORPORATION
NOTE 6 Investments in Jointly Controlled Corporations and Associates
The carrying values of the investments in jointly controlled corporations and associates are as follows:
March , March , Parjointco China AMC Other Total Parjointco China AMC Other Total
Carrying value, beginning of year , , , , Acquisition – – – – – – Investments – – – – – – Share of earnings (losses) ( ) – Share of other comprehensive income (loss) ( ) –
Carrying value, end of period , , , ,
PERSONAL CAPITAL CORPORATION In January 2019, IGM invested an additional amount of $67 million (US$50 million) in Personal Capital Corporation (Personal Capital) which increased its voting interest to 22.7%. IGM has determined that it has significant influence and therefore accounts for its interest as an associate using the equity method. Significant influence arises from its voting interest and board representation. The interest in Personal Capital was previously accounted for as an available-for-sale investment. The carrying value at the time of the acquisition of significant influence was $217 million. The reclassification of the investment from available for sale to an associate resulted in a gain recorded in net investment income.
As at March 31, 2019, IGM held a 25.2% equity interest in Personal Capital.
NOTE 7 Segregated Funds
The following presents details of the investments, determined in accordance with the relevant statutory reporting requirements of each region of Lifeco’s operations, on account of segregated fund policyholders:
INVESTMENTS ON ACCOUNT OF SEGREGATED FUND POLICYHOLDERS
March ,
December ,
Cash and cash equivalents , , Bonds , , Mortgage loans , , Shares and units in unit trusts , , Mutual funds , , Investment properties , , , , Accrued income Other liabilities ( , ) ( , ) Non-controlling mutual fund interest , ,
POWER FINANCIAL CORPORATION�— �FIRST QUARTER REPORT 2019 A 5 1
PFC_QUAT1_Eng01_PFC_2019-05-11_v1.indd B51PFC_QUAT1_Eng01_PFC_2019-05-11_v1.indd B51 19-05-12 8:02 PM19-05-12 8:02 PM

PA
RT
AP
OW
ER F
INA
NC
IAL
CO
RP
OR
ATI
ON
POWER FINANCIAL CORPORATION
NOTE 7 Segregated Funds (continued)
INSURANCE AND INVESTMENT CONTRACTS ON ACCOUNT OF SEGREGATED FUND POLICYHOLDERS
Three months ended March ,
Balance, beginning of year , , Additions (deductions):
Policyholder deposits , , Net investment income Net realized capital gains on investments , Net unrealized capital gains (losses) on investments , ( , ) Unrealized gains (losses) due to changes in foreign exchange rates ( , ) , Policyholder withdrawals ( , ) ( , ) Business acquisition – Segregated fund investment in General Fund – General Fund investment in segregated fund – ( ) Net transfer from General Fund ( ) Non-controlling mutual fund interest ( ) Assets held for sale [Note ] ( ) – Other ( ) –
, , Balance, end of period , ,
INVESTMENTS ON ACCOUNT OF SEGREGATED FUND POLICYHOLDERS (by fair value hierarchy level)
March , Level Level Level Total
Investments on account of segregated fund policyholders [ ] , , , , Investments on account of segregated fund policyholders held for sale [ ] , , Total investments on account of segregated fund policyholders
measured at fair value , , , ,
[ ] Excludes other liabilities, net of other assets, of $2,817 million.
[ ] Excludes other assets, net of other liabilities, of $8 million. December , Level Level Level Total
Investments on account of segregated fund policyholders [ ] , , , , Investments on account of segregated fund policyholders held for sale [ ] , , Total investments on account of segregated fund policyholders
measured at fair value , , , ,
[ ] Excludes other liabilities, net of other assets, of $2,510 million.
[ ] Excludes other assets, net of other liabilities, of $ million.
During the three months ended March 31, 2019, certain foreign equity holdings valued at $1,377 million were transferred from Level 2 to Level 1 ($1,842 million were transferred from Level 2 to Level 1 at December 31, 2018), primarily based on Lifeco’s change in use of inputs in addition to quoted prices in active markets for certain foreign share holdings. Level 2 assets include those assets where fair value is not available from normal market pricing sources, where inputs are utilized in addition to quoted prices in active markets and where Lifeco does not have visibility through the underlying assets.
A 52 POWER FINANCIAL CORPORATION�— �FIRST QUARTER REPORT 2019
PFC_QUAT1_Eng01_PFC_2019-05-11_v1.indd B52PFC_QUAT1_Eng01_PFC_2019-05-11_v1.indd B52 19-05-12 8:02 PM19-05-12 8:02 PM

PA
RT
AP
OW
ER FIN
AN
CIA
L CO
RP
OR
ATIO
NPOWER FINANCIAL CORPORATION
NOTE 7 Segregated Funds (continued)
The following presents additional information about Lifeco’s investments on account of segregated fund policyholders for which Lifeco has utilized Level 3 inputs to determine fair value:
March , December ,
Investments on account of
segregated fund policyholders
Investments on account of
segregated fund policyholders
held for sale Total
Investments on account of
segregated fund policyholders
Investments on account of
segregated fund policyholders
held for sale Total
Balance, beginning of year As previously reported , , , – , Change in accounting policy [ ] – – – –
Restated balance, beginning of year , , , – , Total gains (losses) included in
segregated fund investment income ( ) – ( ) –
Purchases – – Sales ( ) – ( ) ( ) – ( ) Transfers into Level – – – – Transfers out of Level – – – ( ) – ( ) Transfers to assets held for sale – – – ( ) –
Balance, end of period , , , ,
[ ] The segregated funds adopted IFRS 16, which resulted in equal and offsetting right-of-use assets and lease liabilities of $136 million being recorded in investment properties and other liabilities within investments on account of segregated fund policyholders as of January 1, 2019. The adoption of IFRS 16 had no net impact on investments on account of segregated fund policyholders as of January 1, 2019.
Transfers into Level 3 are due primarily to decreased observability of inputs in valuation methodologies. Transfers out of Level 3 are due primarily to increased observability of inputs in valuation methodologies as evidenced by corroboration of market prices with multiple pricing vendors.
Refer to the Lifeco section of the Corporation’s Management’s Discussion and Analysis (Part B) for the three-month period ended March 31, 2019 and the financial statements for the year ended December 31, 2018 for further details on Lifeco’s risk and guarantee and the management of these segregated fund risks.
NOTE 8 Insurance and Investment Contract Liabilities
INSURANCE AND INVESTMENT CONTRACT LIABILITIES
March , December ,
Gross
liabilityReinsurance
assets NetGross
liabilityReinsurance
assets Net
Insurance contract liabilities , , , , , , Investment contract liabilities , – , , – , , , , , , ,
NOTE 9 Debentures and Other Debt Instruments
IGM FINANCIAL On March 20, 2019, IGM issued $250 million of 4.206% debentures maturing March 21, 2050. The net proceeds were used by IGM to fund the redemption, on April 30, 2019, of its issued and outstanding 5.90% Non-Cumulative First Preferred Shares, Series B for $150 million, and for general corporate purposes.
POWER FINANCIAL CORPORATION�— �FIRST QUARTER REPORT 2019 A 53
PFC_QUAT1_Eng01_PFC_2019-05-11_v1.indd B53PFC_QUAT1_Eng01_PFC_2019-05-11_v1.indd B53 19-05-12 8:02 PM19-05-12 8:02 PM
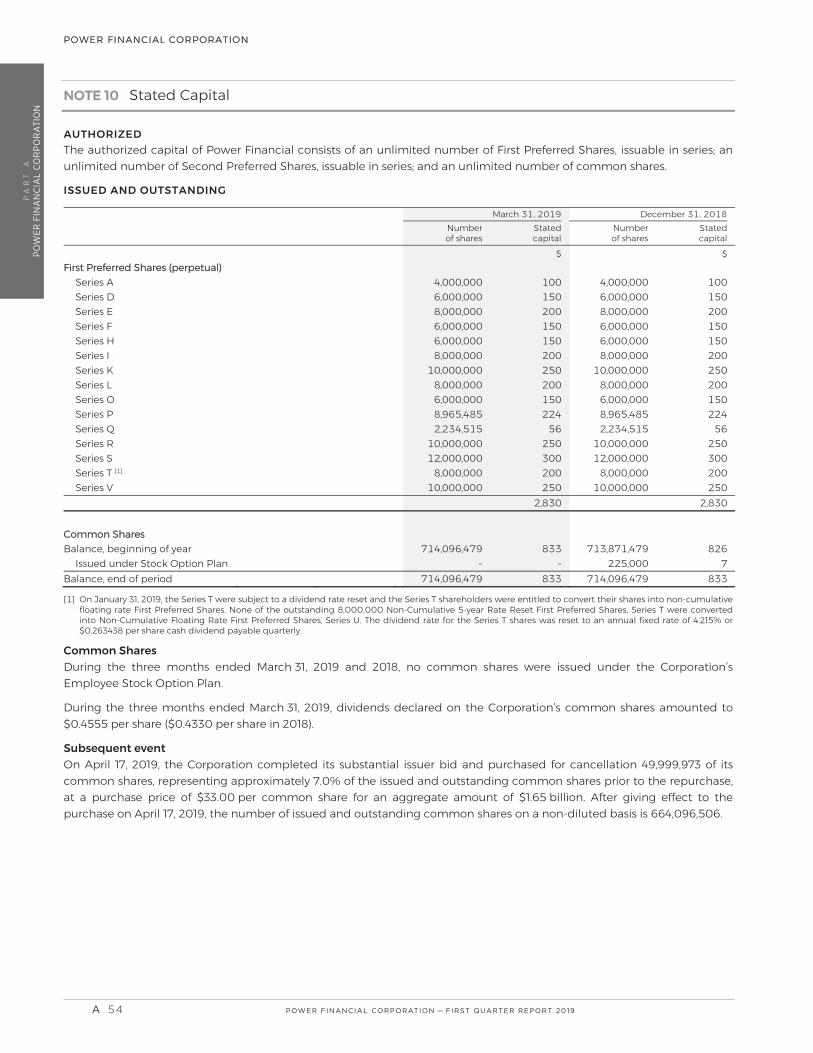
PA
RT
AP
OW
ER F
INA
NC
IAL
CO
RP
OR
ATI
ON
POWER FINANCIAL CORPORATION
NOTE 10 Stated Capital
AUTHORIZED The authorized capital of Power Financial consists of an unlimited number of First Preferred Shares, issuable in series; an unlimited number of Second Preferred Shares, issuable in series; and an unlimited number of common shares.
ISSUED AND OUTSTANDING
March , December ,
Number of shares
Stated capital
Number of shares
Stated capital
$ $ First Preferred Shares (perpetual)
Series A , , , , Series D , , , , Series E , , , , Series F , , , , Series H , , , , Series I , , , , Series K , , , , Series L , , , , Series O , , , , Series P , , , , Series Q , , , , Series R , , , , Series S , , , , Series T [ ] , , , , Series V , , , ,
, , Common Shares Balance, beginning of year , , , ,
Issued under Stock Option Plan – – , Balance, end of period , , , ,
[ ] On January 31, 2019, the Series T were subject to a dividend rate reset and the Series T shareholders were entitled to convert their shares into non-cumulative floating rate First Preferred Shares. None of the outstanding 8,000,000 Non-Cumulative 5-year Rate Reset First Preferred Shares, Series T were converted into Non-Cumulative Floating Rate First Preferred Shares, Series U. The dividend rate for the Series T shares was reset to an annual fixed rate of 4.215% or $0.263438 per share cash dividend payable quarterly.
Common Shares During the three months ended March 31, 2019 and 2018, no common shares were issued under the Corporation’s Employee Stock Option Plan.
During the three months ended March 31, 2019, dividends declared on the Corporation’s common shares amounted to $0.4555 per share ($0.4330 per share in 2018).
Subsequent event On April 17, 2019, the Corporation completed its substantial issuer bid and purchased for cancellation 49,999,973 of its common shares, representing approximately 7.0% of the issued and outstanding common shares prior to the repurchase, at a purchase price of $33.00 per common share for an aggregate amount of $1.65 billion. After giving effect to the purchase on April 17, 2019, the number of issued and outstanding common shares on a non-diluted basis is 664,096,506.
A 54 POWER FINANCIAL CORPORATION�— �FIRST QUARTER REPORT 2019
PFC_QUAT1_Eng01_PFC_2019-05-11_v1.indd B54PFC_QUAT1_Eng01_PFC_2019-05-11_v1.indd B54 19-05-12 8:02 PM19-05-12 8:02 PM
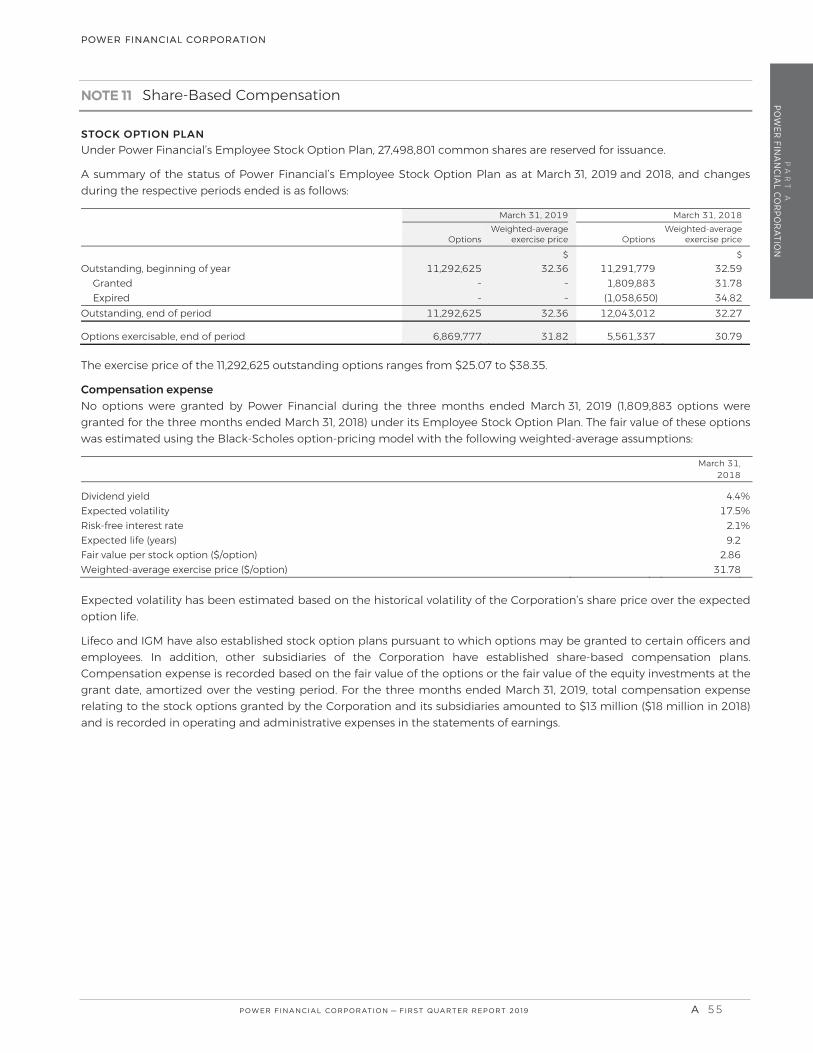
PA
RT
AP
OW
ER FIN
AN
CIA
L CO
RP
OR
ATIO
NPOWER FINANCIAL CORPORATION
NOTE 11 Share-Based Compensation
STOCK OPTION PLAN Under Power Financial’s Employee Stock Option Plan, 27,498,801 common shares are reserved for issuance.
A summary of the status of Power Financial’s Employee Stock Option Plan as at March 31, 2019 and 2018, and changes during the respective periods ended is as follows:
March , March ,
OptionsWeighted-average
exercise price OptionsWeighted-average
exercise price $ $ Outstanding, beginning of year , , . , , .
Granted – – , , .Expired – – ( , , ) .
Outstanding, end of period , , . , , .
Options exercisable, end of period , , . , , . The exercise price of the 11,292,625 outstanding options ranges from $25.07 to $38.35.
Compensation expense No options were granted by Power Financial during the three months ended March 31, 2019 (1,809,883 options were granted for the three months ended March 31, 2018) under its Employee Stock Option Plan. The fair value of these options was estimated using the Black-Scholes option-pricing model with the following weighted-average assumptions:
March ,
Dividend yield . % Expected volatility . % Risk-free interest rate . % Expected life (years) . Fair value per stock option ($/option) . Weighted-average exercise price ($/option) .
Expected volatility has been estimated based on the historical volatility of the Corporation’s share price over the expected option life.
Lifeco and IGM have also established stock option plans pursuant to which options may be granted to certain officers and employees. In addition, other subsidiaries of the Corporation have established share-based compensation plans. Compensation expense is recorded based on the fair value of the options or the fair value of the equity investments at the grant date, amortized over the vesting period. For the three months ended March 31, 2019, total compensation expense relating to the stock options granted by the Corporation and its subsidiaries amounted to $13 million ($18 million in 2018) and is recorded in operating and administrative expenses in the statements of earnings.
POWER FINANCIAL CORPORATION�— �FIRST QUARTER REPORT 2019 A 55
PFC_QUAT1_Eng01_PFC_2019-05-11_v1.indd B55PFC_QUAT1_Eng01_PFC_2019-05-11_v1.indd B55 19-05-12 8:02 PM19-05-12 8:02 PM

PA
RT
AP
OW
ER F
INA
NC
IAL
CO
RP
OR
ATI
ON
POWER FINANCIAL CORPORATION
NOTE 12 Capital Management
POWER FINANCIAL As a holding company, Power Financial’s objectives in managing its capital are to:
provide attractive long-term returns to shareholders of the Corporation; provide sufficient financial flexibility to pursue its growth strategy to invest on a timely basis in its operating companies
and other investments as opportunities present; maintain a capital structure that matches the long-term nature of its investments by maximizing the use of permanent
capital; and maintain an appropriate credit rating to ensure stable access to the capital markets.
The Corporation manages its capital taking into consideration the risk characteristics and liquidity of its holdings. In order to maintain or adjust its capital structure, the Corporation may adjust the amount of dividends paid to shareholders, return capital to shareholders or issue capital.
The capital structure of the Corporation consists of debentures, perpetual preferred shares, common shareholders’ equity and non-controlling interests. The Corporation views perpetual preferred shares as a cost-effective source of permanent capital. The Corporation is a long-term investor and as such holds positions in long-term investments as well as cash and fixed income securities for liquidity purposes.
The Board of Directors of the Corporation is responsible for capital management. Management of the Corporation is responsible for establishing capital management procedures and for implementing and monitoring its capital plans. The Board of Directors of the Corporation reviews and approves capital transactions such as the issuance, redemption and repurchase of common shares, perpetual preferred shares and debentures. The boards of directors of the Corporation’s subsidiaries, as well as those of Pargesa and Groupe Bruxelles Lambert, oversee and have the responsibility for their respective company’s capital management.
The Corporation itself is not subject to externally imposed regulatory capital requirements. However, Lifeco and certain of its main subsidiaries, IGM’s subsidiaries and certain of the Corporation’s other subsidiaries are subject to regulatory capital requirements and they manage their capital as described below.
LIFECO Lifeco manages its capital on both a consolidated basis as well as at the individual operating subsidiary level. The primary objectives of Lifeco’s capital management strategy are:
to maintain the capitalization of its regulated operating subsidiaries at a level that will exceed the relevant minimum regulatory capital requirements in the jurisdictions in which they operate;
to maintain strong credit and financial strength ratings of Lifeco ensuring stable access to capital markets; and to provide an efficient capital structure to maximize shareholder value in the context of Lifeco’s operational risks and
strategic plans.
Lifeco has established policies and procedures designed to identify, measure and report all material risks. Management of Lifeco is responsible for establishing capital management procedures for implementing and monitoring the capital plan.
The target level of capitalization for Lifeco and its subsidiaries is assessed by considering various factors such as the probability of falling below the minimum regulatory capital requirements in the relevant operating jurisdiction, the views expressed by various credit rating agencies that provide financial strength and other ratings to Lifeco, and the desire to hold sufficient capital to be able to honour all policyholder and other obligations of Lifeco with a high degree of confidence.
A 56 POWER FINANCIAL CORPORATION�— �FIRST QUARTER REPORT 2019
PFC_QUAT1_Eng01_PFC_2019-05-11_v1.indd B56PFC_QUAT1_Eng01_PFC_2019-05-11_v1.indd B56 19-05-12 8:02 PM19-05-12 8:02 PM

PA
RT
AP
OW
ER FIN
AN
CIA
L CO
RP
OR
ATIO
NPOWER FINANCIAL CORPORATION
NOTE 12 Capital Management (continued)
In Canada, the Office of the Superintendent of Financial Institutions (OSFI) has established a regulatory capital adequacy measurement for life insurance companies incorporated under the Insurance Companies Act (Canada) and their subsidiaries known as the Life Insurance Capital Adequacy Test (LICAT). The LICAT ratio compares the regulatory capital resources of a company to its Base Solvency Buffer or required capital. The Base Solvency Buffer, defined by OSFI, is the aggregate of all defined capital requirements multiplied by a scalar of 1.05. The total capital resources are provided by the sum of available capital, surplus allowance and eligible deposits. OSFI has established a supervisory target total ratio of 100%, and a supervisory minimum total ratio of 90%. Great-West Life’s consolidated LICAT ratio at March 31, 2019 was 140% (140% at December 31, 2018).
Other foreign operations and foreign subsidiaries of Lifeco are required to comply with local capital or solvency requirements in their respective jurisdictions.
IGM FINANCIAL IGM’s capital management objective is to maximize shareholder returns while ensuring that IGM is capitalized in a manner which appropriately supports regulatory capital requirements, working capital needs and business expansion. IGM’s capital management practices are focused on preserving the quality of its financial position by maintaining a solid capital base and a strong balance sheet. IGM regularly assesses its capital management practices in response to changing economic conditions.
IGM’s capital is primarily used in its ongoing business operations to support working capital requirements, long-term investments made by IGM, business expansion and other strategic objectives.
The IGM subsidiaries that are subject to regulatory capital requirements include investment dealers, mutual fund dealers, exempt market dealers, portfolio managers, investment fund managers and a trust company. These IGM subsidiaries are required to maintain minimum levels of capital based on either working capital, liquidity or shareholders’ equity. At March 31, 2019 IGM subsidiaries have complied with all regulatory capital requirements.
OTHER SUBSIDIARIES Certain other subsidiaries are subject to regulatory capital requirements, including a mutual fund dealer, portfolio managers, and an order-execution-only broker. These other subsidiaries are required to maintain levels of capital based on their working capital, liquidity or shareholders’ equity. At March 31, 2019, these other subsidiaries have complied with all regulatory capital requirements.
POWER FINANCIAL CORPORATION�— �FIRST QUARTER REPORT 2019 A 57
PFC_QUAT1_Eng01_PFC_2019-05-11_v1.indd B57PFC_QUAT1_Eng01_PFC_2019-05-11_v1.indd B57 19-05-12 8:02 PM19-05-12 8:02 PM

PA
RT
AP
OW
ER F
INA
NC
IAL
CO
RP
OR
ATI
ON
POWER FINANCIAL CORPORATION
NOTE 13 Risk Management
The Corporation and its subsidiaries have established policies, guidelines and procedures designed to identify, measure, monitor and mitigate risks associated with financial instruments. The key risks related to financial instruments are liquidity risk, credit risk and market risk.
Liquidity risk is the risk that the Corporation and its subsidiaries would not be able to meet all cash outflow obligations as they come due or be able to, in a timely manner, raise capital or monetize assets at normal market conditions.
Credit risk is the potential for financial loss to the Corporation and its subsidiaries if a counterparty in a transaction fails to meet its payment obligations. Credit risk can be related to the default of a single debt issuer, the variation of credit spreads on tradable fixed income securities and also to counterparty risk relating to derivative products.
Market risk is the risk that the market value or future cash flows of a financial instrument will fluctuate as a result of changes in market factors. Market factors include three types of risks: foreign exchange risk, interest rate risk and equity risk.
Foreign exchange risk relates to the Corporation, its subsidiaries and its jointly controlled corporations and associates operating in different currencies and converting non-Canadian investments and earnings at different points in time at different foreign exchange levels when adverse changes in foreign currency exchange rates occur.
Interest rate risk is the risk that the fair value of a financial instrument will fluctuate following changes in the interest rates.
Equity risk is the potential loss associated with the sensitivity of the market price of a financial instrument arising from volatility in equity markets.
This note to the financial statements includes estimates of sensitivities and risk exposure measures for certain risks, such as the sensitivity due to specific changes in interest rate levels projected and market prices as at the valuation date. Actual results can differ significantly from these estimates for a variety of reasons, including:
assessment of the circumstances that led to the scenario may lead to changes in (re)investment approaches and interest rate scenarios considered;
changes in actuarial, investment return and future investment activity assumptions; actual experience differing from the assumptions; changes in business mix, effective tax rates and other market factors; interactions among these factors and assumptions when more than one changes; and the general limitations of internal models.
For these reasons, the sensitivities should only be viewed as directional estimates of the underlying sensitivities for the respective factors based on the assumptions outlined above. Given the nature of these calculations, the Corporation cannot provide assurance that the actual impact on net earnings will be as indicated.
A 58 POWER FINANCIAL CORPORATION�— �FIRST QUARTER REPORT 2019
PFC_QUAT1_Eng01_PFC_2019-05-11_v1.indd B58PFC_QUAT1_Eng01_PFC_2019-05-11_v1.indd B58 19-05-12 8:02 PM19-05-12 8:02 PM

PA
RT
AP
OW
ER FIN
AN
CIA
L CO
RP
OR
ATIO
NPOWER FINANCIAL CORPORATION
NOTE 13 Risk Management (continued)
POWER FINANCIAL AND OTHER SUBSIDIARIES The risk management policies and procedures of Power Financial and other subsidiaries are discussed in Note 22 to the Corporation’s Consolidated Financial Statements for the year ended December 31, 2018 and have not changed significantly in the three-month period ended March 31, 2019.
LIFECO The risk committee of the board of directors of Lifeco is responsible for the oversight of Lifeco’s key risks. Lifeco has established policies and procedures designed to identify, measure, manage, monitor and report risks associated with financial instruments. Lifeco’s approach to risk management has not changed significantly since December 31, 2018. A summary of the risks is presented below. For a more detailed discussion of Lifeco’s risk governance structure and risk management approach, refer to the Risk Management note in the Corporation’s December 31, 2018 financial statements.
Liquidity risk Lifeco has the following policies and procedures in place to manage liquidity risk:
Lifeco closely manages operating liquidity through cash flow matching of assets and liabilities and forecasting earned and required yields, to ensure consistency between policyholder requirements and the yield of assets.
Management of Lifeco closely monitors the solvency and capital positions of its principal subsidiaries opposite liquidity requirements at the holding company. Additional liquidity is available through established lines of credit or via capital market transactions. Lifeco maintains committed lines of credit with Canadian chartered banks.
Credit risk Concentrations of credit risk arise from exposures to a single debtor, a group of related debtors or groups of debtors that have similar credit risk characteristics in that they operate in the same geographic region or in similar industries. No significant changes have occurred from the year ended December 31, 2018.
Market risk a) Foreign exchange risk
If the assets backing insurance and investment contract liabilities are not matched by currency, changes in foreign exchange rates can expose Lifeco to the risk of foreign exchange losses not offset by liability decreases. Lifeco has net investments in foreign operations. Lifeco’s debt obligations are denominated in Canadian dollars, euros and U.S. dollars. In accordance with IFRS, foreign currency translation gains and losses from net investments in foreign operations, net of related hedging activities and tax effects, are recorded in other comprehensive income. Strengthening or weakening of the Canadian dollar spot rate compared to the U.S. dollar, British pound and euro spot rates impacts Lifeco’s total equity. Correspondingly, Lifeco’s book value per share and capital ratios monitored by rating agencies are also impacted.
A 10% weakening of the Canadian dollar against foreign currencies would be expected to increase non-participating insurance and investment contract liabilities and their supporting assets by approximately the same amount, resulting in an immaterial change to net earnings.
A 10% strengthening of the Canadian dollar against foreign currencies would be expected to decrease non-participating insurance and investment contract liabilities and their supporting assets by approximately the same amount, resulting in an immaterial change in net earnings.
POWER FINANCIAL CORPORATION�— �FIRST QUARTER REPORT 2019 A 59
PFC_QUAT1_Eng01_PFC_2019-05-11_v1.indd B59PFC_QUAT1_Eng01_PFC_2019-05-11_v1.indd B59 19-05-12 8:02 PM19-05-12 8:02 PM

PA
RT
AP
OW
ER F
INA
NC
IAL
CO
RP
OR
ATI
ON
POWER FINANCIAL CORPORATION
NOTE 13 Risk Management (continued)
b) Interest rate risk
Projected cash flows from the current assets and liabilities are used in the CALM to determine insurance contract liabilities. Valuation assumptions have been made regarding rates of returns on supporting assets, fixed income, equity and inflation. The valuation assumptions use best estimates of future reinvestment rates and inflation assumptions with an assumed correlation together with margins for adverse deviation set in accordance with professional standards. These margins are necessary to provide for possibilities of misestimation and/or future deterioration in the best estimate assumptions and provide reasonable assurance that insurance contract liabilities cover a range of possible outcomes. Margins are reviewed periodically for continued appropriateness.
Testing under a number of interest rate scenarios (including increasing, decreasing and fluctuating rates) is done to assess reinvestment risk. The total provision for interest rates is sufficient to cover a broader or more severe set of risks than the minimum arising from the current Canadian Institute of Actuaries-prescribed scenarios.
The range of interest rates covered by these provisions is set in consideration of long-term historical results and is monitored quarterly with a full review annually. An immediate 1% parallel shift in the yield curve would not have a material impact on Lifeco’s view of the range of interest rates to be covered by the provisions. If sustained however, the parallel shift could impact Lifeco’s range of scenarios covered.
The total provision for interest rates also considers the impact of the Canadian Institute of Actuaries-prescribed scenarios:
At March 31, 2019 and December 31, 2018, the effect of an immediate 1% parallel increase in the yield curve on the prescribed scenarios results in interest rate changes to assets and liabilities that will offset each other with no impact to net earnings.
At March 31, 2019 and December 31, 2018, the effect of an immediate 1% parallel decrease in the yield curve on the prescribed scenarios results in interest rate changes to assets and liabilities that will offset each other with no impact to net earnings.
Another way of measuring the interest rate risk associated with this assumption is to determine the effect on the insurance and investment contract liabilities impacting the net earnings of a 1% change in Lifeco’s view of the range of interest rates to be covered by these provisions. The following provides information on the effect of an immediate 1% increase or 1% decrease in the interest rates at both the low and high end of the range of interest rates recognized in the provisions:
March , December , % increase % decrease % increase % decrease
Change in interest rates Increase (decrease) in non-participating insurance
and investment contract liabilities ( ) ( ) Increase (decrease) in net earnings ( ) ( )
A 60 POWER FINANCIAL CORPORATION�— �FIRST QUARTER REPORT 2019
PFC_QUAT1_Eng01_PFC_2019-05-11_v1.indd B60PFC_QUAT1_Eng01_PFC_2019-05-11_v1.indd B60 19-05-12 8:02 PM19-05-12 8:02 PM

PA
RT
AP
OW
ER FIN
AN
CIA
L CO
RP
OR
ATIO
NPOWER FINANCIAL CORPORATION
NOTE 13 Risk Management (continued)
c) Equity risk
Lifeco has investment policy guidelines in place that provide for prudent investment in equity markets with clearly defined limits to mitigate price risk.
The risks associated with segregated fund guarantees have been mitigated through a hedging program for lifetime Guaranteed Minimum Withdrawal Benefit guarantees using equity futures, currency forwards, and interest rate derivatives. For policies with segregated fund guarantees, Lifeco generally determines insurance contract liabilities at a conditional tail expectation of 75 (CTE75) level. In other words, Lifeco determines insurance contract liabilities at a level that covers the average loss in the worst 25% part of the loss distribution.
Some insurance and investment contract liabilities are supported by investment properties, common shares and private equities, for example, segregated fund products and products with long-tail cash flows. Generally these liabilities will fluctuate in line with equity values. However, there may be additional market and liability impacts as a result of changes in the equity values that will cause the liabilities to fluctuate differently than the equity values. The following provides information on the expected impacts of a 10% increase or 10% decrease in equity values:
March , December , % increase % decrease % increase % decrease
Change in equity values Increase (decrease) in non-participating insurance
and investment contract liabilities ( ) ( ) Increase (decrease) in net earnings ( ) ( )
The best estimate return assumptions for equities are primarily based on long-term historical averages. Changes in the current market could result in changes to these assumptions and will impact both asset and liability cash flows. The following provides information on the expected impacts of a 1% increase or 1% decrease in the best estimate assumptions:
March , December , % increase % decrease % increase % decrease
Change in best estimate return assumptions for equities Increase (decrease) in non-participating insurance contract liabilities ( ) ( ) Increase (decrease) in net earnings ( ) ( ) IGM FINANCIAL The risk management policies and procedures of IGM are discussed in the IGM section of the Corporation’s Management’s Discussion and Analysis (Part C) for the three months ended March 31, 2019 and in Note 22 to the Corporation’s Consolidated Financial Statements for the year ended December 31, 2018 and have not changed significantly in the three-month period ended March 31, 2019.
POWER FINANCIAL CORPORATION�— �FIRST QUARTER REPORT 2019 A 61
PFC_QUAT1_Eng01_PFC_2019-05-11_v1.indd B61PFC_QUAT1_Eng01_PFC_2019-05-11_v1.indd B61 19-05-12 8:02 PM19-05-12 8:02 PM

PA
RT
AP
OW
ER F
INA
NC
IAL
CO
RP
OR
ATI
ON
POWER FINANCIAL CORPORATION
NOTE 14 Pension Plans and Other Post-Employment Benefits
The pension plan and other post-employment benefits expense included in net earnings and other comprehensive income are as follows:
Three months ended March ,
Pension plans Service costs Net interest cost
Post-employment benefits Service costs Net interest cost
Expense recognized in net earnings
Remeasurements Pension plans
Actuarial (gains) losses [ ] ( ) Return on assets less (greater) than discount rate ( ) Change in the asset ceiling ( ) –
Post-employment benefits Actuarial (gains) losses [ ] ( )
Expense (recovery) recognized in other comprehensive income ( ) Total expense
[ ] Actuarial losses related to pension plans and other post-employment benefits for the three months ended March 31, 2019 are due to a decrease in discount rates since December 31, 2018.
NOTE 15 Income Taxes
INCOME TAX EXPENSE The components of income tax expense recognized in net earnings are:
Three months ended March ,
Current taxes Deferred taxes ( )
EFFECTIVE INCOME TAX RATE The overall effective income tax rate for the Corporation for the three months ended March 31, 2019 was 17.6%, compared to 14.4% for the full year 2018 and 12.6% for the three months ended March 31, 2018.
The effective income tax rate for the three months ended March 31, 2019 is higher than the effective income tax rate for the same period last year primarily due to changes in certain tax estimates and a lower percentage of income subject to lower rates in foreign jurisdictions.
The effective income tax rates are generally lower than the Corporation’s statutory income tax rate of 26.6% due to non-taxable investment income, lower tax in certain foreign jurisdictions and the fact that results from the jointly controlled corporations and associates are not taxable.
A 62 POWER FINANCIAL CORPORATION�— �FIRST QUARTER REPORT 2019
PFC_QUAT1_Eng01_PFC_2019-05-11_v1.indd B62PFC_QUAT1_Eng01_PFC_2019-05-11_v1.indd B62 19-05-12 8:02 PM19-05-12 8:02 PM

PA
RT
AP
OW
ER FIN
AN
CIA
L CO
RP
OR
ATIO
NPOWER FINANCIAL CORPORATION
NOTE 16 Other Comprehensive Income
Items that may be reclassified subsequently to net earnings
Items that will not be reclassified to net earnings
Three months ended March ,
Investment revaluation
and cash flow hedges
Foreigncurrency
translation
Share of jointly
controlled corporations
and associates
Actuarial gains (losses)
on defined benefit
pensionplans
Share of jointly
controlled corporations
and associates Total
Balance, beginning of year , , ( ) ( ) , Other comprehensive income (loss) ( ) ( ) –
Balance, end of period , , ( ) ( ) ,
Items that may be reclassified subsequently to net earnings
Items that will not be reclassified to net earnings
Three months ended March ,
Investment revaluation
and cash flow hedges
Foreigncurrency
translation
Share of jointly
controlled corporations
and associates
Actuarial gains (losses)
on defined benefit
pensionplans
Share of jointly
controlled corporations
and associates Total
Balance, beginning of year , ( ) ( ) , Other comprehensive income (loss) ( ) –
Balance, end of period , , ( ) ( ) ,
NOTE 17 Earnings Per Share
The following is a reconciliation of the numerators and the denominators used in the computations of earnings per share:
Three months ended March ,
Earnings Net earnings attributable to shareholders Dividends on perpetual preferred shares ( ) ( ) Net earnings attributable to common shareholders Dilutive effect of subsidiaries’ outstanding stock options – ( ) Net earnings adjusted for dilutive effect Number of common shares [millions] Weighted average number of common shares outstanding – Basic . .
Potential exercise of outstanding stock options . . Weighted average number of common shares outstanding – Diluted . . Net earnings per common share Basic . . Diluted . .
For the three months ended March 31, 2019, 9.1 million stock options (7.4 million in 2018) have been excluded from the computation of diluted earnings per share as they were anti-dilutive.
POWER FINANCIAL CORPORATION�— �FIRST QUARTER REPORT 2019 A 63
PFC_QUAT1_Eng01_PFC_2019-05-11_v1.indd B63PFC_QUAT1_Eng01_PFC_2019-05-11_v1.indd B63 19-05-12 8:02 PM19-05-12 8:02 PM

PA
RT
AP
OW
ER F
INA
NC
IAL
CO
RP
OR
ATI
ON
POWER FINANCIAL CORPORATION
NOTE 18 Fair Value Measurement
The Corporation’s assets and liabilities recorded at fair value have been categorized based upon the following fair value hierarchy:
Level Definition Financial assets and liabilities
Level 1 Utilize observable, unadjusted quoted prices in active markets for identical assets or liabilities that the Corporation has the ability to access.
actively exchange-traded equity securities; exchange-traded futures; mutual and segregated funds which have available
prices in an active market with no redemption restrictions;
open-end investment fund units and other liabilities in instances where there are quoted prices available from active markets.
Level 2 Utilize other-than-quoted prices included in Level 1 that are observable for the asset or liability, either directly or indirectly. Level 2 inputs include quoted prices for similar assets and liabilities in active markets, and inputs other-than-quoted prices that are observable for the asset or liability, such as interest rates and yield curves that are observable at commonly quoted intervals. The fair values for some Level 2 securities were obtained from a pricing service. The pricing service inputs include, but are not limited to, benchmark yields, reported trades, broker/dealer quotes, issuer spreads, two-sided markets, benchmark securities, offers and reference data.
assets and liabilities priced using a matrix which is based on credit quality and average life;
government and agency securities; restricted stock; certain private bonds and equities; most investment-grade and high-yield corporate
bonds; most asset-backed securities; most over-the-counter derivatives; most mortgage and other loans; deposits and certificates; most debentures and other debt instruments; most of the investment contracts that are measured
at fair value through profit or loss.
Level 3 Utilize one or more significant inputs that are not based on observable market inputs and include situations where there is little, if any, market activity for the asset or liability. The values of the majority of Level 3 securities were obtained from single-broker quotes, internal pricing models, external appraisers or by discounting projected cash flows.
certain bonds; certain asset-backed securities; certain private equities; certain mortgage and other loans, including
equity-release mortgages; investments in mutual and segregated funds where
there are redemption restrictions; certain over-the-counter derivatives; investment properties; obligations to securitization entities; certain other debt instruments.
A 64 POWER FINANCIAL CORPORATION�— �FIRST QUARTER REPORT 2019
PFC_QUAT1_Eng01_PFC_2019-05-11_v1.indd B64PFC_QUAT1_Eng01_PFC_2019-05-11_v1.indd B64 19-05-12 8:02 PM19-05-12 8:02 PM

PA
RT
AP
OW
ER FIN
AN
CIA
L CO
RP
OR
ATIO
NPOWER FINANCIAL CORPORATION
NOTE 18 Fair Value Measurement (continued)
The following tables present the Corporation’s assets and liabilities recorded at fair value, including their levels in the fair value hierarchy using the valuation methods and assumptions described in the summary of significant accounting policies of the Corporation’s December 31, 2018 financial statements and above. Fair values represent management’s estimates and are generally calculated using market information at a specific point in time and may not reflect future fair values. The calculations are subjective in nature, and involve uncertainties and matters of significant judgment.
March , Level Level Level Total
fair value
Assets Bonds
Fair value through profit or loss – , , Available for sale – , – ,
Mortgage and other loans Fair value through profit or loss –
Shares Fair value through profit or loss , – , Available for sale –
Investment properties – – , , Funds held by ceding insurers , – , Derivative instruments – Asset held for sale Other assets – , , , , ,
Liabilities Investment contract liabilities – , – , Investment contract liabilities held for sale – Derivative instruments , , Other liabilities , ,
December , Level Level Level Total
fair value
Assets Bonds
Fair value through profit or loss – , , Available for sale – , – ,
Mortgage and other loans Fair value through profit or loss –
Shares Fair value through profit or loss , – , Available for sale –
Investment properties – – , , Funds held by ceding insurers , – , Derivative instruments Assets held for sale Other assets – , , , ,
Liabilities Investment contract liabilities – , – , Investment contract liabilities held for sale – Derivative instruments , , Other liabilities , , There were no significant transfers between Level 1 and Level 2 in these periods.
POWER FINANCIAL CORPORATION�— �FIRST QUARTER REPORT 2019 A 65
PFC_QUAT1_Eng01_PFC_2019-05-11_v1.indd B65PFC_QUAT1_Eng01_PFC_2019-05-11_v1.indd B65 19-05-12 8:02 PM19-05-12 8:02 PM

PA
RT
AP
OW
ER F
INA
NC
IAL
CO
RP
OR
ATI
ON
POWER FINANCIAL CORPORATION
NOTE 18 Fair Value Measurement (continued)
The following tables present additional information about assets and liabilities measured at fair value on a recurring basis for which the Corporation and its subsidiaries have utilized Level 3 inputs to determine fair value for the three months ended March 31, 2019 and 2018.
Bonds
Mortgagesand
other loans Shares
Assets (liabilities)
held for sale and other
assets (liabilities
Three months ended March ,
Fair value through
profit or loss
Fair value through
profit or loss
Fair value through
profit or loss Available
for saleInvestment
propertiesDerivatives,
net )
Investment contract liabilities Total
Balance, beginning of year As previously reported , ( ) – , Change in accounting
policy [Note ] – – – – – – – Restated balance,
beginning of year , ( ) – , Total gains (losses)
In net earnings ( ) ( ) ( ) – In other comprehensive
income [ ] ( ) – – ( ) – – – – ( ) Purchases – – ( ) – – Issues – – – – – – – Sales – – ( ) – ( ) – – – ( ) Settlements – ( ) – – – – – Other [ ] – – – ( ) – – – ( )
Balance, end of period , ( ) ( ) – ,
[ ] Other comprehensive income includes unrealized gains (losses) on foreign exchange.
[ ] In January 2019, the investment in Personal Capital was reclassified from available for sale to an investment in an associate (Note 6).
Bonds
Mortgages and
other loans Shares
Three months ended March ,
Fair value through
profit or loss
Fair value through
profit or loss
Fair value through
profit or loss Available
for saleInvestment
propertiesDerivatives,
net
Other assets
(liabilities )
Investment contract liabilities Total
Balance, beginning of year – , ( ) ( ) , Total gains (losses)
In net earnings ( ) ( ) – ( ) – – In other comprehensive
income [ ] – – – Business acquisition – – – – – – – Purchases – – – – Sales – ( ) – ( ) ( ) – – – ( ) Settlements – – – – – – – Other – – – – – – ( ) ( ) ( )
Balance, end of period , ( ) ( ) ,
[ ] Other comprehensive income includes unrealized gains (losses) on foreign exchange.
There were no transfers into or out of Level 3 in these periods.
A 66 POWER FINANCIAL CORPORATION�— �FIRST QUARTER REPORT 2019
PFC_QUAT1_Eng01_PFC_2019-05-11_v1.indd B66PFC_QUAT1_Eng01_PFC_2019-05-11_v1.indd B66 19-05-12 8:02 PM19-05-12 8:02 PM

PA
RT
AP
OW
ER FIN
AN
CIA
L CO
RP
OR
ATIO
NPOWER FINANCIAL CORPORATION
NOTE 18 Fair Value Measurement (continued)
The following table sets out information about significant unobservable inputs used at period-end in measuring assets and liabilities categorized as Level 3 in the fair value hierarchy.
Type of asset Valuation approach Significant unobservable input Input value
Inter-relationship between key unobservable inputs and fair value measurement
Investment properties
Investment property valuations are generally determined using property valuation models based on expected capitalization rates and models that discount expected future net cash flows. The determination of the fair value of investment property requires the use of estimates such as future cash flows (such as future leasing assumptions, rental rates, capital and operating expenditures) and discount, reversionary and overall capitalization rates applicable to the asset based on current market rates.
Discount rate Range of 2.4% – 10.3% A decrease in the discount rate would result in an increase in fair value. An increase in the discount rate would result in a decrease in fair value.
Reversionary rate Range of 4.3% – 6.8% A decrease in the reversionary rate would result in an increase in fair value. An increase in the reversionary rate would result in a decrease in fair value.
Vacancy rate Weighted average of 2.4% A decrease in the expected vacancy rate would generally result in an increase in fair value. An increase in the expected vacancy rate would generally result in a decrease in fair value.
Mortgage and other loans (fair value through profit or loss)
The valuation approach for equity-release mortgages is to use an internal valuation model to determine the projected asset cash flows, including the stochastically calculated cost of the no-negative-equity guarantee for each individual loan, to aggregate these across all loans and to discount those cash flows back to the valuation date. The projection is done monthly until expected redemption of the loan either voluntarily or on the death/entering into long-term care of the loanholders.
Discount rate
Range of 4.2% – 4.7%
A decrease in the discount rate would result in an increase in fair value. An increase in the discount rate would result in a decrease in fair value.
Shares The determination of the fair value of shares requires the use of estimates such as future cash flows, discount rates, projected earnings multiples, or recent transactions.
Discount rate Various A decrease in the discount rate would result in an increase in fair value. An increase in the discount rate would result in a decrease in fair value.
POWER FINANCIAL CORPORATION�— �FIRST QUARTER REPORT 2019 A 67
PFC_QUAT1_Eng01_PFC_2019-05-11_v1.indd B67PFC_QUAT1_Eng01_PFC_2019-05-11_v1.indd B67 19-05-12 8:02 PM19-05-12 8:02 PM

PA
RT
AP
OW
ER F
INA
NC
IAL
CO
RP
OR
ATI
ON
POWER FINANCIAL CORPORATION
NOTE 19 Segmented Information
The Corporation’s reportable operating segments are Lifeco, IGM Financial and Pargesa. These reportable segments reflect Power Financial’s management structure and internal financial reporting. The Corporation evaluates the performance based on the operating segment’s contribution to earnings. The following provides a brief description of the three reportable operating segments:
Lifeco is a financial services holding company with interests in life insurance, health insurance, retirement and investment management services, asset management and reinsurance businesses primarily in Canada, the United States and Europe.
IGM Financial is a leading wealth and asset management company operating in Canada primarily within the advice segment of the financial services market. IGM earns revenues from a range of sources, but primarily from management fees, which are charged to its mutual funds for investment advisory and management services. IGM also earns revenues from fees charged to its mutual funds for administrative services.
Pargesa is held through Parjointco. Pargesa is a holding company with diversified interests in Europe-based companies active in various sectors: minerals-based specialty solutions for industry; testing, inspection and certification; cement, aggregates and concrete; wines and spirits; design and distribution of sportswear; materials technology and recycling of precious metals; oil, gas and chemical industries; disposable hygiene products; supplier of equipment and project management for a wide range of processing industries primarily in the food and beverage sectors; and operation of regional leisure parks.
The column entitled “Corporate” is comprised of corporate activities of Power Financial and the results of Wealthsimple and Portag3. This column also includes consolidation elimination entries.
The contribution to earnings of each segment includes the share of net earnings resulting from the investments that Lifeco and IGM have in each other as well as certain consolidation adjustments.
A 68 POWER FINANCIAL CORPORATION�— �FIRST QUARTER REPORT 2019
PFC_QUAT1_Eng01_PFC_2019-05-11_v1.indd B68PFC_QUAT1_Eng01_PFC_2019-05-11_v1.indd B68 19-05-12 8:02 PM19-05-12 8:02 PM
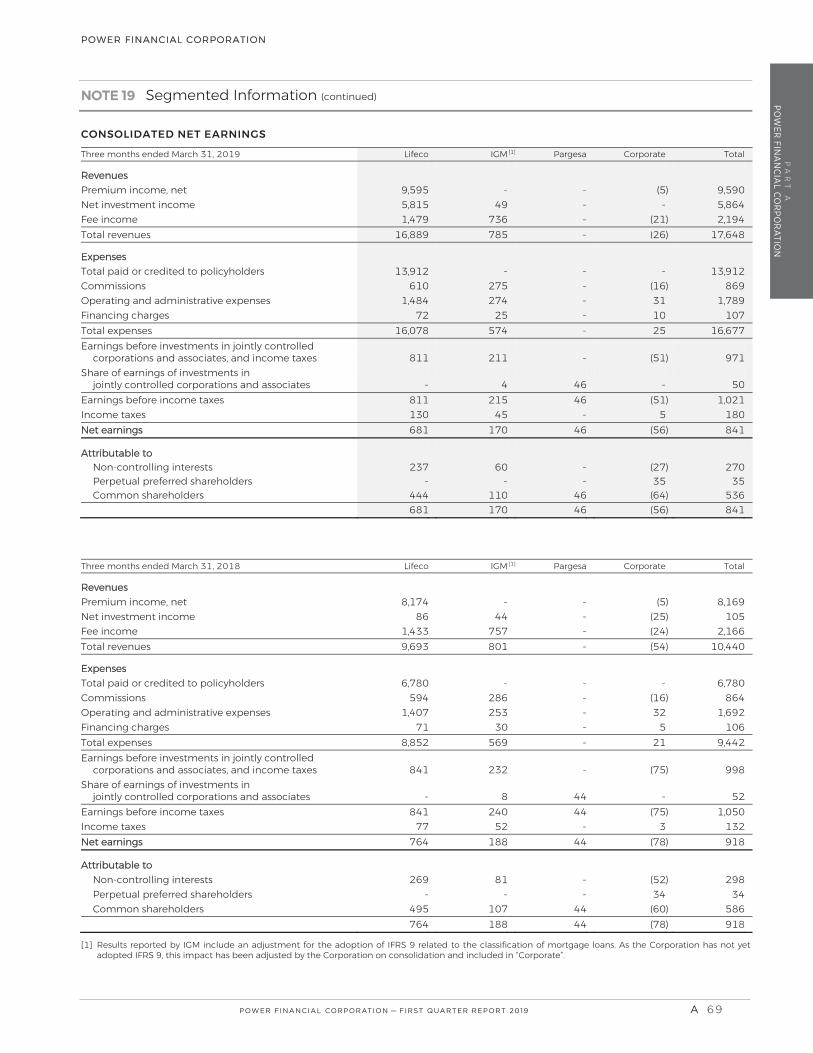
PA
RT
AP
OW
ER FIN
AN
CIA
L CO
RP
OR
ATIO
NPOWER FINANCIAL CORPORATION
NOTE 19 Segmented Information (continued)
CONSOLIDATED NET EARNINGS
Three months ended March , Lifeco IGM [ ] Pargesa Corporate Total
Revenues Premium income, net , – – ( ) , Net investment income , – – , Fee income , – ( ) , Total revenues , – ( ) ,
Expenses Total paid or credited to policyholders , – – – , Commissions – ( ) Operating and administrative expenses , – , Financing charges – Total expenses , – , Earnings before investments in jointly controlled
corporations and associates, and income taxes – ( ) Share of earnings of investments in
jointly controlled corporations and associates – – Earnings before income taxes ( ) , Income taxes – Net earnings ( )
Attributable to Non-controlling interests – ( ) Perpetual preferred shareholders – – – Common shareholders ( )
( ) Three months ended March , Lifeco IGM [ ] Pargesa Corporate Total
Revenues Premium income, net , – – ( ) , Net investment income – ( ) Fee income , – ( ) , Total revenues , – ( ) ,
Expenses Total paid or credited to policyholders , – – – , Commissions – ( ) Operating and administrative expenses , – , Financing charges – Total expenses , – , Earnings before investments in jointly controlled
corporations and associates, and income taxes – ( ) Share of earnings of investments in
jointly controlled corporations and associates – – Earnings before income taxes ( ) , Income taxes – Net earnings ( )
Attributable to Non-controlling interests – ( ) Perpetual preferred shareholders – – – Common shareholders ( )
( )
[ ] Results reported by IGM include an adjustment for the adoption of IFRS 9 related to the classification of mortgage loans. As the Corporation has not yet adopted IFRS 9, this impact has been adjusted by the Corporation on consolidation and included in “Corporate”.
POWER FINANCIAL CORPORATION�— �FIRST QUARTER REPORT 2019 A 69
PFC_QUAT1_Eng01_PFC_2019-05-11_v1.indd B69PFC_QUAT1_Eng01_PFC_2019-05-11_v1.indd B69 19-05-12 8:02 PM19-05-12 8:02 PM

PA
RT
AP
OW
ER F
INA
NC
IAL
CO
RP
OR
ATI
ON
POWER FINANCIAL CORPORATION
NOTE 19 Segmented Information (continued)
TOTAL ASSETS
March , Lifeco IGM [ ] Pargesa Corporate Total
Investments and cash and cash equivalents , , – , , Assets held for sale – – – Investments in jointly controlled corporations
and associates , , Other assets , , – , Goodwill and intangible assets , , – , Investments on account of segregated fund
policyholders , – – – , Investments on account of segregated fund
policyholders held for sale , – – – , Total assets [ ] , , , , ,
December , Lifeco IGM [ ] Pargesa Corporate Total
Investments and cash and cash equivalents , , – , , Assets held for sale – – – Investments in jointly controlled corporations
and associates , , Other assets , , – , Goodwill and intangible assets , , – , Investments on account of segregated fund
policyholders , – – – , Investments on account of segregated fund
policyholders held for sale , – – – , Total assets [ ] , , , , ,
[ ] Total assets of Lifeco and IGM operating segments include the allocation of goodwill and certain consolidation adjustments.
[ ] Assets reported by IGM include an adjustment for the adoption of IFRS 9 related to the classification of mortgage loans. As the Corporation has not yet adopted IFRS 9, this impact has been adjusted by the Corporation on consolidation and included in “Corporate”.
A 70 POWER FINANCIAL CORPORATION�— �FIRST QUARTER REPORT 2019
PFC_QUAT1_Eng01_PFC_2019-05-11_v1.indd B70PFC_QUAT1_Eng01_PFC_2019-05-11_v1.indd B70 19-05-12 8:02 PM19-05-12 8:02 PM

PA
RT
B
GR
EA
T-WE
ST LIFECO
INC
.
MANAGEMENT’S DISCUSSION AND ANALYSIS
PAG E B 2
FINANCIAL STATEMENTS AND NOTES
PAG E B 37
GREAT-WEST LIFECO INC.
PART B
Please note that the bottom of each page in Part B contains two diff erent page numbers. A page number with the prefi x “B” refers to the number of such page in this document and the page number without any prefi x refers to the number of such page in the original document issued by Great-West Lifeco Inc.
The attached documents concerning Great-West Lifeco Inc. are documents prepared and publicly disclosed by such subsidiary. Certain statements in the attached documents, other than statements of historical fact, are forward-looking statements based on certain assumptions and refl ect the current expectations of the subsidiary as set forth therein. Forward-looking statements are provided for the purposes of assisting the reader in understanding the subsidiary’s fi nancial performance, fi nancial position and cash fl ows as at and for the periods ended on certain dates and to present information about the subsidiary’s management’s current expectations and plans relating to the future and the reader is cautioned that such statements may not be appropriate for other purposes.
By its nature, forward-looking information is subject to inherent risks and uncertainties that may be general or specifi c and which give rise to the possibility that expectations, forecasts, predictions, projections or conclusions will not prove to be accurate, that assumptions may not be correct and that objectives, strategic goals and priorities will not be achieved.
For further information provided by the subsidiary as to the material factors that could cause actual results to diff er materially from the content of forward-looking statements, the material factors and assumptions that were applied in making the forward-looking statements, and the subsidiary’s policy for updating the content of forward-looking statements, please see the attached documents, including the section entitled Cautionary Note Regarding Forward-Looking Information. The reader is cautioned to consider these factors and assumptions carefully and not to put undue reliance on forward-looking statements.
POWER FINANCIAL CORPORATION�— �FIRST QUARTER REPORT 2019 B 1
PFC_QUAT1_Eng02_GWL_2019-05-03_v1.indd C1PFC_QUAT1_Eng02_GWL_2019-05-03_v1.indd C1 19-05-10 6:53 AM19-05-10 6:53 AM

PA
RT
B
GR
EA
T-W
EST
LIF
ECO
INC
.
B 2 POWER FINANCIAL CORPORATION�— �FIRST QUARTER REPORT 2019�
PFC_QUAT1_Eng02_GWL_2019-05-03_v1.indd C2PFC_QUAT1_Eng02_GWL_2019-05-03_v1.indd C2 19-05-10 6:53 AM19-05-10 6:53 AM
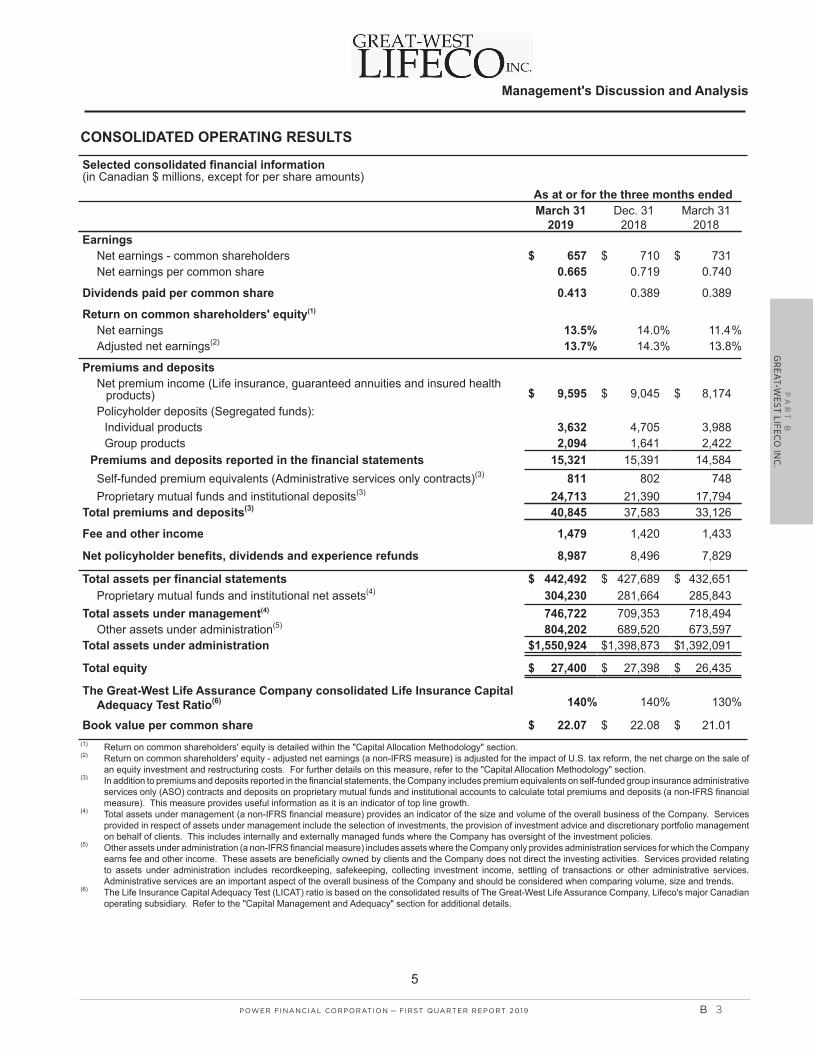
PA
RT
B
GR
EA
T-WE
ST LIFECO
INC
.
POWER FINANCIAL CORPORATION�— �FIRST QUARTER REPORT 2019 B 3
PFC_QUAT1_Eng02_GWL_2019-05-03_v1.indd C3PFC_QUAT1_Eng02_GWL_2019-05-03_v1.indd C3 19-05-10 6:53 AM19-05-10 6:53 AM

PA
RT
B
GR
EA
T-W
EST
LIF
ECO
INC
.
B 4 POWER FINANCIAL CORPORATION�— �FIRST QUARTER REPORT 2019�
PFC_QUAT1_Eng02_GWL_2019-05-03_v1.indd C4PFC_QUAT1_Eng02_GWL_2019-05-03_v1.indd C4 19-05-10 6:53 AM19-05-10 6:53 AM

PA
RT
B
GR
EA
T-WE
ST LIFECO
INC
.
POWER FINANCIAL CORPORATION�— �FIRST QUARTER REPORT 2019 B 5
PFC_QUAT1_Eng02_GWL_2019-05-03_v1.indd C5PFC_QUAT1_Eng02_GWL_2019-05-03_v1.indd C5 19-05-10 6:53 AM19-05-10 6:53 AM

PA
RT
B
GR
EA
T-W
EST
LIF
ECO
INC
.
B 6 POWER FINANCIAL CORPORATION�— �FIRST QUARTER REPORT 2019�
PFC_QUAT1_Eng02_GWL_2019-05-03_v1.indd C6PFC_QUAT1_Eng02_GWL_2019-05-03_v1.indd C6 19-05-10 6:53 AM19-05-10 6:53 AM

PA
RT
B
GR
EA
T-WE
ST LIFECO
INC
.
POWER FINANCIAL CORPORATION�— �FIRST QUARTER REPORT 2019 B 7
PFC_QUAT1_Eng02_GWL_2019-05-03_v1.indd C7PFC_QUAT1_Eng02_GWL_2019-05-03_v1.indd C7 19-05-10 6:53 AM19-05-10 6:53 AM

PA
RT
B
GR
EA
T-W
EST
LIF
ECO
INC
.
B 8 POWER FINANCIAL CORPORATION�— �FIRST QUARTER REPORT 2019�
PFC_QUAT1_Eng02_GWL_2019-05-03_v1.indd C8PFC_QUAT1_Eng02_GWL_2019-05-03_v1.indd C8 19-05-10 6:53 AM19-05-10 6:53 AM

PA
RT
B
GR
EA
T-WE
ST LIFECO
INC
.
POWER FINANCIAL CORPORATION�— �FIRST QUARTER REPORT 2019 B 9
PFC_QUAT1_Eng02_GWL_2019-05-03_v1.indd C9PFC_QUAT1_Eng02_GWL_2019-05-03_v1.indd C9 19-05-10 6:53 AM19-05-10 6:53 AM

PA
RT
B
GR
EA
T-W
EST
LIF
ECO
INC
.
B 10 POWER FINANCIAL CORPORATION�— �FIRST QUARTER REPORT 2019�
PFC_QUAT1_Eng02_GWL_2019-05-03_v1.indd C10PFC_QUAT1_Eng02_GWL_2019-05-03_v1.indd C10 19-05-10 6:53 AM19-05-10 6:53 AM

PA
RT
B
GR
EA
T-WE
ST LIFECO
INC
.
POWER FINANCIAL CORPORATION�— �FIRST QUARTER REPORT 2019 B 1 1
PFC_QUAT1_Eng02_GWL_2019-05-03_v1.indd C11PFC_QUAT1_Eng02_GWL_2019-05-03_v1.indd C11 19-05-10 6:53 AM19-05-10 6:53 AM

PA
RT
B
GR
EA
T-W
EST
LIF
ECO
INC
.
B 12 POWER FINANCIAL CORPORATION�— �FIRST QUARTER REPORT 2019�
PFC_QUAT1_Eng02_GWL_2019-05-03_v1.indd C12PFC_QUAT1_Eng02_GWL_2019-05-03_v1.indd C12 19-05-10 6:53 AM19-05-10 6:53 AM
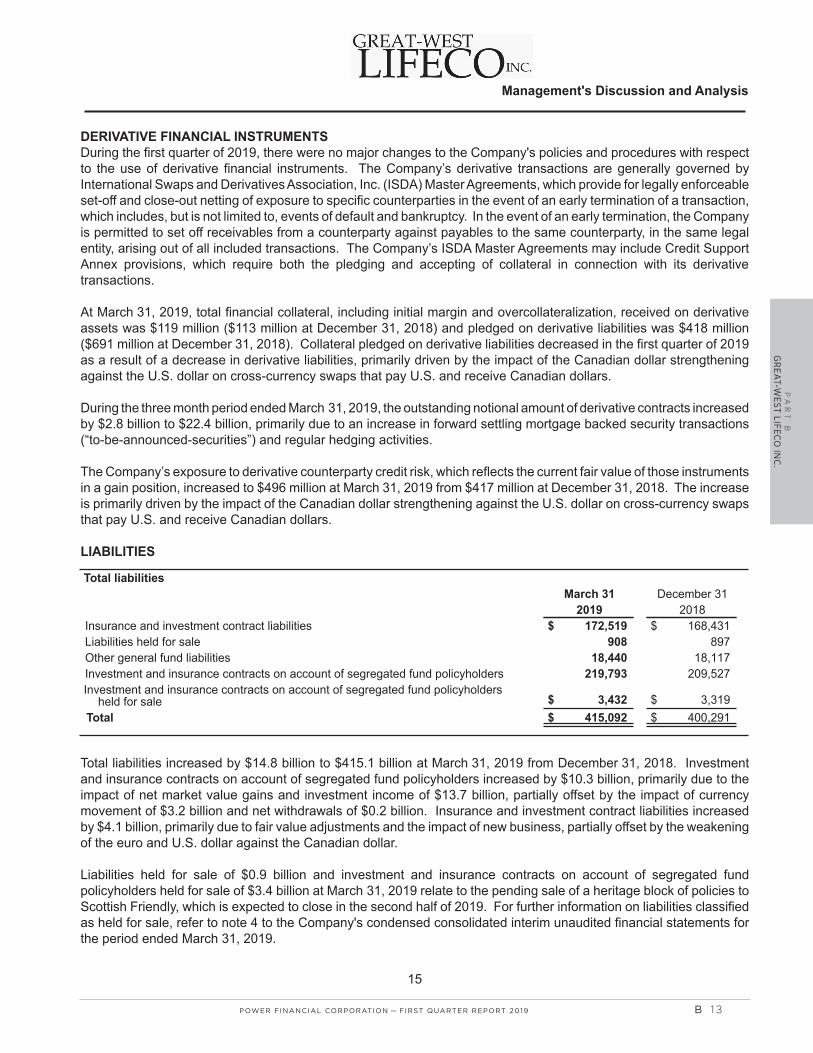
PA
RT
B
GR
EA
T-WE
ST LIFECO
INC
.
POWER FINANCIAL CORPORATION�— �FIRST QUARTER REPORT 2019 B 1 3
PFC_QUAT1_Eng02_GWL_2019-05-03_v1.indd C13PFC_QUAT1_Eng02_GWL_2019-05-03_v1.indd C13 19-05-10 6:53 AM19-05-10 6:53 AM

PA
RT
B
GR
EA
T-W
EST
LIF
ECO
INC
.
B 14 POWER FINANCIAL CORPORATION�— �FIRST QUARTER REPORT 2019�
PFC_QUAT1_Eng02_GWL_2019-05-03_v1.indd C14PFC_QUAT1_Eng02_GWL_2019-05-03_v1.indd C14 19-05-10 6:53 AM19-05-10 6:53 AM

PA
RT
B
GR
EA
T-WE
ST LIFECO
INC
.
POWER FINANCIAL CORPORATION�— �FIRST QUARTER REPORT 2019 B 1 5
PFC_QUAT1_Eng02_GWL_2019-05-03_v1.indd C15PFC_QUAT1_Eng02_GWL_2019-05-03_v1.indd C15 19-05-10 6:53 AM19-05-10 6:53 AM

PA
RT
B
GR
EA
T-W
EST
LIF
ECO
INC
.
B 16 POWER FINANCIAL CORPORATION�— �FIRST QUARTER REPORT 2019�
PFC_QUAT1_Eng02_GWL_2019-05-03_v1.indd C16PFC_QUAT1_Eng02_GWL_2019-05-03_v1.indd C16 19-05-10 6:53 AM19-05-10 6:53 AM

PA
RT
B
GR
EA
T-WE
ST LIFECO
INC
.
POWER FINANCIAL CORPORATION�— �FIRST QUARTER REPORT 2019 B 1 7
PFC_QUAT1_Eng02_GWL_2019-05-03_v1.indd C17PFC_QUAT1_Eng02_GWL_2019-05-03_v1.indd C17 19-05-10 6:53 AM19-05-10 6:53 AM

PA
RT
B
GR
EA
T-W
EST
LIF
ECO
INC
.
B 18 POWER FINANCIAL CORPORATION�— �FIRST QUARTER REPORT 2019�
PFC_QUAT1_Eng02_GWL_2019-05-03_v1.indd C18PFC_QUAT1_Eng02_GWL_2019-05-03_v1.indd C18 19-05-10 6:53 AM19-05-10 6:53 AM
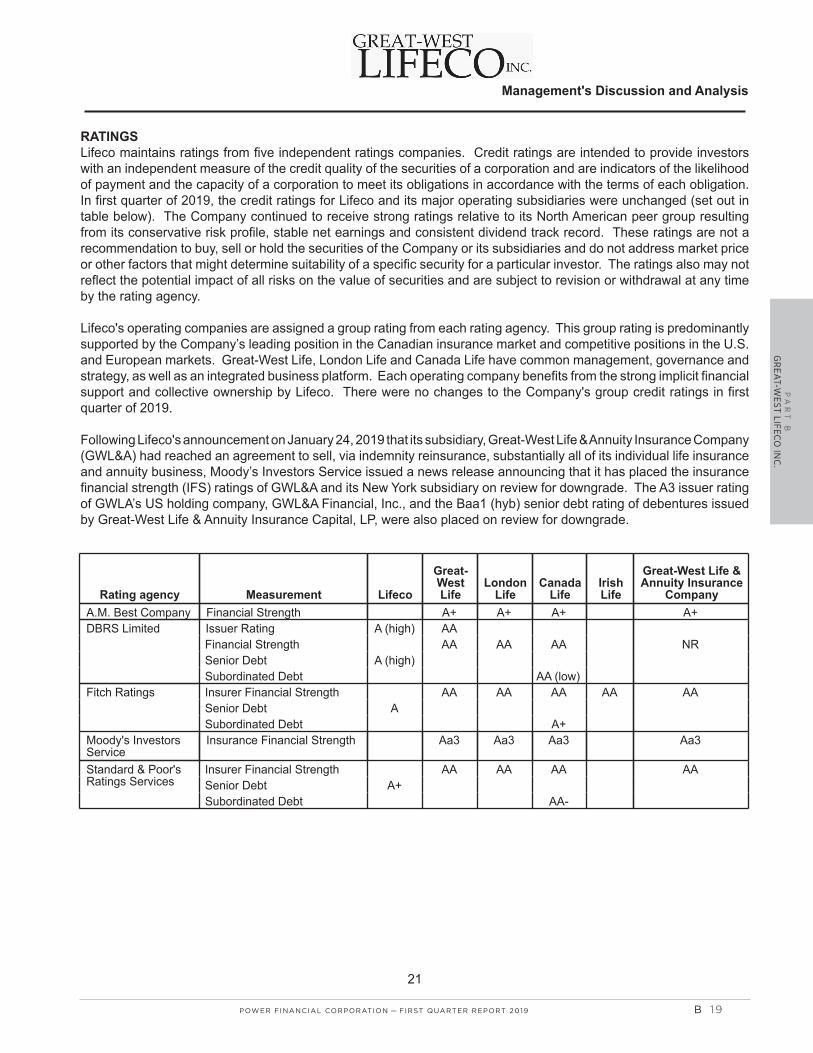
PA
RT
B
GR
EA
T-WE
ST LIFECO
INC
.
POWER FINANCIAL CORPORATION�— �FIRST QUARTER REPORT 2019 B 1 9
PFC_QUAT1_Eng02_GWL_2019-05-03_v1.indd C19PFC_QUAT1_Eng02_GWL_2019-05-03_v1.indd C19 19-05-10 6:53 AM19-05-10 6:53 AM

PA
RT
B
GR
EA
T-W
EST
LIF
ECO
INC
.
B 20 POWER FINANCIAL CORPORATION�— �FIRST QUARTER REPORT 2019�
PFC_QUAT1_Eng02_GWL_2019-05-03_v1.indd C20PFC_QUAT1_Eng02_GWL_2019-05-03_v1.indd C20 19-05-10 6:54 AM19-05-10 6:54 AM
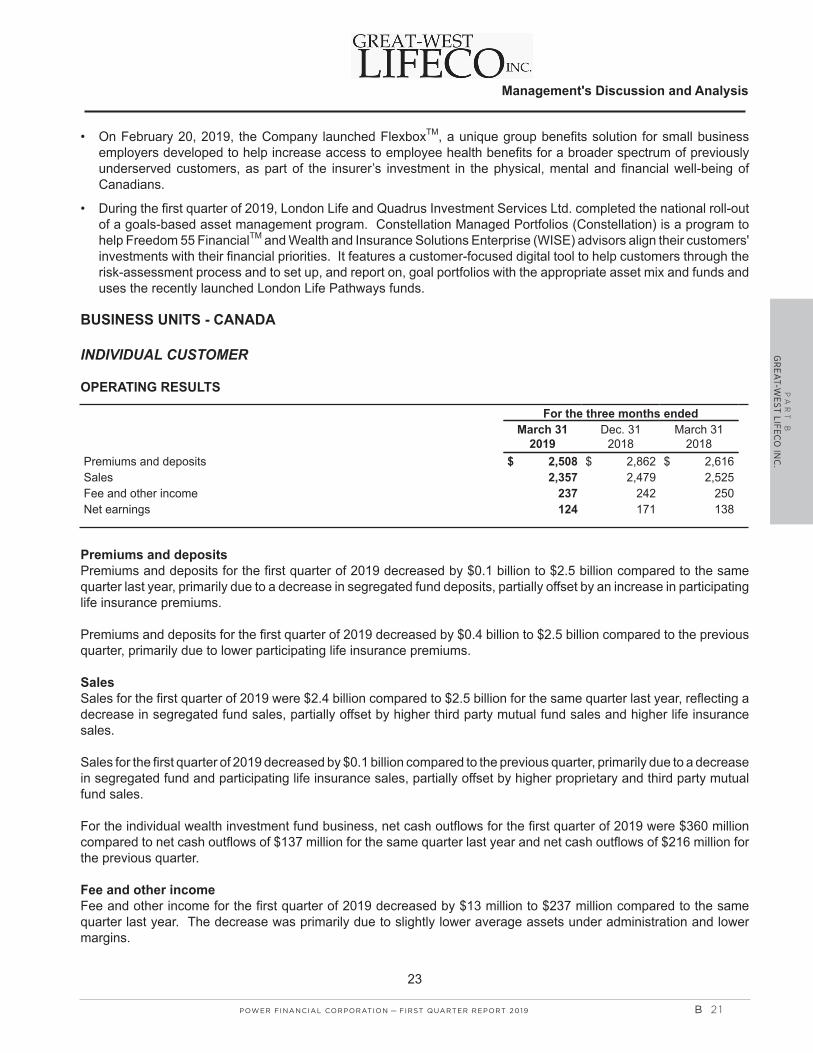
PA
RT
B
GR
EA
T-WE
ST LIFECO
INC
.
POWER FINANCIAL CORPORATION�— �FIRST QUARTER REPORT 2019 B 2 1
PFC_QUAT1_Eng02_GWL_2019-05-03_v1.indd C21PFC_QUAT1_Eng02_GWL_2019-05-03_v1.indd C21 19-05-10 6:54 AM19-05-10 6:54 AM

PA
RT
B
GR
EA
T-W
EST
LIF
ECO
INC
.
B 22 POWER FINANCIAL CORPORATION�— �FIRST QUARTER REPORT 2019�
PFC_QUAT1_Eng02_GWL_2019-05-03_v1.indd C22PFC_QUAT1_Eng02_GWL_2019-05-03_v1.indd C22 19-05-10 6:54 AM19-05-10 6:54 AM

PA
RT
B
GR
EA
T-WE
ST LIFECO
INC
.
POWER FINANCIAL CORPORATION�— �FIRST QUARTER REPORT 2019 B 23
PFC_QUAT1_Eng02_GWL_2019-05-03_v1.indd C23PFC_QUAT1_Eng02_GWL_2019-05-03_v1.indd C23 19-05-10 6:54 AM19-05-10 6:54 AM

PA
RT
B
GR
EA
T-W
EST
LIF
ECO
INC
.
B 24 POWER FINANCIAL CORPORATION�— �FIRST QUARTER REPORT 2019�
PFC_QUAT1_Eng02_GWL_2019-05-03_v1.indd C24PFC_QUAT1_Eng02_GWL_2019-05-03_v1.indd C24 19-05-10 6:54 AM19-05-10 6:54 AM

PA
RT
B
GR
EA
T-WE
ST LIFECO
INC
.
POWER FINANCIAL CORPORATION�— �FIRST QUARTER REPORT 2019 B 25
PFC_QUAT1_Eng02_GWL_2019-05-03_v1.indd C25PFC_QUAT1_Eng02_GWL_2019-05-03_v1.indd C25 19-05-10 6:54 AM19-05-10 6:54 AM

PA
RT
B
GR
EA
T-W
EST
LIF
ECO
INC
.
B 26 POWER FINANCIAL CORPORATION�— �FIRST QUARTER REPORT 2019�
PFC_QUAT1_Eng02_GWL_2019-05-03_v1.indd C26PFC_QUAT1_Eng02_GWL_2019-05-03_v1.indd C26 19-05-10 6:54 AM19-05-10 6:54 AM

PA
RT
B
GR
EA
T-WE
ST LIFECO
INC
.
POWER FINANCIAL CORPORATION�— �FIRST QUARTER REPORT 2019 B 27
PFC_QUAT1_Eng02_GWL_2019-05-03_v1.indd C27PFC_QUAT1_Eng02_GWL_2019-05-03_v1.indd C27 19-05-10 6:54 AM19-05-10 6:54 AM

PA
RT
B
GR
EA
T-W
EST
LIF
ECO
INC
.
B 28 POWER FINANCIAL CORPORATION�— �FIRST QUARTER REPORT 2019�
PFC_QUAT1_Eng02_GWL_2019-05-03_v1.indd C28PFC_QUAT1_Eng02_GWL_2019-05-03_v1.indd C28 19-05-10 6:54 AM19-05-10 6:54 AM

PA
RT
B
GR
EA
T-WE
ST LIFECO
INC
.
POWER FINANCIAL CORPORATION�— �FIRST QUARTER REPORT 2019 B 29
PFC_QUAT1_Eng02_GWL_2019-05-03_v1.indd C29PFC_QUAT1_Eng02_GWL_2019-05-03_v1.indd C29 19-05-10 6:54 AM19-05-10 6:54 AM
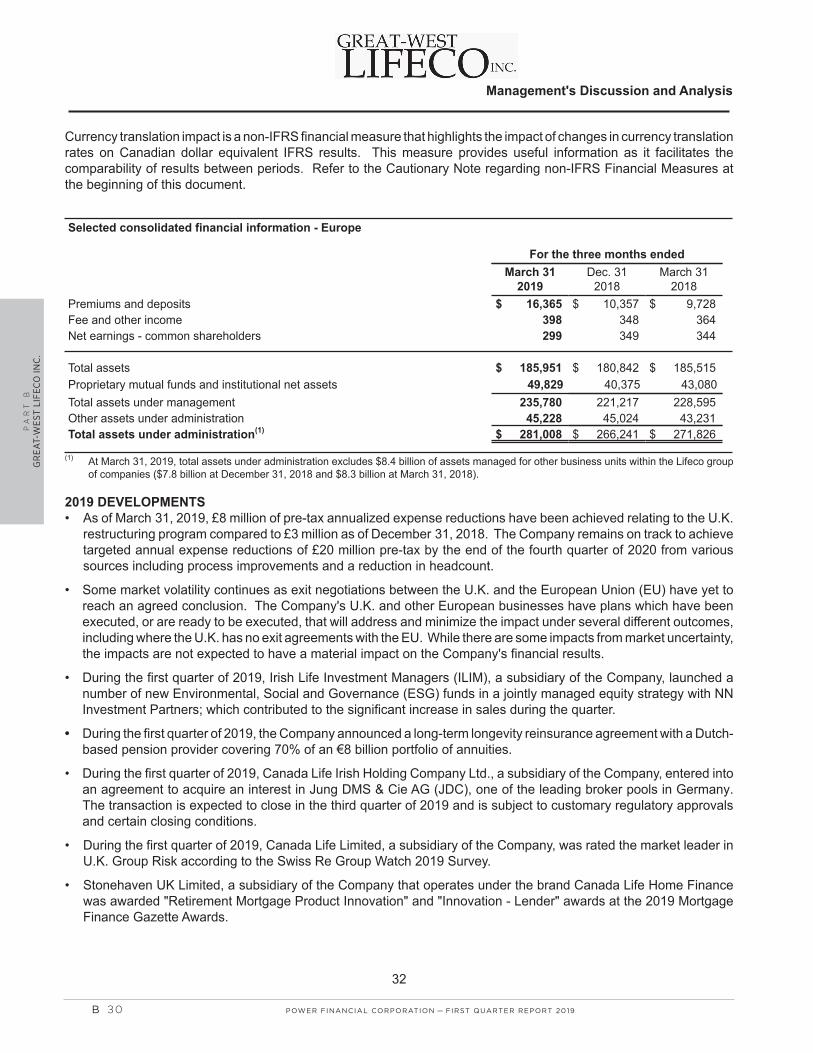
PA
RT
B
GR
EA
T-W
EST
LIF
ECO
INC
.
B 30 POWER FINANCIAL CORPORATION�— �FIRST QUARTER REPORT 2019�
PFC_QUAT1_Eng02_GWL_2019-05-03_v1.indd C30PFC_QUAT1_Eng02_GWL_2019-05-03_v1.indd C30 19-05-10 6:54 AM19-05-10 6:54 AM

PA
RT
B
GR
EA
T-WE
ST LIFECO
INC
.
POWER FINANCIAL CORPORATION�— �FIRST QUARTER REPORT 2019 B 3 1
PFC_QUAT1_Eng02_GWL_2019-05-03_v1.indd C31PFC_QUAT1_Eng02_GWL_2019-05-03_v1.indd C31 19-05-10 6:54 AM19-05-10 6:54 AM

PA
RT
B
GR
EA
T-W
EST
LIF
ECO
INC
.
B 32 POWER FINANCIAL CORPORATION�— �FIRST QUARTER REPORT 2019�
PFC_QUAT1_Eng02_GWL_2019-05-03_v1.indd C32PFC_QUAT1_Eng02_GWL_2019-05-03_v1.indd C32 19-05-10 6:54 AM19-05-10 6:54 AM

PA
RT
B
GR
EA
T-WE
ST LIFECO
INC
.
POWER FINANCIAL CORPORATION�— �FIRST QUARTER REPORT 2019 B 33
PFC_QUAT1_Eng02_GWL_2019-05-03_v1.indd C33PFC_QUAT1_Eng02_GWL_2019-05-03_v1.indd C33 19-05-10 6:54 AM19-05-10 6:54 AM

PA
RT
B
GR
EA
T-W
EST
LIF
ECO
INC
.
B 34 POWER FINANCIAL CORPORATION�— �FIRST QUARTER REPORT 2019�
PFC_QUAT1_Eng02_GWL_2019-05-03_v1.indd C34PFC_QUAT1_Eng02_GWL_2019-05-03_v1.indd C34 19-05-10 6:54 AM19-05-10 6:54 AM

PA
RT
B
GR
EA
T-WE
ST LIFECO
INC
.
POWER FINANCIAL CORPORATION�— �FIRST QUARTER REPORT 2019 B 35
PFC_QUAT1_Eng02_GWL_2019-05-03_v1.indd C35PFC_QUAT1_Eng02_GWL_2019-05-03_v1.indd C35 19-05-10 6:54 AM19-05-10 6:54 AM

PA
RT
B
GR
EA
T-W
EST
LIF
ECO
INC
.
B 36 POWER FINANCIAL CORPORATION�— �FIRST QUARTER REPORT 2019�
PFC_QUAT1_Eng02_GWL_2019-05-03_v1.indd C36PFC_QUAT1_Eng02_GWL_2019-05-03_v1.indd C36 19-05-10 6:54 AM19-05-10 6:54 AM
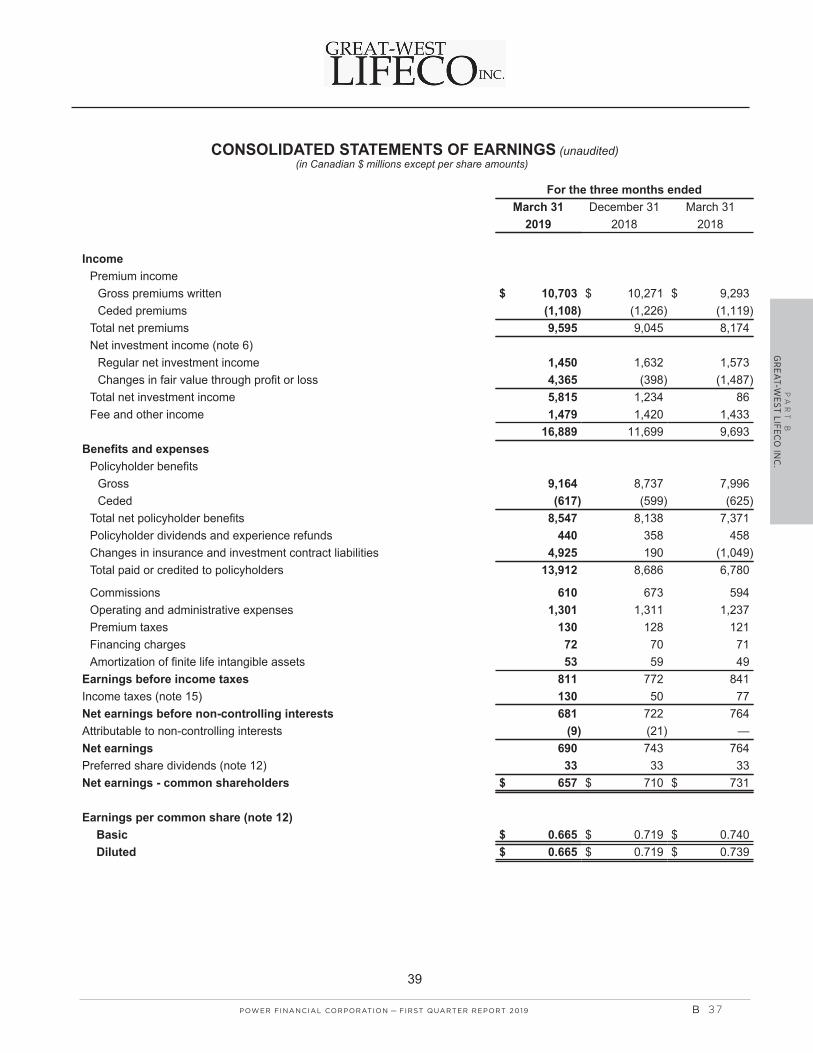
PA
RT
B
GR
EA
T-WE
ST LIFECO
INC
.
POWER FINANCIAL CORPORATION�— �FIRST QUARTER REPORT 2019 B 37
PFC_QUAT1_Eng02_GWL_2019-05-03_v1.indd C37PFC_QUAT1_Eng02_GWL_2019-05-03_v1.indd C37 19-05-10 6:54 AM19-05-10 6:54 AM
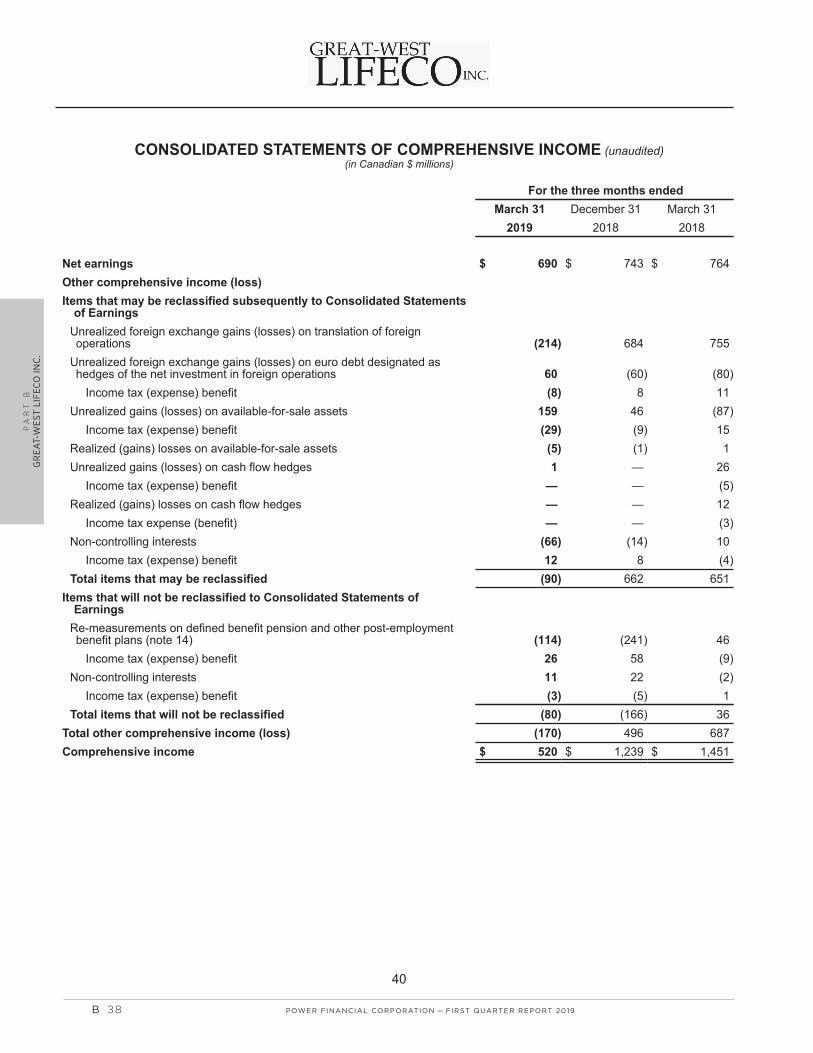
PA
RT
B
GR
EA
T-W
EST
LIF
ECO
INC
.
B 38 POWER FINANCIAL CORPORATION�— �FIRST QUARTER REPORT 2019�
PFC_QUAT1_Eng02_GWL_2019-05-03_v1.indd C38PFC_QUAT1_Eng02_GWL_2019-05-03_v1.indd C38 19-05-10 6:54 AM19-05-10 6:54 AM

PA
RT
B
GR
EA
T-WE
ST LIFECO
INC
.
POWER FINANCIAL CORPORATION�— �FIRST QUARTER REPORT 2019 B 39
PFC_QUAT1_Eng02_GWL_2019-05-03_v1.indd C39PFC_QUAT1_Eng02_GWL_2019-05-03_v1.indd C39 19-05-10 6:54 AM19-05-10 6:54 AM

PA
RT
B
GR
EA
T-W
EST
LIF
ECO
INC
.
B 40 POWER FINANCIAL CORPORATION�— �FIRST QUARTER REPORT 2019�
PFC_QUAT1_Eng02_GWL_2019-05-03_v1.indd C40PFC_QUAT1_Eng02_GWL_2019-05-03_v1.indd C40 19-05-10 6:54 AM19-05-10 6:54 AM

PA
RT
B
GR
EA
T-WE
ST LIFECO
INC
.
POWER FINANCIAL CORPORATION�— �FIRST QUARTER REPORT 2019 B 41
PFC_QUAT1_Eng02_GWL_2019-05-03_v1.indd C41PFC_QUAT1_Eng02_GWL_2019-05-03_v1.indd C41 19-05-10 6:54 AM19-05-10 6:54 AM

PA
RT
B
GR
EA
T-W
EST
LIF
ECO
INC
.
B 42 POWER FINANCIAL CORPORATION�— �FIRST QUARTER REPORT 2019�
PFC_QUAT1_Eng02_GWL_2019-05-03_v1.indd C42PFC_QUAT1_Eng02_GWL_2019-05-03_v1.indd C42 19-05-10 6:54 AM19-05-10 6:54 AM

PA
RT
B
GR
EA
T-WE
ST LIFECO
INC
.
POWER FINANCIAL CORPORATION�— �FIRST QUARTER REPORT 2019 B 43
PFC_QUAT1_Eng02_GWL_2019-05-03_v1.indd C43PFC_QUAT1_Eng02_GWL_2019-05-03_v1.indd C43 19-05-10 6:54 AM19-05-10 6:54 AM

PA
RT
B
GR
EA
T-W
EST
LIF
ECO
INC
.
B 44 POWER FINANCIAL CORPORATION�— �FIRST QUARTER REPORT 2019�
PFC_QUAT1_Eng02_GWL_2019-05-03_v1.indd C44PFC_QUAT1_Eng02_GWL_2019-05-03_v1.indd C44 19-05-10 6:54 AM19-05-10 6:54 AM

PA
RT
B
GR
EA
T-WE
ST LIFECO
INC
.
POWER FINANCIAL CORPORATION�— �FIRST QUARTER REPORT 2019 B 45
PFC_QUAT1_Eng02_GWL_2019-05-03_v1.indd C45PFC_QUAT1_Eng02_GWL_2019-05-03_v1.indd C45 19-05-10 6:54 AM19-05-10 6:54 AM

PA
RT
B
GR
EA
T-W
EST
LIF
ECO
INC
.
B 46 POWER FINANCIAL CORPORATION�— �FIRST QUARTER REPORT 2019�
PFC_QUAT1_Eng02_GWL_2019-05-03_v1.indd C46PFC_QUAT1_Eng02_GWL_2019-05-03_v1.indd C46 19-05-10 6:54 AM19-05-10 6:54 AM

PA
RT
B
GR
EA
T-WE
ST LIFECO
INC
.
POWER FINANCIAL CORPORATION�— �FIRST QUARTER REPORT 2019 B 47
PFC_QUAT1_Eng02_GWL_2019-05-03_v1.indd C47PFC_QUAT1_Eng02_GWL_2019-05-03_v1.indd C47 19-05-10 6:54 AM19-05-10 6:54 AM

PA
RT
B
GR
EA
T-W
EST
LIF
ECO
INC
.
B 48 POWER FINANCIAL CORPORATION�— �FIRST QUARTER REPORT 2019�
PFC_QUAT1_Eng02_GWL_2019-05-03_v1.indd C48PFC_QUAT1_Eng02_GWL_2019-05-03_v1.indd C48 19-05-10 6:54 AM19-05-10 6:54 AM
PA
RT
B
GR
EA
T-WE
ST LIFECO
INC
.
POWER FINANCIAL CORPORATION�— �FIRST QUARTER REPORT 2019 B 49
PFC_QUAT1_Eng02_GWL_2019-05-03_v1.indd C49PFC_QUAT1_Eng02_GWL_2019-05-03_v1.indd C49 19-05-10 6:54 AM19-05-10 6:54 AM

PA
RT
B
GR
EA
T-W
EST
LIF
ECO
INC
.
B 50 POWER FINANCIAL CORPORATION�— �FIRST QUARTER REPORT 2019�
PFC_QUAT1_Eng02_GWL_2019-05-03_v1.indd C50PFC_QUAT1_Eng02_GWL_2019-05-03_v1.indd C50 19-05-10 6:54 AM19-05-10 6:54 AM

PA
RT
B
GR
EA
T-WE
ST LIFECO
INC
.
POWER FINANCIAL CORPORATION�— �FIRST QUARTER REPORT 2019 B 5 1
PFC_QUAT1_Eng02_GWL_2019-05-03_v1.indd C51PFC_QUAT1_Eng02_GWL_2019-05-03_v1.indd C51 19-05-10 6:54 AM19-05-10 6:54 AM

PA
RT
B
GR
EA
T-W
EST
LIF
ECO
INC
.
B 52 POWER FINANCIAL CORPORATION�— �FIRST QUARTER REPORT 2019�
PFC_QUAT1_Eng02_GWL_2019-05-03_v1.indd C52PFC_QUAT1_Eng02_GWL_2019-05-03_v1.indd C52 19-05-10 6:54 AM19-05-10 6:54 AM

PA
RT
B
GR
EA
T-WE
ST LIFECO
INC
.
POWER FINANCIAL CORPORATION�— �FIRST QUARTER REPORT 2019 B 53
PFC_QUAT1_Eng02_GWL_2019-05-03_v1.indd C53PFC_QUAT1_Eng02_GWL_2019-05-03_v1.indd C53 19-05-10 6:54 AM19-05-10 6:54 AM

PA
RT
B
GR
EA
T-W
EST
LIF
ECO
INC
.
B 54 POWER FINANCIAL CORPORATION�— �FIRST QUARTER REPORT 2019�
PFC_QUAT1_Eng02_GWL_2019-05-03_v1.indd C54PFC_QUAT1_Eng02_GWL_2019-05-03_v1.indd C54 19-05-10 6:54 AM19-05-10 6:54 AM

PA
RT
B
GR
EA
T-WE
ST LIFECO
INC
.
POWER FINANCIAL CORPORATION�— �FIRST QUARTER REPORT 2019 B 55
PFC_QUAT1_Eng02_GWL_2019-05-03_v1.indd C55PFC_QUAT1_Eng02_GWL_2019-05-03_v1.indd C55 19-05-10 6:54 AM19-05-10 6:54 AM

PA
RT
B
GR
EA
T-W
EST
LIF
ECO
INC
.
B 56 POWER FINANCIAL CORPORATION�— �FIRST QUARTER REPORT 2019�
PFC_QUAT1_Eng02_GWL_2019-05-03_v1.indd C56PFC_QUAT1_Eng02_GWL_2019-05-03_v1.indd C56 19-05-10 6:54 AM19-05-10 6:54 AM

PA
RT
B
GR
EA
T-WE
ST LIFECO
INC
.
POWER FINANCIAL CORPORATION�— �FIRST QUARTER REPORT 2019 B 57
PFC_QUAT1_Eng02_GWL_2019-05-03_v1.indd C57PFC_QUAT1_Eng02_GWL_2019-05-03_v1.indd C57 19-05-10 6:54 AM19-05-10 6:54 AM

PA
RT
B
GR
EA
T-W
EST
LIF
ECO
INC
.
B 58 POWER FINANCIAL CORPORATION�— �FIRST QUARTER REPORT 2019�
PFC_QUAT1_Eng02_GWL_2019-05-03_v1.indd C58PFC_QUAT1_Eng02_GWL_2019-05-03_v1.indd C58 19-05-10 6:54 AM19-05-10 6:54 AM

PA
RT
B
GR
EA
T-WE
ST LIFECO
INC
.
POWER FINANCIAL CORPORATION�— �FIRST QUARTER REPORT 2019 B 59
PFC_QUAT1_Eng02_GWL_2019-05-03_v1.indd C59PFC_QUAT1_Eng02_GWL_2019-05-03_v1.indd C59 19-05-10 6:54 AM19-05-10 6:54 AM

PA
RT
B
GR
EA
T-W
EST
LIF
ECO
INC
.
B 60 POWER FINANCIAL CORPORATION�— �FIRST QUARTER REPORT 2019�
PFC_QUAT1_Eng02_GWL_2019-05-03_v1.indd C60PFC_QUAT1_Eng02_GWL_2019-05-03_v1.indd C60 19-05-10 6:54 AM19-05-10 6:54 AM

PA
RT
B
GR
EA
T-WE
ST LIFECO
INC
.
POWER FINANCIAL CORPORATION�— �FIRST QUARTER REPORT 2019 B 61
PFC_QUAT1_Eng02_GWL_2019-05-03_v1.indd C61PFC_QUAT1_Eng02_GWL_2019-05-03_v1.indd C61 19-05-10 6:54 AM19-05-10 6:54 AM

PA
RT
B
GR
EA
T-W
EST
LIF
ECO
INC
.
B 62 POWER FINANCIAL CORPORATION�— �FIRST QUARTER REPORT 2019�
PFC_QUAT1_Eng02_GWL_2019-05-03_v1.indd C62PFC_QUAT1_Eng02_GWL_2019-05-03_v1.indd C62 19-05-10 6:54 AM19-05-10 6:54 AM

PA
RT
B
GR
EA
T-WE
ST LIFECO
INC
.
POWER FINANCIAL CORPORATION�— �FIRST QUARTER REPORT 2019 B 63
PFC_QUAT1_Eng02_GWL_2019-05-03_v1.indd C63PFC_QUAT1_Eng02_GWL_2019-05-03_v1.indd C63 19-05-10 6:54 AM19-05-10 6:54 AM

PA
RT
B
GR
EA
T-W
EST
LIF
ECO
INC
.
B 64 POWER FINANCIAL CORPORATION�— �FIRST QUARTER REPORT 2019�
PFC_QUAT1_Eng02_GWL_2019-05-03_v1.indd C64PFC_QUAT1_Eng02_GWL_2019-05-03_v1.indd C64 19-05-10 6:54 AM19-05-10 6:54 AM

PA
RT
B
GR
EA
T-WE
ST LIFECO
INC
.
POWER FINANCIAL CORPORATION�— �FIRST QUARTER REPORT 2019 B 65
PFC_QUAT1_Eng02_GWL_2019-05-03_v1.indd C65PFC_QUAT1_Eng02_GWL_2019-05-03_v1.indd C65 19-05-10 6:54 AM19-05-10 6:54 AM

PA
RT
B
GR
EA
T-W
EST
LIF
ECO
INC
.
B 66 POWER FINANCIAL CORPORATION�— �FIRST QUARTER REPORT 2019�
PFC_QUAT1_Eng02_GWL_2019-05-03_v1.indd C66PFC_QUAT1_Eng02_GWL_2019-05-03_v1.indd C66 19-05-10 6:54 AM19-05-10 6:54 AM
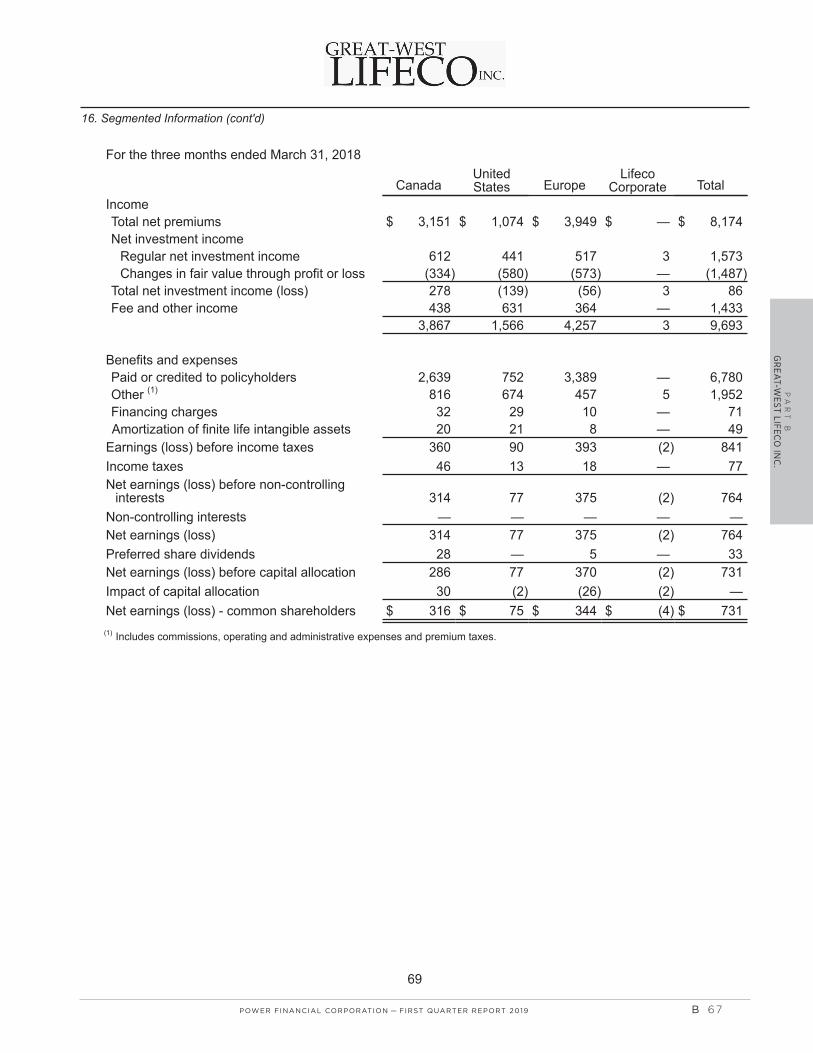
PA
RT
B
GR
EA
T-WE
ST LIFECO
INC
.
POWER FINANCIAL CORPORATION�— �FIRST QUARTER REPORT 2019 B 67
PFC_QUAT1_Eng02_GWL_2019-05-03_v1.indd C67PFC_QUAT1_Eng02_GWL_2019-05-03_v1.indd C67 19-05-10 6:54 AM19-05-10 6:54 AM

Page intentionally left blank.
B 68 POWER FINANCIAL CORPORATION�— �FIRST QUARTER REPORT 2019�
PFC_QUAT1_Eng02_GWL_2019-05-03_v1.indd C68PFC_QUAT1_Eng02_GWL_2019-05-03_v1.indd C68 19-05-10 6:54 AM19-05-10 6:54 AM

PA
RT
C
IGM
FINA
NC
IAL IN
C.
MANAGEMENT’S DISCUSSION AND ANALYSIS
PAG E C 2
FINANCIAL STATEMENTS AND NOTES
PAG E C 46
Please note that the bottom of each page in Part C contains two diff erent page numbers. A page number with the prefi x “C” refers to the number of such page in this document and the page number without any prefi x refers to the number of such page in the original document issued by IGM Financial Inc.
The attached documents concerning IGM Financial Inc. are documents prepared and publicly disclosed by such subsidiary. Certain statements in the attached documents, other than statements of historical fact, are forward-looking statements based on certain assumptions and refl ect the current expectations of the subsidiary as set forth therein. Forward-looking statements are provided for the purposes of assisting the reader in understanding the subsidiary’s fi nancial performance, fi nancial position and cash fl ows as at and for the periods ended on certain dates and to present information about the subsidiary’s management’s current expectations and plans relating to the future and the reader is cautioned that such statements may not be appropriate for other purposes.
By its nature, forward-looking information is subject to inherent risks and uncertainties that may be general or specifi c and which give rise to the possibility that expectations, forecasts, predictions, projections or conclusions will not prove to be accurate, that assumptions may not be correct and that objectives, strategic goals and priorities will not be achieved.
For further information provided by the subsidiary as to the material factors that could cause actual results to diff er materially from the content of forward-looking statements, the material factors and assumptions that were applied in making the forward-looking statements, and the subsidiary’s policy for updating the content of forward-looking statements, please see the attached documents, including the section entitled Forward-Looking Statements. The reader is cautioned to consider these factors and assumptions carefully and not to put undue reliance on forward-looking statements.
IGM FINANCIAL INC.
PART C
POWER FINANCIAL CORPORATION�— �FIRST QUARTER REPORT 2019 C 1
PFC_QUAT1_Eng03_IGM_2019-05-03_v1.indd D1PFC_QUAT1_Eng03_IGM_2019-05-03_v1.indd D1 19-05-10 6:53 AM19-05-10 6:53 AM

PA
RT
C
IGM
FIN
AN
CIA
L IN
C.
IGM FINANCIAL INC. FIRST QUARTER REPORT 2019 / MANAGEMENT’S DISCUSSION AND ANALYSIS 5
MANAGEMENT’S DISCUSSION AND ANALYSIS
The Management’s Discussion and Analysis (MD&A) presents management’s view of the results of operations and financial condition of IGM Financial Inc. (IGM Financial or the Company) as at and for the three months ended March 31, 2019 and should be read in conjunction with the unaudited Interim Condensed Consolidated Financial Statements (Interim Financial Statements) as well as the 2018 IGM Financial Inc. Annual Report filed on www.sedar.com. Commentary in the MD&A as at and for the three months ended March 31, 2019 is as of May 3, 2019.
Certain statements in this report, other than statements of historical fact, are forward-looking statements based on certain assumptions and reflect IGM Financial’s current expectations. Forward-looking statements are provided to assist the reader in understanding the Company’s financial position and results of operations as at and for the periods ended on certain dates and to present information about management’s current expectations and plans relating to the future. Readers are cautioned that such statements may not be appropriate for other purposes. These statements may include, without limitation, statements regarding the operations, business, financial condition, expected financial results, performance, prospects, opportunities, priorities, targets, goals, ongoing objectives, strategies and outlook of the Company, as well as the outlook for North American and international economies, for the current fiscal year and subsequent periods. Forward-looking statements include statements that are predictive in nature, depend upon or refer to future events or conditions, or include words such as “expects”, “anticipates”, “plans”, “believes”, “estimates”, “seeks”, “intends”, “targets”, “projects”, “forecasts” or negative versions thereof and other similar expressions, or future or conditional verbs such as “may”, “will”, “should”, “would” and “could”.
This information is based upon certain material factors or assumptions that were applied in drawing a conclusion or making a forecast or projection as reflected in the forward-looking statements, including the perception of historical trends, current conditions and expected future developments, as well as other factors that are believed to be appropriate in the circumstances. While the Company considers these assumptions to be reasonable based on information currently available to management, they may prove to be incorrect.
By its nature, this information is subject to inherent risks and uncertainties that may be general or specific and which give rise to the possibility that expectations, forecasts, predictions, projections or conclusions will not prove to be accurate, that assumptions may not be correct and that objectives, strategic goals and priorities will not be achieved.
A variety of material factors, many of which are beyond the Company’s and its subsidiaries’ control, affect the operations, performance and results of the Company, and
its subsidiaries, and their businesses, and could cause actual results to differ materially from current expectations of estimated or anticipated events or results. These factors include, but are not limited to: the impact or unanticipated impact of general economic, political and market factors in North America and internationally, interest and foreign exchange rates, global equity and capital markets, management of market liquidity and funding risks, changes in accounting policies and methods used to report financial condition (including uncertainties associated with critical accounting assumptions and estimates), the effect of applying future accounting changes, operational and reputational risks, business competition, technological change, changes in government regulations and legislation, changes in tax laws, unexpected judicial or regulatory proceedings, catastrophic events, the Company’s ability to complete strategic transactions, integrate acquisitions and implement other growth strategies, and the Company’s and its subsidiaries’ success in anticipating and managing the foregoing factors.
The reader is cautioned that the foregoing list is not exhaustive of the factors that may affect any of the Company’s forward-looking statements. The reader is also cautioned to consider these and other factors, uncertainties and potential events carefully and not place undue reliance on forward-looking statements.
Other than as specifically required by applicable Canadian law, the Company undertakes no obligation to update any forward-looking statements to reflect events or circumstances after the date on which such statements are made, or to reflect the occurrence of unanticipated events, whether as a result of new information, future events or results, or otherwise.
Additional information about the risks and uncertainties of the Company’s business and material factors or assumptions on which information contained in forward-looking statements is based is provided in its disclosure materials, including this Management’s Discussion and Analysis and its most recent Annual Information Form, filed with the securities regulatory authorities in Canada, available at www.sedar.com.
FORWARD-LOOKING STATEMENTS
BASIS OF PRESENTATION AND SUMMARY OF ACCOUNTING POLICIES
The Interim Financial Statements of IGM Financial, which are the basis of the information presented in the Company’s MD&A, have been prepared in accordance with International Accounting Standard 34, Interim Financial Reporting (IFRS) and are presented in Canadian dollars (Note 2 of the Interim Financial Statements).
Net earnings available to common shareholders, which is an additional measure in accordance with IFRS, may be subdivided into two components consisting of:
• Adjusted net earnings available to common shareholders; and
• Other items, which include the after-tax impact of any item that management considers to be of a non-recurring nature or that could make the period-over-period comparison of results from operations less meaningful.
“Adjusted net earnings available to common shareholders”, “adjusted diluted earnings per share” (EPS) and “adjusted return on average common equity” (ROE) are non-IFRS financial measures which are used to provide management and investors with additional measures to assess earnings performance. These non-IFRS financial measures do not have standard meanings prescribed by IFRS and may not be directly comparable to similar measures used by other companies.
“Earnings before interest and taxes” (EBIT), “earnings before interest, taxes, depreciation and amortization before sales commissions” (EBITDA before sales commissions), and “earnings before interest, taxes, depreciation and amortization after sales commissions” (EBITDA after sales commissions) are also non-IFRS financial measures. EBIT, EBITDA before sales commissions and EBITDA after sales commissions are alternative measures
of performance utilized by management, investors and investment analysts to evaluate and analyze the Company’s results. The two EBITDA measures have been introduced following the adoption of IFRS 15. EBITDA before sales commissions excludes all mutual fund sales commissions and is comparable to prior periods. EBITDA after sales commissions includes all sales commissions and highlights aggregate cash flows. Other items of a non-recurring nature, or that could make the period-over-period comparison of results from operations less meaningful, are further excluded to arrive at EBITDA before sales commissions and EBITDA after sales commissions. These non-IFRS financial measures do not have standard meanings prescribed by IFRS and may not be directly comparable to similar measures used by other companies.
“Earnings before income taxes” and “net earnings available to common shareholders” are additional IFRS measures which are used to provide management and investors with additional measures to assess earnings performance. These measures are considered additional IFRS measures as they are in addition to the minimum line items required by IFRS and are relevant to an understanding of the entity’s financial performance.
Refer to the appropriate reconciliations of non-IFRS financial measures to reported results in accordance with IFRS in Tables 1, 2 and 3.
NON-IFRS FINANCIAL MEASURES AND ADDITIONAL IFRS MEASURES
C 2 POWER FINANCIAL CORPORATION�— �FIRST QUARTER REPORT 2019�
PFC_QUAT1_Eng03_IGM_2019-05-03_v1.indd D2PFC_QUAT1_Eng03_IGM_2019-05-03_v1.indd D2 19-05-10 6:53 AM19-05-10 6:53 AM

PA
RT
C
IGM
FINA
NC
IAL IN
C.
6 IGM FINANCIAL INC. FIRST QUARTER REPORT 2019 / MANAGEMENT’S DISCUSSION AND ANALYSIS
IGM FINANCIAL INC.SUMMARY OF CONSOLIDATED OPERATING RESULTS
IGM Financial Inc. (TSX:IGM) is a leading wealth and asset management company. The Company’s principal businesses are Investors Group Inc. and Mackenzie Financial Corporation, each operating distinctly primarily within the advice segment of the financial services market.
Total assets under management, which were at the highest quarter end level in the history of the Company, were $160.5 billion at March 31, 2019 compared with $155.8 billion at March 31, 2018 and $149.1 billion at December 31, 2018. Average total assets under management for the first quarter of 2019 were $155.9 billion compared to $156.8 billion in the first quarter of 2018.
Investment fund assets under management, also at the highest quarter-end level, were $154.3 billion at March 31, 2019 compared with $149.2 billion at March 31, 2018 and $143.3 billion at December 31, 2018. Average investment fund assets under management for the first quarter of 2019 were $149.9 billion compared to $150.1 billion in the first quarter of 2018.
The increase in assets under management was primarily due to increases in the level of financial markets.
Net earnings available to common shareholders for the three months ended March 31, 2019 were $167.5 million or 70 cents per share compared with net earnings available to common shareholders of $185.5 million or 77 cents per share for the comparative period in 2018.
Shareholders’ equity was $4.5 billion as at March 31, 2019, compared to $4.6 billion at December 31, 2018. Return on average common equity for the three months ended March 31, 2019 was 15.2% compared with 17.5% for the comparative period in 2018. The quarterly dividend per common share declared in the first quarter of 2019 was 56.25 cents, unchanged from the fourth quarter of 2018.
CAPITAL MANAGEMENT ACTIVITIESIGM Financial initiated a number of capital and liquidity transactions in the first quarter of 2019, including:
• The issuance of $250.0 million 4.206% debentures maturing on March 21, 2050.
• Part of the proceeds from the issuance of the $250.0 million debentures was used to fund the redemption of the $150.0 million issued and outstanding 5.90% Non-Cumulative First Preferred Shares, Series B on April 30, 2019.
• The Company commenced a normal course issuer bid on March 26, 2019 to purchase up to 4 million of its common shares to provide the flexibility to manage its capital position
while generating value for shareholders. In connection with its normal course issuer bid, the Company has established an automatic securities purchase plan for its common shares. The automatic securities purchase plan provides standard instructions regarding how IGM Financial’s common shares are to be purchased under its normal course issuer bid during certain pre-determined trading blackout periods. Outside of these pre-determined trading blackout periods, purchases under the Company’s normal course issuer bid will be completed based upon management’s discretion.
In April 2019, the Company participated on a proportionate basis in the Great-West Lifeco (Lifeco) substantial issuer bid by selling 2,400,255 of its shares for proceeds of $80.4 million. The Company’s 4% interest in Lifeco remains substantially unchanged.
PERSONAL CAPITALIn January 2019, the Company made an additional investment in Personal Capital Corporation (Personal Capital) of $66.8 million which increased its voting interest to 22.7% resulting in the reclassification of $217.0 million on the Consolidated Balance Sheet from Corporate investments to Investments in associates. As a result, the Company now uses the equity method of accounting for its 25.2% equity interest in Personal Capital.
ADOPTION OF IFRS 16 LEASESOn January 1, 2019, the Company adopted IFRS 16, Leases, which resulted in recognition of a right-of-use asset related to the Company’s property leases and a corresponding lease obligation. Previously, the Company expensed total lease payments in non-commission expense. Under IFRS 16, lease related expenses are recognized as amortization in non-commission expense and interest in interest expense (Note 2 to the Interim Financial Statements).
The adoption of IFRS 16 results in a change to timing of non-commission expenses but has no effect on cash flows of the Company.
Non-commission expense in the first quarter of 2019 was $0.9 million lower and interest expense was $1.1 million higher as a result of the adoption of IFRS 16. If IFRS 16 had been applied retrospectively, non-commission expense in the first quarter of 2018 would have been $0.1 million lower and interest expense $1.0 million higher.
IFRS 16 impacts EBITDA as the expenses are now categorized as amortization and interest expenses, which are excluded from EBITDA. Previously, the cash payments were expensed and included within EBITDA.
POWER FINANCIAL CORPORATION�— �FIRST QUARTER REPORT 2019 C 3
PFC_QUAT1_Eng03_IGM_2019-05-03_v1.indd D3PFC_QUAT1_Eng03_IGM_2019-05-03_v1.indd D3 19-05-10 6:53 AM19-05-10 6:53 AM

PA
RT
C
IGM
FIN
AN
CIA
L IN
C.
IGM FINANCIAL INC. FIRST QUARTER REPORT 2019 / MANAGEMENT’S DISCUSSION AND ANALYSIS 7
In the first quarter of 2019, EBITDA before sales commissions increased by $6.6 million to $295.9 million as a result of IFRS 16. If IFRS 16 had been applied retroactively, EBITDA before sales commission for the first quarter of 2018, would have increased by $5.4 million to $338.6 million.
REPORTABLE SEGMENTSIGM Financial’s reportable segments are:
• IG Wealth Management (IG Wealth Management or IG)
• Mackenzie Investments (Mackenzie Investments or Mackenzie)
• Corporate and Other
These segments, as shown in Tables 2 and 3 reflect the Company’s internal financial reporting and performance measurement.
Certain items reflected in Tables 2 and 3 are not allocated to segments:
• Interest expense – represents interest expense on long-term debt and, in 2019 also includes interest expense on leases of $1.1 million as a result of the adoption of IFRS 16, Leases. The change in interest expense in the period also resulted from the impact of the following transactions:
– The redemption of $150 million 6.58% debentures on March 7, 2018;
– The issuance of $200 million 4.174% debentures on July 11, 2018;
– The early redemption of $375 million 7.35% debentures on August 10, 2018, and;
– The issuance of $250 million 4.206% debentures on March 20, 2019.
• Income taxes – changes in the effective tax rates are shown in Table 4.
Tax planning may result in the Company recording lower levels of income taxes. Management monitors the status of its income tax filings and regularly assesses the overall adequacy of its provision for income taxes and, as a result, income taxes recorded in prior years may be adjusted in the current year. The effect of changes in management’s best estimates reported in adjusted net earnings is reflected in Other items, which also includes, but is not limited to, the effect of lower effective income tax rates on foreign operations.
• Perpetual preferred share dividends – represents the dividends declared on the Company’s 5.90% non-cumulative first preferred shares.
TABLE 1: RECONCILIATION OF NON-IFRS FINANCIAL MEASURES
2019 2018 2018 THREE MONTHS ENDED MARCH 31 DECEMBER 31 MARCH 31 ($ millions) EARNINGS EPS(1) EARNINGS EPS(1) EARNINGS EPS(1)
Net earnings available to common shareholders – IFRS $ 167.5 $ 0.70 $ 179.9 $ 0.75 $ 185.5 $ 0.77
EBITDA before sales commissions – Non-IFRS measure $ 295.9 $ 296.8 $ 333.2 Sales-based commissions paid (43.7) (41.2) (62.3)
EBITDA after sales commissions – Non-IFRS measure 252.2 255.6 270.9 Sales-based commissions paid subject to amortization 12.6 13.2 16.3 Amortization of capitalized sales commissions (4.8) (4.3) (2.9) Amortization of capital assets and intangible assets and other(2) (20.0) (14.4) (13.9) Interest expense(3) (25.2) (24.1) (30.3)
Earnings before income taxes 214.8 226.0 240.1 Income taxes (45.1) (43.9) (52.4) Perpetual preferred share dividends (2.2) (2.2) (2.2)
Net earnings available to common shareholders – IFRS $ 167.5 $ 179.9 $ 185.5
(1) Diluted earnings per share
(2) Amortization expense includes amortization on capital assets and intangible assets and in 2019 also includes amortization on right-of-use assets of $5.7 million as a result of the Company’s adoption of IFRS 16, Leases.
(3) Interest expense includes interest on long-term debt and in 2019 also includes interest on leases of $1.1 million as a result of the Company’s adoption of IFRS 16, Leases.
C 4 POWER FINANCIAL CORPORATION�— �FIRST QUARTER REPORT 2019�
PFC_QUAT1_Eng03_IGM_2019-05-03_v1.indd D4PFC_QUAT1_Eng03_IGM_2019-05-03_v1.indd D4 19-05-10 6:53 AM19-05-10 6:53 AM

PA
RT
C
IGM
FINA
NC
IAL IN
C.
8 IGM FINANCIAL INC. FIRST QUARTER REPORT 2019 / MANAGEMENT’S DISCUSSION AND ANALYSIS
TABLE 3: CONSOLIDATED OPERATING RESULTS BY SEGMENT – Q1 2019 VS. Q4 2018
IG WEALTH MANAGEMENT MACKENZIE INVESTMENTS CORPORATE & OTHER TOTAL THREE MONTHS ENDED 2019 2018 2019 2018 2019 2018 2019 2018 ($ millions) MAR. 31 DEC. 31 MAR. 31 DEC. 31 MAR. 31 DEC. 31 MAR. 31 DEC. 31
Revenues Fee income $ 473.2 $ 477.0 $ 193.0 $ 195.1 $ 70.0 $ 71.6 $ 736.2 $ 743.7 Net investment income and other 10.0 11.0 4.2 (3.1) 38.7 39.9 52.9 47.8
483.2 488.0 197.2 192.0 108.7 111.5 789.1 791.5
Expenses Commission 157.0 156.3 72.5 69.7 45.2 46.4 274.7 272.4 Non-Commission(1) 162.9 159.6 88.8 86.9 22.7 22.5 274.4 269.0
319.9 315.9 161.3 156.6 67.9 68.9 549.1 541.4
Earnings before interest and taxes $ 163.3 $ 172.1 $ 35.9 $ 35.4 $ 40.8 $ 42.6 240.0 250.1
Interest expense(2) 25.2 24.1
Earnings before income taxes 214.8 226.0Income taxes 45.1 43.9
Net earnings 169.7 182.1Perpetual preferred share dividends 2.2 2.2
Net earnings available to common shareholders $ 167.5 $ 179.9
(1) The Company’s investment management functions reside at Mackenzie Investments and the cost of investment management activities is allocated proportionately between the segments.
(2) Interest expense includes interest on long-term debt and in 2019 also includes interest on leases of $1.1 million as a result of the Company’s adoption of IFRS 16, Leases.
TABLE 2: CONSOLIDATED OPERATING RESULTS BY SEGMENT – Q1 2019 VS. Q1 2018
IG WEALTH MANAGEMENT MACKENZIE INVESTMENTS CORPORATE & OTHER TOTAL THREE MONTHS ENDED 2019 2018 2019 2018 2019 2018 2019 2018 ($ millions) MAR. 31 MAR. 31 MAR. 31 MAR. 31 MAR. 31 MAR. 31 MAR. 31 MAR. 31
Revenues Fee income $ 473.2 $ 482.2 $ 193.0 $ 202.9 $ 70.0 $ 72.4 $ 736.2 $ 757.5 Net investment income and other 10.0 10.3 4.2 (0.2) 38.7 42.0 52.9 52.1
483.2 492.5 197.2 202.7 108.7 114.4 789.1 809.6
Expenses Commission 157.0 164.8 72.5 75.3 45.2 46.0 274.7 286.1 Non-Commission(1) 162.9 144.7 88.8 85.8 22.7 22.6 274.4 253.1
319.9 309.5 161.3 161.1 67.9 68.6 549.1 539.2
Earnings before interest and taxes $ 163.3 $ 183.0 $ 35.9 $ 41.6 $ 40.8 $ 45.8 240.0 270.4
Interest expense(2) 25.2 30.3
Earnings before income taxes 214.8 240.1Income taxes 45.1 52.4
Net earnings 169.7 187.7Perpetual preferred share dividends 2.2 2.2
Net earnings available to common shareholders $ 167.5 $ 185.5
(1) The Company’s investment management functions reside at Mackenzie Investments and the cost of investment management activities is allocated proportionately between the segments.
(2) Interest expense includes interest on long-term debt and in 2019 also includes interest on leases of $1.1 million as a result of the Company’s adoption of IFRS 16, Leases.
POWER FINANCIAL CORPORATION�— �FIRST QUARTER REPORT 2019 C 5
PFC_QUAT1_Eng03_IGM_2019-05-03_v1.indd D5PFC_QUAT1_Eng03_IGM_2019-05-03_v1.indd D5 19-05-10 6:53 AM19-05-10 6:53 AM

PA
RT
C
IGM
FIN
AN
CIA
L IN
C.
IGM FINANCIAL INC. FIRST QUARTER REPORT 2019 / MANAGEMENT’S DISCUSSION AND ANALYSIS 9
SUMMARY OF CHANGES IN TOTAL ASSETS UNDER MANAGEMENTTotal assets under management were $160.5 billion at March 31, 2019 compared to $155.8 billion at March 31, 2018. Changes in total assets under management are detailed in Table 5.
Changes in assets under management for IG Wealth Management and Mackenzie Investments are discussed further in each of their respective Review of the Business sections in the MD&A.
SUMMARY OF QUARTERLY RESULTSThe Summary of Quarterly Results in Table 6 includes the eight most recent quarters and the reconciliation of non-IFRS financial measures to net earnings in accordance with IFRS.
Changes in average daily investment fund assets under management over the eight most recent quarters, as shown in Table 6, largely reflect the impact of net sales of the Company and changes in domestic and foreign markets.
TABLE 4: EFFECTIVE INCOME TAX RATE
2019 2018 2018 THREE MONTHS ENDED MAR. 31 DEC. 31 MAR. 31
Income taxes at Canadian federal and provincial statutory rates 26.79 % 26.83 % 26.81 % Effect of: Proportionate share of associates’ earnings (3.95) (3.79) (3.92) Tax loss consolidation(1) (1.55) (1.56) (1.41) Other items (0.32) (2.07) 0.34
Effective income tax rate – net earnings 20.97 % 19.41 % 21.82 %
(1) See Note 25 – Related Party Transactions of the Consolidated Financial Statements included in the 2018 IGM Financial Inc. Annual Report (Annual Financial Statements).
C 6 POWER FINANCIAL CORPORATION�— �FIRST QUARTER REPORT 2019�
PFC_QUAT1_Eng03_IGM_2019-05-03_v1.indd D6PFC_QUAT1_Eng03_IGM_2019-05-03_v1.indd D6 19-05-10 6:53 AM19-05-10 6:53 AM

PA
RT
C
IGM
FINA
NC
IAL IN
C.
10 IGM FINANCIAL INC. FIRST QUARTER REPORT 2019 / MANAGEMENT’S DISCUSSION AND ANALYSIS
TABLE 5: CHANGE IN TOTAL ASSETS UNDER MANAGEMENT – Q1 2019 VS. Q1 2018
IG WEALTH MACKENZIE INVESTMENT INTERCOMPANY MANAGEMENT INVESTMENTS PLANNING COUNSEL ELIMINATIONS(1) CONSOLIDATED THREE MONTHS ENDED 2019 2018 2019 2018 2019 2018 2019 2018 2019 2018 ($ millions) MAR. 31 MAR. 31 MAR. 31 MAR. 31 MAR. 31 MAR. 31 MAR. 31 MAR. 31 MAR. 31 MAR. 31
Investment funds Mutual funds(2)
Gross sales $ 2,350 $ 2,859 $ 2,505 $ 2,630 $ 219 $ 260 $ – $ – $ 5,074 $ 5,749 Net sales (14) 784 148 286 (16) 48 – – 118 1,118
ETFs Net creations 228 715 – – 228 715 Inter-product eliminations(1) – (233) (86) (241) (86) (474)
Total investment fund net sales (14) 784 376 768 (16) 48 (86) (241) 260 1,359
Sub-advisory, institutional and other accounts Net sales (103) 229 (4) (231) (107) (2)
Combined net sales $ (14) $ 784 $ 273 $ 997 $ (16) $ 48 $ (90) $ (472) $ 153 $ 1,357
Change in total assets under management Net sales $ (14) $ 784 $ 273 $ 997 $ (16) $ 48 $ (90) $ (472) $ 153 $ 1,357 Investment returns 6,288 (1,689) 4,775 (345) 317 27 (132) (105) 11,248 (2,112)
Net change in assets 6,274 (905) 5,048 652 301 75 (222) (577) 11,401 (755) Beginning assets 83,137 88,008 62,728 64,509 5,125 5,377 (1,924) (1,381) 149,066 156,513
Ending assets $ 89,411 $ 87,103 $ 67,776 $ 65,161 $ 5,426 $ 5,452 $ (2,146) $ (1,958) $ 160,467 $ 155,758
Total assets under management consists of: Investment funds Mutual funds(2) $ 89,411 $ 87,103 $ 57,694 $ 55,586 $ 5,426 $ 5,452 $ – $ – $ 152,531 $ 148,141 ETFs 3,330 2,004 – – 3,330 2,004 Inter-product eliminations(1) (898) (596) (628) (346) (1,526) (942)
Total investment funds 89,411 87,103 60,126 56,994 5,426 5,452 (628) (346) 154,335 149,203 Sub-advisory, institutional and other accounts 7,650 8,167 (1,518) (1,612) 6,132 6,555
Ending assets $ 89,411 $ 87,103 $ 67,776 $ 65,161 $ 5,426 $ 5,452 $ (2,146) $ (1,958) $ 160,467 $ 155,758
(1) Consolidated results eliminate double counting where business is reflected within multiple segments:
– Included with Mackenzie’s results were advisory mandates to other segments with assets of $2.1 billion at March 31, 2019 (2018 – $2.0 billion) and net sales of $90 million for the first quarter of 2019 (2018 – $472 million).
– Included in ETFs are mutual fund investments in ETFs totalling $898 million at March 31, 2019 (2018 – $596 million) and with no net sales in the three months ending March 31, 2019 (2018 – $233 million).
(2) IG Wealth Management and Investment Planning Counsel AUM and net sales includes separately managed accounts.
POWER FINANCIAL CORPORATION�— �FIRST QUARTER REPORT 2019 C 7
PFC_QUAT1_Eng03_IGM_2019-05-03_v1.indd D7PFC_QUAT1_Eng03_IGM_2019-05-03_v1.indd D7 19-05-10 6:53 AM19-05-10 6:53 AM

PA
RT
C
IGM
FIN
AN
CIA
L IN
C.
IGM FINANCIAL INC. FIRST QUARTER REPORT 2019 / MANAGEMENT’S DISCUSSION AND ANALYSIS 11
TABLE 6: SUMMARY OF QUARTERLY RESULTS
2019 2018 2018 2018 2018 2017 2017 2017 Q1 Q4 Q3 Q2 Q1 Q4 Q3 Q2
Consolidated statements of earnings ($ millions)
Revenues Management fees $ 545.2 $ 546.0 $ 573.8 $ 562.8 $ 556.6 $ 564.4 $ 541.9 $ 547.0 Administration fees 101.7 103.3 109.1 107.1 107.6 110.4 109.1 111.2 Distribution fees 89.3 94.4 93.3 89.9 93.3 95.2 89.8 94.8 Net investment income and other 52.9 47.8 55.8 56.2 52.1 36.7 32.5 50.3
789.1 791.5 832.0 816.0 809.6 806.7 773.3 803.3
Expenses Commission 274.7 272.4 270.1 270.1 286.1 288.1 276.0 284.4 Non-commission 274.4 269.0 245.9 252.7 253.1 240.3 238.8 246.5 Interest(1) 25.2 24.1 27.0 28.8 30.3 29.7 28.9 28.7
574.3 565.5 543.0 551.6 569.5 558.1 543.7 559.6
Earnings before undernoted 214.8 226.0 289.0 264.4 240.1 248.6 229.6 243.7Premium paid on early redemption of debentures – – (10.7) – – – – –Restructuring and other – – (22.7) – – (172.3) – (23.0)Pension plan – – – – – – – 50.4Proportionate share of associate’s one-time charges – – – – – (14.0) – –Proportionate share of associate’s provision – – – – – – – (5.1)
Earnings before income taxes 214.8 226.0 255.6 264.4 240.1 62.3 229.6 266.0Income taxes 45.1 43.9 55.2 58.5 52.4 9.5 54.0 63.0
Net earnings 169.7 182.1 200.4 205.9 187.7 52.8 175.6 203.0Perpetual preferred share dividends 2.2 2.2 2.2 2.2 2.2 2.2 2.2 2.2
Net earnings available to common shareholders $ 167.5 $ 179.9 $ 198.2 $ 203.7 $ 185.5 $ 50.6 $ 173.4 $ 200.8
Reconciliation of Non-IFRS financial measures(2) ($ millions)
Adjusted net earnings available to common shareholders – non-IFRS measure $ 167.5 $ 179.9 $ 222.7 $ 203.7 $ 185.5 $ 191.4 $ 173.4 $ 185.9Other items: Premium paid on early redemption of debentures, net of tax – – (7.8) – – – – – Restructuring and other, net of tax – – (16.7) – – (126.8) – (16.8) Pension plan, net of tax – – – – – – – 36.8 Proportionate share of associate’s one-time charges – – – – – (14.0) – – Proportionate share of associate’s provision – – – – – – – (5.1)
Net earnings available to common shareholders – IFRS $ 167.5 $ 179.9 $ 198.2 $ 203.7 $ 185.5 $ 50.6 $ 173.4 $ 200.8
Earnings per Share (¢)
Adjusted net earnings available to common shareholders(1)
– Basic 70 75 92 85 77 80 72 77 – Diluted 70 75 92 85 77 79 72 77 Net earnings available to common shareholders – Basic 70 75 82 85 77 21 72 83 – Diluted 70 75 82 85 77 21 72 83
Average daily investment fund assets ($ billions) $ 149.9 $ 147.0 $ 154.0 $ 150.9 $ 150.1 $ 148.1 $ 142.4 $ 144.3
Total investment fund assets under management ($ billions) $ 154.3 $ 143.3 $ 153.4 $ 152.5 $ 149.2 $ 149.8 $ 144.6 $ 143.3
Total assets under management ($ billions) $ 160.5 $ 149.1 $ 159.7 $ 159.1 $ 155.8 $ 156.5 $ 150.0 $ 148.6
(1) Interest expense includes interest on long-term debt and in 2019 also includes interest on leases as a result of the Company’s adoption of IFRS 16, Leases.
(2) Refer to Non-IFRS Financial Measures and Additional IFRS Measures in this MD&A in addition to the Summary of Consolidated Operating Results section included in the MD&A of the 2018 IGM Financial Inc. Annual Report for an explanation of Other items used to calculate the Company’s Non-IFRS financial measures.
C 8 POWER FINANCIAL CORPORATION�— �FIRST QUARTER REPORT 2019�
PFC_QUAT1_Eng03_IGM_2019-05-03_v1.indd D8PFC_QUAT1_Eng03_IGM_2019-05-03_v1.indd D8 19-05-10 6:53 AM19-05-10 6:53 AM

PA
RT
C
IGM
FINA
NC
IAL IN
C.
12 IGM FINANCIAL INC. FIRST QUARTER REPORT 2019 / MANAGEMENT’S DISCUSSION AND ANALYSIS
IG WEALTH MANAGEMENTREVIEW OF THE BUSINESS
2019 DEVELOPMENTS
CHANGES TO MUTUAL FUND PRODUCT OFFERING
IG Wealth Management continues to enhance the performance, scope and diversity of our investment offering with the introduction of new funds and other product changes that are well-suited to the long-term diverse needs of Canadian investors.
During 2019, IG Wealth Management has implemented changes to simplify its mutual fund offering with investment fund changes and mergers including:
• Changes to the investment objectives and/or fundamental investment strategies of several funds so that they provide broader investment management diversification opportunities.
• Several fund mergers which are expected to provide investors with a streamlined and simplified product line-up, broaden investment management diversification opportunities and in some cases, may result in lower costs to clients.
FEE TRANSPARENCY FOR ALL CLIENTS AND PRICING CHANGES
IG Wealth Management is delivering on its client-focused commitment by expanding fee transparency to all clients while introducing product and pricing changes to accelerate growth.
IG Wealth Management will increase fee transparency by migrating clients to unbundled solutions beginning in the third quarter of 2019, with most accounts expected to be migrated over the following twelve months. Under this model, clients pay an advisory fee to the dealer for its services as opposed to dealer compensation being bundled as part of mutual fund management fees. IG Wealth Management has successfully offered an unbundled fee option (Series U) to high net worth clients across its product suite since 2013.
The company is also introducing more competitive pricing to reward client loyalty while encouraging consolidation of our clients’ assets with IG Wealth Management and increasing the competitiveness of our products to attract new clients. IG Wealth Management plans to implement the changes over the course of 2019:
• Beginning March 1, 2019, IG Wealth Management enhanced the competitiveness of pricing to households with over $1 million in assets with IG Wealth Management through advisory fee reductions across multiple client segments.
• During the third quarter of 2019, IG Wealth Management will open unbundled fee options to households with less than $500,000 in assets.
IG WEALTH MANAGEMENT STRATEGYIG Wealth Management’s promise is to inspire financial confidence.
Our strategic mandate is to be Canada’s financial partner of choice.
Our value proposition is to deliver better Gamma, better Beta and better Alpha:
• Gamma – the value of all efforts that sit outside of investment portfolio construction. This includes the value that a financial advisor adds to a client relationship, and comes from the creation and follow through of a well-constructed financial plan.
• Beta – the value created by well-constructed investment portfolios – achieving expected investment returns for the lowest possible risk.
• Alpha – the value of active management – achieving returns superior to passive benchmarks with a similar composition and risk profile.
We seek to deliver our value proposition through:
• Superior Advice – Acquiring a deep knowledge of Canadian investors and using those insights to shape everything we do.
• Segmented Client Experiences – Creating segmented experiences personalized throughout our clients’ lifetimes.
• Entrepreneurial Advisors – Inspiring our entrepreneurial advisors to constantly deliver an engaging experience and a holistic plan that seeks to deliver superior outcomes.
• Powerful Financial Solutions – Providing our clients with a comprehensive suite of well-constructed, high-performing and competitively priced solutions.
• Business processes that are simple, easy and digitized – Re-designing client and advisor interactions to simplify processes, reduce errors, and digitize the experience with an appropriate cost structure.
• Enabled by a high-performing and diverse culture.
GAMMAthe value of all efforts that sit outside of investment portfolio construction. this includes the value that a financial advisor adds to a client relationship, and comes from the creation and follow through of a well-constructed financial plan.
Entrepreneurial Advisors
IG Wealth Management has a national distribution network of Consultants based in region offices across Canada.
POWER FINANCIAL CORPORATION�— �FIRST QUARTER REPORT 2019 C 9
PFC_QUAT1_Eng03_IGM_2019-05-03_v1.indd D9PFC_QUAT1_Eng03_IGM_2019-05-03_v1.indd D9 19-05-10 6:53 AM19-05-10 6:53 AM

PA
RT
C
IGM
FIN
AN
CIA
L IN
C.
IGM FINANCIAL INC. FIRST QUARTER REPORT 2019 / MANAGEMENT’S DISCUSSION AND ANALYSIS 13
The following provides a breakdown of the IG Wealth Management Consultant network into its significant components at March 31, 2019:
• 1,930 Consultant practices (2,114 at March 31, 2018), which reflect Consultants with more than four years of IG Wealth Management experience. These practices may include Associates as described below. The level of Consultant practices is a key measurement of our business as they serve clientele representing approximately 95% of AUM.
• 676 New Consultants (887 at March 31, 2018), which are those Consultants with less than four years of IG Wealth Management experience.
• 1,036 Associates and Regional Directors (1,080 at March 31, 2018). Associates are licensed team members of Consultant practices who provide financial planning services and advice to the clientele served by the team.
• IG Wealth Management had a total Consultant network of 3,642 (4,081 at March 31, 2018).
IG Wealth Management’s recruiting standards increases the likelihood of success while also enhancing our culture and brand.
Superior Advice
IG Wealth Management requires all Consultants with more than four years of experience to have or be enrolled to achieve the Certified Financial Planner (CFP) or its Quebec equivalent, Financial Planner (F.Pl.) designations. The CFP and F.Pl. designations are nationally recognized financial planning qualifications that require an individual to demonstrate financial planning competence through education, standardized examinations, continuing education requirements, and accountability to ethical standards. The Financial Planning Standards Council published in 2018 that IG Wealth Management ranks first in terms of the number of CFP designation holders.
IG Wealth Management also supports Consultants and clients through its network of product and planning specialists who assist in the areas of advanced financial planning, mortgages and banking, insurance, and securities. These specialists provide support in ensuring that we are offering the very best in financial planning and providing plans that are comprehensive across all elements of a client’s financial life. Our specialist complement also includes wealth planning specialists who are IIROC-licensed and ensure that the same level of comprehensive advice on direct securities is available to clients who are served by both our Mutual Fund Dealers Association of Canada (MFDA) and Investment Industry Regulatory Organization of Canada (IIROC) licensed Consultants. Clients of our MFDA and IIROC licensed Consultants have access to the same product and service offering.
Segmented Client Experiences
IG Wealth Management distinguishes itself from its competition by offering comprehensive planning to its clients within the context of long-term relationships. The value of this approach is illustrated through independent studies demonstrating that households receiving advice from a financial advisor have greater wealth than non-advised households, and that this advantage increases based on the length of the relationship with the financial advisor.
IG Living Plan™ is a holistic, client-centric approach to financial planning that reflects the evolving needs, goals and aspirations of Canadian families and individuals. The IG Living Plan provides a single, integrated view of all aspects of a client’s finances including retirement and estate planning, investments and tax strategies, creating a truly synchronized and comprehensive plan.
The IG Living Plan leverages the experience and expertise of IG Wealth Management’s Consultants who serve over 1 million clients in all provinces and territories.
IG Wealth Management has a full range of products that allow us to provide a tailored IG Living Plan that evolves over time. These products include:
• Powerful financial solutions that include investment vehicles that match risk and investment performance to each client’s needs and requirements.
• Insurance products that include a variety of different policy types from the leading insurers in Canada.
• Mortgage and Banking to develop mortgage and other lending strategies that meet the individual needs and goals of each client as part of their comprehensive financial plan.
• Charitable Giving Program, a donor-advised giving program which enables Canadians to make donations and build an enduring charitable giving legacy with considerably less expense and complexity than setting up and administering their own private foundation.
IG Wealth Management has long believed that providing our clients with personal account level performance and rate of return information over multiple time periods is a meaningful benefit to our clients and further demonstrates the value provided through advice over the history of our client relationships. Our clients’ statements include a multiple-period view of their performance, including one year, three year and five year rates of return.
Communication with our clients includes regular reporting of their IG Wealth Management investment fund holdings and the change in asset values of these holdings. Individual clients
C 10 POWER FINANCIAL CORPORATION�— �FIRST QUARTER REPORT 2019�
PFC_QUAT1_Eng03_IGM_2019-05-03_v1.indd D10PFC_QUAT1_Eng03_IGM_2019-05-03_v1.indd D10 19-05-10 6:53 AM19-05-10 6:53 AM

PA
RT
C
IGM
FINA
NC
IAL IN
C.
14 IGM FINANCIAL INC. FIRST QUARTER REPORT 2019 / MANAGEMENT’S DISCUSSION AND ANALYSIS
experience different returns as a result of having different composition of their portfolios in each quarter as illustrated on the accompanying charts. The first chart reflects in-quarter client account median rates of return for the current year. The second chart reflects the client account median rates of return based on one, three and five year timeframes as at March 31, 2019. Both charts also illustrate upper and lower ranges of rates of return around the median for 90% of IG Wealth Management client accounts.
For the three month period ended March 31, 2019, the client account median rate of return was approximately 7.5%.
Business Processes
Administrative support for Consultants and clients includes timely and accurate client account record-keeping and reporting, effective problem resolution support, and continuous improvements to servicing systems.
This administrative support is provided for Consultants and clients from both IG Wealth Management’s head office in Winnipeg, Manitoba and IG Wealth Management’s Quebec General Office located in Montreal for Consultants and clients residing in Quebec. The Quebec General Office has approximately 200 employees and operating units for most functions supporting approximately 800 Consultants throughout Quebec. Mutual fund assets under management in Quebec were approximately $16 billion as at March 31, 2019.
Enabled by a High-Performing and Diverse Culture
IG Wealth Management has established a high-performing and diverse culture to allow employees and Consultants to achieve maximum results. Gallup surveys are utilized to ensure that employees and Consultants are fully engaged and have the resources required to excel.
BETA AND ALPHAbeta – the value created by well-constructed investment portfolios – achieving expected investment returns for the lowest possible risk.
alpha – the value of active management – achieving returns superior to passive benchmarks with a similar composition and risk profile.
IG Wealth Management strives to provide Beta and Alpha through the selection of its global sub-advisors. The use of sub-advisors allow us to provide clients with products that provide diversification and global reach.
New Products
IG Wealth Management continues to enhance the performance, scope and diversity of our investment offering with the introduction of new funds and other product changes that are well-suited to the long-term diverse needs of Canadian investors.
Powerful Financial Solutions
IG Wealth Management provides a wide range of investment and other financial solutions that enable clients to achieve their goals.
Clients can diversify their holdings across investment managers, asset categories, investment styles, geography, capitalization and sectors through portfolios customized to meet their objectives.
IG Wealth Management monitors its investment performance by comparing to certain benchmarks. Morningstar† fund ranking service is one of the rankings monitored when determining fund performance.
At March 31, 2019, 55.7% of IG Wealth Management mutual funds had a rating of three stars or better from the Morningstar† fund ranking service and 16.2% had a rating of four or five stars.
MedianReturns - %
-15
0
-5
-10
5
10
15
RO
R %
(5.3)
2018 Annual
7.5
Q1 19
90% ofclients rate of returnrange
Client Account Rate of Return (ROR) Experience
MedianReturns - % 3.0
1 Year
4.4
3 Year
3.4
5 Year
90% ofclients rate of returnrange
RO
R %
-15
0
-5
-10
5
10
15
Client Account Compound Annual ROR ExperienceAs at March 31, 2019
POWER FINANCIAL CORPORATION�— �FIRST QUARTER REPORT 2019 C 1 1
PFC_QUAT1_Eng03_IGM_2019-05-03_v1.indd D11PFC_QUAT1_Eng03_IGM_2019-05-03_v1.indd D11 19-05-10 6:53 AM19-05-10 6:53 AM
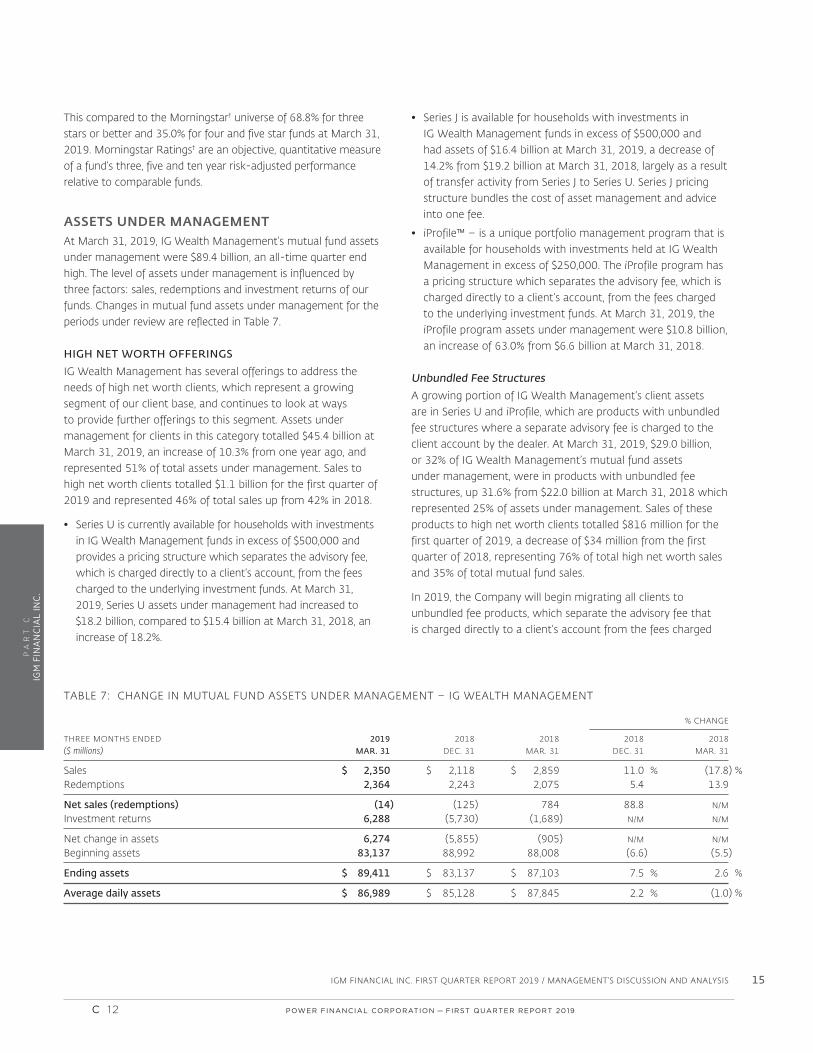
PA
RT
C
IGM
FIN
AN
CIA
L IN
C.
IGM FINANCIAL INC. FIRST QUARTER REPORT 2019 / MANAGEMENT’S DISCUSSION AND ANALYSIS 15
This compared to the Morningstar† universe of 68.8% for three stars or better and 35.0% for four and five star funds at March 31, 2019. Morningstar Ratings† are an objective, quantitative measure of a fund’s three, five and ten year risk-adjusted performance relative to comparable funds.
ASSETS UNDER MANAGEMENTAt March 31, 2019, IG Wealth Management’s mutual fund assets under management were $89.4 billion, an all-time quarter end high. The level of assets under management is influenced by three factors: sales, redemptions and investment returns of our funds. Changes in mutual fund assets under management for the periods under review are reflected in Table 7.
HIGH NET WORTH OFFERINGS
IG Wealth Management has several offerings to address the needs of high net worth clients, which represent a growing segment of our client base, and continues to look at ways to provide further offerings to this segment. Assets under management for clients in this category totalled $45.4 billion at March 31, 2019, an increase of 10.3% from one year ago, and represented 51% of total assets under management. Sales to high net worth clients totalled $1.1 billion for the first quarter of 2019 and represented 46% of total sales up from 42% in 2018.
• Series U is currently available for households with investments in IG Wealth Management funds in excess of $500,000 and provides a pricing structure which separates the advisory fee, which is charged directly to a client’s account, from the fees charged to the underlying investment funds. At March 31, 2019, Series U assets under management had increased to $18.2 billion, compared to $15.4 billion at March 31, 2018, an increase of 18.2%.
• Series J is available for households with investments in IG Wealth Management funds in excess of $500,000 and had assets of $16.4 billion at March 31, 2019, a decrease of 14.2% from $19.2 billion at March 31, 2018, largely as a result of transfer activity from Series J to Series U. Series J pricing structure bundles the cost of asset management and advice into one fee.
• iProfile™ – is a unique portfolio management program that is available for households with investments held at IG Wealth Management in excess of $250,000. The iProfile program has a pricing structure which separates the advisory fee, which is charged directly to a client’s account, from the fees charged to the underlying investment funds. At March 31, 2019, the iProfile program assets under management were $10.8 billion, an increase of 63.0% from $6.6 billion at March 31, 2018.
Unbundled Fee Structures
A growing portion of IG Wealth Management’s client assets are in Series U and iProfile, which are products with unbundled fee structures where a separate advisory fee is charged to the client account by the dealer. At March 31, 2019, $29.0 billion, or 32% of IG Wealth Management’s mutual fund assets under management, were in products with unbundled fee structures, up 31.6% from $22.0 billion at March 31, 2018 which represented 25% of assets under management. Sales of these products to high net worth clients totalled $816 million for the first quarter of 2019, a decrease of $34 million from the first quarter of 2018, representing 76% of total high net worth sales and 35% of total mutual fund sales.
In 2019, the Company will begin migrating all clients to unbundled fee products, which separate the advisory fee that is charged directly to a client’s account from the fees charged
TABLE 7: CHANGE IN MUTUAL FUND ASSETS UNDER MANAGEMENT – IG WEALTH MANAGEMENT
% CHANGE
THREE MONTHS ENDED 2019 2018 2018 2018 2018 ($ millions) MAR. 31 DEC. 31 MAR. 31 DEC. 31 MAR. 31
Sales $ 2,350 $ 2,118 $ 2,859 11.0 % (17.8) %Redemptions 2,364 2,243 2,075 5.4 13.9
Net sales (redemptions) (14) (125) 784 88.8 N/M
Investment returns 6,288 (5,730) (1,689) N/M N/M
Net change in assets 6,274 (5,855) (905) N/M N/M
Beginning assets 83,137 88,992 88,008 (6.6) (5.5)
Ending assets $ 89,411 $ 83,137 $ 87,103 7.5 % 2.6 %
Average daily assets $ 86,989 $ 85,128 $ 87,845 2.2 % (1.0) %
C 12 POWER FINANCIAL CORPORATION�— �FIRST QUARTER REPORT 2019�
PFC_QUAT1_Eng03_IGM_2019-05-03_v1.indd D12PFC_QUAT1_Eng03_IGM_2019-05-03_v1.indd D12 19-05-10 6:53 AM19-05-10 6:53 AM

PA
RT
C
IGM
FINA
NC
IAL IN
C.
16 IGM FINANCIAL INC. FIRST QUARTER REPORT 2019 / MANAGEMENT’S DISCUSSION AND ANALYSIS
to the underlying investment funds. Following this transition, IG Wealth Management will discontinue offering bundled purchase options for investment funds.
CHANGE IN ASSETS UNDER MANAGEMENT – Q1 2019 VS. Q1 2018
IG Wealth Management’s mutual fund assets under management were $89.4 billion at March 31, 2019, representing an increase of 2.6% from $87.1 billion at March 31, 2018. Average daily mutual fund assets were $87.0 billion in the first quarter of 2019, down 1.0% from $87.8 billion in the first quarter of 2018.
For the quarter ended March 31, 2019, sales of IG Wealth Management mutual funds through its Consultant network were $2.4 billion, a decrease of 17.8% from the comparable period in 2018. Mutual fund redemptions totalled $2.4 billion, an increase of 13.9% from 2018. IG Wealth Management mutual fund net redemptions for the first quarter of 2019 were $14 million compared with net sales of $784 million in 2018. During the first quarter, investment returns resulted in an increase of $6.3 billion in mutual fund assets compared to a decrease of $1.7 billion in the first quarter of 2018.
IG Wealth Management’s annualized quarterly redemption rate for long-term funds was 10.4% in the first quarter of 2019, compared to 9.0% in the first quarter of 2018. IG Wealth Management’s twelve month trailing redemption rate for long-term funds was 9.5% at March 31, 2019, compared to 8.4% at March 31, 2018, and remains well below the corresponding average redemption rate for all other members of the Investment Funds Institute of Canada (IFIC) of approximately 17.1% at March 31, 2019.
CHANGE IN ASSETS UNDER MANAGEMENT – Q1 2019 VS. Q4 2018
IG Wealth Management’s mutual fund assets under management were $89.4 billion at March 31, 2019, an increase of 7.5% from $83.1 billion at December 31, 2018. Average daily mutual fund assets were $87.0 billion in the first quarter of 2019 compared to $85.1 billion in the fourth quarter of 2018, an increase of 2.2%.
For the quarter ended March 31, 2019, sales of IG Wealth Management mutual funds through its Consultant network were $2.4 billion, an increase of 11.0% from the fourth quarter of 2018. Mutual fund redemptions, which totalled $2.4 billion for the first quarter, increased 5.4% from the previous quarter and the annualized quarterly redemption rate was 10.4% in the first quarter compared to 9.7% in the fourth quarter of 2018. IG Wealth Management mutual fund net redemptions were $14 million for the current quarter compared to net redemptions of $125 million in the previous quarter.
OTHER PRODUCTS AND SERVICES
SEGREGATED FUNDS
IG Wealth Management offers segregated funds which include the IG Series of Guaranteed Investment Funds (GIFs). Select GIF policies allow for a Lifetime Income Benefit (LIB) option to provide guaranteed retirement income for life. The investment components of these segregated funds are managed by IG Wealth Management. At March 31, 2019, total segregated fund assets were $1.7 billion, compared to $1.8 billion at March 31, 2018.
INSURANCE
IG Wealth Management distributes insurance products through I.G. Insurance Services Inc. The average number of policies sold by each insurance-licensed Consultant was 2.2 for the quarter ended March 31, 2019, unchanged from 2018. Distribution of insurance products is enhanced through IG Wealth Management’s Insurance Planning Specialists, located throughout Canada, who assist Consultants with advanced estate planning solutions for high net worth clients.
SECURITIES OPERATIONS
Investors Group Securities Inc. is an investment dealer registered in all Canadian provinces and territories providing clients with securities services to complement their financial and investment planning. IG Wealth Management Consultants can refer clients to one of our Wealth Planning Specialists available through Investors Group Securities Inc. In addition, there are a growing number of IIROC licensed Consultants using this platform.
MORTGAGE AND BANKING OPERATIONS
IG Wealth Management Mortgage Planning Specialists are located throughout each province in Canada, and work with our clients and their Consultants to develop mortgage and other lending strategies that meet the individual needs and goals of each client as part of their comprehensive financial plan.
Mortgages are offered to clients by IG Wealth Management, a national mortgage lender, and through IG Wealth Management’s Solutions Banking†, provided by National Bank of Canada under a long-term distribution agreement. An All-in-One product, a comprehensive cash management solution that integrates the features of a mortgage, term loan, revolving line of credit and deposit account, is also offered through Solutions Banking†.
Mortgage fundings offered through IG Wealth Management and through Solutions Banking† for the first quarter ended March 31, 2019 were $203 million compared to $195 million in 2018, an increase of 4.1%. At March 31, 2019, mortgages offered through both sources totalled $10.6 billion, compared to $10.7 billion at March 31, 2018, a decrease of 0.9%.
POWER FINANCIAL CORPORATION�— �FIRST QUARTER REPORT 2019 C 13
PFC_QUAT1_Eng03_IGM_2019-05-03_v1.indd D13PFC_QUAT1_Eng03_IGM_2019-05-03_v1.indd D13 19-05-10 6:53 AM19-05-10 6:53 AM

PA
RT
C
IGM
FIN
AN
CIA
L IN
C.
IGM FINANCIAL INC. FIRST QUARTER REPORT 2019 / MANAGEMENT’S DISCUSSION AND ANALYSIS 17
REVIEW OF SEGMENT OPERATING RESULTS
IG Wealth Management’s earnings before interest and taxes are presented in Table 8.
Q1 2019 VS. Q1 2018
FEE INCOME
Fee income is generated from the management, administration and distribution of IG Wealth Management mutual funds. The distribution of insurance and Solutions Banking† products and the provision of securities services provide additional fee income.
IG Wealth Management earns management fees for investment management services provided to its mutual funds, which depend largely on the level and composition of mutual fund assets under management. Management fees were $358.2 million in the first quarter of 2019, a decrease of $2.6 million or 0.7% from $360.8 million in 2018. The net decrease in management fees in the first quarter of 2019 was primarily due to the decrease in average assets under management of 1.0%, as shown in Table 7. The average management fee rate for the first quarter was 167.1 basis points of average assets under management compared to 166.6 basis points in 2018.
IG Wealth Management receives administration fees for providing administrative services to its mutual funds and trusteeship services to its unit trust mutual funds, which also depend largely on the level and composition of mutual fund assets under management. Administration fees totalled $73.9 million in the current quarter compared to $78.1 million a year ago, a decrease of 5.4%. This decrease resulted primarily from the movement of assets into unbundled products which are not charged certain administration fees and changes in the composition of average assets under management.
Distribution fees are earned from:
• Redemption fees on mutual funds that were sold with a deferred sales charge.
• Portfolio fund distribution fees.
• Distribution of insurance products through I.G. Insurance Services Inc.
• Securities trading services provided through Investors Group Securities Inc.
• Banking services provided through Solutions Banking†.
Distribution fee income of $41.1 million for the first quarter of 2019 decreased by $2.2 million from $43.3 million in 2018. The decrease was primarily due to a decrease in distribution fee income from insurance products and lower redemption fees. IG Wealth Management no longer offers the deferred sales purchase option for its mutual funds. Redemption fee income varies depending on the level of deferred sales charge attributable to fee-based redemptions.
NET INVESTMENT INCOME AND OTHER
Net investment income and other includes income related to mortgage banking operations and net interest income related to intermediary operations.
Net investment income and other was $10.0 million in the first quarter of 2019, a decrease of $0.3 million from $10.3 million in 2018.
Net investment income related to IG Wealth Management’s mortgage banking operations totalled $7.3 million for the first quarter of 2019 compared to $8.9 million in 2018, a decrease of $1.6 million. A summary of mortgage banking operations for
Available credit associated with Solutions Banking† All-in-One accounts originated for the quarter ended March 31, 2019 were $135 million compared to $199 million in 2018. At March 31, 2019, the balance outstanding of Solutions Banking† All-in-One products was $2.6 billion, compared to $2.3 billion one year ago, and represented approximately 51% of total available credit associated with these accounts.
Other products and services offered through IG Wealth Management’s Solutions Banking† include investment loans, lines of credit, personal loans, creditor insurance, deposit accounts, and credit cards. Through Solutions Banking†, clients have access to a network of banking machines, as well as a private labeled
client website and client service centre. The Solutions Banking† offering supports IG Wealth Management’s approach to delivering total financial solutions for our clients through a broad financial planning platform. Total lending products of IG Wealth Management clients in the Solutions Banking† offering, including Solutions Banking† mortgages totalled $4.2 billion at March 31, 2019, compared to $3.6 billion at March 31, 2018.
ADDITIONAL PRODUCTS AND SERVICES
IG Wealth Management also provides its clients with guaranteed investment certificates offered by Investors Group Trust Co. Ltd., as well as a number of other financial institutions.
C 14 POWER FINANCIAL CORPORATION�— �FIRST QUARTER REPORT 2019�
PFC_QUAT1_Eng03_IGM_2019-05-03_v1.indd D14PFC_QUAT1_Eng03_IGM_2019-05-03_v1.indd D14 19-05-10 6:53 AM19-05-10 6:53 AM

PA
RT
C
IGM
FINA
NC
IAL IN
C.
18 IGM FINANCIAL INC. FIRST QUARTER REPORT 2019 / MANAGEMENT’S DISCUSSION AND ANALYSIS
the quarter under review is presented in Table 9. The changes in mortgage banking income were due to:
• Net interest income on securitized loans – decreased by $1.9 million for the first quarter ended March 31, 2019 to $8.5 million, compared to 2018. The decrease resulted from lower margins on securitized loans.
• Gains realized on the sale of residential mortgages – decreased by $0.5 million for the three months ended March 31, 2019 to $0.3 million, compared to 2018. The decrease in gains was primarily due to lower sales activity.
EXPENSES
IG Wealth Management incurs commission expense in connection with the distribution of its mutual funds and other financial services and products. Commissions are paid on the sale of these products and fluctuate with the level of sales. Commissions paid on the sale of investment products are capitalized and amortized over their estimated useful lives where the Company receives a fee directly from the client. All other commissions paid on investment product sales are expensed as incurred.
Commission expense was $57.8 million for the first quarter of 2019, a decrease of $11.4 million from $69.2 million in 2018. The decrease in mutual fund commissions was due to lower mutual fund sales in the quarter and lower compensation related to the distribution of insurance products.
Asset-based compensation, which is based on the value of assets under management, increased by $3.6 million for the first quarter ended March 31, 2019 to $99.2 million, compared to 2018. The increase was primarily due to the increase in assets under management.
Non-commission expenses incurred by IG Wealth Management primarily relate to the support of the Consultant network, the administration, marketing and management of its mutual funds and other products, as well as sub-advisory fees related to mutual fund assets under management. Non-commission expenses were $162.9 million for the first quarter of 2019 compared to $144.7 million in 2018, an increase of $18.2 million or 12.6%, primarily due to increased technology expenses relating to the migration of clients to our new dealer platform and unbundled fee arrangements, as well as continued expenses associated with the brand re-launch.
Q1 2019 VS. Q4 2018
FEE INCOME
Management fee income increased by $1.5 million or 0.4% to $358.2 million in the first quarter of 2019 compared with the fourth quarter of 2018. The increase in management fees in the first quarter was primarily due to the increase in average assets under management of 2.2% for the quarter, as shown in Table 7,
TABLE 8: OPERATING RESULTS – IG WEALTH MANAGEMENT
% CHANGE
THREE MONTHS ENDED 2019 2018 2018 2018 2018 ($ millions) MAR. 31 DEC. 31 MAR. 31 DEC. 31 MAR. 31
Revenues Management fees $ 358.2 $ 356.7 $ 360.8 0.4 % (0.7) % Administration fees 73.9 75.2 78.1 (1.7) (5.4) Distribution fees 41.1 45.1 43.3 (8.9) (5.1)
473.2 477.0 482.2 (0.8) (1.9) Net investment income and other 10.0 11.0 10.3 (9.1) (2.9)
483.2 488.0 492.5 (1.0) (1.9)
Expenses Commission Commission amortization 4.8 4.4 2.9 9.1 65.5 Mutual fund sales commissions expensed as incurred 23.4 22.2 35.9 5.4 (34.8) Other commissions 29.6 30.4 30.4 (2.6) (2.6)
57.8 57.0 69.2 1.4 (16.5) Asset-based compensation 99.2 99.3 95.6 (0.1) 3.8 Non-commission 162.9 159.6 144.7 2.1 12.6
319.9 315.9 309.5 1.3 3.4
Earnings before interest and taxes $ 163.3 $ 172.1 $ 183.0 (5.1) % (10.8) %
POWER FINANCIAL CORPORATION�— �FIRST QUARTER REPORT 2019 C 15
PFC_QUAT1_Eng03_IGM_2019-05-03_v1.indd D15PFC_QUAT1_Eng03_IGM_2019-05-03_v1.indd D15 19-05-10 6:53 AM19-05-10 6:53 AM

PA
RT
C
IGM
FIN
AN
CIA
L IN
C.
IGM FINANCIAL INC. FIRST QUARTER REPORT 2019 / MANAGEMENT’S DISCUSSION AND ANALYSIS 19
and was offset by a decrease of approximately $6.5 million resulting from two fewer calendar days in the first quarter compared to the fourth quarter of 2018.
Administration fees decreased to $73.9 million in the first quarter of 2019 from $75.2 million in the fourth quarter of 2018. This decrease resulted primarily from changes in the composition of average assets under management.
Distribution fee income of $41.1 million in the first quarter of 2019 decreased by $4.0 million from $45.1 million in the fourth quarter primarily due to a decrease in distribution fee income from insurance product sales, offset in part by higher redemption fees.
NET INVESTMENT INCOME AND OTHER
Net investment income and other was $10.0 million in the first quarter of 2019 compared to $11.0 million in the previous quarter, a decrease of $1.0 million.
Net investment income related to IG Wealth Management’s mortgage banking operations totalled $7.3 million in the first quarter of 2019, an increase of $1.3 million from $6.0 million
in the previous quarter as shown in Table 9. The change in mortgage banking income was due to:
• Fair value adjustments – increased by $2.6 million in the first quarter of 2019 to ($3.5) million compared to ($6.1) million in the previous quarter primarily due to larger unfavorable fair value adjustments on certain securitization related financial instruments in the previous quarter.
EXPENSES
Commission expense in the current quarter was $57.8 million compared with $57.0 million in the previous quarter. The increase related primarily to higher cash commissions paid being expensed in the quarter primarily due to higher mutual fund sales and the distribution of other financial services offset in part by lower compensation related to the distribution of insurance product sales.
Non-commission expenses were $162.9 million in the current quarter compared to $159.6 million in the prior quarter, reflecting seasonality of expenses and the implementation of certain strategic initiatives.
TABLE 9: MORTGAGE BANKING OPERATIONS – IG WEALTH MANAGEMENT
% CHANGE
THREE MONTHS ENDED 2019 2018 2018 2018 2018 ($ millions) MAR. 31 DEC. 31 MAR. 31 DEC. 31 MAR. 31
Total mortgage banking income Net interest income on securitized loans Interest income $ 52.6 $ 51.7 $ 50.3 1.7 % 4.6 % Interest expense 44.1 42.5 39.9 3.8 10.5
Net interest income 8.5 9.2 10.4 (7.6) (18.3) Gains on sales(1) 0.3 – 0.8 N/M (62.5) Fair value adjustments (3.5) (6.1) (3.9) 42.6 10.3 Other 2.0 2.9 1.6 (31.0) 25.0
$ 7.3 $ 6.0 $ 8.9 21.7 % (18.0) %
Average mortgages serviced Securitizations $ 7,402 $ 7,264 $ 7,529 1.9 % (1.7) % Other 2,855 3,104 3,236 (8.0) (11.8)
$ 10,257 $ 10,368 $ 10,765 (1.1) % (4.7) %
Mortgage sales to:(2)
Securitizations $ 437 $ 550 $ 379 (20.5) % 15.3 % Other(1) 66 81 96 (18.5) (31.3)
$ 503 $ 631 $ 475 (20.3) % 5.9 %
(1) Represents sales to institutional investors through private placements, to Investors Mortgage and Short Term Income Fund, and to Investors Canadian Corporate Bond Fund as well as gains realized on those sales.
(2) Represents principal amounts sold.
C 16 POWER FINANCIAL CORPORATION�— �FIRST QUARTER REPORT 2019�
PFC_QUAT1_Eng03_IGM_2019-05-03_v1.indd D16PFC_QUAT1_Eng03_IGM_2019-05-03_v1.indd D16 19-05-10 6:53 AM19-05-10 6:53 AM

PA
RT
C
IGM
FINA
NC
IAL IN
C.
20 IGM FINANCIAL INC. FIRST QUARTER REPORT 2019 / MANAGEMENT’S DISCUSSION AND ANALYSIS
MACKENZIE STRATEGYMackenzie seeks to be Canada’s preferred global asset management solutions provider and business partner.
Mackenzie’s vision: We are committed to the financial success of investors, through their eyes. This impacts the strategic priorities we select to fulfil that commitment and drive future business growth. Our strategic mandate is two-fold: win in the Canadian retail space and build meaningful strategic relationships. We aim to achieve this mandate by attracting and fostering the best minds in the investment industry, responding to changing needs of financial advisors and investors with distinctive and innovative solutions, and continuing to deliver institutional quality in everything we do.
Supporting this vision and strategic mandate are six key foundational capabilities that our employees strive to achieve:
• Delivering competitive and consistent risk-adjusted performance
• Offering innovative and high quality investment solutions
• Accelerating distribution
• Advancing brand leadership
• Driving operational excellence and discipline
• Enabling a high-performing and diverse culture
Mackenzie seeks to maximize returns on business investment by focusing resources in areas that directly impact the success of our strategic mandate: investment management, distribution and client experience.
Founded in 1967, Mackenzie continues to build an investment advisory business through proprietary investment research and portfolio management while utilizing strategic partners in a selected sub-advisory capacity. Our business focuses on multiple distribution channels: Retail, Strategic Alliances and Institutional.
Mackenzie primarily distributes its retail investment products through third party financial advisors. Mackenzie’s sales teams work with many of the more than 30,000 independent financial advisors and their firms across Canada. In addition to its retail distribution team, Mackenzie also has specialty teams focused on strategic alliances and the institutional marketplace. Within the strategic alliance channel, Mackenzie offers certain series of its mutual funds and provides sub-advisory services to third party and related party investment programs offered by banks, insurance companies and other investment companies. Strategic alliances with related parties include providing advisory services to IG Wealth Management, Investment Planning Counsel and Great-West Lifeco Inc. (Lifeco) subsidiaries, and also include a private label mutual fund arrangement with Lifeco subsidiary Quadrus. Within the strategic alliance channel, Mackenzie’s primary distribution relationship is with the head office of the
respective bank, insurance company or investment company. In the institutional channel, Mackenzie provides investment management services to pension plans, foundations and other institutions. Mackenzie attracts new institutional business through its relationships with pension and management consultants.
Gross sales and redemption activity in strategic alliance and institutional accounts can be more pronounced than in the retail channel given the relative size and the nature of the distribution relationships of these accounts. These accounts are also subject to ongoing reviews and rebalance activities which may result in a significant change in the level of assets under management.
Mackenzie is positioned to continue to build and enhance its distribution relationships given its team of experienced investment professionals, strength of its distribution network, broad product shelf, competitively priced products and its focus on client experience and investment excellence.
ASSETS UNDER MANAGEMENTThe changes in investment fund assets under management are summarized in Table 10 and the changes in total assets under management are summarized in Table 11.
At March 31, 2019, Mackenzie’s investment fund assets under management were $60.1 billion, an all-time high, and total assets under management were $67.8 billion. The change in Mackenzie’s assets under management is determined by investment returns generated for our clients and net contributions from our clients.
FUND PERFORMANCE
Long-term investment performance is a key measure of Mackenzie’s ongoing success. At March 31, 2019, 59.7% of Mackenzie mutual fund assets were rated in the top two performance quartiles for the one year time frame, 49.2% for the three year time frame and 53.9% for the five year time frame. Mackenzie also monitors its fund performance relative to the ratings it receives on its mutual funds from the Morningstar† fund ranking service. At March 31, 2019, 73.0% of Mackenzie mutual fund assets measured by Morningstar† had a rating of three stars or better and 45.4% had a rating of four or five stars. This compared to the Morningstar† universe of 78.9% for three stars or better and 45.8% for four and five star funds at March 31, 2019. These ratings exclude the Quadrus Group of Funds†.
CHANGES TO PRODUCT OFFERINGS
Mackenzie continues to evolve its product shelf by providing enhanced investment solutions for financial advisors to offer their clients. In 2019, Mackenzie launched the Mackenzie Global Growth Balanced Fund, and three new liquid alternative funds
MACKENZIE INVESTMENTSREVIEW OF THE BUSINESS
POWER FINANCIAL CORPORATION�— �FIRST QUARTER REPORT 2019 C 17
PFC_QUAT1_Eng03_IGM_2019-05-03_v1.indd D17PFC_QUAT1_Eng03_IGM_2019-05-03_v1.indd D17 19-05-10 6:53 AM19-05-10 6:53 AM

PA
RT
C
IGM
FIN
AN
CIA
L IN
C.
IGM FINANCIAL INC. FIRST QUARTER REPORT 2019 / MANAGEMENT’S DISCUSSION AND ANALYSIS 21
for Investors to diversify sources of returns and improve portfolio stability. Mackenzie also announced fund mergers to streamline and strengthen its product shelf.
Exchange Traded Funds
The addition of Exchange Traded Funds (ETF) has complemented Mackenzie’s broad and innovative fund line-up and reflects its investor-focused vision to provide advisors and investors with new solutions to drive investor outcomes and achieve their personal goals. These ETFs offer investors another investment option to utilize in building long-term diversified portfolios. Mackenzie’s current line-up consists of twenty-eight ETFs: fifteen active and strategic beta ETFs and thirteen traditional index ETFs. Since the launch in April 2016, Mackenzie’s ETF assets under management have grown to $3.3 billion at the end of March 31, 2019, an all-time high, inclusive of $898 million in investments from Mackenzie mutual funds. This ranks Mackenzie in seventh place in the Canadian ETF industry for assets under management.
Mutual Funds
On January 22, 2019, Mackenzie launched the Mackenzie Global Growth Balanced Fund to give investors increased access to
global markets. The Fund is managed by the award-winning Mackenzie Bluewater Team and Mackenzie Fixed Income Team.
On February 26, 2019, Mackenzie launched three new liquid alternative funds designed to manage the impact of market volatility and improve portfolio stability:
• Mackenzie Credit Absolute Return Fund
• Mackenzie Global Macro Fund
• Mackenzie Global Long/Short Equity Alpha Fund
These funds join the Mackenzie Multi-Strategy Absolute Return Fund and the Mackenzie Diversified Alternatives Fund to form a suite of alternative solutions that can be used to help clients solve investment challenges by providing uncorrelated sources of return, mitigating volatility and improving portfolio stability over the long term. Assets under management in alternative solutions passed $1 billion during the first quarter of 2019.
During the first quarter of 2019, Mackenzie merged two mutual funds to streamline and strengthen its product shelf and make it easier to navigate: Mackenzie Canadian All Cap Dividend Fund into the Mackenzie Canadian Large Cap Dividend Fund, and the Mackenzie Canadian All Cap Dividend Class into the Mackenzie Canadian Large Cap Dividend Class.
TABLE 10: CHANGE IN INVESTMENT FUND ASSETS UNDER MANAGEMENT – MACKENZIE(1)
% CHANGE
THREE MONTHS ENDED 2019 2018 2018 2018 2018 ($ millions) MAR. 31 DEC. 31 MAR. 31 DEC. 31 MAR. 31
Sales $ 2,505 $ 2,328 $ 2,630 7.6 % (4.8) %Redemptions 2,357 2,474 2,344 (4.7) 0.6
Mutual fund net sales (redemptions) 148 (146) 286 N/M (48.3)ETF net creations 228 137 715 66.4 (68.1)Inter-product eliminations – (82) (233) 100.0 100.0
Investment fund net sales (redemptions)(2) 376 (91) 768 N/M (51.0)Investment returns 4,242 (3,894) (317) N/M N/M
Net change in assets 4,618 (3,985) 451 N/M N/M
Beginning assets 55,508 59,493 56,543 (6.7) (1.8)
Ending assets $ 60,126 $ 55,508 $ 56,994 8.3 % 5.5 %
Consists of: Mutual funds $ 57,694 $ 53,407 $ 55,586 8.0 % 3.8 % ETFs 3,330 2,949 2,004 12.9 66.2 Inter-product eliminations (898) (848) (596) (5.9) (50.7)
Investment funds(2) $ 60,126 $ 55,508 $ 56,994 8.3 % 5.5 %
Daily average investment fund assets $ 58,184 $ 57,138 $ 57,070 1.8 % 2.0 %
(1) Mackenzie segment excludes investments into Mackenzie mutual funds by IG Wealth Management mutual funds from its assets under management and net sales.
(2) Total investment fund net sales and assets under management exclude Mackenzie mutual fund investments in ETFs.
C 18 POWER FINANCIAL CORPORATION�— �FIRST QUARTER REPORT 2019�
PFC_QUAT1_Eng03_IGM_2019-05-03_v1.indd D18PFC_QUAT1_Eng03_IGM_2019-05-03_v1.indd D18 19-05-10 6:53 AM19-05-10 6:53 AM

PA
RT
C
IGM
FINA
NC
IAL IN
C.
22 IGM FINANCIAL INC. FIRST QUARTER REPORT 2019 / MANAGEMENT’S DISCUSSION AND ANALYSIS
CHANGE IN ASSETS UNDER MANAGEMENT – Q1 2019 VS. Q1 2018
Mackenzie’s total assets under management at March 31, 2019 were $67.8 billion, an increase of 4.0% from $65.2 billion at March 31, 2018. Mackenzie’s sub-advisory, institutional and other accounts at March 31, 2019 were $7.7 billion, a decrease of 6.3% from $8.2 billion last year.
Mackenzie’s investment fund assets under management were $60.1 billion at March 31, 2019, an increase of 5.5% from March 31, 2018. Mackenzie’s mutual fund assets under management were $57.7 billion at March 31, 2019, an increase of 3.8% from $55.6 billion at March 31, 2018. Mackenzie’s ETF assets were $3.3 billion at March 31, 2019, inclusive of $898 million in investments from Mackenzie mutual funds, compared to $2.0 billion at March 31, 2018, inclusive of $596 million in investments from Mackenzie mutual funds.
In the three months ended March 31, 2019, Mackenzie’s mutual fund gross sales were $2.5 billion, a decrease of 4.8% from $2.6 billion in the comparative period last year. Mutual
fund redemptions in the current quarter were $2.4 billion, an increase of 0.6% from last year. Mutual fund net sales for the three months ended March 31, 2019 were $148 million, as compared to net sales of $286 million last year. In the three months ended March 31, 2019, ETF net creations were $228 million compared to ETF net creations of $715 million last year, inclusive of $233 million in investments from Mackenzie mutual funds. Investment fund net sales in the current quarter were $376 million compared to net sales of $768 million last year. During the current quarter, investment returns resulted in investment fund assets increasing by $4.2 billion compared to a decrease of $317 million last year.
Total net sales for the three months ended March 31, 2019 were $273 million, compared to net sales of $997 million last year. During the current quarter, investment returns resulted in assets increasing by $4.8 billion compared to a decrease of $345 million last year.
Redemptions of long-term mutual funds in the three months ended March 31, 2019, were $2.2 billion, consistent with last
TABLE 11: CHANGE IN TOTAL ASSETS UNDER MANAGEMENT – MACKENZIE(1)
% CHANGE
THREE MONTHS ENDED 2019 2018 2018 2018 2018 ($ millions) MAR. 31 DEC. 31 MAR. 31 DEC. 31 MAR. 31
Net sales (redemptions) Mutual funds $ 148 $ (146) $ 286 N/M % (48.3) % ETF net creations 228 137 715 66.4 (68.1) Inter-product eliminations – (82) (233) 100.0 100.0
Investment funds(2) 376 (91) 768 N/M (51.0) Sub-advisory, institutional and other accounts (103) (224) 229 54.0 N/M
Total net sales (redemptions) 273 (315) 997 N/M (72.6)Investment returns 4,775 (4,304) (345) N/M N/M
Net change in assets 5,048 (4,619) 652 N/M N/M
Beginning assets 62,728 67,347 64,509 (6.9) (2.8)
Ending assets $ 67,776 $ 62,728 $ 65,161 8.0 % 4.0 %
Consists of: Mutual funds $ 57,694 $ 53,407 $ 55,586 8.0 % 3.8 % ETFs 3,330 2,949 2,004 12.9 66.2 Inter-product eliminations (898) (848) (596) (5.9) (50.7)
Investment funds(2) 60,126 55,508 56,994 8.3 5.5 Sub-advisory, institutional and other accounts 7,650 7,220 8,167 6.0 (6.3)
Total assets under management $ 67,776 $ 62,728 $ 65,161 8.0 % 4.0 %
Average total assets(3) $ 65,613 $ 64,628 $ 65,233 1.5 % 0.6 %
(1) Mackenzie segment excludes investments into Mackenzie mutual funds by IG Wealth Management mutual funds from its assets under management and net sales.
(2) Total investment fund net sales and assets under management exclude Mackenzie mutual fund investments in ETFs.
(3) Based on daily average investment fund assets and month-end average sub-advisory, institutional and other assets.
POWER FINANCIAL CORPORATION�— �FIRST QUARTER REPORT 2019 C 19
PFC_QUAT1_Eng03_IGM_2019-05-03_v1.indd D19PFC_QUAT1_Eng03_IGM_2019-05-03_v1.indd D19 19-05-10 6:53 AM19-05-10 6:53 AM

PA
RT
C
IGM
FIN
AN
CIA
L IN
C.
IGM FINANCIAL INC. FIRST QUARTER REPORT 2019 / MANAGEMENT’S DISCUSSION AND ANALYSIS 23
year. Mackenzie’s annualized quarterly redemption rate for long-term mutual funds was 16.4% in the first quarter of 2019, compared to 16.5% in the first quarter of 2018. Mackenzie’s twelve-month trailing redemption rate for long-term mutual funds was 17.0% at March 31, 2019, as compared to 13.7% last year. Mackenzie’s twelve-month trailing redemption rate for long-term funds, excluding rebalance transactions, was 15.6% at March 31, 2019 and 13.7% at March 31, 2018. The corresponding average twelve-month trailing redemption rate for long-term mutual funds for all other members of IFIC was approximately 16.6% at March 31, 2019. Mackenzie’s twelve-month trailing redemption rate is comprised of the weighted average redemption rate for front-end load assets, deferred sales charge and low load assets with redemption fees, and deferred sales charge assets without redemption fees (matured assets). Generally, redemption rates for front-end load assets and matured assets are higher than the redemption rates for deferred sales charge and low load assets with redemption fees.
CHANGE IN ASSETS UNDER MANAGEMENT – Q1 2019 VS. Q4 2018
Mackenzie’s total assets under management at March 31, 2019, were $67.8 billion, an increase of 8.0% from $62.7 billion at December 31, 2018. Mackenzie’s sub-advisory, institutional and other accounts at March 31, 2019 were $7.7 billion, an increase of 6.0% from $7.2 billion at December 31, 2018.
Mackenzie’s investment fund assets under management were $60.1 billion at March 31, 2019, an increase of 8.3% from $55.5 billion at December 31, 2018. Mackenzie’s mutual fund
assets under management were $57.7 billion at March 31, 2019, an increase of 8.0% from $53.4 billion at December 31, 2018. Mackenzie’s ETF assets were $3.3 billion at March 31, 2019, inclusive of $898 million in investments from Mackenzie mutual funds compared to $2.9 billion at December 31, 2018, inclusive of $848 million investments from Mackenzie mutual funds.
For the quarter ended March 31, 2019, Mackenzie mutual fund gross sales were $2.5 billion, an increase of 7.6% from the fourth quarter of 2018. Mutual fund redemptions, which totalled $2.4 billion for the first quarter, decreased by 4.7% from the previous quarter. Net sales of Mackenzie mutual funds for the current quarter were $148 million compared with net redemptions of $146 million in the previous quarter.
Redemptions of long-term mutual fund assets in the current quarter were $2.2 billion, compared to $2.4 billion in the fourth quarter of 2018. Mackenzie’s annualized quarterly redemption rate for long-term mutual funds for the current quarter was 16.4% compared to 17.1% for the fourth quarter of 2018. Net sales of long-term funds for the current quarter were $135 million compared to net redemptions of $136 million in the previous quarter.
For the quarter ended March 31, 2019, Mackenzie ETF net creations were $228 million, an increase of 66.4% from $137 million in the fourth quarter of 2018. ETF net creations were inclusive of $82 million in investments from Mackenzie mutual funds in the fourth quarter.
Investment fund net sales in the current quarter were $376 million compared to net redemptions of $91 million in the fourth quarter.
C 20 POWER FINANCIAL CORPORATION�— �FIRST QUARTER REPORT 2019�
PFC_QUAT1_Eng03_IGM_2019-05-03_v1.indd D20PFC_QUAT1_Eng03_IGM_2019-05-03_v1.indd D20 19-05-10 6:53 AM19-05-10 6:53 AM

PA
RT
C
IGM
FINA
NC
IAL IN
C.
24 IGM FINANCIAL INC. FIRST QUARTER REPORT 2019 / MANAGEMENT’S DISCUSSION AND ANALYSIS
REVIEW OF SEGMENT OPERATING RESULTS
The investment management functions of IG Wealth Management and Mackenzie form a single global investment management organization under Mackenzie to support both companies. Mackenzie’s segment excludes investment advisory mandates to IG Wealth Management funds and investments into Mackenzie mutual funds by IG Wealth Management mutual funds and revenue earned on these mandates are not reflected within Mackenzie’s segment revenues. Mackenzie’s segment reflects its proportionate share of the expenses of the investment management function and aligns with internal management reporting.
Mackenzie’s earnings before interest and taxes are presented in Table 12.
Q1 2019 VS. Q1 2018
REVENUES
The largest component of Mackenzie’s revenues is management fees. The amount of management fees depends on the level and composition of assets under management. Management fee rates vary depending on the investment objective and the account type of the underlying assets under management. For example, equity-based mandates have higher management fee rates than fixed income mandates and retail mutual fund accounts have higher management fee rates than sub-advised and institutional accounts. The majority of Mackenzie’s mutual fund assets are purchased on a retail basis.
Within Mackenzie’s retail mutual fund offering, certain series are offered for fee-based programs of participating dealers whereby dealer compensation on such series is charged directly by the dealer to a client (primarily Series F). As Mackenzie does not pay the dealer compensation, these series have lower management fees. At March 31, 2019, these series had $9.2 billion in assets, an increase of 23.9% from the prior year.
Management fees were $168.3 million for the three months ended March 31, 2019, a decrease of $7.6 million or 4.3% from $175.9 million last year. The net decrease in management fees was due to a decline in the average management fee rate, partially offset by an increase in average assets under management of 0.6%. Mackenzie’s average management fee rate was 104.0 basis points during the current quarter compared to 109.4 basis points in 2018. The decrease in the average management fee rate in the current quarter was due to a change in the composition of assets under management, including the impact of having a greater share in non-retail priced products and Series F and the impact of the pricing changes implemented during 2018. These changes included switching of qualified investors into its Private Wealth Series and the reduction of management fees on mutual funds and ETFs.
Mackenzie earns administration fees primarily from providing services to its investment funds. Administration fees were $23.3 million for the three months ended March 31, 2019, a decrease of $1.6 million or 6.4% from last year.
TABLE 12: OPERATING RESULTS – MACKENZIE
% CHANGE
THREE MONTHS ENDED 2019 2018 2018 2018 2018 ($ millions) MAR. 31 DEC. 31 MAR. 31 DEC. 31 MAR. 31
Revenues Management fees $ 168.3 $ 169.9 $ 175.9 (0.9) % (4.3) % Administration fees 23.3 23.8 24.9 (2.1) (6.4) Distribution fees 1.4 1.4 2.1 – (33.3)
193.0 195.1 202.9 (1.1) (4.9) Net investment income and other 4.2 (3.1) (0.2) N/M N/M
197.2 192.0 202.7 2.7 (2.7)
Expenses Commission 7.6 5.7 9.9 33.3 (23.2) Trailing commission 64.9 64.0 65.4 1.4 (0.8) Non-commission 88.8 86.9 85.8 2.2 3.5
161.3 156.6 161.1 3.0 0.1
Earnings before interest and taxes $ 35.9 $ 35.4 $ 41.6 1.4 % (13.7) %
POWER FINANCIAL CORPORATION�— �FIRST QUARTER REPORT 2019 C 21
PFC_QUAT1_Eng03_IGM_2019-05-03_v1.indd D21PFC_QUAT1_Eng03_IGM_2019-05-03_v1.indd D21 19-05-10 6:53 AM19-05-10 6:53 AM

PA
RT
C
IGM
FIN
AN
CIA
L IN
C.
IGM FINANCIAL INC. FIRST QUARTER REPORT 2019 / MANAGEMENT’S DISCUSSION AND ANALYSIS 25
Mackenzie earns distribution fee income on redemptions of mutual fund assets sold on a deferred sales charge purchase option and on a low load purchase option. Redemption fees charged for deferred sales charge assets range from 5.5% in the first year and decrease to zero after seven years. Redemption fees for low load assets range from 2.0% to 3.0% in the first year and decrease to zero after two or three years, depending on the purchase option. Distribution fee income in the three months ended March 31, 2019 was $1.4 million, a decrease of $0.7 million from $2.1 million last year.
Net investment income and other includes investment returns related to Mackenzie’s investments in proprietary funds. These investments are generally made in the process of launching a fund and are sold as third party investors subscribe. Net investment income and other was $4.2 million for the three months ended March 31, 2019 compared to ($0.2) million last year.
EXPENSES
Mackenzie’s expenses were $161.3 million for the three months ended March 31, 2019, an increase of $0.2 million or 0.1% from $161.1 million in 2018.
Mackenzie pays selling commissions to the dealers that sell its mutual funds on a deferred sales charge and low load purchase option. Commissions paid are expensed as incurred.
Commission expense was $7.6 million in the three months ended March 31, 2019, as compared to $9.9 million last year.
Trailing commissions paid to dealers are paid on certain classes of retail mutual funds and are calculated as a percentage of mutual fund assets under management. These fees vary depending on the fund type and the purchase option upon which the fund was sold: front-end, deferred sales charge or low load. Trailing commissions were $64.9 million in the three months ended March 31, 2019, a decrease of $0.5 million or 0.8% from $65.4 million last year. The decline in trailing commissions in the three months ended March 31, 2019 was due to the decline in the effective trailing commission rate. Trailing commissions as a percentage of average mutual fund assets under management were 46.4 basis points in the three months ended March 31, 2019 compared to 46.8 basis points in the three months ended March 31, 2018. The decline was due to a change in composition of mutual fund assets towards those series within mutual funds that do not pay trailing commissions.
Non-commission expenses are incurred by Mackenzie in the administration, marketing and management of its assets under management. Non-commission expenses were $88.8 million in the three months ended March 31, 2019, an increase of $3.0 million or 3.5% from $85.8 million in 2018.
Q1 2019 VS. Q4 2018
REVENUES
Mackenzie’s revenues were $197.2 million for the current quarter, an increase of $5.2 million or 2.7% from $192.0 million in the fourth quarter.
Management fees were $168.3 million for the current quarter, a decrease of $1.6 million or 0.9% from $169.9 million in the fourth quarter. Factors contributing to the decrease in management fees are as follows:
• Average assets under management were $65.6 billion in the current quarter, a 1.5% increase from $64.6 billion in the prior quarter.
• Mackenzie’s average management fee rate was 104.0 basis points in the current quarter compared to 104.3 basis points in the prior quarter.
• There were two fewer calendar days in the first quarter of 2019 compared to the fourth quarter of 2018, which resulted in a decrease of $3.7 million.
Administration fees were $23.3 million in the current quarter, a decrease of 2.1% from $23.8 million in the fourth quarter.
Net investment income and other includes investment returns related to Mackenzie’s investments in proprietary funds. Net investment income and other was $4.2 million for the current quarter compared to ($3.1) million in the fourth quarter.
EXPENSES
Mackenzie’s expenses were $161.3 million for the current quarter, an increase of $4.7 million or 3.0% from $156.6 million in the fourth quarter.
Commission expense related to selling commissions paid was $7.6 million in the quarter ended March 31, 2019, as compared to $5.7 million in the fourth quarter.
Trailing commissions were $64.9 million in the current quarter, an increase of $0.9 million or 1.4% from $64.0 million in the fourth quarter. The change in trailing commissions reflects the 1.8% period over period increase in average mutual fund assets under management, offset in part, by a decline in the effective trailing commission rate. The effective trailing commission rate was 46.4 basis points in the current quarter compared to 46.6 basis points in the fourth quarter.
Non-commission expenses were $88.8 million in the current quarter, compared to $86.9 million in the fourth quarter. The increase was partially due to the seasonal nature of certain expenses normally incurred in the first quarter.
C 22 POWER FINANCIAL CORPORATION�— �FIRST QUARTER REPORT 2019�
PFC_QUAT1_Eng03_IGM_2019-05-03_v1.indd D22PFC_QUAT1_Eng03_IGM_2019-05-03_v1.indd D22 19-05-10 6:53 AM19-05-10 6:53 AM

PA
RT
C
IGM
FINA
NC
IAL IN
C.
26 IGM FINANCIAL INC. FIRST QUARTER REPORT 2019 / MANAGEMENT’S DISCUSSION AND ANALYSIS
CORPORATE AND OTHERREVIEW OF SEGMENT OPERATING RESULTS
The Corporate and Other segment includes net investment income not allocated to the IG Wealth Management or Mackenzie segments, the Company’s proportionate share of earnings of its associates, Great-West Lifeco Inc. (Lifeco), China Asset Management Co., Ltd. (China AMC) and Personal Capital Corporation (Personal Capital), operating results for Investment Planning Counsel Inc., other income, as well as consolidation elimination entries.
In January 2019, the Company invested an additional amount of $66.8 million (USD $50.0 million) in Personal Capital which increased its voting interest to 22.7% (March 31, 2018 – 15.5%). The Company uses the equity method to account for its investment in Personal Capital as it exercises significant influence. Significant influence arises from its voting interest and board representation.
The Company also has investments in Wealthsimple Financial Corporation and Portag3 Ventures LP.
Corporate and other earnings before interest and taxes are presented in Table 13.
Q1 2019 VS. Q1 2018The proportionate share of associates’ earnings decreased by $5.3 million in the first quarter of 2019, compared to 2018. These earnings reflect equity earnings from Lifeco and China AMC for all periods under review and from Personal
Capital beginning in the first quarter 2019, as discussed in the Consolidated Financial Position section of this MD&A. The decrease resulted primarily from the inclusion of the Company’s proportionate share of Personal Capital’s losses of $3.4 million in the first quarter of 2019 as well as a decrease in Lifeco’s earnings of $1.5 million. Net investment income and other increased to $6.0 million in the first quarter of 2019 compared to $4.0 million in 2018.
Earnings before interest and taxes related to Investment Planning Counsel were $0.8 million higher in the first quarter of 2019 compared to the same period in 2018.
Q1 2019 VS. Q4 2018The proportionate share of associates’ earnings were $32.7 million in the first quarter of 2019, a decrease of $1.9 million from the fourth quarter of 2018. The decrease resulted from the inclusion of the proportionate share of Personal Capital’s net losses of $3.4 million in the first quarter of 2019, which were offset by an increase of $1.3 million in Lifeco’s earnings from the fourth quarter of 2018. Net investment income and other was $6.0 million in the first quarter of 2019, compared to $5.3 million in the fourth quarter of 2018.
Earnings before interest and taxes related to Investment Planning Counsel were $1.5 million higher in the first quarter of 2019 compared to the prior quarter.
TABLE 13: OPERATING RESULTS – CORPORATE AND OTHER
% CHANGE
THREE MONTHS ENDED 2019 2018 2018 2018 2018 ($ millions) MAR. 31 DEC. 31 MAR. 31 DEC. 31 MAR. 31
Revenues Fee income $ 70.0 $ 71.6 $ 72.4 (2.2) % (3.3) % Net investment income and other 6.0 5.3 4.0 13.2 50.0 Proportionate share of associates’ earnings 32.7 34.6 38.0 (5.5) (13.9)
108.7 111.5 114.4 (2.5) (5.0)
Expenses Commission 45.2 46.4 46.0 (2.6) (1.7) Non-commission 22.7 22.5 22.6 0.9 0.4
67.9 68.9 68.6 (1.5) (1.0)
Earnings before interest and taxes $ 40.8 $ 42.6 $ 45.8 (4.2) % (10.9) %
POWER FINANCIAL CORPORATION�— �FIRST QUARTER REPORT 2019 C 23
PFC_QUAT1_Eng03_IGM_2019-05-03_v1.indd D23PFC_QUAT1_Eng03_IGM_2019-05-03_v1.indd D23 19-05-10 6:53 AM19-05-10 6:53 AM

PA
RT
C
IGM
FIN
AN
CIA
L IN
C.
IGM FINANCIAL INC. FIRST QUARTER REPORT 2019 / MANAGEMENT’S DISCUSSION AND ANALYSIS 27
IGM Financial’s total assets were $16.0 billion at March 31, 2019, compared to $15.6 billion at December 31, 2018.
OTHER INVESTMENTSThe composition of the Company’s securities holdings is detailed in Table 14.
FAIR VALUE THROUGH OTHER COMPREHENSIVE INCOME (FVTOCI)
Gains and losses on FVTOCI investments are recorded in Other comprehensive income.
Corporate Investments
Corporate investments is primarily comprised of the Company’s investments in Wealthsimple Financial Corporation (Wealthsimple), and Portag3 Ventures LP and Portag3 Ventures II LP (Portag3). In January 2019, the Company made an additional investment of $66.8 million (USD $50.0 million) in Personal Capital Corporation which increased its voting interest to 22.7% resulting in the reclassification of $217.0 million on the Consolidated Balance Sheet from Corporate investments to Investment in associates.
Portag3 Ventures LP and Portag3 Ventures II LP (Portag3) are early-stage investment funds dedicated to backing innovating financial services companies and are controlled by the Corporation’s parent, Power Financial Corporation. As at March 31, 2019, the Corporation had invested a total of $34.1 million in Portag3, including $16.2 million during 2018.
Wealthsimple Financial Corporation (“Wealthsimple”) is an online investment manager that provides financial investment guidance. As at March 31, 2019, the Corporation had invested a total of $152.9 million in Wealthsimple through a limited partnership controlled by the Corporation’s parent, Power Financial Corporation. The Corporation invested $17.9 million in the first quarter of 2019 and $72.3 million during 2018.
FAIR VALUE THROUGH PROFIT OR LOSS (FVTPL)
Securities classified as FVTPL include equity securities and proprietary investment funds. Gains and losses are recorded in Net investment income and other in the Consolidated Statements of Earnings.
Certain proprietary investment funds are consolidated where the Company has made the assessment that it controls the investment fund. The underlying securities of these funds are classified as FVTPL.
LOANSThe composition of the Company’s loans is detailed in Table 15.
Loans consisted of residential mortgages and represented 48.1% of total assets at March 31, 2019, compared to 49.6% at December 31, 2018.
Loans measured at amortized cost are primarily comprised of residential mortgages sold to securitization programs sponsored by third parties that in turn issue securities to investors. An offsetting liability, Obligations to securitization entities, has been recorded and totalled $7.5 billion at March 31, 2019, compared to $7.4 billion at December 31, 2018.
The Company holds loans pending sale or securitization. Loans measured at fair value through profit or loss are residential mortgages held temporarily by the Company pending sale. Loans held for securitization are carried at amortized cost. Total loans being held pending sale or securitization are $206.9 million at March 31, 2019 compared to $363.9 million at December 31, 2018.
Residential mortgages originated by IG Wealth Management are funded primarily through sales to third parties on a fully serviced basis, including Canada Mortgage and Housing Corporation (CMHC) or Canadian bank sponsored securitization programs.
IGM FINANCIAL INC.CONSOLIDATED FINANCIAL POSITION
TABLE 14: OTHER INVESTMENTS
MARCH 31, 2019 DECEMBER 31, 2018 ($ millions) COST FAIR VALUE COST FAIR VALUE
Fair value through other comprehensive income Corporate investments $ 196.2 $ 231.9 $ 303.6 $ 372.4
Fair value through profit or loss Equity securities 17.0 15.6 17.0 12.9 Proprietary investment funds 81.7 81.5 78.5 74.6
98.7 97.1 95.5 87.5
$ 294.9 $ 329.0 $ 399.1 $ 459.9
C 24 POWER FINANCIAL CORPORATION�— �FIRST QUARTER REPORT 2019�
PFC_QUAT1_Eng03_IGM_2019-05-03_v1.indd D24PFC_QUAT1_Eng03_IGM_2019-05-03_v1.indd D24 19-05-10 6:53 AM19-05-10 6:53 AM

PA
RT
C
IGM
FINA
NC
IAL IN
C.
28 IGM FINANCIAL INC. FIRST QUARTER REPORT 2019 / MANAGEMENT’S DISCUSSION AND ANALYSIS
information related to the Company’s securitization activities, including the Company’s hedges of related reinvestment and interest rate risk, can be found in the Financial Risk section of this MD&A and in Note 5 to the Interim Financial Statements.
INVESTMENT IN ASSOCIATES
Great-West Lifeco Inc. (Lifeco)
At March 31, 2019, the Company held a 4% equity interest in Lifeco. IGM Financial and Lifeco are controlled by Power Financial Corporation.
The equity method is used to account for IGM Financial’s investment in Lifeco, as it exercises significant influence. Changes in the carrying value for the quarter ended March 31, 2019 compared with 2018 are shown in Table 16.
Subsequent to March 31, 2019, the Company participated on a proportionate basis in the Lifeco substantial issuer bid by selling 2,400,255 of its shares in Lifeco for proceeds of $80.4 million. The Company’s 4% interest in Lifeco remains substantially unchanged.
China Asset Management Co., Ltd. (China AMC)
Founded in 1998 as one of the first fund management companies in China, China AMC has developed and maintained a position among the market leaders in China’s asset management industry.
China AMC’s total assets under management, excluding subsidiary assets under management, were RMB¥ 879.7 billion ($174.5 billion) at December 31, 2018, representing a decrease of 2.9% (CAD$ decrease of 3.1%) from RMB¥ 906.0 billion ($180.0 billion) at June 30, 2018.
The equity method is used to account for the Company’s 13.9% equity interest in China AMC, as it exercises significant influence. Changes in the carrying value for the quarter ended March 31, 2019 are shown in Table 16.
IG Wealth Management services $12.6 billion of residential mortgages, including $2.4 billion originated by subsidiaries of Lifeco.
SECURITIZATION ARRANGEMENTSThrough the Company’s mortgage banking operations, residential mortgages originated by IG Wealth Management mortgage planning specialists are sold to securitization trusts sponsored by third parties that in turn issue securities to investors. The Company securitizes residential mortgages through the CMHC sponsored National Housing Act Mortgage-Backed Securities (NHA MBS) and the Canada Mortgage Bond Program (CMB Program) and through Canadian bank-sponsored asset-backed commercial paper (ABCP) programs. The Company retains servicing responsibilities and certain elements of credit risk and prepayment risk associated with the transferred assets. The Company’s credit risk on its securitized mortgages is partially mitigated through the use of insurance. Derecognition of financial assets in accordance with IFRS is based on the transfer of risks and rewards of ownership. As the Company has retained prepayment risk and certain elements of credit risk associated with the Company’s securitization transactions through the CMB and ABCP programs, they are accounted for as secured borrowings. The Company records the transactions under these programs as follows: (i) the mortgages and related obligations are carried at amortized cost, with interest income and interest expense, utilizing the effective interest rate method, recorded over the term of the mortgages, (ii) the component of swaps entered into under the CMB Program whereby the Company pays coupons on Canada Mortgage Bonds and receives investment returns on the reinvestment of repaid mortgage principal, are recorded at fair value, and (iii) cash reserves held under the ABCP program are carried at amortized cost.
In the first quarter of 2019, the Company securitized loans through its mortgage banking operations with cash proceeds of $428.7 million compared to $369.4 million in 2018. Additional
TABLE 15: LOANS
2019 2018 ($ millions) MARCH 31 DECEMBER 31
Amortized cost $ 7,683.2 $ 7,734.5 Less: Allowance for expected credit losses 0.8 0.8
7,682.4 7,733.7Fair value through profit or loss 5.3 4.3
$ 7,687.7 $ 7,738.0
POWER FINANCIAL CORPORATION�— �FIRST QUARTER REPORT 2019 C 25
PFC_QUAT1_Eng03_IGM_2019-05-03_v1.indd D25PFC_QUAT1_Eng03_IGM_2019-05-03_v1.indd D25 19-05-10 6:53 AM19-05-10 6:53 AM

PA
RT
C
IGM
FIN
AN
CIA
L IN
C.
IGM FINANCIAL INC. FIRST QUARTER REPORT 2019 / MANAGEMENT’S DISCUSSION AND ANALYSIS 29
Personal Capital Corporation (Personal Capital)
Founded in 2009 in the United States, Personal Capital is a leading digital wealth manager that has experienced significant growth since its inception.
As at March 31, 2019, Personal Capital had 2.12 million registered users, individuals who have signed up to use Personal Capital’s free dashboard platform, representing an increase of 22.2% from 1.74 million at March 31, 2018 and an increase of 5.4% from 2.01 million at December 31, 2018.
Personal Capital’s total assets under management were USD $9.2 billion as at March 31, 2019, representing an increase of 39.2% from USD $6.6 billion at March 31, 2018 and an increase of 18.0% from USD $7.8 billion as at December 31, 2018.
Tracked Account Value (TAV), the net value of assets and liabilities aggregated by registered users, was USD $703 billion as at March 31, 2019, representing an increase of 32.2% from USD $532 billion at March 31, 2018 and an increase of 10.4% from USD $637 billion as at December 31, 2018.
The equity method is used to account for the Company’s 25.2% equity interest in Personal Capital, as it exercises significant influence. IGM Financial’s equity earnings from Personal Capital includes its proportionate share of Personal Capital’s net income adjusted by IGM Financial’s amortization of intangible assets that it recognized as part of its investment in the company. Changes in the carrying value for the quarter ended March 31, 2019 are shown in Table 16.
TABLE 16: INVESTMENT IN ASSOCIATES
THREE MONTHS ENDED MARCH 31, 2019 MARCH 31, 2018
PERSONAL ($ millions) LIFECO CHINA AMC CAPITAL TOTAL LIFECO CHINA AMC TOTAL
Carrying value, beginning of period $ 967.8 $ 683.5 $ – $ 1,651.3 $ 901.4 $ 647.9 $ 1,549.3 Transfer from corporate investments (FVTOCI) – – 217.0 217.0 Dividends received (16.4) – – (16.4) (15.5) – (15.5) Proportionate share of: Earnings(1) 28.7 7.4 (3.4) 32.7 30.2 7.8 38.0 Other comprehensive income (loss) and other adjustments 19.4 1.9 0.1 21.4 5.9 38.8 44.7
Carrying value, end of period $ 999.5 $ 692.8 $ 213.7 $ 1,906.0 $ 922.0 $ 694.5 $ 1,616.5
(1) The proportionate share of earnings from the Company’s investments in associates is recorded in Net investment income and other in the Corporate and other reportable segment (Tables 2-3).
C 26 POWER FINANCIAL CORPORATION�— �FIRST QUARTER REPORT 2019�
PFC_QUAT1_Eng03_IGM_2019-05-03_v1.indd D26PFC_QUAT1_Eng03_IGM_2019-05-03_v1.indd D26 19-05-10 6:53 AM19-05-10 6:53 AM

PA
RT
C
IGM
FINA
NC
IAL IN
C.
30 IGM FINANCIAL INC. FIRST QUARTER REPORT 2019 / MANAGEMENT’S DISCUSSION AND ANALYSIS
LIQUIDITYCash and cash equivalents totalled $837.1 million at March 31, 2019 compared with $650.2 million at December 31, 2018 and $778.2 million at March 31, 2018. Cash and cash equivalents related to the Company’s deposit operations were $3.3 million at March 31, 2019, compared to $2.4 million at December 31, 2018 and $2.4 million at March 31, 2018, as shown in Table 17.
Working capital, which consists of current assets less current liabilities, totalled $583.1 million at March 31, 2019 compared with $366.1 million at December 31, 2018 and $561.8 million at March 31, 2018 (Table 18). The increase in working capital is due to the issuance of debentures in the first quarter of 2019 totalling $250 million.
Working capital is utilized to:
• Finance ongoing operations, including the funding of sales commissions.
• Temporarily finance mortgages in its mortgage banking operations.
• Pay interest and dividends related to long-term debt and preferred shares.
• Maintain liquidity requirements for regulated entities.
• Pay quarterly dividends on its outstanding common shares.
• Finance common share repurchases, retirement of long-term debt and redemption of preferred shares.
IGM Financial continues to generate significant cash flows from its operations. Earnings before interest, taxes, depreciation and amortization before sales commissions (EBITDA before sales commissions) totalled $295.9 million in the first quarter of 2019 compared to $333.2 million in the first quarter of 2018 and $296.8 million in the fourth quarter of 2018. EBITDA before
sales commissions excludes the impact of both commissions paid and commission amortization (refer to Table 1).
Earnings before interest, taxes, depreciation and amortization after sales commissions (EBITDA after sales commissions) totalled $252.2 million in the first quarter of 2019 compared to $270.9 million in the first quarter of 2018 and $255.6 million in the fourth quarter of 2018. EBITDA after sales commissions excludes the impact of commission amortization (refer to Table 1).
Refer to the Financial Instruments Risk section of this MD&A for information related to other sources of liquidity and to the Company’s exposure to and management of liquidity and funding risk.
CASH FLOWS
Table 19 – Cash Flows is a summary of the Consolidated Statements of Cash Flows which forms part of the Interim Financial Statements for the quarter ended March 31, 2019. Cash and cash equivalents increased by $186.9 million in the first quarter of 2019 compared to a decrease of $188.6 million in 2018.
Adjustments to determine net cash from operating activities during the three month period of 2019 compared to 2018 consist of non-cash operating activities offset by cash operating activities:
• The add-back of amortization of capitalized sale commissions offset by the deduction of capitalized sales commissions paid.
• The add-back of amortization of capital and intangible assets.
• The deduction of investment in associates’ equity earnings offset by dividends received.
• The add-back of pension and other post-employment benefits offset by cash contributions.
CONSOLIDATED LIQUIDITY AND CAPITAL RESOURCES
TABLE 17: DEPOSIT OPERATIONS – FINANCIAL POSITION
2019 2018 2018 ($ millions) MAR. 31 DEC. 31 MAR. 31
Assets Cash and cash equivalents $ 3.3 $ 2.4 $ 2.4 Client funds on deposit 507.6 546.8 454.8 Accounts and other receivables 9.6 8.8 4.2 Loans 21.9 21.3 22.5
Total assets $ 542.4 $ 579.3 $ 483.9
Liabilities and shareholders’ equity Deposit liabilities $ 531.6 $ 568.8 $ 473.1 Other liabilities 0.5 0.5 0.5 Shareholders’ equity 10.3 10.0 10.3
Total liabilities and shareholders’ equity $ 542.4 $ 579.3 $ 483.9
POWER FINANCIAL CORPORATION�— �FIRST QUARTER REPORT 2019 C 27
PFC_QUAT1_Eng03_IGM_2019-05-03_v1.indd D27PFC_QUAT1_Eng03_IGM_2019-05-03_v1.indd D27 19-05-10 6:53 AM19-05-10 6:53 AM

PA
RT
C
IGM
FIN
AN
CIA
L IN
C.
IGM FINANCIAL INC. FIRST QUARTER REPORT 2019 / MANAGEMENT’S DISCUSSION AND ANALYSIS 31
• Changes in operating assets and liabilities and other.
• The deduction of restructuring provision cash payments.
Financing activities during the first quarter of 2019 compared to 2018 related to:
• An increase in obligations to securitization entities of $426.3 million and repayments of obligations to securitization entities of $321.0 million in 2019 compared to an increase in obligations to securitization entities of $361.5 million and repayments of obligations to securitization entities of $352.8 million in 2018.
• Issuance of debentures of $250.0 million in the first quarter of 2019.
• Repayment of debentures of $150.0 million in the first quarter of 2018.
• The purchase of 266,093 common shares in 2019 under IGM Financial’s normal course issuer bid at a cost of $9.2 million. There were no purchases in 2018.
• The payment of perpetual preferred share dividends which totalled $2.2 million in 2019, unchanged from 2018.
• The payment of regular common share dividends which totalled $135.5 million in 2019 compared to $135.4 million in 2018.
Investing activities during the first quarter of 2019 compared to 2018 primarily related to:
• The purchases of other investments totalling $35.4 million and sales of other investments with proceeds of $20.2 million in 2019 compared to $50.2 million and $25.8 million, respectively, in 2018.
TABLE 18: WORKING CAPITAL
2019 2018 2018 ($ millions) MAR. 31 DEC. 31 MAR. 31
Current Assets Cash and cash equivalents $ 837.1 $ 650.2 $ 777.9 Client funds on deposit 507.6 546.8 454.8 Accounts receivable and other assets 301.4 311.9 368.4 Current portion of mortgages and other 1,326.1 1,280.1 1,253.3
2,972.2 2,789.0 2,854.4
Current Liabilities Accounts and other payables 560.0 644.7 599.2 Deposits and certificates 524.5 562.4 465.8 Current portion of long-term liabilities 1,304.6 1,215.8 1,227.6
2,389.1 2,422.9 2,292.6
Working Capital $ 583.1 $ 366.1 $ 561.8
TABLE 19: CASH FLOWS
THREE MONTHS ENDED 2019 2018 ($ millions) MAR. 31 MAR. 31 % CHANGE
Operating activities Earnings before income taxes $ 214.8 $ 240.1 (10.5) % Income taxes paid (96.6) (38.4) (151.6) Adjustments to determine net cash from operating activities (89.3) (83.8) (6.6)
28.9 117.9 (75.5)Financing activities 207.4 (273.8) N/M
Investing activities (49.4) (32.7) (51.1)
Change in cash and cash equivalents 186.9 (188.6) N/M
Cash and cash equivalents, beginning of period 650.2 966.8 (32.7)
Cash and cash equivalents, end of period $ 837.1 $ 778.2 7.6 %
C 28 POWER FINANCIAL CORPORATION�— �FIRST QUARTER REPORT 2019�
PFC_QUAT1_Eng03_IGM_2019-05-03_v1.indd D28PFC_QUAT1_Eng03_IGM_2019-05-03_v1.indd D28 19-05-10 6:53 AM19-05-10 6:53 AM

PA
RT
C
IGM
FINA
NC
IAL IN
C.
32 IGM FINANCIAL INC. FIRST QUARTER REPORT 2019 / MANAGEMENT’S DISCUSSION AND ANALYSIS
• An increase in loans of $293.3 million with repayments of loans and other of $341.3 million in 2019 compared to $383.6 million and $403.0 million, respectively, in 2018 primarily related to residential mortgages in the Company’s mortgage banking operations.
• Net cash used in additions to intangible assets and acquisitions was $10.2 million in 2019 compared to $23.1 million in 2018.
• An additional investment in Personal Capital of $66.8 million in 2019.
CAPITAL RESOURCESThe Company’s capital management objective is to maximize shareholder returns while ensuring that the Company is capitalized in a manner which appropriately supports regulatory capital requirements, working capital needs and business expansion. The Company’s capital management practices are focused on preserving the quality of its financial position by maintaining a solid capital base and a strong balance sheet. Capital of the Company consists of long-term debt, perpetual preferred shares and common shareholders’ equity which totalled $6.6 billion at March 31, 2019, compared to $6.4 billion at December 31, 2018. The Company regularly assesses its capital management practices in response to changing economic conditions.
The Company’s capital is primarily utilized in its ongoing business operations to support working capital requirements, long-term investments made by the Company, business expansion and other strategic objectives. Subsidiaries subject to regulatory capital requirements include investment dealers, mutual fund dealers, exempt market dealers, portfolio managers, investment fund managers and a trust company. These subsidiaries are required to maintain minimum levels of capital based on either working capital, liquidity or shareholders’ equity. The Company’s subsidiaries have complied with all regulatory capital requirements.
The total outstanding long-term debt was $2.1 billion at March 31, 2019, compared to $1.9 billion at December 31, 2018. Long-term debt is comprised of debentures which are senior unsecured debt obligations of the Company subject to standard covenants, including negative pledges, but which do not include any specified financial or operational covenants. The net increase in long-term debt resulted from the issuance on March 20, 2019 of $250.0 million 4.206% debentures maturing March 21, 2050.
Perpetual preferred shares of $150 million at March 31, 2019 remain unchanged from December 31, 2018.
The net proceeds from the issuance of the debenture was used by the Company in part to fund the redemption of $150 million 5.90% Non-Cumulative First Preferred Shares, Series B and for general corporate purposes. The Company redeemed the Series B Preferred Shares on April 30, 2019.
The Company purchased 266,093 common shares during the first quarter of 2019 at a cost of $9.2 million under its normal course issuer bid (refer to Note 8 to the Interim Financial Statements). The Company commenced a normal course issuer bid on March 26, 2019 to purchase up to 4 million of its common shares to provide the flexibility to manage its capital position while generating value for shareholders.
In connection with its normal course issuer bid, the Company has established an automatic securities purchase plan for its common shares. The automatic securities purchase plan provides standard instructions regarding how IGM Financial’s common shares are to be purchased under its normal course issuer bid during certain pre-determined trading blackout periods. Outside of these pre-determined trading blackout periods, purchases under the Company’s normal course issuer bid will be completed based upon management’s discretion.
Other activities in the first quarter of 2019 included the declaration of perpetual preferred share dividends of $2.2 million or $0.36875 per share and common share dividends of $135.5 million or $0.5625 per share. Changes in common share capital are reflected in the Consolidated Statements of Changes in Shareholders’ Equity.
Standard & Poor’s (S&P) current rating on the Company’s senior unsecured debentures is “A” with a stable outlook. Dominion Bond Rating Service’s (DBRS) current rating on the Company’s senior unsecured debentures is “A (High)” with a stable rating trend.
Credit ratings are intended to provide investors with an independent measure of the credit quality of the securities of a company and are indicators of the likelihood of payment and the capacity of a company to meet its obligations in accordance with the terms of each obligation. Descriptions of the rating categories for each of the agencies set forth below have been obtained from the respective rating agencies’ websites.
These ratings are not a recommendation to buy, sell or hold the securities of the Company and do not address market price or other factors that might determine suitability of a specific security for a particular investor. The ratings also may not reflect the potential impact of all risks on the value of securities and are subject to revision or withdrawal at any time by the rating organization.
The A rating assigned to IGM Financial’s senior unsecured debentures by S&P is the sixth highest of the 22 ratings used for long-term debt. This rating indicates S&P’s view that the Company’s capacity to meet its financial commitment on the obligation is strong, but the obligation is somewhat more susceptible to the adverse effects of changes in circumstances and economic conditions than obligations in higher rated categories.
POWER FINANCIAL CORPORATION�— �FIRST QUARTER REPORT 2019 C 29
PFC_QUAT1_Eng03_IGM_2019-05-03_v1.indd D29PFC_QUAT1_Eng03_IGM_2019-05-03_v1.indd D29 19-05-10 6:53 AM19-05-10 6:53 AM
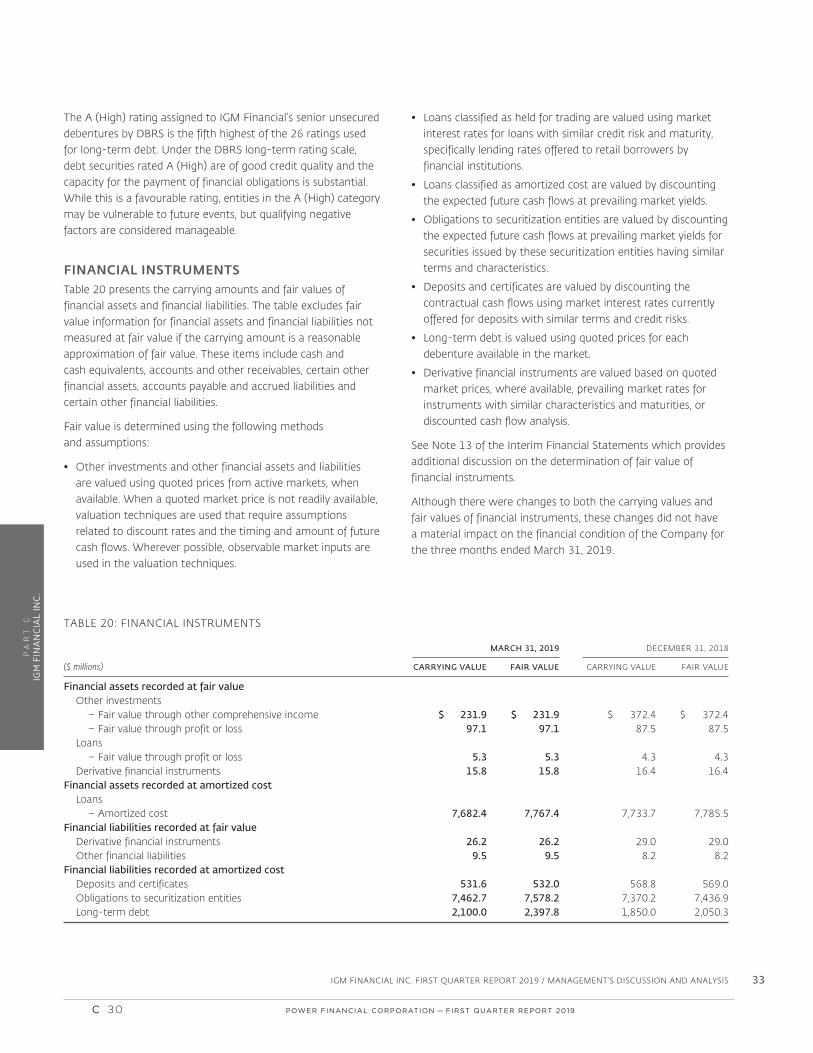
PA
RT
C
IGM
FIN
AN
CIA
L IN
C.
IGM FINANCIAL INC. FIRST QUARTER REPORT 2019 / MANAGEMENT’S DISCUSSION AND ANALYSIS 33
The A (High) rating assigned to IGM Financial’s senior unsecured debentures by DBRS is the fifth highest of the 26 ratings used for long-term debt. Under the DBRS long-term rating scale, debt securities rated A (High) are of good credit quality and the capacity for the payment of financial obligations is substantial. While this is a favourable rating, entities in the A (High) category may be vulnerable to future events, but qualifying negative factors are considered manageable.
FINANCIAL INSTRUMENTSTable 20 presents the carrying amounts and fair values of financial assets and financial liabilities. The table excludes fair value information for financial assets and financial liabilities not measured at fair value if the carrying amount is a reasonable approximation of fair value. These items include cash and cash equivalents, accounts and other receivables, certain other financial assets, accounts payable and accrued liabilities and certain other financial liabilities.
Fair value is determined using the following methods and assumptions:
• Other investments and other financial assets and liabilities are valued using quoted prices from active markets, when available. When a quoted market price is not readily available, valuation techniques are used that require assumptions related to discount rates and the timing and amount of future cash flows. Wherever possible, observable market inputs are used in the valuation techniques.
• Loans classified as held for trading are valued using market interest rates for loans with similar credit risk and maturity, specifically lending rates offered to retail borrowers by financial institutions.
• Loans classified as amortized cost are valued by discounting the expected future cash flows at prevailing market yields.
• Obligations to securitization entities are valued by discounting the expected future cash flows at prevailing market yields for securities issued by these securitization entities having similar terms and characteristics.
• Deposits and certificates are valued by discounting the contractual cash flows using market interest rates currently offered for deposits with similar terms and credit risks.
• Long-term debt is valued using quoted prices for each debenture available in the market.
• Derivative financial instruments are valued based on quoted market prices, where available, prevailing market rates for instruments with similar characteristics and maturities, or discounted cash flow analysis.
See Note 13 of the Interim Financial Statements which provides additional discussion on the determination of fair value of financial instruments.
Although there were changes to both the carrying values and fair values of financial instruments, these changes did not have a material impact on the financial condition of the Company for the three months ended March 31, 2019.
TABLE 20: FINANCIAL INSTRUMENTS
MARCH 31, 2019 DECEMBER 31, 2018 ($ millions) CARRYING VALUE FAIR VALUE CARRYING VALUE FAIR VALUE
Financial assets recorded at fair value Other investments – Fair value through other comprehensive income $ 231.9 $ 231.9 $ 372.4 $ 372.4 – Fair value through profit or loss 97.1 97.1 87.5 87.5 Loans – Fair value through profit or loss 5.3 5.3 4.3 4.3 Derivative financial instruments 15.8 15.8 16.4 16.4Financial assets recorded at amortized cost Loans – Amortized cost 7,682.4 7,767.4 7,733.7 7,785.5Financial liabilities recorded at fair value Derivative financial instruments 26.2 26.2 29.0 29.0 Other financial liabilities 9.5 9.5 8.2 8.2Financial liabilities recorded at amortized cost Deposits and certificates 531.6 532.0 568.8 569.0 Obligations to securitization entities 7,462.7 7,578.2 7,370.2 7,436.9 Long-term debt 2,100.0 2,397.8 1,850.0 2,050.3
C 30 POWER FINANCIAL CORPORATION�— �FIRST QUARTER REPORT 2019�
PFC_QUAT1_Eng03_IGM_2019-05-03_v1.indd D30PFC_QUAT1_Eng03_IGM_2019-05-03_v1.indd D30 19-05-10 6:53 AM19-05-10 6:53 AM
PA
RT
C
IGM
FINA
NC
IAL IN
C.
34 IGM FINANCIAL INC. FIRST QUARTER REPORT 2019 / MANAGEMENT’S DISCUSSION AND ANALYSIS
The Company is exposed to a variety of risks that are inherent in its business activities. Its ability to manage these risks is key to its ongoing success. The Company emphasizes a strong risk management culture and the implementation of an effective risk management approach. The risk management approach coordinates risk management across the organization and its business units and seeks to ensure prudent and measured risk-taking in order to achieve an appropriate balance between risk and return. Fundamental to our enterprise risk management program is protecting and enhancing our reputation.
RISK MANAGEMENT FRAMEWORKThe Company’s risk management approach is undertaken through its Enterprise Risk Management (ERM) Framework which includes five core elements: risk governance, risk appetite, risk principles, a defined risk management process, and risk management culture. The ERM Framework is established under the Company’s ERM Policy, which is approved by the Risk Management Committee.
RISK GOVERNANCE
The Company’s risk governance structure emphasizes a comprehensive and consistent framework throughout the Company and its subsidiaries, with identified ownership of risk management in each business unit and oversight by an executive Risk Management Committee accountable to the Board of Directors. Additional oversight is provided by the Enterprise Risk Management (ERM) Department, compliance groups, and the Company’s Internal Audit Department.
The Board of Directors provides primary oversight and carries out its risk management mandate. The Board is responsible for the oversight of enterprise risk management by: i) ensuring that appropriate procedures are in place to identify and manage risks and establish risk tolerances, ii) ensuring that appropriate policies, procedures and controls are implemented to manage risks, and iii) reviewing the risk management process on a regular basis to ensure that it is functioning effectively.
Other specific risks are managed with the support of the following Board committees:
• The Audit Committee has specific risk oversight responsibilities in relation to financial disclosure, internal controls and the control environment as well as the Company’s compliance activities.
• Other committees having specific risk oversight responsibilities include: i) the Human Resource Committee which oversees compensation policies and practices, ii) the Governance and Nominating Committee which oversees corporate governance practices, and iii) the Related Party and Conduct Review Committee which oversees conflicts of interest as well as the
administration of the Code of Business Conduct and Ethics for Directors, Officers and Employees (Code of Conduct).
Management oversight for risk management resides with the executive Risk Management Committee which is comprised of the President and Chief Executive Officer, IGM Financial and IG Wealth Management, the President and Chief Executive Officer, Mackenzie Investments, the Chief Financial Officer, the General Counsel, the Chief Operating Officer and the Executive Vice President Chief Strategy and Corporate Development Officer. The committee is responsible for providing oversight of the Company’s risk management process by: i) establishing and maintaining the risk framework and policy, ii) defining the Company’s risk appetite, iii) ensuring the Company’s risk profile and processes are aligned with corporate strategy and risk appetite, and iv) establishing “tone at the top” and reinforcing a strong culture of risk management.
The Chief Executive Officers of the operating companies have overall responsibility for overseeing risk management of their respective companies.
The Company has assigned responsibility for risk management using the Three Lines of Defence model, with the First Line reflecting the business units having primary responsibility for risk management, supported by Second Line risk management functions and a Third Line Internal Audit function providing assurance and validation of the design and effectiveness of the ERM Framework.
First Line of Defence
The leaders of the various business units and support functions have primary ownership and accountability for the ongoing risk management associated with their respective activities. Responsibilities of business unit and support function leaders include: i) establishing and maintaining procedures for the identification, assessment, documentation and escalation of risks, ii) implementing control activities to mitigate risks, iii) identifying opportunities for risk reduction or transfer, and iv) aligning business and operational strategies with the risk culture and risk appetite of the organization as established by the Risk Management Committee.
Second Line of Defence
The Enterprise Risk Management (ERM) Department provides oversight, analysis and reporting to the Risk Management Committee on the level of risks relative to the established risk appetite for all activities of the Company. Other responsibilities include: i) developing and maintaining the enterprise risk management program and framework, ii) managing the enterprise risk management process, and iii) providing guidance and training to business unit and support function leaders.
RISK MANAGEMENT
POWER FINANCIAL CORPORATION�— �FIRST QUARTER REPORT 2019 C 31
PFC_QUAT1_Eng03_IGM_2019-05-03_v1.indd D31PFC_QUAT1_Eng03_IGM_2019-05-03_v1.indd D31 19-05-10 6:53 AM19-05-10 6:53 AM

PA
RT
C
IGM
FIN
AN
CIA
L IN
C.
IGM FINANCIAL INC. FIRST QUARTER REPORT 2019 / MANAGEMENT’S DISCUSSION AND ANALYSIS 35
The Company has a number of committees of senior business leaders which provide oversight of specific business risks, including the Financial Risk Management and Operational Risk Management committees. These committees perform critical reviews of risk assessments, risk management practices and risk response plans developed by business units and support functions.
Other oversight accountabilities reside with the Company’s corporate and compliance groups which are responsible for ensuring compliance with policies, laws and regulations.
Third Line of Defence
The Internal Audit Department is the third line of defence and provides independent assurance to senior management and the Board of Directors on the effectiveness of risk management policies, processes and practices.
RISK APPETITE AND RISK PRINCIPLES
The Risk Management Committee establishes the Company’s appetite for different types of risk through the Risk Appetite Framework. Under the Risk Appetite Framework, one of four appetite levels is established for each risk type and business activity of the Company. These appetite levels range from those where the Company has no appetite for risk and seeks to minimize any losses, to those where the Company readily accepts exposure while seeking to ensure that risks are well understood and managed. These appetite levels guide our business units as they engage in business activities, and inform them in establishing policies, limits, controls and risk transfer activities.
A Risk Appetite Statement and Risk Principles provide further guidance to business leaders and employees as they conduct risk management activities. The Risk Appetite Statement’s emphasis is to maintain the Company’s reputation and brand, ensure financial flexibility, and focus on mitigating operational risk.
RISK MANAGEMENT PROCESS
The Company’s risk management process is designed to foster:
• Ongoing assessment of risks and tolerance in a changing operating environment.
• Appropriate identification and understanding of existing and emerging risks and risk response.
• Timely monitoring and escalation of risks based upon changing circumstances.
Significant risks that may adversely affect the Company’s ability to achieve its strategic and business objectives are identified through the Company’s ongoing risk management process.
We use a consistent methodology across our organizations and business units for identification and assessment of risks.
Risks are assessed by evaluating the impact and likelihood of the potential risk event after consideration of controls and any risk transfer activities. The results of these assessments are considered relative to risk appetite and tolerances and may result in action plans to adjust the risk profile.
Risk assessments are monitored and reviewed on an ongoing basis by business units and by oversight areas including the ERM Department. The ERM Department promotes and coordinates communication and consultation to support effective risk management and escalation. The ERM Department regularly reports on the results of risk assessments and on the assessment process to the Risk Management Committee and to the Board of Directors.
RISK MANAGEMENT CULTURE
Risk management is intended to be everyone’s responsibility within the organization. The ERM Department engages all business units in workshops to foster awareness and incorporation of our risk framework into our business activities.
We have an established business planning process which reinforces our risk management culture. Our compensation programs are typically objectives-based, and do not encourage or reward excessive or inappropriate risk taking, and often are aligned specifically with risk management objectives.
Our risk management program emphasizes integrity, ethical practices, responsible management and measured risk-taking with a long-term view. Our standards of integrity and ethics are reflected within our Code of Conduct which applies to directors, officers and employees.
KEY RISKS OF THE BUSINESSThe Company identifies risks to which its businesses and operations could be exposed considering factors both internal and external to the organization. These risks are broadly grouped into six categories.
1) FINANCIAL RISK
LIQUIDITY AND FUNDING RISK
Liquidity and funding risk is the risk of the inability to generate or obtain sufficient cash in a timely and cost-effective manner to meet contractual or anticipated commitments as they come due or arise.
The Company’s liquidity management practices include:
• Maintaining liquid assets and lines of credit to satisfy near term liquidity needs.
• Ensuring effective controls over liquidity management processes.
C 32 POWER FINANCIAL CORPORATION�— �FIRST QUARTER REPORT 2019�
PFC_QUAT1_Eng03_IGM_2019-05-03_v1.indd D32PFC_QUAT1_Eng03_IGM_2019-05-03_v1.indd D32 19-05-10 6:53 AM19-05-10 6:53 AM

PA
RT
C
IGM
FINA
NC
IAL IN
C.
36 IGM FINANCIAL INC. FIRST QUARTER REPORT 2019 / MANAGEMENT’S DISCUSSION AND ANALYSIS
• Performing regular cash forecasts and stress testing.
• Regular assessment of capital market conditions and the Company’s ability to access bank and capital market funding.
• Ongoing efforts to diversify and expand long-term mortgage funding sources.
• Oversight of liquidity management by the Financial Risk Management Committee, a committee of finance business leaders.
A key funding requirement for the Company is the funding of commissions paid on the sale of investment funds. Commissions on the sale of investment funds continue to be paid from operating cash flows.
The Company also maintains sufficient liquidity to fund and temporarily hold mortgages pending sale or securitization to long-term funding sources and to manage any derivative collateral requirements related to the mortgage banking operation. Through its mortgage banking operations, residential mortgages are sold to third parties including certain mutual funds, institutional investors through private placements, Canadian bank-sponsored securitization trusts, and by issuance and sale of National Housing Act Mortgage-Backed Securities (NHA MBS) securities including sales to Canada Housing Trust under the CMB Program. The Company maintains committed capacity within certain Canadian bank-sponsored securitization trusts. Capacity for sales under the CMB Program consists of participation in new CMB issues and reinvestment of principal repayments held in the Principal Reinvestment Accounts. The Company’s continued ability to fund residential mortgages through Canadian bank-sponsored securitization trusts and NHA MBS is dependent on securitization market conditions and government regulations that are subject to change. A condition
of the NHA MBS and CMB Program is that securitized loans be insured by an insurer that is approved by CMHC. The availability of mortgage insurance is dependent upon market conditions and is subject to change.
As part of ongoing liquidity management during 2019 and 2018, the Company:
• Continued to expand our funding channels by issuing NHA MBS to multiple purchasers.
• Continued to assess and identify additional funding sources for the Company’s mortgage banking operations, including the launch of a new residential mortgage product suite through our partners at National Bank in the fourth quarter of 2017, which complements our current mortgage offerings.
• Repaid the $150 million 6.58% debentures in March 2018.
• Issued $200 million of 30 year 4.174% debentures in July 2018. The net proceeds were used by IGM Financial, together with a portion of IGM Financial’s existing internal cash resources, to fund the early redemption in August of all of its $375 million aggregate principal amount of 7.35% debentures due April 8, 2019.
• Issued $250 million 4.206% debentures in March 2019 maturing March 21, 2050. The net proceeds were used by the Company to fund the redemption of $150 million 5.90% Non-Cumulative First Preferred Shares, Series B and for general corporate purposes. The Company redeemed the Series B Preferred Shares on April 30, 2019.
The Company’s contractual obligations are reflected in Table 21.
In addition to IGM Financial’s current balance of cash and cash equivalents, liquidity is available through the Company’s lines of credit. The Company’s lines of credit with various
TABLE 21: CONTRACTUAL OBLIGATIONS
AS AT MARCH 31, 2019 LESS THAN 1-5 AFTER ($ millions) DEMAND 1 YEAR YEARS 5 YEARS TOTAL
Derivative financial instruments $ – $ 7.6 $ 18.2 $ 0.4 $ 26.2Deposits and certificates 516.9 7.6 5.7 1.4 531.6Obligations to securitization entities – 1,274.0 6,163.9 24.8 7,462.7Long-term debt – – – 2,100.0 2,100.0Leases(1) – 27.9 63.1 30.3 121.3Pension funding(2) – 20.2 – – 20.2
Total contractual obligations $ 516.9 $ 1,337.3 $ 6,250.9 $ 2,156.9 $ 10,262.0
(1) Includes future minimum lease payments related to office space and equipment used in the normal course of business.
(2) The next required actuarial valuation will be completed based on a measurement date of December 31, 2020. Pension funding requirements beyond 2019 are subject to significant variability and will be determined based on future actuarial valuations. Pension contribution decisions are subject to change, as contributions are affected by many factors including market performance, regulatory requirements, changes in assumptions and management’s ability to change funding policy.
POWER FINANCIAL CORPORATION�— �FIRST QUARTER REPORT 2019 C 33
PFC_QUAT1_Eng03_IGM_2019-05-03_v1.indd D33PFC_QUAT1_Eng03_IGM_2019-05-03_v1.indd D33 19-05-10 6:53 AM19-05-10 6:53 AM

PA
RT
C
IGM
FIN
AN
CIA
L IN
C.
IGM FINANCIAL INC. FIRST QUARTER REPORT 2019 / MANAGEMENT’S DISCUSSION AND ANALYSIS 37
Schedule I Canadian chartered banks totalled $825 million at March 31, 2019, unchanged from December 31, 2018. The lines of credit at March 31, 2019 consisted of committed lines of $650 million and uncommitted lines of $175 million, unchanged from December 31, 2018. The Company has accessed its uncommitted lines of credit in the past; however, any advances made by a bank under the uncommitted lines of credit are at the bank’s sole discretion. As at March 31, 2019 and December 31, 2018, the Company was not utilizing its committed lines of credit or its uncommitted lines of credit.
The actuarial valuation for funding purposes related to the Company’s registered defined benefit pension plan, based on a measurement date of December 31, 2017, was completed in May 2018. The valuation determines the plan surplus or deficit on both a solvency and going concern basis. The solvency basis determines the relationship between the plan assets and its liabilities assuming that the plan is wound up and settled on the valuation date. A going concern valuation compares the relationship between the plan assets and the present value of the expected future benefit cash flows, assuming the plan will be maintained indefinitely. Based on the actuarial valuation, the registered pension plan had a solvency deficit of $47.2 million compared to $82.7 million in the previous actuarial valuation, which was based on a measurement date of December 31, 2016. The decrease in the solvency deficit resulted primarily from higher assets due to contribution and investment returns, and is required to be funded over five years. The registered pension plan had a going concern surplus of $46.1 million compared to $24.4 million in the previous valuation. The next required actuarial valuation will be based on a measurement date of December 31, 2020. The Company has made contributions of $5.5 million in 2019 (2018 – $23.4 million). The Company utilized $10.5 million of the payments made during 2018 to reduce its solvency deficit and increase its going concern surplus. The Company expects to make further contributions of approximately $20.2 million in 2019. Pension contribution decisions are subject to change, as contributions are affected by many factors including market performance, regulatory requirements, changes in assumptions and management’s ability to change funding policy.
Management believes cash flows from operations, available cash balances and other sources of liquidity described above are sufficient to meet the Company’s liquidity needs. The Company continues to have the ability to meet its operational cash flow requirements, its contractual obligations, and its declared dividends. The current practice of the Company is to declare and pay dividends to common shareholders on a quarterly basis at the discretion of the Board of Directors. The declaration of dividends by the Board of Directors is dependent on a variety of factors, including earnings which are significantly influenced
by the impact that debt and equity market performance has on the Company’s fee income and commission and certain other expenses. The Company’s liquidity position and its management of liquidity and funding risk have not changed materially since December 31, 2018.
CREDIT RISK
Credit risk is the potential for financial loss to the Company if a counterparty to a transaction fails to meet its obligations.
The Company’s cash and cash equivalents, other investment holdings, mortgage portfolios, and derivatives are subject to credit risk. The Company monitors its credit risk management practices on an ongoing basis to evaluate their effectiveness.
Cash and Cash Equivalents
At March 31, 2019, cash and cash equivalents of $837.1 million (December 31, 2018 – $650.2 million) consisted of cash balances of $56.1 million (December 31, 2018 – $81.8 million) on deposit with Canadian chartered banks and cash equivalents of $781.0 million (December 31, 2018 – $568.4 million). Cash equivalents are comprised of Government of Canada treasury bills totalling $86.1 million (December 31, 2018 – $103.5 million), provincial government treasury bills and promissory notes of $230.0 million (December 31, 2018 – $76.2 million), bankers’ acceptances and other short-term notes issued by Canadian chartered banks of $450.4 million (December 31, 2018 – $364.3 million), and highly rated corporate commercial paper of $14.5 million (December 31, 2018 – $24.4 million).
The Company manages credit risk related to cash and cash equivalents by adhering to its Investment Policy that outlines credit risk parameters and concentration limits. The Company regularly reviews the credit ratings of its counterparties. The maximum exposure to credit risk on these financial instruments is their carrying value.
The Company’s exposure to and management of credit risk related to cash and cash equivalents and fixed income securities have not changed materially since December 31, 2018.
Mortgage Portfolio
As at March 31, 2019, residential mortgages, recorded on the Company’s balance sheet, of $7.7 billion (December 31, 2018 – $7.7 billion) consisted of $7.5 billion sold to securitization programs (December 31, 2018 – $7.3 billion), $206.9 million held pending sale or securitization (December 31, 2018 – $363.9 million) and $26.3 million related to the Company’s intermediary operations (December 31, 2018 – $25.6 million).
C 34 POWER FINANCIAL CORPORATION�— �FIRST QUARTER REPORT 2019�
PFC_QUAT1_Eng03_IGM_2019-05-03_v1.indd D34PFC_QUAT1_Eng03_IGM_2019-05-03_v1.indd D34 19-05-10 6:53 AM19-05-10 6:53 AM

PA
RT
C
IGM
FINA
NC
IAL IN
C.
38 IGM FINANCIAL INC. FIRST QUARTER REPORT 2019 / MANAGEMENT’S DISCUSSION AND ANALYSIS
The Company manages credit risk related to residential mortgages through:
• Adhering to its lending policy and underwriting standards;
• Its loan servicing capabilities;
• Use of client-insured mortgage default insurance and mortgage portfolio default insurance held by the Company; and
• Its practice of originating its mortgages exclusively through its own network of Mortgage Planning Specialists and IG Wealth Management Consultants as part of a client’s IG Living Plan.
In certain instances, credit risk is also limited by the terms and nature of securitization transactions as described below:
• Under the NHA MBS program totalling $4.3 billion (December 31, 2018 – $4.2 billion), the Company is obligated to make timely payment of principal and coupons irrespective of whether such payments were received from the mortgage borrower. However, as required by the NHA MBS program, 100% of the loans are insured by an approved insurer.
• Credit risk for mortgages securitized by transfer to bank-sponsored securitization trusts totalling $3.2 billion (December 31, 2018 – $3.1 billion) is limited to amounts held in cash reserve accounts and future net interest income, the fair values of which were $75.4 million (December 31, 2018 – $74.1 million) and $37.6 million (December 31, 2018 – $35.6 million), respectively, at March 31, 2019. Cash reserve accounts are reflected on the balance sheet, whereas rights to future net interest income are not reflected on the balance sheet and will be recorded over the life of the mortgages. This risk is further mitigated by insurance with 7.5% of mortgages held in ABCP Trusts insured at March 31, 2019 (December 31, 2018 – 8.3%).
At March 31, 2019, residential mortgages recorded on balance sheet were 60.9% insured (December 31, 2018 – 61.5%). As at March 31, 2019, impaired mortgages on these portfolios were $2.9 million, compared to $3.3 million at December 31, 2018. Uninsured non-performing mortgages over 90 days on these portfolios were $1.3 million at March 31, 2019, compared to $1.8 million at December 31, 2018.
The Company also retains certain elements of credit risk on mortgage loans sold to the Investors Mortgage and Short Term Income Fund and to the Investors Canadian Corporate Bond Fund through an agreement to repurchase mortgages in certain circumstances benefiting the funds. These loans are not recorded on the Company’s balance sheet as the Company has transferred substantially all of the risks and rewards of ownership associated with these loans.
The Company regularly reviews the credit quality of the mortgages and the adequacy of the allowance for expected credit losses.
The Company’s allowance for expected credit losses was $0.8 million at March 31, 2019, unchanged from December 31, 2018, and is considered adequate by management to absorb all credit-related losses in the mortgage portfolios based on: i) historical credit performance experience and recent trends, ii) current portfolio credit metrics and other relevant characteristics, and iii) regular stress testing of losses under adverse real estate market conditions.
The Company’s exposure to and management of credit risk related to mortgage portfolios have not changed materially since December 31, 2018.
Derivatives
The Company is exposed to credit risk through derivative contracts it utilizes to hedge interest rate risk, to facilitate securitization transactions and to hedge market risk related to certain stock-based compensation arrangements. These derivatives are discussed more fully under the Market Risk section of this MD&A.
To the extent that the fair value of the derivatives is in a gain position, the Company is exposed to credit risk that its counterparties fail to fulfil their obligations under these arrangements.
The Company’s derivative activities are managed in accordance with its Investment Policy which includes counterparty limits and other parameters to manage counterparty risk. The aggregate credit risk exposure related to derivatives that are in a gain position of $16.5 million (December 31, 2018 – $19.4 million) does not give effect to any netting agreements or collateral arrangements. The exposure to credit risk, considering netting agreements and collateral arrangements and including rights to future net interest income, was $0.6 million at March 31, 2019 (December 31, 2018 – nil). Counterparties are all Canadian Schedule I chartered banks and, as a result, management has determined that the Company’s overall credit risk related to derivatives was not significant at March 31, 2019. Management of credit risk related to derivatives has not changed materially since December 31, 2018.
Additional information related to the Company’s securitization activities and utilization of derivative contracts can be found in Note 5 to the Interim Financial Statements and Notes 2, 6 and 21 to the Annual Financial Statements.
MARKET RISK
Market risk is the potential for loss to the Company from changes in the values of its financial instruments due to changes in foreign exchange rates, interest rates or equity prices.
POWER FINANCIAL CORPORATION�— �FIRST QUARTER REPORT 2019 C 35
PFC_QUAT1_Eng03_IGM_2019-05-03_v1.indd D35PFC_QUAT1_Eng03_IGM_2019-05-03_v1.indd D35 19-05-10 6:53 AM19-05-10 6:53 AM
PA
RT
C
IGM
FIN
AN
CIA
L IN
C.
IGM FINANCIAL INC. FIRST QUARTER REPORT 2019 / MANAGEMENT’S DISCUSSION AND ANALYSIS 39
Interest Rate Risk
The Company is exposed to interest rate risk on its mortgage portfolio and on certain of the derivative financial instruments used in the Company’s mortgage banking operations.
The Company manages interest rate risk associated with its mortgage banking operations by entering into interest rate swaps with Canadian Schedule I chartered banks as follows:
• The Company has in certain instances funded floating rate mortgages with fixed rate Canada Mortgage Bonds as part of the securitization transactions under the CMB Program. As previously discussed, as part of the CMB Program, the Company is party to a swap whereby it is entitled to receive investment returns on reinvested mortgage principal and is obligated to pay Canada Mortgage Bond coupons. This swap had a negative fair value of $5.5 million (December 31, 2018 – positive $4.9 million) and an outstanding notional amount of $1.0 billion at March 31, 2019 (December 31, 2018 – $0.9 billion). The Company enters into interest rate swaps with Canadian Schedule I chartered banks to hedge the risk that the interest rates earned on floating rate mortgages and reinvestment returns decline. The negative fair value of these swaps totalled $2.8 million (December 31, 2018 – negative $11.0 million), on an outstanding notional amount of $1.9 billion at March 31, 2019 (December 31, 2018 – $1.7 billion). The net fair value of these swaps of negative $8.3 million at March 31, 2019 (December 31, 2018 – negative $6.1 million) is recorded on the balance sheet and has an outstanding notional amount of $2.9 billion (December 31, 2018 – $2.6 billion).
• The Company is exposed to the impact that changes in interest rates may have on the value of mortgages committed to or held pending sale or securitization to long-term funding sources. The Company enters into interest rate swaps to hedge the interest rate risk related to funding costs for mortgages held by the Company pending sale or securitization. Beginning in 2018, hedge accounting is applied to the cost of funds on certain securitization activities. The effective portion of fair value changes of the associated interest rate swaps are initially recognized in Other comprehensive income and subsequently recognized in Net investment income and other over the term of the related Obligations to securitization entities. The fair value of these swaps was negative $0.7 million (December 31, 2018 – negative $1.8 million) on an outstanding notional amount of $95.9 million at March 31, 2019 (December 31, 2018 – $249.9 million).
As at March 31, 2019, the impact to annual net earnings of a 100 basis point increase in interest rates would have been an
increase of approximately $1.2 million (December 31, 2018 – decrease of $0.5 million). The Company’s exposure to and management of interest rate risk have not changed materially since December 31, 2018.
Equity Price Risk
The Company is exposed to equity price risk on its equity investments which are classified as either fair value through other comprehensive income or fair value through profit or loss. The fair value of the equity investments was $329.0 million at March 31, 2019 (December 31, 2018 – $459.9 million), as shown in Table 14.
The Company sponsors a number of deferred compensation arrangements for employees where payments to participants are deferred and linked to the performance of the common shares of IGM Financial Inc. The Company hedges its exposure to this risk through the use of forward agreements and total return swaps.
Foreign Exchange Risk
The Company is exposed to foreign exchange risk on its investments in Personal Capital and China AMC. Changes to the carrying value due to changes in foreign exchange rates on both of these investments are recognized in Other comprehensive income. A 5% appreciation (depreciation) in Canadian currency relative to foreign currencies would decrease (increase) the aggregate carrying value of foreign investments by approximately $42.9 million ($47.4 million).
The Company’s proportionate share of China AMC’s and Personal Capital’s earnings, recorded in Proportionate share of associates’ earnings in the Consolidated Statement of Earnings, is also affected by changes in foreign exchange rates. A 5% appreciation (depreciation) in Canadian currency relative to foreign currencies would decrease (increase) the Company’s proportionate share of earnings by approximately $0.2 million ($0.2 million).
RISKS RELATED TO ASSETS UNDER MANAGEMENT
At March 31, 2019, IGM Financial’s total assets under management were $160.5 billion compared to $149.1 billion at December 31, 2018.
The Company’s primary sources of revenues are management, administration and other fees which are applied as an annual percentage of the level of assets under management. As a result, the level of the Company’s revenues and earnings are indirectly exposed to a number of financial risks that affect the value of assets under management on an ongoing basis. These include market risks, such as changes in equity prices, interest rates and
C 36 POWER FINANCIAL CORPORATION�— �FIRST QUARTER REPORT 2019�
PFC_QUAT1_Eng03_IGM_2019-05-03_v1.indd D36PFC_QUAT1_Eng03_IGM_2019-05-03_v1.indd D36 19-05-10 6:53 AM19-05-10 6:53 AM

PA
RT
C
IGM
FINA
NC
IAL IN
C.
40 IGM FINANCIAL INC. FIRST QUARTER REPORT 2019 / MANAGEMENT’S DISCUSSION AND ANALYSIS
foreign exchange rates, as well as credit risk on debt securities, loans and credit exposures from other counterparties within our client portfolios.
Changing financial market conditions may also lead to a change in the composition of the Company’s assets under management between equity and fixed income instruments, which could result in lower revenues depending upon the management fee rates associated with different asset classes and mandates.
The Company’s exposure to the value of assets under management aligns it with the experience of its clients. Assets under management are broadly diversified by asset class, geographic region, industry sector, investment team and style. The Company regularly reviews the sensitivity of its assets under management, revenues, earnings and cash flow to changes in financial markets. The Company believes that over the long term, exposure to investment returns on its client portfolios is beneficial to the Company’s results and consistent with stakeholder expectations, and generally it does not engage in risk transfer activities such as hedging in relation to these exposures.
2) OPERATIONAL RISK
Operational risks relating to people and processes are mitigated through policies and process controls. Oversight of risks and ongoing evaluation of the effectiveness of controls is provided by the Company’s Compliance Department, ERM Department and Internal Audit Department.
The Company has an insurance review process where it assesses and determines the nature and extent of insurance that is appropriate to provide adequate protection against unexpected losses, and where it is required by law, regulators or contractual agreements.
OPERATIONAL RISK
Operational risk is the risk of loss resulting from inadequate or failed internal processes or systems, human interaction or external events, but excludes business risk.
Operational risk affects all business activities, including the processes in place to manage other risks. As a result, operational risk can be difficult to measure, given that it forms part of other risks of the Company and may not always be separately identified. Our Company is exposed to a broad range of operational risks, including information technology security and system failures, errors relating to transaction processing, financial models and valuations, fraud and misappropriation of assets, and inadequate application of internal control processes. The impact can result in significant financial loss, reputational harm or regulatory actions.
The Company’s risk management framework emphasizes operational risk management and internal control. The Company has a very low appetite for risk in this area.
The business unit leaders are responsible for management of the day to day operational risks of their respective business units. Specific programs, policies, training, standards and governance processes have been developed to support the management of operational risk.
The Company has a business continuity management program to support the sustainment, management and recovery of critical operations and processes in the event of a business disruption.
TECHNOLOGY AND CYBER RISK
Technology and cyber risk driven by systems are managed through controls over technology development and change
TABLE 22: IGM FINANCIAL ASSETS UNDER MANAGEMENT – ASSET AND CURRENCY MIX
AS AT MARCH 31, 2019 INVESTMENT FUNDS TOTAL
Cash 0.6 % 1.0 %Short-term fixed income and mortgages 6.4 6.3Other fixed income 25.8 25.4Domestic equity 22.0 22.3Foreign equity 42.0 41.9Real Property 3.2 3.1
100.0 % 100.0 %
CAD 57.8 % 57.6 %USD 28.0 27.3Other 14.2 15.1
100.0 % 100.0 %
POWER FINANCIAL CORPORATION�— �FIRST QUARTER REPORT 2019 C 37
PFC_QUAT1_Eng03_IGM_2019-05-03_v1.indd D37PFC_QUAT1_Eng03_IGM_2019-05-03_v1.indd D37 19-05-10 6:53 AM19-05-10 6:53 AM

PA
RT
C
IGM
FIN
AN
CIA
L IN
C.
IGM FINANCIAL INC. FIRST QUARTER REPORT 2019 / MANAGEMENT’S DISCUSSION AND ANALYSIS 41
management. Information security is a significant risk to our industry and our Company’s operations. The Company uses systems and technology to support its business operations and the client and financial advisor experience. As a result, we are exposed to risks relating to technology and cyber security such as data breaches, identity theft and hacking, including the risk of denial of service or malicious software attacks. Such attacks could compromise confidential information of the Company and that of clients or other stakeholders, and could result in negative consequences including lost revenue, litigation, regulatory scrutiny or reputational damage. To remain resilient to such threats, the Company has established enterprise-wide cyber security programs, benchmarked capabilities to sound industry practices, and has implemented threat and vulnerability assessment and response capabilities.
THIRD PARTY SERVICE PROVIDERS
The Company regularly engages third parties to provide expertise and efficiencies that support our operational activities. Our exposure to third party service provider risk could include reputational, regulatory and other operational risks. Policies, standard operating procedures and dedicated resources, including a supplier code of conduct, have been developed and implemented to specifically address third party service provider risk. Due diligence and monitoring activities are performed by the Company prior to entering into contractual relationships with third party service providers and on an ongoing basis. As our reliance on external service providers continues to grow, we continue to enhance resources and processes to support third party risk management.
MODEL RISK
The Company uses a variety of models to assist in: the valuation of financial instruments, operational scenario testing, management of cash flows, capital management, and assessment of potential acquisitions. These models incorporate internal assumptions, observable market inputs and available market prices. Effective controls exist over the development, implementation and application of these models. However, changes in the internal assumptions or other factors affecting the models could have an adverse effect on the Company’s consolidated financial position.
LEGAL AND REGULATORY COMPLIANCE
Legal and Regulatory Compliance Risk is the risk of not complying with laws, contractual agreements or regulatory requirements. This includes distribution compliance, investment management compliance, accounting and internal controls, and reporting and communications.
IGM Financial is subject to complex and changing legal, taxation and regulatory requirements, including the requirements of agencies of the federal, provincial and territorial governments in Canada which regulate the Company and its activities. The Company and its subsidiaries are also subject to the requirements of self-regulatory organizations to which they belong. These and other regulatory bodies regularly adopt new laws, rules, regulations and policies that apply to the Company and its subsidiaries. These requirements include those that apply to IGM Financial as a publicly traded company and those that apply to the Company’s subsidiaries based on the nature of their activities. They include regulations related to the management and provision of financial products and services, including securities, insurance and mortgages, and other activities carried on by the Company in the markets in which it operates. Regulatory standards affecting the Company and the financial services industry are significant and are being continually changed. The Company and its subsidiaries are subject to reviews as part of the normal ongoing process of oversight by the various regulators.
Failure to comply with laws, rules or regulations could lead to regulatory sanctions and civil liability, and may have an adverse reputational or financial effect on the Company. The Company manages legal and regulatory compliance risk through its efforts to promote a strong culture of compliance. The monitoring of regulatory developments and their impact on the Company is overseen by the Regulatory Initiatives Committee chaired by the Executive Vice-President, General Counsel. The Company also continues to develop and maintain compliance policies, processes and oversight, including specific communications on compliance and legal matters, training, testing, monitoring and reporting. The Audit Committee of the Company receives regular reporting on compliance initiatives and issues.
IGM Financial promotes a strong culture of ethics and integrity through its Code of Conduct approved by the Board of Directors, which outlines standards of conduct that apply to all IGM Financial directors, officers and employees. The Code of Conduct incorporates many policies relating to the conduct of directors, officers and employees, and covers a variety of relevant topics, such as anti-money laundering and privacy. Individuals subject to the Code of Conduct attest annually that they understand the requirements and have complied with its provisions.
Business units are responsible for management of legal and regulatory compliance risk, and implementing appropriate policies, procedures and controls. The Company’s Compliance Departments are responsible for providing oversight of all regulated compliance activities. The Internal Audit Department also provides oversight and investigations concerning regulatory compliance matters.
C 38 POWER FINANCIAL CORPORATION�— �FIRST QUARTER REPORT 2019�
PFC_QUAT1_Eng03_IGM_2019-05-03_v1.indd D38PFC_QUAT1_Eng03_IGM_2019-05-03_v1.indd D38 19-05-10 6:53 AM19-05-10 6:53 AM

PA
RT
C
IGM
FINA
NC
IAL IN
C.
42 IGM FINANCIAL INC. FIRST QUARTER REPORT 2019 / MANAGEMENT’S DISCUSSION AND ANALYSIS
CONTINGENCIES
The Company is subject to legal actions arising in the normal course of its business. In December 2018, a proposed class action was filed in the Ontario Superior Court against Mackenzie which alleges that the company should not have paid mutual fund trailing commissions to order execution only dealers. Although it is difficult to predict the outcome of any such legal actions, based on current knowledge and consultation with legal counsel, management does not expect the outcome of any of these matters, individually or in aggregate, to have a material adverse effect on the Company’s consolidated financial position.
3) GOVERNANCE, OVERSIGHT AND STRATEGIC RISK
Governance, oversight and strategic risk is the risk of potential adverse impacts resulting from inadequate or inappropriate governance, oversight, management of incentives and conflicts, and strategic planning.
IGM Financial believes in the importance of good corporate governance and the central role played by directors in the governance process. We believe that sound corporate governance is essential to the well-being of the Company and its shareholders.
Oversight of IGM Financial is performed by the Board of Directors directly and through its five committees. The Company’s President and Chief Executive Officer has overall responsibility for management of the Company. The Company’s activities are carried out principally by three operating companies – Investors Group Inc., Mackenzie Financial Corporation and Investment Planning Counsel Inc. – each of which are managed by a President and Chief Executive Officer.
The Company has a business planning process that supports development of an annual business plan, approved by the Board of Directors, which incorporates objectives and targets for the Company. Components of management compensation are associated with the achievement of earnings targets and other objectives associated with the plan. Strategic plans and direction are part of this planning process and are integrated into the Company’s risk management program.
ACQUISITION RISK
The Company is also exposed to risks related to its acquisitions. The Company undertakes thorough due diligence prior to completing an acquisition, but there is no assurance that the Company will achieve the expected strategic objectives or cost and revenue synergies subsequent to an acquisition. Subsequent changes in the economic environment and other unanticipated factors may affect the Company’s ability to achieve expected earnings growth or expense reductions. The success of an acquisition is dependent on retaining assets under management, clients, and key employees of an acquired company.
4) REGULATORY DEVELOPMENTS
Regulatory development risk is the potential for changes to regulatory, legal, or tax requirements that may have an adverse impact upon the Company’s business activities or financial results.
The Company is exposed to the risk of changes in laws, taxation and regulation that could have an adverse impact on the Company. Particular regulatory initiatives may have the effect of making the products of the Company’s subsidiaries appear to be less competitive than the products of other financial service providers, to third party distribution channels and to clients. Regulatory differences that may impact the competitiveness of the Company’s products include regulatory costs, tax treatment, disclosure requirements, transaction processes or other differences that may be as a result of differing regulation or application of regulation. Regulatory developments may also impact product structures, pricing, and dealer and advisor compensation. While the Company and its subsidiaries actively monitor such initiatives, and where feasible comment upon or discuss them with regulators, the ability of the Company and its subsidiaries to mitigate the imposition of differential regulatory treatment of financial products or services is limited.
5) BUSINESS RISK
GENERAL BUSINESS CONDITIONS
General Business Conditions Risk refers to the potential for an unfavourable impact on IGM Financial resulting from competitive or other external factors relating to the marketplace.
Global economic conditions, changes in equity markets, demographics and other factors including geopolitical risk and government instability, can affect investor confidence, income levels and savings decisions. This could result in reduced sales of IGM Financial’s products and services and/or result in investors redeeming their investments. These factors may also affect the level and volatility of financial markets and the value of the Company’s assets under management, as described more fully under the Risks Related to Assets Under Management section of this MD&A.
The Company, across its operating subsidiaries, is focused on communicating with clients and emphasizing the importance of financial planning across economic cycles. The Company and the industry continue to take steps to educate Canadian investors on the merits of financial planning, diversification and long-term investing. In periods of volatility, Consultants and independent financial advisors play a key role in assisting investors in maintaining perspective and focus on their long-term objectives.
Redemption rates for long-term funds are summarized in Table 23 and are discussed in the IG Wealth Management and Mackenzie Segment Operating Results sections of this MD&A.
POWER FINANCIAL CORPORATION�— �FIRST QUARTER REPORT 2019 C 39
PFC_QUAT1_Eng03_IGM_2019-05-03_v1.indd D39PFC_QUAT1_Eng03_IGM_2019-05-03_v1.indd D39 19-05-10 6:53 AM19-05-10 6:53 AM

PA
RT
C
IGM
FIN
AN
CIA
L IN
C.
IGM FINANCIAL INC. FIRST QUARTER REPORT 2019 / MANAGEMENT’S DISCUSSION AND ANALYSIS 43
PRODUCT/SERVICE OFFERING
There is potential for unfavourable impacts on IGM Financial resulting from inadequate product or service performance, quality or breadth.
IGM Financial and its subsidiaries operate in a highly competitive environment, competing with other financial service providers, investment managers and product and service types. Client development and retention can be influenced by a number of factors, including products and services offered by competitors, relative service levels, relative pricing, product attributes, reputation and actions taken by competitors. This competition could have an adverse impact upon the Company’s financial position and operating results. Please refer to The Competitive Landscape section of this MD&A for further discussion.
The Company provides Consultants, independent financial advisors, as well as retail and institutional clients with a high level of service and support and a broad range of investment products, with a focus on building enduring relationships. The Company’s subsidiaries also continually review their respective product and service offering and pricing to ensure competitiveness in the marketplace.
The Company strives to deliver strong investment performance on its products relative to benchmarks and peers. Poor investment performance relative to benchmarks or peers could reduce the level of assets under management and sales and asset retention, as well as adversely impact our brands. Meaningful and/or sustained underperformance could affect the Company’s results. The Company’s objective is to cultivate investment processes and disciplines that provide it with a competitive advantage, and does so by diversifying its assets under management and product shelf by investment team, brand, asset class, mandate, style and geographic region.
BUSINESS/CLIENT RELATIONSHIPS
Business/Client relationships risk refers to the risk potential for unfavourable impacts on IGM Financial resulting from changes to other key relationships. These relationships primarily include IG Wealth Management clients and Consultants, Mackenzie
retail distribution, strategic and significant business partners, clients of Mackenzie funds, and sub-advisors and other product suppliers.
IG Wealth Management Consultant network – IG Wealth Management derives all of its mutual fund sales through its Consultant network. IG Wealth Management Consultants have regular direct contact with clients which can lead to a strong and personal client relationship based on the client’s confidence in that individual Consultant. The market for financial advisors is extremely competitive. The loss of a significant number of key Consultants could lead to the loss of client accounts which could have an adverse effect on IG Wealth Management’s results of operations and business prospects. IG Wealth Management is focused on strengthening its distribution network of Consultants and on responding to the complex financial needs of its clients by delivering a diverse range of products and services in the context of personalized financial advice, as discussed in the IG Wealth Management Review of the Business section of this MD&A.
Mackenzie – Mackenzie derives the majority of its mutual fund sales through third party financial advisors. Financial advisors generally offer their clients investment products in addition to, and in competition with Mackenzie. Mackenzie also derives sales of its investment products and services from its strategic alliance and institutional clients. Due to the nature of the distribution relationship in these relationships and the relative size of these accounts, gross sale and redemption activity can be more pronounced in these accounts than in a retail relationship. Mackenzie’s ability to market its investment products is highly dependent on continued access to these distribution networks. The inability to have such access could have a material adverse effect on Mackenzie’s operating results and business prospects. Mackenzie is well positioned to manage this risk and to continue to build and enhance its distribution relationships. Mackenzie’s diverse portfolio of financial products and its long-term investment performance record, marketing, educational and service support has made Mackenzie one of Canada’s leading investment management companies. These factors are discussed further in the Mackenzie Review of the Business section of this MD&A.
TABLE 23: TWELVE MONTH TRAILING REDEMPTION RATE FOR LONG-TERM FUNDS
2019 2018 MAR. 31 MAR. 31
IGM Financial Inc. IG Wealth Management 9.5 % 8.4 % Mackenzie 17.0 % 13.7 % Counsel 20.1 % 16.7 %
C 40 POWER FINANCIAL CORPORATION�— �FIRST QUARTER REPORT 2019�
PFC_QUAT1_Eng03_IGM_2019-05-03_v1.indd D40PFC_QUAT1_Eng03_IGM_2019-05-03_v1.indd D40 19-05-10 6:53 AM19-05-10 6:53 AM

PA
RT
C
IGM
FINA
NC
IAL IN
C.
44 IGM FINANCIAL INC. FIRST QUARTER REPORT 2019 / MANAGEMENT’S DISCUSSION AND ANALYSIS
PEOPLE RISK
People risk refers to the potential inability to attract or retain key employees or Consultants, develop to an appropriate level of proficiency, or manage personnel succession or transition.
Management, investment and distribution personnel play an important role in developing, implementing, managing and distributing products and services offered by IGM Financial. The loss of these individuals or an inability to attract, retain and motivate sufficient numbers of qualified personnel could affect IGM Financial’s business and financial performance.
6) ENVIRONMENTAL AND SOCIAL RISKS
Environmental and social risk is the risk of financial loss or reputational damage resulting from environmental or social issues arising from our business operations or investment activities.
Environmental risks include issues such as climate change, biodiversity, pollution, waste, and the unsustainable use of water and other resources. Social risks include issues such as human rights, diversity, and community impacts.
IGM Financial has a long-standing commitment to responsible management, as articulated in the Company’s Corporate Responsibility Statement approved by the Board of Directors. The Board’s risk management oversight includes environmental and social risks.
Our commitment to responsible management is demonstrated through various mechanisms – including our Code of Conduct for our employees, contractors, and directors; our Supplier Code of Conduct for the firms that do business with us; our Respectful
Workplace Policy; our Diversity Policy; our Environmental Policy; and other related policies.
IG Wealth Management and Mackenzie Investments are signatories to the Principles for Responsible Investment (PRI). Under the PRI, investors formally commit to incorporate environmental, social and governance (ESG) issues into their investment decision making and active ownership processes. In addition, IG Wealth Management, Mackenzie Investments and Investment Planning Counsel have implemented Responsible Investing Policies outlining the practices at each company.
We believe that financial services companies have an important role to play in addressing climate change. IGM Financial is a long-standing participant in the CDP (formerly Carbon Disclosure Project), which promotes corporate disclosures on greenhouse gas emissions and climate change management and includes reporting of our emissions and targets. For the 2018 survey, IGM was recognized by CDP as a corporate leader in climate change disclosure with a position on their Climate Change A List. IGM Financial also reports annually on its environmental, social and governance management and performance in its Corporate Responsibility Report available on our website. The information in these reports does not form a part of this document. The Financial Stability Board’s Task Force on Climate-related Financial Disclosures (TCFD) was established in response to investor demand for information on climate-related risks and opportunities. We are evaluating the TCFD recommendations which include a framework for consistent, voluntary climate-related financial disclosures that provide decision-useful information to investors and other stakeholders.
POWER FINANCIAL CORPORATION�— �FIRST QUARTER REPORT 2019 C 41
PFC_QUAT1_Eng03_IGM_2019-05-03_v1.indd D41PFC_QUAT1_Eng03_IGM_2019-05-03_v1.indd D41 19-05-10 6:53 AM19-05-10 6:53 AM

PA
RT
C
IGM
FIN
AN
CIA
L IN
C.
IGM FINANCIAL INC. FIRST QUARTER REPORT 2019 / MANAGEMENT’S DISCUSSION AND ANALYSIS 45
THE FINANCIAL SERVICES ENVIRONMENTCanadians held $4.5 trillion in discretionary financial assets with financial institutions at December 31, 2017 based on the most recent report from Investor Economics. The nature of holdings was diverse, ranging from demand deposits held for short-term cash management purposes to longer-term investments held for retirement purposes. Approximately 66% ($3.0 trillion) of these financial assets are held within the context of a relationship with a financial advisor, and this is the primary channel serving the longer-term savings needs of Canadians. Of the $1.5 trillion held outside of a financial advisory relationship, approximately 63% consisted of bank deposits.
Financial advisors represent the primary distribution channel for the Company’s products and services, and the core emphasis of the Company’s business model is to support these financial advisors as they work with clients to plan for and achieve their financial goals. Multiple sources of emerging research show significantly better financial outcomes for Canadians who use financial advisors compared to those who do not. The Company actively promotes the value of financial advice and the importance of a relationship with an advisor to develop and remain focused on long-term financial plans and goals.
Approximately 41% of Canadian discretionary financial assets or $1.8 trillion resided in investment funds at December 31, 2017, making it the largest financial asset class held by Canadians. Other asset types include deposit products and direct securities such as stocks and bonds. Approximately 77% of investment funds are comprised of mutual fund products, with other product categories including segregated funds, hedge funds, pooled funds, closed end funds and exchange traded funds. With $154 billion in investment fund assets under management at March 31, 2019, the Company is among the country’s largest investment fund managers. Management believes that investment funds are likely to remain the preferred savings vehicle of Canadians. Investment funds provide investors with the benefits of diversification, professional management, flexibility and convenience, and are available in a broad range of mandates and structures to meet most investor requirements and preferences.
Competition and technology have fostered a trend towards financial service providers offering a comprehensive range of proprietary products and services. Traditional distinctions between bank branches, full service brokerages, financial planning firms and insurance agent sales forces have become obscured as many of these financial service providers strive to offer comprehensive financial advice implemented through access to a broad product shelf. Accordingly, the Canadian financial services industry is characterized by a number of large, diversified, vertically-integrated participants, similar to IGM
Financial, who offer both financial planning and investment management services.
Canadian banks distribute financial products and services through their traditional bank branches, as well as through their full service and discount brokerage subsidiaries. Bank branches continue to place increased emphasis on both financial planning and mutual funds. In addition, each of the “big six” banks has one or more mutual fund management subsidiaries. Collectively, mutual fund assets of the “big six” bank-owned mutual fund managers and affiliated firms represented 45% of total industry long-term mutual fund assets at March 31, 2019.
The Canadian mutual fund industry continues to be very concentrated, with the ten largest firms and their subsidiaries representing 75% of industry long-term mutual fund assets and 75% of total mutual fund assets under management at March 31, 2019. Management anticipates continuing consolidation in this segment of the industry as smaller participants are acquired by larger organizations.
Management believes that the financial services industry will continue to be influenced by the following trends:
• Shifting demographics as the number of Canadians in their prime savings and retirement years continue to increase.
• Changes in investor attitudes based on economic conditions.
• Continued importance of the role of the financial advisor.
• Public policy related to retirement savings.
• Changes in the regulatory environment.
• An evolving competitive landscape.
• Advancing and changing technology.
THE COMPETITIVE LANDSCAPEIGM Financial and its subsidiaries operate in a highly competitive environment. IG Wealth Management and Investment Planning Counsel compete directly with other retail financial service providers, including other financial planning firms, as well as full service brokerages, banks and insurance companies. IG Wealth Management, Mackenzie and Investment Planning Counsel compete directly with other investment managers for assets under management, and their products compete with stocks, bonds and other asset classes for a share of the investment assets of Canadians.
Competition from other financial service providers, alternative product types or delivery channels, and changes in regulations or public preferences could impact the characteristics of product and service offerings of the Company, including pricing, product structures, dealer and advisor compensation and disclosure. The Company monitors developments on an ongoing basis, and
OUTLOOK
C 42 POWER FINANCIAL CORPORATION�— �FIRST QUARTER REPORT 2019�
PFC_QUAT1_Eng03_IGM_2019-05-03_v1.indd D42PFC_QUAT1_Eng03_IGM_2019-05-03_v1.indd D42 19-05-10 6:53 AM19-05-10 6:53 AM

PA
RT
C
IGM
FINA
NC
IAL IN
C.
46 IGM FINANCIAL INC. FIRST QUARTER REPORT 2019 / MANAGEMENT’S DISCUSSION AND ANALYSIS
engages in policy discussions and develops product and service responses as appropriate.
IGM Financial continues to focus on its commitment to provide quality investment advice and financial products, service innovations, effective management of the Company and long-term value for its clients and shareholders. Management believes that the Company is well-positioned to meet competitive challenges and capitalize on future opportunities.
The Company enjoys several competitive strengths, including:
• Broad and diversified distribution with an emphasis on those channels emphasizing comprehensive financial planning through a relationship with a financial advisor.
• Broad product capabilities, leading brands and quality sub-advisory relationships.
• Enduring client relationships and the long-standing heritages and cultures of its subsidiaries.
• Benefits of being part of the Power Financial group of companies.
BROAD AND DIVERSIFIED DISTRIBUTION
IGM Financial’s distribution strength is a competitive advantage. In addition to owning two of Canada’s largest financial planning organizations, IG Wealth Management and Investment Planning
Counsel, IGM Financial has, through Mackenzie, access to distribution through over 30,000 independent financial advisors. Mackenzie also, in its growing strategic alliance business, partners with Canadian and U.S. manufacturing and distribution complexes to provide investment management to a number of retail investment fund mandates.
BROAD PRODUCT CAPABILITIES
IGM Financial’s subsidiaries continue to develop and launch innovative products and strategic investment planning tools to assist advisors in building optimized portfolios for clients.
ENDURING RELATIONSHIPS
IGM Financial enjoys significant advantages as a result of the enduring relationships that advisors enjoy with clients. In addition, the Company’s subsidiaries have strong heritages and cultures which are challenging for competitors to replicate.
BENEFITS OF BEING PART OF THE POWER FINANCIAL GROUP OF COMPANIES
As part of the Power Financial group of companies, IGM Financial benefits through expense savings from shared service arrangements, as well as through access to distribution, products and capital.
POWER FINANCIAL CORPORATION�— �FIRST QUARTER REPORT 2019 C 43
PFC_QUAT1_Eng03_IGM_2019-05-03_v1.indd D43PFC_QUAT1_Eng03_IGM_2019-05-03_v1.indd D43 19-05-10 6:53 AM19-05-10 6:53 AM
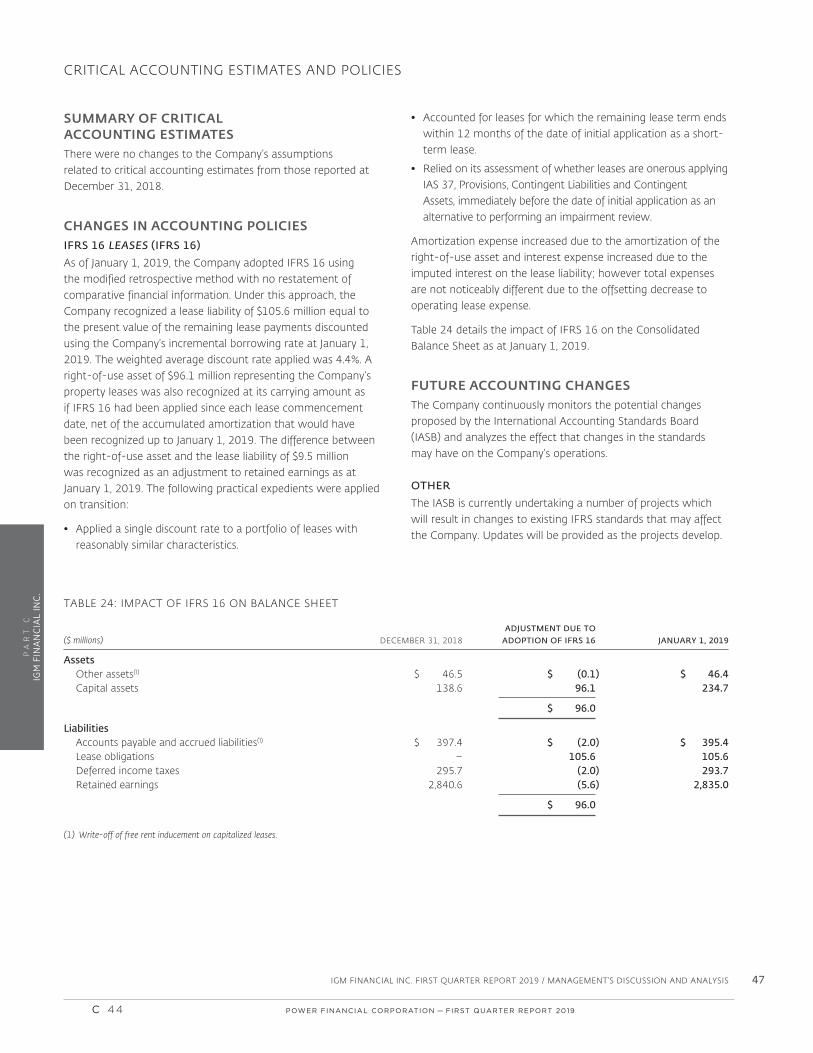
PA
RT
C
IGM
FIN
AN
CIA
L IN
C.
IGM FINANCIAL INC. FIRST QUARTER REPORT 2019 / MANAGEMENT’S DISCUSSION AND ANALYSIS 47
SUMMARY OF CRITICAL ACCOUNTING ESTIMATESThere were no changes to the Company’s assumptions related to critical accounting estimates from those reported at December 31, 2018.
CHANGES IN ACCOUNTING POLICIESIFRS 16 LEASES (IFRS 16)
As of January 1, 2019, the Company adopted IFRS 16 using the modified retrospective method with no restatement of comparative financial information. Under this approach, the Company recognized a lease liability of $105.6 million equal to the present value of the remaining lease payments discounted using the Company’s incremental borrowing rate at January 1, 2019. The weighted average discount rate applied was 4.4%. A right-of-use asset of $96.1 million representing the Company’s property leases was also recognized at its carrying amount as if IFRS 16 had been applied since each lease commencement date, net of the accumulated amortization that would have been recognized up to January 1, 2019. The difference between the right-of-use asset and the lease liability of $9.5 million was recognized as an adjustment to retained earnings as at January 1, 2019. The following practical expedients were applied on transition:
• Applied a single discount rate to a portfolio of leases with reasonably similar characteristics.
• Accounted for leases for which the remaining lease term ends within 12 months of the date of initial application as a short-term lease.
• Relied on its assessment of whether leases are onerous applying IAS 37, Provisions, Contingent Liabilities and Contingent Assets, immediately before the date of initial application as an alternative to performing an impairment review.
Amortization expense increased due to the amortization of the right-of-use asset and interest expense increased due to the imputed interest on the lease liability; however total expenses are not noticeably different due to the offsetting decrease to operating lease expense.
Table 24 details the impact of IFRS 16 on the Consolidated Balance Sheet as at January 1, 2019.
FUTURE ACCOUNTING CHANGESThe Company continuously monitors the potential changes proposed by the International Accounting Standards Board (IASB) and analyzes the effect that changes in the standards may have on the Company’s operations.
OTHER
The IASB is currently undertaking a number of projects which will result in changes to existing IFRS standards that may affect the Company. Updates will be provided as the projects develop.
CRITICAL ACCOUNTING ESTIMATES AND POLICIES
TABLE 24: IMPACT OF IFRS 16 ON BALANCE SHEET
ADJUSTMENT DUE TO ($ millions) DECEMBER 31, 2018 ADOPTION OF IFRS 16 JANUARY 1, 2019
Assets Other assets(1) $ 46.5 $ (0.1) $ 46.4 Capital assets 138.6 96.1 234.7
$ 96.0
Liabilities Accounts payable and accrued liabilities(1) $ 397.4 $ (2.0) $ 395.4 Lease obligations – 105.6 105.6 Deferred income taxes 295.7 (2.0) 293.7 Retained earnings 2,840.6 (5.6) 2,835.0
$ 96.0
(1) Write-off of free rent inducement on capitalized leases.
C 44 POWER FINANCIAL CORPORATION�— �FIRST QUARTER REPORT 2019�
PFC_QUAT1_Eng03_IGM_2019-05-03_v1.indd D44PFC_QUAT1_Eng03_IGM_2019-05-03_v1.indd D44 19-05-10 6:53 AM19-05-10 6:53 AM

PA
RT
C
IGM
FINA
NC
IAL IN
C.
48 IGM FINANCIAL INC. FIRST QUARTER REPORT 2019 / MANAGEMENT’S DISCUSSION AND ANALYSIS
TRANSACTIONS WITH RELATED PARTIESThere were no changes to the types of related party transactions from those reported at December 31, 2018. For further information on transactions involving related parties, see Notes 8 and 25 to the Company’s Annual Financial Statements.
OUTSTANDING SHARE DATAOutstanding common shares of IGM Financial as at March 31, 2019 totalled 240,757,822. Outstanding stock options as at March 31, 2019 totalled 10,975,380, of which 5,672,049 were exercisable. As at April 30, 2019, outstanding common shares
totalled 239,320,382 and outstanding stock options totalled 10,975,380 of which 5,672,049 were exercisable.
Perpetual preferred shares of $150 million were outstanding as at March 31, 2019. On April 30, the Company redeemed the $150 million perpetual preferred shares.
SEDARAdditional information relating to IGM Financial, including the Company’s most recent financial statements and Annual Information Form, is available at www.sedar.com.
OTHER INFORMATION
During the first quarter of 2019, there have been no changes in the Company’s internal control over financial reporting that have materially affected, or are reasonably likely to materially affect, the Company’s internal control over financial reporting.
INTERNAL CONTROL OVER FINANCIAL REPORTING
POWER FINANCIAL CORPORATION�— �FIRST QUARTER REPORT 2019 C 45
PFC_QUAT1_Eng03_IGM_2019-05-03_v1.indd D45PFC_QUAT1_Eng03_IGM_2019-05-03_v1.indd D45 19-05-10 6:53 AM19-05-10 6:53 AM

PA
RT
C
IGM
FIN
AN
CIA
L IN
C.
IGM FINANCIAL INC. FIRST QUARTER REPORT 2019 | INTERIM CONDENSED CONSOLIDATED FINANCIAL STATEMENTS 49
CONSOLIDATED STATEMENTS OF EARNINGS
INTERIM CONDENSED CONSOLIDATED FINANCIAL STATEMENTS
(unaudited) THREE MONTHS ENDED MARCH 31
(in thousands of Canadian dollars, except per share amounts) 2019 2018
Revenues Management fees $ 545,224 $ 556,601 Administration fees 101,699 107,534 Distribution fees 89,274 93,320 Net investment income and other 20,233 14,209 Proportionate share of associates’ earnings (Note 6) 32,650 37,984
789,080 809,648
Expenses Commission 274,666 286,098 Non-commission 274,438 253,145 Interest 25,216 30,264
574,320 569,507
Earnings before income taxes 214,760 240,141Income taxes 45,044 52,390
Net earnings 169,716 187,751Perpetual preferred share dividends 2,213 2,213
Net earnings available to common shareholders $ 167,503 $ 185,538
Earnings per share (in dollars) (Note 14)
– Basic $ 0.70 $ 0.77 – Diluted $ 0.70 $ 0.77
(See accompanying notes to interim condensed consolidated financial statements.)
C 46 POWER FINANCIAL CORPORATION�— �FIRST QUARTER REPORT 2019�
PFC_QUAT1_Eng03_IGM_2019-05-03_v1.indd D46PFC_QUAT1_Eng03_IGM_2019-05-03_v1.indd D46 19-05-10 6:53 AM19-05-10 6:53 AM

PA
RT
C
IGM
FINA
NC
IAL IN
C.
IGM FINANCIAL INC. FIRST QUARTER REPORT 2019 | INTERIM CONDENSED CONSOLIDATED FINANCIAL STATEMENTS50
CONSOLIDATED STATEMENTS OF COMPREHENSIVE INCOME
(unaudited) THREE MONTHS ENDED MARCH 31
(in thousands of Canadian dollars) 2019 2018
Net earnings $ 169,716 $ 187,751
Other comprehensive income (loss), net of tax Items that will not be reclassified to Net earnings Fair value through other comprehensive income investments Other comprehensive income (loss), net of tax of $1,113 and $429 (7,138) (2,746) Employee benefits Net actuarial gains (losses), net of tax of $7,388 and $1,269 (19,980) (3,427) Investment in associates – employee benefits and other Other comprehensive income (loss), net of tax of nil (6,691) (2,875)
Items that may be reclassified subsequently to Net earnings Investment in associates and other Other comprehensive income (loss), net of tax of $(646) and $(4,422) 29,358 40,937
(4,451) 31,889
Total comprehensive income $ 165,265 $ 219,640
(See accompanying notes to interim condensed consolidated financial statements.)
POWER FINANCIAL CORPORATION�— �FIRST QUARTER REPORT 2019 C 47
PFC_QUAT1_Eng03_IGM_2019-05-03_v1.indd D47PFC_QUAT1_Eng03_IGM_2019-05-03_v1.indd D47 19-05-10 6:53 AM19-05-10 6:53 AM

PA
RT
C
IGM
FIN
AN
CIA
L IN
C.
IGM FINANCIAL INC. FIRST QUARTER REPORT 2019 | INTERIM CONDENSED CONSOLIDATED FINANCIAL STATEMENTS 51
CONSOLIDATED BALANCE SHEETS
(unaudited) MARCH 31 DECEMBER 31 (in thousands of Canadian dollars) 2019 2018
Assets Cash and cash equivalents $ 837,089 $ 650,228 Other investments (Note 3) 328,987 459,911 Client funds on deposit 507,553 546,787 Accounts and other receivables 341,445 319,609 Income taxes recoverable 42,517 9,316 Loans (Note 4) 7,687,685 7,738,031 Derivative financial instruments 15,809 16,364 Other assets 44,487 46,531 Investment in associates (Note 6) 1,906,020 1,651,304 Capital assets (Note 2) 233,678 138,647 Capitalized sales commissions 112,813 105,044 Deferred income taxes 58,471 75,607 Intangible assets 1,193,401 1,191,068 Goodwill 2,660,267 2,660,267
$ 15,970,222 $ 15,608,714
Liabilities Accounts payable and accrued liabilities $ 368,741 $ 397,379 Income taxes payable 3,011 51,894 Derivative financial instruments 26,191 28,990 Deposits and certificates 531,583 568,799 Other liabilities 538,542 444,173 Obligations to securitization entities 7,462,680 7,370,193 Lease obligations (Note 2) 104,873 – Deferred income taxes 296,024 295,719 Long-term debt (Note 7) 2,100,000 1,850,000
11,431,645 11,007,147
Shareholders’ Equity Share capital Perpetual preferred shares 150,000 150,000 Common shares 1,613,388 1,611,263 Contributed surplus 46,247 45,536 Retained earnings 2,800,659 2,840,566 Accumulated other comprehensive income (loss) (71,717) (45,798)
4,538,577 4,601,567
$ 15,970,222 $ 15,608,714
These interim condensed consolidated financial statements were approved and authorized for issuance by the Board of Directors on May 3, 2019.
(See accompanying notes to interim condensed consolidated financial statements.)
C 48 POWER FINANCIAL CORPORATION�— �FIRST QUARTER REPORT 2019�
PFC_QUAT1_Eng03_IGM_2019-05-03_v1.indd D48PFC_QUAT1_Eng03_IGM_2019-05-03_v1.indd D48 19-05-10 6:53 AM19-05-10 6:53 AM

PA
RT
C
IGM
FINA
NC
IAL IN
C.
IGM FINANCIAL INC. FIRST QUARTER REPORT 2019 | INTERIM CONDENSED CONSOLIDATED FINANCIAL STATEMENTS52
CONSOLIDATED STATEMENTS OF CHANGES IN SHAREHOLDERS’ EQUITY
THREE MONTHS ENDED MARCH 31
SHARE CAPITAL
ACCUMULATED PERPETUAL OTHER PREFERRED COMMON COMPREHENSIVE TOTAL (unaudited) SHARES SHARES CONTRIBUTED RETAINED INCOME (LOSS) SHAREHOLDERS’ (in thousands of Canadian dollars) (Note 8) (Note 8) SURPLUS EARNINGS (Note 11) EQUITY
2019
Balance, beginning of period As previously reported $ 150,000 $ 1,611,263 $ 45,536 $ 2,840,566 $ (45,798) $ 4,601,567 Change in accounting policy (Note 2)
IFRS 16 – – – (5,568) – (5,568)
As restated 150,000 1,611,263 45,536 2,834,998 (45,798) 4,595,999
Net earnings – – – 169,716 – 169,716Other comprehensive income (loss), net of tax – – – – (4,451) (4,451)
Total comprehensive income – – – 169,716 (4,451) 165,265
Common shares Issued under stock option plan – 3,908 – – – 3,908Stock options Current period expense – – 923 – – 923 Exercised – – (212) – – (212)Perpetual preferred share dividends – – – (2,213) – (2,213)Common share dividends – – – (135,498) – (135,498)Transfer out of fair value through other comprehensive income – – – 21,468 (21,468) –Common share cancellation excess & other – (1,783) – (87,812) – (89,595)
Balance, end of period $ 150,000 $ 1,613,388 $ 46,247 $ 2,800,659 $ (71,717) $ 4,538,577
2018
Balance, beginning of period $ 150,000 $ 1,602,726 $ 42,633 $ 2,620,797 $ (71,113) $ 4,345,043
Net earnings – – – 187,751 – 187,751Other comprehensive income (loss), net of tax – – – – 31,889 31,889
Total comprehensive income – – – 187,751 31,889 219,640
Common shares Issued under stock option plan – 6,234 – – – 6,234Stock options Current period expense – – 906 – – 906 Exercised – – (662) – – (662)Perpetual preferred share dividends – – – (2,213) – (2,213)Common share dividends – – – (135,451) – (135,451)Other – – – (562) – (562)
Balance, end of period $ 150,000 $ 1,608,960 $ 42,877 $ 2,670,322 $ (39,224) $ 4,432,935
(See accompanying notes to interim condensed consolidated financial statements.)
POWER FINANCIAL CORPORATION�— �FIRST QUARTER REPORT 2019 C 49
PFC_QUAT1_Eng03_IGM_2019-05-03_v1.indd D49PFC_QUAT1_Eng03_IGM_2019-05-03_v1.indd D49 19-05-10 6:53 AM19-05-10 6:53 AM

PA
RT
C
IGM
FIN
AN
CIA
L IN
C.
IGM FINANCIAL INC. FIRST QUARTER REPORT 2019 | INTERIM CONDENSED CONSOLIDATED FINANCIAL STATEMENTS 53
CONSOLIDATED STATEMENTS OF CASH FLOWS
(unaudited) THREE MONTHS ENDED MARCH 31
(in thousands of Canadian dollars) 2019 2018
Operating activities Earnings before income taxes $ 214,760 $ 240,141 Income taxes paid (96,629) (38,373) Adjustments to determine net cash from operating activities Capitalized sales commission amortization 4,781 2,928 Capitalized sales commissions paid (12,550) (16,275) Amortization of capital and intangible assets 19,968 13,872 Proportionate share of associates’ earnings, net of dividends received (16,239) (22,526) Pension and other post-employment benefits 799 (17,882) Changes in operating assets and liabilities and other (66,419) (27,786)
Cash from operating activites before restructuring provision payments 48,471 134,099 Restructuring provision cash payments (19,625) (16,234)
28,846 117,865
Financing activities Net increase (decrease) in deposits and certificates 870 (551) Increase in obligations to securitization entities 426,284 361,544 Repayments of obligations to securitization entities and other (320,989) (352,802) Repayments of lease obligations (5,570) – Issue of debentures 250,000 – Repayment of debentures – (150,000) Issue of common shares 3,696 5,572 Common shares purchased for cancellation (9,152) – Perpetual preferred share dividends paid (2,213) (2,213) Common share dividends paid (135,498) (135,375)
207,428 (273,825)
Investing activities Purchase of other investments (35,351) (50,240) Proceeds from the sale of other investments 20,219 25,805 Increase in loans (293,324) (383,643) Repayment of loans and other 341,255 403,007 Net additions to capital assets (5,250) (4,512) Net cash used in additions to intangible assets and acquisitions (10,151) (23,057) Investment in Personal Capital Corporation (66,811) –
(49,413) (32,640)
Increase (decrease) in cash and cash equivalents 186,861 (188,600)Cash and cash equivalents, beginning of period 650,228 966,843
Cash and cash equivalents, end of period $ 837,089 $ 778,243
Cash $ 56,119 $ 49,566Cash equivalents 780,970 728,677
$ 837,089 $ 778,243
Supplemental disclosure of cash flow information related to operating activities Interest and dividends received $ 72,066 $ 69,925 Interest paid $ 64,169 $ 65,917
(See accompanying notes to interim condensed consolidated financial statements.)
C 50 POWER FINANCIAL CORPORATION�— �FIRST QUARTER REPORT 2019�
PFC_QUAT1_Eng03_IGM_2019-05-03_v1.indd D50PFC_QUAT1_Eng03_IGM_2019-05-03_v1.indd D50 19-05-10 6:53 AM19-05-10 6:53 AM

PA
RT
C
IGM
FINA
NC
IAL IN
C.
IGM FINANCIAL INC. FIRST QUARTER REPORT 2019 | NOTES TO THE INTERIM CONDENSED CONSOLIDATED FINANCIAL STATEMENTS54
NOTES TO THE INTERIM CONDENSED CONSOLIDATED FINANCIAL STATEMENTSMarch 31, 2019 (unaudited) (In thousands of Canadian dollars, except shares and per share amounts)
NOTE 1 CORPORATE INFORMATION
IGM Financial Inc. (the Company) is a publicly listed company (TSX: IGM), incorporated and domiciled in Canada. The registered address of the Company is 447 Portage Avenue, Winnipeg, Manitoba, Canada. The Company is controlled by Power Financial Corporation.
IGM Financial Inc. is a wealth and asset management company which serves the financial needs of Canadians through its principal subsidiaries, each operating distinctly within the advice segment of the financial services market. The Company’s wholly-owned principal subsidiaries are Investors Group Inc. and Mackenzie Financial Corporation.
NOTE 2 SUMMARY OF SIGNIFICANT ACCOUNTING POLICIES
The unaudited Interim Condensed Consolidated Financial Statements of the Company (Interim Financial Statements) have been prepared in accordance with International Accounting Standard 34, Interim Financial Reporting, using the accounting policies as set out in this note and in Note 2 to the Consolidated Financial Statements for the year ended December 31, 2018. The Interim Financial Statements should be read in conjunction with the Consolidated Financial Statements in the 2018 IGM Financial Inc. Annual Report.
CHANGES IN ACCOUNTING POLICIES
IFRS 16 LEASES (IFRS 16)
As of January 1, 2019, the Company adopted IFRS 16 using the modified retrospective method with no restatement of comparative financial information. Under this approach, the Company recognized a lease liability of $105.5 million equal to the present value of the remaining lease payments discounted using the Company’s incremental borrowing rate at January 1, 2019. The weighted average discount rate applied was 4.4%. A right-of-use asset of $96.1 million representing the Company’s property leases was also recognized at its carrying amount as if IFRS 16 had been applied since each lease commencement date, net of the accumulated amortization that would have been recognized up to January 1, 2019. The difference between the right-of-use asset and the lease liability of $9.4 million was recognized as an adjustment to retained earnings as at January 1, 2019. The following practical expedients were applied on transition:
• Applied a single discount rate to a portfolio of leases with reasonably similar characteristics.
• Accounted for leases for which the remaining lease term ends within 12 months of the date of initial application as a short-term lease.
• Relied on its assessment of whether leases are onerous applying IAS 37, Provisions, Contingent Liabilities and Contingent Assets, immediately before the date of initial application as an alternative to performing an impairment review.
Amortization expense increased due to the amortization of the right-of-use asset and interest expense increased due to the imputed interest on the lease liability; however total expenses are not materially different due to the offsetting decrease to operating lease expense.
POWER FINANCIAL CORPORATION�— �FIRST QUARTER REPORT 2019 C 51
PFC_QUAT1_Eng03_IGM_2019-05-03_v1.indd D51PFC_QUAT1_Eng03_IGM_2019-05-03_v1.indd D51 19-05-10 6:53 AM19-05-10 6:53 AM

PA
RT
C
IGM
FIN
AN
CIA
L IN
C.
IGM FINANCIAL INC. FIRST QUARTER REPORT 2019 | NOTES TO THE INTERIM CONDENSED CONSOLIDATED FINANCIAL STATEMENTS 55
CHANGES IN ACCOUNTING POLICIES (continued)
IFRS 16 LEASES (IFRS 16) (continued)
Impact of the changes in accounting policies on the Consolidated Balance Sheet:
ADJUSTMENT DUE TO DECEMBER 31, 2018 ADOPTION OF IFRS 16 JANUARY 1, 2019
Assets Other assets(1) $ 46,531 $ (61) $ 46,470 Capital assets 138,647 96,065 234,712
$ 96,004
Liabilities & Shareholders’ Equity Accounts payable and accrued liabilities(1) $ 397,379 $ (1,958) $ 395,421 Lease obligations – 105,539 105,539 Deferred income taxes 295,719 (2,009) 293,710 Retained earnings 2,840,566 (5,568) 2,834,998
$ 96,004
(1) Write-off of free rent inducement on capitalized leases
LEASES
For contracts that contain a lease, the Company recognizes a right-of-use asset and a lease liability. The right-of-use asset is depreciated using the straight-line method from the commencement date to the end of the lease term and is recorded in Non-commission expense. Imputed interest on the lease liability is recorded in Interest expense.
Lease payments included in the measurement of the lease liability comprises fixed payments less any lease incentives receivable, variable payments that depend on an index or a rate, and payments or penalties for terminating the lease, if any. The lease payments are discounted using the Company’s incremental borrowing rate, which is applied to portfolios of leases with reasonably similar characteristics.
The Company does not recognize a right-of-use asset or lease liability for leases that, at commencement date, have a lease term of 12 months or less, and leases for which the underlying asset is of low value. The Company recognizes the payments associated with these leases as an expense on a straight-line basis over the term of the lease.
COMPARATIVE FIGURES
The Company reclassified certain comparative figures in its Statements of Cash Flows to conform to the current year’s presentation. The reclassifications are intended to provide additional details on the nature of the Company’s cash flows and had no impact on the net earnings of the Company.
NOTE 2 SUMMARY OF SIGNIFICANT ACCOUNTING POLICIES (continued)
C 52 POWER FINANCIAL CORPORATION�— �FIRST QUARTER REPORT 2019�
PFC_QUAT1_Eng03_IGM_2019-05-03_v1.indd D52PFC_QUAT1_Eng03_IGM_2019-05-03_v1.indd D52 19-05-10 6:53 AM19-05-10 6:53 AM

PA
RT
C
IGM
FINA
NC
IAL IN
C.
IGM FINANCIAL INC. FIRST QUARTER REPORT 2019 | NOTES TO THE INTERIM CONDENSED CONSOLIDATED FINANCIAL STATEMENTS56
NOTE 3 OTHER INVESTMENTS
MARCH 31, 2019 DECEMBER 31, 2018 FAIR FAIR COST VALUE COST VALUE
Fair value through other comprehensive income (FVTOCI) Corporate investments $ 196,187 $ 231,895 $ 303,619 $ 372,396
Fair value through profit or loss (FVTPL) Equity securities 17,009 15,549 16,976 12,915 Proprietary investment funds 81,719 81,543 78,504 74,600
98,728 97,092 95,480 87,515
$ 294,915 $ 328,987 $ 399,099 $ 459,911
In January 2019, the Company invested an additional amount of $66.8 million (USD $50.0 million) in Personal Capital Corporation which increased its voting interest to 22.7% and resulted in reclassification of the investment in Personal Capital Corporation from FVTOCI to the equity method (Note 6).
In the first quarter of 2019, the Company invested an additional $17.9 million in Wealthsimple Financial Corporation.
On April 15, 2019 the Company invested an additional $11.0 million in Portag3 Ventures II LP.
NOTE 4 LOANS
CONTRACTUAL MATURITY
MARCH 31 DECEMBER 31 1 YEAR 1 – 5 OVER 2019 2018 OR LESS YEARS 5 YEARS TOTAL TOTAL
Amortized cost Residential mortgages $ 1,315,873 $ 6,356,866 $ 10,427 $ 7,683,166 $ 7,734,529
Less: Allowance for expected credit losses 811 801
7,682,355 7,733,728Fair value through profit or loss 5,330 4,303
$ 7,687,685 $ 7,738,031
The change in the allowance for expected credit losses is as follows:Balance, beginning of period $ 801 $ 806Write-offs, net of recoveries (398) (326)Provision for credit losses 408 321
Balance, end of period $ 811 $ 801
Total credit impaired loans as at March 31, 2019 were $2,921 (December 31, 2018 – $3,271).
Total interest income on loans was $54.5 million (2018 – $52.2 million). Total interest expense on obligations to securitization entities, related to securitized loans, was $44.1 million (2018 – $39.9 million). Gains realized on the sale of residential mortgages totalled $0.3 million (2018 – $0.8 million). Fair value adjustments related to mortgage banking operations totalled negative $3.4 million (2018 – negative $3.9 million). These amounts were included in Net investment income and other. Net investment income and other also includes other mortgage banking related items including portfolio insurance, issue costs, and other items.
POWER FINANCIAL CORPORATION�— �FIRST QUARTER REPORT 2019 C 53
PFC_QUAT1_Eng03_IGM_2019-05-03_v1.indd D53PFC_QUAT1_Eng03_IGM_2019-05-03_v1.indd D53 19-05-10 6:53 AM19-05-10 6:53 AM

PA
RT
C
IGM
FIN
AN
CIA
L IN
C.
IGM FINANCIAL INC. FIRST QUARTER REPORT 2019 | NOTES TO THE INTERIM CONDENSED CONSOLIDATED FINANCIAL STATEMENTS 57
NOTE 5 SECURITIZATIONS
The Company securitizes residential mortgages through the Canada Mortgage and Housing Corporation (CMHC) sponsored National Housing Act Mortgage-Backed Securities (NHA MBS) Program and Canada Mortgage Bond (CMB) Program and through Canadian bank-sponsored asset-backed commercial paper (ABCP) programs. These transactions do not meet the requirements for derecognition as the Company retains prepayment risk and certain elements of credit risk. Accordingly, the Company has retained these mortgages on its balance sheets and has recorded offsetting liabilities for the net proceeds received as Obligations to securitization entities which are recorded at amortized cost.
The Company earns interest on the mortgages and pays interest on the obligations to securitization entities. As part of the CMB transactions, the Company enters into a swap transaction whereby the Company pays coupons on CMBs and receives investment returns on the NHA MBS and the reinvestment of repaid mortgage principal. A component of this swap, related to the obligation to pay CMB coupons and receive investment returns on repaid mortgage principal, is recorded as a derivative and had a negative fair value of $5.5 million at March 31, 2019 (December 31, 2018 – positive $4.9 million).
Under the NHA MBS and CMB Program, the Company has an obligation to make timely payments to security holders regardless of whether amounts are received from mortgagors. All mortgages securitized under the NHA MBS and CMB Program are insured by CMHC or another approved insurer under the program. As part of the ABCP transactions, the Company has provided cash reserves for credit enhancement which are recorded at cost. Credit risk is limited to these cash reserves and future net interest income as the ABCP Trusts have no recourse to the Company’s other assets for failure to make payments when due. Credit risk is further limited to the extent these mortgages are insured.
OBLIGATIONS TO SECURITIZED SECURITIZATION MARCH 31, 2019 MORTGAGES ENTITIES NET
Carrying value NHA MBS and CMB Program $ 4,301,389 $ 4,288,284 $ 13,105 Bank sponsored ABCP 3,153,738 3,174,396 (20,658)
Total $ 7,455,127 $ 7,462,680 $ (7,553)
Fair value $ 7,540,808 $ 7,578,167 $ (37,359)
DECEMBER 31, 2018
Carrying value NHA MBS and CMB Program $ 4,246,668 $ 4,250,641 $ (3,973) Bank sponsored ABCP 3,102,498 3,119,552 (17,054)
Total $ 7,349,166 $ 7,370,193 $ (21,027)
Fair value $ 7,405,170 $ 7,436,873 $ (31,703)
The carrying value of Obligations to securitization entities, which is recorded net of issue costs, includes principal payments received on securitized mortgages that are not due to be settled until after the reporting period. Issue costs are amortized over the life of the obligation on an effective interest rate basis.
C 54 POWER FINANCIAL CORPORATION�— �FIRST QUARTER REPORT 2019�
PFC_QUAT1_Eng03_IGM_2019-05-03_v1.indd D54PFC_QUAT1_Eng03_IGM_2019-05-03_v1.indd D54 19-05-10 6:53 AM19-05-10 6:53 AM

PA
RT
C
IGM
FINA
NC
IAL IN
C.
IGM FINANCIAL INC. FIRST QUARTER REPORT 2019 | NOTES TO THE INTERIM CONDENSED CONSOLIDATED FINANCIAL STATEMENTS58
NOTE 6 INVESTMENT IN ASSOCIATES
PERSONAL LIFECO CHINA AMC CAPITAL TOTAL
MARCH 31, 2019
Balance, beginning of period $ 967,830 $ 683,475 $ – $ 1,651,305Transfer from corporate investments (FVTOCI) – – 216,952 216,952Dividends received (16,411) – – (16,411)Proportionate share of: Earnings (losses) 28,642 7,369 (3,361) 32,650 Other comprehensive income (loss) and other adjustments 19,445 1,936 143 21,524
Balance, end of period $ 999,506 $ 692,780 $ 213,734 $ 1,906,020
MARCH 31, 2018
Balance, beginning of period $ 901,405 $ 647,880 $ – $ 1,549,285Dividends received (15,458) – – (15,458)Proportionate share of: Earnings 30,181 7,803 – 37,984 Other comprehensive income (loss) and other adjustments 5,836 38,842 – 44,678
Balance, end of period $ 921,964 $ 694,525 $ – $ 1,616,489
The Company uses the equity method to account for its investments in Great-West Lifeco Inc., China Asset Management Co., Ltd. and Personal Capital Corporation as it exercises significant influence.
GREAT-WEST LIFECO INC. (LIFECO)
At March 31, 2019, the Company held 39,737,388 (December 31, 2018 – 39,737,388) shares of Lifeco, which represented an equity interest of 4.0% (December 31, 2018 – 4.0%).
Subsequent to March 31, 2019, the Company participated on a proportionate basis in the Lifeco substantial issuer bid by selling 2,400,255 of its shares in Lifeco for proceeds of $80.4 million.
CHINA ASSET MANAGEMENT CO., LTD. (CHINA AMC)
China AMC is an asset management company established in Beijing, China and is controlled by CITIC Securities Company Limited.
As at March 31, 2019, the Company held a 13.9% equity interest in China AMC (2018 – 13.9%).
PERSONAL CAPITAL CORPORATION (PERSONAL CAPITAL)
In January 2019, the Company invested an additional amount of $66.8 million (USD $50.0 million) in Personal Capital which increased its voting interest to 22.7% (March 31, 2018 – 15.5%) and, combined with its board representation, resulted in the Company exercising significant influence.
As at March 31, 2019, the Company held a 25.2% equity interest in Personal Capital. IGM Financial’s equity earnings from Personal Capital includes its proportionate share of Personal Capital’s net income adjusted by IGM Financial’s amortization of intangible assets that it recognized as part of its investment in the company.
NOTE 7 LONG-TERM DEBT
On March 20, 2019, the Company issued $250.0 million 4.206% debentures maturing March 21, 2050. The net proceeds were used by the Company to fund the redemption of $150.0 million of its issued and outstanding 5.90% Non-Cumulative First Preferred Shares, Series B and for general corporate purposes. The Company redeemed the Series B Preferred Shares on April 30, 2019.
POWER FINANCIAL CORPORATION�— �FIRST QUARTER REPORT 2019 C 55
PFC_QUAT1_Eng03_IGM_2019-05-03_v1.indd D55PFC_QUAT1_Eng03_IGM_2019-05-03_v1.indd D55 19-05-10 6:53 AM19-05-10 6:53 AM

PA
RT
C
IGM
FIN
AN
CIA
L IN
C.
IGM FINANCIAL INC. FIRST QUARTER REPORT 2019 | NOTES TO THE INTERIM CONDENSED CONSOLIDATED FINANCIAL STATEMENTS 59
NOTE 8 SHARE CAPITAL
AUTHORIZED
Unlimited number of: First preferred shares, issuable in series Second preferred shares, issuable in series Class 1 non-voting shares Common shares, no par value
ISSUED AND OUTSTANDING MARCH 31, 2019 MARCH 31, 2018 STATED STATED SHARES VALUE SHARES VALUE
Perpetual preferred shares – classified as equity: First preferred shares, Series B 6,000,000 $ 150,000 6,000,000 $ 150,000
Common shares: Balance, beginning of period 240,885,317 $ 1,611,263 240,666,131 $ 1,602,726 Issued under Stock Option Plan 138,598 3,908 139,776 $ 6,234 Purchased for cancellation (266,093) (1,783) – –
Balance, end of period 240,757,822 $ 1,613,388 240,805,907 $ 1,608,960
PERPETUAL PREFERRED SHARES
The company redeemed the $150.0 million First preferred shares, Series B on April 30, 2019.
NORMAL COURSE ISSUER BID
In the first quarter of 2019, there were 266,093 shares (2018 – nil) purchased at a cost of $9.2 million. The premium paid to purchase the shares in excess of the stated value was charged to Retained earnings.
The Company commenced a normal course issuer bid on March 26, 2019 which is effective until the earlier of March 25, 2020 and the date on which the Corporation has purchased the maximum number of common shares permitted under the Normal Course Issuer Bid. Pursuant to this bid, the Company may purchase up to 4.0 million or 1.7% of its common shares outstanding as at March 14, 2019. The Company’s previous normal course issuer bid expired on March 19, 2018.
In connection with its normal course issuer bid, the Company has established an automatic securities purchase plan for its common shares. The automatic securities purchase plan provides standard instructions regarding how the Company’s common shares are to be purchased under its normal course issuer bid during certain pre-determined trading blackout periods. Outside of these pre-determined trading blackout periods, purchases under the Company’s normal course issuer bid will be completed based upon management’s discretion.
NOTE 9 CAPITAL MANAGEMENT
The capital management policies, procedures and activities of the Company are discussed in the Capital Resources section of the Company’s Management’s Discussion and Analysis contained in the First Quarter 2019 Report to Shareholders and in Note 17 to the Consolidated Financial Statements in the 2018 IGM Financial Inc. Annual Report and have not changed significantly since December 31, 2018.
C 56 POWER FINANCIAL CORPORATION�— �FIRST QUARTER REPORT 2019�
PFC_QUAT1_Eng03_IGM_2019-05-03_v1.indd D56PFC_QUAT1_Eng03_IGM_2019-05-03_v1.indd D56 19-05-10 6:53 AM19-05-10 6:53 AM

PA
RT
C
IGM
FINA
NC
IAL IN
C.
IGM FINANCIAL INC. FIRST QUARTER REPORT 2019 | NOTES TO THE INTERIM CONDENSED CONSOLIDATED FINANCIAL STATEMENTS60
NOTE 10 SHARE-BASED PAYMENTS
STOCK OPTION PLAN MARCH 31 DECEMBER 31 2019 2018
Common share options – Outstanding 10,975,380 9,701,894 – Exercisable 5,672,049 4,742,050
In the first quarter of 2019, the Company granted 1,485,310 options to employees (2018 – 1,318,390). The fair value of options granted during the three months ended March 31, 2019 has been estimated at $1.82 per option (2018 – $2.56) using the Black-Scholes option pricing model. The closing share price at the grant date was $34.30. The assumptions used in these valuation models include:
THREE MONTHS ENDED MARCH 31 2019 2018
Exercise price $ 34.29 $ 39.29Risk-free interest rate 2.07% 2.35%Expected option life 7 years 6 yearsExpected volatility 18.00% 17.00%Expected dividend yield 6.56% 5.73%
Expected volatility has been estimated based on the historic volatility of the Company’s share price over seven years which is reflective of the expected option life. Options vest over a period of up to 7.5 years from the grant date and are exercisable no later than 10 years after the grant date.
NOTE 11 ACCUMULATED OTHER COMPREHENSIVE INCOME (LOSS)
INVESTMENT EMPLOYEE OTHER IN ASSOCIATES MARCH 31, 2019 BENEFITS INVESTMENTS AND OTHER TOTAL
Balance, beginning of period $ (149,052) $ 57,234 $ 46,020 $ (45,798)Other comprehensive income (loss) (19,980) (7,138) 22,667 (4,451)Transfer out of FVTOCI – (21,468) – (21,468)
Balance, end of period $ (169,032) $ 28,628 $ 68,687 $ (71,717)
MARCH 31, 2018
Balance, beginning of period $ (132,529) $ 39,068 $ 22,348 $ (71,113)Other comprehensive income (loss) (3,427) (2,746) 38,062 31,889
Balance, end of period $ (135,956) $ 36,322 $ 60,410 $ (39,224)
Amounts are recorded net of tax.
NOTE 12 RISK MANAGEMENT
The risk management policies and procedures of the Company are discussed in the Financial Instruments Risk section of the Company’s Management’s Discussion and Analysis contained in the First Quarter 2019 Report to Shareholders and in Note 20 to the Consolidated Financial Statements in the 2018 IGM Financial Inc. Annual Report and have not changed significantly since December 31, 2018.
POWER FINANCIAL CORPORATION�— �FIRST QUARTER REPORT 2019 C 57
PFC_QUAT1_Eng03_IGM_2019-05-03_v1.indd D57PFC_QUAT1_Eng03_IGM_2019-05-03_v1.indd D57 19-05-10 6:53 AM19-05-10 6:53 AM

PA
RT
C
IGM
FIN
AN
CIA
L IN
C.
IGM FINANCIAL INC. FIRST QUARTER REPORT 2019 | NOTES TO THE INTERIM CONDENSED CONSOLIDATED FINANCIAL STATEMENTS 61
NOTE 13 FAIR VALUE OF FINANCIAL INSTRUMENTS
Fair values are management’s estimates and are calculated using market conditions at a specific point in time and may not reflect future fair values. The calculations are subjective in nature, involve uncertainties and are matters of significant judgment.
All financial instruments measured at fair value and those for which fair value is disclosed are classified into one of three levels that distinguish fair value measurements by the significance of the inputs used for valuation.
Fair value is determined based on the price that would be received for an asset or paid to transfer a liability in the most advantageous market, utilizing a hierarchy of three different valuation techniques, based on the lowest level input that is significant to the fair value measurement in its entirety.
Level 1 – Unadjusted quoted prices in active markets for identical assets or liabilities;
Level 2 – Observable inputs other than Level 1 quoted prices for similar assets or liabilities in active markets; quoted prices for identical or similar assets or liabilities in markets that are not active; or inputs other than quoted prices that are observable or corroborated by observable market data; and
Level 3 – Unobservable inputs that are supported by little or no market activity. Valuation techniques are primarily model-based.
Markets are considered inactive when transactions are not occurring with sufficient regularity. Inactive markets may be characterized by a significant decline in the volume and level of observed trading activity or through large or erratic bid/offer spreads. In those instances where traded markets are not considered sufficiently active, fair value is measured using valuation models which may utilize predominantly observable market inputs (Level 2) or may utilize predominantly non-observable market inputs (Level 3). Management considers all reasonably available information including indicative broker quotations, any available pricing for similar instruments, recent arm’s length market transactions, any relevant observable market inputs, and internal model-based estimates. Management exercises judgment in determining the most appropriate inputs and the weighting ascribed to each input as well as in the selection of valuation methodologies.
Fair value is determined using the following methods and assumptions:
Other investments and other financial assets and financial liabilities are valued using quoted prices from active markets, when available. When a quoted market price is not readily available, valuation techniques are used that require assumptions related to discount rates and the timing and amount of future cash flows. Wherever possible, observable market inputs are used in the valuation techniques.
Loans classified as Level 2 are valued using market interest rates for loans with similar credit risk and maturity.
Loans classified as Level 3 are valued by discounting the expected future cash flows at prevailing market yields.
Obligations to securitization entities are valued by discounting the expected future cash flows at prevailing market yields for securities issued by these securitization entities having similar terms and characteristics.
Deposits and certificates are valued by discounting the contractual cash flows using market interest rates currently offered for deposits with similar terms and credit risks.
Long-term debt is valued using quoted prices for each debenture available in the market.
Derivative financial instruments are valued based on quoted market prices, where available, prevailing market rates for instruments with similar characteristics and maturities, or discounted cash flow analysis.
Level 1 financial instruments include exchange-traded equity investments and open-end investment fund units and other financial liabilities in instances where there are quoted prices available from active markets.
Level 2 assets and liabilities include fixed income securities, loans, derivative financial instruments, deposits and certificates and long-term debt. The fair value of fixed income securities is determined using quoted market prices or independent dealer price quotes. The fair value of derivative financial instruments and deposits and certificates are determined using valuation models, discounted cash flow methodologies, or similar techniques using primarily observable market inputs. The fair value of long-term debt is determined using indicative broker quotes.
C 58 POWER FINANCIAL CORPORATION�— �FIRST QUARTER REPORT 2019�
PFC_QUAT1_Eng03_IGM_2019-05-03_v1.indd D58PFC_QUAT1_Eng03_IGM_2019-05-03_v1.indd D58 19-05-10 6:53 AM19-05-10 6:53 AM

PA
RT
C
IGM
FINA
NC
IAL IN
C.
IGM FINANCIAL INC. FIRST QUARTER REPORT 2019 | NOTES TO THE INTERIM CONDENSED CONSOLIDATED FINANCIAL STATEMENTS62
Level 3 assets and liabilities include investments with little or no trading activity valued using broker-dealer quotes, loans, other financial assets, obligations to securitization entities and derivative financial instruments. Derivative financial instruments consist of principal reinvestment account swaps which represent the component of a swap entered into under the CMB Program whereby the Company pays coupons on Canada Mortgage Bonds and receives investment returns on the reinvestment of repaid mortgage principal. Fair value is determined by discounting the projected cashflows of the swaps. The notional amount, which is an input used to determine the fair value of the swap, is determined using an average unobservable prepayment rate of 15% which is based on historical prepayment patterns. An increase (decrease) in the assumed mortgage prepayment rate increases (decreases) the notional amount of the swap.
The following table presents the carrying amounts and fair values of financial assets and financial liabilities, including their levels in the fair value hierarchy. The table distinguishes between those financial instruments recorded at fair value and those recorded at amortized cost. The table also excludes fair value information for financial assets and financial liabilities not measured at fair value if the carrying amount is a reasonable approximation of fair value. These items include cash and cash equivalents, accounts and other receivables, certain other financial assets, accounts payable and accrued liabilities and certain other financial liabilities.
FAIR VALUE
CARRYING VALUE LEVEL 1 LEVEL 2 LEVEL 3 TOTAL
MARCH 31, 2019
Financial assets recorded at fair value Other investments – FVTOCI $ 231,895 $ – $ – $ 231,895 $ 231,895 – FVTPL 97,092 96,473 – 619 97,092 Loans – FVTPL 5,330 – 5,330 – 5,330 Derivative financial instruments 15,809 – 11,247 4,562 15,809Financial assets recorded at amortized cost Loans – Amortized cost 7,682,355 – 226,563 7,540,808 7,767,371Financial liabilities recorded at fair value Derivative financial instruments 26,191 – 16,103 10,088 26,191 Other financial liabilities 9,522 9,423 99 – 9,522Financial liabilities recorded at amortized cost Deposits and certificates 531,583 – 531,966 – 531,966 Obligations to securitization entities 7,462,680 – – 7,578,167 7,578,167 Long-term debt 2,100,000 – 2,397,774 – 2,397,774
DECEMBER 31, 2018
Financial assets recorded at fair value Other investments – FVTOCI $ 372,396 $ – $ – $ 372,396 $ 372,396 – FVTPL 87,515 86,963 – 552 87,515 Loans – FVTPL 4,303 – 4,303 – 4,303 Derivative financial instruments 16,364 – 7,179 9,185 16,364Financial assets recorded at amortized cost Loans – Amortized cost 7,733,728 – 380,372 7,405,170 7,785,542Financial liabilities recorded at fair value Derivative financial instruments 28,990 – 24,704 4,286 28,990 Other financial liabilities 8,237 8,235 2 – 8,237Financial liabilities recorded at amortized cost Deposits and certificates 568,799 – 569,048 – 569,048 Obligations to securitization entities 7,370,193 – – 7,436,873 7,436,873 Long-term debt 1,850,000 – 2,050,299 – 2,050,299
There were no significant transfers between Level 1 and Level 2 in 2019 and 2018.
NOTE 13 FAIR VALUE OF FINANCIAL INSTRUMENTS (continued)
POWER FINANCIAL CORPORATION�— �FIRST QUARTER REPORT 2019 C 59
PFC_QUAT1_Eng03_IGM_2019-05-03_v1.indd D59PFC_QUAT1_Eng03_IGM_2019-05-03_v1.indd D59 19-05-10 6:53 AM19-05-10 6:53 AM

PA
RT
C
IGM
FIN
AN
CIA
L IN
C.
IGM FINANCIAL INC. FIRST QUARTER REPORT 2019 | NOTES TO THE INTERIM CONDENSED CONSOLIDATED FINANCIAL STATEMENTS 63
The following table provides a summary of changes in Level 3 assets and liabilities measured at fair value on a recurring basis.
GAINS/(LOSSES) GAINS/ INCLUDED IN (LOSSES) OTHER PURCHASES BALANCE INCLUDED IN COMPREHENSIVE AND TRANSFERS BALANCE JANUARY 1 NET EARNINGS(1) INCOME ISSUANCES SETTLEMENTS IN/OUT MARCH 31
MARCH 31, 2019
Other investments – FVTOCI $ 372,396 $ – $ (8,251) $ 17,891 $ – $ (150,141)(2) $ 231,895 – FVTPL 552 67 – – – – 619Derivative financial instruments, net 4,899 (9,148) – (973) 304 – (5,526)
MARCH 31, 2018
Other investments – FVTOCI $ 262,825 $ – $ (3,175) $ 47,132 $ – $ – $ 306,782 – FVTPL 661 20 – – – – 681Derivative financial instruments, net 4,095 (2,685) – 194 (3,820) – 5,424
(1) Included in Net investment income in the Consolidated Statements of Earnings.
(2) Reclassification of investment in Personal Capital from Other investments (FVTOCI) to Investment in associates (equity method).
NOTE 14 EARNINGS PER COMMON SHARE
THREE MONTHS ENDED MARCH 31
2019 2018
Earnings Net earnings $ 169,716 $ 187,751 Perpetual preferred share dividends 2,213 2,213
Net earnings available to common shareholders $ 167,503 $ 185,538
Number of common shares (in thousands)
Weighted average number of common shares outstanding 240,941 240,759 Add: Potential exercise of outstanding stock options(1) – 322
Average number of common shares outstanding – Diluted basis 240,941 241,081
Earnings per common share (in dollars)
Basic $ 0.70 $ 0.77 Diluted $ 0.70 $ 0.77
(1) Excludes 3,013 thousand shares for the three months ended March 31, 2019 (2018 – 720 thousand) related to outstanding stock options that were anti-dilutive.
NOTE 13 FAIR VALUE OF FINANCIAL INSTRUMENTS (continued)
C 60 POWER FINANCIAL CORPORATION�— �FIRST QUARTER REPORT 2019�
PFC_QUAT1_Eng03_IGM_2019-05-03_v1.indd D60PFC_QUAT1_Eng03_IGM_2019-05-03_v1.indd D60 19-05-10 6:53 AM19-05-10 6:53 AM

PA
RT
C
IGM
FINA
NC
IAL IN
C.
IGM FINANCIAL INC. FIRST QUARTER REPORT 2019 | NOTES TO THE INTERIM CONDENSED CONSOLIDATED FINANCIAL STATEMENTS64
NOTE 15 SEGMENTED INFORMATION
The Company’s reportable segments are:
• IG Wealth Management
• Mackenzie Investments
• Corporate and Other
These segments reflect the Company’s internal financial reporting and performance measurement. In the third quarter of 2018, the Company announced that it has rebranded Investors Group as IG Wealth Management.
IG Wealth Management earns fee-based revenues in the conduct of its core business activities which are primarily related to the distribution, management and administration of its investment funds. It also earns fee revenues from the provision of brokerage services and the distribution of insurance and banking products. In addition, IG Wealth Management earns intermediary revenues primarily from mortgage banking and servicing activities and from the assets funded by deposit and certificate products.
Mackenzie Investments earns fee-based revenues from services it provides as fund manager to its investment funds and as investment advisor to sub-advisory and institutional accounts.
Corporate and Other includes Investment Planning Counsel, equity income from its investment in Lifeco, China AMC and Personal Capital (Note 6), net investment income on unallocated investments, other income, and also includes consolidation elimination entries.
2019
IG WEALTH MACKENZIE CORPORATE THREE MONTHS ENDED MARCH 31 MANAGEMENT INVESTMENTS AND OTHER TOTAL
Revenues Management fees $ 358,153 $ 168,278 $ 18,793 $ 545,224 Administration fees 73,949 23,272 4,478 101,699 Distribution fees 41,112 1,439 46,723 89,274 Net investment income and other 10,038 4,179 6,016 20,233 Proportionate share of associates’ earnings – – 32,650 32,650
483,252 197,168 108,660 789,080
Expenses Commission 156,984 72,448 45,234 274,666 Non-commission 162,926 88,790 22,722 274,438
319,910 161,238 67,956 549,104
Earnings before undernoted $ 163,342 $ 35,930 $ 40,704 239,976
Interest expense(1) 25,216
Earnings before income taxes 214,760Income taxes 45,044
Net earnings 169,716Perpetual preferred share dividends 2,213
Net earnings available to common shareholders $ 167,503
Identifiable assets $ 9,065,689 $ 1,183,641 $ 3,060,625 $ 13,309,955 Goodwill 1,347,781 1,168,580 143,906 2,660,267
Total assets $ 10,413,470 $ 2,352,221 $ 3,204,531 $ 15,970,222
(1) Interest expense includes interest on long-term debt and, beginning January 1, 2019, includes interest on leases as a result of the Company’s adoption of IFRS 16, Leases.
POWER FINANCIAL CORPORATION�— �FIRST QUARTER REPORT 2019 C 61
PFC_QUAT1_Eng03_IGM_2019-05-03_v1.indd D61PFC_QUAT1_Eng03_IGM_2019-05-03_v1.indd D61 19-05-10 6:53 AM19-05-10 6:53 AM

PA
RT
C
IGM
FIN
AN
CIA
L IN
C.
IGM FINANCIAL INC. FIRST QUARTER REPORT 2019 | NOTES TO THE INTERIM CONDENSED CONSOLIDATED FINANCIAL STATEMENTS 65
NOTE 15 SEGMENTED INFORMATION (continued)
2018
IG WEALTH MACKENZIE CORPORATE THREE MONTHS ENDED MARCH 31 MANAGEMENT INVESTMENTS AND OTHER TOTAL
Revenues Management fees $ 360,807 $ 175,930 $ 19,864 $ 556,601 Administration fees 78,041 24,882 4,611 107,534 Distribution fees 43,318 2,066 47,936 93,320 Net investment income and other 10,336 (174) 4,047 14,209 Proportionate share of associates’ earnings – – 37,984 37,984
492,502 202,704 114,442 809,648
Expenses Commission 164,758 75,273 46,067 286,098 Non-commission 144,726 85,830 22,589 253,145
309,484 161,103 68,656 539,243
Earnings before undernoted $ 183,018 $ 41,601 $ 45,786 270,405
Interest expense 30,264
Earnings before income taxes 240,141Income taxes 52,390
Net earnings 187,751Perpetual preferred share dividends 2,213
Net earnings available to common shareholders $ 185,538
Identifiable assets $ 8,855,206 $ 1,203,987 $ 2,976,020 $ 13,035,213Goodwill 1,347,781 1,168,580 143,906 2,660,267
Total assets $ 10,202,987 $ 2,372,567 $ 3,119,926 $ 15,695,480
C 62 POWER FINANCIAL CORPORATION�— �FIRST QUARTER REPORT 2019�
PFC_QUAT1_Eng03_IGM_2019-05-03_v1.indd D62PFC_QUAT1_Eng03_IGM_2019-05-03_v1.indd D62 19-05-10 6:53 AM19-05-10 6:53 AM

PA
RT
D
PAR
GE
SA H
OLD
ING
SA
PARGESA HOLDING SA
PART D
The attached document discloses information relating to the fi nancial results of Pargesa Holding SA as issued by Pargesa Holding SA.
POWER FINANCIAL CORPORATION�— �FIRST QUARTER REPORT 2019 D 1
PFC_QUAT1_Eng04_PAR_2019-05-03_v1.indd E1PFC_QUAT1_Eng04_PAR_2019-05-03_v1.indd E1 19-05-10 6:09 PM19-05-10 6:09 PM

PA
RT
D
PAR
GE
SA H
OLD
ING
SA
7.5% 7.5% 9.4% 0.6% 8.5% 17.9%16.6%
Pernod Ricard adidas Lafarge
Holcim Total Imerys UmicoreSGS GEA Ontex
€17,095 [5]
€1,381 [4]
Pargesa
Pargesa Holding SA Power Financial Corporation and the Frère Group of Charleroi, Belgium, each hold a 50.0% interest in Parjointco N.V., a Netherlands-based company that, at March 31, 2019, held a 55.5% interest in Pargesa Holding SA (Pargesa), the Pargesa group’s parent company, representing 75.4% of the voting rights in the company. Pargesa has its head office in Geneva, Switzerland and its shares are listed on the Swiss Exchange (SIX: PARG). The Pargesa group holds interests in a limited number of large European companies.
The organization chart below reflects the group's structure at March 31, 2019 [ ]:
[ ] The chart shows the main shareholdings of the portfolio. Shareholdings are expressed as a percentage of the capital held.
[ ] 51.0% of voting rights (and of economic interest), taking into account the suspended voting rights related to GBL treasury shares.
[ ] Comprising significant investments in private equity, debt or specific thematic funds.
[ ] Estimated value in millions of euros at March 31, 2019.
[ ] Market value in millions of euros of the main investments held by GBL at March 31, 2019.
Pargesa holds an interest in Groupe Bruxelles Lambert (GBL), a holding company whose head office is in Brussels, Belgium, and which is listed on the Euronext Exchange (EBR: GBLB). At March 31, 2019, the GBL portfolio was comprised of investments in the following publicly traded companies:
Imerys (EPA: NK) – mineral-based specialty solutions for industry
adidas (XETR: ADS) – design and distribution of sportswear
Pernod Ricard (EPA: RI) – wines and spirits
SGS (SIX: SGSN) – testing, inspection and certification
LafargeHolcim (SIX: HOLN and EPA: LHN) – cement, aggregates and concrete
Umicore (EBR: UMI) – materials technology and recycling of precious metals
Total (EPA: FP) – oil, gas and chemical industries
GEA (XETR: G1A) – supplier of equipment and project management for a wide range of processing industries primarily in the food and beverage sectors
Ontex (EBR: ONTEX) – disposable hygiene products
Parques (BME: PQR) – operation of regional leisure parks
GBL Sienna Capital
Parques
53.9% 20.0% 21.2%
50.0% [2]
D 2 POWER FINANCIAL CORPORATION�— �FIRST QUARTER REPORT 2019
PFC_QUAT1_Eng04_PAR_2019-05-03_v1.indd E2PFC_QUAT1_Eng04_PAR_2019-05-03_v1.indd E2 19-05-10 6:09 PM19-05-10 6:09 PM

PA
RT
D
PAR
GE
SA H
OLD
ING
SA Pargesa Holding SA
Key Financial Data [in millions of Swiss francs] [unaudited]
March March December Variation [ ]
/
Consolidated net result (group share)
Net debt [ ]
Loan to value [ ] . % . % . %
Net asset value , , , . %
Market capitalization , , , . %
[ ] Variation between March 2019 and March 2018 for the consolidated net result, and between March 2019 and December 2018 for net debt, net asset value and market capitalization.
[ ] Pargesa’s net debt (including 50% of GBL’s net debt; the net debt amounts to SF428 million at end of March 2019 against SF566 million at end of December 2018 – see “Net asset value” section for details).
[ ] The loan to value ratio is calculated on the basis of (i) Pargesa’s direct net debt relative to (ii) Pargesa’s portfolio value.
Pargesa’s consolidated net result (group share) stands at SF91 million in the first quarter of 2019. The increase in the contribution of private equity and other funds as well as net financial income more than offset the decrease in Imerys' contribution. Pargesa’s financial position remains sound, with a net financial debt of SF178 million. Pargesa's net asset value rose 13.4% since the beginning of the year to SF10.2 billion at the end of March 2019.
Highlights In a favourable market context, GBL finalized, in March and April 2019, its exit from the energy sector initiated in 2013, by
selling 0.6% of Total's capital through forward sales maturing in January 2020. Sales were executed at an average spot price of €50.52 per share and at an average forward price of €48.37 per share. They have been prepaid[1] on May 2, 2019 for a total amount of €771 million. The capital gain generated by these sales will amount to €411 million at GBL’s level and will not impact the consolidated net income in 2020, in accordance with IFRS 9. At maturity of these sales, on January 24, 2020, GBL's ownership in Total will be reduced to 0.01%. GBL will continue to receive dividends on the disposed shares until this date.
GBL has also seized this market window to monetize 0.3% of adidas’ capital for a net amount of €139 million and generate a capital gain of €86 million which does not impact the income statement under the accounting standard IFRS 9. GBL thus returns to its ownership level of 7.5% of the capital of adidas (7.8% as of December 31, 2018), prior to the passive relution consecutive to the cancellation of shares by adidas in October 2018. At the end of March 2019, the participation in adidas was valued at €3,256 million.
During the first quarter of 2019, GBL continued to strengthen its position in Umicore. At March 31, 2019, GBL holds a 17.9% stake in Umicore (17.7% at the end of 2018), representing a market value of €1,747 million.
Pursuant to GBL’s share buyback program, as announced on October 31, 2018, 0.6 million shares have been bought during the first quarter of 2019. The economic interest of Pargesa in GBL stands at 51.0% following these purchases at March 31, 2019 against 50.8% at December 31, 2018. Between April 1 and April 22, 2019, 0.4 million supplementary shares have been purchased. This share buyback program is executed up to 44% to date.
GBL through Piolin Bidco, S.A.U. (Piolin) announced, on April 26, 2019, its intention to launch a voluntary public takeover bid paid in cash for the shares of Parques (the Bid). Piolin is indirectly held at 23.96% by Miles Capital, a subsidiary indirectly wholly owned by GBL, the remainder of the capital being indirectly held by EQT AB and Corporación Financiera Alba (Alba) at 50.01% and 26.03% respectively. The Bid still has to be approved by the Spanish Market Authority, the CNMV (Comisión Nacional del Mercado de Valores). A cash consideration of €14.00 per share is offered, representing a 31.6%[2] premium over the volume weighted average price observed over the last six months before the launch. The Bid is subject to the following conditions: (i) the acceptance by Parques’ shareholders, other than GBL and Alba, owning at least 30.79% of the capital and (ii) merger control authorizations. GBL and Alba irrevocably undertook to contribute their Parques shares to Piolin if the Bid is successful.
[ ] The prepayment of the forward sales of Total shares will not impact GBL’s net financial position until their maturity in January 2020.
[ ] 29.2% compared to the closing price of April 25, 2019 observed before its launch and 33.4% and 34.9% compared to the average prices observed over the periods of one and three months before its launch.
POWER FINANCIAL CORPORATION�— �FIRST QUARTER REPORT 2019 D 3
PFC_QUAT1_Eng04_PAR_2019-05-03_v1.indd E3PFC_QUAT1_Eng04_PAR_2019-05-03_v1.indd E3 19-05-10 6:09 PM19-05-10 6:09 PM

PA
RT
D
PAR
GE
SA H
OLD
ING
SA
Pargesa Holding SA
At the level of Sienna Capital:
In December 2017, Ergon Capital Partners launched a new fund, Ergon Capital Partners IV, which successfully closed at the end of March 2019, with total commitments of €580 million, beyond the fundraising objective of €500 million. In 2017, Sienna Capital committed €200 million in this new fund.
At March 31, 2019, GBL’s commitments with respect to Sienna Capital amounted to €504 million (€528 million at December 31, 2018).
Presentation of Results in Accordance with IFRS The simplified income statement in accordance with IFRS is as follows: [in millions of Swiss francs] [unaudited]
March ,
March ,
Operating income , . , .
Operating expenses ( , . ) ( , . )
Other income and expenses . –
Operating profit . .
Dividends and interest from long-term investments . .
Other financial income and expenses . ( . )
Taxes ( . ) ( . )
Income from associates and joint ventures . .
Net profit from continuing operations . .
Net profit from discontinued operations – .
Consolidated net profit [before non-controlling interests] . .
Attributable to non-controlling interests ( . ) ( . )
Attributable to Pargesa shareholders [group share] . .
Basic earnings per share attributable to Pargesa shareholders [SF] 1.07 0.72
Average number of shares [in thousands] , ,
€/SF average exchange rate . .
The operating profit amounts to SF84.0 million, compared to SF114.8 million in the first quarter of 2018. This change reflects the decrease in Imerys’ operating profit (loss).
The dividends and interest from long-term investments item of SF100.1 million in the first quarter of 2019 against SF95.8 million in the first quarter of 2018 comprises mainly the net dividend recorded on SGS of SF98.7 million (non-consolidated investment). The variation is primarily due to the increase in the dividend per share paid by SGS to GBL. The contribution of the other dividends will intervene starting from the second quarter.
Other financial income and expenses were SF43.3 million in the first quarter of 2019 compared with -SF44.4 million in the corresponding period of 2018. The increase in the first quarter reflects in particular the positive impact of GBL’s trading activity in 2019, the decrease in interest expenses and the variation in fair value of private equity and other non-consolidated funds.
The net profit from discontinued operations represents the contribution from Imerys’ Roofing division, which was sold in October 2018.
D 4 POWER FINANCIAL CORPORATION�— �FIRST QUARTER REPORT 2019
PFC_QUAT1_Eng04_PAR_2019-05-03_v1.indd E4PFC_QUAT1_Eng04_PAR_2019-05-03_v1.indd E4 19-05-10 6:09 PM19-05-10 6:09 PM

PA
RT
D
PAR
GE
SA H
OLD
ING
SA Pargesa Holding SA
Economic Presentation of Pargesa’s Financial Results The presentation of the economic result that follows makes it possible to assess differently the formation of the group results.
The economic results at March 31, 2019 can be analyzed as follows:
[ ] Information not available at the time of publication of the results for the three-month periods ended March 31, 2019 and 2018.
Most income comes from GBL, whose results are denominated in euros. In the first quarter of 2019, the average €/SF exchange rate is 1.132, compared with 1.165 in the first quarter of 2018, meaning a decrease of 2.8%. Furthermore, following the acquisition of treasury shares by GBL in late 2018 and in 2019 (please refer to the section “Highlights” for more details) and the conversion in 2018 of convertible bonds issued by GBL, Pargesa’s share of GBL’s earning (excluding the portion attributable to non-controlling shareholders) stands at 51.0% at March 31, 2019, compared to 50.8% at December 31, 2018 and 51.8% at March 31, 2018.
Consolidated Holdings (full consolidation or equity accounting) Imerys Imerys’ (which is fully consolidated) net income from current operations (group share) decreases by 2.6% to €75 million in the first quarter of 2019 compared to €77 million in the first quarter of 2018. Including in the first quarter of 2018 the contribution from its Roofing division classified as discontinued operations in the IFRS presentation (€18 million), Imerys’ net operating income as defined by Pargesa amounted to €95 million. Including the effect of the decline of the average €/SF exchange rate, Pargesa’s share of Imerys’ net income from current operations, in Swiss francs, was SF23.6 million in the first quarter of 2019, compared with SF31.2 million in the first quarter of 2018. After taking into account "Other operating income and expenses" of -€8 million net of taxes[3], Imerys’ net income (group share) was €67 million in the first quarter of 2019. In the first quarter of 2018, Imerys’ net income (group share) amounted to €92 million after taking into account "Other operating income and expenses" of -€3 million net of taxes.
[3] Pargesa's share of "Other operating income and expenses" recorded by Imerys appears under "Non-operating income (loss) from consolidated shareholdings".
[in millions of Swiss francs] [unaudited]
March , March ,
Contribution from the portfolio to operating income
Consolidated shareholdings (full consolidation or equity accounting):
Imerys share of operating income . .
Parques share of operating income [ ] – –
Non-consolidated shareholdings:
SGS net dividend . .
Other net dividend . –
Contribution from private equity and other funds . ( . )
Contribution from the portfolio to operating income . .
per share [SF] 1.01 0.91
Contribution from holding companies to operating income
Net financial income and expenses . ( . )
General expenses and taxes ( . ) ( . )
Economic operating income . .
per share [SF] 1.10 0.73
Non-operating income (loss) from consolidated shareholdings ( . ) ( . )
Net income . .
per share [SF] 1.07 0.72
Average number of shares [in thousands] , ,
€/SF average exchange rate . .
POWER FINANCIAL CORPORATION�— �FIRST QUARTER REPORT 2019 D 5
PFC_QUAT1_Eng04_PAR_2019-05-03_v1.indd E5PFC_QUAT1_Eng04_PAR_2019-05-03_v1.indd E5 19-05-10 6:09 PM19-05-10 6:09 PM

PA
RT
D
PAR
GE
SA H
OLD
ING
SA
Pargesa Holding SA
Parques The contribution of Parques, which is accounted for under the equity method, has not been included in the first quarter of 2019, as the company publishes its earnings for the period only after those of the group. As a result, Parques’ first quarter 2019 contribution will be included in the group’s 2019 first-half results.
Non-Consolidated Holdings The contributions from SGS, LafargeHolcim, Pernod Ricard, Total, adidas, Umicore, GEA, and Ontex, represent Pargesa’s share of net dividends recorded by GBL. Usually, the only contribution to operating income recorded in the first quarter of the financial year comes from SGS, as dividends from other shareholdings are recorded from the second quarter on.
The contribution from SGS came in at SF50.4 million at March 31, 2019, compared with SF49.6 million for the corresponding period in 2018. The change of the contribution year-over-year is due to the increase in the dividend per share paid by SGS to GBL (SF78 compared with SF75 in 2018, up 4.0%) offset by the currency effects.
Contributions from Private Equity and Other Funds The contribution from private equity and other investment fund activities comes primarily from the funds held by GBL through its subsidiary Sienna Capital, and also includes general expenses and management fees. In the first quarter of 2019, the net contribution from these activities came in at SF11.0 million, compared to -SF3.9 million in the first quarter of 2018, and includes changes in fair value during the period of the funds that are not fully consolidated for SF14.2 million (-SF2.6 million in the first quarter of 2018).
Net Financial Income and Expenses Net financial income and expenses, which include interest income and expenses, as well as other financial income and expenses, amounted to SF16.6 million in the first quarter of 2019, compared with –SF6.5 million in the first quarter of 2018. Interest income and expenses recorded by Pargesa as well as its share of those recorded by GBL represented –SF1.7 million in the first quarter of 2019, compared with –SF3.8 million in the first quarter of 2018. Other financial income and expenses include in particular Pargesa’s share of the realized and unrealized results recorded by GBL from trading activities (including dividends) and from derivatives used in managing its portfolio. Pargesa’s share of results from these activities was SF9.1 million in the first quarter of 2019, compared with SF1.3 million in the first quarter of 2018.
General Expenses and Taxes The general expenses and taxes line item represents Pargesa’s own general expenses and taxes as well as its share of those of GBL.
Non-Operating Income (loss) Non-operating loss from consolidated shareholdings of SF2.5 million (loss of SF1.2 million in the first quarter of 2018) includes Pargesa’s share of Imerys’ “Other operating income and expenses”, which, as indicated above, amounted to a loss of €8 million in the first quarter of 2019, against a loss of €3 million in the first quarter of 2018.
It should be noted that, pursuant to IFRS 9, the gain resulting from the sale by GBL of 0.3% of adidas’ capital during the first quarter of 2019 amounting to SF49 million (Pargesa’s share) has not been recorded in the income statement, but directly in shareholders’ equity.
D 6 POWER FINANCIAL CORPORATION�— �FIRST QUARTER REPORT 2019
PFC_QUAT1_Eng04_PAR_2019-05-03_v1.indd E6PFC_QUAT1_Eng04_PAR_2019-05-03_v1.indd E6 19-05-10 6:09 PM19-05-10 6:09 PM

PA
RT
D
PAR
GE
SA H
OLD
ING
SA Pargesa Holding SA
Net Asset Value The table below offers a detailed view of Pargesa’s net asset value (on a flow-through basis) at March 31, 2019. The net asset value is calculated by taking, on one hand, the assets and liabilities of Pargesa (excluding Pargesa’s participation in GBL) and, on the other hand, Pargesa’s share in the value of the portfolio, the net cash or net debt position and the other assets and liabilities of GBL. The net asset value is calculated based on current market values and exchange rates for the listed shareholdings, and on the fair value and current exchange rates for private equity and other investment funds (Sienna Capital).
Pargesa’s net asset value per share was SF102.2 per share at March 31, 2019, an increase of 13.4% compared with the level at the end of 2018 (SF105.9 per share). It was SF127.1 per share on May 3, 2019 (+20.0% since the end of 2018).
Pargesa’s share price was SF78.0 on March 31, 2019, compared with SF70.9 at the end of 2018, an increase of 10.1%. At May 3, 2019, the share price closed at SF81.6 (+15.2% since end of 2018).
The net asset value at March 31, 2019 is broken down as follows:
Net asset value of Pargesa March , December ,
[in millions of Swiss francs, except as otherwise noted] [unaudited]
% ofcapital [ ]
% ofeconomic
interest[ ] Share price& currency
Flow-through
value
Weightingas a %
of total
Flow-through
value
Listed companies:
adidas . . € . , ,
Pernod Ricard . . € . , ,
SGS . . SF , . , ,
LafargeHolcim . . € . , ,
Imerys . . € . , ,
Umicore . . € .
Total [ ] . . € .
GEA . . € .
Ontex . . € .
Parques . . € .
Other
Other investments:
Sienna Capital
Other Pargesa –
Total portfolio , ,
GBL treasury assets
Net cash (debt) [ ] ( ) ( ) ( )
Net asset value , ,
Net asset value per share 120.2 105.9
Share price Pargesa 78.0 70.9
€/SF exchange rate . .
[ ] The % of capital represents the % of capital held by GBL in the shareholdings; the % of economic interest represents Pargesa’s share (50%) of the % of capital held by GBL.
[ ] The ownership percentage as well as the market value of the investment do not take into account yet the forward sales of Total shares will mature in January 2020. The fair value of these contracts is included in the item Net cash (debt).
[ ] This item includes also Pargesa’s share in the market value of GBL’s trading portfolio.
The net asset value is published on a weekly basis on the company’s website.
On May 8, 2019, Pargesa declared a dividend of SF2.56 per bearer share, an increase of 2.4% over the previous year.
POWER FINANCIAL CORPORATION�— �FIRST QUARTER REPORT 2019 D 7
PFC_QUAT1_Eng04_PAR_2019-05-03_v1.indd E7PFC_QUAT1_Eng04_PAR_2019-05-03_v1.indd E7 19-05-10 6:09 PM19-05-10 6:09 PM

Page intentionally left blank.
D 8 POWER FINANCIAL CORPORATION�— �FIRST QUARTER REPORT 2019
PFC_QUAT1_Eng04_PAR_2019-05-03_v1.indd E8PFC_QUAT1_Eng04_PAR_2019-05-03_v1.indd E8 19-05-10 6:09 PM19-05-10 6:09 PM

This document is also available on the Corporation’s website
and on SEDAR at www.sedar.com.
Stock ListingsShares of Power Financial Corporation are listed on the
Toronto Stock Exchange:
COMMON SHARES: PWF
FIRST PREFERRED SHARES:
Series A: PWF.PR.A
Series D: PWF.PR.E
Series E: PWF.PR.F
Series F: PWF.PR.G
Series H: PWF.PR.H
Series I: PWF.PR.I
Series K: PWF.PR.K
Series L: PWF.PR.L
Series O: PWF.PR.O
Series P: PWF.PR.P
Series Q: PWF.PR.Q
Series R: PWF.PR.R
Series S: PWF.PR.S
Series T: PWF.PR.T
Series V: PWF.PR.Z
Transfer Agent and RegistrarComputershare Investor Services Inc.
Offices in:
Montréal, Québec; Toronto, Ontario
www.investorcentre.com
Shareholder ServicesShareholders with questions relating to the payment of dividends,
change of address, share certificates, direct registration and estate
transfers should contact the Transfer Agent:
Computershare Investor Services Inc.
Shareholder Services
100 University Avenue, 8th Floor
Toronto, Ontario, Canada M5J 2Y1
Telephone: 1-800-564-6253 (toll-free in Canada and the U.S.)
or 514-982-7555
www.computershare.com
Corporate Information
POWER FINANCIAL CORPORATION
751 Victoria Square
Montréal, Québec, Canada H2Y 2J3
514-286-7430
1-800-890-7440
161 Bay Street, Suite 5000
Toronto, Ontario, Canada M5J 2S1
416-607-2250
www.powerfinancial.com
WE SUPPORT

PR
INT
ED
IN
CA
NA
DA
TH
IRD
QU
AR
TE
R R
EP
OR
T 20
19P
OW
ER
FIN
AN
CIA
L C
OR
PO
RA
TIO
N
Related Documents