First Quarter 2010 R 31 May 2010 First Quarter 2010 R 31 May 2010 Results Results

Welcome message from author
This document is posted to help you gain knowledge. Please leave a comment to let me know what you think about it! Share it to your friends and learn new things together.
Transcript

First Quarter 2010 Results 31 May 2010
First Quarter 2010 Results 31 May 2010
First Quarter 2010 Results First Quarter 2010 Results
Disclaimer
Information contained in our presentation is intended solely for your reference. Such information is subject to change without notice, its accuracy is not guaranteed and it may not contain all material information concerning the Company. Neither we nor our advisors make any representation regarding, and assumes no responsibility or liability for, the accuracy or completeness of, or any errors or omissions in, any information contained herein.
In addition, the information may contain projections and forwardreflect the company’s current views with respect to future events and financial performance. reflect the company’s current views with respect to future events and financial performance. These views are based on current assumptions which are subject to various risks factors and which may change over time. No assurance can be given that future events will occur, that projections will be achieved, or that the company’s assumptions are correct. Actual results may differ materially from those projected.
This presentation can be distributed without any consent of the Company as this is a publicly available announcement.
Information contained in our presentation is intended solely for your reference. Such information is subject to change without notice, its accuracy is not guaranteed and it may not contain all material information concerning the Company. Neither we nor our advisors make any representation regarding, and assumes no responsibility or liability for, the accuracy or completeness of, or any errors or omissions in, any information contained herein.
In addition, the information may contain projections and forward-looking statements that reflect the company’s current views with respect to future events and financial performance. reflect the company’s current views with respect to future events and financial performance. These views are based on current assumptions which are subject to various risks factors and which may change over time. No assurance can be given that future events will occur, that projections will be achieved, or that the company’s assumptions are correct. Actual results
This presentation can be distributed without any consent of the Company as this is a publicly
1
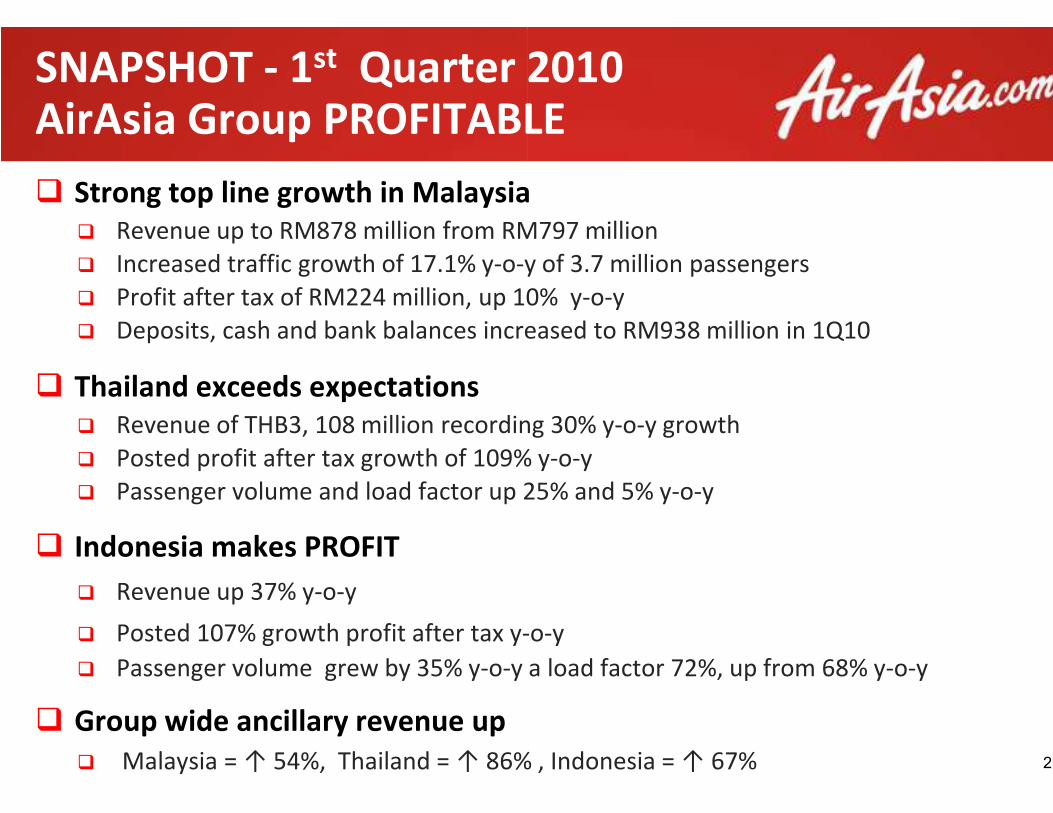
SNAPSHOT - 1st Quarter 2010AirAsia Group PROFITABLE
� Strong top line growth in Malaysia
� Revenue up to RM878 million from RM797 million
� Increased traffic growth of 17.1% y-o-y of 3.7 million passengers
� Profit after tax of RM224 million, up 10% y
� Deposits, cash and bank balances increased to RM938 million in 1Q10
� Thailand exceeds expectations
� Revenue of THB3, 108 million recording 30% y
� Posted profit after tax growth of 109%
� Passenger volume and load factor up 25
� Indonesia makes PROFIT
� Revenue up 37% y-o-y
� Posted 107% growth profit after tax y-
� Passenger volume grew by 35% y-o-y
� Group wide ancillary revenue up
� Malaysia = ↑ 54%, Thailand = ↑ 86% , Indonesia = ↑ 67%
Quarter 2010AirAsia Group PROFITABLE
Strong top line growth in Malaysia
up to RM878 million from RM797 million
y of 3.7 million passengers
up 10% y-o-y
Deposits, cash and bank balances increased to RM938 million in 1Q10
Revenue of THB3, 108 million recording 30% y-o-y growth
109% y-o-y
25% and 5% y-o-y
-o-y
y a load factor 72%, up from 68% y-o-y
Malaysia = ↑ 54%, Thailand = ↑ 86% , Indonesia = ↑ 67% 2
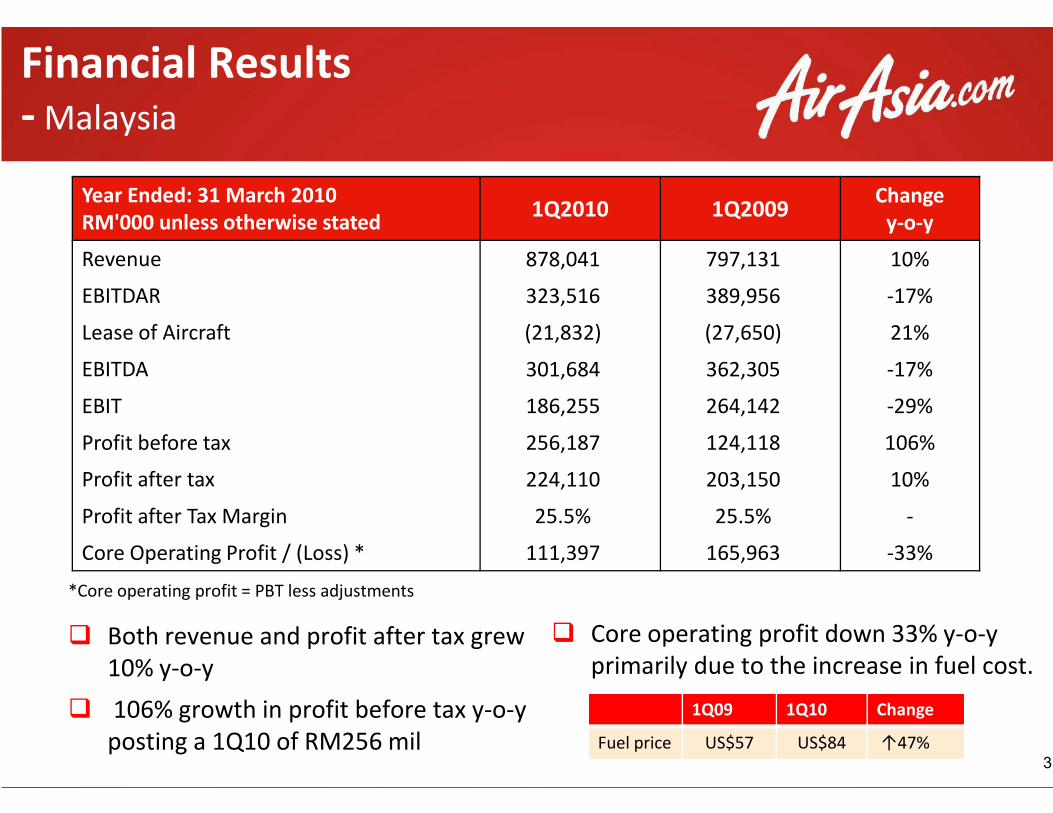
Financial Results- Malaysia
Year Ended: 31 March 2010
RM'000 unless otherwise stated
Revenue 878,041
EBITDAR 323,516
Lease of Aircraft (21,832)
EBITDA 301,684
EBIT 186,255
*Core operating profit = PBT less adjustments
� Both revenue and profit after tax grew
10% y-o-y
� 106% growth in profit before tax y-o-y
posting a 1Q10 of RM256 mil
EBIT 186,255
Profit before tax 256,187
Profit after tax 224,110
Profit after Tax Margin
Core Operating Profit / (Loss) * 111,397
1Q2010 1Q2009 Change
y-o-y
878,041 797,131 10%
323,516 389,956 -17%
(21,832) (27,650) 21%
301,684 362,305 -17%
186,255 264,142 -29%
Both revenue and profit after tax grew
y
3
186,255 264,142 -29%
256,187 124,118 106%
224,110 203,150 10%
25.5% 25.5% -
111,397 165,963 -33%
� Core operating profit down 33% y-o-y
primarily due to the increase in fuel cost.
1Q09 1Q10 Change
Fuel price US$57 US$84 ↑47%
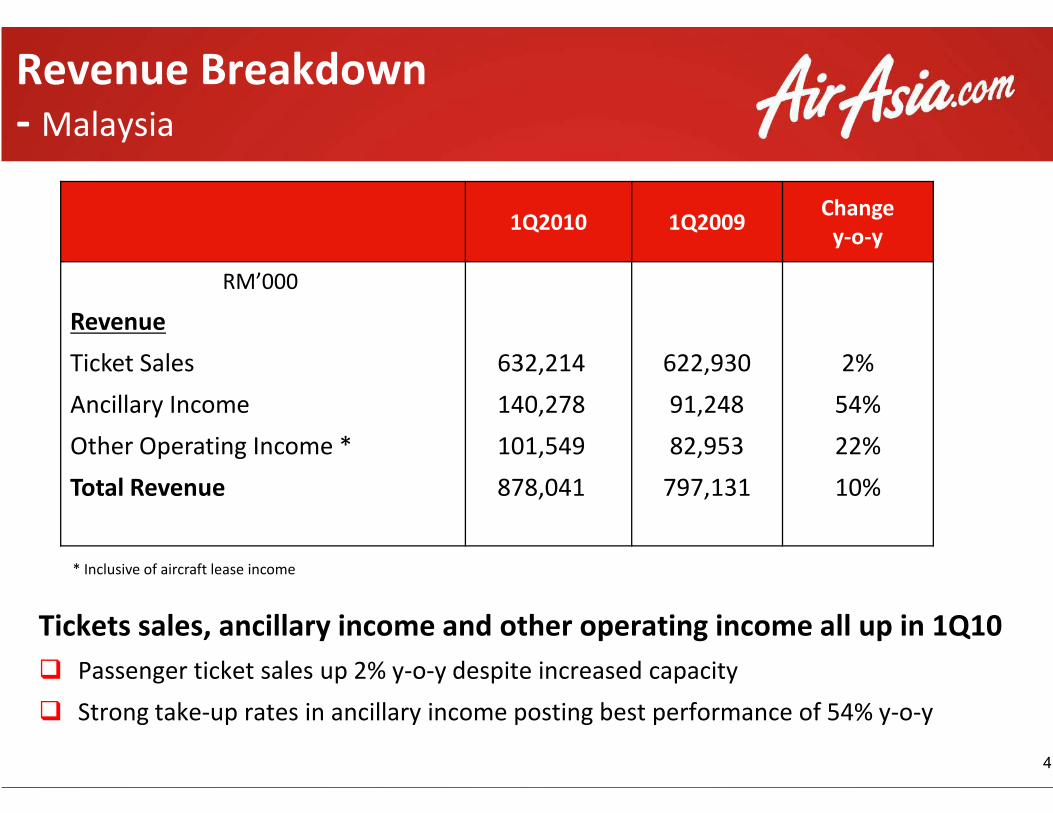
Revenue Breakdown- Malaysia
1Q2010
RM’000
Revenue
Ticket Sales 632,214
Ancillary Income 140,278
Tickets sales, ancillary income and other operating income all up in 1Q10
� Passenger ticket sales up 2% y-o-y despite
� Strong take-up rates in ancillary income posting best performance of 54% y
Ancillary Income 140,278
Other Operating Income * 101,549
Total Revenue 878,041
* Inclusive of aircraft lease income
1Q2010 1Q2009 Change
y-o-y
632,214 622,930 2%
140,278 91,248 54%
Tickets sales, ancillary income and other operating income all up in 1Q10
y despite increased capacity
up rates in ancillary income posting best performance of 54% y-o-y
4
140,278 91,248 54%
101,549 82,953 22%
878,041 797,131 10%
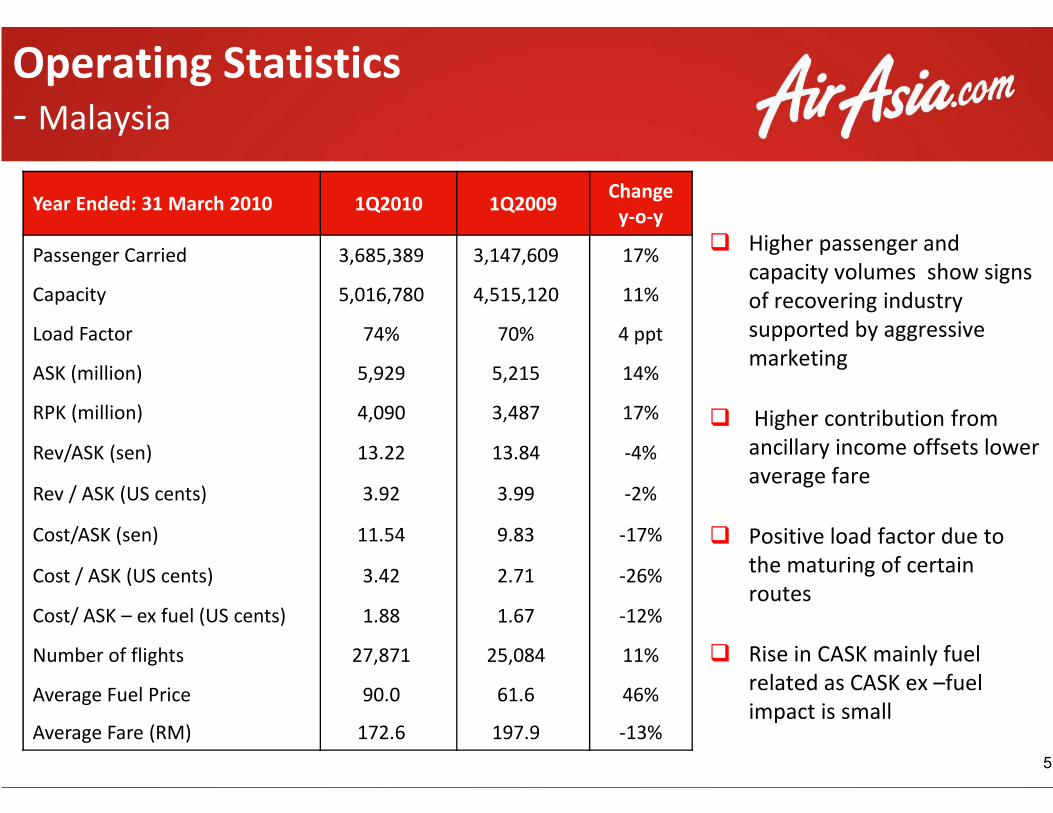
Operating Statistics- Malaysia
Year Ended: 31 March 2010 1Q2010 1Q2009
Passenger Carried 3,685,389 3,147,609
Capacity 5,016,780 4,515,120
Load Factor 74% 70%
ASK (million) 5,929 5,215
RPK (million) 4,090 3,487RPK (million) 4,090 3,487
Rev/ASK (sen) 13.22 13.84
Rev / ASK (US cents) 3.92 3.99
Cost/ASK (sen) 11.54 9.83
Cost / ASK (US cents) 3.42 2.71
Cost/ ASK – ex fuel (US cents) 1.88 1.67
Number of flights 27,871 25,084
Average Fuel Price 90.0 61.6
Average Fare (RM) 172.6 197.9
� Higher passenger and
capacity volumes show signs
of recovering industry
supported by aggressive
marketing
� Higher contribution from
1Q2009 Change
y-o-y
3,147,609 17%
4,515,120 11%
70% 4 ppt
5,215 14%
3,487 17% � Higher contribution from
ancillary income offsets lower
average fare
� Positive load factor due to
the maturing of certain
routes
� Rise in CASK mainly fuel
related as CASK ex –fuel
impact is small
5
3,487 17%
13.84 -4%
3.99 -2%
9.83 -17%
2.71 -26%
1.67 -12%
25,084 11%
61.6 46%
197.9 -13%
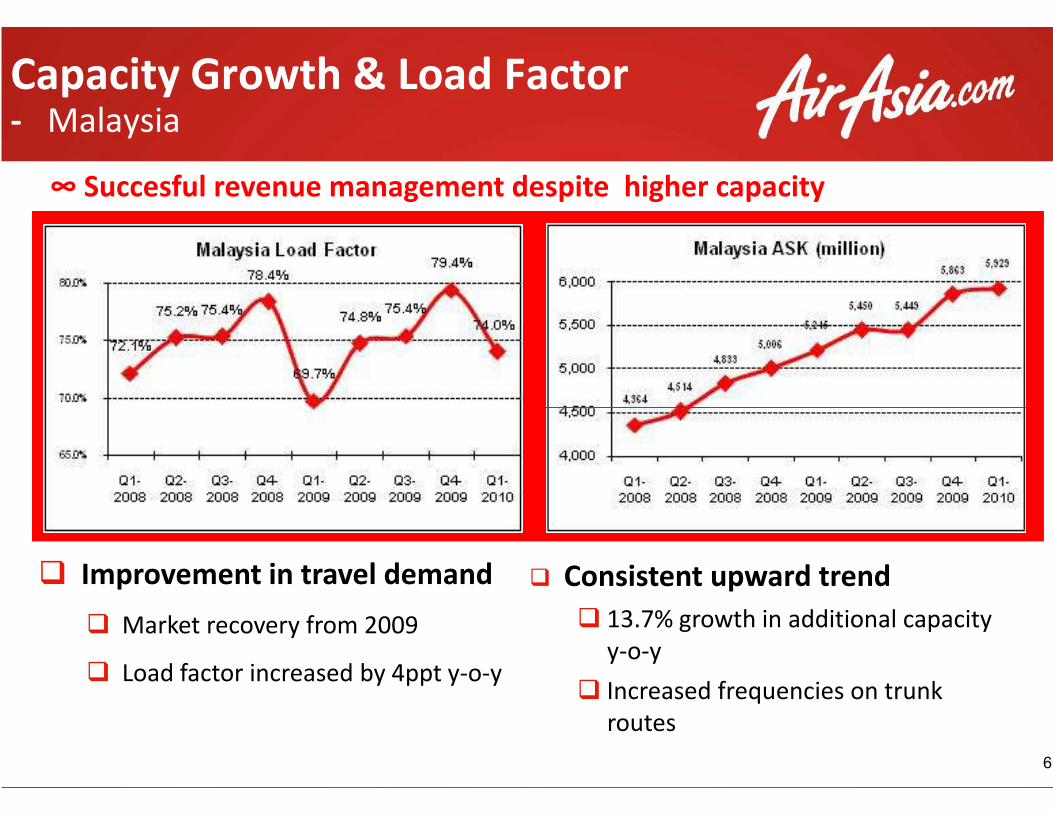
Capacity Growth & Load Factor- Malaysia
∞ Succesful revenue management despite higher
� Improvement in travel demand
� Market recovery from 2009
� Load factor increased by 4ppt y-o-y
Capacity Growth & Load Factor
despite higher capacity
6
� Consistent upward trend
� 13.7% growth in additional capacity
y-o-y
� Increased frequencies on trunk
routes
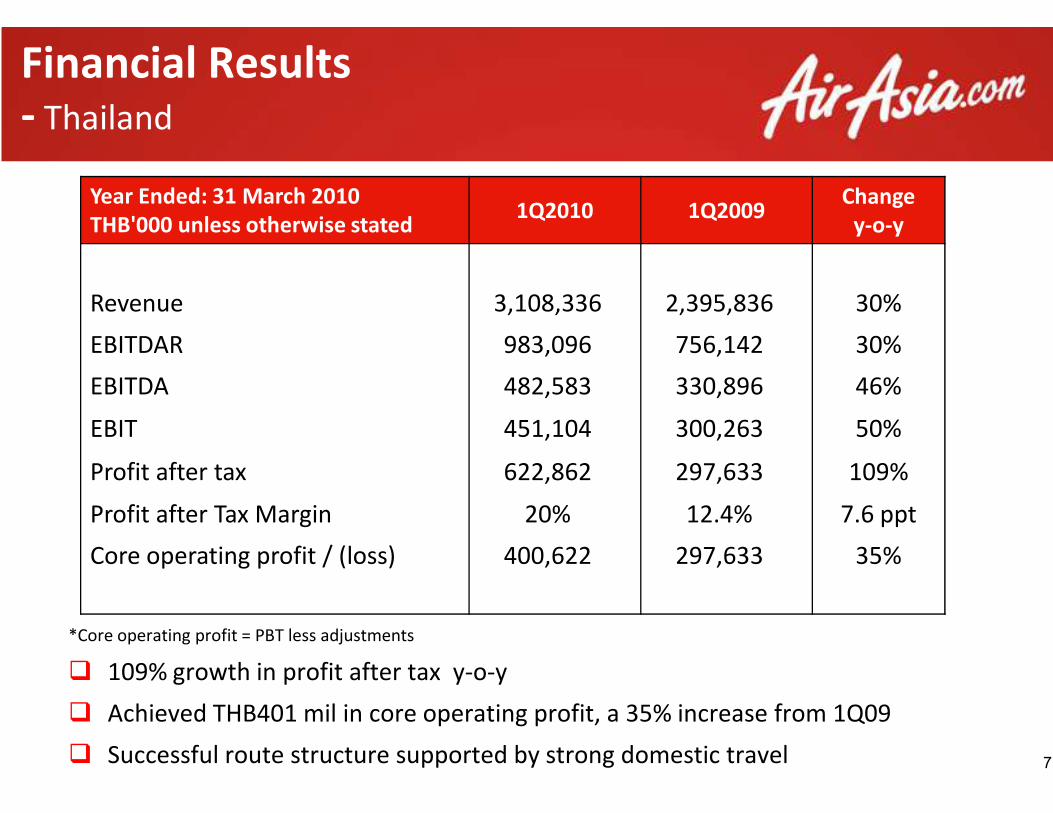
Financial Results- Thailand
Year Ended: 31 March 2010
THB'000 unless otherwise stated1Q2010
Revenue 3,108,336
EBITDAR 983,096
EBITDA 482,583
*Core operating profit = PBT less adjustments
� 109% growth in profit after tax y-o-y
� Achieved THB401 mil in core operating profit, a 35% increase from 1Q09
� Successful route structure supported by strong domestic travel
EBIT 451,104
Profit after tax 622,862
Profit after Tax Margin 20%
Core operating profit / (loss) 400,622
1Q2010 1Q2009 Change
y-o-y
3,108,336 2,395,836 30%
983,096 756,142 30%
482,583 330,896 46%
in core operating profit, a 35% increase from 1Q09
Successful route structure supported by strong domestic travel 7
451,104 300,263 50%
622,862 297,633 109%
20% 12.4% 7.6 ppt
400,622 297,633 35%
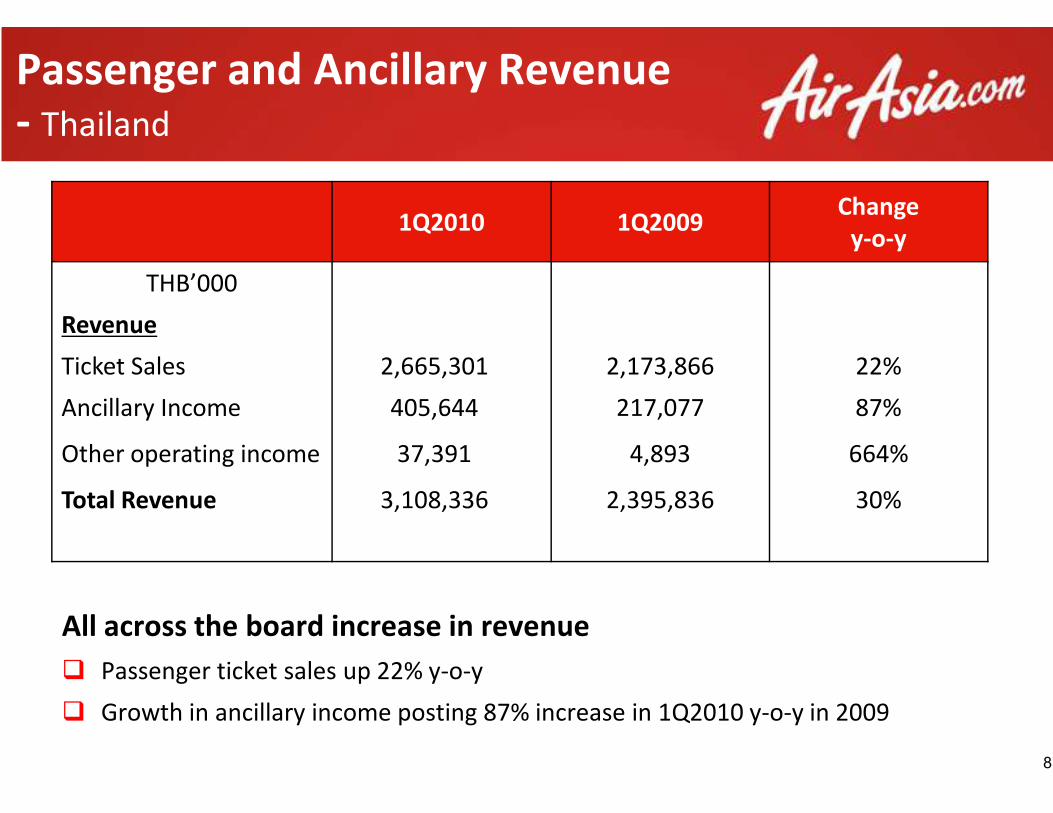
Passenger and Ancillary Revenue- Thailand
1Q2010
THB’000
Revenue
Ticket Sales 2,665,301
Ancillary Income 405,644
All across the board increase in revenue
� Passenger ticket sales up 22% y-o-y
� Growth in ancillary income posting 87% increase in 1Q2010 y
Ancillary Income 405,644
Other operating income 37,391
Total Revenue 3,108,336
Passenger and Ancillary Revenue
1Q2009 Change
y-o-y
2,173,866 22%
217,077 87%
All across the board increase in revenue
Growth in ancillary income posting 87% increase in 1Q2010 y-o-y in 2009
8
217,077 87%
4,893 664%
2,395,836 30%
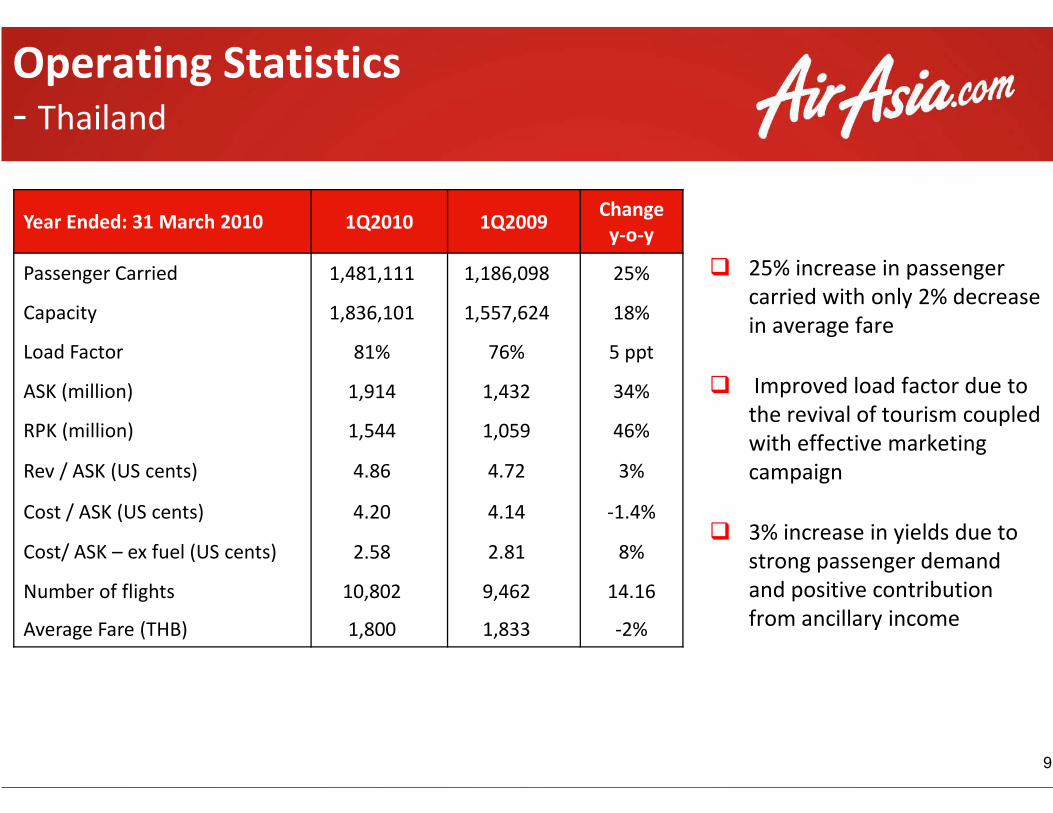
Operating Statistics- Thailand
Year Ended: 31 March 2010 1Q2010 1Q2009
Passenger Carried 1,481,111 1,186,098
Capacity 1,836,101 1,557,624
Load Factor 81% 76%
ASK (million) 1,914 1,432
RPK (million) 1,544 1,059
Rev / ASK (US cents) 4.86 4.72
Cost / ASK (US cents) 4.20 4.14
Cost/ ASK – ex fuel (US cents) 2.58 2.81
Number of flights 10,802 9,462
Average Fare (THB) 1,800 1,833
� 25% increase in passenger
carried with only 2% decrease
in average fare
� Improved load factor due to
the revival of tourism coupled
1Q2009 Change
y-o-y
1,186,098 25%
1,557,624 18%
5 ppt
1,432 34%the revival of tourism coupled
with effective marketing
campaign
� 3% increase in yields due to
strong passenger demand
and positive contribution
from ancillary income
9
1,059 46%
3%
-1.4%
8%
9,462 14.16
1,833 -2%
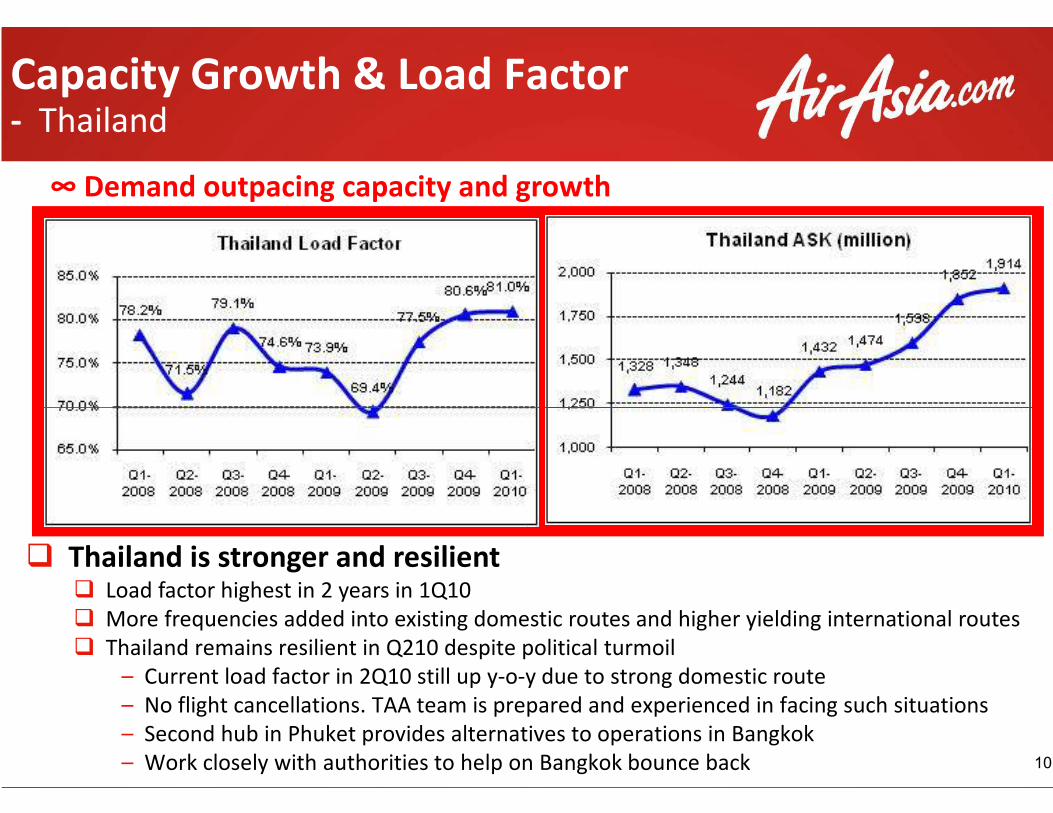
∞ Demand outpacing capacity and growth
Capacity Growth & Load Factor- Thailand
� Thailand is stronger and resilient� Load factor highest in 2 years in 1Q10
� More frequencies added into existing domestic
� Thailand remains resilient in Q210 despite political turmoil
– Current load factor in 2Q10 still up y-o-y due to strong domestic route
– No flight cancellations. TAA team is prepared and experienced in facing such situations
– Second hub in Phuket provides alternatives to operations in Bangkok
– Work closely with authorities to help on
∞ Demand outpacing capacity and growth
Factor
10
More frequencies added into existing domestic routes and higher yielding international routes
Thailand remains resilient in Q210 despite political turmoil
y due to strong domestic route
No flight cancellations. TAA team is prepared and experienced in facing such situations
provides alternatives to operations in Bangkok
help on Bangkok bounce back
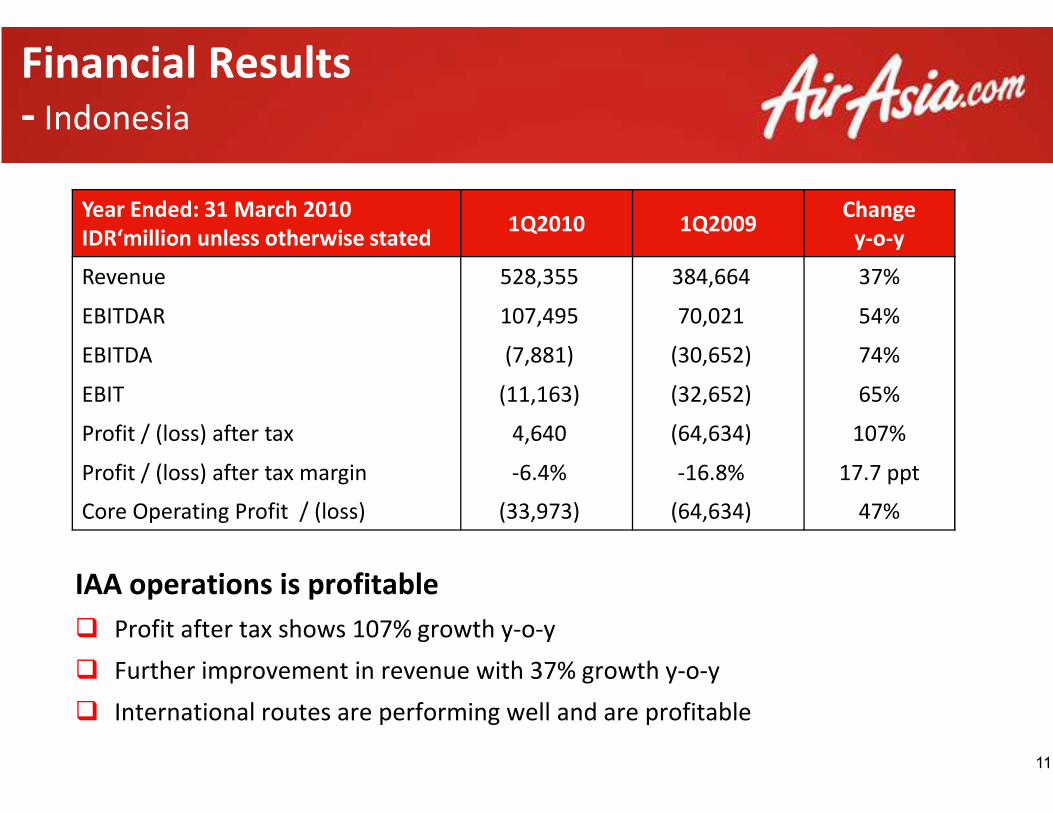
Financial Results- Indonesia
Year Ended: 31 March 2010
IDR‘million unless otherwise stated1Q2010
Revenue 528,355
EBITDAR 107,495
EBITDA (7,881)
EBIT (11,163)
IAA operations is profitable
� Profit after tax shows 107% growth y-o
� Further improvement in revenue with 37% growth y
� International routes are performing well and are profitable
EBIT (11,163)
Profit / (loss) after tax 4,640
Profit / (loss) after tax margin -6.4%
Core Operating Profit / (loss) (33,973)
1Q2010 1Q2009 Change
y-o-y
528,355 384,664 37%
107,495 70,021 54%
(7,881) (30,652) 74%
(11,163) (32,652) 65%
o-y
Further improvement in revenue with 37% growth y-o-y
International routes are performing well and are profitable
11
(11,163) (32,652) 65%
4,640 (64,634) 107%
6.4% -16.8% 17.7 ppt
33,973) (64,634) 47%

Passenger and Ancillary Revenue- Indonesia
IDR ‘million
Revenue
Ticket Sales
Ancillary Income
� 53% increase y-o-y in ticket sales despite heavy domestic competition in Indonesia
� Better route mix for international market
� Upward trending for ancillary income due to high passenger take up
Ancillary Income
Other operating income
Total Revenue
Ancillary Revenue
1Q2010 1Q2009 Change
y-o-y
443,574 332,067 34%
86,359 53,013 63%
y in ticket sales despite heavy domestic competition in Indonesia
Better route mix for international market
Upward trending for ancillary income due to high passenger take up
12
86,359 53,013 63%
(1,578) (416) -279%
528,355 384,664 37%
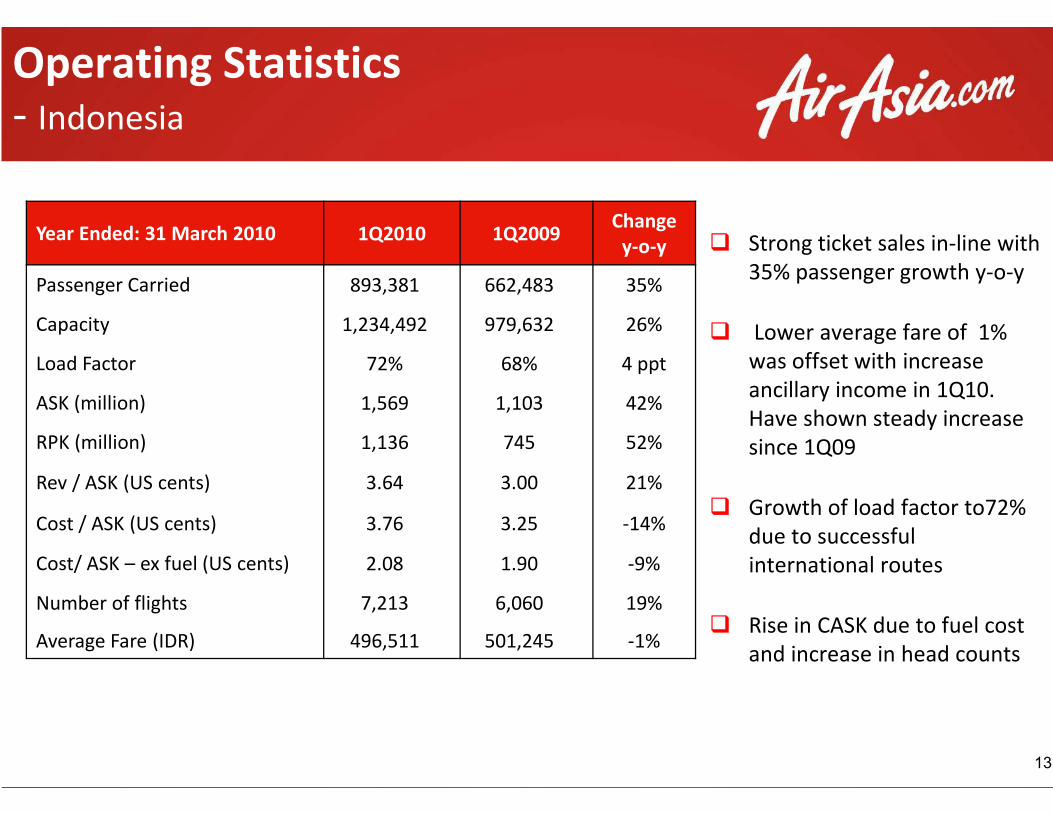
Operating Statistics- Indonesia
Year Ended: 31 March 2010 1Q2010 1Q2009
Passenger Carried 893,381 662,483
Capacity 1,234,492 979,632
Load Factor 72% 68%
ASK (million) 1,569 1,103ASK (million) 1,569 1,103
RPK (million) 1,136 745
Rev / ASK (US cents) 3.64 3.00
Cost / ASK (US cents) 3.76 3.25
Cost/ ASK – ex fuel (US cents) 2.08 1.90
Number of flights 7,213 6,060
Average Fare (IDR) 496,511 501,245
� Strong ticket sales in-line with
35% passenger growth y-o-y
� Lower average fare of 1%
was offset with increase
ancillary income in 1Q10.
Have shown steady increase
1Q2009 Change
y-o-y
662,483 35%
979,632 26%
68% 4 ppt
1,103 42%Have shown steady increase
since 1Q09
� Growth of load factor to72%
due to successful
international routes
� Rise in CASK due to fuel cost
and increase in head counts
13
1,103 42%
745 52%
3.00 21%
3.25 -14%
1.90 -9%
6,060 19%
501,245 -1%
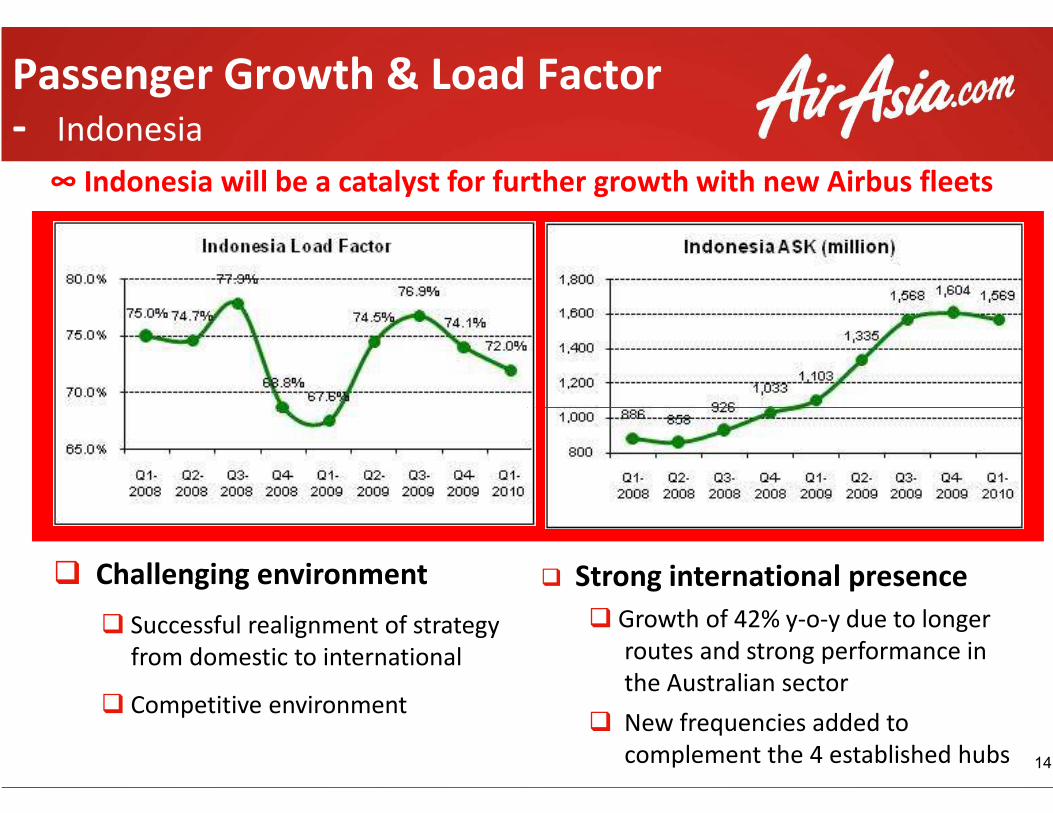
Passenger Growth & Load - Indonesia
∞ Indonesia will be a catalyst for further growth with new
� Challenging environment
� Successful realignment of strategy
from domestic to international
� Competitive environment
& Load Factor
∞ Indonesia will be a catalyst for further growth with new Airbus fleets
14
� Strong international presence
� Growth of 42% y-o-y due to longer
routes and strong performance in
the Australian sector
� New frequencies added to
complement the 4 established hubs
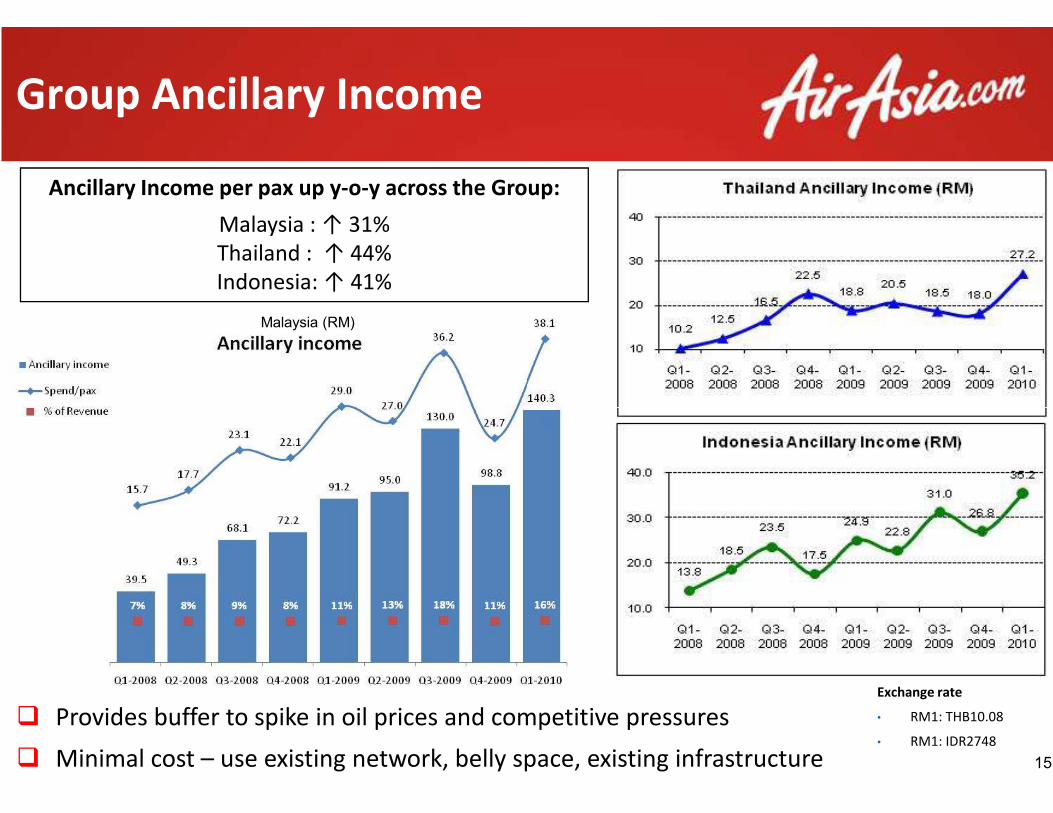
Group Ancillary Income
Malaysia (RM)n
Ancillary Income per pax up y-o-y across the Group:
Malaysia : ↑ 31%
Thailand : ↑ 44%
Indonesia: ↑ 41%
� Provides buffer to spike in oil prices and competitive pressures
� Minimal cost – use existing network, belly space, existing infrastructure
y across the Group:
15
Provides buffer to spike in oil prices and competitive pressures
use existing network, belly space, existing infrastructure
Exchange rate
• RM1: THB10.08
• RM1: IDR2748
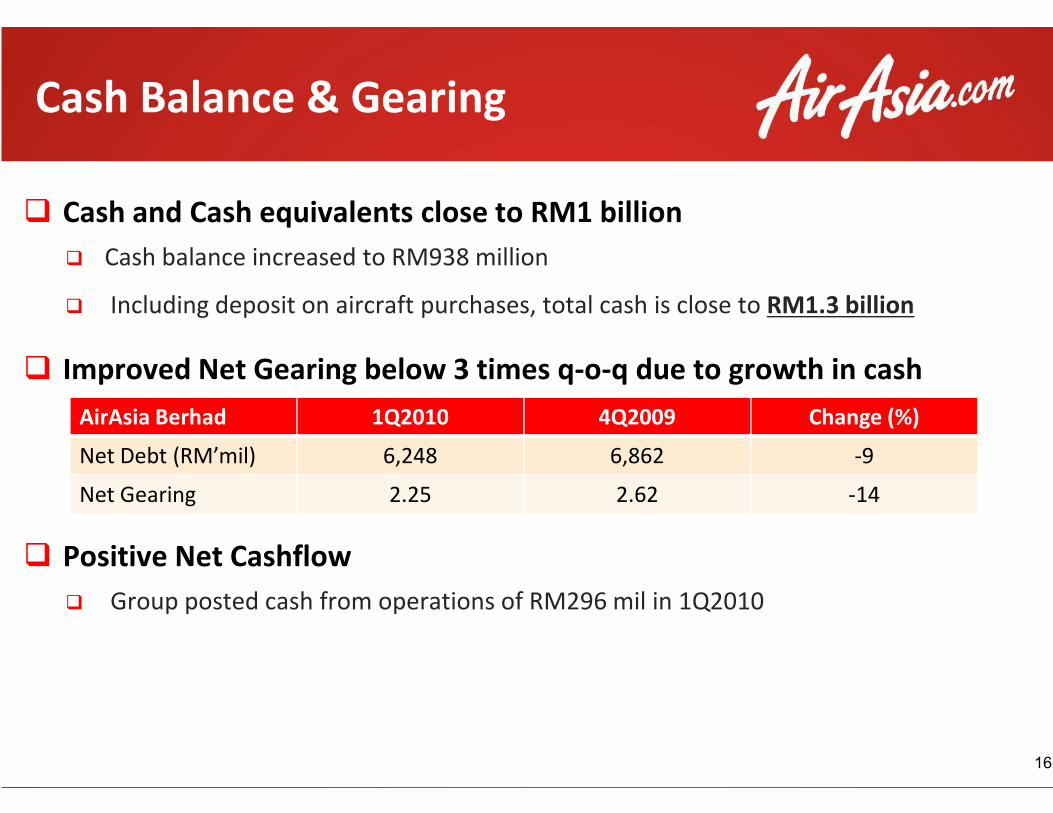
Cash Balance & Gearing
� Cash and Cash equivalents close to RM1 billion
� Cash balance increased to RM938 million
� Including deposit on aircraft purchases, total cash is close to
� Improved Net Gearing below 3 times q
AirAsia Berhad 1Q2010
� Positive Net Cashflow
� Group posted cash from operations of
AirAsia Berhad 1Q2010
Net Debt (RM’mil) 6,248
Net Gearing 2.25
Cash and Cash equivalents close to RM1 billion
million
Including deposit on aircraft purchases, total cash is close to RM1.3 billion
Improved Net Gearing below 3 times q-o-q due to growth in cash
4Q2009 Change (%)
Group posted cash from operations of RM296 mil in 1Q2010
16
4Q2009 Change (%)
6,862 -9
2.62 -14
The amounts due from TAA and IAA have not been provided for:
� The improvement in the financial results of these entities as shown
earlier
� The expected further improvement on the financial performance of
Amounts due from TAA & IAA
� The expected further improvement on the financial performance of
these companies
� The value of AirAsia’s stake in these companies
The amounts due from TAA and IAA have not been provided for:
The improvement in the financial results of these entities as shown
expected further improvement on the financial performance of
Amounts due from TAA & IAA
17
expected further improvement on the financial performance of
stake in these companies

Impact of FRS139Impact of FRS139Impact of FRS139Impact of FRS139
18
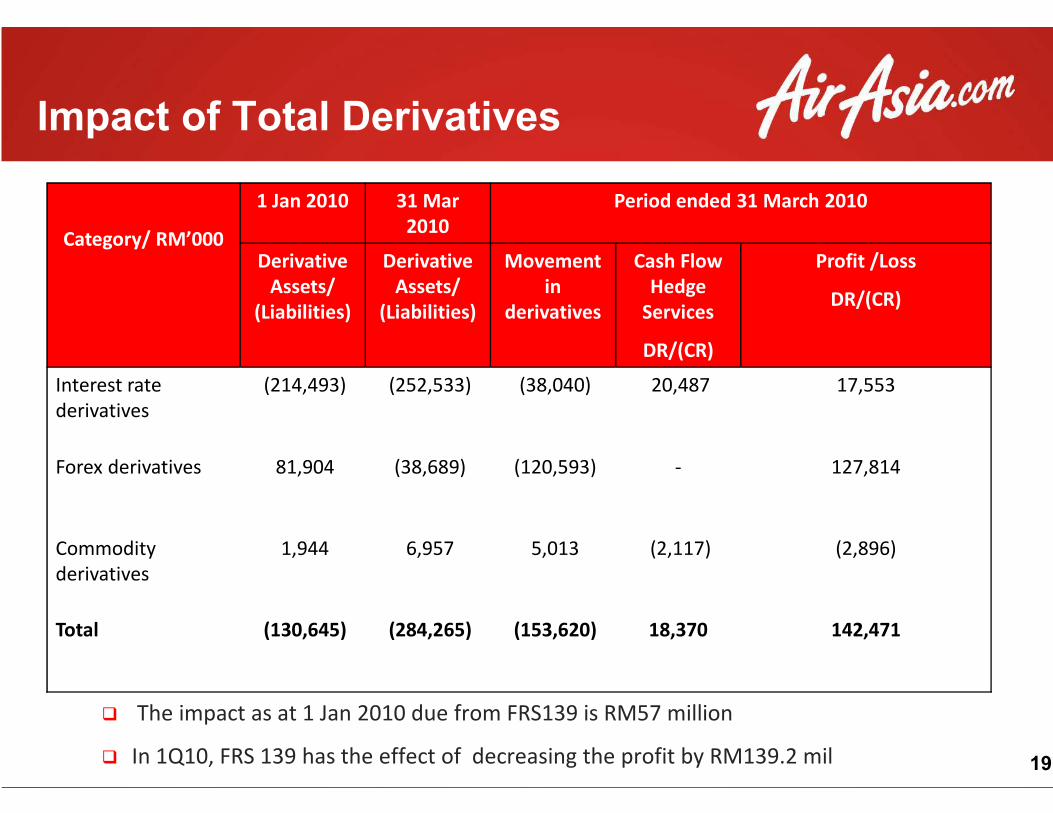
Impact of Total Derivatives
Category/ RM’000
1 Jan 2010 31 Mar
2010
Derivative
Assets/
(Liabilities)
Derivative
Assets/
(Liabilities)
Movement
derivatives
Interest rate
derivatives
(214,493) (252,533) (38,040)
derivatives
Forex derivatives 81,904 (38,689) (120,593)
Commodity
derivatives
1,944 6,957
Total (130,645) (284,265) (153,620)
� The impact as at 1 Jan 2010 due from FRS139
� In 1Q10, FRS 139 has the effect of decreasing the profit by RM139.2 mil
Impact of Total Derivatives
Period ended 31 March 2010
Movement
in
derivatives
Cash Flow
Hedge
Services
DR/(CR)
Profit /Loss
DR/(CR)
(38,040) 20,487 17,553
19
(120,593) - 127,814
5,013 (2,117) (2,896)
(153,620) 18,370 142,471
The impact as at 1 Jan 2010 due from FRS139 is RM57 million
FRS 139 has the effect of decreasing the profit by RM139.2 mil
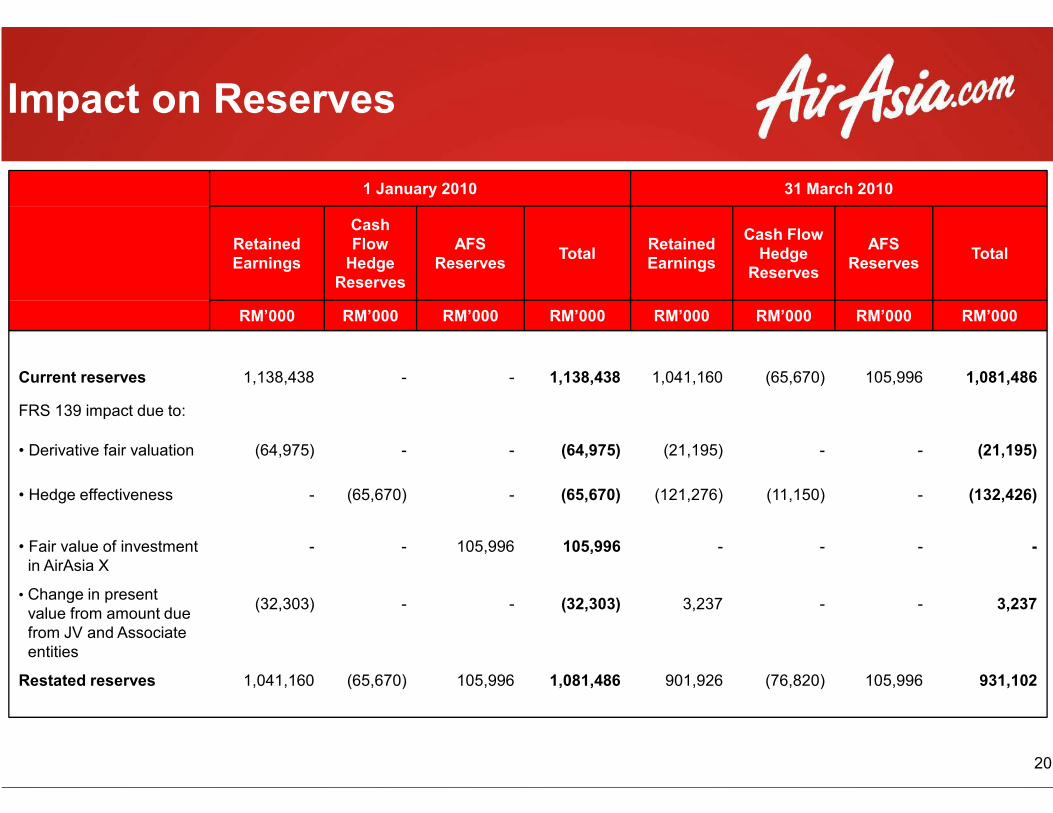
Impact on Reserves
1 January 2010
Retained
Earnings
Cash
Flow
Hedge
Reserves
AFS
Reserves
RM’000 RM’000 RM’000
Current reserves 1,138,438 - -
FRS 139 impact due to:FRS 139 impact due to:
• Derivative fair valuation (64,975) - -
• Hedge effectiveness - (65,670) -
• Fair value of investment
in AirAsia X
• Change in present
value from amount due
from JV and Associate
entities
-
(32,303)
-
-
105,996
-
Restated reserves 1,041,160 (65,670) 105,996
31 March 2010
TotalRetained
Earnings
Cash Flow
Hedge
Reserves
AFS
ReservesTotal
RM’000 RM’000 RM’000 RM’000 RM’000
1,138,438 1,041,160 (65,670) 105,996 1,081,486
20
(64,975) (21,195) - - (21,195)
(65,670) (121,276) (11,150) - (132,426)
105,996
(32,303)
-
3,237
-
-
-
-
-
3,237
1,081,486 901,926 (76,820) 105,996 931,102

Outlook 2010Outlook 2010Outlook 2010Outlook 2010
21
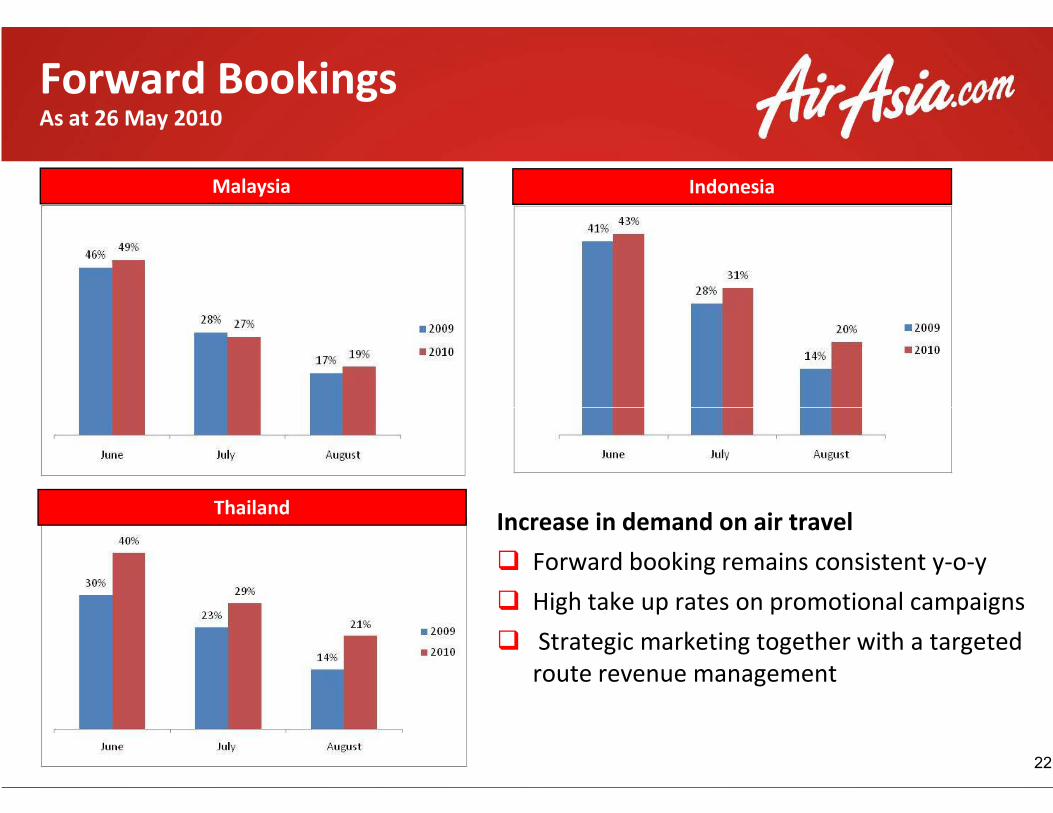
Forward BookingsAs at 26 May 2010
Malaysia
Increase in demand on air travel
�
�
�
Thailand
Indonesia
22
Increase in demand on air travel
Forward booking remains consistent y-o-y
High take up rates on promotional campaigns
Strategic marketing together with a targeted
route revenue management
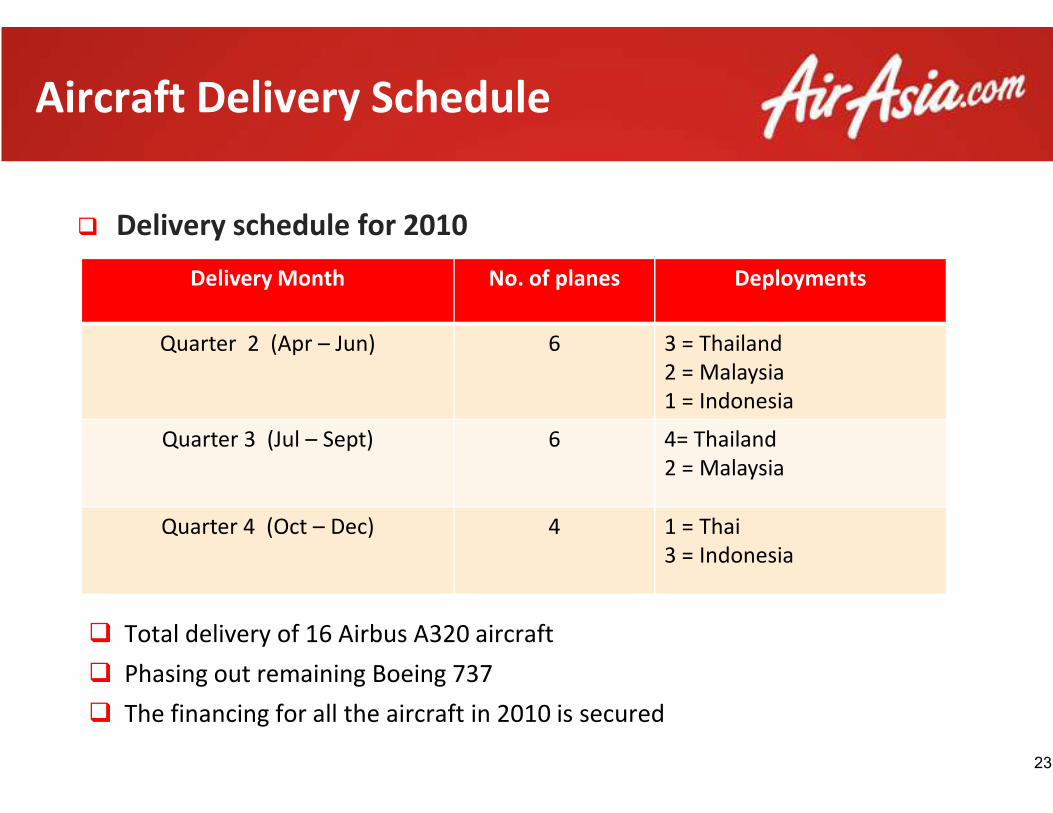
Aircraft Delivery Schedule
� Delivery schedule for 2010
Delivery Month No. of planes
Quarter 2 (Apr – Jun)
Quarter 3 (Jul – Sept)
Quarter 4 (Oct – Dec)
� Total delivery of 16 Airbus A320 aircraft
� Phasing out remaining Boeing 737
� The financing for all the aircraft in 2010 is secured
Aircraft Delivery Schedule
No. of planes Deployments
6 3 = Thailand
2 = Malaysia
1 = Indonesia
23
1 = Indonesia
6 4= Thailand
2 = Malaysia
4 1 = Thai
3 = Indonesia
Total delivery of 16 Airbus A320 aircraft
The financing for all the aircraft in 2010 is secured

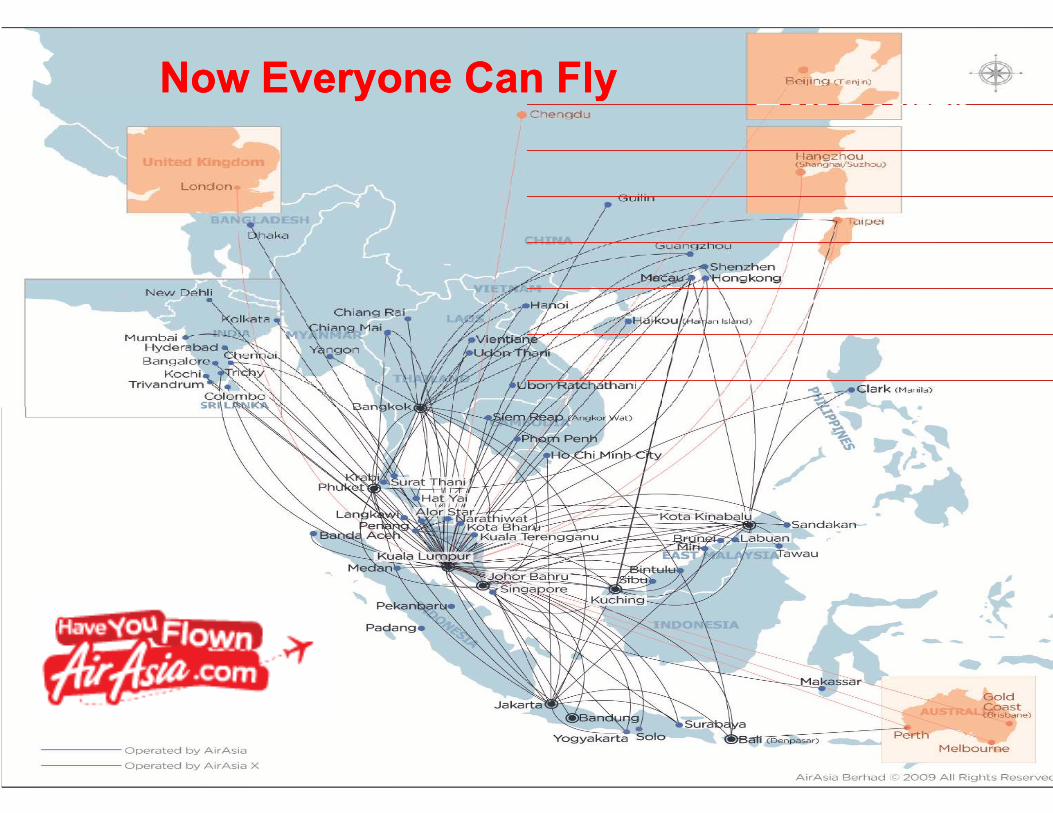
Regional Network Expansion
To further capture and strengthen all routes
� Develop Indian routes from hubs in Malaysia and Thailand
� Increase growth with the addition of frequencies on popular routes
� Further cross connecting main hubs
AirAsia Group Route updateAirAsia Group Route update
New routes Additional frequency
Kota Kinabalu – Taipei
Kota Kinabalu - Hong Kong
Kuala Lumpur - Male
Surabaya – Medan
Penang - Medan
Kuala
Kuala
Kuala
Kuala Lumpur
Kuala Lumpur
Kuala Lumpur
Note: Only based on routes that have been announced or available for sale
Regional Network Expansion
To further capture and strengthen all routes
evelop Indian routes from hubs in Malaysia and Thailand
Increase growth with the addition of frequencies on popular routes
Group Route update
24
Group Route update
Additional frequency
Kuala Lumpur – Kota Kinabalu (8 times)
Kuala Lumpur - Kuching (11 times)
Kuala Lumpur – Hong Kong (3 times)
Kuala Lumpur – Singapore (9 times)
Kuala Lumpur – Macau (3 times)
Kuala Lumpur – Phnom Penh (2 times)
Only based on routes that have been announced or available for sale
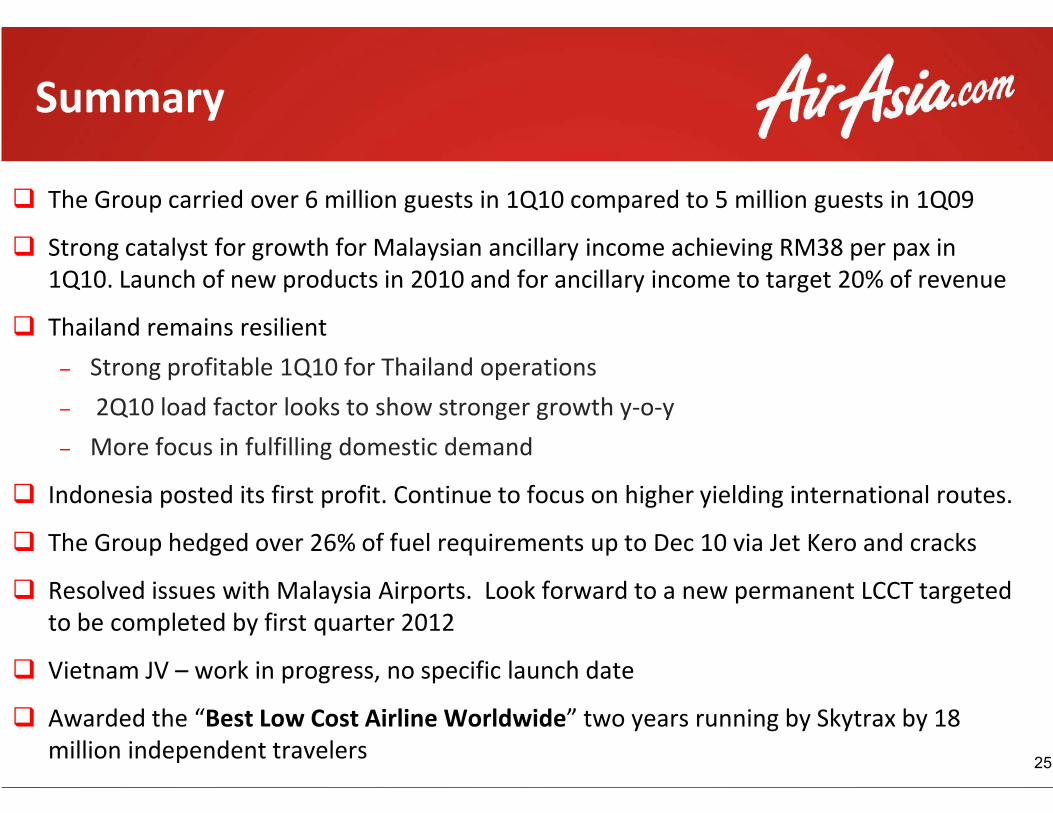
Summary
� The Group carried over 6 million guests in 1Q10 compared to 5 million
� Strong catalyst for growth for Malaysian ancillary
1Q10. Launch of new products in 2010 and for ancillary income to target 20% of revenue
� Thailand remains resilient
– Strong profitable 1Q10 for Thailand operations
– 2Q10 load factor looks to show stronger growth y– 2Q10 load factor looks to show stronger growth y
– More focus in fulfilling domestic demand
� Indonesia posted its first profit. Continue to focus on higher yielding international routes.
� The Group hedged over 26% of fuel requirements up to Dec 10 via Jet
� Resolved issues with Malaysia Airports. Look forward to a new permanent LCCT targeted
to be completed by first quarter 2012
� Vietnam JV – work in progress, no specific launch date
� Awarded the “Best Low Cost Airline Worldwide
million independent travelers
in 1Q10 compared to 5 million guests in 1Q09
Malaysian ancillary income achieving RM38 per pax in
1Q10. Launch of new products in 2010 and for ancillary income to target 20% of revenue
Strong profitable 1Q10 for Thailand operations
2Q10 load factor looks to show stronger growth y-o-y
25
2Q10 load factor looks to show stronger growth y-o-y
More focus in fulfilling domestic demand
Indonesia posted its first profit. Continue to focus on higher yielding international routes.
over 26% of fuel requirements up to Dec 10 via Jet Kero and cracks
Resolved issues with Malaysia Airports. Look forward to a new permanent LCCT targeted
progress, no specific launch date
Best Low Cost Airline Worldwide” two years running by Skytrax by 18
Accounting for InvestmentsAccounting for InvestmentsAccounting for InvestmentsAccounting for Investments
26

AirAsia Consolidated Results 3 months ended 31 March 2010
Malaysia AirAsia (“MAA”)
Thailand AirAsia (“TAA”)Thailand AirAsia (“TAA”)
Indonesia AirAsia (“IAA”)
Total
AirAsia Consolidated Results 3 months ended 31 March 2010
Profit after tax
(RM’mil)
224,110
Nil
Slide 27
Nil
Nil
224,110
27
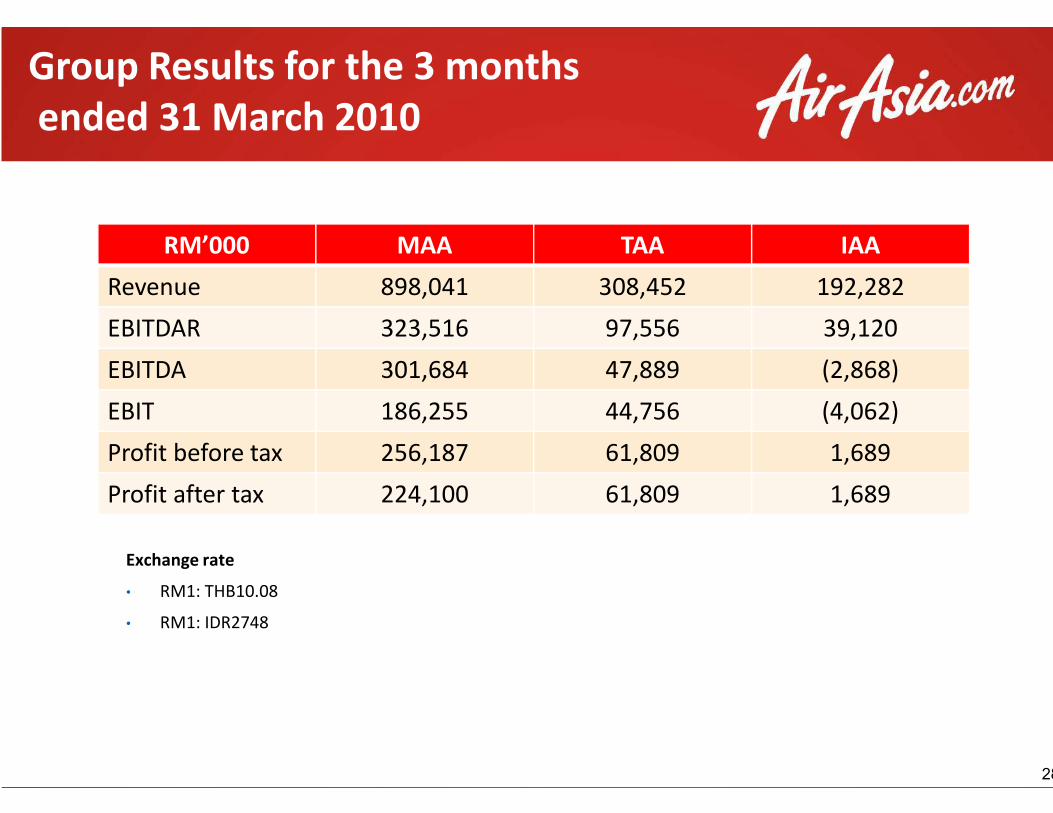
Group Results for the 3 months
ended 31 March 2010
RM’000 MAA
Revenue 898,041
EBITDAR 323,516
EBITDA 301,684
EBIT 186,255
Exchange rate
• RM1: THB10.08
• RM1: IDR2748
EBIT 186,255
Profit before tax 256,187
Profit after tax 224,100
Group Results for the 3 months
TAA IAA
308,452 192,282
97,556 39,120
47,889 (2,868)
44,756 (4,062)
Slide 28
44,756 (4,062)
61,809 1,689
61,809 1,689
28
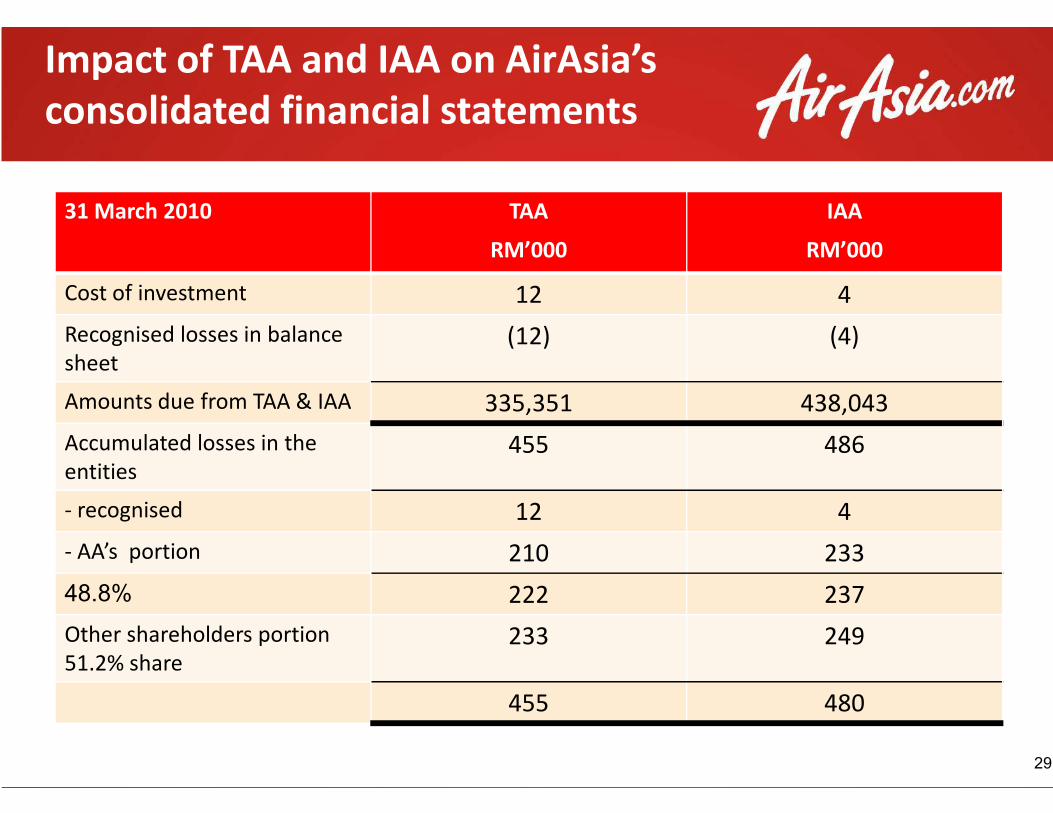
Impact of TAA and IAA on AirAsia’s
consolidated financial statements
31 March 2010 TAA
RM’000
Cost of investment 12
Recognised losses in balance
sheet(12)
Amounts due from TAA & IAA 335,351Amounts due from TAA & IAA 335,351
Accumulated losses in the
entities455
- recognised 12
- AA’s portion 210
48.8% 222
Other shareholders portion
51.2% share233
455
AirAsia’s
consolidated financial statements
TAA
RM’000
IAA
RM’000
12 4
(12) (4)
335,351 438,043
29
335,351 438,043
455 486
12 4
210 233
222 237
233 249
455 480
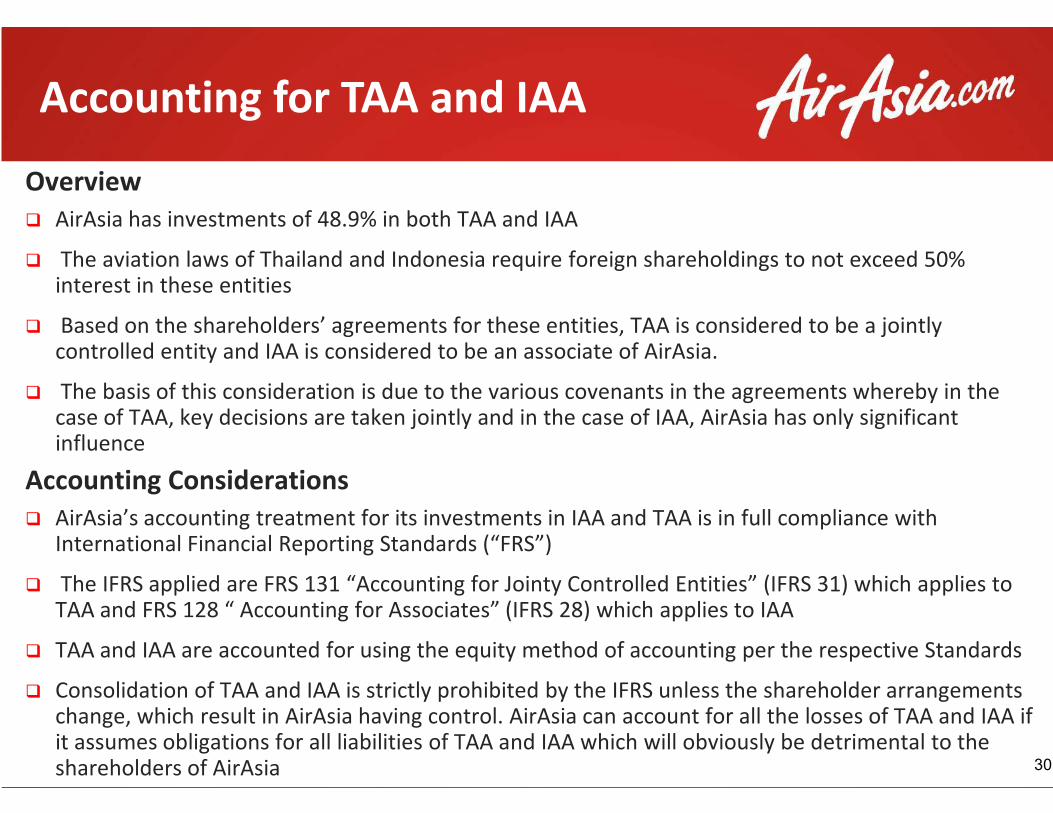
Overview
� AirAsia has investments of 48.9% in both TAA and IAA
� The aviation laws of Thailand and Indonesia require foreign shareholdings to not exceed 50% interest in these entities
� Based on the shareholders’ agreements for these entities, TAA is considered to be a jointly controlled entity and IAA is considered to be an associate of AirAsia.
� The basis of this consideration is due to the various covenants in the agreements whereby in the case of TAA, key decisions are taken jointly and in the case of IAA, AirAsia has only significant
Accounting for TAA and IAA
case of TAA, key decisions are taken jointly and in the case of IAA, AirAsia has only significant influence
Accounting Considerations
� AirAsia’s accounting treatment for its investments in IAA and TAA is in full compliance with International Financial Reporting Standards (“FRS”)
� The IFRS applied are FRS 131 “Accounting for Jointy Controlled Entities” (IFRS 31) which applies to TAA and FRS 128 “ Accounting for Associates” (IFRS 28) which applies to IAA
� TAA and IAA are accounted for using the equity method of accounting per the respective Standards
� Consolidation of TAA and IAA is strictly prohibited by the IFRS unless the shareholder arrangements change, which result in AirAsia having control. AirAsia can account for all the losses of TAA and IAA if it assumes obligations for all liabilities of TAA and IAA which will obviously be detrimental to the shareholders of AirAsia
AirAsia has investments of 48.9% in both TAA and IAA
The aviation laws of Thailand and Indonesia require foreign shareholdings to not exceed 50%
Based on the shareholders’ agreements for these entities, TAA is considered to be a jointly controlled entity and IAA is considered to be an associate of AirAsia.
The basis of this consideration is due to the various covenants in the agreements whereby in the case of TAA, key decisions are taken jointly and in the case of IAA, AirAsia has only significant
Accounting for TAA and IAA
case of TAA, key decisions are taken jointly and in the case of IAA, AirAsia has only significant
AirAsia’s accounting treatment for its investments in IAA and TAA is in full compliance with International Financial Reporting Standards (“FRS”)
The IFRS applied are FRS 131 “Accounting for Jointy Controlled Entities” (IFRS 31) which applies to TAA and FRS 128 “ Accounting for Associates” (IFRS 28) which applies to IAA
TAA and IAA are accounted for using the equity method of accounting per the respective Standards
Consolidation of TAA and IAA is strictly prohibited by the IFRS unless the shareholder arrangements change, which result in AirAsia having control. AirAsia can account for all the losses of TAA and IAA if it assumes obligations for all liabilities of TAA and IAA which will obviously be detrimental to the
30

Equity Accounting
� The equity method is a method of accounting whereby the investment is initially recognised at cost and adjusted thereafter for the post-acquisition change in the investor’s share of net assets of the investee. The profit or loss of the investor includes the investor's share of the profit or loss of the investee.
� FRS 128 and FRS 131 provide that if an investor’s share of losses of an associate or jointly controlled entity equals or exceeds its interest in the associate, the investor discontinues
Accounting for TAA and IAA
(continued)
controlled entity equals or exceeds its interest in the associate, the investor discontinues recognising its share of further losses unless the investor has incurred legal or constructive obligations or made payments on behalf of the associate.
� Consequently, as the share of losses for both TAA and IAA have exceeded the cost of investment in these entities, AirAsia has in prior years fully provided for the cost of investment in both TAA and IAA (amounting to RM12 million and RM4 million respectively), and discontinued its recognition of share of any further losses, as required by the Standard, as it has not provided any legal or constructive obligations or made payments on behalf of the associate or jointly controlled entity.
is a method of accounting whereby the investment is initially recognised acquisition change in the investor’s share of net
assets of the investee. The profit or loss of the investor includes the investor's share of the
FRS 128 and FRS 131 provide that if an investor’s share of losses of an associate or jointly controlled entity equals or exceeds its interest in the associate, the investor discontinues
Accounting for TAA and IAA
31
controlled entity equals or exceeds its interest in the associate, the investor discontinues recognising its share of further losses unless the investor has incurred legal or constructive obligations or made payments on behalf of the associate.
Consequently, as the share of losses for both TAA and IAA have exceeded the cost of investment in these entities, AirAsia has in prior years fully provided for the cost of investment in both TAA and IAA (amounting to RM12 million and RM4 million respectively), and discontinued its recognition of share of any further losses, as required by the Standard, as it has not provided any legal or constructive obligations or made payments on behalf of the
Questions and answers
Now Everyone Can FlyNow Everyone Can Fly
Questions and answersQuestions and answers
Now Everyone Can FlyNow Everyone Can Fly
Questions and answers
32

Appendix- 1Q10 Cost Breakdown for AirAsia Group
Quarter ended: 31 March 2010
Cost / ASK (US cents)
Staff Costs
Fuel and Oil
User Charges and Station Expenses
Maintenance and OverhaulMaintenance and Overhaul
Aircraft related cost
Depreciation & Amortisation
Others
Sales & Marketing
Total Cost / ASK
* Less depreciation from TAA and IAA aircraft
1Q10 Cost Breakdown for AirAsia Group
MAA TAA IAA
0.39 0.37 0.38
1.55 1.62 1.68
0.28 0.55 0.34
0.13 0.41 0.20
33
0.13 0.41 0.20
0.11 0.79 0.79
0.54* 0.05 0.02
0.30 0.21 0.23
0.14 0.19 0.11
3.42 4.20 3.76
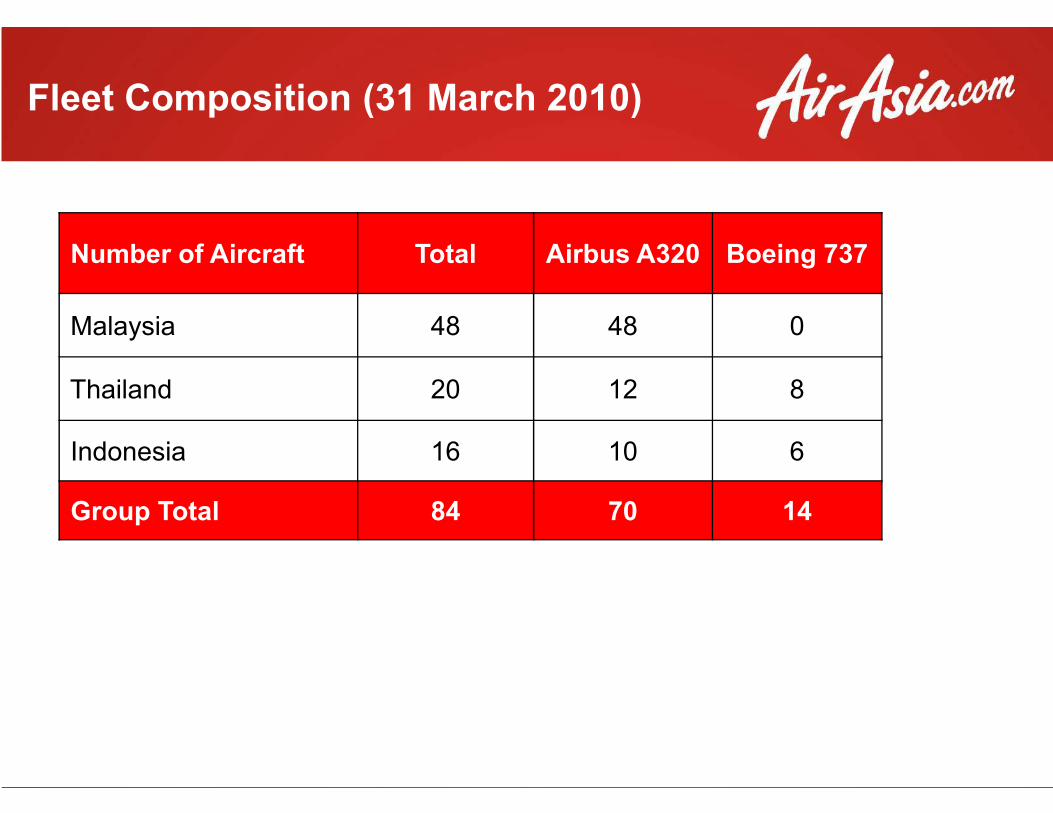
Fleet Composition (31 March 2010)
Number of Aircraft Total
Malaysia 48
Thailand 20
Indonesia 16
Group Total 84
Fleet Composition (31 March 2010)
Airbus A320 Boeing 737
48 0
12 8
10 6
70 14
Related Documents