First Quarter 2018 NCREIF Indices Review May 10, 2018

Welcome message from author
This document is posted to help you gain knowledge. Please leave a comment to let me know what you think about it! Share it to your friends and learn new things together.
Transcript

First Quarter 2018NCREIF Indices Review
May 10, 2018
Panelist Overview
Jeff Fisher
NCREIF Data & Research Consultant
Will McIntosh
Global Head of Research
USAA Real Estate Company
Special thanks to Kevin Scherer, NCREIF Consultant for Slides from NCREIF Analytics

Disclaimer
Today we will be presenting what we see in the NCREIF data, trends and changes; all comments about future expectations are the personal views of the speakers (and could be wrong!) and not a reflection of a NCREIF opinion or forecast.
Overview
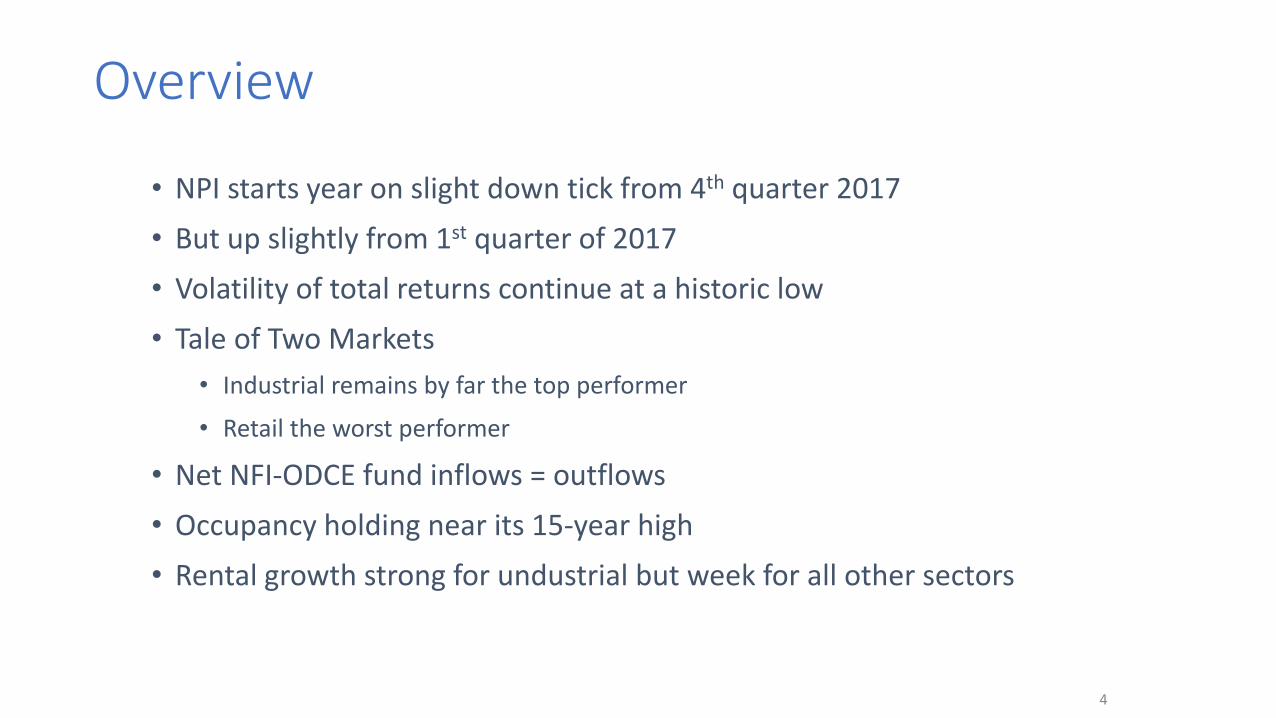
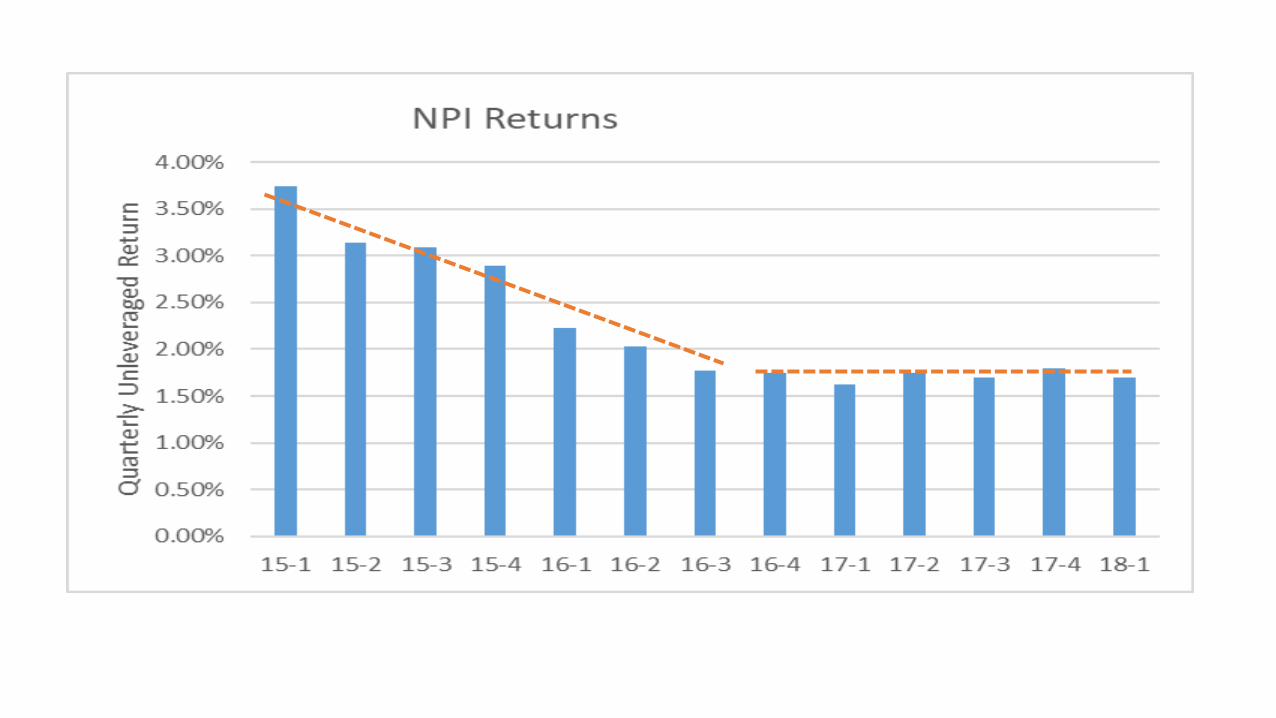
• NPI starts year on slight down tick from 4th quarter 2017
• But up slightly from 1st quarter of 2017
• Volatility of total returns continue at a historic low
• Tale of Two Markets
• Industrial remains by far the top performer
• Retail the worst performer
• Net NFI-ODCE fund inflows = outflows
• Occupancy holding near its 15-year high
• Rental growth strong for undustrial but week for all other sectors
4

NCREIF OverviewFirst Quarter 2018 Index Composition
5
NCREIF Property Index
(NPI)
NPI Leveraged Property Index
NFI-ODCE (Fund Index – Gross of
Fees)
Farmland Properties
Timberland Properties
Leverage Unlevered 44% 22% Unlevered Unlevered
Quarterly Return
1.7% 1.9% 2.2% 1.3% 0.9%
1 Year Return
7.1% 8.9% 8.1% 7.1% 3.8%
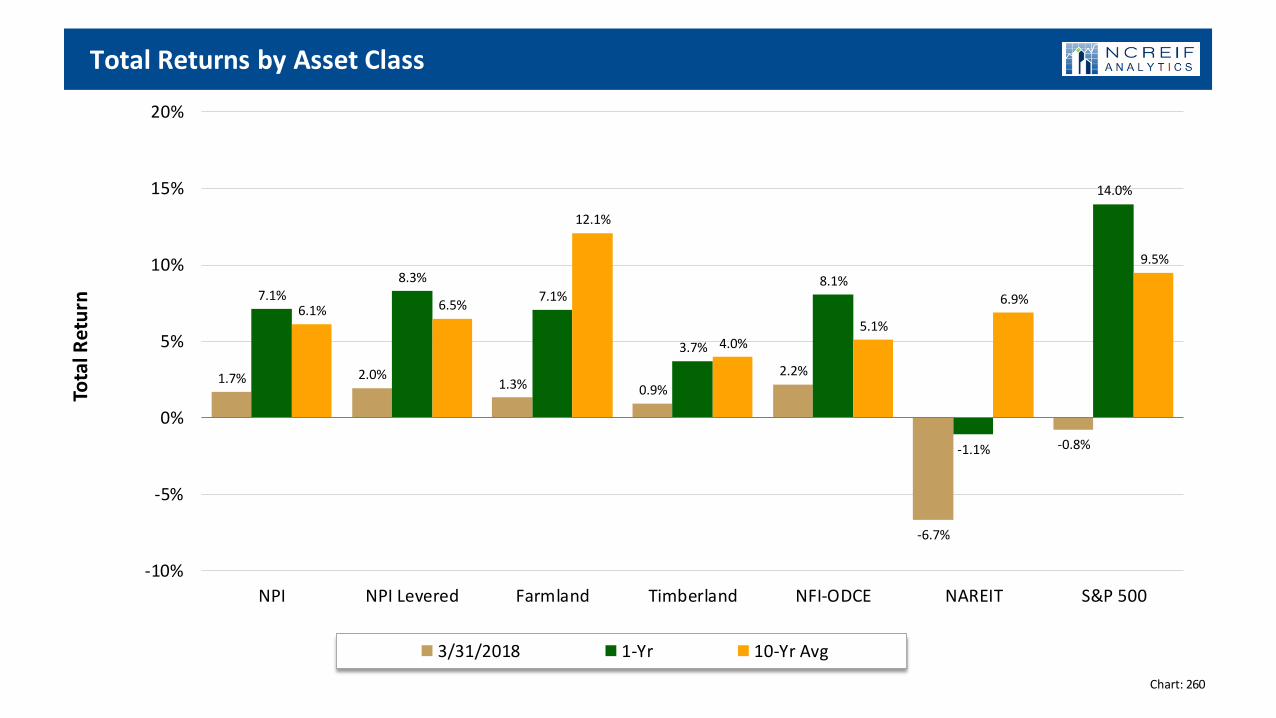
1.7% 2.0%1.3% 0.9%
2.2%
-6.7%
-0.8%
7.1%8.3%
7.1%
3.7%
8.1%
-1.1%
14.0%
6.1% 6.5%
12.1%
4.0%5.1%
6.9%
9.5%
-10%
-5%
0%
5%
10%
15%
20%
NPI NPI Levered Farmland Timberland NFI-ODCE NAREIT S&P 500
Tota
l Re
turn
3/31/2018 1-Yr 10-Yr Avg
Total Returns by Asset Class
Chart: 260

-6%
-1%
4%
9%
14%
19%
2013 2014 2015 2016 2017 2018
Tota
l Re
turn
Agricultural Total Returns
NPI Farmland Timber
Agricultural Total Returns
Annual
Chart: 252

-47%
-37%
-27%
-17%
-7%
3%
13%
23%
33%
2013 2014 2015 2016 2017 2018
NO
I Gro
wth
Agricultural NOI Growth
NPI Farmland Timber
Agricultural NOI Growth
Annual
Chart: 254

Question
• What will be the best performing asset class in 2018?• A. NCREIF Leveraged Returns
• B. Farmland
• C. S&P 500 Stocks
• C. Corporate Bonds
• E. NAREIT Index
9

-12%
-10%
-8%
-6%
-4%
-2%
0%
2%
4%
6%
8%
1983 1987 1991 1995 1999 2003 2007 2011 2015
Income Return Appreciation Return Total Return
NPI Returns
Annual
Chart: 261

-72%
-52%
-32%
-12%
8%
28%
48%
1993 1996 1999 2002 2005 2008 2011 2014 2017
Tota
l Re
turn
5th Percentile 25th Percentile 50th Percentile 75th Percentile 95th Percentile
NPI Total Returns by Percentile Distribution
Annual
Chart: 198


14
Note: The Market Value Index (MVI) is an equal-weighted index and excludes expansion capital expenditures.
Prices Still Rising

Question
• When will the Market Value Index (MVI) peak for this cycle?• A. Peaked in 2017
• B. 2018
• C. 2019
• D. 2020 or later
15

Apartment
Industrial
Office
Retail
Hotel
0%
10%
20%
30%
40%
50%
60%
70%
80%
90%
100%
1986 1990 1994 1998 2002 2006 2010 2014 2018
Exp
osu
res
NPI Exposures
Annual
Chart: 229


2%
4%
6%
8%
10%
12%
14%
16%
2012 2013 2014 2015 2016 2017 2018
Tota
l Re
turn
Returns by Property Type
NPI Apartment Industrial Office Retail
Returns by Property Type
Annual
Chart: 6
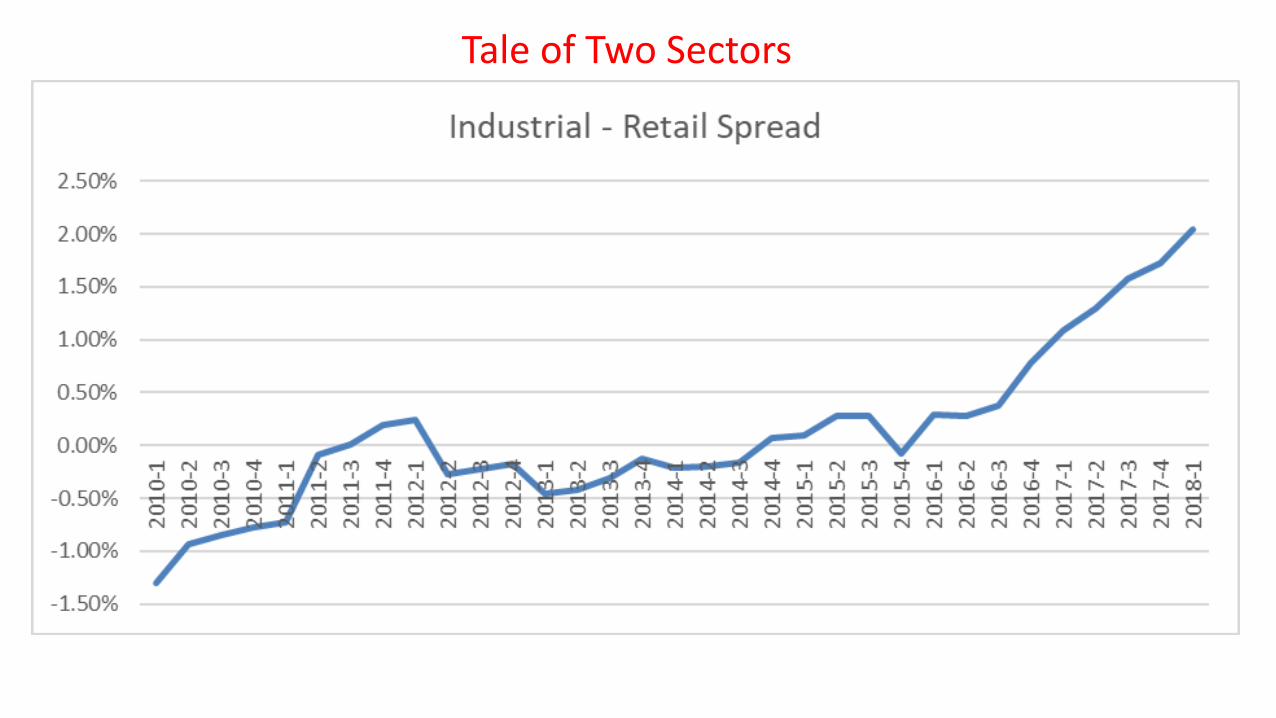
Tale of Two Sectors
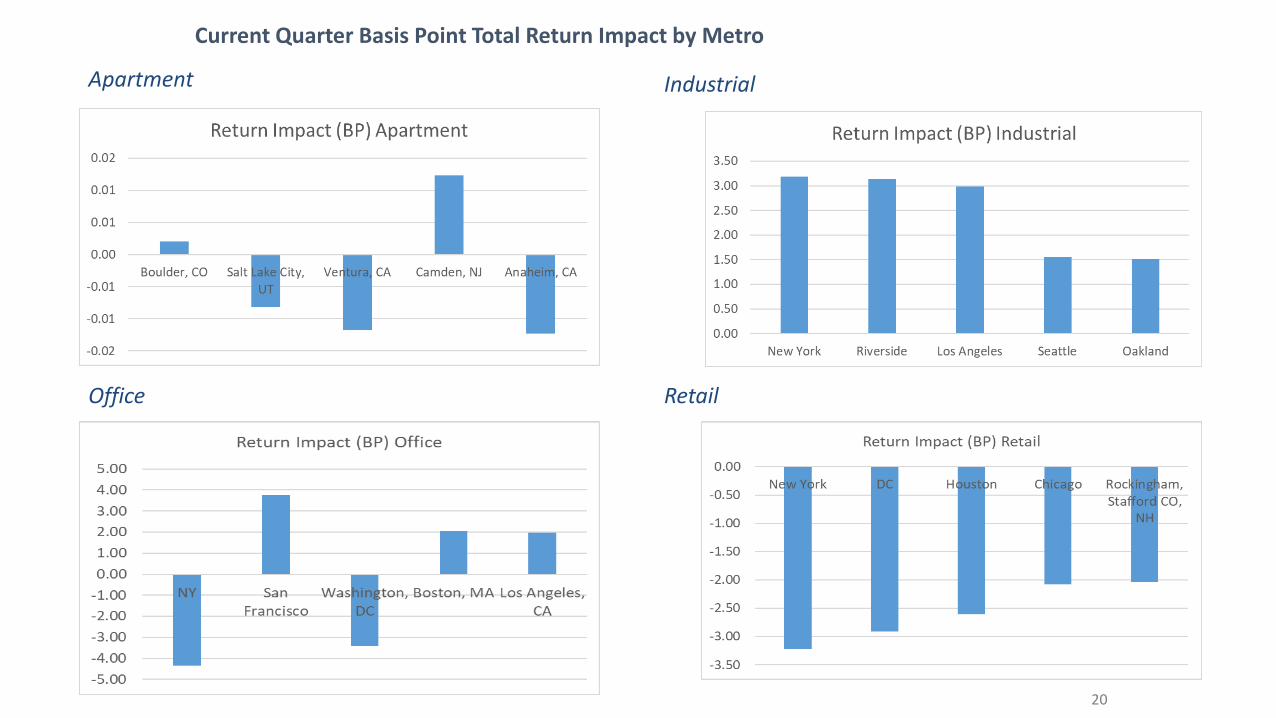
Current Quarter Basis Point Total Return Impact by Metro
Apartment Industrial
Office Retail
20
Question
• What will be the best performing property sector in 2018?• A. Apartment
• B. Hotel
• C. Industrial
• D. Office
• E. Retail
21
-8%
-3%
2%
7%
12%
17%
22%
2012 2013 2015 2016 2018
Co
mp
on
en
ts o
f R
etu
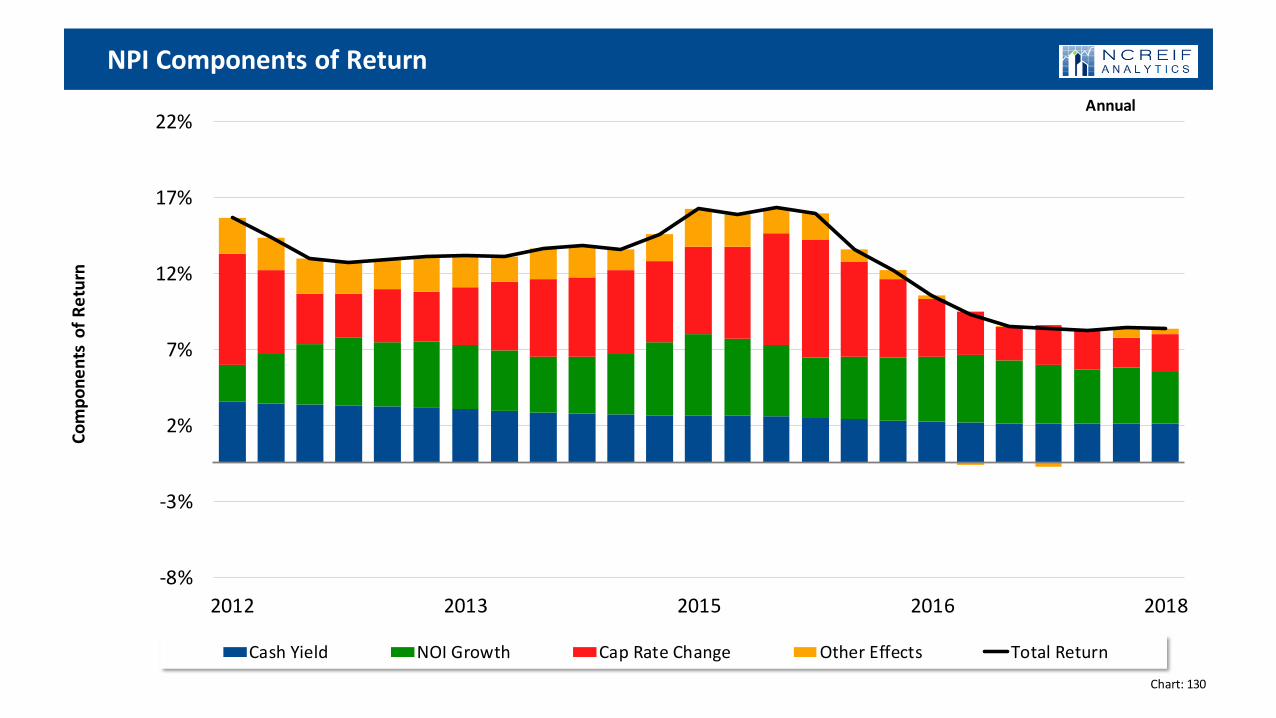
rnNPI Components of Return
Cash Yield NOI Growth Cap Rate Change Other Effects Total Return
NPI Components of Return
Annual
Chart: 130

-1%
4%
9%
14%
19%
2011 2012 2013 2014 2015 2016 2017 2018
Tota
l Re
turn
Returns by Consolidated Metro
United New York Los Angeles San Francisco Washington Chicago Boston
Returns by Consolidated Metro
Annual
Chart: 7


-8%
2%
12%
22%
32%
42%
2003 2005 2007 2009 2011 2013 2015 2017
LTV
Rat
io
5th Percentile 25th Percentile 50th Percentile 75th Percentile 95th Percentile
ODCE LTV Ratio by Percentile Distribution
Annual
Chart: 180
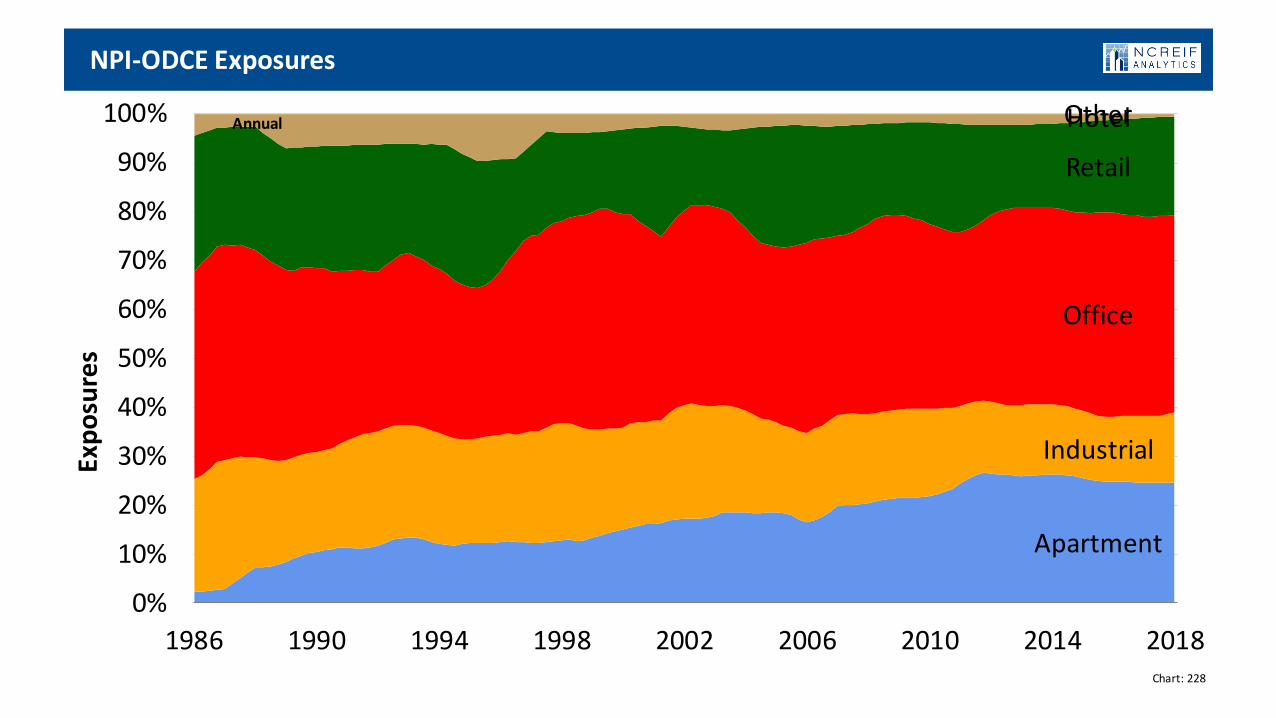
Apartment
Industrial
Office
Retail
HotelOther
0%
10%
20%
30%
40%
50%
60%
70%
80%
90%
100%
1986 1990 1994 1998 2002 2006 2010 2014 2018
Exp
osu
res
NPI-ODCE Exposures
Annual
Chart: 228

2%
4%
6%
8%
10%
12%
14%
16%
18%
2012 2013 2014 2015 2016 2017 2018
Tota
l Re
turn
5th Percentile 25th Percentile 50th Percentile 75th Percentile 95th Percentile
ODCE Total Returns by Percentile Distribution
Annual
Chart: 177

-4%
-2%
0%
2%
4%
6%
8%
1994 1997 2000 2003 2006 2009 2012 2015 2018
Contributions Distributions Net Contributions
ODCE Capital Flows
Annual
Chart: 262

-41%
-21%
-1%
19%
39%
59%
2011 2012 2013 2014 2015 2016 2017
Tota
l Re
turn
5th Percentile 25th Percentile 50th Percentile 75th Percentile 95th Percentile
CEVA Fund Index Total Returns by Percentile Distribution
Annual
Chart: 191

-15%
-10%
-5%
0%
5%
10%
15%
1994 1997 2000 2003 2006 2009 2012 2015 2018
Contributions Distributions Net Contributions
CEVA Capital Flows
Annual
Chart: 265


4.0%
4.5%
5.0%
5.5%
6.0%
6.5%
7.0%
7.5%
2006 2008 2010 2012 2014 2016 2018
Cap
Rat
eCap Rates by Property Type
NPI Apartment Industrial Office Retail
Cap Rates by Property Type
Annual
Chart: 14
3%
3%
4%
4%
5%
5%
6%
6%
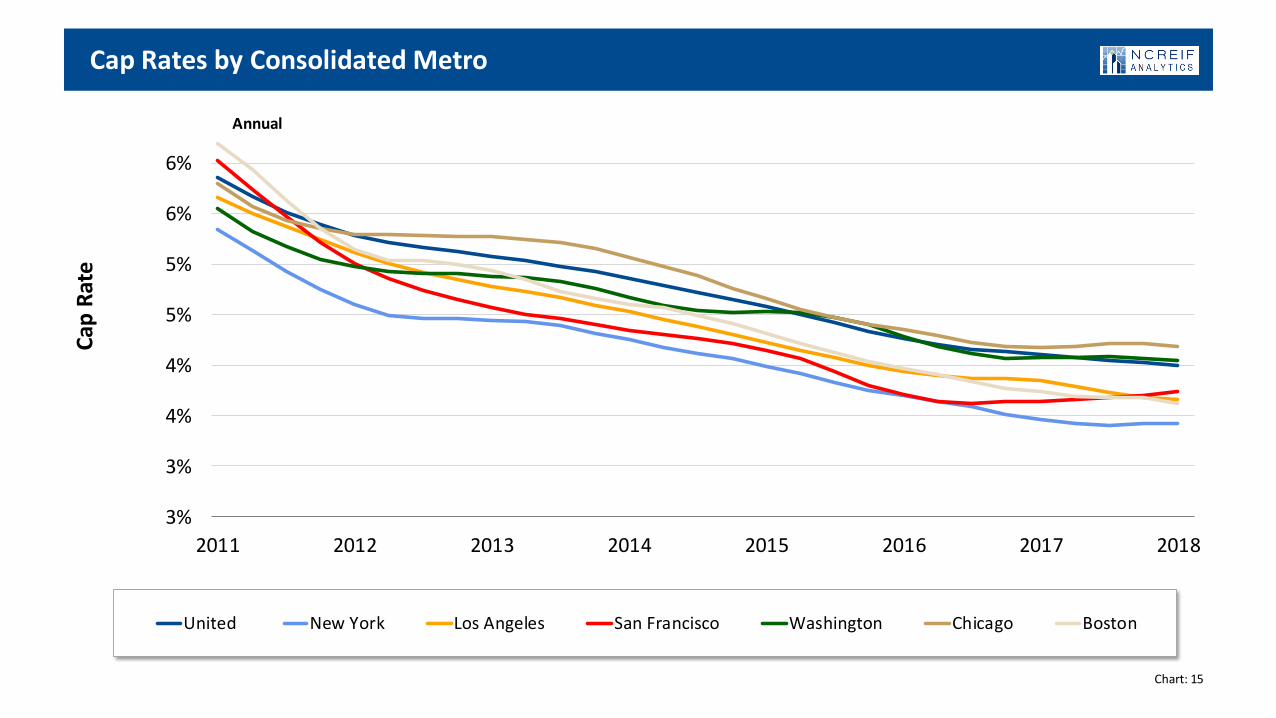
2011 2012 2013 2014 2015 2016 2017 2018
Cap
Rat
eCap Rates by Consolidated Metro
United New York Los Angeles San Francisco Washington Chicago Boston
Cap Rates by Consolidated Metro
Annual
Chart: 15

Question
• What will cap rates be for the nation by the end of 2018?• A. Below 4%
• B. 4% to 5%
• C. 5% to 6%
• D. Above 6%
35

1%
3%
5%
7%
9%
11%
13%
15%
2008 2010 2012 2014 2016 2018
Vac
ancy
Vacancy by Property Type
NPI Apartment Industrial Office Retail
Vacancy by Property Type
Annual
Chart: 21
2%
4%
6%
8%
10%
12%
14%
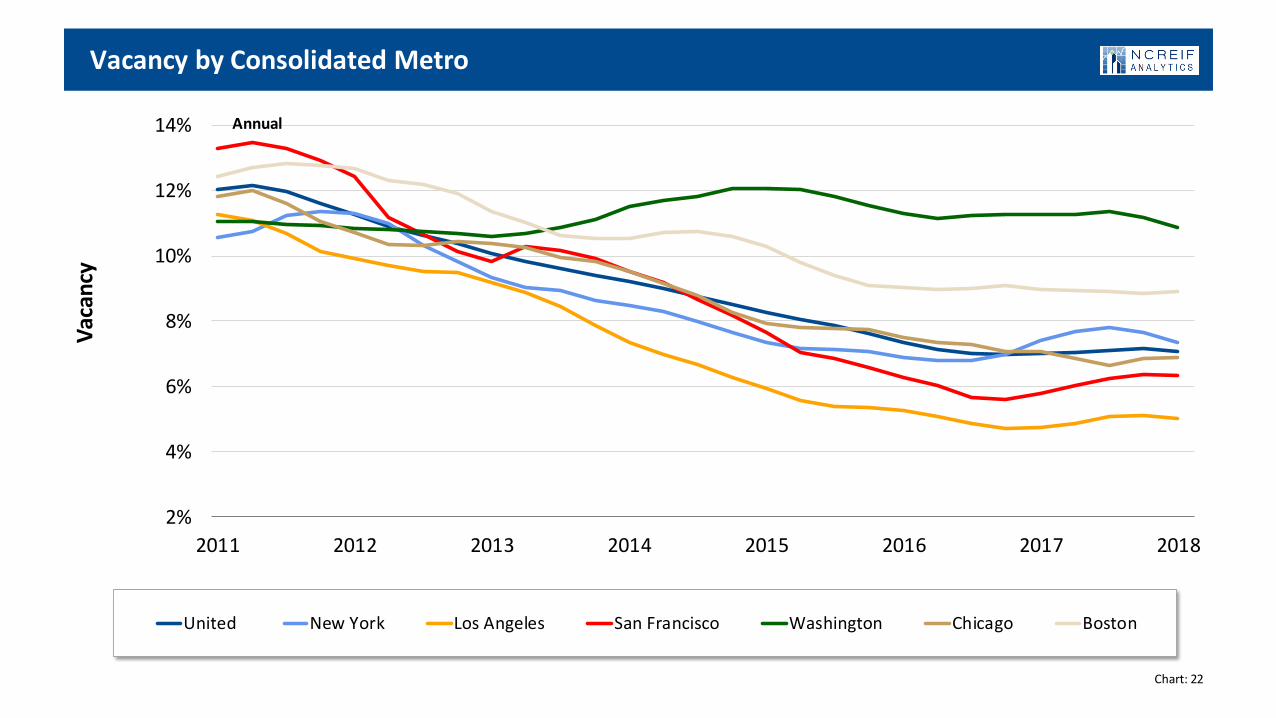
2011 2012 2013 2014 2015 2016 2017 2018
Vac
ancy
Vacancy by Consolidated Metro
United New York Los Angeles San Francisco Washington Chicago Boston
Vacancy by Consolidated Metro
Annual
Chart: 22

1Q 2018

-13%
-8%
-3%
2%
7%
2008 2010 2012 2014 2016 2018
NO
I Gro
wth
NOI Growth by Property Type
NPI Apartment Industrial Office Retail
NOI Growth by Property Type
Annual
Chart: 23

-12%
-7%
-2%
3%
8%
2011 2012 2013 2014 2015 2016 2017 2018
NO
I Gro
wth
NOI Growth by Consolidated Metro
United New York Los Angeles San Francisco Washington Chicago Boston
NOI Growth by Consolidated Metro
Annual
Chart: 24

Question
• Which property type will have the highest NOI growth in 2018?• A. Apartment
• B. Industrial
• C. Office
• D. Retail
41

21%
31%
41%
51%
61%
71%
81%
2003 2005 2007 2009 2011 2013 2015 2017
Cas
h t
o N
OI R
atio
Cash to NOI Ratio by Property Type
NPI Apartment Industrial Office Retail
Cash to NOI Ratio by Property Type
Annual
Chart: 25
19%
29%
39%
49%
59%
69%
79%
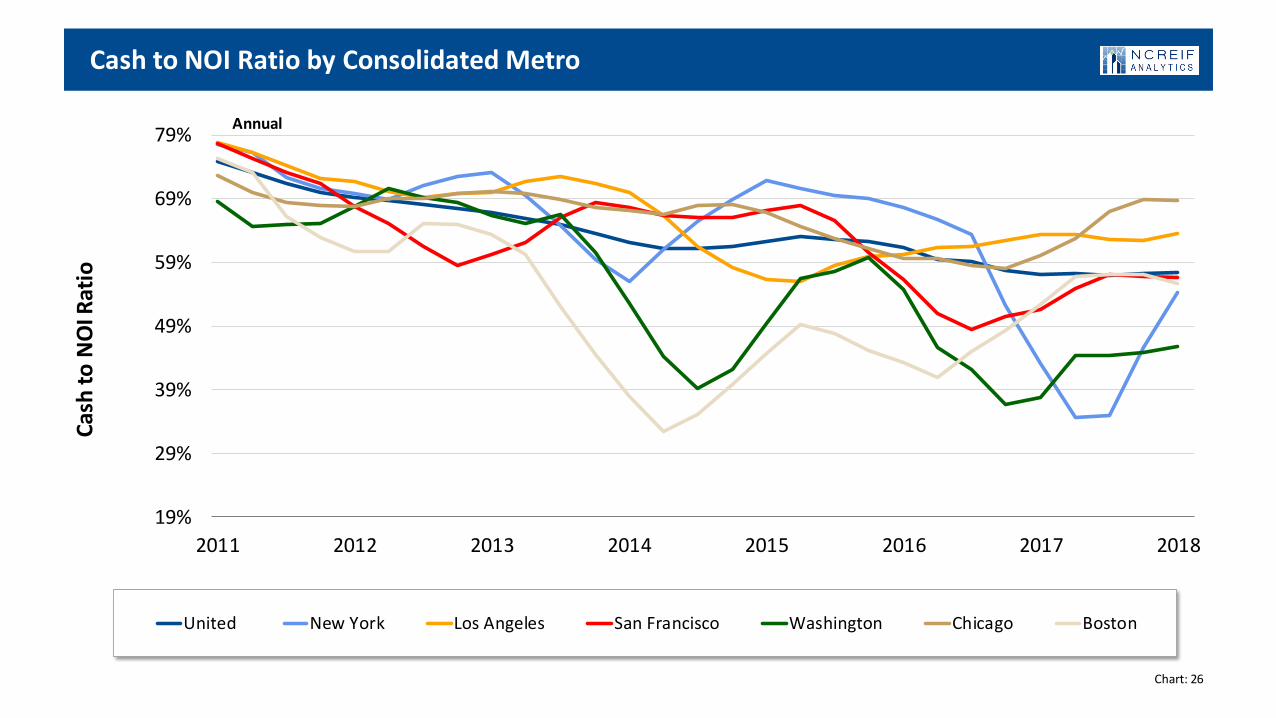
2011 2012 2013 2014 2015 2016 2017 2018
Cas
h t
o N
OI R
atio
Cash to NOI Ratio by Consolidated Metro
United New York Los Angeles San Francisco Washington Chicago Boston
Cash to NOI Ratio by Consolidated Metro
Annual
Chart: 26

1%
3%
5%
7%
9%
11%
13%
15%
2012 2013 2014 2015 2016 2017 2018
Tota
l Re
turn
Apartment Returns by Property Subtype
Apartments Garden Apt Low-Rise Apt Mid-Rise Apt High-Rise Apt
Apartment Returns by Property Subtype
Annual
Chart: 27

Atlanta
Austin
Charlotte
Chicago
Dallas
Denver
Houston
Los Angeles
MiamiMinneapolis
Orlando
Philadelphia
Phoenix
PortlandRaleigh
San Francisco
Seattle
Tampa
Washington, D.C.
3%
4%
5%
6%
7%
8%
9%
10%
11%
12%
13%
3% 4% 5% 6% 7% 8% 9% 10% 11% 12% 13%
Ap
artm
en
t 1
-Yr
Tota
l Re
turn
s
Apartment 20-Yr Total Returns
Apartment 1-Yr Returns v Long-Term Average
Below LT Avg
Above LT Avg
Chart: 33

-4%
1%
6%
11%
16%
21%
26%
31%
2011 2012 2013 2014 2015 2016 2017 2018
Ap
artm
en
t To
tal R
etu
rnApartment Returns by Consolidated Metro
United New York Los Angeles San Francisco Washington Chicago Boston
Apartment Returns by Consolidated Metro
Annual
Chart: 28

3%
4%
4%
5%
5%
6%
2011 2012 2013 2014 2015 2016 2017 2018
Cap
Rat
eApartment Cap Rates by Consolidated Metro
United New York Los Angeles San Francisco Washington Chicago Boston
Apartment Cap Rates by Consolidated Metro
Annual
Chart: 37

0%
5%
10%
15%
20%
2011 2012 2013 2014 2015 2016 2017 2018
Ind
ust
rial
To
tal R
etu
rnIndustrial Returns by Consolidated Metro
United New York Los Angeles San Francisco Washington Chicago Boston
Industrial Returns by Consolidated Metro
Annual
Chart: 57

3%
5%
7%
9%
11%
13%
15%
2012 2013 2014 2015 2016 2017 2018
Tota
l Re
turnOffice Returns by Property Subtype
Office CBD Off Suburban Off
Office Returns by Property Subtype
Annual
Chart: 77

Atlanta
Austin
Boston
Chicago
Dallas
Denver
Houston
Los Angeles
Miami
Minneapolis
New YorkPhiladelphia
Phoenix
Portland
San Diego
San Francisco
San Jose
Seattle
Washington, D.C.
0%
2%
4%
6%
8%
10%
12%
14%
0% 2% 4% 6% 8% 10% 12% 14%
Off
ice
1-Y
r To
tal R
etu
rns
Office 20-Yr Total Returns
Office 1-Yr Returns v Long-Term Average
Below LT Avg
Above LT Avg
Chart: 80

NPI United States
Atlanta
AustinBoston
ChicagoDallas
Denver
Houston
Los Angeles
Miami
Minneapolis
New York
PhiladelphiaPhoenix
Portland
San Diego
San Francisco
San Jose
Seattle
Washington, D.C.
5%
6%
7%
8%
9%
10%
11%
12%
13%
14%
15%
5% 6% 7% 8% 9% 10% 11% 12% 13% 14% 15%
Off
ice
20
-Yr
Tota
l Re
turn
s
Risk (Stdev of Annual Returns)
Office 20-Yr Risk v Return
High Risk / Low Return
Low Risk / High Return
Chart: 78

-3%
2%
7%
12%
17%
22%
2011 2012 2013 2014 2015 2016 2017 2018
Off
ice
To
tal R
etu
rnOffice Returns by Consolidated Metro
United New York Los Angeles San Francisco Washington Chicago Boston
Office Returns by Consolidated Metro
Annual
Chart: 83

3%
3%
4%
4%
5%
5%
6%
6%
7%
7%
2006 2008 2010 2012 2014 2016 2018
Cap
Rat
eOffice Cap Rates by Property Subtype
Office CBD Off Suburban Off
Office Cap Rates by Property Subtype
Annual
Chart: 88
3%
3%
4%
4%
5%
5%
6%
6%
7%
7%
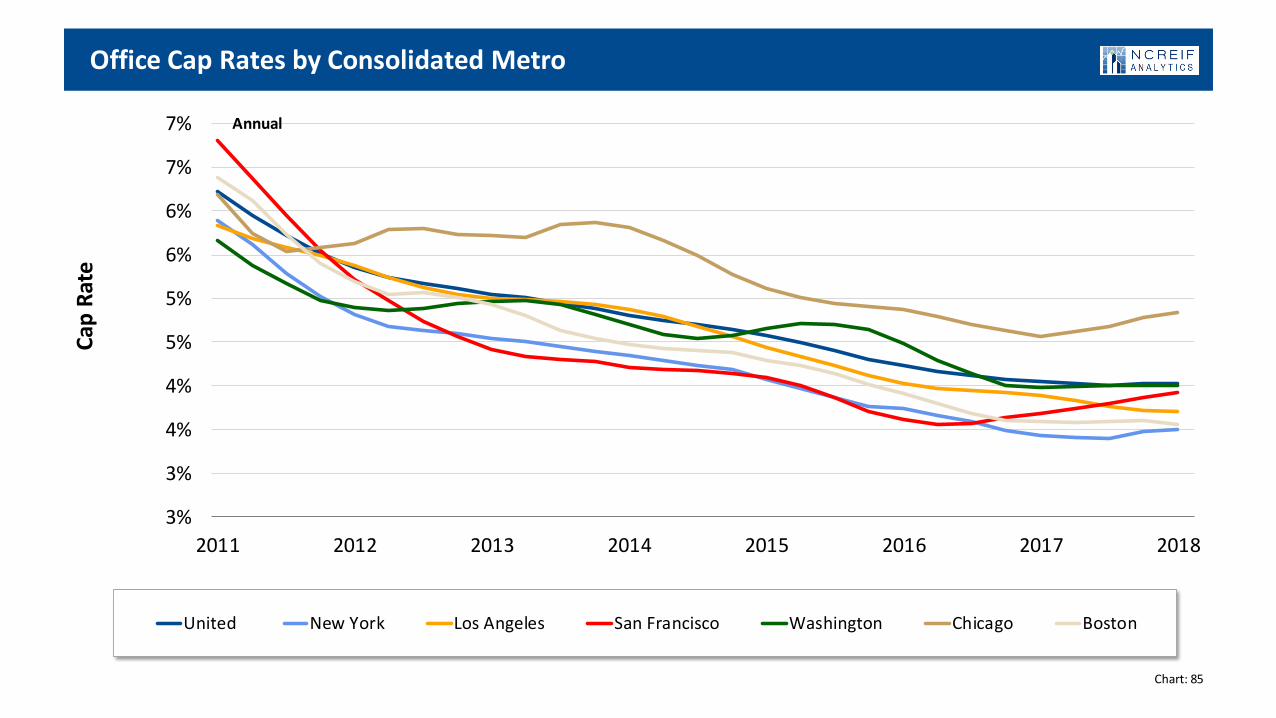
2011 2012 2013 2014 2015 2016 2017 2018
Cap
Rat
eOffice Cap Rates by Consolidated Metro
United New York Los Angeles San Francisco Washington Chicago Boston
Office Cap Rates by Consolidated Metro
Annual
Chart: 85
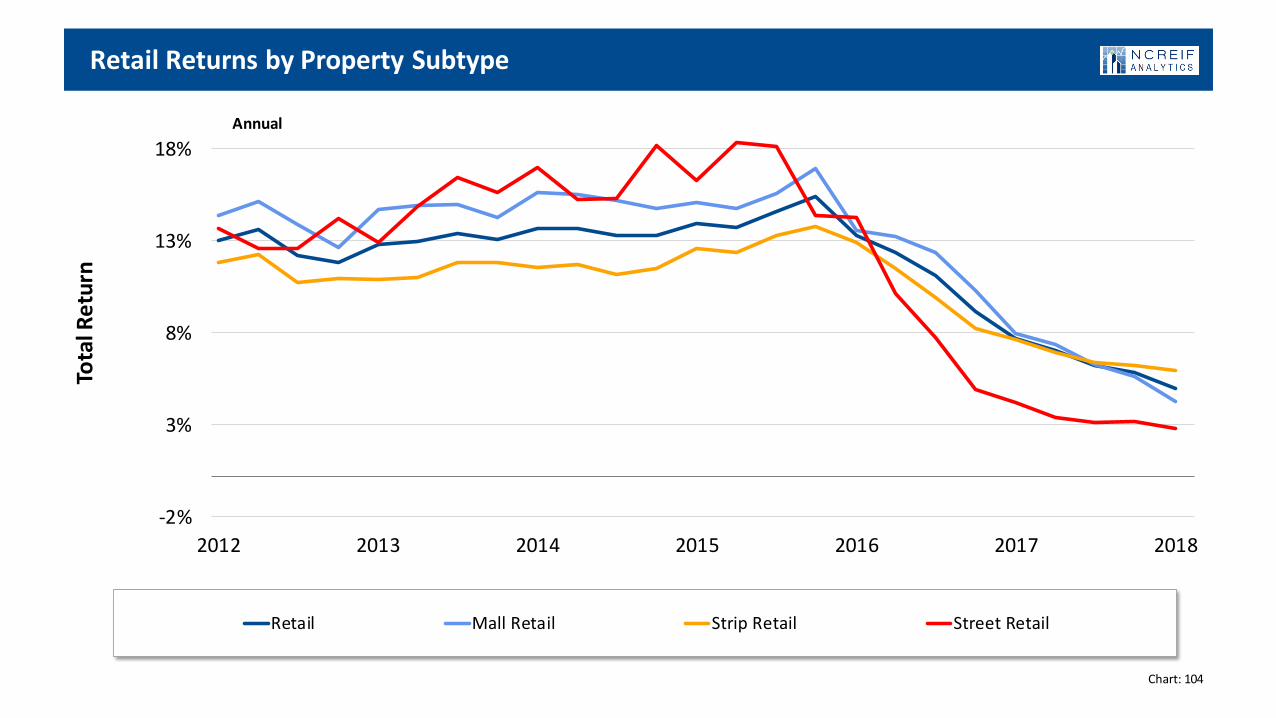
-2%
3%
8%
13%
18%
2012 2013 2014 2015 2016 2017 2018
Tota
l Re
turnRetail Returns by Property Subtype
Retail Mall Retail Strip Retail Street Retail
Retail Returns by Property Subtype
Annual
Chart: 104

Atlanta
ChicagoDallas
Denver
Houston
Los AngelesMiami
New York
Orlando
Phoenix
San Francisco
Seattle
Washington, D.C.
1%
3%
5%
7%
9%
11%
13%
15%
1% 3% 5% 7% 9% 11% 13% 15%
Re
tail
1-Y
r To
tal R
etu
rns
Retail 20-Yr Total Returns
Retail 1-Yr Returns v Long-Term Average
Below LT Avg
Above LT Avg
Chart: 108

-5%
0%
5%
10%
15%
20%
2011 2012 2013 2014 2015 2016 2017 2018
Re
tail
To
tal R
etu
rnRetail Returns by Consolidated Metro
United New York Los Angeles San Francisco Washington Chicago Boston
Retail Returns by Consolidated Metro
Annual
Chart: 107

2%
3%
4%
5%
6%
7%
2006 2008 2010 2012 2014 2016 2018
Cap
Rat
eRetail Cap Rates by Property Subtype
Retail Mall Retail Strip Retail Street Retail
Retail Cap Rates by Property Subtype
Annual
Chart: 114

2%
7%
12%
17%
22%
2013 2014 2015 2016 2017 2018
Tota
l Re
turnOther Property Type Total Returns
NPI Other Asst Living Ind Living Self Storage
Other Property Type Total Returns
Annual
Chart: 249

2.8%
3.3%
3.8%
4.3%
4.8%
5.3%
5.8%
6.3%
6.8%
2013 2014 2015 2016 2017 2018
Cap
Rat
eOther Property Type Cap Rates
NPI Other Asst Living Ind Living Self Storage
Other Property Type Cap Rates
Annual
Chart: 250

-10%
0%
10%
20%
30%
40%
50%
2013 2014 2015 2016 2017 2018
NO
I Gro
wthOther Property Type NOI Growth
NPI Other Asst Living Ind Living Self Storage
Other Property Type NOI Growth
Annual
Chart: 251
0.0
5.0
10.0
15.0
20.0
25.0
30.0
35.0
40.0
45.0
0
100
200
300
400
500
600
700
800
900
1000
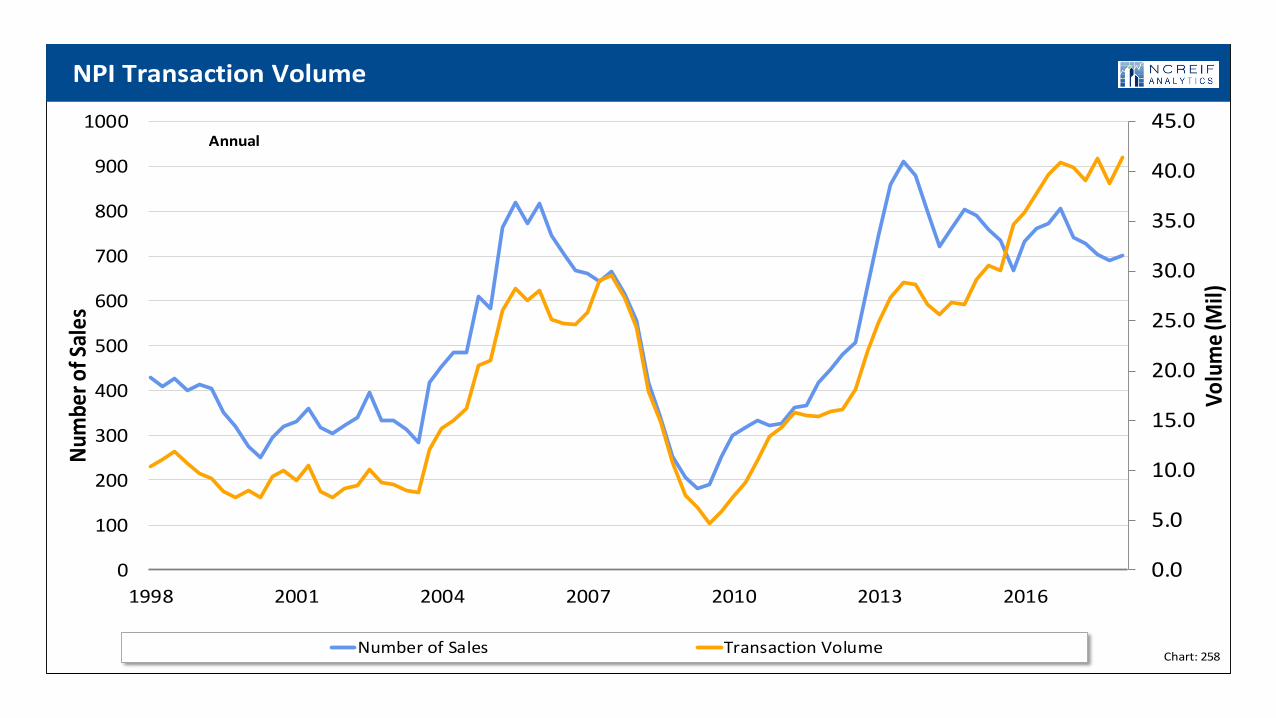
1998 2001 2004 2007 2010 2013 2016
Vo
lum
e (M
il)
Num
ber
of S
ales
Number of Sales Transaction Volume
NPI Transaction Volume
Annual
Chart: 258
Question
• What will the annual NPI total return be for 2018? (Current rolling annual return 7.1%)• A. Below 5%
• B. 5%-to-7%
• C. 7%-to-9%
• D. Above 9%
63

Summary
• Returns below average but stable
• But widening disparity of returns across property sectors
• Cap rate spreads near long-term averages could mitigate
pressure on cap rates from interest rate increases
• NOI growth good for industrial but close to zero for others
• Overall occupancy at historic high driven by industrial
64

Upcoming NCREIF Events
NCREIF Summer Conference 2018Charlotte, NCJune 19–22
Professional Certificate Program in Institutional Real EstateDallas, TXSouthern Methodist UniversityJuly 16–19
Visit www.ncreif.org for more information
65
Related Documents