First Picture The Production Possibilities Frontier Tradeoffs in Pictures Quantity of Computers Produced Quantity of Cars Produced 3,000 1,000 2,000 2,200 A 700 600 300 0 1,000 B Feasible but Inefficient C D Infeasible Pts Production Possibilities Frontier Efficient Points

First Picture The Production Possibilities Frontier Tradeoffs in Pictures Quantity of Computers Produced Quantity of Cars Produced 3,000 1,000 2,000 2,200.
Dec 19, 2015
Welcome message from author
This document is posted to help you gain knowledge. Please leave a comment to let me know what you think about it! Share it to your friends and learn new things together.
Transcript
First PictureThe Production Possibilities Frontier
Tradeoffs in PicturesQuantity ofComputersProduced
Quantity ofCars Produced
3,000
1,000
2,000
2,200 A
7006003000 1,000
B Feasible but Inefficient
C
D
Infeasible Pts
ProductionPossibilitiesFrontier
EfficientPoints

Supply
Demand
Price of Ice-Cream Cone
Quantity of Ice-Cream Cones
Second PictureSupply and Demand
21 3 4 5 6 7 8 9 10 12110
$3.002.502.00
1.501.00
0.50
Equilibrium

Supplyand
Demandon
Parade
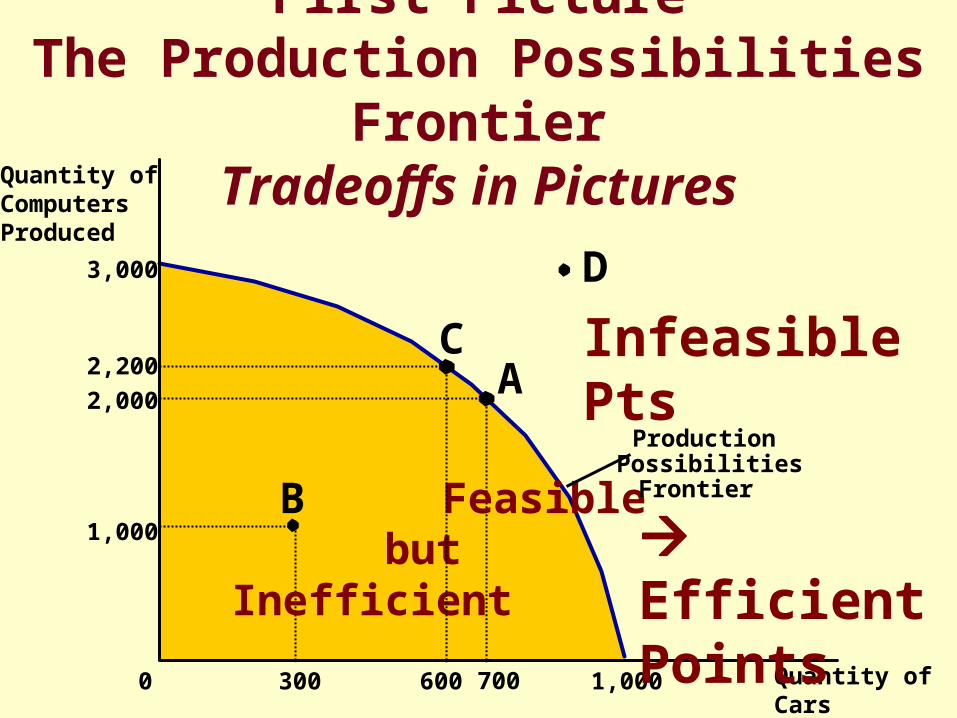
An Increase in Demand
Price ofIce-Cream
Cone
2.00
0 7 Quantity ofIce-Cream Cones
Supply
Initialequilibrium
D1
1. Hot weather increasesthe demand for ice cream...
D2
2. ...resultingin a higherprice...
$2.50
103. ...and a higherquantity sold.
New equilibrium
Harcourt, Inc. items and derived items copyright © 2001 by Harcourt, Inc.

S2
A Decrease in Supply
Price ofIce-Cream
Cone
2.00
0 1 2 3 4 7 8 9 11 12 Quantity ofIce-Cream Cones
13
Demand
Initial equilibrium
S1
10
1. An earthquake reducesthe supply of ice cream...
Newequilibrium
2. ...resultingin a higherprice...
$2.50
3. ...and a lowerquantity sold.

Elastic Demand: Quantity demanded responds dramatically to price
Elasticity is greater than 1
Quantity
Price
4
$51. A 22%increasein price...
Demand
100502. ...leads to a 67% decrease in quantity.

Inelastic Supply: Quantity doesn’t respond much to price
Elasticity is less than 1
Quantity
Price
4
$51. A 22%increasein price...
110100
Supply
2. ...leads to a 10% increase in quantity.
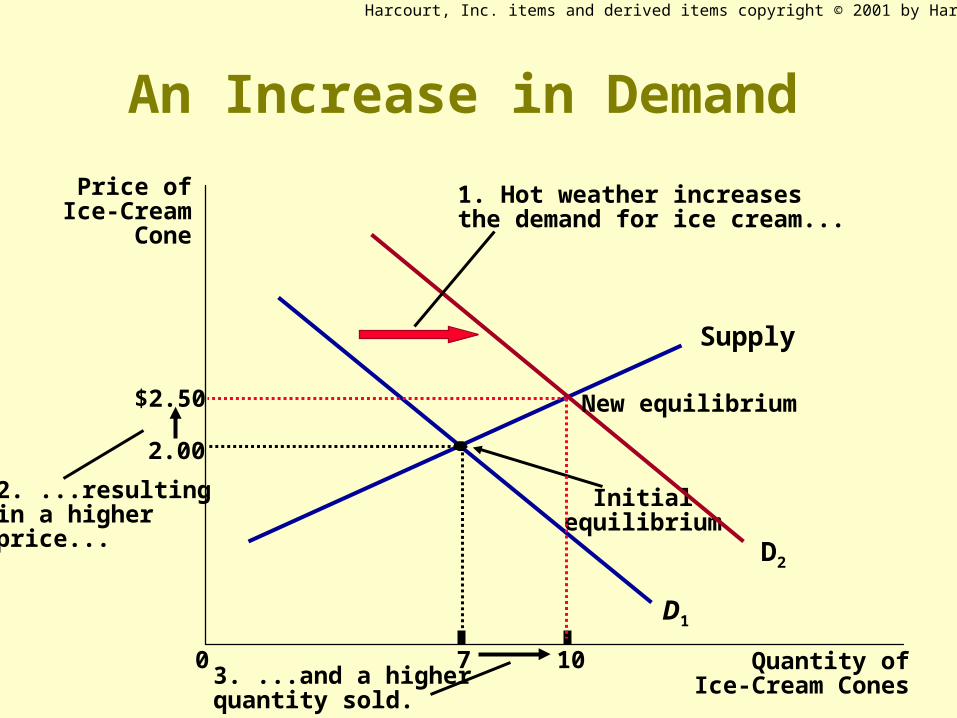
Consumer Surplus and Producer Surplus
Price
Equilibriumprice
0 QuantityEquilibriumquantity
A
Supply
C
B Demand
D
E
Producersurplus
Consumersurplus

Price
0 QuantityEquilibriumquantity
Supply
Demand
Cost to sellers
Value to buyers
Value to
buyers
Cost to
sellers
Value to buyers is greater than cost to sellers.
Value to buyers is less than cost to sellers.
Efficiency of Competitive Market Equilibrium … and the Tax Wedge

Remember
MR = MCand market price is the marginal
revenue of a price-taking competitive firm
MR = P = MC

The Effects of a TariffDeadweight Loss
Priceof Steel
0 Quantityof Steel
Domestic supply
Domestic demand
TariffWorld price
Q1S Q2
S Q2D Q1
D
Price without
tariff
Price with tariff
Imports without tariff
Imports with tariff
A
B
C EG
D F
Deadweight loss

GDP: Real and Nominal• Gross Domestic Product (GDP): Gross Domestic Product (GDP): the market value
of all final goods and services produced within a country during a year.
GDP = C + I + G + Ex – Im GDP = C + I + G + Ex – Im
= C + I + G + NX= C + I + G + NX
• Real GDPReal GDP adjusts for inflation
Nominal GDP = $GDP = P x Q $ GDP = GDP Deflator x Real GDP$ GDP = GDP Deflator x Real GDP
Real GDP = Q = $GDP/P = Nominal GDP divided by
(deflated by) the GDP Price Deflator

Foreign Exchange Rate: Appreciation and Foreign Exchange Rate: Appreciation and DepreciationDepreciation
• A currency A currency appreciatesappreciates when it buys more of a when it buys more of a foreign currency.foreign currency.– AppreciationAppreciation makes foreign goods cheaper. makes foreign goods cheaper.– AppreciationAppreciation Imports Up and Exports Down. Imports Up and Exports Down.
• A currency A currency depreciatesdepreciates when it buys less of a when it buys less of a foreign currency.foreign currency.– DepreciationDepreciation makes foreign goods more expensive. makes foreign goods more expensive.– DepreciationDepreciation Imports Down and Exports Up. Imports Down and Exports Up.

Current Account vs. Financial AccountCurrent Account vs. Financial Account
• The balance of payments must balance
Current Account + Financial Account = 0
– If we buy more goods and services from foreigners than they buy from us, we have to borrow the difference
sell them our IOUs.
Capital inflows help finance domestic investment and the government’s deficit
Interest Rates: Nominal and RealInterest Rates: Nominal and Real
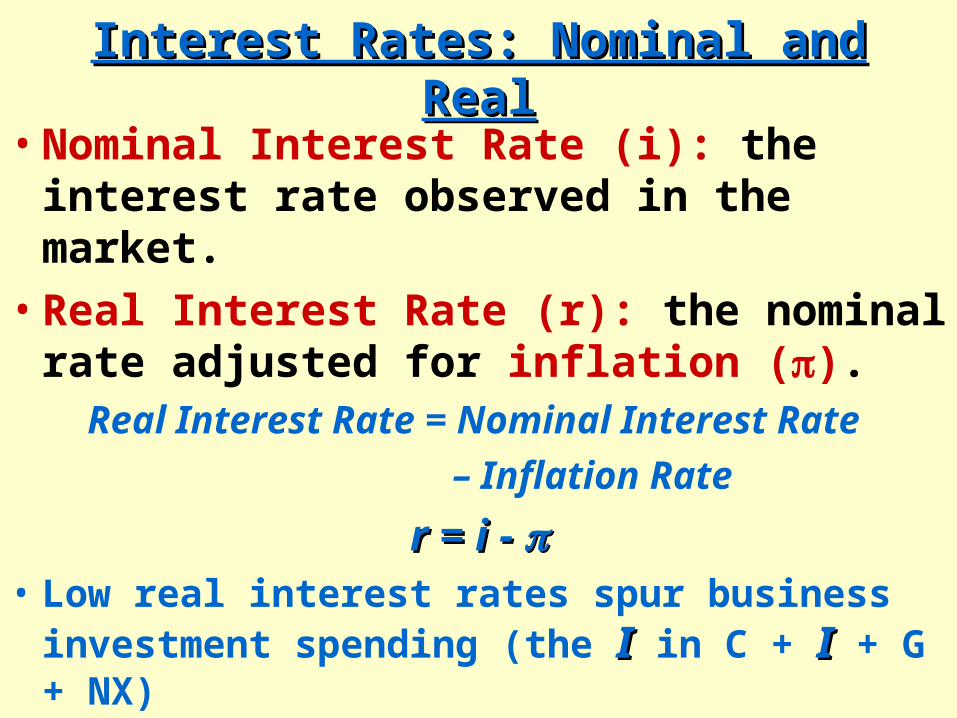
• Nominal Interest Rate (i): the interest rate observed in the market.
• Real Interest Rate (r): the nominal rate adjusted for inflation ().
Real Interest Rate = Nominal Interest Rate
– Inflation Rate
r = i - r = i - • Low real interest rates spur business investment
spending (the II in C + II + G + NX)
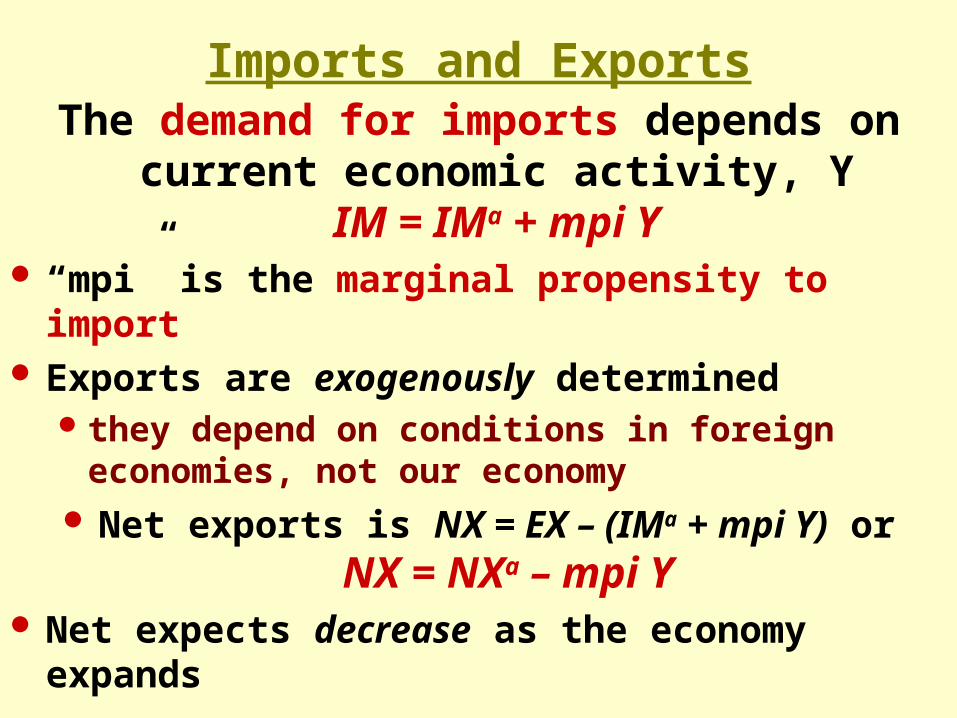
Imports and ExportsThe demand for imports depends on current
economic activity, YIM = IMa + mpi Y
“mpi” is the marginal propensity to import Exports are exogenously determined
they depend on conditions in foreign economies, not our economy
Net exports is NX = EX – (IMa + mpi Y) or NX = NXa – mpi Y
Net expects decrease as the economy expands
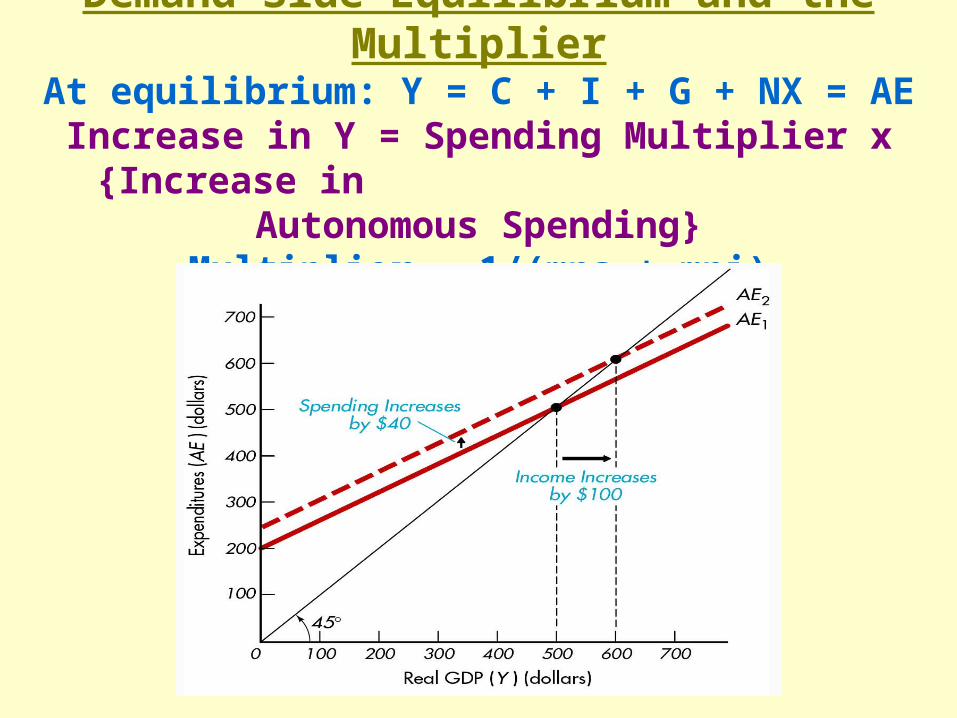
Demand-Side Equilibrium and the MultiplierAt equilibrium: Y = C + I + G + NX = AE
Increase in Y = Spending Multiplier x {Increase in Autonomous Spending}
Multiplier = 1/(mps + mpi)
Related Documents