January 2015 R&D Evaluation Methodology and Funding Principles Background report 1: Evaluation systems in international practice

First Interim Report: Evaluation systems in international practice (country analyses)
Jul 27, 2015
Welcome message from author
This document is posted to help you gain knowledge. Please leave a comment to let me know what you think about it! Share it to your friends and learn new things together.
Transcript

January 2015
R&D Evaluation Methodology and Funding Principles Background report 1: Evaluation systems in international practice

R&D Evaluation Methodology and Funding Principles
Background report 1: Evaluation systems in international practice
January 2015
Oliver Cassagneau-Francis, Kristine Farla, Malin Jondell Assbring, Peter Kolarz, Bea Mahieu, Göran Melin, Anke Nooijen, Martijn Poel, Caspar Roelofs, Tammy-Ann Sharp, Brigitte Tiefenthaler, Frank Zuijdam - Technopolis Group
Kyrre Lekve - NIFU

Evaluation systems in international practice
R&D Evaluation Methodology and Funding Principles i
Table of Contents 1. Introduction 1
2. Research performance assessment in the 5 ‘comparator’ countries 2
2.1 Austria 2 2.1.1 The design of the national evaluation 2 2.1.2 The metrics-based evaluation component 7
2.2 The Netherlands 8 2.2.1 The design of the national evaluation 8 2.2.2 Costs of the evaluation exercise 11 2.2.3 The metrics-based evaluation component 11 2.2.4 Evaluation processes 13 2.2.5 The peer review component 15 2.2.6 Criteria and indicators 15 2.2.7 Self-evaluation 20
2.3 Norway 21 2.3.1 Research Performance Assessment in Norway 21 2.3.2 The design of the national evaluations 22 2.3.3 The metrics-based evaluation component in national evaluations 27 2.3.4 The peer review component in national evaluations 30 2.3.5 Staffing of panels 33 2.3.6 Self-evaluation in national evaluations 36 2.3.7 The PRFS models 40 2.3.8 Entitlement to institutional funding 43
2.4 Sweden 44 2.4.1 The design of the national evaluation 44 2.4.2 Overview of the evaluation process 47 2.4.3 The metrics-based evaluation component 48
2.5 The UK 53 2.5.1 The design of the national evaluation 53 2.5.2 Overview of the evaluation process 58 2.5.3 The peer review component 72 2.5.4 Self-evaluation 81 2.5.5 Appendixes 81
3. Practice of interest in 5 other countries 85
3.1 Australia 85

Evaluation systems in international practice
ii R&D Evaluation Methodology and Funding Principles
3.1.1 Level of assessment 85 3.1.2 Indicators and scoring systems 91 3.1.3 Reflections on intended & non-intended effects 96
3.2 Belgium/Flanders 100 3.2.1 Introduction 100 3.2.2 Background: description of the R&D System 100 3.2.3 The BOF fund for bottom-up basic research 102 3.2.4 The BOF formula 108 3.2.5 The data sources 110 3.2.6 The institutional funding for teaching and research 111
3.3 Finland 113 3.3.1 Inclusion of individual staff 114 3.3.2 Indicators and scoring systems 114 3.3.3 Use and context of the choice of indicators 116 3.3.4 Source of information 116 3.3.5 Scoring system & weights 117 3.3.6 Effects of the use of these indicators 120 3.3.7 Sources: 120
3.4 Italy 121 3.4.1 The national research evaluation – an overview 121 3.4.2 Key principles for the VQR 2004-2010 125 3.4.3 Evaluation of the research activities 128 3.4.4 Evaluation of the research activities: indicators and scorings 132 3.4.5 Evaluation of the third mission activities 133 3.4.6 Reflections on intended & non-intended effects 133
3.5 New Zealand 134 3.5.1 Inclusion of individual staff 135 3.5.2 Indicators and scoring systems 138

Evaluation systems in international practice
R&D Evaluation Methodology and Funding Principles iii
Table of Figures Figure 1 Austria: The University Act 2002 on Evaluation and Quality Assurance ......... 3 Figure 2 Netherlands: Overview of evaluation process ................................................. 11 Figure 3 Netherlands: Categories used in the peer review ........................................... 16 Figure 4 Netherlands: Conditions that the review panel must meet ............................ 17 Figure 5 Netherlands: Timeframe for writing the assessment report .......................... 18 Figure 6 Sweden: Overview of evaluation process ......................................................... 47 Figure 7 UK: Flow chart of the REF2014 evaluation process ........................................ 59 Figure 8 UK: Estimation of Leeds universities’ costs associated with RAE annually .. 60 Figure 9 UK: Total direct expenditure on RAE 2008 ................................................... 61 Figure 10 UK: Average costs per HEI in sample (and extrapolations) RAE 2008 ....... 61 Figure 11 UK: Breakdown of cost per researcher .......................................................... 62 Figure 12 UK: RAE 2008 outputs by type ..................................................................... 63 Figure 13 UK: Example of how the overall quality profile is created using the weighted sub-profiles for an institution ......................................................................................... 72 Figure 14 Australia: ERA 2012 scale ............................................................................. 95 Figure 15 Italy: Example of matrix for the bibliometric indicators ............................. 130 Figure 16 New Zealand: Calculation of funding share allocated by quality assessment ....................................................................................................................................... 139 Figure 17 New Zealand: RDC funding formula ........................................................... 139 Figure 18 New Zealand: Funding formula for the RDC component 2011 .................. 139 Figure 19 New Zealand: An example of the formula for allocating ERI funding to each TEO (2011) .................................................................................................................... 140 Figure 20 New Zealand: The quality categories and weightings for the quality assessment .................................................................................................................... 140 Figure 21 New Zealand: The subject areas and how they are weighted ..................... 140 Figure 22 New Zealand: Research component of degree and corresponding weighting ........................................................................................................................................ 141

Evaluation systems in international practice
iv R&D Evaluation Methodology and Funding Principles
List of Tables Table 1 Austria: Scope of the assessment ........................................................................ 6 Table 2 Netherlands: Scope of the assessment ............................................................... 10 Table 3 Netherlands: Indicators in the metrics-based component ............................... 12 Table 4 Netherlands: Sources for bibliometrics analysis .............................................. 13 Table 5 Netherlands: Data collection & quality assurance ............................................. 14 Table 6 Norway: Scope of the assessment - subject-specific evaluations ..................... 25 Table 7 Norway: Indicators in the metrics-based component ...................................... 28 Table 8 Norway: Sources for bibliometrics analysis ..................................................... 29 Table 9 Norway: Data collection & quality assurance ................................................... 29 Table 27 The publication indicator – components (2014) ............................................. 41 Table 28 Funding of the institute sector, mill NOK (2013) .......................................... 42 Table 29 Norway: System points for publications ......................................................... 43 Table 13 Sweden: Scope of the assessment ................................................................... 45 Table 14 Sweden: Overview of evaluation process ......................................................... 47 Table 15 Sweden: Indicators in the metrics-based component .................................... 48 Table 16 Sweden: Sources for bibliometrics analysis ................................................... 49 Table 17 Sweden: Data collection & quality assurance .................................................. 51 Table 18 UK: Scope of the assessment ............................................................................ 55 Table 19 UK: Main Panels and Units of Assessment ..................................................... 55 Table 20 UK: Indicators used ......................................................................................... 67 Table 21 UK: Sources for bibliometrics analysis .......................................................... 68 Table 22 UK: Data collection & quality assurance ........................................................ 69 Table 23 UK: Sub-profile weightings in the overall quality profile ............................... 71 Table 24 UK: Panel size and structure for REF 2014 ..................................................... 74 Table 25 Australia: List of FoR, low volume threshold and use of bibliometrics ......... 87 Table 26 Australia: Eligible academic outputs per field ............................................... 90 Table 27 Australia: ERA 2015 reference period ............................................................ 93 Table 28 Australia: ERA 2015 Esteem measures .......................................................... 93 Table 29 Australia: ERA 2015 Applied Measures .......................................................... 94 Table 30 Belgium: IOF allocation keys ......................................................................... 101 Table 31 Belgium: Components of the BOF fund ......................................................... 103 Table 32 Belgium: Allocation of public funds to basic research 2006-2012 ............... 103 Table 33 Belgium: The structural component of the BOF key (2013) ........................ 108 Table 34 Belgium: Publication and citation parameters in the BOF-key .................... 109 Table 35 Belgium: Breakdown of the HEI institutional funding budget for teaching and research in 2011 ............................................................................................................. 112

Evaluation systems in international practice
R&D Evaluation Methodology and Funding Principles v
Table 36 Finland: Publication types reported in the annual data collection exercise . 117 Table 37 Finland: University core funding formula implemented since 2010 ............ 118 Table 38 Finland: Polytechnic core funding formula implemented since 2010 .......... 119 Table 39 Finland: The research component of the University core funding formula (2010) ............................................................................................................................ 120 Table 40 Italy: Disciplinary areas covered in the Evaluation of Research Quality ..... 125 Table 41 Italy: Number of products to submit for different staff members ................ 126 Table 42 Italy: List of scientific areas where bibliometrics was chosen ...................... 129 Table 43 Italy: Criteria for peer review ........................................................................ 130 Table 44 Italy: Scores for the research product categories ........................................... 131 Table 45 Italy: Indicators for the evaluation of the research activities ....................... 132 Table 46 Italy: Weights for the calculation of the final indicator for research activities ....................................................................................................................................... 132 Table 47 Italy: Third mission indicators used in the assessment of the quality of areas by structure ................................................................................................................... 133


Evaluation systems in international practice
R&D Evaluation Methodology and Funding Principles 1
1. Introduction
This report constitutes a background report to the Final report 1 – The R&D Evaluation Methodology. It collects the outcomes of the analyses related to the evaluation systems in ten countries. It sets the context for the study team’s design of the new evaluation system in the Czech republic through an analysis of the strengths and weaknesses of each system.
We focused on the five ‘comparator’ countries that were identified for this study, i.e. Austria, the Netherlands, Norway, Sweden and the UK. For these five countries, we analysed also the R&D governance structure and institutional funding system, providing a complete and in-depth view on the RD&I system in the countries.
Norway, Sweden and the UK are three countries where performance-based research funding systems (PRFS) are implemented for the distribution of institutional funding for research. The analysis of the systems in these countries gives a view in particular on the different criteria and approaches to the PRFS. For example, in Norway and Sweden the PRFS evaluation is indicator-based (i.e. uses only metrics), is geared towards an overall improvement of research performance in the system, informs only a small part of the institutional funding, and is complemented with other evaluations at the national level that do not influence institutional funding. In the UK, instead, the PRFS evaluation is panel-based, is geared towards rewarding the best performing institutions, informs a large part of the institutional funding system, and is not complemented with other evaluations at the national level.
In Austria and the Netherlands, instead, the evaluation practice is detached from the allocation of institutional funding. Especially the evaluation system in the Netherlands is of particular interest in the context of this study because of the comprehensive approach to Standard Evaluation Protocol (SEP), which sets the guidelines for the evaluation that is to be implemented at the level of research institution.
We complemented the analyses of the 5 ‘comparator’ countries with an analysis of the evaluation system in Australia, Belgium (the Flanders), Finland, Italy and New Zealand. Australia and New Zealand are two systems that refer strongly to the UK RAE; however, they also show some significant differences: in Australia the evaluation makes use of bibliometrics (but only for some fields of research) and does not influence funding; in New Zealand the panel evaluation is implemented at a highly detailed level, including also site visits. In Belgium, the PRFS system strongly relies on bibliometrics, while in its recent evaluation, Italy chose for an approach similar to Australia and uses bibliometrics only for some fields of research.
The first chapter in the Final report 1 - The R&D Evaluation Methodology sets out the comparative analysis of the various components of the evaluation system in these countries.
In this report we first describe in-depth the evaluation system in the five ‘comparator’ countries. The next chapter describes the evaluation systems in the five other countries, focusing on the most relevant topics of interest in each system.
The analyses for this report were performed in the summer of 2014.

Evaluation systems in international practice
2 R&D Evaluation Methodology and Funding Principles
2. Research performance assessment in the 5 ‘comparator’ countries
2.1 Austria In Austria, there is no uniform research evaluation system in place at the national level. Evaluation is handled de-centrally by the research organisations themselves but issues of evaluation are normally laid down for each (type of) research organisation in its legal basis and / or governing documents. Evaluation is generally considered an element of quality management, and both are to be handled by the autonomous research organisation itself. This holds for all major recipients of public institutional research funding.
In this case study we focus on the system in place for the 21 public universities1 as it is laid down in the University Act 2002 and “Qualitätssicherungsrahmengesetz (QSRG)” (Quality Assurance Framework Act). The 21 public universities are a backbone of the Austrian research system and together, they receive 79.4% of public institutional research funding.
Probably the single most important advantage of a decentralised evaluation system is that is capable of dealing with differences among research organisations and between disciplines, as the evaluation can be tailored to the institutional and disciplinary culture and its publishing and other academic habits.
Supporting documents
• Studies:
− B. Tiefenthaler, F. Ohler: “Dokumentation der Evaluierungen von Forschung an Universitäten”, Vienna 2009
• Legal basis
− University Act 2002
− Qualitätssicherungsrahmengesetz QSRG (Quality Assurance Framework Act).
• Guidelines
− AQ Austria: „Richtlinien für ein Audit des hochschulinternen Qualitätsmanagementsystems“, Vienna, July 14, 2013
2.1.1 The design of the national evaluation Strategic objective and purpose
The 21 public universities in Austria were granted far-reaching autonomy in the university reform of 2002 with the University Act 2002. Evaluation is covered in section 14 “Evaluation and Quality Assurance”:
1 There is one further public university, the Donauuniversität Krems, which focuses on further education and has a separate legal basis. It plays a minor role as a research organisation and will not be covered in this case study. The general statements made in the introduction hold also for this university.

Evaluation systems in international practice
R&D Evaluation Methodology and Funding Principles 3
Figure 1 Austria: The University Act 2002 on Evaluation and Quality Assurance
Evaluation and Quality Assurance
§ 14
(1) The universities shall develop their own quality management systems in order to assure quality and the attainment of their performance objectives.
(2) The subject of an evaluation is the university’s tasks and the entire spectrum of its services.
(3) Evaluations shall be conducted in accordance with subject-based international evaluation standards. The areas of university services to be evaluated shall, in the case of evaluations relating to single universities, be established by the respective performance agreement.
(4) The universities shall carry out internal evaluations on an ongoing basis, in accordance with their statutes.
(5) External evaluations shall take place:
1. on the initiative of the university council or rectorate of the university in question or the Federal Minister where they relate to individual universities;
2. on the initiative of the university councils or rectorates of the universities in question or the Federal Minister where more than one university is concerned.
(6) The universities concerned and their governing bodies shall be obliged to provide the necessary data and information for evaluations, and to contribute to it.
(7) The performance of university professors, associate professors, and other research, artistic and teaching staff shall be regularly evaluated, at least once every five years. The detailed arrangements shall be established by university statutes.
(8) The consequences of all evaluations shall be for the decision of the governing bodies of the universities. Performance agreements shall include arrangements for student evaluation of teaching.
(9) The cost of evaluations ordered by the Federal Minister shall be borne by the Federal Government.
Source: University Act 2002 Please note: The Federal Ministry in charge of public universities is the Federal Ministry of Science, Research and Economy. We refer to it as the Federal Ministry of Science in this document.
Clearly, the strategic objective of evaluation in this context is quality assurance: “The universities shall establish their own quality management system in order to assure quality and performance”. The entire spectrum of a university’s tasks and services are subject to evaluations. The main purpose of evaluations at the public universities is to assess the quality of all activities – not only for research, but also for teaching, administration etc. – and to provide information for improvement of the university services, operations and governance and decision making by the university management – in short for organisational development.
At the level of individual universities, they have laid down what they consider strategic objectives and purposes of (research) evaluation at their organisation in the statutes and guidelines of their quality management systems. Very much in line with the University Act 2002, most universities expect evaluation to contribute to the assurance and development of research quality. Evaluation provides the basis to reflect upon strengths, weaknesses and developments and it provides input for planning and decision making. Moreover, evaluation is also a tool of accountability towards the funding bodies, the research community and the public in general. Some universities explicitly highlight the supportive character of evaluation as opposed to evaluation as a control mechanism in order not to jeopardize intrinsic motivation of researchers.
Roles and responsibilities
As laid down in the University Act 2002, evaluations normally take place upon initiative at the level of each university, i.e. of the University Council or the Rectorate. The Federal Minister can also initiate evaluations. If more than one university is involved, evaluations can take place upon initiative of the University Councils or Rectorates or the Federal Minister. In practice, it is the university level that bears

Evaluation systems in international practice
4 R&D Evaluation Methodology and Funding Principles
responsibility for evaluations to take place. The Federal Minister of Science so far has not initiated evaluations according to the University Act 2002.
Each university is responsible for evaluating its own tasks and services or for having them evaluated externally, and it is obliged by law to develop a quality management system with an evaluation methodology as a part of it. Consequently, each university designs its own evaluation methodologies. These evaluation methodologies have to be in accordance with subject-based international evaluation standards. Typically, they differ according to the subject of evaluation, e.g. teaching, research, administration etc. Moreover, the overall approaches of universities to quality management differ among universities and especially universities with a strong subject specialisation (e.g. the arts, medicine) use their own distinct approaches tailored to their specialisation.
At most universities, specific units responsible for quality management and evaluation have been set up and these units are in charge of developing the respective systems, normally in consultation within the university. These units also plan, organise and manage evaluations at the particular university. Moreover, the quality managers have formed a network across all public universities in order to share experience and ideas and to support mutual learning2, and they also participate in international networks.
Quality management systems and evaluation methodologies have to be laid down as a part of a university’s statutes and as such have to be approved by the rectorate, the University Council and the Senate. Public university publish their statutes on their website.
From what has been said so far it has become clear that there is no single research evaluation system for Austrian public universities but rather 21 individual – tailored – systems at different stages of development and implementation. A study about the status quo of research evaluation in 2009 (B. Tiefenthaler, F. Ohler: “Dokumentation der Evaluierungen von Forschung an Universitäten”, Vienna 2009) found out that these systems were developed at very different paces and approaches at the different universities. In 2009, five years after the University Act 2002 had fully taken effect in 2004, some universities already had fully-fledged evaluation systems in place, while others had implemented only parts of such systems (e.g. for teaching) and were just developing systems for their other activities (e.g. for research), and yet other universities were still discussing their approaches to quality, especially at universities of the arts, where new concepts for arts-based research needed to be developed.
Until 2011, quality assurance of the research evaluation systems and processes at public universities was not explicitly regulated beyond what had been laid down in the University Act 2002. This changed when, in 2011 a new law, the “Qualitätssicherungsrahmengesetz (QSRG)” (Quality Assurance Framework Act) was in order to reform and to develop the external quality assurance for all players in the Austrian higher education system, i.e. for public as well as for private universities and for universities of applied sciences (polytechnics).
For the public university this act means that they now have to have their quality management systems audited and certified at regular intervals by either the Austrian Agency for Quality Assurance and Accreditation3 or by an Agency registered in the European Quality Assurance Register for Higher Education (EQAR) or by an equivalently qualified agency (QSRG § 18 (1)).
For the audit and certification of the quality management system at public universities, the following issues have to be assessed (QSRF §22 (2)):
2 http:// http://www.qm-netzwerk.at
3 http://www.aq.ac.at

Evaluation systems in international practice
R&D Evaluation Methodology and Funding Principles 5
1. The quality strategy and its integration into the steering of the university 2. Structures and procedures of quality assurance applied for studies and teaching;
research or art-based research or applied research and development (as applicable), organisation and administration; and human resources
3. The integration of internationalisation and societal objectives into the quality management system
4. Information system and stakeholder involvement.
The certification is valid for seven years and has to be renewed after this period.
This new act became effective in 2012. The Austrian Agency for Quality Assurance and Accreditation developed guidelines for the audits based on the act which have entered into force in June 20134. An audit including preparatory work is expected to take approximately one to one and a half years. Many universities plan to have their quality management systems audited during the ongoing funding period (see below). So far, no public university has completed the audit according to the new act5 while some audits are already in progress.
Already before the QSRG took effect, evaluation and quality management were (and will continue to be) dealt with in the performance agreements between the Federal Ministry and each university: At the federal level, the Ministry of Science is responsible for the governance and funding of the public universities. The largest share of public institutional funding for these universities is allocated through three-year performance agreements (also called performance contracts) between the Ministry of Science and each university (for more information about the performance agreement see the case study about the Austrian funding system). According to the University Act 2002, the areas of university services to be evaluated shall, in the case of evaluations relating to single universities, be established by the respective performance agreement between the university and the Ministry of Science. This is the only link between research evaluation and institutional funding established by law and it is a qualitative link, i.e. evaluations and their results do not directly influence the decisions about public institutional funding.
In practice, each performance contract contains a chapter about quality assurance. In this chapter, the university describes the basic aspects of its approach to quality assurance (and makes references to such descriptions in the university’s development plan or statutes) and defines specific objectives and activities for each funding period. Examples of goals related to quality assurance and evaluation agreed upon for the on-going funding period 2013 – 2015 include:
• External audit of the quality management system according to QSRG
• Development or re-design and implementation of parts of the existing QM system, e.g. sets of indicators, guidelines
• Improvement of internal decision making procedures, e.g. for internal funding decisions or tenure decisions
Each funding period lasts for three years, the present one from 2013 to 2015. During the funding period, representatives of both parties, the Ministry of Science and each university meet twice a year for monitoring meetings (called “Begleitgespräche”) to discuss the status quo and progress made and to compare it with the plans agreed
4 AQ Austria: „Richtlinien für ein Audit des hochschulinternen Qualitätsmanagementsystems“, Vienna, July 14, 2013
5 Three universities have had their quality management systems audited voluntarily before the QSRG came into effect.

Evaluation systems in international practice
6 R&D Evaluation Methodology and Funding Principles
upon in the performance agreement. If a university fails to reach one or several goals this is addressed in the accompanying meetings but it does not affect the funding for the on-going period. However, it can have an influence on the negotiation positions for the following period.
Key features of the evaluation exercise
From what has been said above it has become clear that there is no standard evaluation methodology for Austrian public universities. In general, each university uses a mix of methods for evaluating research and researchers.
The most commonly used method for evaluating research is some kind of informed peer review procedure. Their design may vary in details, but the key steps of these peer evaluations are:
• Self-evaluation of the evaluation unit (e.g. a department) based on a structured template and on quantitative and qualitative data (human resources, budgets, students, publications etc.).
• Site visit of (mainly internationals) peers (2 – 3 days)
• Written report by the peers
Some universities mainly or additionally rely on metrics including bibliometrics, i.e. on indicator based-systems; these systems typically include publication data and third party funding as well as different other indicators, e.g. editorships, prizes and awards, scholarships etc. These data are normally included in the information provided to peers in peer review processes as well. The difference between the two systems is that in metrics based systems the data are used internally only, mainly for internal target agreements as well as for decisions about funding and human resources.
The frequency of research evaluations is defined in each university’s quality management system. Typical intervals for informed peer reviews of organisational units or research priorities are four to five years. The performance of university professors, associate professors, and other research, artistic and teaching staff are be evaluated at least once every five years (according to UG 2002 §14 (7)). The detailed arrangements are established in each university’s statutes.
Typically the evaluations cover the period between evaluations. At some universities, these self-evaluation reports comprise a forward looking part, i.e. the peers evaluate not only past achievements but also plans.
Table 1 Austria: Scope of the assessment
Metrics Biblio-metrics
Peer review - remote
Peer review - on site
Self-evaluation
Scientific field x x x x Level 1: Institutions (universities, research institutes)
X x x x
Level 2: Faculties or departments in research institutes
x x x x
Level 3: Research groups
Level 4: Individual researchers
x x x x
Universities pick from this menu of methological approaches to put together an evaluation approach that suits their needs when evaluating at different levels:
• Scientific fields: Some universities have organised parts of their research in a way that crosses the borders of traditional organisational structures (e.g. faculties / departments). These universities normally also use these scientific fields or

Evaluation systems in international practice
R&D Evaluation Methodology and Funding Principles 7
research priorities (which are often interdisciplinary) as units of evaluation. Informed peer review as explained above is the method of choice in most cases.
• Level 1 (university): Some smaller universities organise comprehensive evaluations covering their entire research activities or even evaluate the whole university in a comprehensive approach, typically using informed peer review procedures.
• Level 2, the faculties, departments or other organisational units are the most common units of research evaluation at the public universities. In some cases, large units are split into smaller parts, e.g. large faculties are evaluated institute by institute with the faculty, normally using informed peer review.
• Level 3, research groups are no common evaluation unit in the Austrian public universities’ internal quality management systems.
• Level 4, the individual researcher, is actually the most traditional evaluation unit in the university system and very closely linked to human resource issues: universities have always evaluated applicants for professorships or other positions, albeit not always in a very transparent way. Setting up transparent and fair procedures at all levels has been and still is an important issue.
All in all, informed peer review with site visits is the method of choice at most universities and for evaluations that cover more than an individual researcher. Information provided to the peers typically include self-evaluation reports prepared within the unit of analysis; the evaluation department normally provides templates for these self assessment reports and provides material that is collected centrally (like descriptive data about the unit of analysis, output data, competitive funding, prizes etc.). Most universities also use metrics as part of the information; in some (few) cases, metrics based systems are the method of choice for the internal allocation of research funds. Disciplinary differences are normally taken into account in the structure and content of the information provided.
Some universities use a comprehensive approach to evaluation, i.e. not only research but all activities of the respective organisational unit are covered in one evaluation.
2.1.2 The metrics-based evaluation component In Austria and with respect to public universities, metrics-based systems are used as performance-based funding systems rather than as evaluation systems that provide input to quality management. This holds for the national level as well as for the level of individual universities.
In Austria, there is no indicator based research evaluation system at the national level. Nevertheless, many of the indicators listed in the table below (and other data and indicators) are collected and reported by the public universities in their “Wissensbilanzen” (intellectual capital report). Some of these indicators are used in the allocation of institutional funding to universities, namely in the formula-based share which comprises 20% of the available global budget for public universities. This formula-based funding could be considered an evaluation in the widest sense of the word (but is not considered as such by stakeholders in Austria). One out of four indicators is related to research and it is interpreted as an indicator for the transfer of knowledge: revenues generated from R&D projects and arts-based research projects (contracts and grants, both national and international, e.g. from the EU Framework Programmes, the Austrian Science Fund, the Austrian Research Promotion Agency etc.). This indicator governs 2.8% of the total institutional funding granted to the public universities in the present funding period. For more information about this funding formula see the financing-related part of the Austrian case study.
As outlined in the previous chapter, several universities use metrics-based systems. In most cases, such metrics-based systems are used for the performance based internal allocation of funding to the organisational units and they are used in addition to informed peer review which remains the key evaluation instrument. Metrics-based

Evaluation systems in international practice
8 R&D Evaluation Methodology and Funding Principles
systems are considered funding tools rather than evaluation tools (as defined in chapter 1.1), and only few universities use metrics-based systems as evaluation tools, mainly the Medical Universities. Although these three universities are relatively similar in subject specialisation (at a highly aggregate level), their metrics-based systems differ in the indicators used as well as in the methods applied to calculate a scoring based on these indicators which is finally translated into funding decisions.
2.2 The Netherlands The Netherlands has a tradition of bottom-up research evaluation, although the regular assessment of research quality is mandated by law6. The responsibility and design of this assessment lies with the research organisations (Universities, the KNAW, and NWO) who have established a protocol for the research assessments in the ‘Standard Evaluation Protocal’ (SEP). Also, in 2003 the research organisations have established an independent national research integrity committee (LOWI). LOWI is to advise the boards of the research organisations in case of scientific integrity complaints.
In addition to the regular research assessments, the Rathenau institute conducts independent evaluations and monitoring of the science system. Also, there is the annual publication of Science and Technology Indicators by WTI2 on behalf of the Ministry of Education, Culture and Science.7 These indicators, which are based on bibliometric analysis, can also play a role in assessing the quality of research.
2.2.1 The design of the national evaluation Strategic objective and purpose
The main aim of research assessments described in the SEP is: “to reveal and confirm the quality and the relevance of the research to society and to improve these where necessary”. Specific aims for various target groups are also further specified in the SEP8:
• Researchers need to know the quality and societal relevance and their unit’s strategy, and how these aspects can be improved.
• Boards of institutions wish to track impact of their research policy.
• Government wants to know the assessment outcomes in relation to the institution’s accountability and the government’s efforts to support an outstanding research system
• Society and private sectors seek to solve a variety of problems using knowledge that research delivers
The respondents in the interviews underlined that SEP is a ‘learning exercise’. The peers can provide feedback for the institutions or research group in order to improve their quality and research management. SEP is not used for funding decisions nor for ‘naming and shaming’ of bad performers.
6 Higher Education and Research Act.
7 www.wti2.nl
8 Standard Evaluation Protocol 2015-2021.

Evaluation systems in international practice
R&D Evaluation Methodology and Funding Principles 9
Roles and responsibilities
The regular assessment of research quality is mandated by law, in the Higher Education and Research Act. This act also states that the “…Minister [of OCW] may subject the funding of research at universities to certain conditions relating to quality assurance.” In practice however, the outcomes of the assessments have no consequences for institutional funding. The Ministry want to secure that there is a good quality assessment system in place, but has no active role in the governance and steering of SEP. This is mandated to the research organisations.
In response to this legislation, the SEP is drawn up and adopted by the Dutch research organisations: Association of Universities in the Netherlands (VSNU); the Netherlands Organisation for Scientific Research (NWO); and the Royal Netherlands Academy of Arts and Sciences (KNAW). The boards of the Dutch universities, NWO, and KNAW are to assess every research unit at its own institute at least once every six years. They are to decide at which aggregated level the assessment takes place, to define the Terms of Reference with the strategy and targets of the research unit as guiding principles, to set up the Peer Review Committee (PRW) in consultation with the research units.
In the protocol it I agreed that there will be a mid term evaluation of SEP. For the evaluation of the previous SEP a so-called meta-evaluation committee was installed. The committee had to evaluate the working of SEP as a whole. The committee has stopped its work some years ago. For the three research organisations agreed that the new SEP (2015 and beyond) will be evaluated, but no specific arrangement was agreed.
In addition to the SEP, there is some monitoring and analysis of the science system. The Rathenau Institute, an independent research institute, includes since 2004 a Science System Assessment department. It develops knowledge about the science system itself to inform science policy. Target groups include parliament, ministries, other government departments, and stakeholders such as organisations within the science system, societal organisations, the private sector. Also, science, technology and innovation indicators are updated yearly in the WTI2 database9.
Key features of the evaluation exercise
All research units must be evaluated at least once every six years, although not all at the same time. The board of the universities and institutes are responsible for the planning of the evaluations. The institution’s boards also decide which research units are included at an aggregated level in the assessment. Assessments can take place at different levels: the research units, the research institute as a whole or as a discipline (on a national level, containing several research organisations). Individual researchers are not assessed.
The main methodology for the assessments is peer review. The starting point of the peer review is a self-assessment, in which the research units provide information on its strategy and performance (including some bibliometrics and other metrics) over the past six years and its strategy over the coming years.
9 www.wti2.nl
Evaluation systems in international practice
10 R&D Evaluation Methodology and Funding Principles
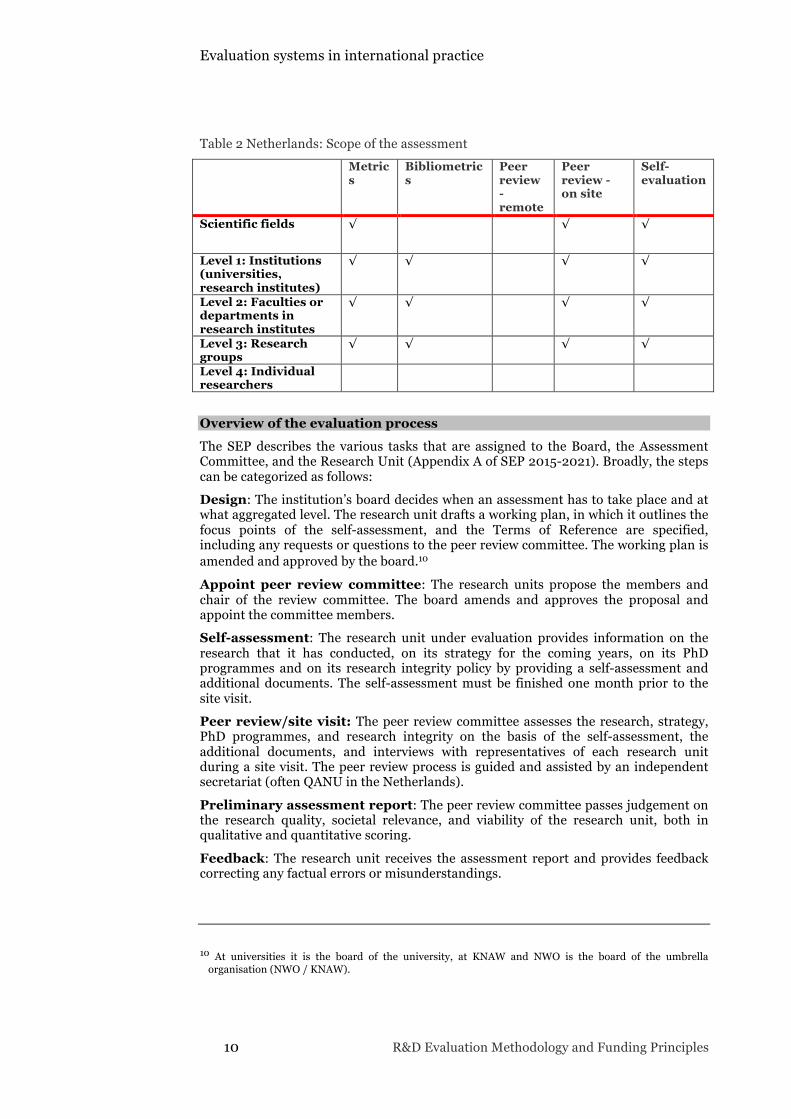
Table 2 Netherlands: Scope of the assessment Metric
s Bibliometrics
Peer review - remote
Peer review - on site
Self-evaluation
Scientific fields √ √ √
Level 1: Institutions (universities, research institutes)
√ √ √ √
Level 2: Faculties or departments in research institutes
√ √ √ √
Level 3: Research groups
√ √ √ √
Level 4: Individual researchers
Overview of the evaluation process
The SEP describes the various tasks that are assigned to the Board, the Assessment Committee, and the Research Unit (Appendix A of SEP 2015-2021). Broadly, the steps can be categorized as follows:
Design: The institution’s board decides when an assessment has to take place and at what aggregated level. The research unit drafts a working plan, in which it outlines the focus points of the self-assessment, and the Terms of Reference are specified, including any requests or questions to the peer review committee. The working plan is amended and approved by the board.10
Appoint peer review committee: The research units propose the members and chair of the review committee. The board amends and approves the proposal and appoint the committee members.
Self-assessment: The research unit under evaluation provides information on the research that it has conducted, on its strategy for the coming years, on its PhD programmes and on its research integrity policy by providing a self-assessment and additional documents. The self-assessment must be finished one month prior to the site visit.
Peer review/site visit: The peer review committee assesses the research, strategy, PhD programmes, and research integrity on the basis of the self-assessment, the additional documents, and interviews with representatives of each research unit during a site visit. The peer review process is guided and assisted by an independent secretariat (often QANU in the Netherlands).
Preliminary assessment report: The peer review committee passes judgement on the research quality, societal relevance, and viability of the research unit, both in qualitative and quantitative scoring.
Feedback: The research unit receives the assessment report and provides feedback correcting any factual errors or misunderstandings.
10 At universities it is the board of the university, at KNAW and NWO is the board of the umbrella organisation (NWO / KNAW).

Evaluation systems in international practice
R&D Evaluation Methodology and Funding Principles 11
Submit final assessment report to board: The review committee submits final assessment report to the institution’s board.
Board’s position document: The board receives the report, acquaints itself with any comments of the research unit, and determines its own position on the assessment outcomes. In the position document, the board states what consequences it attaches to the assessment outcomes.
Publication assessment report & Position document: The board sees to it that the assessment report and the position document are made public.
Follow-up: The board monitors follow-up actions by the research unit on assessment committee’s recommendations. The board decides how such monitoring takes place.
The SEP provides only timeframes for the drafting of the preliminary assessment report until follow-up of assessment committee recommendations. Timeframes for other steps are estimated from our own experience and that of interviewees with such research assessments (Figure 2).
Figure 2 Netherlands: Overview of evaluation process
SEP 2015-2021 and interviews
2.2.2 Costs of the evaluation exercise The board of the research institute is responsible for the costs. An evaluation costs approximately 20 K€ per institute, excluding in-kind contributions.
2.2.3 The metrics-based evaluation component The evaluation system in the Netherlands does not include a separate metrics-based component. The self-assessment conducted by the research unit under evaluation does include output indicators and can also include (biblio)metrics.
Overview
Research outputs, outcomes and economic and social impacts are evaluated as integral part of the criteria research quality and societal relevance. In the self-assessment, the research unit must provide information on a number of basic indicators, such as number of FTE personnel, number of publications, sources of income, number of PhD (Appendix D3 of SEP 2015-2021).
In addition to this basic information, the research is assessed on the two criteria research quality, and societal relevance. These two criteria are assessed along three dimensions: 1) demonstrable products, 2) Demonstrable use of products, and 3)
Com
mitt
ee
Approve Design
Establish committee
Propose/approve
committee
Peer review
Prelim Report
Final Report
Comments
Position Docum
ent
Uni
tBo
ard
Final Report
Published Report & Position document
Follow-upDesign
Monitoring
4 weeks
4 - 8 weeks
4 - 5 months yearly
Self-assessment
8 weeks
3-4 months
2-3 days
±1 week
±1 month

Evaluation systems in international practice
12 R&D Evaluation Methodology and Funding Principles
Demonstrable marks of recognition. For each criterion, the research unit chooses additional indicators relating to these three dimensions to be included in the self-assessment. The SEP provides a non-exhaustive list of suggested indicators, some commonly provided additional indicators (A), and the suggested indicators (S). The indicators are not mandatory. The idea is that each research unit chooses indicators that fits the discipline and corresponds to the mission and strategy.
Table 3 Netherlands: Indicators in the metrics-based component Input criteria Institutional funding B Third-party funding • National competitive funding B
• International competitive funding B • Contract research B/S
• Non competitive funding B Expenditures Personnel costs B Other costs B Research staff (FTE) B Total staff incl. supporting (FTE B Systemic indicators International cooperation • In general S
• Within research community S • Research-education S
• Science-industry • International mobility National cooperation • Within research community • Research-education
• National mobility Process indicators Knowledge transfer to the research system
• Editorship in journals • Conferences etc S
• Intra-research collaboration S Knowledge transfer to education • PhDs enrolment/success rates B
• Postdocs • Graduate teaching Knowledge transfer to enterprises & society
• Collaboration research-industry Research outputs Refereed articles B/S Non-refereed yet important articles B/S Books B/S Book chapters B PhD theses B/S

Evaluation systems in international practice
R&D Evaluation Methodology and Funding Principles 13
Conference papers B Professional publications B/S Publications aimed at general public B Other research output <specify> B/S Total publications B Innovation outputs IPR Other innovation outputs Outcomes/impacts Research (cultural) Innovation (spinoff, incubators) Patents/licenses S Policy reports S Societal B
Bibliometrics
The importance of bibliometric analysis in research evaluation is currently much debated in the Netherlands (the Science in Transition movement). Differences in disciplinary cultures make that bibliometric analysis is not equally relevant to the various disciplines. Also, it is becoming more generally accepted that the current focus on publication output as a measure of research quality favours quantity over quality, jeopardizing the research quality.11 The interviewees indicated that the bibliometrics is not playing an important role in the peer review assessment. The peers want to see the output, but it is a reference rather than a dominant element of the assessment.
Partly due to this public debate, research output no longer is an independent criterion in the SEP. However, the number of publications is still required as part of the basic information. Moreover, further bibliometric analysis may be included as indicators for the dimensions ‘demonstrable products’, and ‘demonstrable use of products’, when deemed appropriate by the research unit. The generally used data-bases are indicated in Table 4.
Table 4 Netherlands: Sources for bibliometrics analysis Sources Use for scientific fields
National identification list of journals/ publishers Social sciences International database • Scopus • WoS Technical, Medical
• Others • Google Scholar Social and Humanities
2.2.4 Evaluation processes The data collection & quality
The data is collected as part of the self-assessment, which is the responsibility of the evaluated unit. Much of the data is extracted from the institutional research information system. Some parts of the self-assessment, such as any bibliometric
11 ERiC, Handreiking: Evaluatie van Maatschappelijke Relevantie van Wetenschappelijk Onderzoek; Dijstelbloem, “Science in Transition Status Report Debate , Progress and Recommendations.”

Evaluation systems in international practice
14 R&D Evaluation Methodology and Funding Principles
analysis, can be outsourced to an external company such as the Dutch Centre for Science and Technology Studies (CWTS) in the Netherlands. The self-assessment is submitted to the board at least one month prior to the peer review site visit. The board approves the self-assessment, with only general quality control on obvious factual errors (Table 5).
Table 5 Netherlands: Data collection & quality assurance
Method for data collection
Annual reports by the institutions
Submission in the national research information system Not used
• By institution n.a.
• By head of research unit n.a.
• By individual researcher n.a.
Harvesting from other RIS Used
• Institutional information systems Yes
• Publication repositories No
• Other information systems No
Rules & tools for quality check of the input
Responsibility institution / submitter, ev. Guiding procedures
Yes, the board approves design before self-assessment, and approves data provided. No structural data check
Central checking procedures No
Close collaboration central - institution No
Direct observation (peer review panel) Yes
Scoring and use of the data
The scoring and use of the data is performed by the review panel (see section 2.2.6). The outcome of the review has no direct implications for the public funding nor direct implications for institutional funding. The response to the outcomes of the assessment differs per organisation and depends on the context. Usually the main focus is on the recommendations. The outcomes and recommendations are followed up by the board and by the research unit with the purpose of improving the research unit. The will be on the agenda of the bilateral meetings. In some cases, the board can respond to a number of SEP evaluations. E.g. the NWO board developed a view on all the NWO-institutes assessment en indicated some common element for improvement (like data management).
This absence of direct financial consequences can contribute to a more critical and constructive review by the panel members. However, the respondents stated that the uncertainly of the implications make the peers also cautious about the scores.
The self-assessment includes a benchmark, where the evaluated unit indicates which other institute they would like to be compared to. However, this requirement is new in the SEP 2015-2021. In the current SEP some institutes already indicated benchmark institutes. It and it is not yet clear how this benchmark is operationalized in the new SEP. It may be that some of the committee members come from this institute,

Evaluation systems in international practice
R&D Evaluation Methodology and Funding Principles 15
resulting in an ‘internal benchmark’. Possibly, the research unit will also have to provide data on the benchmark institute – however, this seems unlikely 12.
2.2.5 The peer review component From literature, nine main aspects of a peer review process have been identified. Below, these aspects of the review process in the Netherlands are described.
Top down versus bottom up organisation of review process
The peer review based research assessment process in the Netherlands is a largely bottom-up process, with the research organisations themselves being responsible for the assessment and research units having significant influence on the process. The boards of the universities, NWO and the Academy are responsible for the assessment of every unit within their institution once every six years.
The SEP provides guidelines on review procedures, criteria and scoring in order to ensure coherence between evaluations. However, guidelines are broad enough to ensure applicability to all disciplines, and the exact ToR are established by the boards with the research units’ strategy and targets as guiding principles. The boards are also free to define the aggregate level of the evaluations, and in consultation with the research units under evaluation they establish the Peer Review Committee (PRC) and appoint its members.
The boards are also responsible for the follow-up of the review committee’s recommendations, with no specific guidelines being provided by the SEP. The committee’s recommendations are generally to be used to improve the research at the institutions, and do not directly affect external funding. A number of studies on the consequences of evaluation in the Netherlands before the implementation of SEP 2015-2021 showed13:
• The results of evaluations can play a role in administrative decisions (such as whether to disband a unit or cut funding), but are never the only grounds for such decisions;
• Low scores often have direct consequences, such as a binding order to improve, and resources may be made available for the purpose;
• High scores rarely lead to direct reward, with no financial resources being available for this purpose;
• High-scoring units are however indirectly rewarded, as their ability to recruit staff or attract funding is enhanced.
2.2.6 Criteria and indicators The starting point of the review is a self-assessment by the research units under evaluation. The review panel evaluates the research based on three main criteria: research quality; societal relevance; and viability. The review committee provides both a qualitative judgment and a quantitative judgment using four categories as represented in Figure 3. The committee ensures that the quantitative and qualitative judgements are in agreement, and that the criteria and judgement are related to the unit’s strategic targets. In addition to these main criteria, the review also provides a
12 Interview Coordinator Research Evaluation, Leiden University
13 Drooge et al., Facts & Figures: Twenty Years of Research Evaluation.

Evaluation systems in international practice
16 R&D Evaluation Methodology and Funding Principles
qualitative judgement on the unit’s PhD programmes and the unit’s policy on research integrity. For these elements no scores are required.
Research quality
Research quality is assessed based on output indicators demonstrating the quality and use of their research (including bibliometric indicators) provided in the self assessment. Furthermore the peers can assess the quality on bases of the interaction during the site visit and reading some key publications.
Societal relevance
Societal relevance is assessed based on indicators and narratives provided in the self-assessment, concerning quality, scale and relevance of contributions in areas that the research unit has itself defined as target areas. Indicators for societal relevance are not always available (more in general under development). In order to tackle this problem the new SEP introduces the so-called narratives: stories about the interactions with societal stakeholders and the outcomes of it.
Viability
Viability concerns the strategy that the research unit plans to pursue in the years ahead, and the extent to which it is capable of meeting its targets in research and society during this period.
Figure 3 Netherlands: Categories used in the peer review Category Meaning Research quality Relevance to
society Viability
1 World leading/ excellent
The research unit has been shown to be one of the few most influential research groups in the world in its particular field.
The research unit makes an outstanding contribution to society.
The research unit is excellently equipped for the future.
2 Very good The research unit conducts very good, internationally recognised research.
The research unit makes a very good contribution to society.
The research unit is very well equipped for the future.
3 Good The research unit conducts good research.
The research unit makes a good contribution to society.
The research unit makes responsible strategic decisions and is therefore well equipped for the future.
4 Unsatisfactory
The research unit does not achieve satisfactory results in its field.
The research unit does not make a satisfactory contribution to society.
The research unit is not adequately equipped for the future.
Staffing of panels
The board is responsible for setting up the procedure to assemble the review panel members. The board and the research unit ensure that the assessment committee’s overall profile matches the research unit’s research and societal domains. The research unit nominates a candidate chairperson and candidate members, and must approve the final panel composition and confirm their ability to adequately assess the unit’s work.

Evaluation systems in international practice
R&D Evaluation Methodology and Funding Principles 17
The SEP lists 9 general conditions that the panel should meet (Figure 4), and requires that panel members should sign a statement of impartiality. It provides no specific guidelines on accounting for multidisciplinarity, geographic distribution, the inclusion of end-users, or gender balance. It provides no guidelines on the size of the panel or the tasks and mandates of individual panel members.
Figure 4 Netherlands: Conditions that the review panel must meet
An international assessment committee:
a Should be familiar with recent trends and developments in the relevant research fields and be capable of assessing the research in its current international context
b Should be capable of assessing the applicability of the research unit’s research and its relevance to society;
c Should have a strategic understanding of the relevant research field;
d Should be capable of assessing the research unit’s management;
e Should have a good knowledge of and experience working with the Dutch research system, including the funding mechanisms;
f Should be capable of commenting on the PhD programmes and the research integrity policy;
g Should be impartial and maintain confidentiality;
g
Should have the assistance of an independent secretary who is not associated with the research unit’s wider institution and who is experienced in assessment processes within the context of scientific research in the Netherlands
SEP 2015-2021
The interviewees stated that sometimes it could be problematic to find real independent peers. Certainly in small research domains. More in general, there are often links between the research unit and the peers, e.g. from conferences. According to the respondents even this (weak) links makes peers cautious for giving low scores, because in some other cases they may depend on the assessment of the researchers of the unit evaluated (e.g. review articles, review funding proposal, part of a review committee).
Structure of panels and sub-panels
The SEP does not provide any guidelines on the further structuring of panels into subpanels. Other than the procedural guidelines provided in the SEP, there are no procedures in place to ensure coherence between the assessments of the various institutes.
Division of roles
The board of the institution is the assignor of the review and the costs. The board defines the terms of reference with the strategy and targets of the evaluated unit as guiding principles. The board and the evaluated unit collaborate closely in establishing the review panel, and the panel must be approved by the unit prior to evaluation. Hence, cross-referrals are not applicable in the Netherlands. The panel is assisted by an independent and experienced secretariat. This secretariat role includes the organisation of the peer review and site visit, and is often fulfilled by an independent agency, such as QUANU. The board is responsible for the follow up of the recommendations by the review panel.
Concrete activities of panel members
The review includes:
• Assessment of self-assessment and accompanying documents

Evaluation systems in international practice
18 R&D Evaluation Methodology and Funding Principles
• Site visit, including interviews
• Writing a preliminary assessment report
• Correcting factual inaccuracies based on feedback
• Finalizing and submitting report to board
Timing
Each unit must be evaluated at least once every six years. There is no specific budget for the review and also no specified time span for the overall review. However, SEP does provide guidelines on the timespan for the drafting of the assessment report (Figure 5).
Figure 5 Netherlands: Timeframe for writing the assessment report
Task Timing
Draft assessment report made available to the research unit
8 weeks after site visit
Comments by research unit concerning factual inaccuracies made available to assessment committee
10 weeks after site visit
Final version of assessment report made available to board
12 weeks after site visit
Board determines its position 16-20 weeks after site visit
Publication of final assessment report + board’s position document on website
No more than six months after site visit
Report on assessments, conclusions, recommendations and follow-up in annual report
Annually
SEP 2015-2021
Transparency
Accountability (for public investment) is one of the objectives of SEP. In theory both the process and the results are very transparent. Each evaluation report should be published, including the followed procedures, panel composition, results and recommendations. Also the board’s position document, in which the board states what consequences it attaches to the assessment, must be published according to the new SEP. In its annual reports, the boards indicate which of the institution’s research units have been assessed according to the SEP, including the most important conclusions, recommendations, and follow-up action. The boards also report which research units will be assessed in the year ahead. In practice not every research organisation publish the results of the SEP evaluations. KNAW and NOW publish all the reports including the board position paper. However, the degree of transparency between the universities differs. Some publish the results, some don’t.
Evolution of the review process
In March 2014, the new SEP 2015-2021 was presented with several changes compared to the SEP 2009-2015 in order to better align with the current needs of science and society14:
14 KNAW, “Research Organisations Present New SEP.”

Evaluation systems in international practice
R&D Evaluation Methodology and Funding Principles 19
• Productivity no longer as independent criterion. In response to recent criticism on the negative effects of the publication pressure, productivity is no longer an independent criterion. It is still considered as part of the quality, but in combination with other indicators.
• Increased focus on societal relevance. Attention for societal relevance of scientific research has increased over recent years. A narrative has been added to the self-assessment report, in which the societal relevance is elaborated on. An important initiative in this respect is the ERiC-project (Evaluating Research in Context)15. ERiC addresses the importance of the societal relevance of scientific results and makes recommendations on how to assess such relevance. Part of these recommendations have been incorporated in the new SEP. The new SEP addresses both scientific quality and societal relevance along three axes: 1) Research outputs, such as papers, books, theses and other outputs such as datasets, designs, prototypes; 2) the use of these outputs, such as citations, use of softwaretools, use of scientific infrastructure; and 3) marks of recognition from peers and societal groups.
• Increased focus on scientific integrity. Recent frauds in science have resulted in more stringent policy on integrity and correct use of data at the research organisations. The new SEP requires that research units provide their policy on safeguarding of scientific integrity. Integrity is part of the new SEP, but is no separate criteria. The peers must assess the policy concerning safeguarding scientific integrity. This topic also has a link with data management.
• Increased focus on PhD training. Research- and graduate schools are visited by the experts to obtain recommendations for further improvement. The quality assurance system for PhD training via the research schools (ECIS) will disappear. This was one of the reasons to incorporate PhD training in SEP (although the old SEP offered also the possibility to assess PhD training).
Strengths and weaknesses
A number of studies on the consequences of evaluation in the Netherlands before the implementation of SEP 2015-2021 showed16:
• The PRC’s final assessment and the numerical score awarded cannot always be clearly deduced from the arguments presented;
• Those concerned perceive evaluation as a major administrative burden;
• Not all research organisations publish the results in full.
15 ERiC, Handreiking: Evaluatie van Maatschappelijke Relevantie van Wetenschappelijk Onderzoek.
16 Drooge et al., Facts & Figures: Twenty Years of Research Evaluation.

Evaluation systems in international practice
20 R&D Evaluation Methodology and Funding Principles
In the interviews we also asked the respondents about the strengths and weaknesses of SEP.
Strengths
• An independent review by renowned peers: the peers are able to understand the specifics of the research and position it in an international (quality) framework.
• SEP is a learning exercise for the institutes/groups/disciplines involved. Aim is to improve the quality and the management of the research. Evaluation reports contain concrete recommendations. SEP contributed to the increased quality of the Dutch research; the system works.
• SEP is not also am ex post evaluation of the performance but also includes strategy and management. Furthermore is also encompasses an ex ante assessment; it take viability and the strategy into account. This allows a more strategic reflection rather than ‘counting outputs’. From this point of view is it also important that SEP emphasis the societal relevance of the research.
• The outcomes are use for improvement and not to reallocate funding or to appraise individual researchers. Peers therefore are ‘free’ in their assessment; they do not have to think about the consequences of their judgement.
• It is a bottom up process: the responsibility for the SEP evaluation lies at the universities. This allows a tailor made approach and also stimulates self-reflection and internal discussion about the own performance and the future strategy.
Weaknesses
• Score inflation: the scores given by the peers increased in general, but do not seem to reflect the quality improvement (too many world leading groups). Peers are reluctant to give low scores and there seems a mechanism to increase the scores of the previous SEP evaluation. More in general it is felt that scores are unnecessary as SEP is a learning exercise.
• It is a bit of struggle to assess the societal relevance of the research groups. Scientific international peers are not always suited for this task as it concerns national and regional specificities. Also indicator developments for societal relevance is not yet very well developed, certainly not for certain disciplines (e.g. SSH). This makes it hard to get a grip in the output and processes of knowledge transfer.
• The main focus of SEP is not to have a national comparison at a national level. The boards of the research organisations are free to choose the unit of analysis, in many case research group, a research institute or a faculty rather than disciplines.
• The interdependency between peers and the research group/institute: members of the committee are cautious for low scores because they might depend on the assessment of members of the research group/institute in other cases, e.g. review of research proposals, review of articles, site visits, etc. This interdependency can make peer less critical.
Best practices and lessons learned
Various studies conducted in the Netherlands have shown that evaluation is appreciated as an instrument of management16. There is also appreciation of the fact that boards of the research organisations are free to take autonomous decisions in response to the outcomes.
2.2.7 Self-evaluation As described under section 2.2.6, a self-evaluation is the starting point of the peer-review based assessment. The self-assessment addresses the research unit’s strategy, targets, efforts and results over the past six years, and its plans for the coming six
Evaluation systems in international practice
R&D Evaluation Methodology and Funding Principles 21
years. For the metrics that must be provided, see section 2.2.3. It also includes a SWOT analysis, and a (preferably international) benchmark. Furthermore the self-assessment addresses the PhD programmes, and research integrity.
The research unit is free to select the output indicators most appropriate for its discipline/context. The rationale for the selection of output indicators must be described in the self-assessment. Output indicators must be selected demonstrating research quality and societal relevance, along the three axes: 1) demonstrable products, 2) demonstrable use of products, and 3) Demonstrable marks of recognition. Societal relevance is further elaborated in an accompanying narrative.
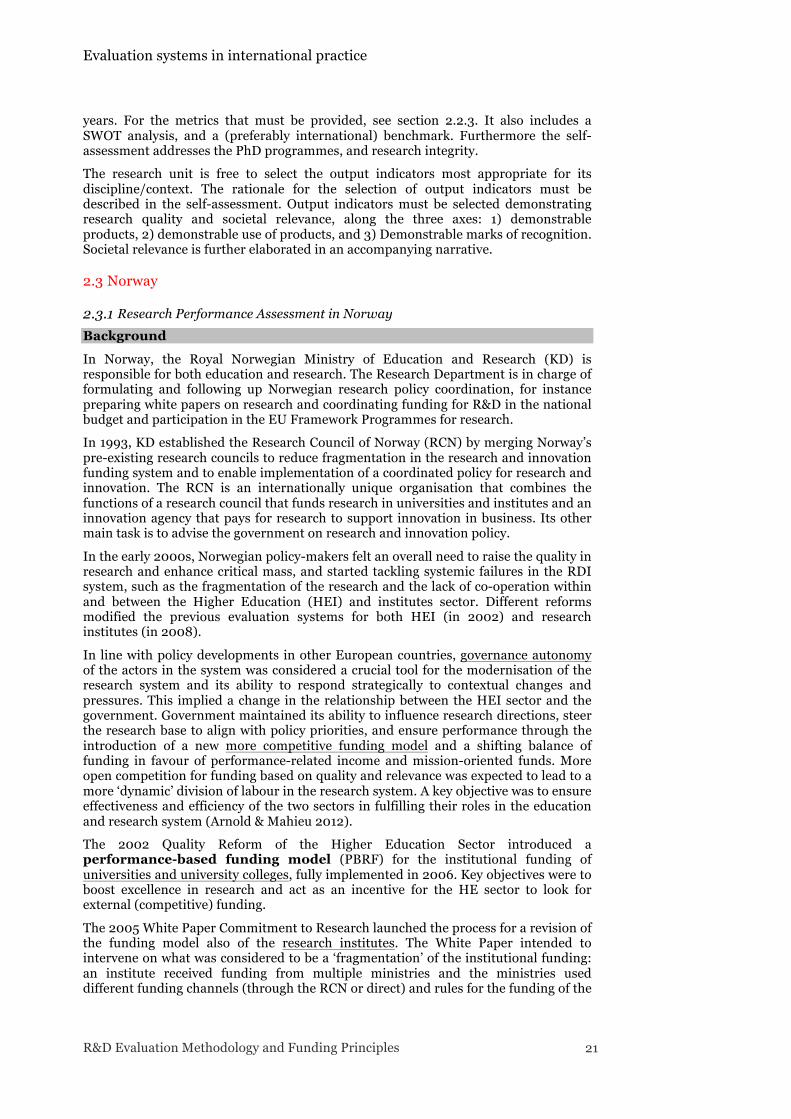
2.3 Norway
2.3.1 Research Performance Assessment in Norway Background
In Norway, the Royal Norwegian Ministry of Education and Research (KD) is responsible for both education and research. The Research Department is in charge of formulating and following up Norwegian research policy coordination, for instance preparing white papers on research and coordinating funding for R&D in the national budget and participation in the EU Framework Programmes for research.
In 1993, KD established the Research Council of Norway (RCN) by merging Norway’s pre-existing research councils to reduce fragmentation in the research and innovation funding system and to enable implementation of a coordinated policy for research and innovation. The RCN is an internationally unique organisation that combines the functions of a research council that funds research in universities and institutes and an innovation agency that pays for research to support innovation in business. Its other main task is to advise the government on research and innovation policy.
In the early 2000s, Norwegian policy-makers felt an overall need to raise the quality in research and enhance critical mass, and started tackling systemic failures in the RDI system, such as the fragmentation of the research and the lack of co-operation within and between the Higher Education (HEI) and institutes sector. Different reforms modified the previous evaluation systems for both HEI (in 2002) and research institutes (in 2008).
In line with policy developments in other European countries, governance autonomy of the actors in the system was considered a crucial tool for the modernisation of the research system and its ability to respond strategically to contextual changes and pressures. This implied a change in the relationship between the HEI sector and the government. Government maintained its ability to influence research directions, steer the research base to align with policy priorities, and ensure performance through the introduction of a new more competitive funding model and a shifting balance of funding in favour of performance-related income and mission-oriented funds. More open competition for funding based on quality and relevance was expected to lead to a more ‘dynamic’ division of labour in the research system. A key objective was to ensure effectiveness and efficiency of the two sectors in fulfilling their roles in the education and research system (Arnold & Mahieu 2012).
The 2002 Quality Reform of the Higher Education Sector introduced a performance-based funding model (PBRF) for the institutional funding of universities and university colleges, fully implemented in 2006. Key objectives were to boost excellence in research and act as an incentive for the HE sector to look for external (competitive) funding.
The 2005 White Paper Commitment to Research launched the process for a revision of the funding model also of the research institutes. The White Paper intended to intervene on what was considered to be a ‘fragmentation’ of the institutional funding: an institute received funding from multiple ministries and the ministries used different funding channels (through the RCN or direct) and rules for the funding of the

Evaluation systems in international practice
22 R&D Evaluation Methodology and Funding Principles
institutes within their field of expertise. Taking stock of the expertise and input from the HE sector and based upon a proposal by the RCN, in 2007 the Ministry of Education presented the main principles of a new performance-based funding system for research institutes, approved in December 2008 (Ministry of Education and Research 2009) and introduced with effect as of the fiscal year 2009 (Norges forskningsråd 2011).
Since 2010, data for the evaluations of the performance of the research organisations is collected in CRIStin (Current Research Information System in Norway). The system provides the data for the calculation of the PBRF metrics since 2012.
Research performance assessment in Norway is not limited to the PBRF system. In the Norwegian research governance system, the Research Council of Norway is the main body responsible for research evaluations and it regularly implements evaluations at the level of scientific disciplines. It also has responsibility for the evaluation of the research institutes, which it implements on a regular basis.
The preferred model for these evaluations is peer review, increasingly complemented with bibliometric data.
2.3.2 The design of the national evaluations The Research Council of Norway (RCN) carries out several types of evaluations:
• Subject-specific evaluations: provides a critical review of the research within defined fields and disciplines in an international perspective.
• Thematic evaluations: considering several fields and disciplines within a thematically defined area, in order to provide an overall assessment of the research/innovation within the field.
• Evaluation of programmes and activities: may either look at the scientific content of a programme, its achievement of goals, results or effects, or if the organizing of the programme is efficient in order to achieve the goal of the programme.
• Evaluation of instruments and application forms: for example programmes and centres, application types (e.g. competence projects). The purpose is to assess how the instruments/application types are working beyond a single programme or activity.
• Institute evaluations: describing status and pointing at potential for improvements for the institutes’ research activities in terms of scientific quality and relevance to society, stakeholders/funders and business community.
• Effect evaluations: RCN has several activities aimed at measuring effects of their initiatives, e.g. an annual survey of results/long-term effects of RCN’s support to innovation projects in the business community. Effects may also take part in the assessments in other evaluation schemes.
• Research based evaluations: RCN facilitates research based evaluations on behalf of several of the sector departments, where researchers/scientific expertise evaluate public reforms.
Norway does not have an integrated system of regular evaluations at the national level. Rather, RCN has the responsibility for a wide set of evaluation types that all in all is supposed to cover all research conducted in Norway. Nevertheless, we have on behalf of Norway, answered those questions in this report that are relevant to the national level. We do so by defining the subjects (e.g. medicine, sociology, physics) to represent the total Norwegian research in these fields (at national level). And our descriptions focus on the subject-specific evaluations, which are the most relevant in this context. In addition we provide some information on the institute evaluations.

Evaluation systems in international practice
R&D Evaluation Methodology and Funding Principles 23
Subject-specific evaluations (e.g. physics, medicine, political science) include relevant researcher groups taken from all relevant organisations, regardless of type (university, academic college, institute sector, university hospitals, etc.). Institute evaluations concern approximately 50 independent research institutions that all receive basic funding from RCN. In institute evaluations both single institutes or groups of institutes (defined as e.g. technical-industrial institutes, social science institutes, climate institutes) are being evaluated. The latter evaluation form, however, has been almost non-existent over the last ten years, but RCN has recently made a new plan for institute evaluations, and there are now ongoing evaluations.
The subject-specific evaluations are intended to be performed in 10-year intervals, and their assessments/recommendations have no direct effects on funding; it is not linked to the Norwegian performance-based funding system (PRF), which allocates research funds on a yearly basis based on a fixed set of indicators.
Strategic objective and purpose
• The purpose of the evaluations is to assess the research quality across research organizations, research institutes or scientific fields in an international context.
• The strategic objectives of the evaluation differ somewhat between subject-specific and institute evaluations. Subject-specific evaluations aim at improving quality and effectiveness of the research by providing the research organizations (RO) recommendations that may be used as tools in their strategic and scientific development work. The evaluations also contribute with information that RCN can use in their research strategy work. Institute evaluations aim at providing RCN and ministries a better knowledge base for developing a targeted and effective policy for the institute sector. Secondly, the institute evaluations shall assist in the designing, and funding framework, of the RCN’s joint tools towards the institute sector. Thirdly, the evaluations shall serve as a base of knowledge for the institutes in their strategic development.
Roles and responsibilities
• RCN is responsible for conducting evaluations on behalf of the council’s funding ministries, as well as an adequate and systematic follow-up of the recommendations in the evaluations. Subject-specific evaluations are carried out by an expert-panel appointed by RCN, which is also the case for the institute evaluations, although some of these evaluations have been conducted by other research institutes or consultancy firms following a tender process.
• RCN has designed the evaluation methodology. The scientific community, i.e. the evaluation units, are involved in the development of mandates for specific evaluations.
• There has not been a committee or a function in RCN that explicitly quality-assures the entire evaluation process. However, in the recent evaluation policy document (2013-2017) from RCN it is stated that RCN will establish an internal evaluation- and indicator group. This group will act as a discussion partner and competence centre in RCN’s work when making programme plans, terms of reference for evaluations, and in the follow-up of evaluations. RCN also lists three more points in their evaluation policy document: 1) the implementation of a process wheel for the evaluations that will provide the RCN with a more standardized/systematic way in their evaluation work. 2) The employees at RCN will be offered courses in evaluation methodology. 3) The RCN wishes to use national and international networks more actively in order to share experiences and highlight their evaluation activities.
• The research organisations are responsible throughout the entire process. Prior to the evaluations they are involved in planning the evaluation, suggesting members for the panels, in identifying their own researchers that are relevant, in making a self-evaluation and provide RCN with relevant background information

Evaluation systems in international practice
24 R&D Evaluation Methodology and Funding Principles
about the institution (and its staff). During the evaluation process they are expected to participate at meeting(s) with the evaluation panel (either site-visits or the research groups are invited to hearings/interviews with the panel elsewhere) and to assist the panel with required information. After the evaluation, they are expected to take part in the follow-up of the evaluation report.
Key features of the evaluation exercise
• The evaluations use a wide range of methods, but there are no common and formal guidelines for how the evaluations are to be conducted. The details of the methods (e.g. the self-evaluation form and the bibliometrics indicators, and what weight they have into the panel’s work) vary from one evaluation to another. This is a deliberate choice from RCN, so that the unique characteristics of each scientific field are taken into account.
• All subject-specific evaluations use metrics, bibliometrics, on-site visits/hearings with the research groups and self-evaluations. Peer review (i.e. panel members reading top publications) is not always conducted. The number of publications to be read differs between the evaluations. In some evaluations each researcher is asked to submit his/hers two best publications, in other, the institutions/department/researcher group is asked to submit its 5-10 best publications.
• The frequency of the subject-specific evaluations is mixed. Some examples: medicine was evaluated in 2000, 2004 and 2011. Political science was evaluated in 2002, but has not been evaluated since. Mathematics (2002 and 2012) and physics (2000 and 2010) have both been evaluated with ten years between each evaluation. The pattern seems to be a stronger regularity in the harder sciences. Institute evaluations are also conducted infrequently, i.e. how many evaluations that have been conducted (and how encompassing they have been).
• The period that is covered in the evaluations differs, but it is common that the preceding ten years are covered, with most emphasis put on the latest five years.
In Table 6 we indicate which methods that are used in the evaluations and the scope of assessment, i.e. the level at which the evaluation takes places/for which data is collected. In general, all evaluations draw upon a common set of methods: metrics, bibliometrics, peer review (remote) and self-evaluation. Peer review on site is not always conducted for practical reasons. The research organisations are invited to meetings at RCN instead.
In the subject-specific evaluations, the main units are in most cases the researcher groups (at the universities, but also including groups from hospitals and the institute sector when relevant). In some cases, there are no defined groups (e.g. the evaluation of philosophy and history of ideas in 2010) and the main unit is instead the departments, partly combined with review of the subfields as such (nation-wide) where some departments’ involvements in the subfields may be mentioned. The selection of units is based on adaptable size criteria, concerning e.g. the inclusion of research at multidisciplinary units, such as university centres and research institutes. This selection is done by RCN, after consulting what they believe are the relevant institutions for the evaluation.
In Institute evaluations, single institutes may be evaluated (example: evaluation of Norwegian Institute for Alcohol and Drug Research, 2006), or groups of institutes (example: evaluation of research institutes within climate/environment, ongoing).
• In e.g. the evaluation of social anthropology the criterion was that the included units should have at least 4 social anthropologists at either professor, associate professor, researcher I/II or post doc-level.
• In the evaluation of biology, medicine and health research, there were different inclusion criterions for different organization types. For example: in university departments and university hospital departments, it was specified that the unit

Evaluation systems in international practice
R&D Evaluation Methodology and Funding Principles 25
should have at least five scientific staff members (professor 1, associate professor) within each subject field (biology, medicine or health sciences), or at least five permanent staff members/clinicians with a doctoral degree and at least 40% of the work time devoted to research (similar to units from the institute sector: at least five researchers with at least 40% research time). Thus, the key factor in subject-specific evaluations s is that there is a research group present above a certain size. This is not so in most institute evaluations, where it is the research institute itself (level 1) which is that scope of assessment.
Table 6 Norway: Scope of the assessment - subject-specific evaluations
Metrics Biblio-metrics
Peer review - remote
Peer review - on site
Self-evaluation
Scientific field Level 1: Institutions (universities, research institutes)
Level 2: Faculties or departments in research institutes
X X X (X) X
Level 3: Research groups
(X) X (X)
Level 4: Individual researchers
(X) X (X)
Metrics and bibliometrics are collected at the level 1 in the institute sector and level 2 in the higher education sector. Bibliometrics is also sometimes collected at level 3, being derived from publication data on individual researchers either taken from the national publication system (Cristin) or in past evaluations (before Cristin), from the individual researchers’ CVs.
Peer review (remote) is conducted at levels 2-4, as the evaluation is based on metrics (level 2), self-evaluations (taking place at these levels); quality assessments concern the research groups in many evaluations (level 3), while the most important indicator in some evaluations (e.g. social sciences and humanities) is the reading of the researchers’ submitted works (level 4). Peer review on site is more difficult to tick in Table 1, as the panels talk to several representative of a unit. Self-evaluations are always carried out at the departments at the universities (level 2) and at the institute level at the research institutes (level 1).
Overview of the evaluation process
The starting point of any evaluation is an invitation to an informal information meeting from RCN to organizations/institutions which RCN considers to be potential participants in the evaluation (more obvious in institute evaluations compared to subject-specific).
At this meeting RCN presents a time schedule and tentative mandate (considered to be a ‘very early’ first draft, covering major headings/topics, but not much details). The participants at the meeting are allowed to suggest changes/new elements to the mandate. RCN is free to decide whether or not these suggestions are taken into account.

Evaluation systems in international practice
26 R&D Evaluation Methodology and Funding Principles
Mandate is decided upon and panel members/chair is appointed by the Division Board of the Division for Science17 at the RCN. All information about mandate and panel members is publically available.
The invited institutions suggest which researcher should be included in the evaluation, and/or the RCN provides them with selection criterions (for example: only including associate professors and higher positions).
Prior to the first meeting of the evaluation panel, the institutions must provide an information package for the panel. This consists of a self-evaluation, CVs of researchers and other factual information (annual reports etc.). In many evaluations, the panels are also provided with different background reports on the institutions and/or subject fields made by RCN or an external institution (for example by NIFU). Hence, most written background information is usually ready when the panel begins its work.
The numbers of panel meetings in subject-specific evaluations differ between scientific fields. In the humanities and social sciences, there are typically 3-4 meetings, while other fields are usually constrained to one meeting. The quantitative elements of metrics and bibliometrics seem to some degree to replace the need for meetings in these fields. In the most extensive subject-specific evaluation to date (biology, medicine and health research in 2011), the seven subpanels met once, in relation to the hearing with the evaluated institutions – an exercise that took each panel one week.
Throughout the evaluation process RCN assist the panel with practical matters and may participate at panel meetings in an observing role. The typical time-frame of an evaluation is 12 months – this is the case for both “small” evaluations (e.g. covering few institutions and relatively few researchers, for example human geography and sociology) and “large” evaluations (e.g. involving several sub-panels, covering many institutions, and several thousand researchers, for example the evaluation of biology, medicine and health research).
Approaching the end of the process, the institutions receive parts of the report for a quality-check of factual information concerning their own institution, i.e. they are not presented with any assessments made by the panel.
The final version of the evaluation report is then delivered to the Division Board of the RCN for approval (there are examples of the Board sending the report back to the panel for further work/clarifications). Once approved, the report is sent for hearing to the involved institutions, before being presented publically by the panel.
Based on the final report and the feedback from the hearing, RCN creates so-called follow-up panels to the subject-specific evaluations (with members from the evaluated units), who are to suggest specific follow-up activities at the national level – as well as identifying which bodies who ought to be responsible for conducting them. The follow-up panel’s report is then sent to the Board of Division.
In order to illustrate a typical subject-specific evaluation process, we describe the time schedule for the evaluation of social anthropology where the evaluation report was finalized in December 2010. The process, however, began in 2008.
• October 2008: information meeting about the evaluation with relevant institutions
• June 2009: institutions asked to provide RCN with factual information (CVs, publication lists, selection of scientific work to be reviewed). Deadline set in October 2009
17 This division is responsible for most of the subject-specific evaluations. For some cross-disciplinary subjects (as climate research) the panels are appointed by other division boards.

Evaluation systems in international practice
R&D Evaluation Methodology and Funding Principles 27
• January 2010: first meeting of the evaluation panel (out of four, where scientific discussions took place)
• January 2010: institutions asked to complete self-evaluation. Deadline set in March 2010
• June 2010: Meetings at RCN with the panel and the evaluated units (three days)
• August 2010: Factual parts of the evaluation report sent to the institutions for comments/quality check
• November 2010: Report finalized and sent to Division Board of the Division for Science
• April 2011: Report presented at RCN for RCN and the evaluated units
• June 2011: Follow-up panel appointed by RCN
• November 2012: Report from follow-up panel finalized
Costs of the evaluation exercise
We have not been able to estimate the full costs of the evaluation exercise.
For RCN, the costs vary greatly from one evaluation to the next. If RCN decides to establish an in-house secretariat to the panel, the budgeted costs will be lower compared to when someone from the outside serves this function, as the secretariat costs is the major cost-driver in RCN-evaluations. In addition to in-house costs, RCN covers fees for panel members and their travel costs. It is estimated that an evaluation within social sciences/humanities in total costs RCN somewhat in the range € 180.000 – 210.000. For larger evaluations (for example medicine) with sub-panels etc., the costs will be substantially higher. In RCN’s 2011 budget proposal, approximately € 810.000 was set of for the evaluation of biology, medicine and health research. For institute evaluations, RCN estimates that an evaluation of a group of 7-14 institutes will generate costs in the region € 180.000 to 360.000.
For the evaluated institutions, we believe that most of the costs will be attached to the making of the self-evaluations, which can be quite extensive (see chapter 1.4). Other costs related to providing written information (CVs, annual reports, etc.), participating with a few persons at a meeting at RCN (alternatively welcoming the panel to a site-visit), quality check of the factual parts of the report, and commenting on the final version of the report, are most likely relatively small compared to costs related to making the self-evaluation. In addition to this, the institutions involved in subject-specific evaluations contribute to the follow-up panels.
2.3.3 The metrics-based evaluation component in national evaluations The panel is provided with metrics-based information (statistics on staff and recruitment, budget situation, external funding, etc.) as well bibliometrics. None of the indicators listed in Table 2 has any direct influence on the overall assessments in the evaluations – again; it is the panel which decides which indicators they find important when they make their overall conclusions.
Evaluation criteria and indicators
Overview
In Table 7, based on our impression from reading several evaluation reports and mandates, we indicate which indicators are (usually) taken into account in the evaluations. We mark the cells with INS for institute evaluation for natural sciences (incl. medicine and technology), ISH for institute evaluation for social sciences and humanities, SENS for subject specific evaluation for natural sciences (incl. medicine and technology) and SESH for subject specific evaluation for social sciences and humanities.

Evaluation systems in international practice
28 R&D Evaluation Methodology and Funding Principles
Table 7 Norway: Indicators in the metrics-based component
Input criteria Third-party funding • National competitive funding All • International competitive funding All
• Contract research INS, ISH • Non competitive funding All Research staff (FTE) Systemic indicators International cooperation • In general All
• Within research community All • Research-education SENS,
SESH • Science-industry SENS.
INS • International mobility All National cooperation • Within research community All
• Research-education SENS, SESH
• National mobility SENS, SESH
Process indicators Knowledge transfer to the research system • Editorship in journals • Conferences etc
• Intra-research collaboration Knowledge transfer to education • PhDs / postdocs All
• Graduate teaching SENS, SESH
Knowledge transfer to enterprises & society
• Collaboration research-industry SENS, INS
Research outputs Publications All Other research outputs SENS,
INS, ISH Innovation outputs IPR INS Other innovation outputs INS Outcomes/impacts Research (cultural) Innovation (spinoff, incubators) INS Societal INS, ISH
Bibliometrics
In all evaluations, regardless of type and scientific field, the panel is being presented with bibliometric analyses covering issues such as research productivity (i.e. the number of publications/outputs) and research impact (i.e. through journal level in the Norwegian funding model, and sometimes even through ‘journal impact). In relevant

Evaluation systems in international practice
R&D Evaluation Methodology and Funding Principles 29
scientific fields (that is, all fields except social sciences and humanities) the bibliometric analysis also includes citation analyses.
Several bibliometric indicators have been used in the evaluations. RCN does not decide on which the panels must use, they choose themselves, and thus the selection of indicators vary between the evaluations.
Some examples: number of fractionalized publications, number of fractionalized publications per man-year, average journal impact factor, citation index (journal), citation index (field): used in evaluations of e.g. physics, and biology, medicine and health. In evaluations of sociology, social anthropology and human geography citation indicators were not used, rather number of publications (and fractionalized publications), both in crude numbers and per researcher. All bibliometric analyses contain information about publishing on level 1 vs 2 in the Norwegian funding model, and shares of international co-publications.
In ‘hard sciences’, WoS is mostly used. In ‘softer sciences’, a national database (Cristin) is used because it has a broader coverage of journal and document types than WoS (covers monographs and anthologies too).
Table 8 Norway: Sources for bibliometrics analysis Sources Use for scientific fields
National identification list of journals/ publishers Used in all scientific fields (covering journals not indexed in WoS, and monographs and anthologies).
International database • Scopus
• WoS Used in all scientific fields (but of lesser relevance in social sciences and humanities)
• Others NIFUs doctoral degree register
Evaluation processes
The data collection & quality
The evaluated research organisations submit their data to RCN prior to the first panel meeting (or shortly after). Although many evaluations focus on researcher groups, it is the head of department/institute director that is responsible for the submission.
In addition to this, NIFU/national databases has often provided RCN with background information at both national and institutional level concerning staff, recruitment, phd’s, etc. This information has then been quality checked by the institutions (e.g. the adequacy of subject delimitations), as opposed to the self-evaluations, where the institutions themselves are responsible for the quality of the content.
As far as we know, there are no formal processes and rules to ensure the quality of the input from the institutions. If the input is inadequate, the panel may – through RCN – ask for more/improved input.
Table 9 Norway: Data collection & quality assurance Method for data collection
Annual reports by the institutions X
Submission in the national research information system This is done independent of the evaluations
• By institution
• By head of research unit
• By individual researcher

Evaluation systems in international practice
30 R&D Evaluation Methodology and Funding Principles
Harvesting from other RIS NIFU/RCN or others summarize statistics from various national databases
• Institutional information systems
• Publication repositories
• Other information systems
Rules & tools for quality check of the input
Responsibility institution / submitter, ev. Guiding procedures
X
Central checking procedures
Close collaboration central - institution
Direct observation (peer review panel) X
Scoring and use of the data
How are the different outputs and outcomes scored? Firstly, there is a difference between scientific fields, where evaluations in the fields of arts, humanities and social sciences seldom use quantitative scoring – the verdicts of the research units being evaluated are qualitatively described only (although partly based on metrics and bibliometrics).
Evaluations in hard sciences typically use a 5-point scale: Excellent (5), very good (4), good (3), fair (2) and weak (1) in describing scientific quality and productivity.
In describing relevance and impact of the research organizations, the following 5-point scale has been used in some evaluations: Very high relevance and impact (A), High relevance and impact (B), Good relevance and impact (C), Low relevance and impact (D), and Very low relevance and impact (E).
The scoring system represents a quantification of the panel’s qualitative assessments of all information retrieved during its work. Thus, the scoring system is not affected in any way by publications being co-published by many research organizations. Whether or not publications are fractionalized based on author addresses in publication analyses also differ from one evaluation to the next.
The performance of the evaluated unit is compared to the performance in the scientific field at the international level. In a few evaluations, the Nordic level is also given attention (e.g. evaluation of Norwegian law research).
2.3.4 The peer review component in national evaluations Top down versus bottom up organisation of review process
The Research Council of Norway – acting on behalf of its funding ministries, and specified in the Council’s mandate – is the responsible agency for the implementation of the peer review process.
In theory, participation in the subject-specific review is optional for the research organisations, but in reality, any “problems” work the other way, i.e. smaller units would like to be included in the evaluations, but may be excluded by RCN because they do not fulfil the necessary criterions for getting included. It has, however, happened that a research group from a research institute has declined to take part, based on the argument that although they fulfilled the selection criterions used by RCN, their researchers do not work specifically within the discipline being evaluated, so that it would not be appropriate for them to take part. Individual researchers can, and do sometimes, choose not to be included. This means that they do not send in their CVs to RCN. In institute evaluations, it seems unthinkable that organizations receiving basic funding from the RCN would decline to participate.

Evaluation systems in international practice
R&D Evaluation Methodology and Funding Principles 31
The review guidelines are comprehensive, covering scientific quality as the main topic, but with several underlying components to be investigated in order to analyze differences in quality (e.g. internationalization, doctoral training, recruitment, economy, etc.), and in the institute evaluations also the institutes role in society and fulfillment of their specific aims. The panels are allowed to add new elements to the review guidelines if they feel so. RCN do sometimes use phrases such as “relevant topics can be…”, leaving the final decision on what to be investigated up to the panels. In some mandates, the panel is encouraged to investigate other topics that they may find relevant.
The research organizations have some (informal) influence regarding the specific elements of the review process, i.e. they are invited to a pre-evaluation meeting with RCN where a draft of the mandate is presented, and the organizations may suggest changes in the draft, topics that should be considered. RCN considers it important that the evaluated units have an influence on this, to give legitimacy to the evaluation process, and because it is important that the evaluation covers issues that are important to the evaluated units (who, after all, will use the recommendations in their future strategic work).
The reviews may both have direct and indirect implications e.g. for funding decisions. There are many examples where recommendations in the reviews have led the RCN to channel research funds directly to efforts at the national level. The institutions themselves may also act directly upon recommendations in the evaluation reports (for example the establishing a phd-school in economics at the Norwegian School of Economics, following recommendations in the evaluation of Norwegian economics). RCN’s main impression is that the indirect effects of the evaluation reports are more frequent. That is, it is rarely one, but the sum of many evaluation reports that lead to large national initiatives funded/coordinated by RCN, such as the establishment of several Centers of Excellence or the strengthening of FRIPRO (RCN’s scheme for researcher initiated/independent projects).
Criteria and indicators
The assessment criteria used by panels differ, due to differences in mandate. In ‘harder’ sciences research quality is typically operationalized as high citation rates, publishing in prestigious journals (or so-called level-2 journals in the Norwegian funding system). In social sciences and humanities quality is more defined through the panel’s reading of the researchers selected top-publications submitted to RCN. Most evaluations seem to highlight indicators such as international co-authorship and the productiveness of the researchers. The institute evaluations are less oriented at the research outputs, but also focus on the societal role/relations to business community/usefulness for public agencies, etc.
Many evaluations do not use a scoring system at all, while some evaluations use a five-graded scoring system (see chapter 1.2.2) defined by RCN, but some panels also make up their own scoring system – e.g. the social anthropology panel giving scores to the submitted scientific works on a 1-5 scale, based on four dimensions: 1) the main objective, 2) the use of ethnography, 3) the quality of the argument, 4) the overall contribution to anthropology. Based on this, each unit in the evaluation was given an average quality score based on the material that the panel had read. In the evaluation of biology, medicine and health sciences (2011) a rather detailed criteria for grading was given:
• Excellent: Research at the international front position: undertaking original research of international interest, publishing in internationally leading journals. High productivity.
• Very good: Research with high degree of originality, but nonetheless falls short of the highest standards of excellence. A publication profile with a high degree of publications in internationally leading journals. High productivity and very relevant to international research within its sub-field.

Evaluation systems in international practice
32 R&D Evaluation Methodology and Funding Principles
• Good: Research at a good international level with publications in internationally and nationally recognized journals. Research of relevance both to national and international research development.
• Fair: Research that only partly meets good international standard, international publication profile is modest. Mainly national publications. Limited contribution to research.
• Weak: Research of insufficient quality and the publication profile is meagre: few international publications. No original research and little relevance to national problems.
All panels are provided a broad range of both qualitative and quantitative data and what to give weight to in the balance between qualitative and quantitative criteria is up to the panel to decide. Based on reading several evaluation reports, our impression is that the quantitative criterions were given most weights, e.g. in the evaluation of biology, medicine and health sciences (2011) where the conclusions of the panel in many cases were directly derived from the bibliometric report. However, the panels’ recommendations seem to be more based on a mix of their overall impression of both the qualitative and the quantitative information they have received.
The evaluations seem to address the challenges of disciplinary cultures between disciplines. The approach seems to be to split the evaluation into different sub-panels in order to compare like-with-like in the larger evaluations. Still, in subject-specific evaluations, the applied research institutes are largely compared to university units based on scientific publishing, which is not always the main publishing form in applied research in Norway.
The peer review process is an informed peer review, i.e. the reviewers are provided beforehand with bibliometrics or self-evaluations, or very early into the evaluation process.
The Self-evaluation is the starting point for the peer review assessment although it may sometimes be given to the panel shortly after the evaluation has begun.
Scientific quality or scientific excellence has different definitions from one evaluation to the next. In the evaluation of social anthropology it was related to issues such as originality and contribution to the field, whereas in medicine it seemed to be defined by the citation impact, and in engineering science it was defined as “research groups that have achieved a high international level in their research or have potential to reach such a level”. Based on reading of several RCN evaluation reports, scientific excellence is, however not defined beyond whether or not the research groups publish in leading journals, or whether their publications are highly cited.
Societal impact is an expression that is rarely used in the mandates. Rather, they frequently ask the panels to address relevance. This does not have a clear definition. In the evaluation of engineering science, there were five points illustrating relevance: 1) Do the research have a high relevance judged by impact on society, value added to professional practice, and recognition by industry and public sector? 2) Does the research group have contracts and joint projects with business and public sector, are they awarded patents, or do they in other ways contribute to innovation? 3) Does the research group contribute to the building of intellectual capital in industry and public sector? 4) Do they play an active role in dissemination of their own research and new international developments in their field to industry and public sector? 5) Do they play an active role in creating and establishing new industrial activity? In the evaluation of climate research the mandate defined relevance as: “Relevance to the challenges to society; relevance of research for Norwegian and international climate policy priorities in light of what the evaluation committee views as key challenges in climate research and knowledge needs of industry players and others in society”.
In the recent evaluation of climatic research, relevance to society should be discussed in the self-evaluation: “This section should discuss the relevance of your climate

Evaluation systems in international practice
R&D Evaluation Methodology and Funding Principles 33
research to society. You may distinguish between specific target groups and society as a whole. Issues you may wish to address here include the following:
• Relevance of your research for the international scientific community
• Interactions with target user groups
• The application of your research results by your target user groups
• The extent to which your research has contributed to (or resulted) in any changes to policy, standards, plans, or regulations
• Your participation in national and international climate related policy processes
• Possible conflicts or synergies between relevance and scientific quality.
The main issue of the evaluations is the quality of the research, but in the reports the panels devote much attention to organisational issues, such as recruitment strategies, internationalisation, economy, and other topics they find relevant in explaining today’s quality or future challenges. One special case is the institute evaluations where fulfilment of national responsibilities and use to stakeholders (ministries, etc.) is a major issue.
2.3.5 Staffing of panels Panel chairs, panels (and sub-panel members) are appointed by the Division Board of the Division for Science at the RCN. All panel members are checked for possible conflicts of interest.
The staffing of panels takes into account:
• Multidisciplinarity, i.e. making sure that core sub-fields of the discipline(s) are covered by the panel.
• Gender
• No bias
• Geographic distribution (international reviewers), i.e. all panels in recent years in subject specific evaluations have had, as far as we know, only international members (while Norwegians are frequently members of panels in the institute evaluations).
• Non-academics and users of research have, as far as we know, only been represented in panels evaluating institutes – not in the subject specific evaluations.
The size of panels differs from evaluations in social sciences and humanities (typically five members) and all other panels (typically 7-8 members).
Formally the panel decisions are collective and consensus-based. The experts in the various subfields may however be decisive for the scoring of the groups in their subfield (i.e. the consensus procedures in the panels may conceal actual minority conclusions).
Structure of panels and sub-panels
Main and subpanels seem to be coordinated by a main panel consisting of one member (not necessarily the leader) of the different subpanels’. In the evaluation of biology, medicine and health research (2011), each of the seven subpanels were represented by the subpanel leaders in the main panel, though.
Since each subpanel is represented in the main panel, coherence of the overall approach, review and outcomes seems to be assured. RCN also provide the subpanels with the same guidelines.

Evaluation systems in international practice
34 R&D Evaluation Methodology and Funding Principles
An illustration of this is provided in the mandate for the evaluation of basic and long term research within engineering and science in Norway 2014: the evaluation will be carried out by an international Evaluation Committee consisting of three sub-panels. Each panel will carry out the evaluation in their field of expertise: 1) Energy and process technology, 2) Product, production, project management, marine systems and renewable energy, 3) Civil engineering and marine structures. The principal evaluation committee will consist of the leader and one member from each sub-panel. The principal evaluation committee is requested to compile a summary report based on the assessments and recommendations from the three sub-panels. This report should offer an overall assessment of the state of the research involved. The report should also offer a set of overall recommendations concerning the future development of this research.
Division of roles
Division of roles is described in chapter 1.1.2.
RCN is responsible for the evaluation report, e.g. the funding of the evaluation, and final accountability for the review report, as it is both approved and published by RCN.
It is difficult to describe the specific roles of the chair and of disciplinary experts as this is the result of internal processes within each panel. Normally, the panels are assembled of people with different expertise so that they would cover all major topics (e.g. within psychology and psychiatry). Each member has a special responsibility for ‘their’ fields – but no decision power.
The evaluated units have the right to ask for cross-referrals (i.e. the assignment to other sub-panels) before the evaluation begins, but this is discussed with RCN who may decide against.
Concrete activities of panel members
The review includes the following activities:
• Participating at meetings in Oslo (at RCN)
• Participate in academic discussions
• Site visits (although the evaluation units are often invited to meetings held at RCN instead of hosting meetings with the panels)
• Reading material (selected top publications, self-evaluations, bibliometrics, other reports on relevant R&D statistics)
• Writing assessment reports on their subfields (and in some cases assigned parts of the main evaluation report/overall topics, although this in most cases is done by the chair of the panel with his/hers scientific secretary appointed by RCN)
• Present final reports at RCN (only mandatory for chair of panel)
The scientific secretary of the panel (either an externally appointed secretary or someone from RCN), provides assistance to the evaluation committee and facilitates its activities as agreed with the chairperson of the committee and the RCN. In cooperation with the committee, the secretary will e.g. draw up a progress plan for the committee’s activities; plan, prepare and summarise the meetings of the committee; prepare the data collection, provide the data needed and adapt the data for use by the committee; draw up an outline for the evaluation report, and to various degree write the first draft, incorporate the contributions of the committee members, and finalise the report. The latter tasks are decided upon by the panel leader.
Timing & budget
As stated in chapter 1.1.5 we are unable to provide full budgets for the reviews.
Officially, the subject-specific evaluations are conducted about every ten years. The institute evaluations more infrequent.
Transparency

Evaluation systems in international practice
R&D Evaluation Methodology and Funding Principles 35
The objectives and rationale of the review are transparent. From the same day that a panel is being established, both the names of the panel members and their mandate are made public by RCN.
Most documents throughout the process are publicly available, e.g. bibliometric analyses, reports on R&D statistics, etc. The institutions’ self-evaluations are not made public (and not the CVs of researchers from the units being evaluated).
The results of the evaluations are publicly presented by RCN, and the reports made public too. The scientific community is encouraged to discuss the reports in order to follow up recommendations. The evaluations do not, however, receive much attention from media.
Evolution of the review process
Over a longer time-span the RCN has become more interested in learning and understanding more than in control. As stated in their evaluation policy document (2013-2017): The rationale for conducting evaluations has changed over time. Former evaluations focused on control and legitimacy of initiatives, while the purpose today is more understanding and learning as a basis for future action plans, strategies and policy development.
Evaluations in the past demanded more work for the institutions in providing RCN with statistics, publication data, etc. Today, some of this is available through national databases, so that the total work load upon the institutions has decreased.
The change is probably more reflected in RCN’s internal follow-up of evaluations, than in the mandates of the evaluation panels. RCN today has a more structured and systematized way of both conducting and following up evaluations.
Since learning and quality development are the key outcomes today, focus is more on the national level (i.e. the sum of all involved institutions), than on the institutions themselves.
Weaknesses and criticism
In Technopolis’ evaluation of the RCN (2011), an historical review was provided on criticism raised towards the evaluation system. The conclusion from this review was that the evaluation system has improved over time and that the ROs being evaluated are more positive towards RCN’s evaluations now than they were 10-15 years ago.
Back in 2004, a NIFU-STEP report18, concluded that the communities evaluated broadly disagreed about the value of the evaluation studies, but appeared (back then) to be increasingly finding the discipline evaluations to be showing a fair picture of the evaluated objects. Especially for evaluations undertaken early in the 2000s, the work method was considered ineffective and/or the researchers were dissatisfied with the contact established with the evaluation team. In 2011, Technopolis overall impression was that the institutions believed they had good value of the discipline evaluations, which “were seen as one of the few genuine sources of ‘advice’ RCN provides to the research-performing institutions”. Stakeholders surveyed in the context of the RCN evaluation in 2011 confirmed the positive trend in quality and value of the scientific discipline evaluations. Overall, significant improvement in the processes and underlying methodologies was noted compared to the evaluations of ten years ago; the quality of the evaluations was stated to be very variable, though.
Some criticism was voiced related to the value for the institutions of big-size evaluations such as the recent evaluation of Biology, Medicine and Health Sciences
18 Brofoss KE: En gjennomgang av Forskningsrådets fagevalueringer. NIFU-STEP Arbeidsnotat 7/2004.

Evaluation systems in international practice
36 R&D Evaluation Methodology and Funding Principles
(2011), involving 3000 researchers. The peer review panels could dedicate only highly limited time to each research unit included in the evaluation.
Since many of the subject-specific evaluations involve research institutions from the institute sector, some of the units heavily involved in applied research, have claimed that they have not been evaluated on their own terms, and that the evaluations fail to distinguish between their research profiles and that of the universities. RCN explicitly states, though, that it is the quality of the research that is the key element, but some of these units may appear weak when studying indicators such as publication volumes, since much of their research is in reports etc., which is not picked up in analyses using scientific publishing in the denominator.
A number of interviewees argued that there is a systematic problem in using professors from abroad who do not understand structures and needs in Norway. Some institutions have argued that the description of them has been inaccurate or not detailed enough. Seen from RCN’s point of view, the institutions must keep in mind that it is the overall quality of the whole scientific community that is the main level of analysis in the subject-specific evaluations.
Best practices and lessons learned
In Technopolis’ evaluation of RCN (2011), interviewees highlighted the positive follow-up to field evaluations within RCN. The subject-specific evaluations are said to have driven big and useful changes in RCN research directions and programmes funded, triggered programmes and schemes like FUGE and the Centres of Excellence, and influenced the design of new or follow-up programmes. Several interviewees also referred to important effects of the discipline evaluations on research strategies and reorganization within their institutions. Field evaluations were considered to give useful signals about quality and had influence on how faculties and departments worked – at least at the overall level.
RCN has recently made a new evaluation policy plan (at a general level), as well as a new plan for institute evaluations. The main impression is that RCN is working well in making their evaluation designs more structured, and their internal follow-up more coordinated across divisions at RCN.
2.3.6 Self-evaluation in national evaluations The RCN does not have a standard formula for self-evaluations. What the institutions are requested to provide information about varies depending on the mandates of the evaluations. This is seen as a strength by RCN, because it allows the guidelines for self-evaluations to be made specifically for different fields or institutional types, thus being more relevant for those under evaluation, taking their uniqueness into account.
The self-evaluations are meant to present a critical review of the units’ current status, pointing at current and future challenges. Further guidelines are not uniform, i.e. they vary between evaluations.
Since the self-evaluations are so different from one evaluation to another, we illustrate with two guidelines provided to the institutions in two subject-specific evaluations:
Evaluation of Norwegian Climate Research:
Quality of research: This section should explain the scientific quality of your climate research results. For this purpose, the climate-related scientific publishing of your institute/department should be discussed. Please attach your unit’s list of publications within climate research, for the period 2001–2010 (see specification attachment 1 below). Please describe and comment on your choice of publication channels, your national and international co-authorship and the impact of your publications. Please comment on your selection of the 5–10 most important climate research articles in international peer reviewed scientific journals (2001–2010) (see specification attachment 2 below).

Evaluation systems in international practice
R&D Evaluation Methodology and Funding Principles 37
Capacity: This section is intended to discuss issues related to the research capacity of your institute/department for climate research. Please describe and comment on past experiences and present efforts regarding: the number of climate researchers at your unit; funding of climate research; climate research infrastructure; and, recruitment and mobility of your climate researchers. What are the strengths of your research unit? Are there any bottlenecks that impact progress? We suggest that you include the following issues (you can add others that you feel are relevant here):
• Recruitment and development of a new generation of researchers;
• masters programmes (if relevant);
• involvement of PhDs and post-doctoral research fellows;
• core funding vs. external programme/project funding;
• short-term funding vs. long-term funding;
• main funding schemes/instruments, both national and international; and,
• participation in national and international research infrastructure (e.g. in climate research related ESFRI research infrastructures).
Strategic focus: This section should explain/describe the strategic focus of your climate research in the past, present and future, and how this is related to the three thematic climate research areas specified in the mandate of this evaluation. Please explain how climate research fits into the overall activities of your department/research institute. You may wish to address the following issues:
• the thematic focus of your climate research
• the disciplinary and methodological approaches used in your climate research;
• your experiences with, and need for, interdisciplinary climate research;
• your main contribution to addressing climate research policy priorities with regard to thegaps defined by the IPCC; and,
• your contribution to strengthening the knowledge base that informs climate policy.
In this context the evaluation committee wants to explore also how the Research Council of Norway and its different research programmes have contributed to the development of a strategic focus in Norwegian climate research. You may wish to comment on the following issues:
• the importance of NORKLIMA for your research;
• the importance of IPY for your research; and,
• the administration of climate research by the Research Council of Norway in general and by NORKLIMA specifically.
Research partnerships – national & international: This section should explain/describe your national and international research collaboration networks. Please discuss your role (leadership vs. participation) in national and international research collaboration networks, your priorities for such collaboration and what these collaborations have meant to the development of your climate research. You may wish to comment on the following issues:
• your main national research partnerships;
• the impact of national competition for funding on national collaboration;
• your main international research partnerships in European, Nordic and international climate change research initiatives, such as EU FP7, ERA-Nets,

Evaluation systems in international practice
38 R&D Evaluation Methodology and Funding Principles
Nordic networks, Top level research initiative, Joint Programming Initiatives, ESFRI Research Infrastructures;
• your participation in the international global change research programmes (i.e., WCRP, IGBP, IHDP, DIVERSITAS, IPY) and your view of the importance of such initiatives;
• the engagement of researchers at your department/research institute in IPCC assessments and other relevant international assessments; and,
• shaping future research priorities: involvement on planning of national, Nordic, European and international science policies, research priorities, funding instruments, etc. (e.g., participation in EC’s Horizon 2020 development).
Communication with stakeholders: This section should explain/describe you communication with stakeholders. Communication with stakeholders can have different purposes, such as the discussion of a research agenda, the formulation of research questions, the development of new knowledge, instruments or techniques and the dissemination of research results. Communication can be interactive or one-way. Please describe how these communications have evolved, what their purpose is and assess their impact. You may wish to comment on the communication with:
• public agencies or policy makers at national, regional or local level;
• specific groups which might be highly exposed to climate change, or which might beinstrumental in implementing adaptation actions (e.g., land owners, farmer’s associations, the Sami people);
• the private sector;
• non-governmental organisations, and,
• how such communication processes have been integrated within an interdisciplinary research framework.
Relevance to society: This section should discuss the relevance of your climate research to society. You may distinguish between specific target groups and the society as a whole. Issues you may wish to address here include the following:
• relevance of your research for the international scientific community;
• interactions with target user groups;
• the application of your research results by your target user groups;
• the extent to which your research has contributed to (or resulted in) any changes to policy,
• standards, plans, or regulations;
• your participation in national and international climate related policy processes; and,
• possible conflicts or synergies between relevance and scientific quality.
What next? This section should discuss your future plans for addressing identified strengths and weaknesses and possible opportunities and threats. Please describe your strategy or plan on climate research. You may wish to discuss plans for changes regarding:
• strategic focus,
• capacity development,
• cooperation patterns, and,
• interaction with target user groups the coming 5–10 years.

Evaluation systems in international practice
R&D Evaluation Methodology and Funding Principles 39
Recommendations: This final section gives you the opportunity to make recommendations for the further development of Norwegian climate research. Please discuss the main challenges for Norwegian climate research, the future needs for climate-related knowledge, and how Norwegian climate research policy should address these challenges and knowledge needs. You may wish to comment on the scope and focus of climate research funding instruments, the support for climate research infrastructure, cooperation with stakeholders and the international research community and relevance to society, among other issues. Please give some recommendations on how the Research Council of Norway should administer climate research in the future. In particular, describe any actions by the Research Council of Norway that you think necessary to minimise threats to your plans or develop opportunities for their success.
Evaluation of Chemistry (2009):
General aspects:
• Which fields of research in Chemistry have a strong scientific position in Norway and which have a weak position?
• Is Norwegian research in Chemistry being carried out in fields that are regarded as relevant by the international research community?
• Is Norwegian research in Chemistry ahead of scientific developments internationally within specific areas?
• Is there a reasonable balance between the various fields of Norwegian research in Chemistry, or is research absent or underrepresented in any particular field? On the other hand; are some fields overrepresented, in view of the quality or scientific relevance of the research that is being carried out?
• Is there a reasonable degree of co-operation and division of research activities at national level, or could these aspects be improved?
• Do research groups maintain sufficient contact with industry and the public sector?
Academic departments:
• Are the academic departments adequately organised?
• Is scientific leadership being exercised in an appropriate way?
• Do individual departments carry out research as part of an overall research strategy?
• How is the balance between men and women in academic positions?
Research groups:
• Do the research groups maintain a high scientific quality judged by the significance of contribution to their field, prominence of the leader and team members, scientific impact of their research?
• Is the productivity, e.g. number of scientific and Ph. D. thesis awarded, reasonable in terms of the resources available?
• Do the research groups have contracts and joint projects with external partners?
• Do they play an active role in dissemination of their own research and new international developments in their field to industry and public sector?
• Do they play an active role in creating and establishing new industrial activity?

Evaluation systems in international practice
40 R&D Evaluation Methodology and Funding Principles
• Is the international network e.g. contact with leading international research groups, number of international guest researchers, and number of joint publications with international colleagues, satisfactory?
• Do they take active part in international professional committees, work on standardization and other professional activities?
• Have research groups drawn up strategies with plans for their research, and are such plans implemented?
• Is the size and organization of the research groups reasonable?
• Is there sufficient contact and co-operation among research groups nationally, in particular, how do they cooperate with colleagues in the research institute sector?
• Do the research groups take active part in interdisciplinary/multidisciplinary research activities?
• How is the long term viability of the group evaluated in view of future plans and ideas, staff age, facilities, research profile, new impulses through recruitment of researchers?
• What roles do Norwegian research groups play in international co-operation in individual subfields of Chemistry? Are there any significant differences between Norwegian research in Chemistry and research being done in other countries?
• Do research groups take part in international programmes or use facilities abroad, or could utilisation be improved by introducing special measures?
Research infrastructure incl. scientific equipment:
• How is the status and future needs with regard to laboratories and research infrastructure?
• Is there sufficient co-operation related to the use of expensive equipment?
Training and mobility:
• Does the scientific staff play an active role in stimulating the interest for their field of research among young people?
• Is recruitment to doctoral training programs satisfactory, or should greater emphasis be put on recruitment in the future?
• Is there an adequate degree of national and international mobility?
• Are there sufficient educational and training opportunities for Ph. D. students?
Future developments and needs: The Committee’s written report is expected to be based on the elements and questions above. The assessments and recommendations should be at research group-, department-, institutional and national level.
Miscellaneous: Are there any other important aspects of Norwegian research in Chemistry that ought to be given consideration?
2.3.7 The PRFS models Different models for different actors
In the Norwegian system, PBRF models have been developed taking into account the characteristics and missions of the actors in the system, i.e. HEIs, hospitals and research institutes.
For the HEI sector, the funding of the institutions consists of three main components: the basic funding, a teaching component and a research component.

Evaluation systems in international practice
R&D Evaluation Methodology and Funding Principles 41
The research component: is made up of two parts – a strategic grant and a performance based component. The strategic grant is mainly made up of funds for phd-positions and scientific equipment. The performance-based component is based on four indicators (weights and value for money in 2014):
• Doctoral degree candidates - 30%
• 0,18 Grants from EU’s framework program for research (and related EU activities) – 18%
• Funds from the Research Council of Norway and regional research funds - 22%
• Publication points – 30%
The publication points are calculated using the following weights:
Table 10 The publication indicator – components (2014) Scientific publications
Weight level 1
Weight level 2
NOK level 1 NOK level 2
Articles in scientific journals
1 3 31 290 NOK 93 870 NOK
Articles in anthologies
0,7 1 21 903 NOK 31 290 NOK
Monographs 5 8 156 540 NOK 250 321 NOK
Publications are fractionalized by author addresses. Publication channels at level 2 constitute the most prestigious journals/publishers, and the share of publications in these channels represents approximately 20 per cent of all publications.
Unlike the teaching component, the research component has a fixed frame, i.e. how much each institution will get depends both on its own, as well as the production of all other institutions. On average, the research component constitutes 15 per cent of the HE’s funding, but with large variations between the four types of institutions in the sector. Universities have by far the highest relative share (23 per cent).
There is no direct funding from the Ministry of Health and Care Services to hospitals (except for some special budget posts related to competence centers, national registries, etc.). Practically, all funds are channeled through the four Regional Health Authorities (RHA) who distribute research funds to individual hospitals. Most of R&D funds at hospitals are channeled as basic funding via the RHAs.
In 2014, total budget for the four RHAs were 118,3 billion NOK, of which 1,083 billion was a specific research grant. Of this sum 30 per cent is a core research grant, whereas 70% (453 million NOK) was distributed based on a PBRF-model similar to the publication component in the HE-sector. The major difference lies in how much money one publication point generates. In the hospital sector one publication points was worth three times as much as in the HE-sector (102 501 NOK versus 31 290 NOK). The health care sector has one component in its research indicator that the HE sector has in its teaching component: completed phds. In the health care sector one phd equals three publication points (=307 503 NOK in 2012).
The publications are fractionalized by author addresses. In addition there are two more components in the calculation: publications co-written with international institutions give a weight of 2,5 and publications co-written with hospitals from other RHAs in Norway give a weight of 1,25.
The research institutes are mainly funded from external incomes. They also receive a core funding, of which a certain proportion is based on a PBRF-model (weight in parentheses):

Evaluation systems in international practice
42 R&D Evaluation Methodology and Funding Principles
• Scientific publishing (30 percent) (the publications are fractionalized: if a publication is co-authored with other national or international institutions, a weight of 1.25 is given)
• Completed doctoral degrees (5 percent)
• International funding (20 percent)
• National (competitive) funding (45 percent)
The institutes are distributed across four arenas, based on their scientific portfolios and users. Ministry of Education and Research decides which arena each institute should belong to following advice from RCN. Four ministries have the responsibility for the institutes’ basic funding, within their sector:
• Environmental institutes (Ministry of Climate and Environment)
• Primary industry institutes (Ministry of Agriculture and Food, and Ministry of Trade, Industry and Fisheries)
• Social science institutes (Ministry of Education and Research)
• Technical-industrial institutes (Ministry of Trade, Industry and Fisheries)
The responsible arena department suggests a total budget frame for their arenas, as well as how much of the budgets should be distributed based on results (PBRF). In addition to the basic funding, the institutes may also receive a strategic institute grant.
Table 11 Funding of the institute sector, mill NOK (2013) Sector Basic
funding (excl. strategic institute grant)
PBRF (%) Strategic institute grant
% public funding of total funding
Environmental institutes
102,4 5,0 64,7 15,0
Primary industry institutes
267,0 2,5 7,6 16,0
Social science institutes
159,0 10,0 0,0 15,0
Technical-industrial institutes
234,8 10,0 24,8 5,9
The primary industry institutes have by far the lowest share of the basic funding being distributed following performance indicators -just 2.5 per cent.
Publication points
For all research organisations, part of the funding depends on share of total publications. The publication indicator covers all disciplines and all scholarly publication forms. A weighting system was introduced to take into account field-specific publication patterns as well as to foster publications in high-quality publication channels.
There are two dimensions in the weighting system: on the one hand, three main publication types are defined and given a different weight (articles in ISSN-titles, chapters in books – ISBN – and books – ISBN). On the other hand, the publication channels are divided into two levels; the highest quality level (level 2) consists of publication channels that are regarded as the leading and most prestigious ones in their field by the scientists themselves (Sivertsen 2010).

Evaluation systems in international practice
R&D Evaluation Methodology and Funding Principles 43
The categorisation is revised annually in collaboration between the national councils in each discipline or field of research and the National Publishing Board. The publication points are as follows:
Table 12 Norway: System points for publications
Channels at level 1 (normal) Channels at level 2 (high) Articles in ISSN titles 1 3 Articles in ISBN titles 0.7 1 Books (ISBN titles) 5 8
2.3.8 Entitlement to institutional funding HE-sector: Institutions are accredited by an agency called NOKUT (Norwegian Agency for Quality Assurance in Education). In order e.g. to become accredited as university, NOKUT investigates whether the criterions set out by KD are met:
• The institution’s main activities should be education, research and scientific or artistic development or procurement. The institution’s organization and infrastructure should be adapted to its activities.
• The institution must have stable research and scientific/artistic development activities of high quality related to its scientific areas.
• The institution must have employees in teaching- and research positions in the scientific fields that are relevant to the study programmes.
• The institution must have accreditation for at least five study programs of at least five years duration (in total or as joint study programs), which provides it with an independent right to award higher degrees, as well as lower degrees within several subject fields. The institution must have examined candidates on both lower and higher degrees in most of these areas.
• The institution must have a stable researcher training and an independent right to award doctoral degrees in at least four subject fields. Two of these must be central in relation to regional enterprises’ value creation, at the same time as the fields are of national importance. One of the four doctoral degrees can be replaced by scholarship programs for artistic development work which the institution has been accredited for.
• The institution must be affiliated with national and international networks within higher education, research and scientific or artistic development work, and must contribute in the national cooperation for researcher training and any similar artistic scholarship program.
• The institution must have a satisfactory scientific library.
The research institute sector: RCN offers advice of approval to KD, who has made guidelines for national basic funding of research institutes. In these, it is specified that basic funding can only be given to institutions who fulfill the following demands:
• The institute must conduct research and research dissemination in fields that is of interest to Norwegian industry/private sector, public administration or social community.
• The institute must have academic and scientific competence that leads to scientific publications in well-known publication channels.
• The institute must have a sufficient level of research activity, so that there is a real competence build-up taking place in the organization.

Evaluation systems in international practice
44 R&D Evaluation Methodology and Funding Principles
• The institute must have several funding sources and participate in an open marked for national and international research funds.
• The institute must take part in a suitable division of labor in the Norwegian research system.
• Neither the institute’s funding agency, owners or single companies can be given exclusive rights to research results that have been funded through the basic funding.
• The institute must be run and organized in such a way that no dividend is payed.
• Academic freedom (etc.).
Just recently, RCN added four specific criterions that must be met, in order to receive basic funding:
• Income from national and international commissioned projects must represent at least 25 per cent of total R&D incomes.
• Scientific publishing (i.e. publication points per FTE) must at least be 1/3 of the average in the institute’s arena.
• The institute must have at least 20 scientific FTEs.
• The institute’s contribution income (e.g. from RCN and EU) must at least equal ten per cent of total R&D incomes.
The regional health authorities (RHA): Included in the RHA’s funding system for research, are those hospitals/institutions that the RHAs have an operating agreement with.
2.4 Sweden
2.4.1 The design of the national evaluation Strategic objective and purpose
The purpose of the evaluation is to assess the quality of research, and to use the evaluation data as a basis for funding allocation.
The objective is to stimulate HEI’s to find a profile where they have a competitive advantage, which will help a clearer division of roles between HEI’s, and increased specialisation.19
Roles and responsibilities
In 2007, the Ministry of Education and Research presented in the inquiry “Resources for quality” (SOU 2007:81), a new model for distribution of block grants. The inquiry suggested a system for evaluation-based funding built on a number of indicators, including the indicators bibliometrics and external funding. Associate Professor Ulf Sandström from Linköping University designed the performance-based model for allocation of direct Governmental appropriations to research.20
HEIs and other stakeholders, such as the Swedish Association of University Teachers (SUHF), the Royal Swedish Academy of Engineering Sciences (IVA), the Swedish National Audit Office (Rikrevisionen), research councils, trade unions and
19 “A boost for research and innovation” (Govt. 2008/09:50)
20 S Carlsson, Allocation of Research Funds Using Bibliometric Indicators – Asset and Challenge to Swedish Higher Education Sector

Evaluation systems in international practice
R&D Evaluation Methodology and Funding Principles 45
business federations, were consulted and expressed their opinions on the proposed model. The model was met by some critique, but the majority of stakeholders were positive to the idea of using bibliometrics (citations and publications) and external funding as indicators in a new allocation system.
In 2008, the Swedish Government introduced the system through the Government bill “A boost for research and innovation” (Govt. 2008/09:50), presenting the two indicators: bibliometrics and external funding. The two indicators account for distribution of 10% of the direct appropriations to universities and university colleges.
In 2009, the Swedish Research Council (Vetenskapsrådet, VR) was commissioned by the Government to develop the necessary data for computing the bibliometric indicator. A reference group that met on two occasions carried out this task at VR. The group consisted of five people nominated by the Association of Swedish Higher Education (SUHF); one representative each from VINNOVA and Swedish National Agency for Higher Education21, and three representatives from VR.22
VR presented a modified version of the model in the report “Bibliometric indicator as a basis for resource allocation”, along with critique of the suggested one. The Government, however, chose not to follow VR’s recommendations, and instead gave VR the mission of collecting data for the bibliometric indicator. Hence, VR has not been involved in developing the model but continues to be responsible for data collection. Research organisations do not report to VR.
The Swedish Higher Education Authority (Universitetskanslersämbetet, UKÄ) is responsible for collecting data for the indicator external funding. HEIs are responsible for reporting annual data to Statistics Sweden who report to the Ministry of Education and Research.
There is no formal quality assurance of the evaluation process at VR, UKÄ or Government level.
Key features of the evaluation exercise
Table 13 Sweden: Scope of the assessment
Metrics Biblio-metrics
Peer review - remote
Peer review - on site
Self-evaluation
Scientific field x x Level 1: Institutions (universities, research institutes)
x x
Level 2: Faculties or departments in research institutes
Level 3: Research groups
Level 4: Individual researchers
x
Methods used for evaluation are bibliometrics (publications and citations), and metrics (external funds), accounting for a total of 10 % of direct appropriations to research (5 % each).
21 Now the Swedish Higher Education Authority
22 Vetenskapsrådet, Missiv 111-2008-7887

Evaluation systems in international practice
46 R&D Evaluation Methodology and Funding Principles
Bibliometrics: The indicator covers the number of publications per HEI, the number of citations to these publications, and an estimate of the average number of publications a researcher produces within 34 different scientific fields (listed in Appendix A).23 The result is a computed bibliometric index for each HEI.24
External funds: The indicator uses data on external funds from each HEI. Data is an average of received external funds over the preceding three years, reported by scientific field.
The evaluation is performed annually. Each indicator is based on an average of the preceding three years in order to level fluctuations between individual years. The evaluation covers all HEIs with the exception of the National Defence College and art colleges, as their scientific output is not deemed large enough, and they no not attract external funding. The evaluation does not cover research institutes.
It should be noted that in Sweden, the model is being revised and will become a mixed model in the years to come. In March 2013, VR and VINNOVA were commissioned by the Government to investigate and propose a new model for the allocation of resources to HEIs, in consultation with the research councils Forte and Formas. The envisaged model will redistribute 20 % of direct appropriations, and entails a qualitative assessment by expert panels, which will possibly cover not only research quality, but also the extent to which the research has had an impact on other sectors (economic development and/or society). The new model will be presented in December 2014 but will not be introduced before 2018.
23 VR, Bibliometriskt underlag för medlesfördelning
24 Vetenskapsrådet, Bibliometriskt underlag för medelsfördelning, 2014

Evaluation systems in international practice
R&D Evaluation Methodology and Funding Principles 47
2.4.2 Overview of the evaluation process
Figure 6 Sweden: Overview of evaluation process
Table 14 Sweden: Overview of evaluation process Task Time spent per
task (time of year)
1. Ulf Sandström designed the evaluation methodology on behalf of the Ministry of Education and Research
2. The Ministry commissioned VR and UKÄ to collect data
3 a) VR collects data from WoS, undertakes refinements and calculations including cross-checking authorship to institution, reclassifying publication type, classifying multidisciplinary work, and undertakes normalisation calculations to correct for differing publication rates, citation rates and database coverage for different fields of research.25
VR reports bibliometric data to the Government
2-3 months
(spring)
3 b) HEIs report data on external funding to Statistics Sweden (SCB), commissioned by UKÄ.
25 An international comparison of performance-based research funding systems

Evaluation systems in international practice
48 R&D Evaluation Methodology and Funding Principles
3 c) SCB reports back to UKÄ. UKÄ publishes metric data in their annual report
2 days
(May)
4. The Ministry of Education and Research applies different weight factors to the data depending on scientific field
5. The Ministry of Finance publishes allocation decisions in the annual Government bill
(September)
Costs of the evaluation exercise
The evaluation system has a very low cost, according to interviewees. VR, Statistics Sweden and UKÄ collect data on research productivity and external funds as part of their other activities, which means the tasks needed for the evaluation take very little additional time, approximately 2 days.
The initial cost for VR for purchase of data for the bibliometric indicator and building the data base was around SEK 3-5 million, and VR will also spend approximately 2-3 months full time each year updating the database.26 But, again, VR uses the database for many other analyses as well, so it is difficult to estimate the time spent for the evaluation exercise.
2.4.3 The metrics-based evaluation component Evaluation criteria and indicators
Table 15 Sweden: Indicators in the metrics-based component
Input criteria Third-party funding • National competitive funding x
• International competitive funding x • Contract research x
• Non competitive funding Research staff (FTE) Systemic indicators International cooperation • In general
• Within research community • Research-education
• Science-industry • International mobility National cooperation • Within research community • Research-education
• National mobility
26 Estimation by Staffan Karlsson, Senior Analyst, VR’s unit for analysis and evaluation

Evaluation systems in international practice
R&D Evaluation Methodology and Funding Principles 49
Process indicators Knowledge transfer to the research system • Editorship in journals • Conferences etc
• Intra-research collaboration Knowledge transfer to education • PhDs / postdocs
• Graduate teaching Knowledge transfer to enterprises & society
• Collaboration research-industry Research outputs Publications x Other research outputs x Innovation outputs IPR Other innovation outputs Outcomes/impacts Research (cultural) Innovation (spinoff, incubators) Societal
The bibliometric indicator evaluates research outputs (research quality through the use of number of citations, research productivity through the use of number of publications).
The external funds indicator indicates research input, including contract research. It does not, however, include funds from foundations linked to a specific HEI.27 None of the indicators take into account economic and social impacts.
Indicators do not differ for different research organisations or fields, but scientific fields are given different weight which reflect their differences in propensity to score
on bibliometrics and external funding (See section 1.2.2). The National Defence College and art colleges are not evaluated.
Bibliometrics
Table 16 Sweden: Sources for bibliometrics analysis Sources Use for scientific fields
National identification list of journals/ publishers International database • Scopus • WoS x
• Others
The bibliometric indicator uses the number of publications per HEI, the number of citations to these publications, and an estimate of the average number of publications
27 “A boost for research and innovation” (Govt. 2008/09:50)

Evaluation systems in international practice
50 R&D Evaluation Methodology and Funding Principles
a researcher produces within different scientific fields. The result is a computed bibliometric index for each HEI.
The source for the bibliometric indicators is the Swedish Research Council (VR) database for bibliometric analyses, developed and maintained at VR department of Research Policy Analysis. Data sources are Science Citation Index Expanded, Social Science Citation Index and Arts and Humanities Citation Index, which are all provided by the US company Thomson Reuters and correspond approximately to the data that can be retrieved from the web service Web of Science.28 VR’s database contains publication records and citations from 1982 onwards. The publications are classified in articles, reviews, and meeting abstracts, while proceedings papers are not present. In Web of Science, there are 255 scientific fields but VR have merged them into 34 fields. Each publication can belong to one or several (up to seven) fields.29
To increase the coverage of publications from the humanities and social sciences, the Government has commissioned the National Library of Sweden to improve and develop the national research database SwePub. The database is expected to become a useful source for publications in the humanities and social sciences in the new model for performance based distribution in 2018.
Evaluation processes
The data collection & quality
Evaluated research organisations (i.e. HEIs) send data on external funding to Statistics Sweden in a standardised template once per year. The data is then retrieved by the Ministry of Education and Research. VR collects data from the Web of Science database, i.e., it is not submitted by the HEIs. Data is sent to the Ministry.
There are no formal processes for quality check of input at Ministry or agency level. However, Statistics Sweden, UKÄ and VR work with metrics and bibliometric analyses on a daily basis, and so the processes are in a way continuously quality checked.
28 Vetenskapsrådet, Bibliometrisk indikator för underlag för medelsfördelning, 2009
29 Measuring scientific performance for improved policy making

Evaluation systems in international practice
R&D Evaluation Methodology and Funding Principles 51
Table 17 Sweden: Data collection & quality assurance
Method for data collection
Annual reports by the institutions x
Submission in the national research information system
• By institution x
• By head of research unit
• By individual researcher
Harvesting from other RIS
• Institutional information systems
• Publication repositories
• Other information systems
Rules & tools for quality check of the input
Responsibility institution / submitter, ev. Guiding procedures
Central checking procedures
Close collaboration central - institution
Direct observation (peer review panel)
Scoring and use of the data
The bibliometric indicator is based on publication addresses, the individual contributions are contributed to the different Swedish HEIs. Publications that are authored by researchers with affiliation to the university hospitals must include the corresponding university name to be counted. Only first authors and corresponding authors are included and the publications are split if these researchers come from different institutions. It should be noted that address information is not always easy to interpret and VR puts considerable effort into this task. The number of publications, and citations to these publications, are counted.30 ¨
Due to differences in publication rate, citation rate and database coverage for different fields of research, VR uses a method for normalisation:
Citations are normalised based on three different conditions: the field of research, the document type (article, review or letter) and publication year. It is done by collecting all papers in VR database that share the same field, document type and publication year with the analysed article. The field is determined by the journal and can be one of several of the fields in the database. From the reference body of papers, an average number of citations per publication can be computing and the field-normalised citation is constructed by dividing the number of citations for the analysed article by the average citation of the reference publications. The resulting indicator is practical in that it is 1 for publications with world-average citation numbers. A score of 1.22 would indicate that the article or a group of articles are cited 22 % more than the world average.31
Publications are also normalised because a large part of the research is conducted in areas where the research is presented in non-journal publication channels, i.e. outside the WoS coverage. The humanities and the social and applied sciences often have a
30 S Carlsson
31 S Carlsson

Evaluation systems in international practice
52 R&D Evaluation Methodology and Funding Principles
lower publication rate. Therefore, the publications are normalised by comparing the publication rate of other Nordic researchers in 34 fields. To generate the normalisation data, the average number of publications per university is computed. The database itself shows all publications with authors that have published at least one publication. By the use of the Waring distribution, the number of authors, which have not published anything, can be estimated and together the average production per researcher can be determined. Using the average production, the publications of the analysed HEI can be converted to the number of average productive researchers, which is used as the normalised value for publications in the evaluation.32
The final step in the calculation of the bibliometric indicator is to determine the product of the field-normalised citation and the number of average productive researchers. The Ministry then uses this score together with the indicator for external funding.
Because less than 10 percent of the publications from the humanities and social sciences are visible in WoS, publications and citation counts are field-normalised, and publications in the social sciences and the humanities have considerably more weight than publications in other areas. Humanities and social sciences are disfavoured also in terms of attracting external funds. The issue is solved by using weight factors for both indicators: publications in humanities and social sciences are weighted by 2, natural sciences by 1.5, medicine and engineering by 1, and other fields by 1.1.33 The same applies for external funds where institutions with large humanities and social sciences activities are given twice the points, 1.5 times the actual score for natural sciences, and 1.1 for other fields.34
Only HEIs are evaluated. The evaluated HEI is only compared to the scientific field at an international level in the process of field normalisation. The final results are only compared to other Swedish HEIs, and the results from previous years, for determining the allocation of performance based research funds.
Scientific fields
1. Agriculture
2. Biology
3. Biomolecular
4. Blood
5. Chemistry
6. Computer Science
7. Dentistry
8. Ecology
9. Economics
10. Education
11. Engineering
32 S Carlsson
33 Measuring scientific performance for improved policy making
34 S Carlsson

Evaluation systems in international practice
R&D Evaluation Methodology and Funding Principles 53
12. Engineering Mathematics
13. Environmental Health
14. Environmental Studies
15. Ergonomics
16. Geoscience
17. Health
18. Health Studies
19. Humanities
20. Immunology
21. Information Science
22. Materials Science
23. Mathematics
24. Mechanics
25. Medicine External
26. Medicine Internal
27. Neuroscience
28. Oncology
29. Pharmacology
30. Physics
31. Psychology
32. Social Science
33. Statistics
34. Surgery
2.5 The UK
2.5.1 The design of the national evaluation Strategic objective and purpose
The Research Excellence Framework (REF) is the system in the UK for assessing the quality of research in higher education institutions in the UK.
It replaces the Research Assessment Exercise (RAE), which has been carried out in the UK periodically since 1986, with two since the turn of the century in 2001 and 2008 respectively. The RAE provided a periodic measure of research quality across the UK university sector through a process of peer review based upon submissions from individual university departments. The resulting quality ratings combined with the number of staff submitted amongst other factors were then used to allocate the QR element within the funding bodies block grant to universities. The REF will – for the first time – explicitly assess the impact of research beyond academia, as well as assessing the academic excellence of research. It seeks to reward departments that engage with business, the public sector and civil society, and carry new ideas through to beneficial outcomes, although the guidance is clear that this impact should always be based on high quality research.

Evaluation systems in international practice
54 R&D Evaluation Methodology and Funding Principles
The primary purpose of the REF2014 was to produce an assessment outcome for each submission made by institutions to:
• Inform the selective allocation of grants for research by the four higher education funding bodies to the institutions which they fund, from 2015-6.
• Provide accountability for public investment in research and produce evidence of the benefits of this investment.
• To provide benchmarking information and to establish reputational yardsticks, for use within the higher education sector and for public information.
Initially, the motivation behind assessment was to concentrate resources on high quality research institutions and to raise overall quality (Adams and Gurney 2009, Geuna and Martin 2003, Hare 2003). Concerns about overconcentration of funding in a few dominant institutions after successive rounds of assessment, and the consequent potential underfunding of high quality research, led in 2008 to research quality profiling instead of single overall assessment grades for units of assessment (Adams and Bekhradnia 2004, Barker 2007, Hare 2003, Roberts 2003)35.
The debate over whether and to what extent research concentration has or should be increased or decreased continues as does debate over its impact in different disciplines (London Mathematical Society 2010, Ramsden 2009, Russel Group 2010, Universities UK 2009, Adams and Gurney 2009, HEFCE 2010, Brown 2009, Gilroy and McNamara 2009).
The RAE started partly because of the massification of higher education (Mayhew et al, 2004; Martin and Whitley, 2010). Government upgraded the polytechnics and eventually renamed them as universities but lacked the budget for them all to be research universities. In fact, it cut the research budgets of the universities and the research councils in the early 1980s. The University Grants Committee therefore decided to award institutional funding for research on a selective basis (Lee and Harley, 1998). The university cuts were very uneven and the rationale for this was not explained. Kogan and Hanney (2000) claim that an intention behind the RAE was to reduce the number of research universities in the UK to as few as 12-15 elite institutions. 36
Roles and responsibilities
The RAE/REF is jointly conducted by the Higher Education Funding Council for England (HEFCE)37, the Scottish Funding Council (SFC)38, the Higher Education Funding Council for Wales (HEFCW)39 and the Department for Employment and
35 Hughes, A., Kitson, M., Bullock, A., Milner, I., The Dual Funding Structure for Research in the UK: Research Council and Funding Council Allocation Methods and the Pathways to Impact of UK Academics, Centre for Business Research (CBR), UK Innovation Research Centre (UK-IRC), Department fro Business, Innovation and Skills, February 2013 36 Arnold, E., Farla, K., Kolarz, P., Mahieu, B., Peter, V., The role of metrics in performance-based research
funding systems. A report to the Russell Group, Technopolis Group, 2014
37 A non-departmental independent public body that promotes and funds teaching and research in universities and colleges in England.
38 A non-departmental public body of the Scottish Government that is responsible for funding, teaching and learning provision, research and other activities in Scotland’s colleges, universities and higher education institutions.
39 A Welsh Government sponsored body responsible for the distribution of funds for education, research and related activities at eleven higher education institutions.

Evaluation systems in international practice
R&D Evaluation Methodology and Funding Principles 55
Learning, Northern Ireland (DEL)40. It is managed by a team based at HEFCE, on behalf of the four UK higher education funding bodies and is overseen by a Steering Group, made up from representatives of each of the funding bodies.
HEFCE distributes public money to universities and colleges in England that provide higher education. The total amount is set by governmental annually and HEFCE subsequently allocates the money to institutions, which is a contribution towards teaching, research and related activities. HEIs have additional sources of income to support their activities, including student fees, their own endowment funds, businesses, other public sector organisations e.g. NHS and other sources of research income including UK Research Councils and charitable organisations.
The RAE/REF has been developed through an evolutionary process, building on previous RAEs and changes to the REF 2014 have been made following on from extensive review and consultation.
Key features of the evaluation exercise
RAE/REF is a remote peer review-based evaluation, based on the submission by the evaluated unit (Units of Assessment) of information on outputs, the research environment and impacts reached. The RAE/REF includes in the assessment research groups (Units of Assessment – UoA) and individual researchers.
The first REF took place in 2014 and covers the period 2008-13. It replaces the former RAE system, which was last completed in 2008, 2001, 1996, 1992, 1989 and 1986. The most significant difference between the RAE and the REF is the introduction of bibliometrics data, which can be used by assessment panels to supplement the peer-review process and provide additional information about the academic significance of research outputs.
Table 18 UK: Scope of the assessment
Metrics Biblio-metrics
Peer review - remote
Peer review - on site
Self-evaluation
Scientific field Level 1: Institutions (universities, research institutes)
Level 2: Faculties or departments in research institutes
Level 3: Research groups
x x x
Level 4: Individual researchers
x x x
In the REF2014 there are 36 “Units of Assessments” (UoA) across four main panels. These are presented in Table 19.
Table 19 UK: Main Panels and Units of Assessment
Main Panel Unit of Assessment
A
Medicine, Health
1 Clinical Medicine
2 Public Health, Health Services and Primary Care
40 A Northern Irish government department responsible for the promotion of learning and skills to prepare people for work and support the economy.

Evaluation systems in international practice
56 R&D Evaluation Methodology and Funding Principles
and Life Sciences 3 Allied Health Professions, Dentistry, Nursing and Pharmacy
4 Psychology, Psychiatry and Neuroscience
5 Biological Sciences
6 Agriculture, Veterinary and Food Science
B
Physical Sciences, Engineering and Mathematics
7 Earth Systems and Environmental Sciences
8 Chemistry
9 Physics
10 Mathematical Sciences
11 Computer Science and Informatics
12 Aeronautical, Mechanical, Chemical and Manufacturing Engineering
13 Electrical and Electronic Engineering, Metallurgy and Materials
14 Civil and Construction Engineering
15 General Engineering
C
Social Sciences
16 Architecture, Built Environment and Planning
17 Geography, Environmental Studies and Archaeology
18 Economics and Econometrics
19 Business and Management Studies
20 Law
21 Politics and International Studies
22 Social Work and Social Policy
23 Sociology
24 Anthropology and Development Studies
25 Education
26 Sport and Exercise Sciences, Leisure and Tourism
D
Arts and Humanities
27 Area Studies
28 Modern Languages and Linguistics
29 English Language and Literature
30 History
31 Classics
32 Philosophy
33 Theology and Religious Studies
34 Art and Design: History, Practice and Theory
35 Music, Drama, Dance and Performing Arts
36 Communication, Cultural and Media Studies, Library and Information Management
HEIs are able to make a submission to any of the 36 UoA. Normally, an HEI will make only one submission to each UoA it submits to and it is very important that the research submitted by a unit must relate primarily to the areas of research set out in the descriptor of the UoA in which it is submitted. There are exceptions under which an HEI make more than one submission to a UoA. This requires prior permissions from the REF manager who will make the decision in consultation with the relevant main and sub-panel chairs. Such exceptions include:

Evaluation systems in international practice
R&D Evaluation Methodology and Funding Principles 57
• Where an institution involved in a joint submission wishes to make an additional individual submission in the same UoA.
• Multiple submissions to sup-panel 28 (Modern Languages and Linguistics) will be permitted where one submission is in Celtic Studies and the other in Modern Languages and Linguistics. This has been agreed in recognition of the special cultural submission of Celtic Studies in parts of the UK and the particular status of the Welsh languages in Wales.
• Where HEIs have merged after 1st July 2011, they can seek permission to make two separate submissions in all of the UoAs in which they wish to submit, if, for example, they anticipate difficulty in achieving academic cohesion between the merger date and the submission date.
• Where a sub-panel considers there is a case for multiple submissions in its UoA, given the nature of the disciplines covered, the institution may request a multiple submission with additional procedures applying.
Joint submissions are permissible and encouraged by two or more UK institutions for a UoA, where this is the best way of describing research they have developed or undertaken collaboratively. For administrative purposes only, a leading HEI needs to be identified and joint submissions should be received be a panel in the form of a unified entity, enabling the assessment of the submission in the same way as submissions from single entities. All data in the submission should be able to be verified by the REF team through the HEIs to which the data relates.
Panels will assess joint submissions as they do single submissions and the outcome will be a single quality profile. Panels will provide confidential feedback to the heads of all HEIs involved in the joint submissions; but the panels on the REF team will not comment specifically on the contribution by an individual HEI to the overall quality profile. HEIs involved in a joint submission may also wish to make an additional individual submission in the same UoA and is normally permitted to do so.
For each submission, HEIs decide which individuals to select for submissions, this is an internal decision and the head of the HEI must inform the REF of the final decision. Staff selected for submission must be lists in one of two possible categories, A or C. It is important to note that submitted units may, but need not, comprise staff who work within a single department or other organisational unit within the HEI. Submitted units can comprise staff who work in multiple organisational units in the HEI.
Category A – academic staff which a contract of employment of 0.2 FTE or greater and on the payroll of the submitting HEI on the census date (13th October 2013 for the REF2014) and whose primary employment function is to undertake either ‘research only’ or ‘teaching and research’. All staff satisfying these demands are eligible for the REF regardless of their job title. This includes staff who hold institutional / NHS joint appointments, pensioned staff who continue in salaried employment to carry out research, academic staff who are on unpaid leave of absence or secondment on the census data and are contracted to return to normal duties up to two years from the start of their period of absence, academic staff employed by the submitting HEI who are based in a discrete department or unit outside of the UK and the primary focus of their research activity on the census date is clearly and directly connected to the submitting unit based in the UK, staff ‘absent’ from their ‘home’ institution by working on secondment as contracted academic staff at another HEI may be included by either or both institutions.
No individual can be included in more than one submission other than those on secondment as described above. If an individual works across two or more submitting units within the same HEI, the HEI must decide on one submission in which to return the individual.
Research assistants, defined as individuals who are on the payroll and hold a contract of employment with the institution and whose primary function is defined as ‘research

Evaluation systems in international practice
58 R&D Evaluation Methodology and Funding Principles
only’ are not eligible for the REF. This is because they are employed to carry out another individual’s research programme rather than as independent researchers in their own right (unless they are named as principal investigator or equivalent on a research grant or significant piece of research work on the census date and satisfy the definition of Category A staff.
Category C – individuals employed by an organisation rather than an HEI whose contract or job role incudes the undertaking of research and whole research is primarily focused in the submitting unit on the census date. These individuals can be employed by the NHS, Research Council Unit, a charity or other organisation except for an HEI. Submitted outputs by Category C staff will inform the quality profiles awarded to submissions but these staff will not contribute towards the volume measure for funding purposes.
Early career researchers are defined as a member of staff who meet the criteria to be selected as Category A or Category C staff on the census date and who started their careers as independent researchers on or after 1st August 2009 for REF2014.
2.5.2 Overview of the evaluation process The REF2014 evaluation process began in early 2010 following the publication of ‘initial decisions’ by the funding bodies on the conduct of the REF. The results of the REF2014 exercise will be published in Dec 2014 with the publication of the submissions, panel overview reports and sub-profiles following in the Spring 2015.

Evaluation systems in international practice
R&D Evaluation Methodology and Funding Principles 59
Figure 7 UK: Flow chart of the REF2014 evaluation process
Source: HEFCE
Costs of the evaluation exercise
There is no publically available information to date on the cost of the peer review component of the REF2014 or the evaluation as a whole. Estimates of the 2001 and 2008 RAEs have been made.
In 2006, the Higher Education Policy Institute (HEPI) published an estimation of the cost of the 2001 RAE. The HEPI report makes a number of claims on costs of RAE rounds. In 2001, the direct additional costs due to RAE were calculated at £5.6m, with the largest element here relating to panel meetings. This figure does not include accommodation and support services provided by HEFCE. After assessment of two research-intensive HEI (Leeds Universities), an estimate of £37.5m for all HEIs in England as a total incremental cost was reached (above and beyond that needed to run a well-managed institution). This lead to an overall estimate of ~£42 million.

Evaluation systems in international practice
60 R&D Evaluation Methodology and Funding Principles
The inclusion of only two universities as the “sample” suggests further that this figure is unreliable. Advances in efficiency due to HEIs streamlining the processes involved and reductions in the amount of physical research outputs required and paperwork, also mean this is likely to be an overestimate. Nonetheless, the breakdown from this review is presented in
Figure 8 UK: Estimation of Leeds universities’ costs associated with RAE annually
Annual costs (either average of two universities or range)
Cost drivers Sector costs (extrapolation)
Student records (all)
£30,000 Number of students £1.5m
Finance and staff records
£5,000 Number of returns £0.5m
Research assessment
£800-850 (per research active staff pa)
Number of research active staff
£7.5m
Continuation audits
£80-100,000 Number of events £2.5m
Subject reviews £40-50,000 (UoL) £80-180,000 (LMU*)
Number of staff involved
£30m+
Bidding schemes (excluding JIF)
£1-9,000 Number of bids placed
£5m(?)
Source: HEFCE 2000/36
*The £180,000 estimate reflects the cost of a very large and complex provision across four academic departments, over 300 modules and in excess of 1500 students.
An estimation of the cost of the RAE 2008, was commissioned by HEFCE, in an Accountability Review41 which was a much more comprehensive exercise that that carried out or the RAE 2001.
This was a much more comprehensive exercise, which selected a representative sample of 15% of the HEIs in England. These twenty institutions42 were selected based upon the following criteria:
• Institution size
• Institution degree of specialism
• Institution type (Russell Group, other pre-92, post-92, Guild HE)
• Geographical location
• Willingness to participate.
The results from this review are therefore significantly more reliable, and show a decrease in expenditure overall compared to 2001, and a significant reduction against the projections made in 2000 and 2004. This reduction is entirely in the costs
41 HEFCE 2009, RAE 2008 Accountability Review
42 The institutions in the sample: Bath Spa University, Harper Adams University College, London School of Hygiene & Tropical Medicine, University of Leeds, Loughborough University, London South Bank University, University of Warwick and University of the West of England were all visited. University of the Arts London, University of Bristol, University of Chester, City University London, Cranfield University, Edge Hill University, University of Hertfordshire, King’s College London, Manchester Metropolitan University, Middlesex University, The University of Nottingham and University of Sussex were all contacted by telephone.

Evaluation systems in international practice
R&D Evaluation Methodology and Funding Principles 61
imposed on universities by the RAE, as Figure 9 shows the direct costs of RAE 2008 are certainly over £10m.
Figure 9 UK: Total direct expenditure on RAE 2008
Year (Financial) Expenditure (£)
2004-2005 414,757
2005-2006 1,817,921
2006-2007 435,242
2007-2008 2,030,011
2008-2009 7,176,069*
2009-2010 126,000*
Total 12,000,000* Source: http://www.rae.ac.uk/pubs/2009/manager/manager.pdf *projected
Though the last two years are projected, the specific figure supplied for 2008-2009 suggests some degree of confidence and so, combined with the small magnitude of the final year’s figure, makes £12m a reliable estimate.
The total incremental sector cost to HEIs in England of the current RAE cycle (2008) is estimated to be £47 million, which translates into an annualised average of £7 million over the seven years covered by the exercise (Figure 10). It is not stated explicitly whether this cost is purely that absorbed by the HEIs, or if it includes the direct costs of the RAE. However, given that the figures were reached following interviews with stakeholders at the sample institutions as well as references to the “externally imposed costs to HEIs”, suggest it does not include direct costs of the RAE not imposed on institutions. The major task for each institution is the preparation of “submissions”, requiring one from each UoA (field) per HEI. These submissions include any number of eligible researchers, with up to four research outputs submitted per researcher.
Figure 10 UK: Average costs per HEI in sample (and extrapolations) RAE 2008
Cost per HEI RAE (£) Annualised (£)
Staff returns (validating publications, information, writing submissions)
315,183 45,026
Faculty review groups 100,785 14,398
Central project management 90,155 12,879
RAE national panels and consultation 56,227 8,032
Central governance or Steering Group 33,551 4,793
Systems upgrades 10,997 1,571
External review 3,125 446
Software 2,589 370
Special recruitment 216 31
Total cost per HEI 612,828 87,547
Total cost per researcher 1,127 161
Total sector cost 47,335,706 6,762,244 Source: HEFCE (2009), RAE Accountability Review
The figures in red are calculated from the average sample costs in black. The total costs per HEI are averages over the 20 HEI sized sample. The total sector costs are

Evaluation systems in international practice
62 R&D Evaluation Methodology and Funding Principles
then calculated using the total number of researchers who took part in the RAE, multiplied by the total cost per researcher from the 20 HEI sample. This figure is not easily retrievable, as though the numbers of FTE headcounts are given for each UoA, this figure was not aggregated anywhere. An RAE report describes how “2,344 submissions were received from 159 HEIs, listing the work of more than 50,000 researchers.”
However, examination of the data provided in the accountability report suggests that the FTE figure is lower:
𝑡𝑜𝑡𝑎𝑙 𝑠𝑒𝑐𝑡𝑜𝑟 𝑐𝑜𝑠𝑡𝑡𝑜𝑡𝑎𝑙 𝑐𝑜𝑠𝑡 𝑝𝑒𝑟 𝑟𝑒𝑠𝑒𝑎𝑟𝑐ℎ𝑒𝑟
= 𝑡𝑜𝑡𝑎𝑙 𝑟𝑒𝑠𝑒𝑎𝑟𝑐ℎ𝑒𝑟𝑠 𝑝𝑒𝑟 𝑠𝑒𝑐𝑡𝑜𝑟 → £47,335,706£1,127
= ~42,000
No references are made to the number of researchers included in the sample either, so to attempt to calculate estimates in each area per researcher (or overall), an average number of researchers per HEI will be estimated using the available data.
𝑐𝑜𝑠𝑡 𝑝𝑒𝑟 𝐻𝐸𝐼𝑐𝑜𝑠𝑡 𝑝𝑒𝑟 𝑟𝑒𝑠𝑒𝑎𝑟𝑐ℎ𝑒𝑟
= 𝑟𝑒𝑠𝑒𝑎𝑟𝑐ℎ𝑒𝑟𝑠 𝑝𝑒𝑟 𝐻𝐸𝐼 → £613,828£1,127
= ~545
This figure allows calculation of the following breakdown of the expenditure per researcher, presented in Figure 11.
Figure 11 UK: Breakdown of cost per researcher
Cost per researcher RAE (£) Annualised (£) Proportion of Cost
Staff returns (validating publications, information, writing submissions) 578 83 51%
Faculty review groups 185 26 16%
Central project management 165 24 15%
RAE national panels and consultation 103 15 9%
Central governance or Steering Group 62 9 5%
Systems upgrades 20 3 2%
External review 6 1 1%
Software 5 1 0%
Special recruitment 0 0 0%
Total cost per researcher 1,127 161
Source: Estimated from data in Figure 10
This breakdown shows that the actual cost per researcher is very little, and that it is the number of researchers involved in the exercise that causes the costs to escalate. As a significant proportion of these costs are not per researcher, but are general costs imposed on the HEI, it seems reasonable to sum the direct and indirect costs of the RAE. Then a representative total per researcher and, using the information in Figure 12, per output can be estimated. These will not be accurate, as much of the data has been extrapolated up or down and so may be incorrect, though it is still informative.
𝑇𝑜𝑡𝑎𝑙 𝑐𝑜𝑠𝑡 = £47,000,000 + £12,000,000 = £59,000,000
𝐶𝑜𝑠𝑡 𝑝𝑒𝑟 𝑟𝑒𝑠𝑒𝑎𝑟𝑐ℎ𝑒𝑟 =£59,000,00042,000
= £1,400

Evaluation systems in international practice
R&D Evaluation Methodology and Funding Principles 63
𝐶𝑜𝑠𝑡 𝑝𝑒𝑟 𝑟𝑒𝑠𝑒𝑎𝑟𝑐ℎ 𝑜𝑢𝑡𝑝𝑢𝑡 = £59,000,000215,657
= £275
In terms of a breakdown of direct costs (£12m over RAE period), the only data available relates to the panels:
• 939 panel members registered (though less were actually involved)
• £250 per panel member involved (increasing if included on more than one panel)
Figure 12 UK: RAE 2008 outputs by type
Source: http://www.rae.ac.uk/pubs/2009/manager/manager.pdf
Evaluation criteria and indicators
As discussed earlier HEIs can make a submission to any of the 36 UoA. Each submission is used to generate a ‘quality profile’ for the submitted unit that takes 3 categories of data/indicators into account, related to a) outputs, b) environment, and c) impact. Each of these categories has an appropriate template to complete, capturing the following information:
• Information on staff in post on the census date, 31st October 2013, selected by the institution to be included in the submission.
• Details of publications and other forms of assessable output, which they have produced during the publication period (1 January 2008 to 31 December 2013). Up to four outputs must be listed against each member of staff included in submission. Outputs can include:
− Academic outputs – Journal papers, conference proceedings, research reports, monographs, books and book chapters, technical reports, standard documents, research derived from development, analysis and interpretation of bioinformatics databases, working papers, exhibitions or museum catalogues, curatorship and conservation, translations, scholarly editions, grammars, dictionaries, creative writing and compositions, case

Evaluation systems in international practice
64 R&D Evaluation Methodology and Funding Principles
notes, publications of development donors, published maps, advisory reports, the creation of archival or specialist collections to support the research infrastructure, policy evaluations, commissioned reports, data reports, critical review articles, systematic reviews, teaching and curriculum assessment matierials and textbooks where they embody original research, outputs from proects commissioned by all levels of government, industry and other research funding bodies.
− IPR – patents, published patent applications, other forms of IPR.
− Digital Artefacts – work published in non-print media, data sets, multi-use data sets, archives, film and other print media, web content, software, computer codes, dgital and broadcast media, design and design codes.
− Physical artefacts – buildings, installations, new materials, images, new devices, new products and processes, prototypes
− Temporary artefacts – exhibitions, performances and other types of live presentation.
• A completed template describing the submitted unit’s approach during the assessment period (1 January 2008 to 31 July 2013) to enabling impact from its research, and case studies describing specific examples of impacts achieved during the assessment period, underpinned by excellent research in the period 1 January 1993 to 31 December 2013.
− Impact includes but is not limited to an effect on, change or benefit to:
− The activity, attitude, awareness, behaviour, capacity, opportunity, performance, policy, practice, process or understanding of an audience, beneficiary, community, constituency, organisation or individuals in any geographic location whether locally, regionally, nationally or internationally,
− Impact includes the reduction of prevention of harm, risk, cost or other negative effects.
− Impact on research or the advancement of academic knowledge within the higher education sector for the purposes of the REF is excluded.
− Impacts on students, teaching or other activities within the submitting HEI are excluded.
− Other impacts within the higher education sector, including on teaching or students, are included where they extend significantly beyond the submitting HEI.
− Impacts are assessed on their terms of ‘reach and significance’ regardless of geographical location. The UK funding bodies expect that many impacts will contribute to the economy, society and culture with the UK, but equally value the international contribution of UK research.
• Data about research doctoral degrees awarded and research income related to the period 1 August 2008 to 31 July 2013.
• A completed template describing the research environment, related to the period January 2008 to 31 July 2013. The component on research environment requires information on:
− Overview which should briefly describe the organisation and structure of the unit to set the context for sub-panels assessing the submission. It should be used to describe which research groups or units are covered by the submission, and how research is structured across the submitted unit. This section will be assessed in combination with the research strategy.

Evaluation systems in international practice
R&D Evaluation Methodology and Funding Principles 65
− Research Strategy should provide evidence of the achievement of strategic aims for research during the assessment period; details of future strategic aims and goals for research; how these relate to the structure described above; and how they will be taken forward. Evidence and indicators may include, but are not limited to:
− Vision, including strategic plans
− An evaluation of the submitting unit's current position with reference to the research position described in the previous RAE
− Evaluation of strategy or strategies outlined in the previous RAE
− Outline of main objectives and activities in research for next 5 years and drivers; methods for monitoring attainment of targets
− New and developing initiatives not yet producing visible outcomes but of strategic importance
− Identification of priority developmental areas, including research topics, funding streams, postgraduate research activity, facilities, staffing, administration and management
• People, including
− Staffing strategy and staff development within the submitted units. Evidence and indicators may include but are not limited to:
− Evidence of how the staffing strategy relates to the unit’s research strategy and physical infrastructure
− Evidence about career development support at all stages in research careers, including for research assistants, early career researchers and established academic staff
− Implementation of the Concordat to support the career development of researchers
− Evidence of how the submitting unit supports equalities and diversity
− Effective integration of clinical academics and NHS-employed active researchers
− Sustainable staff structure
− A description of how the unit has been developing the research of early career researchers and support for integrating them into a wider supportive research culture
− Research career development of both non-clinical and clinical researchers
− Role of clinical researchers where relevant
− Information on staff with personal research fellowships
− Information on international staff appointments, international recruitment and visiting scholars
− Research students – the training and supervision of, evidence and indicators may include but is not limited to:
− Effective and sustainable doctoral research training
− Evidence of strong and integrated research student culture
− Evidence of CASE awards and application of technology generated by research students

Evaluation systems in international practice
66 R&D Evaluation Methodology and Funding Principles
− Information of PGR recruitment such as approaches to recruitment and any discipline specific related issues
− Information on training and support mechanisms
− Information on progress monitoring
− Income, infrastructure and facilities, evidence and indicators may include but are not limited to:
− The nature and quality of the research infrastructure and facilities, including significant equipment, research facilities and facilities for research students
− Evidence of cross-HEI shared or collaborative use of research infrastructure
− Significance of major benefits-in-kind (including, for example, donated items of equipment, sponsorships secured, or other arrangements directly related to research)
− Policy and practice in relation to research governance
− Information on provision and operation of specialist infrastructures and facilities
− Evidence of investments (both current and planned) in infrastructures and facilities
− Information on research funding portfolio, including future plans
− Information on consultancies and professional services
− Collaboration and contribution to the discipline or research base, this includes work with other researchers outside of the submitted unit whether locally, nationally or internationally; support for research collaboration and interdisciplinary research. Evidence and indicators may include but are not limited to the following:
− Indicators of wider influence or contributions to the discipline or research base
− Participation in the peer-review process e.g. national and international grant committees, editorial boards
− Fellowships and relevant awards
− Journal editorships
− Effective academic collaboration
− Extent of collaboration or integration with external bodies such as the NHS
− Responsiveness to national and international priorities and initiatives
− Effective mechanisms to promote collaborative research and to promote collaboration at national and international level within the academic community and / or users of research
− Information of support for and examples of research collaborations, including national or international research collaborations with academia, industry or other bodies
− Information on support for interdisciplinary research
− Information on how research collaborations with research users (including industry users) have informed research activities and strategy

Evaluation systems in international practice
R&D Evaluation Methodology and Funding Principles 67
− Examples of leadership in the academic community
It is important to note that the panels have a high level of autonomy to develop specific aspects of the assessment criteria and to adopt working methods to ensure the assessment is sensitive to disciplinary differences, which may justify differences in the detailed approach to assessment.
Table 20 UK: Indicators used Input criteria Third-party funding • National competitive funding x
• International competitive funding x • Contract research x
• Non competitive funding x Research staff (FTE) Systemic indicators International cooperation • In general x • Within research community x
• Research-education x • Science-industry x
• International mobility National cooperation • Within research community x
• Research-education x • National mobility Process indicators Knowledge transfer to the research system • Editorship in journals x • Conferences etc x
• Intra-research collaboration x Knowledge transfer to education • PhDs / postdocs x • Graduate teaching x Knowledge transfer to enterprises & society
• Collaboration research-industry x Research outputs Publications x Other research outputs x Innovation outputs IPR x Other innovation outputs x Outcomes/impacts Research (cultural) x Innovation (spinoff, incubators) x Societal x

Evaluation systems in international practice
68 R&D Evaluation Methodology and Funding Principles
Bibliometrics As highlighted previously, some panels have made use of citation data and/or JIF – Journal Impact Factors (see 0). This was upon decision of the panel members themselves.
Panels using citation data considered the number of times an output has been cited as additional information about the academic significance of outputs. In doing this, the limited value of citation is recognised for recently published outputs, the variable citation patters of ‘negative citations’ and the limitations of such data for outputs in languages other than English.
This is procured from a single source; Scopus. Scopus is owned by Elsevier and the Scopus database covers almost 18,000 titles from over 5,000 publishers. Each journal in the database is assigned to one or more subject classifications using the ‘All Science Journal Classification’ (ASJC) codes.
The REF team provided the following information for each publication in the period 2008 – 2012 (inclusive) and for each relevant ASJC codes:
• Average number of times that journal articles and conference proceedings published worldwide in that year, in that ASJC code were cited.
• The number of times that journal articles and conference proceedings in that ASJC code would need to be cited to be in the top 1%, 5%, 10% and 25% of papers published worldwide in that year.
The REF team provided this data at the level of the UoA. This is done by assigning an ASJC code to one or more UoAs and providing the contextual data for these grouped ASJC codes. There is a threshold for providing contextual data and in the instance where very few journal articles and conference proceedings have been published in an ASJC category in a particular year the data is not returned.
In sub panel 11: Computing Science and Informatics, there was an indication that Google Scholar would be used as a further source of citation, however, following discussion it was no possible to agree a suitable process for bulk access to citation information. Scopus, alone is thus used.
Table 21 UK: Sources for bibliometrics analysis Sources Use for scientific fields
Scopus All UoA
Evaluation processes
The data collection & quality
Submissions of the information for assessment are made via a web-based application system using a database hosted at HEFCE43. A submission user guide and other guidance documents are published to support this process.
All HEIs have registered to use the submission system, and there are system administrators (dedicated institutional contacts) at each HEI who are responsible for creating accounts for system users within their HEI.
43 This is the only way that a submission can be made. Paper based submissions are not permitted.

Evaluation systems in international practice
R&D Evaluation Methodology and Funding Principles 69
Creating submissions data for the REF can be done manually using the data entry part of the submission system, or by importing from file (using an import tool or web service).
Table 22 UK: Data collection & quality assurance
Method for data collection
Annual reports by the institutions
Submission in the national research information system
• By institution
• By head of research unit x
• By individual researcher x
Harvesting from other RIS
• Institutional information systems x
• Publication repositories x
• Other information systems
Rules & tools for quality check of the input
Responsibility institution / submitter, ev. Guiding procedures
Central checking procedures
Close collaboration central - institution
Direct observation (peer review panel) x
The REF team provides support for data entry by the HEIs, by providing relevant data from the other UK systems. These data also act as a basis for verification and are therefore integrated within the REF information collection system. HEFCE have sought to align the data requirements as far as possible with data reported to other agencies, or used for other purposes. Specifically:
• The data requirements relating to research outputs will be compatible with the Common European Research Information Format (CERIF). Institutions will be able to import data into the REF submission system in various file formats, enabling them to use existing internal data for preparing REF submissions
• The definitions of data on research doctoral degrees awarded and on research income have been aligned as far as possible with definitions used in HESA data returns. The REF team will provide institutions with HESA data that can be used in preparing submissions. Institutions will then be able to allocate the HESA data to REF UoAs, or they may prepare their REF data from internal systems and use the HESA data for validation purposes
• Research councils and the health research funding agencies will also provide institutions with relevant data about research income-in-kind for use in preparing submissions, and HEFCE will also use these data for validation purposes
In their criteria statements, REF panels may require additional specific data to be included in the textual parts of the submission.
Examples of data provided include:

Evaluation systems in international practice
70 R&D Evaluation Methodology and Funding Principles
• The Higher Education Statistics Agency (HESA)44 provides data to HEIs for sections REF4a/b, including the number of research doctoral degrees awarded from academic year (AY) 2008/9 to AY 2010/11 and external research income 2008-09 to 2010-11
• The UK Research Councils will supply data for research income-in-kind from AY 2008-09 to AY 2010-11 on the REF extranet, and will update these data to include AY 2011-12 in summer 2013
• The relevant health research funding bodies’ data for research income-in-kind for AY 2008-09 to AY 2012-13 is provided by the relevant body, directly to the HEIs concerned
Scoring and use of the data
The sub-panels assess three distinct components of each submission – outputs, impact and environment - against the following generic assessment criteria:
• Outputs – sub-panels assess the quality of the submitted research outputs in terms of their ‘originality, significance and rigour’, with reference to international research quality standards.
• Environment – the sub-panels will assess the research environment in terms of its ‘vitality and sustainability’, including its contribution to the vitality and sustainability of the wider discipline research base.
• Impact – the sub-panels will assess the ‘reach and significance’ of impacts on the economy, society and / or culture that were underpinned by excellent research conducted n the submitted unit as well the submitted unit’s approach to enabling impact from its research.
Each of the components assessed above are used to generate an overall ‘quality profile that shows the proportion of the submission that meets each of the following starred levels.
The criteria for assessing the quality of outputs are ‘originality, significance and rigour.’
Outputs sub-profile: Criteria and definitions of starred levels.
Four Star Quality that is world-leading in terms of originality, significance and rigour.
Three Star Quality that is internationally excellent in terms of originality, significance and rigour but which falls short of the highest standards of excellence.
Two Star Quality that is recognised internationally in terms of originality, significance and rigour.
One Star Quality that is recognised nationally in terms of originality, significance and rigour.
Unclassified Quality that falls below the standard of nationally recognised work. Or work which does not meet the published definition of research for the purposes of this assessment.
44 HESA is a charitable company funded by subscriptions from HE providers. HESA collects a range of data every year UK-wide from universities, higher education colleges and other differently funded providers of higher education. This data is then provided to UK government and higher education funding bodies to support their work in regulating and funding higher education providers - https://www.hesa.ac.uk/overview

Evaluation systems in international practice
R&D Evaluation Methodology and Funding Principles 71
The research environment will be assessed in terms of its ‘vitality and sustainability.’ Panels will consider both the ‘vitality and sustainability’ of the submitted unit, and its contribution to the ‘vitality and sustainability’ of the wider research base.
Environment sub-profile: Criteria and definitions of starred
levels
Four Star An environment that is conductive to producing research of world-leading quality, in terms of vitality and sustainability.
Three Star An environment that is conducive to producing research of internationally excellent quality, in terms of vitality and sustainability.
Two Star An environment that is conducive to producing research of internationally recognised quality, in terms of its vitality and sustainability.
One Star An environment that is conducive to producing research of nationally recognised quality, in terms of its vitality and sustainability.
Unclassified An environment that is not conducive to producing research of nationally recognised quality.
The criteria for assessing impacts are ‘reach and significance’.
• In assessing the impact described within a case study, the panel will form an overall view about its ‘reach and significance’ taken as a whole, rather than assess ‘reach and significance’ separately.
• In assessing the impact template the panel will consider the extent to which the unit’s approach described in the template is conducive to achieving impacts of ‘reach and significance’. Impact sub-profile: criteria and definitions of starred levels
Four Star Outstanding impacts in terms of their reach and significance.
Three Star Very considerable impacts in terms of their reach and significance.
Two Star Considerable impacts in terms of their reach and significance.
One Star Recognised but modest impacts in terms of their reach and significance.
Unclassified The impact is of little or no reach and significance; or the impact was not eligible; or the impact was not underpinned by excellent research produced by the submitted unit.
Each sub-panel uses its professional collective judgement to form an overall view about each submission and recommends to the main panel an overall quality profile to be awarded to each submission made in its UoA.
The three profiles generated using the above criteria are assigned different weightings and used to create an overall quality profile:
Table 23 UK: Sub-profile weightings in the overall quality profile Component Weight
Outputs 65%
Environment 15%
Impact 20%

Evaluation systems in international practice
72 R&D Evaluation Methodology and Funding Principles
Overall quality profile: Definitions and starred levels
Four Star Quality that is world-leading in terms of originality, significance and rigour.
Three Star Quality that is internationally excellent in terms of originality, significance and rigour but which falls short of the highest standards of excellence.
Two Star Quality that is recognised internationally in terms of originality, significance and rigour.
One Star Quality that is recognised nationally in terms of originality, significance and rigour.
Unclassified Quality that falls below the standard of nationally recognised work. Or work which does not meet the published definition of research for the purposes of this assessment.
Figure 13 UK: Example of how the overall quality profile is created using the weighted sub-profiles for an institution
The four UK higher education funding bodies use the results of the evaluation to selectively allocate funds for research to HEIs on a ‘block grant’ basis. Specific details on funding formula applied to calculate block funding for each HEI is not in the public domain. This funding formula is not in the public domain.
2.5.3 The peer review component Top down versus bottom up organisation of review process
As previously discussed, the REF2014 is undertaken by the four UK higher education funding bodies. It is managed by the REF team based at HEFCE and overseen by a REF steering group, consisting of representatives of the four funding bodies. For clarity this is applicable to all components on the REF exercise, including the implementation of the peer review component.
Participation in the REF is optional for UK HEIs; however, if a HEI chooses not to participate they will not be eligible to receive grants to support research through the four UK higher education funding bodies. It is the outcome of the REF process that informs the selective allocation of these funds to UK HEIs.
There are a number of different review guidelines provided covering the various aspects of the REF process, each of which begins by reiterating the rationale and objectives of the REF. Each of the documents is available in a freely downloadable

Evaluation systems in international practice
R&D Evaluation Methodology and Funding Principles 73
format. The guidelines are particularly detailed, giving precise definitions, process descriptions etc.
The UK HEI’s have no influence over the specific elements of the review process while it is in progress. During the reform of the RAE and the subsequent design of the REF, however, various consultations were run by HEFCE so that UK HEIs could provide input into the process.
The outcomes of the review are used to inform the selective allocation of research funding to UK HEIs from the four UK higher education funding bodies to support research. The allocation of funds begins with HEFCE determining how much funding to provide for research in different subjects, the total for each subject is then divided between institutions. These decisions take into account the volume of research (using research-active staff numbers), the relative costs (reflecting, for example, that laboratory-based research is more expensive than library-based research), any government policy priorities for particular subjects and the quality of research as measured in the RAE / REF. In addition to the main research funding method described, allocations are also made to contribute towards other research-related costs such as funding for the supervision of postgraduate research students, charity related funding and business related funding.
Criteria and indicators
Expert review will be the primary means of assessment and citation data is used to inform judgements made by the panels, thus this is an informed peer review and the two tracks are not kept separately.
For a description of the assessment criteria and indicators, see 0.
Staffing of panels
HEFCE appointed Chairs Designate for each of the main panels. Initially, their role was to provide advice to the REF Manager on the further planning and development of the framework before taking up their role as Main Panel Chairs once these had been appointed.
Sitting underneath the Chair Designate of each panel are the sub-panel chairs appointed in 2010 for the REF, through an open recruitment process and appointed by the chief executives (or equivalent) of the four UK higher education funding bodies following advice from the Main Panels Chair Designate
For the assessment phase of the exercise, additional experts were appointed to assist the work of the sub-panels in assessing submissions. This was to ensure the panels have sufficient breadth and depth of expertise for this task. Sub-panels were invited to identify and advise on the need for additional assessors, which are expected to have professional experience and be practicing researchers with specific expertise.
Panel, sub-panel members and assessors are assigned through a process of nomination. There were 1,950 nominating bodies identified and invited to directly nominate candidates. These bodies included academic associations and other bodies with and interest in research and in nominating candidates to be REF panel members. Any additional association or organisation with a clear interest in the conduct, quality, funding or wider benefits of publically funded research (except for mission groups, UK HEIs and groups or subsidiaries of individual UK HEIs) may also make nominations.
Each sub-panel is required to have expertise across the main fields of research within the UoA and its membership should collectively command the respect of the relevant research and wider communities. Sub-panel members and additional assessors should provide sufficient breadth and depth of expertise to undertake the assessment across the sub-panel’s remit. This includes, as appropriate, expertise in interdisciplinary research and expertise in the wider use or benefits of research. Sub-panels are composed predominately of practicing researchers and members and assessors will be appointed on the basis of their personal experience and expertise and not as representatives of any group or interest. At least one third of sub-panel

Evaluation systems in international practice
74 R&D Evaluation Methodology and Funding Principles
members have RAE panel experience and at least one third will not have RAE panel experience.
In assigning the membership of sub-panels the funding bodies also took into consideration the desirability of ensuring that the overall body of members reflects the diversity of the research community, including age, gender, ethnic origin, scope and focus of their home institution and geographical location. The REF Equalities and Diversity Advisory Group is responsible for monitoring the diversity of panel membership.
Table 24 UK: Panel size and structure for REF 2014
Panel A Panel B Panel C Panel D
Chair Designate 1 1 1 1
Panel members 16 18 20 19
Observers 2 3 1 1
Panel Advisors 3 3 4 4
Number of sub-panels 6 9 11 10
Total number of sub-panel Chairs and Deputy Chairs
12 18 23 20
Total number of sub-panel members
154 154 202 182
Total number of Assessors 60 57 102 85
Total number of Secretariat 12 17 22 20
Structure of panels and sub-panels and division of roles
There are four main panels. Each main panel works with its corresponding sub-panels to initially define common assessment criteria and also throughout the assessment process to ensure that the published procedures are followed and that the overall assessment standards are applied consistently.
Each sub-panel is responsible for assessing submissions to its UoA, applying the published criteria and working methods and recommending the outcomes to the main panel. In the early stages of the assessment, the sub-panels examine the institutions’ submission intentions and identify where additional assessors may be required in order to extend the breadth and depth of expertise where necessary. Assessors are subsequently appointed and once the actual submissions have been made the sub-panel further assessors can be requested if necessary.
The sub-panel chair consults with the deputy chair and sub-panel members to allocate work to according to expertise (taking into account any conflicts of interest). This allocation takes place at the level of individual groups or impact case studies, whole impact templates and whole environment templates. Each sub-panel member and assessor is allocated a significant volume of material to assess, so that each member and assessor makes a significant contribution to the sub-panel’s overall recommendations.
Each impact case study is allocated to at least one academic member and one user member or assessor wherever possible. User assessors will be allocated impact case studies and impact templates only.
Finally, Each main panel is also responsible for deciding on the quality profile to be awarded to each submission in each of the UoA in its remit, following recommendations made by the sub-panels.
The submitting HEI may identify research outputs as interdisciplinary and / or request that specific parts of submissions be cross-referenced to another sub-panel for

Evaluation systems in international practice
R&D Evaluation Methodology and Funding Principles 75
advice. The sub-panels will consider such requests and the most appropriate means of assessing the material in question.
If the sub-panel deems that there is sufficient expertise within the sub-panel to reach a robust judgement, the work will be assessed within the sub-panel. In instances where the sub-panel does not consider itself to contain appropriate expertise it can request that the work be cross-referred to an appropriate sub-panel for advice. These requests are made to the REF manager, who will decide on the requests and cross-refer parts of submission to other sub-panels as necessary. This may occur outside of the main panel to which the sub-panel belongs.
In addition to considering requests made by institutions, sub-panels may identify specific parts of submissions that it considers should be cross-referred to another panel and request that such work be cross-referred. Specific outputs or impact case studies cannot be cross-referred, nor entire submissions.
Concrete activities of panel members
Sub-panels assess all of the components of the submissions, this reflects an underpinning principle that sub-panels will assess each submission in the round. Sub-panels are expected to make collective judgements about the range of submitted information in order to develop the sub-profiles and recommend the overall quality profile for each unit being assessed. They are not expected to make collective judgements about the contributions of individual researchers.
All outputs listed in submissions will be examined by a sub-panel member and / or assessors and are examined with a level of detail sufficient to contribute to the formation of a robust sub-profile for all the outputs in that submission. Additional information i.e. citation data will be considered where relevant. Sub-panels will meet during the course of this process to discuss their assessment of each element of submissions. Assessors are required to attend these meetings when the relevant element of submissions is being discussed so that they can fully contribute on an equal basis with members to the development of the relevant sub-profile. During this process, the sub-panels will be asked to draw attention to any data they would like the REF team to verify through audit.
Sub-panels develop sub-profiles for each of the three elements – output, impact and environment. The three sub-profiles are then combined to form an overall quality profile using the weightings discussed previously. This overall quality profile is then recommended to the main panel on the basis that each sub-panel has:
• Reached a collective decision within the framework of the exercise and in accordance with the published statement of criteria and working methods and debated the reasoning behind the quality profiles in sufficient detail to reach collective conclusions and the recommendations to the main panel will be formed on the basis of this collective judgement.
• If consensus cannot be reached by the sub-panel on the overall quality profiles, decisions will be taken by a majority vote with the chair holding the casting vote.
• Confirmed to the main panel that each submission has been assessed against the published criteria for the UoA and according to the published procedures.
• Confirm that each submission ha been examined in sufficient detail to form robust judgements and that the appropriate expertise has been deployed in assessing submissions.
The panel secretariat will minute the details of the procedures followed by panels’ ad these will be published at the end of the assessment exercise. Details of the panels’ collective judgement about the sub-profiles and overall quality profiles with respect to each submission is also recorded.

Evaluation systems in international practice
76 R&D Evaluation Methodology and Funding Principles
Timing & budget
REF was first implemented in 2014. Prior to this RAEs were carried out in 2008, 2001, 1996 and 1992.
There are no cost estimates to date for the REF2014. Cost estimates for the RAE2008 and RAE2001 are discussed in 0.
Transparency
The REF2014 has a high level of transparency. This is reflected in a number of different ways. To begin with, the objectives and rationale of the REF2014 are clearly laid out on the website www.ref.ac.uk and are presented in each of the documents that REF2014 has produced for submission guidance. Each of these documents is freely downloadable in both pdf and word format.
In addition to providing guidance on the submission process, documents concerning the panel criteria and working methods (including the names of all panel members and the criteria used to recruit them), using the submission system, details of data requirements, further information on submitting research outputs, guidance on citation data, guidance on the environment data, guidance on data management and audit and verification guidance are also available for download.
In addition to guidance material, REF2014 has also made available on the website all related publications, mainly reports commissioned by HEFCE such as pilot exercises for the REF2014 in freely downloadable format.
The results of the REF2014 are due to be published on the REF website in December of this year and 10 hard copies also sent to reach each HEI for the same date. The results will include an overall quality profile (including each of the three subprofiles) awarded to each submission, listed by UoA. These profiles will present the proportions, rounded to 1%, of research activity judged to have met each of the quality levels from 4* to unclassified. The results on the REF website are due to be published by UoA and by HEI with downloadable files containing all of the results to be available. Join submissions will be listed separately against each institution involved in the submission. Contextual data for the REF will be published on the same date by the Higher Education Statistics Association.
Two days before being published on the REF website, the results will be released to the heads of individual HEI and under embargo until they are officially published on the website. Comparative data will also be provided to HEIs at the same time to help interpretation of the results. This comparative data will also be published alongside the official results.
Institutions will be provided with an example format in which the embargoed results will be provided two months in advance.
Confidential feedback will also be provided in January 2015 by the REF team to the head of each HEI, which for each submission will include concise feedback summarising the reason for the quality profiles awarded with reference to the published assessment criteria. The same will be carried out for joint submissions with the heads of all HEIs involved. Feedback will also be provided to the institution on its individual staff circumstances, at institutional level.
In the spring of 2015 each of the submissions made to the REF will be published on the website which will include a list of staff and outputs, the submitted case studies and impact template, the submitted environmental data and template. Personal and contractual details of staff will be removed and other data that the HEI has indicated should not be published for commercial sensitivity or other reasons. HEIs have had the opportunity to provide redacted versions of templates for the purpose of publications.

Evaluation systems in international practice
R&D Evaluation Methodology and Funding Principles 77
Any adjustments made to submissions as a result of audit will be reflected in the published submissions and all HEI audit contacts will be informed of all such data adjustments.
In early 2015, panel overview reports will also be published, a report by each main panel including sections from each sub-panel will detail how the assessment was carried out, provide an overview of the panel’s observations about the state of research in the areas within its remit and general refection’s of the submissions and their assessment.
A report by the REF Equalities and Diversity Panel will also be published which will provide details of EDAP’s work and observations about the equality aspects of the REF.
In addition to all of this, the minutes of the sub-panel and main panel meetings for the assessment phase of the REF will be published as well as a report by the REF manager, detailing how the process was managed in operational terms and reflections on how the implementation of the REF might be improved in the future.
The impact case studies will also be made into a searchable database by the funding bodies in 2015.
Evolution of the review process
There has been considerable support for the principle of a peer review-based assessment system although concerns have been raised regarding the incentives for ‘game-playing’ in the submission of staff, the disincentives to undertake innovative longer-term research and the level of bureaucracy accompanying the process. Further concerns were raised in the Lambert Review of business-university collaboration about the ability of the RAE to adequately promote the value of interdisciplinary research and applied research and in 2006 the government announced their intention to replace the RAE system with an assessment system based on metrics.
Following the development of a working group and a subsequent consultation the development of a revised scheme was announced later in 2006 and in 2007 HEFCE set out its initial plans for the development of the new system.
Initial intentions to reform the existing RAE to an assessment system based on metrics were announced by the government in 2006 following the 2008 RAE. A working group was put together by the government and a consultation developed to look at the reform of high education research, assessment and funding in more detail. Following the consultation, the government announced later in the 2006 pre-budget report45 the development of a revised scheme. Further details were later provided by a letter from the Secretary of State and a press release by the Department for Education and Skills.
In 2007 HEFCE set out its initial plans for reform in the form of a consultation, which was informed by two research and evaluation reports on the potential use of bibliometric techniques:
• Scoping study on the use of bibliometric analysis to measure the quality of research in UK higher education institutions, Center for Science and Technology Studies, University of Leiden
• Bibliometrics analysis of interdisciplinary research, Evidence Ltd.
The outcomes of the consultation were published in early 2008 by HEFCE in three documents:
45 HM Treasury 2006, Pre-budget report 2006: Investing in Britain’s potential: Building our long-term future

Evaluation systems in international practice
78 R&D Evaluation Methodology and Funding Principles
• Analysis of responses to the Research Excellence Framework consultation
• Research Excellence Framework: outcomes of consultation and next steps
• Update on the Research Excellence Framework
In 2008-09, HEFCE conducted a pilot exercise to test and develop bibliometric indicators of research quality for use in the REF. Twenty-two HEI took parts, covering 35 UoA from the 2008 RAE exercise. The pilot exercise concluded that citation information is not sufficiently robust to be used formulaically or as a primary indicator of quality in the REF; but there is scope for such data to inform and enhance the process of expert review. These conclusions drew on feedback from participating institutions, expert advisory groups and consultation with the wider sector. The results were published in the following reports:
• Report on the effect of using normalised citation scores for particular staff characteristics (HEFCE 2011/03)
• Report on the pilot exercise to develop bibliometric indicators (HEFCE 2009/39)
• Interim report on the bibliometrics pilot exercise
• Report on data collection for the bibliometrics pilot exercise
• First report on ‘lessons learned’ from the bibliometrics pilot exercise: data collection, a report to HEFCE by Technopolis
• Second report on ‘lessons learned’ from the bibliometrics pilot exercise: outcomes, a report to HEFCE by Technopolis
In 2009, the UK higher education funding bodies issued a second consultation on proposals for the REF including proposals to assess the impact of research to be developed further through an impact pilot exercise. This exercise took place during 2010 and involved 29 HEI submitting evidence of impact to be assessed by pilot expert panels (main and sub-panel chairs enlisted through an open recruitment process and panel members through a nominations process) in five REF UoA. The key findings of this pilot exercise were published in late 2010 in the following reports:
• Findings of the pilot expert panel, this report is from the chairs of the five pilot expert panels and sets out their findings and recommendations for the assessment of impact in the REF.
• Feedback from the higher education institutions involved in the pilot, a report from Technopolis providing feedback from the 29 pilot institutions on the experience of making their impact submissions to the pilot exercise.
Following the impact assessment pilot exercise, the four UK higher education funding bodies set out their framework for the assessment of impact in the REF and the weightings of the three elements for consideration: outputs, impact and environment. More specifically, this document set out that there will be also be an element to assess impact arsing from excellent research alongside the ‘outputs; and ‘environment’ elements.
The assessment of impact will be based on expert review of case studies submitted by HEIs and can include and social, economic or cultural impact or benefit beyond academia that has taken place during the assessment period that was underpinned by excellent research produced by the submitting institution within a given time frame. These case studies should also include information about how the unit has supported and enabled impact during the assessment period.
A weighting of 25% will be placed on the impact to give due recognition to the economic and social benefits of excellent research. During the first REF (2014), this will be reduced to 20% due to the fact that the impact assessment in REF 2014 will be a developmental process. The assessment of research outputs will account for 65%

Evaluation systems in international practice
R&D Evaluation Methodology and Funding Principles 79
and the environment will account for 15% of the assessment outcomes. These weightings will apply to all UoA.
The 2008 RAE as we have already seen was reformed to produce the REF and the REF 2014 is the first time the system in its reformed state has been implemented. The following changes are the most note-worthy:
• The UoAs and sub-panels have been reduced from 67 to 36 and the main panels from 15 to 4.
• There is greater consistency in the assessment process across all UoAs, including standard weightings between the three elements of assessment and standardisation of a number of criteria, data requirements and procedures. Panel criteria and working methods have been developed at main panel level with input from sub-panels.
• Some sub-panels will make use of citation information provided by the REF team on a consistent basis as additional information about the academic significance of research outputs.
• The REF includes an explicit element to access the non-academic impact of research.
• ‘Esteem’ is no longer included as a distinct element in the assessment.
• The approach to assessing the research environment has bee revised. It is now based on a structured template for textual information and a significantly reduced set of standard data requirements.
• The measures to promote equality and diversity in research careers have been strengthened and will be applied consistently across UoAs.
• Additional assessors will be appointed to extend the breadth and depth of expertise on sub-panels during the assessment phase. The assessor’s role differs to that of the specialist advisors in the 2008 RAE in that they will participate fully in developing the sub-profiles.
• The outcomes of the assessment will be published in steps of 1% rather than 5%.
A review of REF 2014 has been commissioned by HEFCE which when published may help to inform this section more thoroughly.
Weaknesses and criticism
The RAE has evolved. In each round, the formula connecting performance to money was revealed after university submissions were ranked, making it harder to ‘game’ the system. Universities therefore tried to obtain the highest possible grades in all units of assessment. The proportion of institutional research funding distributed through the RAE rose to 90% by 1992. Funds allocation has become non-linear, so that high-ranking groups get much more money than medium-ranking ones. Low-ranking groups get nothing. Over time, fewer papers had to be submitted per researcher and the universities could decide which members of staff to include in their submissions, so university research managers were increasingly able to influence faculty organisation and work patterns. Efforts to include industry in panels failed, owing to the high workload involved (Martin and Whitley, 2010). Pressure of work meant that, even though panellists ostensibly reviewed articles submitted by the universities in order to judge quality, they increasingly relied on journal impact factors as indicators of the quality of articles submitted for review (Bence and Oppenheim, 2005).
The RAE has had a number of potentially problematic effects in terms of funding concentration. Whitley (2007) suggests that such a PRFS is liable to be used in a way that advantages one ‘school’ over another where two institutions coincide: a highly redistributive PRFS. Fundamentally, it is debatable whether or not concentration of research funding is desirable, and if so, to what extent. Intuitively, some concentration towards institutions and departments with excellent track records is sensible.

Evaluation systems in international practice
80 R&D Evaluation Methodology and Funding Principles
However, evidence suggests that concentration through the RAE went beyond this, due to a number of structural factors. The RAE made intensive use of learned societies, subject associations and professional societies to nominate potential panellists (Martin and Whitley, 2010). More broadly, those who publish in and edit high impact factor journals dominate panels. High impact factor journals are used either directly or via the intermediate use of a list of highly regarded journals as evidence of high quality for the purposes of selecting submissions to the RAE (Rafols et al, 2012; Lee and Harley, 1998). University recruitment and promotion criteria adjust towards publication in these journals (and, in the case of the UK, a ‘transfer market’ of people publishing in such journals develops ahead of each Research Assessment Exercise).
The bias of the RAE in favour of monodisciplinary, ‘basic’ research is widely acknowledged (Martin and Whitley, 2010). Past claims have been based on opinion surveys or pure reasoning. There is now stronger evidence: Rafols et al (2012) show statistically that interdisciplinary research (in this case innovation studies, which is part of the same ‘unit of assessment’ as management) is systematically excluded from the highest impact-factor journals, which are dominated by monodisciplinary management papers. Lee (1998, 2013) shows statistically that heterodox economics is adjudged poorly in competition with the mainstream, neoclassical school to which members of the Royal Economic Society and the editors of leading high impact factor journals tend to adhere.
Sastry and Bekhradnia (2006) demonstrate an almost perfect correlation (0.98) between the way research funding was distributed in the RAE and through the research council system, arguing that the same institutions dominate both systems. Barker (2007) shows that the relative outcomes of the UK RAE rounds have been rather stable, largely reinforcing the established order. In the 1996 RAE, 26 of the 192 submitting institutions got 75% of the money. In the 2001 RAE, 174 institutions submitted returns and 24 of them secured 75% of the money (McNay, 2003).
Overall university rankings have changed little. Especially the former polytechnics have not been able to emerge from the ‘tail’ of the RAE system’s funding distribution. This has meant a reduction of the proportion of overall university teaching in the UK that is research-led, as those institutions at the tail of the funding system struggle to raise research funding and thus become teaching rather than research institutions46.
Best practices and lessons learned
The UK RAE, first undertaken in 1986 and renamed REF for the 2014 round, is the longest established PRFS. It is seen as having increased the quality of UK university research, encouraged universities to develop research strategies and maximised research returns for limited funding (Clark, 2006). A reason for the RAE’s success is said to be that there was a gap of several years between successive exercises, allowing time for universities and individual researchers to change their behaviour (Taylor and Taylor, 2003). 47
The Dual Funding components show opposite movements to each other. In terms of mainstream QR funding the data shows a pattern of increased concentration in the first part of the decade, followed by a decrease. Concentration of mainstream QR funding across institutions has tended to become more evenly spread and by 2010 it was the least concentrated of all sources.7 The increase in concentration (shown as a fall in the Inverse Herfindahl Index in Exhibit 2.3) between 2009 and 2010 reflects of
46 Arnold, E., Farla, K., Kolarz, P., Mahieu, B., Peter, V., The role of metrics in performance-based research funding systems. A report to the Russell Group, Technopolis Group, 2014
47 Arnold, E., Farla, K., Kolarz, P., Mahieu, B., Peter, V., The role of metrics in performance-based research funding systems. A report to the Russell Group, Technopolis Group, 2014

Evaluation systems in international practice
R&D Evaluation Methodology and Funding Principles 81
the change in the weighting given to the profiling of research based on the 2008 RAE between those years. The weighting used in 2010/11 gave more weight to the highest category of quality assessment than used for 2009/10. This had the effect of rebalancing the allocation towards the most research intensive universities which had more of their research profile in the higher grades. The result was an increase in concentration between 2009 and 2010 reflected in the movement of the index48.
2.5.4 Self-evaluation The self-assessment of the research environment is an important component of the RAE/REF evaluations. This has been covered previously.
2.5.5 Appendixes Use of output indicators in the panels, REF2014
Output Type Scholarly Output / indicators Panel A Panel B Panel C Panel D
Academic outputs
papers in conference proceedings Y Y Y Y research reports Y Y monographs Y Y Y
books and book chapters
Y Y Y
Y (authored or edited)
technical reports, including confidential reports Y standards documents Y research derived from development, analysis and interpretation of bio- informatic databases; Y working papers. Y Y exhibition or museum catalogues; curatorship and conservation Y translations; scholarly editions; grammars, dictionaries Y creative writing and compositions Y Case notes; catalogues; publications of development donors; published maps; Y Advisory report Y the creation of archival or specialist collections Y
48 Hughes, A., Kitson, M., Bullock, A., Milner, I., The Dual Funding Structure for Research in the UK: Research Council and Funding Council Allocation Methods and the Pathways to Impact of UK Academics, Centre for Business Research (CBR), UK Innovation Research Centre (UK-IRC), Department fro Business, Innovation and Skills, February 2013

Evaluation systems in international practice
82 R&D Evaluation Methodology and Funding Principles
to support the research infrastructure policy evaluations/reports/commissioned reports; primary data reports; Y critical review articles; systematic reviews; Y teaching, curriculum and assessment materials and textbooks (including those for training and/or for practice) where they embody original research; Y outputs from projects commissioned by all levels of government, industry and other research funding bodies; Y
IPR
Patents Y Y Y published patent applications Y Other forms of IPR Y
Digital artefacts
work published in non- print media. Y Y data sets, multi-use data sets Y Y archives Y film and other non-print media Y Y web content such as interactive tools Y software (design & development) Y Y Y Y Computer codes & algorithms Y digital and broadcast media Y Designs; design codes Y Y
Physical artefacts
Buildings Y Installations Y new materials; Y Y Y images Y Y new devices Y Y Y new products & processes Y Y Prototypes Y
Temporary artefacts
Exhibitions Y Y performances and other types of live presentation Y Y

Evaluation systems in international practice
R&D Evaluation Methodology and Funding Principles 83
Use of bibliometrics in the REF2014
The table below shows the use of different bibliometric data (citations data or journal impact factors) by the different panels in the REF 2014. The information is provided against fields reflecting the OECD classification that is used in this study.
Major area (OECD) Field (OECD)
Citation
JIF WOS/Scopus
1. Physical Sciences
1.1 Mathematics Yes
1.2 Physical sciences Yes Yes
1.3 Chemical sciences Yes Yes 1.4 Earth and related environmental sciences Yes Yes
1.5 Other natural sciences Yes Yes
2. Engineering and Technology
2.1 Civil engineering 2.2 Electrical engineering, electronic engineering, information engineering
2.3 Computer and information sciences Yes Yes
2.4 Mechanical engineering
2.5 Chemical engineering
2.6 Materials engineering
2.7 Medical engineering
2.8 Environmental engineering
2.9 Environmental biotechnology
2.10 Industrial Biotechnology
2.11 Nano-technology 2.12 Other engineering and technologies
3. Medical and Health Sciences
3.1 Basic medicine Yes Yes
3.2 Clinical medicine Yes Yes
3.3 Health sciences Yes Yes
3.4 Health biotechnology Yes Yes
3.5 Other medical sciences Yes Yes
4. Biological and Agricultural Sciences
4.1 Biological sciences Yes Yes 4.2 Agriculture, forestry, and fisheries Yes Yes
4.3 Animal and dairy science Yes Yes
4.4 Veterinary science Yes Yes
4.5 Agricultural biotechnology Yes Yes
4.6 Other agricultural sciences Yes Yes
5. Social Sciences
5.1 Psychology Yes Yes
5.2 Economics and business
Economics & econometrics
Economics & econometrics
5.3 Educational sciences
5.4 Sociology
5.5 Law

Evaluation systems in international practice
84 R&D Evaluation Methodology and Funding Principles
Major area (OECD) Field (OECD)
Citation
JIF WOS/Scopus
5.6 Political Science
5.7 Social and economic geography
5.8 Media and communications
5.9 Other social sciences
6. Humanities
6.1 History and archaeology
6.2 Languages and literature
6.3 Philosophy, ethics and religion 6.4 Art (arts, history of arts, performing arts, music)
6.5 Other humanities
References
Hughes, A., Kitson, M., Bullock, A., Milner, I., The Dual Funding Structure for Research in the UK: Research Council and Funding Council Allocation Methods and the Pathways to Impact of UK Academics, Centre for Business Research (CBR), UK Innovation Research Centre (UK-IRC), Department fro Business, Innovation and Skills, February 2013
Arnold, E., Farla, K., Kolarz, P., Mahieu, B., Peter, V., The role of metrics in performance-based research funding systems. A report to the Russell Group, Technopolis Group, 2014
HEFCE 2009, RAE 2008 Accountability Review
HM Treasury 2006, Pre-budget report 2006: Investing in Britain’s potential: Building our long-term future
Dept for Education and Skills (2006), Response to consultation on successor to RAE
HEFCE (2007), Research Excellence Framework Consultation on the assessment and funding of higher education research post-2008
HEFCE (2008), Analysis of responses to the Research Excellence Framework consultation
HEFCE (2008), Research Excellence Framework: outcomes of consultation and next steps
HEFCE (2008), Update on the Research Excellence Framework
HEFCE (2009), Report on the pilot exercise to develop bibliometric indicators for the Research Excellence Framework
HEFCE (2009), Interim report of the REF bibliometrics pilot exercise
HEFCE (2010), REF Research Impact Pilot Exercise Lessons-Learned Project Feedback on Pilot Submissions
HEFCE (2011), Analysis of data from the pilot exercise to develop bibliometric indicators for the REF: The effect of using normalised citation scores for particular staff characteristics
HEFCE (2011), Decisions on assessing research impact

Evaluation systems in international practice
R&D Evaluation Methodology and Funding Principles 85
3. Practice of interest in 5 other countries
3.1 Australia The Australian evaluation system is the Excellence in Research Australia (ERA). It is administered by the Australian research Council (ARC, and 41 institutions are eligible for evaluation (2013). The next round of the ERA is the ERA 2015. The ERA seeks to establish the competencies of Australia’s higher education in specific research fields rather than the competencies of individual researchers or research departments.
As stated in the ERA 2015 application guidelines49, the objectives of ERA are to:
• Establish an evaluation framework that gives government, industry, business and the wider community assurance of the excellence of research conducted in Australian higher education institutions;
• Provide a national stocktake of discipline level areas of research strength and areas where there is opportunity for development in Australian higher education institutions;
• Identify excellence across the full spectrum of research performance;
• Identify emerging research areas and opportunities for further development; and
• Allow for comparisons of research in Australia, nationally and internationally, for all discipline areas.
The ERA is used to collect reliable and credible data about the quality of research of the higher education system of Australia. Research quality as a key emphasis stems from the 1990s, when research evaluation was such that quantity of outputs was rewarded, leading to an increase in research outputs in Australia, but a drop in quality as measured by citations. To address this problem, evaluation systems focused more on quality than quantity were established, resulting first in the Research Quality Framework (RQF), which in 2008 was then replaced with the ERA, with full ERA assessment rounds running in 2010 and 2012, and the next due in 2015.50 The ERA is used as a quality assurance and accountability tool but also to reward excellence in research. Moreover, on the basis of the data, Australia can support the strengthening of strategic research capacity.
3.1.1 Level of assessment Categorisation of the scientific fields
One of the key distinguishing factors of the Australian system is the attention devoted to differences between disciplines and fields of science. The expectations, and especially the assessment methodology and required data submission vary greatly by discipline. Underpinning the distinctions is the Australian and New Zealand Standard Research Classification (ANZSRC). This is an extensive document that classifies research fields at four different levels, and is used for many purposes related to comparison and interoperability besides the ERA by the Australian Bureau of Statistics and Statistics New Zealand.51 The ERA draws on this data to sub-divide
49 ERA 2015. ERA 2015 Submission Guidelines, Australian Government, Australian Research Council. See also the ERA–SEER 2015 Technology Pack the ERA 2015 Discipline Matrix, and the ERA 2015 Submission Journal List, Submission Conference List and Submission Publisher List—provided as a tables in Microsoft Excel format
50 Acil Allen Consulting (2013) Benefits Realisation Review of Excellence in Research for Australia. Final Report. Report to the Australian research Council, 27 September 2013.
51 For the full document, see: http://www.arc.gov.au/pdf/ANZSRC_FOR_codes.pdf

Evaluation systems in international practice
86 R&D Evaluation Methodology and Funding Principles
research and science into three levels of distinction. The first of these, ‘Clusters’, is the most general level, and this division exists for administrative purposes only: each cluster has a Research Evaluation Committee (REC)52 consisting of internationally recognised experts responsible for evaluating the performance of Australian research institutions. However, the evaluation itself happens at a different level: each cluster then is divides into several Fields of Research (FoR), each supplemented with a two-digit numeric code, each of which is in turn sub-divided into several more specific Fields of Research (FoR) with a four-digit code. To give an example: Cluster FoR (2 digits) FoR (4 digits)
Title PCE (Physical, Chemical and Earth Sciences
Physical Sciences Astronomical and space Sciences
Code n/a 02 0201
Overall number 8 22 157
Evaluation is conducted at the level of FoR4, and occasionally FoR2, within the institution. Crucially, each FoR4 has its own prescribed assessment method, where for instance FoRs in many hard sciences will be subjected to citation analysis, whilst in many humanities they will not. Conversely, peer-review does not apply in several hard science fields. Meanwhile, applied measures such as registered designs are only applicable in the more applied sciences. Additionally, each FoR2 also has its own method components, usually some form of aggregate of all FoR4s within it. The full matrix of Clusters, FoR2s and FoR4s, each with all applicable assessment method components noted is perhaps the most crucial tool to understanding the ERA. It is available at:
http://www.arc.gov.au/pdf/ERA15/ERA%202015%20Discipline%20Matrix.pdf
Unit of Assessment
The Unit of Assessment is the Field of Research within the institution, specifically either the 2-digit or 4-digit FoR. Which of the two is chosen depends on the size of the Evaluation Unit at the institution concerned, or more specifically, the volume of outputs. Put simply, this means that in a small research department, FoR2 will be used, whilst in larger research departments, activity will be broken up into FoR4s. This system is designed to ensure more meaningful comparisons of roughly similar-sized Evaluation units.
The decisive factor is the designated Low Volume Threshold of 50 apportioned research outputs. The documentation notes:
…the low volume threshold is the equivalent of 50 submitted apportioned research outputs. This means that, if the number of submitted apportioned research outputs over the six year research outputs reference period is equivalent to fewer than 50 in any four-digit or two-digit FoR at an institution, no evaluation will be conducted for that FoR at that institution. […]An institution may meet the low volume threshold for a two-digit FoR regardless of whether or not it has met the low volume threshold for any of the four-digit FoRs within that two-digit FoR. This is because outputs from all the four-digit FoRswithin that two-digit FoR are aggregated for evaluation purposes to the two-digit level. For example, an institution may have 20 apportioned outputs in
52 See also http://www.arc.gov.au/era/era_2015/2015_keydocs.htm

Evaluation systems in international practice
R&D Evaluation Methodology and Funding Principles 87
each of three four-digit FoRs within the one two-digit FoR. The institution will not meet the low volume threshold in any of the four-digit FoRs but will meet the low volume threshold in this two-digit FoR.53
The ERA2015 makes a distinction for the Low Volume Threshold between fields where the assessment will be done through bibliometrics and others. For the ‘bibliometric fields’, the threshold is expressed in 50 indexed apportioned journal articles (50IJ); for the other fields it is expressed in 50 apportioned weighted outputs (50WO).
The FoRC that have at least 50 apportioned journal articles over a six -year period, - at either the 4 digit FoRC or 2 digit FoRC - undergo citation analysis, whenever the ARC regards citation analysis in the specific discipline to yield robust indicators.
The ERA uses a broad range of assessment tools, including bibliometric and non-bibliometric indicators, as well as peer review. Crucially, these are not all used equally across all disciplines. Instead, each FoR4 has its own assigned combination of techniques to be used. Citation analysis is used more extensively in the sciences and peer review is used more extensively in social sciences, humanities and computing. When the low-threshold is not met, the FoRC discipline and indicators are reported but not formally assessed.
Table 25 lists the ERA 2015 field categories and the use of bibliometrics/thresholds applied.
Table 25 Australia: List of FoR, low volume threshold and use of bibliometrics FoRCode FoRTitle Low
Volume Threshold
Journal Article Citation Analysis
Exceptions: threshold 50WO & peer review
1 Mathematical Sciences 50IJ Yes* Pure Mathematics
2 Physical Sciences 50IJ Yes
3 Chemical Sciences 50IJ Yes
4 Earth Sciences 50IJ Yes
5 Environmental Sciences 50IJ Yes
6 Biological Sciences 50IJ Yes
7 Agriculture and Veterinary Sciences
50IJ Yes
8 Information and Computing Sciences
50WO -
9 Engineering 50IJ Yes
10 Technology 50IJ Yes* Communications technologies & Computer hardware
11 Medical and Health Sciences
50IJ Yes
12 Built Environment and Design
50WO -
13 Education 50WO -
14 Economics 50WO -
15 Commerce, Management, Tourism and Services
50WO -
53 http://www.arc.gov.au/pdf/ERA15/ERA%202015%20Submission%20Guidelines.pdf page 14-15

Evaluation systems in international practice
88 R&D Evaluation Methodology and Funding Principles
FoRCode FoRTitle Low Volume Threshold
Journal Article Citation Analysis
Exceptions: threshold 50WO & peer review
16 Studies in Human Society 50WO -
17 Psychology and Cognitive Sciences
50IJ Yes
18 Law and Legal Studies 50WO -
19 Studies in Creative Arts and Writing
50WO -
20 Language, Communication and Culture
50WO -
21 History and Archaeology 50WO -
22 Philosophy and Religious Studies
50WO -
Source: ERA 2015 Matrix
The ERA 2015 peer review process only covers a sample of the total research output submitted: research institutions are required to nominate 30% of the output value, proportionally distributed over the different types of research output (e.g. 30% to books, and 30% to articles), to each four-digit field. Assessments are only made at the FoRC 4 level when the volume of apportioned outputs is 50 or greater over a six-year period. Otherwise, the assessment is based on the FoRC 2 level.
Books are given an effective weighting of 5:1 compared with other research outputs for the purposes of determining the low volume threshold in these disciplines; for other purposes in ERA they are counted as a single research output (see ERA 2015 submission guidelines)
Academics included in the evaluation and criteria
The criteria for submissions are outlined extensively in the ERA 2015 Submission Guidelines. In brief, eligible researchers are identified by the following criteria:
• Researchers must be affiliated with the institution on designated staff census dates. For 2015 ERA submission for instance, the staff census date is 31 March 2014.
• Researchers must meet the definition of a ‘member of staff’, reflecting the definition in the Higher Education Staff Data Collection (HESDC): A ‘member of staff’ is defined as a person who performs duties for the institution or one of its controlled entities, and is either:
− a person employed by the institution or one of its controlled entities on a full time or fractional full time basis
− a person employed by the institution or one of its controlled entities on a casual basis;
− an employee of another institution who is working at the institution or one of its controlled entities as either:
� ‘Visiting staff’ or
� ‘Exchange staff’ or
� ‘Seconded staff’ or

Evaluation systems in international practice
R&D Evaluation Methodology and Funding Principles 89
� a person who works for the institution or one of its controlled entities on a regular basis but who receives no remuneration (e.g. members of religious denominations, unpaid visiting fellows)54
A flowchart from the ERA 2015 submission guidelines is shown below for further illustration. Institutions are required to submit information on all eligible researchers and on all eligible research output that has been produced within the specified reference periods.
Source: Australian Research Council (2014) ERA 2015 Submission Guidelines
Eligible outputs
Research outputs eligible for submission must be research that has created new knowledge and/or has used existing knowledge in a new and creative way. For ERA 2015, eligible output includes:
• Books—Authored Research;
• Book—Chapters in Research Books;
• Journal Articles—Refereed, Scholarly Journal; and
• Conference Publications—Full Paper Refereed.
The ERA 2012 Journal List includes 22,414 scholarly journals. A journal article must be published in a journal included in the list in order to be submitted as a journal article in ERA. Criteria for inclusion in the journal list are that journals
• Were active during the ERA 2012 reference period for research outputs (1 January 2005–31 December 2010);
• Are scholarly
• Have peer or editorial review policies acceptable to the discipline
54 Australian Research Council (2014) ERA 2015 Submission Guidelines

Evaluation systems in international practice
90 R&D Evaluation Methodology and Funding Principles
• Have an ISSN55
Researchers and research items can be assigned up to three four-digit codes. Percentage appointment must be provided for the different codes.
The type of academic outputs included are different per field. Table 26, below, lists the types of outputs that were taken into account in the different review panels.
Table 26 Australia: Eligible academic outputs per field
Non-traditional outputs by type
FoR
Cod
e
FoRTitle Books Book Chap-ters
Journal articles
Conference Publications
Other NTRO
Research Report for External Body
1 Mathematical Sciences Yes* Yes* Yes* Yes* - Yes*
2 Physical Sciences - - - - - -
3 Chemical Sciences - - - - - -
4 Earth Sciences - - - - - -
5 Environmental Sciences - - - - - -
6 Biological Sciences - - - - - -
7 Agriculture and Veterinary Sciences - - - - - -
8 Information and Computing Sciences Yes Yes Yes Yes - Yes
9 Engineering - - - - - -
10 Technology Yes* Yes* Yes* Yes* - Yes*
11 Medical and Health Sciences - - - - - -
12 Built Environment and Design Yes Yes Yes Yes Yes Yes
13 Education Yes Yes Yes Yes Yes Yes
14 Economics Yes Yes Yes Yes Yes Yes
15 Commerce, Management, Tourism and Services
Yes Yes Yes Yes Yes Yes
16 Studies in Human Society Yes Yes Yes Yes Yes Yes
17 Psychology and Cognitive Sciences - - - - - -
18 Law and Legal Studies Yes Yes Yes Yes Yes Yes
19 Studies in Creative Arts and Writing Yes Yes Yes Yes Yes Yes
20 Language, Communication and Culture
Yes Yes Yes Yes Yes Yes
21 History and Archaeology Yes Yes Yes Yes Yes Yes
22 Philosophy and Religious Studies Yes Yes Yes Yes Yes Yes
55 ERA 2012 Evaluation Handbook. Australian Government, Australian Research Council

Evaluation systems in international practice
R&D Evaluation Methodology and Funding Principles 91
Notes: * applicable only for some sub-fields
3.1.2 Indicators and scoring systems Australia implemented the first first-order indicator model in 1990 (Hansen for the OECD, 2010) using four indicators common to all areas:
• Institutions’ ability to attract research grants in competition
• Number of publications
• Number of masters and PhD students (stock)
• Number of masters and PhD students finishing on time.
The Research Quality Framework (RQF) that was proposed thereafter was more RAE-like, based on peer review panels, but also including end-user assessments of impact on the economy and society. This system was criticised for being costly and non-transparent and when a new government took over in 2007, it was never implemented.
ERA 2010 was the first detailed ERA evaluation covering all disciplines.56 As stated in the ERA 2010 Handbook, in 2008 the ARC convened an indicator development group (IDG) that comprised of experts in metrics and statistics. This IDG defined discipline appropriate indicators to measure research quality. The appropriateness of the discipline indicators was tested using discipline cluster workshops and indicator consultation papers.
On the basis of the evaluation of ERA 2010 and consultation some changes were introduced in ERA 2012. These changes included:
• Changes in the method of evaluation, introducing peer review to the evaluation of specific – subfields (instead of citation analysis).
• Introduction of a category of Non-traditional Research Outputs (NTRO) to the 2-digit codes Economics (14) and Studies in Human Society (16) and their relevant 4-digit codes. This change allows institutions to submit research outputs such as policy documents.
The ERA 2015 includes (more quantitative) bibliometric and non-bibliometric indicators and (more qualitative) peer review. As such, each unit of evaluation is assessed through expert review, which draws on various field-specific combination of peer review (based of 30% or the unit’s outputs) and what the ERA ERA evaluation handbook describes as an indicator suite. The Expert review draws on this set of available information to score each unit on a five point scale (see below).
Description of the indicators
Following ERA 2012, further adjustments were made to the ERA submission guideline (discussed above).
The ERA 2012 indicators comprise of:57
Type Indicators
Volume and Activity
• Staffing Profile (total headcount) • Volume of Research Outputs (books, book chapters,
journal articles, conference publications)
56 ERA 2012 Evaluation Handbook. Australian Government, Australian Research Council
57 ERA 2012 Evaluation Handbook. Australian Government, Australian Research Council

Evaluation systems in international practice
92 R&D Evaluation Methodology and Funding Principles
Publishing Profile
• Journal articles • Conference publications • Books • Book Chapters
Citation Analysis of journal articles (using Scopus)
• Centile Profile • Relative Citation Impact (RCI) Classes • RCI against world and Australian benchmarks
Esteem Measures
• Editor of prestigious works of reference • Recipient of (Category 1) Fellowship or Australia Council
Grant or Fellowship • Membership of, statutory committee or Learned
Academy
Research Income
• Australian competitive grants • Other public sector research income • Industry and other research income • Competitive research centre income
Applied measures
• Patents • Commercialisation Income • Plant Breeder’s Rights • NHMRC Endorsed Guidelines • Registered Designs
As noted, this is effectively a ‘suite’ of indicators, which are combined in a number of different ways to suit each FoR. This meant it was important to start out with this relatively broad range of indicators. Yet, each one was developed and chosen to meet certain criteria aimed at achieving meaningful comparison and benchmarking. As set out in the ERA 2012 handbook (pp. 21), the indicators are designed under eight criteria:
1. Quantitative—objective measures that meet a defined methodology that will reliably produce the same result, regardless of when and by whom the principles are applied.
2. Internationally recognised—while not all indicators will allow for direct international comparability, the indicators must be internationally-recognised measures of research quality. Indicators must be sensitive to a range of research types, including research relevant to different audiences (e.g. practitioner focused, internationally relevant, nationally- and regionally-focused research). ERA will include research published in non-English language publications.
3. Comparable to indicators used for other disciplines—while ERA evaluation processes will not make direct comparisons across disciplines, indicators must be capable of identifying comparable levels of research quality across disciplines.
4. Able to be used to identify excellence—indicators must be capable of assessing the quality of research, and where necessary, focused to identify excellence.
5. Research relevant—indicators must be relevant to the research component of any discipline.
6. Repeatable and verifiable—indicators must be repeatable and based on transparent and publicly available methodologies. This should allow institutions to reproduce the methodology in-house. All data submitted to ERA must be auditable and reconcilable.

Evaluation systems in international practice
R&D Evaluation Methodology and Funding Principles 93
7. Time-bound—indicators must be specific to a particular period of time as defined by the reference period. Research activity outside of the reference period will not be assessed under ERA other than to the extent it results in the triggering of an indicator during the reference period.
8. Behavioural impact—indicators should drive responses in a desirable direction and not result in perverse unintended consequences. They should also limit the scope for special interest groups or individuals to manipulate the system to their advantage.
For the ERA 2015, Table 27 lists the relevant reference period by year. The eligibility of researchers is also dependent on the eligibility of output.
Table 27 Australia: ERA 2015 reference period
Data Type Reference Period Years
Research Outputs 1 January 2008 – 31 December 2013 6
Research Income 1 January 2011 – 31 December 2013 3
Applied Measures 1 January 2011 – 31 December 2013 3
Esteem Measures 1 January 2011 – 31 December 2013 3
Source: ERA 2015 Submission Guidelines, Australian Government, Australian Research Council
Table 28 and Table 29, below, show the types of esteem and applied measures that were taken into account in the different FoR.
Table 28 Australia: ERA 2015 Esteem measures
FoR
Cod
e
FoRTitle Editor Prestigious Works of Reference
Membership of learned academy
Category 1 research fellowships
Membership of statutory committees
Australia Council Grants or Fellowships
1 Mathematical Sciences
- Yes Yes - -
2 Physical Sciences - Yes Yes - -
3 Chemical Sciences
- Yes Yes - -
4 Earth Sciences - Yes Yes - -
5 Environmental Sciences
- Yes Yes - -
6 Biological Sciences
- Yes Yes - -
7 Agriculture and Veterinary Sciences
- Yes Yes - -
8 Information and Computing Sciences
- Yes Yes - -
9 Engineering - Yes Yes - -
10 Technology - Yes Yes - -
11 Medical and Health Sciences
- Yes Yes Yes* -
12 Built Environment and Design
Yes Yes Yes - -
13 Education Yes Yes Yes - -
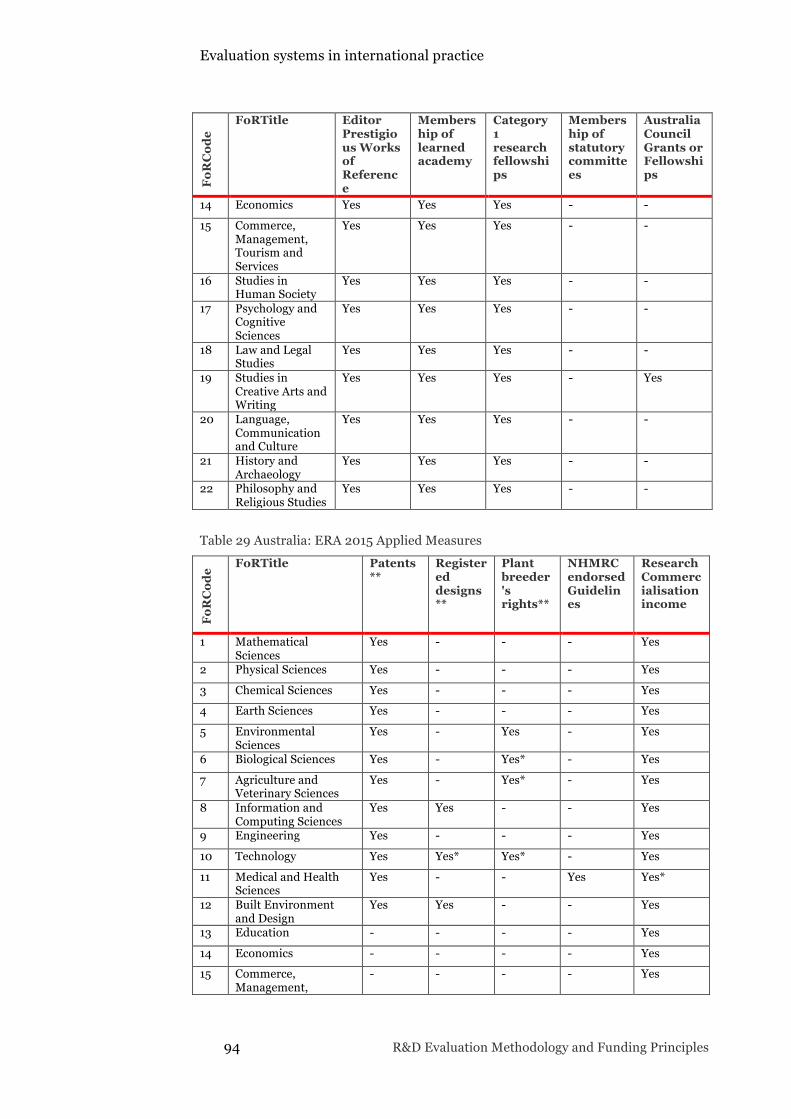
Evaluation systems in international practice
94 R&D Evaluation Methodology and Funding Principles
FoR
Cod
e
FoRTitle Editor Prestigious Works of Reference
Membership of learned academy
Category 1 research fellowships
Membership of statutory committees
Australia Council Grants or Fellowships
14 Economics Yes Yes Yes - -
15 Commerce, Management, Tourism and Services
Yes Yes Yes - -
16 Studies in Human Society
Yes Yes Yes - -
17 Psychology and Cognitive Sciences
Yes Yes Yes - -
18 Law and Legal Studies
Yes Yes Yes - -
19 Studies in Creative Arts and Writing
Yes Yes Yes - Yes
20 Language, Communication and Culture
Yes Yes Yes - -
21 History and Archaeology
Yes Yes Yes - -
22 Philosophy and Religious Studies
Yes Yes Yes - -
Table 29 Australia: ERA 2015 Applied Measures
FoR
Cod
e FoRTitle Patents **
Registered designs**
Plant breeder's rights**
NHMRC endorsed Guidelines
Research Commercialisation income
1 Mathematical Sciences
Yes - - - Yes
2 Physical Sciences Yes - - - Yes
3 Chemical Sciences Yes - - - Yes
4 Earth Sciences Yes - - - Yes
5 Environmental Sciences
Yes - Yes - Yes
6 Biological Sciences Yes - Yes* - Yes
7 Agriculture and Veterinary Sciences
Yes - Yes* - Yes
8 Information and Computing Sciences
Yes Yes - - Yes
9 Engineering Yes - - - Yes
10 Technology Yes Yes* Yes* - Yes
11 Medical and Health Sciences
Yes - - Yes Yes*
12 Built Environment and Design
Yes Yes - - Yes
13 Education - - - - Yes
14 Economics - - - - Yes
15 Commerce, Management,
- - - - Yes

Evaluation systems in international practice
R&D Evaluation Methodology and Funding Principles 95
FoR
Cod
e FoRTitle Patents **
Registered designs**
Plant breeder's rights**
NHMRC endorsed Guidelines
Research Commercialisation income
Tourism and Services
16 Studies in Human Society
- - - - Yes
17 Psychology and Cognitive Sciences
- - - - Yes
18 Law and Legal Studies - - - - -
19 Studies in Creative Arts and Writing
Yes Yes - - Yes
20 Language, Communication and Culture
- - - - Yes
21 History and Archaeology
Yes* - - - Yes
22 Philosophy and Religious Studies
- - - - Yes
Scoring system & weights
Given the emphasis placed by ERA on the differences between FoRs, with tailored mixtures of assessment tools for each one, there can be no unified scoring and weighting system as such. Once again, the ERA discipline matrix details the mix of assessment tools to be used respectively for each FoR. Ultimately, the expert reviewers classify each FoR within each institution on a five-point scale. Figure 14 presents the rating scale used for ERA 2015 evaluations.
Figure 14 Australia: ERA 2012 scale
Rating Description
5 The Unit of Evaluation profile is characterised by evidence of outstanding performance well above world standard presented by the suite of indicators used for evaluation.
4 The Unit of Evaluation profile is characterised by evidence of performance above world standard presented by the suite of indicators used for evaluation.
3 The Unit of Evaluation profile is characterised by evidence of average performance at world standard presented by the suite of indicators used for evaluation.
2 The Unit of Evaluation profile is characterised by evidence of performance below world standard presented by the suite of indicators used for evaluation.
1 The Unit of Evaluation profile is characterised by evidence of performance well below world standard presented by the suite of indicators used for evaluation.
n/a Not assessed due to low volume. The number of research outputs does not meet the volume threshold standard for evaluation in ERA
Source: ERA 2012 Evaluation Handbook. Australian Government, Australian Research Council
Moving from the various indicators and peer review results to a final placement on the scale, even at the level of individuals FoRs, is not accomplished by designated weightings as such. Instead, there is a substantial amount of implicit trust in the expert reviewers’ judgement, with some generic criteria on how to move from the mix of field-specific assessment tools to a final verdict. These are noted in the ERA evaluation handbook, and include:

Evaluation systems in international practice
96 R&D Evaluation Methodology and Funding Principles
• REC members exercise their knowledge, judgment and expertise to reach a single rating for each UoE. In reaching a rating, REC members take account of all of the supporting evidence, which is submitted for the UoE. REC members do not make comment about the contributions of individual researchers
• The rating for each UoE reflects the REC members’ expert and informed view of the characteristics of the UoE as a whole. In all cases the quality judgments relate to all of the evidence, including the entire indicator suite, and the ERA Rating Scale. In order to achieve a rating at a particular point on the scale, the majority of the output from the UoE will normally be expected to meet the standard for that rating point. Experience has demonstrated that there is normally a variety of quality within a UoE
• The ‘banding’ of quality ratings assists REC members in determining a final rating. If, for example, a UoE has a preliminary rating at the top margin of the ‘4’ band based on the assessment of the quality of the research outputs, other indicators (e.g. income or esteem measures) may be sufficient to raise the rating into the ‘5’ band. The lack of such indicators will not, however, be used to lower a rating58
3.1.3 Reflections on intended & non-intended effects Effects of the use of the indicators
The advantage of using indicators to benchmark research performance is that, to some extent, this reporting can stimulate research into strategic areas of importance, or types of outputs. An evaluation of ERA 2012 indicates that there have indeed been benefits to strategy, coordination and management at the institutions.59
Butler’s60 criticisms of the ERA made in 2003 still appear valid today: Butler argued that since the introduction of the research evaluation system in Australia, there has been an increase in the journal publication productivity and a decline in the impact or the quality of the research output. As a result of the ‘comprehensive’ reporting approach, it seems that research institutes are under pressure to produce (and report) relatively large research volumes (books, chapters, etc.). This ‘publish or perish’ culture can generate substantial pressure on researchers; especially young researchers that have more job uncertainly. It appears that this has a negative side effect on the quality of research. At the same time, the ERA does not evaluate impact as such, and hence does not stimulate the creation of high impact research. Whilst quality of research is now very much on the agenda, the low-volume threshold still necessitates a certain emphasis on quantity of outputs, meaning that the long-established problem with research in Australia is still present to some extent.
Martin (2011) also notes several more general problems with the ERA that have already been noted earlier (eg the time-intensive submission efforts), but also notes some noteworthy effects more closely related to specific indicators:
• Inputs counted as outputs
In Australia, grant successes seem to be treated as a measure of research success more than most other countries (Allen 2010). Peer review of grant applications is one measure of quality, but grant monies
58 ERA 2012 Evaluation Handbook. Australian Government, Australian Research Council
59 Acil Allen Consulting (2013) Benefits Realisation Review of Excellence in Research for Australia. Final Report. Report to the Australian research Council, 27 September 2013.
60 Butler (2003) Explaining Australia’s increased share of ISI publications—the effects of a funding formula based on publication counts, Research Policy 32, 143–155.

Evaluation systems in international practice
R&D Evaluation Methodology and Funding Principles 97
themselves are inputs to research, not outputs. ERA continues the emphasis on grants. Big grants are seen as more prestigious, even when there are no more outputs
• Disciplinary boundries
ERA categories are built primarily around disciplines. Interdisciplinary researchers often publish in a range of journals. Their outputs are spread over several different research codes, thus weakening a university’s claim to have concentrations of excellent research. The result is that more narrowly specialised research is encouraged at the expense of cross-disciplinary innovation.
• Susceptibility to misuse
ERA is supposed to be used to measure the performance of institutions and research groups, not individuals. However, it did not take long before university managers began enforcing ERA-related measures on individual academics, for example by rewarding those who published in A and A* journals or brought in research grants. Academics are at risk of missing out on appointments or promotions, or even losing their jobs, if their performance falls short in ERA measures, no matter how outstanding they might be otherwise.61
The effects of evaluation
A report was published in 2013, detailing the benefits of the ERA 2012. It concluded that ERA 2012 had lead to benefits in terms of research performance, university planning, strategy and operations, as well as accountability, transparency and policy-making. The table below summarises the specific benefits and resulting impacts that the study found.
Influence of
ERA Benefit Impact
Research performance
Better quality research
• Attract and retain international students and academic staff
• Generate economic benefits to regions where universities are located
• Increase the absorptive capacity of businesses • Encourage new partnerships with other researchers and
with industry • Enhance Australian researchers’ access to international
networks • Enhance the economic, social, cultural and
environmental benefits of research
Increased social rate of return of university research
61 Martin B (2011) ERA: Adverse Consequences. Australian Universities’ review, 53(2) pp. 99-102

Evaluation systems in international practice
98 R&D Evaluation Methodology and Funding Principles
Influence of ERA Benefit Impact
Focusing research effort
• Enhance coordination and improve resource allocation • Enhance the concentration of research, resulting in
increased financial returns, greater collaboration with industry and gaining an influential role in international research collaboration
• Avoid research duplication as a result of streamlining programs
• Increase the number of high-quality publications (and attain greater international recognition)
Enhancing collaboration
• Resolve complex problems, share knowledge, develop skills, stay up-to-date with new developments, expand market reach and achieve economies of scale
• Spread risk, build critical mass and capacity, and drive innovation
• Enhance the capacity of innovators to absorb new knowledge, recruit new personnel and subsequently develop new skills
• Reduce costs by removing duplication, realising economies of scale and improving access to expensive infrastructure
Improving resource allocation
• Ensure resources are used to their best effect • Lead to the realisation of goals in a faster and more
efficient manner • Improve operational efficiencies
Informing human resource decision making
• Enhance skills utilisation, productivity and innovation • Increased efficiency of resources • Enhance collaboration
University planning, strategy and operations
Improved coordination and management
• Maximise research capabilities • Allocate resources effectively • Alleviate challenges related to the limited availability of
funding • Avoid overlapping efforts and duplication
Cost savings for universities
Enhanced strategic planning
• Improve labour productivity and mobilisation of resources
• Enhance decision-making, competitive advantage and enable a greater focus on achieving desired goals
• Reduced the cost of products and services • Improve awareness of gaps in products and services to
achieve operational efficiencies
Recognition and promotion
• Recruit international students and academics • Increase research commercialisation • Enhance industry collaboration
Increased university revenue and economic activity
Accountability, transparency and policy-making

Evaluation systems in international practice
R&D Evaluation Methodology and Funding Principles 99
Influence of ERA Benefit Impact
Accountability, transparency and monitoring
• Increase research funding • Enhance national data collections • Improve the monitoring of progress against performance
indicators and targets
Increased accountability, transparency and more informed government policy-making
Better informed government policy
• Provide reliable data about research quality across all Fields of Research
• Provide a framework (with associated processes) that can help to drive future policy agendas about research quality
Source: ACIl Allen Consulting
The evaluation rarely makes explicitly clear, which benefits can be attributed to which aspects of the assessment system. Moreover, this evaluation explicitly set out to describe the benefits, rather than the limitations of this assessment system. Though the ERA 2012, as well as its predecessor achieved a greater emphasis on assessing research quality, and this going some way to undo the trend of increasing outputs alongside decreasing quality and impact of Australian research, some shortcomings are evident in the fact that there are several changes between ERA 2012 and the forthcoming ERA 2015. These changes in Submission Guidelines include:
• Changes in the criteria of eligible staff: “For ERA 2015, staff employed less than 0.4 fulltime equivalent (FTE) at an institution at the staff census date must have a publication association with the institution”
• Institutions are asked to submit gender data although this data will not be used in the context of evaluation
• Books and book chapters submitted must be given a Publisher ID from the pre-determined list rather than indicated using an ‘other category’
• Institutions are asked to indicate if a research output is published ‘open access’. This information data will however not be used in the context of evaluation
• Institutions will be asked to indicate their time spend on ERA 2015 preparation activities
These changes to the ERA reflect wider problems known about the various elements of research assessment not just in the Australian context. Inclusion of non-affiliated or tangentially affiliated staff may easily occur, where such stuff have produced research that would benefit the institution’s submission; gender differences in promotion and citation patterns are a well known phenomenon; semi-formal outputs such as working papers will almost certainly be submitted as outputs if there is no safeguard against this; the open access revolution has caught many research evaluators off-guard, so this is an issue that needs to be captured; and finally, submissions to complex research assessments such as the ERA can be time-consuming for institutions.
Respectively, the changes to ERA 2015 reflect these issues and signal attempts to address them. More generally, most of these changes to the system are intended to improve reporting and documentation and ‘appropriate’ evaluation of sub-fields. To some extend, the changes are intended to ‘keep up’ with the changes in the research landscape such as the heightened importance of open access and digital reporting. These changes have no specific consequence on individual researchers, for the most even in the case of eligibility criteria of part-time researchers. Seen the mobility of the academic labour market and possible personal circumstances (e.g. health issues), in ERA 2015 institutes are also allowed to propose the inclusion of researchers that are normally ‘ineligible’.

Evaluation systems in international practice
100 R&D Evaluation Methodology and Funding Principles
3.2 Belgium/Flanders
3.2.1 Introduction This chapter focuses on the funding system for research in the Flanders, and more specifically the Special Research Fund (BOF), which is a funding system for bottom-up basic research in the Higher Education Institutes (HEI).
We cover the criteria that are used for the distribution of this fund, based on a formula called BOF key, and the conditions that are set for the internal allocations of this fund. We also look into the developments in the BOF key, its data sources, and the consequences of the BOF system on the research community.
Finally, we briefly cover the principles for the distribution of institutional funding for teaching and research, since the 2008 reform partly based on the BOF key.
Of particular interest for this study and the evauation and funding system to be developed for the Czech republic are
• The conditions set for the awarding of BOF funding, essentially establishing a light-weight performance contract system
• The minimum threshold set for institutional funding for research (fixed component)
• The adjustments to the BOF fund distribution reflecting the need to take into account the positioning of the medium-sized universities
• The effects of the BOF criteria on the Flemish research system
• The procedures established for the management of the VABB-SHW
3.2.2 Background: description of the R&D System The governing bodies for R&D
Belgium is a federal country that has three regions: Wallonia, Flanders and Brussels-capital. The federal state retains the responsibility for funding research programmes of national interest, such as in the area of space and defence. The regions have a decentralized and autonomous research policy and are responsible for funding education and fundamental research at universities and higher education establishments. There are different protocols for the evaluation of science, tied to different institutes and to different disbursements of funding. In this chapter we look at the research funding system of the region Flanders.
• Competitive funding for research is coordinated via agencies such as the Fonds voor Wetenschappelijk Onderzoek (FWO) and the Agentschap voor Innovatie door Innovatie en Technologie (IWT).
− FWO – Flanders provides competitive funding via support grants and programmes
− IWT funds innovation schemes to enterprise and HEI (hogescholen and Universities).
• The Department of Economy, Science and Innovation (EWI) governs the Flemish research system. EWI coordinates and evaluates a range of instruments that finance fundamental and strategic basic research. It directly funds the six Flemish universities (institutional funding) and every year, it computes and publishes the funding to be allocated via the Special Research Fund (BOF) and the Industrial Research Fund (IOF). BOF is a fund dedicated to bottom-up basic research; IOF is dedicated to innovation-focused research. Distribution of BOF and IOF funding is based on a performance-based funding model, which includes research inputs and outputs such as counts of academic staff, degrees awarded, publications and

Evaluation systems in international practice
R&D Evaluation Methodology and Funding Principles 101
citations outputs (see further below). The IOF additionally includes innovation and collaboration performance – see Table 30
Table 30 Belgium: IOF allocation keys
IOF-Key (2010) Weight
Proportion (weighted) of doctorates 15%
Proportion of publications and citations 15%
Institution’s proportion of industrial contract income 30%
Proportion of income from the European Framework Programme 10%
Proportion of patents 15%
Proportion of spin-offs ( 15% Source: OECD (OECD 2010)
R&D actors in the Flemish system
The Higher Education Institutes (HEI) sector in the Flanders is composed of universities and colleges (‘hogescholen’).
Universities are highly research-intensive in the Flanders and account for more than 85% of the academic output62. There are currently five academic universities in the Flanders:
• Katolieke Universitei Leuven (since 2014 integrates Katolieke Universiteit Brussel)
• Universiteit Hasselt63
• Universiteit Antwerpen
• Universiteit Gent
• Vrije Universiteit Brussel
The Colleges have earned a full-fledged higher education status in the reform of 2008. They typically conduct more applied-oriented research. They include:
• Artesis Plantijn Hogeschool Antwerpen
• Arteveldehogeschool
• Erasmushogeschool Brussel
• Groep T Hogeschool
• Hogere Zeevaartschool Antwerpen
• Odisee
• Hogeschool Gent
• LUCA School of Arts
• Hogeschool West-Vlaanderen
• Karel de Grote-Hogeschool
• Hogeschool Thomas More Kempen
62 ECOOM. Vlaams IndicatorenBoek, 2013 63 The University Hasselt has a special agreement with the University of Maastricht – which led to the
establishment of a transnational university. Special regulations exist with respect to attributing financing and measuring the performance of the transnational university.

Evaluation systems in international practice
102 R&D Evaluation Methodology and Funding Principles
• Hogeschool Thomas More Mechelen-Antwerpen
• Katholieke Hogeschool Leuven
• Katholieke Hogeschool Limburg
• Katholieke Hogeschool Vives
• Hogeschool PXL
Next to the universities, which are the most important actors in the field of basic research, the Flemish government decided to concentrate resources in a number of relevant strategic areas of scientific and technological innovation research. For this purpose, it founded four big Flemish research centres, the so-called SOC – Strategic Research Centres. Common characteristics of these centres are their institutional funding on the basis of 5-year performance contracts and their explicit focus on industry. The four SOCs are
• The Interuniversity Centre for Micro-electronics – IMEC
• The Flemish Intsitution for Technological research – VITO
• The Flemish Institute for Biotechnology – VIB
• iMinds, previously the Institute for Broadband Technology – IBBT
Other research institutes are the Strategisch Initiatief Materialen – SIM (focused on advanced materials), the Centrum voor Medische Innovatie – CMI (focus on medical innovation) and the FISCH-initiative (focus on durable chemistry and advanced materials). There are also a number of institutes for policy-oriented research and management schools.
3.2.3 The BOF fund for bottom-up basic research Overview
The Special Research Fund (BOF) is a public fund dedicated to the funding of basic research in HEIs.
It was created in 1985 with the objective to stimulate groundbreaking research. An additional objective is to encourage universities developing an internal research policy. With this intent, specific conditions were set to be elegible for BOF funding (see further below).
The BOF funding is allocated among the universities through a parameter-driven model, also referred to as the BOF key. The rationale for the creation of this model was to allocate funding on a fair basis; contemporaneously, the BOF key is used to reward universities for their performance.
The BOF key is made public. The percentual distribution of the fund, instead, is sent to the universities and other stakeholders, but is not published. Since 2013, the BOF-key is used also in the calculation of the university institutional funding and other funding mechanisms.
The unit of assessment at the national level is the university, which is also the final recipient of the funding. The individual is the unit of analysis when it comes to the evaluation for the internal funding allocation.
The volume of the BOF fund
The BOF fund budget is set on an annual basis by the Flemish government, deciding on the budget to allocate to the three components of the BOF, i.e.
• The basic component of the BOF, constituting the major component of the fund
• The sources dedicated for the funding of Tenure Track grants, i.e. for the coverage of the salary costs of postdoc researchers that participate in the programme (5-

Evaluation systems in international practice
R&D Evaluation Methodology and Funding Principles 103
year term contracts with precise objectives, followed by a fixed-term contract is completed successfully)
• The sources dedicated for the Methusalem programme and ZAP grants, i.e. long-term grants for individual excellent researchers, allowing them to focus exclusively on research and/or pursue international research. The Methusalem programme was launched in 2006 and became part of the BOF fund in 2009. The Methusalem budget has increased substantially from €3,000 in 2006 to almost €20,000 in 2012. ZAP mandates are to the benefit of excellent academic staff
The basic BOF is the key component of the fund distributed among the universities on the basis of the BOF key (Table 31). This is followed by the Methusalem programme components and the Tenure Track grants.
Table 31 Belgium: Components of the BOF fund
2006 2007 2008 2009 2010 2011 2012
Basic BOF 99,033 100,726 105,140 107,138 107,130 107,677 116,090
BOF - Tenure Track 2,800 5,653 5,645 8,961 9,154 BOF - Methusalem-programme 3,000 10,051 15,242 20,532 20,076 19,402 19,822
BOF – ZAP grants 1,500 3,029 4,587 4,348 4,196 5,586
Total BOF 102,033 112,277 126,211 137,910 137,199 140,236 150,652
Basic BOF 97% 90% 83% 78% 78% 77% 77%
BOF - Tenure Track 0% 0% 2% 4% 4% 6% 6% BOF - Methusalem-programme 3% 9% 12% 15% 15% 14% 13%
BOF - ZAP-grants 0% 1% 2% 3% 3% 3% 4%
BOF funding has increased fivefold since 1993 (as the allocation criteria have gradually become more complex). From 2006 to 2012 the BOF subsidy has relatively moderately increased from around €99,000 to €116,000.
It has constituted a relatively stable share of 45% in the Flemish public funding of basic research (Table 32). In 2007, the Hercules financing was introduced, aimed at providing Flemish researchers with research infrastructure.
Table 32 Belgium: Allocation of public funds to basic research 2006-2012
2006 2007 2008 2009 2010 2011 2012
FWO-Flanders (competitive funding)
132,750 138,259 146,504 151,131 148,415 156,186 173,040
BOF 102,033 112,277 126,211 137,910 137,199 140,236 150,652
Hercules (50%) 2,800 7,803 7,803 7,418 5,250 10,270
Total 234,783 253,336 280,518 296,844 293,032 301,672 333,962
FWO-Flanders (competitive funding)
57% 55% 52% 51% 51% 52% 52%
BOF 43% 44% 45% 46% 47% 46% 45%
Hercules (50%) 0% 1% 3% 3% 3% 2% 3%
Source: Vlaams Indicatorenboek Wetenschap, Technologie en Innovatie, 2013 The 2013 changes to the BOF fund
On January 1, 2013, changes were made to the BOF decree. These were

Evaluation systems in international practice
104 R&D Evaluation Methodology and Funding Principles
• The introduction of a number of conditions for eligibility to BOF funding related to strategic governance, quality management, communication on science and diversity
• The establishment of dynamic minimum shares for the University of Hasselt, the University Antwerp, and the Free University Brussels, with the aim to ensure a more stable funding for each university enabling them to undertake longer-term commitments. The minimum shares were, in 2013, 2.91% for the University of Hasselt, 10.12% for the Free University of Brussels and 11.75% for the University of Antwerp. A growth path with an upper limit on the minimum financing is foreseen; this upper limit is, in 2013, 4%, 10.5%, and 13%, for these universities respectively. The minimum shares are dynamic because, depending on the growth / performance of the universities, from 2014 there is scope to increase the share of minimum funding. As the University of Hasselt is still growing in capacity, it will benefit from a guaranteed grow-path in the minimum financing.
• Measures to offer more opportunities to women in science, such as priority rulings in case of new openings for independent academic personnel (ZAP) and postdoc researchers through the use of BOF resources
• The revision of some parameters in the formula, the so-called BOF key
The rationale for the minimum share was to take better into account the diversity between universities. Universities are scrutinised under the exact same conditions despite great differences in size, objectives and performances. The minimum percentages in the BOF-key for each of the smaller universities are to ensure a more stable funding stream for research. Larger universities also have relatively better access to a wider range of funding channels (e.g. EU funding) and have better opportunities to attract researchers. The minimum share rule is intended to compensate for this financial disadvantage, thereby ensuring a sufficiently differentiated university landscape in the Flanders.
In relation to the BOF key, the 2013 regulation aimed to ensure that the bibliometric parameters envisaged the following:
• Encourage both productivity and visibility;
• Define the degree of excellence via international quality standards;
• Use impact factors to classify groups of magazines (not for the assessment of individual publications);
• Average the extreme variation of impact factors within and between disciplines (to avoid skewing investment in experimental sciences with high impact factors);
• Transparency in the count;
• Apply the count across all disciplines (discipline neutral);
• Ensure that the count is compatible with the VABB-SHW count scheme.
Internal distribution of the BOF fund
The BOF funding for research process is based on the principle of the universities’ autonomy. The funding is directly allocated to universities, i.e. granted as a lump sum to specific BOF funds within each university. This is then followed by an internal fund allocation process in each university, deciding on the final allocation of funding to fellowships and projects.
The internal university allocation is usually based on a peer-review process, involving international experts and an assessment of the (bibliometric) performance of the submitters, as well as a detailed review and assessment of the substance of the work proposed. However, the university autonomy in the management of the BOF fund is increasingly limited and precise conditions and expectations are being set for the eligibility to BOF funding (see the next chapter).

Evaluation systems in international practice
R&D Evaluation Methodology and Funding Principles 105
and universities are regularly assessed on this process and its outcomes. CRITIQUE ON COSTS
In order to complement the information provided through the BOF keys, at the national level an external evaluation of the universities’ research performance is organised every two years. This includes research and HR management as well as the quality of the processes adopted internally to allocate the BOF funding.
Conditions linked to the BOF funds
There are several conditions put on the HEIs to be eligible for BOF funding in terms of research strategy and governance64:
• The university management draws up a five-year strategic plan defining its policy for scientific research in general and the focus for spending the BOF funds in particular
• The University Board shall adopt rules for the internal allocation of basic component in the BOF fund; to be embedded in the Charter of Good Governance of the university
• Universities report on their performance on an annual basis
• Universities are part of and adhere too the Flemish science communication policy and support the general principles of the relevant marketing and communication plan of the Flemish Government in the matter
• The Flemish Minister is authorized to further determine the regulations and attach funding to the abovementioned conditions.
The strategy plan should include as a minimum
• The key principles of the governance approach
• The instruments and action plan to reach the defined objectives
• The financial means for the achievement of the objectives
Specific attention should be dedicated to
• The monitoring and evaluation of the quality of research
• The principles of good governance in research
• Increase in participation of women and minorities in research
• The training and career development of researchers
• Communication on ongoing and concluded research
There are specific indications also for the internal use of the fund. These include:
• Conditions are placed on appointing new ZAP academic staff/post-doctoral staff. Under certain conditions, the under-represented sex is given preferential appointment in order to achieve an improvement in gender balance.
• The BOF-2013 decree outlines that a maximum of 25% of university spending on BOF-ZAP mandates can be allocated to mandates that extend indefinitely. At most 15% of the BOF-ZAP resources are allocated to attract outstanding researchers from abroad or from another research institute, under a minimum employment rate of at least 50%.
64 See article 22 BOF 2013, http://www.ond.vlaanderen.be/edulex/database/document/document.asp?docid=14492

Evaluation systems in international practice
106 R&D Evaluation Methodology and Funding Principles
• At least 50% of the BOF funds are to be allocated to projects for fundamental research of the following types
− Projects with a duration of 4-6 years and minimal annual funding of €45,000, carried out by research groups of excellent scientific value. This is to be demonstrated by means of objective data, more specifically on the basis of publications or other indicators of scientific quality. The Flemish minister competent for research governance can increase this minimum value
− Projects with a duration of 2-5 years and minimal annual financing of €150,000. The Flemish minister competent for research governance can increase this minimum value
• Each year, at least 3.5% of the BOF funding is allocated to grants or projects in the framework of international scientific collaboration. In relation to research grants for researchers from abroad, eligible costs are limited to personnel costs (salary of fellowships), eventually complemented with a bench fee. For the research projects, personnel, operational and equipment costs can be accounted for.
• The allocation of funds for the Methusalem programme must be based on an external evaluation of the research proposals by an international panel, to be organised by the university. Every 7 years, an internal panel is to evaluate the effectiveness of the research project (objectives reached), the HR aspect of the project (research training), and the adequacy of the research plan for the following 7 years
Finally, the internal regulation for the allocation of the fund should define
• The research initiatives that can be funded and the conditions and criteria for their selection
• The procedures for the allocation of the resources for the research grants and projects, with as minimum conditions:
− The funding is allocated by the university management after motivated advice by an internal research council
− Maximum two third of the internal research council is of the same gender. If the research council does not meet this requirement, it cannot give legal advice; the same ruling accounts for all selection and advisory committees involved in the allocation of the funding
− The university’s research council selects the research grants and projects to be funded
− Experts will be involved for the appraisal of large project proposals; these experts will be external to the university and will be appointed following a procedure defined by the university management
− Funding of Methusalem grants are decided through appraisal by an internal panel of experts
• The rules for the organisation of calls and funding approvals
• The methodology for the ex-ante evaluation of the proposals, the ex-post evaluation of the projects implemented, and eventually the interim evaluation
• The process for the communication of the proposal appraisal results to the researchers
• The process for the communication to the researchers on the selection procedures
• The process for the researchers to present appeal
The university is entitled to allocate the following shares of the BOF fund for internal management purposes:

Evaluation systems in international practice
R&D Evaluation Methodology and Funding Principles 107
• 2% of the basic BOF fund component for the activities of the offices responsible for research coordination
• 1% of the basic BOF fund component (or at least 100,000 euro) for the expenses related to operational and personnel costs that are directly linked to the management of research projects or initiatives funded by the BOF fund
Critique on the BOF system
In 2010, the Flemish Interuniversity Council (VLIR) nominated an external committee to evaluate the quality of research management in the Flemish universities65. The committee concluded its work expressing some major critiques to the BOF system.
The Commission agreed with the stakeholder communities that the BOF has become too complex and unclear. On the one hand, the BOF key has become complex in its parameters used, which is to be added on to their lack of continuity and ongoing changes. In addition, the BOF fund has expanded with the introduction of financing for tenure track academics and Metrusalem financing. Each of these financing streams has independent objectives. At this stage the committee concluded that, with reference to the increased complexity, no additional funding mechanisms should be initiated. Rather, the existing channels of financing should be strengthened.
Following the evaluation by the external committee, additional criticism was made on the use of journal impact factors and the lack of normalization across disciplines – disciplines with traditionally higher impact factors receive relatively higher scores. As a result, scholars may choose to invest in disciplines with higher impact factors.
The BOF key has its consequences on the career path of individual researchers. The Commission noted that not all academic personnel receive BOF funding internally and the reasons behind this uneven distribution are partly linked to the parameters used for the central BOF funding. There is an uneven distribution of the funding with certain staff members charged with heavy teaching workloads and not having the opportunity to acquire research experience. In some universities, part of the staff is condemned to teaching without acquiring an adequate level of research experience. The Commission expressed concern on the consequences of this phenomenon for the integration of education and research, which is a fundamental characteristic of university education. A similar concern was exoressed by the evaluation commission in 2004.
In recent years the discussion on scientific integrity and the academic pressure to perform / publish has escalated substantially. The main challenge is the impact of measuring publications/citations on researchers. The BOF explicitly is not meant to rank universities or to do more than divide money in an equitable way. However, universities often use the same principles in their internal distribution of funds and thus substantial pressure is put on the researchers to publish more. The Committee questions whether this so-called ‘rat-race’ compromises academic integrity. The committee references the ‘European Code of Conduct for Research Integrity’ and the report of the European Science Foundation (ESF) ‘Fostering Research Integrity in Europe’ as a relevant benchmark and encourages universities that have not yet implemented specific policy on academic integrity to do so.
Finally, at a more general level, the Committee considered that in the Flemish research funding system as a whole, there is a disproportionate balance between funding of targeted and bottom-up research. This is a result of the increased focus on the valorisation of research and research results – by government policy and EU policy. This is also evident in the BOF funding distribution criteria. There has been an
65 Beoordeling van de kwaliteit van het onderzoeksmanagement van de Vlaamse universiteiten, Vlaamse Interuniversitaire Raad, Brussels, 2010

Evaluation systems in international practice
108 R&D Evaluation Methodology and Funding Principles
increase in the targeted funding for science and innovation, EU funded projects, projects with industrial partners, etc. In contrast, there is stagnation in the financing of bottom-up research, including the BOF fund. A reduction of investment in bottom-up research is a matter of concern.
3.2.4 The BOF formula Developments in the BOF formula
Up to 2002 it was based only on the number of PhDs awarded by the university, the number of graduates and the amount of public and investment money received by the university A major update of the BOF-key took place in 2003, when bibliometric data was introduced into the calculation formula.
In 2008, a weighting was introduced for papers that appeared in WoS-indexed journals with an impact factor. Since 2008, and even more since the introduction of the VABB-SHW database for SSH, the focus has therefore been on the quality and impact of publication rather than quantity only.
Since 2011, the BOF exercise not only includes publications and citations from the WoS, but also bibliometric results from the Flemish Academic Bibliographic Database for the Social Sciences and Humanities (VABB-SHW – see further below).
The BOF key is composed of a set of bibliometric and ‘structural’ indicators. Research outputs (publications and citations) accounted for 37% of the BOF-key in 2013, while other activity indicators weighted 63%. These are shown in Table 33 and include: (A1) the percentage share of every university under the diploma parameter, (A2) the doctorate parameter and (A3) the gender diversity parameter.
• The parameter for Part A1 is constructed by counting the master degrees awarded; master degrees are a proxy for the capacity and size of the institution and the likely inflow of new students. Bachelor diplomas are counted whenever a given institute cannot award a master diploma
• Part A2 reflects the count of doctorate diplomas awarded. This parameter has the largest weight
• Part A3 reflects the count of female researchers at post-graduate level and the ZAP researchers. The relevant weight of this parameter is low: 3% in 2013 and 2% from 2014 onwards
Both for the master degrees and doctorates, a distinction between study areas is made, creating a system of weighted and non-weighted diplomas and doctorates.
Table 33 Belgium: The structural component of the BOF key (2013)
BOF-Key parameters Weight
A1 Institution’s proportion of bachelor and initial masters diplomas 25%
A2 Proportion (weighted) of doctorates 35%
A3 Diversity 2%
Over the years, the BOF-key has given more weight to publications and citation counts compared to non-bibliometric factors and it is expected that this trend will continue to increase. Table 34, below, shows that the percentage of bibliometric indicators constituted only 10% of the BOF-Key in 2003, while it is expected to constitute 40% of the final calculation for the allocation of funding in 2016.

Evaluation systems in international practice
R&D Evaluation Methodology and Funding Principles 109
Table 34 Belgium: Publication and citation parameters in the BOF-key
2003 2008 2012 2016
Publications WoS 5% 15,8% 15,3% 16.6%
Publications VABB-SHW
0% 0% 2,7% 6,8%
Citations 5% 15,8% 18% 16.6%
Non-bibliometric factors
90% 68,5% 64% 60%
Reproduced from a presentation by T. Engels (2012) on the Flemish BOF-key
The bibliometrics components is composed of the following parameters
• B1 – percentage share in the total number of publications in:
− Science Citation Index Expanded (SCI-Expanded)
− Social Sciences Citation Index (SSCI)
− Arts & Humanities Citation Index (A&HCI)
− Conference Proceedings Citation Index - Science (CPCI-S)
To compute the parameter B1, all journals in SCIE and SSCI are classified into 68 ECOOM66 subdomains. The 68 ECOOM subdomains are further classified using (10-year) impactfactors into twenty segments, which are allocated a specific weight. Publications are given a weight as determined by the weight [10-0.1] that is allocated to a given journal. The weights are equal across disciplines.
• B2 – percentage share in the total number of publications in the Flemish Academic Bibliographic Database for the Social Sciences and Humanities (VABB-SHW). The VABB-SHW sheds light on other types of publications (e.g. books and book chapters) for which citations remain undocumented in the citation parameter.
Publication in VABB-SHW are weighted as following:
− Factor 1 - Articles in VABB-SHW journals
− Factor 4 – Authored books published in VABB-SHW
− Factor 1 – Books, edited and published in VABB-SHW
− Factor 1 – Articles or parts of books published in VABB-SHW
− Factor 0.5 – Articles in proceedings, to be included in VABB-SHW
• B3 – percentage share in the total number of citations parameter allocated on the basis of university or hospital address
66 The Centre for R&D Monitoring (ECOOM), an inter-university consortium in which all Flemish universities participate, collects and processes data on publications, citations, patents and spin-offs. Publications and citations are calculated by ECOOM, based on: Arts & Humanities Citation Index, Conference Proceedings Citation Index-Science, Proceedings Citation Index (CPCI), Conference Proceedings Citation Index - Social Sciences & Humanities, Science Citation Index Expanded, Social Sciences Citation Index, VABB.

Evaluation systems in international practice
110 R&D Evaluation Methodology and Funding Principles
3.2.5 The data sources The data collected to calculate the BOF (and IOF) keys are not aggregated in a single data system, but come from three different databases: the ECOOM databases, the personnel database and the database of higher education. The level of data collection is for the most part the individual researcher.
• The Centre for R&D Monitoring (ECOOM), an inter-university consortium in which all Flemish universities participate, collects and processes data on publications, citations, patents and spin-offs. Publications and citations are calculated by ECOOM, based on: Arts & Humanities Citation Index, Conference Proceedings Citation Index-Science, Proceedings Citation Index (CPCI), Conference Proceedings Citation Index - Social Sciences & Humanities, Science Citation Index Expanded, Social Sciences Citation Index, the VABB (see below)
• Data on doctoral students is drawn from the database of higher education (Databank Hoger Onderwijs) of the Flemish Ministry of Education
• Data on personnel is gathered from the personnel database at the Rectors’ council (VLIR 2012)
The integration of data and the calculation of the key are conducted by the Ministry in charge of research and innovation. The Flemish legislation establishes by what date the data per parameter should be provided. The Steunpunt O&O Statistieken (SOOS) institute was established in 2002 by the Flemish government to produce the bibliometric analysis for the calculation of the annual allocation (OECD 2010).
The Flemish Academic Bibliographic Database for the Social Sciences and Humanities (VABB-SHW)
The Flemish Academic Bibliographic Database for the Social Sciences and Humanities - VABB-SHW was introduced following concern on the measuring of research performance launched in 2003, in particular among academics in social sciences and humanities (SSH). It contains the peer-reviewed publication output in social sciences and humanities in the Flanders. ECCOM constructed the database, which was technically developed by the University of Antwerp.
The VABB-SHW collects the references on scientific publications in the field of social sciences and humanities from researchers affiliated to Flemish higher education institutions. Currently eligible publications are journal articles including articles in proceedings, books, and book chapters. The database is publicly available online in Dutch, French and English.
The database was specifically commissioned by the Flemish government to capture non-WoS peer reviewed SSH output, and therefore to take into account the specific characteristics of the SSH when allocating research funds among the universities. It also explicitly tackles the language issue, i.e. the fact that publications by SSH researchers working in the Flanders are often published in Dutch.
The Authorative Panel (AP) is in charge of the scientific management of the database. Its role is scientifically to select the publications that are allowed for inclusion in the VABB-SHW database. This does not imply an assessment of the intrinsic scientific quality of the publication. The criteria for the selection are
• The publication is publically available and peer reviewed
• It is identifiable via an ISBN-ISSN number
• It makes a contribution to the development of new insights or the application of them
• In 2014 an additional criterion of minimal 4 pages of length was established, in order to filter out as much as possible publications of a minor scientific character (eg editorials) without having to assess the publications individually.

Evaluation systems in international practice
R&D Evaluation Methodology and Funding Principles 111
The 2014 AP also specified that prior to publication there must have been a clear peer-review process by scientists experts in the (sub)field(s). This peer review needs to be imolemented by an editorial board, a stable reading committee, external reviewers or a combination of these types. At least one contribution must come from an expert external to the research group publishing and independent to the author. The author of the publication should not be also the organizer of the peer review.
The AP has the authority to assign also quality labels to journals and editors and/or to apply stronger selection criteria than the ones established in the relevant decree.
The AP is ‘double representative’, i.e. representing both higher education institutions and the scientific disciplines.67 It is composed of at least 12 and maximum 18 researchers affiliated to Flemish universities, active in the field of SSH and of internationally recognised standing in their field. The universities propose the AP members upon consultation of their internal research councils; each university proposes at least 2 members. The Flemish Government nominates the panel members for four years (renewable). The AP must include at least 1 member representing each university and maximum two thirds of the panel members are of the same gender.
The Flemish Interuniversity Council (VLIR) supports the decision process from a logistic and administrative perspective. For its evaluation of the publications and the channels for publication, the AP is supported by disciplinary sub-panels providing advice.
Every 5 years, the Flemish Government commissions an evaluation panel to assess the quality of the VABB-SHW. This should include as a minimum the following elements:
• The process and selection procedures for the definition of the list of journals, editors and proceedings
• The extent to which the publications registered in the VABB-SHW fulfill the criteria established by law and the extent to which those that were refused do not
This evaluation panel is to be composed of at least 5 members active in the field of SSH, of internationally recognised standing. None of the evaluation panel members should be working in Belgium at the time of nomination.
3.2.6 The institutional funding for teaching and research In 2008, a University Reform was introduced that set the Colleges firmly at the level of the Universities, jointly forming the Flemish Higher Education Institutions sector, and introduced common funding systems for the two HEI typologies. This included a revision of the institutional funding system for both universities and colleges, introducing a PRFS component based on quality indicators (for both teaching and research).
The Minister of Education set the following principles for the new institutional funding system68:
• The system must be kept simple. This will increase the efficiency for reaching the objectives, reducing to the maximum the burden for the governance bodies and the HEIs
67 Begeleidende nota VABB-SHW – vierde versie, VLIR, 2014
68 Frank Vandenbroucke, Vlaams Minister van Werk, Onderwijs en Vorming, Voorstel aan de werkgroep financiering, 2004

Evaluation systems in international practice
112 R&D Evaluation Methodology and Funding Principles
• It must be transparent. Transparency is needed in order to reach legitimacy. This also means that third parties need to be able to understand the logic and objectives of the data. This implies that teaching and research components of the funding need to be clearly separated
• The new system needs to be common for the entire HEI sector in the Flanders, i.e.universities and colleges. Collaboration agreements between these two typologies of institutions will be taken into account
• Institutional funding will be provided as a lump sum, including the ‘incentive funding’ copmponents. The institutions remain autonomous in their decision making on internal allocation of the funding. Obviously, the institutions will be accountable for how they distribute the funding from public sources internally and how they use it
• The new system must be relatively stable and foster planning of financial management. This means that changes in the parameters should not be too abrupt. Institutions need to maintain the possibility to do mid-term planning
• There must be a step-wise introduction of the new system. In the long-term it will provoke considerable shifts in institutional funding and the institutions need to be given the time to prepare for that. Transition measures will therefore need to be set in place to go over from the old to the new system
A major objective for the introduction of the PRFS was to foster an improvement of teaching and research quality in the region, both for universities and colleges.
After a long period where the number of students mostly determined the overall budget of institutional funding for the HEI’s, the decree of 14/03/200869 established the new partly formula-based institutional funding model for the Higher Education Institutes (HEI) in the Flanders..
There are two components to the institutional funding budget, one for teaching and one for research, each with a fixed and a performance-based component. The ratio institutional funding for teaching versus research is to gradually increase towards 55%/45%. Table 35 shows the budget allocation for the different components in 2011.
Table 35 Belgium: Breakdown of the HEI institutional funding budget for teaching and research in 2011 In m€ Share
Teaching Fixed 106 8%
Variable 888 69%
Total 994 77%
Research Fixed 111 9%
Variable 186 14%
Total 281 23%
Overall total 1,293 100%
Different shares of the teaching funding (both fixed and variable components) are foreseen for the different HEIs in the educational system, i.e. colleges and universities.
From the year 2014 onwards, distinction is made between
69 http://www.ond.vlaanderen.be/edulex/database/document/document.asp?docid=13988

Evaluation systems in international practice
R&D Evaluation Methodology and Funding Principles 113
• The professional oriented colleges
• The professional oriented art schools
• The academic universities
In relation to the institutional funding component for research, the Decree set a minimum threshold on:
• At least 65 doctorate diplomas awarded over 4 years (the years t-7/t-6 until t-3/t-2)
• At least 1,000 publications over 10 years (the years t-12 and t-3)
The BOF key determines the variable component. Normalisation for the size of the HEI is based on the following weighting scales:
• For the number of doctorate diplomas awarded:
− Factor 3 - the number of doctoral degrees awarded is less than or equal to 65
− Factor 2 - the number of doctoral degrees awarded is greater than 65 and less than or equal to 500
− Factor 0 - the number of doctoral degrees awarded is greater than 500
• For the number of publications:
− Factor 3 - the number of publications is less than or equal to 600
− Factor 2 - the number of publications is greater than 600 and less than or equal to 3000
− Factor 1 - the number of publications is greater than 3000 and less than or equal to 10000
− Factor 0 - the number of publications is greater than 10000
3.3 Finland Funding for universities in Finland is formula-based. Crucially, education and research are not considered separately, but instead both feed into the formula, making it partially performance-based and partially based on size (ie number of students, etc) of the institution.
Though an RAE-style comprehensive assessment exercise was proposed in Finland in 2010, this never materialised. Nevertheless, funding allocation in Finland is effectively performance-based, though on a broad range of criteria relating to the full range of HEIs’ operations – notably including teaching – is applied and obtained regularly through annual data submission of each institution to MINEDU.
Within the Finnish government, the Ministry of Education and Culture (MINEDU) is responsible for steering science policy. Its remits include the funding of basic research and its infrastructure and the allocation of core funding to Finnish Higher Education Institutions (HEIs) and the Academy of Finland (AKA) - the national agency that funds basic research from individual researchers and research units of universities and research centres. R&D evaluations and impact assessments are also part of its remits, when related to national R&D policies and the Academy of Finland. In Finland universities and polytechnics are responsible for the evaluation of their own quality assurance operations and outcomes, with support from the Higher Education Evaluation Council (FINHEEC).

Evaluation systems in international practice
114 R&D Evaluation Methodology and Funding Principles
Some distinction exists in Finland between the universities and the polytechnics. Whilst the mission of universities is to conduct scientific research and provide research-based instruction and postgraduate education, the polytechnics train professionals in accordance with labour market needs. However, the role in research in polytechnics is getting increasingly important, though its focus is much more on applied research, targeting more explicitly the R&D needs of regions and local enterprises. Originally, there were 20 universities and 26 polytechnics in Finland, but following the 2010 University Act (see below), several mergers have taken place, where especially the smaller universities and polytechnics merge with larger ones, with the expected result being 15 universities and 18 polytechnics in total, once all planned mergers are complete.
In Finland, for universities and the polytechnics, the distribution of the institutional funding is partly performance based, guided by common criteria, and partly linked to the individual performance contracts with the Ministry, taking into account strategic lines and objectives (prospective) as well as evaluation of the achievement of previously agreed targets (retrospective). Finland’s use of performance-based funding for HEIs is rather old and well established. It was extensively reformed in 2010, when Finnish universities gained their autonomy with the Universities Act, with introduction of a new set of criteria that focus increasingly on research objectives and outputs.
Overall, the main emphasis is on capacity-building and assisting the institutions to fulfill strategic goals and priorities. Finland especially stands out in terms of the priority given to teaching and training as key indicators of quality.
3.3.1 Inclusion of individual staff Assessment is conducted at the level of the institution, with individual staff in no way formally highlighted in the assessment. In fact, though each university and polytechnic submits its publication data on an annual basis to VIPUNEN, everything is made public on the VIPUNEN website, except for personal data related to the author (TG 2013). In some part, this is due to the fact that universities/ polytechnics were fully state-owned until 2010 and academics were classed as civil servants, making individual competitive performance assessment problematic. Since the major higher education reforms of 2010 this status of academics has changed, but there is no evidence that this has lead to any kind of individual-level performance assessment from a national research funding perspective. Internally, there is of course the possibility that research performance assessment is happening, though there is currently no evidence for this either.
The literature frequently notes that the university (rather than eg departments or research groups) is the key level of assessment in Finland, but that universities are at liberty to distribute the performance-based share of research funding at their own discretion among their various department. Once again, little is known about how this happens, though the literature notes frequently that universities may choose to reward individual or departmental performance, or align their internal funding allocation with wider strategic science priorities.
3.3.2 Indicators and scoring systems Specific indicators are:
• Number of teachers/researchers
• Agreed number of doctoral degrees
• Effective number of doctoral degrees
• Funding from Academy of Finland (centres of excellence)
• Funding from TEKES

Evaluation systems in international practice
R&D Evaluation Methodology and Funding Principles 115
• Funding form competitive international research programmes
• Number of publications in
− Peer reviewed international journals − Refereed journals − Books − Number of other publications
• Number of teachers and researchers spending time abroad (> 1 week) (TG, 2013)
The publication indicators noted here of course only reflect the amount of output and say little about quality. To add this dimension, publications are additionally divided into a three-point scale:
Level 1: Channels recognised as scientific
• The channel is specialised in the publication of scientific research outcomes
• There is an editorial board constituted by experts;
• The scientific publications are subject to a peer evaluation focusing on the entire manuscript.
Level 2: Prestigious scientific publication channels
• Mainly international scientific publications channels, with the editors, authors and readers representing various nationalities. The journals publishing reviews only must not account for an overly large share of the whole.
Level 3: channels representing state-of-the-art quality in the respective field
• The research published in them represents the highest level in the discipline and has very high impact (e.g., as measured through citation indicators);
• The series cover the discipline comprehensively, not limiting to the discussion of narrow special themes;
• Both the authors and readers are international and the editorial boards are constituted by the leading researcher in the field;
• Publication in these journals and series is highly appreciated among the international research community of the field. 70
The scale was built through a publication forum project between 2010 and 2012 with the objective to produce a national rating of journals, conference and book series, and book publishers in all disciplines. It involved 23 field-specific panels with 210 panellists. Ratings are to be reviewed every three years. Besides the criteria, by which publication channels are to be classified, the classification panel additionally is limited by quotas, where no more than 20% of channels can be Level 2 or 3, and the total of level 3 channels cannot exceed 25% of the overall number of level 2 channels.
This ranking system will be put into operation from 2015 onwards, with publication in channels 2 and 3 to be assigned greater weight in the calculation of publication
70 For full criteria, see http://www.tsv.fi/julkaisufoorumi/materiaalit/jufo_panelguidelines_17122013.pdf

Evaluation systems in international practice
116 R&D Evaluation Methodology and Funding Principles
outputs. The ultimate intention here is to avoid publication patterns that emphasise volume rather than quality of outputs.71
3.3.3 Use and context of the choice of indicators Benneworth et al (2011) summarise the rationale behind Finland’s funding criteria:
The new steering model aims at a structural development of higher education institutions linked with the general reforms of the research system and the modernisation of higher education in Europe. This means that the main objectives are to improve the quality of teaching and research, to boost international competitiveness, greater effectiveness, profiling and internationalisation.
As such, even at the level of performance agreements between MINEDU and each HEI (universities and polytechnics), five domains of performance are considered:
• Basic studies and study processes (quality of study processes)
• Scientific postgraduate education
• Research, development and innovation
• Internationalisation
• Social impact
The large proportion of weight given to indicators of student numbers and graduates simply reflect the absence of tuition fees in Finland. Other indicators reflect various challenges and priorities. Most notably these include:
• Inclusion of funding from TEKES as an indicator is symptomatic of the changing relationship between research and innovation: there has traditionally been a strong division of labour between science and basic research on one hand, and technology with direct commercial implication on the other. Over the past few years however the co-operation has increased significantly between the Ministry of Education and the Ministry of Employment and Economy (and by extension TEKES) on issues related to science and innovation. An example of this collaboration is their participation in the Research and Innovation Council and its steering of Finnish R&D policy. Inclusion of TEKES funding, and more generally of social impact of research in the domains and indicators of funding allocation at Finnish universities is a logical expression of this shift towards closer cooperation.
• Internationalisation is another prominent aspect of the selection of indicators in Finland. This choice reflects a key problem pointed out in the Finnish system, namely its low level of internationalisation, not so much in terms of international co-publication, but in terms of direct international experience, both in-coming and out-going. As such, indicators rewarding time spent abroad are a direct response to this acknowledged weakness.
3.3.4 Source of information The national research information database VIPUNEN contains information on student numbers, degrees, staff and student mobility and other factors, as well as data on research publications from all HEIs. This is kept up to date by annual performance reports submitted by universities to MINEDU (TG 2013). Some additional data is not collected in this way but by Statistics Finland (TG 2013). The information collected by
71 See Puuska HM (2014) Scholarly Publishing Patterns in Finland. P 81: http://tampub.uta.fi/bitstream/handle/10024/95381/978-951-44-9480-2.pdf?sequence=1

Evaluation systems in international practice
R&D Evaluation Methodology and Funding Principles 117
the MINEDU is partly for statistical purposes and partly for information-based steering of HEIs. The objective of the exercise is to give MINEDU access to data needed in the planning, monitoring and evaluation of university operations and management, as well as to provide statistical information on the research activities and societal impact of HEIs at the national level for the general steering of Finnish research policy. Research output is understood in a broad sense, covering scientific publications, books, conference proceedings, but also patents, invention, audiovisual material and performance and public events resulting from artistic activities. Types of publication are presented in the table below.
Table 36 Finland: Publication types reported in the annual data collection exercise
Publication type Sub-category
A. Peer-reviewed scientific article
A1. Journal article (refereed), original research A2. Review article, Literature review, Systematic review A3. Book section, Chapters in a research book A4. Conference proceedings
B. Non-refereed scientific articles
B1. Non-refereed journal articles B2. Book section B3. Non-refereed conference proceedings
C. Scientific books (monographs)
C1. Book C2. Book (editor), chapters in research book, conference proceedings or special issues of journals
D. Publications intended for professional communities
D1. Article in a trade journal D2. Article in a professional book D3. Professional conference proceedings D4. Published development or research report or study D5. Textbook, professional manual or guide
E. Publications intended for the general public
E1. Popularised article, newspaper article E2. Popularised monograph
F. Public artistic and design activities
F1. Published independent work of art F2. Published partial realisation of a work of art F3. Artistic part of a non-artistic publication
G. Theses (for which no data are collected by MINEDU)
G1. Polytechnic thesis, Bachelor’s thesis G2. Master’s thesis, Polytechnic Master’s thesis G3. Licentiate thesis G4. Doctoral dissertation (monograph) G5. Doctoral dissertation (article)
H. Patents and innovation annoucements
H1. Granted patent H2. Invention annoucement
I. Audiovisual material, ICT software
I1. Audiovisual material I2. ICT Software
Based on: Ministry of Education and Culture, Publication Data Collection manual 2012, English version 10 January 2013
3.3.5 Scoring system & weights There is a standard core funding formula for universities, the majority of which is effectively related to the size of the institution or the extent of its activities, with additional parts based on quality. Furthermore, the bulk of this formula consists of teaching and training.

Evaluation systems in international practice
118 R&D Evaluation Methodology and Funding Principles
Table 37 Finland: University core funding formula implemented since 2010
Funding based on the quality, extent and effectiveness of the activities: 75%
Other education and science policy objectives: 25 %
Education: 55%
Research and researcher training: 45%
Extent of activities 85% Extent of activities 75% Strategic development 25%
Quality and effectiveness 15%
Quality and effectiveness 25%
Education and discipline structure 75%
Source: Joint Report by the Economic Policy Committee (Quality of Public Finances) and the Directorate-General for Economic and Financial Affairs, Efficiency and effectiveness of public expenditure on tertiary education in the EU, Annex: country fiche Finland, European Economy Occasional Papers No 70.
The components of the ‘Quality, extent and effectiveness’ scoring are calculated based on the following aspects:
Extent of activities in education
Degree targets and their attainment continue to play a key part in the model because they are the key outputs of universities. However, the focus on degree-based funding has shifted from targets to outputs, in order to find a balance between plans and reality. The idea is to have incentives in place. Making the number of degrees awarded a criterion in funding encourages universities to organise their activities in such a way as to make it possible for students to complete their degree studies within the normal time.
Up to the early 2000s the institutional funding component of the budget was directly based on annual institutional targets for Master’s and doctoral degrees, as agreed with the Ministry of Education for each main field of study offered by the university. Target figures were simply multiplied by a field-specific cost factor, which was also agreed for the three-year contract period.
With a view to balancing the annual variations in the number of degrees awarded by the smaller universities, the average number of degrees over several years will be considered. The differences in the cost structure of different fields of education (including the specific nature of the arts; required equipment) and in teacher training colleges will be taken into account in the funding model as part of the educational and disciplinary structure funding element, which forms part of ‘other education and science policy objectives’
Quality and effectiveness in education
• The quality of education and functioning of study processes (80%), of which
− The number of students studying for first- and second-cycle higher education degrees completing at least 45 ECTS credits in one academic year (50%)
− The number of student graduates who started studying for their first degree in x after 7 years have passed (50%)
• Internationalisation of education (20%), of which
− Number of outgoing and incoming exchange students in Finland (duration of exchange over 3 months) (50%)
− Number of ECTS credits completed in education in a foreign language (and the number of ECTS credits completed abroad included in the degree) (13%)

Evaluation systems in international practice
R&D Evaluation Methodology and Funding Principles 119
− The number of ECTS credits acquired abroad and included in the degree is included in the calculation when the data collection of the statistical material is complete (12%)
− Number of international degree students (25%)
Extent of activities in research and researcher education
• Teaching and research person-years (50%);
• Total number of doctoral degrees determined in the agreement between the Ministry and the university (25%);
• Total number of doctoral degrees completed at the university (25%)
Quality and effectiveness of research and researcher education:
• Nationally competed research funding (60%), of which
− Academy of Finland funding for the university (50%),
− Funding allocated to the university on the basis of the Academy’s decisions on Centres of Excellence (30%)
− Tekes funding for the university (20%)
• Scientific publications (20%), of which
− Number of refereed international publications (60%)
− Number of other scientific publications (40%)
• Internationalisation of research (20%), of which
− Amount of internationally competed research funding (60%)
− Overall extent of teacher and researcher mobility (40%) In effect, this means that the element of the formula relating strictly to performance measures for research equates to 8.44% of the entire formula (an increase from previous years, see Ministry of education FI 2005, p63)Reflecting the different mission and focus, there is a different approach to allocation of core funding to polytechnics:
Table 38 Finland: Polytechnic core funding formula implemented since 2010
Government transfer (Unit price*number of students)
€849m in 2009
State subsidy €24m in 2009
70%
30%
On the basis of calculated number of students
On the basis of completed degrees
Project funding (approx. €20m)
Number of students determined by field of study
2-year average Performance-based funding (€4m)
Discretionary raise of unit price
Source: Benneworth et al 2011
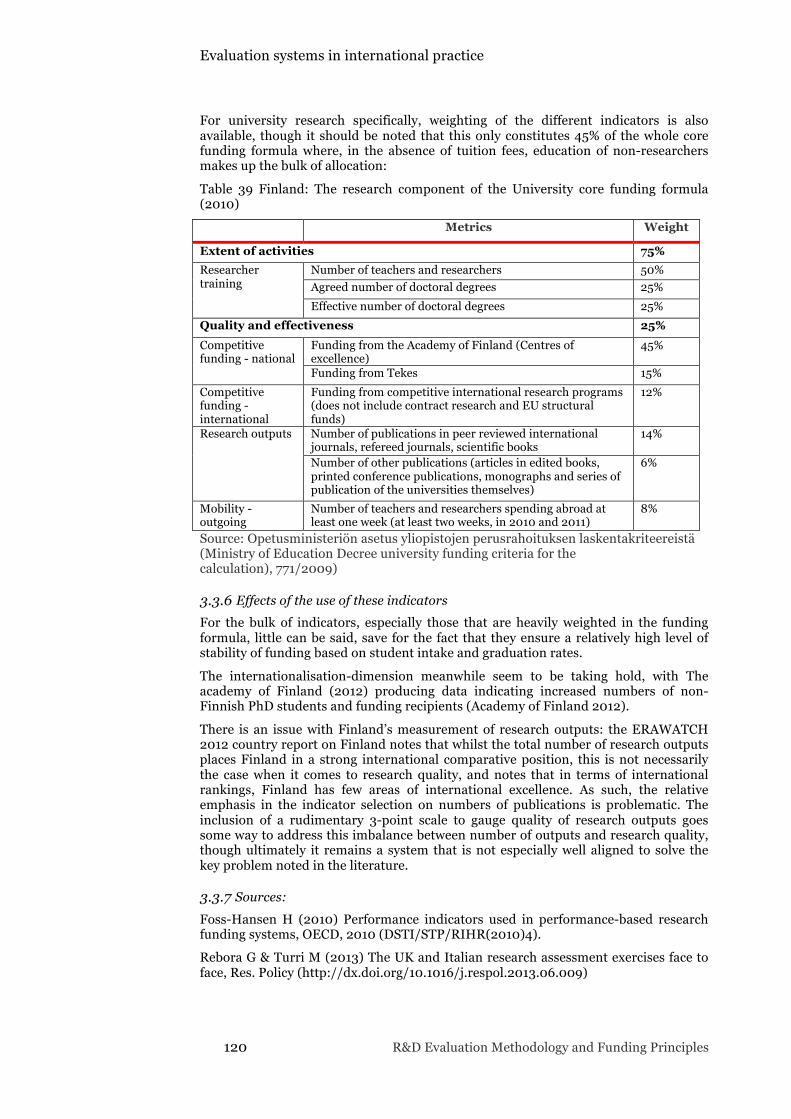
Evaluation systems in international practice
120 R&D Evaluation Methodology and Funding Principles
For university research specifically, weighting of the different indicators is also available, though it should be noted that this only constitutes 45% of the whole core funding formula where, in the absence of tuition fees, education of non-researchers makes up the bulk of allocation:
Table 39 Finland: The research component of the University core funding formula (2010)
Metrics Weight
Extent of activities 75% Researcher training
Number of teachers and researchers 50% Agreed number of doctoral degrees 25% Effective number of doctoral degrees 25%
Quality and effectiveness 25% Competitive funding - national
Funding from the Academy of Finland (Centres of excellence)
45%
Funding from Tekes 15% Competitive funding - international
Funding from competitive international research programs (does not include contract research and EU structural funds)
12%
Research outputs Number of publications in peer reviewed international journals, refereed journals, scientific books
14%
Number of other publications (articles in edited books, printed conference publications, monographs and series of publication of the universities themselves)
6%
Mobility - outgoing
Number of teachers and researchers spending abroad at least one week (at least two weeks, in 2010 and 2011)
8%
Source: Opetusministeriön asetus yliopistojen perusrahoituksen laskentakriteereistä (Ministry of Education Decree university funding criteria for the calculation), 771/2009)
3.3.6 Effects of the use of these indicators For the bulk of indicators, especially those that are heavily weighted in the funding formula, little can be said, save for the fact that they ensure a relatively high level of stability of funding based on student intake and graduation rates.
The internationalisation-dimension meanwhile seem to be taking hold, with The academy of Finland (2012) producing data indicating increased numbers of non-Finnish PhD students and funding recipients (Academy of Finland 2012).
There is an issue with Finland’s measurement of research outputs: the ERAWATCH 2012 country report on Finland notes that whilst the total number of research outputs places Finland in a strong international comparative position, this is not necessarily the case when it comes to research quality, and notes that in terms of international rankings, Finland has few areas of international excellence. As such, the relative emphasis in the indicator selection on numbers of publications is problematic. The inclusion of a rudimentary 3-point scale to gauge quality of research outputs goes some way to address this imbalance between number of outputs and research quality, though ultimately it remains a system that is not especially well aligned to solve the key problem noted in the literature.
3.3.7 Sources: Foss-Hansen H (2010) Performance indicators used in performance-based research funding systems, OECD, 2010 (DSTI/STP/RIHR(2010)4).
Rebora G & Turri M (2013) The UK and Italian research assessment exercises face to face, Res. Policy (http://dx.doi.org/10.1016/j.respol.2013.06.009)

Evaluation systems in international practice
R&D Evaluation Methodology and Funding Principles 121
Technopolis (2013) Measuring scientific performance for improved policy making – Survey Report, TG, 2013
NZ Ministry of Education (2012) An international comparison of performance-based research funding systems (PBRFS), NZME.
Ministry of Education FI (2005) OECD thematic review of tertiary education – Country background report for Finland. Publications of the Ministry of Education, Finland, 2005-38; available: http://www.oecd.org/education/skills-beyond-school/36039008.pdf
Benneworth P, de Boer H, Cremonini L, Jongbloed B, Leisyte L, Vossensteyn H & de Weert E (2011) Quality-related funding, performance agreements and profiling in higher education - An international comparative study. Center for Higher Education Policy Studies, University of Twente; available: http://www.utwente.nl/mb/cheps/publications/Publications%202011/C11HV018%20Final%20Report%20Quality-related%20funding,%20performance%20agreements%20and%20profiling%20in%20HE.pdf
Academy of Finland (2012) The State of Scientific Research in Finland 2012. Publications of the Academy of Finland 7/12; available: http://www.aka.fi/Tiedostot/Tieteentila2012/en/The_State_of_Scientific_Research_in_Finland_2012.pdf
AArrevaara T, Dobson I & Elander C (2009) Brave New World: Higher Education Reform in Finland. Higher Education Management and Policy, 21(2); available: http://www.oecd.org/edu/imhe/50314040.pdf
Könnölä T (2012) ERAWATCH Country reports 2012: Finland. Available: http://www.minedu.fi/export/sites/default/OPM/Koulutus/koulutuspolitiikka/Hankkeet/Kv_nakokulmia_Suomen_kk-jarjestelman_kehittamiseen/Liitteet/ERAWATCH_country_report_2012_Finland.pdf
Auranan O & Nieminen M (2010) University Research funding and publication performance – an international comparison. Research Policy 39 pp822-834
3.4 Italy
3.4.1 The national research evaluation – an overview Up to date, the Italian Ministry for Universities and Research (MIUR) has launched two comprehensive research evaluation exercises: VTR, which took place during the years 2001-2003 and the most recent evaluation exercise VQR (2004-2010). Whilst the VTR consisted of a peer-review evaluation, the VQR was a combination of peer review and informed bibliometrics.
The VTR evaluation 2001-2003
The first-ever national research evaluation in Italy was launched in December 2003, managed by the Committee for the Evaluation of Research (CIVR)
The VTR evaluation had the following characteristics: 72
72 Franscheta, M., Costantici, A. (2011) The first Italian research assessment exercise: A bibliometric perspective, Journal of Informetrics 5 (2011) 275–291

Evaluation systems in international practice
122 R&D Evaluation Methodology and Funding Principles
• It was fully based on peer review evaluation method: a pool of experts assessed each submitted research product and expressed a qualitative judgement that was then mapped to a quantitative categorial rating
• The ‘structures’ (universities/institutes) autonomously selected the submitted products in the measure of max. 1 product per 2 FTE researchers, choosing among the entire production over a three-year period.
• A full-time-equivalent researcher represents 0.5 researchers in universities, where researchers teach as well, while it corresponds to 1 researcher in research agencies/institutes.
• Research structures were also asked to transmit data and indicators about human resources, international mobility of researchers, funding for research projects, patents, spin-off and partnerships.
• CIVR divided the national research system into 20 scientific-disciplinary areas, including 6 interdisciplinary sectors, and set up an evaluation panel responsible for the assessment of each area.
• Each product was assessed by at least two referees who peer-reviewed it according to four aspects of merit: quality (the opinion of peer on the scientific excellence of the product compared to the international standard), importance, originality and internationalization.
• For every evaluated product panels drew up a consensus report where panelists re-examined the peer judgments and fixed the final score. CIVR weighted the peer review scores as follows: 1 (excellent), 0.8 (good), 0.6 (acceptable), and 0.2 (limited).
• The numeric formulation made it possible to sum product scores, in order to obtain a mean rating for single research structures providing a proxy for the value of the institution research performance and the possibility to compile corresponding rankings of structures.
• Rankings were compiled for each disciplinary area and within groups of structures of comparable sizes: mega structures (more than 74 products), large structures (25–74 products), medium structures (10–24 products), and small structures (less than 10 products).
• Panels provided a final report including ranking lists of the institutions in the surveyed area, highlighting strength and weakness points of the research area, and proposing possible actions of improvement.
• In the final phase of the assessment exercise, CIVR produced a detailed analysis of requested data and indicators, integrating panel reports with collected data about human resources and project funding.
The VQR 2004-2010
The VQR 2004-2010, launched in November 2011, covered a seven-year period of research activities. With more than 100 participant organisations, almost 70,000 contributors, and approximately 190,000 research products being evaluated, it was the most ambitious research evaluation exercise ever carried out in Italy. The evaluation reports were published in 2013; the results therefore guided the funding allocation in 2013.
VQR is mandatory for state universities, private universities entitled to grant academic degrees, and public research institutions controlled by the MIUR. Other public and private institutions performing research activities may be evaluated on a voluntary basis, but need to cover related expenses.
The VQR 2004-2010 included 95 universities, 12 research agencies/institutes under the control of the MIUR, and 26 research agencies/institutes which had voluntary

Evaluation systems in international practice
R&D Evaluation Methodology and Funding Principles 123
submitted an application to be evaluated by ANVUR (8 research agencies/institutes and 18 interuniversity consortia).
The objectives for the VQR were73
• To provide an objective and rigorous assessment of research in the universities and research agencies/institutes as well as their internal structures (departments, institutes etc)
• To define a national ranking per scientific area and ‘structure’ typology based on the evaluation indicators, upon which to base the allocation of the ‘premium’ share of the FFO
• To offer the institutional governance bodies an assessment of their departments and institutes which would allow for an internal allocation of the funding, in full autonomy
• To allow for a comparison of the national research quality with the quality in the major industrialised countries
The VQR was implemented adopting a mix of peer review and bibliometrics (depending on the decisions of the GEV, i.e. the evaluation panels for the different areas), combined with other metrics. Major components were
• The evaluation of the research products
• Evaluation of the research activities
• Evaluation of the ‘third mission’ activities
It involved 450 national and international scientific experts forming 14 Groups of Experts of Evaluation (GEV) for the 14 Areas of Research. This included about 17,000 national and foreign reviewers (Malgarini, ANVUR, 2014).74
Abramo et al. (2013)75 state that estimates of the direct costs of the VQR 2004-2010 are around 10-11M euro.
Major differences between the VTR 2001-2003 and the VQR 2004-2010 are: Item VTR 2001-2003 VQR 2004-2010
Method Peer review Mixed peer review & bibliometrics
Coverage 3 years 7 years
Submitted products 0.5 product per FTE researcher
6 products per FTE researcher
Nr of scientific areas 20 areas 14 areas
Focus Teaching & research activities Teaching, research & third-mission activities
Influence of PRF on institutional funding
Limited 13.5% in 2013
73 Valutazione della Qualità della Ricerca 2004-2010 (VQR 2004-2010), Parte Prima: Statistiche e risultati di compendio, ANVUR, 30 Giugno 2013 74 Malgarini (2014) Presentation: Evaluating Research in Italy: methods and practices 75 Abramo, Cicero, D’Angelo (2013). National peer-review research assessment exercises for the hard sciences can be a complete waste of money: the Italian case. Scientometrics, 95:311–324

Evaluation systems in international practice
124 R&D Evaluation Methodology and Funding Principles
Intentions for the future
The ambition of ANVUR is to launch a new VQR in 2017 (i.e. 6 years after the previous exercise), covering the time period 2011-2014 – i.e. 5 years (Malgarini, ANVUR, 2014).76
ANVUR also identified a means for an annual updating of the institutional funding allocation, based upon a set of indicators that the institutions are required to include in their annual self-assessment reports. These would include:
• Indicators for the evaluation of research activities:
− Percentage of inactives (i.e. those with zero publications in the last five years)
− Number of Scientific publications by Area in the last 10 yerars
− Number of National and international scientific awards
− Number of Fellowships in scientific bodies
− Number of projects in competitive tenders per researcher in the last 10 years
− Number of scientific products with international co-authors in the last 5 years
− Average number of Ph.D thesis per capita
− Number of months per capita of foreign teachers/students in the Department
− VQR Results
• Possible Indicators for the evaluation of third mission activities
− Scientific and cultural dissemination activities (public engagement)
− Number of patents per capita in the last ten years
− Turnover from third parties activities and competitive tenders per capita in the last ten years
− Number of spin-off (academic entrepreneurship) in the last ten years
− Number of consortia
− Third parties turnover
− Number of Extra moenia activities linked to research activities in the last ten years (e.g. Museums, Archeological sites, organization of Conferences and cultural activities)
− Life long learning
− Placement
− (Only in the bio-medical areas) Clinical experimentation and infrastructures
In her intervention to the Chamber of Deputees of April 1, 2014, however, minister Giannini stressed the importance for universities and research institutes to plan their activites, for which funding stability is a prime condition. She therefore announced her intention to stabilise the funding allocations for 3 years, discarding the idea of annual adjustments to the institutional funding allocations.
76 Malgarini (2014) Presentation: Evaluating Research in Italy: methods and practices

Evaluation systems in international practice
R&D Evaluation Methodology and Funding Principles 125
She also stressed the need fully to apply the concept of autonomy of universities in their expenditure of available funds and called for a simplification of the funding criteria, in particular in relation to the FOE.77
3.4.2 Key principles for the VQR 2004-2010 The level of assessment
The Italian VQR assess the performance of the R&D system at the level of ‘structure’, i.e. the university or research agency/institute. The institutions had the possibility also the require assessment at the second level of their organisation, i.e. departments or separate institutes.
The assessment was carried out by taking into account the performance of the ‘structure’ in specific fields of research. The scientific disciplines were categorised into 14 disciplinary areas, defined by the CUN (the National Committee for the University).
Table 40 Italy: Disciplinary areas covered in the Evaluation of Research Quality Area Name 1 Mathematics and Computer Science 2 Physics 3 Chemistry 4 Earth Sciences 5 Biology 6 Medicine 7 Agricultural and veterinary sciences 8 Civil Engineering and Agriculture 9 Industrial and Information Engineering 10 Ancient History, Philology, Literature and Art History 11 History, Philosophy, Pedagogy and Psychology 12 Law 13 Economics and Statistics 14 Political and Social Sciences
The institution was required to assign each research product submitted to one of the 14 research areas:78
For each individual researcher it hosts, the structure being evaluated must select a sample of research products. The number of products to be submitted is defined at the level of FTE researcher, i.e. 6 products per FTE researcher. Similar to the process in the VTR, each member of staff at universities accounts for 0.5 FTE researchers, taking into account their division of time between research and teaching activities.
VQR takes into account the work of research personnel (both full time and part time), including assistants, associate professors, and full professors working in Italian universities (both full time and part time), as well as first researchers, research
77 http://www.roars.it/online/il-ministro-giannini-con-asn-e-anvur-invece-di-semplificare-abbiamo-complicato/
78 See also http://www.anvur.org/index.php?option=com_content&view=article&id=32&Itemid=200&lang=it
1 ANVUR (2011) Valutazione della Qualità della Ricerca 2004‐2010 (VQR 2004‐2010)
http://www.anvur.org/attachments/article/122/bando_vqr_def_07_11.pdf

Evaluation systems in international practice
126 R&D Evaluation Methodology and Funding Principles
managers and technologists, first technologists and technologist managers working for the research institutions on the date of the publication of the call. Research personnel involved in administrative activities and other activities not linked to research activity are not considered.
Table 41 lists the typologies of staff included and the expected number of products submitted. For young researchers/technologists, a more limited number of products were to be submitted, depending on the date of hiring. Reductions were foreseen also in cases of justified absence due to illnesses and maternity leave.
The selection of the products to be submitted is done by the ‘structure’, upon proposal by the researcher submitting.
Table 41 Italy: Number of products to submit for different staff members
Function Nr product Structure
Ordinary Profesor 3 University
Associated professor 3 University
University researcher 3* University
Research director 6 Research institute
First researcher 6 Research institute
Researcher in a research institute 6** Research institute
Technology director 3 Research institute
First technologist 3 Research institute
Technologist 3* Research institute Ordinary professor in charge of research at research institute for at least 3 years 3 Research institute
Associated professor in charge of research at research institute for at least 3 years 3 Research institute
Notes: * Only if active before 2006; for each year less of activity, 1 product less; no product to be submitted if active as of 2010
** Only if active before 2006; for each year less of activity, 2 products less; no product to be submitted if active as of 2010
For each ‘structure’, each research product is to be assigned to a researcher as author or co-author, with identification of the scientific area it is submitted to. Research outputs with more than 1 author within a single institution can be submitted only once.
In case of co-authorship across institutions, the research output can be submitted by each of the institutions. In order to foster the collaboration among institutions, no weighting for co-authorships is provided, i.e. for each of the institutions the co-publication accounts as any other publication.79
Products and information submitted
The following research products were eligible for evaluation:
• Journal articles
• Books and their chapters, and conference proceedings (only those provided with an IBSN)
79 Valutazione della Qualità della Ricerca 2004-‐‑ 2010 (VQR 2004-‐‑2010), Bando di partecipazione, 7 Novembre 2011

Evaluation systems in international practice
R&D Evaluation Methodology and Funding Principles 127
• Critical editions, translations and scientific comments
• Patents granted within the seven years of the evaluation for which the individual is the author or co-author
• Compositions, drawings and design; performances, shows and expositions; manufactures, prototypes and art works, and their projects; databases and software; thematic maps - only if endowed with a publication that enables their evaluation
The institutions submit their products electronically in pdf format, together with for each product a descriptive document (in Italian or English) that contains the following information:
• The bibliographic metadata of the product
• Identification of the individual researcher
• Identification of disciplinary area and scientific field
• Indication of the presence of a foreign co-author
• An abstract of the product
• The specification that the product is an outcome of research in emerging areas or in areas of high specialisation or inter-disciplinary character, for which peer review is preferred due to the limited availability of bibliometric indicators in the field
• Any other information considered relevant for the evaluation of the product (received awards, prestige of the journal/editor etc)
In relation to the other indicators (see further below), the institutions were required to submit also the following information:
• List of patents for which the ‘structure’ is author or co-author and indication of the income deriving from the sales of patents or their licences,; information on the nature and characteristics of the buying entities, within the contractual limits of discretion
• List of spin-offs registered to the institution, with indication of the year of foundation and the income in the last 3 years, if applicable
• List of incubators in which the structure participates
• List of consortia where the structure participates – in case they have technology transfer among their objectives
• List of archeological sites active in the 7 years
• List of museums managed or co-managed
• List of other signigifcant third mission activities that are not quantifiabl as activities for third entities
• Number of evaluated staff members hosted by foreign/international institutions or researchers employed by foreign/international institutions hosted by the ‘structure’, in case of collaborations longer than 3 continuous months, within the 7 years and with indication of the total number of months
• Income from research project funding based on competition, per year within the 7 years and with specification of the call for national programmes, EC framework programmes, ERC, Structural Funds and other Italian and foreign public and private entities
• Income from research for third parties (contract research funding/consulting for public or private entities by means of direct contracting)

Evaluation systems in international practice
128 R&D Evaluation Methodology and Funding Principles
• Allocation by the ‘structure’ of funding and co-funding budgets (total for the 7 years) to funds for research without earmarking
• List of departments and evaluated staff members in each department
Methodology
The VQR 2004-2010 adopted a mix indicators/peer review approach.
The evaluation had two focus areas:
• The evaluation of the research activities, including the evaluation of the research products
• The evaluation of the third mission activities
The evaluation of the research products was based on a combination of bibliometrics and peer review.
The evaluation of the research and third mission activities, instead, was purely quantitative and based on formulas calculating the performance of an institution in a specific disciplinary area with the total performance. The methodology did not foresee site visits by the panels.
3.4.3 Evaluation of the research activities Evaluation of the research products: process, methodology and indicators
For each disciplinary area, ANVUR nominated an expert panel - GEV (Gruppi di Esperti della Valutazione). The GEVs were responsible for the nomination of the external reviewers (referees), supporting the evaluation in their area.
Selection criteria for the GEVs included their scientific expertise (quality of the research expressed in bibliometric terms and scientific awards) and previous experience in the field of research evaluation (at national and international level). For the final selection, also the share of foreign experts (minimum 20%), disctribution over the genders and the geographical disctribution in the national territory were taken into account.80
The GEVs were responsible for defining the general principles for the evaluation of research products in their field, and for evaluating the quality of each the products submitted by structures being assessed (ANVUR 2011).
ANVUR granted a considerable level of freedom to the GEVs for the definition of the evaluation methodology and the criteria to apply.
Overall, in the VQR 2004-2010, a mix of (informed) peer review and bibliometric assessments has been used. GEVs were free to decide upon the level upon which they used one or a combination of the following methodologies to carry out research product evaluation.
• Bibliometric analysis: based on the Journal Impact Factor (IF) and on the number of citations received in a year by articles published. Databases were selected in collaboration with ANVUR (e.g. Scopus, Thompson Reuters)81
80 Valutazione della Qualità della Ricerca 2004-2010 (VQR 2004-2010), Parte Prima: Statistiche e risultati di compendio, 30 Giugno 2013 81 Specific grading thresholds, criteria and databases are determined by GEVs based on the disciplinary
field.

Evaluation systems in international practice
R&D Evaluation Methodology and Funding Principles 129
• Peer review: anonymous external reviewers’ assessment of research products (normally two for each product); this was accompanied with bibliometrics (informed peer review) or simply with a journal classification list82
According to existing legislation, the overall percentage of products assigned to peer review, however, had to exceed 50%.
The peer review process was remote, and focused only on the research outputs.
Table 42 lists the disciplinary areas where the GEVs opted for the bibliometric analysis. In contrast to the British REF, this includes Maths, the engineering sciences, and economics & statistics.
Table 42 Italy: List of scientific areas where bibliometrics was chosen Area Bibliometrics
VQR (citation & IF)
Bibliometrics REF (citation)
1 – Mathematics & informatics Yes 2 - Physics Yes Yes 3 - Chemistry Yes Yes 4 – Earth sciences Yes Yes 5 - Biology Yes Yes 6 – Medical sciences Yes Yes 7 – Agrarian & veterinarian sciences Yes Yes 8 – Civil engineering & architecture Yes (partly) 9 – Industrial engineering & engineering of information
Yes
10 - Sciences of the ancient civilisations, philology/literature and history of the arts
11 – History, philosophy, pedagogics & psychology
Yes (partly)
12 - Law 13 – Economics & statistics Yes 14 – Political & social sciences Source: Valutazione della Qualita’ della Ricerca 2004-2010 , Rapporto finale ANVUR, Appendice B, Il confronto tra valutazione peer e valutazione bibliometrica, ANVUR, 2013
In the areas making significant use of bibliometrics, the process foresaw the development of a matrix to define publications for which peer review was needed, based on the outcomes of the 2 bibliometric analyses (IF versus citations). For this purpose, publications in the area were grouped into 4 performance categories in the intersection of outcomes for the 2 bibliometric indicators (Excellent, Good, Acceptable, Limited – based on %); peer review was used for those publications where the bibliometric indicators gave contradicting indications of merit (class IR in the matrix – see Figure 15).
The allocation of the different performance categories was different in various areas, depending on the importance attributed to the 2 bibliometric indicators. GEV 13, for example, (Economics and statistics) adopted different criteria than mainstream for the identification of the publications to peer review. Some GEVs adopted different matrixes taking into account the publication date of the articles.
82 Valutazione della qualita della ricerca 2004-2010 (VQR 2004-2010) Accompagnamento dei criteri (2012).

Evaluation systems in international practice
130 R&D Evaluation Methodology and Funding Principles
Figure 15 Italy: Example of matrix for the bibliometric indicators
The GEVs that did not base their make significant use of the bibliometric indicators went over to an informed peer review of the products submitted.
They also made up a classification of the journals in their scientific area, grouping them in 2 or 3 categories and based upon consultation with the research community. This was conceived as a first step in ANVUR’s process towards the development of journal lists for future use. ANVUR highlights that in the VQR2004-2010, in most cases these journal lists have not been used for the evaluation.
The peer reviewers were expected to assess the research products along the criteria listed in Table 43.
Table 43 Italy: Criteria for peer review
Criteria Description
Relevance Relevance, as added value for the advancement of knowledge in the field of science in general, as well as the induced social benefits also in terms of consistency, effectiveness, promptness and duration of the fallouts
Originality & innovation
Originality/innovation, as contribution to the advancement of knowledge or to new discoveries in the field
Internationalisation Internationalisation and/or international standing, as positioning in the international scenario, in terms of importance, competitiveness, editorial spreading and appreciation from the scientific community, including explicit cooperation with researchers and research groups form other countries
Evaluation of technology transfer
Concerning patents, the judgment must also include the evaluation of technology transfer and development, and socio-economic fallouts (even though only potential)
Based on these criteria, evaluators translated their descriptive judgments into synthetic judgements, and provide all products with a level of merit ranging from A (Excellent) to L(Limited):
• Excellent products were those recognised as such at international level in terms of their originality, methodological rigour and interpretative relevance. It could also include research products that were particularly innovative in their field at national level
• Good products are those of international and national importance for which the originality of the results and the methodological rigour is recognised

Evaluation systems in international practice
R&D Evaluation Methodology and Funding Principles 131
• Acceptable products have an international or national diffusion and have increased to a certain extent the knowledge base in their fields of research
• Products of limited value have a natonal or local diffusion, or internationally of little relevance, and have contributed in a modest manner to knowledge in their fields of research
The outcome of the peer review and the bibliometric assessment consist of for each research product a score for the quality with range [1,-2].
There are also some negative points given:
• The category “NV” is given to products for which the information provided by the institutions was insufficient or the product was published in a time period outside of the evaluation time frame.
• The category “M” is the result of the comparison between the number of products that a specific institution was expected to submit for a specific area (based on the number of FTE researchers) and the actual number of products submitted.
In this context it should be noted that in Italy, each researcher is ‘registered’ to a specific scientific discipline.
ANVUR itself put some question marks behind the use of this indicator
Table 44 Italy: Scores for the research product categories
Category Points E – Excellent (among the 20% best at international level) 1 B – Good (among the 20% to 40% best) 0.8 A – Acceptable (among the 40% to 50% best) 0.5 L – Limited (below 50%) 0 P – Plagiariism or fraud -2 NV - Cannot be evaluated -1 M – Missing product -0.5
The final score at institutional level related to the quality of research outputs is calculated in two steps:
• First, an average score for the ‘structure’ in the area is calculated, taking into consideration the size of the institution. The formula is: the sum of the scores per structure in the area divided by the number of products that were expected for submission.
• Second, two final scores are calculated:
− The performance of the structure in the area (indicator R), i.e. the average score of the structure in the area divided by the average score in the area, indicating whether the structure performs better (R>1) or worse (R<1) than the average in the area
− The level of excellence (indicator X), i.e. the % of products valued as excellent in the structure divided by the % of products valued as excellent in the area
These final scores were published and a ranking of the institutions within each area was identified. However, for the final ranking of the institutions as well as funding allocation purposes, this indicator was combined with the other research activities indicators (see below).

Evaluation systems in international practice
132 R&D Evaluation Methodology and Funding Principles
3.4.4 Evaluation of the research activities: indicators and scorings Table 45 lists the indicators that in the VQR2004-2010 were taken into consideration for the evaluation of the institutions’ research activities. For each of these indicators, the performance of the institution was defined in terms of share of the overall performance in the specific area.
An indicator that stands out compared to the usual international practice is the mobility indicator. This indicator is to be set against the context of the particularly low level of turnover in the Italian university system and the need to support young researchers.
Table 45 Italy: Indicators for the evaluation of the research activities Indicator code
Indicator Description
IRAS 1 Research quality Sum of the scores for submitted research products
IRAS 2 Attraction of resources
Total funds obtained by participating in competitive calls (national & international)
IRAS 3 Mobility indicator Sum of the quality scores for research results submitted by researchers recruited or promoted in the examined period
IRAS 4 Internationalisation
• Person months of outgoing and ingoing researchers • Sum of the scores for excellent research products with at
least 1 foreign co-author
IRAS 5 High qualification indicator
Nr of researchers in training (PhD students, postdoc grants etc)
IRAS 6 Own resources Total funds devoted by the structure to research projects to fund internal research projects or co-fund projects selected in national and international calls.
IRAS 7 Improvement Difference in performance for IRAS 1 compared to previous evaluation
The final score at institutional level related to the quality of the research activities in a specific area was defined in two steps:
• First, an aggregated indicator IRFS was constructed, aggregating the outcomes for the different indicators and applying different weights as shown in Table 46. Research quality accounted for 50% of the final score.
• Second, the size of the institution is taken into account. The formula expected products (% of total) divided by the IRFS1 x 100 gives the “% improvement” score. This score directs the ranking of the institution at the area level.
Table 46 Italy: Weights for the calculation of the final indicator for research activities
Indicator code Indicators Weight
IRAS 1 Research quality 0.5
IRAS 2 Attraction of resources 0.1
IRAS 3 Mobility indicator 0.1
IRAS 4 Internationalisation 0.1
IRAS 5 Post-graduate education 0.1
IRAS 6 Own resources 0.05
IRAS 7 Improvement 0.05
The main purpose of the VQR2004-2010 was the ranking of the universities and research agencies/institutions within specific fields and as such.

Evaluation systems in international practice
R&D Evaluation Methodology and Funding Principles 133
For this purpose, at the level of institutions, the VQR states the need to weight the outcomes of the evaluation at area level. Up to this date (2014), the VQR does not provide indications from that perspective, stating that these weightings are of competence to the MIUR as, e.g., it gives space for the prioritization of certain fields in line with the national priorities.
3.4.5 Evaluation of the third mission activities The VQR 2004-2010 was the first Italian evaluation to include indicators to capture third mission activities. ANVUR defined third mission indicators along two lines:
• Activities focused on the valorization of knowledge and the transformation of scientific knowledge into knowledge used for productive purposes.
• Activities focused on the production of public good and collective local goods, corresponding to the needs of society at large. In some presentations, ANVUR categorises these indicators also as ‘social sciences and humanities’ indicators
The weights indicated I the table below indicate the values of the different indicators for the construction of the final aggregated score at institutional level.
However, in its final report, ANVUR stated that these third mission indicators should be considered as experimental. In particular the large number of ‘other’ activities submitted by the universities and research organisations and their high level of diversity did not allow for an appropriate assessment.
ANVUR therefore recommended not (yet) using these indicators for the allocation of institutional funding.
Table 47 Italy: Third mission indicators used in the assessment of the quality of areas by structure
Indicator Metrics Weight Third parties Total of revenues derived from research/consulting
contracts with third parties for consultancies/research. 20%
Patents Number of granted patents owned or co-owned by the structure during the evaluation period 2004-2010
10%
Spin-off Number of spin-offs during the evaluation period 2004-2010
10%
Incubator Number of incubators co-owned by the structure in the period 2004-2010
10%
Consortia Number of consortia for technological transfer co-participated for 2004-2010
10%
Archaeological sites Number of archaeological sites and institutes activty,
within the evaluation period 2004-2010 10%
Museum centres Number of museum centres managed or co-managed by the structure during the evaluation period
10%
Other List of other activities provided by the structure 20% Sources: Malgarini, 2014 and ANVUR (2013) presentation
3.4.6 Reflections on intended & non-intended effects The distribution of ‘missing’ products

Evaluation systems in international practice
134 R&D Evaluation Methodology and Funding Principles
ANVUR83 noticed that the level of ‘missing’ products highly varies among disciplinary areas, ranging from 1.3% to 18.4%. This is only partly due to the number of ‘non-active’ researchers. It also reflects the choicve of area in which the products are submitted, decided by the ‘structure’, which may be different from the area to which the researcher ‘belongs’. This explains, for example, the fact that the Area 9 had more products submitted than were expected.
The level of ‘migration’ was particularly high for the Areas 1 and 4; Area 9 was the one receiving most prodycts from other areas.
The allocation on funding; rewarding performance
Abramo et al. (2011b)84 examine the effect of selective allocation of university funding in competitive and non-competitive university systems. They notice that in Italy, an example of a less competitive university system, the overall research product of each university is significantly concentrated in the output of a small number of scientists. Italian universities all show a particularly skewed distribution of performance, which makes them all very similar. “The variability of performance between universities is lower than within.”
The authors consider that in these cases, without a mechanism for internal redistribution coherent with that adopted by the central government for allocating portions of research funding to universities, the objectives of the PBRF system will not be realized. National evaluation exercises do not provide the universities with performance rankings at the level of individual scientists, and the universities lack suitable instruments for their measure. As a consequence, in higher education systems where performance differences within universities are notably higher than between, government funding allocations based on university rankings rather than on individual scientist rankings are likely to fall short of their purpose and penalize high performers located at lower ranked universities..
Indirect effects on career prospects of individual scientists
The evaluation of individuals is not an explicit objective of the VQR and the ANVUR has repeatedly communicated that the evaluation outcomes should not be considered at the individual level. However, the VQR does have an indirect impact on individual researchers (Rebora and Turri, 2013). The degree to which scholars publish in journals listed as level ‘A’ in the VQR is shaping the career progression of scholars in Italy. Scholars that publish in high -ranking journals have more chance to secure a research position or a promotion than others.
3.5 New Zealand The Performance-Based Research Funding (PBRF) system in New Zealand (NZ) is loosely based on the RAE system that preceded the REF system in the UK, though with some consideration also given to the advantages of metrics-led systems. It has three elements: a quality evaluation measure, involving periodic peer assessments of the research performance of eligible staff (60%), as well as a measure of postgraduate Research Degree Completions (RDC) (25%) and a measure of External Research
83 Valutazione della Qualità della Ricerca 2004-2010 (VQR 2004-2010), Parte Prima: Statistiche e risultati di compendio, 30 Giugno 2013 84 Abramo, G., Cicero, T., D’Angelo, C.A., (2011), The dangers of performance-based research funding in non-competitive higher education systems, Scientometrics (2011) 87:641–654

Evaluation systems in international practice
R&D Evaluation Methodology and Funding Principles 135
Income (ERI) (15%), which form the metrics-component.85 Whilst these particular metrics-components are collected at the institutional level, the NZ PBRF is one of the only systems in the world to use individual-level peer reviews.86
The NZ research assessment system is especially costly, given its scope to peer-review all eligible researchers. The total estimated transaction costs for universities and the Tertiary Education Commission the six-year period between 2007/08 and 2012/13 was $52.1 million, amounting to just under 4% of the PBRF funding allocated in that period.87
The stated aims of the NZ PBRF are: 88
• Increase the average quality of research
• Ensure that research continues to support degree and postgraduate teaching
• Ensure that funding is available for postgraduate students and new researchers
• Improve the quality of public information on research outputs
• Prevent undue concentration of funding that would undermine research support for all degrees or prevent access to the system by new researchers
• Underpin the existing strength in the tertiary education sector
Institutions eligible to apply are “all NZ-based degree-granting tertiary education organisations” (TEOs), and all of their wholly owned subsidiaries.89
3.5.1 Inclusion of individual staff In NZ individual researchers are subject to a direct assessment of their research outputs by peer review. This involves creation of an Evidence Portfolio (EV), which is submitted to the NZ Tertiary Education Commission (NZTEC) who will assign it to a quality category (Figure 20).
Unit of assessment
The Evaluation Unit (EvU) is the TEO. The quality assessment focuses on the individual researchers, whose direct assessment score is used to calculate the organisation’s score. However, this is supplemented with scores on reasearch-degree completion rates and external research income (ERI) raised. As such, the NZ system has a dual focus, with the metrics-component assessing the institution as a whole and the peer review focusing on the individual researcher, all of which then combine into institutional scores.
All eligible researchers are required to submit an EP to their TEO. Each EP submitted is labelled with the research area to which it belongs. This determines which of the
85 New Zealand Tertiary Education Commission (NZTEC), PBRF Quality Evaluation Guidelines 2012, 2013
86 New Zealand Ministry of Education, An international comparison of performance-based research funding systems, 2012
87 New Zealand Ministry of Education (2013) Review of the Performance-Based Research Fund (PBRF), Consultation Document, page 9; available: http://www.minedu.govt.nz/NZEducation/EducationPolicies/TertiaryEducation/PolicyAndStrategy/~/media/MinEdu/Files/EducationSectors/TertiaryEducation/PBRF/PBRFConsultationDocument.pdf
88 NZTEC, 2013 (as above)
89 NZTEC, PBRF User Manual, 2014

Evaluation systems in international practice
136 R&D Evaluation Methodology and Funding Principles
twelve panels will review it (or if the research is inter-disciplinary, the TEO may nominate a panel) (NZTEC, 2012):90
• Biological Sciences
• Business and Economics
• Creative and Performing Arts
• Education
• Engineering, Technology and Architecture
• Health
• Humanities and Law
• Maori Knowledge and Development
• Mathematical and Information Sciences and Technology
• Medicine and Public Health
• Physical Sciences
• Social Sciences and Other Cultural/Social Sciences
NZTEC state that the reason all researchers have to submit an EP is to “ensure all academic and research staff who are substantially involved in research and/or teaching participate.”91 According to an assessment of the system, peer assessment at an individual level was recommended initially to:92
• Give an accurate picture of the research “landscape”
• Enhance the transparency of the assessment system
• Enable the implementation of a more finely-grained funding mechanism
• Avoid some of the undesirable features of the UK’s RAE, where large funding steps between group ratings could be destabilising in a country like NZ.
The other two elements are measured at TEO level, and are a measure of the amount of postgraduate degrees completed and the amount of external research income received respectively. These are collected annually, whilst the peer review component is less frequent: previous assessments were in 2003, 2006 and 2012, with a plan to have one every 6 years.
Academics included in the evaluation and criteria
Academic staff are eligible (and must be included) if:93
• They are expected to contribute to the learning environment at the degree level
And/or
90 NZTEC, 2013 (as above)
91 New Zealand Tertiary Education Commission (NZTEC), PBRF Quality Evaluation Guidelines 2012, 2013
92 Expert Advisory Panel advice to inform the 2012/13 review of the Performance-Based Research Fund, 2013
93 NZTEC, 2013 (see above)

Evaluation systems in international practice
R&D Evaluation Methodology and Funding Principles 137
• They are expected to make a sufficiently substantive contribution to research activity
In addition, there is a list of eligibility requirements which they must fulfil:94
• Employed or other contracted (for service) at any time between 11 June 2011 and 14 June 2012
• EITHER they were employed or otherwise contracted under an agreement or concurrent agreements of paid employment or service with a duration of at least one year
OR they were employed or otherwise contracted under one or more agreement(s) of paid employment or service for at least one year on a continuous basis
• They were employed or otherwise contracted for a minimum of one day a week, or 0.2 FTE
• Their employment or service contract functions include research and/or degree-level teaching
• Their contribution to research and/or degree-level teaching meets the requirements of the substantiveness test
• If their principal place of research or degree-level teaching is overseas, they must fulfil the staff-participation criteria for overseas staff
• If they are contracted to a TEO by an non-TEO, they must fulfil the staff-participation criteria for non-TEO staff
The EPs submitted by researcher consist of three types of evidence:
• Research outputs (ROs)
• Peer esteem (PE)
• Contributions to research environment (CRE).
Each researcher is entitled to submit up to 30 examples of each, plus 4 nominated research outputs.
The criteria for work to be submitted as a RO (NZTEC, 2012):95
• Output of research as defined for purposes of the PBRF
• Produced within the relevant period
• Able to be made available to, and assessable by, a peer review panel
They can be either quality-assured or non-quality assured, and include: published academic work, work presented as non-print media, other types of output (patents, material, products etc.).
PE is designed as a gauge of a staff member’s research quality, and is a measure of the recognition of their research by their peers. Evidence of PE can include: research-related fellowships, prizes, awards; ability to attract graduate students or to sponsor student into higher-level research positions/qualifications/opportunities; research-related citations and favourable review. They note that the number of citations alone is not a good measure, as they may not be positive.
94 NZTEC, 2013 (see above)
95 New Zealand Tertiary Education Commission (NZTEC), PBRF Quality Evaluation Guidelines 2012, 2013

Evaluation systems in international practice
138 R&D Evaluation Methodology and Funding Principles
CRE designed to provide an opportunity for staff to indicate their role and contributions to a vital, high-quality research environment. Examples of CRE evidence are: membership of research collaborations and consortia, facilitating discipline-based and research networks, supervision of student research.
The effects of the rulings
The expert advisory panel report96 recommends a number of changes to the current (2013) PBRF system in New Zealand, despite reporting that there have been increases and/or improvements in many of the areas assessed in the system. These include: increases in quality of research as measured by the expert panels; improvements in qualification completion rates of Doctoral and Masters degrees; increases in PBRF-eligible ERI. However, they find it hard to attribute any of these changes to specific parts of the PBRF. They also find that the system has very high associated costs when compared to situations in other countries.
The panel advise a transition to a group assessment scheme, based on the existing data retrieval systems. A focus on groups would encourage collaboration, which was seen as a weakness of the individual system. It also removes some of the pressure on individual scores, which was believed to be influencing hiring decisions, with more senior researchers being preferred. Allowing assessment at group level should allow more opportunities for new researchers. They also recommend a redesign of the system to reduce transaction costs.
The panel praise the direct assessment system in that it reduces the susceptibility of the system to gaming. Though the measurement of individuals encourages individualism, the inclusion of CRE goes some way to mitigate this.
The ERI and RDC measures are generally sound, though transition to an equal weighting of 20% each is suggested. This would encourage TEOs to chase ERI, securing additional funding as well as supporting links to industry. Another suggestion is to focus funding in areas with the greatest labour market need, which they describe as “ideal but difficult to implement.”97 A separate issue with RDC funding is the fixed size of the fund, which coupled with increasing enrolments, leads to a steadily declining amount per RDC.
3.5.2 Indicators and scoring systems Description of the indicators
The 3 areas of assessment in the NZ PBRF system are:
• Quality assessment
• Post-graduate qualification completions (RDC)
• External research income (ERI)
For the quality assessment, each researcher submits an EP (see page 136), which is subject to a direct peer assessment. This assessment then allocates the portfolio to a quality category, with the score further weighted by the FTE status of the researcher.
96 Expert Advisory Panel advice to inform the 2012/13 review of the Performance-Based Research Fund, 2013
97 Expert Advisory Panel advice to inform the 2012/13 review of the Performance-Based Research Fund, 2013

Evaluation systems in international practice
R&D Evaluation Methodology and Funding Principles 139
Figure 16 New Zealand: Calculation of funding share allocated by quality assessment
𝑛𝑢𝑚𝑒𝑟𝑖𝑐𝑎𝑙𝑞𝑢𝑎𝑙𝑖𝑡𝑦 𝑠𝑐𝑜𝑟𝑒 × 𝐹𝑇𝐸 𝑠𝑡𝑎𝑡𝑢𝑠
𝑜𝑓 𝑟𝑒𝑠𝑒𝑎𝑟𝑐ℎ𝑒𝑟 ×𝑓𝑢𝑛𝑑𝑖𝑛𝑔 𝑟𝑎𝑡𝑖𝑛𝑔 𝑓𝑜𝑟 𝑟𝑒𝑙𝑒𝑣𝑎𝑛𝑡 𝑎𝑟𝑒𝑎
!"#
𝑛𝑢𝑚𝑒𝑟𝑖𝑐𝑎𝑙𝑞𝑢𝑎𝑙𝑖𝑡𝑦 𝑠𝑐𝑜𝑟𝑒 × 𝐹𝑇𝐸 𝑠𝑡𝑎𝑡𝑢𝑠
𝑜𝑓 𝑟𝑒𝑠𝑒𝑎𝑟𝑐ℎ𝑒𝑟 ×𝑓𝑢𝑛𝑑𝑖𝑛𝑔 𝑟𝑎𝑡𝑖𝑛𝑔 𝑓𝑜𝑟 𝑟𝑒𝑙𝑒𝑣𝑎𝑛𝑡 𝑎𝑟𝑒𝑎
!"" !"#$
×
𝑡𝑜𝑡𝑎𝑙 𝑎𝑚𝑜𝑢𝑛𝑡𝑜𝑓 𝑓𝑢𝑛𝑑𝑖𝑛𝑔 𝑎𝑣𝑎𝑖𝑙𝑎𝑏𝑙𝑒𝑓𝑜𝑟 𝑡ℎ𝑒 𝑄𝐸𝑐𝑜𝑚𝑝𝑜𝑛𝑒𝑛𝑡
Source: PBRF User Manual (NZTEC)
The formula in Figure 16 gives the ratio used to calculate the share of the total amount of funding available for the quality component allocated to each institution. The ratio is the sum of scores for all researchers within the TEO over the sum of all researchers at all TEOs. The score for each individual researcher is their numerical quality score weighted by their FTE status and the funding rating for their research area.
This indicator directly addresses the objectives of the PBRF relating to increasing the average quality of research, and also improving the quality of public information on research outputs.
The RDC component consists of the number of research-based postgraduate degrees that are completed at the TEO, weighted according to the qualification. This measure is designed to perform two purposes: to capture the connection between staff research and research training, so providing assurance of the future of tertiary education; as a proxy for research quality, assuming students who choose to undertake expensive degrees will seek out those researchers/departments with good reputations.
Figure 17 New Zealand: RDC funding formula
𝑅𝐷𝐶 =𝑟𝑒𝑠𝑒𝑎𝑟𝑐ℎ 𝑐𝑜𝑚𝑝𝑜𝑛𝑒𝑛𝑡𝑤𝑒𝑖𝑔ℎ𝑡𝑖𝑛𝑔
× 𝑐𝑜𝑠𝑡 𝑤𝑒𝑖𝑔ℎ𝑡𝑖𝑛𝑔 𝑓𝑜𝑟 𝑟𝑒𝑙𝑒𝑣𝑎𝑛𝑡𝑠𝑢𝑏𝑗𝑒𝑐𝑡 𝑎𝑟𝑒𝑎
× 𝑒𝑞𝑢𝑖𝑡𝑦
𝑤𝑒𝑖𝑔ℎ𝑡𝑖𝑛𝑔
Source: PBRF User Manual (NZTEC)
Figure 17 shows how the RDC score for each TEO is calculated. Each research degree is allocated a score, which is a product of its research component rating (see Figure 22) and its subject rating. Each degree completed is then given this score weighted by the ethnicity of the completing student, reflecting the strategic objective to increase participation of the Maori and Pacific Islander minorities. In Figure 18 the formula used in 2011 to allocate funding by RDC scores is displayed. Each TEOs annual score is calculated summing the scores for each RDC that year. Then the ratio for funding allocation is a ratio of the weighted sum of the TEOs scores from 2007, 2008 and 2009 over the weighted sum of the scores for all TEOs in these years.
Figure 18 New Zealand: Funding formula for the RDC component 2011
𝑅𝐷𝐶 𝑓𝑜𝑟 𝑇𝐸𝑂2007 × 0.15 +𝑅𝐷𝐶 𝑓𝑜𝑟 𝑇𝐸𝑂2008 × 0.35 +𝑅𝐷𝐶 𝑓𝑜𝑟 𝑇𝐸𝑂2009 × 0.5𝑅𝐷𝐶 𝑓𝑜𝑟 𝑇𝐸𝑂2007 × 0.15 +𝑅𝐷𝐶 𝑓𝑜𝑟 𝑇𝐸𝑂2008 × 0.35 +( 𝑅𝐷𝐶 𝑓𝑜𝑟 𝑇𝐸𝑂2009 × 0.5)
!"#$
× 𝑇𝑜𝑡𝑎𝑙 𝑎𝑚𝑜𝑢𝑛𝑡 𝑜𝑓 𝑓𝑢𝑛𝑑𝑖𝑛𝑔𝑎𝑣𝑎𝑖𝑙𝑎𝑏𝑙𝑒 𝑓𝑜𝑟 𝑡ℎ𝑒 𝑅𝐷𝐶𝑐𝑜𝑚𝑝𝑜𝑛𝑒𝑛𝑡 𝑜𝑓 𝑃𝐵𝑅𝐹
Source: PBRF User Manual (NZTEC)
RDC addresses a number of the specific objectives of the PBRF. It directly ensures that research continues to support postgraduate teaching, and that funding will be available for postgraduate students. It will also increase the average quality of

Evaluation systems in international practice
140 R&D Evaluation Methodology and Funding Principles
research, as a proxy for research quality. The equity measure is designed to encourage TEOs to take on more students from under-represented backgrounds.
ERI includes all research income received by the TEO and any wholly owned subsidies. This does not include any income received in a personal capacity by researchers, controlled trusts, partnerships and joint ventures. It is used an indicator as a proxy for research quality. The understanding is that external sources of funding will allocate their resources to research that they see as high quality. This will help to increase the average quality of research, and underpin existing research strengths, specific objectives of the PBRF system.
Figure 19 New Zealand: An example of the formula for allocating ERI funding to each TEO (2011)
𝐸𝑅𝐼 𝑓𝑜𝑟 𝑇𝐸𝑂2007 × 0.15 +𝐸𝑅𝐼 𝑓𝑜𝑟 𝑇𝐸𝑂2008 × 0.35 +𝐸𝑅𝐼 𝑓𝑜𝑟 𝑇𝐸𝑂2009 × 0.5
𝑇𝑜𝑡𝑎𝑙 𝐸𝑅𝐼 𝑓𝑜𝑟 𝑎𝑙𝑙 𝑇𝐸𝑂𝑠2007 × 0.15 +𝑇𝑜𝑡𝑎𝑙 𝐸𝑅𝐼 𝑓𝑜𝑟 𝑎𝑙𝑙 𝑇𝐸𝑂𝑠2008 × 0.35 +(𝑇𝑜𝑡𝑎𝑙 𝐸𝑅𝐼 𝑓𝑜𝑟 𝑎𝑙𝑙 𝑇𝐸𝑂𝑠2009 × 0.5)
× 𝑇𝑜𝑡𝑎𝑙 𝑎𝑚𝑜𝑢𝑛𝑡 𝑜𝑓 𝑓𝑢𝑛𝑑𝑖𝑛𝑔𝑎𝑣𝑎𝑖𝑙𝑎𝑏𝑙𝑒 𝑓𝑜𝑟 𝑡ℎ𝑒 𝐸𝑅𝐼𝑐𝑜𝑚𝑝𝑜𝑛𝑒𝑛𝑡 𝑜𝑓 𝑃𝐵𝑅𝐹
Source: PBRF User Manual (NZTEC)
The formula for calculating each TEOs share of the funding allocated based on ERI is very similar to that for RDCs. The amount of ERI received by the TEO in 2007, 2008 and 2009 is summed with lower weights for earlier years. This is then factored the total ERI received by all TEOs also weighted by year. This ratio gives the share of the funding due to that TEO.
Scoring system & weights
The scoring system differs slightly across the three categories of indicator. For the quality assessment, quality categories are assigned via peer assessment to each EP. The following categories are awarded based on scores in the 3 areas of assessment.
Figure 20 New Zealand: The quality categories and weightings for the quality assessment
Quality Category Quality weighting
A 5
B 3
C 1
C(NE) 1
R 0
R(NE) 0 Source: PBRF User Manual, NZTEC
This is used in a formula (Figure 16) along with a subject weighting, and indicator of FTE status of each researcher to calculate an overall score for each TEO.
Figure 21 New Zealand: The subject areas and how they are weighted
Subject areas Funding Category Weighting
Mäori knowledge and development; law; history, history of art, classics and curatorial studies; English language and literature; foreign languages and linguistics; philosophy; religious studies and theology; political science, international relations and public policy;
A, I, J 1

Evaluation systems in international practice
R&D Evaluation Methodology and Funding Principles 141
Subject areas Funding Category Weighting
human geography; sociology, social policy, social work, criminology and gender studies; anthropology and archaeology; communications, journalism and media studies; education; pure and applied mathematics; statistics; management, human resources, industrial relations, international business and other business; accounting and finance; marketing and tourism; and economics.
Psychology; chemistry; physics; earth sciences; molecular, cellular and whole organism biology; ecology, evolution and behaviour; computer science, information technology, information sciences; nursing; sport and exercise science; other health studies (including rehabilitation therapies); music, literary arts and other arts; visual arts and crafts; theatre and dance, film and television and multimedia; and design.
B, L, V 2
Engineering and technology; agriculture and other applied biological sciences; architecture, planning, surveying; biomedical; clinical medicine; pharmacy; public health; veterinary studies and large animal science; and dentistry.
C, G, H, M, Q, N 2.5
Source: PBRF User Manual, NZTEC
The above funding categories are also used to calculate the cost weighting for the RDC measure, along with higher weights for students of Maori- and Pacific-origin. This is to encourage TEOs to enrol these students who are under-represented. Also used in the formula is a measure of the research-component of the degree.
Figure 22 New Zealand: Research component of degree and corresponding weighting
Research-component Weighting
Less than 0.75 EFTS 0
0.75-1.0 EFTS of Masters EFTS value
Masters course of 1.0 EFTS thesis or more 1
Professional Doctorate with research component EFTS value of research component
Doctorate 3 Source: PBRF User Manual, NZTEC
Overall, the three categories are weighted as follows:
• Research quality (60%)
• Research degree completions (25%)
• External research income (15%)
Effects of the use of these indicators
As the data collected in the research quality category are not used directly, but to inform peer review, the indicators that directly affect the PBRF are the number of research degree completions and external research income.
These indicators can have both positive and negative effects. The measure for degree completions can be weighted and, as is the case in NZ, used to encourage a particular group into tertiary education (students of Maori and Pacific origin). Measuring completions rather than enrolments ensures that universities are only enrolling students they believe are capable. However, through the use of a fixed RDC pool of funding, organisations will seek to increase their cohort year on year, to maintain or

Evaluation systems in international practice
142 R&D Evaluation Methodology and Funding Principles
grow their “market share”.98 This leads to a decrease in the unit of funding per completed degree.
Focus on external research income also has positives and negatives. An example is harnessing market power to ensure that the research is relevant and of high quality. On the other hand, this can lead to TEOs neglecting those areas of research that do not attract private funding.
98 NZTEC, PBRF User Manual, 2014


In collaboration with
Related Documents