FIRST IN THE HEARTS OF CUSTOMERS, FIRST IN OUR REGION The Chiba Bank, Ltd. Annual Report 2009 Year ended March 31, 2009

Welcome message from author
This document is posted to help you gain knowledge. Please leave a comment to let me know what you think about it! Share it to your friends and learn new things together.
Transcript

Printed in JapanThis annual report is printed on using soy ink.
1-2, Chiba-minato, Chuo-ku, Chiba City, Chiba 260-8720, Japan
Telephone: 81-43-245-1111
e-mail: [email protected]
http://www.chibabank.co.jp/
Financial HighlightsMessage from the PresidentThe Medium-Term Management Plan “1st1st”Retail Banking Corporate BankingExpanding Our NetworkImproving Effi ciencyCorporate GovernanceComplianceImprove the Development of Human ResourcesContributing to the Environment and the Local Community Financial SectionFive-Year Summary (Consolidated)Management’s Discussion and Analysis (Consolidated)Asset QualityRisk Management Consolidated Balance SheetsConsolidated Statements of IncomeConsolidated Statements of Changes in Net AssetsConsolidated Statements of Cash FlowsNotes to Consolidated Financial StatementsReport of Independent AuditorsNon-Consolidated Balance Sheets (Unaudited)Non-Consolidated Statements of Income (Unaudited)Supplementary Information (Unaudited)Directors, Auditors and Executive Offi cersOrganizationSubsidiariesInternational Directory Corporate Data
010205060708080910111213131416182223242526404142434546474849
Contents
Forward-Looking StatementsThis annual report contains forward-looking statements concerning Chiba Bank's future plans, strategies and performance. These forward-looking statements are not guarantees of future performance and involve risks and uncertainties, and actual results may materially differ from those contained in the forward-looking statements as a result of various factors. Important factors that might cause such a material difference include, but are not limited to, those economic conditions referred to in this annual report as assumptions. In addition, the following are among the factors that could cause actual results to differ materially from the forward-looking statements in this annual report: business conditions in the banking industry, the regulatory environment, new legislation, competition with other financial services companies, changing technology and evolving banking industry standards.
FIRST IN THE HEARTS OF CUSTOMERS, FIRST IN OUR REGION
The Chiba Bank, Ltd. Annual Report 2009Year ended March 31, 2009
The Chib
a Bank, Ltd
. Annual R
epo
rt 2009

Major Operating Indicators
Deposits*1 ¥ 8.5 trillion 2nd of Regional Banks
Loans Outstanding*2 ¥ 6.9 trillion 2nd of Regional Banks
Net Income ¥12.4 billion
Capital Ratio 11.7 %
Credit Ratings
L: A S: A-1
L: A1 S: P-1
L: AA- S: - L: Long-term
S: Short-term*1 Non-consolidated, excluding NCD*2 Non-consolidated
Standard & Poor’s
Moody’s
Rating and Investment Information
Chiba Prefecture, our operating base, is located in the Tokyo Metropolitan Area.
The total prefectural income of this area, consisting of Tokyo, Chiba, Saitama and
Kanagawa, is over 30 percent of the national fi gure. And Chiba Prefecture is one
of Japan’s leading prefectures in terms of shipments, production and marketing
in sectors such as commerce, manufacturing, fi sheries and agriculture. In terms
of industrial profi le, too, Chiba Prefecture has a very balanced economy.
With a population of over 6.1 million people, Chiba Prefecture has great
potential as an operating base. We can expect further sustained growth in the
future in light of the population growth rate, one of Japan’s highest.
Chiba Prefecture is an important industrial and economic base and gate-
way into Japan by air and sea. Narita International Airport and Chiba Port are
international trade ports whose volume of goods handled are the largest and
second-largest, respectively, in Japan.
More recently, with the development of tourism in the prefecture, and the
emergence of venture businesses to carry the local economy into the future,
Chiba Prefecture is one of Japan’s most promising domestic markets.
Our Operating Area
The Chiba Bank is the dominant bank in Chiba Prefecture. As such,
it is dedicated to providing high-quality fi nancial services, increasing
customer satisfaction and contributing to regional development.
As a regional comprehensive financial services provider, it is
pursuing various initiatives in a new spirit of fl exibility and imagina-
tion, to win the highest-possible esteem of the region’s customers,
shareholders and investors.
As of March 31, 2009, the Group comprised the Bank and its
14 subsidiaries. Chiba Bank operates 172 domestic outlets and
provides access to 28,582 ATMs. Overseas, the Bank has three
branches and one representative offi ce.
Chiba Bank Profi le
450
500
550
600
650
-0.6
3.0
4.0
2.0
1.0
0
Japan
Chiba
Population of Chiba Prefecture(10 thousand)
Rates of Population Change(‰)
Business Share of Banks Operating inChiba (As of March 31, 2008)(%)
22.9
36.9
24.2
19.5
8.6
5.88.4
6.5
12.1
Chiba Bank
Regional Banks (excluding Chiba Bank)
Second-tier Regional Banks
JA Banks, other
Source: MONTHLY KINYU JOURNAL
Japan Post Bank
Shinkin Banks
City Banks
9.0
’90
’04
555
2.8
0.7
’95
’05
579
1.6
-0.1
’00
’06
592
2.8
0.0 0.0
’05
’07
605
4.0
’07
’08
610
3.9
-0.6
’08
612
A
A
B
B
C
C
D
D
E
E
F
G
23.2
8.8
DepositsTotal:
¥35.2 trillion
NaritaMakuhariTokyo
Kanagawa Prefecture
Saitama Prefecture
Ibaraki Prefecture
Chiba
ChibaPrefecture
LoansTotal:
¥14.1 trillion
F
14.1
A
C
D
F G
E
B
Corporate Data
Principal ShareholdersThe ten largest shareholders of Chiba Bank and their respective shareholdings as of March 31, 2009 were as follows:
Number of Shares (in thousands)*
Percentage of Total Shares in Issue**
Japan Trustee Services Bank, Ltd. (Trust Account) ................................................................ 70,928 7.92%
Japan Trustee Services Bank, Ltd. (Trust Account 4G) .......................................................... 50,325 5.61%
The Master Trust Bank of Japan, Ltd. (Trust Account) .......................................................... 49,987 5.58%
The Bank of Tokyo-Mitsubishi UFJ, Ltd. ................................................................................ 44,158 4.93%
NIPPONKOA Insurance Co., Ltd. ........................................................................................... 29,905 3.33%
Nippon Life Insurance Company............................................................................................. 29,177 3.25%
The Dai-ichi Mutual Life Insurance Company ........................................................................ 25,678 2.86%
Sumitomo Life Insurance Company ........................................................................................ 17,842 1.99%
Meiji Yasuda Life Insurance Company .................................................................................... 15,579 1.73%
THE CHASE MANHATTAN BANK, N. A. LONDON SECS LENDING OMNIBUS ACCOUNT ................................................... 13,331 1.48%
* Rounded down to the nearest thousand** Rounded to two decimal places
Corporate Information
Established March 1943
Network Domestic 172 Offices (151 branches, 19 sub-branches and 2 virtual branches) 28,582 Off-branch ATM locations ( 9,454 E-net ATM locations at convenience stores, 6,053 LAWSON ATM locations at
convenience stores and 12,814 ATM locations jointly with Seven Bank, Ltd.)3 Money exchange counters
Overseas 3 Branches (New York/Hong Kong/London)1 Representative office (Shanghai)
Number of Employees* 4,081
Total Assets ¥9,996.8 billion
Loans and Bills Discounted ¥6,991.3 billion
Deposits (including NCD) ¥8,683.0 billion
Common Stock ¥145.0 billion
Capital Ratio (BIS guidelines) 11.12% (Non-consolidated) 11.70% (Consolidated)
Authorized Number of Shares 2,500,000 thousand
Number of Issued Shares 895,521 thousand
Number of Shareholders** 28,076
Ticker Code 8331
Transfer Agent Japan Securities Agents, Ltd.1-2-4, Nihombashi Kayabacho Chuo-ku, Tokyo 103-8202
Long-term Short-term
Credit Ratings (As of July 1, 2009) Standard & Poor’s A A-1
Moody’s A1 P-1
Rating and Investment Information, Inc. AA- —
Figures as shown are presented on a non-consolidated basis.* Number of Employees includes transferred employees but excludes temporary staff and one-year contract employees.** Shareholders with fewer than 1,000 shares are excluded.
The Chiba Bank, Ltd.As of March 31, 2009
49 Annual Report 2009
01 Annual Report 2009
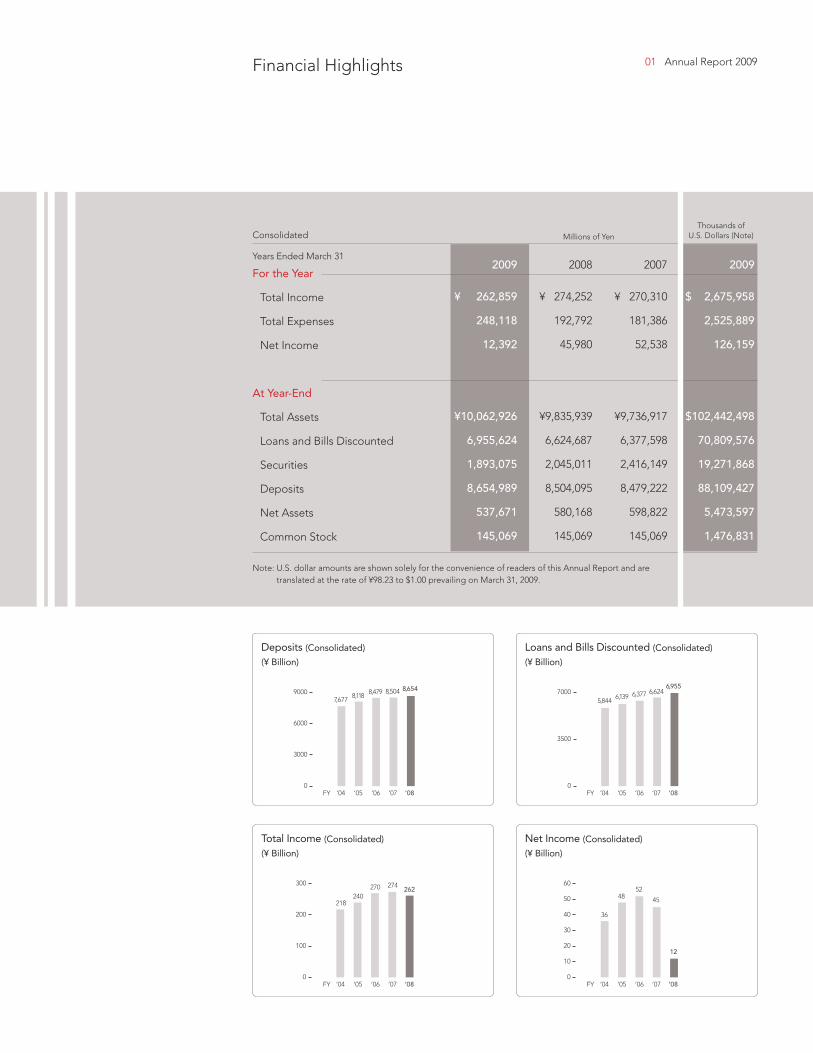
For the Year
Total Income
Total Expenses
Net Income
At Year-End
Total Assets
Loans and Bills Discounted
Securities
Deposits
Net Assets
Common Stock
Thousands ofU.S. Dollars (Note)Millions of Yen
¥ 274,252
192,792
45,980
¥9,835,939
6,624,687
2,045,011
8,504,095
580,168
145,069
2008
¥ 270,310
181,386
52,538
¥9,736,917
6,377,598
2,416,149
8,479,222
598,822
145,069
2007
Consolidated
¥ 262,859
248,118
12,392
¥10,062,926
6,955,624
1,893,075
8,654,989
537,671
145,069
2009
$ 2,675,958
2,525,889
126,159
$102,442,498
70,809,576
19,271,868
88,109,427
5,473,597
1,476,831
2009Years Ended March 31
0
3000
6000
9000
0
100
200
300
0
3500
7000
0
10
20
30
40
50
60
Note: U.S. dollar amounts are shown solely for the convenience of readers of this Annual Report and are translated at the rate of ¥98.23 to $1.00 prevailing on March 31, 2009.
Financial Highlights
Deposits (Consolidated)
(¥ Billion)
Total Income (Consolidated)
(¥ Billion)
Loans and Bills Discounted (Consolidated)
(¥ Billion)
Net Income (Consolidated)
(¥ Billion)
’04FY
’04FY
’04FY
’04FY
’05
’05
’05
’05
’06
’06
’06
’06
’07
’07
’07
’07
7,677
218
8,118
240
8,479
270
8,504
274
6,624
45
6,377
52
6,139
48
5,844
36
’08
’08
’08
’08
8,654
262
6,955
12

02 The Chiba Bank, Ltd.
The Business Environment
The Japanese economy in the year ended March
31, 2009 did not escape the effects of the global
fi nancial crisis that grew from the subprime loan
problem in the U.S. Exports and capital expen-
ditures dropped, while consumer spending and
housing purchases continued to be sluggish.
In our operating base of Chiba Prefecture,
business conditions have been harsh. But, we do
see some bright news as the population contin-
ues to grow, especially in the northwest corridor,
stimulated, in part, by development along the
Tsukuba Express rail line. The pending comple-
tion of a new high-speed rail link to Narita Airport
in 2010 will bring new infrastructure and further
raise the growth potential of the prefecture.
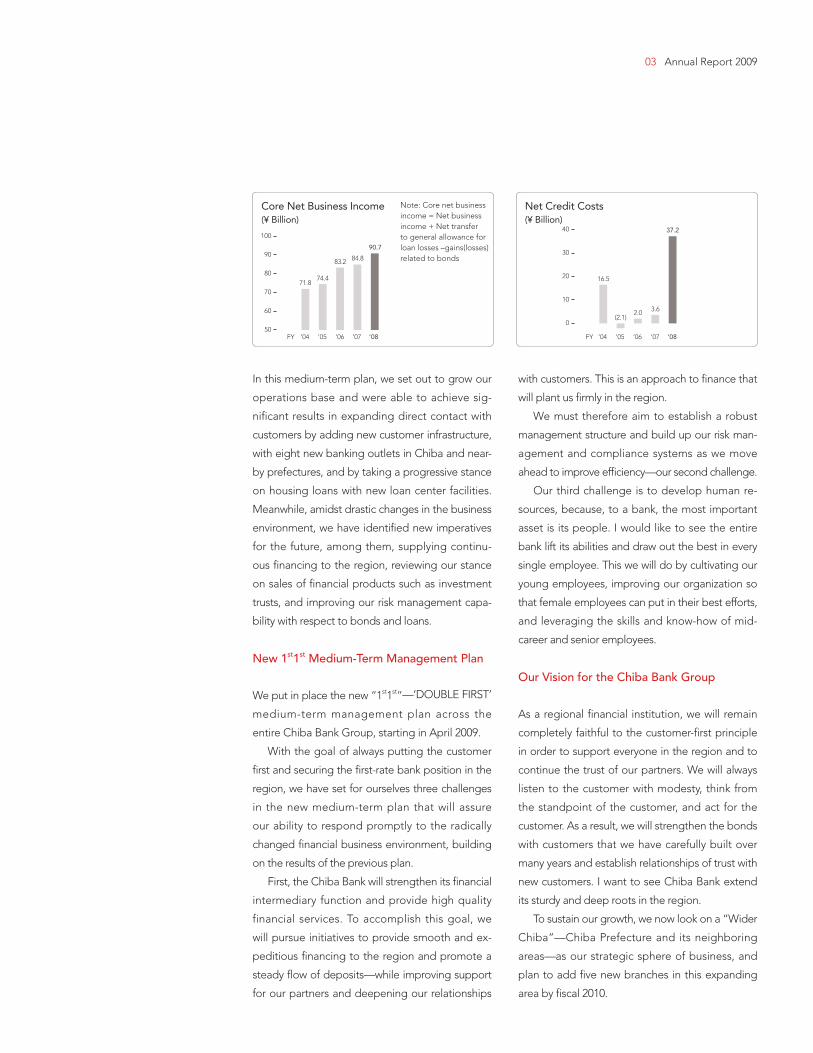
Overview of Business Performance and the
Previous Medium-Term Management Plan
Our core net business income indicates that we are
a bank with a strong earnings foundation result-
ing from healthy growth in deposits and loans. In
a fifth-consecutive record year, it reached ¥90.7
billion, a ¥5.8 billion increase from the previous
year. However, impairment losses on foreign stocks
and bonds and other holdings, together with the
increased cost of credit accompanying the fi nancial
crisis, pushed down net income, which fell ¥33.3
billion to ¥11.3 billion. Our management indicators
show continued financial health and capital ef-
fi ciency with a consolidated equity ratio of 11.70%,
a consolidated Tier I ratio of 10.17%, and an over-
head ratio of 47.07%. Cash dividends per share
were 11 yen, the same as the previous year.
In March 2009, we completed the previous
medium-term management plan, “Going Forward
with the Region: 100 Weeks of Trust and Growth.”
The Chiba Bank Group is earning the trust of all stakeholders, meeting the needs of
customers and contributing to the development of our region through the provision
of fi nancial services. To deepen this trust, we initiated the “1st1st”—‘DOUBLE FIRST’
medium-term management plan in April 2009 to target new growth, and are now
tackling the new challenges that face our group.
FIRST WITH CUSTOMERS FIRST IN QUALITY NO.1 IN OUR REGION
Message from the President
03 Annual Report 2009
In this medium-term plan, we set out to grow our
operations base and were able to achieve sig-
nificant results in expanding direct contact with
customers by adding new customer infrastructure,
with eight new banking outlets in Chiba and near-
by prefectures, and by taking a progressive stance
on housing loans with new loan center facilities.
Meanwhile, amidst drastic changes in the business
environment, we have identifi ed new imperatives
for the future, among them, supplying continu-
ous fi nancing to the region, reviewing our stance
on sales of fi nancial products such as investment
trusts, and improving our risk management capa-
bility with respect to bonds and loans.
New 1st1st Medium-Term Management Plan
We put in place the new “1st1st”—‘DOUBLE FIRST’
medium-term management plan across the
entire Chiba Bank Group, starting in April 2009.
With the goal of always putting the customer
fi rst and securing the fi rst-rate bank position in the
region, we have set for ourselves three challenges
in the new medium-term plan that will assure
our ability to respond promptly to the radically
changed fi nancial business environment, building
on the results of the previous plan.
First, the Chiba Bank will strengthen its fi nancial
intermediary function and provide high quality
financial services. To accomplish this goal, we
will pursue initiatives to provide smooth and ex-
peditious fi nancing to the region and promote a
steady fl ow of deposits—while improving support
for our partners and deepening our relationships
with customers. This is an approach to fi nance that
will plant us fi rmly in the region.
We must therefore aim to establish a robust
management structure and build up our risk man-
agement and compliance systems as we move
ahead to improve effi ciency—our second challenge.
Our third challenge is to develop human re-
sources, because, to a bank, the most important
asset is its people. I would like to see the entire
bank lift its abilities and draw out the best in every
single employee. This we will do by cultivating our
young employees, improving our organization so
that female employees can put in their best efforts,
and leveraging the skills and know-how of mid-
career and senior employees.
Our Vision for the Chiba Bank Group
As a regional financial institution, we will remain
completely faithful to the customer-fi rst principle
in order to support everyone in the region and to
continue the trust of our partners. We will always
listen to the customer with modesty, think from
the standpoint of the customer, and act for the
customer. As a result, we will strengthen the bonds
with customers that we have carefully built over
many years and establish relationships of trust with
new customers. I want to see Chiba Bank extend
its sturdy and deep roots in the region.
To sustain our growth, we now look on a “Wider
Chiba”—Chiba Prefecture and its neighboring
areas—as our strategic sphere of business, and
plan to add fi ve new branches in this expanding
area by fi scal 2010.
50
60
70
80
90
100
0
10
20
30
40
Core Net Business Income(¥ Billion)
Net Credit Costs(¥ Billion)
’04 ’04FY FY’05 ’05’06 ’06’07 ’07
71.816.574.4
(2.1)
83.2
2.0
84.8
3.6
’08 ’08
90.7
37.2
Note: Core net business income = Net business income + Net transfer to general allowance for loan losses –gains(losses) related to bonds

04 The Chiba Bank, Ltd.
“
The Chiba Bank has the competitive attitude
to tackle new challenges. Whether it is the sales
of investment trusts and insurance, newly intro-
duced fi nancial intermediary services, or any of
the numerous deregulatory measures, we are
prepared to respond promptly to the diverse
needs of our customers, backed by the continu-
ously developing talent of our employees. The
public’s high regard for these programs is shown
in the fifth Retail Bank Survey, conducted by
the Nikkei newspaper and Nikkei Research Inc.
in July 2009, in which the Chiba Bank was No.1
for the second year in a row among 121 banks
surveyed nationwide. We shall continue to move
toward becoming a “one-stop bank” providing
products and services that meet the needs of a
broad range of customers as a comprehensive
fi nancial service group for the region.
We want to nurture the trust of our customers
and must of course continue to provide leading
fi nancial products and services. And we can only
do this if we maintain the Bank’s fi nancial health
and move ahead on strengthening internal man-
agement systems. We will therefore continue our
efforts with staff at all levels working in unison to
fully uphold our standing as the region’s top bank.
I believe that through these activities, we will raise
our corporate value and meet the expectations of
our shareholders.
The Chiba Bank was No.1 for the second year in a row among 121 banks surveyed nationwide
”
40
50
60
OHR (Non-Consolidated)(%)
’04FY ’05 ’06 ’07
50.8049.95
48.82 47.97
’08
47.07
FY ’04
11.16
11.19
11.63
12.20
11.70
’05 ’06 ’07 ’089
11
13
Capital Ratio (Consolidated)(%)
FY ’04
6.007.00
9.00
11.00 11.00
’05 ’06 ’07 ’080
3
6
9
12
Cash Dividends(¥)
Hidetoshi Sakuma, President

05 Annual Report 2009
We shall achieve steady growth as an integrated regional fi nancial services group.
Improve customer satisfaction levels: We shall at all times listen closely to our customers with modesty, think from the standpoint of our customers, and act for our customers
The medium-term management plan “1st1st” – ‘DOUBLE FIRST’
We shall thoroughly implement the “customer fi rst policy” and establish the status of the bank as the “fi rst-rate bank in the region”, with 2011 being the goal of this plan.
Main Subjects
Aims
Strengthen the fi nancial intermediation functions and provide high-quality fi nancial services
By offering smooth and expeditious fi nancing, increasing our deposits, providing the optimum fi nancial products and services for customers, and suchlike, we aim to expand our customer base and thereby increase our business share in the region. We will distribute management resources effectively so that we achieve this.
Establish a robust management structure
We shall improve business effi ciency by reviewing the business processes, and reduce expenses. Also, we shall put compliance at the core of all our activities and strengthen the risk management structure.
Improve the development of human resources
By further improving the development of human resources for all the levels of employees, we shall upgrade the effectiveness of our staff.
SUBJECT 1 SUBJECT 2 SUBJECT 3
Share of loans in Chiba pref.40% or more
Number of newcustomers for loans4,000 or more per a year
Share of deposits inChiba pref.25% or more
OHR below 50%
Consolidated capital ratio around 12%

06 The Chiba Bank, Ltd. Retail Banking
Expanded Range of Loan Products The Chiba Bank is always taking steps forward and continually enhancing its range of retail loan prod-ucts to meet the needs of its customers.
These efforts have brought sustained growth in the balance of loans outstanding, especially in hous-ing loans where new loans reached a record ¥344.4 billion and helped bring the balance as of March 31, 2009, to ¥2,267.5 billion, an increase of 6.7% over the previous fiscal year’s level. The total consumer loan balance as of March 31, 2009 increased by 6.2% from the previous fi scal year to ¥2,377.0 billion. Our loan centers and loan plazas, capitalizing on alliances with residential construction companies, have been notably effective at adapting timely responses to the needs of home purchasers, and now account for 56% of new loans accepted. We have also been increas-ing business by placing new branches in the rapidly developing area along the new Tsukuba Express line.
As a participant in the Regional Bank Housing Loan Joint Research Group (main members: the Chiba Bank and the Bank of Yokohama), we have launched a housing loan exclusively for women (named the “Long Escort”), bundled a set of excel-lent services into the “Happy Everyday” product, and are participating in the “Environmental Hous-ing Loan Support Campaign” to develop products and services that help homeowners help the earth. We have also put efforts into adding convenient features like “ATM Card Loans,” whose applications can be fi lled out on an ATM screen, and consumer loans that consumers can apply for any time, any day by mobile phone (named the “Cash Top”).
Enhanced Consulting Features The Bank has been developing the skills of its fi nan-cial consultants to put in place a network of branches that can offer advice to customers and provide them with the most appropriate products.
We have placed insurance specialists at three consulting plazas where advice can be obtained on life insurance policies. Meanwhile, we are hold-ing seminars on various insurance-related themes
to support customers’ lifetime fi nancial needs. We are also enhancing our consulting services for inheritance and trust business and offer a full line of products and services as a “one-stop bank.”
Deposit and Investment Products
The Bank is actively acquiring individual deposits and aims for new customer acquisitions through expanding and concentrating business from exist-ing customers with loyalty point services like the “Himawari1 Sengen” program and by encouraging customers to designate Chiba Bank accounts for bank transfers and pension deposits. As a result of these initiatives, the balance of personal deposits as of March 31, 2009, rose 3.5% from the same time in the previous year to ¥6,594.0 billion.
On the other hand, the sudden fall in stock prices reduced sales of investment trusts. In response, we are proposing products that best fi t our customers’ changing needs, which has led to increases in total handling fees received for personal annuities and the balance of public bonds held.
In September 2008, we started a membership program for individual customers who make a certain volume of transactions and have been supplying fi -nancial services related to asset management (named the “Chibagin2 Yume Club”).
We continue to expand sales by providing the best-fit financial services for customers’ financial management requirements in the areas of investment trusts, annuities, public bonds, and other products.
The Chiba Bank is continually enhancing its line-up of products and services to match changing customer lifestyles and are augmenting our consulting functions to provide the most appropriate and highest-level fi nancial products to our customers.
FY ’04
2,267.5
’05 ’06 ’07 ’080
500
1,000
2,000
1,500
2,500
1,744.81,892.7
2,124.02,022.1
Housing Loan Balance(¥ Billion)
FY ’04
344.4
’05 ’06 ’07 ’080
50
100
300
200
250
150
350
289.4
325.4 321.5 325.3
New Housing Loans(¥ Billion)
1. Himawari is Japanese for “sunfl ower,” and the symbol of the Chiba Bank.
2. Chibagin is abbreviation in Japanese of the Chiba Bank’s name.
07 Annual Report 2009Corporate Banking
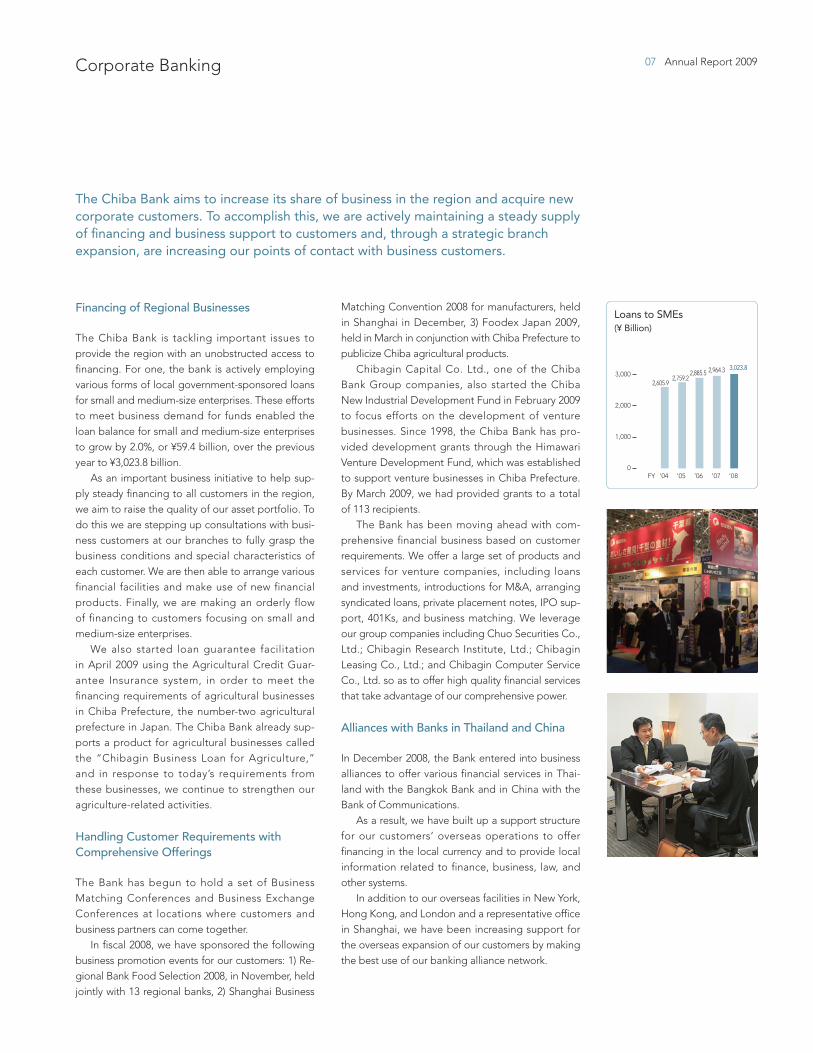
Financing of Regional Businesses The Chiba Bank is tackling important issues to provide the region with an unobstructed access to financing. For one, the bank is actively employing various forms of local government-sponsored loans for small and medium-size enterprises. These efforts to meet business demand for funds enabled the loan balance for small and medium-size enterprises to grow by 2.0%, or ¥59.4 billion, over the previous year to ¥3,023.8 billion.
As an important business initiative to help sup-ply steady fi nancing to all customers in the region, we aim to raise the quality of our asset portfolio. To do this we are stepping up consultations with busi-ness customers at our branches to fully grasp the business conditions and special characteristics of each customer. We are then able to arrange various financial facilities and make use of new financial products. Finally, we are making an orderly flow of financing to customers focusing on small and medium-size enterprises.
We also started loan guarantee facilitation in April 2009 using the Agricultural Credit Guar-antee Insurance system, in order to meet the fi nancing requirements of agricultural businesses in Chiba Prefecture, the number-two agricultural prefecture in Japan. The Chiba Bank already sup-ports a product for agricultural businesses called the “Chibagin Business Loan for Agriculture,” and in response to today’s requirements from these businesses, we continue to strengthen our agriculture-related activities.
Handling Customer Requirements with Comprehensive Offerings The Bank has begun to hold a set of Business Matching Conferences and Business Exchange Conferences at locations where customers and business partners can come together.
In fiscal 2008, we have sponsored the following business promotion events for our customers: 1) Re-gional Bank Food Selection 2008, in November, held jointly with 13 regional banks, 2) Shanghai Business
Matching Convention 2008 for manufacturers, held in Shanghai in December, 3) Foodex Japan 2009, held in March in conjunction with Chiba Prefecture to publicize Chiba agricultural products.
Chibagin Capital Co. Ltd., one of the Chiba Bank Group companies, also started the Chiba New Industrial Development Fund in February 2009 to focus efforts on the development of venture businesses. Since 1998, the Chiba Bank has pro-vided development grants through the Himawari Venture Development Fund, which was established to support venture businesses in Chiba Prefecture. By March 2009, we had provided grants to a total of 113 recipients.
The Bank has been moving ahead with com-prehensive financial business based on customer requirements. We offer a large set of products and services for venture companies, including loans and investments, introductions for M&A, arranging syndicated loans, private placement notes, IPO sup-port, 401Ks, and business matching. We leverage our group companies including Chuo Securities Co., Ltd.; Chibagin Research Institute, Ltd.; Chibagin Leasing Co., Ltd.; and Chibagin Computer Service Co., Ltd. so as to offer high quality fi nancial services that take advantage of our comprehensive power.
Alliances with Banks in Thailand and China
In December 2008, the Bank entered into business alliances to offer various financial services in Thai-land with the Bangkok Bank and in China with the Bank of Communications.
As a result, we have built up a support structure for our customers’ overseas operations to offer fi nancing in the local currency and to provide local information related to finance, business, law, and other systems.
In addition to our overseas facilities in New York, Hong Kong, and London and a representative offi ce in Shanghai, we have been increasing support for the overseas expansion of our customers by making the best use of our banking alliance network.
The Chiba Bank aims to increase its share of business in the region and acquire new corporate customers. To accomplish this, we are actively maintaining a steady supply of fi nancing and business support to customers and, through a strategic branch expansion, are increasing our points of contact with business customers.
FY ’04
3,023.8
’05 ’06 ’07 ’080
1,000
2,000
3,0002,605.9
2,885.52,759.2
2,964.3
Loans to SMEs(¥ Billion)

08 The Chiba Bank, Ltd. Expanding Our Network Improving Effi ciency
Strategic Expansion of Branches
As a result of numerous infrastructure projects, steady growth is expected in Chiba Prefecture, the operat-ing base of the Chiba Bank. The Tsukuba Express rail line that opened in 2005 in the northwest section of Chiba Prefecture has spurred population growth nearby and contributed to the general population growth of the area. Other planned infrastructure projects include a runway extension at Narita Airport expected to fi nish in 2009 and a new high-speed rail link to Narita Airport scheduled to open in 2010.
The bank is allocating significant resources to this growth region and has embarked on enriching its branch network. From fi scal 2006 to fi scal 2008, we added five new branches in Chiba Prefecture, plus two branches each in Ibaraki Prefecture and southern Saitama Prefecture, as well as four branch-es in Eastern Tokyo area. We see strategic growth potential in Chiba Prefecture and these neighboring areas as the sphere of a “Wider Chiba” and plan to add fi ve more branches by fi scal 2010. Meanwhile, we are shifting office staff at branches and in the head offi ce and related departments into fi eld staff and are putting our efforts into adding functions at the loan centers and raising the sales and opera-tions capability of all branches.
ATM Alliances Established by Six Regional Banks The Chiba Bank is moving ahead with ATM alliances covering five other regional banks: the Bank of Yokohama, the Tokyo Tomin Bank, the Joyo Bank, the Kanto Tsukuba Bank, and the Musashino Bank, allowing our customers to use the ATMs of these banks at reduced charges. This ATM alliance covers Chiba Prefecture, Tokyo, Kanagawa Prefecture, Saitama Prefecture, and Ibaraki Prefecture and provides reduced ATM charges to customers of the allied banks, excepting certain services.
More Effi cient Work Processes In addition to the strategic branch expansion, the Bank continues to streamline its work processes through a thorough reexamination of the processes themselves, sales channels, and its products and services as well as to reduce business expenses.
Since October 2008, we have gradually con-centrated telephone reception and various back offi ce management functions into an operations center and reduced the offi ce work at branches, as we take this opportunity to offer additional customer convenience.
In fiscal 2009, we initiated a review of branch work processes in search of ways to improve work-fl ow and reduce the burden of offi ce work. We will have a new branch system fully in place in fiscal year 2011, which will allow us to provide even better sales support and more rigorous office functions as we proceed with our plans to streamline work processes through concentration at the head offi ce and other means.
Strategic System-Sharing Initiatives
To make progress on streamlining operations and improving efficiency several systems must be strengthened, and to this end the Bank continues to move ahead on strategic alliances.
In July 2007, the Chiba Bank began to conduct studies concerning system sharing and alliances with the Daishi Bank, the Hokkoku Bank, the Chugoku Bank and the Iyo Bank. Anticipated benefi ts include faster product development and service provision, enhanced internal control and risk management functions, reduced IT costs and sharing of IT personnel. This initiative has been named the “Tsubasa Project,” after the Japanese word for “wing.” Since April 2008 we have proceeded on shared development of individual subsystems for joint use.
The Chiba Bank, in order to expand operations that strengthen ties with the region, provides comprehensive fi nancial services to customers while actively expanding its branch network. To this end, we are shoring up our fi nancial functions through new strategic alliances.
To maintain a slim management structure and increase profi tability, the Chiba Bank has embarked on efforts to improve our own business effi ciency.

09 Annual Report 2009
Board of Directors
The Board of Directors consists of nine directors. It makes decisions on management policies and other important matters and supervises the execution of business by the directors and executive offi cers.
Corporate Auditors The Chiba Bank has adopted a corporate auditor system. Five corporate auditors, including three highly independent outside corporate auditors (two of whom are standing corporate auditors), attend meetings of the Board of Directors and other important meetings and monitor the execution of business by the directors.
Executive Offi cer System The Bank has introduced an executive offi cer system to separate management supervision and business execution and to clarify authority and responsibility. Under this system, executive officers appointed by the Board of Directors are responsible for the execution of business.
Internal Auditing
The Audit and Inspection Division, which is inde-pendent of the units subject to auditing, conducts internal audits of headquarters, branches, and subsidiaries in accordance with the Internal Audit Plan decided each year by the Board of Directors. Audit results and any observations are reported quarterly to the Board of Directors, and problem areas from the perspective of compliance and risk management and improvement measures are con-sidered by the Internal Auditing Committee, which was established in April 2009.
Group Management Systems
The Bank maintains a system under which subsid-iaries decide their own regulations, in line with the Bank’s Compliance Regulations and various risk
management regulations, and the Bank’s adminis-trative departments control subsidiary compliance and risk management.
The Bank’s internal audit units conduct internal audits of subsidiaries throughout the Chiba Bank Group. Additionally, the Bank has a basic policy of rigorously practicing transparent management to ensure proactive, fair disclosure of business informa-tion and strives for timely, appropriate information disclosure to stakeholders by utilizing business results briefi ngs, general meetings of shareholders, and disclosure pamphlets.
Basic Policy on establishing Internal Control Systems
The Bank introduced a basic policy for the estab-lishment of systems to ensure the appropriateness of operations (Internal Control Systems) through the Board of Directors. In accordance with this policy, the Bank is working to establish a high quality management structure.
Management Structure and Headquarters Organization
General Meeting of Shareholders
Staff
Board of Directors Corporate AuditorsBoard of Corporate Auditors
Board of Designated Directors
Business Promotion Unit
Business Planning Division
Business Promotion Division Risk Management Division
Public Relations Division
Personnel Division
Branch Support Division
Treasury Operation Division
Operation Planning Division
EDP System Division
Business Operation Division
Operation Division
Credit UnitCorporate Planning and
Administration Unit
Treasury Division Compliance Division
General Secretariat
General AdministrationDivision
Overseas RepresentativeOffi ce
Credit Division
Credit Supervisory Division
Business Support Division
Corporate Planning Division
Audit andInspection
Division
Tokyo Liaison Offi ce
The Chiba Bank Group has put in place the system described below to strengthen and enhance corporate governance.
Corporate Governance

10 The Chiba Bank, Ltd. Compliance
Compliance Structure
The Chiba Bank regards compliance as one of its most important management priorities. We are determined to conduct all of our business activities fairly and in good faith, by complying with all laws and regulations relating to banking transactions, by observing all internal rules and regulatory requirements pertaining to our role in society, and by avoiding actions that would fall short of normal social expectations.
Specific action plans and measures to ensure compliance are formulated at regular meetings of the Compliance Committee. This committee is chaired by the President and consists of directors, executive offi cers and divisional general managers.
In June 2009, we established the Compliance Division to enhance our compliance activities and improve the customer protection management system. This division is responsible for various compliance-related tasks, including the adminis-tration of compliance regulations and manuals, the preparation and monitoring of training programs, and periodic checks on the compliance situation. They also monitor branch-level compliance and provide advice, including on-site guidance.
Consistent Implementation of Basic Policies Our compliance regulations include a clearly defi ned code of conduct for employees in the form of the Chiba Bank Code of Ethics. To ensure that these rules are understood and observed, all employees receive a copy of our Compliance Manual, which contains specifi c guidelines.
Compliance Program
Every year, the Board of Directors formulates a compliance program stipulating specific measures to strengthen our compliance systems, including employee education and guidance, and compliance checks. The Board of Directors and the Compliance Committee regularly monitor the implementation of this program.
Protecting Customers and Personal Information
The Bank regards customer protection as a vital element of compliance. All employees undergo guidance and training to ensure that they conduct their business activities fairly and in good faith. This is especially important when marketing complex fi nancial products, which expose customers to the risk of a reduction in principal value. All solicita-tion for such products must observe the Financial Instruments and Exchange Law and be carried out appropriately and in accordance with the Chiba Bank Solicitation Policy.
Also, the Bank has rigorously controlled customer information in accordance with our Policy for Appro-priate Protection and Use of Personal Information (Personal Information Protection Declaration).
Preventing Money Laundering The Bank is thoroughly enforcing measures against money laundering as laid out in the Management Policy to Prevent Money Laundering and Terrorism Financing Activities.
Chiba Bank Code of Ethics
Earning Unwavering TrustRemaining constantly aware of the social responsibility and public mission of a bank, the Chiba Bank will strive to earn the unwavering trust of society through sound, appropriate business operations based on the principle of self-responsibility.
Thorough Compliance with Laws, Rules and Other Fundamental PrinciplesComplying strictly with all laws and rules and never deviating from social standards, the Chiba Bank will conduct fair and honest business activities.
Opposition to Antisocial ForcesThe Chiba Bank will firmly oppose antisocial forces and groups that threaten the order and safety of society and undermine healthy economic and social development.
Transparent ManagementThe Chiba Bank will provide active and fair disclosure of management information and manage its operations in a transparent manner.
The Chiba Bank is steadfast in making compliance the basis of all business undertakings, and seeks to strengthen and enhance its systems to optimally ensure customer protection and prevent fi nancial crime.

11 Annual Report 2009Improve the Development of Human Resources
Upgrading Work Skills of New Employees
With the primary themes of strengthening corpo-rate sales and operations, strengthening credit assessment capabilities, and improving proposals for investment and financial products, the Chiba Bank conducts results-oriented training in realistic situations and raises the practical business skills for all levels of employees. In particular, we aim to develop competitive skills in new and younger employees through instructional programs and on-the-job training and emphasize the development of the workforce that will run the bank in the future.
We are focusing on lifting the skills of offi cers in administrative positions by sharing management techniques from branch managers with a wealth of experience. In particular, we conduct training for management-level positions at the worksite under the theme of management that develops their employees and meets business goals at the same time, and our operations managers convey their experience and know-how to junior managers.
Supporting Mid-career/Senior Employees and Female Employees The Bank supports the full participation of mid-career/senior employees and female employees. For mid-career and senior employees, we provide continual support for career planning through the “Active Lifestyle Support Plan” that provides a comprehensive package of second career training, surveys and assessments, and counseling.
For female employees, we are developing active support measures that could lead to promotion to management/officer-level or head office appoint-ments, extended leave for raising a family, high motivation, and career advancement. We also seek to spread full understanding at the management level of the signifi cance of supporting the develop-ment of female employees through training and the importance of work-life balance.
As a bank that is a step ahead in creating an environment for work-life balance, in May 2009
we achieved certification according to the Act for Measures to Support the Development of the Next Generation.
Improving Customer Satisfaction The Bank places high importance on having all group employees work in unison to improve customer satisfaction and is expanding its efforts in this area.
Chibagin Heartful Projects
Through its “Chibagin Heartful Projects,” the entire Chiba Bank organization is working to create and maintain environments in which all customers, includ-ing the elderly and those with disabilities, can use its services with confi dence and peace of mind. We are working to make all of our branches barrier free and have completed the necessary construction and repairs at 138 branches and have installed at least one machine per ATM location with audio guidance systems for customers with visual impairments. We have also trained and assigned 256 service assistants.
Customer Surveys
In January 2009, the Bank conducted a customer survey in which it listened to the views and wishes of a broad range of customers, which it has taken earnestly and used to improve customer satisfaction and offer high quality fi nancial services.
The Chiba Bank places high importance on having new employees develop competitive skills as quickly as possible. We seek to develop employees who can carry out a wide variety of work through complete training and instill in all employees the need for a high level of customer satisfaction.

12 The Chiba Bank, Ltd. Contributing to the Environment and the Local Community
Chibagin Cup Chiba Bank wishes to support sports activities in Chiba Prefecture including its local J-League pro-fessional soccer teams and has been sponsoring the Chibagin Cup, a pre-season soccer match, since 1995. In the 15th Annual Chibagin Cup in February 2009, we invited about 300 disabled fans from the city of Kashiwa to enjoy the red-hot excitement of the competition.
Tree-planting in the City of Chiba In March 2009, the Chiba Bank donated 36 somei yoshino cherry trees to the city of Chiba for planting along city streets.
Chibagin Himawari Concerts
In April 2009, we sponsored the 39th season of Chibagin Himawari Concerts. A wide variety of art-ists perform at various locations throughout Chiba Prefecture, and local customers are invited for free. Each year’s concerts are extremely popular for bringing a musical experience with a wide variety of music genres to the region.
Inbanuma Clean Walk
In March 2009, as part of a program to adopt Lake Inbanuma in Chiba Prefecture for restoration (the Inbanuma Association Program), approximately 120 past and present employees and offi cers of the Chiba Bank participated in a water quality preserva-tion project initiated by Chiba Prefecture in the Lake Inbanuma area (the Lake Inbanuma Clean Walk).
Preservation of Japan’s Forests In July 2008, the Chiba Bank participated in the newly established Regional Bank Volunteer Asso-ciation for the Preservation of Japan’s Forests.
A total of 56 banks participate in this association, which creates an information network of forest preser-vation activities that are refl ected in the association’s
work, and also publishes information, both inside Japan and overseas, about the importance of forest preservation. These regional activities cover all of Japan and constitute an important step in the effort to preserve Japan’s forests.
Chibagin Film Library The Chibagin Film Library was started in 1963 to commemorate the 20th anniversary of the bank’s founding. It includes collections of history and geography, sports, drama, and a wide range of other fi lms in 16mm fi lm and video formats along with equipment like 16mm film projectors, video projectors, and viewing screens. Video materials can be borrowed for free through our branches for local children’s groups like nursery schools and kindergartens, for nursing homes and senior cen-ters, and for a wide variety of other facilities.
The Chiba Bank, as a regional fi nancial institution concentrated in Chiba Prefecture, considers contribution to the local community as one of its important missions and is actively promoting corporate social responsibility (CSR).

13 Annual Report 2009
Millions of Yen
2009 2008 2007 2006 2005For the Year:
Total Income . . . . . . . . . . . . . . . . . . . . . . . . . . . . . . . . . . . ¥ 262,859 ¥ 274,252 ¥ 270,310 ¥ 240,014 ¥ 218,379
Total Expenses . . . . . . . . . . . . . . . . . . . . . . . . . . . . . . . . . . 248,118 192,792 181,386 153,807 151,409
Income Before Income Taxes and Minority Interests . . . 14,741 81,460 88,923 86,206 66,970
Net Income . . . . . . . . . . . . . . . . . . . . . . . . . . . . . . . . . . . . 12,392 45,980 52,538 48,927 36,395
At Year-End:
Total Assets . . . . . . . . . . . . . . . . . . . . . . . . . . . . . . . . . . . . ¥10,062,926 ¥9,835,939 ¥9,736,917 ¥9,802,061 ¥8,707,929
Loans and Bills Discounted . . . . . . . . . . . . . . . . . . . . . . . . 6,955,624 6,624,687 6,377,598 6,139,665 5,844,581
Securities . . . . . . . . . . . . . . . . . . . . . . . . . . . . . . . . . . . . . . 1,893,075 2,045,011 2,416,149 2,635,218 1,710,389
Deposits . . . . . . . . . . . . . . . . . . . . . . . . . . . . . . . . . . . . . . . 8,654,989 8,504,095 8,479,222 8,118,802 7,677,370
Net Assets . . . . . . . . . . . . . . . . . . . . . . . . . . . . . . . . . . . . . 537,671 580,168 598,822 — —
Total Shareholders’ Equity . . . . . . . . . . . . . . . . . . . . . . . . — — — 531,954 418,138
Capital Ratio (BIS guidelines) . . . . . . . . . . . . . . . . . . . . . . 11.70% 12.20% 11.63% 11.19% 11.16%
PER (Times) . . . . . . . . . . . . . . . . . . . . . . . . . . . . . . . . . . . . . 34.98 13.16 17.65 18.37 16.06
PBR (Times) . . . . . . . . . . . . . . . . . . . . . . . . . . . . . . . . . . . . 0.82 1.06 1.58 1.75 1.39
Yen
Per Share:
Net Income . . . . . . . . . . . . . . . . . . . . . . . . . . . . . . . . . . . . ¥ 13.86 ¥ 51.43 ¥ 58.89 ¥ 56.96 ¥ 43.19
Net Assets . . . . . . . . . . . . . . . . . . . . . . . . . . . . . . . . . . . . . 587.51 634.94 655.89 — —
Stockholders’ Equity . . . . . . . . . . . . . . . . . . . . . . . . . . . . . — — — 596.84 496.87
Five-Year Summary (Consolidated)The Chiba Bank, Ltd. and Consolidated SubsidiariesYears ended March 31
Financial Section
Note: Japanese yen amounts less than 1 million have been rounded down.

14 The Chiba Bank, Ltd.
Management’s Discussion and Analysis
Financial and Economic Environment A look back at the Japanese economy during the year under review
shows that economic conditions worsened signifi cantly. High energy
and raw material prices in the fi rst half of the fi scal year induced slower
growth, then the global economic downturn in the second half reduced
exports and dampened corporate earnings, leading to lower business
investment. Consumer spending slackened as employment and pay
conditions became more severe. Housing investment remained fl at
from the previous year, despite the receding impact of the revisions to
the Building Standards Act. Public investment was also low.
A look at the fi nancial markets shows that in short-term markets,
the unsecured overnight call rate stayed around 0.50% in the fi rst half
of the fi scal term, but then trended around 0.10% starting near the
end of 2008 following the decline in the interest policy rate in October
and December. Meanwhile, current yields on long-term government
bonds broke above the 1.8% barrier in June 2008, but then retreated
to 1.1% in December due to the worldwide economic slowdown. Since
then it has remained around 1.3%. The Nikkei Average maintained the
¥14,000 level through June 2008, then fell drastically from the impact
of the worldwide fi nancial crisis that started with the collapse of
Lehman Brothers in September and was held down to ¥8,000 in the
second half of the fi scal term. In March 2009, the Nikkei fell to ¥7,054,
its lowest level since the collapse of the Bubble Economy.
Business PerformanceFinancial Position Trends in the major fi nancial accounts for the year under review
are as follows.
Deposits increased ¥150.8 billion compared to the end of the pre-
vious fi scal year to ¥8,654.9 billion. The continued growth refl ects our
emphasis on maintaining a full lineup of fi nancial products and ser-
vices, and targeting usage of the Chiba Bank by families as their main
bank for transactions like automatic salary or pension deposits.
Loans and bills discounted grew ¥330.9 billion from the end of the
previous fi scal year to ¥6,955.6 billion. We attribute this growth to posi-
tive responses to the needs of regional businesses and to retail cus-
tomers with housing loan requirements, among other factors.
Total assets at the end of the previous fi scal year under review rose
¥226.9 billion to ¥10,062.9 billion at the end of fi scal 2008.
The consolidated capital adequacy ratio as calculated according
to BIS guidelines, was 11.70%, a year-over-year deterioration of 0.49%
from the end of the previous fi scal year.
Income and Expenses Consolidated total income was down ¥11,393 million from the previ-
ous fi scal year at ¥262,859 million. Increases in interest on loans and
discounts due to solid growth in loans and bills discounted were out-
weighed by the decrease in interest and dividends on securities, fees
and commissions, and other income sources.
Total expenses also grew year on year, to ¥248,118 million for a
¥55,326 million increase. This increase refl ects the increased cost of
funds due to deteriorating corporate earnings arising from the eco-
nomic downturn. We also recorded extraordinary losses for impair-
ment losses and losses on sales of securities for our foreign bond
holdings, due to the effects of the collapse of fi nancial institutions in
Europe and America, and we recorded further impairment losses on
stock holdings, stemming from the slumping stock market.
The above results led to consolidated net income of ¥12,392 mil-
lion, a decrease of ¥33,588 million from the previous fi scal year.
Net income per share on a consolidated basis was ¥13.86.
FY ’04 ’05 ’06 ’07 ’080
2,000
8,000
4,000
10,000
6,000
7,6778,118 8,479 8,504 8,654
Deposits (Consolidated)(¥ Billion)
FY ’04 ’05 ’06 ’07 ’080
2,000
4,000
8,000
6,000
10,000
12,000
8,7079,802 9,736 9,835 10,062
Total Assets (Consolidated)(¥ Billion)
FY ’04 ’05 ’06 ’07 ’080
2,000
4,000
8,000
6,000 5,8446,139 6,377 6,624
6,955
Loans and Bills Discounted (Consolidated)(¥ Billion)

15 Annual Report 2009
Segment Information Analysis of segment results shows that ordinary income from banking
operations decreased by ¥9,670 million from the previous fi scal year to
¥235,996 million, and that ordinary profi t decreased by ¥68,168 million
to ¥8,763 million.
Ordinary income from the leasing business decreased by ¥470 mil-
lion to ¥19,086 million, while ordinary profi t was down by ¥488 million
to ¥1,059 million. Ordinary income from other business decreased by
¥1,633 million to ¥3,303 million, while ordinary profi t decreased by
¥1,085 million to a loss of ¥244 million.
Cash Flows Net cash from operating activities in the consolidated accounting pe-
riod under review increased by ¥437.3 billion from the previous fi s-
cal year, to a net infl ow of ¥122.2 billion, due to a decrease in due
from banks and other factors. Net cash provided by investing activi-
ties decreased by ¥230.0 billion to a net infl ow of ¥27.4 billion, owing
to sales and redemptions of marketable securities and other factors.
Cash fl ows for fi nancing activities decreased by ¥14.8 billion from the
previous fi scal year to a net outfl ow ¥10.0 billion. A primary factor was
the payment of cash dividends.
As a result, cash and equivalents at the end of the term increased
by ¥139.5 billion year on year (¥192.4 billion increase from the previous
year) to ¥274.0 billion as of March 31, 2009.
Dividend Policy Our basic dividend policy takes an aggressive stance on return of prof-
its to our shareholders while maintaining sound fi nancial health sup-
ported by substantial internal reserves. This policy allows the Chiba
Bank to fulfi ll its important public role and maintain a sound fi nancial
condition. Dividend stability is an integral part of our dividend policy.
In line with this policy, we pay dividends twice per year, an interim divi-
dend on the date of record of September 30 and an annual dividend
using a March 31 date of record. The amount of the interim dividend
is approved by the board of directors and the annual dividend is ap-
proved at the ordinary general meeting of shareholders.
The fi nal dividend for the year ended March 31, 2009, was ¥4.50
per share, bringing the total dividend for the term to ¥11, which was
approved at the ordinary general meeting of shareholders.
Future Performance and Dividend Outlook The Chiba Bank Group’s outlook for the next fi scal year, ending March
31, 2010, includes projections of ¥31.0 billion in net income.
On an unconsolidated basis, we are projecting net income of
¥30.0 billion.
Taking account of our business environment for the next term end-
ing March 31, 2010, and our performance outlook for the same period,
we plan on maintaining our total annual dividend of ¥11 for the year.
FY ’04 ’05 ’06 ’07 ’080
50
200
100
300
250
150
218240
270 274 262
Total Income (Consolidated)(¥ Billion)
FY ’04 ’05 ’06 ’07 ’080
11
9
13
12
10
11.16 11.1911.63
12.2011.70
Capital Ratio (Consolidated)(%/BIS Guidelines)
FY ’04 ’05 ’06 ’07 ’080
10
40
20
60
50
30
36
4852
45
12
Net Income (Consolidated)(¥ Billion)

Normal Debtors Debtors whose business situation is good and whose fi nancial position gives no cause for concern.
Debtors Requiring CautionDebtors who are viewed with concern because of stagnant or unstable business performance, including losses.
Potentially Bankrupt Debtors Debtors who are not currently bankrupt but are seen as being at serious risk of bankruptcy.
Effectively Bankrupt DebtorsDebtors who are bankrupt in real terms, even though legal and formal bankruptcy proceedings have not been implemented.
Bankrupt DebtorsDebtors who have become bankrupt under various circumstances, including bankruptcy procedures, corporate liquidation, corporate rehabilitation and civil rehabilitation.
Non-Consolidated Consolidated
As of March 31, 2008 As of March 31, 2009 As of March 31, 2008 As of March 31, 2009
Loans to Bankrupt Borrowers 3.5 8.8 3.3 8.5
Delinquent Loans 90.4 87.0 92.4 88.8
Loans Past Due 3 Months or More 3.1 4.1 3.1 4.1
Restructured Loans 88.6 50.9 88.7 50.9
Total 185.8 150.9 187.6 152.5
Debtor Classifi cation
Risk-Monitored Loans (¥ Billion)
16 The Chiba Bank, Ltd.
Asset Quality
In June 2009, the Corporate Support Division was linked to branch
offi ces in order to help customers of those branches with manage-
ment rehabilitation plans and managing progress on these plans.
Measures to Maintain Asset Quality The Chiba Bank always endeavors to maintain and improve the quality
of its assets by such measures as proper handling of non-performing
loans, measures to prevent new occurrences of non-performing loans,
and measures to support the management rehabilitation of its cus-
tomers. We continue to develop and enhance our credit screening
and credit risk management systems.
The bank uses ties between branches and the head offi ce to offer
assistance for restoring the fi nancial health of customers. As of March
31, 2009, the ratio of non-performing assets had declined to 2.1%, and
the classifi cations of 78 of 475 customers (16.4%) provided with this
support were upgraded. In June 2009, the Corporate Support Division
was founded to strengthen our dedicated support to customers.
Self-Assessment and Debtor Classifi cationSelf-assessment of assets is the process whereby fi nancial institutions
individually review and analyze assets and classify them on the basis
of asset value impairment and the risk of default. Loans and other
assets are classifi ed into fi ve categories according to debtor credit-
worthiness: Normal Debtors, Debtors Requiring Caution, Potentially
Bankrupt Debtors, Effectively Bankrupt Debtors, and Bankrupt Debt-
ors. In the Debtors Requiring Caution category, borrowers for whom
loan repayment terms have been eased are classifi ed as Substan-
dard Debtors.
Disposal of Non-Performing AssetsThe Bank has taken appropriate measures to dispose of non-perform-
ing assets by implementing write-offs and making provisions each
term-end on the basis of the results of rigorous self-assessment of as-
sets. With respect to major debtors, the Bank calculates the allowance
for loan losses using the discounted cash fl ow method for Claims of
Substandard Debtors and Claims of Potentially Bankrupt Debtors.
Moreover, the allowance for loan losses from Bankrupt Debtors
and Effectively Bankrupt Debtors makes up the full amount of the
claims not covered by the mortgage etc. The allowance for loan losses
from Potentially Bankrupt Debtors equates to the amount of expected
losses calculated on the past loan loss ratio, as a rule.

As of March 31, 2008 As of March 31, 2009
Bankrupt and Substantially Bankrupt Claims 29.3 35.9
Doubtful Claims 65.4 61.2
Substandard Claims 91.8 55.0
Total 186.6 152.2
Total Claims Outstanding 6,827.5 7,158.1
Coverage Ratio (%) 71.4 75.1
Comparison of Classifi cations under Self-Assessment, Financial Reconstruction Law and Risk-Monitored Loans (Non-Consolidated) (As of March 31, 2009) (¥ Billion)
Disclosed Claims under the Financial Reconstruction Law (Non-Consolidated) (¥ Billion)
Assets under Self-AssessmentRisk-Monitored Loans under
the Banking LawDisclosed Claims under
the Financial Reconstruction Law
Bankrupt Assets and Effectively Bankrupt Assets 35.9
Loans to Bankrupt Borrowers 8.8 Bankrupt and SubstantiallyBankrupt Claims 35.9Delinquent Loans 87.0
Potentially Bankrupt Assets 61.2 Doubtful Claims 61.2
Assets Requiring Caution 1,157.4
Substandard Assets 68.6 Loans Past Due 3 Months or More 4.1 Substandard Claims 55.0Restructured Loans 50.9
Normal Claims 7,005.8Other Assets Requiring Caution 1,088.8
Normal Assets 5,903.4Total Assets 7,158.1 Loans Outstanding 6,991.3 Total Claims 7,158.1
17 Annual Report 2009
The coverage ratio, calculated as the allowance for loan losses
added to mortgages and the guarantees stands at 75.1%, indicating a
high level of security on the basis of claims disclosed under the Finan-
cial Reconstruction Law and limited cause for anxiety over the occur-
rence of future losses.
Disclosure of Non-Performing AssetsUnder banking regulations, disclosure of non-performing assets in-
cludes reporting of 1) risk-monitored loans as defi ned in the Banking
Law (hereinafter Risk-monitored Loans) and 2) disclosed claims under
the Financial Reconstruction Law. The Bank discloses both on the ba-
sis of self-assessment debtor classifi cations.
Disclosure of Risk-monitored Loans includes only the amount of
such loans, while disclosed claims under the Financial Reconstruc-
tion Law include customer’s liabilities for acceptances and guarantees
other than loans, accrued interest, foreign exchange, and other assets,
with the exception of Substandard Claims.
Risk-Monitored LoansIn the classifi cation of Risk-Monitored Loans, Loans to Bankrupt Bor-
rowers corresponds to Bankrupt Assets under self-assessment, Delin-
quent Loans corresponds to Effectively Bankrupt Assets and Poten-
tially Bankrupt Assets under self-assessment, Loans Past Due Three
Months or More and Restructured Loans correspond to loans delin-
quent by three months or more and loans for which repayment terms
have been eased, respectively, in Assets Requiring Caution.
Disclosed Claims under the Financial Reconstruction LawWith regard to disclosure of claims under the Financial Reconstruction
Law, the Bank discloses Claims of Bankrupt Debtors and Effectively
Bankrupt Debtors under self-assessment as Bankrupt and Substan-
tially Bankrupt Claims, Claims of Potentially Bankrupt Debtors under
self-assessment as Doubtful Claims, and loans delinquent by three
months or more and loans for which repayment terms have been
eased in Claims of Debtors Requiring Caution under self-assessment
as Substandard Claims.

18 The Chiba Bank, Ltd.
The Chiba Bank recognizes that accurately identifying and analyz-
ing and appropriately managing and administering risk is extremely
important and is reinforcing and enhancing its risk management
system through measures including compliance with Basel II (new
capital adequacy regulations), which was implemented in the year
ended March 31, 2007.
Integrated Risk Management SystemThe principal forms of risk to which banking operations are subject
include credit risk, market risk, and operational risk. In order to improve
profi tability and ensure sound business operations, the Bank considers
it necessary to not only individually manage each of these forms of
risk, but also to centrally monitor risk to control it within acceptable
overall limits.
Accordingly, in addition to assigning divisions to manage overall
risk in the Group for each form of risk, the Bank is constructing an inte-
grated risk management system by which the Risk Management Divi-
sion centrally monitors these risks. The division engages in detailed
management and deliberation of risks at meetings of the ALM Com-
mittee, Credit Risk Management Committee, and Operational Risk
Management Committee and reports to the Board of Directors on
risk-related matters and is developing an integrated risk management
system for considering and implementing risk countermeasures.
To ensure an effective risk management system, the Audit and In-
spection Division periodically conducts audits to determine whether
risk management is appropriately implemented and reports the audit
results to the Board of Directors.
Integrated Risk ManagementThe basis of risk management at the Bank is the integrated manage-
ment of various risks using uniform measures to the extent possible.
The term Integrated risk refers to the sum of credit risk, market risk,
and operational risk measurement, forms of risk that can be managed
by means of risk quantifi cation.
The Risk Management Department in the Risk Management Divi-
sion, the section responsible for integrated risk management, con-
ducts a comparison of quantifi ed integrated risk and capital, verifi es
the suffi ciency of capital with respect to risk, and reports the results
quarterly to the Board of Directors. The division also conducts stress
tests, a means of verifi cation of capital suffi ciency in times of stress
that involves the assumption of certain stress scenarios, such as de-
terioration of the corporate environment in a period of recession
or a decrease in land prices, and forecasting of the increase in the
amount of risk based on the scenarios.
The Bank has introduced a risk capital allocation system as a con-
crete framework for integrated risk measurement. A risk capital alloca-
tion system is a mechanism for engaging in business operations that
duly recognize risk and return, such as profi tability improvement at
business units and the effective utilization of capital, on the basis of
assuring management soundness by means of the preallocation of risk
capital (the amount of acceptable risk) to areas such as the domestic
banking sections and treasury sections within the scope of capital, an
indicator of fi nancial strength.
Credit Risk ManagementCredit risk is the risk of incurring a loss because of a decline in, or total
loss of, the value of owned assets as a result of deterioration in bor-
rowers’ fi nancial position. Credit risk accounts for a major portion of
risk in banking operations.
The Bank has developed a rigorous credit risk management system
centered on an internal credit rating system and engages in individual
credit management and credit portfolio management. In self-assess-
ment of assets, the Bank implements appropriate write-offs and provi-
sions and has introduced a rating and self-assessment system linked
to internal credit ratings to upgrade credit risk management.
Also the Bank has long ensured the independence of the sections
involved in credit risk. Specifi cally, the credit screening and adminis-
trative sections manage credit risk for individual business transactions
in the credit operating sections (banking offi ces and the sales promo-
tion sections). The Credit Risk Department in the Risk Management
Division, whose organization and operation are independent from the
credit screening and administrative sections and the credit operating
sections, is a credit risk management unit that engages in unifi ed man-
agement of overall credit risk. The Risk Management Department in
the Risk Management Division is a unifi ed risk management unit that
engages in the integrated management of all forms of risk, including
credit risk. The Audit and Inspection Division audits operations in the
business units involved in credit risk management.
The Credit Risk Management Committee, which is chaired by the
President, receives reports from the Credit Risk Department in the
Risk Management Division, considers credit risk management policy,
monitors the operation of the internal credit rating system and the
credit portfolio, and works to ensure the quality of loan assets.
Internal Credit Rating SystemThe Bank uses an internal credit rating system to classify borrowers
into fi fteen credit rating categories on the basis of fi nancial data such
as fi nancial condition and cash fl ow. We strive to enhance the identi-
fi cation and examination of the fi nancial circumstances at companies,
the starting point of credit risk management, by means of periodic
reviews once a year and ad-hoc reviews in accordance with borrower
circumstances. The internal credit rating system is the core of credit
risk management and is extensively used in actual management, such
as in loan rate pricing and approval authorization.
Individual Asset Credit ManagementThe banking offi ce or branch and the Credit and Supervisory Depart-
ment in the Credit Division takes the lead with regard to the screening
Risk Management

Integrated Management
Various Risks
Primary Control
Secondary Control
Liquidity RiskMarket RiskIntegrated Risk Credit Risk Operational Risk
Board of Corporate Auditors Board of Directors
ALM Committee Risk Management
Sector
Risk Operation Sector
Audit Sector
Risk Management Division
Branches, Head Office Divisions, Subsidiaries
Credit RiskManagement Committee
Operational RiskManagement Committee
Operation Planning DivisionEDP System DivisionPersonnel Division
General AdministrationDivision
Audit and Inspection Division
Risk Management System
19 Annual Report 2009
of individual assets, engaging in rigorous screening in accordance with
screening criteria on the basis of the basic principles of credit (safety,
profi tability, liquidity, growth potential and public good). The Business
Support Division provides support for the fi nancial soundness of bor-
rowers who require management improvement, and the Credit Su-
pervisory Division engages in resolution and collection activities with
regard to Bankrupt Debtors and other borrowers. The Bank strives to
accumulate excellent loan assets and minimize future losses through
this practice of advance screening and management after the fact.
Credit Portfolio ManagementCredit portfolio management is the management of the risk of simul-
taneously incurring a major loss due to the concentration of individual
loans in specifi c countries or specifi c industries. The Credit Risk Man-
agement Department in the Risk Management Division monitors the
state of credit risk from various perspectives, such as by country, by
industry, and by customer credit rating.
In credit portfolio management, the Bank engages in the quantifi -
cation of credit risk. The quantifi cation of credit risk is the forecasting
by statistical methods of the amount of future losses (the amount of
risk) forecasted to occur due to circumstances such as borrower bank-
ruptcy or worsening business performance. We measure value at risk
(VaR: the assumed maximum loss) as the amount of risk and strive to
increase the soundness of the credit portfolio by further elaborating
and developing quantifi cation by accumulating and organizing default
data and loan recovery data from defaulted borrowers.
By importing the quantitative results into various systems, we utilize
them in loan rate pricing that refl ects credit risk and other processes.
In this way, we aim to ensure more appropriate interest rate levels than
were previously possible and refi ne risk management.
Self-Assessment of AssetsSelf-assessment of assets is the practice whereby fi nancial institutions
individually review and analyze their own assets and classify them on
the basis of asset value impairment and the risk of default. Self-assess-
ment of assets is obligatory for fi nancial institutions under the system
of prompt corrective action under the Banking Law. The system of
prompt corrective action is a system by which administrative measures
are triggered in accordance with the state of the capital adequacy ra-
tio of fi nancial institutions. A prerequisite to the accurate calculation
of capital is implementation of appropriate write-offs and provisions
and the preparation of fi nancial statements that to the extent possible
objectively refl ect the actual state of asset quality.
At the Chiba Bank, branches and offi ces conduct self-assessment
of assets on the basis of Asset Self-Assessment Regulations, the credit
screening and administrative sections checks details of self assess-
ments, and the Credit Assessment Department in the Audit and Inspec-
tion Division conducts an audit of the accuracy of the self-assessment

20 The Chiba Bank, Ltd.
results and process. According to the results of these assessments, the
Credit Risk Management Department in the Risk Management Divi-
sion calculates the level of provisions, and the Credit Supervisory Divi-
sion conducts write-offs. Finally, the Credit Assessment Department
in the Audit and Inspection Division conducts an audit. Through this
process, the Bank rigorously maintains the soundness of its assets.
Market Risk ManagementMarket risk is the risk of incurring a loss due to a change in the value
of owned assets as a result of fl uctuations in interest rates, prices of
securities or other fi nancial instruments, or exchange rates.
The Bank has introduced an ALM management system with respect
to market risk. The ALM Committee, which is chaired by the President,
meets periodically to discuss and decide detailed measures to counter
interest rate risk, foreign exchange risk and price fl uctuation risk, and
manage overall market risk.
Specifi cally, as part of the Risk Capital Allocation System, within
the scope of the risk capital allocated to the business sections the
Bank sets and manages upper guideline limits and alarm points for
the amount of market risk (value at risk or VaR: the assumed maximum
loss) for each product, such as securities investments and other mar-
ket transactions or loans and deposits. In this way, we strive to ensure
management soundness. In addition to VaR management of market
transactions, the Bank sets upper limits for market investments accord-
ing to the balance and alarm point of valuation differences and imple-
ments risk control by reviewing investment policy each quarter.
With regard to market risk for market transactions for trading pur-
poses (trading with the aim of earning profi t by means of short term
fl uctuations in interest rates or prices), VaR is calculated on a daily basis,
periodic stress tests (the estimation and testing of losses in worst-case
scenarios that assume sudden market fl uctuations) are conducted,
and risk is limited and the occurrence of major losses avoided through
the setting of maximum trading limits and the rigorous application of
loss-cutting rules.
The dividing of market operations among the front offi ce (the
Treasury Division and overseas branch offi ces), back offi ce (Treasury
Operation Division), and middle offi ce (the Market Risk Management
Department in the Risk Management Division) results in a mutual con-
trol of each division.
Liquidity Risk ManagementLiquidity risk consists of cash fl ow risk and market liquidity risk. Cash
fl ow risk is the risk of incurring a loss due to failure to maintain cash
fl ow as a result of the inability to secure necessary funds or the neces-
sity of procuring funds at signifi cantly higher interest rates than usual
due to the worsening of the fi nancial institution’s fi nancial position or
other circumstances. Market liquidity risk is the risk of incurring a loss
due to the inability to trade on markets or the necessity of trading at
prices signifi cantly less favorable than usual due to market turmoil or
other circumstances.
At the Chiba Bank, the Treasury Division is the business unit that
manages cash fl ow. The division ascertains the market environment
and analyzes the state of investment and procurement of funds. With
respect to cash fl ow risk, the division engages in appropriate day-to-
day cash fl ow management through such means as the establishment
of upper limits to ensure that the amount of funds procured on the
market is not excessive and the maintenance of a certain minimum
level of assets as a liquidity reserve that can be converted to cash in a
short time. The Bank manages market liquidity risk by setting limits on
daily positions taken in market trading.
As the section that manages risk, the Market Risk Management De-
partment in the Risk Management Division strives to avoid increases
in liquidity risk by identifying and assessing various factors that affect
liquidity risk and monitoring the observance of limits. The ALM Com-
mittee meets to discuss and decide matters related to liquidity risk, as
it does with market risk. The Bank also maintains a crisis management
plan that provides for a rapid, network-wide response in the event
of the occurrence of unforeseen circumstances that could affect the
Bank’s cash fl ow.
Operational Risk ManagementOperational risk is the risk of incurring losses due to the inappropriate-
ness of business processes, employee activities, or systems or external
events. The Bank classifi es operational risk into clerical risk (described
in the next section), system risk (described in the section after next),
human risk, tangible asset risk, and reputational risk. Human risk is the
risk of a loss occurring due to the workplace safety environment, dis-
crimination, or the like. Tangible asset risk is the risk of a loss occurring
due to damage to buildings or facilities or the like. Reputational risk is
the risk of a loss occurring due to loss of public confi dence resulting
from deterioration of the Bank’s reputation.
In its risk management structure, the Bank decides the corporate
divisions having jurisdiction over the various forms of operational risk
(the Operation Planning Division for clerical risk, the EDP System Divi-
sion for system risk, the Personnel Division for human risk, and the
General Administration Division for tangible asset risk), and the divi-
sions collaborate in risk management under the overall management
of the Risk Management Department in the Risk Management Division,
the division responsible for central oversight of risk. The Risk Management
Department in the Risk Management Division directly manages repu-
tational risk and, the Compliance Division jointly manages legal risk
and compliance-related risk included in the various risk categories
with the corporate divisions that have jurisdiction.
The Bank has established the Operational Risk Management Com-
mittee, which is chaired by the President. On the basis of direct in-
volvement in management, the committee receives reports concern-
ing the state of operational risk losses and develops a management
structure for improving and correcting problem areas by means of a

21 Annual Report 2009
PDCA cycle involving the preparation of a risk management plan, de-
velopment of management regulations, and evaluation and improve-
ment. To ensure the effectiveness of management by means of this
PDCA cycle, the Bank has introduced Control Self-Assessment (CSA),
by which it formulates and implements measures to identify, assess,
monitor, and manage the details of risk, as well as to reduce risk. Man-
agement by means of CSA entails not only responding to operational
risk loss events that have occurred at the Bank, but also the preven-
tion of risk eventuation by means of evaluation of the adequacy of the
Bank’s management system in light of scenarios prepared based on
loss events that have occurred at other banks or in other industries and
the devising of countermeasures as necessary.
Clerical Risk ManagementClerical risk is the risk of incurring a loss due to the failure to perform
accurate clerical work, clerical accidents or fraud, or the failure to per-
form offi cial obligations or provide explanations to customers.
The Bank considers accurate clerical work to be essential to ob-
taining the trust of customers, and the Operation Planning Division
plays a central role in the performance of exact clerical work in ac-
cordance with basic procedures and in the effort to prevent clerical
accidents. Specifi cally, the division prepares clerical standards that
indicate detailed clerical procedures for each operation, ensures the
correct handling of cash, promissory notes, passbooks, and other im-
portant items, provides guidance on clerical management systems at
branches, offi ces, and headquarters, and conducts training to raise the
level of clerical work. The branches and offi ces periodically conduct
self-assessments and strive to ensure clerical accuracy and raise the
level of clerical work.
With regard to the auditing system, the Audit and Inspection
Division visits all branches, offi ces, and headquarters sections and
conducts rigorous audits of all clerical work in accordance with audit-
ing standards. The division promptly notifi es the branches, offi ces,
and sections of the audit results, periodically reports to the Board of
Directors, and implements a framework for refl ecting audit results in
clerical improvements.
System Risk ManagementSystem risk is the risk of incurring a loss attendant on the leakage or
falsifi cation of information owned by the Bank or the unauthorized
use, failure, or incorrect operation of computer systems. The Bank
possesses customer transaction data and various other types of infor-
mation and has developed systems to process that information. To
ensure the provision of various services to customers, the role of com-
puter systems in banking operations is increasing year by year, and
the eventuation of a system risk would result in great inconvenience
to customers. For this reason, we regard system risk management as
increasingly important.
The EDP System Division plays a central role in devising measures
to ensure the stable operation of computer systems. Specifi cally, the
Bank duplicates hardware and circuits for account systems, information
systems, and other backbone systems and maintains a framework for
rapidly switching to the backup system so that business can continue
in the event of failure. In addition, for all computer systems, including
those used individually at departments, the Bank takes every means
to prevent crime and guard against disaster, including rigorous data
management, barriers to prevent unauthorized access or the introduc-
tion of viruses, and the preparation of a contingency plan to provide
for unforeseen circumstances such as large-scale disasters. The Audit
and Inspection Division conducts audits of computer systems through-
out the organization.
Basel II ComplianceImplementation of Basel II (new capital adequacy regulations) began
in fi scal 2006. The new regulations consist of three pillars: Pillar 1 is a
minimum capital adequacy ratio based on exhaustive risk measure-
ment, Pillar 2 is the development of capital strategies by banks and
verifi cation by regulatory authorities and Pillar 3 is assurance of market
discipline through disclosure enhancement.
Under the new regulations, each bank selects a method of calculat-
ing minimum required capital according to its risk circumstances and
risk management method.
The basic policy of the Chiba Bank is to expand its business by up-
grading internal management, and the Bank is proactively complying
with the new regulations as part of its policy of building an integrated
risk management system. With regard to the calculation of minimum
required capital, we have selected the Foundation Internal Ratings-
Based (FIRB) Approach for credit risk and Standardized Approach for
operational risk (both approaches require the approval of the regula-
tory authorities) from Fiscal year 2006 and are more exhaustively re-
fl ecting risk in the minimum capital adequacy ratio.
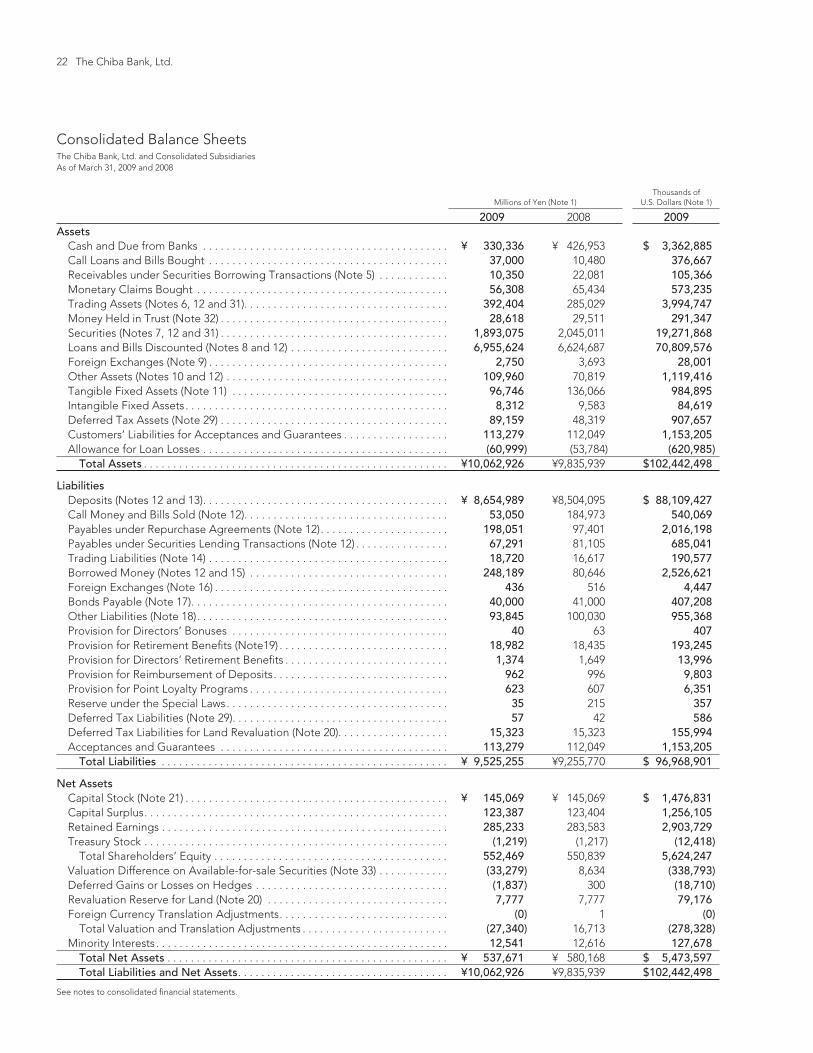
22 The Chiba Bank, Ltd.
Millions of Yen (Note 1)Thousands of
U.S. Dollars (Note 1)
2009 2008 2009Assets
Cash and Due from Banks . . . . . . . . . . . . . . . . . . . . . . . . . . . . . . . . . . . . . . . . . . ¥ 330,336 ¥ 426,953 $ 3,362,885 Call Loans and Bills Bought . . . . . . . . . . . . . . . . . . . . . . . . . . . . . . . . . . . . . . . . . 37,000 10,480 376,667 Receivables under Securities Borrowing Transactions (Note 5) . . . . . . . . . . . . 10,350 22,081 105,366 Monetary Claims Bought . . . . . . . . . . . . . . . . . . . . . . . . . . . . . . . . . . . . . . . . . . . 56,308 65,434 573,235 Trading Assets (Notes 6, 12 and 31). . . . . . . . . . . . . . . . . . . . . . . . . . . . . . . . . . . 392,404 285,029 3,994,747 Money Held in Trust (Note 32) . . . . . . . . . . . . . . . . . . . . . . . . . . . . . . . . . . . . . . . 28,618 29,511 291,347 Securities (Notes 7, 12 and 31) . . . . . . . . . . . . . . . . . . . . . . . . . . . . . . . . . . . . . . . 1,893,075 2,045,011 19,271,868 Loans and Bills Discounted (Notes 8 and 12) . . . . . . . . . . . . . . . . . . . . . . . . . . . 6,955,624 6,624,687 70,809,576 Foreign Exchanges (Note 9) . . . . . . . . . . . . . . . . . . . . . . . . . . . . . . . . . . . . . . . . . 2,750 3,693 28,001 Other Assets (Notes 10 and 12) . . . . . . . . . . . . . . . . . . . . . . . . . . . . . . . . . . . . . . 109,960 70,819 1,119,416 Tangible Fixed Assets (Note 11) . . . . . . . . . . . . . . . . . . . . . . . . . . . . . . . . . . . . . 96,746 136,066 984,895 Intangible Fixed Assets . . . . . . . . . . . . . . . . . . . . . . . . . . . . . . . . . . . . . . . . . . . . . 8,312 9,583 84,619 Deferred Tax Assets (Note 29) . . . . . . . . . . . . . . . . . . . . . . . . . . . . . . . . . . . . . . . 89,159 48,319 907,657 Customers’ Liabilities for Acceptances and Guarantees . . . . . . . . . . . . . . . . . . 113,279 112,049 1,153,205 Allowance for Loan Losses . . . . . . . . . . . . . . . . . . . . . . . . . . . . . . . . . . . . . . . . . . (60,999) (53,784) (620,985)
Total Assets . . . . . . . . . . . . . . . . . . . . . . . . . . . . . . . . . . . . . . . . . . . . . . . . . . . . ¥10,062,926 ¥9,835,939 $102,442,498
LiabilitiesDeposits (Notes 12 and 13) . . . . . . . . . . . . . . . . . . . . . . . . . . . . . . . . . . . . . . . . . . ¥ 8,654,989 ¥8,504,095 $ 88,109,427 Call Money and Bills Sold (Note 12). . . . . . . . . . . . . . . . . . . . . . . . . . . . . . . . . . . 53,050 184,973 540,069 Payables under Repurchase Agreements (Note 12) . . . . . . . . . . . . . . . . . . . . . . 198,051 97,401 2,016,198 Payables under Securities Lending Transactions (Note 12) . . . . . . . . . . . . . . . . 67,291 81,105 685,041 Trading Liabilities (Note 14) . . . . . . . . . . . . . . . . . . . . . . . . . . . . . . . . . . . . . . . . . 18,720 16,617 190,577 Borrowed Money (Notes 12 and 15) . . . . . . . . . . . . . . . . . . . . . . . . . . . . . . . . . . 248,189 80,646 2,526,621 Foreign Exchanges (Note 16) . . . . . . . . . . . . . . . . . . . . . . . . . . . . . . . . . . . . . . . . 436 516 4,447 Bonds Payable (Note 17) . . . . . . . . . . . . . . . . . . . . . . . . . . . . . . . . . . . . . . . . . . . . 40,000 41,000 407,208 Other Liabilities (Note 18) . . . . . . . . . . . . . . . . . . . . . . . . . . . . . . . . . . . . . . . . . . . 93,845 100,030 955,368 Provision for Directors’ Bonuses . . . . . . . . . . . . . . . . . . . . . . . . . . . . . . . . . . . . . 40 63 407 Provision for Retirement Benefi ts (Note19) . . . . . . . . . . . . . . . . . . . . . . . . . . . . . 18,982 18,435 193,245 Provision for Directors’ Retirement Benefi ts . . . . . . . . . . . . . . . . . . . . . . . . . . . . 1,374 1,649 13,996 Provision for Reimbursement of Deposits . . . . . . . . . . . . . . . . . . . . . . . . . . . . . . 962 996 9,803 Provision for Point Loyalty Programs . . . . . . . . . . . . . . . . . . . . . . . . . . . . . . . . . . 623 607 6,351 Reserve under the Special Laws . . . . . . . . . . . . . . . . . . . . . . . . . . . . . . . . . . . . . . 35 215 357 Deferred Tax Liabilities (Note 29). . . . . . . . . . . . . . . . . . . . . . . . . . . . . . . . . . . . . 57 42 586 Deferred Tax Liabilities for Land Revaluation (Note 20). . . . . . . . . . . . . . . . . . . 15,323 15,323 155,994 Acceptances and Guarantees . . . . . . . . . . . . . . . . . . . . . . . . . . . . . . . . . . . . . . . 113,279 112,049 1,153,205
Total Liabilities . . . . . . . . . . . . . . . . . . . . . . . . . . . . . . . . . . . . . . . . . . . . . . . . . ¥ 9,525,255 ¥9,255,770 $ 96,968,901
Net AssetsCapital Stock (Note 21) . . . . . . . . . . . . . . . . . . . . . . . . . . . . . . . . . . . . . . . . . . . . . ¥ 145,069 ¥ 145,069 $ 1,476,831 Capital Surplus . . . . . . . . . . . . . . . . . . . . . . . . . . . . . . . . . . . . . . . . . . . . . . . . . . . . 123,387 123,404 1,256,105 Retained Earnings . . . . . . . . . . . . . . . . . . . . . . . . . . . . . . . . . . . . . . . . . . . . . . . . . 285,233 283,583 2,903,729 Treasury Stock . . . . . . . . . . . . . . . . . . . . . . . . . . . . . . . . . . . . . . . . . . . . . . . . . . . . (1,219) (1,217) (12,418)
Total Shareholders’ Equity . . . . . . . . . . . . . . . . . . . . . . . . . . . . . . . . . . . . . . . . 552,469 550,839 5,624,247 Valuation Difference on Available-for-sale Securities (Note 33) . . . . . . . . . . . . (33,279) 8,634 (338,793)Deferred Gains or Losses on Hedges . . . . . . . . . . . . . . . . . . . . . . . . . . . . . . . . . (1,837) 300 (18,710)Revaluation Reserve for Land (Note 20) . . . . . . . . . . . . . . . . . . . . . . . . . . . . . . . 7,777 7,777 79,176 Foreign Currency Translation Adjustments . . . . . . . . . . . . . . . . . . . . . . . . . . . . . (0) 1 (0)
Total Valuation and Translation Adjustments . . . . . . . . . . . . . . . . . . . . . . . . . (27,340) 16,713 (278,328)Minority Interests . . . . . . . . . . . . . . . . . . . . . . . . . . . . . . . . . . . . . . . . . . . . . . . . . . 12,541 12,616 127,678
Total Net Assets . . . . . . . . . . . . . . . . . . . . . . . . . . . . . . . . . . . . . . . . . . . . . . . . ¥ 537,671 ¥ 580,168 $ 5,473,597 Total Liabilities and Net Assets . . . . . . . . . . . . . . . . . . . . . . . . . . . . . . . . . . . . ¥10,062,926 ¥9,835,939 $102,442,498
Consolidated Balance SheetsThe Chiba Bank, Ltd. and Consolidated SubsidiariesAs of March 31, 2009 and 2008
See notes to consolidated financial statements.

23 Annual Report 2009
Millions of Yen (Note 1)Thousands of
U.S. Dollars (Note 1)
2009 2008 2009Income
Interest Income:
Interest on Loans and Discounts . . . . . . . . . . . . . . . . . . . . . . . . . . . . . . . . . . . ¥149,824 ¥144,937 $1,525,237
Interest and Dividends on Securities . . . . . . . . . . . . . . . . . . . . . . . . . . . . . . . . 28,699 38,163 292,164
Other Interest Income . . . . . . . . . . . . . . . . . . . . . . . . . . . . . . . . . . . . . . . . . . . . 2,789 3,533 28,396
Trust Fees . . . . . . . . . . . . . . . . . . . . . . . . . . . . . . . . . . . . . . . . . . . . . . . . . . . . . . . . 5 8 56
Fees and Commissions . . . . . . . . . . . . . . . . . . . . . . . . . . . . . . . . . . . . . . . . . . . . . 39,650 43,789 403,645
Trading Income (Note 22) . . . . . . . . . . . . . . . . . . . . . . . . . . . . . . . . . . . . . . . . . . . 5,106 3,959 51,986
Other Ordinary Income (Note 23) . . . . . . . . . . . . . . . . . . . . . . . . . . . . . . . . . . . . 5,712 6,239 58,151
Other Income (Note 24) . . . . . . . . . . . . . . . . . . . . . . . . . . . . . . . . . . . . . . . . . . . . 31,072 33,621 316,322
Total Income . . . . . . . . . . . . . . . . . . . . . . . . . . . . . . . . . . . . . . . . . . . . . . . . . . . ¥262,859 ¥274,252 $2,675,958
Expenses
Interest Expenses:
Interest on Deposits . . . . . . . . . . . . . . . . . . . . . . . . . . . . . . . . . . . . . . . . . . . . . ¥ 24,167 ¥ 30,963 $ 246,029
Interest on Borrowings and Rediscounts . . . . . . . . . . . . . . . . . . . . . . . . . . . . . 3,939 4,287 40,103
Other Interest Expenses . . . . . . . . . . . . . . . . . . . . . . . . . . . . . . . . . . . . . . . . . . 5,789 10,223 58,943
Fees and Commissions payments . . . . . . . . . . . . . . . . . . . . . . . . . . . . . . . . . . . . 14,298 14,226 145,561
Trading Expenses . . . . . . . . . . . . . . . . . . . . . . . . . . . . . . . . . . . . . . . . . . . . . . . . . — 66 —
Other Ordinary Expenses (Note 25) . . . . . . . . . . . . . . . . . . . . . . . . . . . . . . . . . . . 30,380 4,412 309,281
General and Administrative Expenses . . . . . . . . . . . . . . . . . . . . . . . . . . . . . . . . . 87,046 86,247 886,151
Other Expenses (Note 26) . . . . . . . . . . . . . . . . . . . . . . . . . . . . . . . . . . . . . . . . . . . 82,495 42,364 839,821
Total Expenses . . . . . . . . . . . . . . . . . . . . . . . . . . . . . . . . . . . . . . . . . . . . . . . . . ¥248,118 ¥192,792 $2,525,889
Income before Income Taxes and Minority Interests . . . . . . . . . . . . . . . . . . . . . 14,741 81,460 150,069
Income Taxes-Current . . . . . . . . . . . . . . . . . . . . . . . . . . . . . . . . . . . . . . . . . . . . . . 13,681 31,105 139,279
Income Taxes-Deferred . . . . . . . . . . . . . . . . . . . . . . . . . . . . . . . . . . . . . . . . . . . . (11,729) 3,728 (119,410)
Minority Interests in Income . . . . . . . . . . . . . . . . . . . . . . . . . . . . . . . . . . . . . . . . . 396 645 4,041
Net Income . . . . . . . . . . . . . . . . . . . . . . . . . . . . . . . . . . . . . . . . . . . . . . . . . . . . ¥ 12,392 ¥ 45,980 $ 126,159
Consolidated Statements of IncomeThe Chiba Bank, Ltd. and Consolidated SubsidiariesFor the years ended March 31, 2009 and 2008
See notes to consolidated financial statements.
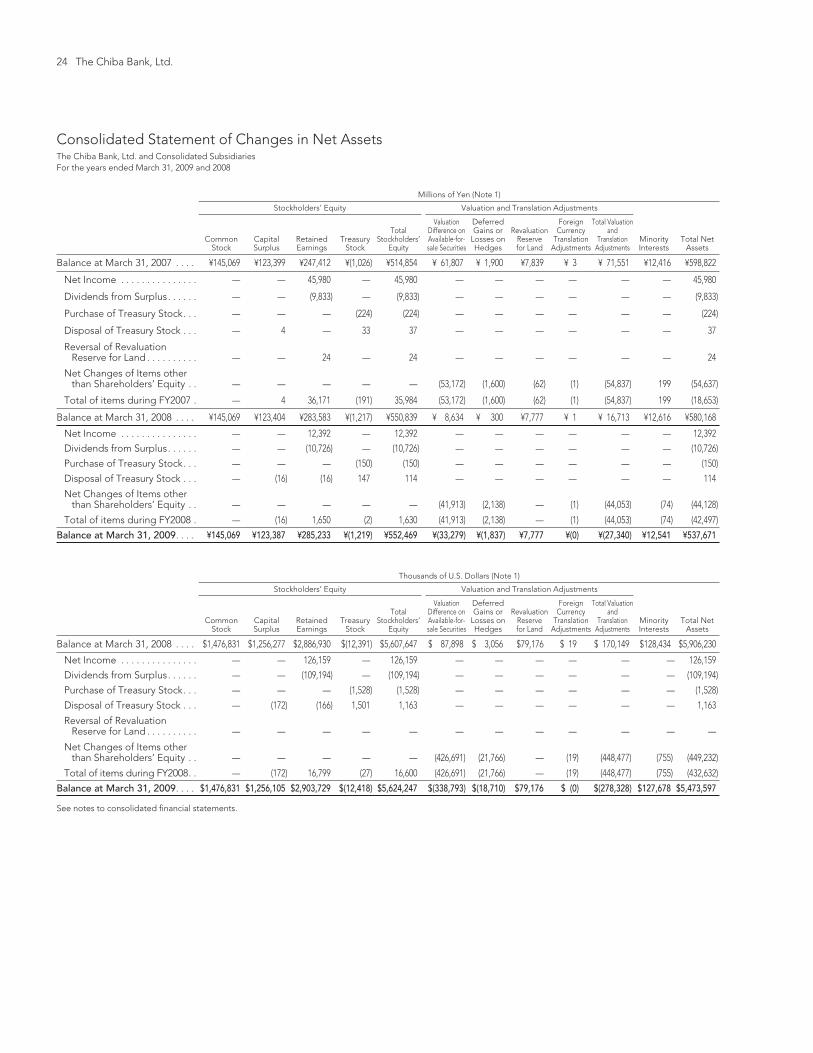
24 The Chiba Bank, Ltd.
Consolidated Statement of Changes in Net AssetsThe Chiba Bank, Ltd. and Consolidated SubsidiariesFor the years ended March 31, 2009 and 2008
See notes to consolidated financial statements.
Millions of Yen (Note 1)
Stockholders’ Equity Valuation and Translation Adjustments
MinorityInterests
Total Net Assets
Common Stock
CapitalSurplus
Retained Earnings
TreasuryStock
Total Stockholders’
Equity
Valuation Difference on Available-for-sale Securities
Deferred Gains or
Losses on Hedges
Revaluation Reserve for Land
ForeignCurrency
Translation Adjustments
Total Valuation and
Translation Adjustments
Balance at March 31, 2007 . . . . ¥145,069 ¥123,399 ¥247,412 ¥(1,026) ¥514,854 ¥ 61,807 ¥ 1,900 ¥7,839 ¥ 3 ¥ 71,551 ¥12,416 ¥598,822
Net Income . . . . . . . . . . . . . . . — — 45,980 — 45,980 — — — — — — 45,980
Dividends from Surplus . . . . . . — — (9,833) — (9,833) — — — — — — (9,833)
Purchase of Treasury Stock . . . — — — (224) (224) — — — — — — (224)
Disposal of Treasury Stock . . . — 4 — 33 37 — — — — — — 37
Reversal of Revaluation Reserve for Land . . . . . . . . . . — — 24 — 24 — — — — — — 24
Net Changes of Items other than Shareholders’ Equity . . — — — — — (53,172) (1,600) (62) (1) (54,837) 199 (54,637)
Total of items during FY2007 . — 4 36,171 (191) 35,984 (53,172) (1,600) (62) (1) (54,837) 199 (18,653)
Balance at March 31, 2008 . . . . ¥145,069 ¥123,404 ¥283,583 ¥(1,217) ¥550,839 ¥ 8,634 ¥ 300 ¥7,777 ¥ 1 ¥ 16,713 ¥12,616 ¥580,168
Net Income . . . . . . . . . . . . . . . — — 12,392 — 12,392 — — — — — — 12,392
Dividends from Surplus . . . . . . — — (10,726) — (10,726) — — — — — — (10,726)
Purchase of Treasury Stock . . . — — — (150) (150) — — — — — — (150)
Disposal of Treasury Stock . . . — (16) (16) 147 114 — — — — — — 114
Net Changes of Items other than Shareholders’ Equity . . — — — — — (41,913) (2,138) — (1) (44,053) (74) (44,128)
Total of items during FY2008 . — (16) 1,650 (2) 1,630 (41,913) (2,138) — (1) (44,053) (74) (42,497)
Balance at March 31, 2009 . . . . ¥145,069 ¥123,387 ¥285,233 ¥(1,219) ¥552,469 ¥(33,279) ¥(1,837) ¥7,777 ¥(0) ¥(27,340) ¥12,541 ¥537,671
Thousands of U.S. Dollars (Note 1)
Stockholders’ Equity Valuation and Translation Adjustments
MinorityInterests
Total Net Assets
Common Stock
CapitalSurplus
Retained Earnings
TreasuryStock
Total Stockholders’
Equity
Valuation Difference on Available-for-sale Securities
Deferred Gains or
Losses on Hedges
Revaluation Reserve for Land
ForeignCurrency
Translation Adjustments
Total Valuation and
Translation Adjustments
Balance at March 31, 2008 . . . . $1,476,831 $1,256,277 $2,886,930 $(12,391) $5,607,647 $ 87,898 $ 3,056 $79,176 $ 19 $ 170,149 $128,434 $5,906,230
Net Income . . . . . . . . . . . . . . . — — 126,159 — 126,159 — — — — — — 126,159
Dividends from Surplus . . . . . . — — (109,194) — (109,194) — — — — — — (109,194)
Purchase of Treasury Stock . . . — — — (1,528) (1,528) — — — — — — (1,528)
Disposal of Treasury Stock . . . — (172) (166) 1,501 1,163 — — — — — — 1,163
Reversal of Revaluation Reserve for Land . . . . . . . . . . — — — — — — — — — — — —
Net Changes of Items other than Shareholders’ Equity . . — — — — — (426,691) (21,766) — (19) (448,477) (755) (449,232)
Total of items during FY2008 . . — (172) 16,799 (27) 16,600 (426,691) (21,766) — (19) (448,477) (755) (432,632)
Balance at March 31, 2009 . . . . $1,476,831 $1,256,105 $2,903,729 $(12,418) $5,624,247 $(338,793) $(18,710) $79,176 $ (0) $(278,328) $127,678 $5,473,597

25 Annual Report 2009
Millions of Yen (Note 1)Thousands of
U.S. Dollars (Note 1)
2009 2008 2009Cash Flows from Operating Activities:
Income before Income Taxes and Minority Interests . . . . . . . . . . . . . . . . . . . . . . . . . ¥ 14,741 ¥ 81,460 $ 150,069 Depreciation and Amortization . . . . . . . . . . . . . . . . . . . . . . . . . . . . . . . . . . . . . . . . . . 6,779 21,003 69,016 Impairment Loss . . . . . . . . . . . . . . . . . . . . . . . . . . . . . . . . . . . . . . . . . . . . . . . . . . . . . . — 13 —Equity in (Earnings) Losses of Affi liates . . . . . . . . . . . . . . . . . . . . . . . . . . . . . . . . . . . . (236) (212) (2,411)Increase (Decrease) in Allowance for Loan Losses . . . . . . . . . . . . . . . . . . . . . . . . . . . 7,215 (9,575) 73,452 Increase (Decrease) in Provision for Directors’ Bonuses . . . . . . . . . . . . . . . . . . . . . . (23) 3 (243)Increase (Decrease) in Provision for Retirement Benefi ts . . . . . . . . . . . . . . . . . . . . . 547 (1,036) 5,571 Increase (Decrease) in Provision for Point Loyalty Programs . . . . . . . . . . . . . . . . . . . 16 62 164 Increase (Decrease) in Provision for Reimbursement of Deposits . . . . . . . . . . . . . . . (33) 996 (339)Increase (Decrease) in Provision for Directors’ Retirement Benefi ts . . . . . . . . . . . . . (274) 1,649 (2,793)Interest Income . . . . . . . . . . . . . . . . . . . . . . . . . . . . . . . . . . . . . . . . . . . . . . . . . . . . . . . (181,312) (186,634) (1,845,797)Interest Expenses . . . . . . . . . . . . . . . . . . . . . . . . . . . . . . . . . . . . . . . . . . . . . . . . . . . . . 33,896 45,475 345,075 Loss (Gain) Related to Securities . . . . . . . . . . . . . . . . . . . . . . . . . . . . . . . . . . . . . . . . . 43,012 2,948 437,872 Loss (Gain) on Money Held in Trust . . . . . . . . . . . . . . . . . . . . . . . . . . . . . . . . . . . . . . . 122 (466) 1,242 Loss (Gain) on Foreign Exchange Transactions . . . . . . . . . . . . . . . . . . . . . . . . . . . . . 148 148 1,508 Loss (Gain) on Disposal of Fixed Assets . . . . . . . . . . . . . . . . . . . . . . . . . . . . . . . . . . . 273 830 2,786 Net Decrease (Increase) in Trading Assets . . . . . . . . . . . . . . . . . . . . . . . . . . . . . . . . . (107,374) (1,940) (1,093,094)Net Increase (Decrease) in Trading Liabilities . . . . . . . . . . . . . . . . . . . . . . . . . . . . . . . 2,102 13 21,403 Net Decrease (Increase) in Loans and Bills Discounted . . . . . . . . . . . . . . . . . . . . . . . (330,937) (247,089) (3,369,002)Net Increase (Decrease) in Deposits (excluding Negotiable Certifi cates of Deposit) . . 125,229 27,453 1,274,855 Net Increase (Decrease) in Negotiable Certifi cates of Deposit . . . . . . . . . . . . . . . . 25,664 (2,580) 261,274 Net Increase (Decrease) in Borrowed Money (excluding Subordinated Borrowings) . . 165,543 (52,604) 1,685,261 Net Decrease (increase) in Due from Banks (excluding Due from BOJ). . . . . . . . . . 236,167 (237,642) 2,404,229 Net Decrease (Increase) in Call Loans and Bills Bought and Others . . . . . . . . . . . . (17,393) 47,035 (177,074)Net Decrease (Increase) in Receivables under Securities Borrowing Transactions . . 11,731 (2,678) 119,426 Net Increase (Decrease) in Call Money and Bills Sold . . . . . . . . . . . . . . . . . . . . . . . . (31,273) 209,956 (318,366)Net Increase (Decrease) in Payables under Securities Lending Transactions . . . . . (13,813) (108,781) (140,627)Net Decrease (Increase) in Foreign Exchanges - Assets . . . . . . . . . . . . . . . . . . . . . . 943 (183) 9,605 Net Increase (Decrease) in Foreign Exchanges - Liabilities . . . . . . . . . . . . . . . . . . . . (79) (33) (807)Interest Received . . . . . . . . . . . . . . . . . . . . . . . . . . . . . . . . . . . . . . . . . . . . . . . . . . . . . . 182,062 188,497 1,853,435 Interest Paid . . . . . . . . . . . . . . . . . . . . . . . . . . . . . . . . . . . . . . . . . . . . . . . . . . . . . . . . . . (33,501) (42,989) (341,048)Other, net . . . . . . . . . . . . . . . . . . . . . . . . . . . . . . . . . . . . . . . . . . . . . . . . . . . . . . . . . . . . 9,176 (9,273) 93,415
Sub total . . . . . . . . . . . . . . . . . . . . . . . . . . . . . . . . . . . . . . . . . . . . . . . . . . . . . . . . . . . ¥ 149,118 ¥(276,175) $ 1,518,056 Income Taxes Paid . . . . . . . . . . . . . . . . . . . . . . . . . . . . . . . . . . . . . . . . . . . . . . . . . . . . . (26,825) (38,900) (273,088)
Net Cash Provided by (Used in) Operating Activities . . . . . . . . . . . . . . . . . . . . . ¥ 122,293 ¥(315,075) $ 1,244,968 Cash Flows from Investment Activities:
Purchase of Securities . . . . . . . . . . . . . . . . . . . . . . . . . . . . . . . . . . . . . . . . . . . . . . . . . . ¥(576,498) ¥(698,896) $(5,868,860)Proceeds from Sales of Securities . . . . . . . . . . . . . . . . . . . . . . . . . . . . . . . . . . . . . . . . 170,880 573,001 1,739,591 Proceeds from Redemption of Securities . . . . . . . . . . . . . . . . . . . . . . . . . . . . . . . . . . 444,167 404,691 4,521,712 Increase in Money Held in Trust . . . . . . . . . . . . . . . . . . . . . . . . . . . . . . . . . . . . . . . . . . (2,795) (5,839) (28,456)Decrease in Money Held in Trust . . . . . . . . . . . . . . . . . . . . . . . . . . . . . . . . . . . . . . . . . 2,377 5,873 24,208 Purchase of Tangible Fixed Assets . . . . . . . . . . . . . . . . . . . . . . . . . . . . . . . . . . . . . . . (7,616) (19,247) (77,540)Purchase of Intangible Fixed Assets . . . . . . . . . . . . . . . . . . . . . . . . . . . . . . . . . . . . . . (3,370) (3,263) (34,317)Proceeds from Sales of Tangible Fixed Assets . . . . . . . . . . . . . . . . . . . . . . . . . . . . . . 263 1,151 2,686 Proceeds from Sales of Intangible Fixed Assets . . . . . . . . . . . . . . . . . . . . . . . . . . . . . 1 0 10
Net Cash Provided by (Used in) Investment Activities. . . . . . . . . . . . . . . . . . . . . ¥ 27,409 ¥ 257,471 $ 279,035 Cash Flows from Financing Activities:
Increase in Subordinated Borrowings . . . . . . . . . . . . . . . . . . . . . . . . . . . . . . . . . . . . . ¥ 18,000 ¥ — $ 183,243 Decrease in Subordinated Borrowings . . . . . . . . . . . . . . . . . . . . . . . . . . . . . . . . . . . . (16,000) (5,000) (162,883)Issuance of Subordinated Bonds . . . . . . . . . . . . . . . . . . . . . . . . . . . . . . . . . . . . . . . . . 10,000 20,000 101,802 Redemption of Subordinated Bonds . . . . . . . . . . . . . . . . . . . . . . . . . . . . . . . . . . . . . . (11,000) — (111,982)Cash Dividends Paid . . . . . . . . . . . . . . . . . . . . . . . . . . . . . . . . . . . . . . . . . . . . . . . . . . . (10,726) (9,833) (109,194)Cash Dividends Paid to Minority Shareholders . . . . . . . . . . . . . . . . . . . . . . . . . . . . . (242) (160) (2,471)Purchase of Treasury Stock . . . . . . . . . . . . . . . . . . . . . . . . . . . . . . . . . . . . . . . . . . . . . . (150) (224) (1,528)Proceeds from Sales of Treasury Stock . . . . . . . . . . . . . . . . . . . . . . . . . . . . . . . . . . . . 114 37 1,163
Net Cash Provided by (Used in) Financing Activities . . . . . . . . . . . . . . . . . . . . . . ¥ (10,004) ¥ 4,819 $ (101,850)Effect of Exchange Rate Change on Cash and Cash Equivalents . . . . . . . . . . . . . . . . ¥ (148) ¥ (148) (1,508)Net Increase (Decrease) in Cash and Cash Equivalents . . . . . . . . . . . . . . . . . . . . . . . . ¥ 139,550 ¥ (52,932) $ 1,420,646 Cash and Cash Equivalents at Beginning of Period . . . . . . . . . . . . . . . . . . . . . . . . . . . ¥ 134,533 ¥ 187,466 $ 1,369,580 Cash and Cash Equivalents at End of Period (Note 27) . . . . . . . . . . . . . . . . . . . . . . . . ¥ 274,083 ¥ 134,533 $ 2,790,226
Consolidated Statements of Cash FlowsThe Chiba Bank, Ltd. and Consolidated SubsidiariesFor the years ended March 31, 2009 and 2008
See notes to consolidated financial statements.

26 The Chiba Bank, Ltd.
Notes to Consolidated Financial StatementsThe Chiba Bank, Ltd. and Consolidated SubsidiariesFor the Years ended March 31, 2009 and 2008
1. Basis of Presentation
The Chiba Bank, Ltd. (the “Bank”) and its subsidiaries maintain their books of accounts in accordance with the provisions set forth in the Japanese Financial Instruments and Exchange Act and its related accounting regulations and in con-formity with accounting principles and practices generally accepted in Japan, which are different in certain respects as to the application and disclosure requirements of International Financial Reporting Standards. The classifi cation of accounts is in conformity with the Ordinance for Enforcement of Banking Law of Japan. The accompanying consolidated fi nancial statements have been com-piled from the consolidated fi nancial statements issued domestically in order to present them in a form which is more familiar to readers outside Japan. Certain reclassifi cations and rearrangements have been made to the fi nancial statements for the previous year to conform to the classifi cation used in the fi nancial statements for the current year. In addition, the accompanying notes include information that is not required under accounting principles generally accepted in Japan, but is presented herein for the convenience of readers. Japanese yen amounts are presented in millions of yen by rounding down fi gures below one million. As a result, the totals in Japanese yen in the accom-panying consolidated fi nancial statements do not necessarily agree with the sums of individual amounts. U.S. dollar amounts are shown solely for the convenience of the readers of this Annual Report and are translated at the rate of ¥98.23 to $1.00, the exchange rate prevailing at March 31, 2009.
2. Principles of Consolidation
The consolidated fi nancial statements include the accounts of the Bank and its subsidiaries, including Chibagin Guarantee Co., Ltd., Chibagin Leasing Co., Ltd., Chuo Securities Co., Ltd. and other subsidiaries. The number of consoli-dated subsidiaries as of March 31, 2009 and 2008 were 10 and 11, respectively. Chibagin Business Service Co., Ltd. was liquidated. Chiba Capital Funding (Cayman) Ltd. was dissolved on March 31, 2009 and is now under the process of liquidation. Information of two special purpose entities subject to disclosure was not represented in this note due to their immateriality. All signifi cant inter-company accounts and transactions have been elimi-nated. The consolidated fi nancial statements do not include the accounts of the Chibagin Computer Service Co., Ltd. and three other subsidiaries, since the combined total assets, total revenue, net income and retained earnings of these subsidiaries are not signifi cant and would not have a material impact on the consolidated fi nancial statements of the Bank. Nevertheless, the invest-ments in these unconsolidated subsidiaries are carried using the equity meth-od and are included in securities in the balance sheets. Also, the consolidated fi nancial statements do not include the accounts of fi ve limited partnerships, including two newly established and one liquidated in the fi scal year 2008. The investments in these unconsolidated subsidiaries are not accounted for by the equity method since net income and retained earnings of these subsidiaries are not signifi cant and would not have a material impact on the consolidated fi nancial statements of the Bank. The difference between the cost and the underlying equity in the net assets measured at their market value at dates of acquisition of consolidated subsidiar-ies is amortized on a straight-line method over a period of fi ve years, if signifi -cant in amount, or is charged or credited to income in the year of acquisition. Fiscal year-ends of all consolidated subsidiaries are at the end of March except for one consolidated subsidiary whose fi scal year-end is at the end of December. The fi nancial statements of the consolidated subsidiary, for which fi scal year-end is December 31, are included in consolidation on the basis of its fi scal year after making appropriate adjustments for the signifi cant transactions during the period from its year-end to the date of the Bank’s fi scal year-end.
3. Signifi cant Accounting Policies
(1) Trading AccountThe following criteria are applied in accounting for the Bank’s trading assets and liabilities, and trading income and expenses: Transactions that aim to gain a profi t by arbitraging short term fl uctuations in interest rates, currency values and market prices, other benchmarks in the traded securities’ market prices and by arbitraging differentials between mar-kets (hereafter “trading purposes”) are accounted for under “Trading Assets” or “Trading Liabilities” on the balance sheets. Profi t or loss from such transac-tions is recorded under “Trading income” or “Trading expenses” on the state-ments of income. Trading securities and monetary claims, etc. held for trading purposes are stated at market value at the end of the fi scal year. Trading-related fi nancial derivatives such as swaps, futures or options are valued on the assumption that they were settled at the end of the fi scal year. In the case of trading-related fi nancial derivatives, “Trading income/expenses” includes the interest received/paid during the fi scal year and the difference between the amount of profi t/loss based on the assumption that transactions were settled at the end of the current fi scal year and that at the end of the previous fi scal year.
(2) SecuritiesHeld-to-maturity bonds are stated at amortized cost determined by the mov-ing average method. Interests of unconsolidated subsidiaries not accounted for by the equity method are stated at cost determined by the moving average method. Other securities available for sale whose current value can be estimat-ed are stated at the market value at the fi scal year end for the fi scal year 2007 while their costs are calculated mainly by the moving average method. In order to lessen the effect of external price fl uctuations, the valuation measures of domestic stocks and investment trusts with market value included Other securities were changed to the average market value during the last month of the period since the fi scal year 2008. This change resulted in decrease by ¥2,410 million in Securities, increase by ¥968 million in Deferred Tax Assets, and decrease by ¥1,447 million in Valuation Difference on Available-for-sale Securities. And losses related to securities (write-offs) increased by ¥860 mil-lion while Income before Income Taxes and Minority Interests decreased by the same amounts respectively. Other non-marketable securities are stated at cost determined by the moving average method or amortized cost. Unrealized gains and losses on other securities available for sale are included in net assets, net of income taxes. Moreover, the same way as above (1) and market value method based upon the market value at the fi scal year end are applied for the valuation of securities that are held as trust assets in individually managed money trusts with the principal objective of securities portfolio management.
(3) DerivativesDerivatives for purposes other than trading are also stated at the market value.
(4) Tangible Fixed Assets Depreciation for Tangible Fixed Assets of the Bank is computed using the declining-balance method. Principal useful lives are as follows: Buildings ........................ 6 years to 50 years Others ............................ 2 years to 20 yearsTangible Fixed Assets of the consolidated subsidiaries are depreciated princi-pally by the declining-balance method over the estimated useful lives.

27 Annual Report 2009
(5) Intangible Fixed AssetsDepreciation for Intangible Fixed Assets is computed using the straight-line method. Especially, depreciation for capitalized software for internal-use is computed using the straight-line method based on useful life determined by the Bank and its consolidated subsidiaries (5 years). (6) Bond Issuance CostsBond Issuance Costs are charged to income as occurred.
(7) Allowance for Loan LossesAllowance made by the Bank was provided in accordance with the internally established standards for write-offs and provisions. For claims on borrowers that have entered into bankruptcy, special liquida-tion proceedings or similar legal proceedings (“Bankrupt Borrowers”), or bor-rowers that are not legally or formally insolvent but are regarded as substan-tially in the same situation (“Effectively Bankrupt Borrowers”), an allowance is provided based on the amount of claims, after the write-off stated below, net of the expected amount of recoveries from collateral and guarantees. For claims on borrowers that are not currently bankrupt but likely to be-come bankrupt in the future (“Potentially Bankrupt Borrowers”), an allowance is provided in the amount deemed necessary based on an overall solvency assessment of the claims, net of the expected amount of recoveries from col-lateral and guarantees. For claims on Potentially Bankrupt Borrowers and on borrowers whose loans are classifi ed as “Loans past due 3 months or more” or “Restructured Loans” over a certain amount, if future cash fl ows from the collection of principal and interest are reasonably estimated, the allowances for loan losses are calculated by “Discounted Cash Flow Method,” by which the allowances for loan losses are calculated as the difference between the booked amounts of the loans and the cash fl ows discounted by the original contracted interest rates. For other claims, an allowance is provided based on the historical loan-loss ratio. Also, regarding the allowance for loans to specifi c countries, the expect-ed amount of the losses on such loans arising from political and economic conditions in those countries has been provided in the reserve for specifi c overseas loans. The operating divisions assess all claims in accordance with the Bank’s poli-cy and guidelines for the self-assessment of asset quality, and the internal audit and inspection division, which is independent from the operating divisions, au-dits these assessments. The allowance for loan losses is provided based on the results of these assessments. For collateralized or guaranteed claims on Bankrupt Borrowers and Effec-tively Bankrupt Borrowers, the amount exceeding the estimated value of col-lateral and guarantees is deemed to be uncollectible and written off against the total outstanding amount of the claims. The amount of write-off as of March 31, 2009 and 2008 were ¥72,801 million and ¥66,737 million, respectively. Allowance made by consolidated subsidiaries for general claims is pro-vided in the amount deemed necessary based on the historical loan-loss ra-tio, and for specifi c claims in the amount deemed uncollectible based on the respective assessments.
(8) Provision for Directors’ Bonuses The Bank has a provision for bonuses for directors and corporate auditors which is provided for the payments of bonuses to directors and corporate au-ditors based on the estimated amounts of the payments corresponding to the fi scal year.
(9) Provision for Retirement Benefi tsThe Bank has a provision for retirement benefi ts which is provided for the pay-ments of employees’ retirement benefi ts based on the estimated amounts of the actuarial retirement benefi t obligation and the pension assets. Net actuarial gain (loss) is amortized using the straight-line method over 10 years commencing from the next fi scal year of incurrence.
(10) Provision for Directors’ Retirement Benefi tsProvision for directors’ retirement benefi ts is provided for payment of retire-ment benefi ts to directors and corporate auditors, in the amount deemed ac-crued until the fi scal year-end.
(11) Provision for Reimbursement of DepositsProvision for reimbursement of deposits which were derecognized as liabil-ities under certain conditions and recognized as profi t is provided for the possible losses on the future claims of withdrawal based on the historical reimburse experience.
(12) Provision for Point Loyalty ProgramsThe Bank has a provision for point loyalty programs which is provided for ac-cumulation of points (the “Leaf Points”) granted to customers in the Bank’s point loyalty program, “Chibagin Leaf Point Present”, based on the estimated amounts equivalent to expected future usage of the Leaf Points.
(13) Reserve under the Special LawsReserve under the Special Laws is a Reserve for Financial Products Transaction Liabilities of ¥35 million provided by Chuo Securities Co. Ltd. This reserve is provided for losses from securities transactions pursuant to Article 46-5-1 of the Financial Instruments and Exchange Act and Article 175 of the Cabinet Offi ce Ordinance on Financial Instrument Business Operators, etc.
(14) Translation of Foreign CurrenciesThe Bank’s assets and liabilities denominated in foreign currencies and over-seas branches’ accounts are translated into Japanese yen primarily at the ex-change rate at the balance sheet date, except for stocks of subsidiaries and affi liates which are translated at prevailing rates at the time of acquisition. Con-solidated subsidiaries’ assets and liabilities denominated in foreign currencies are translated into the currency of the subsidiary at the exchange rate prevail-ing at the fi scal year-end of each company.
(15) Lease Transactions(As lessees)The Bank and domestic consolidated subsidiaries account for as operating leases fi nance leases other than those that are deemed to transfer the own-ership of leased properties to the lessees, which commenced in fi scal years beginning prior to April 1, 2008 (See Note 28).(As lessors)Finance leases other than those that are deemed to transfer the ownership of leased property to the lessees are accounted for as installment sales.
(16) Hedge Accounting i) Hedge of Interest Rate Risk As for the hedge accounting method applied to hedging transactions for in-
terest rate risk arising from fi nancial assets and liabilities, the Bank applies the deferral hedge accounting stipulated in the “Treatment for Accounting and Auditing of Application of Accounting Standard for Financial Instruments in Banking Industry” (JICPA Industry Audit Committee Report No. 24).
The Bank assesses the effectiveness of such hedges by monitoring off-

28 The Chiba Bank, Ltd.
setting fl uctuation of fair value by changes in interest rates, of the hedged items (such as deposits and loans) and hedging instruments (such as inter-est rate swaps) classifi ed by their maturity.
ii) Hedge of Foreign Currency Fluctuation Risk As for the hedge accounting method applied to hedging transactions for
foreign currency fl uctuation risk arising from foreign-currency-denominat-ed fi nancial assets and liabilities, the Bank applies the deferral hedge ac-counting stipulated in the “Treatment for Accounting and Auditing of Con-cerning Accounting for Foreign Currency Transactions in Banking Industry” (JICPA Industry Audit Committee Report No. 25).
The Bank designates certain currency swaps and foreign exchange swap transactions as hedges against fl uctuation in foreign currency ex-change rates arising from foreign-currency monetary claims and debts, and assesses the effectiveness of such hedges by verifying that the Bank holds foreign currency positions of the hedged items corresponding to the posi-tions of the hedging instruments.
In addition to the above accounting, the Bank applies to a part of as-sets and liabilities the deferral hedge accounting or exceptional treatments permitted for interest rate swaps.
(17) Consumption TaxesConsumption tax and municipal consumption tax of the Bank and its domestic consolidated subsidiaries are accounted for using the tax-excluded method.
(18) Appropriation of Retained EarningsDividends from Surplus are recorded in the fi scal year in which the proposed appropriation of retained earnings is approved by the board of directors and by the general meeting of shareholders. There is a limit for dividend from surplus by Article 18 of the Banking Law. An amount equal to 20% of the aggregated amount of dividends from surplus shall be set aside as a legal reserve or legal capital surplus, regardless of Article 445-4 of the Companies Act of Japan.
(19) Cash FlowsIn preparing the consolidated statements of cash fl ows, cash and due from the Bank of Japan are considered to be cash and cash equivalents.
4. New Accounting Pronouncements
(1) Practical Solution on Unifi cation of Accounting Policies Applied to Foreign Subsidiaries for Consolidated Financial Statements
As “Practical Solution on Unifi cation of Accounting Policies Applied to For-eign Subsidiaries for Consolidated Financial Statements” (Practical Issues Task Force No.18, May 17, 2006) became applicable to fi scal years beginning on or after April 1, 2008, the Bank adopted the report from the beginning of this fi scal year. This adoption did not have any effect on the consolidated fi nancial statements.
(2) Accounting Standard for Lease TransactionsFinance leases other than those that were deemed to transfer the ownership of leased properties to the lessees have previously been accounted for as op-erating leases. However, the “Accounting Standard for Lease Transactions” (ASBJ Statement No.13, March 30, 2007) and the “Guidance on the Account-ing Standard for Lease Transactions” (ASBJ Guidance No.16, March 30, 2007) became applicable to fi scal years beginning on or after April 1, 2008, and the Bank adopted this standard in this fi scal year. The adoption of the new stan-dard did not have a signifi cant effect on the consolidated fi nancial statements. Similar transactions on the lessor side are accounted for as lease investment assets in the “Other Assets”. These transactions which commenced in fi scal years began prior to April 1, 2008 are considered as if they had been entered
into lease agreements at the net book value of the previous fi scal year end at the beginning of this fi scal year. Lease investment assets in the “Other Assets” increased by ¥40,247 million while “Tangible Fixed Assets” decreased by ¥38,538 million and “Intangible Fixed Assets” decreased by ¥1,708 million.
(3) Related Party DisclosuresThe Bank adopted the “Accounting Standard for Related Party Disclosures” (ASBJ Statement No.11, October 17, 2006) and the “Guidance on Accounting Standard for Related Party Disclosures” (ASBJ Guidance No.13, October 17, 2006). As a result, transactions between consolidated subsidiaries and related parties have been added to the scope of disclosure in the current year.
5. Securities Borrowing Transactions
As for securities borrowed under securities borrowing transactions which the bank has the right to sell or pledge, ¥4,031 million was held in hand on March 31, 2009. The respective amount at March 31, 2008 was ¥11,647 million.
6. Trading Assets
Trading assets as of March 31, 2009 and 2008 consisted of the following:
Millions of Yen (Note 1)Thousands of
U.S. Dollars (Note 1)
2009 2008 2009Trading Account Securities . . . . . . . . . . . . . . . ¥ 27,396 ¥ 17,224 $ 278,902 Derivatives of Trading Securities . . . . . . . . . . 0 0 9 Securities Related to Trading Transactions . . 507 — 5,166 Trading-Related Financial Derivatives . . . . . . 13,440 7,868 136,828 Other Trading Assets . . . . . . . . . . . . . . . . . . . . 351,058 259,935 3,573,842
Total . . . . . . . . . . . . . . . . . . . . . . . . . . . . . . . ¥392,404 ¥285,029 $3,994,747
7. Securities
Securities as of March 31, 2009 and 2008 consisted of the following:
Millions of Yen (Note 1)Thousands of
U.S. Dollars (Note 1)
2009 2008 2009Japanese Government Bonds . . . . . . . . . . . . ¥ 622,807 ¥ 457,726 $ 6,340,295 Japanese Local Government Bonds . . . . . . 237,368 221,590 2,416,454 Japanese Corporate Bonds . . . . . . . . . . . . . . 463,046 608,915 4,713,903 Japanese Stocks . . . . . . . . . . . . . . . . . . . . . . . . 145,508 192,854 1,481,300 Other Securities . . . . . . . . . . . . . . . . . . . . . . . . 424,345 563,924 4,319,915
Total . . . . . . . . . . . . . . . . . . . . . . . . . . . . . . . ¥1,893,075 ¥2,045,011 $19,271,868
Securities Included investments in non-consolidated subsidiaries and affi liates of ¥3,574 million and ¥2,919 million at March 31, 2009 and 2008, respectively. Guarantee obligations for bonds in private placement (defi ned in Article 2 (3) of Financial Instruments and Exchange Act) included in Japanese Corporate Bonds were ¥74,905 million and ¥81,926 million as of March 31, 2009 and 2008, respectively.

29 Annual Report 2009
8. Loans and Bills Discounted
(1) Loans and bills discounted as of March 31, 2009 and 2008 consisted of the following:
Millions of Yen (Note 1)Thousands of
U.S. Dollars (Note 1)
2009 2008 2009Bills Discounted . . . . . . . . . . . . . . . . . . . . . . . . ¥ 26,726 ¥ 36,611 $ 272,085 Loans on Bills. . . . . . . . . . . . . . . . . . . . . . . . . . . 210,624 239,822 2,144,192 Loans on Deeds . . . . . . . . . . . . . . . . . . . . . . . . 5,993,979 5,678,272 61,019,847 Overdrafts . . . . . . . . . . . . . . . . . . . . . . . . . . . . . 724,294 669,980 7,373,452
Total . . . . . . . . . . . . . . . . . . . . . . . . . . . . . . . ¥6,955,624 ¥6,624,687 $70,809,576
Bills discounted are accounted for as fi nancial transactions in accordance with JICPA Industry Audit Committee Report No. 24. The Bank has rights to sell or pledge bank acceptance bought, commercial bills discounted, documentary bills and foreign exchanges bought without restric-tions.Their total face value as of March 31, 2009 and 2008 were ¥27,403 million and ¥37,655 million, respectively. Contracts of overdraft facilities and loan commitment limits are the contracts that the Bank lends to customers up to the prescribed limits in response to customers’ application of loan as long as there is no violation of any condition in the contracts. The unused amount within the limits was ¥1,696,897 million relating to these contracts, including ¥1,623,560 million of which the term of contracts is less than one year or revocable at any time as of March 31, 2009. The respective amounts were ¥1,797,171 million and ¥1,736,774 million as of March 31, 2008. Since many of these commitments expire without being utilized, the unused amount does not necessarily represent a future cash requirement. Most of these contracts have conditions that the Bank can refuse customers’ application of loan or decrease the contract limits with proper reasons (e.g., changes in fi nancial situation, deterioration in customers’ creditworthiness). At the inception of contracts, the Bank obtains real estate, securities, etc. as collateral if considered to be necessary. Subsequently, the Bank performs periodic review of the customers’ business results based on initial rules, and takes necessary measures to reconsider conditions in contracts and/or require additional collateral and guarantees. Additionally, the unused amount within the limits of overdraft facilities on General Accounts as of March 31, 2009 and 2008 were ¥973,715 million and ¥932,621 million, respectively. General Accounts are the Ordinary Deposit Accounts that its depositors can overdraw up to the amounts calculated by multiplying incidental Time Deposits and so by certain weight.
(2) Risk monitored loans as of March 31, 2009 and 2008 consisted of the following:
Millions of Yen (Note 1)Thousands of
U.S. Dollars (Note 1)
2009 2008 2009Loans to Bankrupt Borrowers . . . . . . . . . . . . . ¥ 8,543 ¥ 3,325 $ 86,978 Delinquent Loans . . . . . . . . . . . . . . . . . . . . . . . 88,840 92,430 904,416 Loans Past Due 3 Months or More. . . . . . . . . 4,154 3,170 42,294 Restructured Loans. . . . . . . . . . . . . . . . . . . . . . 50,983 88,735 519,024
Total . . . . . . . . . . . . . . . . . . . . . . . . . . . . . . . ¥152,522 ¥187,662 $1,552,712
Loans to bankrupt borrowers represent non-accrual loans to borrowers who are legally bankrupt as defi ned in Article 96 (1) (iii) and (iv) of the Corporation Tax Act Enforcement Ordinance (Article 97 of 1965 Cabinet Order). Delinquent loans represent non-accrual loans other than (i) loans to bankrupt borrowers and (ii) loans of which payments of interest are deferred in order to assist or facilitate the restructuring of borrowers in fi nancial diffi culties. Loans past due 3 months or more represent loans on which the payment of principal and/or interest has not been received for three months or more from the due date, and which are not included in Loans to bankrupt borrowers or Delinquent loans. Restructured loans are loans which have been restructured to support the rehabilitation of cer-tain borrowers who are encountering fi nancial diffi culties, with the intention of ensuring recovery of the loans by providing easier repayment terms for the borrowers (such as by reducing the rate of interest or by providing a grace period for the payment of principal/interest, etc.) and are not classifi ed in any of the above categories.
9. Foreign Exchange Assets
Foreign exchange assets as of March 31, 2009 and 2008 consisted of the following:
Millions of Yen (Note 1)Thousands of
U.S. Dollars (Note 1)
2009 2008 2009Due from Foreign Banks (our accounts) . . . . ¥1,675 ¥2,009 $17,055 Foreign Bills Bought . . . . . . . . . . . . . . . . . . . . . 694 1,063 7,070 Foreign Bills Receivable . . . . . . . . . . . . . . . . . . 380 621 3,876
Total . . . . . . . . . . . . . . . . . . . . . . . . . . . . . . . ¥2,750 ¥3,693 $28,001
10. Other Assets
Other assets as of March 31, 2009 and 2008 consisted of the following:
Millions of Yen (Note 1)Thousands of
U.S. Dollars (Note 1)
2009 2008 2009Domestic Exchange Settlement Account, debit. . . . . . . . . . . . . . . . . . . . . . . . . ¥ 932 ¥ 1,053 $ 9,494
Accrued Income . . . . . . . . . . . . . . . . . . . . . . . . 15,253 15,885 155,284 Prepaid Expenses . . . . . . . . . . . . . . . . . . . . . . . 560 570 5,707 Derivatives . . . . . . . . . . . . . . . . . . . . . . . . . . . . . 19,083 27,192 194,276 Lease Investment Assets . . . . . . . . . . . . . . . . . 40,247 — 409,723 Other . . . . . . . . . . . . . . . . . . . . . . . . . . . . . . . . . 33,882 26,117 344,932
Total . . . . . . . . . . . . . . . . . . . . . . . . . . . . . . . ¥109,960 ¥70,819 $1,119,416
11. Tangible Fixed Assets
Depreciation was computed using the declining-balance method. Tangible Fixed Assets as of March 31, 2009 as of March 31, 2008 were shown at net of the following accumulated depreciation:
Millions of Yen (Note 1)Thousands of
U.S. Dollars (Note 1)
2009 2008 2009¥91,938 ¥89,936 $935,947
Deferred gain on real estate deductible for tax purposes amounted to ¥10,560 million and ¥10,581 million on March 31, 2009 and 2008, respectively.
12. Assets Pledged
Assets pledged as collateral as of March 31, 2009 and 2008 were as follows:
Millions of Yen (Note 1)Thousands of
U.S. Dollars (Note 1)
2009 2008 2009Securities . . . . . . . . . . . . . . . . . . . . . . . . . . . . . . ¥788,009 ¥532,949 $8,022,089 Trading Assets . . . . . . . . . . . . . . . . . . . . . . . . . 197,949 97,409 2,015,166 Loans and Bills Discounted . . . . . . . . . . . . . . . 1,114 149,167 11,348
Liabilities related to the above pledged assets as of March 31, 2009 and 2008 were as follows:
Millions of Yen (Note 1)Thousands of
U.S. Dollars (Note 1)
2009 2008 2009Deposits . . . . . . . . . . . . . . . . . . . . . . . . . . . . . . . ¥ 18,248 ¥23,214 $ 185,775 Payables under Repurchase Agreements . . . 198,051 97,401 2,016,198 Call Money and Bills Sold . . . . . . . . . . . . . . . . 26,000 64,700 264,685 Payables under Securities Lending Transactions. . . . . . . . . . . . . . . . . . . . . . . . . . . 67,291 81,105 685,041
Borrowed Money . . . . . . . . . . . . . . . . . . . . . . . 209,089 43,446 2,128,575
In addition, the followings was pledged as collateral for settlements of exchange or margins for futures transactions as of March 31, 2009 and 2008 respectively.
Millions of Yen (Note 1)Thousands of
U.S. Dollars (Note 1)
2009 2008 2009Securities . . . . . . . . . . . . . . . . . . . . . . . . . . . . . . ¥127,571 ¥103,943 $1,298,700
Initial margins of futures markets of ¥55 million and guarantee deposits of ¥5,425 million were included in Other Assets as of March 31, 2009 The respective amounts were ¥215 million and ¥5,205 million as of March 31, 2008.

30 The Chiba Bank, Ltd.
13. Deposits
An analysis of deposits as of March 31, 2009 and 2008 was as follows:
Millions of Yen (Note 1)Thousands of
U.S. Dollars (Note 1)
2009 2008 2009Current Deposits . . . . . . . . . . . . . . . . . . . . . . . ¥ 176,292 ¥ 175,896 $ 1,794,690 Ordinary Deposits . . . . . . . . . . . . . . . . . . . . . . 4,491,588 4,485,530 45,725,225 Savings Deposits . . . . . . . . . . . . . . . . . . . . . . . 258,420 272,135 2,630,774 Deposits at Notice . . . . . . . . . . . . . . . . . . . . . . 7,313 7,011 74,452 Time Deposits . . . . . . . . . . . . . . . . . . . . . . . . . . 3,379,613 3,271,011 34,405,106 Other Deposits . . . . . . . . . . . . . . . . . . . . . . . . . 188,091 164,505 1,914,803
Sub Total . . . . . . . . . . . . . . . . . . . . . . . . . . . ¥8,501,320 ¥8,376,091 $86,545,050 Negotiable Certifi cates of Deposit . . . . . . . . 153,668 128,003 1,564,378
Total . . . . . . . . . . . . . . . . . . . . . . . . . . . . . . . ¥8,654,989 ¥8,504,095 $88,109,427
14. Trading Liabilities
Trading liabilities as of March 31, 2009 and 2008 consisted of the following:
Millions of Yen (Note 1)Thousands of
U.S. Dollars (Note 1)
2009 2008 2009Trading Securities Sold for Short Sales . . . . . . . ¥ 6,262 ¥10,328 $ 63,754 Derivatives of Trading Securities . . . . . . . . . . — 27 —Trading-related Financial Derivatives . . . . . . 12,457 6,262 126,823
Total . . . . . . . . . . . . . . . . . . . . . . . . . . . . . . . ¥18,720 ¥16,617 $190,577
15. Borrowed money
Borrowed money as of March 31, 2009 and 2008 consisted of the following:
Millions of Yen (Note 1)Thousands of
U.S. Dollars (Note 1)
2009 2008 2009Borrowings from the Bank of Japan and Other Financial Institutions . . . . . . . . . . . . . . ¥248,189 ¥80,646 $2,526,621
Total . . . . . . . . . . . . . . . . . . . . . . . . . . . . . . . ¥248,189 ¥80,646 $2,526,621
Subordinated Borrowings of ¥39,000 million and ¥37,000 million were included in Borrowed Money as of March 31, 2009 and 2008.
16. Foreign Exchange Liabilities
Foreign exchange liabilities as of March 31, 2009 and 2008 consisted of the following:
Millions of Yen (Note 1)Thousands of
U.S. Dollars (Note 1)
2009 2008 2009Foreign Bills Sold . . . . . . . . . . . . . . . . . . . . . . . ¥396 ¥462 $4,032 Foreign Bills Payable . . . . . . . . . . . . . . . . . . . . 40 53 415
Total . . . . . . . . . . . . . . . . . . . . . . . . . . . . . . . ¥436 ¥516 $4,447
17. Bonds Payable
Bonds Payable as of March 31, 2009 and 2008 consisted of the following:
Millions of Yen (Note 1)Thousands of
U.S. Dollars (Note 1)
2009 2008 2009Issuer: The Bank (Subordinated Bonds) . . . . ¥40,000 ¥40,000 $407,208 Issuer: Overseas Subsidiary, Chiba Capital Funding (Cayman) Ltd. . . . . . — 1,000 —
Total . . . . . . . . . . . . . . . . . . . . . . . . . . . . . . . ¥40,000 ¥41,000 $407,208
18. Other Liabilities
Other liabilities as of March 31, 2009 and 2008 consisted of the following:
Millions of Yen (Note 1)Thousands of
U.S. Dollars (Note 1)
2009 2008 2009Domestic Exchange Settlement Account, credit . . . . . . . . . . . . . . . . . . . . . . . . . ¥ 289 ¥ 904 $ 2,943
Accrued Expenses . . . . . . . . . . . . . . . . . . . . . . 14,929 14,682 151,987 Unearned Revenue . . . . . . . . . . . . . . . . . . . . . . 20,584 19,945 209,557 Income Taxes Payable . . . . . . . . . . . . . . . . . . . 1,837 14,978 18,708 Other . . . . . . . . . . . . . . . . . . . . . . . . . . . . . . . . . 56,204 49,519 572,171
Total . . . . . . . . . . . . . . . . . . . . . . . . . . . . . . . ¥93,845 ¥100,030 $955,368
19. Retirement Benefi t Plans
The Bank and its domestic consolidated subsidiaries have defi ned benefi t plans, i.e., lump-sum payment plans, welfare pension fund plans and tax-qual-ifi ed pension plans.(1) The liabilities/assets for employees’ retirement benefi t plans as of March
31, 2009 and 2008 were as follows:
Millions of Yen (Note 1)Thousands of
U.S. Dollars (Note 1)
2009 2008 2009Retirement Benefi t Obligation . . . . . . . . . . . . ¥(65,620) ¥(65,308) $(668,032)Plan Assets at Fair Value . . . . . . . . . . . . . . . . . 32,958 38,833 335,528 Unfunded Retirement Benefi t Obligation . . (32,661) (26,474) (332,504)Unrecognized Actuarial Gain or Loss . . . . . . 14,634 8,039 148,987 Net Amount Accrued on the Balance Sheets . . . . . . . . . . . . . . . . . . . . . . . . (18,027) (18,435) (183,517)
Prepaid Pension Cost. . . . . . . . . . . . . . . . . . . . 955 — 9,729 Provision for Retirement Benefi ts . . . . . . . . . . ¥(18,982) ¥(18,435) $(193,245)
(2) The components of retirement benefi t cost for the years ended March 31, 2009 and 2008 were as follows:
Millions of Yen (Note 1)Thousands of
U.S. Dollars (Note 1)
2009 2008 2009Service Cost . . . . . . . . . . . . . . . . . . . . . . . . . . . . ¥ 2,013 ¥ 2,230 $ 20,499 Interest Cost . . . . . . . . . . . . . . . . . . . . . . . . . . . 1,292 1,292 13,155 Expected Return on Plan Assets . . . . . . . . . . (1,358) (1,478) (13,828)Amortization of Actuarial Gain or Loss . . . . . 1,440 885 14,663 Other (nonrecurring additional retirement allowance paid and other) . . . . . . . . . . . . . . . 22 22 229
Net Periodic Retirement Benefi t Cost . . . . . . ¥ 3,410 ¥ 2,953 $ 34,717
(3) Assumptions used in accounting for the above plans for the years ended March 31, 2009 and 2008 were as follows:
2009 2008Discount Rate . . . . . . . . . . . . . . . . . . . . . . . . . . . . . . . . . . . . . . . . 2.0% 2.0%Expected Rate of Return on Plan Assets . . . . . . . . . . . . . . . . . . 3.5% 3.5%Amortization Period of Actuarial Gain or Loss . . . . . . . . . . . . . 10 years 10 years

31 Annual Report 2009
20. Revaluation Reserve for Land
Pursuant to the Law concerning Revaluation of Premises, premises used for business operations have been revalued as of March 31, 1998. Premises revalu-ation gain was included in Net Assets, net of income taxes. Date of the revaluation: March 31, 1998 The method of the revaluation (set forth in Article 3 (3) of the Law): Pursuant to Article 2 (4) of the Enforcement Ordinance for the Law concern-ing Revaluation of Premises, the premises price for the revaluation is deter-mined based on the method established and published by the Director Gen-eral of National Tax Agency in order to calculate the premises value for a basis of determining the taxable amount subject to premises value tax prescribed by Article 16 of the Premises Value Tax Law, refl ecting appropriate adjustments for land shape and timing of the assessment. The difference between the revalued carrying amount and the fair value of premises revalued pursuant to the Article 10 of the Law were ¥23,198 million and ¥29,105 million as of March 31, 2009 and 2008, respectively.
21. Capital Stock
The number of the Bank’s authorized shares was 2,500,000,000 as of March 31, 2009 and 2008. The number of shares in issue as of March 31, 2009 and 2008 was as follows:
Number of Shares
2009 2008Shares in Issue . . . . . . . . . . . . . . . . . . . . . . . . . . 895,521,087 895,521,087
The number of treasury shares held by the Bank was 1,703 thousand and 1,656 thousand as of March 31, 2009 and 2008.
22. Trading Income
The composition of trading income for the years ended March 31, 2009 and 2008 was as follows:
Millions of Yen (Note 1)Thousands of
U.S. Dollars (Note 1)
2009 2008 2009Gains on Trading Account Securities Transactions . . . . . . . . . . . . . . . . . . . ¥ 752 ¥ 646 $ 7,658
Income from Securities and Derivatives Related to Trading Transactions . . . . . . . . . 21 — 217
Income from Trading-Related Financial Derivatives Transactions . . . . . . . . 1,072 1,394 10,918
Other Trading Income . . . . . . . . . . . . . . . . . . . 3,260 1,917 33,194 Total . . . . . . . . . . . . . . . . . . . . . . . . . . . . . . . ¥5,106 ¥3,959 $51,986
23. Other Ordinary Income
The composition of other ordinary income for the years ended March 31, 2009 and 2008 was as follows:
Millions of Yen (Note 1)Thousands of
U.S. Dollars (Note 1)
2009 2008 2009Gains on Foreign Exchange Transactions . . . . ¥2,921 ¥3,709 $29,736 Gains on Sales of Bonds . . . . . . . . . . . . . . . . . 1,942 2,373 19,779 Income from Derivatives other than for Trading or Hedging . . . . . . . . . . . . . . . . . 845 — 8,607
Other . . . . . . . . . . . . . . . . . . . . . . . . . . . . . . . . . 2 156 28 Total . . . . . . . . . . . . . . . . . . . . . . . . . . . . . . . ¥5,712 ¥6,239 $58,151
24. Other Income
The composition of other income for the years ended March 31, 2009 and 2008 was as follows:
Millions of Yen (Note 1)Thousands of
U.S. Dollars (Note 1)
2009 2008 2009Gains on Sale of Stocks and Other Securities . . ¥ 296 ¥ 2,649 $ 3,019 Gains on Money Held in Trust . . . . . . . . . . . . 532 806 5,419 Revenue on Lease . . . . . . . . . . . . . . . . . . . . . . 17,315 17,816 176,279 Recoveries of Written-off Claims . . . . . . . . . . 5,435 5,100 55,330 Reversal of Allowance for Loan Losses . . . . . — 268 —Other . . . . . . . . . . . . . . . . . . . . . . . . . . . . . . . . . 7,492 6,980 76,274
Total . . . . . . . . . . . . . . . . . . . . . . . . . . . . . . . ¥31,072 ¥33,621 $316,322
25. Other Ordinary Expenses
The composition of other ordinary expenses for the years ended March 31, 2009 and 2008 was as follows:
Millions of Yen (Note 1)Thousands of
U.S. Dollars (Note 1)
2009 2008 2009Loss on Sales of Bonds . . . . . . . . . . . . . . . . ¥ 9,826 ¥1,647 $100,036 Loss on Redemption of Bonds . . . . . . . . 1,676 — 17,064 Loss on Devaluation of Bonds . . . . . . . . . 18,877 1,662 192,182 Expenses on Derivatives other than for Trading or Hedging . . . . . . . . . . . . . . — 1,103 —
Total . . . . . . . . . . . . . . . . . . . . . . . . . . . . ¥30,380 ¥4,412 $309,281
26. Other Expenses
The composition of other expenses for the years ended March 31, 2009 and 2008 was as follows:
Millions of Yen (Note 1)Thousands of
U.S. Dollars (Note 1)
2009 2008 2009Provision of Allowance for Loan Losses . . . . . . ¥14,024 ¥ — $142,777 Written-off of Loans . . . . . . . . . . . . . . . . . . . . . 32,853 14,756 334,457 Losses on Sales of Stocks and Other Securities . . . . . . . . . . . . . . . . . . . . . . . 123 64 1,262
Losses on Devaluation of Stocks and Other Securities . . . . . . . . . . . . . . . . . . . . . . . 14,746 4,598 150,127
Loss on Money Held in Trust . . . . . . . . . . . . . 654 339 6,661 Cost of Leased Assets . . . . . . . . . . . . . . . . . . . 14,767 15,525 150,333 Impairment Losses on Fixed Assets . . . . . . . . — 13 —Provision for Directors' Retirement Benefi ts. . — 1,493 —Provision for Reimbursement of Deposits . . 373 1,590 3,797 Other . . . . . . . . . . . . . . . . . . . . . . . . . . . . . . . . . 4,951 3,981 50,407
Total . . . . . . . . . . . . . . . . . . . . . . . . . . . . . . . ¥82,495 ¥42,364 $839,821
27. Cash and Cash Equivalents
The reconciliation of cash and due from banks in the consolidated balance sheets to the cash and cash equivalents as of March 31, 2009 and 2008 was as follows:
Millions of Yen (Note 1)Thousands of
U.S. Dollars (Note 1)
2009 2008 2009Cash and Due from Banks . . . . . . . . . . . . . . . . ¥330,336 ¥ 426,953 $3,362,885 Interest-bearing Deposits included in Due from Banks (excluding Due from BOJ) . . . . (56,252) (292,419) (572,659)
Cash and Cash Equivalents . . . . . . . . . . . . . . . ¥274,083 ¥ 134,533 $2,790,226

32 The Chiba Bank, Ltd.
28. Lease Transactions
(1) Finance Lease Transactions
Millions of Yen (Note 1)Thousands of
U.S. Dollars (Note 1)
2009 2008 2009Lessee Side
Amount Corresponding to the Purchased Prices of the Leased Assets . . . . . . . . . . . . ¥430 ¥144 $4,379
Amount Corresponding to Accumulated Depreciation . . . . . . . . . . . . 131 77 1,337
Amount Corresponding to Balance at Fiscal Year-End . . . . . . . . . . . . ¥298 ¥66 $3,041
Millions of Yen (Note 1)Thousands of
U.S. Dollars (Note 1)
2009 2008 2009Amount Corresponding to Lease Payables (within 1 year) . . . . . . . . . . ¥ 37 ¥28 $ 378
Amount Corresponding to Lease Payables (over 1 year) . . . . . . . . . . . 261 38 2,664 Total . . . . . . . . . . . . . . . . . . . . . . . . . . . . . . ¥298 ¥66 $3,041
Millions of Yen (Note 1)Thousands of
U.S. Dollars (Note 1)
2009 2008 2009Lease Fees Paid . . . . . . . . . . . . . . . . . . . . . . . . ¥44 ¥26 $458 Amount Corresponding to Depreciation . . . 44 26 458
Note: 1. The lease period is set at the useful lifetime of the asset and the straight-line method of depreciation is used to compute the remaining value of the asset.
2. The amount corresponding to the Purchased Prices of the Leased Assets presented above include interest amounts calculated under the interest method, as the balances of Lease Payables are small as a percentage of the book value of total tangible fi xed assets.
Millions of Yen (Note 1)
2008Lessor Side
Amount Corresponding to the Purchased Prices of the Leased Asset . . . . . . . . . . . . . . . . . . . . . . . . . . . . . . . . . . . . . . . . . ¥105,384
Amount Corresponding to Accumulated Depreciation . . . . . . . . . . . . 63,027 Amount Corresponding to Balance at Fiscal Year-End . . . . . . . . . . . . ¥ 42,356
Millions of Yen (Note 1)
2008Amount Corresponding to Lease Receivable (within 1 year) . . . . . . ¥15,210 Amount Corresponding to Lease Receivable (over 1 year) . . . . . . . . 31,077
Total . . . . . . . . . . . . . . . . . . . . . . . . . . . . . . . . . . . . . . . . . . . . . . . . . . . ¥46,288
Millions of Yen (Note 1)
2008Lease Fees Received . . . . . . . . . . . . . . . . . . . . . . . . . . . . . . . . . . . . . . . . . . . . ¥17,201 Depreciation . . . . . . . . . . . . . . . . . . . . . . . . . . . . . . . . . . . . . . . . . . . . . . . . . . 14,203
(2) Operating Lease Transactions
Millions of Yen (Note 1)
Thousands ofU.S. Dollars
(Note 1)
2009 2008 2009Lessee Side (Lease Payables having to do with Incancelable Operating Lease Transactions)Amount Corresponding to Lease Payables (within 1 year) . . . . . . . . . ¥136 ¥ — $1,385
Amount Corresponding to Lease Payables (over 1 year) . . . . . . . . . . . 377 — 3,847 Total . . . . . . . . . . . . . . . . . . . . . . . . . . . . . . ¥513 ¥ — $5,232
Millions of Yen (Note 1)
2008Lessor Side
Amount Corresponding to Lease Receivables (within 1 year) . . . . . . ¥337 Amount Corresponding to Lease Receivables (over 1 year) . . . . . . . . 6
Total . . . . . . . . . . . . . . . . . . . . . . . . . . . . . . . . . . . . . . . . . . . . . . . . . . . . . ¥344
29. Tax Effect
The tax effects of temporary differences that give rise to signifi cant portions of the deferred tax assets and deferred tax liabilities as of March 31, 2009 and 2008 consisted of the following:
Millions of Yen (Note 1)Thousands of
U.S. Dollars (Note 1)
2009 2008 2009Deferred Tax Assets:
Allowance for Loan Losses . . . . . . . . . . . . ¥44,588 ¥38,759 $453,918 Valuation Difference on Available-for-sale Securities . . . . . . . . . . ¥23,075 ¥ — $234,917
Write-offs of Securities . . . . . . . . . . . . . . . . 9,396 6,598 95,654 Provision for Retirement Benefi ts . . . . . . . 7,668 7,447 78,068 Other . . . . . . . . . . . . . . . . . . . . . . . . . . . . . . 9,511 9,092 96,825
Sub Total . . . . . . . . . . . . . . . . . . . . . . . . . . . . . . ¥94,240 ¥61,897 $959,383 Valuation Allowance . . . . . . . . . . . . . . . . . . (4,602) (8,599) (46,853)
Total Deferred Tax Assets . . . . . . . . . . . . . . . . ¥89,637 ¥53,298 $912,529 Deferred Tax Liabilities:
Valuation Difference on Available-for-sale Securities . . . . . . . . . . ¥ 200 ¥ 4,769 $ 2,040
Deferred Gains or Losses on Hedges . . . — 203 —Reserve for Advanced Depreciation . . . . 47 47 487 Prepaid Pension Cost. . . . . . . . . . . . . . . . . 287 — 2,931
Total Deferred Tax Liabilities . . . . . . . . . . . . . ¥ 536 ¥ 5,021 $ 5,458 Net Deferred Tax Assets . . . . . . . . . . . . . . . . . ¥89,101 ¥48,277 $907,071
A reconciliation of the effective income tax rate refl ected in the accompanying consolidated statements of income to the statutory tax rate for the years ended March 31, 2009 and 2008 were follows:
2009 2008Statutory Tax Rate . . . . . . . . . . . . . . . . . . . . . . . . . . . . . . . . . . . . 40.4% 40.4%
Dividends Exempted for Income Tax Purposes . . . . . . . . . (5.3%) (0.6%)Valuation Allowance . . . . . . . . . . . . . . . . . . . . . . . . . . . . . . . . (28.0%) 3.0%Adjustment in Enterprise Tax Imposed on Overseas Profi ts . . . . . . . . . . . . . . . . . . . . . . . . . . . . . . . 2.6% —
Others . . . . . . . . . . . . . . . . . . . . . . . . . . . . . . . . . . . . . . . . . . . 3.5% —Effective Income Tax Rate . . . . . . . . . . . . . . . . . . . . . . . . . . . . . . 13.2% 42.7%

33 Annual Report 2009
30. Segment Information
(1) Business Segment InformationFor the year ended March 31, 2009
Millions of Yen (Note 1)
Banking Business Leasing Business Other Business Total Elimination Consolidated
Ordinary Income, Ordinary Profi t/LossOrdinary Income
(a) Outside Customers . . . . . . . . . . . . . . . . . . . . . . . . . . . . ¥ 235,013 ¥18,738 ¥ 3,267 ¥ 257,019 ¥ — ¥ 257,019 (b) Inter-Segment . . . . . . . . . . . . . . . . . . . . . . . . . . . . . . . . 983 347 36 1,367 (1,367) —
Total . . . . . . . . . . . . . . . . . . . . . . . . . . . . . . . . . . . . . . . . ¥ 235,996 ¥19,086 ¥ 3,303 ¥ 258,387 ¥ (1,367) ¥ 257,019 Ordinary Expenses . . . . . . . . . . . . . . . . . . . . . . . . . . . . . . . . . . ¥ 227,233 ¥18,027 ¥ 3,548 ¥ 248,809 ¥ (1,188) ¥ 247,620 Ordinary Profi t/Loss . . . . . . . . . . . . . . . . . . . . . . . . . . . . . . . . . ¥8,763 ¥ 1,059 ¥ (244) ¥ 9,577 ¥ (178) ¥ 9,399
Assets . . . . . . . . . . . . . . . . . . . . . . . . . . . . . . . . . . . . . . . . . . . . . ¥10,039,561 ¥45,905 ¥21,239 ¥10,106,706 ¥(43,780) ¥10,062,926 Depreciation . . . . . . . . . . . . . . . . . . . . . . . . . . . . . . . . . . . . . . . 6,656 19 103 6,779 — 6,779 Impairment Losses on Fixed Assets . . . . . . . . . . . . . . . . . . . . — — — — — —Capital Expenditure . . . . . . . . . . . . . . . . . . . . . . . . . . . . . . . . . 9,074 26 4 9,106 — 9,106
1. Ordinary Income and Ordinary Profi t/loss are presented instead of sales and operating profi ts of companies in other industries.2. “Other Business” includes securities business.
For the year ended March 31, 2008
Millions of Yen (Note 1)
Banking Business Leasing Business Other Business Total Elimination Consolidated
Ordinary Income, Ordinary Profi t/LossOrdinary Income
(a) Outside Customers . . . . . . . . . . . . . . . . . . . . . . . . . . . . ¥ 244,779 ¥19,192 ¥ 4,911 ¥ 268,883 ¥ — ¥ 268,883 (b) Inter-Segment . . . . . . . . . . . . . . . . . . . . . . . . . . . . . . . . 887 364 25 1,277 (1,277) —
Total . . . . . . . . . . . . . . . . . . . . . . . . . . . . . . . . . . . . . . . . ¥ 245,666 ¥19,556 ¥ 4,936 ¥ 270,160 ¥ (1,277) ¥ 268,883 Ordinary Expenses . . . . . . . . . . . . . . . . . . . . . . . . . . . . . . . . . . ¥ 168,735 ¥18,008 ¥ 4,095 ¥ 190,839 ¥ (1,141) ¥ 189,698 Ordinary Profi t/Loss . . . . . . . . . . . . . . . . . . . . . . . . . . . . . . . . . ¥ 76,931 ¥ 1,548 ¥ 841 ¥ 79,320 ¥ (136) ¥ 79,184
Assets . . . . . . . . . . . . . . . . . . . . . . . . . . . . . . . . . . . . . . . . . . . . . ¥9,811,362 ¥47,451 ¥22,195 ¥9,881,009 ¥(45,070) ¥9,835,939 Depreciation . . . . . . . . . . . . . . . . . . . . . . . . . . . . . . . . . . . . . . . 6,664 14,222 116 21,003 — 21,003 Impairment Losses on Fixed Assets . . . . . . . . . . . . . . . . . . . . — — 13 13 — 13 Capital Expenditure . . . . . . . . . . . . . . . . . . . . . . . . . . . . . . . . . 8,593 13,804 112 22,510 — 22,510
1. From the year ended March 31, 2007, “Acceptances and Guarantees” and “Customers’ Liabilities for Acceptances and Guarantee” were offset against the amounts corresponding to the private offerings of bonds with Chiba Bank’s guarantee. Thus, total assets of “Banking Business” decreased by ¥61,450 million compared with the amounts calculated by the previous measure.
2. Ordinary Income and Ordinary Profi t/loss are presented instead of sales and operating profi ts of companies in other industries.3. “Other Business” includes securities business.
(2) Geographic Segment InformationThe domestic share of Ordinary Income exceeds 90 percent. Thus, segment information by geographic area is omitted.
(3) Ordinary Income from Overseas OperationsThe share of Ordinary Income from overseas operations is under 10 percent. Thus, Ordinary income from overseas operation is omitted.
31. Market Value of Securities
Current Year’s Information on Market Value of Securities(1) Trading Securities
Millions of Yen (Note 1)
March 31, 2009
Amount in the Balance Sheets
Valuation Gain Included in Income before Income
Taxes and Minority Interests
Trading Securities . . . . . . . . . . . . . . . . . . . . . . . . . . . . . . . . . . . . . . . . . . . . . . . . . . . . . . . . . . . . . . . . . . . . . . . . . . . . . . . . . . . . . . . . . . . . . . . ¥378,962 ¥666
(2) Marketable Securities Held-to-MaturityMillions of Yen (Note 1)
March 31, 2009Amount in the Balance Sheets Market Value Differences Gain Loss
Bonds:Japanese Government Bonds . . . . . . . . . . . . . . . . . . . . . . . . . . . . . . . . . . . . . . . . . . . ¥ — ¥ — ¥ — ¥— ¥ — Japanese Local Government Bonds . . . . . . . . . . . . . . . . . . . . . . . . . . . . . . . . . . . . . . — — — — —Japanese Corporate Bonds . . . . . . . . . . . . . . . . . . . . . . . . . . . . . . . . . . . . . . . . . . . . . — — — — —
Other . . . . . . . . . . . . . . . . . . . . . . . . . . . . . . . . . . . . . . . . . . . . . . . . . . . . . . . . . . . . . . . . . . . 41,194 40,841 (352) 39 391 Total . . . . . . . . . . . . . . . . . . . . . . . . . . . . . . . . . . . . . . . . . . . . . . . . . . . . . . . . . . . . . . . . . . . . ¥41,194 ¥40,841 ¥(352) ¥39 ¥391
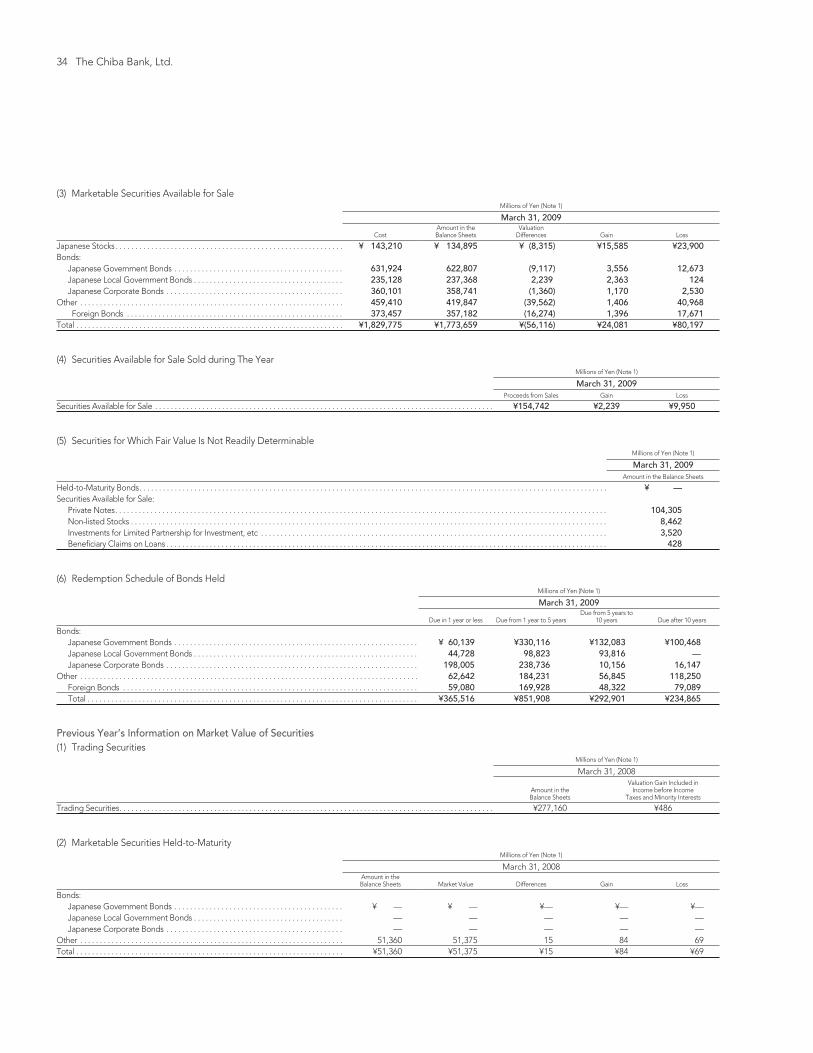
34 The Chiba Bank, Ltd.
(3) Marketable Securities Available for SaleMillions of Yen (Note 1)
March 31, 2009
CostAmount in the Balance Sheets
ValuationDifferences Gain Loss
Japanese Stocks . . . . . . . . . . . . . . . . . . . . . . . . . . . . . . . . . . . . . . . . . . . . . . . . . . . . . . . . . . ¥ 143,210 ¥ 134,895 ¥ (8,315) ¥15,585 ¥23,900 Bonds:
Japanese Government Bonds . . . . . . . . . . . . . . . . . . . . . . . . . . . . . . . . . . . . . . . . . . . 631,924 622,807 (9,117) 3,556 12,673 Japanese Local Government Bonds . . . . . . . . . . . . . . . . . . . . . . . . . . . . . . . . . . . . . . 235,128 237,368 2,239 2,363 124 Japanese Corporate Bonds . . . . . . . . . . . . . . . . . . . . . . . . . . . . . . . . . . . . . . . . . . . . . 360,101 358,741 (1,360) 1,170 2,530
Other . . . . . . . . . . . . . . . . . . . . . . . . . . . . . . . . . . . . . . . . . . . . . . . . . . . . . . . . . . . . . . . . . . . 459,410 419,847 (39,562) 1,406 40,968 Foreign Bonds . . . . . . . . . . . . . . . . . . . . . . . . . . . . . . . . . . . . . . . . . . . . . . . . . . . . . . . 373,457 357,182 (16,274) 1,396 17,671
Total . . . . . . . . . . . . . . . . . . . . . . . . . . . . . . . . . . . . . . . . . . . . . . . . . . . . . . . . . . . . . . . . . . . . ¥1,829,775 ¥1,773,659 ¥(56,116) ¥24,081 ¥80,197
(4) Securities Available for Sale Sold during The YearMillions of Yen (Note 1)
March 31, 2009Proceeds from Sales Gain Loss
Securities Available for Sale . . . . . . . . . . . . . . . . . . . . . . . . . . . . . . . . . . . . . . . . . . . . . . . . . . . . . . . . . . . . . . . . . . . . . . . . . . . . . . . . . . . . . . ¥154,742 ¥2,239 ¥9,950
(5) Securities for Which Fair Value Is Not Readily DeterminableMillions of Yen (Note 1)
March 31, 2009Amount in the Balance Sheets
Held-to-Maturity Bonds . . . . . . . . . . . . . . . . . . . . . . . . . . . . . . . . . . . . . . . . . . . . . . . . . . . . . . . . . . . . . . . . . . . . . . . . . . . . . . . . . . . . . . . . . . . . . . . . . . . . . . . . . . . . . . . . . . . . . . . ¥ —Securities Available for Sale:
Private Notes . . . . . . . . . . . . . . . . . . . . . . . . . . . . . . . . . . . . . . . . . . . . . . . . . . . . . . . . . . . . . . . . . . . . . . . . . . . . . . . . . . . . . . . . . . . . . . . . . . . . . . . . . . . . . . . . . . . . . . . . . . . . . 104,305 Non-listed Stocks . . . . . . . . . . . . . . . . . . . . . . . . . . . . . . . . . . . . . . . . . . . . . . . . . . . . . . . . . . . . . . . . . . . . . . . . . . . . . . . . . . . . . . . . . . . . . . . . . . . . . . . . . . . . . . . . . . . . . . . . . 8,462 Investments for Limited Partnership for Investment, etc . . . . . . . . . . . . . . . . . . . . . . . . . . . . . . . . . . . . . . . . . . . . . . . . . . . . . . . . . . . . . . . . . . . . . . . . . . . . . . . . . . . . . . . . 3,520 Benefi ciary Claims on Loans . . . . . . . . . . . . . . . . . . . . . . . . . . . . . . . . . . . . . . . . . . . . . . . . . . . . . . . . . . . . . . . . . . . . . . . . . . . . . . . . . . . . . . . . . . . . . . . . . . . . . . . . . . . . . . . . 428
(6) Redemption Schedule of Bonds HeldMillions of Yen (Note 1)
March 31, 2009
Due in 1 year or less Due from 1 year to 5 yearsDue from 5 years to
10 years Due after 10 years
Bonds:Japanese Government Bonds . . . . . . . . . . . . . . . . . . . . . . . . . . . . . . . . . . . . . . . . . . . . . . . . . . . . . . . . . . . . . . ¥ 60,139 ¥330,116 ¥132,083 ¥100,468 Japanese Local Government Bonds . . . . . . . . . . . . . . . . . . . . . . . . . . . . . . . . . . . . . . . . . . . . . . . . . . . . . . . . . 44,728 98,823 93,816 —Japanese Corporate Bonds . . . . . . . . . . . . . . . . . . . . . . . . . . . . . . . . . . . . . . . . . . . . . . . . . . . . . . . . . . . . . . . . 198,005 238,736 10,156 16,147
Other . . . . . . . . . . . . . . . . . . . . . . . . . . . . . . . . . . . . . . . . . . . . . . . . . . . . . . . . . . . . . . . . . . . . . . . . . . . . . . . . . . . . . . 62,642 184,231 56,845 118,250 Foreign Bonds . . . . . . . . . . . . . . . . . . . . . . . . . . . . . . . . . . . . . . . . . . . . . . . . . . . . . . . . . . . . . . . . . . . . . . . . . . . 59,080 169,928 48,322 79,089 Total . . . . . . . . . . . . . . . . . . . . . . . . . . . . . . . . . . . . . . . . . . . . . . . . . . . . . . . . . . . . . . . . . . . . . . . . . . . . . . . . . . . . ¥365,516 ¥851,908 ¥292,901 ¥234,865
Previous Year’s Information on Market Value of Securities(1) Trading Securities
Millions of Yen (Note 1)
March 31, 2008
Amount in the Balance Sheets
Valuation Gain Included in Income before Income
Taxes and Minority Interests
Trading Securities . . . . . . . . . . . . . . . . . . . . . . . . . . . . . . . . . . . . . . . . . . . . . . . . . . . . . . . . . . . . . . . . . . . . . . . . . . . . . . . . . . . . . . . . . . . . . . . ¥277,160 ¥486
(2) Marketable Securities Held-to-MaturityMillions of Yen (Note 1)
March 31, 2008Amount in the Balance Sheets Market Value Differences Gain Loss
Bonds:Japanese Government Bonds . . . . . . . . . . . . . . . . . . . . . . . . . . . . . . . . . . . . . . . . . . . ¥ — ¥ — ¥— ¥— ¥—Japanese Local Government Bonds . . . . . . . . . . . . . . . . . . . . . . . . . . . . . . . . . . . . . . — — — — —Japanese Corporate Bonds . . . . . . . . . . . . . . . . . . . . . . . . . . . . . . . . . . . . . . . . . . . . . — — — — —
Other . . . . . . . . . . . . . . . . . . . . . . . . . . . . . . . . . . . . . . . . . . . . . . . . . . . . . . . . . . . . . . . . . . . 51,360 51,375 15 84 69 Total . . . . . . . . . . . . . . . . . . . . . . . . . . . . . . . . . . . . . . . . . . . . . . . . . . . . . . . . . . . . . . . . . . . . ¥51,360 ¥51,375 ¥15 ¥84 ¥69

35 Annual Report 2009
(3) Marketable Securities Available for SaleMillions of Yen (Note 1)
March 31, 2008
CostAmount in the Balance Sheets
ValuationDifferences Gain Loss
Japanese Stocks . . . . . . . . . . . . . . . . . . . . . . . . . . . . . . . . . . . . . . . . . . . . . . . . . . . . . . . . . . ¥ 137,208 ¥ 184,330 ¥ 47,121 ¥54,118 ¥ 6,996 Bonds:
Japanese Government Bonds . . . . . . . . . . . . . . . . . . . . . . . . . . . . . . . . . . . . . . . . . . . 468,693 457,726 (10,967) 1,323 12,290 Japanese Local Government Bonds . . . . . . . . . . . . . . . . . . . . . . . . . . . . . . . . . . . . . . 219,979 221,590 1,610 1,905 295 Japanese Corporate Bonds . . . . . . . . . . . . . . . . . . . . . . . . . . . . . . . . . . . . . . . . . . . . . 509,349 509,888 538 1,414 875
Other . . . . . . . . . . . . . . . . . . . . . . . . . . . . . . . . . . . . . . . . . . . . . . . . . . . . . . . . . . . . . . . . . . . 584,000 559,329 (24,671) 2,065 26,737 Foreign Bonds . . . . . . . . . . . . . . . . . . . . . . . . . . . . . . . . . . . . . . . . . . . . . . . . . . . . . . . . 492,049 477,649 (14,400) 2,048 16,448
Total . . . . . . . . . . . . . . . . . . . . . . . . . . . . . . . . . . . . . . . . . . . . . . . . . . . . . . . . . . . . . . . . . . . . ¥1,919,232 ¥1,932,865 ¥ 13,632 ¥60,827 ¥47,194
(4) Securities Available for Sale Sold during The YearMillions of Yen (Note 1)
March 31, 2008Proceeds from Sales Gain Loss
Securities Available for Sale . . . . . . . . . . . . . . . . . . . . . . . . . . . . . . . . . . . . . . . . . . . . . . . . . . . . . . . . . . . . . . . . . . . . . . . . . . . . . . . . . . . . . . ¥516,291 ¥5,022 ¥1,711
(5) Securities for Which Fair Value Is Not Readily DeterminableMillions of Yen (Note 1)
March 31, 2008Amount in the Balance Sheets
Held-to-Maturity Bonds . . . . . . . . . . . . . . . . . . . . . . . . . . . . . . . . . . . . . . . . . . . . . . . . . . . . . . . . . . . . . . . . . . . . . . . . . . . . . . . . . . . . . . . . . . . . . . . . . . . . . . . . . . . . . . . . . . . . . . . ¥ — Securities Available for Sale:
Private Notes . . . . . . . . . . . . . . . . . . . . . . . . . . . . . . . . . . . . . . . . . . . . . . . . . . . . . . . . . . . . . . . . . . . . . . . . . . . . . . . . . . . . . . . . . . . . . . . . . . . . . . . . . . . . . . . . . . . . . . . . . . . . . 99,026 Non-listed Stocks . . . . . . . . . . . . . . . . . . . . . . . . . . . . . . . . . . . . . . . . . . . . . . . . . . . . . . . . . . . . . . . . . . . . . . . . . . . . . . . . . . . . . . . . . . . . . . . . . . . . . . . . . . . . . . . . . . . . . . . . . 6,503 Investments for Limited Partnership for Investment, etc . . . . . . . . . . . . . . . . . . . . . . . . . . . . . . . . . . . . . . . . . . . . . . . . . . . . . . . . . . . . . . . . . . . . . . . . . . . . . . . . . . . . . . . . 4,183 Benefi ciary Claims on Loans . . . . . . . . . . . . . . . . . . . . . . . . . . . . . . . . . . . . . . . . . . . . . . . . . . . . . . . . . . . . . . . . . . . . . . . . . . . . . . . . . . . . . . . . . . . . . . . . . . . . . . . . . . . . . . . . 428
(6) Redemption Schedule of Bonds HeldMillions of Yen (Note 1)
March 31, 2008
Due in 1 year or less Due from 1 year to 5 yearsDue from 5 years to
10 years Due after 10 years
Bonds:Japanese Government Bonds . . . . . . . . . . . . . . . . . . . . . . . . . . . . . . . . . . . . . . . . . . . . . . . . . . . . . . . . . . . . . . ¥ 44,027 ¥199,155 ¥ 98,879 ¥115,664 Japanese Local Government Bonds . . . . . . . . . . . . . . . . . . . . . . . . . . . . . . . . . . . . . . . . . . . . . . . . . . . . . . . . . 59,649 116,210 45,730 —Japanese Corporate Bonds . . . . . . . . . . . . . . . . . . . . . . . . . . . . . . . . . . . . . . . . . . . . . . . . . . . . . . . . . . . . . . . . 199,493 384,061 11,269 14,090
Other . . . . . . . . . . . . . . . . . . . . . . . . . . . . . . . . . . . . . . . . . . . . . . . . . . . . . . . . . . . . . . . . . . . . . . . . . . . . . . . . . . . . . . 32,285 267,658 114,070 138,766 Foreign Bonds . . . . . . . . . . . . . . . . . . . . . . . . . . . . . . . . . . . . . . . . . . . . . . . . . . . . . . . . . . . . . . . . . . . . . . . . . . . 32,242 247,943 106,242 89,675 Total . . . . . . . . . . . . . . . . . . . . . . . . . . . . . . . . . . . . . . . . . . . . . . . . . . . . . . . . . . . . . . . . . . . . . . . . . . . . . . . . . . . . ¥335,456 ¥967,085 ¥269,949 ¥268,520
32. Money Held in Trust
(1) Money Held in Trust for Trading Purposes
Millions of Yen (Note 1)Thousands of
U.S. Dollars (Note 1)
2009 2008 2009Book Value . . . . . . . . . . . . . . . . . . . . . . . . . . . . . . . . . . . . . . . . . . . . . . . . . . . . . . . . . . . . . . . . . . . . . . . . . . . . . . . . . . . . . . . . . . . . . . . . . . . ¥24,649 ¥24,666 $250,935 Valuation Gains Included in the Consolidated Statements of Income . . . . . . . . . . . . . . . . . . . . . . . . . . . . . . . . . . . . . . . . . . . . . . . . . . (0) 0 (3)
(2) Money Held in Trust for Other Purposes
Millions of Yen (Note 1)Thousands of
U.S. Dollars (Note 1)
2009 2008 2009Cost . . . . . . . . . . . . . . . . . . . . . . . . . . . . . . . . . . . . . . . . . . . . . . . . . . . . . . . . . . . . . . . . . . . . . . . . . . . . . . . . . . . . . . . . . . . . . . . . . . . . . . . . . ¥3,968 ¥4,842 $40,397 Book Value . . . . . . . . . . . . . . . . . . . . . . . . . . . . . . . . . . . . . . . . . . . . . . . . . . . . . . . . . . . . . . . . . . . . . . . . . . . . . . . . . . . . . . . . . . . . . . . . . . . 3,969 4,845 40,411 Valuation Differences . . . . . . . . . . . . . . . . . . . . . . . . . . . . . . . . . . . . . . . . . . . . . . . . . . . . . . . . . . . . . . . . . . . . . . . . . . . . . . . . . . . . . . . . . . . 1 2 14
Gains . . . . . . . . . . . . . . . . . . . . . . . . . . . . . . . . . . . . . . . . . . . . . . . . . . . . . . . . . . . . . . . . . . . . . . . . . . . . . . . . . . . . . . . . . . . . . . . . . . . . . 1 2 14 Losses . . . . . . . . . . . . . . . . . . . . . . . . . . . . . . . . . . . . . . . . . . . . . . . . . . . . . . . . . . . . . . . . . . . . . . . . . . . . . . . . . . . . . . . . . . . . . . . . . . . . . — — —

36 The Chiba Bank, Ltd.
33. Valuation Difference on Available-for-sale Securities
Valuation Difference on Available-for-sale Securities as of March 31, 2009 and 2008 consisted of the following:
Millions of Yen (Note 1)Thousands of
U.S. Dollars (Note 1)
2009 2008 2009Difference between Cost and Fair Value . . . . . . . . . . . . . . . . . . . . . . . . . . . . . . . . . . . . . . . . . . . . . . . . . . . . . . . . . . . . . . . . . . . . . . . . . . ¥(56,114) ¥13,635 $(571,258)
Securities Available for Sale . . . . . . . . . . . . . . . . . . . . . . . . . . . . . . . . . . . . . . . . . . . . . . . . . . . . . . . . . . . . . . . . . . . . . . . . . . . . . . . . . . (56,116) 13,632 (571,272)Other Money Held in Trust . . . . . . . . . . . . . . . . . . . . . . . . . . . . . . . . . . . . . . . . . . . . . . . . . . . . . . . . . . . . . . . . . . . . . . . . . . . . . . . . . . . 1 2 14
Deferred Tax Liabilities . . . . . . . . . . . . . . . . . . . . . . . . . . . . . . . . . . . . . . . . . . . . . . . . . . . . . . . . . . . . . . . . . . . . . . . . . . . . . . . . . . . . . . . . . (22,875) 4,769 (232,877)Difference between Cost and Fair Value, Net of Taxes . . . . . . . . . . . . . . . . . . . . . . . . . . . . . . . . . . . . . . . . . . . . . . . . . . . . . . . . . . . . . . ¥(33,239) ¥ 8,865 $(338,381)Amount Attributable to Minority Interests . . . . . . . . . . . . . . . . . . . . . . . . . . . . . . . . . . . . . . . . . . . . . . . . . . . . . . . . . . . . . . . . . . . . . . . . . 76 304 775 Net Unrealized Gains on Securities Available for Sale Owned by Subsidiaries, which is Attributable to the Parent . . . . . . . . . . . 35 73 362 Valuation Difference on Available-for-sale Securities . . . . . . . . . . . . . . . . . . . . . . . . . . . . . . . . . . . . . . . . . . . . . . . . . . . . . . . . . . . . . . . . ¥(33,279) ¥ 8,634 $(338,793)
34. Derivative Transactions
(1) Risk Control for Derivative Transactions (a) Details of Derivative Financial Products Derivative fi nancial products traded by the Bank and its consolidated subsidiaries are as follows: ( i ) Interest rate-related products Futures, Futures Options, FRAs (forward rate agreements), Swaps, Options, Interest-rate Caps and Interest-rate Floors ( ii ) Currency-related products Swaps, Forward Exchange, Options, Futures, NDFs (non-deliverable forward) (iii) Bond-related products Futures, Futures options, and Over-the-Counter Options (iv) Stock-related products Index Futures, Index Options and Stock Options
(b) Purposes and Policies for Using Derivative Financial Products The Bank and the consolidated subsidiaries use derivative fi nancial products for the purposes below: ( i ) To respond to the diverse needs of customers. ( ii ) For risk controls related to the assets and liabilities as a part of asset and liability management. (iii) For trading purposes. As for risk controls related to assets and liabilities, the Bank and the consolidated subsidiaries utilize the deferred hedge accounting method for the
management of the interest rate risk and currency risk. The method of hedge accounting is mentioned in the Note 3 (15). The Bank and the consolidated subsidiaries engage in trading activities under strict management and set the limit for possible losses.
(c) Risk Main risks of derivatives trading are as follows: ( i ) Market Risk The risk of incurring a loss because the value of the derivative products decrease caused by fl uctuations in market risk factors such as interest rates,
foreign exchange rates and bond and stock prices. ( ii ) Credit Risk The risk of incurring a loss because the counter-parties are unable to fulfi ll their obligations due to bankruptcy or other reasons. Amount of market risk and credit risk on derivative trading calculated into the capital ratio (BIS guidelines) as of March 31, 2009 are ¥6.9 billion and ¥74.1
billion respectively (consolidated base by current exposure method).
(d) Risk Management Structure The Bank has established Risk Management Department in the Risk Management and Compliance Coordination Division to monitor risks of the entire
portfolio, mainly market risk and credit risk. Also, the Bank has made a strict management system with various risk management guidelines. Especially for risks related to derivative fi nancial products, the Bank monitors with other market-related transactions. The Bank controls market risk by setting trading limits and stop-loss rules and monitors daily with VaR analysis. As for credit risk, credit section, independent of operating sections, sets credit lines for each counterparty. In addition, the consolidated subsidiaries have set trading limits, etc., and are reviewing daily gains/losses, market values, etc.
(e) Notional Principal or Contract Amount Notional principal or contract amount in below (2) does not necessarily indicate the amount of risk.

37 Annual Report 2009
(2) Market Value of Derivatives Notional principal or contract amount, market value and valuation gains (losses) on derivatives (a) Interest rate derivatives
Millions of Yen (Note 1)
March 31, 2009 March 31, 2008Notional Principal or Contract Amount
Market Value Valuation Gain (Loss)
Notional Principal or Contract Amount
Market Value Valuation Gain (Loss) Total Over 1 Year Total Over 1 Year
Listed:Futures:
Sold . . . . . . . . . . . . . . . . . . . . . . ¥ 2,488 ¥ — ¥ 2 ¥ 2 ¥ 2,476 ¥ — ¥ (4) ¥ (4)Bought . . . . . . . . . . . . . . . . . . . . — — — — — — — —
Options:Sold — — — — — — — —Bought . . . . . . . . . . . . . . . . . . . . — — — — — — — —
Over-the-counter:FRAs:
Sold . . . . . . . . . . . . . . . . . . . . . . — — — — — — — —Bought . . . . . . . . . . . . . . . . . . . . — — — — — — — —
Swaps:Receive Fixed / Pay Float . . . . 968,829 780,098 10,156 10,156 585,897 475,305 3,380 3,380 Receive Float / Pay Fixed . . . . 1,015,655 789,205 (9,379) (9,379) 637,994 464,724 (2,017) (2,017)Receive Float / Pay Float . . . . . 153,230 73,230 (260) (260) 176,000 80,000 (170) (170)
Options:Sold . . . . . . . . . . . . . . . . . . . . . . — — — — — — — —Bought . . . . . . . . . . . . . . . . . . . . — — — — — — — —
Other:Sold . . . . . . . . . . . . . . . . . . . . . . 123,393 109,254 (218) (218) 139,804 89,624 (364) (364)Bought . . . . . . . . . . . . . . . . . . . . 19,000 12,000 75 75 47,000 13,000 97 97
Total ¥ 377 ¥ 377 ¥ 920 ¥ 920
1. Valuation gains (losses) are recognized in the consolidated statements of income. Derivatives which qualify for hedge-accounting are not included in the above table.2. Market value of exchange-traded transactions is based on closing prices on the Tokyo International Financial Future Exchange, etc. Market value of over-the-counter transactions is based on dis-
counted cash fl ow method, option pricing models, etc.
(b) Currency derivativesMillions of Yen (Note 1)
March 31, 2009 March 31, 2008Notional Principal or Contract Amount
Market Value Valuation Gain (Loss)
Notional Principal or Contract Amount
Market Value Valuation Gain (Loss) Total Over 1 Year Total Over 1 Year
Listed:Futures:
Sold . . . . . . . . . . . . . . . . . . . . . . ¥ — ¥ — ¥ — ¥ — ¥ — ¥ — ¥ — ¥ —Bought . . . . . . . . . . . . . . . . . . . . — — — — — — — —
Options:Sold . . . . . . . . . . . . . . . . . . . . . . — — — — — — — —Bought . . . . . . . . . . . . . . . . . . . . — — — — — — — —
Over-the-counter:Currency Swaps . . . . . . . . . . . . . . . 470,275 402,753 710 710 439,633 360,370 811 811 Forward foreign exchange:
Sold . . . . . . . . . . . . . . . . . . . . . . 10,748 — (64) (64) 7,100 — 154 154 Bought . . . . . . . . . . . . . . . . . . . . 16,516 — 170 170 4,800 — 1 1
Currency Options:Sold . . . . . . . . . . . . . . . . . . . . . . 185,259 — (12,136) 1,361 181,868 — (11,865) 571 Bought . . . . . . . . . . . . . . . . . . . . 185,259 — 12,136 2,400 181,868 — 11,865 2,677
Other:Sold . . . . . . . . . . . . . . . . . . . . . . 1,987 1,544 435 435 1,070 828 188 188 Bought . . . . . . . . . . . . . . . . . . . . 1,987 1,544 (323) (323) 1,070 828 (149) (149)
Total . . . . . . . . . . . . . . . . . . . ¥ 928 ¥4,690 ¥ 1,007 ¥4,256
1. Valuation gains (losses) are recognized in the consolidated statements of income. Derivatives which qualify for hedge-accounting and which are corresponded to the foreign-currency positions and are recognized in the consolidated balance sheets are not included in the
above table.2. Market values are based on the discounted cash fl ow method.3. Other foreign exchange-related derivatives such as forward exchange contracts and currency options which were previously excluded from the above table, are now included in the above table.
Derivatives such as currency swaps which qualify for hedge-accounting based on JICPA Industry Audit Committee Report No. 25 are not included in the above table.
(c) Equity derivatives There are no corresponding items.

38 The Chiba Bank, Ltd.
(d) Bond derivativesMillions of Yen (Note 1)
March 31, 2009 March 31, 2008Notional Principal or Contract Amount
Market Value Valuation Gain (Loss)
Notional Principal or Contract Amount
Market Value Valuation Gain (Loss) Total Over 1 Year Total Over 1 Year
Listed:Futures:
Sold . . . . . . . . . . . . . . . . . . . . . . ¥138 ¥— ¥ 0 ¥ 0 ¥2,221 ¥— ¥(27) ¥(27)Bought . . . . . . . . . . . . . . . . . . . . 138 — 0 0 562 — 0 0
Futures Options:Sold . . . . . . . . . . . . . . . . . . . . . . — — — — — — — —Bought . . . . . . . . . . . . . . . . . . . . — — — — — — — —
Over-the-counter:Options:
Sold . . . . . . . . . . . . . . . . . . . . . . — — — — — — — —Bought . . . . . . . . . . . . . . . . . . . . — — — — — — — —
Other:Sold . . . . . . . . . . . . . . . . . . . . . . — — — — — — — —Bought . . . . . . . . . . . . . . . . . . . . — — — — — — — —
Total . . . . . . . . . . . . . . . . . . . ¥ 0 ¥ 0 ¥(26) ¥(26)
1. Valuation gains (losses) are recognized in the consolidated statements of income. Derivatives which qualify for hedge-accounting are not included in the above table.2. Market value of exchange-traded transactions are based on closing prices on the Tokyo Stock Exchange, etc. Market values of over-the-counter transactions are based on option pricing models, etc.
(e) Commodity derivatives There are no corresponding items.
(f) Credit derivatives There are no corresponding items.
35. Per Share Data
Consolidated Net Assets per Share and Consolidated Net Income per Share for the fi scal years ended March 31, 2009 and 2008 and related information were as follows:
Yen (Note 1) U.S. Dollars (Note 1)
2009 2008 2009Net Assets per Share of Common Stock . . . . . . . . . . . . . . . . . . . . . . . . . . . . . . . . . . . . . . . . . . . . . . . . . . . . . . . . . . . . . . . . . . . . . . . . . . ¥587.51 ¥634.94 $5.98 Net Income per Share of Common Stock . . . . . . . . . . . . . . . . . . . . . . . . . . . . . . . . . . . . . . . . . . . . . . . . . . . . . . . . . . . . . . . . . . . . . . . . . 13.86 51.43 0.14
1. Basis on calculating Net Assets per Share for the fi scal years ended March 31, 2009 and 2008 were as follows:
Millions of Yen (Note 1)Thousands of
U.S. Dollars (Note 1)
2009 2008 2009Consolidated Net Assets. . . . . . . . . . . . . . . . . . . . . . . . . . . . . . . . . . . . . . . . . . . . . . . . . . . . . . . . . . . . . . . . . . . . . . . . . . . . . . . . . . . . . . . . ¥537,671 ¥580,168 $5,473,597 Minority Interest . . . . . . . . . . . . . . . . . . . . . . . . . . . . . . . . . . . . . . . . . . . . . . . . . . . . . . . . . . . . . . . . . . . . . . . . . . . . . . . . . . . . . . . . . . . . . . . 12,541 12,616 127,678 Consolidated Net Assets attribute to common stockholders . . . . . . . . . . . . . . . . . . . . . . . . . . . . . . . . . . . . . . . . . . . . . . . . . . . . . . . . . 525,129 567,552 5,345,919
Number of Shares
2009 2008Number of shares of common stock used for calculating Net Assets per Share . . . . . . . . . . . . . . . . . . . . . . . . . . . . . . . . . . . . . . . . . 893,817,424 893,864,254
2. Basis on calculating Net Income per Share for the fi scal years ended March 31, 2009 and 2008 were as follows:
Millions of Yen (Note 1)Thousands of
U.S. Dollars (Note 1)
2009 2008 2009Consolidated Net Income . . . . . . . . . . . . . . . . . . . . . . . . . . . . . . . . . . . . . . . . . . . . . . . . . . . . . . . . . . . . . . . . . . . . . . . . . . . . . . . . . . . . . . . ¥12,392 ¥45,980 $126,159 Consolidated Net Income not attributable to common stockholders . . . . . . . . . . . . . . . . . . . . . . . . . . . . . . . . . . . . . . . . . . . . . . . . . . — — —Consolidated Net Income attributable to common stockholders . . . . . . . . . . . . . . . . . . . . . . . . . . . . . . . . . . . . . . . . . . . . . . . . . . . . . 12,392 45,980 126,159
Number of Shares
2009 2008Average number of shares of common stock (excluding treasury stock) . . . . . . . . . . . . . . . . . . . . . . . . . . . . . . . . . . . . . . . . . . . . . . . . 893,836,942 893,921,316
3. Diluted Net Income per Share was not presented as there were not potentially dilutive stocks.

39 Annual Report 2009
36. Related Party Transactions
I. Related party transactions for the fi scal year ended March 31, 2008 were as follows: Amounts of the transactions Balance at end of year
Related party Category Account Classifi cation Millions of Yen (Note 1) Millions of Yen (Note 1)
2008 2008Jiro Sakan Auditor Loan ¥80 ¥80
Jiro Sakan was a director of the Chiba Keizai Kaihatsu Kosha Ltd. as a Related Party.Terms of transactions and policies of determinating the terms; Similar to the general cases
II. Related party transactions for the fi scal year ended March 31, 2009 were as follows: 1 Related party transactions (1) Transactions between the Bank and related parties Directors of the Bank or major shareholders (individuals only), etc.
Party Classifi cationName of company
or individualPercentage of voting rights
Relations with related party
Type of transaction
Amounts of the transactions
Account classifi cation
Balance at the end of year
Company held a majority by the close members of directors' respective families
Watanabereisyoku Co., Ltd. 0.00 — Lending
Average balance ¥405 million Loan ¥475 million
Terms of transactions and policies of determinating the terms; Similar to the general cases
(2) Transactions between subsidiaries of the Bank and related parties None 2 Notes to a parent company or major affi liated companies None
37. Cash Dividends Paid
I. Cash Dividends Paid for the fi scal year ended March 31, 2008 were as follows:
Resolution Category of sharesTotal amounts of
Cash Dividends Paid Cash Dividends per shareRecord Date Date of Effectuation
Millions of Yen (Note 1) Yen (Note 1)
Annual General Meeting, at June 28, 2007 Common stock ¥4,917 ¥5.50 March 31, 2007 June 29, 2007Board of Directors, at November 13, 2007 Common stock ¥4,916 ¥5.50 September 30, 2007 December 10, 2007
II. Cash Dividends Paid for the fi scal year ended March 31, 2009 were as follows:
Resolution Category of sharesTotal amounts of
Cash Dividends Paid Cash Dividends per shareRecord Date Date of Effectuation
Millions of Yen (Note 1) Yen (Note 1)
Annual General Meeting, at June 27, 2008 Common stock ¥4,916 ¥5.50 March 31, 2008 June 30, 2008Board of Directors, at November 14, 2008 Common stock ¥5,809 ¥6.50 September 30, 2008 December 10, 2008
III. Cash Dividends with the cut-off date in the fi scal year ended March 31, 2009 and the effective date in the fi scal year ending March 31, 2010 were as follows:
Approval Category of sharesTotal amounts of
Cash Dividends Paid Cash Dividends per shareRecord Date Date of Effectuation
Millions of Yen (Note 1) Yen (Note 1)
Annual General Meeting, at June 26, 2009 Common stock ¥4,022 ¥4.50 March 31, 2009 June 29, 2009

40 The Chiba Bank, Ltd.
Report of Independent Auditors

41 Annual Report 2009
Millions of YenThousands of U.S. Dollars
2009 2008 2009Assets
Cash and Due from Banks . . . . . . . . . . . . . . . . . . . . . . . . . . . . . . . . . . . . . . . . . . ¥ 329,727 ¥ 425,889 $ 3,356,690 Call Loans . . . . . . . . . . . . . . . . . . . . . . . . . . . . . . . . . . . . . . . . . . . . . . . . . . . . . . . . 30,000 7,980 305,406 Receivables under Securities Borrowing Transactions . . . . . . . . . . . . . . . . . . . . 10,350 22,081 105,366 Monetary Claims Bought . . . . . . . . . . . . . . . . . . . . . . . . . . . . . . . . . . . . . . . . . . . 46,751 55,577 475,938 Trading Assets . . . . . . . . . . . . . . . . . . . . . . . . . . . . . . . . . . . . . . . . . . . . . . . . . . . . 392,183 284,647 3,992,498 Money Held in Trust . . . . . . . . . . . . . . . . . . . . . . . . . . . . . . . . . . . . . . . . . . . . . . . 25,367 26,058 258,247 Securities . . . . . . . . . . . . . . . . . . . . . . . . . . . . . . . . . . . . . . . . . . . . . . . . . . . . . . . . 1,893,347 2,044,463 19,274,635 Loans and Bills Discounted . . . . . . . . . . . . . . . . . . . . . . . . . . . . . . . . . . . . . . . . . . 6,991,343 6,656,245 71,173,199 Foreign Exchanges . . . . . . . . . . . . . . . . . . . . . . . . . . . . . . . . . . . . . . . . . . . . . . . . 2,750 3,693 28,001 Other Assets. . . . . . . . . . . . . . . . . . . . . . . . . . . . . . . . . . . . . . . . . . . . . . . . . . . . . . 60,522 62,679 616,133 Tangible Fixed Assets . . . . . . . . . . . . . . . . . . . . . . . . . . . . . . . . . . . . . . . . . . . . . . 90,841 90,270 924,784 Intangible Fixed Assets . . . . . . . . . . . . . . . . . . . . . . . . . . . . . . . . . . . . . . . . . . . . . 8,131 7,466 82,778 Deferred Tax Assets . . . . . . . . . . . . . . . . . . . . . . . . . . . . . . . . . . . . . . . . . . . . . . . 82,716 42,576 842,069 Customers’ Liabilities for Acceptances and Guarantees . . . . . . . . . . . . . . . . . . 82,838 80,539 843,313 Allowance for Loan Losses . . . . . . . . . . . . . . . . . . . . . . . . . . . . . . . . . . . . . . . . . . (49,982) (43,625) (508,826)
Total Assets . . . . . . . . . . . . . . . . . . . . . . . . . . . . . . . . . . . . . . . . . . . . . . . . . . . . ¥9,996,889 ¥9,766,545 $101,770,229
LiabilitiesDeposits . . . . . . . . . . . . . . . . . . . . . . . . . . . . . . . . . . . . . . . . . . . . . . . . . . . . . . . . . ¥8,683,013 ¥8,529,101 $ 88,394,722 Call Money . . . . . . . . . . . . . . . . . . . . . . . . . . . . . . . . . . . . . . . . . . . . . . . . . . . . . . . 53,050 184,973 540,069 Payables under Repurchase Agreements . . . . . . . . . . . . . . . . . . . . . . . . . . . . . . 198,051 97,401 2,016,198 Payables under Securities Lending Transactions . . . . . . . . . . . . . . . . . . . . . . . . 67,291 81,105 685,041 Trading Liabilities . . . . . . . . . . . . . . . . . . . . . . . . . . . . . . . . . . . . . . . . . . . . . . . . . 18,720 16,617 190,577 Borrowed Money . . . . . . . . . . . . . . . . . . . . . . . . . . . . . . . . . . . . . . . . . . . . . . . . . . 247,479 80,901 2,519,389 Foreign Exchanges . . . . . . . . . . . . . . . . . . . . . . . . . . . . . . . . . . . . . . . . . . . . . . . . 436 516 4,447 Bonds Payable . . . . . . . . . . . . . . . . . . . . . . . . . . . . . . . . . . . . . . . . . . . . . . . . . . . . 40,000 40,000 407,208 Other Liabilities . . . . . . . . . . . . . . . . . . . . . . . . . . . . . . . . . . . . . . . . . . . . . . . . . . . 63,641 70,191 647,887 Provision for Directors’ Bonuses . . . . . . . . . . . . . . . . . . . . . . . . . . . . . . . . . . . . . 40 40 407 Provision for Retirement Benefi ts . . . . . . . . . . . . . . . . . . . . . . . . . . . . . . . . . . . . . 18,550 18,034 188,844 Provision for Directors’ Retirement Benefi ts . . . . . . . . . . . . . . . . . . . . . . . . . . . . 1,148 1,360 11,696 Provision for Reimbursement of Deposits . . . . . . . . . . . . . . . . . . . . . . . . . . . . . . 962 996 9,803 Provision for Point Loyalty Programs . . . . . . . . . . . . . . . . . . . . . . . . . . . . . . . . . . 349 330 3,556 Deferred Tax Liabilities for Land Revaluation . . . . . . . . . . . . . . . . . . . . . . . . . . . 15,323 15,323 155,994 Acceptances and Guarantees . . . . . . . . . . . . . . . . . . . . . . . . . . . . . . . . . . . . . . . 82,838 80,539 843,313
Total Liabilities . . . . . . . . . . . . . . . . . . . . . . . . . . . . . . . . . . . . . . . . . . . . . . . . . ¥9,490,899 ¥9,217,433 $ 96,619,151
Net AssetsCapital Stock . . . . . . . . . . . . . . . . . . . . . . . . . . . . . . . . . . . . . . . . . . . . . . . . . . . . . ¥ 145,069 ¥ 145,069 $ 1,476,831 Capital Surplus . . . . . . . . . . . . . . . . . . . . . . . . . . . . . . . . . . . . . . . . . . . . . . . . . . . . 122,134 122,151 1,243,348 Retained Earnings . . . . . . . . . . . . . . . . . . . . . . . . . . . . . . . . . . . . . . . . . . . . . . . . . 267,399 266,817 2,722,174
Legal Retained Earnings . . . . . . . . . . . . . . . . . . . . . . . . . . . . . . . . . . . . . . . . . . 50,930 50,930 518,479 Other Retained Earnings. . . . . . . . . . . . . . . . . . . . . . . . . . . . . . . . . . . . . . . . . . 216,468 215,887 2,203,695
Treasury Stock . . . . . . . . . . . . . . . . . . . . . . . . . . . . . . . . . . . . . . . . . . . . . . . . . . . . (1,219) (1,217) (12,418)Total Shareholders’ Equity . . . . . . . . . . . . . . . . . . . . . . . . . . . . . . . . . . . . . . 533,382 532,820 5,429,936
Valuation Difference on Available-for-sale Securities . . . . . . . . . . . . . . . . . . . . (33,331) 8,214 (339,324)Deferred Gains or Losses on Hedges . . . . . . . . . . . . . . . . . . . . . . . . . . . . . . . . . (1,837) 300 (18,710)Revaluation Reserve for Land . . . . . . . . . . . . . . . . . . . . . . . . . . . . . . . . . . . . . . . . 7,777 7,777 79,176
Total Valuation and Translation Adjustments . . . . . . . . . . . . . . . . . . . . . . . (27,392) 16,291 (278,858)Total Net Assets . . . . . . . . . . . . . . . . . . . . . . . . . . . . . . . . . . . . . . . . . . . . . . . . ¥ 505,990 ¥ 549,111 $ 5,151,078 Total Liabilities and Net Assets . . . . . . . . . . . . . . . . . . . . . . . . . . . . . . . . . . . . ¥9,996,889 ¥9,766,545 $101,770,229
Non-Consolidated Balance Sheets (Unaudited)The Chiba Bank, Ltd.As of March 31, 2009 and 2008

42 The Chiba Bank, Ltd.
Millions of YenThousands of U.S. Dollars
2009 2008 2009Income
Interest Income:
Interest on Loans and Discounts . . . . . . . . . . . . . . . . . . . . . . . . . . . . . . . . . . . ¥148,718 ¥143,505 $1,513,978
Interest and Dividends on Securities . . . . . . . . . . . . . . . . . . . . . . . . . . . . . . . . 29,165 38,150 296,910
Other Interest Income . . . . . . . . . . . . . . . . . . . . . . . . . . . . . . . . . . . . . . . . . . . . 2,634 3,249 26,816
Trust Fees . . . . . . . . . . . . . . . . . . . . . . . . . . . . . . . . . . . . . . . . . . . . . . . . . . . . . . . . 5 8 56
Fees and Commissions . . . . . . . . . . . . . . . . . . . . . . . . . . . . . . . . . . . . . . . . . . . . . 31,883 34,607 324,584
Trading Income . . . . . . . . . . . . . . . . . . . . . . . . . . . . . . . . . . . . . . . . . . . . . . . . . . . 4,799 3,439 48,860
Other Ordinary Income . . . . . . . . . . . . . . . . . . . . . . . . . . . . . . . . . . . . . . . . . . . . . 5,708 6,234 58,109
Other Income . . . . . . . . . . . . . . . . . . . . . . . . . . . . . . . . . . . . . . . . . . . . . . . . . . . . . 11,228 18,480 114,310
Total Income . . . . . . . . . . . . . . . . . . . . . . . . . . . . . . . . . . . . . . . . . . . . . . . . . . . ¥234,143 ¥247,674 $2,383,623
Expenses
Interest Expenses:
Interest on Deposits . . . . . . . . . . . . . . . . . . . . . . . . . . . . . . . . . . . . . . . . . . . . . ¥ 24,265 ¥ 31,024 $ 247,031
Interest on Borrowings and Rediscounts . . . . . . . . . . . . . . . . . . . . . . . . . . . . . 3,979 4,318 40,513
Other Interest Expenses . . . . . . . . . . . . . . . . . . . . . . . . . . . . . . . . . . . . . . . . . . 5,674 10,121 57,764
Fees and Commissions Payments . . . . . . . . . . . . . . . . . . . . . . . . . . . . . . . . . . . . 16,500 16,164 167,975
Trading Expenses . . . . . . . . . . . . . . . . . . . . . . . . . . . . . . . . . . . . . . . . . . . . . . . . . — 66 —
Other Ordinary Expenses . . . . . . . . . . . . . . . . . . . . . . . . . . . . . . . . . . . . . . . . . . . 30,380 4,412 309,281
General and Administrative Expenses . . . . . . . . . . . . . . . . . . . . . . . . . . . . . . . . . 81,706 80,503 831,786
Other Expenses . . . . . . . . . . . . . . . . . . . . . . . . . . . . . . . . . . . . . . . . . . . . . . . . . . . 60,086 23,791 611,691
Total Expenses . . . . . . . . . . . . . . . . . . . . . . . . . . . . . . . . . . . . . . . . . . . . . . . . . ¥222,593 ¥170,402 $2,266,041
Income before Income Taxes . . . . . . . . . . . . . . . . . . . . . . . . . . . . . . . . . . . . . . . . 11,550 77,272 117,582
Income Taxes-Current . . . . . . . . . . . . . . . . . . . . . . . . . . . . . . . . . . . . . . . . . . . . . . 11,652 28,511 118,628
Income Taxes-Deferred . . . . . . . . . . . . . . . . . . . . . . . . . . . . . . . . . . . . . . . . . . . . (11,427) 4,081 (116,330)
Net Income . . . . . . . . . . . . . . . . . . . . . . . . . . . . . . . . . . . . . . . . . . . . . . . . . . . . ¥ 11,324 ¥ 44,678 $ 115,285
Non-Consolidated Statements of Income (Unaudited)The Chiba Bank, Ltd.For the years ended March 31, 2009 and 2008

43 Annual Report 2009
Millions of YenThousands of U.S. Dollars
2009 2008 2009Tier I:
Common Stock . . . . . . . . . . . . . . . . . . . . . . . . . . . . . . . . . . . . . . . . . . . . . . . . . . . ¥ 145,069 ¥ 145,069 $ 1,476,831
Capital Surplus . . . . . . . . . . . . . . . . . . . . . . . . . . . . . . . . . . . . . . . . . . . . . . . . . . . . 123,387 123,404 1,256,105
Retained Earnings . . . . . . . . . . . . . . . . . . . . . . . . . . . . . . . . . . . . . . . . . . . . . . . . . 285,233 283,583 2,903,729
Treasury Stock . . . . . . . . . . . . . . . . . . . . . . . . . . . . . . . . . . . . . . . . . . . . . . . . . . . . (1,219) (1,217) (12,418)
Expected Outfl ow from Net Assets . . . . . . . . . . . . . . . . . . . . . . . . . . . . . . . . . . . (4,738) (5,737) (48,235)
Minority Interests in Consolidated Subsidiaries . . . . . . . . . . . . . . . . . . . . . . . . . 12,465 12,311 126,904
Net Unrealized Losses on Other Securities . . . . . . . . . . . . . . . . . . . . . . . . . . . . . (29,873) — (304,121)
Foreign Currency Translation Adjustments . . . . . . . . . . . . . . . . . . . . . . . . . . . . . (0) 1 (0)
Amount Equivalent to capital increase due to Securitization Transaction . . . . (86) (90) (883)
50% of Expected Loss exceeding Eligible Provisions . . . . . . . . . . . . . . . . . . . . (5,034) (14,704) (51,251)
Total Tier I Capital . . . . . . . . . . . . . . . . . . . . . . . . . . . . . . . . . . . . . . . . . . . . . . . ¥ 525,202 ¥ 542,620 $ 5,346,660
Tier II:
45% of Unrealized Gains on Other Securities . . . . . . . . . . . . . . . . . . . . . . . . . . . ¥ — ¥ 6,267 $ —
45% of Land Revaluation Excess . . . . . . . . . . . . . . . . . . . . . . . . . . . . . . . . . . . . . 10,395 10,395 105,827
General Allowance for Loan Losses . . . . . . . . . . . . . . . . . . . . . . . . . . . . . . . . . . . 1,653 582 16,834
Qualifying Subordinated Debt . . . . . . . . . . . . . . . . . . . . . . . . . . . . . . . . . . . . . . . 79,000 78,000 804,235
Total Tier II Capital . . . . . . . . . . . . . . . . . . . . . . . . . . . . . . . . . . . . . . . . . . . . . . ¥ 91,048 ¥ 95,244 $ 926,895
Deductions from Capital . . . . . . . . . . . . . . . . . . . . . . . . . . . . . . . . . . . . . . . . . . . . . . ¥ 11,781 ¥ 20,081 $ 119,941
Total Capital . . . . . . . . . . . . . . . . . . . . . . . . . . . . . . . . . . . . . . . . . . . . . . . . . . . . ¥ 604,469 ¥ 617,783 $ 6,153,614
Risk-Weighted Assets, etc.:
Credit Risk . . . . . . . . . . . . . . . . . . . . . . . . . . . . . . . . . . . . . . . . . . . . . . . . . . . . . . . ¥4,747,941 ¥4,665,389 $48,334,944
On-Balance-Sheet Items . . . . . . . . . . . . . . . . . . . . . . . . . . . . . . . . . . . . . . . . . . 4,484,011 4,400,102 45,648,088
Off-Balance-Sheet Items, etc . . . . . . . . . . . . . . . . . . . . . . . . . . . . . . . . . . . . . . 263,929 265,287 2,686,855
Asset Equivalent of Market Risk . . . . . . . . . . . . . . . . . . . . . . . . . . . . . . . . . . . . . . 86,780 64,807 883,439
Asset Equivalent of Operational Risk . . . . . . . . . . . . . . . . . . . . . . . . . . . . . . . . . . 327,598 315,655 3,335,011
Floor Adjustment . . . . . . . . . . . . . . . . . . . . . . . . . . . . . . . . . . . . . . . . . . . . . . . . . . — 14,405 —
Total Risk-Weighted Assets . . . . . . . . . . . . . . . . . . . . . . . . . . . . . . . . . . . . . . . ¥5,162,319 ¥5,060,257 $52,553,394
Capital Ratio (BIS guidelines) . . . . . . . . . . . . . . . . . . . . . . . . . . . . . . . . . . . . . . . . . . 11.70% 12.20% 11.70%
Supplementary Information (Unaudited)The Chiba Bank, Ltd. and Consolidated SubsidiariesAs of March 31, 2009 and 2008
Japanese yen amounts are presented in millions of yen by rounding down figures below one million. As a result, the totals in Japanese yen in the accompanying consoli-dated financial statements do not necessarily agree with the sums of individual amounts. U.S. dollar amounts are shown solely for the convenience of the readers of this Annual Report and are translated at the rate of ¥98.23 to $1.00, the exchange rate prevail-ing at March 31, 2009. The following approaches were adopted to calculate the capital ratio. Credit Risk: Foundation Internal Ratings Based Approach (using ratings for risk measurement) Operational risk: the Standardized Approach (Gross Profits of every business line multiplied by the predetermined rate)
Capital Ratio (BIS Guidelines) (Consolidated)

44 The Chiba Bank, Ltd.
Millions of Yen
2009 2008Outstanding Balance Composition Outstanding Balance Composition
Domestic operations:
Manufacturing . . . . . . . . . . . . . . . . . . . . . . . . . . . . . . . . . . . . . ¥ 716,172 10.37% ¥ 524,515 7.95%
Agriculture . . . . . . . . . . . . . . . . . . . . . . . . . . . . . . . . . . . . . . . . 6,507 0.09% 7,319 0.11%
Forestry . . . . . . . . . . . . . . . . . . . . . . . . . . . . . . . . . . . . . . . . . . . 1 0.00% 2 0.00%
Fisheries . . . . . . . . . . . . . . . . . . . . . . . . . . . . . . . . . . . . . . . . . . 1,289 0.02% 1,501 0.02%
Mining . . . . . . . . . . . . . . . . . . . . . . . . . . . . . . . . . . . . . . . . . . . . 17,310 0.25% 11,349 0.17%
Construction . . . . . . . . . . . . . . . . . . . . . . . . . . . . . . . . . . . . . . . 338,380 4.90% 314,618 4.77%
Electricity, Gas, Heat Supply and Water . . . . . . . . . . . . . . . . 16,084 0.23% 37,214 0.56%
Information and Communications . . . . . . . . . . . . . . . . . . . . . 37,321 0.54% 32,018 0.49%
Transportation . . . . . . . . . . . . . . . . . . . . . . . . . . . . . . . . . . . . . 208,511 3.02% 188,846 2.86%
Wholesale and Retail Trade . . . . . . . . . . . . . . . . . . . . . . . . . . 661,212 9.57% 616,411 9.34%
Finance and Insurance . . . . . . . . . . . . . . . . . . . . . . . . . . . . . . 329,215 4.76% 260,590 3.95%
Real Estate . . . . . . . . . . . . . . . . . . . . . . . . . . . . . . . . . . . . . . . . 1,441,899 20.87% 1,469,714 22.27%
Various Services . . . . . . . . . . . . . . . . . . . . . . . . . . . . . . . . . . . . 581,799 8.42% 564,207 8.55%
Government and Local Public Sector . . . . . . . . . . . . . . . . . . 146,446 2.12% 295,224 4.48%
Others (Mainly Consumer Loans) . . . . . . . . . . . . . . . . . . . . . . 2,407,494 34.84% 2,274,873 34.48%
Total . . . . . . . . . . . . . . . . . . . . . . . . . . . . . . . . . . . . . . . . . . . . . . . ¥6,909,647 100.00% ¥6,598,406 100.00%
Overseas Operations and JOM Account . . . . . . . . . . . . . . . . . ¥ 45,976 — ¥ 26,280 —
Loans and Bills Discounted, Borrower Classifi cation by Industry (Consolidated)

45 Annual Report 2009
Directors, Auditors and Executive Offi cers
The Chiba Bank, Ltd.As of July 1, 2009
Directors
Chairman
Tadashi Takeyama
President (Representing Director)
Hidetoshi Sakuma
Director and Senior Executive Officer(Representing Director)
Katsuhiko WatanabeHead of Business Promotion UnitExecutive Officer in charge of Business Planning Division, Branch Support Division and Business Promotion Division
Director and Senior Executive Officer(Representing Director)
Tadashi ItoHead of Corporate Planning and Administration UnitExecutive Officer in charge of Corporate Planning Division, Public Relations Division, General Secretariat and Personnel Division
Director and Senior Executive Officer
Masahisa ShiizuHead of Credit UnitExecutive Officer in charge of Credit Division, Business Support Division and Credit Supervisory Division
Director and Managing Executive Officer
Tadashi AbeExecutive Officer in charge of Audit and Inspection Division
Director and Managing Executive Officer
Tsutomu NozawaExecutive Officer in charge of Operation Planning Division, EDP System Division, Business Operation Division and Operation Division
Director and Managing Executive Officer
Katsumi IchiharaExecutive Officer in charge of Treasury Division and Treasury Operation Division
Director and Executive Officer
Takashi SudaExecutive Officer in charge of Risk Management Division, Compliance Division and General Administration Division
Executive Officers
Managing Executive Officer
Yasuo TakahashiGeneral Manager, Funabashi Branch
Managing Executive Officer
Yoshiro NakajimaGeneral Manager, Chuo Branch
Executive Officer
Shinshichi MarushimaGeneral Manager, Head Office
Executive Officer
Tetsuya KoikeGeneral Manager, Kashiwa Branch
Executive Officer
Kyoichi HanashimaGeneral Manager, Credit Division
Executive Officer
Kazuyasu KuriharaGeneral Manager, Business Planning Division
Executive Officer
Toshikazu OkuboGeneral Manager, Corporate Planning Division
Executive Officer
Takayuki MiyazawaGeneral Manager, Branch Support Division
Executive Officer
Masao MorimotoGeneral Manager, EDP System Division
Executive Officer
Yoshinobu SakamaGeneral Manager, Business Promotion Division
Corporate Auditors
Standing Corporate Auditor
Tetsuhiro Kashima
Standing Corporate Auditor
Yukio Saruhashi
Standing Corporate Auditor
Junichiro Seo
Corporate Auditor
Jiro Sakan
Corporate Auditor
Hideo Tanabe

46 The Chiba Bank, Ltd.
The Chiba Bank, Ltd.As of July 1, 2009
Organization
Corporate Auditors
Board of Corporate Auditors
Business Promotion Unit
General Meeting of Shareholders
Board of Designated Directors
Board of Directors
Staff
Business Planning Division
Branch Support Division
Business Promotion Division
Treasury Division
Overseas Representative Office
Treasury Operation Division
Operation Planning Division
EDP System Division
Business Operation Division
Operation Division
Corporate Planning and Administration Unit
Corporate Planning Division
Tokyo Liaison Office
Risk Management Division
Compliance Division
Public Relations Division
General Administration Division
General Secretariat
Personnel Division
Audit and Inspection Division
Credit Unit
Credit Division
Business Support Division
Credit Supervisory Division
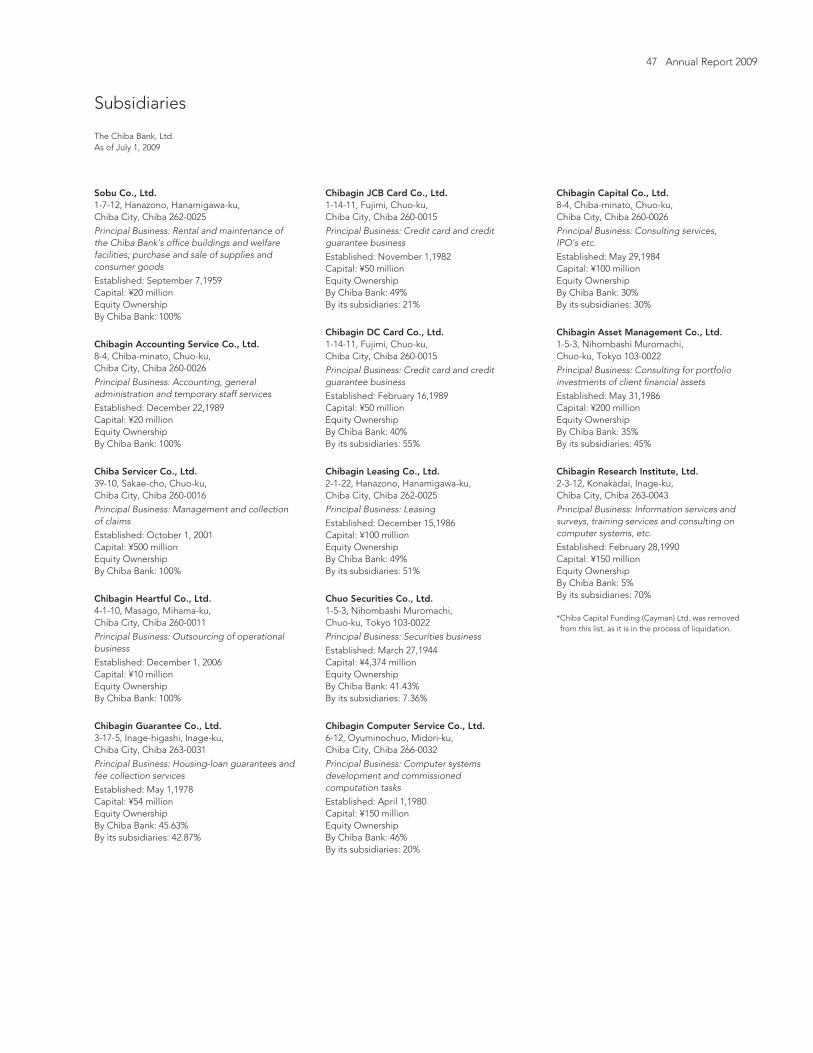
47 Annual Report 2009
Subsidiaries
Sobu Co., Ltd.1-7-12, Hanazono, Hanamigawa-ku,Chiba City, Chiba 262-0025
Principal Business: Rental and maintenance of the Chiba Bank’s office buildings and welfare facilities; purchase and sale of supplies and consumer goods
Established: September 7,1959Capital: ¥20 millionEquity OwnershipBy Chiba Bank: 100%
Chibagin Accounting Service Co., Ltd.8-4, Chiba-minato, Chuo-ku, Chiba City, Chiba 260-0026
Principal Business: Accounting, general administration and temporary staff services
Established: December 22,1989Capital: ¥20 millionEquity OwnershipBy Chiba Bank: 100%
Chiba Servicer Co., Ltd.39-10, Sakae-cho, Chuo-ku, Chiba City, Chiba 260-0016
Principal Business: Management and collection of claims
Established: October 1, 2001Capital: ¥500 millionEquity OwnershipBy Chiba Bank: 100%
Chibagin Heartful Co., Ltd.4-1-10, Masago, Mihama-ku, Chiba City, Chiba 260-0011
Principal Business: Outsourcing of operational business
Established: December 1, 2006Capital: ¥10 millionEquity OwnershipBy Chiba Bank: 100%
Chibagin Guarantee Co., Ltd.3-17-5, Inage-higashi, Inage-ku, Chiba City, Chiba 263-0031
Principal Business: Housing-loan guarantees and fee collection services
Established: May 1,1978Capital: ¥54 millionEquity OwnershipBy Chiba Bank: 45.63%By its subsidiaries: 42.87%
Chibagin JCB Card Co., Ltd.1-14-11, Fujimi, Chuo-ku, Chiba City, Chiba 260-0015
Principal Business: Credit card and credit guarantee business
Established: November 1,1982Capital: ¥50 millionEquity OwnershipBy Chiba Bank: 49%By its subsidiaries: 21%
Chibagin DC Card Co., Ltd.1-14-11, Fujimi, Chuo-ku, Chiba City, Chiba 260-0015
Principal Business: Credit card and credit guarantee business
Established: February 16,1989Capital: ¥50 millionEquity OwnershipBy Chiba Bank: 40%By its subsidiaries: 55%
Chibagin Leasing Co., Ltd.2-1-22, Hanazono, Hanamigawa-ku, Chiba City, Chiba 262-0025
Principal Business: Leasing
Established: December 15,1986Capital: ¥100 millionEquity OwnershipBy Chiba Bank: 49%By its subsidiaries: 51%
Chuo Securities Co., Ltd.1-5-3, Nihombashi Muromachi, Chuo-ku, Tokyo 103-0022
Principal Business: Securities business
Established: March 27,1944Capital: ¥4,374 millionEquity OwnershipBy Chiba Bank: 41.43%By its subsidiaries: 7.36%
Chibagin Computer Service Co., Ltd.6-12, Oyuminochuo, Midori-ku, Chiba City, Chiba 266-0032
Principal Business: Computer systems development and commissioned computation tasks
Established: April 1,1980Capital: ¥150 millionEquity OwnershipBy Chiba Bank: 46%By its subsidiaries: 20%
Chibagin Capital Co., Ltd.8-4, Chiba-minato, Chuo-ku, Chiba City, Chiba 260-0026
Principal Business: Consulting services, IPO's etc.
Established: May 29,1984Capital: ¥100 millionEquity OwnershipBy Chiba Bank: 30%By its subsidiaries: 30%
Chibagin Asset Management Co., Ltd.1-5-3, Nihombashi Muromachi, Chuo-ku, Tokyo 103-0022
Principal Business: Consulting for portfolio investments of client financial assets
Established: May 31,1986Capital: ¥200 millionEquity OwnershipBy Chiba Bank: 35%By its subsidiaries: 45%
Chibagin Research Institute, Ltd.2-3-12, Konakadai, Inage-ku, Chiba City, Chiba 263-0043
Principal Business: Information services and surveys, training services and consulting on computer systems, etc.
Established: February 28,1990Capital: ¥150 millionEquity OwnershipBy Chiba Bank: 5%By its subsidiaries: 70%
* Chiba Capital Funding (Cayman) Ltd. was removed from this list, as it is in the process of liquidation.
The Chiba Bank, Ltd.As of July 1, 2009
48 The Chiba Bank, Ltd.
International Directory
Head Office
1-2, Chiba-minato, Chuo-ku,
Chiba City, Chiba 260-8720, Japan
Telephone: 81-43-245-1111
http://www.chibabank.co.jp/
Treasury Operation Division
5-3, Nihombashi Muromachi 1-chome,
Chuo-ku, Tokyo 103-0022, Japan
Telephone: 81-3-3270-8459
Fax: 81-3-3242-1735
81-3-3271-1029
SWIFT Address: CHBA JPJT
Treasury Division
5-3, Nihombashi Muromachi 1-chome,
Chuo-ku, Tokyo 103-0022, Japan
Telephone: 81-3-3231-1285
Fax: 81-3-3242-1736
SWIFT Address: CHBA JPJT
New York Branch
1133 Avenue of the Americas, 15th Floor,
New York, N.Y. 10036, U.S.A.
Telephone: 1-212-354-7777
Fax: 1-212-354-8575
Telex: 251829 CHIBA NYK
Hong Kong Branch
Unit 2510, One Pacific Place, 88 Queensway, Hong Kong
Telephone: 852-2840-1222
Fax: 852-2840-0507
Telex: 62737 CHBK HX
SWIFT Address: CHBAHKHH
London Branch
3rd Floor, Atlas House, 1 King Street,
London EC2V 8AU, U.K.
Telephone: 44-20-7315-3111
Fax: 44-20-7600-3452
SWIFT Address: CHBAGB2L
Shanghai Representative Office
Room 707, Shanghai International Trade Center,
2201 Yan-An Road (West), Shanghai, P.R.C. 200336
Telephone: 86-21-62780482
Fax: 86-21-62780422
The Chiba Bank, Ltd.As of July 1, 2009

Major Operating Indicators
Deposits*1 ¥ 8.5 trillion 2nd of Regional Banks
Loans Outstanding*2 ¥ 6.9 trillion 2nd of Regional Banks
Net Income ¥12.4 billion
Capital Ratio 11.7 %
Credit Ratings
L: A S: A-1
L: A1 S: P-1
L: AA- S: - L: Long-term
S: Short-term*1 Non-consolidated, excluding NCD*2 Non-consolidated
Standard & Poor’s
Moody’s
Rating and Investment Information
Chiba Prefecture, our operating base, is located in the Tokyo Metropolitan Area.
The total prefectural income of this area, consisting of Tokyo, Chiba, Saitama and
Kanagawa, is over 30 percent of the national fi gure. And Chiba Prefecture is one
of Japan’s leading prefectures in terms of shipments, production and marketing
in sectors such as commerce, manufacturing, fi sheries and agriculture. In terms
of industrial profi le, too, Chiba Prefecture has a very balanced economy.
With a population of over 6.1 million people, Chiba Prefecture has great
potential as an operating base. We can expect further sustained growth in the
future in light of the population growth rate, one of Japan’s highest.
Chiba Prefecture is an important industrial and economic base and gate-
way into Japan by air and sea. Narita International Airport and Chiba Port are
international trade ports whose volume of goods handled are the largest and
second-largest, respectively, in Japan.
More recently, with the development of tourism in the prefecture, and the
emergence of venture businesses to carry the local economy into the future,
Chiba Prefecture is one of Japan’s most promising domestic markets.
Our Operating Area
The Chiba Bank is the dominant bank in Chiba Prefecture. As such,
it is dedicated to providing high-quality fi nancial services, increasing
customer satisfaction and contributing to regional development.
As a regional comprehensive financial services provider, it is
pursuing various initiatives in a new spirit of fl exibility and imagina-
tion, to win the highest-possible esteem of the region’s customers,
shareholders and investors.
As of March 31, 2009, the Group comprised the Bank and its
14 subsidiaries. Chiba Bank operates 172 domestic outlets and
provides access to 28,582 ATMs. Overseas, the Bank has three
branches and one representative offi ce.
Chiba Bank Profi le
450
500
550
600
650
-0.6
3.0
4.0
2.0
1.0
0
Japan
Chiba
Population of Chiba Prefecture(10 thousand)
Rates of Population Change(‰)
Business Share of Banks Operating inChiba (As of March 31, 2008)(%)
22.9
36.9
24.2
19.5
8.6
5.88.4
6.5
12.1
Chiba Bank
Regional Banks (excluding Chiba Bank)
Second-tier Regional Banks
JA Banks, other
Source: MONTHLY KINYU JOURNAL
Japan Post Bank
Shinkin Banks
City Banks
9.0
’90
’04
555
2.8
0.7
’95
’05
579
1.6
-0.1
’00
’06
592
2.8
0.0 0.0
’05
’07
605
4.0
’07
’08
610
3.9
-0.6
’08
612
A
A
B
B
C
C
D
D
E
E
F
G
23.2
8.8
DepositsTotal:
¥35.2 trillion
NaritaMakuhariTokyo
Kanagawa Prefecture
Saitama Prefecture
Ibaraki Prefecture
Chiba
ChibaPrefecture
LoansTotal:
¥14.1 trillion
F
14.1
A
C
D
F G
E
B
Corporate Data
Principal ShareholdersThe ten largest shareholders of Chiba Bank and their respective shareholdings as of March 31, 2009 were as follows:
Number of Shares (in thousands)*
Percentage of Total Shares in Issue**
Japan Trustee Services Bank, Ltd. (Trust Account) ................................................................ 70,928 7.92%
Japan Trustee Services Bank, Ltd. (Trust Account 4G) .......................................................... 50,325 5.61%
The Master Trust Bank of Japan, Ltd. (Trust Account) .......................................................... 49,987 5.58%
The Bank of Tokyo-Mitsubishi UFJ, Ltd. ................................................................................ 44,158 4.93%
NIPPONKOA Insurance Co., Ltd. ........................................................................................... 29,905 3.33%
Nippon Life Insurance Company............................................................................................. 29,177 3.25%
The Dai-ichi Mutual Life Insurance Company ........................................................................ 25,678 2.86%
Sumitomo Life Insurance Company ........................................................................................ 17,842 1.99%
Meiji Yasuda Life Insurance Company .................................................................................... 15,579 1.73%
THE CHASE MANHATTAN BANK, N. A. LONDON SECS LENDING OMNIBUS ACCOUNT ................................................... 13,331 1.48%
* Rounded down to the nearest thousand** Rounded to two decimal places
Corporate Information
Established March 1943
Network Domestic 172 Offices (151 branches, 19 sub-branches and 2 virtual branches) 28,582 Off-branch ATM locations ( 9,454 E-net ATM locations at convenience stores, 6,053 LAWSON ATM locations at
convenience stores and 12,814 ATM locations jointly with Seven Bank, Ltd.)3 Money exchange counters
Overseas 3 Branches (New York/Hong Kong/London)1 Representative office (Shanghai)
Number of Employees* 4,081
Total Assets ¥9,996.8 billion
Loans and Bills Discounted ¥6,991.3 billion
Deposits (including NCD) ¥8,683.0 billion
Common Stock ¥145.0 billion
Capital Ratio (BIS guidelines) 11.12% (Non-consolidated) 11.70% (Consolidated)
Authorized Number of Shares 2,500,000 thousand
Number of Issued Shares 895,521 thousand
Number of Shareholders** 28,076
Ticker Code 8331
Transfer Agent Japan Securities Agents, Ltd.1-2-4, Nihombashi Kayabacho Chuo-ku, Tokyo 103-8202
Long-term Short-term
Credit Ratings (As of July 1, 2009) Standard & Poor’s A A-1
Moody’s A1 P-1
Rating and Investment Information, Inc. AA- —
Figures as shown are presented on a non-consolidated basis.* Number of Employees includes transferred employees but excludes temporary staff and one-year contract employees.** Shareholders with fewer than 1,000 shares are excluded.
The Chiba Bank, Ltd.As of March 31, 2009
49 Annual Report 2009
Printed in JapanThis annual report is printed on using soy ink.
1-2, Chiba-minato, Chuo-ku, Chiba City, Chiba 260-8720, Japan
Telephone: 81-43-245-1111
e-mail: [email protected]
http://www.chibabank.co.jp/
Financial HighlightsMessage from the PresidentThe Medium-Term Management Plan “1st1st”Retail Banking Corporate BankingExpanding Our NetworkImproving Effi ciencyCorporate GovernanceComplianceImprove the Development of Human ResourcesContributing to the Environment and the Local Community Financial SectionFive-Year Summary (Consolidated)Management’s Discussion and Analysis (Consolidated)Asset QualityRisk Management Consolidated Balance SheetsConsolidated Statements of IncomeConsolidated Statements of Changes in Net AssetsConsolidated Statements of Cash FlowsNotes to Consolidated Financial StatementsReport of Independent AuditorsNon-Consolidated Balance Sheets (Unaudited)Non-Consolidated Statements of Income (Unaudited)Supplementary Information (Unaudited)Directors, Auditors and Executive Offi cersOrganizationSubsidiariesInternational Directory Corporate Data
010205060708080910111213131416182223242526404142434546474849
Contents
Forward-Looking StatementsThis annual report contains forward-looking statements concerning Chiba Bank's future plans, strategies and performance. These forward-looking statements are not guarantees of future performance and involve risks and uncertainties, and actual results may materially differ from those contained in the forward-looking statements as a result of various factors. Important factors that might cause such a material difference include, but are not limited to, those economic conditions referred to in this annual report as assumptions. In addition, the following are among the factors that could cause actual results to differ materially from the forward-looking statements in this annual report: business conditions in the banking industry, the regulatory environment, new legislation, competition with other financial services companies, changing technology and evolving banking industry standards.
FIRST IN THE HEARTS OF CUSTOMERS, FIRST IN OUR REGION
The Chiba Bank, Ltd. Annual Report 2009Year ended March 31, 2009
The Chib
a Bank, Ltd
. Annual R
epo
rt 2009

Major Operating Indicators
Deposits*1 ¥ 8.5 trillion 2nd of Regional Banks
Loans Outstanding*2 ¥ 6.9 trillion 2nd of Regional Banks
Net Income ¥12.4 billion
Capital Ratio 11.7 %
Credit Ratings
L: A S: A-1
L: A1 S: P-1
L: AA- S: - L: Long-term
S: Short-term*1 Non-consolidated, excluding NCD*2 Non-consolidated
Standard & Poor’s
Moody’s
Rating and Investment Information
Chiba Prefecture, our operating base, is located in the Tokyo Metropolitan Area.
The total prefectural income of this area, consisting of Tokyo, Chiba, Saitama and
Kanagawa, is over 30 percent of the national fi gure. And Chiba Prefecture is one
of Japan’s leading prefectures in terms of shipments, production and marketing
in sectors such as commerce, manufacturing, fi sheries and agriculture. In terms
of industrial profi le, too, Chiba Prefecture has a very balanced economy.
With a population of over 6.1 million people, Chiba Prefecture has great
potential as an operating base. We can expect further sustained growth in the
future in light of the population growth rate, one of Japan’s highest.
Chiba Prefecture is an important industrial and economic base and gate-
way into Japan by air and sea. Narita International Airport and Chiba Port are
international trade ports whose volume of goods handled are the largest and
second-largest, respectively, in Japan.
More recently, with the development of tourism in the prefecture, and the
emergence of venture businesses to carry the local economy into the future,
Chiba Prefecture is one of Japan’s most promising domestic markets.
Our Operating Area
The Chiba Bank is the dominant bank in Chiba Prefecture. As such,
it is dedicated to providing high-quality fi nancial services, increasing
customer satisfaction and contributing to regional development.
As a regional comprehensive financial services provider, it is
pursuing various initiatives in a new spirit of fl exibility and imagina-
tion, to win the highest-possible esteem of the region’s customers,
shareholders and investors.
As of March 31, 2009, the Group comprised the Bank and its
14 subsidiaries. Chiba Bank operates 172 domestic outlets and
provides access to 28,582 ATMs. Overseas, the Bank has three
branches and one representative offi ce.
Chiba Bank Profi le
450
500
550
600
650
-0.6
3.0
4.0
2.0
1.0
0
Japan
Chiba
Population of Chiba Prefecture(10 thousand)
Rates of Population Change(‰)
Business Share of Banks Operating inChiba (As of March 31, 2008)(%)
22.9
36.9
24.2
19.5
8.6
5.88.4
6.5
12.1
Chiba Bank
Regional Banks (excluding Chiba Bank)
Second-tier Regional Banks
JA Banks, other
Source: MONTHLY KINYU JOURNAL
Japan Post Bank
Shinkin Banks
City Banks
9.0
’90
’04
555
2.8
0.7
’95
’05
579
1.6
-0.1
’00
’06
592
2.8
0.0 0.0
’05
’07
605
4.0
’07
’08
610
3.9
-0.6
’08
612
A
A
B
B
C
C
D
D
E
E
F
G
23.2
8.8
DepositsTotal:
¥35.2 trillion
NaritaMakuhariTokyo
Kanagawa Prefecture
Saitama Prefecture
Ibaraki Prefecture
Chiba
ChibaPrefecture
LoansTotal:
¥14.1 trillion
F
14.1
A
C
D
F G
E
B
Corporate Data
Principal ShareholdersThe ten largest shareholders of Chiba Bank and their respective shareholdings as of March 31, 2009 were as follows:
Number of Shares (in thousands)*
Percentage of Total Shares in Issue**
Japan Trustee Services Bank, Ltd. (Trust Account) ................................................................ 70,928 7.92%
Japan Trustee Services Bank, Ltd. (Trust Account 4G) .......................................................... 50,325 5.61%
The Master Trust Bank of Japan, Ltd. (Trust Account) .......................................................... 49,987 5.58%
The Bank of Tokyo-Mitsubishi UFJ, Ltd. ................................................................................ 44,158 4.93%
NIPPONKOA Insurance Co., Ltd. ........................................................................................... 29,905 3.33%
Nippon Life Insurance Company............................................................................................. 29,177 3.25%
The Dai-ichi Mutual Life Insurance Company ........................................................................ 25,678 2.86%
Sumitomo Life Insurance Company ........................................................................................ 17,842 1.99%
Meiji Yasuda Life Insurance Company .................................................................................... 15,579 1.73%
THE CHASE MANHATTAN BANK, N. A. LONDON SECS LENDING OMNIBUS ACCOUNT ................................................... 13,331 1.48%
* Rounded down to the nearest thousand** Rounded to two decimal places
Corporate Information
Established March 1943
Network Domestic 172 Offices (151 branches, 19 sub-branches and 2 virtual branches) 28,582 Off-branch ATM locations ( 9,454 E-net ATM locations at convenience stores, 6,053 LAWSON ATM locations at
convenience stores and 12,814 ATM locations jointly with Seven Bank, Ltd.)3 Money exchange counters
Overseas 3 Branches (New York/Hong Kong/London)1 Representative office (Shanghai)
Number of Employees* 4,081
Total Assets ¥9,996.8 billion
Loans and Bills Discounted ¥6,991.3 billion
Deposits (including NCD) ¥8,683.0 billion
Common Stock ¥145.0 billion
Capital Ratio (BIS guidelines) 11.12% (Non-consolidated) 11.70% (Consolidated)
Authorized Number of Shares 2,500,000 thousand
Number of Issued Shares 895,521 thousand
Number of Shareholders** 28,076
Ticker Code 8331
Transfer Agent Japan Securities Agents, Ltd.1-2-4, Nihombashi Kayabacho Chuo-ku, Tokyo 103-8202
Long-term Short-term
Credit Ratings (As of July 1, 2009) Standard & Poor’s A A-1
Moody’s A1 P-1
Rating and Investment Information, Inc. AA- —
Figures as shown are presented on a non-consolidated basis.* Number of Employees includes transferred employees but excludes temporary staff and one-year contract employees.** Shareholders with fewer than 1,000 shares are excluded.
The Chiba Bank, Ltd.As of March 31, 2009
49 Annual Report 2009
Related Documents