Press Release Quarterly financial information August 5th 2008 Second quarter: Revenues: -18.9%* vs. Q2 07 +2.2% vs. Q2 07 excluding the effect of non-recurring items (b) (EUR -917m in Q2 08 and EUR +261m in Q2 07) Cost of risk: 43 bp Operating income: EUR 1,240m Group net income: EUR 644m First half results: Positive commercial momentum maintained despite a challenging environment Revenues: -14.0%* vs. H1 07 +0.1% vs. H1 07 excluding the effect of non-recurring items (b) (EUR -1,160m in H1 08 and EUR +255m in H1 07) Positive commercial momentum NBI of Retail Banking and Financial Services: +6.5%* vs. H1 07 NBI of Corporate and Investment Banking’s client-driven activities: EUR 2.3bn (vs. record level in H1 07: EUR 2.6bn) Cost/income ratio: 69.8% Group ROE after tax: 12.3% ROE of 15.6% excluding non-recurring items (b) Basel I Tier One Ratio at June 30th 2008: 8.1% (a) Reported 2007 historic quarterly results have been restated for the fictitious operations recorded on unauthorised and concealed market activities The quarterly results at March 31st 2007, June 30th 2007, September 30th 2007 and December 31st 2007, presented for comparative purposes, have been adjusted to restate the accounting consequences of the fictitious operations recorded in 2007 and 2008 on unauthorised and concealed market activities discovered in January 2008. This information is presented in Appendix 3. However, in order to provide more relevant information on the Group’s performance, the figures in this document correspond to reported historic data. The comments are also based on these reported data. * When adjusted for changes in Group structure and at constant exchange rates. (b): All non-recurring items (affecting NBI, cost of risk and net income from other assets) are presented in Appendix 4 PRESS RELATIONS SOCIETE GENERALE Hélène AGABRIEL +33 (0)1 41 45 97 13 Stéphanie CARSON-PARKER +33 (0)1 42 14 95 77 Hélène MAZIER +33 (0)1 58 98 72 74 Mireille MOURTADA +33 (0)1 42 14 58 19 Laura SCHALK +33 (0)1 42 14 52 86 P.A +33(0)1 42 14 49 48 Fax +33(0)1 42 14 28 98 SOCIETE GENERALE COMM/PRS 75886 PARIS CEDEX 18 www.socgen.com A French corporation with share capital of EUR 738,409,055 552 120 222 RCS PARIS

Welcome message from author
This document is posted to help you gain knowledge. Please leave a comment to let me know what you think about it! Share it to your friends and learn new things together.
Transcript
Press Release
Quarterly financial information
August 5th 2008
Second quarter: Revenues: -18.9%* vs. Q2 07 +2.2% vs. Q2 07 excluding the effect of non-recurring items(b) (EUR -917m in
Q2 08 and EUR +261m in Q2 07) Cost of risk: 43 bp Operating income: EUR 1,240m Group net income: EUR 644m
First half results: Positive commercial momentum maintaineddespite a challenging environment Revenues: -14.0%* vs. H1 07 +0.1% vs. H1 07 excluding the effect of non-recurring items(b) (EUR -1,160m in
H1 08 and EUR +255m in H1 07) Positive commercial momentum NBI of Retail Banking and Financial Services: +6.5%* vs. H1 07 NBI of Corporate and Investment Banking’s client-driven activities:
EUR 2.3bn (vs. record level in H1 07: EUR 2.6bn) Cost/income ratio: 69.8% Group ROE after tax: 12.3% ROE of 15.6% excluding non-recurring items(b)
Basel I Tier One Ratio at June 30th 2008: 8.1% (a) Reported 2007 historic quarterly results have been restated for the fictitious operations recorded on unauthorised and concealed market activities
The quarterly results at March 31st 2007, June 30th 2007, September 30th 2007 and December 31st 2007, presented for comparative purposes, have been adjusted to restate the accounting consequences of the fictitious operations recorded in 2007 and 2008 on unauthorised and concealed market activities discovered in January 2008. This information is presented in Appendix 3. However, in order to provide more relevant information on the Group’s performance, the figures in this document correspond to reported historic data. The comments are also based on these reported data.
* When adjusted for changes in Group structure and at constant exchange rates. (b): All non-recurring items (affecting NBI, cost of risk and net income from other assets) are presented in Appendix 4 PRESS RELATIONS SOCIETE GENERALE Hélène AGABRIEL +33 (0)1 41 45 97 13 Stéphanie CARSON-PARKER +33 (0)1 42 14 95 77 Hélène MAZIER +33 (0)1 58 98 72 74
Mireille MOURTADA +33 (0)1 42 14 58 19 Laura SCHALK +33 (0)1 42 14 52 86 P.A +33(0)1 42 14 49 48 Fax +33(0)1 42 14 28 98
SOCIETE GENERALE COMM/PRS 75886 PARIS CEDEX 18 www.socgen.com A French corporation with share capital of EUR 738,409,055 552 120 222 RCS PARIS

2/26
At the meeting of August 4th 2008, the Board of Directors of Societe Generale approved the financial statements for the second quarter and first half of 2008. The Group generated net income of EUR 1.7 billion in H1. Frédéric Oudéa, the Group’s CEO, stated: “During a H1 2008 marked by a crisis on an exceptional scale, Societe Generale’s performance reflects the robustness of its portfolio of activities. The Group’s core activities, Retail Banking and Financial Services, continued to grow, Global Investment Management and Services made a positive contribution to net income, and Corporate and Investment Banking generated very good business volumes in H1. Societe Generale will take advantage of the quality of its customer franchises, its solid capital position and the commitment of all its employees to pursue its strategy despite an environment that is likely to remain difficult”. 1. GROUP CONSOLIDATED RESULTS
(a): Reported data not restated for the accounting consequences of the fictitious operations recorded in 2007 on unauthorised and concealed market activities. The restated data appear in Appendix 3. However, in order to provide more relevant information on the Group’s performance, the figures correspond to reported historic data. The comments are also based on these reported historic data.
The global economy has been confronted with a quadruple shock since the beginning of 2008:
• the property crisis in the United States, and now in the United Kingdom and Spain, • the liquidity and financial crises, • the soaring price of oil and food products, • imbalances in exchange rate parities.
Against this backdrop, short- and medium-term growth forecasts for the United States, United Kingdom and the major western European countries have been revised downwards, although France and Germany should prove more resilient than others. However, emerging countries – particularly those with commodity reserves – continue to enjoy dynamic economic activity in contrast to the sluggishness experienced in the developed countries. In a more difficult environment for banks, Societe Generale’s broadly-based portfolio of activities and geographical positioning make it more resilient. The Group generates a very significant proportion of its total revenues from Retail Banking and Financial Services (around 66% in H1 08, around 61% in 2007) and particularly from the French Networks (which operate in a market with structurally little exposure to the property shocks that are affecting some other countries). In Corporate and
In EUR million Q2 08 Q2 07 (a) Change Q2/Q2 H1 08 H1 07(a) Change
H1/H1Net banking income 5,584 6,622 -15.7% 11,263 12,668 -11.1%
On a like-for-like basis* -18.9% -14.0%
Operating expenses -3,957 -3,817 +3.7% -7,862 -7,515 +4.6%On a like-for-like basis* +1.0% +2.2%
Gross operating income 1,627 2,805 -42.0% 3,401 5,153 -34.0%On a like-for-like basis* -45.2% -37.0%
Operating income 1,240 2,619 -52.7% 2,416 4,775 -49.4%On a like-for-like basis* -54.5% -51.3%
Net income 644 1,744 -63.1% 1,740 3,175 -45.2%
Q2 08 Q2 07 (a) H1 08 H1 07 (a)
Group ROE after tax 8.6% 29.0% 12.3% 26.7%Business line ROE after tax 12.9% 36.3% 14.0% 34.5%

3/26
Investment Banking, the Group generates a large proportion of its revenues from equity activities which have been less affected by the crisis than fixed income or credit activities. Commercial activity increased strongly in Q2 08. This is reflected in revenue growth of +5.0%* vs. Q2 07 for Retail Banking and Financial Services, and 31.3%(b) growth in the net banking income of Corporate and Investment Banking’s client-driven activities vs. Q1 08. That said, the Group’s results continue to be impacted by non-recurring items (representing total net banking income of EUR -917 million), some related to the application of IFRS (revaluation of financial liabilities and mark-to-market of CDS) and others to the dislocation of credit markets. In accordance with guidance from the Financial Stability Forum, Societe Generale is presenting this quarter a comprehensive disclosure of its exposure to assets at risk. Lastly, within Asset Management, no new write-downs were recorded on dynamic money market funds during the quarter. The Group’s management, which has been strengthened as a result of the recent reorganisation, can now focus its attention and efforts on further expanding the customer franchises, improving operating efficiency and enhancing risk control in a less favourable environment than previously. Net banking income Q2 08 net banking income totalled EUR 5,584 million, down -18.9%* (-15.7% in absolute terms) vs. Q2 07. All Retail Banking and Financial Services activities saw revenue growth vs. Q2 07 (+0.9% after adjustment for changes in the PEL/CEL provision and the Euronext capital gain in 2007 for the French Networks, +14.2%* for International Retail Banking, +11.4%* for Financial Services). Global Investment Management and Services posted a -22.9%* drop in revenues vs. Q2 07. This was due to Asset Management, which continues to be confronted with a difficult environment. As expected, Asset Management recorded no new write-downs in Q2. Private Banking and Securities Services posted increased revenues (excluding Euronext capital gain and after adjustment for the Fimat /Newedge structure effect). The second quarter saw confirmation of Corporate and Investment Banking’s dynamic client-driven activities, but the division was adversely affected by EUR -1.2 billion of non-recurring items. Overall, its revenues were down -66.6%* vs. Q2 07. Net banking income totalled EUR 11,263 million in H1, down -14.0%* (-11.1% in absolute terms) vs. H1 07. Operating expenses Operating expenses rose +1.0%* (+3.7% in absolute terms) vs. Q2 07. The increase reflects the Group’s continuing investment in retail banking, financial services and private banking. Societe Generale’s cost to income ratio increased to 70.9% (vs. Q2 07, which represented an exceptionally low comparative base at 57.6%). The Group’s C/I ratio was 69.8% in H1 2008 vs. 59.3% a year earlier. The Group’s C/I ratio automatically increased in both Q2 and H1 due to the effect of non-recurring items.

4/26
Operating income The Group’s Q2 gross operating income totalled EUR 1,627 million (-45.2%* vs. Q2 07), with a EUR 1,411 million contribution from the businesses. Gross operating income for H1 (EUR 3,401 million) was down -37.0%* (-34.0% in absolute terms) vs. H1 07. The Group’s cost of risk (EUR 387 million in Q2 08) returned to a level of 43 bp after rising in Q1 2008 primarily as a result of precautionary provisions on a few specific Corporate and Investment Banking accounts. The cost of risk remained at a low level for the French Networks (28 bp), with the Group observing no significant deterioration in its customers’ solvency. When adjusted for the effect of integrating Rosbank, the cost of risk for International Retail Banking was a modest 35 bp. With Rosbank, it stood at 49 bp and remains below the Group’s anticipated level for the business (60-80 bp). The rise in the cost of risk to 120 bp for Financial Services can be attributed to structure effects and the growth of consumer credit outstandings in emerging countries. The Group’s Q2 operating income totalled EUR 1,240 million, down -54.5%* vs. Q2 07 (-52.7% in absolute terms). Operating income for H1 amounted to EUR 2,416 million, down -51.3%* vs. H1 07 (-49.4% in absolute terms). Net income After tax (the Group’s effective tax rate was 33.9% in Q2) and minority interests, Group net income for Q2 08 came to EUR 644 million (-63.8%* vs. Q2 07 or -63.1% in absolute terms). The Group’s Q2 ROE after tax was 8.6%. Group net income for H1 came to EUR 1,740 million, down -45.1%* (-45.2% at constant structure) vs. H1 07. The Group’s ROE after tax stood at 12.3% in H1 08. The numerous non-recurring items recorded by the Group in H1 (these are detailed in Appendix 4) had an impact of EUR -1,160 million on revenues and EUR 840 million on net income (before tax). When adjusted for these items, the Group’s ROE after tax is around 15.6%, testifying to the resilience of the Group’s portfolio of activities in an environment of serious crisis. H1 08 earnings per share amounts to EUR 3.17.

5/26
2. THE GROUP’S FINANCIAL STRUCTURE At June 30th 2008, Group shareholders’ equity totalled EUR 35.6 billion1 and net asset value per share EUR 54.62, including EUR 0.18 of unrealised capital gains. The Group repurchased 0.8 million shares in Q2 08 (0.9 million in H1 08). At end-June, the Group held 30.2 million treasury shares (representing 5.1% of the capital) excluding shares held for trading purposes. The Group completed the hedging of the bonus share plan implemented in Q1 08. However, in order to maintain its high solvency levels, the Group will not proceed to cancel the dilution resulting from the 2008 global employee share ownership plan (7.5 million shares) and the 2008 stock option plan implemented in Q1 (2.2 million options). Basel I risk-weighted assets (EUR 364.7 billion) increased +15.0% between June 30th 2007 and June 30th 2008. The Group’s Basel II risk-weighted assets stood at EUR 340.4 billion, up +3.4% vs. March 31st 2008. As a result, the Basel I Tier One ratio stood at 8.1% at June 30th 2008 (including 6.5% for Core Tier One) after deducting the dividend provision calculated on the assumption of a 45% payout ratio. The Tier One ratio was 8.2% at the same date (including 6.6% for Core Tier One) based on the new Basel II standards. The Group is rated AA- by S&P and Fitch, and Aa2 by Moody’s.
1 This figure includes notably (i) EUR 1.0 billion for the issue of deeply subordinated notes in January 2005, EUR 1.425 billion for issues in April and December 2007 and EUR 1.9 billion for issues in May and June 2008, EUR 0.8 billion of undated subordinated notes and (ii) EUR 0.1 billion of unrealised capital gains.
6/26
3. FRENCH NETWORKS
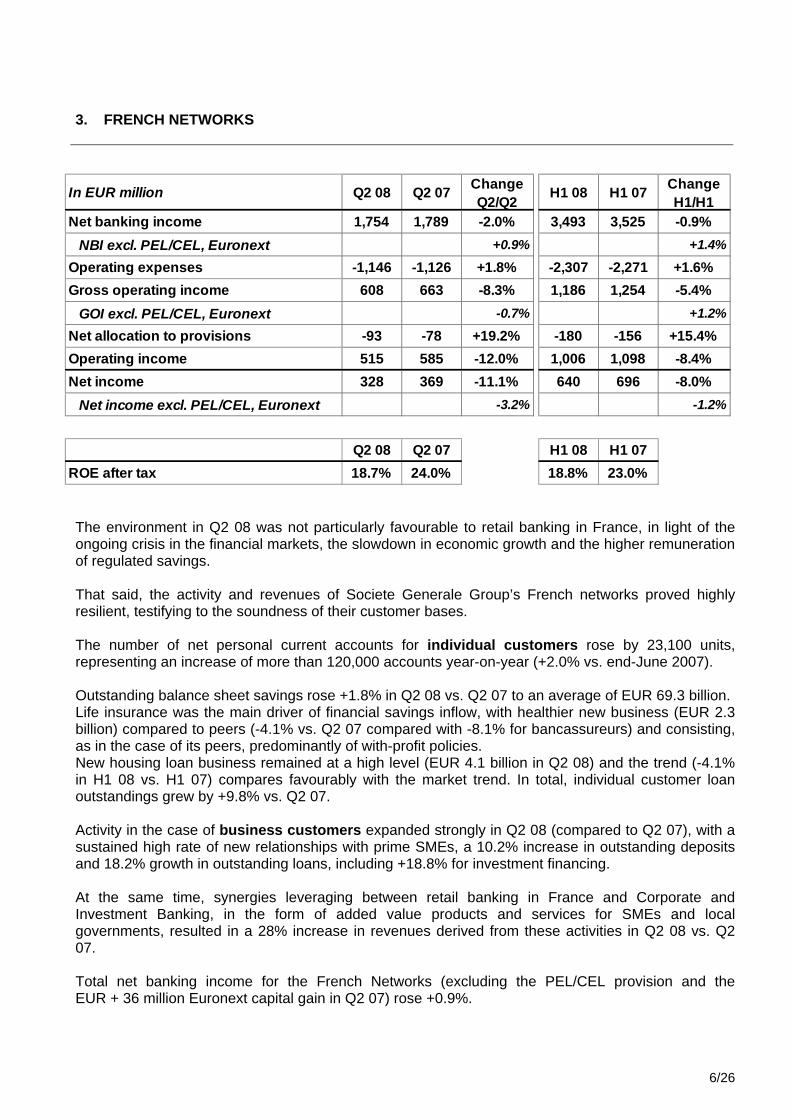
The environment in Q2 08 was not particularly favourable to retail banking in France, in light of the ongoing crisis in the financial markets, the slowdown in economic growth and the higher remuneration of regulated savings. That said, the activity and revenues of Societe Generale Group’s French networks proved highly resilient, testifying to the soundness of their customer bases. The number of net personal current accounts for individual customers rose by 23,100 units, representing an increase of more than 120,000 accounts year-on-year (+2.0% vs. end-June 2007). Outstanding balance sheet savings rose +1.8% in Q2 08 vs. Q2 07 to an average of EUR 69.3 billion. Life insurance was the main driver of financial savings inflow, with healthier new business (EUR 2.3 billion) compared to peers (-4.1% vs. Q2 07 compared with -8.1% for bancassureurs) and consisting, as in the case of its peers, predominantly of with-profit policies. New housing loan business remained at a high level (EUR 4.1 billion in Q2 08) and the trend (-4.1% in H1 08 vs. H1 07) compares favourably with the market trend. In total, individual customer loan outstandings grew by +9.8% vs. Q2 07. Activity in the case of business customers expanded strongly in Q2 08 (compared to Q2 07), with a sustained high rate of new relationships with prime SMEs, a 10.2% increase in outstanding deposits and 18.2% growth in outstanding loans, including +18.8% for investment financing. At the same time, synergies leveraging between retail banking in France and Corporate and Investment Banking, in the form of added value products and services for SMEs and local governments, resulted in a 28% increase in revenues derived from these activities in Q2 08 vs. Q2 07. Total net banking income for the French Networks (excluding the PEL/CEL provision and the EUR + 36 million Euronext capital gain in Q2 07) rose +0.9%.
In EUR million Q2 08 Q2 07 Change Q2/Q2 H1 08 H1 07 Change
H1/H1Net banking income 1,754 1,789 -2.0% 3,493 3,525 -0.9%
NBI excl. PEL/CEL, Euronext +0.9% +1.4%
Operating expenses -1,146 -1,126 +1.8% -2,307 -2,271 +1.6%Gross operating income 608 663 -8.3% 1,186 1,254 -5.4%
GOI excl. PEL/CEL, Euronext -0.7% +1.2%
Net allocation to provisions -93 -78 +19.2% -180 -156 +15.4%Operating income 515 585 -12.0% 1,006 1,098 -8.4%Net income 328 369 -11.1% 640 696 -8.0%
Net income excl. PEL/CEL, Euronext -3.2% -1.2%
Q2 08 Q2 07 H1 08 H1 07ROE after tax 18.7% 24.0% 18.8% 23.0%

7/26
Interest income was 2.6% higher than in Q2 07 (excluding the effect of the PEL/CEL provision), with the impact of rate increases on savings accounts in August 2007 and again in February 2008 offset by the rise in outstanding deposits and loans. At the same time, commission income was lower (-1.0% vs. Q2 07). Service commissions were up +3.7%, due primarily to increased activity with business customers. However, financial commissions were down -13.5%, reflecting the decline in new life insurance business, mutual fund outstandings and stock market transactions in a deteriorated market environment. Net banking income for H1 was up +1.4% vs. H1 07 (excluding the PEL/CEL provision and Euronext capital gain). Meanwhile, operating expenses rose +1.8% in Q2 08 vs. Q2 07, representing a total increase of +1.6% January 1st compared with H1 07. As a result, the cost to income ratio (excluding the effect of the PEL/CEL provision) was 65.3% in Q2 08 (+0.6 pt vs. Q2 07 when restated for the Euronext capital gain). The net cost of risk increased slightly to 28 bp vs. 27 bp in Q2 07 and remained stable vs. Q1 08. The French Networks' contribution to Group net income totalled EUR 328 million in Q2 08, down -3.2% vs. Q2 07 (excluding Euronext capital gain and excluding PEL/CEL provision). The figure for H1 was EUR 640 million, or -1.2% vs. H1 07 (excluding Euronext capital gain and excluding PEL/CEL provision). ROE after tax (excluding the effect of the PEL/CEL provision) stood at 18.8% in Q2 08 vs. 22.2% in Q2 07 (restated for the Euronext capital gain). H1 ROE after tax (excluding the effect of the PEL/CEL provision) reached 18.9%, vs. 21.5% (excluding Euronext capital gain) in H1 07. Against the backdrop of higher regulated rates and a deteriorated financial market, the Group now expects 2008 revenue growth of between 1% and 2% (excluding the effect of the PEL/CEL provision and the Euronext capital gain) for the French Networks.

8/26
4. INTERNATIONAL RETAIL BANKING
International Retail Banking produced a very solid performance in H1 08: revenues were up +17.9%* vs. H1 071 (+43.4% in absolute terms2). International Retail Banking accounted for nearly 21% of Group revenues in H1 and its contribution to the Group’s gross operating income amounted to EUR 985 million, gradually approaching the French Networks’ contribution. This fine performance reflects the quality of the Group’s positioning in relation to its retail banking activities, vindicating its strategic decisions. Whereas most of the retail banking markets are affected by the current financial crisis, albeit to varying degrees, the markets in which the Group operates continue to prove resilient and still reveal significant growth potential. As a result, around two-thirds of International Retail Banking’s total revenues3 in H1 08 originated from the following operations:
• The Czech Republic, where Komercni Banka (third largest local bank) continues to produce strong commercial performances on the back of the expansion of its network (+53 branches opened between 2003 and 2007) and the acquisition of Modra Pyramida in 2006,
• Russia, a country where Societe Generale started up its retail banking operation in 2003 and where it continues to expand its platform using organic and external growth,
• Romania, where BRD, the country’s leading retail banking network, continues to expand, • Egypt, where NSGB is ranked No. 2 among the country’s private banks, • Morocco, where the Group is also a major player via SGMA, the country’s fourth largest
private bank. To support this expansion, headcount increased by more than 2,900 year-on-year and at constant structure. At end-June 2008, the total headcount was 58,000. 330 new branches have been opened since June 2007 at constant structure (taking the total network to more than 3,580). 1 Structure effects: integration of Albania and Crédical in Q4 07 2 Mainly due to the integration of Rosbank 3 Excluding the effect of integrating Rosbank
In EUR million Q2 08 Q2 07 Change Q2/Q2 H1 08 H107 Change
H1/H1Net banking income 1,212 860 +40.9% 2,328 1,623 +43.4%
On a like-for-like basis* +14.2% +17.9%
Operating expenses -694 -498 +39.4% -1,343 -963 +39.5%On a like-for-like basis* +8.2% +11.3%
Gross operating income 518 362 +43.1% 985 660 +49.2%On a like-for-like basis* +22.4% +27.4%
Net allocation to provisions -78 -53 +47.2% -166 -111 +49.5%Operating income 440 309 +42.4% 819 549 +49.2%
On a like-for-like basis* +27.5% +32.7%
Net income 238 168 +41.7% 430 312 +37.8%
Q2 08 Q2 07 H1 08 H107ROE after tax 38.0% 37.4% 36.0% 35.7%

9/26
The number of individual customers has risen by more than 807,000 at constant structure since end-June 2007, or +9.7% in one year. Over the same period, deposits and loans increased by respectively +10.7%* and +31.0%* for individual customers, and by +14.2%* and +28.0%* for business customers. Q2 revenues totalled EUR 1,212 million, up 14.2%* (+40.9% in absolute terms). Operating expenses increased at a moderate rate (+8.2%*, +39.4% in absolute terms1) in Q2 08. The increase is limited to +5.1%* if branch network development costs are excluded. Against this backdrop, the Q2 08 C/I ratio continued to improve and stood at 57.3% (vs. 57.9% in Q2 07). H1 operating expenses increased +7%* excluding network development costs, and +11.3%* (+39.5% in absolute terms1) including these costs. The C/I ratio was lower at 57.7% (vs. 59.3% in H1 07). As a result, Q2 gross operating income increased significantly vs. Q2 07 (up 22.4%* at EUR 518 million and +43.1% in absolute terms1). H1 gross operating income grew +27.4%* vs. H1 07 (+49.2% in absolute terms1). The cost of risk was stable at 49 bp in Q2 08 (48 bp in Q2 07). The figure is lower (35 bp) excluding Rosbank. The division's contribution to Group net income totalled EUR 238 million, up 38.9%* vs. Q2 07 (+41.7% in absolute terms). The contribution to net income was up 35.2%* (+37.8% in absolute terms) in H1 vs. H1 07, at EUR 430 million. ROE after tax stood at 38.0% in Q2 (37.4% in Q2 07). It stood at 36.0% in H1 (vs. 35.7% in H1 07).
1 Mainly due to the integration of Rosbank

10/26
5. FINANCIAL SERVICES
The Financial Services division comprises Specialised Financing (consumer credit, equipment finance, operational vehicle leasing and fleet management, IT leasing and management), Life and Non-Life Insurance. Specialised Financing continued to enjoy strong and controlled expansion in countries with strong potential, through consumer credit and leasing offerings. In Q2 2008, Specialised Financing’s net banking income rose +13.0%* vs. Q2 07 (+12.8%* vs. H1 07), with the contribution of activities outside France amounting to 77.8% of the total (vs. 72.8% in Q2 07). Consumer credit’s development strategy in countries with strong potential is based on three core principles: (i) entrepreuneurial development or small acquisitions (entailing no significant goodwill), (ii) adapting the product offering to local customers’ requirements and market constraints, and (iii) pro-active risk management (scoring, active monitoring of loans in arrears). In France, Italy, Germany (more mature economies where market shares are more firmly entrenched), the Group is systematically looking for commercial or banking partners that will enable it to enhance customer outreach. Hence, in France, the Banque Postale has chosen to enter into exclusive negotiations with Societe Generale Group following a tender offer. This is expected to lead to the setting up of a joint company specialising in consumer credit. New consumer credit business and outstandings enjoyed dynamic growth in Q2 08 vs. Q2 07, with increases of respectively +22.2%* (+17.6%* vs. H1 07) and +16.1%*, driven mainly by activity in Russia and Poland. Outstandings totalled EUR 20.0 billion at June 30th 2008.
In EUR million Q2 08 Q2 07 Change Q2/Q2 H1 08 H1 07 Change
H1/H1Net banking income 824 688 +19.8% 1,599 1,333 +20.0%
On a like-for-like basis* +11.4% +11.9%
Operating expenses -455 -372 +22.3% -883 -716 +23.3%On a like-for-like basis* +13.3% +13.0%
Gross operating income 369 316 +16.8% 716 617 +16.0%On a like-for-like basis* +9.2% +10.7%
Net allocation to provisions -134 -86 +55.8% -247 -170 +45.3%Operating income 235 230 +2.2% 469 447 +4.9%
On a like-for-like basis* +1.7% +5.1%
Net income 167 147 +13.6% 321 285 +12.6%
Q2 08 Q2 07 H1 08 H1 07ROE after tax 16.1% 16.0% 15.7% 15.7%

11/26
As for equipment finance, new financing1 by the business line increased by +12.9%* vs. Q2 07 (+12.2%* vs. H1 07). In Germany, its main market, new financing grew strongly in both Q2 (+21.4%* vs. Q2 07) and H1 (+17.3%* vs. H1 07). The other operations in Europe continue to enjoy healthy growth, with in particular growth of +27.9%* in the Czech Republic and +23.2%* in Poland in Q2 08 vs. Q2 07. SG Equipment Finance's outstandings1 rose +8.8%* (vs. Q2 07) to EUR 18.3 billion at June 30th 2008. In operational vehicle leasing and fleet management, ALD Automotive is No. 2 in Europe with a fleet under management totalling 758,455 vehicles at end-June 2008 (+9.3%* vs. end-June 2007). ALD continues to grow in countries with strong potential such as Brazil (x 3.9), India (x 2.5) and Russia (x 2) and has upheld its leading position in its two main markets, France and Germany (respectively +5.4%* and +6.9%* vs. end-June 2007). Specialised Financing revenues were up +13.0%* (+23.1% in absolute terms) vs. Q2 07, amounting to EUR 699 million at end of Q2 08. The increase was +12.8%* in H1 (+22.6% in absolute terms) vs. H1 07 and resulted in net banking income of EUR 1,342 million. The increase of 13.5%* in operating expenses (+23.6% in absolute terms) in Q2 and +12.6%* in H1 (+24.2% in absolute terms), reflects ongoing development investments. Gross operating income rose to EUR 290 million in Q2 2008, up +12.3%* (+22.4% in absolute terms) compared with the same period in 2007. At EUR 551 million, the figure for H1 08 was 13.1%* higher (+20.3% in absolute terms) than in H1 07. The increase in the net cost of risk to 120 bp (vs. 88 bp in Q2 07) can be attributed to the growth in consumer credit, particularly in emerging countries (integration of the Brazilian subsidiaries and change in the mix) where margins easily cover the net cost of risk. Life insurance was affected by a less buoyant market in H1 08. Gross new inflows were nevertheless up +6.0%* at EUR 2.4 billion in Q2 08 vs. Q2 07. The proportion of unit-linked policies amounted to 15.2% in Q2 08. Total life insurance revenues were up +2.7%* in Q2 vs. Q2 07, and +7.7%* in H1 vs. H1 07. The Financial Services division generated total operating income for Q2 of EUR 235 million, up +1.7%* (+2.2% in absolute terms) vs. Q2 07. The H1 increase was +5.1%* (+4.9% in absolute terms) to EUR 469 million. The contribution to Group net income amounted to EUR 167 million in Q2 08, up +12.2%* (+13.6% in absolute terms) vs. Q2 07. The H1 contribution to Group net income was up +13.3%* (+12.6% in absolute terms) compared with the same period last year, at EUR 321 million. ROE after tax stood at 16.1% in Q2 08 and 15.7% in H1 08 (stable vs. Q2 07 and H1 07).
1 Excluding factoring
12/26
6. GLOBAL INVESTMENT MANAGEMENT AND SERVICES
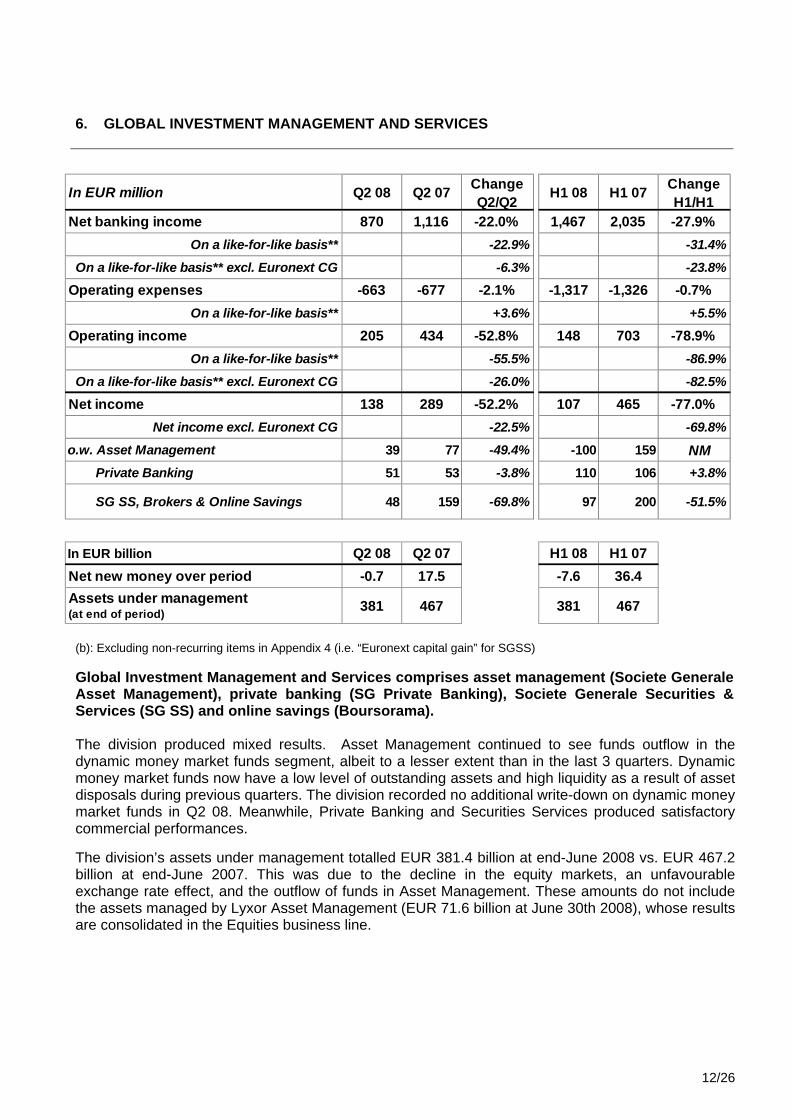
(b): Excluding non-recurring items in Appendix 4 (i.e. “Euronext capital gain” for SGSS) Global Investment Management and Services comprises asset management (Societe Generale Asset Management), private banking (SG Private Banking), Societe Generale Securities & Services (SG SS) and online savings (Boursorama). The division produced mixed results. Asset Management continued to see funds outflow in the dynamic money market funds segment, albeit to a lesser extent than in the last 3 quarters. Dynamic money market funds now have a low level of outstanding assets and high liquidity as a result of asset disposals during previous quarters. The division recorded no additional write-down on dynamic money market funds in Q2 08. Meanwhile, Private Banking and Securities Services produced satisfactory commercial performances. The division’s assets under management totalled EUR 381.4 billion at end-June 2008 vs. EUR 467.2 billion at end-June 2007. This was due to the decline in the equity markets, an unfavourable exchange rate effect, and the outflow of funds in Asset Management. These amounts do not include the assets managed by Lyxor Asset Management (EUR 71.6 billion at June 30th 2008), whose results are consolidated in the Equities business line.
In EUR million Q2 08 Q2 07 Change Q2/Q2 H1 08 H1 07 Change
H1/H1Net banking income 870 1,116 -22.0% 1,467 2,035 -27.9%
On a like-for-like basis** -22.9% -31.4%
On a like-for-like basis** excl. Euronext CG -6.3% -23.8%
Operating expenses -663 -677 -2.1% -1,317 -1,326 -0.7%On a like-for-like basis** +3.6% +5.5%
Operating income 205 434 -52.8% 148 703 -78.9%On a like-for-like basis** -55.5% -86.9%
On a like-for-like basis** excl. Euronext CG -26.0% -82.5%
Net income 138 289 -52.2% 107 465 -77.0%Net income excl. Euronext CG -22.5% -69.8%
o.w. Asset Management 39 77 -49.4% -100 159 -162.9%
Private Banking 51 53 -3.8% 110 106 +3.8%
SG SS, Brokers & Online Savings 48 159 -69.8% 97 200 -51.5%
In EUR billion Q2 08 Q2 07 H1 08 H1 07Net new money over period -0.7 17.5 -7.6 36.4Assets under management (at end of period) 381 467 381 467
NM

13/26
Overall, the division generated net banking income down -6.3%** (b) (-22.0% in absolute terms) at EUR 870 million in Q2 08 vs. Q2 07. Revenues in H1 (EUR 1,467 million) were down -23.8%**(b) (-27.9% in absolute terms) vs. H1 07. Operating income was down -26.0%**(b) (-52.8% in absolute terms) vs. Q2 07 and -82.5%**(b) (-78.9% in absolute terms) vs. H1 07. The contribution to Group net income totalled EUR 138 million in Q2 08, down -24.4%**(b) (-52.2% in absolute terms) vs. Q2 07. The division’s H1 contribution to Group net income (EUR 107 million) was down -79.4%**(b) (-77.0% in absolute terms) vs. H1 07, due primarily to the impact of the financial crisis on asset management activities.
Asset management SGAM recorded a limited net outflow of EUR -2.7 billion in Q2 2008, which breaks down as follows: EUR -2.3 billion on dynamic money market funds, EUR -0.7 billion on bonds (including EUR -1.6 billion for CDOs), EUR -2.6 billion on other alternative and diversified investments, EUR +1.6 billion on traditional money market funds and EUR +1.3 billion on equity products. The net outflow in H1 amounted to EUR -10.0 billion. Assets managed by SGAM totalled EUR 309.2 billion at end-June 2008, vs. EUR 393.4 billion a year earlier. The decline was due to negative exchange rate (EUR -19.3 billion), market (EUR -34.7 billion) and cumulative outflow effects. Q2 net banking income was down -24.8%* (-23.5% in absolute terms) vs. Q2 07, with a gross margin (34 points) lower than in Q2 07 primarily on the back of a drop in performance fees. Net banking income for H1 was down -68.2%* (-64.1% in absolute terms) vs. H1 07, as a result of losses booked in Q1 2007 relating to sales of riskier assets and the decline in commissions in an unfavourable market. Operating expenses were lower in Q2 (-7.5%* and -9.7% in absolute terms vs. Q2 07). H1 operating expenses also fell -5.6%* vs. H1 07 (-7.5% in absolute terms). Gross operating income was down -57.0%* in Q2 08 vs. Q2 07 (-49.6% in absolute terms) at EUR 60 million. The contribution to Group net income (EUR 39 million in Q2 08) was down -56.8%* vs. Q2 07 (-49.4% in absolute terms). The figure for H1 was EUR -100 million (EUR 159 million in H1 07) given the write-downs recorded in Q1 08.
Private banking Q2’s good commercial and financial performance provided further evidence of the quality of SG Private Banking’s customer franchise. The business line continued to expand with, in particular, the decision to enter into a global alliance with Rockefeller Financial Services & Co, a prominent player in private banking in North America. New inflow amounted to EUR 2.0 billion in Q2 2008 (or 11% of assets on an annualised basis), a similar amount to Q2 07 (EUR 2.3 billion) and much higher than in Q1 08 (EUR 0.4 billion). Assets under management totalled EUR 72.2 billion at end-June 2008, vs. EUR 73.8 billion a year earlier (due solely to unfavourable market and exchange rate effects). Private Banking’s Q2 net banking income (EUR 203 million) rose +3.6%* vs. Q2 07 (+2.5% in absolute terms) with a high gross margin of 113 basis points. H1 net banking income (EUR 417 million) was 8.1%* higher than in H1 07 (+7.2% in absolute terms). ** Excluding Fimat and Newedge (effect of change in structure: Societe Generale has consolidated 50% of Newedge on a proportional basis since Q1 08. This therefore constitutes a smaller entity than the 100% of Fimat consolidated until end-2007)

14/26
Operating expenses increased +7.4%* vs. Q2 07 (+5.6% in absolute terms), as a result of continued commercial investments in all these businesses’ target markets. H1 operating expenses rose +10.5%* (+9.0% in absolute terms). At EUR 70 million, gross operating income was down -2.8%* in Q2 08 vs. Q2 07 (-2.8% in absolute terms). The contribution to Group net income (EUR 51 million) fell -3.8%* in Q2 08 vs. Q2 07 (-3.8% in absolute terms). Private Banking’s H1 contribution (EUR 110 million) was up 3.8%* (the same in absolute terms).
Societe Generale Securities Services (SG SS), Brokers and online savings (Boursorama) SGSS’ business volumes were higher in Q2 08 (and in H1 08). The business line continued its international expansion, particularly in emerging countries, by setting up a securities services JV with State Bank of India. Securities services saw its assets under custody and assets under administration increase by respectively +5.9% and +21.9% vs. end-June 2007, mainly on the back of the acquisition of Capitalia’s securities activities and the migration of Pioneer funds under the agreement with Unicredit. At end-June 2008, assets under custody totalled EUR 2,733 billion and assets under administration EUR 495 billion. Newedge enjoyed buoyant business in Q2 2008 with 394 million trades executed and 442 million contracts cleared. In an environment marked by the sharp decline in stock market indices, the number of orders executed by Boursorama fell 16% vs. Q2 07 (down -14% in H1 08 vs. H1 07). Outstanding online savings totalled EUR 4.1 billion at end-June 2008. Lastly, Boursorama’s banking offering in France continues to enjoy real success with more than 4,500 accounts opened in Q2 08 (more than 10,300 in H1 08), taking the total number of bank accounts to approximately 70,600 at end-June 2008. Net banking income for SGSS, Brokers and Online Savings rose +11.7%**(b) vs. Q2 07 (-29.7% in absolute terms1). H1 net banking income increased +16.3%**(b) vs. H1 07 (-16.3% in absolute terms1). Operating expenses increased +15.4%** (+0.3% in absolute terms) vs. Q2 07. H1 operating expenses were up 16.3%** (+0.3% in absolute terms). As a result, gross operating income for Societe Generale Securities Services (SG SS), Brokers and online savings (Boursorama) rose +1.6%** (b) in Q2 08. The contribution to Group net income was 11.8%** (b) higher in Q2 08 than in Q2 07 and 27.3%** (b) higher in H1 08 than in H1 07.
1 In addition to the restatement related to the Euronext capital gain recorded in Q2 07, it should be noted that any interpretation of the changes in the results of SGSS, Brokers and Online Savings is affected by the change in structure related to the consolidation of Newedge. Societe Generale has consolidated 50% of Newedge on a proportional basis since Q1 08. This therefore constitutes a smaller entity than the 100% of Fimat consolidated until end-2007. ** Excluding Fimat and Newedge

15/26
7. CORPORATE AND INVESTMENT BANKING
(a): Reported data not restated for the accounting consequences of the fictitious operations recorded in 2007 on unauthorised and concealed market activities. The restated data appear in Appendix 3. However, in order to provide more relevant information on Corporate and Investment Banking’s performance, the figures correspond to reported historic data. The comments are also based on these reported historic data.
(b): Excluding non-recurring items in Appendix 4.
Corporate and Investment Banking’s net banking income amounted to EUR 663 million in Q2 08 (-68.1% in absolute terms vs. Q2 07). 2007 and 2008 data (and the corresponding changes) include non-recurring items(b) resulting mainly from a market environment affected by the substantial volatility of credit spreads and the continued deterioration of some asset classes. Comments on revenue trends are based on numbers which exclude these non-recurring items to allow a better assessment of the underlying trends in the division’s businesses. However, data relating to operating income and contribution to Group net income include these non-recurring items(b). Therefore, the division’s restated Q2 net banking income totalled EUR 1,886(b) million, i.e. a limited -1.9%*(b) decline vs. Q2 07. Net banking income for H1 08 came to EUR 3,418(b) million, down -10.1%*(b) vs. H1 07, which benefited from a very benign market environment. The second quarter was characterised both by dynamic client-driven activities and the good performance of Corporate and Investment Banking’s trading activities despite challenging market conditions. As a result, client-driven revenues posted the third best historic performance, with EUR 1,333 million in Q2 08 (+31.3% vs. Q1 08, -6.7% vs. Q2 07), primarily on the back of dynamic flow product sales. Corporate and Investment Banking’s client-driven revenues in H1 08 totalled EUR 2,348 million compared with the record level of EUR 2,643 million in H1 07.
In EUR million Q2 08 Q2 07 (a) Change Q2/Q2 H1 08 H1 07 (a) Change
H1/H1Net banking income 663 2,077 -68.1% 2,226 4,024 -44.7%
On a like-for-like basis* -66.6% -42.3%
Financing and Advisory -88 449 -119.6% 892 803 +11.1%Fixed Income, Currencies and Commodities 48 584 -91.8% -103 1,109 -109.3%
Equities 703 1,044 -32.7% 1,437 2,112 -32.0%
Operating expenses -954 -1,112 -14.2% -1,955 -2,193 -10.9%On a like-for-like basis* -9.9% -7.1%
Gross operating income -291 965 -130.2% 271 1,831 -85.2%On a like-for-like basis* -131.5% -84.5%
Net allocation to provisions -77 31 -348.4% -389 60 -748.3%Operating income -368 996 -136.9% -118 1,891 -106.2%
On a like-for-like basis* -138.5% -106.5%
Net income -186 721 -125.8% -47 1,387 -103.4%
Q2 08 Q2 07 (a) H1 08 H1 07 (a)
ROE after tax -12.1% 50.3% -1.6% 50.3%
NM
x,x%
NM
NM
NM
NMNM
NM
NMNM
NMNMNMNM
NM
16/26
In a bear market environment, Equities activities produced a robust performance, demonstrating that Societe Generale’s leading global franchise remains unscathed by the recent turmoil. Business volumes with institutional clients were solid, flow product market shares remain strong (25.2% on ETFs at June 30th 2008) and Lyxor enjoyed substantial new inflows (EUR +5.8 billion in H1 08). Trading activities posted very satisfactory results, particularly for arbitrage activities, despite the limit on stress tests put in place following the fraud detected at the beginning of the year, thus illustrating the excellence of Societe Generale’s trading platform. The Equities business posted revenues of EUR 771(b) million in Q2 08 (-22.3%*(b) vs. Q2 07 and +44.4%*(b) vs. Q1 08). H1 net banking income came to EUR 1,305(b) million (-35.7%*(b) vs. H1 07). The Fixed Income, Currencies & Commodities businesses enjoyed a strong quarter, with revenues of EUR 709(b) million, or a 36.6%*(b) increase vs. Q2 07 and a 1.1%(b) decline vs. Q1 08. Net banking income totalled EUR 1,426(b) million in H1 08. Q2 08 confirmed the very healthy position of client-driven activities where net banking income was up +11.4% vs. Q2 07 and up +34.3% vs. Q1 08, underpinned in particular by dynamic activity for flow products (+36.2% vs. Q2 07 and +9.9% vs. Q1 08) and structured products. Trading activities produced a satisfactory performance in a difficult environment with, in particular, a good performance in flow trading and the negligible impact of Euro yield curve inversion in June. Financing & Advisory revenues totalled EUR 406(b) million, a limited -1.5%*(b) decline vs. Q2 07 and a 44.5% (b) increase vs. Q1 08. Net banking income came to EUR 687(b) million in H1 08, down -9.4%*(b) vs. H1 07, reflecting the contrasting activity levels in various markets. Hence, whereas volumes in the leveraged financing market remained lower than in H1 07, commodity and infrastructure financing confirmed their sound activity levels. Q2 contributions were strong in these two segments which account for approximately one-third of the business line’s revenues and in which Corporate and Investment Banking has developed recognised expertise (illustrated by awards for ”Best Global Commodities House” and ”Best Project Finance House in Western Europe, Central & Eastern Europe and Africa” from Euromoney in July 2008). In addition, Corporate and Investment Banking has upheld its good positioning in European fixed income markets, ranking No. 5 in euro bond issues, with a 6.0% market share in H1 08 (vs. 5.0% in Q1 08). Operating expenses for Corporate and Investment Banking were 9.9%* lower than in Q2 07. The division recorded EUR +77 million of provision expenses in Q2 08 vs. a EUR -31 million write-back in Q2 07. Operating income, taking into account the non-recurring items that affected the division, totalled EUR -368 million in Q2 08 and EUR -118 million in H1 08. Corporate and Investment Banking’s contribution to Group net income amounted to EUR -186 million in Q2 08 and EUR -47 million in H1 08.

17/26
8. CORPORATE CENTRE The Corporate Centre recorded gross operating income of EUR 216 million in Q2 2008 (vs. EUR 60 million in Q2 2007). The increase can be attributed to a combination of factors:
• A substantial increase in equity portfolio income, up from EUR 54 million in Q2 07 to EUR 259 million in Q2 08 as a result of the disposal of BankMuscat. At June 30th 2008, the IFRS net book value of the industrial equity portfolio, excluding unrealised capital gains, amounted to EUR 0.9 billion, representing market value of EUR 1.0 billion.
• The revaluation of Crédit du Nord’s liabilities (EUR +44 million).
2008-2009 financial communication calendar
November 6th 2008 Publication of third quarter 2008 results
February 18th 2009 Publication of fourth quarter and FY 2008 results
May 7th 2009 Publication of first quarter 2009 results
August 5th 2009 Publication of second quarter 2009 results
November 4th 2009 Publication of third quarter 2009 results
This document contains a number of forecasts and comments relating to the targets and strategies of the Societe Generale Group.
These forecasts are based on a series of assumptions, both general and specific. As a result, there is a risk that these projections will not be met. Readers are
therefore advised not to rely on these figures more than is justified as the Group’s future results are liable to be affected by a number of factors and may
therefore differ from current estimates.
Investors are advised to take into account factors of uncertainty and risk when basing their investment decisions on information provided in this document.
Neither Societe Generale nor its representatives may be held liable for any loss resulting from the use of this presentation or its contents, or anything relating to
them, or any document or information to which the presentation may refer.
Unless otherwise specified, the sources for the rankings are internal.

18/26
(a): Reported data not restated for the accounting consequences of the fictitious operations recorded in 2007 on unauthorised and concealed market activities. The restated data are presented in Appendix 3.
APPENDIX 1: FIGURES AND QUARTERLY RESULTS BY CORE BUSINESS
2008 2007 (a) 2008 2007 (a)
Net banking income 5,584 6,622 -15.7% -18.9%(*) 11,263 12,668 -11.1% -14.0%(*)
Operating expenses (3,957) (3,817) +3.7% +1.0%(*) (7,862) (7,515) +4.6% +2.2%(*)
Gross operating income 1,627 2,805 -42.0% -45.2%(*) 3,401 5,153 -34.0% -37.0%(*)
Net allocation to provisions (387) (186) N/S +82.5%(*) (985) (378) NM ########Operating income 1,240 2,619 -52.7% -54.5%(*) 2,416 4,775 -49.4% -51.3%(*)Net income from other assets 35 6 NM 641 30 NMNet income from companies accounted for by the equity method 7 9 -22.2% 12 20 -40.0%
Impairment losses on goodwill 0 0 NM 0 0 NMIncome tax (432) (719) -39.9% (951) (1,332) -28.6%Net income before minority interests 850 1,915 -55.6% 2,118 3,493 -39.4% o.w. minority interests 206 171 +20.5% 378 318 +18.9%
Net income 644 1,744 -63.1% 1,740 3,175 -45.2%
Annualised Group ROE after tax (%) 8.6% 29.0% 12.3% 26.7%
Tier One ratio at end of period 8.1% 7.6% 8.1% 7.6%
(*) When adjusted for changes in Group structure and at constant exchange rates
CONSOLIDATED INCOME STATEMENT(in millions of euros)
First half
Change H1/H1
Second quarter
Change Q2/Q2
X%
x2.4(*)x2.1 x2.6
2008 2007 (a) Change Q2/Q2 2008 2007 (a) Change
H1/H1
French Networks 328 369 -11.1% 640 696 -8.0%International Retail Banking 238 168 +41.7% 430 312 +37.8%Financial Services 167 147 +13.6% 321 285 +12.6%Global Investment Management &Services 138 289 -52.2% 107 465 -77.0%
o.w. Asset Management 39 77 -49.4% (100) 159 NMo.w. Private Banking 51 53 -3.8% 110 106 +3.8%o.w. SG SS, Brokers & Online Savings
48 159 -69.8% 97 200 -51.5%
Corporate & Investment Banking (186) 721 NM (47) 1,387 NM
CORE BUSINESSES 685 1,694 -59.6% 1,451 3,145 -53.9%
Corporate Centre (41) 50 NM 289 30 NMGROUP 644 1,744 -63.1% 1,740 3,175 -45.2%
NET INCOME AFTER TAX BY CORE BUSINESS(in millions of euros)
First halfSecond quarter

19/26
QUARTERLY RESULTS BY CORE BUSINESSES
(in millions of euros) Q1 Q2 Q3 Q4 Q1 Q2 Q3 Q4 Q1 Q2 Q3 Q4 Q1 Q2 Q3 Q4
Net banking income 1,545 1,513 1,559 1,678 1,698 1,730 1,677 1,728 1,736 1,789 1,746 1,787 1,739 1,754Operating expenses -1,093 -1,081 -1,054 -1,088 -1,130 -1,093 -1,084 -1,143 -1,145 -1,126 -1,108 -1,187 -1,161 -1,146Gross operating income 452 432 505 590 568 637 593 585 591 663 638 600 578 608Net allocation to provisions -68 -67 -64 -85 -61 -71 -55 -88 -78 -78 -68 -105 -87 -93Operating income 384 365 441 505 507 566 538 497 513 585 570 495 491 515Net income from other assets 0 1 0 1 0 2 1 2 3 1 0 0 1 1Net income from companies accounted for by the equity method 0 1 0 0 0 1 0 1 0 1 0 1 0 1
Income tax -134 -129 -154 -177 -173 -192 -185 -169 -176 -199 -192 -169 -167 -176Net income before minority interests 250 238 287 329 334 377 354 331 340 388 378 327 325 341 o.w. minority interests 12 11 11 11 13 14 12 13 13 19 14 12 13 13Net income 238 227 276 318 321 363 342 318 327 369 364 315 312 328Average allocated capital 4,897 5,063 5,208 5,375 5,547 5,702 5,756 5,806 5,965 6,155 6,335 6,456 6,631 7,015ROE after tax 19.4% 17.9% 21.2% 23.7% 23.1% 25.5% 23.8% 21.9% 21.9% 24.0% 23.0% 19.5% 18.8% 18.7%
Net banking income 541 572 576 656 641 669 695 781 763 860 871 950 1,116 1,212Operating expenses -327 -341 -349 -402 -378 -395 -415 -456 -465 -498 -494 -529 -649 -694Gross operating income 214 231 227 254 263 274 280 325 298 362 377 421 467 518Net allocation to provisions -28 -27 -29 -47 -48 -53 -47 -67 -58 -53 -44 -49 -88 -78Operating income 186 204 198 207 215 221 233 258 240 309 333 372 379 440Net income from other assets 8 -2 0 -1 9 -1 1 -2 20 1 -2 9 -3 13Net income from companies accounted for by the equity method 1 1 1 1 2 3 2 4 8 11 8 9 4 1
Income tax -54 -57 -55 -58 -58 -58 -59 -67 -64 -78 -82 -96 -79 -94Net income before minority interests 141 146 144 149 168 165 177 193 204 243 257 294 301 360 o.w. minority interests 47 50 49 48 57 57 57 61 60 75 85 92 109 122Net income 94 96 95 101 111 108 120 132 144 168 172 202 192 238Average allocated capital 875 919 967 1,074 1,103 1,164 1,401 1,597 1,701 1,796 1,917 2,025 2,275 2,503ROE after tax 43.0% 41.8% 39.3% 37.6% 40.3% 37.1% 34.3% 33.1% 33.9% 37.4% 35.9% 39.9% 33.8% 38.0%
Net banking income 459 494 498 570 562 592 594 656 645 688 707 798 775 824Operating expenses -250 -263 -268 -317 -304 -318 -321 -347 -344 -372 -375 -435 -428 -455Gross operating income 209 231 230 253 258 274 273 309 301 316 332 363 347 369Net allocation to provisions -38 -49 -57 -55 -66 -60 -60 -87 -84 -86 -102 -102 -113 -134Operating income 171 182 173 198 192 214 213 222 217 230 230 261 234 235Net income from other assets 0 0 0 0 0 0 0 -1 0 1 0 0 0 -1Net income from companies accounted for by the equity method 0 0 0 -8 1 -3 -2 -10 -2 -3 -1 -1 -3 8
Income tax -60 -64 -59 -69 -67 -75 -74 -75 -73 -77 -78 -87 -72 -71Net income before minority interests 111 118 114 121 126 136 137 136 142 151 151 173 159 171 o.w. minority interests 2 2 3 4 3 4 3 4 4 4 4 5 5 4Net income 109 116 111 117 123 132 134 132 138 147 147 168 154 167Average allocated capital 2,604 2,706 2,797 2,909 3,094 3,264 3,301 3,462 3,560 3,681 3,779 3,884 4,013 4,144ROE after tax 16.7% 17.1% 15.9% 16.1% 15.9% 16.2% 16.2% 15.3% 15.5% 16.0% 15.6% 17.3% 15.4% 16.1%
2008 - IFRS(inc. IAS 32 & 39 and IFRS 4)
2007 - IFRS(inc. IAS 32 & 39 and IFRS 4)
2005 - IFRS(incl. IAS 32 & 39 and IFRS 4)
French Networks
International Retail Banking
Financial Services
2006 - IFRS(incl. IAS 32 & 39 and IFRS 4)

20/26
Q1 Q2 Q3 Q4 Q1 Q2 Q3 Q4 Q1 Q2 Q3 Q4 Q1 Q2 Q3 Q4Global Investment Management & Services
Net banking income 602 608 640 734 769 775 767 884 919 1,116 854 852 597 870Operating expenses -415 -435 -455 -547 -523 -552 -564 -659 -649 -677 -638 -744 -654 -663Gross operating income 187 173 185 187 246 223 203 225 270 439 216 108 -57 207Net allocation to provisions 0 -1 -1 -4 -3 -1 -1 -3 -1 -5 -2 -33 0 -2Operating income 187 172 184 183 243 222 202 222 269 434 214 75 -57 205Net income from other assets 0 0 0 0 0 0 0 -1 0 0 -2 -4 0 1Net income from companies accounted for by the equity method 0 0 0 0 1 -1 0 0 0 0 0 0 0 0
Income tax -58 -54 -56 -55 -75 -69 -65 -64 -83 -136 -64 -12 25 -60Net income before minority interests 129 118 128 128 169 152 137 157 186 298 148 59 -32 146 o.w. minority interests 12 9 11 11 14 10 5 9 10 9 11 9 -1 8Net income 117 109 117 117 155 142 132 148 176 289 137 50 -31 138Average allocated capital 810 917 930 919 1,019 1,052 1,074 1,197 1,239 1,282 1,456 1,550 1,506 1,421ROE after tax 57.8% 47.5% 50.3% 50.9% 60.8% 54.0% 49.2% 49.5% 56.8% 90.2% 37.6% 12.9% NM 38.8%
o.w. Asset Management
Net banking income 269 259 286 338 333 305 295 348 340 345 243 191 -18 264Operating expenses -154 -163 -178 -220 -193 -196 -186 -230 -212 -226 -176 -227 -201 -204Gross operating income 115 96 108 118 140 109 109 118 128 119 67 -36 -219 60Net allocation to provisions 0 0 0 -2 0 0 0 1 0 0 0 -4 0 0Operating income 115 96 108 116 140 109 109 119 128 119 67 -40 -219 60Net income from other assets 0 0 0 0 0 0 0 -1 0 0 -2 -4 0 0Net income from companies accounted for by the equity method 0 0 0 0 1 -1 0 0 0 0 0 0 0 0
Income tax -39 -33 -36 -39 -47 -38 -38 -39 -43 -41 -22 15 72 -20Net income before minority interests 76 63 72 77 94 70 71 79 85 78 43 -29 -147 40 o.w. minority interests 9 7 7 8 9 2 3 2 3 1 3 1 -8 1Net income 67 56 65 69 85 68 68 77 82 77 40 -30 -139 39Average allocated capital 287 327 307 272 287 293 276 265 277 302 404 502 450 301ROE after tax 93.4% 68.5% 84.7% 101.5% 118.5% 92.8% 98.6% 116.2% 118.4% 102.0% 39.6% NM NM 51.8%
o.w. Private Banking
Net banking income 127 129 135 149 164 164 156 174 191 198 201 233 214 203Operating expenses -86 -90 -93 -107 -102 -106 -105 -121 -118 -126 -130 -157 -133 -133Gross operating income 41 39 42 42 62 58 51 53 73 72 71 76 81 70Net allocation to provisions 0 0 -1 0 -2 0 -1 -1 0 -1 0 0 -1 -1Operating income 41 39 41 42 60 58 50 52 73 71 71 76 80 69Net income from other assets 0 0 0 0 0 0 0 0 0 0 0 0 0 0Net income from companies accounted for by the equity method 0 0 0 0 0 0 0 0 0 0 0 0 0 0
Income tax -9 -9 -7 -8 -14 -14 -12 -9 -17 -15 -17 -14 -18 -16Net income before minority interests 32 30 34 34 46 44 38 43 56 56 54 62 62 53 o.w. minority interests 2 2 2 2 3 3 2 4 3 3 3 4 3 2Net income 30 28 32 32 43 41 36 39 53 53 51 58 59 51Average allocated capital 283 316 329 340 376 386 372 377 396 410 435 466 480 513ROE after tax 42.4% 35.4% 38.9% 37.6% 45.7% 42.5% 38.7% 41.4% 53.5% 51.7% 46.9% 49.8% 49.2% 39.8%
o.w. SG SS, Brokers & Online Savings
Net banking income 206 220 219 247 272 306 316 362 388 573 410 428 401 403Operating expenses -175 -182 -184 -220 -228 -250 -273 -308 -319 -325 -332 -360 -320 -326Gross operating income 31 38 35 27 44 56 43 54 69 248 78 68 81 77Net allocation to provisions 0 -1 0 -2 -1 -1 0 -3 -1 -4 -2 -29 1 -1Operating income 31 37 35 25 43 55 43 51 68 244 76 39 82 76Net income from other assets 0 0 0 0 0 0 0 0 0 0 0 0 0 1Net income from companies accounted for by the equity method 0 0 0 0 0 0 0 0 0 0 0 0 0 0Income tax -10 -12 -13 -8 -14 -17 -15 -16 -23 -80 -25 -13 -29 -24Net income before minority interests 21 25 22 17 29 38 28 35 45 164 51 26 53 53 o.w. minority interests 1 0 2 1 2 5 0 3 4 5 5 4 4 5Net income 20 25 20 16 27 33 28 32 41 159 46 22 49 48Average allocated capital 240 274 294 307 356 373 426 555 566 570 617 582 576 607ROE after tax 33.3% 36.5% 27.2% 20.8% 30.3% 35.4% 26.3% 23.1% 29.0% 111.6% 29.8% 15.1% 34.0% 31.6%
2006 - IFRS(incl. IAS 32 & 39 and IFRS 4)
2005 - IFRS(incl. IAS 32 & 39 and IFRS 4)
2007 - IFRS(inc. IAS 32 & 39 and IFRS 4)
2008 - IFRS(inc. IAS 32 & 39 and IFRS 4)

21/26
(a): Reported data not restated for the accounting consequences of the fictitious operations recorded in 2007 on unauthorised and concealed market activities. The restated data are presented in Appendix 3.
Q1 Q2 Q3 Q4 Q1 Q2 Q3 Q4 Q1 Q2 Q3 Q4 Q1 Q2 Q3 Q4Corporate and Investment Banking
Net banking income 1,550 1,233 1,496 1,418 1,957 1,832 1,521 1,688 1,947 2,077 1,159 -661 1,563 663Operating expenses -843 -784 -853 -840 -1,066 -1,063 -831 -930 -1,081 -1,112 -743 -489 -1,001 -954Gross operating income 707 449 643 578 891 769 690 758 866 965 416 -1,150 562 -291Net allocation to provisions 47 22 32 44 19 35 23 16 29 31 -9 5 -312 -77Operating income excluding net loss onunauthorised and concealed marketactivities
754 471 675 622 910 804 713 774 895 996 407 -1,145 250 -368
Net loss on unauthorised and concealed market activities 0 0 0 0 0 0 0 0 0 0 0 -4,911 0 0
Operating income including net loss onunauthorised and concealed marketactivities
754 471 675 622 910 804 713 774 895 996 407 -6,056 250 -368
Net income from other assets 0 0 1 -12 23 1 4 2 1 -1 2 24 -3 7Net income from companies accounted for by the equity method 4 6 -5 17 6 6 8 4 6 2 6 5 5 1
Impairment losses on goodwill 0 -13 0 0 0 0 0 0 0 0 0 0 0 0Income tax -257 -115 -170 -126 -293 -219 -197 -193 -233 -274 -101 2,109 -113 177Net income before minority interests 501 349 501 501 646 592 528 587 669 723 314 -3,918 139 -183 o.w. minority interests 3 3 3 2 3 3 5 2 3 2 4 0 0 3Net income 498 346 498 499 643 589 523 585 666 721 310 -3,918 139 -186Average allocated capital 3,686 3,975 4,362 4,570 4,747 4,868 4,969 5,067 5,303 5,731 5,888 5,811 5,913 6,145ROE after tax 54.0% 34.8% 45.7% 43.7% 54.2% 48.4% 42.1% 46.2% 50.2% 50.3% 21.1% NM 9.4% NM
Corporate and Investment Banking(excl. Cowen)
Net income 1,494 1,195 1,441 1,359 1,879 1,776 1,517 1,688 1,947 2,077 1,159 -661 1,563 663Financing and Advisory 348 330 354 456 308 396 416 439 354 449 375 681 980 -88Fixed Income, Currencies and Commodities 485 289 477 507 543 623 492 594 525 584 105 -2099 -151 48Equities 661 576 610 396 1028 757 609 655 1068 1044 679 757 734 703
Operating expenses -791 -746 -794 -783 -997 -1,004 -824 -930 -1,081 -1,112 -743 -489 -1,001 -954Gross operating income 703 449 647 576 882 772 693 758 866 965 416 -1,150 562 -291Net allocation to provisions 47 22 32 44 19 35 23 16 29 31 -9 5 -312 -77Operating income excluding net loss onunauthorised and concealed market activities 750 471 679 620 901 807 716 774 895 996 407 -1,145 250 -368
Net loss on unauthorised and concealed market activities
0 0 0 0 0 0 0 0 0 0 0 -4,911 0 0
Operating income including net loss on unauthorisedand concealed market activities 750 471 679 620 901 807 716 774 895 996 407 -6,056 250 -368
Net income from other assets 0 0 1 -12 23 1 4 2 1 -1 2 24 -3 7Net income from companies accounted for by the equity method 4 6 -5 17 6 6 8 4 6 2 6 5 5 1
Impairment losses on goodwill 0 -13 0 0 0 0 0 0 0 0 0 0 0 0Income tax -256 -115 -171 -125 -290 -219 -199 -193 -233 -274 -101 2,109 -113 177Net income before minority interests 498 349 504 500 640 595 529 587 669 723 314 -3,918 139 -183 o.w. minority interests 3 3 3 2 3 3 5 2 3 2 4 0 0 3Net income 495 346 501 498 637 592 524 585 666 721 310 -3,918 139 -186Average allocated capital 3,677 3,965 4,353 4,561 4,738 4,860 4,963 5,065 5,303 5,731 5,888 5,811 5,913 6,145ROE after tax 53.8% 34.9% 46.0% 43.7% 53.8% 48.7% 42.2% 46.2% 50.2% 50.3% 21.1% NM 9.4% NM
Corporate CentreNet banking income 53 38 102 31 144 111 12 -66 36 92 38 154 -111 261Operating expenses -57 7 -37 -64 -11 -68 2 -54 -14 -32 -16 -32 -12 -45Gross operating income -4 45 65 -33 133 43 14 -120 22 60 22 122 -123 216Net allocation to provisions 14 7 -1 7 -3 -2 6 -2 0 5 -1 -17 2 -3Operating income 10 52 64 -26 130 41 20 -122 22 65 21 105 -121 213Net income from other assets 158 0 -1 -5 2 2 -3 2 0 4 -1 -16 611 14Net income from companies accounted for by the equity method 0 0 0 0 0 -3 0 -2 -1 -2 -1 -2 -1 -4
Impairment losses on goodwill 0 0 0 -10 0 0 0 -18 0 0 0 0 0 0Income tax 56 52 11 52 29 -2 62 45 16 45 33 -211 -113 -208Net income before minority interests 224 104 74 11 161 38 79 -95 37 112 52 -124 376 15 o.w. minority interests 61 46 49 54 55 58 61 41 57 62 59 44 46 56Net income 163 58 25 -43 106 -20 18 -136 -20 50 -7 -168 330 -41
2008 - IFRS(inc. IAS 32 & 39 and IFRS 4)
2007 (a) - IFRS(inc. IAS 32 & 39 and IFRS 4)
2005 - IFRS(incl. IAS 32 & 39 and IFRS 4)
2006 - IFRS(incl. IAS 32 & 39 and IFRS 4)

22/26
(a): Reported data not restated for the accounting consequences of the fictitious operations recorded in 2007 on unauthorised and concealed market activities. The restated data are presented in Appendix 3.
Q1 Q2 Q3 Q4 Q1 Q2 Q3 Q4 Q1 Q2 Q3 Q4 Q1 Q2 Q3 GROUP
Net banking income 4,750 4,458 4,871 5,087 5,771 5,709 5,266 5,671 6,046 6,622 5,375 3,880 5,679 5,584Operating expenses -2,985 -2,897 -3,016 -3,258 -3,412 -3,489 -3,213 -3,589 -3,698 -3,817 -3,374 -3,416 -3,905 -3,957Gross operating income 1,765 1,561 1,855 1,829 2,359 2,220 2,053 2,082 2,348 2,805 2,001 464 1,774 1,627Net allocation to provisions -73 -115 -120 -140 -162 -152 -134 -231 -192 -186 -226 -301 -598 -387Operating income excluding net loss onunauthorised and concealed marketactivities
1,692 1,446 1,735 1,689 2,197 2,068 1,919 1,851 2,156 2,619 1,775 163 1,176 1,240
Net loss on unauthorised and concealed market activities 0 0 0 0 0 0 0 0 0 0 0 -4,911 0 0
Operating income including net loss onunauthorised and concealed marketactivities
1,692 1,446 1,735 1,689 2,197 2,068 1,919 1,851 2,156 2,619 1,775 -4,748 1,176 1,240
Net income from other assets 166 -1 0 -17 34 4 3 2 24 6 -3 13 606 35Net income from companies accounted for by the equity method
5 8 -4 10 10 3 8 -3 11 9 12 12 5 7
Impairment losses on goodwill 0 -13 0 -10 0 0 0 -18 0 0 0 0 0 0Income tax -507 -367 -483 -433 -637 -615 -518 -523 -613 -719 -484 1,534 -519 -432Net income before minority interests 1,356 1,073 1,248 1,239 1,604 1,460 1,412 1,309 1,578 1,915 1,300 -3,189 1,268 850 o.w. minority interests 137 121 126 130 145 146 143 130 147 171 177 162 172 206Net income 1,219 952 1,122 1,109 1,459 1,314 1,269 1,179 1,431 1,744 1,123 -3,351 1,096 644Average allocated capital 15,771 16,412 17,083 17,759 18,437 19,454 20,482 22,054 23,268 23,727 24,324 23,413 25,436 29,033ROE after tax 30.8% 23.1% 26.1% 24.8% 31.5% 26.8% 24.6% 21.2% 24.4% 29.0% 18.0% NM 16.5% 8.6%
2006 - IFRS(incl. IAS 32 & 39 and IFRS 4)
2005 - IFRS(incl. IAS 32 & 39 and IFRS 4)
2007 (a) - IFRS(inc. IAS 32 & 39 and IFRS 4)
2008 - IFRS(inc. IAS 32 & 39 and IF

23/26
1- Reported 2007 historic quarterly results have been restated: corrections in respect of the fictitious operations recorded on unauthorised and concealed market activities uncovered in January 2008. The quarterly results at March 31st 2007, June 30th 2007, September 30th 2007 and December 31st 2007, presented for comparative purposes, have been adjusted to restate the accounting consequences of the fictitious operations recorded in 2007 and 2008 on unauthorised and concealed market activities discovered in January 2008. This information is presented in Appendix 3. However, in order to provide more relevant information on the Group’s performance, the figures in this document correspond to reported historic data. The comments are also based on these reported data.
2- The interim consolidated results at June 30th 2008 and the comparative information established for this purpose are reviewed by the Statutory Auditors. They were approved by the Board of Directors on August 4th 2008 The financial information presented for the six-month period ended June 30th 2008 has been prepared in accordance with IFRS (International Financial Reporting Standards) as adopted in the European Union on June 30th 2008. In particular, the Group’s summarised interim consolidated financial statements have been prepared and are presented in accordance with IAS 34 "Interim Financial Reporting". 3- Group ROE is calculated on the basis of average Group shareholders’ equity under IFRS excluding (i) unrealised or deferred capital gains or losses booked directly under shareholders' equity excluding conversion reserves, (ii) deeply subordinated notes, (iii) undated subordinated notes recognised as shareholders’ equity, and deducting (iv) interest to be paid to holders of deeply subordinated notes and of the reclassified, undated subordinated notes. The net income used to calculate ROE excludes interest, net of tax impact, to be paid to holders of deeply subordinated notes for the period and, as of 2006, to the holders of reclassified, undated subordinated notes (i.e. EUR 23 million in Q2 2008 and EUR 83 million in 2007 vs. EUR 22 million in Q2 2007). 4- Earnings per share is the ratio of (i) net income for the period after deduction (as of 2005) of the interest, net of tax, to be paid to holders of deeply subordinated notes (EUR 20 million in Q2 2008 and EUR 15 million in Q2 2007) and, as of 2006, the interest, net of tax, to be paid to holders of undated subordinated notes which were reclassified from debt to shareholders' equity (EUR 14 million in Q2 2008 vs. EUR 11 million in Q2 2007) and (ii) the average number of shares outstanding excluding treasury shares, but taking into account (a) trading shares held by the Group, and (b) shares held under the liquidity contract. 5- Net assets are comprised of Group shareholders’ equity, excluding (i) deeply subordinated notes (EUR 4.3 billion), undated subordinated notes previously recognised as debt (EUR 0.8 billion) and (ii) interest to be paid to holders of deeply subordinated notes and undated subordinated notes, but reinstating the book value of trading shares held by the Group and shares held under the liquidity contract. The number of shares used to calculate book value per share is the number outstanding at June 30th 2008, excluding treasury shares but including (a) trading shares held by the Group and (b) shares held under the liquidity contract.
APPENDIX 2: METHODOLOGY

24/26
3.1 Comparative income statement for Q2 and H1
APPENDIX 3: FICTITIOUS OPERATIONS RECORDED ON UNAUTHORISED AND CONCEALED MARKET ACTIVITIES HAVE BEEN RESTATED
(in millions of euros)Q2 07
Restated Q2 08 ChgeH1 07
Restated H1 08 Chge
GROUPNet banking income 6,622 5,584 -1,038 12,668 11,263 -1,405Operating expenses -3,817 -3,957 -140 -7,515 -7,862 -347Gross operating income 2,805 1,627 -1,178 5,153 3,401 -1,752Net allocation to provisions -186 -387 -201 -378 -985 -607Operating income excluding net gains orlosses on unauthorised and concealedmarket activities
2,619 1,240 -1,379 4,775 2,416 -2,359
Net loss on unauthorised and concealed market activities -2,064 0 2,064 -2,161 0 2,161
Operating income including net gains orlosses on unauthorised and concealedmarket activities
555 1,240 685 2,614 2,416 -198
Net income from other assets 6 35 29 30 641 611Net income from companies accounted for by the equity method
9 7 -2 20 12 -8
Impairment losses on goodwill 0 0 0 0 0 0Income tax -8 -432 -424 -588 -951 -363Net income before minority interests 562 850 288 2,076 2,118 42 o.w. minority interests 171 206 35 318 378 60Net income 391 644 253 1,758 1,740 -18Average allocated capital 22,986 29,033 23,111 27,235ROE after tax 6.4% 8.6% 14.9% 12.3%

25/26
3.2 Reported 2007 historic quarterly results have been restated for the fictitious operations recorded on unauthorised and concealed market activities
(in millions of euros)
Reported Restated Reported Restated Reported Restated Reported RestatedCorporate and Investment Banking
Net banking income 1,947 1,947 2,077 2,077 1,159 1,159 -661 -661Operating expenses -1,081 -1,081 -1,112 -1,112 -743 -743 -489 -489Gross operating income 866 866 965 965 416 416 -1,150 -1,150Net allocation to provisions 29 29 31 31 -9 -9 5 5Operating income excluding net gains orlosses on unauthorised and concealedmarket activities
895 895 996 996 407 407 -1,145 -1,145
Net loss on unauthorised and concealed market activities 0 -97 0 -2,064 0 2,524 -4,911 -5,274
Operating income including net gains orlosses on unauthorised and concealedmarket activities
895 798 996 -1,068 407 2,931 -6,056 -6,419
Net income from other assets 1 1 -1 -1 2 2 24 24Net income from companies accounted for by the equity method
6 6 2 2 6 6 5 5
Impairment losses on goodwill 0 0 0 0 0 0 0 0Income tax -233 -200 -274 428 -101 -959 2,109 2,232Net income before minority interests 669 605 723 -639 314 1,980 -3,918 -4,158 o.w. minority interests 3 3 2 2 4 4 0 0Net income 666 602 721 -641 310 1,976 -3,918 -4,158
Corporate CentreNet banking income 36 36 92 92 38 38 154 154Operating expenses -14 -14 -32 -32 -16 -16 -32 -32Gross operating income 22 22 60 60 22 22 122 122Net allocation to provisions 0 0 5 5 -1 -1 -17 -17Operating income 22 22 65 65 21 21 105 105Net loss on unauthorised and concealed 0 0 4 4 -1 -1 -16 -16Net income from companies accounted for by the equity method
-1 -1 -2 -2 -1 -1 -2 -2
Impairment losses on goodwill 0 0 0 0 0 0 0 0Income tax 16 16 45 54 33 22 -211 -209Net income before minority interests 37 37 112 121 52 41 -124 -122 o.w. minority interests 57 57 62 62 59 59 44 44Net income -20 -20 50 59 -7 -18 -168 -166
GROUPNet banking income 6,046 6,046 6,622 6,622 5,375 5,375 3,880 3,880Operating expenses -3,698 -3,698 -3,817 -3,817 -3,374 -3,374 -3,416 -3,416Gross operating income 2,348 2,348 2,805 2,805 2,001 2,001 464 464Net allocation to provisions -192 -192 -186 -186 -226 -226 -301 -301Operating income excluding net gains orlosses on unauthorised and concealedmarket activities
2,156 2,156 2,619 2,619 1,775 1,775 163 163
Net loss on unauthorised and concealed market activities 0 -97 0 -2,064 0 2,524 -4,911 -5,274
Operating income including net gains orlosses on unauthorised and concealedmarket activities
2,156 2,059 2,619 555 1,775 4,299 -4,748 -5,111
Net income from other assets 24 24 6 6 -3 -3 13 13Net income from companies accounted for by the equity method
11 11 9 9 12 12 12 12
Impairment losses on goodwill 0 0 0 0 0 0 0 0Income tax -613 -580 -719 -8 -484 -1,353 1,534 1,659Net income before minority interests 1,578 1,514 1,915 562 1,300 2,955 -3,189 -3,427
Q1
2007
Q2 Q3 Q4

26/26
APPENDIX 4: IMPACT OF NON-RECURRING ITEMS ON PRE-TAX PROFITS
EUR m Q1 07 Q2 07 Q1 08 Q2 08 H1 07 H1 08French Networks - 36 - - 36 -
Euronext capital gain - 36 - - 36 -
Global Investment Management and Securities - 165 -274 - 165 -274Asset Management - - - 274 - - - 274
Liquidity support provided to certain funds - - - 274 - - - 274 Private Banking - 1 - - 1 -
Euronext capital gain - 1 - - 1 - SG SS, Brokers and Online Savings - 164 - - 164 -
Euronext capital gain at SG SS - 159 - - 159 - Euronext capital gain at Fimat - 5 - - 5 -
Corporate and Investment Banking - 6 60 31 - 1,223 54 - 1,192 Equities 1 20 200 - 68 21 132
Euronext capital gain at SG CIB - 34 - - 34 - Revaluation of financial liabilities + Own shares 1 - 14 200 - 68 - 13 132
Fixed Income, Currencies and Commodities 1 26 - 868 - 661 27 - 1,529 Revaluation of financial liabilities - - 323 - 79 - 244 Losses and write-downs on exotic credit derivatives 14 10 - 417 - 372 24 - 789 Write-down of unhedged CDOs - 5 - 37 - 350 - 20 - 42 - 370 Write-down of monolines - - - 203 - 98 - - 301 Write-down of RMBS - 8 - 29 - 43 - 15 - 37 - 58 Write-down of European ABS sold by SGAM - - - 166 - 84 - - 250 Write-down/Reversal of SIV PACE - - - 12 7 - - 5 ICE capital gain - 82 - - 82 -
Financing and Advisory - 8 14 699 - 494 6 205
MtM value of CDS - 8 14 743 - 501 6 242
Write-down/Reversal of Non IG transactions in underwriting - - - 44 7 - - 37
Corporate Centre - - - 306 - 306 Revaluation of financial liabilities at Crédit du Nord - - - 44 - 44 Capital gain on Muscat - - - 262 - 262
Total impact on GROUP NBI - 6 261 - 243 - 917 255 - 1,160 Corporate and Investment Banking - - - 282 - - - 282
Allocations to a few accounts - - - 282 - - - 282
Corporate Centre - - 602 - - 602 Capital gain on Fimat - - 602 - - 602
- 6 261 77 - 917 255 - 840
Non-recurring
items in NBI
Net alloc. to provisions
Net gain on other assets
Total impact on GROUP
Related Documents
![Georgian Banking Sector And Tbc Bank 2011 Q2[1]](https://static.cupdf.com/doc/110x72/555c8a33d8b42a85758b45c8/georgian-banking-sector-and-tbc-bank-2011-q21.jpg)