FIRST HALF 2016 STOCKHOLDER LETTER AND SEMIANNUAL REPORT NYSE SYMBOLS: ECC / ECCA / ECCZ

Welcome message from author
This document is posted to help you gain knowledge. Please leave a comment to let me know what you think about it! Share it to your friends and learn new things together.
Transcript

F I R S T H A L F 2 0 1 6 S T O C K H O L D E R L E T T E R A N D
S E M I A N N U A L R E P O R T NYSE SYMBOLS: ECC / ECCA / ECCZ


Not Part of the Semiannual Report 1
Dear Stockholders:
We are pleased to provide you with the enclosed report of Eagle Point Credit Company Inc. (“we”, “us”, “our” or the “Company”) for the six months ended June 30, 2016.
The Company’s primary investment objective is to generate high current income, with a secondary objective to generate capital appreciation. We seek to achieve these objectives by investing primarily in equity and junior debt tranches of collateralized loan obligations (“CLOs”) and may also invest in other securities or instruments that are related investments or that that are consistent with our investment objective. The Company has a long-term oriented investment philosophy and invests with a primarily buy-and-hold mentality.
While 2016 began with a notably bearish sentiment, total returns for the six months ended June 30, 2016 for the S&P 500 Index, Merrill Lynch High Yield Master II Index, and Credit Suisse Leverage Loan Index (“CSLLI”) were strong, registering 3.84%, 9.32%, and 4.23%, respectively.1 To put the strength of the loan market recovery into perspective, from the trough experienced on February 12, 2016 through June 30, 2016, the average price of the CSLLI rose by 3.52 points (from 89.33 to 92.85), generating a total return during the period of 5.97%. From June 30, 2016 through August 19, 2016, the average price of the CSLLI rose by another 1.29 points (from 92.85 to 94.14).
As long term investors, the Company sought to capitalize on the price volatility during the first half of the year. As described further below, the CLO equity investments that we made during the first half of 2016 had a weighted average effective yield 1.63% greater than our overall CLO equity portfolio at the beginning of the year.2
The quality of our investments, coupled with the strength in the market and other factors as described below, had a favorable impact on the value of the Company’s investment portfolio. From December 31, 2015 through June 30, 2016, the Company’s net asset value (“NAV”) increased by 5.39%, from $13.72 per share of common stock to $14.46 per share. In addition, as described below, during this period, the Company declared aggregate distributions payable to common stockholders of $1.20 per share. As of July 31, 2016, management’s estimate of the Company’s NAV per share was $16.33, representing an increase of 12.9% from June 30, 2016.
1 The CSLLI tracks the investable universe of the US dollar-denominated leveraged loan market. The
Merrill Lynch US High Yield Master II Index tracks the performance of US dollar-denominated below investment grade corporate debt publicly issued in the US domestic market. The S&P 500 Index tracks the performance of US equity markets and is based on the market capitalization of 500 large companies having common stock listed on the NYSE or NASDAQ. The performance of an index is not an exact representation of any particular investment, as you cannot invest directly in an index.
2 The weighted average effective yield of these CLO equity investments includes an allowance for future credit losses. Past performance is not indicative of, or a guarantee of, future performance.
August 22, 2016

Not Part of the Semiannual Report 2
While the fair value of the Company’s investment portfolio fell then rose during the first six months of 2016, cash flows from our investment portfolio continued unabated during the period. During the first six months of 2016, we collected $45.0 million of cash flows, $3.18 per share of common stock (based on the average daily number of shares outstanding over the period) from our investment portfolio.
As of June 30, 2016, our shares of common stock were trading at a premium to NAV and our preferred stock and unsecured debt were both trading at premiums to their liquidation values.3
During the first six months of 2016, the Company completed two public securities offerings. We believe that both of the offerings were benefical to the Company and will help us maximize stockholder value, allowing us to grow in a prudent manner and continue to seek vintage period diversification within our investment portfolio.
COMPANY OVERVIEW
Common Stock
The Company’s common stock trades on the New York Stock Exchange (“NYSE”) under the symbol “ECC”. As of June 30, 2016, the NAV per share of the Company’s common stock was $14.46. The trading price of our common stock may differ from NAV per share. The closing price per share of our common stock was $16.10 on June 30, 2016, representing a 11.34% premium to NAV per share as of such date. The total return on our common stock for the six months ended June 30, 2016, inclusive of reinvestment of distributions, was 5.23%.
As of August 19, 2016, the closing price per share of common stock was $17.78, representing a 8.9% premium to management’s estimate for NAV per share of $16.33 as of July 31, 2016.
On May 13, 2016, the Company announced that it priced the public offering of 1,250,000 shares of its common stock at $17.65 per share, which resulted in net proceeds to the Company of $20.8 million after payment of underwriting discounts and commissions and estimated offering expenses payable by the Company. The price per share in the offering (after fees and expenses) represented a 16.1% premium to management’s estimate of the Company’s net asset value per share of common stock as of April 30, 2016 of $14.33. The net proceeds from this common stock issuance increased our NAV by $0.19 per share.
During the six months ended June 30, 2016, the Company declared aggregate distributions payable to common stockholders of $1.20 per share, or $0.60 per calendar quarter. This represents a 14.6% annualized distribution rate based on the average daily share price of our
3 An investment company trades at a premium when the market price at which its shares trade is more
than its net asset value per share. Alternatively, an investment company trades at a discount when the market price at which its shares trade is less than its net asset value per share. Past performance is not indicative of, or a guarantee of, future performance.

Not Part of the Semiannual Report 3
common stock during the six-month period of $16.43. A portion of these distributions was comprised of a return of capital to common stockholders as disclosed at the time of the distributions.
Given our current portfolio, we expect to continue a base quarterly distribution of $0.60 per share of common stock over time, though we note that the actual components and amount of such distributions are subject to variation from time to time.
Since the time of our initial public offering (“IPO”), as available cash was invested (including cash raised from issuances of Series A Term Preferred Stock and Series 2020 Notes), the amount of the distribution covered by net investment income grew steadily from $0.31 per share in Q4 2014 to $0.61 per share in Q1 2016. Surpassing $0.60 per share in quarterly net investment income represented an important milestone for the Company in that the $0.60 per share quarterly distribution was fully covered by net investment income in Q1 2016. In Q2 2016, the Company’s net investment income and realized gains were, in the aggregate, $0.57 per share of common stock (based on the average daily number of shares outstanding over the period). The decrease in aggregate net investment income and realized gains per share in Q2 2016 is attributable to capital raised during the quarter that had yet to be fully invested by quarter end. Eagle Point Credit Management LLC, our investment adviser (our “Adviser”), anticipates that once a significant portion of our available cash is deployed, the run-rate quarterly net investment income per share should, all else equal, begin to increase again over time.
During every quarter since our IPO, quarterly cash flows from the investment portfolio have covered our distributions. These cash flows remained strong during the first half of 2016, totaling $45.0 million over the six month period, or $3.18 per share of common stock (based on the average daily number of shares outstanding over the period).
As of June 30, 2016, we had debt and preferred securities outstanding which totaled approximately 30.8% of our total assets (less current liabilities), which is in line with management’s expectations under current market conditions of operating the Company with leverage (in the form of borrowings, debt securities and/or preferred stock) within a range of 25% to 35% of total assets. As market conditions evolve, or should significant opportunities present themselves, the Company may incur leverage outside of this range, subject to applicable regulatory limits.
We also want to highlight the Company’s dividend reinvestment plan for common stockholders. This plan allows common stockholders to have their distributions automatically reinvested into new shares of common stock. If the prevailing market price of our common stock exceeds our NAV per share by a certain margin as described in the plan, such reinvestment is at a discount to the prevailing market price. We encourage all common stockholders to carefully review the terms of the plan.

Not Part of the Semiannual Report 4
Series A Term Preferred Stock
As of June 30, 2016, the Company had 1,818,000 shares of Series A Term Preferred Stock due 2022 (“Series A Term Preferred Stock”) outstanding. The Series A Term Preferred Stock has a liquidation preference of $25 per share and carries a 7.75% annual dividend, payable monthly. We are required to redeem the Series A Term Preferred Stock on June 30, 2022 and may redeem the outstanding shares of the Series A Term Preferred Stock in whole or in part at our option on or after June 29, 2018.
The Series A Preferred Stock trades on the NYSE under the symbol “ECCA”. On June 30, 2016, the closing price of the Series A Term Preferred Stock was $25.52 per share. As of August 19, 2016, the closing price of the Series A Term Preferred Stock was $25.91.
During the six-month period ending June 30, 2016, we paid aggregate dividends of $0.97 per share of the Series A Term Preferred Stock.
Series 2020 Notes
On June 1, 2016, the Company priced a public offering of $24,998,750 aggregate principal amount of the Series 2020 Notes, which resulted in net proceeds to the Company of approximately $24.0 million after payment of underwriting discounts and commissions and estimated offering expenses payable by the Company.
As of June 30, 2016, the Company had $49,998,750 aggregate principal amount of the Series 2020 Notes outstanding. As noted in subsequent developments below, the Company has issued additional Series 2020 Notes.
The Series 2020 Notes mature on December 31, 2020 and may be redeemed in whole or in part at the Company’s option on or after December 31, 2017. The Series 2020 Notes bear interest at a rate of 7.00% per year, payable quarterly, and are rated “A-” by Egan-Jones Rating Company.
The Series 2020 Notes were issued in minimum denominations of $25 (and integral multiples thereof) and trade on the NYSE under the symbol “ECCZ”. On June 30, 2016, the closing price of the Series 2020 Notes was $26.08 per $25 principal amount. As of August 19, 2016, the closing price of the Series 2020 Notes was $26.16.
PORTFOLIO OVERVIEW
First Half of 2016 Portfolio Update
Our portfolio continues to generate meaningful cash flow. During the six month period ended June 30, 2016, the Company received cash distributions from our portfolio of $45.0 million, or approximately $3.18 per share of common stock (based on the average daily number of shares outstanding over the period). We seek to reinvest cash flows in excess of our costs, including

Not Part of the Semiannual Report 5
our financing costs, and common stock distributions in a manner consistent with our investment objectives and strategy.
During the six months ended June 30, 2016, the Company made 19 new investments with total purchase proceeds of $99.0 million (inclusive of amounts reinvested). This includes 14 CLO equity investments of which 4 (representing $43.5 million of purchase proceeds) were primary market CLO equity investments and 10 were made in the secondary market (representing $23.5 million of purchase proceeds).
During the first six months of 2016, we believe that the Company was able to capitalize on the volatility in the broad markets. The CLO equity purchased during the period had a weighted average effective yield of 18.31%. This compares favorably to a weighted average effective yield on our CLO equity portfolio of 16.68% as of December 31, 2015. Importantly, we highlight that the Company’s effective yields include an allowance for future credit losses.
Our Adviser continues to seek attractive investment opportunities on our behalf and continues to evaluate a large number of opportunities both in the primary and secondary markets. Maintaining varied exposure to CLO vintage periods remains a very important part of our investment approach, and our Adviser remains selective in its investment process with this approach in mind. As of June 30, 2016, our Adviser has over $1.2 billion of assets under management (inclusive of unfunded capital commitments) and we believe the scale and experience of our Adviser in CLO investing provides the Company with meaningful advantages.
Included within the enclosed report, you will find detailed portfolio information, including certain look-through information related to the underlying collateral characteristics of the CLO equity and other unrated investments that we held as of June 30, 2016.
MARKET OVERVIEW
Loan Market
Following the 2015 calendar year, which was only the second year of negative total returns (-0.38%) for the CSLLI in its 24-year history, the CSLLI fell in both January and February of 2016, generating a total return of -1.28% for the two months ended February 28, 2016. However, from the trough experienced on February 12, 2016 through June 30, 2016, the average price of the CSLLI rose by 3.52 points (from 89.33 to 92.85), a total return during the period of 5.97%. From June 30, 2016 through August 19, 2016, the average price of the CSLLI rose by another 1.29 points (from 92.85 to 94.14).
New issue US institutional loan volume decreased to $128.1 billion in the first half of 2016 from the $141.2 billion recorded during the first half of 2015, according to S&P Capital IQ. As of June 30, 2016, there was approximately $894 billion of loans outstanding according to S&P Capital IQ, up slightly from $881 billion as of December 31, 2015. We believe this sizeable market will allow for a broad range of reinvestment opportunities for the CLOs in our portfolio.

Not Part of the Semiannual Report 6
CLO Market
For the six months ended June 30, 2016, U.S. CLO issuance totaled $26.2 billion (with $8.2 billion issued in Q1 and $18.0 billion issued in Q2) according to S&P Global Market Intelligence. This compares to $59.9 billion for the first half of 2015. Our Adviser believes that the decrease in CLO issuance during the first half of 2016 as compared to the first half of 2015 is attributable to a handful of factors including primarily the market volatility during Q1 2016 and certain market technical factors.
Drafts of U.S. Securitization Risk Retention Rules were originally published in August 2013 and have been garnering increased attention in the market. Under the US risk retention rules, which are expected to take force for CLOs issued in December 2016, a CLO sponsor (e.g., the collateral manager of the CLO) is generally required to retain a 5% interest in the credit risk of the assets collateralizing the CLO. Risk retention can be satisfied using a “vertical” investment (i.e., through holding interests in each tranche of a CLO) or “horizontal” investment (i.e., through holding interests in the first loss tranche of a CLO). We believe that there is no “one size fits all” approach to satisfying the risk retention requirement and that there are a number of viable alternatives for CLO collateral managers to pursue to comply with the requirement. Importantly, there is no requirement to bring existing CLOs issued prior to the effective date into compliance once the rules take force.
Nevertheless, a number of the CLOs in the Company’s portfolio have already been designed to be compliant with the rules using the “vertical” approach.
SUBSEQUENT DEVELOPMENTS
In the period from July 1, 2016 through August 19, 2016, we received cash distributions on our investment portfolio of $20.8 million. From July 1, 2016 to August 19, 2016, we made new investments totaling $12.4 million.
On August 8, 2016, the Company priced an offering of an additional $10,000,000 aggregate principal amount of Series 2020 Notes, which resulted in net proceeds to the Company of approximately $9.9 million after payment of estimated offering expenses payable by the Company. As of the date of this letter, the Company has $59,998,750 aggregate principal amount of Series 2020 Notes outstanding.
ADDITIONAL INFORMATION
In addition to the Company’s regulatory requirement to file certain quarterly and semi-annual portfolio information as described further in the enclosed report, the Company makes a monthly estimate of NAV and certain additional financial information available to investors via our website (www.eaglepointcreditcompany.com). This information includes (1) an estimated range of the Company’s net investment income and realized capital gains or losses per share of common stock for each calendar quarter end, generally made available within the first fifteen days after the applicable calendar month end, (2) an estimated range of the Company’s NAV per share of common stock for the prior month end and certain additional

Not Part of the Semiannual Report 7
portfolio-level information, generally made available within the first fifteen days after the applicable calendar month end, and (3) during the latter part of each month, an updated estimate of NAV, if applicable, and, with respect to each calendar quarter end, an updated estimate of the Company’s net investment income and realized capital gains or losses per share for the applicable quarter, if available.
We appreciate the trust and confidence our stockholders have placed in the Company.
Thomas Majewski Chief Executive Officer
This letter is intended to assist stockholders in understanding the Company’s performance during the six months ended June 30, 2016. The views and opinions in this letter were current as of August 22, 2016. Statements other than those of historical facts included herein may constitute forward-looking statements and are not guarantees of future performance or results and involve a number of risks and uncertainties. Actual results may differ materially from those in the forward-looking statements as a result of a number of factors. The Company undertakes no duty to update any forward-looking statement made herein.

Page Intentionally Left Blank
i
Eagle Point Credit Company Inc. Semiannual Report – June 30, 2016
Table of Contents
Important Information ................................................................................................................................................................. ii
Summary of Certain Unaudited Portfolio Characteristics............................................................................................................ 1
Consolidated Financial Statements for the Six Months Ended June 30, 2016 (Unaudited) ......................................................... 3
Dividend Reinvestment Plan ..................................................................................................................................................... 31
Additional Information .............................................................................................................................................................. 33

ii
Important Information
This report is transmitted to the stockholders of Eagle Point Credit Company Inc. (“we”, “us”, “our” or the “Company”) and is furnished pursuant to certain regulatory requirements. This report is provided for informational purposes only, does not constitute an offer to sell securities of the Company and is not a prospectus.
Investors should read the Company’s prospectus carefully and consider their investment goals, time horizons and risk tolerance before investing in the Company. Investors should consider the Company’s investment objectives, risks, charges and expenses carefully before investing in securities of the Company. There is no guarantee that any of the goals, targets or objectives described in this report will be achieved.
An investment in the Company is not appropriate for all investors. The investment program of the Company is speculative, entails substantial risk and includes investment techniques not employed by traditional mutual funds. An investment in the Company is not intended to be a complete investment program. Shares of closed-end investment companies, such as the Company, frequently trade at a discount from their net asset value (“NAV”), which may increase investors’ risk of loss. Past performance is not indicative of, or a guarantee of, future performance. The performance and certain other portfolio information quoted herein represents information as of June 30, 2016. Nothing herein should be relied upon as a representation as to the future performance or portfolio holdings of the Company. Investment return and principal value of an investment will fluctuate, and shares, when sold, may be worth more or less than their original cost. The Company’s performance is subject to change since the end of the period noted in this report and may be lower or higher than the performance data shown herein.
Neither Eagle Point Credit Management LLC (the “Adviser”) nor the Company provide legal, accounting or tax advice. Any statement regarding such matters is explanatory and may not be relied upon as definitive advice. Investors should consult with their legal, accounting and tax advisors regarding any potential investment. The information presented herein is as of the dates noted herein and is derived from financial and other information of the Company, and, in certain cases, from third party sources and reports (including reports of third party custodians, CLO managers and trustees) that have not been independently verified by the Company. As noted herein, certain of this information is estimated and unaudited, and therefore subject to change. We do not represent that such information is accurate or complete, and it should not be relied upon as such.
For more complete information, or to obtain a prospectus, please visit http://www.eaglepointcreditcompany.com.
About Eagle Point Credit Company Inc.
The Company is a publicly-traded, non-diversified, closed-end management investment company. The Company’s investment objectives are to generate high current income and capital appreciation primarily through investment in equity and junior debt tranches of CLOs. The Company is externally managed and advised by Eagle Point Credit Management LLC. The principals of Eagle Point Credit Management LLC are Thomas P. Majewski, Daniel W. Ko and Daniel M. Spinner. The Company makes certain unaudited financial and portfolio information available each month on its website (www.eaglepointcreditcompany.com). This information includes (1) an estimated range of the Company’s net investment income (“NII”) and realized capital gains or losses per share of common stock for each calendar quarter end, generally made available within the first fifteen days after the applicable calendar month end, (2) an estimated range of the Company’s net asset value (“NAV”) per share of common stock for the prior month end and certain additional portfolio-level information, generally made available within the first fifteen days after the applicable calendar month end, and (3) during the latter part of each month, an updated estimate of NAV, if applicable, and, with respect to each calendar quarter end, an updated estimate of the Company’s NII and realized capital gains or losses per share for the applicable quarter, if available.
Forward-Looking Statements
This report may contain “forward-looking statements” within the meaning of the Private Securities Litigation Reform Act of 1995. Statements other than statements of historical facts included in this report may constitute forward-looking statements and are not guarantees of future performance or results and involve a number of risks and uncertainties. Actual results may differ materially from those in the forward-looking statements as a result of a number of factors, including those described in the Company’s filings with the US Securities and Exchange Commission. The Company undertakes no duty to update any forward-looking statement made herein. All forward-looking statements speak only as of the date of this report.
1. Depending on when such information was received, this data may reflect a lag in the information reported. As such, while this information was obtained from third party data sources, June 2016 trustee reports and similar reports, it does not reflect actual underlying portfolio characteristics as of June 30, 2016 and this data may not be representative of current or future holdings.Industry categories are based on the S&P industry categorization of each obligor as set forth in CLO trustee reports relating to investments held by the Company or, if such information is not available in CLO trustee reports, the categories are based on equivalent categorizations as reported by a third party data provider. In addition, certain underlying borrowers may be re‐classified from time to time based on developments in their respective businesses and/or market practices. Accordingly, certain underlying borrowers that are currently, or were previously, summarized as a single borrower or in a particular industry may in current or future periods be reflected as multiple borrowers or in a different industry, as applicable.
2 We obtain exposure in underlying senior secured loans indirectly through our investments in CLOs. 3 “LIBOR” refers to the London Interbank Offered Rate. 4 Credit ratings shown are based on those assigned by Standard & Poor’s Rating Group, or “S&P,” or, for comparison and informational purposes, if
S&P does not assign a rating to a particular obligor, the weighted average rating shown reflects the S&P equivalent rating of a rating agency that rated the obligor provided that such other rating is available with respect to a CLO equity or related investment held by us. In the event multiple ratings are available, the lowest S&P rating, or if there is no S&P rating, the lowest equivalent rating, is used. The ratings of specific borrowings by an obligor may differ from the rating assigned to the obligor and may differ among rating agencies. Ratings below BBB- are below investment grade. Further information regarding S&P’s rating methodology and definitions may be found on its website (www.standardandpoors.com).
5 This data includes underlying portfolio characteristics of the Company’s CLO equity and loan accumulation facility portfolio.
1
Summary of Certain Unaudited Portfolio Characteristics
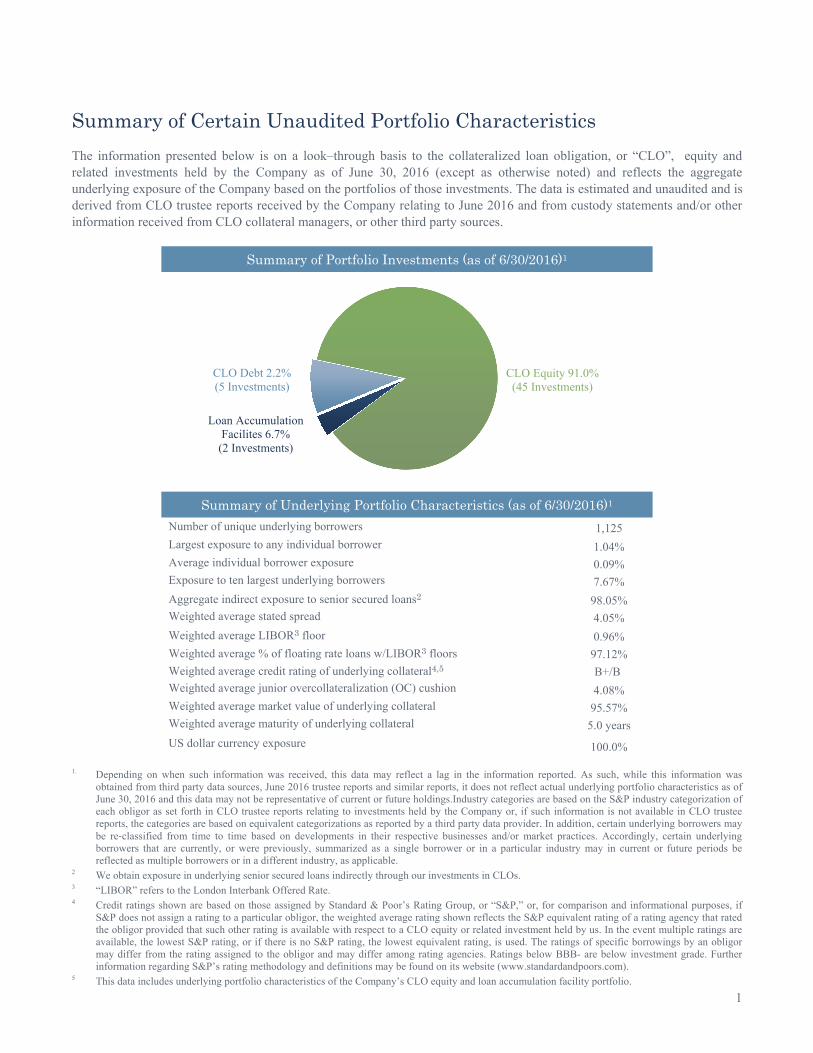
The information presented below is on a look–through basis to the collateralized loan obligation, or “CLO”, equity and related investments held by the Company as of June 30, 2016 (except as otherwise noted) and reflects the aggregate underlying exposure of the Company based on the portfolios of those investments. The data is estimated and unaudited and is derived from CLO trustee reports received by the Company relating to June 2016 and from custody statements and/or other information received from CLO collateral managers, or other third party sources.
Summary of Portfolio Investments (as of 6/30/2016)1
Summary of Underlying Portfolio Characteristics (as of 6/30/2016)1
Number of unique underlying borrowers 1,125 Largest exposure to any individual borrower 1.04% Average individual borrower exposure 0.09% Exposure to ten largest underlying borrowers 7.67%
Aggregate indirect exposure to senior secured loans2 98.05% Weighted average stated spread 4.05%
Weighted average LIBOR3 floor 0.96%
Weighted average % of floating rate loans w/LIBOR3 floors 97.12%
Weighted average credit rating of underlying collateral4,5 B+/B Weighted average junior overcollateralization (OC) cushion 4.08% Weighted average market value of underlying collateral 95.57% Weighted average maturity of underlying collateral 5.0 years
US dollar currency exposure 100.0%
CLO Equity 91.0% (45 Investments)
Loan Accumulation Facilites 6.7%
(2 Investments)
CLO Debt 2.2% (5 Investments)

Please see footnote disclosures on the preceding page
2
The top ten underlying obligors on a look-through basis to the Company’s CLO equity and other unrated investments as of June 30, 2016 are provided below:
Obligor % of Total Dell 1.0% Asurion 0.9% Albertsons 0.8% American Airlines 0.8% Avago Technologies 0.8% Valeant Pharmaceuticals 0.8% First Data 0.7% Community Health Systems 0.7% Numericable 0.6% Altice 0.6% Total 7.7%
The credit ratings distribution of the underlying obligors on a look-through basis to the Company’s CLO equity and other unrated investments as of June 30, 2016 is provided below:
The top ten industries of the underlying obligors on a look-through basis to the Company’s CLO equity and other unrated investments as of June 30, 2016 are provided below:
Industry % of Total Business equipment & services 9.3% Electronics/electrical 8.6% Health care 8.1% Leisure goods/activities/movies 5.6% Financial intermediaries 5.1% Telecommunications 5.0% Retailers (except food and drug) 4.7% Chemicals & plastics 4.6% Lodging & casinos 3.3% Oil & gas 3.2% Total 57.6%
The maturity distribution of the underlying obligors on a look-through basis to the Company’s CLO equity and other unrated investments as of June 30, 2016 is provided below:
0.02% 1.3% 5.1% 4.6%
14.5%
21.8%
38.9%
8.8%
2.3% 0.7% 1.3%
0%
10%
20%
30%
40%
50%
BBB BBB- BB+ BB BB- B+ B B- CCC+ CCC CCC-and
Below
% F
und
Exp
osur
e
S&P Issuer Rating
0.1% 0.8% 3.8%
9.5%
21.8%
29.5%
23.6%
10.5%
0.5%
0%
10%
20%
30%
40%
2016 2017 2018 2019 2020 2021 2022 2023 2024+
% F
und
Exp
osur
e
Maturity
Top 10 Underlying Obligors1
Rating Distribution of Underlying Obligors1,4
Top 10 Industries of Underlying Obligors1
Maturity Distribution of Underlying Obligors1,5
3
Consolidated Financial Statements for the Six Months Ended June 30, 2016 (Unaudited)
Consolidated Statement of Assets and Liabilities .............................................................................................................. 4
Consolidated Schedule of Investments .............................................................................................................................. 5
Consolidated Statement of Operations ............................................................................................................................... 7
Consolidated Statements of Changes in Net Assets ......................................................................................................... 10
Consolidated Statement of Member’s Equity .................................................................................................................. 11
Consolidated Statement of Cash Flows ........................................................................................................................... 12
Notes to Consolidated Financial Statements .................................................................................................................... 13
Financial Highlights ......................................................................................................................................................... 29

Eagle Point Credit Company Inc. & Subsidiaries Consolidated Statement of Assets and Liabilities
As of June 30, 2016 (expressed in U.S. dollars)
(Unaudited)
See accompanying notes to the consolidated financial statements
4
ASSETS
Investments, at fair value (cost $329,430,496) $ 266,456,961
Cash 53,425,087
Interest receivable 10,037,052
Prepaid expenses 465,781
Total Assets 330,384,881
LIABILITIES
Mandatorily redeemable preferred stock (Note 7):
Mandatorily redeemable preferred stock (1,818,000 shares outstanding) 45,450,000
Unamortized deferred debt issuance costs associated with mandatorily redeemable preferred stock (1,825,240)
Net mandatorily redeemable preferred stock less associated unamortized deferred debt issuance costs 43,624,760
Unsecured notes payable (Note 8):
Unsecured notes payable (1,999,950 notes outstanding) 49,998,750
Unamortized deferred debt issuance costs associated with unsecured notes payable (2,172,811)
Net unsecured notes payable less associated unamortized deferred debt issuance costs 47,825,939
Common stock distribution payable 9,073,495
Payable for securities purchased 6,414,745
Incentive fee payable 2,918,763
Management fee payable 1,118,688
Due to affiliates 347,358
Administration fees payable (Note 4) 166,495
Professional fees payable 91,089
Directors' fees payable 86,375
Other expenses payable 5,405
Total Liabilities 111,673,112
COMMITMENTS AND CONTINGENCIES (Note 10)
NET ASSETS applicable to 15,122,491 shares of $0.001 par value common stock outstanding $ 218,711,769
NET ASSETS consist of:
Paid-in capital (Notes 5 & 6) $ 292,011,630
Accumulated net realized gain (loss) on investments 1,130,526
Accumulated net unrealized appreciation (depreciation) on investments (62,973,535)
Aggregate common stock distributions paid in excess of net investment income (11,456,852)
Total Net Assets $ 218,711,769
Net asset value per share of common stock $ 14.46

Eagle Point Credit Company Inc. & Subsidiaries Consolidated Schedule of Investments
As of June 30, 2016 (expressed in U.S. dollars)
(Unaudited)
See accompanying notes to the consolidated financial statements
5
Investment (1)
Cost % of Net
Assets
CIFC Funding 2015-III, Ltd. CLO Secured Note - Class F (7.53% due 10/19/27) (3)
$ 1,150,000 $ 1,044,793 $ 797,042 0.36%
Cutwater 2015-I, Ltd. CLO Secured Note - Class F (7.73% due 7/15/27) (3)
3,500,000 3,167,452 2,282,350 1.04%
Marathon CLO VIII Ltd. CLO Secured Note - Class D (6.68% due 7/18/27) (3)
750,000 705,118 545,588 0.25%
THL Credit Wind River 2016-1 CLO Ltd. CLO Secured Note - Class E (8.22% due 7/15/28) (3)
900,000 845,886 839,250 0.38%
Zais CLO 3, Ltd. CLO Secured Note - Class E (7.93% due 7/15/27) (3)
2,600,000 2,313,782 1,579,500 0.72%
8,077,031 6,043,730 2.75%
ALM VIII, Ltd. CLO Preferred Shares (estimated yield of 16.40% due 1/20/26) (4)
2,125,000 1,625,625 1,634,573 0.75%
Apidos CLO XIV CLO Subordinated Note (estimated yield of 15.34% due 4/15/25) (4)(5)
11,177,500 7,523,598 6,084,271 2.78%
Ares XXXIX CLO Ltd. CLO Subordinated Note (estimated yield of 18.04% due 7/18/28) (4)
5,600,000 4,789,120 4,789,120 2.19%
Atrium IX CLO Subordinated Note (estimated yield of 14.35% due 2/28/24) (4)
4,550,000 3,120,638 3,078,886 1.41%
Avery Point V CLO, Ltd. CLO Income Note (estimated yield of 14.57% due 7/17/26) (4)
10,875,000 7,496,767 3,313,861 1.52%
Babson CLO Ltd. 2013-II CLO Subordinated Note (estimated yield of 16.65% due 1/18/25) (4)(5)
12,939,125 7,930,312 6,635,146 3.03%
Battalion CLO IX Ltd. CLO Subordinated Note (estimated yield of 19.03% due 7/15/28) (4)(5)
18,250,000 15,495,426 12,470,660 5.70%
BlueMountain CLO 2013-2, Ltd. CLO Subordinated Note (estimated yield of 15.45% due 1/22/25) (4)
5,000,000 3,899,450 3,140,091 1.44%
Bowman Park CLO Ltd. CLO Subordinated Note (estimated yield of 20.75% due 11/23/25) (4)
8,180,000 5,870,096 4,998,043 2.29%
Carlyle Global Market Strategies CLO 2014-5, Ltd. CLO Subordinated Note (estimated yield of 18.41% due 10/16/25) (4)
8,300,000 5,166,750 5,173,692 2.37%
CIFC Funding 2013-I, Ltd. CLO Subordinated Note (estimated yield of 14.85% due 4/16/25) (4)
4,000,000 2,976,398 2,114,832 0.97%
CIFC Funding 2013-II, Ltd. CLO Subordinated Note (estimated yield of 14.79% due 4/21/25) (4)(5)
12,325,000 6,688,566 6,517,666 2.98%
CIFC Funding 2013-II, Ltd. CLO Income Note (estimated yield of 27.80% due 4/21/25) (4)
4,025,000 1,511,699 2,055,439 0.94%
CIFC Funding 2014, Ltd. CLO Subordinated Note (estimated yield of 18.04% due 4/18/25) (4)(5)
13,387,500 8,583,720 6,748,266 3.09%
CIFC Funding 2014, Ltd. CLO Income Note (estimated yield of 18.04% due 4/18/25) (4)
500,000 344,182 238,951 0.11%
CIFC Funding 2014-III, Ltd. CLO Income Note (estimated yield of 16.19% due 7/22/26) (4)
5,000,000 3,801,015 2,739,996 1.25%
CIFC Funding 2014-IV, Ltd. CLO Income Note (estimated yield of 14.11% due 10/17/26) (4)
7,000,000 5,164,571 3,688,040 1.69%
CIFC Funding 2015-III, Ltd. CLO Subordinated Note (estimated yield of 16.75% due 10/19/27) (4)(5)
15,400,000 11,837,127 11,203,458 5.12%
Cutwater 2015-I, Ltd. CLO Subordinated Note (estimated yield of 19.52% due 7/15/27) (4)(5)
27,300,000 20,494,612 16,560,060 7.57%
Flagship CLO VIII, Ltd. CLO Subordinated Note (estimated yield of 14.82% due 1/16/26) (4)(5)
20,000,000 14,032,337 7,897,716 3.61%
Flagship CLO VIII, Ltd. CLO Income Note (estimated yield of 14.82% due 1/16/26) (4)
7,360,000 4,841,214 2,524,432 1.15%
Galaxy XVIII CLO, Ltd. CLO Subordinated Note (estimated yield of 13.12% due 10/15/26) (4)
5,000,000 3,428,882 1,903,784 0.87%
GoldenTree Loan Opportunities VIII, Limited CLO Subordinated Note (estimated yield of 17.20% due 4/19/26) (4)
16,560,000 13,197,835 10,020,338 4.58%
Halcyon Loan Advisors Funding 2014-3, Ltd. CLO Subordinated Note (estimated yield of 13.43% due 10/22/25) (4)
5,750,000 4,300,418 1,727,005 0.79%
KVK CLO 2013-1 Ltd. CLO Subordinated Note (estimated yield of 37.35% due 4/14/25) (4)
2,575,000 882,875 954,690 0.44%
KVK CLO 2013-2 Ltd. CLO Subordinated Note (estimated yield of 35.81% due 1/15/26) (4)
1,550,000 558,775 558,203 0.26%
Madison Park Funding XIV, Ltd. CLO Subordinated Note (estimated yield of 15.81% due 7/20/26) (4)
2,200,000 1,705,000 1,716,000 0.78%
Marathon CLO VI Ltd. CLO Subordinated Note (estimated yield of 14.24% due 5/13/25) (4)
2,975,000 1,933,050 1,603,250 0.73%
Marathon CLO VII Ltd. CLO Subordinated Note (estimated yield of 15.67% due 10/28/25) (4)
10,526,000 7,964,547 5,505,132 2.52%
Marathon CLO VIII Ltd. CLO Subordinated Note (estimated yield of 19.42% due 7/18/27) (4)
14,500,000 12,180,094 11,142,251 5.09%
Octagon Investment Partners 26, Ltd. CLO Subordinated Note (estimated yield of 16.96% due 4/15/27) (4)(5)
13,750,000 11,446,875 11,196,314 5.12%
Octagon Investment Partners 27, Ltd. CLO Subordinated Note (estimated yield of 17.05% due 7/15/27) (4)(5)
14,800,000 13,120,318 13,249,340 6.06%
Octagon Investment Partners XIV, Ltd. CLO Subordinated Note (estimated yield of 18.17% due 1/15/24) (4)(5)
12,325,000 8,300,184 4,033,082 1.84%
Octagon Investment Partners XIV, Ltd. CLO Income Note (estimated yield of 18.17% due 1/15/24) (4)
4,250,000 2,654,310 1,330,381 0.61%
Octagon Investment Partners XIX, Ltd. CLO Subordinated Note (estimated yield of 15.76% due 4/15/26) (4)
3,000,000 2,118,226 1,283,030 0.59%
Octagon Investment Partners XVII, Ltd. CLO Subordinated Note (estimated yield of 15.08% due 10/25/25) (4)
12,000,000 8,550,042 4,454,656 2.04%
Octagon Investment Partners XX, Ltd. CLO Subordinated Note (estimated yield of 13.45% due 8/12/26) (4)
2,500,000 2,016,040 1,265,774 0.58%
OHA Credit Partners IX, Ltd. CLO Subordinated Note (estimated yield of 12.13% due 10/20/25) (4)
6,750,000 5,440,142 3,420,733 1.56%
Regatta III Funding Ltd. CLO Subordinated Note (estimated yield of 12.29% due 4/15/26) (4)
2,500,000 1,673,667 851,409 0.39%
Sheridan Square CLO, Ltd. CLO Subordinated Note (estimated yield of 21.00% due 4/15/25) (4)(5)
2,125,000 1,588,802 1,324,995 0.61%
Staniford Street CLO, Ltd. CLO Subordinated Note (estimated yield of 35.10% due 6/15/25) (4)
1,550,000 498,801 722,183 0.33%
Symphony CLO XII, Ltd. CLO Subordinated Note (estimated yield of 18.38% due 10/15/25) (4)
1,250,000 728,125 729,379 0.33%
THL Credit Wind River 2013-2 CLO Ltd. Class M Note (estimated yield of 7.68% due 1/18/26) (4)
1,275,000 39,701 378,701 0.17%
THL Credit Wind River 2013-2 CLO Ltd. CLO Subordinated Note (estimated yield of 14.15% due 1/18/26) (4)
11,462,250 8,130,124 6,189,219 2.83%
THL Credit Wind River 2014-1 CLO Ltd. CLO Subordinated Note (estimated yield of 17.43% due 4/18/26) (4)
11,800,000 7,463,500 7,367,079 3.37%
THL Credit Wind River 2014-3 CLO Ltd. CLO Subordinated Note (estimated yield of 17.65% due 1/22/27) (4)
13,000,000 10,417,603 9,933,887 4.54%
THL Credit Wind River 2016-1 CLO Ltd. CLO Subordinated Note (estimated yield of 18.85% due 7/15/28) (4)(5)
16,050,000 14,220,300 14,362,186 6.57%
Voya CLO 2014-4, Ltd. CLO Subordinated Note (estimated yield of 15.28% due 10/14/26) (4)
10,000,000 8,122,054 5,835,969 2.67%
Zais CLO 3, Ltd. CLO Subordinated Note (estimated yield of 19.04% due 7/15/27) (4)(5)
11,750,000 8,479,952 6,423,536 2.94%
304,353,465 243,089,705 111.17%
CLO Debt
CLO Equity
Issuer Principal Amount Fair Value (2)
Eagle Point Credit Company Inc. & Subsidiaries Consolidated Schedule of Investments
As of June 30, 2016 (expressed in U.S. dollars)
(Unaudited)
See accompanying notes to the consolidated financial statements
6
Investment (1)
Cost % of Net
Assets
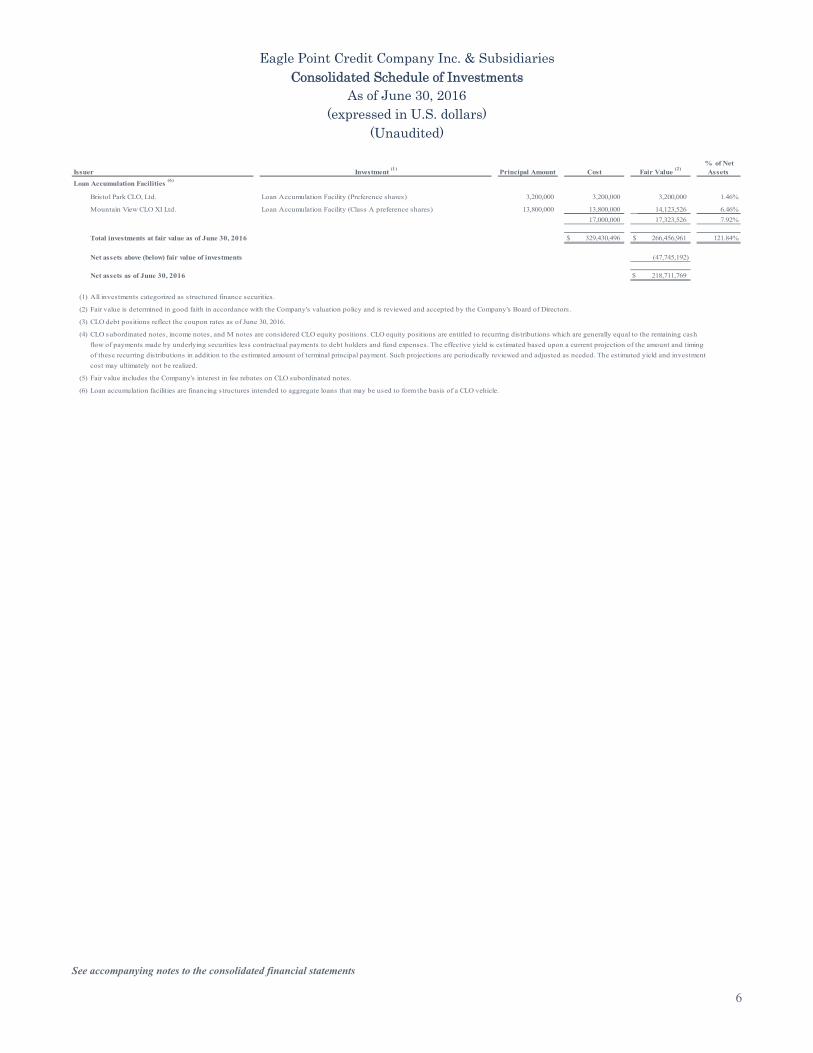
Bristol Park CLO, Ltd. Loan Accumulation Facility (Preference shares) 3,200,000 3,200,000 3,200,000 1.46%
Mountain View CLO XI Ltd. Loan Accumulation Facility (Class A preference shares) 13,800,000 13,800,000 14,123,526 6.46%
17,000,000 17,323,526 7.92%
Total investments at fair value as of June 30, 2016 $ 329,430,496 $ 266,456,961 121.84%
Net assets above (below) fair value of investments (47,745,192)
Net assets as of June 30, 2016 $ 218,711,769
(1)
(2)
(3)
(4)
(5)
(6)
of these recurring distributions in addition to the estimated amount of terminal principal payment. Such projections are periodically reviewed and adjusted as needed. The estimated yield and investment
cost may ultimately not be realized.
Fair value includes the Company's interest in fee rebates on CLO subordinated notes.
Loan accumulation facilities are financing structures intended to aggregate loans that may be used to form the basis of a CLO vehicle.
Loan Accumulation Facilities (6)
All investments categorized as structured finance securities.
Fair value is determined in good faith in accordance with the Company's valuation policy and is reviewed and accepted by the Company's Board of Directors.
CLO debt positions reflect the coupon rates as of June 30, 2016.
CLO subordinated notes, income notes, and M notes are considered CLO equity positions. CLO equity positions are entitled to recurring distributions which are generally equal to the remaining cash
flow of payments made by underlying securities less contractual payments to debt holders and fund expenses. The effective yield is estimated based upon a current projection of the amount and timing
Issuer Principal Amount Fair Value (2)

Eagle Point Credit Company Inc. & Subsidiaries Consolidated Statement of Operations
For the six months ended June 30, 2016 (expressed in U.S. dollars)
(Unaudited)
See accompanying notes to the consolidated financial statements
7
INVESTMENT INCOME
Interest income $ 26,571,134
Other income 456,071
Total Investment Income 27,027,205
EXPENSES
Incentive fee 4,083,857
Management fee 2,118,230
Interest expense on mandatorily redeemable preferred stock 1,913,168
Interest expense on unsecured notes payable 1,157,694
Administration fees (Note 4) 393,604
Professional fees 356,990
Tax expense 275,335
Directors' fees 172,750
Other expenses 220,081
Total Expenses 10,691,709
NET INVESTMENT INCOME 16,335,496
REALIZED AND UNREALIZED GAIN (LOSS) ON INVESTMENTS
Net realized gain (loss) on investments 334,236
Net change in unrealized appreciation (depreciation) on investments 8,102,293
NET GAIN (LOSS) ON INVESTMENTS 8,436,529
NET INCOME (LOSS) AND NET INCREASE (DECREASE) IN NET ASSETS
RESULTING FROM OPERATIONS $ 24,772,025

Eagle Point Credit Company Inc. & Subsidiaries Consolidated Statement of Operations
(expressed in U.S. dollars) (Unaudited)
See accompanying notes to the consolidated financial statements
8
INVESTMENT INCOME
Interest income $ 26,571,134 $ 18,269,044
Other income 456,071 290,373
Total Investment Income 27,027,205 18,559,417
EXPENSES
Incentive fee 4,083,857 2,946,446
Management fee 2,118,230 2,373,030
Interest expense on mandatorily redeemable preferred stock 1,913,168 456,032
Interest expense on unsecured notes payable 1,157,694 -
Administration fees (Note 4) 393,604 304,199
Professional fees 356,990 340,326
Tax expense 275,335 90,250
Directors' fees 172,750 169,000
Other expenses 220,081 164,244
Total Expenses 10,691,709 6,843,527
NET INVESTMENT INCOME 16,335,496 11,715,890
REALIZED AND UNREALIZED GAIN (LOSS) ON INVESTMENTS
Net realized gain (loss) on investments 334,236 258,144
Net change in unrealized appreciation (depreciation) on investments 8,102,293 (1,792,154)
NET GAIN (LOSS) ON INVESTMENTS 8,436,529 (1,534,010)
NET INCOME (LOSS) AND NET INCREASE (DECREASE) IN NET ASSETS
RESULTING FROM OPERATIONS $ 24,772,025 $ 10,181,880
Note: The above Consolidated Statements of Operations includes the six months ended June 30, 2015 which has been provided as supplemental information to the consolidated financial statements.
June 30, 2015six months ended
For the
June 30, 2016six months ended
For the

Eagle Point Credit Company Inc. & Subsidiaries Consolidated Statement of Operations
(expressed in U.S. dollars) (Unaudited)
See accompanying notes to the consolidated financial statements
9
INVESTMENT INCOME
Interest income $ 13,036,697 $ 13,534,437 $ 26,571,134
Other income 230,351 225,720 456,071
Total Investment Income 13,267,048 13,760,157 27,027,205
EXPENSES
Incentive fee 1,975,670 2,108,187 4,083,857
Management fee 1,118,688 999,542 2,118,230
Interest expense on mandatorily redeemable preferred stock 956,649 956,519 1,913,168
Interest expense on unsecured notes payable 660,027 497,667 1,157,694
Administration fees (Note 4) 191,992 201,612 393,604
Professional fees 171,978 185,012 356,990
Tax expense 110,000 165,335 275,335
Directors' fees 86,375 86,375 172,750
Other expenses 92,920 127,161 220,081
Total Expenses 5,364,299 5,327,410 10,691,709
NET INVESTMENT INCOME 7,902,749 8,432,747 16,335,496
REALIZED AND UNREALIZED GAIN (LOSS) ON INVESTMENTS
Net realized gain (loss) on investments 321,439 12,797 334,236
Net change in unrealized appreciation (depreciation) on investments 17,950,763 (9,848,470) 8,102,293
NET GAIN (LOSS) ON INVESTMENTS 18,272,202 (9,835,673) 8,436,529
NET INCOME (LOSS) AND NET INCREASE (DECREASE) IN NET ASSETS
RESULTING FROM OPERATIONS $ 26,174,951 $ (1,402,926) $ 24,772,025
Note: The above Consolidated Statement of Operations represents the quarter ended June 30, 2016, the quarter ended March 31, 2016, and the six months ended June 30, 2016, and has been provided as supplemental information to the consolidated financial statements.
For thethree months ended
March 31, 2016
For thesix months ended
June 30, 2016June 30, 2016
For thethree months ended

Eagle Point Credit Company Inc. & Subsidiaries Consolidated Statements of Changes in Net Assets
(expressed in U.S. dollars) (Unaudited)
See accompanying notes to the consolidated financial statements
10
Net income (loss) and net increase (decrease) in net assets
resulting from operations:
Net investment income $ 16,335,496 $ 26,069,657
Net realized gain (loss) on investments 334,236 265,277
Net change in unrealized appreciation (depreciation) on investments 8,102,293 (67,292,826)
Total net income (loss) and net increase (decrease) in net assets
resulting from operations 24,772,025 (40,957,892)
Common stock distributions paid to stockholders:
Common stock distributions from net investment income (16,335,496) (26,069,657)
Common stock distributions from net realized gains on investments (334,236) (265,277)
Common stock distributions from return of capital (698,844) (6,822,840)
Total common stock distributions paid to stockholders (17,368,576) (33,157,774)
Capital share transactions:
Issuance of shares of common stock upon conversion - -
Issuance of shares of common stock upon the Company's initial public offering - -
Issuance of shares of common stock upon the Company's secondary public offering 20,805,940 -
Proceeds from issuance of shares of common stock in accordance
with the Company's dividend reinvestment plan 895,295 162,291
Total capital share transactions 21,701,235 162,291
Total increase (decrease) in net assets 29,104,684 (73,953,375)
Net assets at beginning of period 189,607,085 263,560,460
Net assets at end of period $ 218,711,769 $ 189,607,085
Capital share activity:
Shares of common stock issued upon conversion - -
Shares of common stock sold upon the Company's initial public offering - -
Shares of common stock sold upon the Company's secondary public offering 1,250,000 -
Shares of common stock issued in accordance with the Company's dividend
reinvestment plan 52,381 8,752
Total increase (decrease) in capital share activity 1,302,381 8,752
For the six months ended
June 30, 2016
For the year ended
December 31, 2015

Eagle Point Credit Company Inc. & Subsidiaries Consolidated Statement of Member’s Equity
For the period from June 6, 2014 (Commencement of Operations) to October 5, 2014 (expressed in U.S. dollars)
(Unaudited)
See accompanying notes to the consolidated financial statements
11
Member's equity at beginning of period $ -
Contributed securities at fair value 148,926,566
Contributed cash 15,256,539
Net investment income 7,755,029
Net realized gain (loss) on investments 1,204,960
Net change in unrealized appreciation (depreciation) on investments 194,972
Member's equity at end of period $ 173,338,066
Units issued and outstanding as of October 5, 2014 (prior to conversion)(1)
2,500,000
Net asset value per unit $ 69.34
(1) Units were converted into 8,656,057 shares of common stock, effective October 6, 2014.
See Note 5 "Sole Member's Equity" for further discussion relating to Member's Equity for the period from June 6, 2014 (Commencement of Operations)to October 5, 2014.
Note: The above Consolidated Statement of Member's Equity represents the period when the Company was initially organized as a Delaware limited liabilitycompany and a wholly-owned subsidiary of Eagle Point Credit Partners Sub Ltd.

Eagle Point Credit Company Inc. & Subsidiaries Consolidated Statement of Cash Flows
For the six months ended June 30, 2016 (expressed in U.S. dollars)
(Unaudited)
See accompanying notes to the consolidated financial statements
12
CASH FLOWS FROM OPERATING ACTIVITIES
Net income (loss) and net increase (decrease) in net assets resulting from operations $ 24,772,025
Adjustments to reconcile net income (loss) and net increase (decrease) in net assets resulting from operations to net cash provided by (used in) operating activities:
Purchases of investments (100,506,909)
Proceeds from sales or maturity of investments (1)
76,786,362
Net realized (gain) loss on investments (334,236)
Net change in unrealized (appreciation) depreciation on investments (8,102,293)
Net amortization (accretion) included in interest expense on mandatorily redeemable preferred stock 141,973
Net amortization (accretion) included in interest expense on unsecured notes payable 141,729
Net amortization (accretion) of premiums or discounts on CLO debt securities (19,267)
Changes in assets and liabilities:
Interest receivable 2,156,162
Receivable for securities sold -
Prepaid expenses 49,966
Due from affiliates 30,000
Payable for securities purchased 6,414,745
Incentive fee payable 757,728
Management fee payable 78,075
Professional fees payable (41,880)
Administration fees payable 1,975
Directors' fees payable 86,375
Due to affiliates 347,358
Accrued interest on unsecured notes payable (131,250)
Other expenses payable (146,572)
Net cash provided by (used in) operating activities 2,482,066
CASH FLOWS FROM FINANCING ACTIVITIES
Common stock distributions paid to stockholders (16,587,147)
Issuance of shares of common stock upon the Company's secondary public offering 20,805,940
Proceeds from shares of common stock issued in accordance with the Company's dividend reinvestment plan 895,295
Unsecured notes payable 24,998,750
Deferred debt issuance costs associated with unsecured notes (1,111,190)
Net cash provided by (used in) financing activities 29,001,648
NET INCREASE (DECREASE) IN CASH 31,483,714
CASH, BEGINNING OF PERIOD 21,941,373
CASH, END OF PERIOD $ 53,425,087
Supplemental disclosure of non-cash financing activities:
Change in distributions declared on shares of common stock, not yet paid $ 781,429
Supplemental disclosures:
Cash paid for interest expense on mandatorily redeemable preferred stock $ 1,761,195
Cash paid for interest expense on unsecured notes payable $ 1,443,728
(1) Proceeds from sales or maturity of investments includes $15,548,991 of cash flows reflected as return of capital on portfolio investments.
Eagle Point Credit Company Inc. & Subsidiaries Notes to Consolidated Financial Statements
June 30, 2016 (Unaudited)
13
1. ORGANIZATION
Eagle Point Credit Company Inc. (the “Company”) is an externally managed, non-diversified closed-end management investment company registered under the Investment Company Act of 1940, as amended (the “1940 Act”). The Company’s common stock is listed on the New York Stock Exchange (the “NYSE”) under the symbol “ECC.” As of June 30, 2016, the Company had two wholly-owned subsidiaries: Eagle Point Credit Company Sub LLC, a Delaware limited liability company, and Eagle Point Credit Company Sub (Cayman) Ltd., a Cayman Islands exempted company.
The Company was initially formed on March 24, 2014 as Eagle Point Credit Company LLC, a Delaware limited liability company and a wholly-owned subsidiary of Eagle Point Credit Partners Sub Ltd., a Cayman Island exempted company (the “Sole Member”), which, in turn, is a subsidiary of Eagle Point Credit Partners LP (the “Private Fund”). The Private Fund is a master fund in a master feeder structure and has three feeder funds which invest substantially all of their assets in the Private Fund. The Company commenced operations on June 6, 2014, the date the Sole Member contributed, at fair value, a portfolio of cash and securities to the Company. On October 6, 2014, the Company converted from a Delaware limited liability company into a Delaware corporation (the “Conversion”). At the time of the Conversion, the Sole Member became a stockholder of Eagle Point Credit Company Inc. In connection with the Conversion, the Sole Member converted 2,500,000 units of the Delaware limited liability company into shares of common stock in the Delaware corporation at $20 per share, resulting in 8,656,057 shares and an effective conversion rate of 3.4668 shares per unit. On October 7, 2014, the Company priced its initial public offering (the “IPO”) and, on October 8, 2014, the Company’s shares began trading on the NYSE. See Note 5 “Sole Member’s Equity” and Note 6 “Common Stock” for further discussion relating to the Conversion and the IPO.
The Company intends to operate so as to qualify to be taxed as a regulated investment company (“RIC”) under subchapter M of the Internal Revenue Code of 1986, as amended (the “Code”), for federal income tax purposes.
Eagle Point Credit Management LLC (the “Adviser”) is the investment adviser of the Company and manages the investments of the Company subject to the supervision of the Company’s Board of Directors (the “Board”). The Adviser is registered as an investment adviser with the U.S. Securities and Exchange Commission (the “SEC”) under the Investment Advisers Act of 1940, as amended. Eagle Point Administration LLC, a wholly-owned subsidiary of the Adviser, is the administrator of the Company (the “Administrator”). The Company’s primary investment objective is to generate high current income, with a secondary objective to generate capital appreciation. The Company seeks to achieve its investment objectives by investing primarily in equity and junior debt tranches of collateralized loan obligations (“CLOs”) that are collateralized by a portfolio consisting primarily of below investment grade U.S. senior secured loans. The CLO securities in which the Company will primarily seek to invest are unrated or rated below investment grade and are considered speculative with respect to timely payment of interest and repayment of principal. The Company may also invest in other securities and instruments related to these investments or that the Adviser believes are consistent with the Company’s investment objectives, including senior debt tranches of CLOs and loan accumulation facilities. From time to time, in connection with the acquisition of newly issued CLO equity, the Company may receive fee rebates from the CLO issuer. The majority of the Company’s interests in fee rebates are held in the name of Eagle Point Credit Company Sub LLC.

Eagle Point Credit Company Inc. & Subsidiaries Notes to Consolidated Financial Statements
June 30, 2016 (Unaudited)
14
2. SUMMARY OF SIGNIFICANT ACCOUNTING POLICIES Basis of Accounting The consolidated financial statements include the accounts of the Company and its wholly-owned subsidiaries. All intercompany accounts have been eliminated upon consolidation. The Company is considered an investment company under accounting principles generally accepted in the United States of America (“U.S. GAAP”). The Company follows the accounting and reporting guidance applicable to investment companies in the Financial Accounting Standards Board (“FASB”) Accounting Standards Codification (“ASC”) Topic 946 Financial Services – Investment Companies. Items included in the consolidated financial statements are measured and presented in United States dollars. Use of Estimates The preparation of the consolidated financial statements in conformity with U.S. GAAP requires management to make estimates and assumptions which affect the reported amounts included in the consolidated financial statements and accompanying notes as of the reporting date. Actual results may differ from those estimated. Valuation of Investments The most significant estimate inherent in the preparation of the consolidated financial statements is the valuation of investments. In the absence of readily determinable fair values, fair value of the Company’s investments is determined in accordance with the Company’s valuation policy. Due to the uncertainty of valuation, this estimate may differ significantly from the value that would have been used had a ready market for the investments existed, and the differences could be material. There is no single method for determining fair value in good faith. As a result, determining fair value requires judgment be applied to the specific facts and circumstances of each portfolio investment while employing a consistently applied valuation process for the types of investments held by the Company. The Company accounts for its investments in accordance with U.S. GAAP, and fair values its investment portfolio in accordance with the provisions of the FASB ASC Topic 820 Fair Value Measurements and Disclosures, which defines fair value, establishes a framework for measuring fair value and requires enhanced disclosures about fair value measurements. Investments are reflected in the consolidated financial statements at fair value. Fair value is the estimated amount that would be received to sell an asset, or paid to transfer a liability, in an orderly transaction between market participants at the measurement date (i.e., the exit price). The Company’s fair valuation process is reviewed and approved by the Board. The fair value hierarchy prioritizes and ranks the level of market price observability used in measuring investments at fair value. Market price observability is impacted by a number of factors, including the type of investment, the characteristics specific to the investment and the state of the marketplace (including the existence and transparency of transactions between market participants). Investments with readily available actively quoted prices, or for which fair value can be measured from actively quoted prices in an orderly market, will generally have a higher degree of market price observability and a lesser degree of judgment used in measuring fair value. Investments measured and reported at fair value are classified and disclosed in one of the following categories based on inputs:
Level I – Observable, quoted prices for identical investments in active markets as of the reporting date.
Level II – Quoted prices for similar investments in active markets or quoted prices for identical investments in markets that are not active as of the reporting date.
Level III – Pricing inputs are unobservable for the investment and little, if any, active market exists as of the reporting date. Fair value inputs require significant judgment or estimation from the Adviser.

Eagle Point Credit Company Inc. & Subsidiaries Notes to Consolidated Financial Statements
June 30, 2016 (Unaudited)
15
In certain cases, inputs used to measure fair value may fall into different levels of the fair value hierarchy. In such cases, the determination of which category within the fair value hierarchy is appropriate for any given investment is based on the lowest level of input significant to that fair value measurement. The assessment of the significance of a particular input to the fair value measurement in its entirety requires judgment and consideration of factors specific to the investment. Investments for which observable, quoted prices in active markets do not exist are reported at fair value based on Level III inputs. The amount determined to be fair value may incorporate the Adviser’s own assumptions (including assumptions the Adviser believes market participants would use in valuing investments and assumptions relating to appropriate risk adjustments for nonperformance and lack of marketability), as provided for in the Company’s valuation policy and accepted by the Board. An estimate of fair value is made for each investment at least monthly taking into account information available as of the reporting date. For financial reporting purposes, valuations are accepted by the Board on a quarterly basis. See Note 3 “Investments” for further discussion relating to the Company’s investments. In valuing the Company’s investments in CLO debt, CLO equity and loan accumulation facilities, the Adviser considers a variety of relevant factors as set forth in the Company’s valuation policy, including price indications from multiple dealers, recent trading prices for specific investments, recent purchases and sales known to the Adviser in similar securities and output from a third-party financial model. The third-party financial model contains detailed information on the characteristics of CLOs, including recent information about assets and liabilities, and is used to project future cash flows. Key inputs to the model, including assumptions for future loan default rates, recovery rates, prepayment rates, reinvestment rates and discount rates are determined by considering both observable and third-party market data and prevailing general market assumptions and conventions as well as those of the Adviser. The Company engages a nationally recognized valuation firm as an input to the Company’s evaluation of the fair value of its investments in CLO equity. The valuation firm’s advice is only one factor considered by the Company in its evaluation of the fair value of such investments and is not determinative of the Company’s assessment of such fair value. Investment Income Recognition Interest income from investments in CLO debt is recorded using the accrual basis of accounting to the extent such amounts are expected to be collected. Amortization of premium or accretion of discount is recognized using the effective interest method. Interest income from investments in CLO equity is recorded based upon an effective yield to maturity utilizing assumed cash flows. The Company monitors the expected cash flows from its CLO equity investments and effective yield is determined and adjusted as needed. Cash flows received in excess of the effective yield are reflected as return of capital. Interest income from loan accumulation facilities is characterized and recorded based on information provided by the trustees of each loan accumulation facility. Other Income Other income may include the Company’s share of income under the terms of Class M notes and fee rebate agreements and is recorded based upon an effective yield to maturity utilizing assumed cash flows. The Company monitors the expected cash flows from its Class M notes and fee rebate agreements and effective yield is determined and adjusted as needed. Cash flows received in excess of the effective yield are reflected as return of capital.

Eagle Point Credit Company Inc. & Subsidiaries Notes to Consolidated Financial Statements
June 30, 2016 (Unaudited)
16
Interest Expense Interest expense includes the Company’s distributions associated with its 7.75% Series A Term Preferred Stock due 2022 (the “Series A Term Preferred Stock”), and interest, paid and accrued, associated with its 7.00% Unsecured Notes due 2020 (the “Series 2020 Notes”). For the six months ended June 30, 2016, the Company was charged a total of $1,913,168 in interest expense on the Series A Term Preferred Stock, of which, $0 was payable as of June 30, 2016. For the six months ended June 30, 2016, the Company was charged a total of $1,157,694 in interest expense on the Series 2020 Notes, of which $0 was payable as of June 30, 2016. Interest expense also includes the Company’s amortization of deferred debt issuance costs associated with its Series A Term Preferred Stock and its Series 2020 Notes, as well as amortization of original issue discount associated with its Series 2020 Notes. See Note 7 “Mandatorily Redeemable Preferred Stock” and Note 8 “Unsecured Notes” for further discussion relating to the Series A Term Preferred Stock issuance and the Series 2020 Notes issuance, respectively. Deferred Debt Issuance Costs Deferred debt issuance costs consist of fees and expenses incurred in connection with the issuances of the Series A Term Preferred Stock and Series 2020 Notes, as well as unamortized original issue discount associated with the Series 2020 Notes. Deferred debt issuance costs were capitalized at the time of issuance and will be amortized on a straight-line basis, which approximates the effective interest method, over the respective terms of the Series A Term Preferred Stock and Series 2020 Notes. Amortization of deferred debt issuance costs are reflected in the interest expense on mandatorily redeemable preferred stock and interest expense on unsecured notes payable balances in the Consolidated Statement of Operations. In the event of an early termination of the Company’s Series A Term Preferred Stock or its Series 2020 Notes, the remaining balance of unamortized deferred debt issuance costs associated with such debt will be accelerated into interest expense. Securities Transactions The Company records the purchases and sales of securities on trade date. Realized gains and losses on investments sold are recorded on the basis of the specific identification method. Cash and Cash Equivalents The Company has defined cash and cash equivalents as cash and short-term, highly liquid investments with original maturities of three months or less from the date of purchase. The Company maintains its cash in bank accounts, which, at times, may exceed federal insured limits. The Adviser monitors the performance of the financial institution where the accounts are held in order to manage any risk associated with such accounts. No cash equivalent balances were held as of June 30, 2016. Expense Recognition Expenses are recorded on the accrual basis of accounting. Prepaid Expenses Prepaid expenses consist primarily of insurance premiums and shelf registration expenses. Shelf registration expenses represent fees and expenses incurred in connection with the Company’s shelf registration, not allocated to the Series 2020 Notes offering costs. Federal and Other Taxes The Company intends to operate so as to qualify to be taxed as a RIC under subchapter M of the Code and, as such, to not be subject to federal income tax on the portion of its taxable income and gains distributed to stockholders. To qualify for RIC tax treatment, among other requirements, the Company is required to distribute at least 90% of its investment company taxable income, as defined by the Code. Because U.S. federal income tax regulations differ from U.S. GAAP, distributions in accordance with tax regulations may differ from net investment income and realized gains recognized for financial reporting purposes. Differences may be permanent or temporary. Permanent differences are reclassified among capital accounts in the consolidated

Eagle Point Credit Company Inc. & Subsidiaries Notes to Consolidated Financial Statements
June 30, 2016 (Unaudited)
17
financial statements to reflect their tax character. Temporary differences arise when certain items of income, expense, gain or loss are recognized at some time in the future. Differences in classification may also result from the treatment of short-term gains as ordinary income for federal income tax purposes. The tax basis components of distributable earnings differ from the amounts reflected in the Consolidated Statement of Assets and Liabilities due to temporary book/tax differences arising primarily from partnerships and passive foreign investment company investments. These amounts will be finalized before filing the Company’s federal income tax return. As of June 30, 2016, the federal income tax cost and net unrealized depreciation on securities were as follows: Cost for federal income tax purposes 385,987,130$
Gross unrealized appreciation 872,201
Gross unrealized depreciation (120,402,369)
Net unrealized depreciation (119,530,168)$
Eagle Point Credit Company Sub LLC, a wholly-owned subsidiary of the Company, has elected to be treated as a corporation for federal income tax purposes. For the six months ended June 30, 2016, the Company incurred $90,600 in Delaware franchise tax expense. Additionally, Eagle Point Credit Company Sub LLC incurred $150,325 in federal income tax expense and $34,410 in state income tax expense. Distributions Distributions paid to common stockholders from net investment income and capital gain distributions are determined in accordance with U.S. federal income tax regulations, which differ from U.S. GAAP. Distributions to common stockholders from net investment income, if any, are expected to be declared and paid quarterly. Distributions paid to common stockholders are recorded as a liability on declaration date and are automatically reinvested in full shares of the Company as of the payment date, in accordance with the Company’s dividend reinvestment plan (the “DRIP”). The Company’s common stockholders who opt-out of participation in the DRIP (including those common stockholders whose shares are held through a broker who has opted out of participation in the DRIP) will receive all distributions in cash. In addition to the regular quarterly distributions, and subject to available taxable earnings of the Company, the Company may make periodic special distributions. A special distribution represents the excess of the Company’s net investment income over the Company’s aggregate quarterly distributions paid during the year. The characterization of distributions paid to stockholders reflect estimates made by the Company for U.S. GAAP purposes. Such estimates are subject to re-characterization for federal income tax purposes at year-end.

Eagle Point Credit Company Inc. & Subsidiaries Notes to Consolidated Financial Statements
June 30, 2016 (Unaudited)
18
3. INVESTMENTS Fair Value Measurement The following tables summarize the valuation of the Company’s investments measured and reported at fair value under the fair value hierarchy levels described in Note 2 “Summary of Significant Accounting Policies” as of June 30, 2016: Fair Value Measurement
Level I Level II Level III Total
CLO Debt -$ -$ 6,043,730$ 6,043,730$
CLO Equity - - 243,089,705 243,089,705
Loan Accumulation Facilities - - 17,323,526 17,323,526
Total Investments at Fair Value -$ -$ 266,456,961$ 266,456,961$
There were no transfers of investments between these levels during the six months ended June 30, 2016. The changes in investments classified as Level III are as follows for the six months ended June 30, 2016: Change in Investments Classified as Level III
LoanAccumulation
CLO Debt CLO Equity Facilities Total
Beginning Balance at January 1, 2016 5,843,523$ 182,953,024$ 45,484,071$ 234,280,618$
Purchases of investments 845,820 (1) 68,361,089 (1) 31,300,000 100,506,909
Proceeds from sales or maturity of investments - (16,816,054) (59,970,308) (1) (76,786,362)
Net (amortization) accretion of premiums or discounts on CLO debt securities 19,267 - - 19,267
Net realized gains (losses) and net change in unrealized appreciation (depreciation) (664,881) 8,591,647 509,763 8,436,529
Balance as of June 30, 2016 6,043,730$ 243,089,705$ 17,323,526$ 266,456,961$
Change in unrealized appreciation (depreciation) on investments st ill held as of June 30, 2016 (664,881)$ 8,577,719$ 189,455$ 8,102,293$
(1) Reflects $845,820 and $36,790,618 of proceeds from sales or maturity of investments in loan accumulation facilities transferred to purchases of investments in CLO debt and CLO equity, respectively.
The net realized gains (losses) recorded for Level III investments are reported in the net realized gain (loss) on investments balance in the Consolidated Statement of Operations. Net changes in unrealized appreciation (depreciation) are reported in the net change in unrealized appreciation (depreciation) on investments balance in the Consolidated Statement of Operations. The change in unrealized depreciation on investments still held as of June 30, 2016 was $8,102,293.

Eagle Point Credit Company Inc. & Subsidiaries Notes to Consolidated Financial Statements
June 30, 2016 (Unaudited)
19
Valuation of CLO Subordinated and Income Notes The Adviser gathers price indications from dealers, if available, as part of its valuation process as an input to estimate fair value of each CLO subordinated and income note investment. Dealer price indications are not firm bids and may not be representative of the actual value where trades can be consummated. In addition, the Adviser utilizes a third party financial model as an input to estimate the fair value of CLO subordinated and income note investments. The model contains detailed information on the characteristics of each CLO, including recent information about assets and liabilities from data sources such as trustee reports, and is used to project future cash flows to the CLO note tranches, as well as management fees. The following table summarizes the quantitative inputs and assumptions used for investments categorized in Level III of the fair value hierarchy as of June 30, 2016. In addition to the techniques and inputs noted in the table below, according to the Company’s valuation policy, the Adviser may use other valuation techniques and methodologies when determining the Company’s fair value measurements as provided for in the valuation policy and approved by the Board. The table below is not intended to be all-inclusive, but rather provides information on the significant Level III inputs as they relate to the Company’s fair value measurements, as of June 30, 2016.
Assets
Fair Value as of June 30, 2016
Valuation Techniques/Methodologies Unobservable Inputs Range / Weighted Average
CLO Equity 243,089,705$ Discounted Constant Default Rate 0.00% - 2.00%
Cash Flows Constant Prepayment Rate 20.00%
Reinvestment Spread 3.50% - 3.95% / 3.82%
Reinvestment Price 99.00%
Reinvestment Floor (1) 1.00%
Recovery Rate 64.98% - 70.00% / 69.24%
Discount Rate to Maturity 12.90% - 45.00% / 21.83%
(1) Assumed 1.0% reinvestment floor for 2 years after purchase of asset and 0.0% thereafter
Q uantitative Information about Level III Fair Value Measurements
Increases (decreases) in the constant default rate, reinvestment price and discount rate in isolation would result in a lower (higher) fair value measurement. Increases (decreases) in the reinvestment spread, reinvestment floor and recovery rate in isolation would result in a higher (lower) fair value measurement. Changes in the constant prepayment rate may result in a higher (lower) fair value, depending on the circumstances. Generally, a change in the assumption used for the constant default rate may be accompanied by a directionally opposite change in the assumption used for the constant prepayment rate and recovery rate. The Adviser categorizes CLO subordinated and income notes as Level III investments. Certain pricing inputs may be unobservable. An active market may exist, but not necessarily for investments the Company holds as of the reporting date. Additionally, unadjusted dealer quotes, when obtained for valuation purposes, are indicative. Valuation of CLO Secured Notes The Company’s CLO debt has been valued using unadjusted indicative broker dealer quotes. As a result, there were no unobservable inputs that have been internally developed by the Company in determining the fair values of these investments as of June 30, 2016. The Adviser categorizes CLO secured notes as Level III investments. An active market may exist, but not necessarily for investments the Company holds as of the reporting date. Additionally, unadjusted dealer quotes, when obtained for valuation purposes, are indicative.
Eagle Point Credit Company Inc. & Subsidiaries Notes to Consolidated Financial Statements
June 30, 2016 (Unaudited)
20
Valuation of Loan Accumulation Facilities Loan accumulation facilities are typically short- to medium-term in nature and are entered into in contemplation of a specific CLO investment. Unless the loan accumulation facility documents contemplate transferring the underlying loans at a price other than original cost plus accrued interest or the Adviser determines the originally contemplated CLO is unlikely to be consummated, the fair value of the loan accumulation facility is based on the cost of the underlying loans plus accrued interest and realized gains (losses) reported by the trustee. In all other situations, the fair value of the loan accumulation facility is based on the market value of the underlying loans plus accrued interest and realized gains (losses) reported by the trustee. The Adviser categorizes loan accumulation facilities as Level III investments. There is no active market and prices are unobservable. Investment Risk Factors and Concentration of Investments Market Risk Certain events particular to each market in which the Company’s investments conduct operations, as well as general economic and political conditions, may have a significant negative impact on the operations and profitability of the Company’s investments and/or on the fair value of the Company’s investments. Such events are beyond the Company’s control, and the likelihood they may occur and the potential effect on the Company cannot be predicted. Concentration Risk The Company is classified as “non-diversified” under the 1940 Act. As a result, the Company can invest a greater portion of its assets in obligations of a single issuer than a “diversified” fund. The Company may therefore be more susceptible than a diversified fund to being adversely affected by any single corporate, economic, political or regulatory occurrence. In particular, because the Company’s portfolio of investments may lack diversification among CLO securities and related investments, the Company is susceptible to a risk of significant loss if one or more of these CLO securities and related investments experience a high level of defaults on the collateral they hold. Liquidity Risk The securities issued by CLOs generally offer less liquidity than below investment grade or high-yield corporate debt, and are subject to certain transfer restrictions imposed on certain financial and other eligibility requirements on prospective transferees. Other investments the Company may purchase through privately negotiated transactions may also be illiquid or subject to legal restrictions on their transfer. As a result of this illiquidity, the Company’s ability to sell certain investments quickly, or at all, in response to changes in economic and other conditions and to receive a fair price when selling such investments may be limited, which could prevent the Company from making sales to mitigate losses on such investments. In addition, CLOs are subject to the possibility of liquidation upon an event of default, which could result in full loss of value to the CLO equity and junior debt investors. CLO equity tranches are the most likely tranche to suffer a loss of all of their value in these circumstances. Risks of Investing in CLOs The Company’s investments consist in part of CLO securities and the Company may invest in other related structured finance securities. CLOs and structured finance securities are generally backed by an asset or a pool of assets (typically senior secured loans and other credit-related assets in the case of a CLO) which serve as collateral. The Company and other investors in CLO and structured finance securities ultimately bear the credit risk of the underlying collateral. If there are defaults or the relevant collateral otherwise underperforms, scheduled payments to senior tranches of such securities take precedence over those of mezzanine tranches, and scheduled payments to mezzanine tranches take precedence over those to subordinated/equity tranches. Therefore, CLO and other structured finance securities may present risks similar to those of the other types of debt obligations and, in fact, such risks may be of greater significance in the case of CLO and other structured finance securities. In addition to the general risks associated with investing in debt securities, CLO securities carry additional risks, including, but not limited to: (1) the possibility that distributions from collateral assets will not be adequate to make interest or other payments; (2) the quality of the collateral may decline in value or default; (3) the fact that investments in CLO equity and junior debt tranches will likely be subordinate to other senior classes of CLO debt; and (4) the complex structure of the security may not be fully understood at the time of investment and may produce disputes with the issuer or unexpected

Eagle Point Credit Company Inc. & Subsidiaries Notes to Consolidated Financial Statements
June 30, 2016 (Unaudited)
21
investment results. Additionally, changes in the collateral held by a CLO may cause payments on the instruments the Company holds to be reduced, either temporarily or permanently. Structured investments, particularly the subordinated interests in which the Company invests, are less liquid than many other types of securities and may be more volatile than the assets underlying the CLOs the Company may target. In addition, CLO and other structured finance securities may be subject to prepayment risk. Risks of Investing in Loan Accumulation Facilities The Company invests in loan accumulation facilities, which are short- to medium-term facilities often provided by the bank that will serve as placement agent or arranger on a CLO transaction and which acquire loans on an interim basis which are expected to form part of the portfolio of a future CLO. Investments in loan accumulation facilities have risks similar to those applicable to investments in CLOs. In addition, there typically will be no assurance future CLOs will be consummated or that loans held in such a facility are eligible for purchase by the CLO. Furthermore, the Company likely will have no consent rights in respect of the loans to be acquired in such a facility and in the event the Company does have any consent rights, they will be limited. In the event a planned CLO is not consummated, or the loans are not eligible for purchase by the CLO, the Company may be responsible for either holding or disposing of the loans. This could expose the Company primarily to credit and/or mark-to-market losses, and other risks. Leverage is typically utilized in such a facility and as such the potential risk of loss will be increased for such facilities employing leverage. Interest Rate Risk The fair value of certain investments held by the Company may be significantly affected by changes in interest rates. Although senior secured loans are generally floating rate instruments, the Company’s investments in senior secured loans through CLOs are sensitive to interest rate levels and volatility. Although CLOs are generally structured to mitigate the risk of interest rate mismatch, there may be some difference between the timing of interest rate resets on the assets and liabilities of a CLO. Such a mismatch could have a negative effect on the amount of funds distributed to CLO equity investors. In addition, CLOs may not be able to enter into hedge agreements, even if it may otherwise be in the best interests of the CLO to hedge such interest rate risk. Furthermore, in the event of a significant rising interest rate environment and/or economic downturn, loan defaults may increase and result in credit losses which may adversely affect the Company’s cash flow, fair value of its assets and operating results. In the event the Company’s interest expense was to increase relative to income, or sufficient financing became unavailable, return on investments and cash available for distribution would be reduced. In addition, future investments in different types of instruments may carry a greater exposure to interest rate risk. LIBOR Floor Risk An increase in LIBOR will increase the financing costs of CLOs. Since many of the senior secured loans within these CLOs have LIBOR floors, there may not be corresponding increases in investment income (if LIBOR increases but stays below the average LIBOR floor rate of such senior secured loans) resulting in smaller distribution payments to the equity investors in these CLOs. LIBOR Risk The CLOs in which the Company invests typically obtain financing at a floating rate based on LIBOR. Regulators and law-enforcement agencies from a number of governments, including entities in the United States, Japan, Canada and the United Kingdom, have conducted or are conducting civil and criminal investigations into potential manipulation of LIBOR. Several financial institutions have reached settlements with the Commodity Futures Trading Commission, the U.S. Department of Justice Fraud Section and the United Kingdom Financial Services Authority in connection with investigations by such authorities into submissions made by such financial institutions to the bodies whom set LIBOR and other interbank offered rates. Additional investigations remain ongoing with respect to other major banks. There can be no assurance there will not be additional admissions or findings of rate-setting manipulation or manipulations of LIBOR or other similar interbank offered rates will not be shown to have occurred. ICE Benchmark Administration Limited (formerly NYSE Euronext Rate Administration Limited) assumed administration of LIBOR on February 1, 2014. Any new administrator of LIBOR may make methodological changes to the way in which LIBOR is calculated or may alter, discontinue or suspend calculation or dissemination of LIBOR. Any such actions or other effects from the ongoing investigations could adversely affect the liquidity and value of the Company’s investments. Further, additional admissions or findings of manipulation may decrease the confidence of
Eagle Point Credit Company Inc. & Subsidiaries Notes to Consolidated Financial Statements
June 30, 2016 (Unaudited)
22
the market in LIBOR and lead market participants to look for alternative, non-LIBOR based types of financing, such as fixed rate loans or bonds or floating rate loans based on non-LIBOR indices. An increase in alternative types of financing at the expense of LIBOR-based CLOs may impair the liquidity of the Company’s investments. Additionally, it may make it more difficult for CLO issuers to satisfy certain conditions set forth in a CLO’s offering documents. Historically Low Interest Rate Environment As of the date of the consolidated financial statements, interest rates in the United States are near historic lows, which may increase the Company’s exposure to risks associated with rising interest rates. Moreover, interest rate levels are currently impacted by extraordinary monetary policy initiatives, the effect of which is impossible to predict with certainty. Leverage Risk The Company has incurred leverage through the issuances of the Series A Term Preferred Stock and the Series 2020 Notes, and the Company may incur additional leverage, directly or indirectly, through one or more special purpose vehicles, including indebtedness for borrowed money and leverage in the form of derivative transactions, additional shares of preferred stock and other structures and instruments, in significant amounts and on terms the Adviser and the Board deem appropriate, subject to applicable limitations under the 1940 Act. Any such leverage does not include embedded or inherent leverage in CLO structures in which the Company invests or in derivative instruments in which the Company may invest. Accordingly, there may be a layering of leverage in overall structure. The more leverage is employed, the more likely a substantial change will occur in the Company’s net asset value (“NAV”). Accordingly, any event adversely affecting the value of an investment would be magnified to the extent leverage is utilized.
Highly Subordinated and Leveraged Securities Risk The Company’s portfolio includes equity and junior debt investments in CLOs, which involve a number of significant risks. CLO equity and junior debt securities are typically very highly leveraged (with CLO equity securities typically being leveraged nine to thirteen times), and therefore the junior debt and equity tranches in which the Company is currently invested are subject to a higher degree of risk of total loss. In particular, investors in CLO securities indirectly bear risks of the collateral held by such CLOs. The Company will generally have the right to receive payments only from the CLOs, and will generally not have direct rights against the underlying borrowers or the entity that sponsored the CLO. While the CLOs the Company intends to initially target generally enable the investor to acquire interests in a pool of senior secured loans without the expenses associated with directly holding the same investments, the Company will generally pay a proportionate share of the CLOs’ administrative, management and other expenses. In addition, the Company may have the option in certain CLOs to contribute additional amounts to the CLO issuer for purposes of acquiring additional assets or curing coverage tests, thereby increasing overall exposure and capital at risk to such CLO.
Credit Risk If a CLO in which the Company invests, an underlying asset of any such CLO or any other type of credit investment in the Company’s portfolio declines in price or fails to pay interest or principal when due because the issuer or debtor, as the case may be, experiences a decline in its financial status either or both the Company’s income and NAV may be adversely impacted. Non-payment would result in a reduction of the Company’s income, a reduction in the value of the applicable CLO security or other credit investment experiencing non-payment and, potentially, a decrease in the Company’s NAV. With respect to investments in CLO securities and credit investments that are secured, there can be no assurance that any liquidation of collateral would satisfy the issuer’s obligation in the event of non-payment for scheduled dividends, interest or principal. Also, there can be no assurance that any such collateral could be readily liquidated. In the event of bankruptcy of an issuer, the Company could experience delays or limitations with respect to its ability to realize the benefits of any collateral securing a CLO security or credit investment. To the extent the credit rating assigned to a security in the Company’s portfolio is downgraded, the market price and liquidity of such security may be adversely affected. In addition, if a CLO triggers an event of default as a result of failing to make payments when due or for other reasons, the CLO would be subject to the possibility of liquidation, which could result in full loss of value to the CLO equity and junior debt investors. CLO equity tranches are the most likely tranche to suffer a loss of all of their value in these circumstances.

Eagle Point Credit Company Inc. & Subsidiaries Notes to Consolidated Financial Statements
June 30, 2016 (Unaudited)
23
4. RELATED PARTY TRANSACTIONS
Investment Adviser On June 6, 2014, the Company entered into an investment advisory agreement (the ‘‘Advisory Agreement’’) with the Adviser. Pursuant to the terms of the Advisory Agreement, the Company pays the Adviser a management fee and an incentive fee for its services.
The management fee is calculated and payable quarterly, in arrears, at an annual rate equal to 1.75% of the Company’s “total equity base.” “Total equity base” means the net asset value attributable to the common stock and the paid-in, or stated, capital of the Series A Term Preferred Stock. The management fee for any partial quarter is pro-rated (based on the number of days actually elapsed at the end of such partial quarter relative to the total number of days in such calendar quarter). The Company was charged management fees of $2,118,230 for the six months ended June 30, 2016, of which $1,118,688 was payable as of June 30, 2016. The incentive fee is calculated and payable quarterly, in arrears, based on the pre-incentive fee net investment income (the “PNII”) of the Company for the immediately preceding calendar quarter. For this purpose, PNII means interest income, dividend income and any other income (including any other fees, such as commitment, origination, structuring, diligence and consulting fees or other fees the Company receives from an investment) accrued during the calendar quarter, minus the Company’s operating expenses for the quarter (including the base management fee, expenses payable under the Administration Agreement (as defined below) and any interest expense and distributions paid on any issued and outstanding preferred stock or issued and outstanding unsecured notes payable, but excluding the incentive fee). PNII includes accrued income the Company has not yet received in cash, including investments with a deferred interest feature (such as original issue discount, debt instruments with payment in-kind interest and zero coupon securities). PNII does not include any realized or unrealized capital gains or realized or unrealized capital losses. PNII, expressed as a rate of return on the value of the Company’s NAV at the end of the immediately preceding calendar quarter, is compared to a hurdle rate of 2.00% per quarter (8.00% annualized). The Company pays the Adviser an incentive fee with respect to the Company’s PNII in each calendar quarter as follows: (1) no incentive fee in any calendar quarter in which the Company’s PNII does not exceed the hurdle rate of 2.00%; (2) 100% of the Company’s PNII with respect to that portion of such PNII, if any, exceeding the hurdle rate but less than 2.50% in any calendar quarter; and (3) 20% of the amount of the Company’s PNII, if any, exceeding 2.50% in any calendar quarter. The Company incurred incentive fees of $4,083,857 for the six months ended June 30, 2016, of which $2,918,763 was payable as of June 30, 2016. Administrator Effective June 6, 2014, the Company entered into an administration agreement (the ‘‘Administration Agreement’’) with the Administrator, a wholly-owned subsidiary of the Adviser. Pursuant to the Administration Agreement, the Administrator performs, or arranges for the performance of, the Company’s required administrative services, which include being responsible for the financial records which the Company is required to maintain and preparing reports which are disseminated to the Company’s stockholders. In addition, the Administrator provides the Company with accounting services, assists the Company in determining and publishing its net asset value, oversees the preparation and filing of the Company’s tax returns, monitors the Company’s compliance with tax laws and regulations, and prepares and assists the Company with any audits by an independent public accounting firm of the consolidated financial statements. The Administrator is also responsible for printing and disseminating reports to the Company’s stockholders and maintaining the Company’s website, providing support to investor relations; generally overseeing the payment of the Company’s expenses and the performance of administrative and professional services rendered to the Company by others, and providing such other administrative services as the Company may from time to time designate. Payments under the Administration Agreement are equal to an amount based upon the Company’s allocable portion of the Administrator’s overhead in performing its obligations under the Administration Agreement, including rent, the fees and expenses associated with performing compliance functions and the Company’s allocable portion of the compensation of the Company’s chief financial officer, chief compliance officer and the Company’s allocable portion

Eagle Point Credit Company Inc. & Subsidiaries Notes to Consolidated Financial Statements
June 30, 2016 (Unaudited)
24
of the compensation of any related support staff. To the extent the Administrator outsources any of its functions, the Company pays the fees on a direct basis, without profit to the Administrator. Certain accounting and other administrative services have been delegated by the Administrator to SS&C Technologies, Inc. (“SS&C”). The Administration Agreement may be terminated by the Company without penalty upon not less than sixty days’ written notice to the Administrator and by the Administrator upon not less than ninety days’ written notice to the Company. The Administration Agreement is approved by the board of directors, including by a majority of the Company’s independent directors, on an annual basis, subject to an initial two-year term. For the six months ended June 30, 2016, the Company was charged a total of $393,604 in administration fees consisting of $315,079 and $78,525, relating to services provided by the Administrator and SS&C, respectively, which are included in the Consolidated Statement of Operations and, of which, $166,495 was payable as of June 30, 2016. Affiliated Ownership Certain directors, officers and other related parties, including members of the Company’s management, hold 58.6% of the Company’s common stock and 0.9% of the Series A Term Preferred Stock. This represents 52.4% of the total outstanding voting stock of the Company as of June 30, 2016. Additionally, certain officers of the Company hold 0.1% of the Series 2020 Notes as of June 30, 2016. Exemptive Relief On March 17, 2015, the SEC issued an order granting the Company exemptive relief to co-invest in certain negotiated investments with affiliated investment funds managed by the Adviser, subject to certain conditions.
5. SOLE MEMBER’S EQUITY For the period of June 6, 2014 to October 5, 2014, the Company was a wholly-owned subsidiary of the Sole Member, which in turn was a wholly-owned subsidiary of the Private Fund. As of October 5, 2014, the Company had 2,500,000 units issued and outstanding, all of which were held by the Sole Member. On June 6, 2014, the Sole Member contributed $155,301,542 to the Company, consisting of cash of $6,374,976 and securities with a fair value of $148,926,566 (cost basis of $143,825,556) as detailed in the following table: Contributed Portfolio
Cost Fair Valueas of June 6, 2014 as of June 6, 2014
CLO Debt 6,586,030$ 6,632,450$
CLO Equity 79,864,526 83,219,961
Loan Accumulation Facilit ies 57,375,000 59,074,155
Total 143,825,556$ 148,926,566$
The contribution price represents fair value of the securities as determined in accordance with U.S. GAAP as of the contribution date and as accepted by the Company’s audit committee and the Board.
6. COMMON STOCK On October 6, 2014, the Company converted from a Delaware limited liability company into a Delaware corporation. At the time of the Conversion, the Sole Member of Eagle Point Credit Company LLC became a stockholder of Eagle Point Credit Company Inc. and was issued an aggregate of 8,656,057 shares of common stock, par value $0.001 per share.
On October 7, 2014, the Company priced its IPO and sold an additional 5,155,301 shares of its common stock at a

Eagle Point Credit Company Inc. & Subsidiaries Notes to Consolidated Financial Statements
June 30, 2016 (Unaudited)
25
public offering price of $20 per share. The Company raised gross proceeds of $103.1 million. The Company paid $1,000,000 or $0.07 per share in offering costs associated with the successful offering. This cost was borne by all common stockholders of the Company as a charge to stockholders’ equity.
On October 8, 2014, the Company’s shares began trading on the NYSE under the symbol “ECC.”
On May 13, 2016, the Company priced a secondary public offering of 1,250,000 shares of its common stock at $17.65 per share, resulting in net proceeds to the Company of $20.8 million after payment of underwriting discounts and commissions and estimated offering expenses. The Company intends to use the net proceeds from this offering of its common stock to acquire investments in accordance with the Company’s investment objectives and strategies and for general working capital purposes. The offering closed on May 18, 2016.
As of June 30, 2016, there were 100,000,000 shares of common stock authorized, of which 15,122,491 shares were issued and outstanding.
7. MANDATORILY REDEEMABLE PREFERRED STOCK On May 18, 2015, the Company closed an underwritten, public offering of 1,600,000 shares of Series A Term Preferred Stock at a public offering price of $25 per share, resulting in gross proceeds of $40.0 million and approximately $38.1 million in net proceeds to the Company, after payment of underwriting discounts and commissions and offering expenses. Subsequently, the underwriters partially exercised the thirty-day overallotment option granted to them in connection with the offering on June 2, 2015, and purchased an additional 218,000 shares of Series A Term Preferred Stock, resulting in additional gross proceeds of $5.5 million and approximately $5.2 million in additional net proceeds to the Company, after payment of underwriting discounts and commissions. The Series A Term Preferred Stock is listed on the NYSE under the symbol “ECCA.” As of June 30, 2016, there were 20,000,000 shares of preferred stock authorized, of which 1,818,000 shares were issued and outstanding. The Company is required to redeem all outstanding shares of the Series A Term Preferred Stock on June 30, 2022 at a redemption price of $25 per share (the “Liquidation Preference”), plus accumulated but unpaid dividends, if any. At any time on or after June 29, 2018, the Company may, at its sole option, redeem the outstanding shares of the Series A Term Preferred Stock at a redemption price per share equal to the Liquidation Preference, plus accumulated but unpaid dividends, if any. See Note 9 “Asset Coverage” for further discussion on the Company’s calculation of asset coverage with respect to its Series A Term Preferred Stock.
8. UNSECURED NOTES On December 4, 2015, the Company closed an underwritten, public offering of $25.0 million in aggregate principal amount of Series 2020 Notes, resulting in net proceeds of $23.8 million, after payment of underwriting discounts, commissions and offering expenses. On June 1, 2016, the Company closed a follow-on underwritten, public offering of $25.0 aggregate principal amount of its Series 2020 Notes, resulting in net proceeds of approximately $24.0 million, after payment of underwriting discounts, commissions and offering expenses. The Company intends to use the net proceeds from the issuance of the Series 2020 Notes to acquire investments in accordance with the Company’s investment objectives and strategies and for general working capital purposes. The Series 2020 Notes were issued in minimum denominations of $25 and integral multiples of $25 in excess thereof.
Eagle Point Credit Company Inc. & Subsidiaries Notes to Consolidated Financial Statements
June 30, 2016 (Unaudited)
26
The Series 2020 Notes are listed on the NYSE under the symbol “ECCZ.” As of June 30, 2016, there were 1,999,950 unsecured notes issued and outstanding. The Series 2020 Notes will mature on December 31, 2020 and 100% of the aggregate principal amount will be paid at maturity. The Company may redeem the Series 2020 Notes in whole or in part at any time or from time to time at the Company’s option, on or after December 31, 2017. See Note 9 “Asset Coverage” for further discussion on the Company’s calculation of asset coverage with respect to its Series 2020 Notes.
9. ASSET COVERAGE Under the provisions of the 1940 Act, the Company is permitted to issue senior securities, including debt securities and preferred stock, and borrow from banks or other financial institutions, provided that the Company satisfies certain asset coverage requirements. With respect to senior securities that are stocks, such as the Series A Term Preferred Stock, the Company is required to have asset coverage of at least 200%, as measured at the time of the issuance of any such shares of preferred stock and calculated as the ratio of the Company’s total consolidated assets, less all liabilities and indebtedness not represented by senior securities, over the aggregate amount of the Company’s outstanding senior securities representing indebtedness plus the aggregate liquidation preference of any outstanding shares of preferred stock. With respect to senior securities representing indebtedness, such as the Series 2020 Notes or any bank borrowings (other than temporary borrowings as defined under the 1940 Act), the Company is required to have asset coverage of at least 300%, as measured at the time of borrowing and calculated as the ratio of the Company’s total consolidated assets, less all liabilities and indebtedness not represented by senior securities, over the aggregate amount of the Company’s outstanding senior securities representing indebtedness. If the Company’s asset coverage declines below 300% (or 200%, as applicable), the Company would be prohibited under the 1940 Act from incurring additional debt or issuing additional preferred stock and from making certain distributions to its stockholders. In addition, the terms of the Series A Term Preferred Stock and the Series 2020 Notes require the Company to redeem shares of the Series A Term Preferred Stock and/or a certain principal amount of the Series 2020 Notes, if such failure to maintain the applicable asset coverage is not cured by a certain date.

Eagle Point Credit Company Inc. & Subsidiaries Notes to Consolidated Financial Statements
June 30, 2016 (Unaudited)
27
The following table summarizes the Company’s asset coverage with respect to its Series A Term Preferred Stock and Series 2020 Notes, as of June 30, 2016 and for the year ended December 31, 2015: Asset Coverage of Preferred Stock and Debt Securities
As of As of June 30, 2016 December 31, 2015
Total assets 330,384,881$ 268,960,952$
Less liabilities and indebtedness not represented by senior securities (20,222,413) (12,074,430)
Net total assets and liabilities 310,162,468 256,886,522
Series A Term Preferred Stock 45,450,000 45,450,000
Series 2020 Notes 49,998,750 25,000,000
95,448,750 70,450,000
Asset coverage of preferred stock (1) 325% 365%
Asset coverage of debt securities (2) 620% 1028%
(1) The asset coverage of preferred stock, which includes the Series A Term Preferred Stock, is calculated in accordance with section 18(h) of the
1940 Act, as generally described in Note 9.
(2) The asset coverage ratio of debt securities, which includes the Series 2020 Notes, is calculated in accordance with section 18(h) of the 1940
Act, as generally described in Note 9.
Information about the Company’s senior securities, shown in the following table as of June 30, 2016 and as of December 31, 2015, have been derived from the consolidated financial statements. The Company had no senior securities outstanding as of December 31, 2014.
Class
Total Amount O utstanding Exclusive of Treasury Securities
Asset Coverage Per Unit (1)
Involuntary Liquidating Preference Per Unit (2)
Average Market Value Per Unit (3)
For the six months ended June 30, 2016
Series A Term Preferred Stock $45,450,000 $81.24 $25 $25.02
Series 2020 Notes $49,998,750 $6,203.40 N/A $24.76
For the year ended December 31, 2015
Series A Term Preferred Stock $45,450,000 $91.16 $25 $25.43
Series 2020 Notes $25,000,000 $10,275.46 N/A $24.52
(1) The asset coverage per unit figure is the ratio of the Company's total consolidated assets, less all liabilities and indebtedness not represented by senior securities,
to the aggregate dollar amount of outstanding applicable senior securities, as calculated separately for each of the Series A Term Preferred Stock and the Series
2020 Notes in accordance with section 18(h) of the 1940 Act. With respect to the Series A Term Preferred Stock, the asset coverage per unit figure is expressed
in terms of dollar amounts per share of outstanding preferred stock (based on a per share liquidation preference of $25). With respect to the Series 2020 Notes, the
asset coverage per unit figure is expressed in terms of dollar amounts per $1,000 principal amount of such notes.
(2) The involuntary liquidating preference per unit is the amount to which a share of Series A Term Preferred Stock would be entitled in preference to any security
junior to it upon our involuntary liquidation.
(3) The average market value per unit is calculated by taking the average of the closing price of each of (a) a share of the Series A Term Preferred Stock (NYSE: ECCA)
and (b) $25 principal amount of the Series 2020 Notes (NYSE: ECCZ) for each day during the six months ended June 30, 2016 and for the year ended December
31, 2015, for which the applicable security was listed on the NYSE.

Eagle Point Credit Company Inc. & Subsidiaries Notes to Consolidated Financial Statements
June 30, 2016 (Unaudited)
28
10. COMMITMENTS AND CONTINGENCIES The Company is not currently subject to any material legal proceedings. From time to time, the Company may be a party to certain legal proceedings in the ordinary course of business, including proceedings relating to the enforcement of the Company’s rights under contracts. While the outcome of these legal proceedings cannot be predicted with certainty, the Company does not expect these proceedings will have a material effect upon its financial condition or results of operations. As of June 30, 2016, the Company had no unfunded commitments.
11. INDEMNIFICATIONS Under the Company’s organizational documents, its officers and directors are indemnified against certain liabilities arising out of the performance of their duties to the Company. In addition, during the normal course of business, the Company enters into contracts containing a variety of representations which provide general indemnifications. The Company’s maximum exposure under these agreements cannot be known; however, the Company expects any risk of loss to be remote.
12. RECENT ACCOUNTING PRONOUNCEMENTS As of the date of these consolidated financial statements, there were no accounting standards applicable to the Company that had been issued but not yet adopted by the Company.
13. SUBSEQUENT EVENTS The Company has recorded a common stock distribution payable of $9,073,495 or $0.60 per share, for distributions declared, but not yet paid, as of June 30, 2016. The distribution was subsequently paid to common stockholders on July 29, 2016. In accordance with the Company’s DRIP, 4,835 new shares of common stock were issued to common stockholders as of July 29, 2016. On July 5, 2016, the Company declared three separate distributions of $293,532 or $0.161459 per share on its Series A Term Preferred Stock. The first distribution was paid on July 29, 2016 to holders of record on July 15, 2016. The additional distributions are payable on each of August 31, 2016 and September 30, 2016 to holders of record on August 15, 2016 and September 15, 2016, respectively. On July 20, 2016, the Company entered into a customary custody agreement with Wells Fargo Bank, National Association (“Wells Fargo”), pursuant to which the Company intends for its portfolio of securities to be held by Wells Fargo. The Company is currently in the process of transitioning custody of its assets from Deutsche Bank Trust Company Americas to Wells Fargo. The principal business address of Wells Fargo is 9062 Old Annapolis Road, Columbia, Maryland 21045. On August 8, 2016, the Company priced an offering of $10.0 million in aggregate principal amount of its Series 2020 Notes, resulting in net proceeds of approximately $9.9 million, after payment of estimated offering expenses. The Series 2020 Notes were issued in minimum denominations of $25 and integral multiples of $25 in excess thereof. The Company plans to use the net proceeds from the issuance of the Series 2020 Notes to acquire investments in accordance with the Company’s investment objectives and strategies and for general working capital purposes. Management of the Company has evaluated the need for disclosures and/or adjustments resulting from subsequent events through the date of release of this report. Management has determined there are no events in addition to those described above which would require adjustment to or disclosure in the consolidated financial statements and related notes through the date of release of this report.
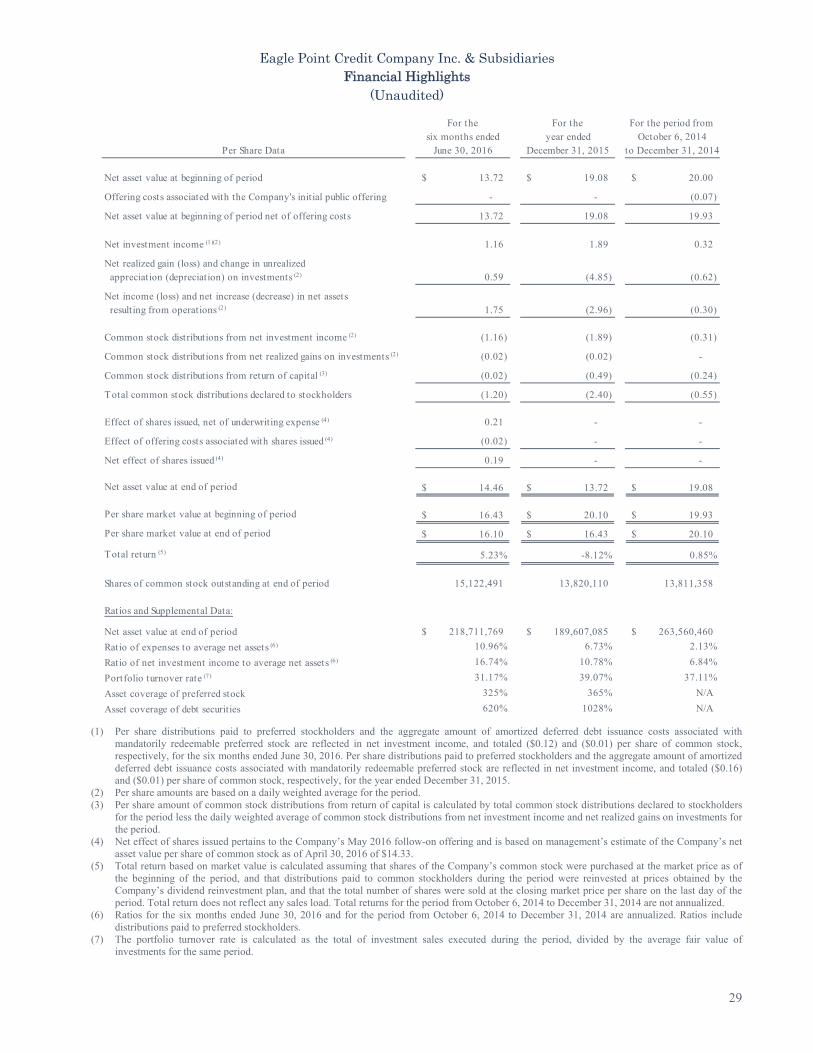
Eagle Point Credit Company Inc. & Subsidiaries Financial Highlights
(Unaudited)
29
For the For the For the period from six months ended year ended October 6, 2014
Per Share Data June 30, 2016 December 31, 2015 to December 31, 2014
Net asset value at beginning of period 13.72$ 19.08$ 20.00$
Offering costs associated with the Company's init ial public offering - - (0.07)
Net asset value at beginning of period net of offering costs 13.72 19.08 19.93
Net investment income (1)(2) 1.16 1.89 0.32
Net realized gain (loss) and change in unrealized appreciation (depreciation) on investments (2) 0.59 (4.85) (0.62)
Net income (loss) and net increase (decrease) in net assets resulting from operations (2) 1.75 (2.96) (0.30)
Common stock distributions from net investment income (2) (1.16) (1.89) (0.31)
Common stock distributions from net realized gains on investments (2) (0.02) (0.02) -
Common stock distributions from return of capital (3) (0.02) (0.49) (0.24)
Total common stock distributions declared to stockholders (1.20) (2.40) (0.55)
Effect of shares issued, net of underwriting expense (4) 0.21 - -
Effect of offering costs associated with shares issued (4) (0.02) - -
Net effect of shares issued (4) 0.19 - -
Net asset value at end of period 14.46$ 13.72$ 19.08$
Per share market value at beginning of period 16.43$ 20.10$ 19.93$
Per share market value at end of period 16.10$ 16.43$ 20.10$
Total return (5) 5.23% -8.12% 0.85%
Shares of common stock outstanding at end of period 15,122,491 13,820,110 13,811,358
Ratios and Supplemental Data:
Net asset value at end of period 218,711,769$ 189,607,085$ 263,560,460$
Ratio of expenses to average net assets (6) 10.96% 6.73% 2.13%
Ratio of net investment income to average net assets (6) 16.74% 10.78% 6.84%
Portfolio turnover rate (7) 31.17% 39.07% 37.11%
Asset coverage of preferred stock 325% 365% N/A
Asset coverage of debt securities 620% 1028% N/A (1) Per share distributions paid to preferred stockholders and the aggregate amount of amortized deferred debt issuance costs associated with
mandatorily redeemable preferred stock are reflected in net investment income, and totaled ($0.12) and ($0.01) per share of common stock, respectively, for the six months ended June 30, 2016. Per share distributions paid to preferred stockholders and the aggregate amount of amortized deferred debt issuance costs associated with mandatorily redeemable preferred stock are reflected in net investment income, and totaled ($0.16) and ($0.01) per share of common stock, respectively, for the year ended December 31, 2015.
(2) Per share amounts are based on a daily weighted average for the period. (3) Per share amount of common stock distributions from return of capital is calculated by total common stock distributions declared to stockholders
for the period less the daily weighted average of common stock distributions from net investment income and net realized gains on investments for the period.
(4) Net effect of shares issued pertains to the Company’s May 2016 follow-on offering and is based on management’s estimate of the Company’s net asset value per share of common stock as of April 30, 2016 of $14.33.
(5) Total return based on market value is calculated assuming that shares of the Company’s common stock were purchased at the market price as of the beginning of the period, and that distributions paid to common stockholders during the period were reinvested at prices obtained by the Company’s dividend reinvestment plan, and that the total number of shares were sold at the closing market price per share on the last day of the period. Total return does not reflect any sales load. Total returns for the period from October 6, 2014 to December 31, 2014 are not annualized.
(6) Ratios for the six months ended June 30, 2016 and for the period from October 6, 2014 to December 31, 2014 are annualized. Ratios include distributions paid to preferred stockholders.
(7) The portfolio turnover rate is calculated as the total of investment sales executed during the period, divided by the average fair value of investments for the same period.

Eagle Point Credit Company Inc. & Subsidiaries Financial Highlights
(Unaudited)
30
Financial highlights for the period from June 6, 2014 (Commencement of Operations) to October 5, 2014 for the Sole Member are as follows:
For the period fromJune 6, 2014
(Commencement of Operations)Per Unit Data to October 5, 2014
Net asset value at beginning of period 62.12$
Net investment income 3.10
Net realized and unrealized capital gain (loss) on investments 0.56
Total from investment operations 3.66
Adjustment for additional cash contributions 3.56
Net asset value at end of period 69.34$
Total return (1) 5.89%
Ratios and Supplemental Data:
Net asset value at end of period 173,338,066$
Ratio of total expenses to average net assets (1) 0.00%
Ratio of net investment income to average net assets (1) 4.74%
Portfolio turnover rate (2) 52.07%
(1) Total return and ratios for the period from June 6, 2014 (Commencement of Operations) to October 5, 2014 are not annualized. (2) The portfolio turnover rate is calculated as the total of investment sales executed during the period from June 6, 2014
(Commencement of Operations) to October 5, 2014, divided by the average fair value of investments for the same period.
Note: The above Financial Highlights for the period from June 6, 2014 (Commencement of Operations) to October 5, 2014 for the Sole Member represents the period when the Company was initially organized as a Delaware limited liability company and a wholly-owned subsidiary of Eagle Point Credit Partners Sub Ltd.

31
Dividend Reinvestment Plan
The Company has established an automatic dividend reinvestment plan (“DRIP”). Each holder of at least one full share of our common stock will be automatically enrolled in the DRIP. Under the DRIP, distributions on shares of the Company’s common stock are automatically reinvested in additional shares of the Company’s common stock by American Stock Transfer and Trust Company, LLC (the “DRIP Agent”) unless a stockholder “opts-out” of the DRIP. Holders of the Company’s common stock who receive distributions in the form of additional shares of the Company’s common stock are nonetheless required to pay applicable federal, state or local taxes on the reinvested distribution but will not receive a corresponding cash distribution with which to pay any applicable tax. Holders of shares of the Company’s common stock who opt-out of participation in the DRIP (including those holders whose shares are held through a broker or other nominee who has opted out of participation in the DRIP) will receive all distributions in cash. Reinvested distributions increase the Company’s stockholders’ equity on which a management fee is payable to the Adviser.
If the Company declares a distribution payable in cash, the Company will issue shares of common stock to participants at a value equal to 95% of the market price per share of common stock at the close of regular trading on the payment date for such distribution unless the DRIP Agent otherwise purchases shares in the open market, as described below. The number of newly issued shares of common stock to be credited to each participant’s account will be determined by dividing the dollar amount of the distribution by 95% of the market price. Notwithstanding the foregoing, the Company reserves the right to purchase shares in the open market in connection with its implementation of the DRIP. The DRIP Agent may be instructed not to credit accounts with newly issued shares and instead to buy shares in the open market if (i) the price at which newly issued shares are to be credited does not exceed 110% of the last determined NAV of the shares; or (ii) the Company has advised the DRIP Agent that since such NAV was last determined, the Company has become aware of events that indicate the possibility of a material change in per share NAV as a result of which the NAV of the shares on the payment date might be higher than the price at which the DRIP Agent would credit newly issued shares to stockholders.
In the event that the DRIP Agent is instructed to buy shares of our common stock in the open market, the DRIP Agent (or the DRIP Agent’s broker) will have until the last business day before the next date on which the shares trade on an “ex-dividend” basis or 30 days after the payment date for the applicable distribution, whichever is sooner (the “Last Purchase Date”), to invest the distribution amount in shares acquired in the open market. Open market purchases may be made on any securities exchange where shares of our common stock are traded, in the over-the-counter market or in negotiated transactions, and may be on such terms as to price, delivery and otherwise as the DRIP Agent shall determine. If, before the DRIP Agent has completed its open market purchases, the market price per share of our common stock exceeds the NAV per share, the average per share purchase price paid by the DRIP Agent may exceed the NAV of the shares, resulting in the acquisition of fewer shares than if the distribution had been paid in newly issued shares of common stock on the applicable payment date. Because of the foregoing difficulty with respect to open market purchases, the DRIP provides that if the DRIP Agent is unable to invest the full distribution amount in open market purchases during the purchase period or if the market discount shifts to a market premium of 10% or more of NAV during the purchase period, the DRIP Agent may cease making open market purchases and may invest the uninvested portion of the distribution amount in newly issued shares of common stock at the NAV per share at the close of business on the Last Purchase Date provided that, if the NAV is less than or equal to 95% of the then current market price per share, the dollar amount of the distribution will be divided by 95% of the market price on the payment date.
There are no brokerage charges with respect to shares of common stock issued directly by the Company. However, whenever shares are purchased or sold on the NYSE or otherwise on the open market, each participant will pay a pro rata portion of brokerage trading fees, currently $0.10 per share purchased or sold. Brokerage trading fees will be deducted from amounts to be invested.
Holders of the Company’s common stock can also sell shares held in the DRIP account at any time by contacting the DRIP Agent in writing at American Stock Transfer and Trust Company, LLC, P.O. Box 922, Wall Street Station, New York, NY
32
10269-0560. The DRIP Agent will mail a check to such holder (less applicable brokerage trading fees) on the settlement date, which is three business days after the shares have been sold. If a stockholder chooses to sell its shares through a broker, the holder will need to request that the DRIP Agent electronically transfer their shares to the broker through the Direct Registration System.
Stockholders participating in the DRIP may withdraw from the DRIP at any time by contacting the DRIP Agent in writing at American Stock Transfer and Trust Company, LLC, P.O. Box 922, Wall Street Station, New York, NY 10269-0560. Such termination will be effective immediately if the notice is received by the DRIP Agent prior to any dividend or distribution record date; otherwise, such termination will be effective on the first trading day after the payment date for such dividend or distribution, with respect to any subsequent dividend or distribution. If a holder of the Company’s common stock withdraws, full shares will be credited to their account, and the stockholder will be sent a check for the cash adjustment of any fractional share at the market value per share of the Company’s common stock as of the close of business on the day the termination is effective, less any applicable fees. Alternatively, if the stockholder wishes, the DRIP Agent will sell their full and fractional shares and send them the proceeds, less a transaction fee of $15.00 and less brokerage trading fees of $0.10 per share. If a stockholder does not maintain at least one whole share of common stock in the DRIP account, the DRIP Agent may terminate such stockholder’s participation in the DRIP Plan after written notice. Upon termination, stockholders will be sent a check for the cash value of any fractional share in the DRIP account, less any applicable broker commissions and taxes.
Stockholders who are not participants in the DRIP, but hold at least one full share of our common stock, may join the DRIP by notifying the DRIP Agent in writing at American Stock Transfer and Trust Company, LLC, P.O. Box 922, Wall Street Station, New York, NY 10269-0560. If received in proper form by the DRIP Agent before the record date of a dividend, the election will be effective with respect to all dividends paid after such record date. If a stockholders wishes to participate in the DRIP and their shares are held in the name of a brokerage firm, bank or other nominee, the stockholder should contact their nominee to see if it will participate in the DRIP. If a stockholder wishes to participate in the DRIP Plan, but the brokerage firm, bank or other nominee is unable to participate on their behalf, the stockholder will need to request that their shares be re-registered in their own name, or the stockholder will not be able to participate. The DRIP Agent will administer the DRIP on the basis of the number of shares certified from time to time by the stockholder as representing the total amount registered in their name and held for their account by their nominee.
Experience under the DRIP Plan may indicate that changes are desirable. Accordingly, the Company and the DRIP Agent reserve the right to amend or terminate the DRIP upon written notice to each participant at least 30 days before the record date for the payment of any dividend or distribution by the Company.
All correspondence or additional information about the DRIP should be directed to American Stock Transfer and Trust Company, LLC, 6201 15th Avenue, Brooklyn, NY 11219.

33
Additional Information
Management
Our Board of Directors (the “Board”) is responsible for managing the Company’s affairs, including the appointment of advisers and sub-advisers. The Board has appointed officers who assist in managing the Company’s day-to-day affairs.
The Board
The Board currently consists of six members, four of whom are not “interested persons” (as defined in the Investment Company Act of 1940, as amended (the “1940 Act”)) of the Company. The Company refers to these directors as the Company’s “independent directors.”
Under our certificate of incorporation and bylaws, our board of directors is divided into three classes with staggered terms, with the term of only one of the three classes expiring at each annual meeting of our stockholders. The classification of the board across staggered terms may prevent replacement of a majority of the directors for up to a two-year period.
The directors and officers of the Company are listed below. Except as indicated, each individual has held the office shown or other offices with the same company for the last five years. Certain of the Company’s officers and directors also are officers or managers of our Adviser. None of our directors serves, nor have they served during the last five years, on the board of directors of another company registered under the Securities Exchange Act of 1934, as amended (or subject to the reporting requirements of Section 15(d) thereof), or registered under the 1940 Act (including any other companies in a fund complex with us).
Name, Address1
and Age Position(s) held with
the Company Term of Office and
Length of Time Served Principal Occupation(s) During the Past 5 Years
Interested Directors2
Thomas P. Majewski Age: 41
Class III Director and Chief Executive Officer
Since inception; Term expires 2017
Managing Partner of Eagle Point Credit Management LLC sinceSeptember 2012; Managing Director and US Head of CLO Bankingat RBS Securities Inc. from September 2011 to September 2012;President of AMP Capital Investors (US) Ltd. from August 2010 toSeptember 2011.
James R. Matthews Age: 49
Class II Director and Chairperson of the Board
Since inception; Term expires 2019
Principal of Stone Point Capital LLC since October 2011; SeniorManaging Director and Co-Head of Private Equity for EvercorePartners Inc. from January 2007 to October 2011.
Independent Directors
Scott W. Appleby Age: 51
Class I Director
Since inception; Term expires 2018
President of Appleby Capital, Inc. since April 2009.
Kevin F. McDonald Age: 50
Class III Director
Since inception; Term expires 2017
Director of Business Development of Folger Hill AssetManagement, LP since December 2014; Principal of TaylorInvestment Advisors, LP since March 2002; Chief ExecutiveOfficer of Taylor Investment Advisors, LP from 2006 to December2014.
Paul E. Tramontano Age: 54
Class II Director
Since inception; Term expires 2019
Managing Director and Portfolio Manager at First RepublicInvestment Management since October 2015; Co-Chief ExecutiveOfficer of Constellation Wealth Advisors LLC from April 2007 toOctober 2015.
Jeffrey L. Weiss Age: 55
Class I Director
Since inception; Term expires 2018
Private Investor since June 2012; Global Head of FinancialInstitutions at Barclays from August 2008 to June 2012.
1 The business address of each of our directors is c/o Eagle Point Credit Company Inc., 20 Horseneck Lane, Greenwich, Connecticut 06830.
2 Mr. Majewski is an interested director due to his position with the Adviser. Mr. Matthews is an interested director due to his position with Stone Point Capital LLC, the investment manager to the Trident V Funds, which are the primary owners of the Adviser.

34
The Company’s registration statement, prospectus and annual proxy statement include additional information about our directors. A copy of the prospectus and proxy statement is available free of charge at www.eaglepointcreditcompany.com or upon request by calling (844) 810-6501. Officers
Information regarding our officers who are not directors is as follows:
Name, Address1 and Age
Positions Held with the Company
Term of Office and Length of Time
Served2 Principal Occupation(s)
During the Last Five Years Kenneth P. Onorio Age: 48
Chief Financial Officer and Chief Operating Officer
Since July 2014
Chief Financial Officer of Eagle Point Credit Management LLCsince July 2014; Chief Operating Officer of Eagle Point CreditManagement LLC since August 2014; Executive Director of PrivateEquity and Hedge Fund Administration at JPMorgan AlternativeInvestment Services from September 2008 to July 2014.
Courtney B. Fandrick Age: 34
Secretary
Since August 2015
Deputy Chief Compliance Officer of Eagle Point CreditManagement LLC since December 2014; Senior ComplianceAssociate, Bridgewater Associates, LP from August 2007 toDecember 2014.
1 The business address of each of our officers is c/o Eagle Point Credit Company Inc., 20 Horseneck Lane, Greenwich, Connecticut 06830. All of our officers are officers or employees of the Adviser or affiliated companies.
2 Each officer holds office until his or her successor is chosen and qualifies, or until his or her earlier resignation or removal. Director and Officer Compensation
Our directors received compensation from the Company in the amounts set forth in the following table during the six months ended June 30, 2016.
Name Aggregate Compensation from the Company1, 2 Scott W. Appleby
$21,750
Kevin F. McDonald $20,500
Paul E. Tramontano $20,500
Jeffrey L. Weiss $23,625
TOTAL
$86,375
1 For a discussion of the independent directors’ compensation, see below. 2 The Company does not maintain a pension plan or retirement plan for any of our
directors. As compensation for serving on the Board, each independent director receives an annual fee of $75,000. The chairman of the audit committee receives an additional annual fee of $12,500 and the chairman of the nominating committee receives an additional annual fee of $5,000 for their additional services in these capacities. In addition, each independent director receives $1,750 for each regularly scheduled Board meeting attended, $500 for each other Board meeting attended at which action is taken, and $500 for each committee meeting attended at which action is taken (except that separate compensation for committee meetings is not received if such meeting is held on the same day as a meeting of the Board), as well as reasonable out-of-pocket expenses incurred in attending such meetings. No compensation was, or is expected to be, paid by us to our directors who are “interested persons” of us, as such term is defined in the 1940 Act, or to our officers. Our officers, Mr. Majewski, Mr. Onorio and Ms. Fandrick, are compensated by the Adviser or one of its affiliates, as applicable.

35
Stockholder Meeting Information
An annual meeting of stockholders of the Company was held on May 10, 2016. At the meeting, the two nominees for re-election as Class II directors, James R. Matthews and Paul E. Tramontano, were each elected to serve as a director for a three-year term expiring at the Company’s 2019 annual meeting or until his successor is duly elected and qualified.
Nominee Shares Voted “For” Shares Voted “Withhold” James R. Matthews1 9,599,094 23,321
Paul E. Tramontano2 249,200 6,010
1 Mr. Matthews was elected by the holders of the Company’s outstanding common stock and preferred stock, voting together as a single class.
2 Mr. Tramontano was elected by the holders of the Company’s outstanding preferred stock, voting separately as a single class.
The Company is not aware of any broker non-votes at the meeting (i.e., share of common stock held of record by brokers or nominees present at the meeting but as to which instructions had not been received from the beneficial owners or the persons entitled to vote and the broker or nominee had not voted, or had no discretionary power to vote, on a particular matter).
The following persons’ terms of office as directors also continued after the annual meeting given that each person is either a Class I or Class III director: Thomas P Majewski, Scott W. Appleby, Kevin F. McDonald and Jeffrey L. Weiss.
Investment Advisory Agreement
At an in person meeting held on May 10, 2016, the Board, including all of the directors that are not interested persons of the Company (voting separately), unanimously voted to approve the continuation of the investment advisory agreement (the “Investment Advisory Agreement”) by and between the Company and the Adviser for an additional one-year period. In reaching a decision to continue the Investment Advisory Agreement, the Board, assisted by the advice of fund counsel, requested and received a significant amount of information and considered all the factors the Board believed relevant, including, among other things, the following: (1) the nature, extent and quality of services to be performed by the Adviser; (2) the investment performance of the Company and the Adviser; (3) the costs of providing services to the Company; (4) the profitability of the relationship between the Company and the Adviser; (5) comparative information on fees and expenses borne by other comparable registered investment companies or business development companies and, as applicable, other advised accounts; (6) comparative registered investment companies’ or business development companies’ performance and other competitive factors and, as applicable, those of other advised accounts; (7) the extent to which economies of scale would be realized as the Company grows; and (8) whether fee levels reflect these economies of scale for the benefit of the Company’s investors. The Board’s decision to renew the Investment Advisory Agreement was not based on any single factor, but rather was based on a comprehensive consideration of all the information provided to the Board at its meetings throughout the year. The Board did not assign relative weights to the factors considered by it as the Board conducted an overall analysis of these factors. Individual members of the Board may have given different weights to different factors. Among other factors, the Board requested, considered and evaluated information regarding: Nature, Extent and Quality of Services and Performance The Board reviewed and considered the nature, extent and quality of the services provided by the Adviser under the Investment Advisory Agreement and by its affiliate under a separate administration agreement. The Board reviewed the most recent Form ADV for the Adviser, information about the background and experience of the staff and personnel of the Adviser primarily responsible for the day-to-day portfolio management of the Company, including their experience in managing portfolios of collateralized loan obligation (“CLO”) securities and the CLO industry knowledge of the Adviser’s senior investment team. The Board also evaluated the ability of the Adviser to attract and retain high-caliber professional
36
employees. In this regard, the Board considered information regarding the Adviser’s compensation program, and reviewed the financial stability, investment and risk management programs and legal and compliance programs of the Adviser. The Board then reviewed and considered the Company’s performance results in terms of both (1) changes in the net asset value of the Company and (2) total returns to stockholders, each during (a) the 2015 calendar year and (b) the period since the Company’s initial public offering, and considered such performance in light of the Company’s investment objective, strategies and risks. They also considered and discussed at length these results in comparison to the performance results of (1) a comparable account managed by the Adviser (“Comparable Account”), (2) one publicly listed registered investment company that has an investment strategy that is comparable to the Company (“Peer Fund”), and (3) other registered investment companies and business development companies that either invest a portion of their assets in CLO equity or junior debt securities or have similar underlying assets to the underlying assets of the CLO securities held by the Company (“Other Peer Companies”). The Board considered that the Company’s use of leverage magnified the effects of unrealized losses incurred during the relevant periods as compared to the Comparable Account managed by the Adviser. The Board also reviewed the relative performance results, on both a net asset value basis and a total return to stockholder basis, of the Company and the Peer Fund. With respect to the Other Peer Companies and their relative performance with the Company, the Board considered that the investment strategies and portfolios of the Other Peer Companies are materially different than those of the Company. Based on a review of the above information, together with the factors referenced below, the Board concluded that they were generally satisfied with, and that the Company should continue to benefit from, the nature, extent and quality of services provided to the Company by the Adviser. Investment Advisory Fee Rates and Total Expense Ratio The Board then reviewed and considered the advisory fee rates, including the base management fee and incentive fee, payable by the Company to the Adviser under the Investment Advisory Agreement and the total expense ratio of the Company as of the most recent quarter. Additionally, the Board received and considered information comparing the advisory fee rates and total expense ratio of the Company with those of the Peer Fund and the Other Peer Companies. The Board considered a comparison of the Company’s base management fee rate and incentive fee hurdle with those applicable to the Peer Fund, as well as the Company’s and the Peer Fund’s total expense ratio (as a percentage of total investments). The Board also considered that the comparisons of the advisory fee rates and total expense ratios to the Other Peer Companies were not as meaningful, as the investment strategies and portfolios are materially different than those of the Company. The Board took into consideration the Company's smaller investment portfolio size as compared to the Peer Fund and certain of the Other Peer Companies in reviewing the Company’s total expense ratio. The Board also compared the advisory fee rates paid by each of the Company and the other Comparable Account managed by the Adviser, and considered the reasons for the differences in advisory fee rate structures, such as differences in strategies, services provided, investor expectations for different types of investment vehicles and the applicable tax environment. In considering the advisory fee rates, the Board also discussed the Company’s use of leverage, including the issuance of preferred stock and debt securities, and the potential of any such leverage to increase the Adviser’s incentive fee and related potential conflicts of interest. Based on its review, the Board concluded that each of the Company’s advisory fee rates and total expense ratio is fair and reasonable in light of the services provided to the Company and other factors considered. Profitability The Board also considered a profitability analysis of the Adviser and its affiliates with respect to the Company. The Board concluded that, in light of the costs of providing investment advisory services to the Company, the Adviser’s profitability was not excessive.

37
Economies of Scale The Board considered information regarding whether the Investment Advisory Agreement adequately addresses economies of scale with respect to providing advisory services to the Company. The Board considered that (1) based on the complexity and time required to manage the types of CLO securities in which the Company invests, the costs associated with managing a larger portfolio of CLO securities would be expected to require additional investment resources, and (2) such securities are generally acquired and disposed of in transactions which require considerable resources, particularly when acquired in the primary market. Based on the foregoing, the Board concluded that the opportunity of the Company to realize significant economies of scale is limited. Other Benefits The Board considered other benefits to the Adviser and its affiliates derived from their relationship with the Company. Based on information provided by the Adviser, the Board concluded that these benefits were not material. Based on the information reviewed and the discussions detailed above, the Board reached a determination, through the exercise of its business judgment, that the compensation payable to the Adviser pursuant to the Advisory Agreement was fair and reasonable in light of the services to be provided to the Company by the Adviser and other factors considered. Portfolio Information
The Company files its complete schedule of portfolio holdings with the SEC for the first and third quarters of each fiscal year on Form N-Q. The Company’s Forms N-Q are available on the SEC’s website at http://www.sec.gov. The SEC’s Forms N-Q may be reviewed and copied at the SEC’s Public Reference Room in Washington, DC, and information on the operation of the Public Reference Room may be obtained by calling 1-800-SEC-0330. The Company also makes its Form N-Q filings available on its website at www.eaglepointcreditcompany.com. Proxy Information
The Company has delegated its proxy voting responsibility to Eagle Point. A description of these policies and procedures is available (1) without charge, upon request, by calling toll free (844) 810-6501; and (2) on the SEC’s website at http://www.sec.gov. Information regarding how the Company voted proxies relating to portfolio securities for the 12-month period ending June 30, 2016 is available: (1) without charge, upon request, by calling toll free (844) 810-6501; and (2) on the SEC’s website at http://www.sec.gov. The Company also makes this information available on its website at www.eaglepointcreditcompany.com. Tax Information
For the six month period ended May 31, 2016, the Company recorded distributions on our common stock equal to $1.20 per share or $17.4 million. Privacy Information
The Company is committed to protecting your privacy. This privacy notice explains privacy policies of Eagle Point Credit Company Inc. and its affiliated companies. The terms of this notice apply to both current and former stockholders. The Company will safeguard, according to strict standards of security and confidentiality, all information it receives about you. With regard to this information, the Company maintains procedural safeguards that comply with federal standards.

38
The Company’s goal is to limit the collection and use of information about you. When you purchase shares of the Company’s common stock, the transfer agent collects personal information about you, such as your name, address, social security number or tax identification number. This information is used only so that the Company can send you annual and semiannual reports, proxy statements and other information required by law, and to send you information it believes may be of interest to you. The Company does not share such information with any non-affiliated third party except as described below:
It is the Company’s policy that only authorized employees of its investment adviser, Eagle Point Credit Management LLC, and its affiliates who need to know your personal information will have access to it.
The Company may disclose stockholder-related information to unaffiliated third party financial service providers (which may include a custodian, transfer agent, accountant or financial printer) who need to know that information in order to provide services to you or to the Company. These companies are required to protect your information and use it solely for the purpose for which they received it.
If required by law, the Company may disclose stockholder-related information in accordance with a court order or at the request of government regulators. Only that information required by law, subpoena, or court order will be disclosed.

[End of Semiannual Report. Back Cover Follows.]

1
Eagle Point Credit Company Inc. 20 Horseneck Lane Greenwich, CT 06830 (203) 340 8500
Investment Adviser Eagle Point Credit Management LLC 20 Horseneck Lane Greenwich, CT 06830
Transfer Agent, Registrar, Dividend Disbursement and Stockholder Servicing Agent American Stock Transfer and Trust Company, LLC 6201 15th Avenue Brooklyn, NY 11219 (800) 937 5449
www.eaglepointcreditcompany.com
© Eagle Point Credit Company Inc. All rights reserved.
Related Documents