1 FIRST FINANCIAL HOLDING CO., LTD. AND ITS SUBSIDIARIES CONSOLIDATED FINANCIAL STATEMENTS AND REPORT OF INDEPENDENT ACCOUNTANTS FOR THE THREE MONTHS ENDED MARCH 31, 2007 AND 2006

Welcome message from author
This document is posted to help you gain knowledge. Please leave a comment to let me know what you think about it! Share it to your friends and learn new things together.
Transcript
1
FIRST FINANCIAL HOLDING CO., LTD. AND ITS SUBSIDIARIES
CONSOLIDATED FINANCIAL STATEMENTS AND REPORT OF INDEPENDENT ACCOUNTANTS
FOR THE THREE MONTHS ENDED
MARCH 31, 2007 AND 2006

2
(96) PWCR07000265
Review Report of Independent Accountants To: First Financial Holding Co., Ltd. We have reviewed the accompanying consolidated balance sheets of First Financial Holding Co., Ltd. (the “Company”) and its subsidiaries (collectively the “First Group”) as of March 31, 2007 and 2006, and the related consolidated statements of income and of cash flows for the three months then ended March 31, 2007. These consolidated financial statements are the responsibility of the First Group’s management. Our responsibility is to issue a review report on these consolidated financial statements based on our reviews.
Except as stated in the next paragraph, we conducted our reviews in accordance with the Statement of Auditing Standards No. 36 “Reviews of Financial Statements” in the Republic of China. A review consists primarily of inquiries of company personnel and analytical review procedures applied to financial data. It is substantially less in scope than an audit conducted in accordance with generally accepted auditing standards in the Republic of China, the objective of which is the expression of an opinion regarding the financial statements taken as a whole. Accordingly, we do not express such an opinion.
As described in Note 1. 3) to the consolidated financial statements as of and for the three months ended March 31, 2006, the financial statements of certain subsidiaries were not reviewed by independent accountants. Total assets of these subsidiaries as of March 31, 2006 were $1,404,186 thousand New Taiwan dollars, accounting for 0.09% of the total consolidated assets. As of March 31, 2006, total liabilities of these subsidiaries were $338,448 thousand New Taiwan dollars, accounting for 0.02% of the total consolidated liabilities. For the three months ended March 31, 2006, total net income of these subsidiaries was $140,541 thousand New Taiwan dollars, accounting for 1.73% of the consolidated net income.
Based on our reviews, except for the effects on the consolidated financial statements as of and for the three months ended March 31, 2006 of such adjustments, if any, as might have been determined to be necessary have the subsidiaries’ financial statements been reviewed as explained in the preceding paragraph, we are not aware of any material modifications that should be made to the consolidated financial statements referred to in the first paragraph in order for them to be in conformity with the “Guidelines Governing the Preparation of Financial Reports by Financial Holding
3
Companies”, “Guidelines Governing the Preparation of Financial Reports by Securities Issuers” ,“Guidelines Governing the Preparation of Financial Reports by Public Banks”, “Guidelines Governing the Preparation of Financial Reports by Securities Firms”, “Guidelines Governing the Preparation of Financial Reports by Futures Commission Merchants”, "Business Entity Accounting Act","Regulation on Business Entity Accounting Handling", and generally accepted accounting principles in the Republic of China.
As described in Note 3 to the consolidated financial statements, First Financial Holding Co., Ltd. and its subsidiaries have adopted Financial Accounting Standards No.34 “Financial Instruments: Recognition and Measurement” and No.36 “Financial Instruments: Disclosure and Presentation”, effective from January 1, 2006.
May 7, 2007 ------------------------------------------------------------------------------------------------------- The accompanying consolidated financial statements are not intended to present the consolidated financial position and consolidated results of operations and cash flows in accordance with accounting principles and practices generally accepted in countries and jurisdictions other than the Republic of China. The standards, procedures, and practices utilized in the Republic of China to audit such consolidated financial statements may differ from those generally accepted in countries and jurisdictions other than the Republic of China. Accordingly, the accompanying consolidated financial statements and review report of the independent accountants are not intended for uses by those who are not informed about the accounting principles or auditing standards generally accepted in the Republic of China and their applications in practice.

4
First Financial Holding Co., Ltd. And Its Subsidiaries Consolidated Balance Sheets
March 31, 2007 And 2006 (Expressed In Thousands of New Taiwan Dollars)
(Reviewed, Not Audited)
March 31, 2007 March 31, 2006 Change
Percentage March 31, 2007 March 31, 2006 Change
Percentage Amount Amount % Amount Amount % ASSETS LIABILITIES AND STOCKHOLDERS’ EQUITY Cash And Cash Equivalents (Note 4(1)) $ 38,474,530 $ 24,091,275 60 Due To Central Bank And Other Banks (Notes 4(14) and 5) $ 114,736,730 $ 135,858,190 ( 16) Due From Central Bank And Call Loans To Other Banks (Notes 4(2) and 5) 147,823,262 134,775,989 10 Funds Borrowed From Central Bank And Other Banks 169,731 231,559 ( 27) Financial Assets At Fair Value Through Profit Or Loss– Net(Notes 4(3) Commercial Paper Payable – Net (Note 4(15)) 2,768,101 2,546,289 9
5 and 6) 49,436,206 44,700,290 11 Financial Liabilities At Fair Value Through Profit Or Loss - Net Investments In Bills And Bonds Under Resale Agreements (Note 4(4)) 3,505,612 1,745,000 101 (Note 4(16)) 53,336,715 36,692,167 45 Receivables – Net (Note 4(5)) 31,792,940 25,813,755 23 Bills And Bonds Payable Under Repurchase Agreements Bills Discounted and Loans– Net (Notes 4(6) and 5) 983,913,161 874,046,566 13 (Note 4(17)) 14,464,437 16,956,125 ( 15) Available-for-sale Financial Assets – Net (Notes 4(7) and 6) 75,182,169 88,331,124 ( 15) Payables (Notes 4(18)) 49,310,202 36,358,177 36 Held-to-maturity Financial Assets – Net (Note 4(8)) 201,474,543 227,192,836 ( 11) Deposits And Remittances (Notes 4(19) and 5) 1,221,573,427 1,128,643,000 8 Equity Investments Accounted For Under The Equity Method (Note 4(9)) 3,455,919 3,291,510 5 Bonds Payable (Note 4(20)) 25,500,000 28,992,051 ( 12) Other Financial Assets – Net (Note 4(10) and (13)) 20,939,653 32,593,643 ( 36) Other Borrowings (Note 4(21)) 2,915,200 2,393,186 22 Properties , Plants And Equipment – Net (Notes 4(11) and 6) 24,079,034 24,684,513 ( 2) Accrued Pension Liabilities (Note 4(22)) 1,510,288 1,415,035 7 Intangible Assets 394,366 292,634 35 Other Financial Liabilities 518,985 6,557,019 ( 92) Other assets Reserves For Operation And Liabilities 833,116 796,445 5 Other Assets (Notes 4(12), and 6) 12,198,633 13,769,075 ( 11) Other Liabilities (Note 4(23)) 8,350,834 8,938,190 ( 7) Deferred Income Tax Assets (Note4(28)) 7,117,728 10,385,526 ( 31) TOTAL LIABILITIES 1,495,987,766 1,406,377,433 6 STOCKHOLDERS’ EQUITY Common Stock (Note 4(24)) 59,721,919 58,265,287 2
Additional Paid-in Capital (Note 4(25)) 15,704,668 15,718,385 - Retained Earnings Legal reserve (Notes 4(26)) 2,447,294 1,029,755 138 Special reserve (Notes 4(26)) 78,743 269,956 ( 71) Unappropriated earnings (Notes 4(27)) 19,639,422 18,974,074 4 Other Stockholders’ Equity Cumulative translation adjustments 112,353 ( 168,426 ) -
Unrealized gain or loss on available-for-sale financial assets
(Note 4(7)) 5,797,453 4,852,579 19 Unrealized gain or loss on cash flow hedges (Note 10(1)) 299,675 394,693 ( 24) Net loss not recognized as pension cost ( 1,537 ) - - TOTAL STOCKHOLDERS’ EQUITY 103,799,990 99,336,303 4 TOTAL ASSETS $ 1,599,787,756 $ 1,505,713,736 6 TOTAL LIABILITIES AND STOCKHOLDERS’ EQUITY $ 1,599,787,756 $ 1,505,713,736 6
The accompanying notes are an integral part of these consolidated financial statements.
See PricewaterhouseCoopers reviewed report date May 7, 2007.

5
First Financial Holding Co., Ltd. And Its Subsidiaries Consolidated Statements of Income
For The Three Months Ended March 31, 2007 And 2006 (Expressed In Thousands of New Taiwan Dollars, Except For Earnings Per Share)
(Reviewed, Not Audited)
For The Three Months Ended March 31,
2007 2006 Change
Percentage Amount Amount % Interest Income $ 11,557,599 $ 10,220,302 13 Less: Interest Expenses ( 6,275,506 ) ( 5,122,097 ) 23 Net Interest Income 5,282,093 5,098,205 4 Net Non-interest Income
Net service fee and commission income 1,958,430 1,479,099 32 Gains or losses on financial assets and
financial liabilities at fair value through profit or loss (Note4(3)(16)) 770,082 480,077 60
Realized gains or losses on available-for-sale financial assets 220,162 7,941 2,672
Realized gains or losses on held-to-maturity financial assets 1,845 1,864 ( 1)
Income from equity investments accounted for under the equity method – net(Note 4(9)) 70,023 108,961 ( 36)
Foreign exchange gains or losses 86,056 287,210 ( 70) Impairment losses (Note4(13)) ( 21,307 ) ( 52,722 ) ( 60) Other non-interest income
Bad debts and overdue accounts recovered 636,098 524,658 21 Other 15,703 171,453 ( 91)Net Revenues 9,019,185 8,106,746 11 Provision For Credit Losses ( 1,394,494 ) ( 1,362,421 ) 2 Operating Expenses
Personnel expenses (Note 4(29)) ( 2,461,435 ) ( 2,457,794 ) - Depreciation and amortization expenses
(Note 4(29)) ( 316,117 ) ( 348,437 ) ( 9) Business expenses and general and
administrative expenses ( 1,091,440 ) ( 1,040,006 ) 5 Consolidated Income From Continuing
Operations Before Income Taxes 3,755,699 2,898,088 30 Income Tax Expenses (Note 4(28)) ( 800,855 ) ( 694,895 ) 15 Consolidated Income From Continuing
Operations After Income Taxes 2,954,844 2,203,193 34 Cumulative Effect Of A Change In Accounting
Principle (Net Of Income Taxes Of $367 AND $0 ) - 647,608 ( 100)
Total Consolidated Net Income $ 2,954,844 $ 2,850,801 4 Total Consolidated Net Income Attributed to:
Stockholders of parent company $ 2,954,844 $ 2,850,801 Minority interests $ - $ -
Earnings Per Common Share (Note 4(30)) Before Taxes After Taxes Before Taxes After Taxes Consolidated Income From Continuing
Operations $ 0.63 $ 0.49 $ 0.48 $ 0.37 Cumulative Effect Of A Change In Accounting
Principle (Note 3) - - 0.11 0.11 $ 0.63 $ 0.49 $ 0.59 $ 0.48
The accompanying notes are an integral part of these consolidated financial statements. See PricewaterhouseCoopers reviewed report date May 7, 2007.
6
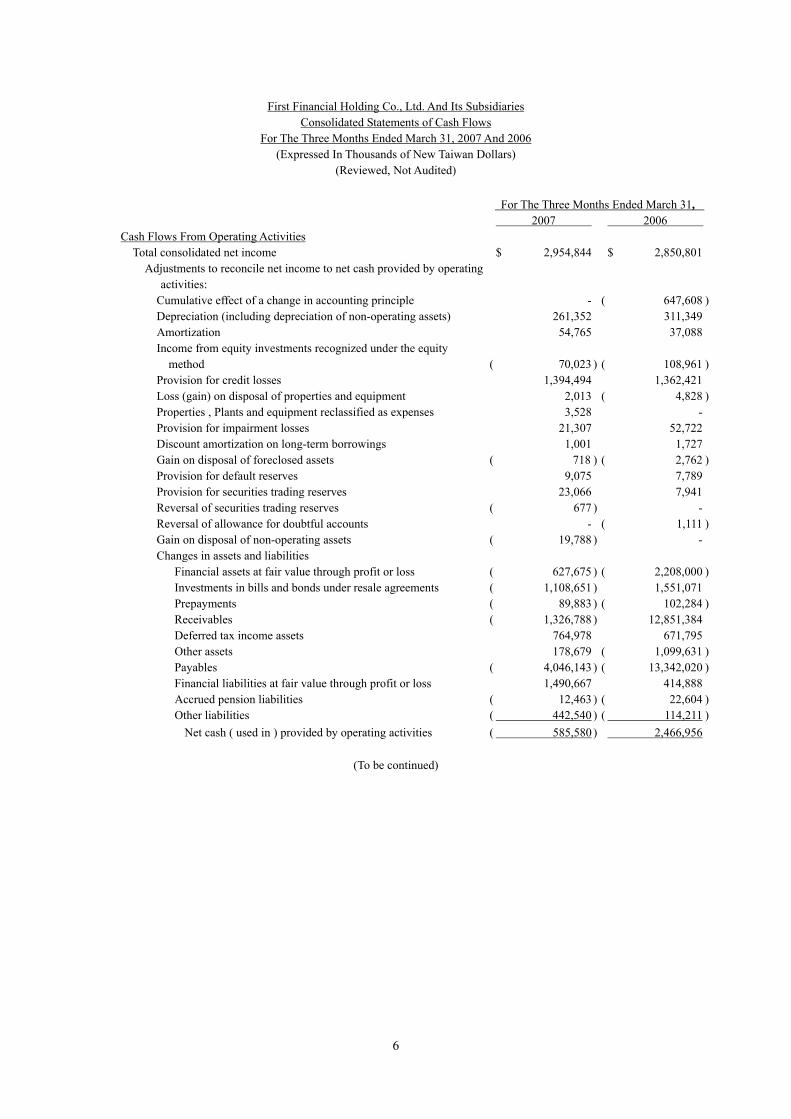
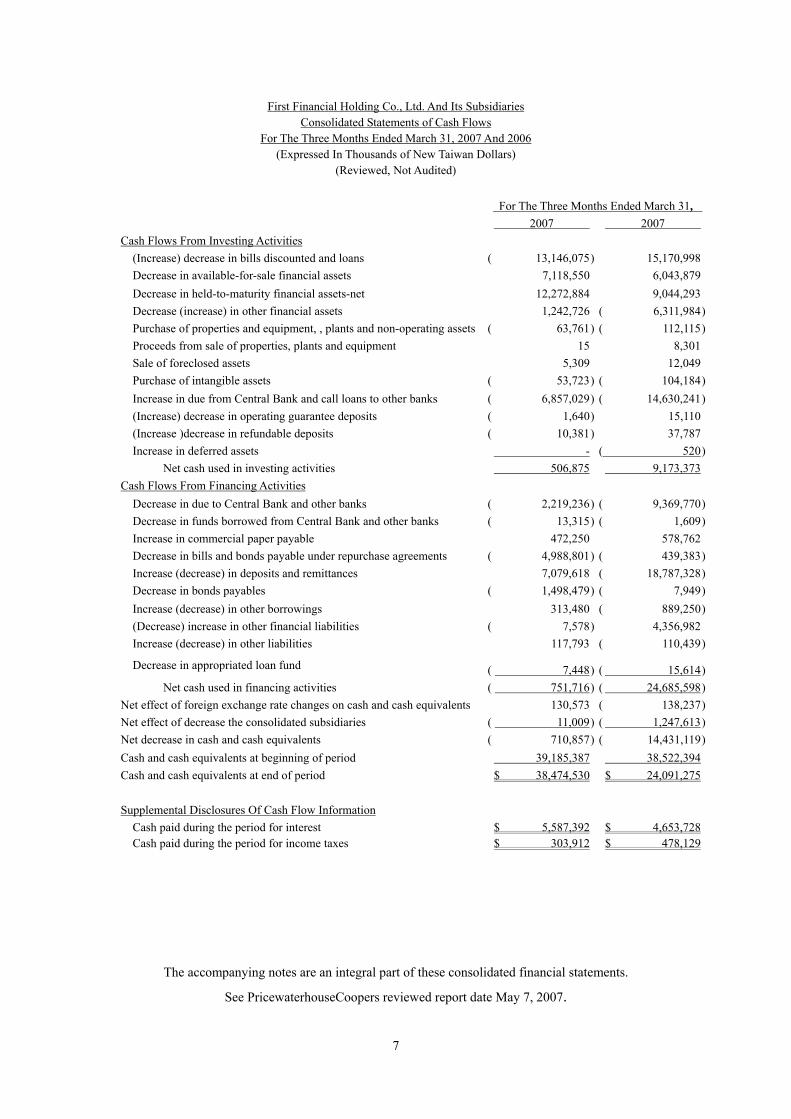
First Financial Holding Co., Ltd. And Its Subsidiaries Consolidated Statements of Cash Flows
For The Three Months Ended March 31, 2007 And 2006 (Expressed In Thousands of New Taiwan Dollars)
(Reviewed, Not Audited)
For The Three Months Ended March 31, 2007 2006 Cash Flows From Operating Activities Total consolidated net income $ 2,954,844 $ 2,850,801 Adjustments to reconcile net income to net cash provided by operating
activities: Cumulative effect of a change in accounting principle - ( 647,608 ) Depreciation (including depreciation of non-operating assets) 261,352 311,349 Amortization 54,765 37,088 Income from equity investments recognized under the equity
method ( 70,023 ) ( 108,961 ) Provision for credit losses 1,394,494 1,362,421 Loss (gain) on disposal of properties and equipment 2,013 ( 4,828 ) Properties , Plants and equipment reclassified as expenses 3,528 - Provision for impairment losses 21,307 52,722 Discount amortization on long-term borrowings 1,001 1,727 Gain on disposal of foreclosed assets ( 718 ) ( 2,762 ) Provision for default reserves 9,075 7,789 Provision for securities trading reserves 23,066 7,941 Reversal of securities trading reserves ( 677 ) - Reversal of allowance for doubtful accounts - ( 1,111 ) Gain on disposal of non-operating assets ( 19,788 ) - Changes in assets and liabilities Financial assets at fair value through profit or loss ( 627,675 ) ( 2,208,000 ) Investments in bills and bonds under resale agreements ( 1,108,651 ) 1,551,071 Prepayments ( 89,883 ) ( 102,284 ) Receivables ( 1,326,788 ) 12,851,384 Deferred tax income assets 764,978 671,795 Other assets 178,679 ( 1,099,631 ) Payables ( 4,046,143 ) ( 13,342,020 ) Financial liabilities at fair value through profit or loss 1,490,667 414,888 Accrued pension liabilities ( 12,463 ) ( 22,604 ) Other liabilities ( 442,540 ) ( 114,211 )
Net cash ( used in ) provided by operating activities ( 585,580 ) 2,466,956
(To be continued)
7
First Financial Holding Co., Ltd. And Its Subsidiaries Consolidated Statements of Cash Flows
For The Three Months Ended March 31, 2007 And 2006 (Expressed In Thousands of New Taiwan Dollars)
(Reviewed, Not Audited)
For The Three Months Ended March 31, 2007 2007 Cash Flows From Investing Activities (Increase) decrease in bills discounted and loans ( 13,146,075 ) 15,170,998 Decrease in available-for-sale financial assets 7,118,550 6,043,879 Decrease in held-to-maturity financial assets-net 12,272,884 9,044,293 Decrease (increase) in other financial assets 1,242,726 ( 6,311,984 ) Purchase of properties and equipment, , plants and non-operating assets ( 63,761 ) ( 112,115 ) Proceeds from sale of properties, plants and equipment 15 8,301 Sale of foreclosed assets 5,309 12,049 Purchase of intangible assets ( 53,723 ) ( 104,184 ) Increase in due from Central Bank and call loans to other banks ( 6,857,029 ) ( 14,630,241 ) (Increase) decrease in operating guarantee deposits ( 1,640 ) 15,110 (Increase )decrease in refundable deposits ( 10,381 ) 37,787 Increase in deferred assets - ( 520 )
Net cash used in investing activities 506,875 9,173,373 Cash Flows From Financing Activities Decrease in due to Central Bank and other banks ( 2,219,236 ) ( 9,369,770 ) Decrease in funds borrowed from Central Bank and other banks ( 13,315 ) ( 1,609 ) Increase in commercial paper payable 472,250 578,762 Decrease in bills and bonds payable under repurchase agreements ( 4,988,801 ) ( 439,383 ) Increase (decrease) in deposits and remittances 7,079,618 ( 18,787,328 ) Decrease in bonds payables ( 1,498,479 ) ( 7,949 ) Increase (decrease) in other borrowings 313,480 ( 889,250 ) (Decrease) increase in other financial liabilities ( 7,578 ) 4,356,982 Increase (decrease) in other liabilities 117,793 ( 110,439 )
Decrease in appropriated loan fund ( 7,448 ) ( 15,614 )Net cash used in financing activities ( 751,716 ) ( 24,685,598 )
Net effect of foreign exchange rate changes on cash and cash equivalents 130,573 ( 138,237 )Net effect of decrease the consolidated subsidiaries ( 11,009 ) ( 1,247,613 )Net decrease in cash and cash equivalents ( 710,857 ) ( 14,431,119 )Cash and cash equivalents at beginning of period 39,185,387 38,522,394 Cash and cash equivalents at end of period $ 38,474,530 $ 24,091,275 Supplemental Disclosures Of Cash Flow Information Cash paid during the period for interest $ 5,587,392 $ 4,653,728 Cash paid during the period for income taxes $ 303,912 $ 478,129
The accompanying notes are an integral part of these consolidated financial statements.
See PricewaterhouseCoopers reviewed report date May 7, 2007.
8
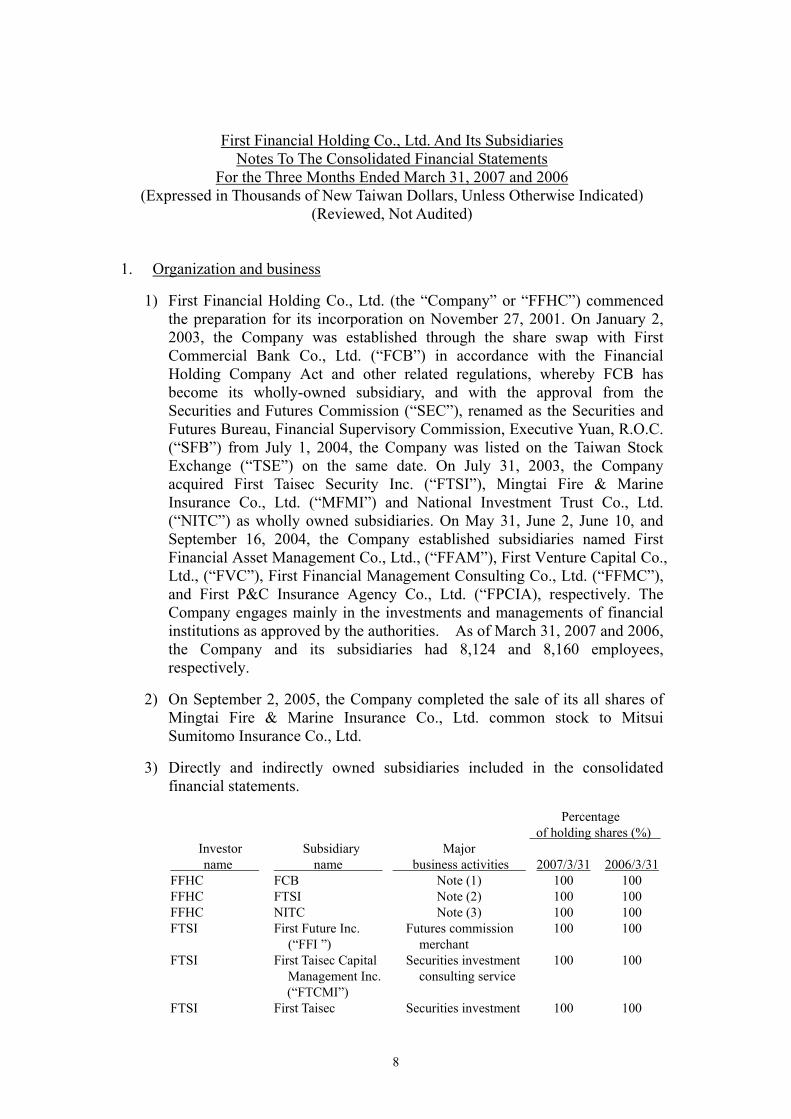
First Financial Holding Co., Ltd. And Its Subsidiaries Notes To The Consolidated Financial Statements
For the Three Months Ended March 31, 2007 and 2006 (Expressed in Thousands of New Taiwan Dollars, Unless Otherwise Indicated)
(Reviewed, Not Audited)
1. Organization and business
1) First Financial Holding Co., Ltd. (the “Company” or “FFHC”) commenced the preparation for its incorporation on November 27, 2001. On January 2, 2003, the Company was established through the share swap with First Commercial Bank Co., Ltd. (“FCB”) in accordance with the Financial Holding Company Act and other related regulations, whereby FCB has become its wholly-owned subsidiary, and with the approval from the Securities and Futures Commission (“SEC”), renamed as the Securities and Futures Bureau, Financial Supervisory Commission, Executive Yuan, R.O.C. (“SFB”) from July 1, 2004, the Company was listed on the Taiwan Stock Exchange (“TSE”) on the same date. On July 31, 2003, the Company acquired First Taisec Security Inc. (“FTSI”), Mingtai Fire & Marine Insurance Co., Ltd. (“MFMI”) and National Investment Trust Co., Ltd. (“NITC”) as wholly owned subsidiaries. On May 31, June 2, June 10, and September 16, 2004, the Company established subsidiaries named First Financial Asset Management Co., Ltd., (“FFAM”), First Venture Capital Co., Ltd., (“FVC”), First Financial Management Consulting Co., Ltd. (“FFMC”), and First P&C Insurance Agency Co., Ltd. (“FPCIA), respectively. The Company engages mainly in the investments and managements of financial institutions as approved by the authorities. As of March 31, 2007 and 2006, the Company and its subsidiaries had 8,124 and 8,160 employees, respectively.
2) On September 2, 2005, the Company completed the sale of its all shares of Mingtai Fire & Marine Insurance Co., Ltd. common stock to Mitsui Sumitomo Insurance Co., Ltd.
3) Directly and indirectly owned subsidiaries included in the consolidated financial statements.
Percentage of holding shares (%)
Investor Subsidiary Major name name business activities 2007/3/31 2006/3/31FFHC FCB Note (1) 100 100 FFHC FTSI Note (2) 100 100 FFHC NITC Note (3) 100 100 FTSI First Future Inc.
(“FFI ”) Futures commission
merchant 100 100
FTSI First Taisec Capital Management Inc.
(“FTCMI”)
Securities investment consulting service
100 100
FTSI First Taisec Securities investment 100 100

9
Percentage of holding shares (%)
Investor Subsidiary Major name name business activities 2007/3/31 2006/3/31
Securities (Asia) Limited (“FTSL”) (Note 4)
consulting service
FTSL
First Worldsec Securities Limited (‘FWSL”) (Note4)
Securities investment consulting service
100 100
Note (1) FCB was established in 1899 and it had been a listed company since February 9, 1962. It was privatized on January 22, 1998. On January 2, 2003, FCB became the subsidiary of First Financial Holding Co., Ltd. through the share swap and was de-listed from the TSE to become a public company in accordance with the related regulations set forth by the SFB. As of March 31, 2007, FCB comprises various Divisions, including Operation Division, Trust Division, International Business Division, Offshore Banking Unit, domestic and overseas branches, and representative offices. FCB engages mainly in the following business activities:
1) Business activities provided by the Banking Law;
2) Trust business as authorized by the authorities;
3) Establishing overseas branches to engage in those business activities as approved by the respective local governments;
4) Other business activities approved by the authorities.
Note (2) FTSI (formerly known as Taisec Securities Inc.) was established in August 1988 and it became the subsidiary of the Company on July 31, 2003. FTSI is authorized to engage in the following business activities:
1) Brokerages and proprietary trading of marketable securities at the securities exchange markets;
2) Underwriting of marketable securities;
3) Registration and transfer agency service for securities;
4) Margin loans and stock loans of marketable securities trading;
5) Futures introducing broker business;
6) Brokerages of futures business; and
7) Other securities-related businesses as approved by the competent authorities.

10
FTSI transferred its futures brokerage business to First Futures Inc. (the wholly owned subsidiary of FTSI) to promote its business in November 2003. FTSI founded futures dealing department to perform future business in September 2005.
As FCB and FTSI are both wholly owned subsidiaries of the Company, the Board of Directors of FTSI resolved to acquire securities brokerage business of FCB at book value to leverage the synergies of the First Group, effective on December 1, 2003.
Note (3) NITC became the wholly owned subsidiary of the Company through the share swap on July 31, 2003. NITC engages mainly in the management of securities investment trust funds.
Note (4)The financial statements of such investees which are consolidated in the First Group’s first quarter consolidated financial statements were not reviewed by the independent accountants as of and for the three month ended March 31, 2007 and 2006. The Company believed that the impact, if any, would be insignificant had the investees’ financial statements been reviewed.
4) Movement of consolidated entities.
A. Increase in consolidated entities: None
B. Decrease in consolidated entities
Percentage of the Company’s direct/ indirect holding ownership (%)
Name RelationshipMajor Business
Activities March 31, 2007 March 31,2006 Note
NITC (Cayman Islands) Ltd.
(“NITC (Cayman)”)
Indirect Subsidiary
1. Issuing beneficiary certificates and raising securities investment trust funds;
2. Managing securities investment trust funds to invest in securities;
3. Engaging in trading and investments approved by the British Cayman Islands government
100 100 Note 1
Note 1: Effective from January 1, 2006, NITC prepares its consolidated financial statements pursuant to the amended Statement of Financial Accounting Standards No.7, “Consolidated Financial Statements”. As the NITC Cayman’s total assets accounts for less than 1% of the NITC’s total assets and its net revenue account for less than 0.2% of NITC’s net revenue, the NITC Cayman is immaterial to NITC. Therefore, excluding the NITC Cayman financial statements from the consolidated financial statements will
11
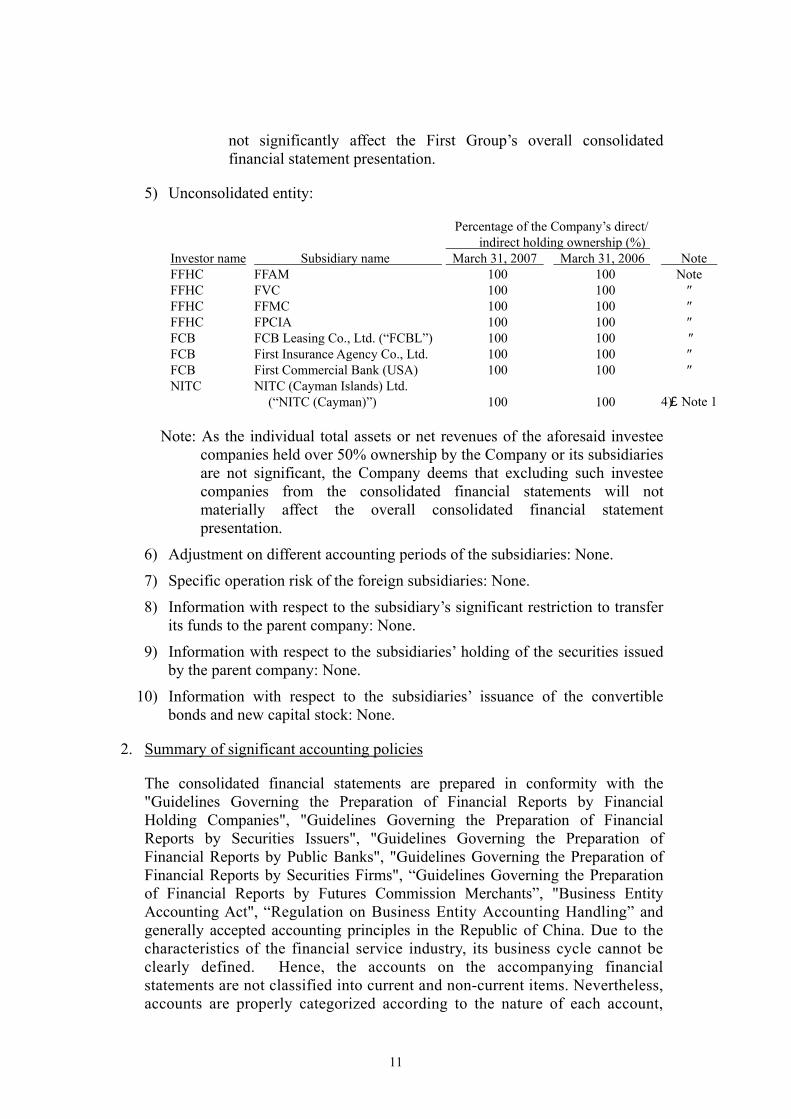
not significantly affect the First Group’s overall consolidated financial statement presentation.
5) Unconsolidated entity:
Percentage of the Company’s direct/ indirect holding ownership (%)
Investor name Subsidiary name March 31, 2007 March 31, 2006 Note FFHC FFAM 100 100 Note FFHC FVC 100 100 ″ FFHC FFMC 100 100 ″ FFHC FPCIA 100 100 ″ FCB FCB Leasing Co., Ltd. (“FCBL”) 100 100 ″ FCB First Insurance Agency Co., Ltd. 100 100 ″ FCB First Commercial Bank (USA) 100 100 ″ NITC NITC (Cayman Islands) Ltd.
(“NITC (Cayman)”)
100
100
4)、Note 1
Note: As the individual total assets or net revenues of the aforesaid investee companies held over 50% ownership by the Company or its subsidiaries are not significant, the Company deems that excluding such investee companies from the consolidated financial statements will not materially affect the overall consolidated financial statement presentation.
6) Adjustment on different accounting periods of the subsidiaries: None.
7) Specific operation risk of the foreign subsidiaries: None.
8) Information with respect to the subsidiary’s significant restriction to transfer its funds to the parent company: None.
9) Information with respect to the subsidiaries’ holding of the securities issued by the parent company: None.
10) Information with respect to the subsidiaries’ issuance of the convertible bonds and new capital stock: None.
2. Summary of significant accounting policies
The consolidated financial statements are prepared in conformity with the "Guidelines Governing the Preparation of Financial Reports by Financial Holding Companies", "Guidelines Governing the Preparation of Financial Reports by Securities Issuers", "Guidelines Governing the Preparation of Financial Reports by Public Banks", "Guidelines Governing the Preparation of Financial Reports by Securities Firms", “Guidelines Governing the Preparation of Financial Reports by Futures Commission Merchants”, "Business Entity Accounting Act", “Regulation on Business Entity Accounting Handling” and generally accepted accounting principles in the Republic of China. Due to the characteristics of the financial service industry, its business cycle cannot be clearly defined. Hence, the accounts on the accompanying financial statements are not classified into current and non-current items. Nevertheless, accounts are properly categorized according to the nature of each account,
12
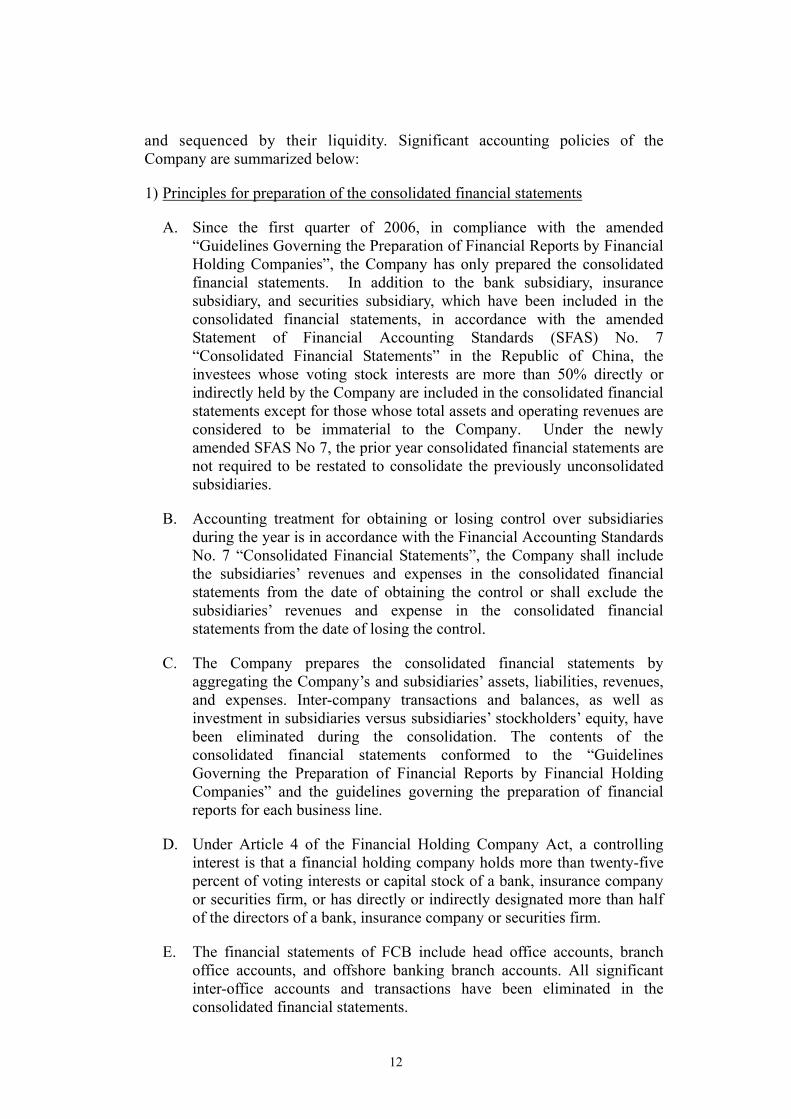
and sequenced by their liquidity. Significant accounting policies of the Company are summarized below:
1) Principles for preparation of the consolidated financial statements
A. Since the first quarter of 2006, in compliance with the amended “Guidelines Governing the Preparation of Financial Reports by Financial Holding Companies”, the Company has only prepared the consolidated financial statements. In addition to the bank subsidiary, insurance subsidiary, and securities subsidiary, which have been included in the consolidated financial statements, in accordance with the amended Statement of Financial Accounting Standards (SFAS) No. 7 “Consolidated Financial Statements” in the Republic of China, the investees whose voting stock interests are more than 50% directly or indirectly held by the Company are included in the consolidated financial statements except for those whose total assets and operating revenues are considered to be immaterial to the Company. Under the newly amended SFAS No 7, the prior year consolidated financial statements are not required to be restated to consolidate the previously unconsolidated subsidiaries.
B. Accounting treatment for obtaining or losing control over subsidiaries during the year is in accordance with the Financial Accounting Standards No. 7 “Consolidated Financial Statements”, the Company shall include the subsidiaries’ revenues and expenses in the consolidated financial statements from the date of obtaining the control or shall exclude the subsidiaries’ revenues and expense in the consolidated financial statements from the date of losing the control.
C. The Company prepares the consolidated financial statements by aggregating the Company’s and subsidiaries’ assets, liabilities, revenues, and expenses. Inter-company transactions and balances, as well as investment in subsidiaries versus subsidiaries’ stockholders’ equity, have been eliminated during the consolidation. The contents of the consolidated financial statements conformed to the “Guidelines Governing the Preparation of Financial Reports by Financial Holding Companies” and the guidelines governing the preparation of financial reports for each business line.
D. Under Article 4 of the Financial Holding Company Act, a controlling interest is that a financial holding company holds more than twenty-five percent of voting interests or capital stock of a bank, insurance company or securities firm, or has directly or indirectly designated more than half of the directors of a bank, insurance company or securities firm.
E. The financial statements of FCB include head office accounts, branch office accounts, and offshore banking branch accounts. All significant inter-office accounts and transactions have been eliminated in the consolidated financial statements.

13
2) Cash and cash equivalents
Cash includes cash on hand, demand deposits, checking deposits, and cancelable time deposits. Cash equivalents are short-term investments that are readily convertible to known amounts of cash and are so near the maturity date that such investments present insignificant risk of value arising from changes in interest rates. Such investments include treasury bills, commercial paper, bankers’ acceptance, and so forth whose maturity dates are less than three months from the investment dates.
3) Financial assets and financial liabilities at fair value through profit or loss
A. Equity securities and beneficiary certificates are accounted for using trade date accounting; debt securities, and derivative financial instruments are accounted for using settlement date accounting. Financial instruments are initially recognized at their fair values.
B. Financial assets and liabilities at fair value through profit or loss shall be measured at fair value with changes in fair value recognized as gains or losses in the current period. For stocks listed on TSE or OTC and closed-end funds, fair value is determined based on the closing price at the balance sheet date. For open-end funds, fair value is determined based on the net asset value of the given fund at the balance sheet date. For beneficiary securities, fair value is determined based on the discounted value of expected future cash flows at the balance sheet date. For bonds listed on TSE or OTC, fair value is determined based on the latest transaction price of Automatic Order Matching and Execution System in OTC. For those bonds not listed on the TSE or OTC, fair value is determined based on the discounted value of expected future cash flows at the balance sheet date or the market price provided by Bloomberg or Reuters. For derivative financial instruments for trading purpose, fair value is determined based on a quoted market price in an active market at the balance sheet date if there is a quoted market price in an active market, or is determined based on applying other valuation techniques, such as discounted cash flow analyses or option pricing models, to estimate the fair value at the balance sheet date if there is no quoted market price in an active market.
C. Criteria to designate financial assets and financial liabilities as at fair value through profit or loss are as follows:
A) Hybrid (combined) instruments;
B) The designation can eliminate or significantly reduce a measurement or recognition inconsistency; or
C) The designation is in compliance with a documented risk management or investment strategy of the Company and its subsidiaries to evaluate the performance of assets or liabilities based on a fair value basis.

14
4) Bills and bonds under repurchase or resale agreements
Bills and bonds under resale or repurchase agreements are accounted for under the financing method. Bills and bonds sold under repurchase agreements are recorded as “Bills and bonds payable under repurchase agreements” at the sale date. Bills and bonds invested under resale agreements are recorded as “Investments in bills and bonds under resale agreements” at the purchase date. The difference between the cost and the repurchase price is recorded as interest expenses between the sale date and the repurchase date. The difference between the cost and the resale price is recorded as interest income between the purchase date and the resale date.
5) Margin loans, stock loans and refinancing
A. FTSI conducts margin loan business to provide funds for its customers to purchase securities. The margin loans given to customers are recorded as “margin loans receivable” and are collateralized by the securities that the customers purchase. The collateral securities are recorded through memorandum accounts and are returned to customers when the loans are repaid.
B. FTSI conducts stock loan business to lend securities to its customers to sell short. The deposits received from customers on FTSI’s securities lending are recorded as “deposits received on securities lending”. Proceeds from sales of securities lent to customers less any securities exchange taxes, dealer’s commissions, and financing charges are as the collateral for securities lent and are recorded under “collateralized proceeds payable from securities lending”, the securities lent to customers to sell short are recorded through memorandum accounts. When the customers return the securities, FTSI gives the deposits received and the proceeds from securities sold back to customers.
C. The “refinancing of margin loans” refers to refinancing to borrow funds from securities finance companies when there are insufficient funds to conduct margin loan business. The refinancing of margin loans is recorded as “refinancing borrowing” and is collateralized by the securities purchased by customers on margin loans.
D. The “refinancing of stock loans” refers to refinancing to borrow securities from securities finance companies when there are insufficient securities to conduct securities lending business. The deposits or collateral given to securities finance companies by FTSI are recorded as “refinancing margin deposits”. The proceeds from securities lent to customer to sell short are given to the securities finance companies as the collateral and are recorded as “collateralized proceeds payable from securities lending” and “refinancing deposits receivable”, respectively.
15
6) Customer margin deposit account
FFI conducts futures brokerage business and requires customers to open margin accounts to receive margin deposits and premiums, and to adjust the mark-to-market differences.
7) Futures trader’s equity / Futures margin deposits receivable
The futures trader’s equity includes margin deposits and premiums received from futures customers and the mark-to-market adjustment, and the futures trader’s equity is recorded as liabilities on the balance sheet. The customers’ margin accounts cannot be offset reciprocally except for the same type of account under the same customer. When the futures trader’s equity results in a debit balance, it should be recorded as futures margin deposits receivable.
8) Bills discounted and loans
A. Bills discounted and loans (including non-performing loans) are recorded at the amounts of principal outstanding. Interest income is recognized on an accrual basis except for interest on non–performing loans.
B. All non-performing loans under which there is no principal payment after the lapse of six full months, lawsuit has been filed against borrower and guarantor(s) or the collaterals are executed shall be transferred to non-accrual loans account item. Interest shall cease to be accrued for non-performing loans that are transferred to non-accrual loans account item. Any unpaid interest due on a non-performing loan prior to its transfer to a non-accrual loan shall be transferred to the non-accrual loans item together with principal.
C. When there is postponement or modification of the credit terms for the debtors, the Bank agrees to receive partial interests and the rest of interests will cease accrual and will be recognized after cash is received.
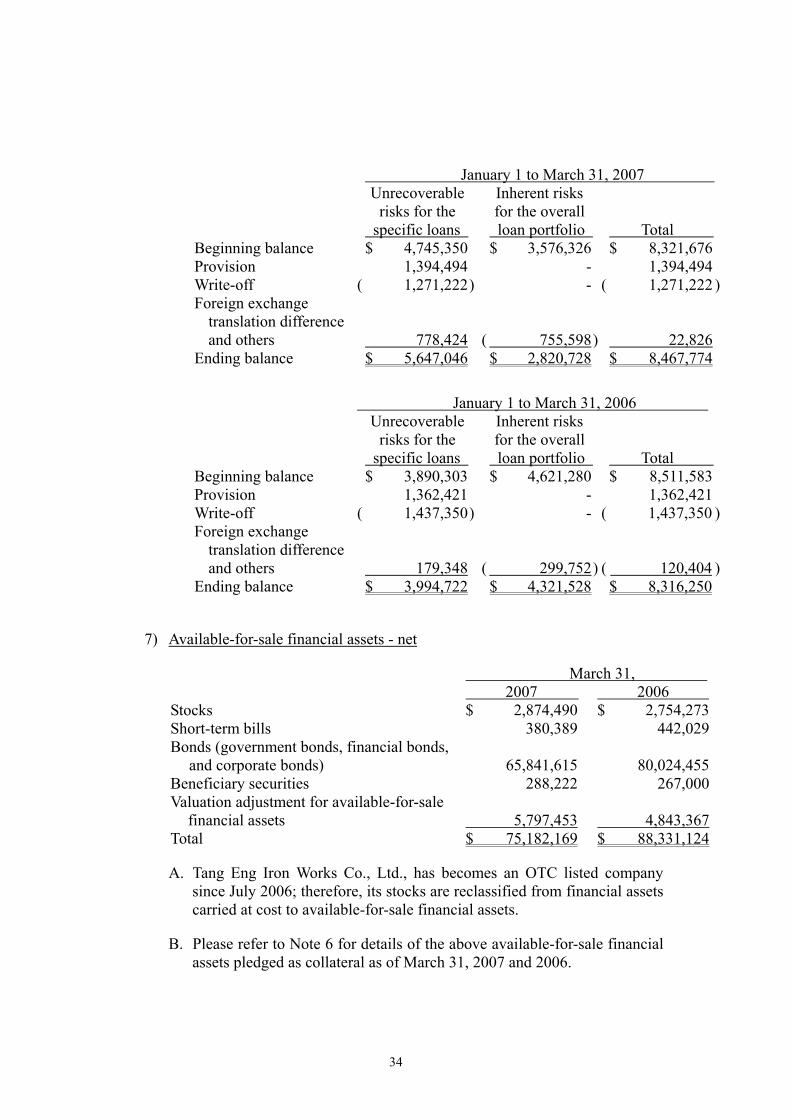
9) Available-for-sale financial assets
A. Equity securities are accounted for using trade date accounting; Debt securities are accounted for using settlement date accounting. Such financial instruments are initially recognized at fair value plus the acquisition or issuance cost.
B. Available-for-sale financial assets are measured at fair value with changes in fair value recognized in an adjustment account in the stockholders’ equity. When the financial asset is derecognized, the cumulative gain or loss that was previous recognized in equity is recognized in profit or loss in income statement. For stocks listed on the TSE or OTC and closed-end funds, fair value is determined based on the closing price at the balance sheet date. For open-end funds, fair value is determined based on the net asset value of the given fund at the
16
balance sheet date. For beneficiary securities, fair value is determined based on the discounted value of expected future cash flows at the balance sheet date. For bonds listed on TSE or OTC, fair value is determined based on the latest transaction price of Automatic Order Matching and Execution System in OTC. For those bonds not listed on the TSE or OTC, fair value is determined based on discounted value of expected future cash flows at the balance sheet date or the market price provided by Bloomberg or Reuters.
C. An impairment loss is recognized when there is objective evidence of impairment. In the subsequent period, if the amount of the impairment loss decreases due to an event occurring after the impairment was originally recognized, for equity instruments, the decrease shall be recognized as an adjustment account in the stockholders’ equity; and for debt instruments, the previously recognized impairment loss is reversed through profit and loss.
10) Held-to-maturity financial assets
A. Held-to-maturity financial assets are accounted for using settlement date accounting and are initially recognized at fair value plus the acquisition or issuance cost. Gains or losses are recognized in the income statement when the investments are derecognized.
B. Held-to-maturity financial assets are measured at amortized cost using the interest method at the balance sheet date.
C. An impairment loss is recognized when there is objective evidence of impairment. In the subsequent period, if the amount of the impairment loss decreases due to an event occurring after the impairment was originally recognized, the previously recognized impairment loss is reversed through profit and loss to the extent that the carrying amounts shall not exceed the amortized cost that would have been determined had no impairment loss been recognized in prior years.
11) Equity investments accounted for under the equity method
A. The Company was formed by FCB pursuant to the Explanatory Note (90) No. 182 of the Accounting Research and Development Foundation of the R.O.C. dated October 29, 2001. Capital expenditure incurred by the Company to acquire equity interest in a financial institution through share swap is stated at the book value of the respective financial institution’s assets less the book value of liabilities. The par value of the new shares issued is recorded as common stock, and the amount in excess of the par value is recorded as capital surplus.
B. Long-term equity investments that the First Group owns at least 20% of the investees’ voting stock interests or exercises significant influence over the investees are accounted for under the equity method. The
17
carrying amount of such equity investments are evaluated pursuant to the investment costs plus or minus the net income or loss and changes in stockholders’ equity of the investee recognized proportionally according to the percentage of the investee’s ownership held by the First Group. The cash dividends received from investees are recorded as deduction of the investment cost. For the stock dividends received from investees, the investment amount will not be increased and the investment income will not be recognized. A memorandum entry will be made to record the additional shares received. When there is sufficient evidence to indicate that the fair value of the investment is impaired and the probability of the recovery is remote, the loss on investments is recognized in the current period. If such equity investments are disposed of, the cost is calculated under the weighted average method.
C. Effective from January 1, 2006, for an investee company accounted for under the equity method, if the First Group does not have control interests but can exercise significant influence over the investee, investment losses are recognized to the extent that the balance of the investment plus advances to the investee is reduced to zero, unless the First Group guarantee the debts of investee company or has a commitment or intention to provide financial support to the investee company and then recognizes the investment loss proportionally according to the percentage of the investee’s ownership held by the Company continuously. However, if the First Group has control interests over the investee company, the investment losses in excess of the investee’s stockholders equity’s balance shall be fully recognized, unless other stockholders of the investee company have the obligation and ability to provide additional capital to take the losses. When the investee company begins to make a profit in the subsequent periods, the earnings are attributed to the First Group until the originally recognized excess losses are fully recovered.
D. For unrealized gain or loss from the downstream transactions between the Company and an investee accounted for under the equity method, if the Company has control interests over the investee, unrealized gain or loss shall be fully eliminated while if the Company does not have control interests over the investee, unrealized gain or loss shall be eliminated according to the percentage of the investee’s ownership held by the Company in the year end. For the unrealized gain or loss on transactions between investees accounted for under the equity method, if the Company has control interest over both the investees, unrealized gain or loss is eliminated according to the percentage of the ownership held by the Company in the investee generating the unrealized gain or loss, otherwise, it shall be eliminated according to the product of the percentage of each investee’s ownership held by the Company. Unrealized gain or loss is not recognized until it is realized.
E. The cumulative translation adjustment resulted from translation of the financial statements of foreign equity investments accounted for under

18
the equity method is recognized proportionally in the stockholders’ equity account based on the percentage of the investees’ ownership held by the First Group.
12) Other financial assets and financial liabilities
A. Financial assets measured at cost
A) Long-term investments in equity securities, which are not listed on the TSE or OTC, are accounted for using trade date accounting. Such financial instruments are initially recognized at fair value plus the acquisition or issuance cost and are subsequently carried at cost at the balance sheet date.
B) For financial assets measured at cost, an impairment loss shall be recognized if there is objective evidence of impairment. The impairment loss shall not be reversed.
B. Bond investments with no active market
A) Bond investments with no active market are accounted for using settlement date accounting. Such financial instruments are initially recognized at fair value plus acquisition or issuance cost. Gains or losses are recognized in the income statement when the investments are derecognized.
B) Bond investments with no active market shall be subsequently measured at amortized cost using the interest method.
C) An impairment loss is recognized when there is objective evidence of impairment. In the subsequent period, if the amount of the impairment loss decreases due to an event occurring after the impairment was originally recognized, the previously recognized impairment loss is reversed through profit and loss to the extent that the carrying amounts shall not exceed the amortized cost that would have been determined had no impairment loss been recognized in prior years.
C. Derivative financial assets and financial liabilities held for hedging
Derivative financial assets and financial liabilities held for hedging are those derivative financial assets and financial liabilities that are designated as effective hedging instruments under the hedge accounting and are measured at fair value.

19
13) Hedge accounting
A. Fair value hedge
When all the criteria of fair value hedge accounting are met, it recognizes the offsetting effects on gains or losses of changes in the fair values of the hedging instrument and the hedged item. The accounting treatment for hedging instruments is that the gain or loss from remeasuring the hedging instrument at fair value or the foreign currency component of its carrying amount shall be recognized immediately in the statement of income. The accounting treatment for hedged items is that the gain or loss attributable to the hedged risk shall adjust the carrying amount of the hedged item and be recognized immediately in the statement of income.
B. Cash flow hedge
A) When all the criteria of cash flow hedge accounting are met, the effective hedge portion of the gain or loss on the hedging instrument shall be recognized directly in the stockholders’ equity, and the ineffective hedge portion of the gain or loss on the hedging instrument shall be recognized in the statement of income.
B) The accounting treatment for a forecast transaction is as follows:
a. If a hedge of a forecast transaction subsequently results in the recognition of a financial asset or a financial liability, the related gains or losses that were originally recognized directly in the stockholders’ equity shall be reclassified into the statement of income in the same period or periods during which the asset acquired or liability assumed affects profit or loss. However, if it is expected that all or a portion of a loss recognized directly in stockholders’ equity will not be recovered in one or more future periods, the amount that is not expected to be recovered shall be reclassified into the statement of income immediately.
b. If a hedge of a forecast transaction subsequently results in the recognition of a non-financial asset or a non-financial liability, or if a forecast transaction for a non-financial asset or non-financial liability becomes a firm commitment for which fair value hedge accounting is applied, then the associated gains and losses that were recognized originally and directly in stockholders’ equity shall be reclassified into the statement of income in the same period or in the periods during which the asset acquired or liability assumed affects profit or loss or shall be adjusted to the initial cost or other carrying amount of the asset or liability, and this accounting treatment shall be adopted consistently.

20
14) Allowance for doubtful accounts and credit losses
A. The Bank shall classify on and off balance sheet credit assets and determines the allowance for credit losses by evaluating the recoverability of the outstanding balances of various loans at the balance sheet date according to “Guidance for Credit Assets Risk Assessment” and “Standard for Risk Classification of Credit Assets”. As to non-credit assets, the Bank evaluates the possible risks by the characteristics of assets in accordance with “Guidance for Non-Credit Assets Risk Assessment” and generally accepted accounting principles.
According to the amended “Regulations Governing the Procedures for Banking Institutions to Evaluate Assets and Deal with Non-performing / Non-accrual Loans” of the MOF, loans are classified into five categories: (1) normal (2) special attention (3) substandard (4) doubtful and (5) unrecoverable. Except that the normal loans are classified under categories 1, the abnormal loans shall be evaluated based on the status of the loan collateral and the length of time overdue. The allowance for credit losses for abnormal loans is provided at 2%, 10%, 50%, and 100% on loans classified under categories 2, 3, 4, and 5, respectively. Furthermore, the additional reserve is provided for specific loans as needed if the aforementioned allowance is insufficient according to the recoverability.
Upon the approval of the Board of Directors and the notice to the supervisors of FCB, the overdue loans are written off in accordance with the guideline of the “Regulations Governing the Procedures for Banking Institutions to Evaluate Assets and Deal with Non-performing / Non-accrual Loans”.
B. Allowance for doubtful accounts of FTSI and its subsidiaries are provided by assessing the collectibility of the notes and accounts receivable at the period-end. Securities dealing department’s allowance for bad debts evaluation is provided based on the Explanatory Letter Tai-Tsai-Jen (2) No. 82416 dated September 29, 1999 of the Securities and Futures Commission.
(1) Margin trading:
(a) When the Margin Ratio of a margin loan receivable is lower than the regulated minimum ratio and the balance of the margin loan receivable has not been partially collected to the extent that the margin ratio reaches the minimum ratio by the scheduled time, the related receivable should be transferred to and recorded as “overdue receivables”. The allowance for doubtful debts should be at least 50% and action should be taken to collect the receivable within 6 months. Additional allowance for bad debts within 6 months may need to be provided based on facts and circumstances if the receivable can not be collected.
21
(b) If the marketable securities in customers’ margin trading account are not disposable, the balance of the related margin loan receivable should be transferred to and recorded as “other receivables” immediately and 100% allowance for doubtful debts should be provided. Action should be taken to collect the receivable and review the appropriateness of its classification. Receivable not collected after further action is taken should be transferred to and recorded as “overdue receivables”.
(c) For these margin loan receivable that agreement has been reached with customers and the customers has fulfilled the obligation according to the agreement, no allowance for doubtful debts need to be provided. However, if there is any default on the subsequent payments, additional allowance for doubtful debts should be provided according to the above A or B.
(2) Normal trading part:
The receivables generated from customers breaching contracts should be transferred to and recorded as “other receivables” and 100% allowance for doubtful debts should be provided. Actions should be taken to collect the receivable and review the appropriateness of its classifications. Receivables not collected after further actions are taken should be transferred to “overdue receivables”
In accordance with the Value-added and Non-value-added Business Tax Law (the “Business Tax Law”), the business tax rate was adjusted from 5% to 2%, effective from July 1, 1999. The 3% tax reduction shall be set aside as additional allowance for doubtful accounts or be used to write off overdue accounts within four years, starting from July 1, 1999. If a company does not follow the above regulations, the tax authorities will impose 3% business taxes on the sales violating the “Business Tax Law”.
According to the Explanatory Letter Tai-Tsai-Jen Ruling (2) No.0920002964 of the MOF dated July 17, 2003, effective from July 1, 2003, the aforementioned regulation is no longer applicable to securities firms. However, if there is an outstanding balance of the aforesaid allowance for doubtful accounts on June 30, 2003, securities firms should comply with the Explanatory Letter Tai-Tsai-Jen (2) No.82416 dated September 29, 1999 to retain such a balance to write off overdue accounts in the future.
15) Properties, plants and equipments / non-operating assets
A. Properties, plants and equipments / non-operating assets are stated at cost except for appraisal increment as permitted under the relevant regulations. At the balance sheet date, the non-operating assets are evaluated at the

22
lower of carrying amount or recoverable amount. Depreciation is provided on a straight-line basis over the estimated service lives of the assets plus an additional year as salvage value, except for leasehold improvements, which are depreciated over the shorter of the leasing periods of the lease agreement or 5 years. The service lives of major properties and equipment range from 3 to 60 years.
B. Major renewals and improvements, which are incurred to increase the future economic benefits of the assets, are capitalized and depreciated. Routine maintenance and repairs are charged to expenses as incurred.
C. When properties, plants and equipment, and non-operating assets are sold or abandoned, the cost and accumulated depreciation are removed from the respective accounts and the related gain or loss on the disposal of property, plants and equipment is recorded as ”other non-interest income or loss ”.
16) Other Assets
Other assets are mainly comprised of non-operating assets, foreclosed assets, refundable deposits, operating guarantee deposits and settlement clearing funds, restricted assets, prepayments, temporary payment and suspense accounts, other assets to be adjusted, and so on.
Foreclosed assets are recorded at acquisition costs and are revalued at the lower of carrying amounts or recoverable amounts as of the balance sheet date. If the foreclosed assets are impaired, an impairment loss is recognized in the current period. In the subsequent period, if the recoverable amount increases, the previously recognized impairment loss is reversed to the extent that the carrying amounts, after the reversal, shall not exceed the carrying amounts that would have been determined had no impairment loss been recognized for the assets in the prior years.
17) Intangible assets
Intangible assets, mainly comprising of computer software costs, are initially recorded at cost and are amortized over 3 to 5 years under the straight-line method.
18) Reserve for guarantees
Reserves for guarantees of FCB are determined based on the estimated losses arising from default possibility of the ending balances of guarantees receivable, bills accepted receivable, and letters of credit receivable, net of the margin deposits received from customers.

23
19) Reserve for default
As required by Article 12 of the “Rules Governing Securities Firms”, a securities firm should allocate 0.0028% of the amounts of monthly securities consignment trading as the reserves for losses from default, and such reserves are recorded as other liabilities. The reserves should only be used for recovering the losses caused by default on such consignment trading or for other purposes as approved by the SFB. When the accumulated reserve balances reach $200,000, no further reserve provision is required.
20) Reserve for securities trading losses
As required by the “Rules Governing Securities Firms”, a securities firm should set aside 10% of the excess of monthly gains over losses from “trading securities – proprietary trading” and “ issuance of call (put) warrants” as the reserves for securities trading losses while engaging in proprietary trading business. Such reserves can only be used to offset losses over gains arising from the aforesaid securities trading. The reserves must be provided until the accumulated reserve balances reach $200,000.
Futures commission merchants should set aside 10% of monthly net realized gains from trading securities as the reserves for securities trading losses while engaging in proprietary trading business. The reserves must be provided until the accumulated reserve reaches the portion of the regulated minimum issued capital stock, working capital or operating capital. Such reserves can only be used to offset losses over gains arising from the aforesaid securities trading.
21) Retirement plan and pension cost
A. In compliance with the Statement of Financial Accounting Standards No.18, “Accounting for Pensions”, if the retirement plan is a defined benefit pension plan, the First Group recognizes the difference as the minimum pension liability when the accumulated benefit obligation exceeds the fair value of plan assets. For interim financial statements, minimum pension liability is adjusted for the difference between net periodic pension costs and appropriated funds. The net periodic pension costs, which include the service cost, interest cost, expected return on plan assets, amortization of unrecognized net transition asset or obligation, amortization of pension gains or losses, and amortization of prior period service cost, are recognized based on the actuarial report.
A) The Company has a defined benefit plans in accordance with the Labor Standards Law of the R.O.C. From September 2005, monthly contributions made to the pension fund that is deposited in the designated pension account at the Central Trust of China have been reduced from 10% to 6% of the total monthly salaries and wages.

24
B) NITC contributes to the pension fund based on 2% of monthly salaries in accordance with the approval of Bei Shih Lao (2) NO. 09432136500 of the Department Of Labor, Taipei City Government (8% prior to May 2001 and 6% from May 2001 to April 2005). Such pension funds are administered by the Supervisory Committee of the Labor Retirement Fund of NITC and are deposited in the designated pension account at the Central Trust of China under the name of the Supervisory Committee.
B. If the retirement plan is a defined contribution pension plan, the contributions are based on an accrual basis and are recognized as pension costs in the current period. Effective from July 1, 2005, the contributions made pursuant to the Labor Pension Act are under the defined contribution pension plan. Such contributions are made monthly based on not less than 6% of the employee's salaries and are deposited in the labors’ individual pension fund accounts at the Bureau of Labor Insurance.
22) Foreign currency transactions and translations of foreign currency financial statements
The First Group’s foreign currency transactions are recorded in New Taiwan dollars at the spot rates of the transaction dates. Differences between actual payments or receipts and recorded transaction amounts are recognized as foreign exchange gains or losses in the current period. The revaluation of the foreign currency assets and liabilities at the balance sheet date is as follow:
A. Except that a cash flow hedge or a hedge of a net investment in a foreign operation is accounted for under the hedge accounting, monetary assets and liabilities denominated in foreign currencies are revalued using the spot foreign exchange rates at the balance sheet date, and the resulting foreign exchange gain or loss on the revaluation should be included in current income.
B. Non-monetary assets and non-monetary liabilities denominated in foreign currencies that are financial assets or financial liabilities at fair value through profit or loss are revalued using the spot foreign exchange rates at the balance sheet date, and the related foreign exchange gains or losses are recorded as gains or losses in the current period. Those that are available-for-sale financial assets are revalued using the spot foreign exchange rates at the balance sheet date, and the related foreign exchange gains or losses are recorded in the stockholders’ equity. Those that are financial assets or financial liabilities carried at cost are stated using the historical foreign exchange rates of the transaction dates.
C. For equity investments accounted for under the equity method whose functional currency is foreign currency, the translation differences arising from the foreign currency financial statements translated into domestic currency financial statements are recognized proportionally as the

25
cumulative translation adjustment in the stockholders’ equity based on the percentage of the investees’ ownership held by the First Group.
D. When the financial statements of a foreign operation are translated into domestic currency financial statements, all asset and liability accounts are translated using the spot foreign exchange rate at the balance sheet date, and the shareholders’ equity accounts are translated at the historical foreign exchange rate except that the beginning retained earnings are stated at the translated carrying amount of the ending retained earnings in the prior year and except that the profit and loss accounts are translated at the average foreign exchange rate in the reporting period. The final translation differences are recorded as the cumulative translation adjustment in the stockholders’ equity.
23) Revenue and expense recognition
A. Revenues are recognized in accordance with the provisions of Statement of Financial Accounting Standards No. 32 “Accounting for Revenue Recognition” and the following statements.
B. Interest income on loans of FCB is recognized on an accrual basis. However, interest income arising from loans which meet any of the following criteria is recognized on cash basis when the proceeds are received:
A) Reclassified as non- accrual loans.
B) Interest from restructured loans that are agreed to extend their maturities are not recognized as interest income but recorded on the memo accounts.
Handling fee is recognized when cash is received, or the earning process is substantially completed.
C. Under respective securities investment trust contracts, NITC earns annual management fees ranging from 0.20% to 2.00% of the average daily net asset value of each of the managed mutual funds. It also earns sale service fees according to various percentages of the transaction value of the beneficiary certificates issued and reissued by the managed mutual funds.
D. Revenue and expense recognition principles of FTSI, FTSL, FWSL, and FFI are as follows:
A) Brokerage commissions, gains (losses) on sale of securities, and related handling fee expenses are recognized on the transaction date.
B) Interest income and interest expenses resulting from margin loan business, stock loan business, and bills and bonds under repurchase or resale agreements are recognized on an accrual basis during the transaction periods.
26
C) Underwriting commission income or expenses: subscription handling fees are recognized when the amounts are received; underwriting commission income and related commission expenses are recognized at the completion of such underwriting contracts.
D) Service fee income from providing registration and transfer agency service for securities are recognized monthly according to the contracts.
E) Futures commission income: futures commission income resulted from engaging in futures introducing broker business and received from the futures commission merchants is recognized on the accrual basis during the transaction periods.
F) Futures contract income: futures margin deposits are recorded at cost originally. The gains or losses of futures contracts resulting from the daily market-to-market adjustment and the opposite transactions to close out or the settlement at maturity are recognized as gains or losses in the current period. Handling fees are recognized as expenses on futures transaction dates.
E. Service revenue of FTCMI is recognized when the earnings process is substantially completed and when the income is realized or realizable. Related expenses are recognized as current expenses when incurred.
24) Income taxes
A. According to the Statement of Financial Accounting Standards No. 22 “Accounting for Income Taxes” of the R.O.C., the Company is required to apply the inter-period and intra-period income tax allocations. Under the inter-period income tax allocation, the income tax effects of deductible temporary differences, loss carry forwards, and income tax credits are recognized as deferred income tax assets, and the income tax effects of taxable temporary differences are recorded as deferred income tax liabilities. Valuation allowance is provided against deferred income tax assets if it is more likely than not that the deferred income tax assets will not be realized. Deferred income tax assets or liabilities are classified as current items or non-current items according to the related asset and liability classifications or the expected realization period of temporary differences. The adjustment for over-provision or under-provision of previous years’ income taxes is included in the current year’s income taxes. Under the intra-period income tax allocation, the income tax expenses (benefits) should be allocated to continuing operations, discontinued operations, extraordinary gains or losses, cumulative effect of a change in accounting principle, and prior period adjustments of retained earnings.

27
B. In accordance with the Statements of Financial Accounting Standards No. 12, “Accounting for Income Tax Credits”, income tax credits resulting from purchases of equipment, research and development expenditures, employee trainings, and investments in equity stocks are recognized as incurred.
C. Pursuant to the Explanatory Letter Tai-Tsai-Shui No.0910458039 of the MOF dated February 12, 2003 to promulgate the “Criteria for Profit-seeking Enterprises in Filing Consolidated Profit-seeking Enterprise Income Tax Returns According to Article 49 of the Financial Holding Company Act and Article 40 of the Business Mergers and Acquisitions Law”, if a financial holding company holds at least 90% of the issued capital stock of its domestic subsidiaries for twelve months in a fiscal taxable year, starting from such a fiscal taxable year, the financial holding company may elect to have itself as the taxpayer to file the consolidated profit-seeking enterprise income tax returns and to file the profit-seeking enterprise income tax returns of the 10% surtax on undistributed earnings, whereas other tax affairs should be handled separately by the financial holding company and its domestic subsidiaries. The 10% surtax on undistributed current earnings calculated pursuant to the Income Tax Law of the R.O.C is recorded as income tax expenses in the resolution year when the earnings distribution is approved by the Shareholders’ Meeting.
D. Effective on January 1, 2006, in accordance with the Alternative Minimum Tax Act, the Company should calculate the alternative minimum tax in addition to the regular income tax. If the regular income tax is lower than the alternative minimum tax, the differences should be accrued as an income tax adjustment.
E. The accounting treatment for the Company and its subsidiaries to adopt the consolidated income tax return system to file the consolidated income tax returns is in compliance with the Explanatory Note (92) No. 240 of the Accounting Research and Development Foundation of the R.O.C. dated October 3, 2003. The Company and its subsidiaries should separately apply the Statement of Financial Accounting Standards No. 22, “Accounting for Income Taxes” to cope with the income taxes according to their respective income tax returns. However, settlements received or paid within the affiliated group arising from filing consolidated income tax returns have to adjust the deferred income tax assets / liabilities or income taxes payable / refundable in the current period based on a reasonable, consistent, and systematic method. Besides, while estimating the provision for income taxes in the financial statements, the Company should record such settlements receivable from subsidiaries or settlements payable to subsidiaries as “other receivable from / other payable to subsidiaries for consolidated income tax return system”.
28
25) Financial asset securitization transaction
According to the “Financial Asset Securitization Act” and the “Trust Law”, FCB entrusted the rights of personal residential mortgage loans and related rights and obligations to Deutsche Bank AG, Taipei Branch (the Trustee) under special purpose trust. The Trustee raised funds for FCB by issuing beneficiary securities. Because FCB lost control of transferred assets under the framework of securitization transaction, FCB derecognized the assets from loans and recognized servicing assets, recourse liabilities, and the gain on securitization. The portion of subordinated beneficiary securities held by FCB for credit enhancement was recorded as held-to-maturity financial assets.
There is no market price for the retained interests of the subordinated beneficiary securities, so FCB estimates the fair value based on the expected prepayment rate, expected weighted average useful lives, expected credit loss rate, and discount rate of residual cash flows.
Interest income is recognized with respect to the subordinated beneficiary securities when the Trustee pays the interest.
Servicing assets are recorded as other assets and are amortized under straight-line method over the period of service lives.
26) Impairment of assets
An impairment loss shall be recognized when circumstances that have changed or events that have occurred indicate that an asset’s recoverable amount is less than its carrying amount. The recoverable amount of an asset is the higher of its fair value less costs to sell and its value in use. The fair value less costs to sell is the amount obtainable from the sale of an asset in an arm’s length transaction between knowledgeable, willing parties, less the costs of disposal. The value in use is the present value of the future cash flows expected to be derived from an asset.
If there is an indication that an impairment loss recognized in the prior periods for an asset other than goodwill may no longer exist or may have decreased, the impairment loss recognized could be reversed, and such a reversal shall not exceed the impairment loss recognized in the prior periods. Besides, the impairment loss recognized for goodwill in a previous period shall not be reversed in the subsequent periods.
27) Use of estimates
In preparing the consolidated financial statements in conformity with generally accepted accounting principles in the R.O.C., the management is required to make estimates and assumptions that affect the reported amounts of assets and liabilities and disclosures of contingent assets and liabilities as of the date of the consolidated financial statements, and the reported amounts of

29
revenues, costs of revenues, and expenses during the reporting period. Therefore, actual results could differ from those estimates.
28) Contingency loss
If the development of events is probably confirmed that assets have been impaired or liabilities have been incurred as of the balance sheet date and the loss amount could be reasonably estimated, the amount shall be recognized as loss for the current year. If the development of events is probably confirmed that assets have been impaired or liabilities have been incurred as of the balance sheet date but the loss amount could not be reasonably estimated, it shall be disclosed in the consolidated financial statements.
3. Changes in accounting principles
1) Financial instruments
A. As of January 1, 2006, the Company and its subsidiaries adopted the Statements of Financial Accounting Standards No.34 and No.36 to account for the financial instruments.
B. The change in the accounting principle for such financial instruments credited other adjustments to stockholders’ equity for $4,852,579, and the effects on the consolidated net income for the three months then ended March 31, 2006 were as follows:
Amount
Earnings per share (NTD)
Income before income tax ( $ 31,712 ) ( $ 0.005 )Cumulative effect of a change in
accounting principle (Net of income tax expense of $367) 647,608 0.108
Net income $ 615,896 $ 0.103
4. Summary of significant accounts
1) Cash and cash equivalents
March 31, 2007 2006 Cash on hand $ 9,901,756 $ 9,118,677 Checks for clearance 24,027,722 9,819,220 Short-term bills 414,097 475,529 Due from other banks 4,130,955 4,677,849 Total $ 38,474,530 $ 24,091,275

30
2) Due from Central Bank and call loans to other banks
March 31, 2007 2007 Reserve for deposits - account A $ 12,998,187 $ 4,387,702 Reserve for deposits - account B 31,448,439 29,267,713 Central Bank deposits 2,100,000 - Inter-bank clearing fund 1,820,771 1,819,143 Reserve for deposits - foreign currency 122,014 72,683 Deposits of overseas branches with
foreign Central Banks 819,303 606,356 Deposits of national treasury account 869,274 859,116 Call loans and overdrafts to other banks 97,645,274 97,763,276 Total $ 147,823,262 $ 134,775,989
The FCB’s reserve for deposits is required by the Banking Law to maintain the reserve requirements based on the monthly average balance of each kind of deposits and the reserve ratio set by the Central Bank of China and to deposit in the reserve deposit account at the Central Bank of China. According to the regulations, such reserve requirements for reserve for deposits - account B can not be withdrawn except for monthly adjustments of the reserve for deposits.
3) Financial assets at fair value through profit or loss-net
March 31, 2007 2006 Financial assets for trading purpose Stocks $ 3,576,263 $ 1,989,232 Bonds (government bonds, financial
bonds, and corporate bonds) 11,720,719 1,767,341 Beneficiary certificates 275,013 940,000 Other marketable securities 1,175,609 468,584
Derivative financial instruments 3,118,978 1,901,925Valuation adjustment for financial
assets for trading purpose - non-derivative instruments 582,428 65,031
Subtotal 20,449,010 7,132,113Financial assets designated as at fair
value through profit or loss 28,079,790 36,514,731Valuation adjustment for designated
financial assets as at fair value through profit or loss 907,406 1,053,446
Subtotal 28,987,196 37,568,177Total $ 49,436,206 $ 44,700,290

31
A. For the three months ended March 31, 2007 and 2006, the net gains on financial assets for trading purpose and the net realized and unrealized gains (including interest income) on designated financial assets as at fair value through profit or loss amounted to $3,004,167 and $2,448,118, respectively.
B. Financial instruments designated at fair value through profit or loss are to eliminate or significantly reduce a measurement or recognition inconsistency and to evaluate the performance of assets on a fair value basis.
C. As of March 31, 2007 and 2006, the above financial assets for trading purposes undertaken for repurchase agreements were $2,996,770 and $950,596, respectively.
D. Please refer to Note 6 for details of the above financial assets at fair value through profit or loss pledged as collateral as of March 31, 2007 and 2006.
E. Types of derivative financial instruments held for trading purpose and related contract information were as follows:
March 31, 2007 March 31, 2006
Financial Instruments Contract amount
(Notional principal) Credit Risk Contract amount
(Notional principal) Credit Risk Trading Purpose:
Foreign exchange contracts
(FX swaps and forwards) $ 84,619,833 $ 568,486 $ 75,268,088 $ 57,972 FX margin trading 4,949,969 247,255 3,580,241 265,947 Non-delivery FX forwards 10,675,384 95,710 630,781 7,929 FX Options written 10,061,186 - 283,087 - Interest rate options written 16,330,750 - 200,000 - Bond options written 3,344,809 - 746,,626 - Interest rate options held 12,550,977 97,278 1,267,055 9,326 Interest rate swaptions held 2,000,000 12,306 1,200,000 200 Bond options held 165,375 79 5,846,316 4,163 Cross currency swap contracts 18,048,963 260,253 9,126,327 162,353 Interest rate swap contracts 263,496,770 1,766,032 140,526,399 1,021,222 Futures margin deposits (Note) - 60,073 - 329,618
Options purchased - futures 4,212 4,354 2,827 1,898 Bond options 300,000 71 2,400,000 2,087 Asset swap options 49,635 7,081 714,120 39,210

32
Note: The credit exposure amounts stated on March 31, 2007 are the excess margin deposits of future trading of the bank business segment. The balance stated on March 31, 2006 is the margin deposits that securities segment engaged in TAIFEX Taiwan stock index futures trading and this margin deposits include the excess margin deposits of the amount of $228,839.
4) Investments in bills and bonds under resale agreements
March 31, 2007 2006 Central government construction bonds $ 3,065,612 $ 1,305,000Financial bonds 440,000 440,000 $ 3,505,612 $ 1,745,000
As of March 31, 2007 and 2006, the Company and its subsidiaries are obliged to subsequently sell the above bonds at purchase price plus a mark-up based on the resale agreements, and such resale amount are $3,518,159 and $1,751,292, respectively. As of March 31, 2007 and 2006, bonds dealing department is obliged to investment in bills and bonds to fulfill resale agreements with the price $1,015,612 and 305,000, respectively.
5) Receivables - net
March 31, 2007 2006 Interest receivable $ 6,101,346 $ 5,288,892Acceptances receivable 7,642,220 5,716,607Margin loans receivable 8,152,414 6,166,175Accounts and notes receivable 2,188,924 1,484,198Accrued income 384,577 144,250Credit card account receivable 3,725,117 4,619,397Income tax refundable 2,740,167 2,004,715Other receivables 1,091,351 680,983 32,026,116 26,105,217Less: allowance for doubtful accounts ( 233,176 ) ( 291,462 )Net amount $ 31,792,940 $ 25,813,755
As of March 31, 2007 and 2006, FCB’s reserves for guarantees, including acceptances receivable and guarantees receivable, were both $450,518, and such reserves were recorded under ” reserves for operation and liabilities.”

33
6) Bills discounted and loans – net
March 31, 2007 2006 Bills discounted $ 5,132,332 $ 5,039,570Overdrafts 856,795 1,343,390Short-term loans 307,998,163 244,476,540Medium-term loans 280,929,320 273,414,825Long-term loans 376,841,712 339,495,331Import-export negotiations 3,556,592 2,762,059Non-accrual loans 16,772,671 15,460,810Sub-total 992,087,585 881,992,525Less: allowance for credit losses ( 8,174,424 ) ( 7,945,959 )Net amount $ 983,913,161 $ 874,046,566
A. Gain from hedge evaluation was $181,432, which was included in the balances of loans as of March 31, 2007. The fair values of fixed-rate loans held by overseas branches may fluctuate with changes in interest rates. FCB assessed that the risk might be significant, so hedged such risk by engaging in interest rate swap contracts.
B. As of March 31, 2007 and 2006, non-accrual loans and other credit extensions where interest accruals had been ceased were $16,643,629 and $15,467,312, respectively. For the three months ended March 31, 2007 and 2006, interests that were not accrued were $133,529 and $157,189, respectively.
C. Proper prosecutions of claims against debtors have been made before any credit extensions and loans were written off for the three months ended March 31, 2007 and 2006.
D. The bank business segment had revalued the allowance for doubtful receivables, loans, bills discounted, and non-accrual loans by considering unrecoverable risks for the specific loans and inherent risks for the overall loan portfolio. Movements in allowance for credit losses of doubtful receivables, loans, bills discounted, and non-accrual loans for the three months ended March 31, 2007 and 2006 were as follows:
34
January 1 to March 31, 2007 Unrecoverable
risks for the specific loans
Inherent risks for the overall
loan portfolio Total Beginning balance $ 4,745,350 $ 3,576,326 $ 8,321,676Provision 1,394,494 - 1,394,494Write-off ( 1,271,222 ) - ( 1,271,222 )Foreign exchange
translation difference and others 778,424 ( 755,598 ) 22,826
Ending balance $ 5,647,046 $ 2,820,728 $ 8,467,774
January 1 to March 31, 2006 Unrecoverable
risks for the specific loans
Inherent risks for the overall
loan portfolio Total Beginning balance $ 3,890,303 $ 4,621,280 $ 8,511,583Provision 1,362,421 - 1,362,421Write-off ( 1,437,350 ) - ( 1,437,350 )Foreign exchange
translation difference and others 179,348 ( 299,752 ) ( 120,404 )
Ending balance $ 3,994,722 $ 4,321,528 $ 8,316,250
7) Available-for-sale financial assets - net
March 31, 2007 2006 Stocks $ 2,874,490 $ 2,754,273Short-term bills 380,389 442,029Bonds (government bonds, financial bonds,
and corporate bonds) 65,841,615 80,024,455Beneficiary securities 288,222 267,000Valuation adjustment for available-for-sale
financial assets 5,797,453 4,843,367Total $ 75,182,169 $ 88,331,124
A. Tang Eng Iron Works Co., Ltd., has becomes an OTC listed company since July 2006; therefore, its stocks are reclassified from financial assets carried at cost to available-for-sale financial assets.
B. Please refer to Note 6 for details of the above available-for-sale financial assets pledged as collateral as of March 31, 2007 and 2006.
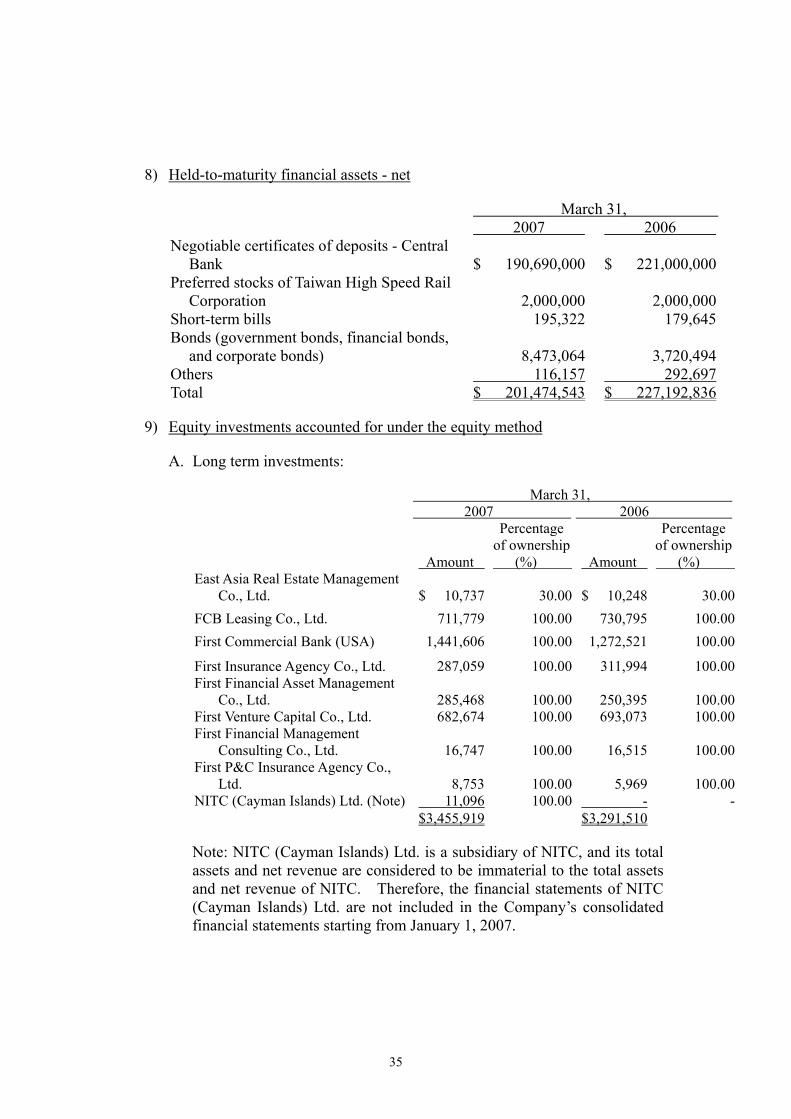
35
8) Held-to-maturity financial assets - net
March 31, 2007 2006 Negotiable certificates of deposits - Central
Bank $ 190,690,000 $ 221,000,000 Preferred stocks of Taiwan High Speed Rail
Corporation 2,000,000 2,000,000 Short-term bills 195,322 179,645 Bonds (government bonds, financial bonds,
and corporate bonds) 8,473,064 3,720,494 Others 116,157 292,697 Total $ 201,474,543 $ 227,192,836
9) Equity investments accounted for under the equity method
A. Long term investments:
March 31, 2007 2006
Amount
Percentage of ownership
(%) Amount
Percentageof ownership (%)
East Asia Real Estate Management Co., Ltd. $ 10,737 30.00 $ 10,248 30.00
FCB Leasing Co., Ltd. 711,779 100.00 730,795 100.00First Commercial Bank (USA) 1,441,606 100.00 1,272,521 100.00
First Insurance Agency Co., Ltd. 287,059 100.00 311,994 100.00First Financial Asset Management
Co., Ltd. 285,468 100.00 250,395 100.00First Venture Capital Co., Ltd. 682,674 100.00 693,073 100.00First Financial Management
Consulting Co., Ltd. 16,747 100.00 16,515 100.00First P&C Insurance Agency Co.,
Ltd. 8,753 100.00 5,969 100.00NITC (Cayman Islands) Ltd. (Note) 11,096 100.00 - - $ 3,455,919 $ 3,291,510
Note: NITC (Cayman Islands) Ltd. is a subsidiary of NITC, and its total assets and net revenue are considered to be immaterial to the total assets and net revenue of NITC. Therefore, the financial statements of NITC (Cayman Islands) Ltd. are not included in the Company’s consolidated financial statements starting from January 1, 2007.
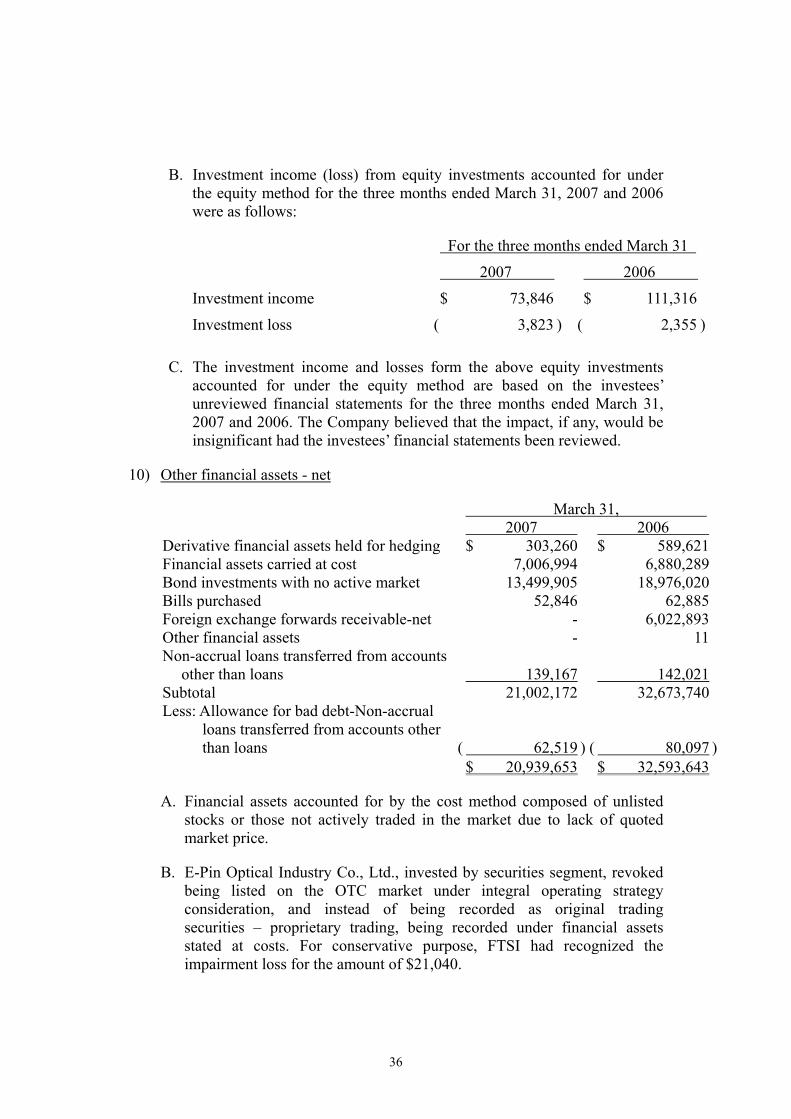
36
B. Investment income (loss) from equity investments accounted for under the equity method for the three months ended March 31, 2007 and 2006 were as follows:
For the three months ended March 31
2007 2006
Investment income $ 73,846 $ 111,316
Investment loss ( 3,823 ) ( 2,355 )
C. The investment income and losses form the above equity investments accounted for under the equity method are based on the investees’ unreviewed financial statements for the three months ended March 31, 2007 and 2006. The Company believed that the impact, if any, would be insignificant had the investees’ financial statements been reviewed.
10) Other financial assets - net
March 31, 2007 2006 Derivative financial assets held for hedging $ 303,260 $ 589,621Financial assets carried at cost 7,006,994 6,880,289Bond investments with no active market 13,499,905 18,976,020Bills purchased 52,846 62,885Foreign exchange forwards receivable-net - 6,022,893Other financial assets - 11Non-accrual loans transferred from accounts
other than loans 139,167 142,021Subtotal 21,002,172 32,673,740Less: Allowance for bad debt-Non-accrual
loans transferred from accounts other than loans
( 62,519 )
( 80,097 )
$ 20,939,653 $ 32,593,643
A. Financial assets accounted for by the cost method composed of unlisted stocks or those not actively traded in the market due to lack of quoted market price.
B. E-Pin Optical Industry Co., Ltd., invested by securities segment, revoked being listed on the OTC market under integral operating strategy consideration, and instead of being recorded as original trading securities – proprietary trading, being recorded under financial assets stated at costs. For conservative purpose, FTSI had recognized the impairment loss for the amount of $21,040.

37
C. Nature of derivative financial assets held for hedging and related contract information were as follows:
March 31, 2007 March 31,2006
Financial instruments Contract amount (Notional principal) Credit risk
Contract amount (Notional principal) Credit risk
Non-trading purpose Interest rate swap contracts $ 8,329,302 $ 303,260 $ 8,595,401 $ 589,621
D. Please refer to Note 10 1) H. for details of relevant hedge information
11) Properties, plants and equipments - net
March 31, 2007
Cost
Appraisal
Increments
Accumulated
Depreciation Book Value
Land and improvements $ 7,510,292 $ 9,364,135 ($ 2,131) $ 16,872,296
Buildings 8,509,375 56,884 ( 3,207,973) 5,358,286
Machinery and equipment 3,501,723 - ( 2,638,852) 862,871
Transportation equipment 930,311 - ( 566,052) 364,259
Other equipment 1,866,106 - ( 1,522,078) 344,028
Leasehold improvements 816,366 - ( 622,347) 194,019
Construction in process and prepayments for equipment 83,275 - - 83,275
$ 23,217,448 $ 9,421,019 ( $ 8,559,433) $ 24,079,034
March 31, 2006
Cost
Appraisal
Increments
Accumulated
Depreciation Book Value
Land and improvements $ 7,537,395 $ 9,368,263 ($ 1,722) $ 16,903,936
Buildings 8,370,033 56,891 ( 2,909,706) 5,517,218
Machinery and equipment 3,656,490 - ( 2,566,227) 1,090,263
Transportation equipment 885,445 - ( 508,422) 377,023
Other equipment 1,852,876 - ( 1,418,432) 434,444
Leasehold improvements 778,647 - ( 576,048) 202,599
Construction in process and prepayments for equipment 159,030 - - 159,030
$ 23,239,916 $ 9,425,154 ($ 7,980,557) $ 24,684,513

38
A. FCB revalued its assets in accordance with the relevant regulations. As of March 31, 2007 and 2006, the balances of the revaluation increments (including those for non-operating assets) amounted to $15,730,609 and $15,752,672, respectively, and the relevant reserves for land appraisal increment taxes recorded as other liabilities, were $5,607,323 and $5,615,834, respectively. The difference was recorded under the Company’s other stockholders’ equity.
B. There was no interest capitalized on properties, plants and equipment purchased for the three months ended March 31, 2007 and 2006.
C. Please refer to Note 6 for details of the property, plants and equipment pledged as collateral as of March 31, 2007 and 2006.
12) Other assets
March 31, 2007 2006 Non-operating assets
Cost Land $ 589,001 $ 562,103 Buildings 1,418,523 1,402,779 Others 295,984 295,831 Sub-total 2,303,508 2,260,713
Revaluation increments 6,309,591 6,327,518Total cost and revaluation increments 8,613,099 8,588,231
Less: accumulated depreciation ( 446,046 ) ( 406,823 )Less: accumulated impairment losses ( 25,000 ) ( 25,000 )
Net non-operating assets 8,142,053 8,156,408Other assets
Foreclosed assets Cost 202,777 381,133 Less: Accumulated impairment losses ( 118,742 ) ( 267,817 ) Net foreclosed assets 84,035 113,316
Refundable deposits 483,618 586,481Restricted assets 121,400 681,000Operating guarantee deposits and
settlement clearing funds 828,767 817,716Debit items for securities consignment
trading 94,219 -Customer margin deposit accounts 880,603 891,350Prepaid income tax 616,060 883,668Prepayments 883,986 969,436Others 63,892 669,700Other net assets 3,972,545 5,499,351
Total $ 12,198,633 $ 13,769,075
A. Please refer to Note 6 for details of other assets pledged as collateral as of March 31, 2007 and 2006.
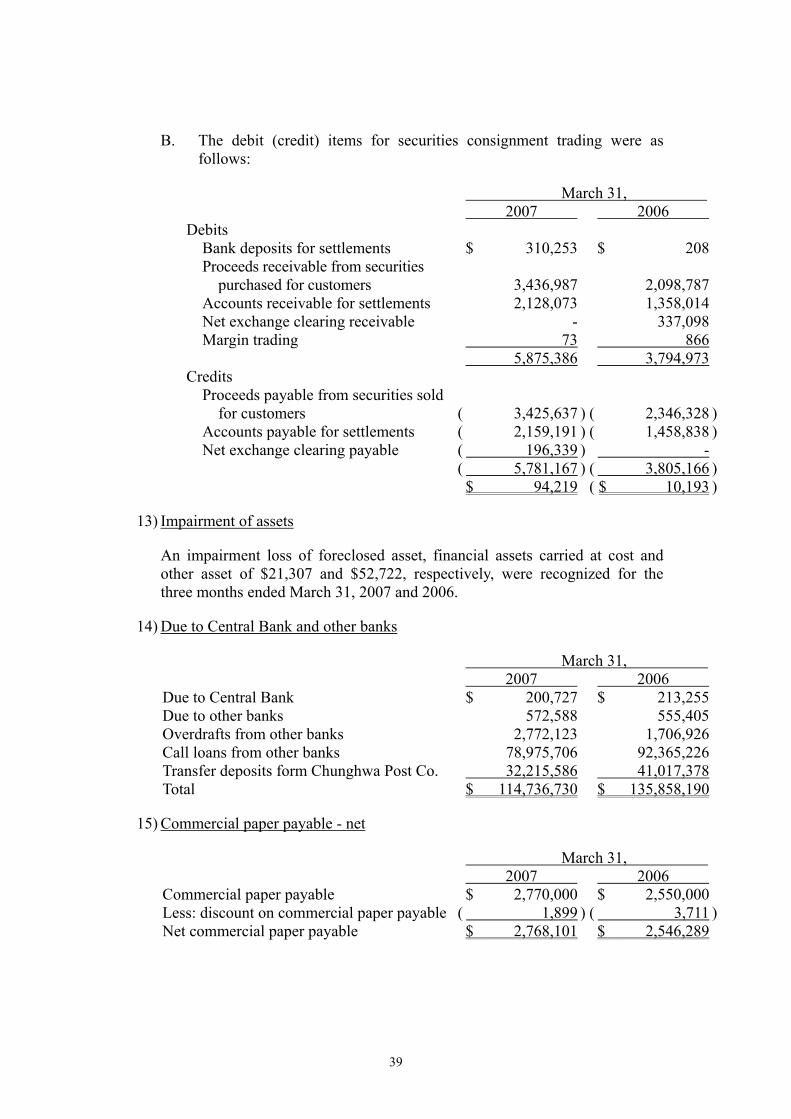
39
B. The debit (credit) items for securities consignment trading were as follows:
March 31, 2007 2006 Debits Bank deposits for settlements $ 310,253 $ 208 Proceeds receivable from securities
purchased for customers 3,436,987 2,098,787 Accounts receivable for settlements 2,128,073 1,358,014 Net exchange clearing receivable - 337,098 Margin trading 73 866 5,875,386 3,794,973Credits Proceeds payable from securities sold
for customers ( 3,425,637 ) ( 2,346,328 ) Accounts payable for settlements ( 2,159,191 ) ( 1,458,838 ) Net exchange clearing payable ( 196,339 ) - ( 5,781,167 ) ( 3,805,166 ) $ 94,219 ( $ 10,193 )
13) Impairment of assets
An impairment loss of foreclosed asset, financial assets carried at cost and other asset of $21,307 and $52,722, respectively, were recognized for the three months ended March 31, 2007 and 2006.
14) Due to Central Bank and other banks
March 31, 2007 2006 Due to Central Bank $ 200,727 $ 213,255Due to other banks 572,588 555,405Overdrafts from other banks 2,772,123 1,706,926Call loans from other banks 78,975,706 92,365,226Transfer deposits form Chunghwa Post Co. 32,215,586 41,017,378Total $ 114,736,730 $ 135,858,190
15) Commercial paper payable - net
March 31, 2007 2006 Commercial paper payable $ 2,770,000 $ 2,550,000Less: discount on commercial paper payable ( 1,899 ) ( 3,711 )Net commercial paper payable $ 2,768,101 $ 2,546,289
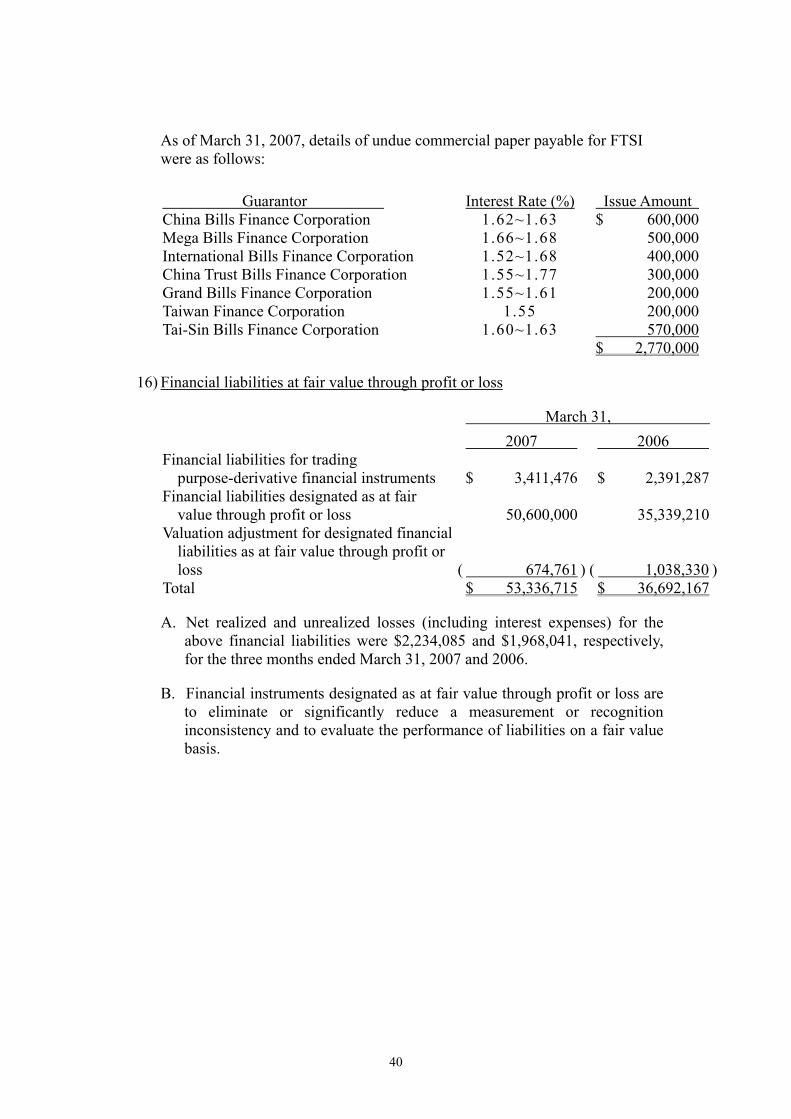
40
As of March 31, 2007, details of undue commercial paper payable for FTSI were as follows:
16) Financial liabilities at fair value through profit or loss
March 31, 2007 2006 Financial liabilities for trading
purpose-derivative financial instruments $ 3,411,476 $ 2,391,287Financial liabilities designated as at fair
value through profit or loss 50,600,000 35,339,210Valuation adjustment for designated financial
liabilities as at fair value through profit or loss ( 674,761 ) ( 1,038,330 )
Total $ 53,336,715 $ 36,692,167
A. Net realized and unrealized losses (including interest expenses) for the above financial liabilities were $2,234,085 and $1,968,041, respectively, for the three months ended March 31, 2007 and 2006.
B. Financial instruments designated as at fair value through profit or loss are to eliminate or significantly reduce a measurement or recognition inconsistency and to evaluate the performance of liabilities on a fair value basis.
Guarantor Interest Rate (%) Issue Amount China Bills Finance Corporation 1.62~1.63 $ 600,000 Mega Bills Finance Corporation 1.66~1.68 500,000 International Bills Finance Corporation 1.52~1.68 400,000 China Trust Bills Finance Corporation 1.55~1.77 300,000 Grand Bills Finance Corporation 1.55~1.61 200,000 Taiwan Finance Corporation 1.55 200,000 Tai-Sin Bills Finance Corporation 1.60~1.63 570,000 $ 2,770,000
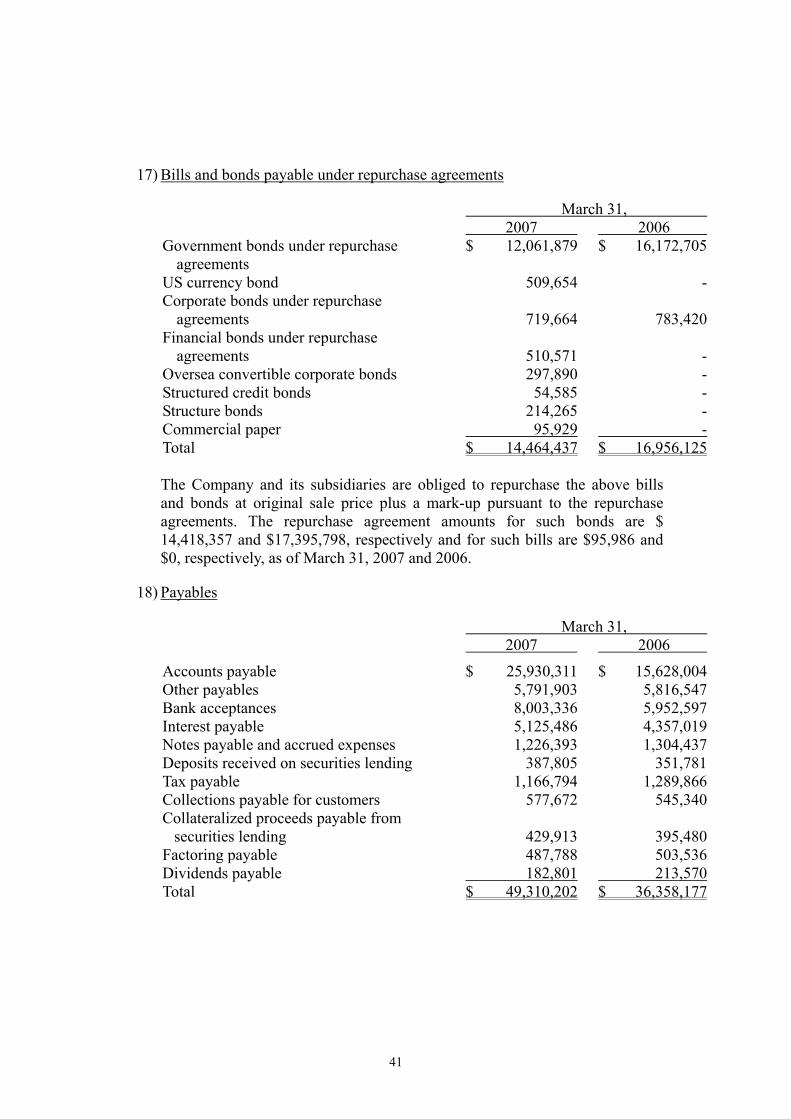
41
17) Bills and bonds payable under repurchase agreements
March 31, 2007 2006 Government bonds under repurchase
agreements $ 12,061,879 $ 16,172,705
US currency bond 509,654 - Corporate bonds under repurchase
agreements 719,664 783,420 Financial bonds under repurchase
agreements 510,571 - Oversea convertible corporate bonds 297,890 - Structured credit bonds 54,585 - Structure bonds 214,265 - Commercial paper 95,929 - Total $ 14,464,437 $ 16,956,125
The Company and its subsidiaries are obliged to repurchase the above bills and bonds at original sale price plus a mark-up pursuant to the repurchase agreements. The repurchase agreement amounts for such bonds are $ 14,418,357 and $17,395,798, respectively and for such bills are $95,986 and $0, respectively, as of March 31, 2007 and 2006.
18) Payables
March 31, 2007 2006
Accounts payable $ 25,930,311 $ 15,628,004 Other payables 5,791,903 5,816,547 Bank acceptances 8,003,336 5,952,597 Interest payable 5,125,486 4,357,019 Notes payable and accrued expenses 1,226,393 1,304,437 Deposits received on securities lending 387,805 351,781 Tax payable 1,166,794 1,289,866 Collections payable for customers 577,672 545,340 Collateralized proceeds payable from
securities lending 429,913 395,480 Factoring payable 487,788 503,536 Dividends payable 182,801 213,570 Total $ 49,310,202 $ 36,358,177

42
19) Deposits and remittances
March 31, 2007 2006 Checking deposits $ 38,447,438 $ 34,277,843Demand deposits 214,088,778 210,496,544Time deposits 279,036,252 224,631,857Negotiable certificates of deposits 8,879,200 10,305,100Savings deposits 680,090,849 647,845,574Outward remittances 51,004 47,871Inward remittances 979,906 1,038,211Total $ 1,221,573,427 $ 1,128,643,000
20) Bonds payable
A. Corporate bonds payable
In order to improve the financial position, strengthen the Company’s capital adequacy ratio, and raise funds to invest related financial institutions, the Company’s Board of Directors resolved to issue unsecured and subordinated corporate bonds of $5,000,000 on March 18, 2004, which had been approved by the MOF. The holders of the subordinated corporate bonds take precedence over shareholders but rank junior to the other creditors in the event of liquidation. The detailed terms of issuance are listed as follows:
First issue, 2004
(Expressed in New Taiwan dollars )
Issue date June 23, 2004
Issue amount NT $5 billion dollars
Issue price At par
Coupon rate Floating rates; and the minimum yield rate is 0%. Interest rate indexes are USD 6M LIBOR or 90-day commercial paper rates.
Interest and repayment terms
Interest is paid quarterly or semi-annually. The principal is paid pursuant to face value at maturity.
Maturity period 7 years
As of March 31, 2007 and 2006, interest rates of the above corporate bond are 3.80% ~ 5.37% and 3.80% ~ 4.68%, respectively.

43
B. Financial bonds payable
On June 22, 2001, October 3, 2002, November 14, 2003, June 24, 2005, and August 18, 2006 the Board of Directors of FCB resolved to issue senior and subordinated financial bonds with the quotas of $50, $30, $20, and $20 billion New Taiwan dollars, respectively, to strengthen FCB's capital adequacy ratio and to finance long-term operating capital. The issuances of the financial bonds had been approved by the MOF. The subordinated financial bonds take precedence over shareholders but rank junior to the other creditors in the event of liquidation. The detailed terms of each issuance are listed as follows:
First issue, 2001
Issue date September 12, 2001
Issue amount NT $10 billion dollars
Issue price At par
Coupon rate 4%
Interest and repayment terms
Interest is paid annually and principal of 20%, 30% and 50% is repaid at the 5th, 6th, and 7th years, respectively.
Maturity period 7 years
First to Fourth issues, 2002
Issue date March 4, July 9, December 10, and December19, 2002
Issue amount NT $20.5 billion dollars
Issue price At par
Coupon rate Part of interest rates is fixed rates (3.2% ~ 3.9%), the rest is either floating rates or inverse floating rates with the minimum yield rate rates of 0%
Interest and repayment terms
For the fixed rates, interest is paid annually. For the floating rates, interest is paid either quarterly or semi-annually. The principal is to be paid pursuant to face value at maturity.
Maturity period 5 years to 5 years and 7 months

44
First to Ninth issues, 2003
Issue date January 20, February 25, May 2, September 10, October 27, and November 13, 2003
Issue amount NT $24.8 billion dollars
Issue price At par
Coupon rate Part of interest rates is fixed rate (2.9% ~ 3.0%), the rest is either at floating rates or inverse floating rates with the minimum yield rates of 0%. Interest rate indexes are USD 6M LIBOR, 90-day commercial paper rates, or IRS rates.
Interest and repayment terms
For the fixed rates, interest is paid annually. For the floating rates, interest is paid either quarterly or semi-annually. The principal is to be paid pursuant to face value at maturity.
Maturity period 4 years to 8 years
First issue, 2004
Issue date May 25, 2004
Issue amount NT $4 billion dollars
Issue price At par
Coupon rate Part of interest rates is fixed rates of 4%, and the rest is floating rates with the minimum yield rates of 0.5%. Interest rate indexes are USD 6M LIBOR.
Interest and repayment terms
Interest is paid semi-annually. The principal is to be paid pursuant to face value at maturity.
Maturity period 7 years
First issue, 2006
Issue date April 24, 2006
Issue amount NT $5 billion dollars
Issue price At par
Coupon rate 2.24%
Interest and repayment terms
Interest is paid annually. The principal is to be paid pursuant to face value at maturity.
Maturity period 7 years

45
Second issue (A~C), 2006
Issue date July 27, 2006
Issue amount NT $3 billion dollars
Issue price At par
Coupon rate 2.45%, 2.55%, 2.75%
Interest and repayment terms
Interest is paid annually. The principal is to be paid pursuant to face value at maturity.
Maturity period 5 years and 6 months to 10 years
Third issue, 2006
Issue date December 4, 2006
Issue amount NT $6 billion dollars
Issue price At par
Coupon rate 2.6%
Interest and repayment terms
Interest is paid annually. The principal is to be paid pursuant to face value at maturity.
Maturity period 10 years
First issue (A&B), 2007
Issue date March 9, 2007
Issue amount NT $5.5 billion dollars
Issue price At par
Coupon rate Interest rate indexes+0.25%, fixed rates+2.4%. Interest rate indexes are NTD 90-day commercial paper in secondary market’s average rates provided by Reuters.
Interest and repayment terms
A: Interest is accrued quarterly and paid annually. Simple interest is adopted. The principal is to be paid pursuant to face value at maturity.
B: Interest is paid annually. Simple interest is adopted. The principal is to be paid pursuant to face value at maturity.
Maturity period 7~10 years

46
As of March 31, 2007 and 2006, interest rates of the above financial bonds ranged from 0% to 5.17% and 0% to 5.42%, respectively.
As of March 31, 2007 and 2006, among the above financial bonds, interest rate risk associating with the senior financial bonds with face value of $21.6 and $22.3 billion New Taiwan dollars, respectively, and the subordinated financial bonds with face value of $29 and $13 billion New Taiwan dollars, respectively, were hedged by interest rate swap contracts. As such interest rate swap contracts were valued at fair value with changes in fair value recognized as a profit or loss, the financial bonds stated above were designated as financial liabilities at fair value through profit or loss in order to eliminate or significantly reduce a measurement or recognition inconsistency.
21) Other borrowings
A. Short-term borrowings
March 31, 2007
Item
Borrower
Amount
Rate
Credit limits
Collateral
(Note1)
Secured borrowings
FTSI $ 370,000 1.87%~1.93% $ 1,700,000 Certificates of deposits(Note2)
Unsecured borrowings FTSI 250,000 1.85%~1.86% 2,500,000 None
$ 620,000
Note1: The book value of collateral is $80,000.
Note2: Lending banks which had long-term borrowing contracts with securities segment provide the letter of guarantee and are liable for the range of total guarantee amounts.
March 31, 2006
Item Borrower Amount Rate Credit limit
Collateral
(Note1)
Secured borrowings
FTSI $ 600,000 1.52%~1.65% $ 2,750,000 Certificates of deposits and real estate
Note: The book value of collateral is $137,369.
47
B. Long term borrowings
March 31, 2007 March 31, 2006
Long-term commercial paper payable $ 2,300,000 $ 1,800,000Less: discount on long-term
commercial paper payable ( 4,800 ) ( 6,814 )
Net amount $ 2,295,200 $ 1,793,186
Interest rate intervals (%) 1.577%~1.638% 1.290%~1.492%
FTSI entered into the “Syndicated Loan Contract” with Mega International Commercial Bank, Mega Bills Finance Corporation, and International Bills Finance Corporation for issuing commercial paper within the credit limit of $7,000,000. The effective period of the contract is from March 2006 to March 2009 (original contract period was from December 2003 to December 2006). Within the effective period of such loans, the average draw rate shall be maintained at above 50% of the credit limit. If the actual drawn amount is less than 50% of the credit limit, FTSI shall pay 0.075% of the difference between 50% of the credit limit and the actual drawn amount as commitment fees. Such fees shall be calculated and received by the agent bank at the end of each quarter, and then be transferred to each lending bank.
22) Accrued pension liabilities
Relevant pension information of the Company and its subsidiaries are as follows:
A. The Company and its subsidiaries have a defined benefit pension plan set up in accordance with the Labor Standards Law of the R.O.C., covering all regular employees for their services prior to the implementation of the Labor Pension Act on July 1, 2005 and those employees who choose continuously to be applicable to the Labor Standards Law for the services after the implementation of the Labor Pension Act. The payment of pension benefits is based on the length of the service period and average monthly compensation in the last six months prior to retirement. Under the defined benefit plan, employees are granted two points for each year of service for the first 15 years and are granted one point for each additional year of service from the 16th year, but it is subject to a maximum of 45 points. The Company and its subsidiaries make contributions monthly based on certain percentage of salaries and such contributions are deposited in the designated pension account at the Central Trust of China under the names of the respective companies’ independent retirement fund committees.
48
First quarter 2007 March 31, 2007
Company name Pension expense
Pension fund deposited in the Central Trust of
China Accrued pension
Liabilities First Financial
Holding Co., Ltd. (FFHC) $ 603 $ 15,042 $ 3,759
First Commercial Bank 166,772 3,496,529 1,427,625First Taisec Securities
Inc.(FTSI) and its subsidiaries 2,035 35,418 53,939
National Investment Trust Co., Ltd. (NITC) 228 38,369 24,965
$ 169,638 $ 3,585,358 $ 1,510,288
First quarter 2007 March 31, 2006
Company name Pension expense
Pension fund deposited in the Central Trust of
China Accrued pension
Liabilities First Financial Holding Co., Ltd. (FFHC) $ 773 $ 12,203 $ 1,683First Commercial Bank 153,742 2,974,135 1,352,405First Taisec Securities Inc.(FTSI) and subsidiaries 2,017 31,355 43,745National Investment Trust Co., Ltd. (NITC) 508 35,975 17,202 $ 157,040 $ 3,053,668 $ 1,415,035
B. Effective from July 1, 2005, the First Group has established a defined contribution plan pursuant to the Labor Pension Act, which covers the employees whose nationalities are the R.O.C. and who choose to or are required to apply the Labor Pension Act. The contributions are made monthly based on not less than 6% of the employee's salaries and are deposited in the labors’ individual pension fund accounts at the Bureau of Labor Insurance. The payment of pension benefits is based on the labors’ individual pension fund accounts and the cumulative profit in such accounts, and the employees can choose to receive such pension benefits monthly or in one time. As of March 31, 2007 and 2006, the pension costs of the First Group under defined contribution plan were $25,687 and
49
$24,170, respectively.
C. NITC has established an employee retirement and resignation plan covering all full-time employees hired prior to May 11, 1996. The employees who have worked for more than five years since May 11, 1996 can apply the plan. Upon retirement or resignation, the payment of pension benefits is based on the length of the service period and average monthly compensation in the last six months prior to retirement or resignation.
23) Other liabilities
March 31, 2007 2006 Accrued liabilities for land tax revaluation
increment $ 5,607,323 $ 5,615,834Guarantee deposit-in and margin deposits 1,243,193 1,275,392Other collections in advance 777,673 681,035Futures traders’ equity 478,325 890,683Credit items for securities consignment
trading (note 4. 12)) - 10,193Others 244,320 465,053Total $ 8,350,834 $ 8,938,190
24) Common stock
The Company’s initial capital stock was $38,216,000 on January 2, 2003 when the Company was officially incorporated. The Company acquired FTSI, MFMI, and NITC as wholly owned subsidiaries through issuing new shares of $7,299,044 to swap the acquirees’ capital stock on July 31, 2003. In accordance with the Explanatory Letter Tai-Tsai-Jen No. 0920123723 of the SFB on July 3, 2003, the Company issued 48,837,080 units of global depository receipts (GDRs), which were equivalent to 976,742 thousand shares of common stock and the GDRs were listed on the Luxembourg Stock Exchange. In addition, the Company issued 23,258 thousand shares subscribed by employees and other designated individuals. On July 31, 2003, the Board of Directors resolved to issue one billion shares of common stock at $17.75 New Taiwan Dollars per share, totaling $17,300,408, for the shares of GDRs and the aforementioned subscriptions on August 1, 2003 as the record date. The Company’s capital stock held by subsidiaries is accounted for as treasury stock, and all treasury stock was reissued or retired in 2003. Total amount of common stock retired was $24,294. As of March 31, 2007 and 2006, the approved and issued capital stock were $100,000,000 and $59,721,919, respectively. Total issued and outstanding shares were both 5,972,192 thousand shares with par value of $10 (in dollars) New Taiwan dollars per share.
50
25) Additional paid-in capital
A. In accordance with Article 47 of the Financial Holding Company Act and the Explanatory Letter Tai-Tsai-Jen (6) No.0910003413 of the SFC in 2002, if a financial institution transforms into a financial holding company, the retained earnings of the financial institution is recorded as capital reserves, namely additional paid-in capital, in the financial holding company’s book after such transformation. Such capital reserves may be distributed by the financial holding company as cash dividends, and the restrictions under Article 241, Paragraph 1 of the Company Law shall not be applicable to such distribution of capital reserves. In addition, such capital reserves may be also converted into capital stock during the current year of transformation, and the ratio of conversion into capital stock is not subject to the restrictions of capitalized ratios prescribed in Article 41, Paragraph 2 of the Securities and Exchange Act and Article 8 of the Securities and Exchange Act Enforcement Rules. According to the Explanatory Letter Tai-Tsai-Jung (1) No.0910016280 of the Bureau of Monetary Affairs in 2002, as the aforementioned capital reserves are not generated from the business operation results of the financial holding company, such capital reserves cannot be used for the distribution of remuneration to Directors and Supervisors or bonuses to employees.
B. The Securities & Exchange Act and the Company Law of the R.O.C. require that capital reserves, namely additional paid-in capital, resulting from price received in excess of par value of the issuance of capital stock and donation income received should be only used to recover losses or to increase the capital stock of a company pursuant to a maximum limit of 10% of the issued capital stock per year while the company has no accumulated deficits. The capital reserves can not be used to recover losses unless the special reserves and legal reserves are insufficient to recover the accumulated deficits.
C. As of March 31, 2007, while the Company was transformed from a financial institution into a financial holding company, the Company recognized less capital reserves, namely additional paid-in capital, as a result of bearing the accumulated deficits of the financial institution before such transformation. On June 20, 2003, the Board of Directors of FCB exercised the authority on behalf of the Stockholders’ Meeting of FCB to resolve to use the legal reserve, special reserve, and capital reserve of $15,268,422, $3,695,364, and $4,075,242, respectively, to recover its accumulated deficits. After the recovering of the FCB’s accumulated deficits, the Company’s additional paid-in capital resulting from the financial institution transforming into the financial holding company, other than those generated from the additional paid-in capital of the original financial institution, was only the FCB’s cumulative translation adjustment of $247,091.

51
26) Legal reserve and special reserve
A. Legal reserve
Accordingly to the Company Law of the R.O.C., legal reserve can be only used to recover accumulated deficits or to increase capital stock and shall not be used for any other purposes. It is permitted that the legal reserve is used to increase capital stock if the balance of the legal reserve has reached fifty percent of the issued capital stock, and then only half of the legal reserve can be capitalized.
B. Special reserve
In compliance with the Explanatory Letter Tai-Tsai-Jen (1) No.100116 of the former SFC in 2000 and the Explanatory Letter Jin-Guan-Jen (1) No. 0950000507 of the FSC dated 27 January, 2006, except for appropriating legal reserve according to the law, if the current year-end contra accounts in the stockholders’ equity, such as unrealized loss on available-for-sale financial assets 、unrealized loss on cash flow 、net loss not recognized as pension cost and cumulative translation adjustment, have negative / debit balances, listed or OTC companies are required to appropriate a special reserve equaling such negative / debit balances before distributing the undistributed earnings. Such appropriation of the special reserve should be subject to the following restriction according to the aforesaid regulations. (a) If the amounts of the contra accounts in the stockholders’ equity result from the current year, the amount of the special reserve to be set aside should not exceed the current net income after income taxes plus the accumulated undistributed earnings of the prior years. (b) If the amounts of the contra accounts in the stockholders’ equity result from the prior years, the amount of the special reserve to be set aside should not exceed the accumulated undistributed earnings of the prior years less those undistributed earnings that have been set aside in the above (a). In the subsequent years, if there is a reversal incurred for the special reserve when the negative / debit balances of the contra accounts in the stockholders’ equity reduced, the portion of the reversal of the special reserve can be used for earnings distribution.
Moreover, in compliance with the Explanatory Letter Tai-Tsai-Jen (1) No.170010 of the SFC in 2002, if the market values of a parent company’s shares held by its subsidiaries fell below the book values at the period-end, the parent company should set aside a special reserve for the differences between the book values and the market values according to the percentage of subsidiaries’ voting stock interests held by the parent company. In the subsequent revaluation, if the market values recover, the parent company can reverse the aforementioned special reserve that equals to the portion of the market value recovery according to the percentage of subsidiaries’ voting stock interests held by the parent company.

52
27) Unappropriated earnings
A. As stipulated in the Company’s Articles of Incorporation, the annual net income after income taxes should be first used to recover accumulated deficits, and the remaining amount should then be set aside as legal reserve and special reserve in accordance with provisions under the applicable laws and regulations. The remaining earnings are then distributed as follows: (1) 0.02% to 0.16% as bonuses to employees (2) not more than 1% as remuneration to Directors and Supervisors, and (3) the remaining earnings plus prior year’s accumulated unappropriated earnings as the distributable amount for stockholder dividends, among which 30% to 100% of the distributable amount is subject to the Board of Directors’ decision to propose a distribution plan and to submit to the Ordinary Stockholders’ Meeting for approval. It may also distribute employee stock bonuses to subsidiaries’ employees if there are employee stock bonuses distributed.
B. In order to ensure that there is adequate working capital available for the expansion of the Company’s operations and so as to increase its profitability, dividends may be distributed in a combination of cash and shares. However, the cash dividends should not be less than 10% of the current year’s distributable amount for stockholder dividends, and the remainder will be the share dividends.
C. If the cash dividend is less than $0.1 New Taiwan dollar per share, it should not be distributed unless it is resolved by the Ordinary Stockholders’ Meeting.
D. The appropriation of 2006 earnings had been resolved by the Board of Directors On April 26, 2007. The appropriation of 2005 earnings had been resolved by the Board of Directors on April 20, 2006 and by the Ordinary Stockholders’ Meeting on June 9, 2006. There is no difference between the Board of Directors and the Ordinary Stockholders’ Meeting with respect to the appropriation of 2006 and 2005 earnings. There is no difference between the Board of directors and Ordinary Stockholders’ Meeting with respect to the appropriation of 2006and 2005. Detail of the appropriation of 2006 and 2005 earnings are summarized as follows:
Earnings distribution Dividend per share (NT dollar) 2006 2005 2006 2005 Legal reserve $ 1,066,156 $ 1,417,539 $ - $ -
Special reserve - - - - Cash dividends on common
stock 5,972,192 7,283,161 1.00 1.25 Stock dividends on common
stock 1,194,438 1,456,632 0.20 0.25 Remuneration of Directors
and Supervisors 96,742 129,491 - - Employee bonuses 4,063 4,532 - -
$ 8,333,591 $ 10,291,355 $ 1.20 $ 1.50

53
E. Information on the appropriation of the Company’s earnings as resolved by the Board of Directors and approved by the shareholders’ meeting will be posted in the “Market Observation Post System” at the website of the Taiwan Stock Exchange.
28) Income Taxes
A. The Company’s operating revenues mainly consisted of long-term investment income recognized under the equity method. There were no income tax payable as the investment income stated above should not be included in the taxable amount under the income tax imputation system according to Article 42 of the Income Tax Law of the R.O.C. Additionally, in order to bring about effects on saving income taxes to reduce the First Group’s tax burdens, the Company and its subsidiaries, FCB, FTSI, MFMI, and NITC have adopted the consolidated income tax return system pursuant to Article 49 of the Financial Holding Company Act and choosed the Company as the taxpayer to file the profit-seeking enterprise income tax return for the fiscal year 2004 and the profit-seeking enterprise income tax return of the 10% surtax on undistributed earnings for the fiscal year 2003 since the fiscal year 2004. In addition, the Company and its subsidiaries, FCB, FTSI, NITC, FFAM, FVC, FFMC, and FPCIA have adopted the consolidated income tax return system and choosed the Company as the taxpayer to file the profit-seeking enterprise income tax return for the fiscal year 2005 (Effective January 1, 2006 , in accordance with the Alternative Minimum Tax Act, the Company should calculate the alternative minimum tax in addition to regular income tax.) and the profit-seeking enterprise income tax return of the 10% surtax on undistributed earnings for the fiscal year 2004 since the fiscal year 2005.
B. The detail of income taxes related information for the Company and its subsidiaries are as follow:
A) Income tax expense
March 31, 2007 2006 Income tax expense $ 43,896 $ 29,616Net changes in deferred income tax
assets 764,978 671,795Income tax levied separately 2,580 3,497Effect of joint filing the consolidated
income tax return system ( 10,590 ) ( 14,041 )Cumulative effect of a change in
accounting principle - ( 367 )Adjustments for foreign income tax ( 9 ) 4,395Income tax expense $ 800,855 $ 694,895
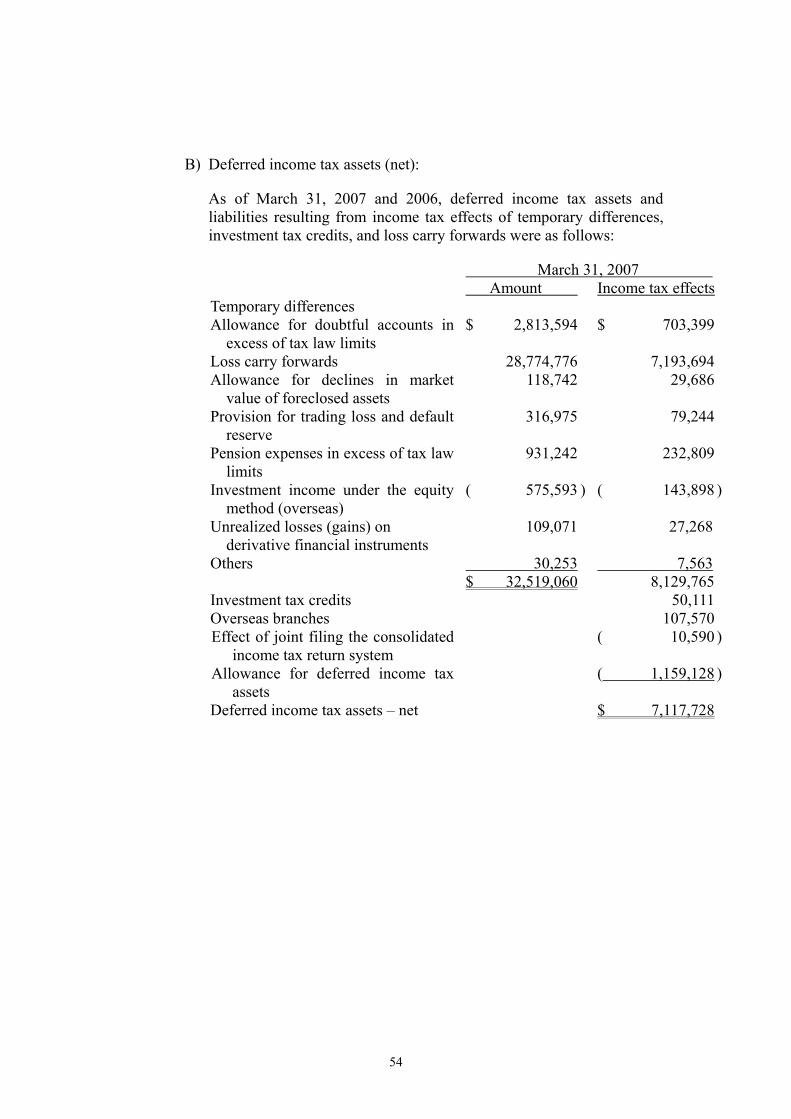
54
B) Deferred income tax assets (net):
As of March 31, 2007 and 2006, deferred income tax assets and liabilities resulting from income tax effects of temporary differences, investment tax credits, and loss carry forwards were as follows:
March 31, 2007 Amount Income tax effectsTemporary differences Allowance for doubtful accounts in
excess of tax law limits $ 2,813,594 $ 703,399
Loss carry forwards 28,774,776 7,193,694Allowance for declines in market
value of foreclosed assets 118,742 29,686
Provision for trading loss and default reserve
316,975 79,244
Pension expenses in excess of tax law limits
931,242 232,809
Investment income under the equity method (overseas)
( 575,593 ) ( 143,898 )
Unrealized losses (gains) on derivative financial instruments
109,071 27,268
Others 30,253 7,563 $ 32,519,060 8,129,765Investment tax credits 50,111Overseas branches 107,570Effect of joint filing the consolidated
income tax return system ( 10,590 )
Allowance for deferred income tax assets
( 1,159,128 )
Deferred income tax assets – net $ 7,117,728

55
March 31, 2006 Amount Income tax effectsTemporary differences Allowance for doubtful accounts in
excess of tax law limits $ 2,813,175 $ 703,294Loss carry forwards 40,369,595 10,092,399Allowance for declines in market
value of foreclosed assets 267,817 66,954Provision for trading loss and default
reserve 277,590 69,398Pension expenses in excess of tax law
limits 786,709 196,677
Accumulated impairment losses of assets 29,012 7,253
Investment income under the equity method ( 435,658 ) ( 108,915 )
Unrealized losses (gains) on derivative financial instruments ( 141,980 ) ( 35,495 )
Others 247,212 61,803 $ 44,213,472 11,053,368Investment tax credits 59,230Overseas branches 146,441Effect of joint filing the consolidated
income tax return system ( 14,041 )Allowance for deferred income tax
assets ( 859,472 )Deferred income tax assets – net $ 10,385,526
C) As of March 31, 2007, details of tax credits were as follows:
Items for tax credits Company name Amount Available period (year)Personnel training costs FCB $ 47,306 2007~2010 Personnel training costs FTSI 2,578 2007~2010 Personnel training costs NITC 226 2007~2010 $ 50,110
D) According to the Income Taxes Law, the losses could be carried forward for 5 years to deduct the future years’ taxable income. As of March 31, 2007, the details of the First Group’s losses available were as follows:
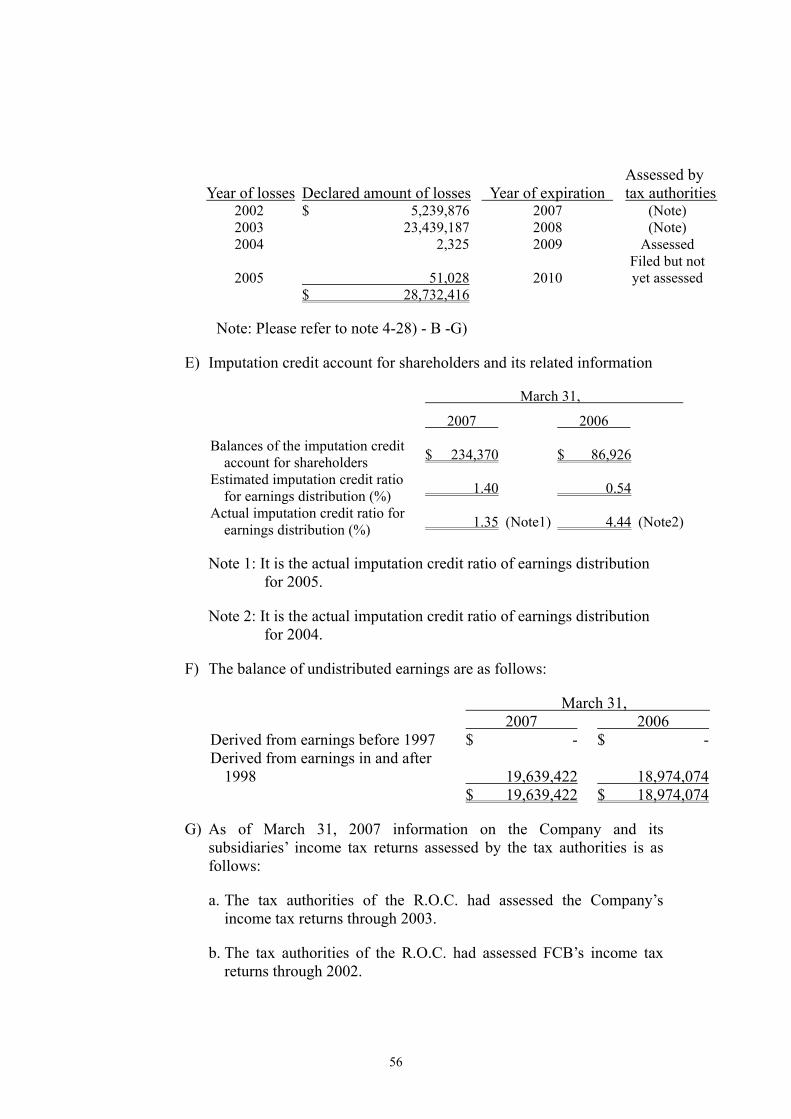
56
Year of losses Declared amount of losses Year of expiration Assessed by tax authorities
2002 $ 5,239,876 2007 (Note) 2003 23,439,187 2008 (Note) 2004 2,325 2009 Assessed
2005 51,028 2010 Filed but not yet assessed
$ 28,732,416
Note: Please refer to note 4-28) - B -G)
E) Imputation credit account for shareholders and its related information
March 31,
2007 2006
Balances of the imputation credit account for shareholders $ 234,370 $ 86,926
Estimated imputation credit ratio for earnings distribution (%) 1.40 0.54
Actual imputation credit ratio for earnings distribution (%) 1.35 (Note1) 4.44 (Note2)
Note 1: It is the actual imputation credit ratio of earnings distribution for 2005.
Note 2: It is the actual imputation credit ratio of earnings distribution for 2004.
F) The balance of undistributed earnings are as follows:
March 31, 2007 2006 Derived from earnings before 1997 $ - $ -Derived from earnings in and after
1998 19,639,422 18,974,074 $ 19,639,422 $ 18,974,074
G) As of March 31, 2007 information on the Company and its subsidiaries’ income tax returns assessed by the tax authorities is as follows:
a. The tax authorities of the R.O.C. had assessed the Company’s income tax returns through 2003.
b. The tax authorities of the R.O.C. had assessed FCB’s income tax returns through 2002.
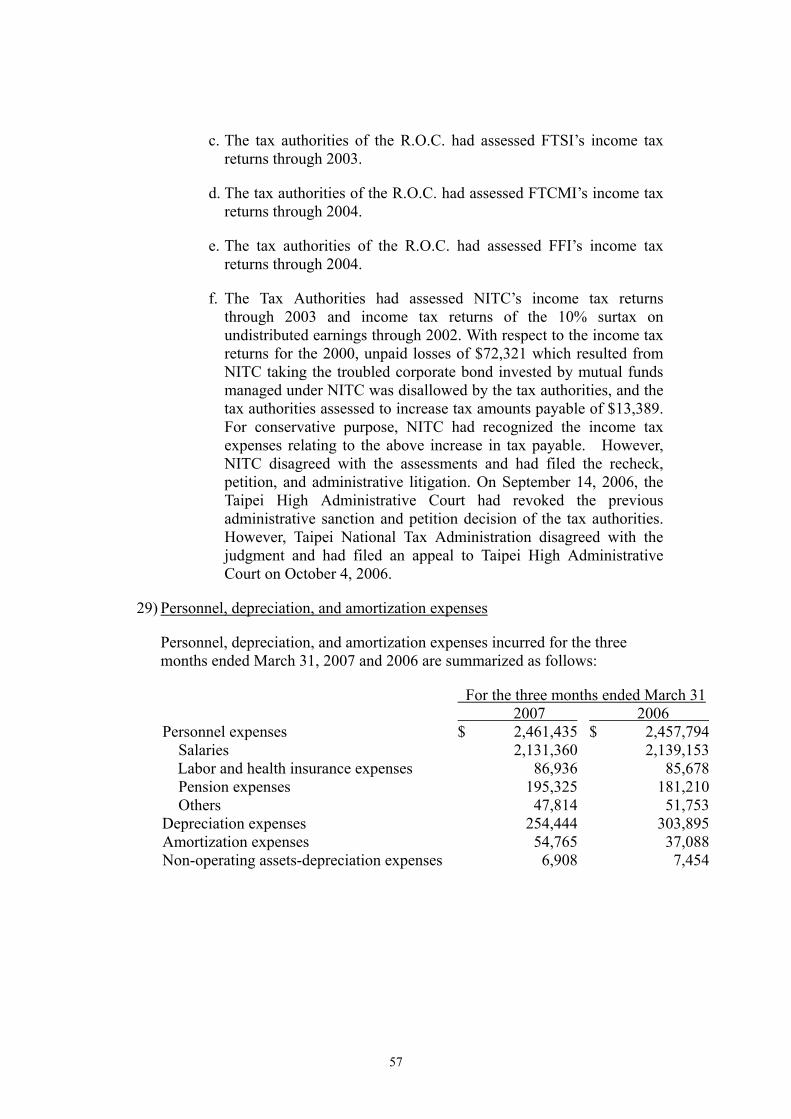
57
c. The tax authorities of the R.O.C. had assessed FTSI’s income tax returns through 2003.
d. The tax authorities of the R.O.C. had assessed FTCMI’s income tax returns through 2004.
e. The tax authorities of the R.O.C. had assessed FFI’s income tax returns through 2004.
f. The Tax Authorities had assessed NITC’s income tax returns through 2003 and income tax returns of the 10% surtax on undistributed earnings through 2002. With respect to the income tax returns for the 2000, unpaid losses of $72,321 which resulted from NITC taking the troubled corporate bond invested by mutual funds managed under NITC was disallowed by the tax authorities, and the tax authorities assessed to increase tax amounts payable of $13,389. For conservative purpose, NITC had recognized the income tax expenses relating to the above increase in tax payable. However, NITC disagreed with the assessments and had filed the recheck, petition, and administrative litigation. On September 14, 2006, the Taipei High Administrative Court had revoked the previous administrative sanction and petition decision of the tax authorities. However, Taipei National Tax Administration disagreed with the judgment and had filed an appeal to Taipei High Administrative Court on October 4, 2006.
29) Personnel, depreciation, and amortization expenses
Personnel, depreciation, and amortization expenses incurred for the three months ended March 31, 2007 and 2006 are summarized as follows:
For the three months ended March 31 2007 2006 Personnel expenses $ 2,461,435 $ 2,457,794
Salaries 2,131,360 2,139,153Labor and health insurance expenses 86,936 85,678Pension expenses 195,325 181,210Others 47,814 51,753
Depreciation expenses 254,444 303,895Amortization expenses 54,765 37,088Non-operating assets-depreciation expenses 6,908 7,454
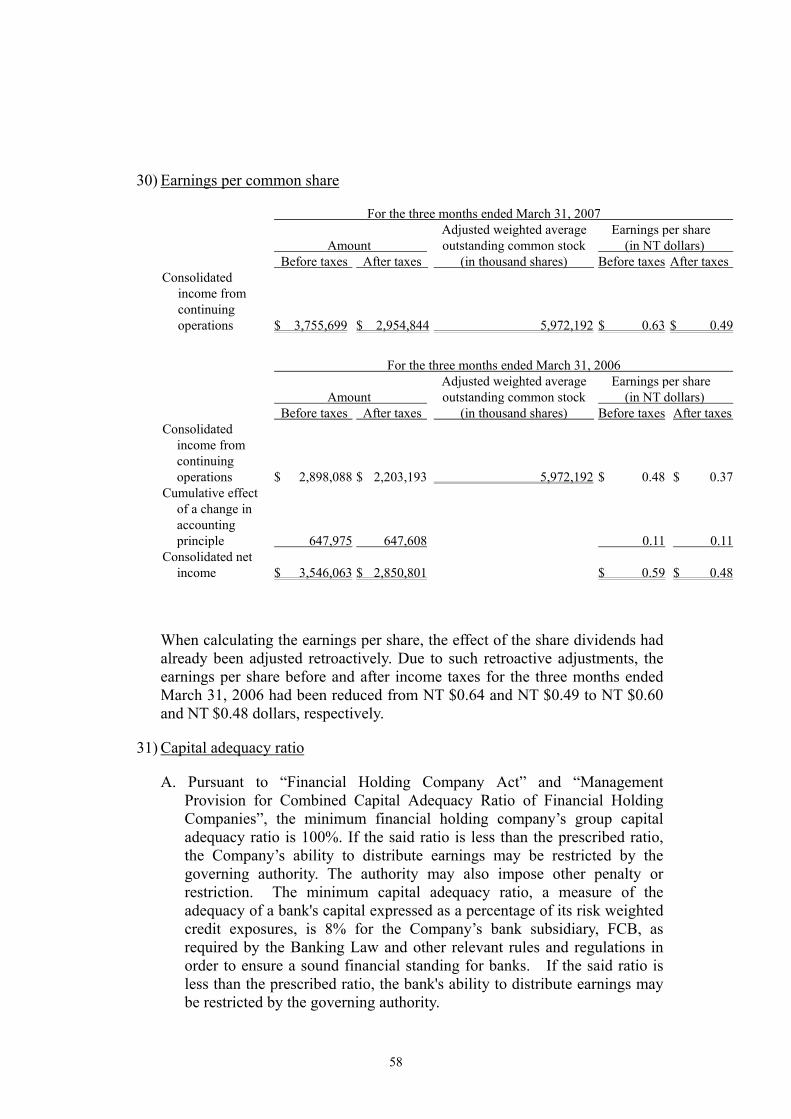
58
30) Earnings per common share
For the three months ended March 31, 2007
Amount Earnings per share (in NT dollars)
Before taxes After taxes
Adjusted weighted average outstanding common stock
(in thousand shares) Before taxes After taxes Consolidated
income from continuing operations $ 3,755,699 $ 2,954,844 5,972,192 $ 0.63 $ 0.49
For the three months ended March 31, 2006
Amount Earnings per share (in NT dollars)
Before taxes After taxes
Adjusted weighted average outstanding common stock
(in thousand shares) Before taxes After taxes Consolidated
income from continuing operations $ 2,898,088 $ 2,203,193 5,972,192 $ 0.48 $ 0.37
Cumulative effect of a change in accounting principle 647,975 647,608 0.11 0.11
Consolidated net income $ 3,546,063 $ 2,850,801 $ 0.59 $ 0.48
When calculating the earnings per share, the effect of the share dividends had already been adjusted retroactively. Due to such retroactive adjustments, the earnings per share before and after income taxes for the three months ended March 31, 2006 had been reduced from NT $0.64 and NT $0.49 to NT $0.60 and NT $0.48 dollars, respectively.
31) Capital adequacy ratio
A. Pursuant to “Financial Holding Company Act” and “Management Provision for Combined Capital Adequacy Ratio of Financial Holding Companies”, the minimum financial holding company’s group capital adequacy ratio is 100%. If the said ratio is less than the prescribed ratio, the Company’s ability to distribute earnings may be restricted by the governing authority. The authority may also impose other penalty or restriction. The minimum capital adequacy ratio, a measure of the adequacy of a bank's capital expressed as a percentage of its risk weighted credit exposures, is 8% for the Company’s bank subsidiary, FCB, as required by the Banking Law and other relevant rules and regulations in order to ensure a sound financial standing for banks. If the said ratio is less than the prescribed ratio, the bank's ability to distribute earnings may be restricted by the governing authority.
59
B. The capital adequacy ratios of FFHC’s Group was 119.35% and 122.05% as of December 31, 2006 and December 31, 2005, respectively.
C. The capital adequacy ratios of FCB was 11.00% and 10.24% as of December 31, 2006 and December 31, 2005, respectively.
32) Asset securitization transaction
a. Product nature and profit (loss)
On March 2, 2004, 2,026 items of residential mortgage loans with the carrying amount of $4,572,697 were sold by FCB under securitization structure and were entrusted to the trustee under a special purpose trust (SPT) to issue two kinds of beneficiary securities. One was senior beneficiary certificates of $4,280,000, which were issued at par value and were classified into three classes of certificates with floating rates as follow:
Certificate A:the issue amount was $3,910,000 and the coupon rate was the adjustable rate mortgage (ARM) index plus 0.25%.
Certificate B: the issue amount was $220,000 and the coupon rate was the adjustable rate mortgage (ARM) index plus 0.55%.
Certificate C:the issue amount was $150,000 and the coupon rate was the adjustable rate mortgage (ARM) index plus 0.65%.
The other was a subordinated beneficiary certificate of $292,697 issued for a credit enhancement purpose with non-interest bearing and was purchased by FCB. If debtors are unable to pay off the principal and related interest when due, the investors and the trustee have no recourse to FCB’s assets. The repayment of the principal with respect to retained interests is subordinated to investors, and the value of the retained interests is affected by the transferred debt’s credit risk, prepayment rate, and interest rate risk. For the three months ended March 31, 2007 and 2006, FCB has recognized the interest income of subordinated beneficiary certificates in the amount of $0 and $9,887, respectively.
60
b. Cash flows
The cash flows received from and paid to securitization trusts are summarized as follows:
For the three months ended March 31, Proceeds from securitization 2007 2006 Servicing fee income received $ - $ 1,008 Proceeds from other cash flows of
retained interests - 9,294 Setting aside as cash reserves
(recorded under “refundable deposits”)
-
-
Setting aside as cash reserves of servicing institution - -
Essential reserves received - -
c. Recognition and measurement of servicing assets
As of March 31, 2007 and 2006, the amounts of servicing assets are $0 and $5,463, respectively, and the amounts of the servicing assets after amortization are $0 and $2,026, respectively, and the servicing assets are recognized as “other assets”.
d. Termination of securitization contract
As of December 16, 2005, the Board of Directors of FCB had passed the resolution to redeem all residential mortgage loans. On April 3, 2006, FCB redeemed all of the aforementioned beneficiary securities (Certificate A, B, C, and D) and terminated the related contracts. Thus, the Bank did not disclose information about the major assumptions for measuring retained interests, sensitivity analysis for cash flows at fair value, and expected static pool loss rate.
61
5. Related party transactions
1) Details of the related parties
Name of related parties Nature of relationship The Ministry of Finance, R.O.C. The ultimate controller of the Company Bank of Taiwan The company’s representative is a director of
the Company Hua Nan Commercial Bank, Ltd. (Hua Nan Bank) (Note)
The company’s representative is a director of the Company
First Financial Asset Management Co., Ltd. (“FFAM”)
Subsidiary of the Company
First Financial Management Consulting Co., Ltd. (“FFMC”)
Subsidiary of the Company
First Venture Capital Co., Ltd. (“FVC”)
Subsidiary of the Company
FCB Leasing Co., Ltd. (“FCBL”) Subsidiary of FCB First Insurance Agency Co., Ltd.
(“FIA”) Subsidiary of FCB
East-Asia Real Estate Management Co., Ltd. (“EAREM”)
FCB’s investee accounted for under the equity method
Mutual Funds Managed by National Investment Trust Co., Ltd. (“MF”)
Mutual funds managed by a subsidiary of the Company
First Commercial Bank Education Foundation (“ FCBEF”)
One-third of total fund was donated by FCB
Note: From January 2, 2006, Hua Nan Bank is no longer a related party of the Company.
2) Major transactions with related parties (for transaction amounts more than or equal to NT $100 million dollars):
A. Call loans to other banks
As of and for the three months ended March 31, 2007
Highest balance
Ending balance
Interest income
Annual interest
rate (%) Bank of Taiwan $ 3,000,000 $ - $ 417 1.69
62
As of and for the three months ended March 31, 2006
Highest balance
Ending balance
Interest income
Annual interest
rate (%) Bank of Taiwan $ 4,000,000 $ 2,000,000 $ 3,509 1.45~1.51
Terms and conditions of the related party transactions are not significantly different from those of transactions with third parties.
B. Call loans from other banks
As of and for the three months ended March 31, 2007
Highest balance
Ending balance
Interest expenses
Annual interest
rate (%) Bank of Taiwan $ 2,000,000 $ - $ 1,367 1.69~1.7 As of and for the three months ended March 31, 2006
Highest balance
Ending balance
Interest expenses
Annual interest
rate (%) Bank of Taiwan $ 10,000,000 $ - $ 1,192 1.45
C. Deposits
March 31 2007 2006 Ending balance Percentage Ending balance PercentageFVC $ 164,813 - $ 322,547 -FIA 265,882 - 364,079 -EAREM 14,234 - 78,877 -Others 5,464,252 1 5,356,024 - $ 5,909,181 1 $ 6,121,527 -
D. Loans
March 31, 2007 2006 Ending balance Percentage Ending balance PercentageFCBL $ 2,985,000 - $ 4,821,000 1Others 1,572,509 - 3,336,938 - $ 4,557,509 - $ 8,157,938 1

63
E. Interest rate swap transactions
March 31, 2007 2006 Notional
principal Gain on interest rate swaps
Notional principal
Gain on interest rate swaps
FCBL $ 90,000 $ 57 $ 132,000 $ 285
F. Foreign exchange transactions
March 31, 2007 2006
Contract
amount Payable to
related partiesContract
amounts Payable to
related partiesBank of Taiwan $ 165,357 ( $ 18) $ 520,182 ( $ 790)
G. Bond payable under repurchase agreement
March 31, 2007 2006 Ending balance Percentage Ending balance PercentageNITC Bond Fund
Affirmed $ 206,876 - $ 157,051 -NITC Taiwan
Bond Fund 243,974 - - - $ 450,850 - $ 157,051 -
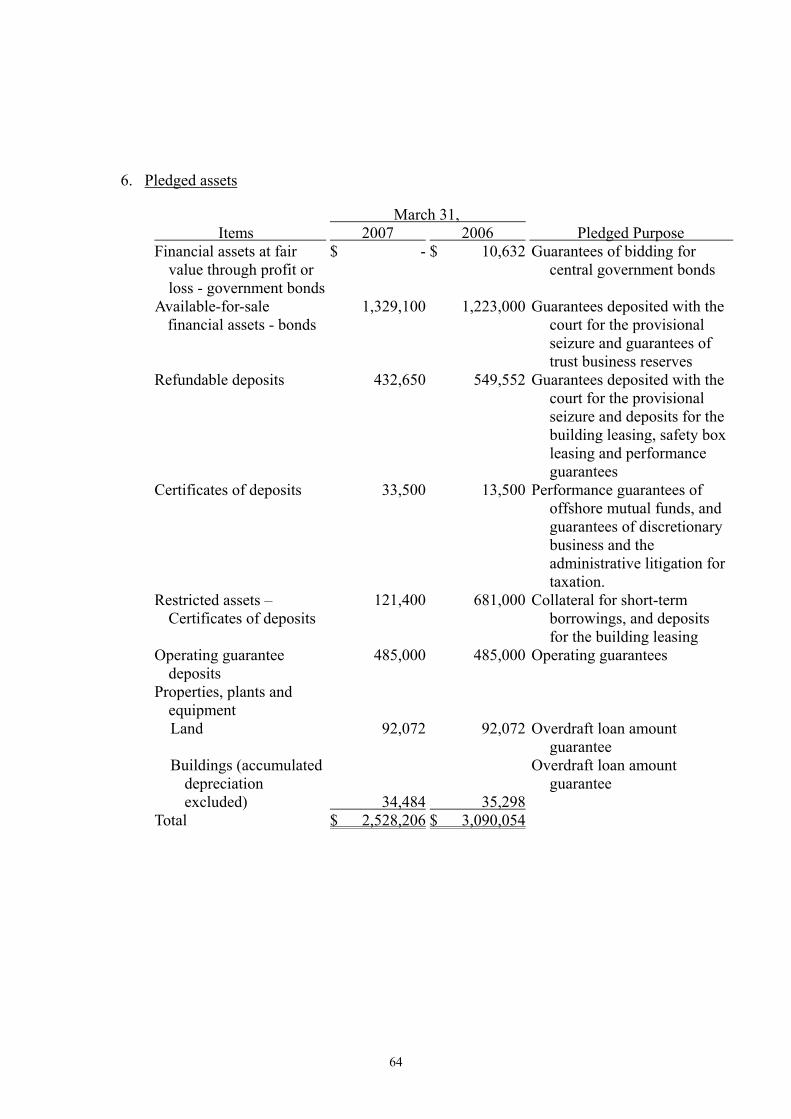
64
6. Pledged assets
March 31, Items 2007 2006 Pledged Purpose Financial assets at fair
value through profit or loss - government bonds
$ - $ 10,632 Guarantees of bidding for central government bonds
Available-for-sale financial assets - bonds
1,329,100 1,223,000 Guarantees deposited with the court for the provisional seizure and guarantees of trust business reserves
Refundable deposits 432,650 549,552 Guarantees deposited with the court for the provisional seizure and deposits for the building leasing, safety box leasing and performance guarantees
Certificates of deposits 33,500 13,500 Performance guarantees of offshore mutual funds, and guarantees of discretionary business and the administrative litigation for taxation.
Restricted assets – Certificates of deposits
121,400 681,000 Collateral for short-term borrowings, and deposits for the building leasing
Operating guarantee deposits
485,000 485,000 Operating guarantees
Properties, plants and equipment
Land 92,072 92,072 Overdraft loan amount guarantee
Buildings (accumulated depreciation excluded)
34,484
35,298
Overdraft loan amount guarantee
Total $ 2,528,206 $ 3,090,054
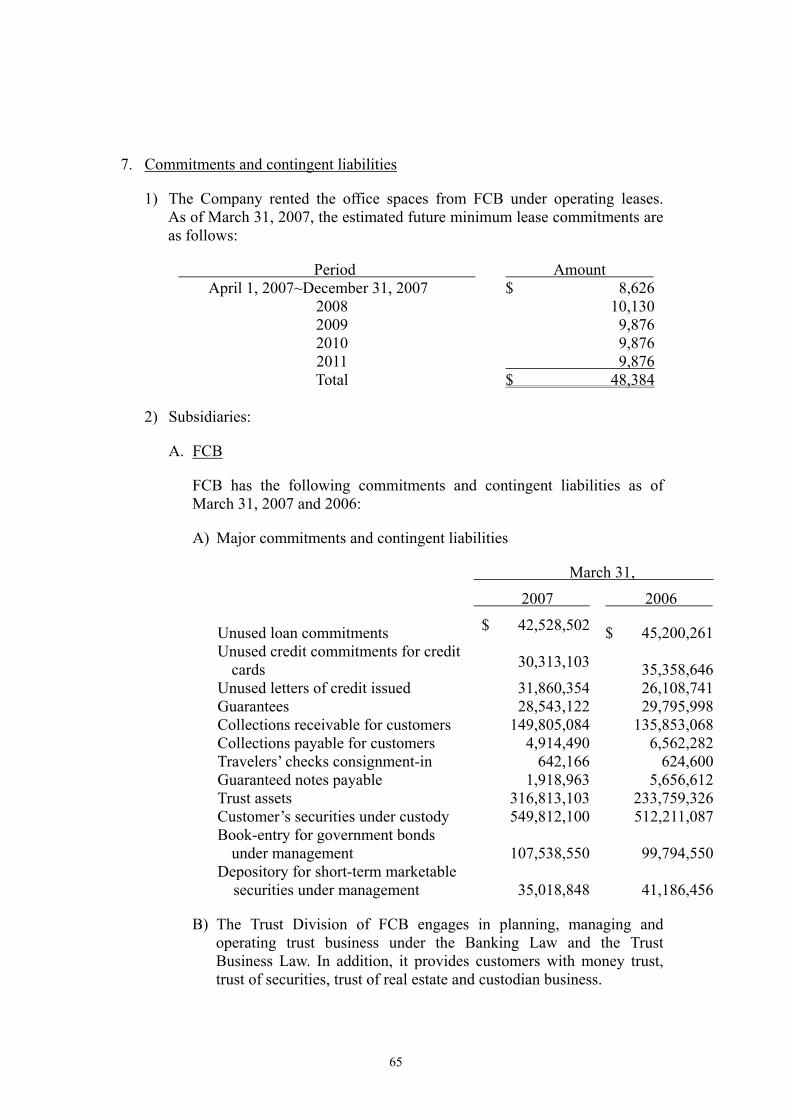
65
7. Commitments and contingent liabilities
1) The Company rented the office spaces from FCB under operating leases. As of March 31, 2007, the estimated future minimum lease commitments are as follows:
Period Amount April 1, 2007~December 31, 2007 $ 8,626
2008 10,1302009 9,8762010 9,8762011 9,876Total $ 48,384
2) Subsidiaries:
A. FCB
FCB has the following commitments and contingent liabilities as of March 31, 2007 and 2006:
A) Major commitments and contingent liabilities
March 31,
2007 2006
Unused loan commitments $ 42,528,502 $ 45,200,261Unused credit commitments for credit
cards 30,313,103 35,358,646Unused letters of credit issued 31,860,354 26,108,741Guarantees 28,543,122 29,795,998Collections receivable for customers 149,805,084 135,853,068Collections payable for customers 4,914,490 6,562,282Travelers’ checks consignment-in 642,166 624,600Guaranteed notes payable 1,918,963 5,656,612Trust assets 316,813,103 233,759,326Customer’s securities under custody 549,812,100 512,211,087Book-entry for government bonds
under management 107,538,550 99,794,550Depository for short-term marketable
securities under management 35,018,848 41,186,456
B) The Trust Division of FCB engages in planning, managing and operating trust business under the Banking Law and the Trust Business Law. In addition, it provides customers with money trust, trust of securities, trust of real estate and custodian business.

66
As of March 31, 2007 and 2006, the investment details of trust assets are listed as follows:
Balance Sheet of Trust Accounts March 31, 2007
Trust assets Trust liabilities
Cash and bank deposits $ 1,597,309 Short-term
borrowings $ - Bonds 51,821,809 Payables - Stocks 42,651,392 Other liabilities - Mutual funds 214,098,217 Beneficiary certificates 224,958 Real Estate 2,424,936 Trust capital 316,809,391 Net assets under
collective investment management accounts 3,994,482
Accumulated profit and loss 3,712
Total $ 316,813,103 Total $ 316,813,103
Property List of Trust Accounts Investment Items Bonds $ 51,821,809 Stocks 42,651,392 Mutual funds 214,098,217 Beneficiary certificates 224,958
Real estate 2,424,936 Net assets under collective investment management
accounts 3,994,482 Total $ 315,215,794
According to Tai-Tsai-Tax Ruling No. 0928011305 of Ministry of Finance, effective from January 1, 2006, the Bank is required to disclose income statement of trust accounts as follows:
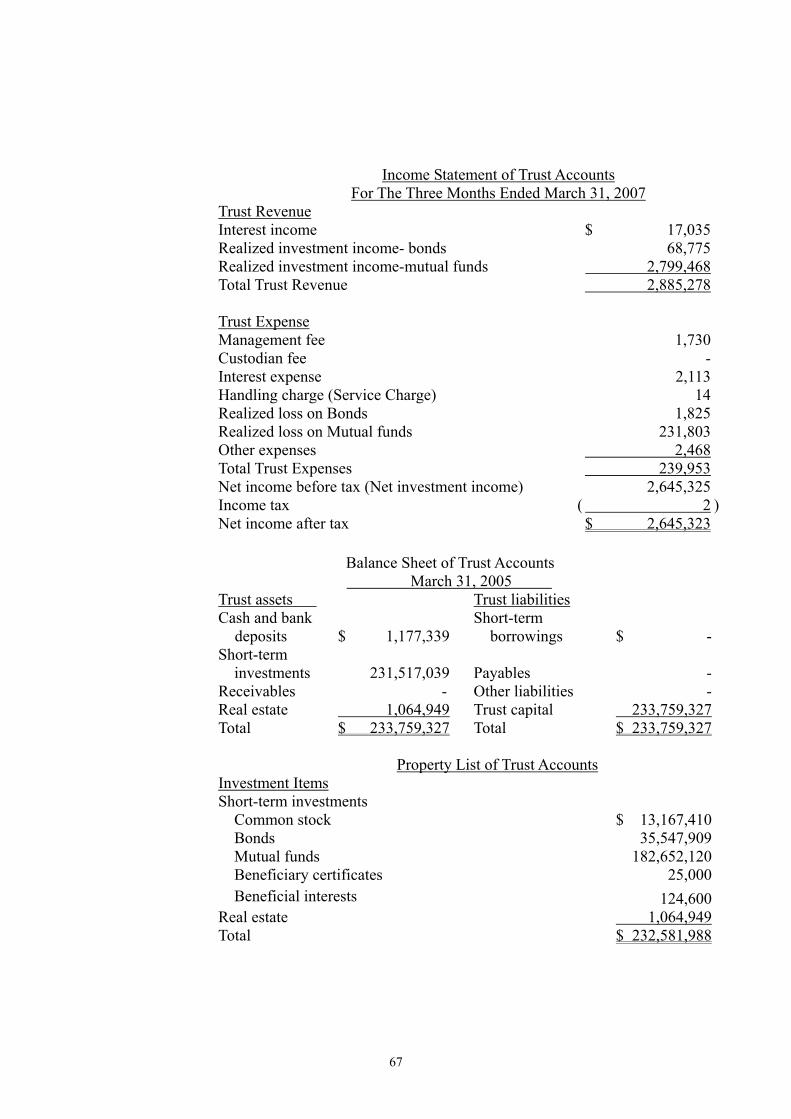
67
Income Statement of Trust Accounts For The Three Months Ended March 31, 2007
Trust Revenue Interest income $ 17,035 Realized investment income- bonds 68,775 Realized investment income-mutual funds 2,799,468 Total Trust Revenue 2,885,278 Trust Expense Management fee 1,730 Custodian fee - Interest expense 2,113 Handling charge (Service Charge) 14 Realized loss on Bonds 1,825 Realized loss on Mutual funds 231,803 Other expenses 2,468 Total Trust Expenses 239,953 Net income before tax (Net investment income) 2,645,325 Income tax ( 2 )Net income after tax $ 2,645,323
Balance Sheet of Trust Accounts
March 31, 2005 Trust assets Trust liabilities Cash and bank
deposits $ 1,177,339 Short-term
borrowings $ - Short-term
investments 231,517,039 Payables - Receivables - Other liabilities - Real estate 1,064,949 Trust capital 233,759,327 Total $ 233,759,327 Total $ 233,759,327
Property List of Trust Accounts
Investment Items Short-term investments Common stock $ 13,167,410 Bonds 35,547,909 Mutual funds 182,652,120 Beneficiary certificates 25,000 Beneficial interests 124,600 Real estate 1,064,949 Total $ 232,581,988

68
C) Due to the collapse of the Tung Xin building caused by an earthquake disaster happened on September 21, 1999, the residents filed a legal claim of loss of personal properties against Hong Cheng Building Co., Ltd., Hong Ku Construction Co., Ltd., (including its Directors and Supervisors), Dah Lin Architect Office, and FCB. Up to now, the case is still being heard by the Taipei District Court. However, FCB’s attorney believes that FCB may prevail in the case because there is no evidence found between the cause of collapse and FCB’s maintenance construction work, and nor is any malicious misconduct or negligence on the part of FCB. Accordingly, no provision is made for the contingent liabilities in the FCB’s financial statements.
D) FCB rented office spaces under operating leases. As of March 31, 2007, the estimated future minimum lease commitments for FCB are as follows:
Period Amount April 1, 2007~December 31,2007 $ 368,947
2008 384,387 2009 239,881 2010 120,713
2011 and thereafter 146,566 $ 1,260,494
E) Others
As of March 31, 2007, FCB had entered into the construction contracts in the amount of $140,000 and $60,342 of which had been paid and had been recorded in “construction in process and prepayments for equipments” account.
B. FTSI and its subsidiaries
A) As of March 31, 2007, FTSI has rented branch office spaces under operating leases, and the estimated future minimum lease commitments for FTSI are as follows:
Period Amount 2007 $ 55,250 2008 53,447 2009 11,062 2010 2,626 2011 1,750
$ 124,135

69
B) As of March 31, 2007 and 2006, FTSI had entered into an agreement to purchase properties and equipment in the amount of $2,790 and $17,690, respectively, and had paid $1,945 and $12,383, respectively.
C) As of March 31, 2007 and 2006, there are 486,835 thousand and 414,845 thousand shares, respectively, of clients’ stocks under the custody of FTSI as a result of margin loan and stock loan activities. FTSI has also lent 14,509 thousand and 8,148 thousand shares, respectively, to its clients as a result of securities lending activities and has received sufficient guarantee deposits for such activities.
D) A client of FTSI, Lin Sheng Jeng, purchased shares of Guo Feng Co., Ltd., Nan Gan Co., Ltd., and Ya Tie Co., Ltd. totaling 4,846 thousand shares, 2,200 thousand shares, and 1,355 thousand shares, respectively, and the settlement amount of $147,252 was not settled by the deadline. FTSI notified the Taiwan Securities Exchange Corporation of the incident and sold part of the stocks for $25,325. FTSI requested Lin Sheng Jeng to pay approximately $121,926 to recover FTSI’s losses, which was recorded as other receivables under other current assets, and had set aside an allowance for bad debts of $120,376. FTSI made a settlement agreement with Lin Jeng Sheng in October 2001 for repayment of $48,000 by installments from 2002 to 2007. Until March 31, 2007, FTSI has accumulatively received the settlement amounts of $42,000.
E) Taipei National Tax Administration, Ministry of Financial (NTA) has determined that the warrant issued by the FTSI was not in compliance with the “Rules of the Securities Transactions Tax”. Accordingly, additional income tax of $ 1,019 and a fine of $ 20,316 has been assessed by NTA. However, FTSI disagreed with the assessments of the penalty and filed tax appeals within the statutory deadline. The petitions had been revoked in September of this year, and FTSI had filed the administrative litigations in November. For conservative purpose, related tax and penalties has been accrued in the financial statements.
C. NITC
NITC has rented office spaces, cars, and copy machines under operating leases. As of March 31, 2007, the estimated future minimum lease commitments are as follows:
Period Amount April 1, 2007~December 31,2007 $ 677
2008 694 Total $ 1,371
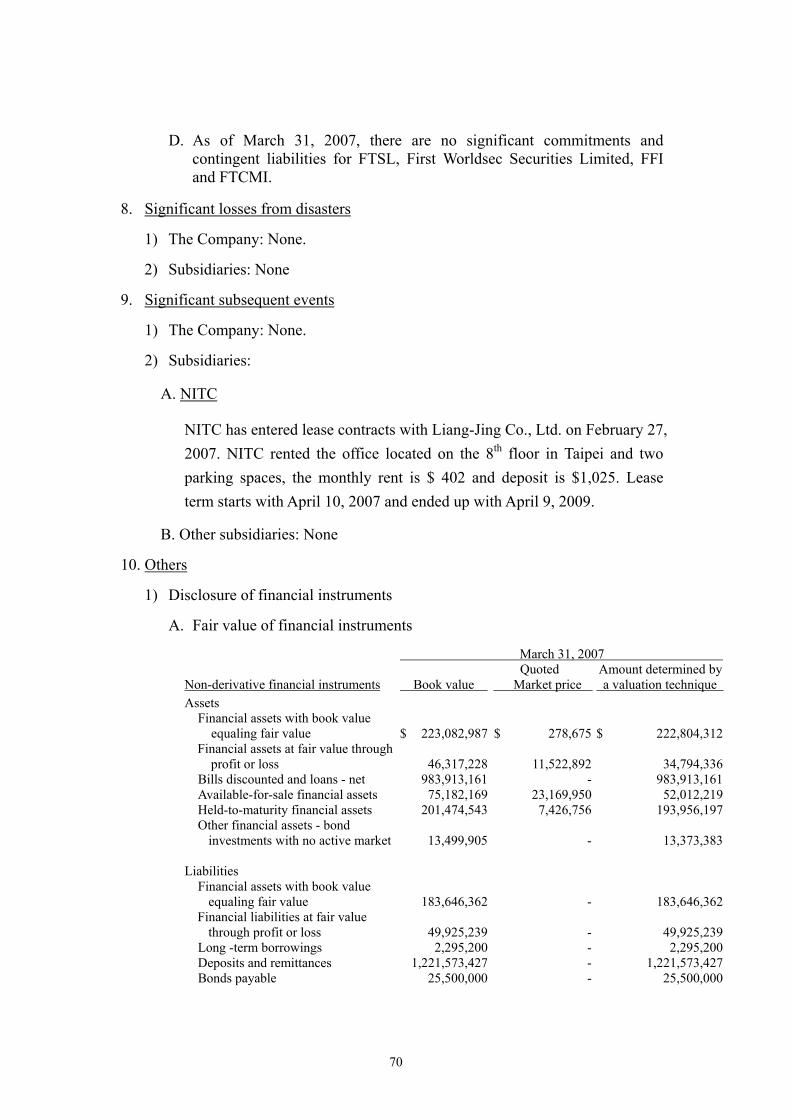
70
D. As of March 31, 2007, there are no significant commitments and contingent liabilities for FTSL, First Worldsec Securities Limited, FFI and FTCMI.
8. Significant losses from disasters
1) The Company: None.
2) Subsidiaries: None
9. Significant subsequent events
1) The Company: None.
2) Subsidiaries:
A. NITC
NITC has entered lease contracts with Liang-Jing Co., Ltd. on February 27, 2007. NITC rented the office located on the 8th floor in Taipei and two parking spaces, the monthly rent is $ 402 and deposit is $1,025. Lease term starts with April 10, 2007 and ended up with April 9, 2009.
B. Other subsidiaries: None
10. Others
1) Disclosure of financial instruments
A. Fair value of financial instruments
March 31, 2007
Non-derivative financial instruments Book value Quoted Market price
Amount determined by a valuation technique
Assets Financial assets with book value
equaling fair value $ 223,082,987 $ 278,675 $ 222,804,312 Financial assets at fair value through
profit or loss 46,317,228 11,522,892 34,794,336 Bills discounted and loans - net 983,913,161 - 983,913,161 Available-for-sale financial assets 75,182,169 23,169,950 52,012,219 Held-to-maturity financial assets 201,474,543 7,426,756 193,956,197 Other financial assets - bond
investments with no active market 13,499,905 - 13,373,383 Liabilities Financial assets with book value
equaling fair value 183,646,362 - 183,646,362 Financial liabilities at fair value
through profit or loss 49,925,239 - 49,925,239 Long -term borrowings 2,295,200 - 2,295,200 Deposits and remittances 1,221,573,427 - 1,221,573,427 Bonds payable 25,500,000 - 25,500,000
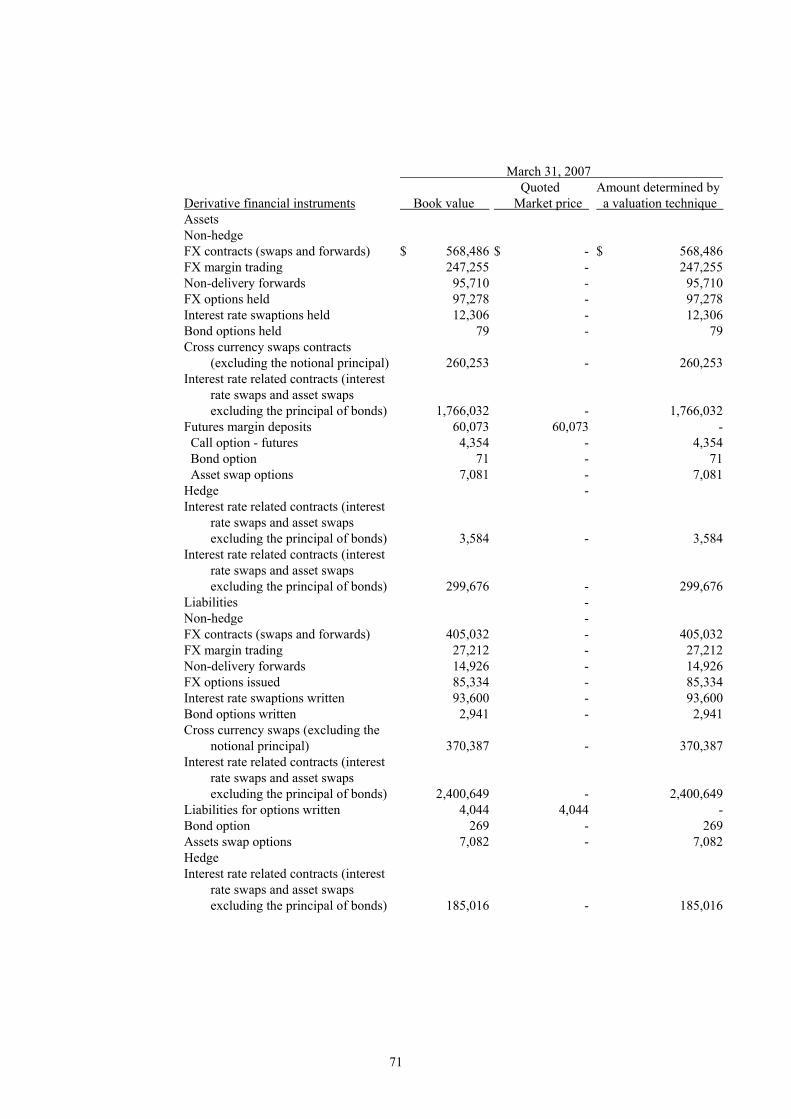
71
March 31, 2007
Derivative financial instruments Book value Quoted Market price
Amount determined by a valuation technique
Assets Non-hedge FX contracts (swaps and forwards) $ 568,486 $ - $ 568,486FX margin trading 247,255 - 247,255Non-delivery forwards 95,710 - 95,710FX options held 97,278 - 97,278Interest rate swaptions held 12,306 - 12,306Bond options held 79 - 79Cross currency swaps contracts
(excluding the notional principal) 260,253 - 260,253Interest rate related contracts (interest
rate swaps and asset swaps excluding the principal of bonds) 1,766,032 - 1,766,032
Futures margin deposits 60,073 60,073 - Call option - futures 4,354 - 4,354Bond option 71 - 71
Asset swap options 7,081 - 7,081Hedge - Interest rate related contracts (interest
rate swaps and asset swaps excluding the principal of bonds) 3,584 - 3,584
Interest rate related contracts (interest rate swaps and asset swaps excluding the principal of bonds) 299,676 - 299,676
Liabilities - Non-hedge - FX contracts (swaps and forwards) 405,032 - 405,032FX margin trading 27,212 - 27,212Non-delivery forwards 14,926 - 14,926FX options issued 85,334 - 85,334Interest rate swaptions written 93,600 - 93,600Bond options written 2,941 - 2,941Cross currency swaps (excluding the
notional principal)
370,387 - 370,387Interest rate related contracts (interest
rate swaps and asset swaps excluding the principal of bonds)
2,400,649
- 2,400,649
Liabilities for options written 4,044 4,044 -Bond option 269 - 269Assets swap options 7,082 - 7,082Hedge Interest rate related contracts (interest
rate swaps and asset swaps excluding the principal of bonds) 185,016
- 185,016

72
March 31, 2006
Non-derivative financial instruments Book value Quoted
Market price Amount determined by a valuation technique
Assets Financial assets with book value
equaling fair value $ 195,513,675 $ 132,798 $ 195,380,877 Financial assets at fair value
through profit or loss 42,798,365 34,525,117 8,273,248 Bill discounted and loans - net 874,046,566 - 874,046,566 Available-for-sale financial assets 88,331,124 87,485,274 845,850 Held-to-maturity financial assets 227,192,836 3,900,139 223,292,697 Other financial assets - bond
investments with no active market 18,976,020 - 18,976,020
Liabilities Financial assets with book value
equaling fair value 200,220,813 - 200,220,813 Financial liabilities at fair value
through profit or loss 34,300,880 - 34,300,880Long -term borrowings 1,793,186 - 1,793,186
Deposits and remittances 11,128,643,000 - 11,128,643,000 Bonds payable 28,992,051 - 28,992,051

73
March 31, 2006
Derivative financial instruments Book value Quoted
Market price Amount determined by a valuation technique
Assets Non-hedge FX contracts (swaps and forwards) $ 57,972 $ - $ 57,972FX margin trading 265,947 - 265,947Non-delivery forwards 7,929 - 7,929FX options held 9,326 - 9,326Interest rate swaptions held 200 - 200Bond options held 4,163 - 4,163Cross currency swaps contracts
(excluding the notional principal) 162,353 - 162,353Interest rate related contracts (interest
rate swaps and asset swaps excluding the principal of bonds) 1,021,222 - 1,021,222
Futures margin deposits 329,618 329,618 - Call option - futures 1,898 1,898 -Bond option 2,087 - 2,087
Asset swap options 39,210 - 39,210Hedge - Interest rate related contracts (interest
rate swaps and asset swaps excluding the principal of bonds) 194,928 - 194,928
Interest rate related contracts (interest rate swaps and asset swaps excluding the principal of bonds) 394,693 - 394,693
Liabilities - Non-hedge - FX contracts (swaps and forwards) 240,116 - 240,116FX margin trading 2,879 - 2,879Non-delivery forwards 7,025 - 7,025FX options issued 9,903 - 9,903Interest rate swaptions written 59 - 59Bond options written 4,471 - 4,471Cross currency swaps (excluding the
notional principal) 307,557 - 307,557Interest rate related contracts (interest
rate swaps and asset swaps excluding the principal of bonds) 1,812,827
- 1,812,827
Liabilities for options written 5,518 5,518 -Bond option 932 - 932Assets swap options - - -Hedge - Interest rate related contracts (interest
rate swaps and asset swaps excluding the principal of bonds) 194,928
- 194,928
74
B. Methods and assumptions used by the Company and its subsidiaries to measure the fair value of financial instruments are summarized as follows:
A) The fair values of financial instruments listed below are estimated at carrying amounts at balance sheet date, as the maturity date is near the balance sheet date or the future receivable or payable amount is close to the carrying amounts:.
Cash and cash equivalents, due from Central Bank and call loans to other banks, investment in bills and bonds under resale agreements, receivables (net of allowance for doubtful accounts), other financial assets (excluding financial assets carried at cost, derivative financial assets held for hedging, and bond investments with no active market), due to Central Bank and other banks, bills and bonds payable under repurchase agreements, funds borrowed from Central Bank and other banks, commercial paper payable, payables, other financial liabilities (excluding derivative financial liabilities held for hedging purposes), short-term borrowings, and so on.
B) For refundable deposits, and operating guarantee deposits and settlement clearing funds, if there is a quoted market price available in an active market, the fair value is determined using the quoted market price. When there is no quoted market price for reference, an assessment of fair value based on the consideration of the carrying amount is deemed reasonable.
C) Bills discounted and loans (including non-performing loans): Considering the nature of the financial service industry, which is the market rate (market price) maker, the effective interest rates of loans are generally based on the basic interest rate or the interest rate index plus (minus) certain adjustment (point) (equivalent to floating rate) to reflect the market rate. As a result, it is reasonable to assume that book value, after adjustments of reserves based on estimated recoverability, approximate fair values. Fair values for mid-term and long-term loans with fixed rates shall be estimated using their discounted values of expected future cash flows. However, as such loans account for only a small portion of all loans, book value was used to estimate the fair value.
D) The fair values of derivative financial instruments are estimated based on the amounts expected to receive or pay under the given situation that the derivative contracts are terminated pursuant to contract terms at the balance sheet date. In general, such an amount includes unrealized gains or losses on outstanding derivative contracts. The Company and its subsidiaries adopt the valuation
75
model that is identical to the market to determine the fair values of derivative financial instruments.
E) When there is a quoted market price available in an active market for available-for-sale financial assets and held-to-maturity financial assets, the fair value is determined using the quoted market price. If there is no quoted market price for reference, a valuation technique will be adopted to measure the fair value. The estimation and assumption of the valuation technique used by the First Group is consistent with those used by the market participants for financial instrument pricing. The discount rate used is consistent with the expected return rate of the financial instruments that have the same conditions and characteristics. Such conditions and characteristics include the debtor’s credit rating, the remaining period of the fixed interest rate contracts, the remaining period for principal repayment, the payment currency, etc.
F) Deposits and remittances: Considering the nature of the financial service industry, which is the market rate (market price) maker, and that deposit transactions usually mature within one year, a book value is a reasonable basis to estimate the fair value. Fair values for long-term fixed rate deposits shall be estimated using their discounted values of expected future cash flows. However, as these deposits account for only a small portion of all deposits and as their maturities are less than three years, book value was used to estimate the fair value.
G) Bonds payable: Since the coupon rates of the senior and subordinated corporate bonds and financial bonds issued by the First Group approximate the market rates, the fair value based on the discounted value of expected future cash flows approximates the book value. The discount rate is the original effective rates of the corporate bonds issued by the Company and its subsidiaries.
H) The fair values of long-term borrowings are estimated based on the amount discounted at coupon rates, and the coupon rate approximates the market interest rate as the long-term borrowings are the short-term commercial paper issued with long-term credit commitments.
I) Other financial assets- bond investments with no active market: If there is an actual transaction price or a quoted market price for bond investments with no active market, the fair value of such bond investments will be determined by the latest actual transaction price or quoted market price. Moreover, if there is no quoted market price for reference, a valuation technique will be adopted to measure the fair value, and the valuation technique is the discounted values of expected future cash flows.
76
J) The fair value measurement is not applicable to equity investments accounted for under the equity method. In addition, there is no quoted market price in an active market for the unlisted stocks under the financial asset carried at cost, and their variability in the range of reasonable fair value estimates is not insignificant and their probability of the various estimates within the range can not be reasonably assessed, so the fair value of the unlisted stocks is not reliably measurable. As a result, information of the book value and the fair value with respect to these financial assets is not disclosed.
C. The Company and its subsidiaries have recognized $(115,734) and $208,356, respectively, of current net (loss) gains on changes in fair value arising from valuation techniques for the three months ended March 31, 2007 and 2006,.
D. As of March 31, 2007 and 2006, the Company and its subsidiaries have financial assets with fair value risk arising from interest rate changes amounted to $84,219,552 and $37,987,238, respectively. The Company and its subsidiaries have financial assets with cash flow risk arising from interest rate changes amounted to $21,648,610 and $4,849,662, respectively.
E. For the three months ended March 31, 2007, and 2006 the Company and its subsidiaries have recognized interest income from the financial assets or financial liabilities not at fair value through profit or loss amounted to $11,557,599 and $10,220,302, respectively, and interest expenses from the financial assets or financial liabilities not at fair value through profit or loss amounted to $6,257,506 and $5,122,097, respectively. The Company and its subsidiaries have recognized the change in fair value of available-for-sale financial assets and have recorded as an adjustment account in the stockholders’ equity amounted to $5,797,453 and $4,852,579, respectively, and the amount of the gain on fair value change reclassified from the stockholders’ equity into the statement of income was $220,162 and $7,941, respectively for the three months ended March 31, 2007 and 2006.
F. Risk management and hedging strategy (including financial hedge)
FCB
A) FCB engages in risk management and hedge under the principles of not only serving customers but also conforming to the bank operational goal, overall risk tolerance limit, and legal compliance to achieve risk diversification, risk transfer, and risk avoidance, and to maximize the benefits of customers, shareholders, and employees. FCB mainly faces the credit risk, market risk (including the interest rate, foreign exchange rate, equity securities, and instrument risks),
77
operation risk, and liquidity risk regardless whether they are on or off balance sheets.
B) FCB’s Board of Directors has the ultimate approval right in risk management. Major management risk items that include the company-wide risk management policy, risk tolerance limit, and authority must be approved by the Board of Directors. Under the Board of Directors, there is a risk management committee, which is responsible to review, supervise, report, and coordinate company-wide risk management. Besides, Risk Management Center, which is independent from business units, is comprised of Regional Center, Risk Management Division, Credit Approval Division, Special Asset Management Division and Research Division, and is responsible for implementing the risk management strategy of FCB.
C) The goal of market risk management of FCB is to achieve optimal risk position, maintain proper liquidity position, and manage all market risk centralized by considering the economic environment, competition condition, market value risk, and impact on net interest income. In order to achieve this goal, FCB’s hedging activities concentrate on risk transfer and risk management of net interest income and market value risk. FCB set the strategy of fair value hedge of interest rate exposure according to the fund transfer pricing principle. FCB primarily uses interest rate swaps to hedge fair value changes, and FCB also hedges the interest rate exposure of partial fixed-rate loans and fixed-rate liabilities.
FTSI and subsidiaries
A) Financial risk control
Enterprise Information System and daily risk management report monitor FTSI's risk. FTSI also establishes timely, accurate, effective risk management indicators to identify, measure, and monitor various business and company-wide risks of FTSI and its subsidiaries, and to cope with market changes. Therefore, it enables management to control risk effectively, and can be used as the operation basis for capital allocation.
FTSI established a Risk Management Committee to implement the overall monitoring, preventing, and controlling by setting risk limits. In addition, FTSI established a risk management system, composed of risk control personnel from chairman office and each business unit, to assure effective control.
78
FTSI’s Risk Management Committee has an executive secretary, appointed by the Board of Directors, to take charge of all risk management strategies. The primary responsibilities of this committee are as follows:
a. Supervising and controlling the implementation status of risk management policy.
b. Establishing the overall structure to measure, monitor, and evaluate quantifiable financial risk.
c. Guiding the implementation of risk measurement, monitoring, and assessment.
d. Monitoring the risk limit of business unit and supervising necessary remediation for business unit when violation of risk limit occurs.
e. Engage in the risk-adjusted performance measurement (RAPM) of business unit or providing the necessary risk information for risk-adjusted performance measurement.
f. Adopting the proper method for the effectiveness evaluation and back testing of a model in order to assure the accuracy of estimation.
g. Assuring risk management to be improved over time.
h. Other related risk management matters.
Except for aforementioned matters, the executive secretary shall also assist the Board of Directors to designate appropriate business units to manage together the unquantifiable risk, including making an emergent contingency plan.
In accordance with FTSI’s “Risk Management Procedures and Execution Standards”, FTSI and its subsidiaries plan and execute the risk management procedures as follows:
a. Complying with FTSI’s “Risk Management Procedures and Execution Standards” to establish a comprehensive risk management procedures with detailed requirements for each business unit.
b. Complying with the related law and regulations issued by competent authority, internal control system, and risk management policies and procedures of each business unit, while conducting business.

79
c. Taking related risk factors into consideration and establishing the transaction limit or authorization limit and risk tolerance limit. In order to apply and monitor the control of such limits, FTSI and its subsidiaries directly control the transaction limit of trader through the online trading system. In addition, FTSI and its subsidiaries quantify the market risk and estimate potential losses for each position by using Value-at-Risk (VaR) taken as the risk management information.
d. All open positions are marked to market on a daily basis unless otherwise stipulated by the related regulations.
e. Establishing the qualification condition and credit limit of the counterparty and granting different credit limits by referring to information from domestic and foreign credit rating institutions or by establishing its own rating system.
f. Avoiding the concentration risk, that is, through limiting the amount of financing to or investing in single customer, single industry, single conglomerate, single stock, or related parties.
g. Evaluating the liquidity risk related to the market, instruments, or funds, and focusing on the size and liquidity of specific market or specific instruments to set the liquidity risk limit.
Besides, according to different requirements from department head, President, Chairman, or the Board of Directors, to present daily, weekly, monthly, or quarterly risk management reports and to provide timely warning report based on periodic monitoring.
B) Hedging strategy (financial hedge)
a. Warrants
FTSI sets its hedging strategy based on conservatism principle after taking into consideration the market risk, liquidity risk of underlying securities, liquidity risk of funds, current regulations, and trading system. In order to hedge the warrants issued, FTSI mainly uses the Delta dynamic hedging principle supplemented by strict risk control system. Such hedging strategy enables FTSI to earn reasonable returns under the limited risk.
a) Dynamic hedging principle
i. Delta hedging strategy
To long or short underlying securities when their prices are fluctuating to offset the profit or loss from warrants with those from underlying securities. Hence, changes in stock price will not have significant impact on the hedging portfolio.

80
When the price of underlying securities rises, Delta value increases and FTSI shall buy more stocks; and when the price of underlying securities falls, Delta value decreases and FTSI shall sell more stocks. Based on the aforementioned strategy, FTSI maintains a Delta neutral position. The hedging instruments are mainly the underlying securities and are supplemented by the certificates of entitlement to new shares of the underlying securities.
ii. In order to maintain a Delta neutral position, FTSI’s hedging operators dynamically adjust the hedge position within authorized limit when the price of underlying securities fluctuates. Expected changes in hedge position when future stock price fluctuates between -50% ~ 50% with volatility rate between -2% ~ 2% are stated as follows:
Unit:thousand shares
Volatility / Stock price f luctuation -2.00% -1.00% 0.00% 1.00% 2.00% -50% 364 410 458 510 565 -40% 1,115 1,208 1,303 1,401 1,502 -30% 2,455 2,591 2,727 2,864 3,002 -20% 4,349 4,506 4,662 4,816 4,969 -10% 6,632 6,785 6,935 7,082 7,226
0% 9,094 9,221 9,344 9,464 9,582 10% 11,542 11,629 11,714 11,798 11,880 20% 13,832 13,877 13,921 13,965 14,009 30% 15,880 15,886 15,893 15,902 15,911 40% 17,650 17,624 17,601 17,580 17,560 50% 19,138 19,090 19,044 19,001 18,960
Holding volumes listed above are just stated for reference, and may differ from the actual holding position. Factors that affect the holding position include the fluctuation volatility, interest rate, and time to maturity. In addition, hedging operators can decide actual holding position within authorized scope by weighting the effects that the adjusting frequency of hedge positions may have an impact on the hedging cost and risk.
b) Gamma hedging strategy
Effects of price changes in underlying securities on Delta value can be estimated by Gamma value. Gamma risk directly influences the adjusting frequency of hedge positions. In order to achieve a Gamma neutral position, other warrants with the same underlying securities shall be traded as hedging instruments, as the Gamma value for underlying securities is zero. The profit and loss and risk changes of convertible bonds of the underlying securities are equivalent to those of the warrants of the same underlying securities. Thus, these
81
convertible bonds can be used to offset the Gamma risk. However, after considering the liquidity of domestic convertible corporate bonds and time to maturity of warrants, the hedging instruments for the Gamma risk are mainly the warrants listed in domestic market with the same underlying securities (including the warrants issued by FTSI) and are supplemented by the convertible corporate bonds issued by the companies of the underlying securities.
c) Hedging frequency
In order to achieve risk neutral, the dynamic hedging requires issuer to adjust holding position with changes in stock price of the underlying securities. However, in practice, the hedge operators cannot immediately adjust the position because the stock price might abruptly rise or fall. In order to react to the aforementioned deficiency, FTSI set upper and lower limits for value at risk; that is, risk management officers timely monitor whether Delta value fluctuates within certain percentage range. Traders can adjust the positions within their authorities according to their judgments on the trend of the market and the underlying securities.
b. Options
FTSI engages in bond options hedge transactions, which primarily consisted of delta-neutral transactions.
c. Convertible bond asset swaps
Convertible bonds asset swaps are divided into corporate bonds and options. Conducting this business is involved in market risk and credit risk of the counterparty. FTSI trades options via a third party; this is to reduce the market risk of that portion. At the same time, monitoring the credit limits bases on counterparty’s evaluation system to reduce the credit risk
NITC
In order to integrate the operation mechanism of NITC’s risk management practice, NITC has established a Risk Management Committee. In accordance with the risk management policies and guidelines set by the Board of Directors, the committee established risk management procedures, valuation method, and management indicators. In addition, the committee monitors the quality of risk management procedures and the risk exposure to assure the effectiveness of implementing risk management and control policy.

82
Within the committee, the Chairman of Board of Directors of NITC acts as the Chairman of the committee, and President, Executive Vice President, Vice President of each department, and Chief Auditor act as committee members. The committee calls an ordinary quarterly meeting and, if needed, a special meeting. Missions and responsibilities of the committee are as follows:
A) Setting up the risk management policies and procedures, operating standards, and risk management indicators.
B) Setting up the schemes of asset and liability management and capital adequacy of NITC.
C) Review each risk limit, model analyses and evaluation methods, and risk management control steps and organization structures.
D) Monitoring various risks of NITC, operating processes, and the compliance with law. The committee quarterly reports the result to the Chairman of the Board of Directors.
E) Other affairs related to the risk management of NITC.
Business units under NITC all comply with laws issued by the authorities, related management rules for subsidiaries set by the Company, and NITC’s internal control system and operation regulations. When establishing the internal control system, NITC had taken into consideration the possible risks (including the market risk, credit risk, liquidity risk, and operation risk) to frame the practical compliance procedures and management steps. In addition, NITC draws up the trading authority and risk tolerance limit to be a basis of implementation.
In compliance with the related risk management regulations, operation departments regularly or irregularly present related statements to NITC’s management, the Company, and the authorities. Risk control officers regularly trace the related risk indicators and, if necessary, present a warning report to assure timely and appropriate treatment.
G. Financial risk information
FCB
A) Market risk
FCB sets the specific trade period, position limit, and stop loss limit for its investments in marketable securities according to different degrees of risk for each specific product. FCB monitors those limitations by various risk indicators such as value at risk, DV01, and GREEKs. In addition, FCB periodically conducts the risk sensitivity analysis of company-wide positions.

83
Each derivative financial instrument transaction undertaken by FCB has set the open aggregate position limit and maximum loss tolerance amount to control the market risk of derivative financial instruments. In addition, the profit and loss arising from fluctuations in the market interest rate or foreign exchange rate will be substantially offset by the profit and loss from hedged items, and thus those instruments would not expose FCB to the significant market risk.
FCB calculates the capital requirements of financial instruments in compliance with the Standardized Approach, and the estimated values of the risk-weighted assets are stated as follows:
Type of market risk March 31, 2007 March 31, 2006 Interest rate risk $ 859,407 $ 1,160,313Equity securities risk 365,427 332,348Foreign exchange risk 144,160 247,647
B) Credit risk
Financial instruments held by FCB may incur losses if counterparties are not able to fulfill their obligations at the maturity date. In order to prevent investments from significant credit risk concentration, FCB sets up the upper credit tolerance limits for investment in stocks by industries and conglomerates. Bond investments are primarily composed of government bonds, financial bonds, and investment-grade corporate bonds. Each corporate bond is reviewed individually to control the credit risk.
Counterparties in FCB’s derivative financial instrument transactions are all financial institutions with good credit ratings. FCB controls credit exposures of its counterparties by giving different risk limits to different counterparties based on their credit ratings.
The credit risk amounts stated below are for those with positive fair values as of the balance sheet date and those contracts with off-balance sheet commitments and guarantees.

84
For all financial instruments held by FCB, the maximum credit exposures are as follows:
March 31, 2007
Items Book value Maximum credit
exposure (Note 1) Non-derivative financial instruments Financial assets for trading purpose Bonds $ 8,686,973 $ 8,686,973 Beneficiary certificates 155,695 155,695 Other marketable securities 451,111 451,111 Financial assets designated for
trading purpose Bonds 28,987,196 28,987,196 Available-for-sale financial assets Bonds 66,001,147 66,001,147 Short-term bills 380,325 380,325 Beneficiary certificates 256,088 256,088 Held-to-maturity financial assets 201,474,543 201,474,543 Bills discounted and loans 984,149,161 984,149,161Derivative financial instruments Non-hedging purpose FX contracts (swaps and forwards) 568,486 568,486 FX margin trading 247,255 247,255 Non-delivery forwards 95,710 95,710 FX options held 97,278 97,278 Interest rate swaptions held 12,306 12,306
Bonds options held 79 79 Cross currency swaps contracts
(excluding the notional principal) 260,253 260,253
Interest rate related contracts (interest rate swaps and asset swaps excluding the principal of bonds) 1,766,032 1,766,032
Futures margin trading (Note 2) 120,104 120,104Hedging purpose Interest rate related contracts
(interest rate swaps and asset swaps excluding the principal of bonds) 3,584 3,584
Off-balance sheet commitments and guarantees - 60,403,476
Note 1: The maximum credit exposures of derivative instruments stated is for those with positive fair values.
Note 2: It is the excess margin deposits that the FCB paid for before it started to engage in futures margin trading.
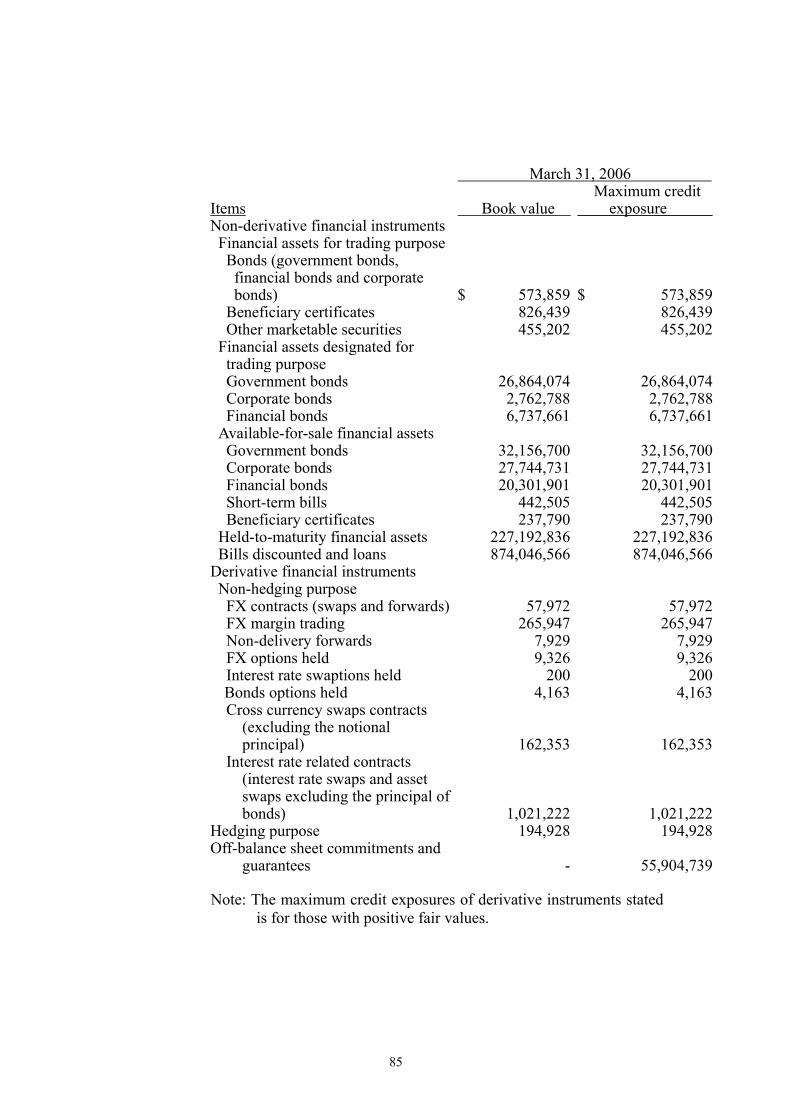
85
March 31, 2006
Items Book value Maximum credit
exposure Non-derivative financial instruments Financial assets for trading purpose Bonds (government bonds,
financial bonds and corporate bonds) $ 573,859 $ 573,859
Beneficiary certificates 826,439 826,439 Other marketable securities 455,202 455,202 Financial assets designated for
trading purpose Government bonds 26,864,074 26,864,074 Corporate bonds 2,762,788 2,762,788 Financial bonds 6,737,661 6,737,661 Available-for-sale financial assets Government bonds 32,156,700 32,156,700 Corporate bonds 27,744,731 27,744,731 Financial bonds 20,301,901 20,301,901 Short-term bills 442,505 442,505 Beneficiary certificates 237,790 237,790 Held-to-maturity financial assets 227,192,836 227,192,836 Bills discounted and loans 874,046,566 874,046,566Derivative financial instruments Non-hedging purpose FX contracts (swaps and forwards) 57,972 57,972 FX margin trading 265,947 265,947 Non-delivery forwards 7,929 7,929 FX options held 9,326 9,326 Interest rate swaptions held 200 200
Bonds options held 4,163 4,163 Cross currency swaps contracts
(excluding the notional principal) 162,353 162,353
Interest rate related contracts (interest rate swaps and asset swaps excluding the principal of bonds) 1,021,222 1,021,222
Hedging purpose 194,928 194,928Off-balance sheet commitments and
guarantees - 55,904,739
Note: The maximum credit exposures of derivative instruments stated is for those with positive fair values.

86
The credit exposure amounts stated above are for those with positive fair value as of the balance sheet date and those contracts with off-balance sheet commitments and guarantees. There will be a significant concentration of credit risk when the counterparty of the financial instruments is highly concentrated in a single customer or a group of counterparties who engage mostly in similar business activities with similar economic nature, and such business activities make their abilities to fulfill the contractual obligations influenced similarly by the economic affairs or other situations. FCB does not engage in transactions that are concentrated significantly in a single customer or counterparty. However, the information on concentrations of credit risks, which represents up to 5% of FCB’s loans, bills discounted, and non-accrual loans is classified below by counterparties and regions:
Contract amounts of significant credit risk concentration for bills discounted and loans are as follows:
March 31, 2007
Book value Maximum
credit exposure Loans by industries
Private enterprises $ 425,041,050 $ 425,041,050
State-owned enterprises 36,782,277 36,782,277
Government institutions 93,130,315 93,130,315
Non-profit organizations 3,164,718 3,164,718
Private individual 317,744,292 317,744,292
Others 6,030 6,030
Offshore entities 116,454,903 116,454,903
Total $ 992,323,585 $ 992,323,585
Loans by regions
Asia $ 961,146,987 $ 961,146,987
Europe 397,187 397,187
North America 24,381,799 24,381,799
Central America 6,035,168 6,035,168
Oceania 362,444 362,444
Total $ 992,323,585 $ 992,323,585

87
March 31, 2006
Book value Maximum
credit exposure Loans by industries Private enterprises $ 384,986,952 $ 384,986,952State-owned enterprises 41,106,482 41,106,482Government institutions 65,739,080 65,739,080Non-profit organizations 3,669,101 3,669,101Private individual 293,543,402 293,543,402Others 2,372,057 2,372,057Offshore entities 90,575,451 90,575,451 $ 881,992,525 $ 881,992,525 Loans by regions Asia $ 859,333,796 $ 859,333,796 Europe 449,004 449,004North America 18,239,439 18,239,439Central America 3,655,293 3,655,293Oceania 314,993 314,993 $ 881,992,525 $ 881,992,525
C) Liquidity risk
Stocks traded by FCB are all listed on the Taiwan Stock Exchange or the OTC Securities Market. Thus, these stocks have high liquidity and are expected to be sold at fair value promptly when needed. Bonds that FCB hold are primary government bonds and their liquidity is within an acceptable range. As a result, FCB does not have the significant liquidity risk.
For the derivative financial instruments held by FCB, all positions have an active market and high liquidity (except for those financial bonds issued by the Bank and structured with interest rate swap contracts, which have no need for further swaps). Thus, there is no significant concern for liquidity risk.
The liquid reserve ratio for FCB was 26.69%. In addition, FCB’s capital and working capital were sufficient to fulfill all obligations. Thus, there was no material liquidity risk that FCB may fail to meet the obligation.
Analyses for time to maturity of FCB’s assets and liabilities are as follows:
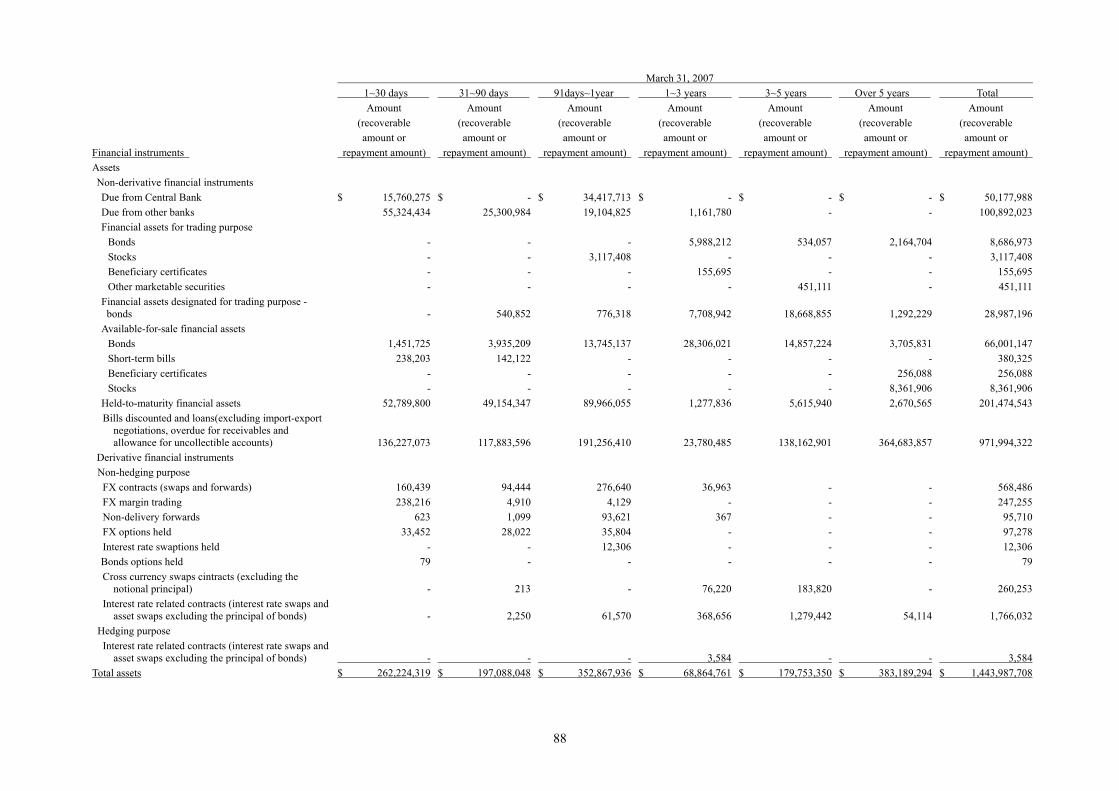
88
March 31, 2007
Financial instruments
1~30 days Amount
(recoverable amount or
repayment amount)
31~90 days Amount
(recoverable amount or
repayment amount)
91days~1year Amount
(recoverable amount or
repayment amount)
1~3 years Amount
(recoverable amount or
repayment amount)
3~5 years Amount
(recoverable amount or
repayment amount)
Over 5 years Amount
(recoverable amount or
repayment amount)
Total Amount
(recoverable amount or
repayment amount) Assets Non-derivative financial instruments Due from Central Bank $ 15,760,275 $ - $ 34,417,713 $ - $ - $ - $ 50,177,988 Due from other banks 55,324,434 25,300,984 19,104,825 1,161,780 - - 100,892,023 Financial assets for trading purpose
Bonds - - - 5,988,212 534,057 2,164,704 8,686,973 Stocks - - 3,117,408 - - - 3,117,408 Beneficiary certificates - - - 155,695 - - 155,695 Other marketable securities - - - - 451,111 - 451,111
Financial assets designated for trading purpose - bonds - 540,852 776,318 7,708,942 18,668,855 1,292,229 28,987,196
Available-for-sale financial assets Bonds 1,451,725 3,935,209 13,745,137 28,306,021 14,857,224 3,705,831 66,001,147 Short-term bills 238,203 142,122 - - - - 380,325 Beneficiary certificates - - - - - 256,088 256,088 Stocks - - - - - 8,361,906 8,361,906
Held-to-maturity financial assets 52,789,800 49,154,347 89,966,055 1,277,836 5,615,940 2,670,565 201,474,543 Bills discounted and loans(excluding import-export
negotiations, overdue for receivables and allowance for uncollectible accounts) 136,227,073 117,883,596 191,256,410 23,780,485 138,162,901 364,683,857 971,994,322
Derivative financial instruments Non-hedging purpose
FX contracts (swaps and forwards) 160,439 94,444 276,640 36,963 - - 568,486 FX margin trading 238,216 4,910 4,129 - - - 247,255 Non-delivery forwards 623 1,099 93,621 367 - - 95,710 FX options held 33,452 28,022 35,804 - - - 97,278 Interest rate swaptions held - - 12,306 - - - 12,306
Bonds options held 79 - - - - - 79 Cross currency swaps cintracts (excluding the
notional principal) - 213 - 76,220 183,820 - 260,253 Interest rate related contracts (interest rate swaps and
asset swaps excluding the principal of bonds) - 2,250 61,570 368,656 1,279,442 54,114 1,766,032 Hedging purpose
Interest rate related contracts (interest rate swaps and asset swaps excluding the principal of bonds) - - - 3,584 - - 3,584
Total assets $ 262,224,319 $ 197,088,048 $ 352,867,936 $ 68,864,761 $ 179,753,350 $ 383,189,294 $ 1,443,987,708

89
March 31, 2007
Financial instruments
1~30 days Amount
(recoverable amount or
repayment amount)
31~90 days Amount
(recoverable amount or
repayment amount)
91days~1year Amount
(recoverable amount or
repayment amount)
1~3 years Amount
(recoverable amount or
repayment amount)
3~5 years Amount
(recoverable amount or
repayment amount)
Over 5 years Amount
(recoverable amount or
repayment amount)
Total Amount
(recoverable amount or
repayment amount) Liabilities
Non-derivative financial instruments Due to Central Bank $ 200,727 $ - $ - $ - $ - $ - $ 200,727 Due to other banks 50,143,002 29,510,506 34,693,510 188,985 - - 114,536,003 Funds borrowed to Central Bank and other banks 169,731 - - - - - 169,731 Bills and bonds payable under repurchase agreements 5,150,000 4,064,000 1,189,746 - - - 10,403,746
Deposits and remittances 289,397,137 122,578,027 772,313,149 14,020,279 27,630,524 - 1,225,939,116 Financial liabilities designated for trading purpose - - 9,175,982 21,015,961 16,773,302 2,959,994 49,925,239 Financial bonds payable - - 5,500,000 11,500,000 - 3,500,000 20,500,000 Derivative financial instruments
Non-hedging FX contracts (swaps and forwards) 78,451 93,217 231,968 1,396 - - 405,032 FX margin trading 24,953 2,169 90 - - - 27,212 Non-delivery forwards 5,533 2,543 6,501 349 - - 14,926 FX options written 32,078 29,409 23,847 - - - 85,334 Interest rate swaptions written 107 1,265 11,088 15,468 65,672 - 93,600 Bond options written 455 2,318 168 - - - 2,941 Cross currency swaps contracts (excluding the
notional principal) 391 - - 114,287 255,709 - 370,387 Interest rate related contracts (interest rate swaps
and asset swaps excluding the principal of bonds) - 219 8,207 291,224 2,052,682 48,317 2,400,649
Hedging Interest rate related contracts (interest rate swaps
and asset swaps excluding the principal of bonds) - - - - - 185,016 185,016
Total liabilities 345,202,565 156,283,673 823,154,256 47,147,949 46,777,889 6,693,327 1,425,259,659 Net liquidity gap ( $ 82,978,246 ) $ 40,804,375 ( $ 470,286,320 ) $ 21,716,812 $ 132,975,461 $ 376,495,967 $ 18,728,049
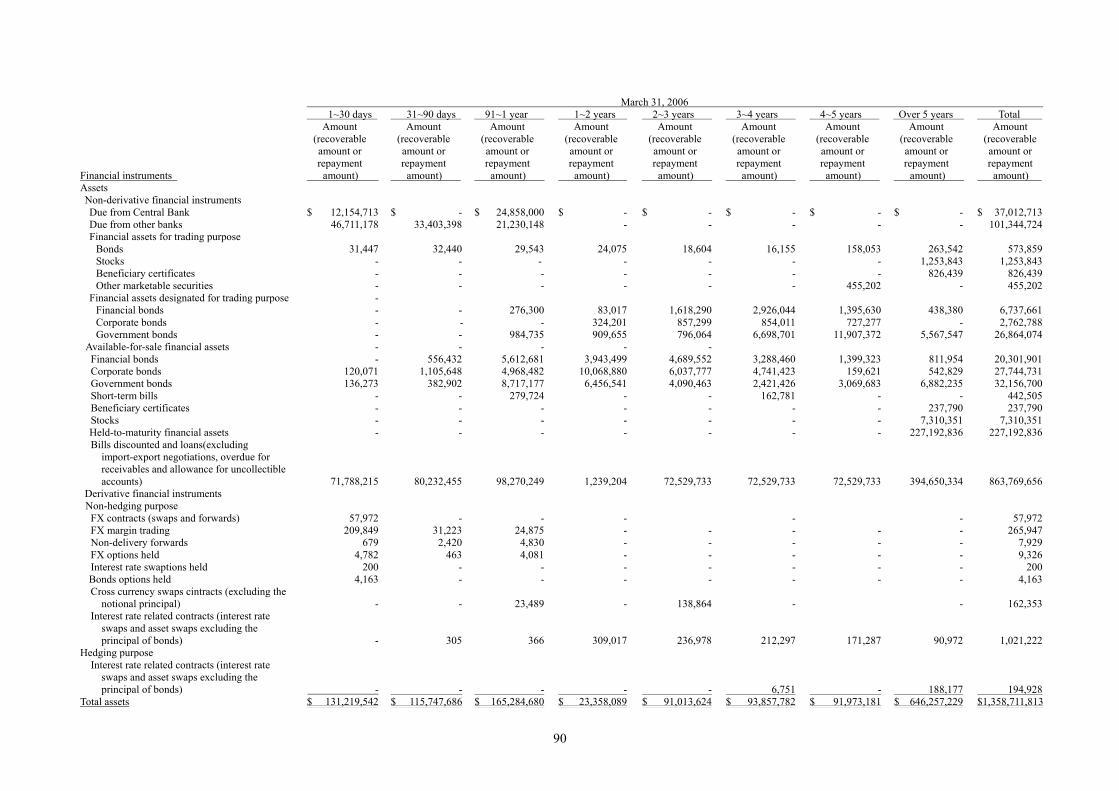
90
March 31, 2006
Financial instruments
1~30 days Amount
(recoverable amount or repayment
amount)
31~90 days Amount
(recoverable amount or repayment
amount)
91~1 year Amount
(recoverable amount or repayment
amount)
1~2 years Amount
(recoverable amount or repayment
amount)
2~3 years Amount
(recoverable amount or repayment
amount)
3~4 years Amount
(recoverable amount or repayment
amount)
4~5 years Amount
(recoverable amount or repayment
amount)
Over 5 years Amount
(recoverable amount or repayment
amount)
Total Amount
(recoverable amount or repayment
amount) Assets Non-derivative financial instruments Due from Central Bank $ 12,154,713 $ - $ 24,858,000 $ - $ - $ - $ - $ - $ 37,012,713 Due from other banks 46,711,178 33,403,398 21,230,148 - - - - - 101,344,724 Financial assets for trading purpose
Bonds 31,447 32,440 29,543 24,075 18,604 16,155 158,053 263,542 573,859 Stocks - - - - - - - 1,253,843 1,253,843 Beneficiary certificates - - - - - - - 826,439 826,439 Other marketable securities - - - - - - 455,202 - 455,202
Financial assets designated for trading purpose - Financial bonds - - 276,300 83,017 1,618,290 2,926,044 1,395,630 438,380 6,737,661 Corporate bonds - - - 324,201 857,299 854,011 727,277 - 2,762,788 Government bonds - - 984,735 909,655 796,064 6,698,701 11,907,372 5,567,547 26,864,074 Available-for-sale financial assets - - - - -
Financial bonds - 556,432 5,612,681 3,943,499 4,689,552 3,288,460 1,399,323 811,954 20,301,901 Corporate bonds 120,071 1,105,648 4,968,482 10,068,880 6,037,777 4,741,423 159,621 542,829 27,744,731 Government bonds 136,273 382,902 8,717,177 6,456,541 4,090,463 2,421,426 3,069,683 6,882,235 32,156,700 Short-term bills - - 279,724 - - 162,781 - - 442,505 Beneficiary certificates - - - - - - - 237,790 237,790 Stocks - - - - - - - 7,310,351 7,310,351 Held-to-maturity financial assets - - - - - - - 227,192,836 227,192,836 Bills discounted and loans(excluding
import-export negotiations, overdue for receivables and allowance for uncollectible accounts) 71,788,215 80,232,455 98,270,249 1,239,204 72,529,733 72,529,733 72,529,733 394,650,334 863,769,656
Derivative financial instruments Non-hedging purpose
FX contracts (swaps and forwards) 57,972 - - - - - 57,972 FX margin trading 209,849 31,223 24,875 - - - - - 265,947 Non-delivery forwards 679 2,420 4,830 - - - - - 7,929 FX options held 4,782 463 4,081 - - - - - 9,326 Interest rate swaptions held 200 - - - - - - - 200
Bonds options held 4,163 - - - - - - - 4,163 Cross currency swaps cintracts (excluding the
notional principal) - - 23,489 - 138,864 - - 162,353 Interest rate related contracts (interest rate
swaps and asset swaps excluding the principal of bonds) - 305 366 309,017 236,978 212,297 171,287 90,972 1,021,222
Hedging purpose Interest rate related contracts (interest rate
swaps and asset swaps excluding the principal of bonds)
- - - - - 6,751 - 188,177 194,928 Total assets $ 131,219,542 $ 115,747,686 $ 165,284,680 $ 23,358,089 $ 91,013,624 $ 93,857,782 $ 91,973,181 $ 646,257,229 $1,358,711,813

91
March 31, 2006
Financial instruments
1~30 days Amount
(recoverable amount or repayment
amount)
31~90 days Amount
(recoverable amount or repayment
amount)
91~1 year Amount
(recoverable amount or repayment
amount)
1~2 years Amount
(recoverable amount or repayment
amount)
2~3 years Amount
(recoverable amount or repayment
amount)
3~4 years Amount
(recoverable amount or repayment
amount)
4~5 years Amount
(recoverable amount or repayment
amount)
Over 5 years Amount
(recoverable amount or repayment
amount)
Total Amount
(recoverable amount or repayment
amount) Liabilities
Non-derivative financial instruments Due to Central Bank $ 213,255 $ - $ - $ - $ - $ - $ - $ - $ 213,255 Due to other banks 39,291,792 51,592,378 44,682,765 - 78,000 - - - 135,644,935 Bills and bonds payable under repurchase
agreements 10,245,981 3,319,000 2,026,000 - - - - - 15,590,981 Funds borrowed to Central Bank and other banks
231,559 - - - - - - - 231,559
Deposits and remittances 227,906,969 193,218,826 436,067,284 155,309,000 122,389,000 - - - 1,134,891,079 Financial liabilities designated for
trading purpose - - - 7,924,638 7,344,787 - 5,122,022 13,870,223 34,261,670 Financial bonds payable - - - 4,998,344 12,495,860 - - 6,497,847 23,992,051 Derivative financial instruments -
Non-hedging FX contracts (swaps and forwards) 240,116 - - - - - - - 240,116 FX margin trading 2,220 659 - - - - - 2,879 Non-delivery forwards 614 2,093 4,318 - - - - 7,025 FX options written 4,264 1,371 4,268 - - - - 9,903 Interest rate swaptions written 59 - - - - - - 59 Bond options written 4,471 - - - - - - 4,471 Cross currency swaps contracts
(excluding the notional principal) - - - - 175,134 - 17,767 114,656 307,557 Interest rate related contracts (interest
rate swaps and asset swaps excluding the principal of bonds) - 7,366 8,724 57,898 167,201 279,381 976,954 315,303 1,812,827
Hedging Interest rate related contracts (interest
rate swaps and asset swaps excluding the principal of bonds) - - - - - 6,751 - 188,177 194,928
Total liabilities $ 278,141,300 $ 248,141,693 $ 482,793,359 $ 168,289,880 $ 142,649,982 $ 286,132 $ 6,116,743 $ 20,986,206 $ 1,347,405,295 Net liquidity gap ( $ 146,921,758 ) ( $ 132,394,007) ( $ 317,508,679 ) ( $ 144,931,791) ( $ 51,636,358 ) $ 93,571,650 $ 85,856,438 $ 625,271,023 $ 11,306,518

92
D) Cash flow risk and fair value risk arising from changes in interest rates
In order to stabilize the long-term profitability and maintain the business growth, FCB sets a certain interval for each interest-rate-sensitivity indicator.
a. Expected repricing date or expected maturity date
As of March 31, 2007 and 2006, the expected repricing date or expected maturity date was not affected by the contract date. The following table, showing the interest rate risk of FCB, is presented by the book value of financial assets and financial liabilities and classified by the earlier of the expected repricing date or expected maturity date:

93
December 31, 2006
Financial instrument
1~30 days Amount
(recoverable amount or
repayment amount)
31~90 days Amount
(recoverable amount or
repayment amount)
91days~1year Amount
(recoverable amount or
repayment amount)
1~3 years Amount
(recoverable amount or
repayment amount)
3~5 years Amount
(recoverable amount or
repayment amount)
Over 5 years Amount
(recoverable amount or
repayment amount)
Total Amount
(recoverable amount or
repayment amount) Assets
Non-derivative financial instruments Due from Central Bank $ 15,760,275 $ - $ 34,417,713 $ - $ - $ - $ 50,177,988 Due from other banks 55,324,434 25,300,984 19,104,825 1,161,780 - - 100,892,023 Financial assets for trading purpose -
bonds - - - 5,988,212 534,057 2,164,704 8,686,973 Financial assets designated for trading
purpose - bonds - 540,852 776,318 7,708,942 18,668,855 1,292,229 28,987,196 Available-for-sale financial assets
Bonds 1,451,725 3,935,209 13,745,137 28,306,021 14,857,224 3,705,831 66,001,147 Short-term bills 238,203 142,122 - - - - 380,325
Held-to-maturity financial assets 52,789,800 49,154,347 89,966,055 1,277,836 5,615,940 2,670,565 201,474,543 Bills discounted and loans (excluding
import-export negotiations, overdue receivables, allowance for doubtful debts) 773,338,946 90,859,363 76,559,051 8,896,300 5,190,804 17,149,858 971,994,322
Derivative financial instruments Interest rate swaption option held - - 12,306 - - - 12,306 Bonds options held 79 - - - - - 79 Cross currency swaps contracts
(excluding the notional principal) - 170,192 13,840 76,221 - - 260,253 Interest rate related contracts (interest
rate swaps and asset swaps excluding the principal of bonds) 269,756 939,628 9,299 71,240 431,760 44,349 1,766,032
Hedging Interest rate related contract (asset swaps excluding the principal of bonds) - - - 3,584 - - 3,584
Total assets $ 899,173,218 $ 171,042,697 $ 234,604,544 $ 53,490,136 $ 45,298,640 $ 27,027,536 $ 1,430,636,771
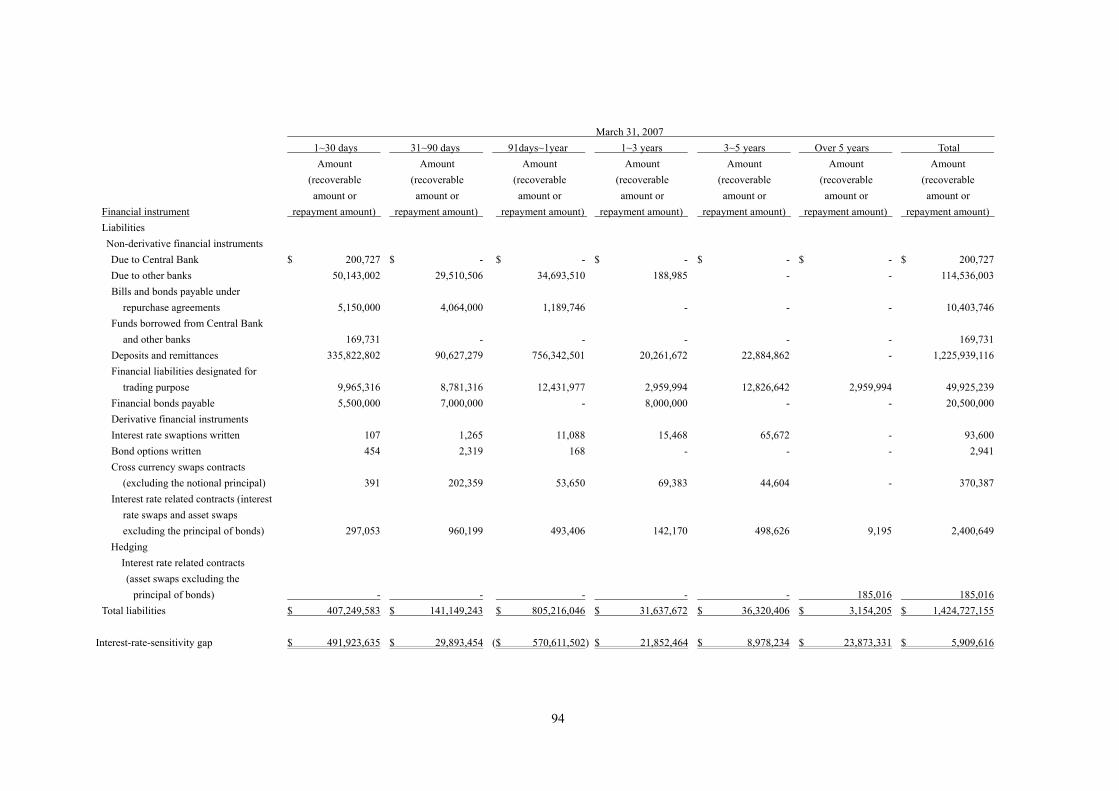
94
March 31, 2007
Financial instrument
1~30 days Amount
(recoverable amount or
repayment amount)
31~90 days Amount
(recoverable amount or
repayment amount)
91days~1year Amount
(recoverable amount or
repayment amount)
1~3 years Amount
(recoverable amount or
repayment amount)
3~5 years Amount
(recoverable amount or
repayment amount)
Over 5 years Amount
(recoverable amount or
repayment amount)
Total Amount
(recoverable amount or
repayment amount) Liabilities Non-derivative financial instruments Due to Central Bank $ 200,727 $ - $ - $ - $ - $ - $ 200,727 Due to other banks 50,143,002 29,510,506 34,693,510 188,985 - - 114,536,003 Bills and bonds payable under
repurchase agreements 5,150,000 4,064,000 1,189,746 - - - 10,403,746 Funds borrowed from Central Bank
and other banks 169,731 - - - - - 169,731 Deposits and remittances 335,822,802 90,627,279 756,342,501 20,261,672 22,884,862 - 1,225,939,116 Financial liabilities designated for
trading purpose 9,965,316 8,781,316 12,431,977 2,959,994 12,826,642 2,959,994 49,925,239 Financial bonds payable 5,500,000 7,000,000 - 8,000,000 - - 20,500,000 Derivative financial instruments Interest rate swaptions written 107 1,265 11,088 15,468 65,672 - 93,600 Bond options written 454 2,319 168 - - - 2,941 Cross currency swaps contracts
(excluding the notional principal) 391 202,359 53,650 69,383 44,604 - 370,387 Interest rate related contracts (interest
rate swaps and asset swaps excluding the principal of bonds) 297,053 960,199 493,406 142,170 498,626 9,195 2,400,649
Hedging Interest rate related contracts
(asset swaps excluding the principal of bonds) - - - - - 185,016 185,016
Total liabilities $ 407,249,583 $ 141,149,243 $ 805,216,046 $ 31,637,672 $ 36,320,406 $ 3,154,205 $ 1,424,727,155
Interest-rate-sensitivity gap $ 491,923,635 $ 29,893,454 ($ 570,611,502) $ 21,852,464 $ 8,978,234 $ 23,873,331 $ 5,909,616
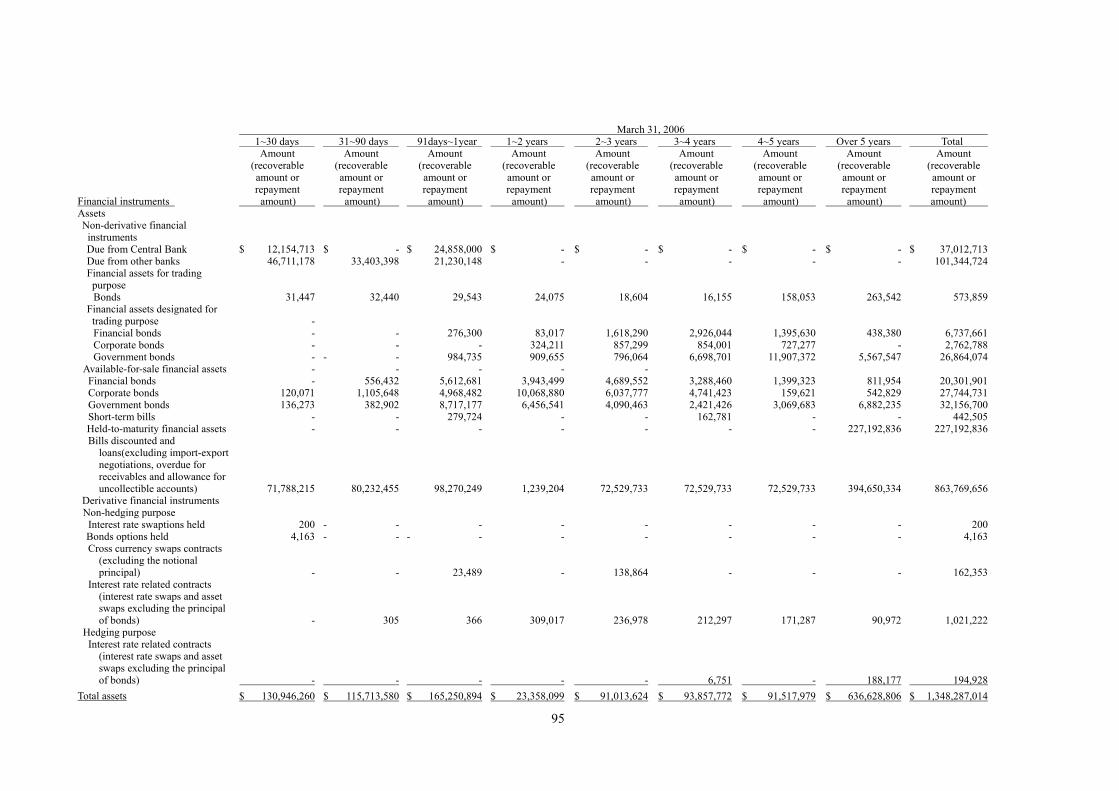
95
March 31, 2006
Financial instruments
1~30 days Amount
(recoverable amount or repayment
amount)
31~90 days Amount
(recoverable amount or repayment
amount)
91days~1year Amount
(recoverable amount or repayment
amount)
1~2 years Amount
(recoverable amount or repayment
amount)
2~3 years Amount
(recoverable amount or repayment
amount)
3~4 years Amount
(recoverable amount or repayment
amount)
4~5 years Amount
(recoverable amount or repayment
amount)
Over 5 years Amount
(recoverable amount or repayment
amount)
Total Amount
(recoverable amount or repayment
amount) Assets Non-derivative financial
instruments Due from Central Bank $ 12,154,713 $ - $ 24,858,000 $ - $ - $ - $ - $ - $ 37,012,713 Due from other banks 46,711,178 33,403,398 21,230,148 - - - - - 101,344,724 Financial assets for trading purpose
Bonds 31,447 32,440 29,543 24,075 18,604 16,155 158,053 263,542 573,859 Financial assets designated for trading purpose -
Financial bonds - - 276,300 83,017 1,618,290 2,926,044 1,395,630 438,380 6,737,661 Corporate bonds - - - 324,211 857,299 854,001 727,277 - 2,762,788 Government bonds - - - 984,735 909,655 796,064 6,698,701 11,907,372 5,567,547 26,864,074 Available-for-sale financial assets - - - - -
Financial bonds - 556,432 5,612,681 3,943,499 4,689,552 3,288,460 1,399,323 811,954 20,301,901 Corporate bonds 120,071 1,105,648 4,968,482 10,068,880 6,037,777 4,741,423 159,621 542,829 27,744,731 Government bonds 136,273 382,902 8,717,177 6,456,541 4,090,463 2,421,426 3,069,683 6,882,235 32,156,700 Short-term bills - - 279,724 - - 162,781 - - 442,505 Held-to-maturity financial assets - - - - - - - 227,192,836 227,192,836 Bills discounted and
loans(excluding import-export negotiations, overdue for receivables and allowance for uncollectible accounts) 71,788,215 80,232,455 98,270,249 1,239,204 72,529,733 72,529,733 72,529,733 394,650,334 863,769,656
Derivative financial instruments Non-hedging purpose
Interest rate swaptions held 200 - - - - - - - - 200 Bonds options held 4,163 - - - - - - - - - 4,163
Cross currency swaps contracts (excluding the notional principal) - - 23,489 - 138,864 - - - 162,353
Interest rate related contracts (interest rate swaps and asset swaps excluding the principal of bonds) - 305 366 309,017 236,978 212,297 171,287 90,972 1,021,222
Hedging purpose Interest rate related contracts
(interest rate swaps and asset swaps excluding the principal of bonds) - - - - - 6,751 - 188,177 194,928
Total assets $ 130,946,260 $ 115,713,580 $ 165,250,894 $ 23,358,099 $ 91,013,624 $ 93,857,772 $ 91,517,979 $ 636,628,806 $ 1,348,287,014

96
March 31, 2006
Financial instruments
1~30 days Amount
(recoverable amount or repayment
amount)
1~30 days Amount
(recoverable amount or repayment
amount)
1~30 days Amount
(recoverable amount or repayment
amount)
1~30 days Amount
(recoverable amount or repayment
amount)
1~30 days Amount
(recoverable amount or repayment
amount)
1~30 days Amount
(recoverable amount or repayment
amount)
1~30 days Amount
(recoverable amount or repayment
amount)
1~30 days Amount
(recoverable amount or repayment
amount)
1~30 days Amount
(recoverable amount or repayment
amount) Liabilities
Non-derivative financial instruments Due to Central Bank $ 213,255 $ - $ - $ - $ - $ - $ - $ - $ 213,255 Due to other banks 39,291,792 51,592,378 44,682,765 - 78,000 - - - 135,644,935 Bills and bonds payable under
repurchase agreements 10,245,981 3,319,000 2,026,000 - - - - - 15,590,981 Funds borrowed to Central Bank and other banks 231,559 - - - - - - - 231,559
Deposits and remittances 227,906,969 193,218,826 436,067,284 155,309,000 122,389,000 - - - 1,134,891,079 Financial liabilities designated
for trading purpose - - - 7,924,638 7,344,787 - 5,122,022- 13,870,223 34,261,670 Financial bonds payable - - - 4,998,344 12,495,860 - - 6,497,847 23,992,051 Derivative financial instruments -
Non-hedging Interest rate swaptions written 59 - - - - - - 59 Bond options written 4,471 - - - - - - 4,471 Cross currency swaps contracts
(excluding the notional principal) - - - - 175,134 - 17,767 114,656 307,557
Interest rate related contracts (interest rate swaps and asset swaps excluding the principal of bonds) - 7,366 8,724 57,898 167,201 279,381 976,954 315,303 1,812,827
Hedging Interest rate related contracts
(interest rate swaps and asset swaps excluding the principal of bonds) - - - - - 6,751 - 188,177 194,928
Total liabilities $ 277,894,086 $ 248,137,570 $ 482,784,773 $ 168,289,880 $ 142,649,982 $ 286,132 $ 6,116,743 $ 20,986,206 $ 1,347,145,372 Net liquidity gap ($ 146,947,826) ($ 132,423,990) ($ 317,533,879) ($ 144,931,781) ($ 51,636,358) $ 93,571,640 $ 85,401,236 $ 615,642,600 $ 1,141,642
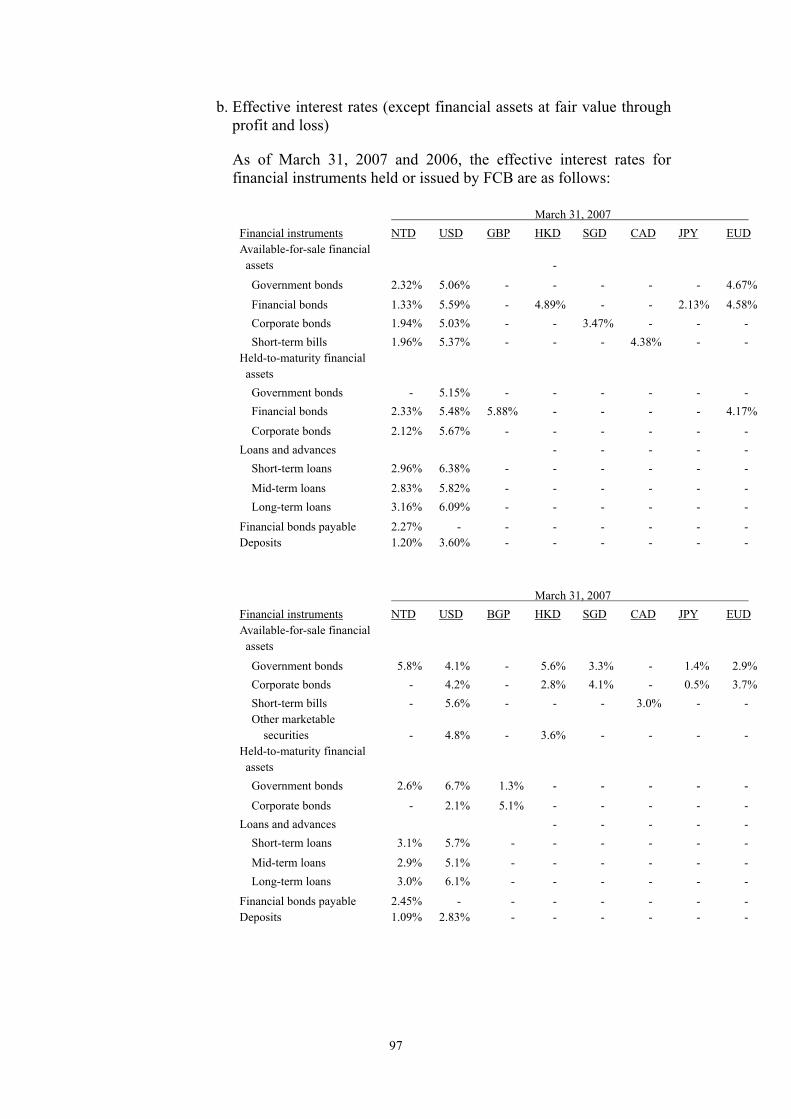
97
b. Effective interest rates (except financial assets at fair value through profit and loss)
As of March 31, 2007 and 2006, the effective interest rates for financial instruments held or issued by FCB are as follows:
March 31, 2007 Financial instruments NTD USD GBP HKD SGD CAD JPY EUD Available-for-sale financial
assets -
Government bonds 2.32% 5.06% - - - - - 4.67%
Financial bonds 1.33% 5.59% - 4.89% - - 2.13% 4.58%Corporate bonds 1.94% 5.03% - - 3.47% - - - Short-term bills 1.96% 5.37% - - - 4.38% - -
Held-to-maturity financial assets
Government bonds - 5.15% - - - - - - Financial bonds 2.33% 5.48% 5.88% - - - - 4.17%
Corporate bonds 2.12% 5.67% - - - - - - Loans and advances - - - - -
Short-term loans 2.96% 6.38% - - - - - -
Mid-term loans 2.83% 5.82% - - - - - - Long-term loans 3.16% 6.09% - - - - - -
Financial bonds payable 2.27% - - - - - - - Deposits 1.20% 3.60% - - - - - -
March 31, 2007 Financial instruments NTD USD BGP HKD SGD CAD JPY EUD Available-for-sale financial
assets
Government bonds 5.8% 4.1% - 5.6% 3.3% - 1.4% 2.9%Corporate bonds - 4.2% - 2.8% 4.1% - 0.5% 3.7%Short-term bills - 5.6% - - - 3.0% - - Other marketable
securities - 4.8% - 3.6% - - - - Held-to-maturity financial
assets Government bonds 2.6% 6.7% 1.3% - - - - -
Corporate bonds - 2.1% 5.1% - - - - - Loans and advances - - - - -
Short-term loans 3.1% 5.7% - - - - - -
Mid-term loans 2.9% 5.1% - - - - - - Long-term loans 3.0% 6.1% - - - - - -
Financial bonds payable 2.45% - - - - - - - Deposits 1.09% 2.83% - - - - - -

98
FTSI and its subsidiaries
A) Credit risk
a. Financial instruments held by FTSI may expose to losses if counterparties are not able to fulfill their obligations at the maturity date. FTSI deposits its cash in different financial institutions to control risk. The maximum exposure risk of the financial assets is for those with the positive fair value at the balance sheet date. FTSI always pre-evaluates the counterparty’s credit and updates periodically. It predetermines the credit limit of each counterparty to control credit limit. Thus, no significant credit risk is expected. Besides, FTSI does not offer any financial guarantees.
FFI, FTSI’s subsidiary, invests in open-end funds, and the counterparty is a financial institution with a good credit rating. Hence, the credit risk is low.
b. First Future Inc. (FFI) is a futures commission merchant. Credit risk is the main risk as clients fail to pay margin calls. FFI is commissioned to trade futures and daily update the margin deposit based on each client’s transactions. When it is necessary, FFI requires clients to add margin call or reduce the amount of trading to control credit limit.
c. Information for significant concentration of credit risk.
Significant concentration of credit risk refers to the following situations: (a) financial instrument transactions significantly concentrate on few counterparties; or (b) although it does not meet situation (a), most of the counterparties engage in similar business activities and have similar economic nature, which make their debt-servicing capability affected by similar economic conditions. FTSI has no such situations.
B) Market risk
a. FTSI undertakes options transactions, in which the counterparty has the right to purchase a convertible corporate bond at a strike price during a specific period. FTSI has no significant market risk for such transactions as it has already held those convertible corporate bonds through the underwriting or proprietary trading activities.
b. FTSI holds a short position after issuing warrants. Such a position has the potential market risk that warrant holders may exercise such warrants before maturity arising from changes in fair value of the underlying securities. Based on the conservatism principle, FTSI reduce such risk by hedging activity.

99
c. FTSI undertakes futures transactions of index options and stock index options in the domestic futures market. Prices of those futures fluctuate with the stock market. FTSI has set and complied with a stop-loss point, so it does not expect the significant market risk.
d. FTSI undertakes bonds options trading, and the primary risk comes from the values of option fluctuate with the market interest rate. FTSI has no significant market risk, as each option has been set up a stop-loss point and its changes in the fair value are controlled under the predetermined limit
e. Financial assets held by FTSI for trading purposes are stocks listed on the Taiwan Stock Exchange or the GreTai Securities Market, open-end funds, convertible corporate bonds, and government bonds. Values of those assets fluctuate with the market interest rate and stock price. FTSI controlled the market risk by position limit management, an investment review, and a stop loss mechanism.
f. FTSL undertakes asset swaps and options trading, and the holders of those options have the right to purchase a convertible corporate bond at a strike price during a specific period. FTSL periodically evaluates the theoretical price for those trading positions
C) Cash flow risk arising from changes in interest rates
FTSI’s borrowings are renewable loans or short-term commercial paper. Future cash flows of those borrowings may fluctuate with the market interest rate, and thus it exposes FTSI to interest rate risk.
D) Liquidity risk
FTSI has no liquidity risk arising from insolvency due to its sufficient working capital. There is no active market or limited trade volume for partial financial instruments such as unlisted stocks, corporate bonds and financial bonds held by FTSI, so FTSI has liquidity risk. However, FTSI does not expect to dispose of those investments in short-term and has sufficient working capital; FTSI has no significant cash flow risk.
NITC and its subsidiary
A) Market risk
NITC engages in beneficiary certificate transactions, whose primary market risk comes from price changes in those instruments. NITC has no significant market risk, as each mutual fund has been set up a stop-loss point and its changes in the fair value are controlled under the predetermined limit.

100
B) Credit risk
All counterparties of NITC are mutual funds managed by NITC. The possibility of those counterparties to default is insignificant, as those funds have offer prices in an open market. Book value of financial assets with credit risk held by NITC can reflect credit exposures after deducting a proper valuation allowance, and thus the credit exposure information is not separately disclosed. NITC does not provide financial guarantees for anyone.
C) Liquidity risk
NITC has no liquidity risk arising from insolvency due to its sufficient working capital. There is an active market for open-end beneficiary certificates held by NITC, so those certificates can be sold at fair value promptly.
D) Cash flow risk arising from changes in interest rates
NITC has no cash flow risk arising from changes in interest rates, since it does not hold any interest-rate-linked products.
H. Fair value hedge and cash flow hedge
A) Fair value hedge
Fair values of fixed-rate loans held by overseas branches of FCB may fluctuate with changes in interest rates. FCB had assessed that the risk may be significant, so FCB hedged such risk by interest rate swap contracts.
Designated hedging instruments Fair value
Hedged item Designated hedging instruments March 31, 2007 Fixed-rate loans Interest rate swap contracts $ 3,584 Fixed-rate loans Interest rate swap contracts ( 185,016 ) ( $ 181,432 )
B) Cash flow hedge
Future cash flows of floating rate bonds issued by the Company may fluctuate due to changes in interest rates. Thus, those bonds may expose the Company to the cash flow risk. The Company has entered into the interest rate swap contract to hedge such risk, as the potential risk may be significant.

101
Designated hedging instruments
Hedged item
Designated hedging
instruments
Fair value
March 31, 2007
Expected period
for cash flows
Expected period for related profit and loss
recognized in statement
of income Assets (Liabilities)
NT dollar-denominated
corporate bonds payable
Interest rate swap
contracts $ 299,675 2006~2011 2006~2011
As of the three months ended March 31, 2007, $299,675 was recognized directly in the stockholders’ equity.
2) Capital adequacy ratio: Non applicable.
3) Disclosures of total amounts or ratios with respect to credit extensions, endorsements, or other transactions undertaken by a financial holding company and its subsidiaries for the same individual, the same related individual, or the same affiliated enterprises in accordance with Article 46 of the "Financial Holding Company Act": Non applicable.
4) Significant impact arising from changes in government laws and regulations: None
5) Information for discontinued operations: None
6) Major operating assets or liabilities transferred from (or to) other financial institutions: None
7) Allocation of expenses between the Company and its subsidiaries and among subsidiaries:
For the three months ended March 31, 2007, the allocation of expenses for operating equipment and office spaces among the Company and its subsidiaries are as follows:
Company Name Expenses recognized by the Company
Allocated party
Allocated amount Basis of allocation
FFHC Rental expenses FCB $ 1,749 Allocated by the space occupancy pursuant to the lease contracts
FFHC Utility expenses FCB 181 Allocated by the utility usage and space occupancy
FFHC Building administration
expenses
FCB 126 Allocated by the space occupancy pursuant to the lease contracts.
FTSI Building administration
expenses
FCB 6,876 Allocated by the space occupancy pursuant to the lease contracts.
8) Information for private placement securities: None
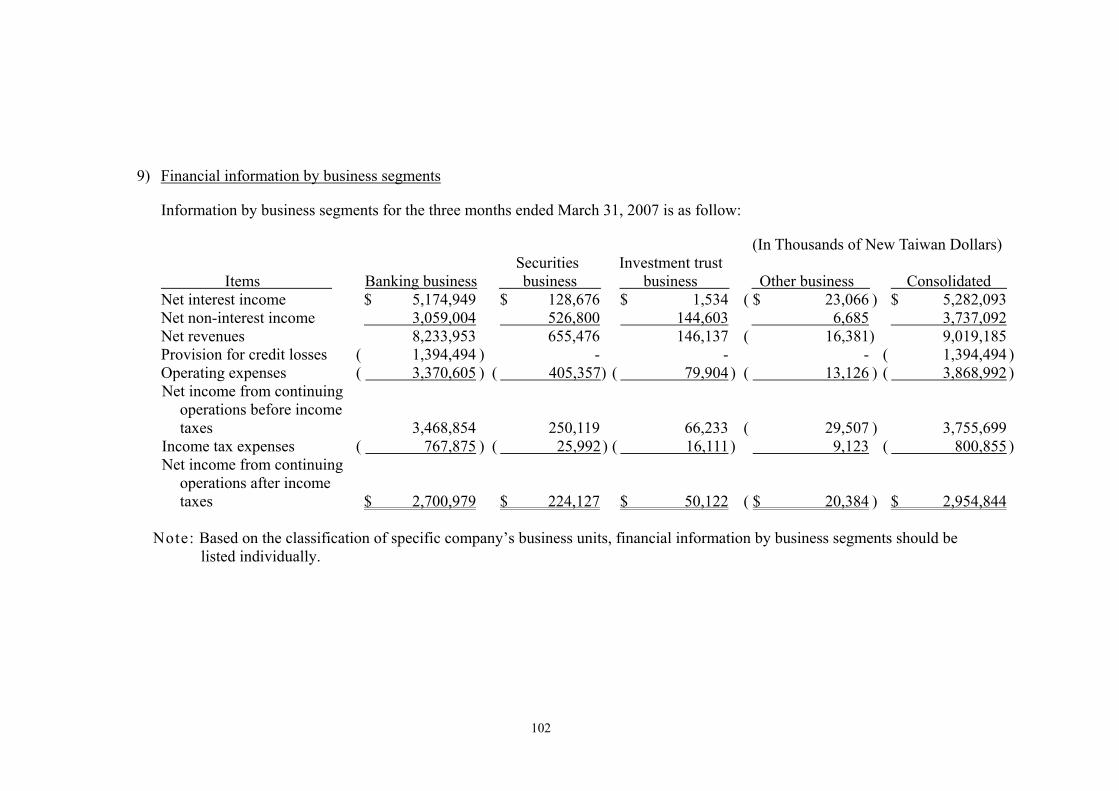
102
9) Financial information by business segments
Information by business segments for the three months ended March 31, 2007 is as follow:
(In Thousands of New Taiwan Dollars)
Items Banking business Securities business
Investment trust business Other business Consolidated
Net interest income $ 5,174,949 $ 128,676 $ 1,534 ( $ 23,066 ) $ 5,282,093 Net non-interest income 3,059,004 526,800 144,603 6,685 3,737,092 Net revenues 8,233,953 655,476 146,137 ( 16,381) 9,019,185 Provision for credit losses ( 1,394,494 ) - - - ( 1,394,494 ) Operating expenses ( 3,370,605 ) ( 405,357 ) ( 79,904 ) ( 13,126 ) ( 3,868,992 ) Net income from continuing
operations before income taxes 3,468,854 250,119 66,233 ( 29,507 ) 3,755,699
Income tax expenses ( 767,875 ) ( 25,992 ) ( 16,111 ) 9,123 ( 800,855 ) Net income from continuing
operations after income taxes $ 2,700,979 $ 224,127 $ 50,122 ( $ 20,384 ) $ 2,954,844
Note: Based on the classification of specific company’s business units, financial information by business segments should be
listed individually.
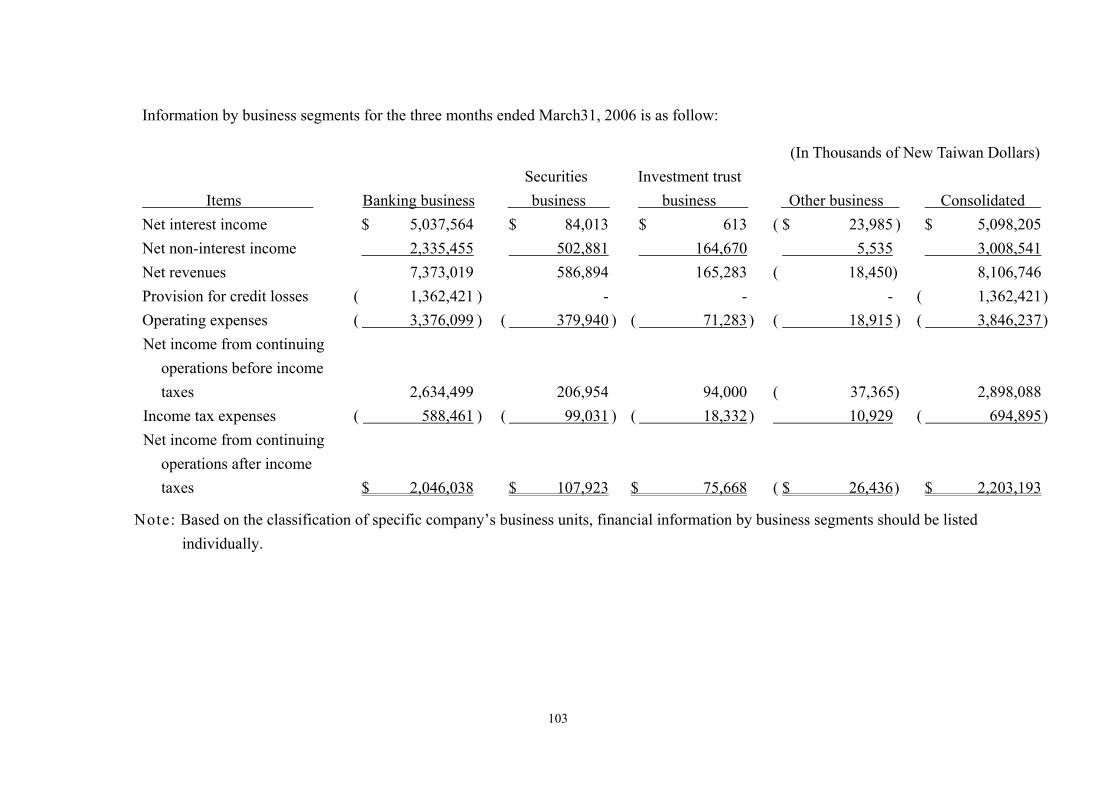
103
Information by business segments for the three months ended March31, 2006 is as follow:
(In Thousands of New Taiwan Dollars)
Items Banking business Securities business
Investment trust business Other business Consolidated
Net interest income $ 5,037,564 $ 84,013 $ 613 ( $ 23,985 ) $ 5,098,205 Net non-interest income 2,335,455 502,881 164,670 5,535 3,008,541 Net revenues 7,373,019 586,894 165,283 ( 18,450) 8,106,746 Provision for credit losses ( 1,362,421 ) - - - ( 1,362,421 ) Operating expenses ( 3,376,099 ) ( 379,940 ) ( 71,283 ) ( 18,915 ) ( 3,846,237 ) Net income from continuing
operations before income taxes 2,634,499 206,954 94,000 ( 37,365) 2,898,088
Income tax expenses ( 588,461 ) ( 99,031 ) ( 18,332 ) 10,929 ( 694,895 ) Net income from continuing
operations after income taxes $ 2,046,038 $ 107,923 $ 75,668 ( $ 26,436 ) $ 2,203,193
Note: Based on the classification of specific company’s business units, financial information by business segments should be listed individually.
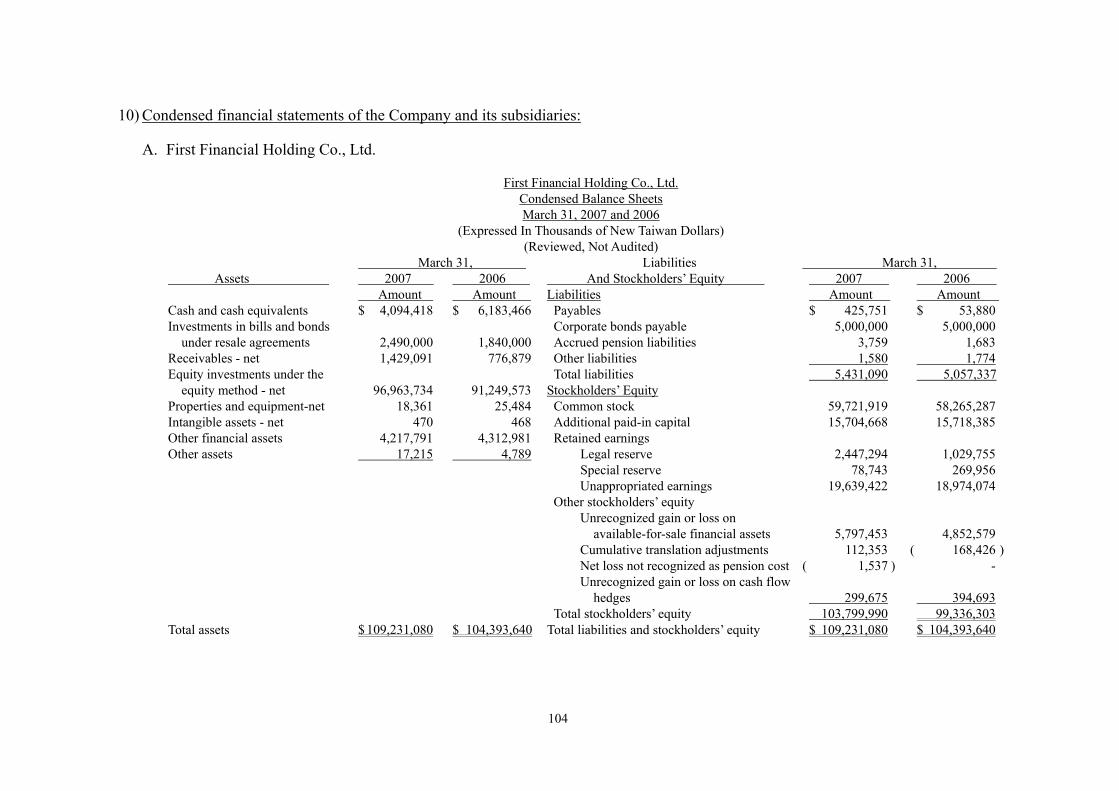
104
10) Condensed financial statements of the Company and its subsidiaries:
A. First Financial Holding Co., Ltd.
First Financial Holding Co., Ltd. Condensed Balance Sheets March 31, 2007 and 2006
(Expressed In Thousands of New Taiwan Dollars) (Reviewed, Not Audited)
March 31, Liabilities March 31, Assets 2007 2006 And Stockholders’ Equity 2007 2006
Amount Amount Liabilities Amount Amount Cash and cash equivalents $ 4,094,418 $ 6,183,466 Payables $ 425,751 $ 53,880 Investments in bills and bonds Corporate bonds payable 5,000,000 5,000,000
under resale agreements 2,490,000 1,840,000 Accrued pension liabilities 3,759 1,683 Receivables - net 1,429,091 776,879 Other liabilities 1,580 1,774 Equity investments under the Total liabilities 5,431,090 5,057,337
equity method - net 96,963,734 91,249,573 Stockholders’ Equity Properties and equipment-net 18,361 25,484 Common stock 59,721,919 58,265,287 Intangible assets - net 470 468 Additional paid-in capital 15,704,668 15,718,385 Other financial assets 4,217,791 4,312,981 Retained earnings Other assets 17,215 4,789 Legal reserve 2,447,294 1,029,755 Special reserve 78,743 269,956 Unappropriated earnings 19,639,422 18,974,074 Other stockholders’ equity Unrecognized gain or loss on
available-for-sale financial assets 5,797,453 4,852,579 Cumulative translation adjustments 112,353 ( 168,426 ) Net loss not recognized as pension cost ( 1,537 ) - Unrecognized gain or loss on cash flow
hedges 299,675 394,693 Total stockholders’ equity 103,799,990 99,336,303 Total assets $ 109,231,080 $ 104,393,640 Total liabilities and stockholders’ equity $ 109,231,080 $ 104,393,640
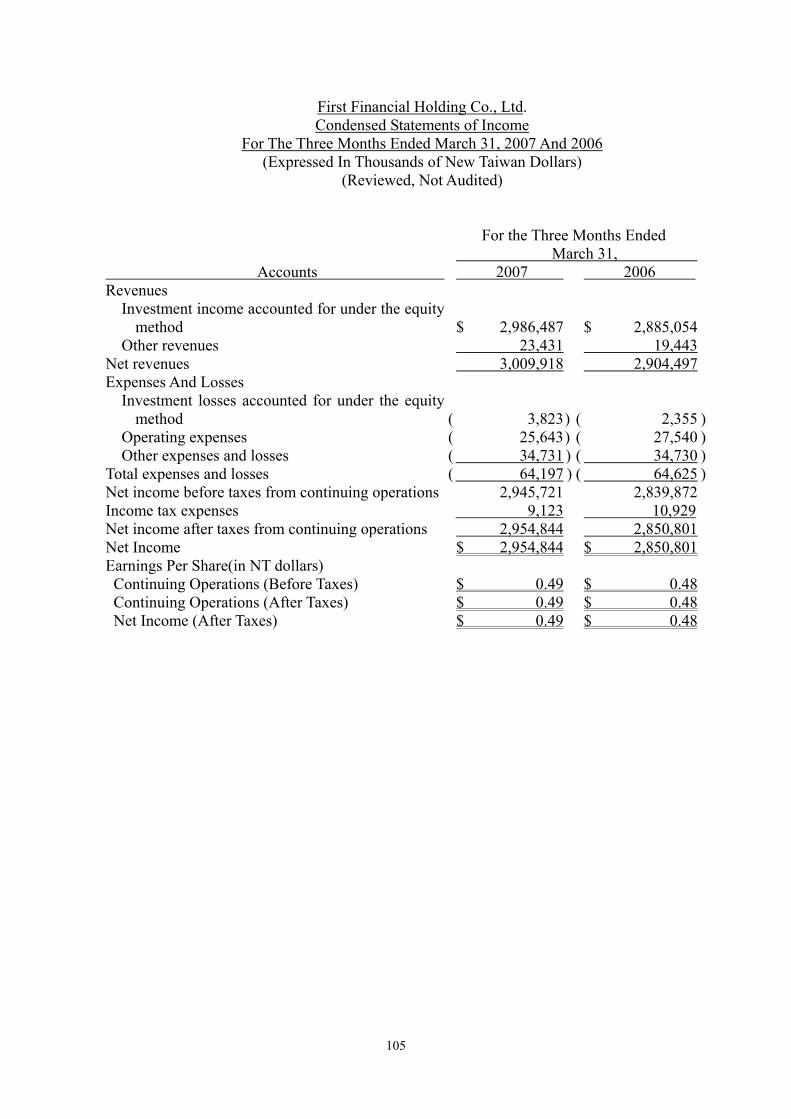
105
First Financial Holding Co., Ltd. Condensed Statements of Income
For The Three Months Ended March 31, 2007 And 2006 (Expressed In Thousands of New Taiwan Dollars)
(Reviewed, Not Audited)
For the Three Months Ended March 31,
Accounts 2007 2006 Revenues Investment income accounted for under the equity
method $ 2,986,487 $ 2,885,054 Other revenues 23,431 19,443Net revenues 3,009,918 2,904,497Expenses And Losses Investment losses accounted for under the equity
method ( 3,823 ) ( 2,355 ) Operating expenses ( 25,643 ) ( 27,540 ) Other expenses and losses ( 34,731 ) ( 34,730 )Total expenses and losses ( 64,197 ) ( 64,625 )Net income before taxes from continuing operations 2,945,721 2,839,872Income tax expenses 9,123 10,929 Net income after taxes from continuing operations 2,954,844 2,850,801Net Income $ 2,954,844 $ 2,850,801Earnings Per Share(in NT dollars)
Continuing Operations (Before Taxes) $ 0.49 $ 0.48Continuing Operations (After Taxes) $ 0.49 $ 0.48Net Income (After Taxes) $ 0.49 $ 0.48
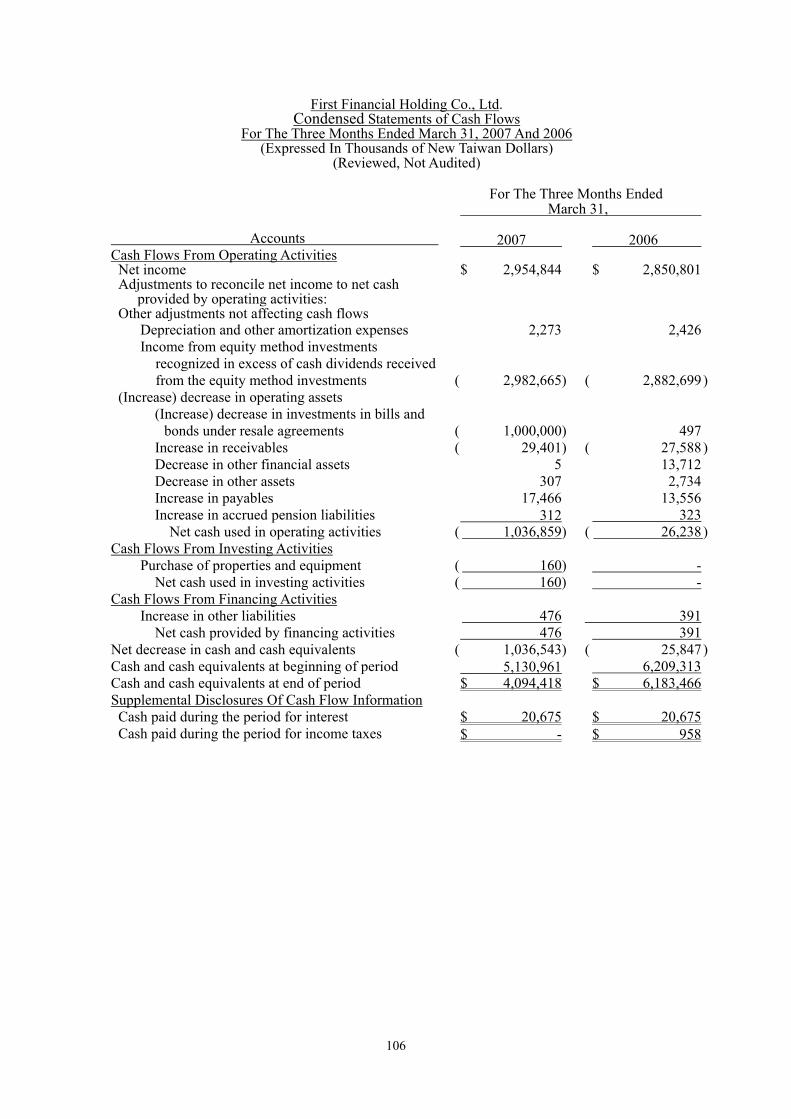
106
First Financial Holding Co., Ltd. Condensed Statements of Cash Flows
For The Three Months Ended March 31, 2007 And 2006 (Expressed In Thousands of New Taiwan Dollars)
(Reviewed, Not Audited) For The Three Months Ended
March 31,
Accounts 2007 2006 Cash Flows From Operating Activities Net income $ 2,954,844 $ 2,850,801 Adjustments to reconcile net income to net cash
provided by operating activities: Other adjustments not affecting cash flows Depreciation and other amortization expenses 2,273 2,426 Income from equity method investments
recognized in excess of cash dividends received from the equity method investments ( 2,982,665) ( 2,882,699 )
(Increase) decrease in operating assets (Increase) decrease in investments in bills and
bonds under resale agreements ( 1,000,000) 497 Increase in receivables ( 29,401) ( 27,588 ) Decrease in other financial assets 5 13,712 Decrease in other assets 307 2,734 Increase in payables 17,466 13,556 Increase in accrued pension liabilities 312 323 Net cash used in operating activities ( 1,036,859) ( 26,238 )Cash Flows From Investing Activities Purchase of properties and equipment ( 160) - Net cash used in investing activities ( 160) -Cash Flows From Financing Activities Increase in other liabilities 476 391 Net cash provided by financing activities 476 391Net decrease in cash and cash equivalents ( 1,036,543) ( 25,847 )Cash and cash equivalents at beginning of period 5,130,961 6,209,313Cash and cash equivalents at end of period $ 4,094,418 $ 6,183,466Supplemental Disclosures Of Cash Flow Information Cash paid during the period for interest $ 20,675 $ 20,675 Cash paid during the period for income taxes $ - $ 958

107
B. FCB FCB
Condensed Balance Sheets March 31, 2007 And 2006
(Expressed In Thousands of New Taiwan Dollars) (Reviewed, Not Audited)
March 31, Liabilities March 31, Assets 2007 2006 And Stockholders’ Equity 2007 2006
Amount Amount Liabilities Amount Amount Cash and cash equivalents $ 37,174,824 $ 22,518,024 Due to Central Bank and other banks $ 114,736,730 $ 135,858,190Due from Central Bank and other
banks 147,823,262 134,775,989Funds borrowed from Central Bank and
other banks 169,731 231,559Financial assets at fair value
through profit or loss - net 44,565,886 41,002,978Financial liabilities at fair value through
profit or loss 53,325,320 36,646,507 Receivables - net 21,778,403 19,542,004
Bills and bonds payable under repurchase agreements
10,403,746 15,590,981
Bills discounted and loans - net 984,149,161 874,046,566 Payables 46,739,745 34,754,595Available-for-sale financial
assets - net 74,999,466 88,193,978 Deposits and remittances 1,225,939,116 1,134,891,079Held-to-maturity financial
assets-net 201,474,543 227,192,836 Financial bonds payable 20,500,000 23,992,051Equity investments accounted for
under the equity method 2,451,181 2,325,558 Accrued pension liabilities 1,427,625 1,352,405Other financial assets-net 16,673,076 28,606,271 Other financial liabilities 518,984 6,557,019Properties, plants and equipment 23,215,617 23,706,226 Other liabilities 8,503,844 8,639,483Intangible assets 376,290 280,087 Total liabilities 1,482,264,841 1,398,513,869Other assets 17,070,450 20,541,853 Stockholders’ Equity Common stock 46,216,000 46,216,000 Additional paid-in capital 8,660,326 8,660,326 Retained earnings Legal reserve 6,055,815 2,990,128 Unappropriated earnings 16,861,762 15,852,126 Other stockholders’ equity Reserves for land appraisal increments 5,514,101 5,527,648 Cumulative translation adjustments 384,721 122,611 Unrecognized gain or loss on financial
instruments 5,794,593 4,849,662 Total stockholders’ equity 89,487,318 84,218,501
Total assets $ 1,571,752,159 $ 1,482,732,370Total liabilities and
stockholders’ equity $ 1,571,752,159 $ 1,482,732,370

108
FCB Condensed Statements Of Income
For The Three Months Ended March 31, 2007 And 2006 (Expressed In Thousands of New Taiwan Dollars)
(Reviewed, Not Audited)
For The Three Months Ended March 31,
Accounts 2007 2006 Net interest income $ 5,174,949 $ 5,037,564Net non-interest income 3,059,004 2,335,455Net revenues 8,233,953 7,373,019Prevision for credit losses ( 1,394,494 ) ( 1,362,421)Operating expenses ( 3,370,605 ) ( 3,376,099)Income from continuing operations before income taxes 3,468,854 2,634,499Income tax expenses ( 767,875 ) ( 588,461)Income from continuing operations after income taxes 2,700,979 2,046,038Cumulative effect of a change in accounting principle - 564,643Net income $ 2,700,979 $ 2,610,681Earnings per share (in NT dollars)
Continuing operations (Before taxes) $ 0.75 $ 0.57Continuing operations (After taxes) $ 0.58 $ 0.44Cumulative effect of a change in accounting
principle(After taxes) $ - $ 0.12 Net income(After taxes) $ 0.58 $ 0.56

109
C. FTSI and its subsidiaries
FTSI And Its Subsidiaries Condensed Consolidated Balance Sheets
March 31, 2007 and 2006 (Expressed In Thousands of New Taiwan Dollars)
(Reviewed, Not Audited)
March 31, Liabilities And March 31, Assets 2007 2006 Stockholders’ Equity 2007 2006
Amount Amount Liabilities Amount Amount Current assets $ 17,453,847 $ 13,744,962 Current liabilities $ 10,318,872 $ 7,363,059 Funds and investments 107,646 105,695 Long-term liabilities 2,295,200 1,793,186 Properties, plants and equipment - net 315,560 377,324 Other liabilities 235,282 221,558 Intangible assets 17,606 12,079 Credit items for securities Other assets 922,989 996,393 consignment trading - net - 10,193 Debit items for securities Total liabilities 12,849,354 9,387,996
consignment trading - net 94,219 - Stockholders’ Equity Common stock 5,000,000 5,000,000 Additional paid-in capital 5,600 5,600 Retained earnings 1,078,071 880,939 Other stockholders’ equity ( 21,158 ) ( 38,082 ) Total stockholders’ equity 6,062,513 5,848,457
Total assets $ 18,911,867 $ 15,236,453 Total liabilities and
stockholders’ equity $ 18,911,867 $ 15,236,453

110
FTSI And Its Subsidiaries Condensed Consolidated Statements of Income
For The Three Months Ended March 31, 2007 And 2006 (Expressed In Thousands of New Taiwan Dollars)
(Reviewed, Not Audited) ( For The Three Months Ended
March 31, Accounts 2007 2006 Revenues $ 787,689 $ 620,757 Expenses ( 537,570 ) ( 413,803 )Net income from continuing operations before
income taxes 250,119 206,954 Income taxes ( 25,992 ) ( 99,031 )Net income from continuing operations after income taxes 224,127 107,923 Cumulative effect of a change in accounting principle - 81,867 Net income after income taxes $ 224,127 $ 189,790 Earnings per share (in NT dollars) Continuing operations (Before taxes) $ 0.50 $ 0.41 Continuing operations (After taxes) $ 0.45 $ 0.22 Cumulative effect of a change in accounting
principle(After taxes) $ - $ 0.16 Net income(After taxes) $ 0.45 $ 0.38

111
D. NITC and its subsidiaries
NITC And Its Subsidiaries Condensed Consolidated Balance Sheets
March 31, 2007 And 2006 (Expressed In Thousands of New Taiwan Dollars)
(Reviewed, Not Audited)
March 31, Liabilities And March 31, Assets 2007 2006 Stockholders’ Equity 2007 2006
Amount Amount Liabilities Amount Amount Current assets $ 419,979 $ 230,393 Current liabilities $ 142,461 $ 159,861Equity investments Other liabilities 26,478 18,473 accounted for
under the equity method 11,096 10,469 Total liabilities 168,939 178,334
Properties, plant and Stockholders’ Equity equipment-net 529,496 575,479 Common stock 600,000 600,000
Other assets 240,629 190,656 Retained earnings 435,055 234,232 Other stockholders’ equity ( 2,794 )( 5,569 )
Total stockholders’
equity 1,032,261 828,663
Total assets $ 1,201,200 $ 1,006,997
Total liabilities and stockholders’ equity $ 1,201,200 $ 1,006,997
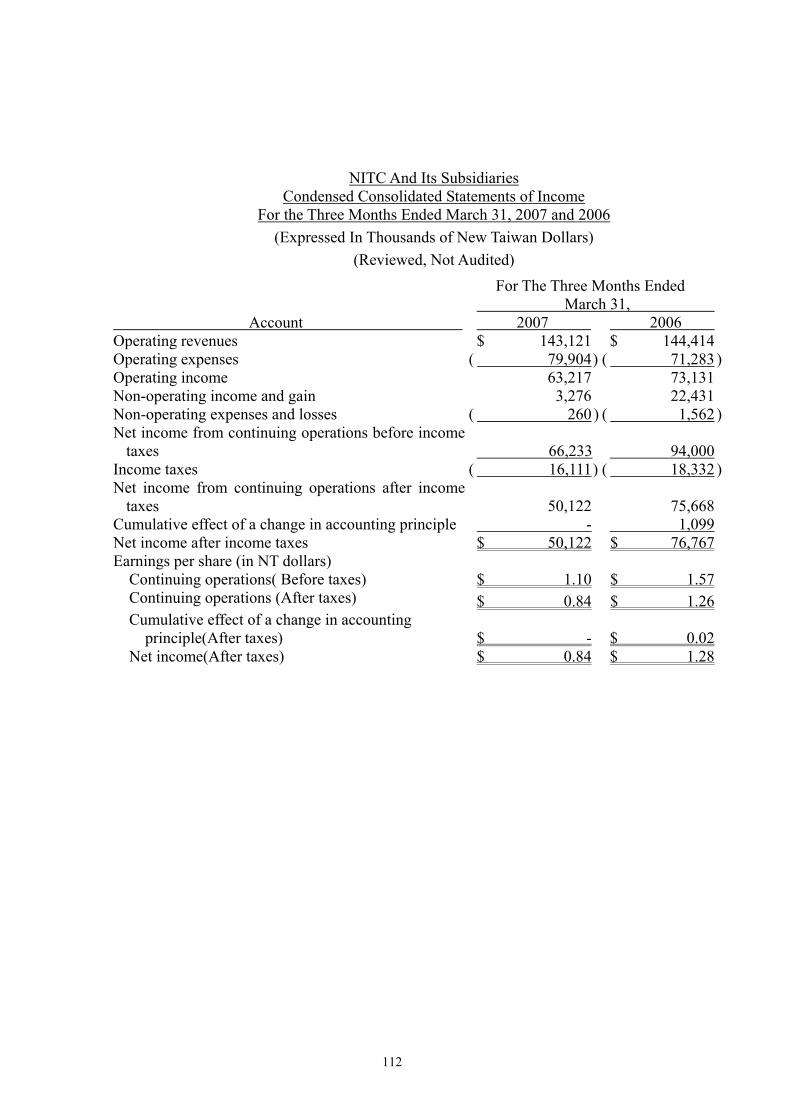
112
NITC And Its Subsidiaries
Condensed Consolidated Statements of Income For the Three Months Ended March 31, 2007 and 2006
(Expressed In Thousands of New Taiwan Dollars) (Reviewed, Not Audited)
For The Three Months Ended March 31,
Account 2007 2006 Operating revenues $ 143,121 $ 144,414Operating expenses ( 79,904 ) ( 71,283 )Operating income 63,217 73,131Non-operating income and gain 3,276 22,431Non-operating expenses and losses ( 260 ) ( 1,562 )Net income from continuing operations before income
taxes 66,233 94,000Income taxes ( 16,111 ) ( 18,332 )Net income from continuing operations after income
taxes 50,122 75,668 Cumulative effect of a change in accounting principle - 1,099Net income after income taxes $ 50,122 $ 76,767 Earnings per share (in NT dollars)
Continuing operations( Before taxes) $ 1.10 $ 1.57 Continuing operations (After taxes) $ 0.84 $ 1.26
Cumulative effect of a change in accounting principle(After taxes) $ - $ 0.02
Net income(After taxes) $ 0.84 $ 1.28

113
11) Profitability, asset quality, management information, and liquidity and market risk sensitivity of subsidiaries:
FCB:
A. Profitability
March 31,
2007 2006
Before taxes 0.22 0.18Return on total assets (%) After taxes 0.17 0.17Before taxes 3.93 3.27Return on stockholders’ equity (%) After taxes 3.06 3.24
Net profit margin ratio (%) 32.80 35.41
Note 1: Return on total assets = Income before (after) income taxes / average total assets.
Note 2: Return on stockholders’ equity = Income before (after) income taxes / average stockholders’ equity.
Note 3: Net profit margin ratio = Income after income taxes / net revenues.
Note 4: The term “Income before (after) income taxes” means net income from January 1 to the balance sheet date of the reporting period.
B. Loan asset quality
(Expressed In Thousands of New Taiwan Dollars, %)
March 31, 2007
Items Amount
Non-performing loans / gross
loans (%) Non-performing loans A $ 13,413,120 1.35% Non-performing loans B 2,723,531 0.28% Gross non-performing loans 16,136,651 1.63%
March 31, 2006 Non-performing loans $ 11,953,938 1.36% Non-performing loan ratio (%) 3,359,127 0.38% Gross non-performing loans 15,313,065 1.74%
Note 1: The amount recognized as non-performing loans (NPLs) is in compliance with the “Regulations Governing the Procedures for Banking Institutions to Evaluate Assets and Deal with Non-performing / Non-accrual Loans“.
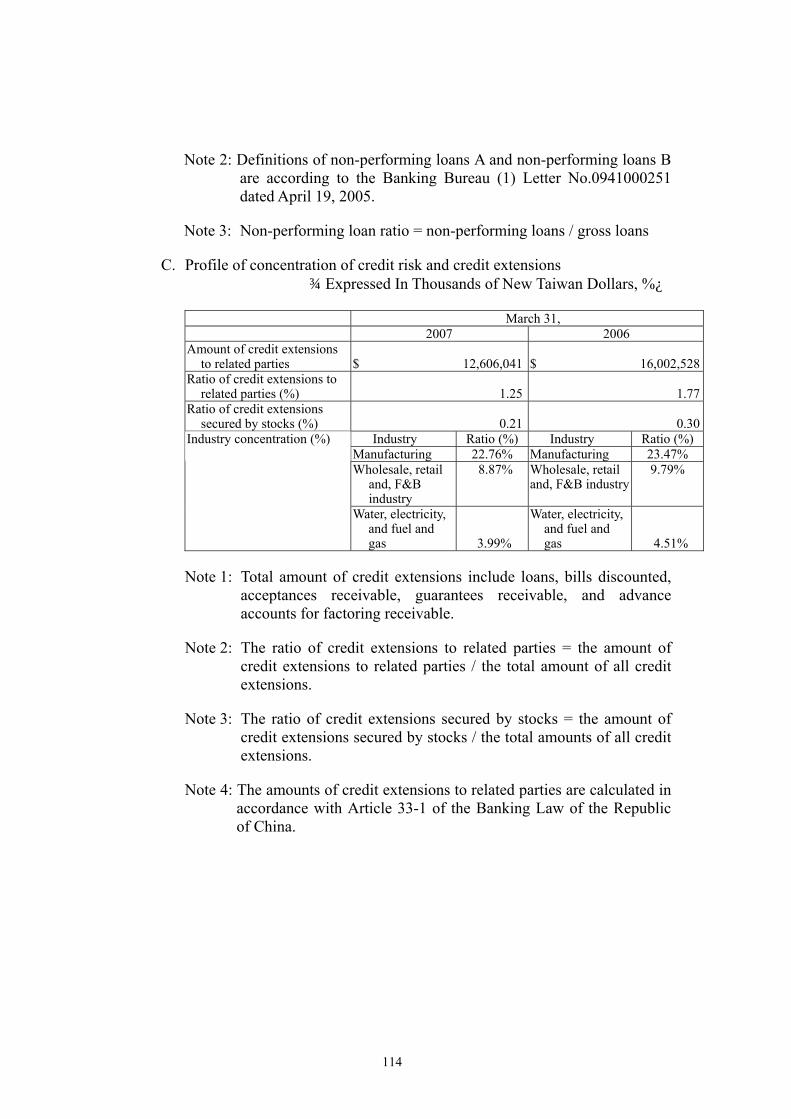
114
Note 2: Definitions of non-performing loans A and non-performing loans B are according to the Banking Bureau (1) Letter No.0941000251 dated April 19, 2005.
Note 3: Non-performing loan ratio = non-performing loans / gross loans
C. Profile of concentration of credit risk and credit extensions (Expressed In Thousands of New Taiwan Dollars, %)
March 31, 2007 2006 Amount of credit extensions
to related parties $ 12,606,041 $ 16,002,528Ratio of credit extensions to
related parties (%) 1.25 1.77Ratio of credit extensions
secured by stocks (%) 0.21 0.30 Industry Ratio (%) Industry Ratio (%)Manufacturing 22.76% Manufacturing 23.47% Wholesale, retail
and, F&B industry
8.87% Wholesale, retail and, F&B industry
9.79%
Industry concentration (%)
Water, electricity, and fuel and gas 3.99%
Water, electricity, and fuel and gas 4.51%
Note 1: Total amount of credit extensions include loans, bills discounted, acceptances receivable, guarantees receivable, and advance accounts for factoring receivable.
Note 2: The ratio of credit extensions to related parties = the amount of credit extensions to related parties / the total amount of all credit extensions.
Note 3: The ratio of credit extensions secured by stocks = the amount of credit extensions secured by stocks / the total amounts of all credit extensions.
Note 4: The amounts of credit extensions to related parties are calculated in accordance with Article 33-1 of the Banking Law of the Republic of China.
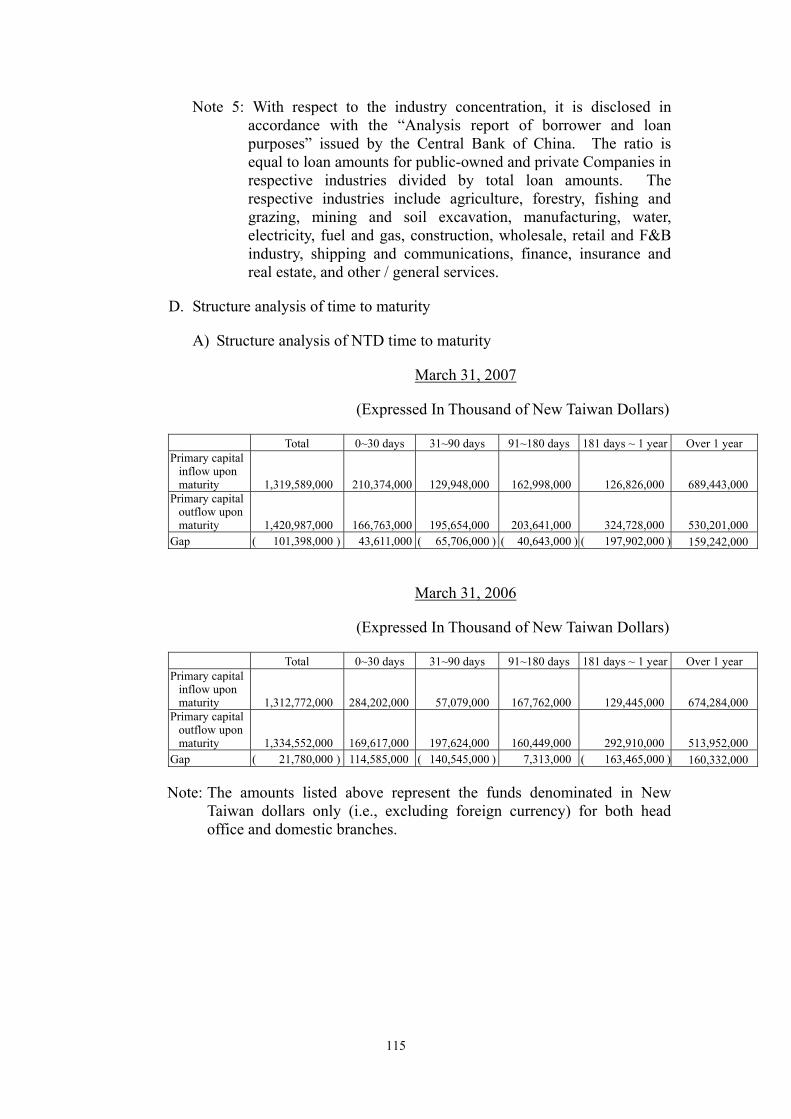
115
Note 5: With respect to the industry concentration, it is disclosed in accordance with the “Analysis report of borrower and loan purposes” issued by the Central Bank of China. The ratio is equal to loan amounts for public-owned and private Companies in respective industries divided by total loan amounts. The respective industries include agriculture, forestry, fishing and grazing, mining and soil excavation, manufacturing, water, electricity, fuel and gas, construction, wholesale, retail and F&B industry, shipping and communications, finance, insurance and real estate, and other / general services.
D. Structure analysis of time to maturity
A) Structure analysis of NTD time to maturity
March 31, 2007
(Expressed In Thousand of New Taiwan Dollars)
Total 0~30 days 31~90 days 91~180 days 181 days ~ 1 year Over 1 year Primary capital
inflow upon maturity 1,319,589,000 210,374,000 129,948,000 162,998,000 126,826,000 689,443,000
Primary capital outflow upon maturity 1,420,987,000 166,763,000 195,654,000 203,641,000 324,728,000 530,201,000
Gap ( 101,398,000 ) 43,611,000 ( 65,706,000 ) ( 40,643,000 ) ( 197,902,000 ) 159,242,000
March 31, 2006
(Expressed In Thousand of New Taiwan Dollars)
Total 0~30 days 31~90 days 91~180 days 181 days ~ 1 year Over 1 year Primary capital
inflow upon maturity 1,312,772,000 284,202,000 57,079,000 167,762,000 129,445,000 674,284,000
Primary capital outflow upon maturity 1,334,552,000 169,617,000 197,624,000 160,449,000 292,910,000 513,952,000
Gap ( 21,780,000 ) 114,585,000 ( 140,545,000 ) 7,313,000 ( 163,465,000 ) 160,332,000
Note: The amounts listed above represent the funds denominated in New Taiwan dollars only (i.e., excluding foreign currency) for both head office and domestic branches.

116
B) Structure analysis of USD time to maturity
March 31, 2007
(Expressed In Thousands of US Dollars)
Total 0~30 days 31~90 days 91~180 days 181 days ~ 1 year Over 1 year Primary capital inflow
upon maturity 7,185,580 2,565,411 1,637,842 1,427,264 367,112 1,187,951Primary capital
outflow upon maturity 7,203,811 3,720,098 1,106,987 974,952 721,608 680,166
Gap ( 18,231 ) ( 1,154,687) 530,855 452,312 ( 354,496 ) 507,785
March 31, 2006
(Expressed In Thousands of US Dollars)
Total 0~30 days 31~90 days 91~180 days 181 days ~ 1 year Over 1 year Primary capital inflow
upon maturity 3,863,000 802,000 1,611,000 1,104,000 298,000 47,000Primary capital
outflow upon maturity 5,669,000 3,974,000 726,000 455,000 514,000 -
Gap ( 1,806,000 ) ( 3,172,000) 885,000 649,000 ( 216,000 ) 47,000
E. Sensitivity analysis of interest rate for assets and liabilities
Sensitivity analysis of interest rate for assets and liabilities (NTD)
March 31, 2007
(Expressed In Thousands of New Taiwan Dollars,%)
Note: The amounts listed above represent the items denominated in New Taiwan dollars only (i.e., excluding foreign currency) for both head office and domestic branches and overseas branches.
Items 1~90 days91~180
days 181 days ~
1 year Over 1 year Total
Interest-rate-sensitive assets $ 880,140,00
$ 123,500,000
$ 41,209,000
$ 103,728,000
$ 1,148,577,000
Interest-rate-sensitive liabilities
319,669,000
106,829,000 50,795,000
1,040,724,000
Interest-rate-sensitive gap
560,471,000 ( 439,931,000( 65,620,000)
52,933,000
107,853,000
Total stockholders’ equity 89,487,318Ratio of interest-rate-sensitive assets to interest-rate-sensitive liabilities (%) 110.36%Ratio of interest-rate-sensitive gap to stockholders’ equity (%) 120.52%

117
Sensitivity analysis of interest rate for assets and liabilities (USD)
December 31, 2006
(Expressed in thousands of US dollars,%)
Note: The amounts listed above represent the items denominated in U.S. dollars for head office, domestic branches, Offshore Banking Units, and overseas branches, excluding contingent assets and contingent liabilities.
Sensitivity analysis of interest rate for assets and liabilities (NTD)
March 31, 2006
(Expressed In Thousands of New Taiwan Dollars,%)
Note: The amounts listed above represent the items denominated in New Taiwan dollars only (i.e., excluding foreign currency) for both head office and domestic branches and overseas branches.
Items 1~90 days 91~180 days 181 days ~
1 year Over 1
year Total Interest–rate-sensitive
assets $ 7,407,
000 $ 1,956,000$ 410,00
0$ 329,0
00 $ 10,102,000Interest–rate-sensitive
liabilities 7,002,000 2,682,000 502,000 18,000 10,204,000Interest-rate-sensitive
gap 405,000 ( 726,000)( 92,0
00) 311,000 ( 102,000)Total stockholders’ equity 2,705,588Ratio of interest–rate-sensitive assets to interest–rate-sensitive liabilities (%) 99.00%Ratio of interest–rate–sensitive gap to stockholders’ equity (%) -3.77%
Items 1~90 days 91~180 days181 days ~
1 year Over 1 year Total
Interest-rate-sensitive assets
$ 800,789,000
$ 125,070,000
$ 40,815,000
$ 175,106,000
$ 1,141,780,00
0Interest-rate-sensitive
liabilities 347,999,000 563,633,000 62,185,000 45,524,000 1,019,341,0
00Interest-rate-sensitive
gap 452,790,000( 438,563,000)
( 21,370,000) 129,582,000 122,439,000
Total stockholders’ equity 84,218,501Ratio of interest-rate-sensitive assets to interest-rate-sensitive liabilities (%) 112.01%Ratio of interest-rate-sensitive gap to stockholders’ equity (%) 145.38%

118
Sensitivity analysis of interest rate for assets and liabilities (USD)
December 31, 2006
(Expressed in thousands of US dollars,%)
Note: The amounts listed above represent the items denominated in U.S. dollars for head office, domestic branches, Offshore Banking Units, and overseas branches, excluding contingent assets and contingent liabilities.
Note 1: Interest-rate-sensitive assets and liabilities are those interest earned assets and interest bearing liabilities, revenues and costs of which are sensitive to change in interest rates.
Note 2: Ratio of interest-rate-sensitive assets to interest-rate-sensitive liabilities = Interest-rate-sensitive assets / interest-rate-sensitive liabilities (refer to NTD denominated interest-rate-sensitive assets and interest-rate-sensitive liabilities)
Note 3: Interest-rate-sensitive gap = Interest-rate-sensitive assets - interest-rate-sensitive liabilities.
F. Average value and average interest rates of interest-earning assets and interest-bearing liabilities.
Items 1~90 days 91~180 days181 days ~
1 year Over 1
year Total Interest–rate-sensitive
assets $ 6,910,00
0$ 1,522,00
0 $ 426,000$ 9,00
0 $ 8,867,000Interest–rate-sensitive
liabilities 7,941,000 675,000 655,000 - 9,271,000Interest-rate-sensitive
gap ( 1,031,000)
847,000 ( 229,00
0) 9,000 ( 404,000)Total stockholders’ equity 84,218,501Ratio of interest–rate-sensitive assets to interest–rate-sensitive liabilities (%) 95.64%Ratio of interest–rate–sensitive gap to stockholders’ equity (%) -0.48%
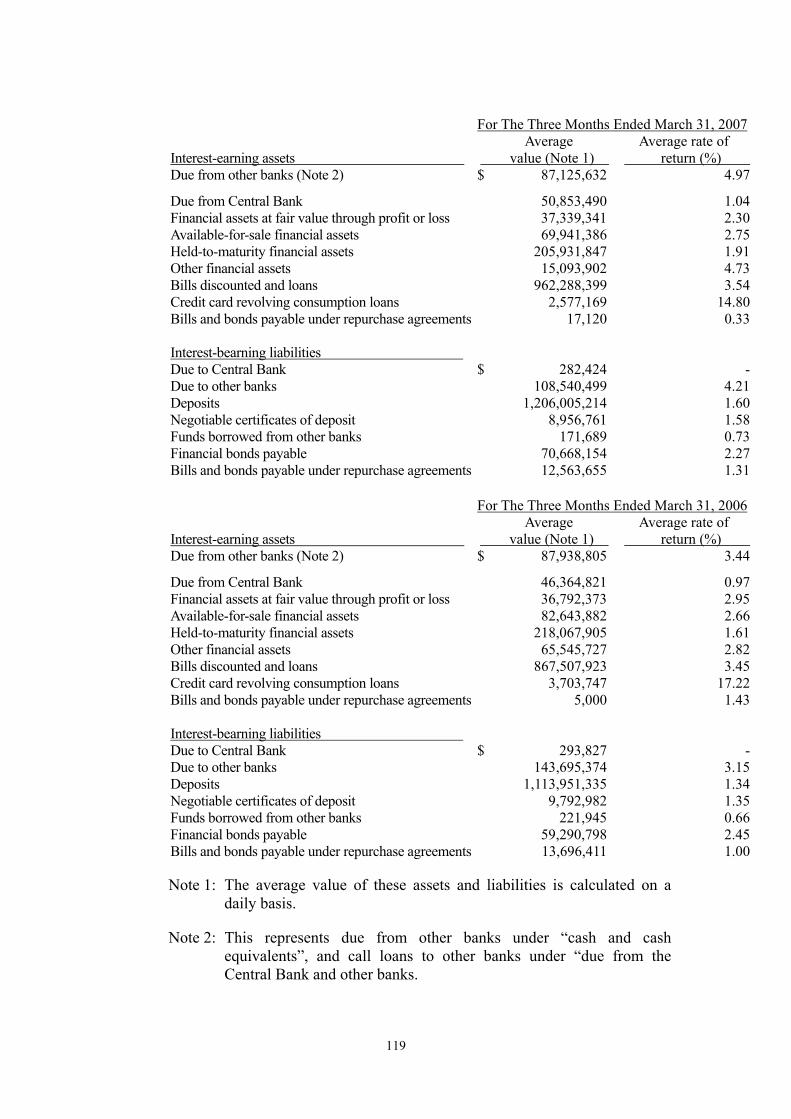
119
For The Three Months Ended March 31, 2007
Interest-earning assets Average
value (Note 1) Average rate of
return (%) Due from other banks (Note 2) $ 87,125,632 4.97
Due from Central Bank 50,853,490 1.04Financial assets at fair value through profit or loss 37,339,341 2.30Available-for-sale financial assets 69,941,386 2.75Held-to-maturity financial assets 205,931,847 1.91Other financial assets 15,093,902 4.73Bills discounted and loans 962,288,399 3.54Credit card revolving consumption loans 2,577,169 14.80Bills and bonds payable under repurchase agreements 17,120 0.33 Interest-bearning liabilities Due to Central Bank $ 282,424 -Due to other banks 108,540,499 4.21Deposits 1,206,005,214 1.60Negotiable certificates of deposit 8,956,761 1.58Funds borrowed from other banks 171,689 0.73Financial bonds payable 70,668,154 2.27Bills and bonds payable under repurchase agreements 12,563,655 1.31 For The Three Months Ended March 31, 2006
Interest-earning assets Average
value (Note 1) Average rate of
return (%) Due from other banks (Note 2) $ 87,938,805 3.44
Due from Central Bank 46,364,821 0.97Financial assets at fair value through profit or loss 36,792,373 2.95Available-for-sale financial assets 82,643,882 2.66Held-to-maturity financial assets 218,067,905 1.61Other financial assets 65,545,727 2.82Bills discounted and loans 867,507,923 3.45Credit card revolving consumption loans 3,703,747 17.22Bills and bonds payable under repurchase agreements 5,000 1.43 Interest-bearning liabilities Due to Central Bank $ 293,827 -Due to other banks 143,695,374 3.15Deposits 1,113,951,335 1.34Negotiable certificates of deposit 9,792,982 1.35Funds borrowed from other banks 221,945 0.66Financial bonds payable 59,290,798 2.45Bills and bonds payable under repurchase agreements 13,696,411 1.00
Note 1: The average value of these assets and liabilities is calculated on a daily basis.
Note 2: This represents due from other banks under “cash and cash equivalents”, and call loans to other banks under “due from the Central Bank and other banks.

120
G. Net position for major foreign currency transactions
March 31, 2007 March 31, 2006 Currency
(in thousands) NTD Currency
(in thousands) NTD USD $ 15,171 $ 501,780 USD $ 49,387 $ 1,603,201CAD 16,717 477,061 CAD 14,540 406,719GBP 6,326 410,556 JPY 1,226,464 338,870JPY 1,170,445 328,544 GBP 4,954 280,725
Net position for major foreign currency transactions (Market Risk) HKD 76,386 323,334 HKD 58,568 244,996
Note1: The major foreign currencies are the top 5 currencies by position, which is expressed in New Taiwan dollars after exchange rate conversion.
Note2: Net position represents an absolute value of each currency.
H. Capital adequacy ratio (expressed in thousands of New Taiwan dollars, %)
March 31, 2007 March 31, 2006
Net eligible capital $ 98,744,145 $ 86,948,194
Total risk-weighted assets 897,352,036 849,285,387
Capital adequacy ratio 11.00% 10.24%
Tier one capital / Total risk-weighted assets 8.38% 8.33%
Tier two capital/ Total risk-weighted assets 3.56% 2.92%
Tier three capital/ Total risk-weighted assets - -
Shareholder's equity/Total assets 5.54% 5.12%
Note:
1. Capital adequacy ratio = net eligible capital / total risk-weighted assets.
2. Total assets are the amounts recognized on balance sheets
3. Capital adequacy ratio discloses the latest data.
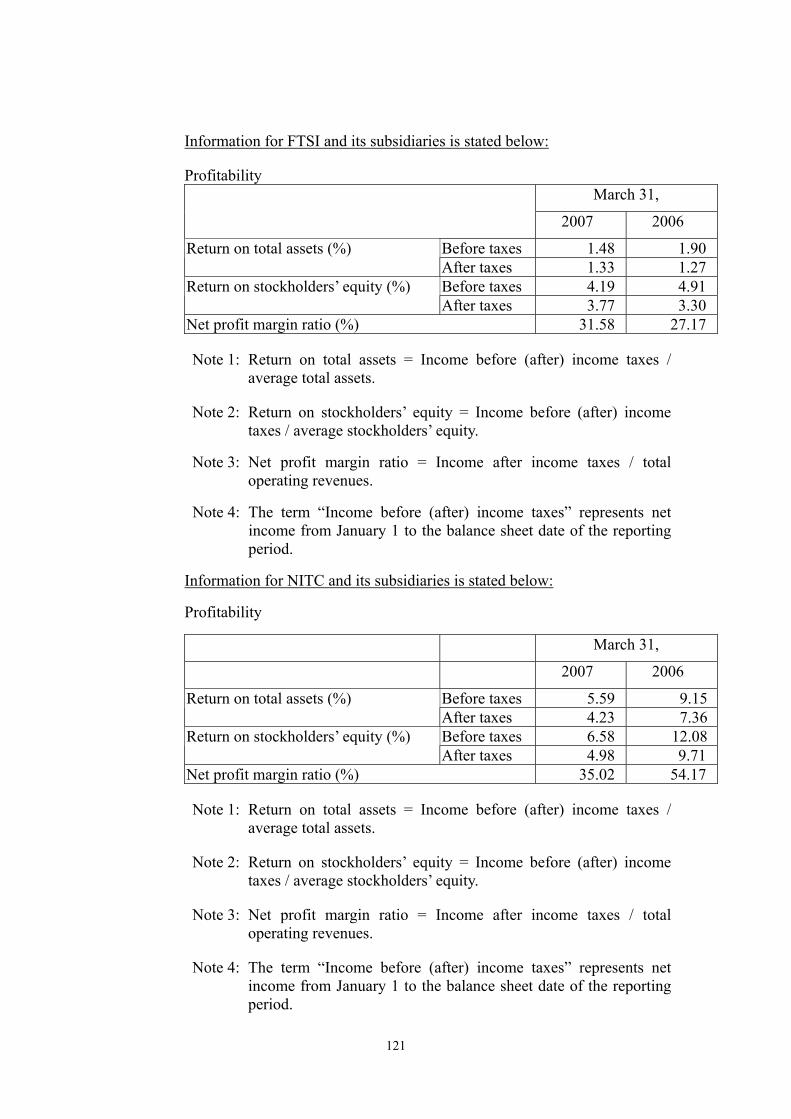
121
Information for FTSI and its subsidiaries is stated below:
Profitability March 31,
2007 2006
Before taxes 1.48 1.90Return on total assets (%) After taxes 1.33 1.27Before taxes 4.19 4.91Return on stockholders’ equity (%) After taxes 3.77 3.30
Net profit margin ratio (%) 31.58 27.17
Note 1: Return on total assets = Income before (after) income taxes / average total assets.
Note 2: Return on stockholders’ equity = Income before (after) income taxes / average stockholders’ equity.
Note 3: Net profit margin ratio = Income after income taxes / total operating revenues.
Note 4: The term “Income before (after) income taxes” represents net income from January 1 to the balance sheet date of the reporting period.
Information for NITC and its subsidiaries is stated below:
Profitability
March 31,
2007 2006
Before taxes 5.59 9.15Return on total assets (%) After taxes 4.23 7.36Before taxes 6.58 12.08Return on stockholders’ equity (%) After taxes 4.98 9.71
Net profit margin ratio (%) 35.02 54.17
Note 1: Return on total assets = Income before (after) income taxes / average total assets.
Note 2: Return on stockholders’ equity = Income before (after) income taxes / average stockholders’ equity.
Note 3: Net profit margin ratio = Income after income taxes / total operating revenues.
Note 4: The term “Income before (after) income taxes” represents net income from January 1 to the balance sheet date of the reporting period.
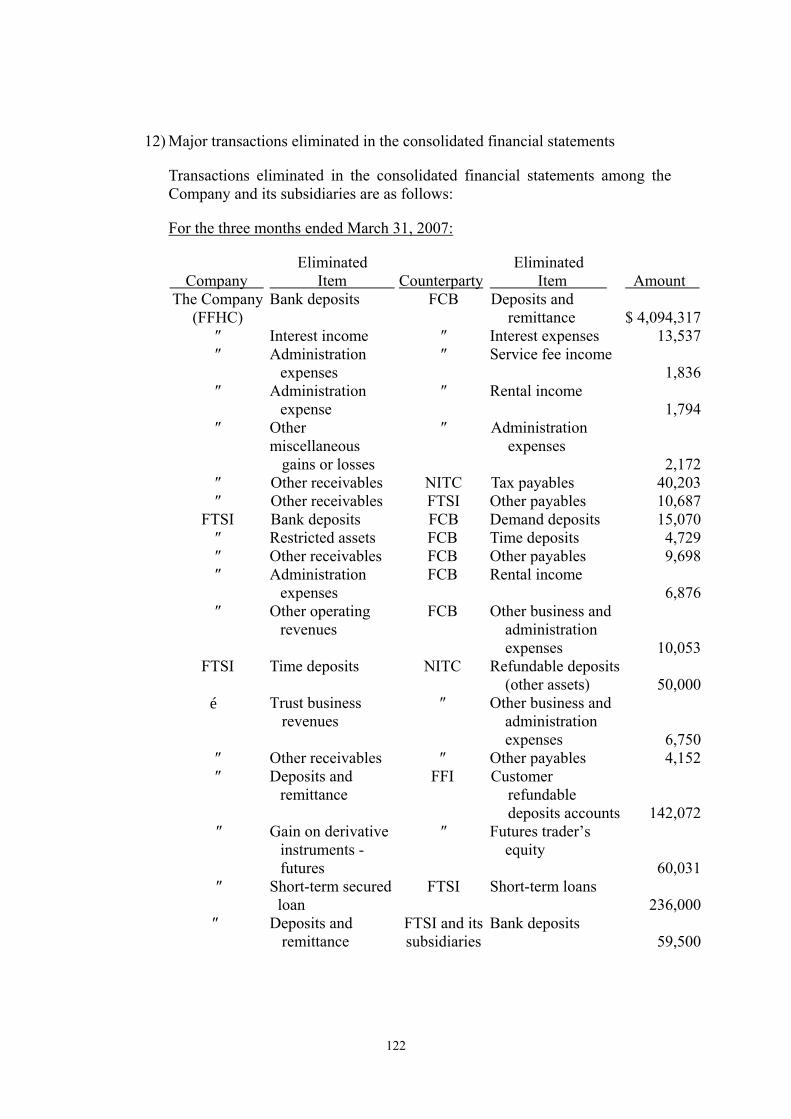
122
12) Major transactions eliminated in the consolidated financial statements
Transactions eliminated in the consolidated financial statements among the Company and its subsidiaries are as follows:
For the three months ended March 31, 2007:
Company Eliminated
Item Counterparty Eliminated Item Amount
The Company (FFHC)
Bank deposits FCB Deposits and remittance $ 4,094,317
″ Interest income ″ Interest expenses 13,537 ″ Administration
expenses ″ Service fee income
1,836 ″ Administration
expense ″ Rental income
1,794 ″ Other
miscellaneous gains or losses
″ Administration expenses
2,172 ″ Other receivables NITC Tax payables 40,203 ″ Other receivables FTSI Other payables 10,687
FTSI Bank deposits FCB Demand deposits 15,070 ″ Restricted assets FCB Time deposits 4,729 ″ Other receivables FCB Other payables 9,698 ″ Administration
expenses FCB Rental income
6,876 ″ Other operating
revenues FCB Other business and
administration expenses 10,053
FTSI Time deposits NITC Refundable deposits (other assets) 50,000
〞 Trust business revenues
″ Other business and administration expenses 6,750
″ Other receivables ″ Other payables 4,152 ″ Deposits and
remittance FFI Customer
refundable deposits accounts 142,072
″ Gain on derivative instruments - futures
″ Futures trader’s equity
60,031 ″ Short-term secured
loan FTSI Short-term loans
236,000 ″ Deposits and
remittance FTSI and its subsidiaries
Bank deposits 59,500

123
For the three months ended March 31, 2006:
Company Eliminated
Item CounterpartyEliminated
Item Amount The Company
(FFHC) Bank deposits FCB Demand deposits
$ 2,633,416″ Bank deposits ″ Time deposits 3,550,000″ Interest income ″ Inrerest expenses 10,810″ Investments in
bills and bonds under resale agreements
″ Bills and bonds payable under repurchase agreements 400,000
″ Interest receivables ″ Interest payables 2,353″ Administration
expenses ″ Service fee income
1,926″ Administration
expenses ″ Rental income 1,770
″ Other miscellaneous gains or losses
″ Administration expenses
2,044″ Other receivables NITC Tax payables 91,100″ Other payables FTSI Other receivables 16,481
FTSI Bank deposits FCB Demand deposits 4,515″ Restricted assets ″ Time deposits 4,729″ Administration
expenses ″ Rental income
6,812FCB Time deposits NITC Refundable
deposits 54,500″ Demand deposits ″ Bank deposits 919″ Trust business
revenue ″ Other business and
administration expenses 3,647
″ Other receivables ″ Other payables 2,090
13) Information with respect to the subsidiary holding the capital stock of parent company: None
14) Presentation of financial statements
Certain accounts of the consolidated financial statements for the three months ended March 31, 2006 have been reclassified to conform to the presentation of the consolidated financial statements for the three months ended March 31, 2007.

124
11. Supplementary disclosures
1) Information regarding significant transactions
Disclosures of significant transactions of the Company for the three months ended March 31, 2007 are as follows:
A. Cumulative purchases or sales of the same investee’s capital stock up to NT $300 million dollars or 10% of issued capital stock: None.
B. Acquisition or disposal of real estate up to NT $300 million dollars or 10% of issued capital stock: None.
C. Handling fee discounts for transactions with related parties up to NT $5 million dollars: None.
D. Receivables from related parties up to NT $300 million dollars or 10% of issued capital stock: None.
E. Disposal of non-performing loans of subsidiaries up to NT $5 billion dollars: None.
F. Securitization products, including its related information, applied by subsidiaries in compliance with the“Financial Asset Securitization Act”or “Real Estate Securitization Act”: None.
G. Other significant transactions that may affect the decisions made by financial statement users: None.

125
2) Supplementary disclosures regarding investee companies (Expressed In Thousands Of New Taiwan Dollars)
Note 1: Banking industry. Note 2: Securities and futures industry and Security investment trust industry.
Note 5: Leasing, investment consulting, and business consulting industries and holding company
Note 3: Insurance industry. Note 6: Construction proposal consulting and contract certification. Note 4: Venture Capital industry
The Original Investment Costs At The End Of Period
Main Shares (In Percentage Of
Ownership Net Income (Loss) Investments From Investment Investor Investee Address Service Ending Bal. Beginning Bal. Thousands) % Book Value Of The Investee Related Party Income (Loss)
FFHC FCB 30, Chung-King S. Road, Sec. 1, Taipei, Taiwan Note 1 $ 71,289,806 $ 71,289,806 4,621,600 100 $ 88,875,318 $ 2,700,979 None $ 2,700,979
″ FTSI 6F, 27, An Ho Road, Sec. 1, Taipei, Taiwan Note 2 5,303,851 5,303,851 500,000 100 6,062,513 224,127 ″ 224,127
″ NITC 7F, 6, Min Chuan E. Road Sec. 3, Taipei, Taiwan Note 2 1,061,461 1,061,461 60,000 100 1,032,261 50,122 ″ 50,122
″ FFAM 7F,94, Chung Hsiao E. Road, Sec 2, Taipei, Taiwan Note 5 250,000 250,000 25,000 100 285,468 8,674 ″ 8,674
″ FVC 9F, 30, Chung-King S. Road, Sec. 1, Taipei, Taiwan Note 4 700,000 700,000 70,000 100 682,674 ( 3,823) ″ ( 3,823)
″ FFMC 9F, 30, Chung-King S. Road, Sec. 1, Taipei, Taiwan Note 5 20,000 20,000 2,000 100 16,747 432 ″ 432
″ FPCIA 9F, 30, Chung-King S. Road, Sec. 1, Taipei, Taiwan Note 3 3,000 3,000 300 100 8,753 2,153 ″ 2,153
FCB First Commercial Bank (USA)
200 East Main Street, Alhambra, CA 91801, USA Note 1 810,000 810,000 3,000 100 1,441,606 36,992 ″ 35,000
″ FIA 9F, 30, Chung-King S. Road, Sec. 1, Taipei, Taiwan Note 3 50,000 50,000 5,000 100 287,059 7,268 ″ 3,500
″ FCBL 6F, 94, Chung Hsiao E. Road, Sec. 2, Taipei, Taiwan Note 5 500,023 500,023 50,000 100 711,779 19,502 ″ 24,000
″ EAREM 9F, 94, Chung Hsiao E. Road., Sec. 2, Taipei, Taiwan Note 6 15,000 15,000 1,500 30 10,737
( 3,451) ″ -
FCBL FCBL Capital International (B.V.I) Ltd.
Citco Building, Wickhams Cay, P.O. Box 662, Road Town, Tortola, British Virgin Islands Note 5 1,620 1,620 50 100 77,307 4,320 ″ 4,320
FTSI FTCMI 6F, 29, An Ho Road, Sec. 1, Taipei, Taiwan Note 5 89,304 289,325 10,000 100 139,268 1,614 ″ 1,614
″ FTSL P.O. Box 659, Road Town, Tortola, British Virgin Islands Note 5 33,315 333,156 1,000 100 798,341 2,009 ″ 2,009
″ FFI 4F, 29, An Ho Road, Sec. 1, Taipei, Taiwan
Note 2 400,000
400,000
40,000 100 396,193 952 ″ 952
FTSL FWSL Hong Kong Note 2 and 5
USD3,378,270 USD3,378,270 30,000 100 USD2,094,660 USD 8,219 ″ USD 8219
NITC NITC (Cayman Islands) Ltd.
British Cayman Islands Note 2
3,231(USD100,000)
3,231(USD100,000) 100 100 11,096 87 ″ 87

126
3) Significant transactions regarding investee companies
A. Acquisition of real estate up to NT $300 million dollars or 10% of issued capital stock: None
B. Disposal of real estate up to NT $300 million dollars or 10% of issued capital stock: None
C. Handling fee discounts for transactions with related parties up to NT $5 million dollars: None.
D. Receivables from related parties up to NT $300 million dollars or 10% of issued capital stock: Subsidiaries have no such situations except for FCB and FTSI. Please refer to Note 5 2) C. and D. for details with respect to deposit and loan transactions of FCB. Information of FTSI is as follows:
Amount overdue The company
listed accounts
receivable
Counterparty Relationship Accounts
receivable
from related
party at Mar.
31, 2007
Turnover rate
Amount Disposure
Amount received
Subsequent to first
quarter end
Amount of
allowance
FTSI FTCMI Investee under
equity method
$ 200,076 Note $ - - $ - $ -
FTSI FTSL Investee under
equity method
$ 296,149 Note $ - - $ - $ -
Note: Not applicable, as mainly are other receivables of subsidiaries’ reducing capital
E. Disposal of non-performing loans of subsidiaries up to NT $5 billion dollars: None.
F. Securitization products and its related information that applied by subsidiaries in compliance with the “Financial Asset Securitization Act”or “Real Estate Securitization Act”: None.
G. Other significant transactions that may affect the decisions made by financial statement users: None.
H. Funds lent to others:
FCB engages in the loan and credit business regulated by the Banking Law and is classified as a financial service industry. Thus, the disclosure requirement is not applicable. FTSI, classified as a securities firm, does not lend funds to others except that engages in the margin loan and stock loan business.
NITC, FFAM, FVC, FFMC, and FPCIA have no such situations.
Indirect investee First Commercial Bank (USA) engages in the loan and credit business regulated by the Banking Law and is classified as a financial service industry, so the disclosure requirement is not applicable. Other indirect investees have no such situations.

127
I . Endorsements and guarantees provided for others:
FCB engages in guarantee business regulated by the Banking Law and is classified as a financial service industry, so the disclosure requirement is not applicable.
FTSI, NITC, FFAM, FVC, FFMC, and FPCIA have no such transactions.
Indirect investee First Commercial Bank (USA) engages in loan and credit business regulated by the Banking Law and is classified as a financial service industry, so the disclosure requirement is not applicable. Other indirect investees have no such situations.
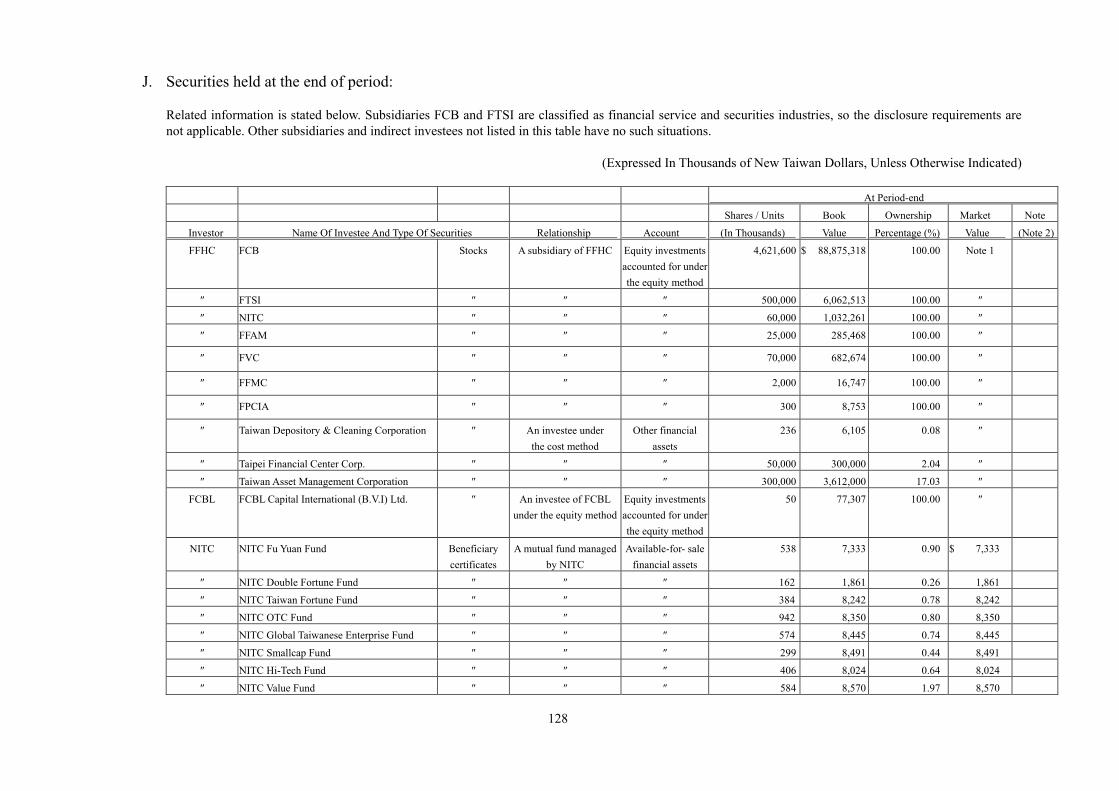
128
J. Securities held at the end of period:
Related information is stated below. Subsidiaries FCB and FTSI are classified as financial service and securities industries, so the disclosure requirements are not applicable. Other subsidiaries and indirect investees not listed in this table have no such situations.
(Expressed In Thousands of New Taiwan Dollars, Unless Otherwise Indicated)
At Period-end
Shares / Units Book Ownership Market Note
Investor Name Of Investee And Type Of Securities Relationship Account (In Thousands) Value Percentage (%) Value (Note 2)
FFHC FCB Stocks A subsidiary of FFHC Equity investments accounted for under the equity method
4,621,600 $ 88,875,318 100.00 Note 1
″ FTSI ″ ″ ″ 500,000 6,062,513 100.00 ″
″ NITC ″ ″ ″ 60,000 1,032,261 100.00 ″
″ FFAM ″ ″ ″ 25,000 285,468 100.00 ″
″ FVC ″ ″ ″ 70,000 682,674 100.00 ″
″ FFMC ″ ″ ″ 2,000 16,747 100.00 ″
″ FPCIA ″ ″ ″ 300 8,753 100.00 ″
″ Taiwan Depository & Cleaning Corporation ″ An investee under the cost method
Other financial assets
236 6,105 0.08 ″
″ Taipei Financial Center Corp. ″ ″ ″ 50,000 300,000 2.04 ″
″ Taiwan Asset Management Corporation ″ ″ ″ 300,000 3,612,000 17.03 ″
FCBL FCBL Capital International (B.V.I) Ltd. ″ An investee of FCBLunder the equity method
Equity investments accounted for under the equity method
50 77,307 100.00 ″
NITC NITC Fu Yuan Fund Beneficiary certificates
A mutual fund managed by NITC
Available-for- sale financial assets
538 7,333 0.90 $ 7,333
″ NITC Double Fortune Fund ″ ″ ″ 162 1,861 0.26 1,861
″ NITC Taiwan Fortune Fund ″ ″ ″ 384 8,242 0.78 8,242
″ NITC OTC Fund ″ ″ ″ 942 8,350 0.80 8,350
″ NITC Global Taiwanese Enterprise Fund ″ ″ ″ 574 8,445 0.74 8,445
″ NITC Smallcap Fund ″ ″ ″ 299 8,491 0.44 8,491
″ NITC Hi-Tech Fund ″ ″ ″ 406 8,024 0.64 8,024
″ NITC Value Fund ″ ″ ″ 584 8,570 1.97 8,570
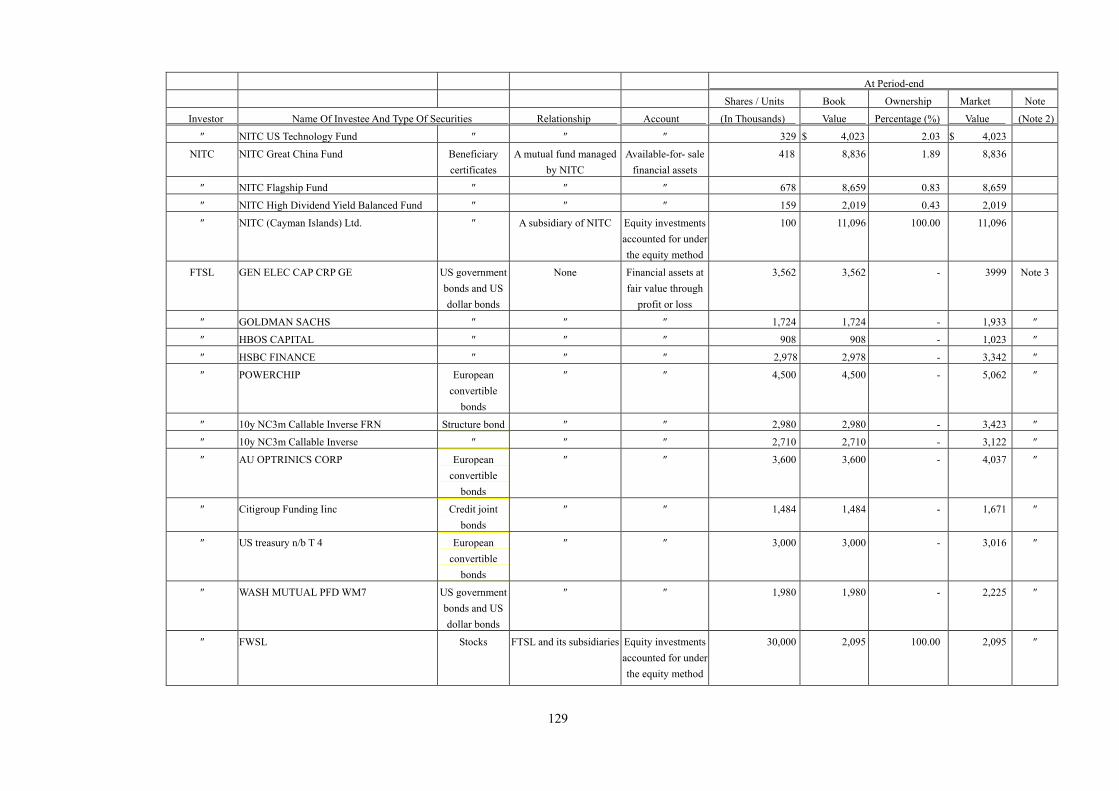
129
At Period-end
Shares / Units Book Ownership Market Note
Investor Name Of Investee And Type Of Securities Relationship Account (In Thousands) Value Percentage (%) Value (Note 2)
″ NITC US Technology Fund ″ ″ ″ 329 $ 4,023 2.03 $ 4,023
NITC NITC Great China Fund Beneficiary certificates
A mutual fund managed by NITC
Available-for- sale financial assets
418 8,836 1.89 8,836
″ NITC Flagship Fund ″ ″ ″ 678 8,659 0.83 8,659
″ NITC High Dividend Yield Balanced Fund ″ ″ ″ 159 2,019 0.43 2,019
″ NITC (Cayman Islands) Ltd. ″ A subsidiary of NITC Equity investments accounted for under the equity method
100 11,096 100.00 11,096
FTSL GEN ELEC CAP CRP GE US government bonds and US dollar bonds
None Financial assets at fair value through
profit or loss
3,562 3,562 - 3999 Note 3
″ GOLDMAN SACHS ″ ″ ″ 1,724 1,724 - 1,933 ″
″ HBOS CAPITAL ″ ″ ″ 908 908 - 1,023 ″
″ HSBC FINANCE ″ ″ ″ 2,978 2,978 - 3,342 ″
″ POWERCHIP European convertible
bonds
″ ″ 4,500 4,500 - 5,062 ″
″ 10y NC3m Callable Inverse FRN Structure bond ″ ″ 2,980 2,980 - 3,423 ″
″ 10y NC3m Callable Inverse ″ ″ ″ 2,710 2,710 - 3,122 ″
″ AU OPTRINICS CORP European convertible
bonds
″ ″ 3,600 3,600 - 4,037 ″
″ Citigroup Funding Iinc Credit joint bonds
″ ″ 1,484 1,484 - 1,671 ″
″ US treasury n/b T 4 European convertible
bonds
″ ″ 3,000 3,000 - 3,016 ″
″ WASH MUTUAL PFD WM7 US government bonds and US dollar bonds
″ ″ 1,980 1,980 - 2,225 ″
″ FWSL Stocks FTSL and its subsidiaries Equity investments accounted for under the equity method
30,000 2,095 100.00 2,095 ″

130
At Period-end
Shares / Units Book Ownership Market Note
Investor Name Of Investee And Type Of Securities Relationship Account (In Thousands) Value Percentage (%) Value (Note 2)
FFI ING Taiwan Local Balanced Selection Fund Beneficiary certificates
None Financial assets at fair value through
profit or loss
482 5,000 - 5,107
ING Global Bond Portfolio 967 10,000 - 10,159
″ ING Taiwan Income II Fund ″ ″ 851 10,005 - 10,040
″ NITC Strategy Balanced Fund ″ ″ ″ 2,000 20,000 - 18,747
″ ING Global Biotech & Health Care Fund ″ ″ ″ 1,000 10,000 - 9,890
″ Taishin Mainstream Fund ″ ″ ″ 1,000 10,000 - 10,940
FTCMI ING Taiwan Income II Fund Government bonds
″ ″ 2,129 25,008 - 25,094
″ Central Government Construction Bonds 92-8 ″ ″ Available-for- sale financial assets
100,000 99,851 - 100,228
Note 1: There is no readily available market price, as the stock is not listed on any public exchange.
Note 2: Long-term investments in the above table remain free of pledge or guarantee.
Note 3: Book value and market value are expressed in thousands of US dollars.

131
K. Cumulative purchases or sales of the same marketable securities up to NT $300 million dollars or 10% of issued capital stock:
FCB and FTSI are classified as financial service and securities industries, so the disclosure requirement is not applicable.
Indirect investee FCB (USA) is classified as a financial service industry, so the disclosure requirement is not applicable.
L. Information of derivative instrument transactions:
Please refer to Note 10 1) for information of FCB and FTSI. FTSI conducts derivative instrument transactions, fair values on March 31, 2007 and 2006 are as follow:
March 31, 2007 March 31, 2006 Derivative financial assets Future margins deposits – proprietary fund
$ 342,254
$ 329,618
Purchase options 4,354 1,898Bond options 71 2,087 $ 346,679 $ 333,603
Derivative financial liabilities
Sell options - futures $ 4,044 $ 2,119Convertible corporate bond asset swap options
-
3,399
Bond options 269 932 $ 4,313 $ 6,450
Subsidiaries, NITC , FFAM, FVC, FFMC, and FPCIA, have no such transactions.
Indirect investees have no such transactions except for FFI、FWSL and FCBL. FFI primarily engages in futures brokerage business and FCBL engages overseas convertible bond asset swaps and options. As of March 31, 2007 and 2006, the fair value of Future options are US $214,012 and US $1,207,946, respectively while the fair value of options sold are $214,012 and US$1,207,946, respectively. Information of derivative financial instrument transactions between FCBL and its counterparty FCB is as follow:

132
Interest rate swap transaction
March 31, 2007 March 31, 2006 Notional
Principal Gains (losses)
on interest rate swaps
Notional Principal
Gains (losses) on
interest rate swaps
FCBL $ 90,000$ $ 132,00$
4) Investments in People’s Republic of China
The Company and its subsidiaries have no investments in People’s Republic of China for the three months ended March 31, 2007.
5) Significant commitments or contingency of subsidiaries
Please refer to Note 7.
6) Significant loss from disasters of subsidiaries
Please refer to Note 8.
7) Significant subsequent events of subsidiaries
Please refer to Note 9.
8) Related party transactions of subsidiaries amounting to at least NT $100 million dollars
Please refer to Note 5.

133
9) Significant transactions between parent company and subsidiaries
Information for the three months ended March 31, 2007:
(Expressed In Thousands Of New Taiwan Dollars)
Details of transactions No.
(Note 1) Company Counterparty Relationship(Note 2)
Account Amount Conditions Percentage (%) of total consolidated net
revenues or assets 0 FFHC FCB 1 Bank deposits $ 4,094,317 No significant
difference from general customers
0.26%
FCB 1 Interest income 13,537 ″ 0.15%
FCB 1 Rental expenses 1,794 ″ 0.02%
FCB 1 Administration expenses 1,836 ″ 0.02%
FCB 1 Remuneration of Directors and Supervisors 2,172
″ 0.02%
FTSI 1 Other receivables-consolidated income tax return system 10,687
″ 0.00%
NITC 1 Other payables- consolidated income tax return system 40,203
″ 0.00%
1 FCB FFHC 2 Deposits and remittances 4,094,317 ″ 0.26%
FFHC 2 Interest expenses 13,537 ″ 0.15%
FFHC 2 Rental income 1,794 ″ 0.02%
FFHC 2 Service fee income from providing registration and transfer agency service for securities 1,836
″ 0.02%
FFHC 2 remuneration to Directors and Supervisors
2,172 ″ 0.02%
FTSI 3 Deposits and remittances 4,729 ″ 0.00%
FTSI 3 Other payables 9,698 ″ 0.00%
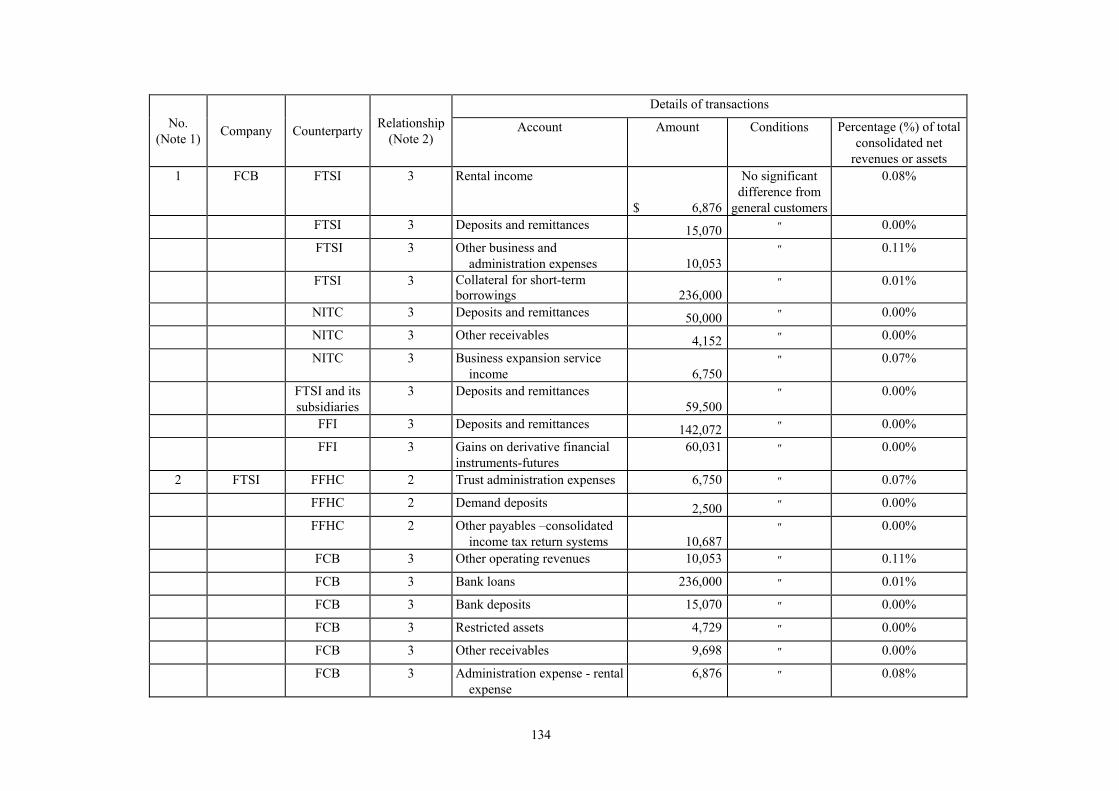
134
Details of transactions No.
(Note 1) Company Counterparty Relationship(Note 2)
Account Amount Conditions Percentage (%) of total consolidated net
revenues or assets 1 FCB FTSI 3 Rental income
$ 6,876
No significant difference from
general customers
0.08%
FTSI 3 Deposits and remittances 15,070 ″ 0.00%
FTSI 3 Other business and administration expenses 10,053
″ 0.11%
FTSI 3 Collateral for short-term borrowings 236,000
″ 0.01%
NITC 3 Deposits and remittances 50,000 ″ 0.00%
NITC 3 Other receivables 4,152 ″ 0.00%
NITC 3 Business expansion service income 6,750
″ 0.07%
FTSI and its subsidiaries
3 Deposits and remittances 59,500
″ 0.00%
FFI 3 Deposits and remittances 142,072 ″ 0.00%
FFI 3 Gains on derivative financial instruments-futures
60,031 ″ 0.00%
2 FTSI FFHC 2 Trust administration expenses 6,750 ″ 0.07%
FFHC 2 Demand deposits 2,500 ″ 0.00%
FFHC 2 Other payables –consolidated income tax return systems 10,687
″ 0.00%
FCB 3 Other operating revenues 10,053 ″ 0.11%
FCB 3 Bank loans 236,000 ″ 0.01%
FCB 3 Bank deposits 15,070 ″ 0.00%
FCB 3 Restricted assets 4,729 ″ 0.00%
FCB 3 Other receivables 9,698 ″ 0.00%
FCB 3 Administration expense - rental expense
6,876 ″ 0.08%
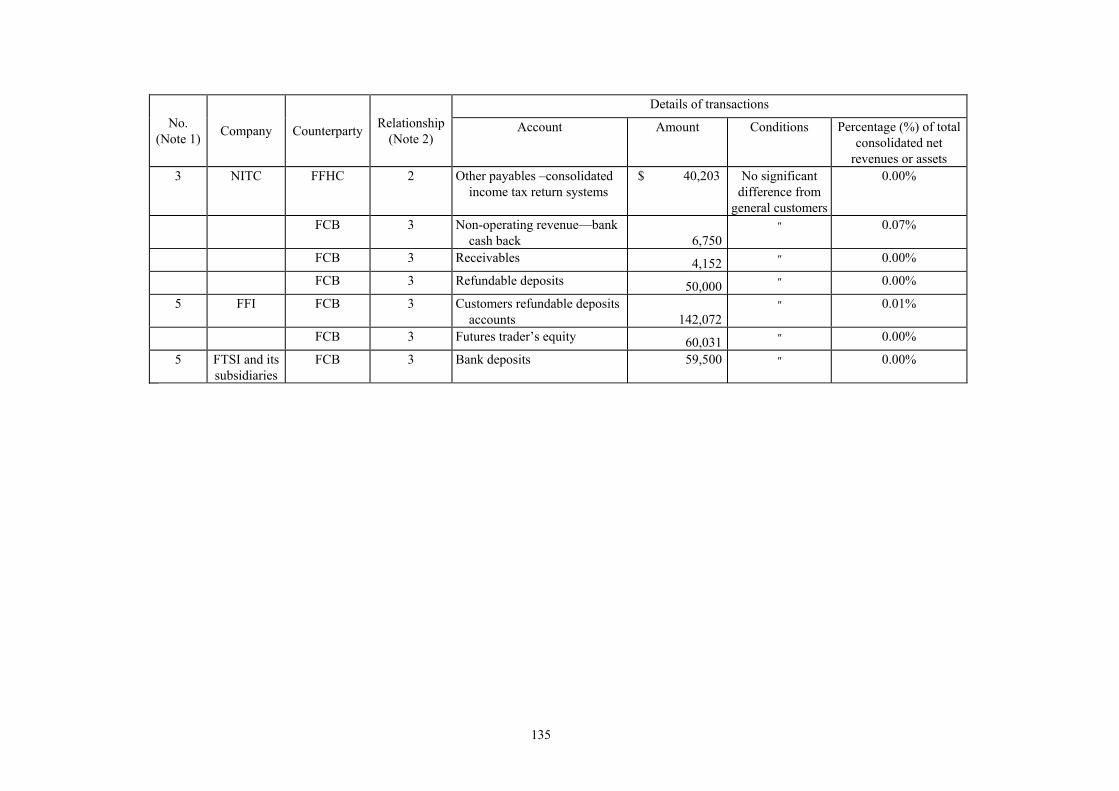
135
Details of transactions No.
(Note 1) Company Counterparty Relationship(Note 2)
Account Amount Conditions Percentage (%) of total consolidated net
revenues or assets 3 NITC FFHC 2 Other payables –consolidated
income tax return systems $ 40,203 No significant
difference from general customers
0.00%
FCB 3 Non-operating revenue—bank cash back 6,750
″ 0.07%
FCB 3 Receivables 4,152 ″ 0.00%
FCB 3 Refundable deposits 50,000 ″ 0.00%
5 FFI FCB 3 Customers refundable deposits accounts 142,072
″ 0.01%
FCB 3 Futures trader’s equity 60,031 ″ 0.00%
5 FTSI and its subsidiaries
FCB 3 Bank deposits 59,500 ″ 0.00%
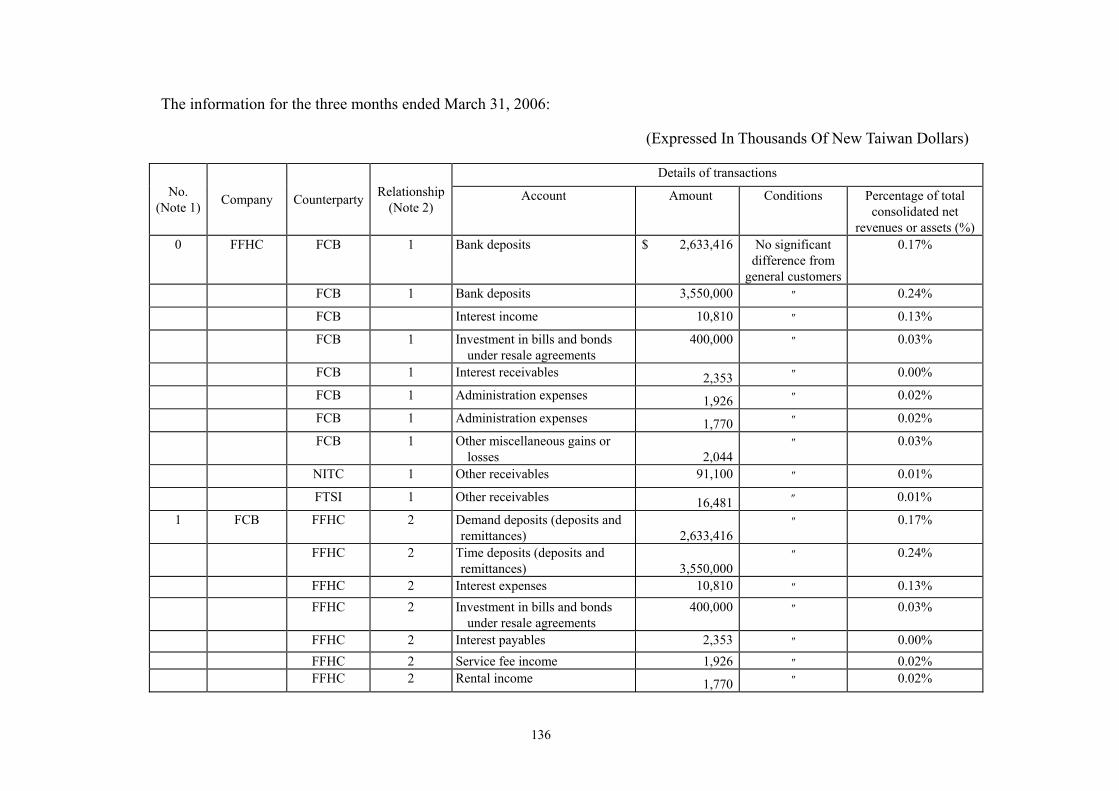
136
The information for the three months ended March 31, 2006:
(Expressed In Thousands Of New Taiwan Dollars)
Details of transactions No.
(Note 1) Company Counterparty Relationship(Note 2)
Account Amount Conditions Percentage of total consolidated net
revenues or assets (%)0 FFHC FCB 1 Bank deposits $ 2,633,416 No significant
difference from general customers
0.17%
FCB 1 Bank deposits 3,550,000 ″ 0.24%
FCB Interest income 10,810 ″ 0.13%
FCB 1 Investment in bills and bonds under resale agreements
400,000 ″ 0.03%
FCB 1 Interest receivables 2,353 ″ 0.00%
FCB 1 Administration expenses 1,926 ″ 0.02%
FCB 1 Administration expenses 1,770 ″ 0.02%
FCB 1 Other miscellaneous gains or losses 2,044
″ 0.03%
NITC 1 Other receivables 91,100 ″ 0.01%
FTSI 1 Other receivables 16,481 ″ 0.01%
1 FCB FFHC 2 Demand deposits (deposits and remittances) 2,633,416
″ 0.17%
FFHC 2 Time deposits (deposits and remittances) 3,550,000
″ 0.24%
FFHC 2 Interest expenses 10,810 ″ 0.13% FFHC 2 Investment in bills and bonds
under resale agreements 400,000 ″ 0.03%
FFHC 2 Interest payables 2,353 ″ 0.00% FFHC 2 Service fee income 1,926 ″ 0.02% FFHC 2 Rental income 1,770 ″ 0.02%
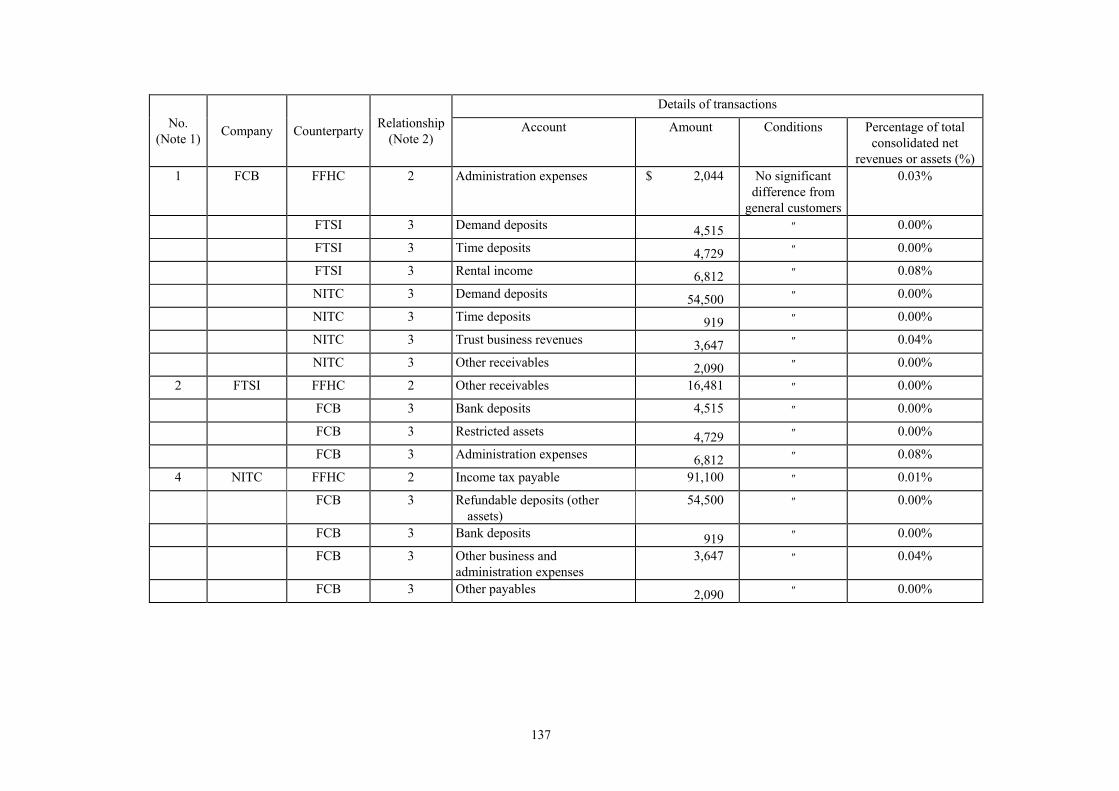
137
Details of transactions No.
(Note 1) Company Counterparty Relationship(Note 2)
Account Amount Conditions Percentage of total consolidated net
revenues or assets (%)1 FCB FFHC 2 Administration expenses $ 2,044 No significant
difference from general customers
0.03%
FTSI 3 Demand deposits 4,515 ″ 0.00%
FTSI 3 Time deposits 4,729 ″ 0.00%
FTSI 3 Rental income 6,812 ″ 0.08%
NITC 3 Demand deposits 54,500 ″ 0.00%
NITC 3 Time deposits 919 ″ 0.00%
NITC 3 Trust business revenues 3,647 ″ 0.04%
NITC 3 Other receivables 2,090 ″ 0.00%
2 FTSI FFHC 2 Other receivables 16,481 ″ 0.00%
FCB 3 Bank deposits 4,515 ″ 0.00%
FCB 3 Restricted assets 4,729 ″ 0.00%
FCB 3 Administration expenses 6,812 ″ 0.08%
4 NITC FFHC 2 Income tax payable 91,100 ″ 0.01%
FCB 3 Refundable deposits (other assets)
54,500 ″ 0.00%
FCB 3 Bank deposits 919 ″ 0.00%
FCB 3 Other business and administration expenses
3,647 ″ 0.04%
FCB 3 Other payables 2,090 ″ 0.00%

138
Note 1: The numbers in the No. column represent as follows:
1. 0 for the parent company
2. According to the sequential order, subsidiaries are numbered from 1.
Note 2: There are three types of relationships with the counterparties and they are labeled as follows:
1. Parent company to subsidiary.
2. Subsidiary to parent company.
3. Subsidiary to subsidiary.
Note 3: The calculation basis of the trading amount accounting for the total consolidated net revenues or assets is that the account ending balance is divided by the total consolidated assets if it is attributed to the balance sheet accounts, and the accumulated trading amount of the reporting period is divided by the total consolidated net revenues if it is attributed to the profit or loss accounts.

139
12. Disclosure of financial information by segments
Not applicable for interim financial statements.
Related Documents