Welcome message from author
This document is posted to help you gain knowledge. Please leave a comment to let me know what you think about it! Share it to your friends and learn new things together.
Transcript

Learning and Labour Market Intelligence for Wales:
National Report
April 2006

Learning and Labour Market Intelligence for Wales: National Report 2006
CONTENTS
Introduction - The 2006 Reports
Wales 2006
Chapter 1 Overview of Wales – a brief economic profile
Chapter 2 Participation in Learning
Chapter 3 Patterns of Employment, Unemployment and Inactivity
List of Tables
List of Figures
1

Learning and Labour Market Intelligence for Wales: National Report 2006
Tables
CHAPTER 1
Table 1.1: Population and Migration: Population Change, 1994 to 2004, by Age
Table 1.2: 2004-Based Population Projections for Wales
Table 1.3: Population Migration to Year Ending December 2004
Table 1.4: Gross Value Added by Income Component, 1995-2004
Table 1.5: GVA per head: UK Country
Table 1.6: Births, Deaths and Business Density
Table 1.7: VAT Registered Businesses by Industrial Group, Wales and GB, 2004
Table 1.8: VAT Registrations and Deregistrations by Industrial Group 2004, Wales
Table 1.9: Size Structure of Welsh Business, 2003
Table 1.10: Size Band Analysis of Local Units in Wales, 2003
Table 1.11: Exports Destination, Wales and UK
Table 1.12: Research and Development 2003
Table 1.13: Estimated Regional Breakdown of Personnel Engaged on R&D in the Business and Government Sectors, 2003
Table 1.14: GDP per hour Worked in 2002 (% EU average)
Table 1.15: Summary of Domains and Indicators
Table 1.16: Changing Sectoral Structure of Employment in Wales, 2003 to 2008
Table 1.17: Changing Occupational Structure of Employment in Wales, 2003 to 2008
Table 1.18: Sectoral Skills Imbalance – Wales 2003
Table 1.19: The top 5 types of training provided and level of provision by occupational
group
Table 1.20: Welsh Index of Multiple Deprivation 2005: Local Authority Lower Super Output Areas in the 10% most deprived
2
Learning and Labour Market Intelligence for Wales: National Report 2006
CHAPTER 2Table 2.1: Percentage of Adult Learners in Wales, 2004
Table 2.2: Destinations of Pupils at the End of Compulsory Education
Table 2.3: Participation of 16-18, 19-24 and 25-30 year olds in Education and Training in Wales, 2003/2004
Table 2.4: Estimated Participation of 16-18 year olds in Education and Training in Wales, by Economic Activity 2003/04
Table 2.5: Learners by Age and Ethnicity 2004/05
Table 2.6: Enrolments by Age, Mode, Gender; Wales 2004/05
Table 2.7: FE Learning Activities at FE providers by subject and qualification type 2004/05 (A) Subject Distribution by Qualification (%) (B) Distribution of Qualifications by Subject (%)
Table 2.8: Number of Learning Activities by Subject and Qualification at Community Learning Providers, 2004/05
Table 2.9: Learning Activities (FE,CL,WBL) and Language of Provision, 2004/05
Table 2.10: Table 2.10 Workforce Development in Wales 2004
Table 2.11: Workforce Development UK, Wales and ELWa (DELLS) Regions, 2004
Table 2.12: Percentage Qualified to NVQ equivalent levels, UK Regions, 2004
Table 2.13: Adult Literacy and Numeracy in Wales Headline Results
Table 2.14: Adult Literacy and Numeracy by Occupation
Table 2.15: Overall Satisfaction with Learning Experience
Table 2.16: Learners’ Objectives in undertaking their course
Table 2.17: Extent to which course has helped achieve objectives by Type of Provision
CHAPTER 3
Table 3.1: Labour Market Statistics, 1999-2005
Table 3.2: Employment Rate by Age and Gender, Wales, 2005
3

Learning and Labour Market Intelligence for Wales: National Report 2006
Table 3.3:Patterns of Employment and Economic Inactivity by Parliamentary Constituency, 2004
Table 3.4: Economic Activity by Unitary Authority, 2003 Apr 2004-Mar 2005
Table 3.5: Wales: Employment by Industry 2004
Table 3.6: Wales: Employment by Industry – Annual Business Inquiry data, 2003
Table 3.7: Annual Change in Employment by Industry, Spring 2004-2005
Table 3.8: Employment in Industries by Qualification Level 2005-05
Table 3.9: Occupations in Wales by Qualification Level (academic-based classification), Winter 2004-5
Table 3.10: Occupational Numbers - Changes in Employment 2004-05
Table 3.11: Self-Employment 2004 in Wales
Table 3.12: Full-Time Average Gross Weekly Earnings (£), UK regions, 2000 to 2005
Table 3.13: Unemployment and Inactivity, Wales and UK 1999-2005
Table 3.14: Qualifications of the Unemployed, Economically Inactive and of the Non-Employed, Winter 2005/05Table 3.15: Disability in Wales, 2004
Table 3.16: Disabled Employment Rates, ELWa regions, 2004
Table 3.17: Disability, Economic Inactivity and Unemployment, 2004-05
Table 3.18: Qualifications for the Working Age Population aged 50 and over, 2003
Table 3.19: Employment for Black and Minority Ethnic Groups in Wales, 2005
Table 3.20: Patterns of Non-Employment by UA area, 2005
Table 3.21: Patterns of Key Benefit Receipt by UA area, August 2005
Table 3.22: Unemployment and Inactivity, Wales and UK 1999-2005
Table 3.23: Claimant Count of Jobseeker's Allowance claimants, June 2005
Table 3.24: Summary of People into Jobs through New Deal
Table 3.25: Jobcentre Plus District Performance against Target Profile, 2004-05
Table 3.26 : Jobcentre Plus District Performance: Lone Parent Job Entries 2004-05
4

Learning and Labour Market Intelligence for Wales: National Report 2006
Table 3.27: Jobcentre Plus District Performance: Job Entries by People with Disabilities 2004-05
Table 3.28: Jobcentre Plus District Performance 2004-05: Job Entries by Long-Term Unemployed Customers
Table 3.29: Jobcentre Plus District Performance 2004-05: Job Entries by Long-Term Unemployed Customers
Table 3.30: Qualifications of the Unemployed, Economically Inactive and of the Non-Employed Winter 2004/05
Table 3.31: Employment and Non-Employment Rates by Skill Level 2004-05
Table 3.32: Employment Starts by Occupational Category, 2004-05
Table 3.33: People Starting Employment within the last three months: December 2004 – February 2005, by Qualification
Table 3.34: Employment Starts by Industry, 2004-05
Table 3.35: Job Density 2001-03
Table 3.36: Productivity in Wales 2003
Table 3.37: Skills that Need Improving in the next 12 months to Meet Business Needs in Wales, 2003
Table 3.38: Reasons for Not Providing Training, 2003
Figures
Figure 1.1: Gross Value Added by Industry 1990-2003
Figure 1.2: Survival of 1998 First Registrations at 6 months – 48 months: Wales
Figure 1.3: Anticipated Generic Skills Demand in Wales
Figure 1.4 Education Domain: Dispersion around the MIND (Welsh LSOAs)
Figure 2.1: Percent Very Likely/Unlikely to Learn in Future by Learning Status
Figure 2.2: Learner Numbers as a Percentage of the Population 2004/05
Figure 2.3: Learning Activities by level of study at FE Institutions 2004/05
Figure 2.4: Learning activities by Subject at FEIs 2004/2005
5

Learning and Labour Market Intelligence for Wales: National Report 2006
Figure 2.5: Adult Literacy Assessment by Age: Wales 2004
Figure 2.6: Percentage Not In Employment, Education of Training by Age Group
6
Learning and Labour Market Intelligence for Wales: National Report 2006
Learning and Labour Market Intelligence for Wales: The 2006 Reports
Introduction
Successful economies are adapting to the increasingly competitive international
environment by shifting production towards higher value-added products and
economic growth is now more dependent than ever on accumulation of knowledge and
skills that can generate increasing returns. The historical advantages of low wages,
low taxes, and low input costs are less important in the “knowledge economy” where
competitive advantage follows from innovation, quality, and productivity-driven cost
reductions. It follows that those countries that can offer an environment where firms
become more productive and innovative will generally experience superior
performance to those that are only able to offer low costs.
Developing the nation’s stock of human capital resources has become a central
platform of economic policy in the UK. In Wales, the National Assembly has assumed
strategic responsibility for tackling a low skill, low wage and high dependency problem
endemic to the region. Accordingly investment in people is given priority and
considered to be the key to successful community development, social inclusion and
wealth creation.
However, it is necessary that decisions on planning provision are based on a sound
understanding of need and evidence. Those responsible for planning and delivering
learning and education need to know where best to target their resources, what is
being achieved in return for those resources and whether the broad policy directions
are being achieved. It follows that accurate and timely intelligence on the needs of
employers and learners and the supply of skills within the framework of a rapidly
changing labour market are made available to policymakers.
7

Learning and Labour Market Intelligence for Wales: National Report 2006
Using the Reports
The 2006 Learning and Labour Market Intelligence reports for Wales follow the same
format as the 2005 reports previously produced for ELWa, based on 1 National, 4 Re-
gional and 22 local area reports1.
Their purpose is to alert users to the range of statistical and intelligence resources rel-
evant to the learning agenda in Wales. Where possible, all tables have been updated
along with any revisions to information published last year. A section relating to the
Multiple Index of Deprivation for 2005 has also been added. A number of new data
sets have also been included in the 2006 reports and in particular the learning data in
Chapter 2 draws for the first time on information derived the Lifelong Learning Wales
records. As with the 2005 reports, where source materials can be accessed via the in-
ternet, the appropriate URLs have been referenced.
Data sourced from the Office for National Statistics (ONS), Statistics Wales (SW) and
NOMIS are Crown Copyright. Data sourced from the Department of Education,
Lifelong Learning and Skills (DELLS) are copyright DELLS. Other data sources are
referenced in the text.
Report Structure
The structure and format of the 2006 report is unchanged. The main body of the na-
tional and regional reports is comprised of 3 chapters. Each of these is divided into
separate text and exhibit sections with hypertext links at appropriate reference points.
Many of the data exhibits have been annotated so as to emphasise the key messages.
This format should be especially welcome by those users whose needs are well
defined and specific. Those who require access to a broader information set will also
find the shorter narrative and annotated data sections more convenient. Nevertheless,
to evaluate the entire document is a substantial undertaking and a freestanding intro-
ductory section therefore precedes the main report. This is a not strictly an executive
summary but a short briefing document (Wales 2006) presenting bullet style “facts and 1 The 2006 Learning and Labour Market Intelligence reports have been jointly prepared by MGS Economics and the Welsh Economy Labour Market Evaluation and Research Centre (WELMERC) at the University of Wales, Swansea.
8

Learning and Labour Market Intelligence for Wales: National Report 2006
figures” pertinent to those who are concerned with the evolving labour market and
learning issues in Wales.
Wales 2006
Wales has undergone a period of huge economic and social change over the last 30
years. It is apparent that the rate and magnitude of change will be faster and greater
over the next decade. The key economic drivers of this process are:
Technological change; Productivity growth; International competition; Globalisation; Specialisation and sub-contracting;
Learning, education and training will have a vital role to play in ensuring that the
people of Wales have the skills they require so that they can fulfil their potential to
themselves, their work and their communities.
The following bullets provide a quick reference guide to the demographic, social and
economic condition of the Welsh nation and the extent to which it is embracing the
learning paradigm.
9
Demographics As of 2004 the population of Wales was 2.95 million and is expected to
reach 3 million in 20081
The population is also ageing. By 2008 there will be 22,000 fewer children - a fall of 4%. Over the same period the retirement age population will have increased by 40,000.
The working age population will grow moderately between now and 2008. However there will be some larger changes within this group with an increase of 40,000 in the age group 15-29 and a fall of 33,000 in the number of 30-44 year olds.
The natural component of population change is zero or negative so that population growth is entirely driven by net in-migration.
Between 2004 and 2008, net migration into Wales will amount to roughly 12,000 people a year. Of those who are leaving Wales, the majority are aged 16-24 while most in-migrants are typically aged 45 and over.
The largest urban areas in Wales are Cardiff (pop. 316,000), Swansea (226,000) and Newport (140,000). They are a magnet to young people and are the only areas not losing young people.
67.8% of residents say they are Welsh and 27.2% of them claim to speak Welsh
2.4% of the working age population belong to a non-white ethnic group (43,000)

Learning and Labour Market Intelligence for Wales: National Report 2006
1.Population projections (October 2005 release)
http://www.gad.gov.uk/Population_Projections/Population_projections_background.htm
10
Social Conditions in Wales
36% of Welsh households have internet access – the lowest rate of penetration of all UK regions1.
The 2005 Welsh Index of Multiple Deprivation indicates there are 190 Lower Super Output Areas (LSOAs) which are among the 10% most deprived in Wales2.
The Unitary Authorities of Cardiff, Rhondda Cynon Taff and Swansea together account for 44% of the 190 LSOAs in the lowest 10%. However Merthyr Tydfil and Blaenau Gwent had a greater extent of deprivation with 36% and 26% respectively of their LSOAs in the lower 10% category.
Almost ¼ of the Welsh population have a limiting long term illness or disability. Despite this only 12% of all residents say their health is not good
Merthyr Tydfil, Neath Port Talbot, Blaenau Gwent, Rhondda Cynon Taf, Caerphilly and Carmarthenshire suffer from a prevalence of limiting long-term illness
Wales has a high proportion of lone-parent households (9.9% vs 9.3% in England).
1 in 5 of the people in Wales work 45 hours a week or more.
Average full-time earnings in Wales are £454 a week. Although this is well below the UK average of £517, when the effects of London and the South East of England are removed, the pay gap is reduced to just over £20 per week2.

Learning and Labour Market Intelligence for Wales: National Report 2006
1.Households with home access to the internethttp://www.statistics.gov.uk/downloads/theme_social/Social_Trends35/13_11.xls
2. Index of Multiple Deprivation 2005http://www.wales.gov.uk/keypubstatisticsforwales/wimd/wimd2005-results.htm
3. Annual Survey of Hours and Earnings, 2005http://www.wales.gov.uk/keypubstatisticsforwales/content/publication/economy/2006/sb3-2006/sb3-2006.pdf
11
The Economy of Wales
Wales is a £39 billion1 economy, with 184,000 enterprises2 and a workforce of 1.3 million people
At £13,292 Wales has a lower GVA per head than any other region of the UK – 79% of the UK average
Hourly productivity in Wales is around 71% of the EU average and 80% of the UK average 3
At 4.7% Wales has an almost identical unemployment rate to the UK (4.8%). However, activity rates and employment rates are both 3% points lower than the UK
1 in 5 working age people in Wales do not want employment compared to 16% in Great Britain
149,600 people are self employed – 13% of workforce jobs
Wales is a net exporter of employment. In 2004, 82,700 Welsh residents were working outside Wales; this was offset by 41,400 people resident outside Wales coming into Wales to work.4

Learning and Labour Market Intelligence for Wales: National Report 2006
1.Regional GVA http://www.statswales.wales.gov.uk/TableViewer/tableView.aspx?ReportId=115
2. Enterprises in Wales http://www.statswales.wales.gov.uk/TableViewer/tableView.aspx?ReportId=1754
3. “Where in the World Are We?” http://www.elwa.org.uk/elwaweb/elwa.aspx?pageid=3069
4. Commuting in Wales 2004http://www.wales.gov.uk/keypubstatisticsforwales/content/publication/economy/2005/sb76-2005/sb76-2005.pdf
12

Learning and Labour Market Intelligence for Wales: National Report 2006
1.VAT Statistics http://www.wales.gov.uk/keypubstatisticsforwales/content/publication/economy/2005/sb74-2005/sb74-2005.pdf
2.Survival of VAT regd. Enterprises http://www.statswales.wales.gov.uk/TableViewer/tableView.aspx?ReportId=107
3.Foreign owned manufacturing plants http://www.wales.gov.uk/keypubstatisticsforwales/content/publication/compendia/2004/dwlas2004/dwlas2004-ch7/dwlas2004-t7-8.xls
4. Forecasts – Future Skills Waleshttp://www.futureskillswales.com/eng/content.php?cID=5&pID=1&zID=39&nhID=55SSDA – “Working Futures” http://www.ssda.org.uk/ssda/PDF/sectoral_report.pdf
13
The Industrial Structure of Wales
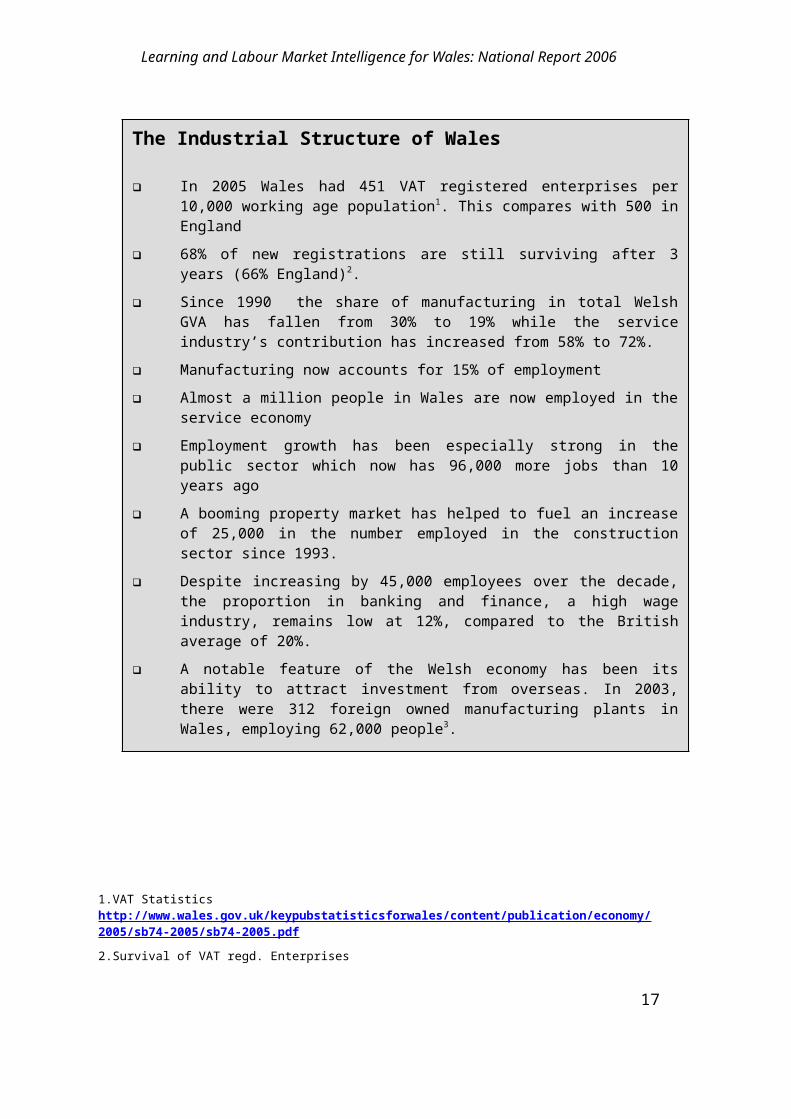
In 2005 Wales had 451 VAT registered enterprises per 10,000 working age population1. This compares with 500 in England
68% of new registrations are still surviving after 3 years (66% England)2.
Since 1990 the share of manufacturing in total Welsh GVA has fallen from 30% to 19% while the service industry’s contribution has increased from 58% to 72%.
Manufacturing now accounts for 15% of employment
Almost a million people in Wales are now employed in the service economy
Employment growth has been especially strong in the public sector which now has 96,000 more jobs than 10 years ago
A booming property market has helped to fuel an increase of 25,000 in the number employed in the construction sector since 1993.
Despite increasing by 45,000 employees over the decade, the proportion in banking and finance, a high wage industry, remains low at 12%, compared to the British average of 20%.
A notable feature of the Welsh economy has been its ability to attract investment from overseas. In 2003, there were 312 foreign owned manufacturing plants in Wales, employing 62,000 people3.
Tourism and Hospitality are also very important to the economy of Wales; in 2004 more than 100,000 people were employed in tourism-related activities.
Employment forecasts4 indicate growth in Wales to 2008 will be at around 0.3% a year and will be concentrated in the service economy - in particular in: wholesale and retail, other business services, health, other services (sewage and refuse disposal, leisure, domestic services).
Occupational growth is likely to be concentrated in those areas relating to health, leisure, sales and service support with particular emphasis on health professionals, caring personal service, health and social welfare associate professionals, leisure and personal service, sales, business and public service associate professionals

Learning and Labour Market Intelligence for Wales: National Report 2006
1. National Survey of Adult Basic Skills (2004)http://www.wales.gov.uk/keypubstatisticsforwalesheadline/content/post16education/2005/hdw200505111/hdw200505111-e.htm
14
Skills and Qualifications
Some 440,000 adults in Wales (25% of the total aged 16-65) are at entry level or below in literacy and over one half of adults (almost 1 million people) do not have Level 1 numeracy skills1. Corresponding proportions from the all-England survey are 16% and 47%
Among the under 50s population poor basic skills are most prevalent among school leavers and young people (16-19).
At key stage three, half way through secondary school, 33% of 14 year olds fail to attain the expected standard in English and 29% are below the target in maths2.
57% of 16-18 year olds in Wales are in full-time education and almost 8 out of 10 are participating in education or training3.
However there are almost 15,000 16-18 year olds - 12% of the total - who are not in education, training or employment 4
42% of working age people in Wales in 2005 are qualified to NVQ level 3 or above compared to 51% in Scotland and 45% in England
28% of those in work in Wales in 2005 are qualified to level 4 and above compared to 30% in England and 36% in Scotland
17% of working age adults in Wales have no qualifications. The corresponding UK figure is 14.7%
In 2005 10% of establishments reported hard-to-fill vacancies (14% in 2003); 4% reported skill shortage vacancies (7% in 2003)5
18% of employers in 2005 reported workforce skills gaps (amounting to 6% of the Welsh workforce). The skills most commonly lacking were generic skills such as problem solving skills (58% of establishments), customer handling skills (57%), other technical and practical skills (52%).
Forecasts to the end of the decade anticipate substantial growth in the number of professional and associate professional occupation, while the number employed in skilled trades and machine operatives will decline. By far the largest fall will be in the number of people employed in elementary occupations.

Learning and Labour Market Intelligence for Wales: National Report 2006
2. Assessment and Examination Performance (2004) http://www.wales.gov.uk/keypubstatisticsforwales/content/publication/schools-teach/2005/sb44-2005/sb44-2005.pdf
3. Participation of 16-30 year olds in education and traininghttp://www.statswales.wales.gov.uk/TableViewer/tableView.aspx?ReportId=769
4. Estimated participation of 16-24 year olds in education and traininghttp://www.statswales.wales.gov.uk/TableViewer/tableView.aspx?ReportId=772
5. Future Skills Wales Employer Survey 2005 http://www.futureskillswales.com/eng/content.php?cID=5&pID=1&zID=100&nhID=136
15

Learning and Labour Market Intelligence for Wales: National Report 2006
16
Learning in Wales
Formal Learning 88% of Welsh 16 – 18 year olds were participating in education, training or
work in 2003/04.
Roughly ¾ of 16 year olds (i.e. year 11 pupils) will continue in full-time education. In 2004, around one half (54%) of year 11 pupils remaining in full-time education stayed on school while 46% opted to continue to year 12 in a further education or tertiary college.
Roughly three quarters of 16-18 year olds are learning outside of the school sector.
In 2004/05 there were some 98,000 enrolments by young people aged 19 or under outside the school sector. Almost two thirds of enrolments were at Further Education institutions1.
There is a significant age specific fall in formal learning after age 18. In 2003/04, participation was 42% for 19-24 year olds and 16% for 25-30 year olds.
Accompanying this decline in participation is increased demand for more flexible learning. Two thirds of learners aged 25-30 are part-time with the majority of full-time learners enrolled in higher education programmes
Learning and Work There were 67,000 ELWa funded Work Based Learners in the financial
year to March 2005.
Workforce development is marginally greater in Wales than in England. The Labour Force Survey shows that 16% of employees in Wales received work related training in the 4 weeks preceding the survey (15% in England)
Training opportunities are more likely to be offered to / taken up by the better skilled and already qualified employees.
Adult Participation in Learning In 2003 42% of adults in Wales were either currently engaged in learning or
had undertaken some sort of learning activity during the previous 3 years.
Current participation promotes future participation but intentions decay rapidly over time
88% of 17-19-year-olds are current or recent learners. This compares with less than 60% of the rest of the working age population
The APS (Annual Population Survey, 2004/05) estimates that 30% of the working age population in Wales had not participated in any form of adult learning2 during the previous 12 months. In Great Britain the figure was 27%.
The are notable age differences in non-participation in learning which ranges from 7% among 16-19 year olds to 27% among 25-49 year olds and 55% among the over 50s. .
Learning and Labour Market Intelligence for Wales: National Report 2006
1. Learner numbers at FE Institutions and Community Learning Providers. http://www.statswales.wales.gov.uk/TableViewer/tableView.aspx
2. Adult Learning
An adult learner as defined in the APS is someone aged 16 and over who has done some taught and/or non-taught adult learning over the last year.
Taught adult learning: taught courses that were meant to lead to a qualification; taught courses designed to help develop skills used in a job; courses, instructions or tuition in driving, playing a musical instrument, art or craft, sport or any practical skill; evening classes; learning involving an individual working on their own from a package of materials provided by an employer, college, commercial organisation or other training provider; other taught course, instruction or tuition.
Non-taught adult learning: studying for qualifications without taking part in a taught course; supervised training while doing a job; time spent keeping up-to-date with developments in one's work or profession e.g. by reading books or attending seminars; deliberately trying to improve one's knowledge about anything or teach oneself a skill without taking part in a taught course.
17
Why are People Learning in Wales ? 61% of learners say that they started learning for personal
development reasons, 51% for work-related reasons and 35% for education/ progression reasons.
8% of learners say that they did not choose to participate in learning, but were required to do so by their employer, for professional reasons or as a benefit requirement
Benefits of Learning 30% of learners report improvements in self-confidence, 26% believe
they have developed as a person, 25% have gained or expect to gain a recognised qualification and 23% have met new people and made new friends.
Benefits more likely to be reported by men are related to their work. For example, 20% of men have gained or expect to gain a job compared with 13% of women, and 15% of men have been helped/expect to be helped in their current job compared with 12% of women
Barriers to Learning 13% of learners say that they are not interested in learning and 16%
that they do not feel that anything is preventing them from learning.
Attitudinal reasons such as feeling too old (20%) or feeling that there is no need to learn anymore (8%) are also identified as main factors, as are work/time pressures (21%), and caring commitments

Learning and Labour Market Intelligence for Wales: National Report 2006
Chapter 1
Overview of Wales – a brief economic profile
IntroductionAgainst a background of economic change and intense global competition, economies
must be capable of adapting rapidly when confronted by shocks to their industrial base
and other uncertainties. Public policy has a significant part to play in promoting this
versatility, by encouraging new investment and directing resources into appropriate
skills and new productive capacity.
In the context of learning and skills development the UK has much to do. For instance
85% of German adults and 77% of French adults of working age are qualified at Level 2 or higher compared with just 64% of UK adults;
Only 28% of the UK workforce has intermediate skills compared with 51% in France and 65% in Germany.
Nearly two hundred thousand 16 to 18 year olds in Britain are not in education, employment or training
14% of 16 to 24 year olds have literacy problems below level 1 14% of adults of working age have no qualification. over 5 million adults have literacy skills below level 1 and even more have
problems with numbers. many communities have high concentrations of low skilled adults.
In addressing these deficiencies, scarce resources must be targeted effectively and
decision makers must be “up to speed” in understanding economic events so as to
anticipate and identify future spending needs and priorities.
In keeping with the format of the previous Learning and Labour Market Intelligence
Report (2005), this chapter undertakes a brief examination of the Welsh economy and
sets the context for later sections. Drawing on the latest available statistical
information, the aim is to consider what shape the Welsh economy is in, the direction
18

Learning and Labour Market Intelligence for Wales: National Report 2006
in which it is being driven by economic forces and the factors that may influence its
performance in the future.
Population
In mid 2004 Wales had a population of 2.95 million, an increase of 65,000 (2.3%)
compared to a decade earlier and a gain of almost 15,000 since 2003. It is generally
accepted that a gradually rising population is beneficial to economic growth by
stimulating greater demand for goods and services, as well as providing additional
labour supply.
However, the picture is complicated by changes in the age profile and the increasing
average age of the population. For instance, since 1994 there has been an increase of
almost 5% in the number over retirement age (some 25,800) while the numbers of the
pre-school and early school age children has fallen by some 33,800 (Table 1.1). A
consequence of the latter has been a decline in the demand for school places, which
is likely to continue in the short term.
The population of working age, which grew by 4.2%, is much larger than pre-working
and post-working age combined (1.82 million compared to 1.13 million), which means
the effects of changes in the latter will be muted. These figures do not reveal either
how many people retire early or continue to work after retirement age. There are
notable increases in the age cohort 75+, which grew by some 37,000 and few of these
are likely to be in work. Further, the proportion of the population that is of working age
in Wales is smaller than that in England and Scotland2.
Population projections for Wales based on 2004 revisions suggest that growth will be
around 0.4% per annum up until 2020 with the population expected to reach the three
million mark by 2008 (Table 1.2). However as already indicated, the changing
composition of the working age population may have implications for learning
2 According to the 2001 census 59.7% of the population in Wales was of working age compared to 61.5% in England and 62.2% in Scotland. In M.K.Jones, R.J.Jones and P.J. Sloane, ‘An Overview of the Welsh Labour Market, WELMERC Discussion Paper No. 2003-01, University of Wales Swansea, it is also noted that cross border commuting to work also lowers the effective working population. In 2001 75,000 Welsh residents worked outside of Wales, whilst only 42,000 non-residents travelled in the opposite direction. Calculations in National Economic Development Strategy, Welsh Assembly Government, 2002 suggest that having a smaller proportion of the population of working age accounts for 2.5 out of the 20 percentage points gap between Welsh and UK GDP.
19

Learning and Labour Market Intelligence for Wales: National Report 2006
providers in the future. In the short and medium term a substantial increase in the 20-
29 population is expected, while the 15-19 and the 30-44 age groups are set to
diminish. Longer term, the challenge for planners will be to maximise participation in
learning from a smaller population of 16-19 year olds while encouraging more adults
and older people to gain new skills throughout longer working lives.
Population size is determined by a combination of birth rates, death rates and net
immigration. Natural population change (births minus deaths) is marginally negative in
Wales (deaths exceed births) so that the entire growth in the population of the region
is due to net immigration (Table 1.3). This increased from 9,000 in 2001 to 15,000 in
2003 and is estimated to continue at around 12,000 per year for the remainder of the
decade. Both in and out migration are higher in relation to regions which are adjacent
to Wales such as the North-West, West Midlands, South-East and South-West.
Also of interest in the context of population dynamics is the effect on the dependency
ratio, the number of working age divided by the number of pension age. This stood at
3.02 in 2004 and compares unfavourably to the rest of the UK. Following the EU’s
Employment Directive on Equal Treatment, which outlaws discrimination at work on
grounds of age (as well as sexual orientation disability and religion), the UK is obliged
to implement legislation against age discrimination by (1st October) 2006.
Furthermore, it is the intention of the Government to have legislation in place earlier, in
order to allow time for adjustment to the new arrangements.
The Government has concluded that legislation should set a default retirement age of
65, but also create a right for employees to request working beyond a compulsory
retirement age, which employers will have a duty to consider.3 This will complicate the
definition of the working population. More critically, increased longevity will have an
adverse effect on the dependency ratio and encourage delayed retirement to ensure
adequate pension provision. The pace of labour force ageing in Wales as in the rest
of the UK is relatively slow by OECD standards, but is likely to accelerate if increased
numbers of older workers delay their retirement. Dixon (2003)4 points out that key
issues include 3 See Equality and Diversity Age Matters: Age Consultation 2003.DTI, Crown Copyright, 2003, http://www.dti.gov.uk4 S.Dixon, Implications of Population Ageing for the Labour Market, Labour Market Trends, February, 2003, pp. 67-76.
20

Learning and Labour Market Intelligence for Wales: National Report 2006
the need to maintain the employability of older workers who wish to remain in work,
the need to avoid obsolescence in older workers’ skills through lifelong learning
and
the need to ensure that mobility is sufficient to adjust to future changes in the
location and composition of jobs.
Gross Value Added (GVA)
Gross value added5 is the difference between the values of inputs and outputs and
therefore can be used to measure regional rates of economic growth. Measured in
current basic prices and before allowing for inflation, GVA grew by 51% in Wales
between 1995 and 2004 and between 2000 and 2004 it increased by 24% (Table 1.4),
which was marginally greater than the UK average. Of particular importance are the
factor shares in value added and over the whole period labour’s share has grown from
60% to 65%, while the (apparent) profit share has correspondingly fallen from 40% to
35%. This is likely to inhibit investment, although factor shares have been relatively
more stable since 2000.
GVA per head is a better measure when comparing economic performance and
prosperity between countries (Table 1.5). On this measure, Wales continues to
perform poorly by the standards of other regions of the United Kingdom as well as the
EU average (and hence qualifies for EU development assistance). GVA per head in
Wales declined from 83.7% of the UK average in 1995 to 78.9% in 2001, and has
remained roughly at this level.
Structural change in the Welsh Economy will contribute to these outcomes. The share
of manufacturing in total GVA has fallen from 30% in 1993 to 19% in 2003 and
recorded GVA per head in manufacturing tends to be higher than in services, the
share of which increased from 57% to 69% over this same period. The most marked
5 The headline estimates that are presented are a moving average based ‘trend’ of the unadjusted estimates for each region. The trending removes some of the year-to-year volatility in the unadjusted series. Under the European System of Accounts 1995 (ESA 95) the term GVA is used to denote estimates that were previously known as gross domestic product (GDP) at basic prices. Under ESA 95 the term GDP denotes GVA plus taxes (less subsidies) on products i.e. at market prices. Regional Accounts are only published at basic prices.
21

Learning and Labour Market Intelligence for Wales: National Report 2006
increase in share of total GVA occurred in Real Estate, Renting and Business
Activities (see Figure 1.1).
The Consultation Document Wales: A Vibrant Economy (2005)6 (WAVE) attributes
60% to 70% of the total gap between Wales and the rest of the UK to lower average
value added per job; 20% to 30% is attributed to a relatively low employment rate and
around 10% of the gap to Wales having an above average share of the population not
in the labour force. Further, the WAVE Consultation Document suggests that the
economic activity rate is hampering the rapid relative improvement of Welsh GVA per
head.
Within Wales the objective of the Welsh Assembly Government has been to narrow
the disparities between East Wales and the Objective One area of West Wales and
the Valleys in terms of GDP per head, earnings and employment, especially through
the use of Objective One funding. Recent benchmarking work by WELMERC using an
index combining employment, income and human capital shows that over the period
2000-2005 the relative labour market improvement in the Objective One area (14.22%)
was actually exceeded by that in the Objective Three area of East Wales (13.73%).7
Businesses Formation and SurvivalComprehensive coverage of business stocks and flows are not available in the UK and
VAT registrations and de-registrations are the best official guide to business start-ups
and closures. They are an indicator of entrepreneurship and used judiciously can yield
insights into business formation and survival rates.
The VAT data are produced by the Small Business Service (SBS) Statistics Unit and
are based on data collected from the Inter Departmental Business Register (IDBR). On
a cautionary note however, the registrations and de-registrations data do not equate to
‘actual’ business closures or start-ups. Firms can be removed from the VAT register
for a variety of reasons including; falling turnover, mergers, takeovers and relocations
as well as the business actually ceasing to trade. However, VAT registrations and de-
registrations are thought to be indicative of the underlying rate of business ‘births’ and
‘deaths’.
6 Wales: A Vibrant Economy, The Welsh Assembly Government’s Strategic Framework For Economic Development, Consultation Document, November 2005.7 WELMERC Calculation.
22

Learning and Labour Market Intelligence for Wales: National Report 2006
It is common to express registrations and deregistrations either as a percentage of the
stock of VAT businesses or as a proportion of the resident (or working) population.
Both conventions have been adopted in this report because levels of entrepreneurship
can appear high or low depending on which denominator is applied (Table 1.6).
In 2004, registrations in Wales amounted to 8.7 % of the VAT stock and lower than the
registration rate in Scotland and England. However, relative to its population, the
business formation rate in Wales is 23 per 10,000 residents. Although still lower than
that in England, this is the same as the formation rate in Scotland.
Within Wales, the highest and lowest registration rates, measured in relation to the
business stock, are in South East Wales and Mid Wales respectively (at 10.8% and
5.0%). However, on a per capita basis, business starts (at 29 per 10,000 residents)
are higher in Mid Wales than in South East Wales (at just 22). The reason for this
reversal is linked to differences in business density and firm size. Accordingly, South
East Wales has substantially fewer firms per head of population than Mid Wales but
the average firm size is much larger in South East Wales. The effect of the smaller
density is to artificially inflate the ratio of registration to VAT stock.
Turning to business survival and closure,8 regions with high levels of registrations also
tend to exhibit higher de-registration. This reflects the short lifespan of many new
enterprises. Typically in Wales, the 12 month survival rate of new registrations is just
under 90% and this falls to around 60% after 4 years (Figure 1.2).
The correlation between registrations and deregistrations implies that calculated
closure rates are subject to the same problems of interpretation as are encountered
with the business formation rate. However, the difference between registrations and
deregistrations – the net registration rate, is less prone to ambiguity. Thus in Table 1.6
the net rate of business closure is unambiguously greater in Mid Wales than in South
East Wales, irrespective of how it is measured.
8 Closure does not necessary imply business failure. Businesses close for a variety of reasons - the owner may have retired; the business may have been taken over or (in the case of region data), the businesses may have relocated.
23

Learning and Labour Market Intelligence for Wales: National Report 2006
At the close of 2004 Wales had just over 80,000 VAT registered businesses, an
increase of 250 on the year start. However, Wales’ VAT enterprises are highly
concentrated in just three sectors, Agriculture and Fishing (19.9%), Wholesale and
Retail (21.0%) and Real Estate, Business Services (18.5%). Compared to Great
Britain as a whole, Wales is over-represented in Agriculture and Fishing, and Hotels
and Restaurants and under-represented in Finance and Real Estate, Business
Services (Table 1.7). Turnover in the VAT register is high particularly in Mining and
Energy/Water and in Hotels and Restaurants. During 2004 significant growth is
observed in the VAT stock in Real Estate and Business Services, Hotels and
Restaurants and in Construction. There were also significant falls recorded in the
number of VAT registered businesses in Agriculture and fishing (Table 1.8).
Size Distribution of BusinessThe size structure of Welsh Business matters to the extent there are potential
economies and diseconomies of scale. Micro enterprises (employing less than 10
people) account for no less than 94% of the business stock, though only 31% of
employment and 18% of turnover (Table 1.9). These percentages are little different
than elsewhere in the UK. Just under 1% of establishments in Wales are large
(employing 250+ workers), compared to only 0.2% in the rest of the UK and though
they employ a lower proportion of workers than in the rest of the UK they account for
57.3% of the turnover, with the corresponding figure in the rest of the UK only 50.1%.
This suggests that productivity in large establishments is higher than in the rest of the
UK, though this may be due to differences in industrial distribution.
Economies or diseconomies of scale may apply to individual establishments as well as
companies as a whole. In 2003 no less than 67.6% of all establishments in Wales had
no employees; they were single employer businesses.9 Nonetheless, they accounted
for nearly 16% of total employment in Wales. SMEs are normally defined as
enterprises employing less than 250 workers. Though Table 1.10 does not provide
information on company employment, (apart from single establishment enterprises) no
9 According to J. Hurstfield and B. Newton (Small Businesses Service - Annual Survey of Small Businesses, Wales 2003, Institute for Employment Studies Brighton, 2004), the most common rationale for starting a new business was to develop an existing attribute (an idea, hobby or skill) and 70% of owners in new businesses had previously been in full-time employment. Nearly half had not sought any advice before starting up the new business. Obstacles to business creation which were most often cited were regulations, taxation and competition.
24

Learning and Labour Market Intelligence for Wales: National Report 2006
less than 99.8% of Welsh establishments employ less than 250 and these account for
80.2% of all employment. It is clear that SMEs are critical to the future of the Welsh
Economy. Since small firms tend to employ individuals with relatively low endowments
of human capital and many are too small to employ functional specialists in areas such
as finance, marketing and human resource management, their training needs are likely
to be substantial.
Exports
Figures are available up to quarter three 2005 (Table 1.11). These show that in recent
years export sales from Wales have improved relative to the UK total. Wales’ share of
total UK exports now comes to around 4.5%. Although Wales’ share of non EU exports
is lower (at just under 4%), the gain in share here has been more impressive.
The Welsh Assembly Government assists firms to overcome barriers and exploit
opportunities by meeting demand-led training requirements and improving the skills
base of the labour force.
Size of firm is important to export generation. In the Small Business Survey 2003 only
one in ten employers were exporters and for most of these, their principle markets
were close to home, with exports providing only a minority of their turnover. Thus, only
3% said that most of their output was exported abroad.
Research and Development Expenditure (R&D)
The Assembly’s Consultation Document WAVE (2005) also reports earnings increases
are sustainable only if they are underpinned by increases in the value created by
workers. One way of increasing earnings for new and existing employees is for
companies to locate their R&D units in Wales. Wales has not been successful on this
front.
At just 1.3% of Gross Value Added, R & D expenditure in Wales is among the lowest
of the UK regions (only the West Midlands, Yorkshire and Humberside and Northern
Ireland having lower percentages in 2003). However, as important as the level, is the
25

Learning and Labour Market Intelligence for Wales: National Report 2006
composition of R & D expenditure. In the UK as a whole 66% of R & D activity is
performed within business compared to 10% within Government establishments and
21% within Higher Education Institutions (mainly universities). In Wales business R &
D is just 55% of the total while the higher education sector accounts for 36%. The
government share of R & D spending is roughly the same in Wales as in the rest of the
UK. Evidently the University sector is an important contributor to R & D activity in
Wales (Table 1.12).
Employment in R & D activities, which requires high levels of skills and expertise, is
equally low in Wales with around 4,000 full-time equivalents or 0.3% of the regional
labour force (slightly up on the previous year) engaged on R & D in the Business and
Government sectors in 2003. There is a high concentration of such employment in
Southern England, reflecting the fact that R & D rarely takes place in peripheral plants
(Table 1.13). The figures are also consistent with other evidence which shows lower
levels of demand for high-level skills in Wales than in other regions. It appears also
that foreign firms establishing operations in Wales are not locating R & D functions
here. The relatively low incidence of R & D in Welsh businesses reflects the fact that
relatively high R & D intensive companies are under-represented within Wales. This
is recognised by the WDA which is attempting to promote Wales as a centre for new
industries, such as telecommunications, electronics and multi-media and software
design. The attainment of this objective requires the existence of sufficiently large
pool of highly qualified labour.
Skills and Productivity
Although there have been some concerns about global economic slowdown, the
medium term growth prospects for the world economy remain quite favourable.
However, if Britain (and Wales) is to share in the benefits of this revival in activity it
must be adequately prepared for a recovery which is almost entirely based on jobless
growth – where increases in economic prosperity are productivity based.
The Leitch Review10 identifies skills as a key driver of economic growth, which boosts
productivity and contributing to increased employment. Skills play a major role in
10 Leitch Review of Skills: Skills in the UK: The Long-term Challenge, Interim Report, December 2005.
26

Learning and Labour Market Intelligence for Wales: National Report 2006
improving long-term growth and prosperity of a country. The Review (LR) also
suggests investment in skills is becoming increasingly critical if the UK is to effectively
meet global challenges.
This contrasts with past experience. For the last two decades real GDP growth in the
UK has exceeded the EU average. However, this was almost entirely because the UK
achieved more rapid employment growth than the EU countries (SSDA,2004)11. In
terms of productivity growth, the UK’s performance has been considerably poorer. The
Leitch Review (2005) reports that its prosperity has been constrained by its relatively
poor skills base. A poor skills base constrains productivity and rises in employment.
In addition, the skills of the population are one of the major determinants of the output
produced from one hour worked. Table 1.14 shows that the UK performs below the EU
average in terms of labour productivity per hour worked, with an index value of 90
relative to 100 (EU average) or a performance of 90% of the EU average. This puts
the UK in 16th position on the international ranking, well below countries like Norway
and Belgium. Recent work (see below) estimates that GDP per hour worked in Wales
(2002) is 71% of the EU average. This is well below the figure of 89% for the UK.
The challenge confronting UK business generally and Welsh business especially is
how to secure more value added from the same quantity (or less) of jobs. To raise
productivity requires that businesses do things better. That in turn requires a skilled
workforce that can respond quickly and effectively to rapidly changing markets and
conditions. The WAVE Report suggests the priority for Wales is to improve the skills
base using the opportunities created by the mergers to provide more demand-led
training tailored to meet the requirements of businesses.
The WAVE Consultation Document reports that the Assembly Government has an
extensive policy agenda set out in the Skills and Employment Action Plan 2005 (SEAP
2005) to improve the skills of new entrants to the labour market and of those currently
in employment. This is one of the four objectives it identifies pertaining to skills.
A range of indicators are being developed by WELMERC in order to determine the
relative international position of Wales in lifelong learning, and to enable DELLS to
11 The UK Skills and Productivity Agenda: The Evidence Base for the SSDA’s, Strategic Plan 2005-2008, September 2004 (see http://www.ssda.org.uk):
27

Learning and Labour Market Intelligence for Wales: National Report 2006
identify areas of particularly good or bad performance. Setting up a benchmark that
will be updated will also allow areas of improvement or deterioration to be identified.
The indicators are all supplied by international organisations, which ensure quality
control and harmonisation through a standard methodology. The central production of
statistics also ensures they are defined using standardised international conventions.
Table 1.15 gives full definitions and sources of the indicators used.
The results of the first stage of this project have recently been published. These show
the UK has a relatively good performance in lifelong learning participation, with Wales
being ranked 6th. The UK also performs well in workforce development, being ranked
4th when participation in CVT courses is considered. The two indicators constructed
from PISA data youth literacy and numeracy also display relatively good performance
when compared to the OECD average. In terms of labour market outcomes the UK
has one of the highest rates of return to education illustrating the importance of
education in the labour market.
However the UK/Wales performs relatively badly in several aspects of lifelong
learning. The rate of participation in education and training for youths is lower in Wales
than the all-country mean. Wales also does relatively poorly in terms of the proportion
of adults not achieving basic literacy levels. The labour force participation rate in
Wales of those without upper secondary education is considerably less than the
country mean, reinforcing the importance of obtaining qualifications in the UK.
Indeed, few countries perform consistently well. This may be due to inter-relationships
between indicators and conflicting policy goals. For example, adult literacy measures
are likely to be highly correlated with youth literacy measures and participation rates
will affect rates of attainment. The resources invested into education may also affect
the capacity or quality of the education system, and thus may influence participation
and or attainment. Countries such as Sweden or Switzerland do perform better on a
more consistent basis.
28
Learning and Labour Market Intelligence for Wales: National Report 2006
Employment and Skills Forecasts:- SectorsForecasts for the Welsh economy (Future Skills Wales, 2003; SSDA, 2003) indicate
that employment in Wales will grow at around 0.3% a year to the end of the current
decade, while across the whole of the UK the corresponding estimate is nearer 0.6%
per year. These increases will be concentrated in the service economy and in
particular in:
Wholesale and Retail Other Business Services Health Other Services (Sewage and Refuse Disposal, Leisure, Domestic Services).
It is expected that productivity gains in Wales will drive increases in output without the need for further employment. This trend is predicted in financial services, transport
and communications, construction, agriculture and manufacturing, where job levels are
likely to decline despite continued increases in sector output (Table 1.16)
Predicted rates of job loss are expected to exceed the UK average in the primary
sector and utilities, manufacturing and construction (IER/SSDA, 2004)12. The largest
decline is anticipated in manufacturing which may lose some 35,000 jobs in the 10
years to 2012. Other major losses over this period include around 8,000 in the primary
sector and utilities and 11,000 in construction.
- Occupations
Occupational classifications cut across industries and each is associated with a
particular set of skills. Since 1998, the occupational mix in both Wales and the UK has
changed with a movement towards professional, sales, administrative and care
12 Working Futures: New Projections of Employment by Sector and Region, Institute for Employment Research, University of Warwick, 2004 http://www.ssda.org.uk/ssda/PDF/sectoral_report.pdf
29

Learning and Labour Market Intelligence for Wales: National Report 2006
occupations and away from skilled trades (although Wales has not always followed
this trend), secretarial and agricultural occupations. The strongest employment growth
in Wales since 1998 has been in:
Textiles, Printing and Other Skilled Trades
Caring Personal Services
Science and Technology Associated Professionals
Sales
Culture, Media and Sports
Teaching and Research Professionals
Health and Social Welfare Associate Professionals
Business and Public Service Associate Professionals.
Looking forward to 2008 occupational growth is likely to concentrate in those areas
relating to health, leisure, sales and service support, particularly the following
occupations (Table 1.17)
Health Professionals
Secretarial and Related
Caring Personal Service
Health and Social Welfare Associate Professionals
Culture, Media and Sports
Leisure and Personal Service
Sales
Business and Public Service Associate Professionals.
- Skills
Generic skills, which include abilities such as good oral communication, initiative and
problem solving are fundamental to the process of re-skilling the Welsh labour force.
These are increasingly in demand by progressive employers and are particularly
valuable when combined with technical and sector specific knowledge. They have
been closely identified with skills gaps in communication, team working and customer
service – a shortfall that is allegedly preventing many firms from expanding into new
higher quality products or services.
30
Learning and Labour Market Intelligence for Wales: National Report 2006
Increases in generic skill needs in Wales are anticipated across the board (Figure 1.3)
but are likely to be especially concentrated in the following areas (ranked in order of
mean score with increase in the proportion of employers demanding an advanced
level of skills shown in brackets):
Understanding customer needs: 3.1 (7%)
Communication skills: 3.0 (6%)
Adaptability and flexibility: 3.0 (6%)
Showing initiative: 2.9 (6%)
Ability to follow instructions: 2.9 (5%)
Team working: 2.9 (5%).
Until recently obtaining an informed picture of the skills demanded within individual
sectors in Wales have been patchy. However as a consequence of research
programmes such as FSW and the establishment of the Sector Skills Development
initiative, analysts and policy makers are beginning to gain a better understanding of
the skills and learning issues at sector level. An important innovation has been the
development of a new resource – in the form of a Sector Skills Matrix. While still
under development this permits access to a range of comparable data for 27 industry
categories and 14 more aggregate sector groupings. The matrix also attempts to
integrate broader (macro) labour market data from sources such as ONS with more
specific information such as hard to fill vacancies, skills shortage vacancies and skills
gaps.
It is the single most comprehensive source of sector data available. Whilst covering
the UK as a whole, breakdowns for Wales, are also permitted. For richer, deeper
intelligence on specific sectors, users should consult the relevant SSC and links to
them are also provided within the Matrix.
Drawing on the skills matrix Table 1.18 shows that overall some 14% of Welsh
establishments were reporting hard–to-fill (HTF) vacancies during 2003. Recruitment
difficulties were particularly acute in manufacturing establishments (16%), the
construction industry (16%) and in health and social work (18%). However only in the
manufacturing and construction industry were skill shortage vacancies (SSVs) also at
31

Learning and Labour Market Intelligence for Wales: National Report 2006
correspondingly high levels (11% of establishments). In contrast in health and social
work only 6% of establishments reported SSVs despite 18% claiming HTF vacancies.
This suggests that the recruitment difficulties in this sector may be linked to other
factors (such as pay and conditions) rather than skills. Rather interestingly, and
perhaps by no coincidence, reported skills gaps were greatest in health and social
work.
Future Skills Wales
First started in 1998, the Future Skills Wales project is now an established research
programme designed to monitor skills needs and development in Wales. Results from
the latest (2005) employer survey13 are now available. These show there has been a
slight improvement in terms of hard-to-fill vacancies and skill shortages in Wales with
10% of establishments reporting hard-to-fill vacancies (14% in 2003)
4% of establishments reporting skill shortage vacancies (7% in 2003)
Recruitment problems were greatest in micro establishments. These account for
19% of employment but 51% of hard-to-fill vacancies, and 55% of skill shortage
vacancies.
Occupations with the highest proportion of hard-to-fill vacancies reported were
Skilled Trades, Associate Professional occupations and Elementary occupations.
Skill shortage vacancies were most commonly thought to relate to a lack of:
Technical and practical skills (52%);
Customer handling skills (44%);
Communication skills (43%);
Problem solving skills (41%)
However the incidence of skills gaps appears to be largely unchanged compared to
the 2003 position with 18% of employers reporting workforce skills gaps (6% of the
Welsh workforce). Sectors reporting the highest incidence of skill gaps were
Production, Construction, Wholesale/Retail and Hotels/Catering. Skills gaps were also
13 http://www.futureskillswales.com/eng/content.php?cID=5&pID=1&zID=100&nhID=136
32

Learning and Labour Market Intelligence for Wales: National Report 2006
found to vary by employment size: establishments with 100+ employees were 3 times
as likely to report a skills gap as those with 1-9 employees.
The most commonly lacking skills among employers reporting skills gaps were generic
skills such as problem solving (58% of establishments), customer handling skills
(57%), other technical and practical skills (52%).
The response of employers experiencing skill gaps was positive with the majority of
establishments providing further training/development to their existing workforce.
Other measures such as increasing recruitment or expanding recruitment channels
were less common. More than one half of employers (58%) in the 2005 survey
reported providing off-the-job training to their workforce. This is a slight increase since
2003. Industry sectors most likely to provide this type of training were:
Public Administration/Education/Health (88%);
Banking/Insurance/Other Financial
Services (60%);
Construction (58%)
Other Services (58%).
As in previous FSW surveys, Managers and Administration/Secretarial occupations
were most likely to receive off-the-job training (65% and 35% respectively of
establishments had provided training for these groups). This compares to just 9% for
Process, Plant and Machine Operatives and 12% for Personal Service occupations.
This may be partly because on-the-job training is more appropriate and consistent with
the higher incidence of skills gaps observed in these occupations. However it may
indicate a prevailing culture of overlooking certain occupations when it comes to
providing off-the-job training.
The 2005 Employers Panel Survey
The results of the 2005 ELWa Employers Panel Survey indicate the extent to which
employers perceive a need for training within different occupations and how they have
responded. These show that two thirds (67%) of establishments had provided on-the-
33

Learning and Labour Market Intelligence for Wales: National Report 2006
job training in the last year (2005). The most common category of on-the-job training
was ‘other technical/practical skills’. This type of training was the most prevalent for
those classified as associate professional occupations (52%), skilled trade
occupations (46%) and process/plant/machine operatives (54%).
Just over a half (55%) of establishments had provided their staff with off-the-job training. The most frequently provided off-the-job training was ‘other
technical/practical skills’. Again, this type of training was most likely to have been
provided to professional occupations (30%), associate professional occupations
(35%), skilled trade occupations (29%), process/plant/machine operatives (27%) and
elementary occupations (19%). Table 1.19 provides a two dimensional description of
the priority and incidence of the various types of off-the-job training per occupational
group.
When asked what types of training had been planned for employees ‘other
technical/practical skills’ were the most frequently mentioned. However, more than a
third mentioned:
team working (43%)
customer handling skills (41%)
communication skills (39%)
management skills (37%)
problem solving skills (36%)
general IT user skills (36%)
Almost one in ten (9%) establishments had experienced difficulties over the last year
in finding an appropriate training provider. Public sector establishments were
particularly likely to have experienced problems (15%). The small number of
establishments which had difficulty finding a provider found it most difficult to find a
trainer for IT and computing (14%), job related/specific training (11%) and NVQ
training (11%). When asked what happened as a result of their difficulties in finding a
training provider, the most frequently given response was that they did not undertake
that type of training (43%).
34
Learning and Labour Market Intelligence for Wales: National Report 2006
Welsh Index of DeprivationThe Welsh Index of Multiple Deprivation 2005 (WIMD) is the official measure of
deprivation for small areas in Wales. It was developed for the Welsh Assembly
Government by the Assembly’s Statistical Directorate and the Local Government Data
Unit (Wales). It replaces the index which was produced in 2000.
The 2005 index has been based on new geographies called Super Output Areas
(SOAs) each having roughly the same population. There are three levels: Lower Layer
(the smallest), Middle Layer, and Upper Layer (the largest). There are 1,896 Lower
Layer Super Output Areas (LSOAs) in Wales each having about 1,500 people.
Deprivation scores have been worked out for each of these LSOAs: higher scores
mean more deprivation.
Users should note there are limitations to the use of the Index:
The following domains and weights were use to calculate the overall index of
deprivation
Domain Weight (%)Income 25
Employment 25
Health 15
Education, Skills, Training 15
35
Differences in deprivation score can only be interpreted qualitatively. Thus if area A has a score of 40 and area B one of 20, it does not follow that A is twice as deprived as B
Deprivation scores from the 2005 index cannot be compared with those from 2000 as the index was calculated differently.
Deprivation scores cannot be compared with those from the deprivation indexes of other parts of the UK.
There are no official local authority deprivation scores. Local authority scores can be worked out but there are several ways to do it, and there is no single obviously right way to do it.
Learning and Labour Market Intelligence for Wales: National Report 2006
Housing 5
Physical environment 5
Geographical access to services 10
Deprivations scores for the overall index were derived by combining the seven domain
indexes.
Results – Overview
The overall deprivation scores in Wales ranged from 78.1 to 1.4, with larger figures
indicating higher levels of deprivation. Ranks in the WIMD 2005 range between 1 and
1896, with 1 indicating the most deprived LSOA in Wales.
The 5 most deprived LSOAs in Wales are:
Butetown 2 , Cardiff (W01001700) Rhyl West 2, Denbighshire (W01000240) Penydarren 1, Merthyr Tydfil (W01001308) Penrhiwceiber 1, Rhondda Cynon Taf (W01001209) Castle 2, Swansea (W01000743)
There are 190 LSOAs in the most deprived 10% in Wales for all deprivation measures.
The number and percentage of areas within each Unitary Authority area are shown in
Table 1.20. This shows Cardiff (17%), Rhondda Cynon Taff (15%), and Swansea
(12%), accounted for the greatest share of the SOAs in the most deprived 10% in
Wales, for overall deprivation. Merthyr Tydfil (39%), Blaenau Gwent (26%), Neath Port
Talbot (19%), and Rhondda Cynon Taff (19%) had the highest concentration of their SOAs in the most deprived 10% in Wales, for overall deprivation.
Separate area rankings can be derived for the Education, Skills and Training domain
alone. It turns out these correspond broadly with rankings obtained from the overall
index of multiple deprivation as is illustrated in Figure 1.4. This is not altogether
surprising and merely emphasizes an association between the domains that make up
the aggregate index. More interesting perhaps is the dispersion of the data around the
overall index. While beyond the scope of this report, this dispersion merits further
investigation.
36

Learning and Labour Market Intelligence for Wales: National Report 2006
ConclusionsThe gradual increase in the population of Wales is likely to be helpful in the context of
economic growth, but the ageing of the workforce, together with the deterioration in the
dependency ratio will pose an increasing challenge in the coming years. Employers
will also need to be educated about the implications of the new age discrimination
legislation and associated changes to retirement provisions.
Particular problems for the Welsh economy are low gross value added (GVA) per
head, a relatively poor skills base, the relative absence of very large enterprises, an
over-representation of very small enterprises and relatively low R & D expenditure.
However, the economy is growing relatively rapidly as are exports. There are,
nonetheless, distributional issues, since the gap in GDP and employment between the
Objective One area (West Wales and the Valleys) and the rest of Wales has not
narrowed, despite large scale Objective One funding for the former. As the focus of
European Union redistribution activities moves in favour of the accession countries,
Wales may be particularly susceptible to new competition.
There are clear implications for DELLS. Greater emphasis is required on re-skilling
middle-aged and older workers and adult returners to the workforce, paying attention
to the fact that the overall rate of return to education and training diminishes with age.
More general research on SMEs suggests they are less likely to provide formal
learning opportunities for their employees than larger firms, though they are
disproportionately affected by skill shortages. Consideration needs to be given to
overcoming this training deficit, particularly where there is potential for future
employment growth. Further training support is required in the field of entrepreneurial
and management skills in order to support new business starts and their survival. The
Wales Management Council’s Agenda for Action document has emphasised the
importance of the evaluation of Management and Leadership Development (MLD) and
has recently reported on the matter. The Report Measuring the Difference, 200614 by
the Wales Management Council has put forward a way of assisting SMEs to measure
Management and Leadership Development (MLD) activity on the performance of
14 O’Connor, S. (2006), Measuring the Difference, How to evaluate the impact of management and leadership development, Leed Unit, Cardiff Business School, February 2006.
37
Learning and Labour Market Intelligence for Wales: National Report 2006
business. The Report claims to have developed an evaluation tool and accompanying
guidance notes for SMEs and their managers who are investing in MLD.
Consideration of how to increase R & D expenditure in Wales is complex. Is the
existing distribution of resources between business and universities appropriate? Can
the number of highly qualified individuals be increased to ensure that competitiveness
is maintained and enhanced? What role will the Techniums developed by the WDA
play in this process? It should be noted that large numbers of well qualified Welsh
Graduates either commute to work in England or migrate there, so that the creation of
more highly qualified jobs in Wales may serve to keep such individuals in Wales, while
at the same time encouraging businesses to move resources in this direction.
38

Learning and Labour Market Intelligence for Wales: National Report 2006
Table 1.1: Population and Migration: Population Change, 1994 to 2004, by Age
Population and Migration: Population Change, Mid 1994 to Mid 2004, by AgeChange
from 1994Mid 1994 Mid 2004 1994-2004 %
Total population All ages 2,887,300 2,952,500 65,200 2.3%
Children: Pre-school 0-4 187,400 159,000 -28,400 -15.2% School age 5-9 192,900 178,300 -14,600 -7.6% 10-14 186,100 195,300 9,200 4.9%Total Under 15 566,400 532,600 -33,800 -6.0%
Working age 15-29 565,800 540,500 -25,300 -4.5% 30-44 581,400 607,800 26,400 4.5% 45-59 525,100 587,500 62,400 11.9% 60-64M 72,100 81,800 9,700 13.5%Total 15-59F/64M 1,744,400 1,817,600 73,200 4.2%
Retirement age 60-64F 76,700 84,500 7,800 10.2% 65-74 288,900 270,200 -18,700 -6.5% 75-84 160,300 187,900 27,600 17.2% 85+ 50,600 59,700 9,100 18.0%Total 60F/65M+ 576,500 602,300 25,800 4.5%
Source: Registrar-General's mid year estimates, ONS
39
The population of Wales reached 2.95 million in mid 2004, up by 2.3% on the 1994 figure.The other key feature of these data is the changing age distribution. Compared to 1993 there are
34,000 fewer children 73,000 more people of working age 26,000 more above the statutory retirement age – while the number of people aged 75
or over has increased by 37,000

Learning and Labour Market Intelligence for Wales: National Report 2006
Table 1.2: 2004-Based Population Projections for Wales
2004-based population projections for WalesWALES Population projections based
Year 2004 2008 2011 2016 2021Thousands
0-14 533 512 502 500 508 15-19 199 202 195 181 17220-29 342 378 394 401 37930-44 608 575 557 548 582 45-59 588 595 610 635 619 60-74 437 484 515 547 569
75 &over 247 256 265 290 335 All Ages 2,954 3,002 3,038 3,102 3,164
Percentages0-14 18.0 17.1 16.5 16.1 16.1
15-19 6.7 6.7 6.4 5.8 5.420-29 11.6 12.6 13.0 12.9 12.030-44 20.6 19.2 18.3 17.7 18.445-59 19.9 19.8 20.1 20.5 19.660-74 14.8 16.1 17.0 17.6 18.0
75 &over 8.4 8.5 8.7 9.3 10.6All Ages 100.0 100.0 100.0 100.0 100.0
Source: Government Actuary's Department 2004-Based Principal Population Projections For Wales. October 2005
http://www.gad.gov.uk/Population_Projections/Population_projections_background.htm
40
Table 1.2 By 2008, the population of Wales will have exceeded (just) the 3 million mark. Ageing is a feature of these data, although the fall in the number of children starts to mod-
erate from 2011. The population of retirement age continues to swell. While the increase in the total
population between 2004-2021 is some 7%, the retirement age population will increase by around 17%.

Learning and Labour Market Intelligence for Wales: National Report 2006
Table 1.3: Population Migration to Year Ending December 2004
Population Migration 2004
Origin Wales Destination Wales
Figures in Thousands (out-migration) (in-migration) Net movement
Destination OriginNorth East 1 North East 1 0North West 8 North West 11 3Yorkshire and Humber 3 Yorkshire and Humber 3 0East Midlands 3 East Midlands 4 0West Midlands 8 West Midlands 10 2East 3 East 4 1London 5 London 7 2South East 7 South East 11 4South West 10 South West 11 2 England 47 England 61 15Scotland 2 Scotland 2 0Northern Ireland 1 Northern Ireland - - United Kingdom 49 United Kingdom 63 15Numbers are rounded to the nearest 1000 so the total of English regions is not the same as the England figure. The data are based on patients re-registering with NHS doctors in other parts of the United KingdomSource: National Statistics.
http://www.statistics.gov.uk/STATBASE/ssdataset.asp?vlnk=8906
41
Table 1.3: At 14,000 net in-migration was positive – more people moved into Wales than left. The more important donor and destination regions were not surprisingly those adjacent to Wales, though 1 in 4 people who left Wales moved to London and the South East

Learning and Labour Market Intelligence for Wales: National Report 2006
Table 1.4: Gross Value Added by Income Component, 1995-2004
Wales
Compensation of employees
(£ million)
Percentage of total gross
value added
Other income (gross operating surplus/mixed
income) (£ million)
Percentage of total gross
value added
Total gross value added £
million1995 15,680 60.1% 10,392 39.9% 26,072
2000 20,368 64.2% 11,367 35.8% 31,7352001 21,612 64.5% 11,900 35.5% 33,5122002 22,808 64.7% 12,469 35.3% 35,2772003 24,130 64.6% 13,229 35.4% 37,3592004 25,526 65.0% 13,717 35.0% 39,243Note: GVA is residence based at current basic pricesSource: STATSWALEShttp://www.statswales.wales.gov.uk/TableViewer/tableView.aspx?ReportId=115
Table 1.5 GVA per head: UK CountryGross Value Added per Head
at current basic prices£/head England Wales Scotland Northern
Ireland1995 10,956 9,026 10,857 8,703
2000 14,247 10,917 13,312 11,2412001 14,938 11,515 13,864 11,7312002 15,711 12,067 14,658 12,2742003 16,521 12,716 15,523 12,8932004 17,188 13,292 16,157 13,482
Index UK=1001995 101.6 83.7 100.6 80.7
2000 102.4 78.4 95.7 80.82001 102.4 78.9 95.1 80.42002 102.4 78.6 95.5 80.02003 102.3 78.8 96.2 79.92004 102.3 79.1 96.2 80.2
Source: STATSWALESEstimates of regional GVA in this table are on a residence basis, where the income of commuters is alloc-ated to where they live rather than their place of work.
42
Table 1.5: GVA per head of population is less than 80% of the UK average and is the lowest of the 4 regions
Figure 1.1: Gross Value Added by Industry 1990-2003
Source: National Statistics: http://www.statistics.gov.uk/downloads/theme_economy/NUTS1_Tables_1-8.xls
43
Structural change in the Welsh economy has resulted in a steady decline in the relative importance of manufacturing in the eco-nomy and corresponding increases in services. Since 1990, the share of manufacturing in total GVA has fallen from 30% to 19% while the service industry’s contribution has increased from 58% to 72%.

Table 1.6: Business Births, Deaths and Density
Percent of VAT Stock Per 10,000 resident population Firm SizeEmployees
per ABI Workplace
Unit
Registration Deregistration Net Registration
Registration Deregistration Net Registration
Business Density
England 10.2 10.1 0.1 32 31 1 310 11
Scotland 9.3 9.4 -0.1 23 24 -1 250 14
Wales 8.7 8.3 0.4 23 23 0 271 12
North Wales 8.3 8.2 0.1 25 24 0 300 11
Mid Wales 5.0 6.5 -1.4 29 37 -8 571 8
South West Wales 8.1 8.4 -0.3 23 24 -1 281 11
South East Wales 10.8 9.2 1.6 22 19 3 207 14
Note: Regions are amalgamations of Unitary Authority areas and not conform to DELLS (formerly ELWa) planning regions.
Source: National Statistics (NOMIS tables): VAT registrations/deregistrations by industry 2004 ; Midyear population estimates 2004; Annual Business Inquiry workplace analysis 2004
44
Figure 1.2: Survival of 1998 First Registrations at 6 months – 48 months: Wales
Source: Small Business Servicehttp://www.sbs.gov.uk/SBS_Gov_files/researchandstats/survival-jan-2004.xls
45

Table 1.7: VAT Registered Businesses by Industrial Group, Wales and GB, 2004
VAT registered businesses by industrial group, Wales and GB, 2004
WalesWales % of
totalGreat Britain % of
totalLocation Quotient
Wales/GBAgriculture; fishing 15,890 19.9 7.0 2.8Mining; energy/water 85 0.1 0.1 1.1Manufacturing 5,870 7.3 8.4 0.9Construction 9,215 11.5 11.2 1.0Wholesale & retail 16,830 21.0 21.3 1.0Hotels & restaurants 7,580 9.5 7.2 1.3Transport & communications 3,485 4.4 4.4 1.0Finance 355 0.4 1.0 0.4Real estate, business services 14,800 18.5 29.7 0.6Public administration; other 4,780 6.0 8.1 0.7Education; health 1,125 1.4 1.5 0.9Total 80,015 100.0 100.0 1.0Source: National Statistics; www.nomisweb.co.uk
Table 1.8: VAT Registrations and Deregistrations by Industrial Group 2004, Wales
Business start-ups by industrial group 2004, Wales
Registrations as
% of stock beginning 2004
Deregistrations as
% of stock beginning 2004
Absolute change in VAT
Stock
Year end VAT Stock
Agriculture; fishing 2 6 -695 15,890Mining; energy/water 12 12 0 85Manufacturing 7 8 -20 5,870Construction 11 8 235 9,215Wholesale & retail 9 8 10 16,830Hotels & restaurants 14 12 180 7,580Transport & communications 11 9 65 3,485Finance 8 8 0 355Real Estate, business services 13 10 500 14,800Public admin; other 7 8 -35 4,780Education; health 6 5 10 1,125Total 9 8 250 80,015
Source: National Statistics, VAT registrations www.nomisweb.co.uk
46
Table 1.7: 1 in 5 VAT businesses are in Agriculture and Fishing with a similar number in Wholesale and Retail. The service economy accounts for 60% of the business stock but some services (notably Finance, Business Services) are under-represented when compared to the UK benchmark.

Learning and Labour Market Intelligence for Wales: National Report 2006
Table 1.9: Size Structure of Welsh Business, 2003
Enterprises % of total
Employment % of total
Turnover % of total
Employee Size band Wales UK Wales UK Wales UK
Micro (0 - 9)93.8 94.5 31.3 28.2 18.2 19.2
Small (10 - 49)4.2 4.5 14.8 15.1 11.4 15.4
Medium (50 – 249)1.0 0.8 12.4 13.3 13.1 15.6
Large (250+)0.9 0.2 41.5 43.4 57.3 50.1
All 100.0 100.0 100.0 100.0 100.0 100.0
Source: National Statistics, Size Analysis of Welsh business, Sept 2004http://www.wales.gov.uk/keypubstatisticsforwales/content/publication/economy/2004/sdr69-2004/sdr69-2004.pdf
Table 1.10: Size Band Analysis of Local Units in Wales, 2003
Employee Size Band Local Units % of total
Employment% of total
Micro 0 67.6 15.8Micro 1-9 25.2 20.2All Micro 0-9 92.8 36.0Small 10-49 5.9 23.6Medium 50-249 1.1 20.7Large250+ 0.2 19.8All 100.0 100.0Due to rounding columns may not sum to 100
Source: STATSWALES http://www.wales.gov.uk/keypubstatisticsforwales/economy.htm
47
Table 1.9Micro-enterprises account for the bulk of the business stock in Wales (94%) but only 31% of employees and 18% of turnover. Large businesses make up just 1% of the total but account for over 41% of employment and 57% of gross turnover.
Table 1.10When local unit analysis is performed and size band is defined based on the number of employees in the local unit, as opposed to the whole enterprise then more than 80% of employment in Wales is located in local establishments with fewer than 250 employees.

Learning and Labour Market Intelligence for Wales: National Report 2006
Table 1.11: Exports Destination, Wales and UK
Exports destination, Wales and UK (£m)
Wales UK Wales as a percentage of UKEU Non-EU Total EU Non-EU Total EU Non-EU Total
2001 4,944 2,155 7,099 112,780 75,596 189,376 4.4% 2.9% 3.7%2002 4,870 1,749 6,619 113,325 73,744 186,978 4.3% 2.4% 3.5%2003 4,890 2,307 7,197 109,383 78,999 188,382 4.5% 2.9% 3.8%2004 5,492 2,824 8,316 110,221 80,327 190,548 5.0% 3.5% 4.4%
2005 Qtr 1 1,421 698 2,118 28,391 18,853 47,244 5.0% 3.7% 4.5%
Qtr 2 1,271 864 2,136 29,000 23,025 52,025 4.4% 3.8% 4.1%Qtr 3 1,160 839 1,999 27,546 23,846 51,392 4.2% 3.5% 3.9%
Source: Statistics Wales.2005 figures are provisional.http://www.statswales.wales.gov.uk/ReportFolders/ReportFolders.aspx
Table 1.12: Research and Development 2003
£ Million
R&D performed
within business
R&D performed within
Government Establishments
R&D performed within Higher
Education Institutions All R&D
Share ofGross value
addedUnited Kingdom 13,687 2,010 4,457 20,823 2.2%North East 281 2 158 441 1.4%North West and Merseyside 1,559 54 363 1,976 2.0%Yorkshire and the Humber 382 134 347 863 1.2%East Midlands 929 22 223 1,174 1.9%West Midlands 587 38 228 853 1.1%Eastern 3,453 336 412 4,200 4.4%London 771 279 1,069 2,119 1.4%South East 3,464 583 614 4,661 3.1%South West 1,359 231 192 1,782 2.4%England 12,786 1,678 3,606 18,071 2.2%Wales 264 43 175 483 1.3%Scotland 521 271 575 1,368 1.8%Northern Ireland 116 17 100 233 1.1%Source:STATSWALES http://www.statswales.wales.gov.uk/ReportFolders/ReportFolders.aspx
Table 1.13: Estimated Regional Breakdown of Personnel Engaged on R&D in the Business and Government Sectors, 2003
Estimated regional breakdown of personnel engaged on R&D in the Business and
48
Table 1.11: Wales accounts for a steady 4% of the UK’s export market though its contribution to the non-EU market is slightly smaller. However non EU exports shares have increased in recent years.

Learning and Labour Market Intelligence for Wales: National Report 2006
Government sectors, 2003
R&D performed within business
R&D performed within Government establish-
ments Total
Full time equivalents
000’s
% of the regional Labour
Force3,4
Full time equivalents
000’s
% of the regional Labour
Force3,4
Full time equivalents
000’s
% of the regional Labour
Force3,4United Kingdom 162.9 0.57 21.3 0.07 184.2 0.64North East 3.5 0.31 0.0 0.00 3.5 0.31North West and Merseyside 16.7 0.53 0.6 0.02 17.3 0.55Yorkshire and the Humber 6.3 0.27 1.4 0.06 7.7 0.33East Midlands 14.2 0.68 0.2 0.01 14.4 0.69West Midlands 9.0 0.36 0.4 0.02 9.4 0.38Eastern 37.1 1.36 3.6 0.13 40.7 1.49London 9.0 0.25 3.0 0.08 12.0 0.33South East 39.6 0.98 6.2 0.15 45.8 1.13South West 13.7 0.56 2.4 0.10 16.1 0.66England 148.9 0.62 17.7 0.07 166.6 0.69Wales 3.6 0.27 0.5 0.03 4.1 0.30Scotland 7.4 0.30 2.9 0.12 10.3 0.42Northern Ireland 2.9 0.41 0.2 0.03 3.1 0.44Source: Economic Trends August 20051 Regional breakdown is based on the GOR (Government Office Region) classification.2 Government sector covers Central Government only. Local Authorities, NHS and those areas of Central Government not available from the Government survey are excluded3 Labour Force figure used is a head count. An estimate of the Labour Force in full-time equivalents (FTE) is not available. Using the head count figure gives a lower percentage than a FTE would give.Labour Force figures relate to those in employment, rather than all those economically active.
Table 1.14: GDP per hour Worked in 2002 (% EU average)
EU (15) = 100France 124Germany 104Netherlands 113Ireland 113
UK 90
Wales 79
EU Average 100
USA 118
Source: Eurostat, Structural Indicator. Data for Wales imputed – see “International Benchmarking” below. http://www.elwa.org.uk/elwaweb/elwa.aspx?pageid=3069
Table 1.15: Summary of Domains and Indicators
Domain Description Definition SourceResources Secondary Expenditure on educational OECD
49

Learning and Labour Market Intelligence for Wales: National Report 2006
Expenditure (upper and lower secondary, which includes pre and post-14 secondary school and 16-19 ed/training)
institutions per student relative to GDP per capita by level of education, based on full-time equivalents
Participation Lifelong Learning Percentage of the adult (25-64) population participating in education and training in the last 4 weeks by gender 2003.
ELFS, Eurostat
Youth Learning Percentage of the youth (18-24) population participating in education and training in the last 4 weeks
ELFS, Eurostat
Informal Learning No indicator at present Potential futuredatasource AES.
Work-related training Training undertaken within enterprises
CVTS
Retention Youth Unemployment and Non-participation in Education
Percentage of unemployed non-students in the total population aged 15-19.
OECD
Attainment Upper Secondary (post age14 secondary education)
Percentage of the population having completed upper secondary education
OECD
Knowledge and skills
Literacy Percentage of students at or below level 1 on the PISA reading literacy scale.
PISA
Adult Literacy Proportion of the population at level 1 on the IALS prose, document and quantitative literacy scale.
IALS
Numeracy Percentage of the population scoring less than 400 on the PISA mathematical literacy scale.
PISA
ICT Skills Self reported competence in use of computers.
CEDEFOP
Generic skills No indicator at present -Productive skills
Participation Rates Labour force participation rates (2001) By level of educational attainment and gender for 25 to 64 year-olds.
OECD
Unemployment Unemployment rates (2001) by level of educational attainment and gender for 25 to 64 year-olds
OECD
Earnings Rate of return to education by level Blondal et al(2002). OECD Working Paper.
Source: Where in the World Are We? A Snapshot View of Wales’ Performance in Lifelong Learning,WELMERC/ELWa September 2004. http://www.elwa.org.uk/elwaweb/elwa.aspx?pageid=3069
Table 1.16: Changing Sectoral Structure of Employment in Wales, 2003 to 2008
50

Learning and Labour Market Intelligence for Wales: National Report 2006
Employment level (000s)
Share of employment (%)
Location Quotient
2003 2008 2003 2008 2008Agriculture 33.8 27.3 2.7 2.2 2.2Mining and Quarrying 2.9 1.9 0.2 0.2 0.7Manufacturing 188.8 179.5 15.3 14.3 1.2Energy and Water 5.9 4.4 0.5 0.4 1.0Construction 91.1 85.9 7.4 6.9 1.1Wholesale and Retail 202.7 212.0 16.5 16.9 1.0Hotels and Restaurants 79.7 77.7 6.5 6.2 0.9Transport and Communications 54.9 53.2 4.5 4.3 0.7
Banking and Insurance 30.1 29.4 2.4 2.4 0.7Other Business Services 117.6 131.7 9.5 10.5 0.6Public Admin and Defence 76.8 73.7 6.2 5.9 1.3Education 109.0 110.3 8.9 8.8 1.1Health 167.4 184.9 13.6 14.8 1.3Other Services 71.3 79.0 5.8 6.3 1.0Total Employment 1,232.0 1,251.1 100.0 100.0 Note: a location quotient greater than 1 means the sector is more important in Wales than in the UK (calculated by the sector's share of employment relative to the UK's sector share of employment)Note: Forecasts prepared by Experian Business Strategies LtdTable. Source: Future Skills Wales Generic Skills Survey, 2003 http://www.futureskillswales.com/eng/content.php?cID=5&pID=1&zID=39&nhID=55
Table 1.17: Changing Occupational Structure of Employment in Wales, 2003 to 2008
Occupation level (000s)
Share of employment (%)
Location quotient
SOC 2000 2003 2008 2003 2008 2008
51
Jobless growth is predicted financial services, transport and communications, construction, agriculture and manufacturing
Learning and Labour Market Intelligence for Wales: National Report 2006
1. Managers and senior officials11. Corporate Managers 100.2 101.2 8.2 8.1 0.712. Managers and Proprietors in Agriculture and Services 34.9 33.7 2.8 2.7 0.7
2. Professional21. Science and Technology Professionals 26.2 26.8 2.1 2.1 0.622. Health Professionals 11.8 14.2 1.0 1.1 1.123. Teaching and Research Professionals 55.2 55.0 4.5 4.4 1.124. Business and Public Service Professionals 32.4 33.6 2.6 2.7 0.8
3. Associate professional and technical31. Science and Technology Associate Professionals 25.0 24.3 2.0 1.9 1.2
32. Health and Social Welfare Associate Professionals 45.5 50.0 3.7 4.0 1.2
33. Protective Service 9.0 8.9 0.7 0.7 0.734. Culture, Media and Sports 21.9 23.8 1.8 1.9 0.835. Business and Public Service Associate Professionals 53.1 56.7 4.3 4.5 0.8
4. Administrative and secretarial41. Administrative 117.4 121.5 9.6 9.7 1.042. Secretarial and Related 32.2 36.0 2.6 2.9 0.7
5. Skilled trades51. Skilled Agricultural Trades 27.7 24.0 2.3 1.9 2.252. Skilled Metal and Electrical Trades 65.1 63.4 5.3 5.1 1.253. Skilled Construction and Building Trades 44.2 40.0 3.6 3.2 1.054. Textiles, Printing and Other Skilled Trades 39.5 37.0 3.2 3.0 1.3
6. Personal service61. Caring Personal Service 86.6 95.4 7.0 7.6 1.462. Leisure and Other Personal Service 25.7 27.8 2.1 2.2 1.1
7. Sales and customer service71. Sales 91.6 98.2 7.5 7.9 1.172. Customer Service 5.8 5.6 0.5 0.5 0.4
8. Process, plant and machine operatives81. Process, Plant and Machine Operatives 78.3 73.6 6.4 5.9 1.682. Transport, Mobile Machine Drivers and Operatives 44.1 42.9 3.6 3.4 0.9
9. Elementary91.Elementary Trades, Plant and Storage Related 42.5 40.7 3.5 3.3 1.1
92.Elementary Administration and Service 112.8 114.2 9.2 9.2 1.0Employees in Employment 1,228.6 1,248.5 100.0 100.0
Note: Forecasts prepared by Experian Business Strategies LtdTable source: http://www.futureskillswales.com/eng/content.php?cID=5&pID=1&zID=39&nhID=55
Figure 1.3: Anticipated Generic Skills Demand in Wales
52
Occupational growth is likely to concentrate in those areas relating to health, leisure, sales and service support, particularly the following occupations
Learning and Labour Market Intelligence for Wales: National Report 2006
Skills needs - now and in the future
0.0 1.0 2.0 3.0 4.0
Numeracy
Literacy
Welsh language
Foreign language
Problem solving
CommunicationAbility to follow
instructionsIT skills
Ability to learn
Showing initiative
Leadership skills
Management skillsOrganising own
learning andTeam working
Understandingcustomer needs
Entrepreneurial skills
Adaptability/flexibility
CurrentFuture
Mean score (not required = 0, advanced = 4)
Source: Future Skills Wales Generic Skills Survey 2003
Table 1.18: Sectoral Skills Imbalance – Wales 2003
Proportion of Proportion of Proportion of
53
Generic skill needs will increase across the board

Learning and Labour Market Intelligence for Wales: National Report 2006
Establishments reporting HTF Vacancies
Establishments reporting Skill Shortage Vacancies
establishment reporting internal skills gaps
Agriculture, hunting, forestry and fishing 8% 6% 14%
Mining and quarrying * * *Manufacturing 16% 11% 23%Electricity, gas and water supply * * *Construction 16% 11% 22%Wholesale and retail trade 12% 5% 18%Hotels and restaurants 16% 4% 20%Transport, storage and communication 17% 8% 15%
Financial services 5% 2% 14%Real estate, renting and business activities 12% 7% 15%
Public admin, defence; compulsory social security * * *
Education 15% 6% 18%Health and social work 18% 6% 27%Community, social and personal service activities 14% 6% 20%
All Sectors 14% 7% 19%
* Sample size statistically unreliableSource: SSDA (Experian), Sector Skills Matrix http://www.ssdamatrix.org.uk/sector.asp
Table 1.19: The top 5 types of training provided and level of provision by occupational group
Occupational group Top five types of training % of establishments
54
On average skills shortages account for one half of establishments reporting HTF vacancies. Skills shortages may be a particular problem in manufacturing and construction industries.

Learning and Labour Market Intelligence for Wales: National Report 2006
provided providing training Managers/senior managers Other technical/practical skills
Management skillsTeam working skillsCustomer handling skillsProblem solving skills
HighHighHighHighHigh
Professional occupations Other technical/practical skillsCommunication skillsManagement skillsTeam working skillsProblem solving skills
HighHighHighHighHigh
Associate professional Other technical/practical skillsCommunication skillsTeam working skillsCustomer handling skillsIT users skills
HighHighMediumHighHigh
Administrative/secretarial Other technical/practical skillsCommunication skillsTeam working skillsIT users skillsProblem solving skills
MediumMediumMediumHighMedium
Skilled trades Other technical/practical skillsCommunication skillsTeam working skillsIT users skillsProblem solving skills
HighMediumMediumMediumMedium
Personal service occupations Communication skillsTeam working skillsCustomer handling skillsProblem solving skillsLiteracy skills
HIghHighHighMediumHIgh
Sales/customer service occupations
Communication skillsManagement skillsTeam working skillsCustomer handling skillsProblem solving skills
HighHighMediumHighHIgh
Process/plant/machine operatives Other technical/practical skillsCommunication skillsManagement skillsTeam working skillsIT users skills
HighLowLowLowLow
Elementary occupations Other technical/practical skillsCommunication skillsTeam working skillsCustomer handling skillsProblem solving skills
MediumMediumMediumMediumLow
The chart singles out the top five mentions per occupational category and also labels each type of provision as either high level (at least 20% of establishments mentioning it), medium level (between 10 and 20% of establishments mentioning it) and low level (under 10% of establishments mentioning it).
Source: Employers Panel Survey (2005)
Table 1.20: Welsh Index of Multiple Deprivation 2005: Local Authority Lower Super Output Areas in the 10% most deprived
55

Learning and Labour Market Intelligence for Wales: National Report 2006
Local Authority ANumber of LSOAs
BNumber in 10% most deprived
C=B/190 % of 10% most deprived
D=A/1896% of LSOAs in LA
E=B/A% LSOAs in LA in 10% most deprived
Anglesey 44 1 1 2 2Gwynedd 75 2 1 4 3Conwy 71 3 2 4 4Denbighshire 58 5 3 3 9Flintshire 92 2 1 5 2Wrexham 85 6 3 4 7Powys 80 0 0 4 0Ceredigion 47 0 0 2 0Pembrokeshire 71 2 1 4 3Carmarthen 112 7 4 6 6Swansea 147 22 12 8 15Neath Port Talbot 91 17 9 5 19Bridgend 85 10 5 4 12Vale of Glamorgan 78 2 1 4 3Cardiff 203 33 17 11 16Rhondda Cynon Taff 152 29 15 8 19Merthyr Tydfil 36 13 7 2 36Caerphilly 110 12 6 6 11Blaenau Gwent 47 12 6 2 26Torfaen 60 2 1 3 3Monmouthshire 58 0 0 3 0Newport 94 10 5 5 11Source: Welsh Index of Multiple Deprivation, 2005http://www.wales.gov.uk/keypubstatisticsforwales/wimd/wimd2005-analysis/wimd2005-analysis-r1.htm
56

Learning and Labour Market Intelligence for Wales: National Report 2006
Figure 1.4: Education Domain: Dispersion around the MIND (Welsh LSOAs)
57

Learning and Labour Market Intelligence for Wales: National Report 2006
Chapter 2
Participation in Learning
Introduction
Human capital is the stock of skills and knowledge embodied in the workforce. Like
other forms of capital, human capital can be accumulated. However, to function
effectively, it requires regular maintenance. It deteriorates if left idle for long periods
and it has a tendency towards obsolescence. Most advances in technology are only as
effective as the ability to incorporate that knowledge into the workforce. A nation’s
human capital must therefore also be regularly refreshed if prosperity and other
economic rewards are to be secured. Exactly how human capital is best acquired is a
controversial matter. But the evidence that those individuals and nation states with a
high regard for learning and skills development enjoy superior economic outcomes is
less contentious.
Results from the 2003 NIACE survey (boosted in Wales) showed that 42% of adults in
Wales (people aged 17 or over) were either currently engaged in learning or had
undertaken some sort of learning activity during the previous 3 years. This was a
higher proportion than for any other UK country. The definition of learning adopted by
the NIACE survey included any learning activity formal or otherwise - including
practicing or reading. Their findings therefore imply that nearly 6 out of 10 people had
had no exposure to any form of learning in the preceding 3 years.
In replacing the Labour Force Survey with the Annual Population Survey (APS) new
data measuring adult involvement in taught and non-taught learning15 has become
15 An adult learner as defined in the APS is someone aged 16 and over who has participated in some taught and/or non-taught adult learning over the last year. Taught adult learning includes taught courses that were meant to lead to a qualification; taught courses designed to help develop skills used in a job; courses, instructions or tuition in driving, playing a musical instrument, art or craft, sport or any practical skill; evening classes; learning involving an individual working on their own from a package of materials provided by an employer, college, commercial organisation or other training provider; other taught course, instruction or tuition. Non-taught adult learning includes studying for qualifications without taking part in a taught course; supervised training while doing a job; time spent keeping up-to-date with developments in one's work or profession e.g. by reading books or attending seminars; deliberately trying to improve one's knowledge about anything or teach oneself a skill without taking part in a taught course.
58

Learning and Labour Market Intelligence for Wales: National Report 2006
available. The first (2004) set of results from the APS, indicate that 70% of the working
age population in Wales had undertaken some learning activity during the previous 12
months. This is a far greater involvement in learning than might be concluded from the
NIACE research, even though in both surveys learning activity was very broadly
defined.
Not withstanding this puzzle, the APS data are particularly valuable in highlighting
differences in learning exposure across different groups, and in particular between
those people with and those without a disability. In this respect, the APS indicates that
working age people with a disability are more than twice as likely not to have engaged
in learning activity than non-disabled people (Table 2.1).
For its part, the NIACE research provides corroborating evidence of the impact of
current learning on future learning intentions. Accordingly 62% of current learners
reported that they were very likely to take up learning in the future. This is
encouraging, but good intentions decay quickly with time. Only 30% of recent learners
(in the last 3 years) and 12% of past learners (over 3 years) considered themselves to
be very likely of learning again. Of those who have not been involved in any learning
since leaving full-time education, 68% were very unlikely to take up learning in the
future (Fig 2.1). The rate at which learning intentions decay, and the inertia exhibited
by non-learners should be of concern to policymakers.
Participation Rates – Publicly Funded Learning
Participation rates in formal learning are highest among 16-18 year olds and tail off
quickly thereafter. The participation of young people in post compulsory education and
training is largely governed by their destinations after completion of their GCSEs.
Destinations at age 16 provide a good indication of their likelihood of participation in
post-compulsory education. Data on early destinations published by Careers Wales
indicate that the proportion continuing in learning after compulsory education is
remarkably stable with around 74% of 16 year olds staying on in full-time education
and a further 8% in training (Table 2.2).
In 2003/04 6 out of 10 of 16-18 year olds in Wales were in full-time education with a
further 9% in part-time education. A further 10% were on government supported
59
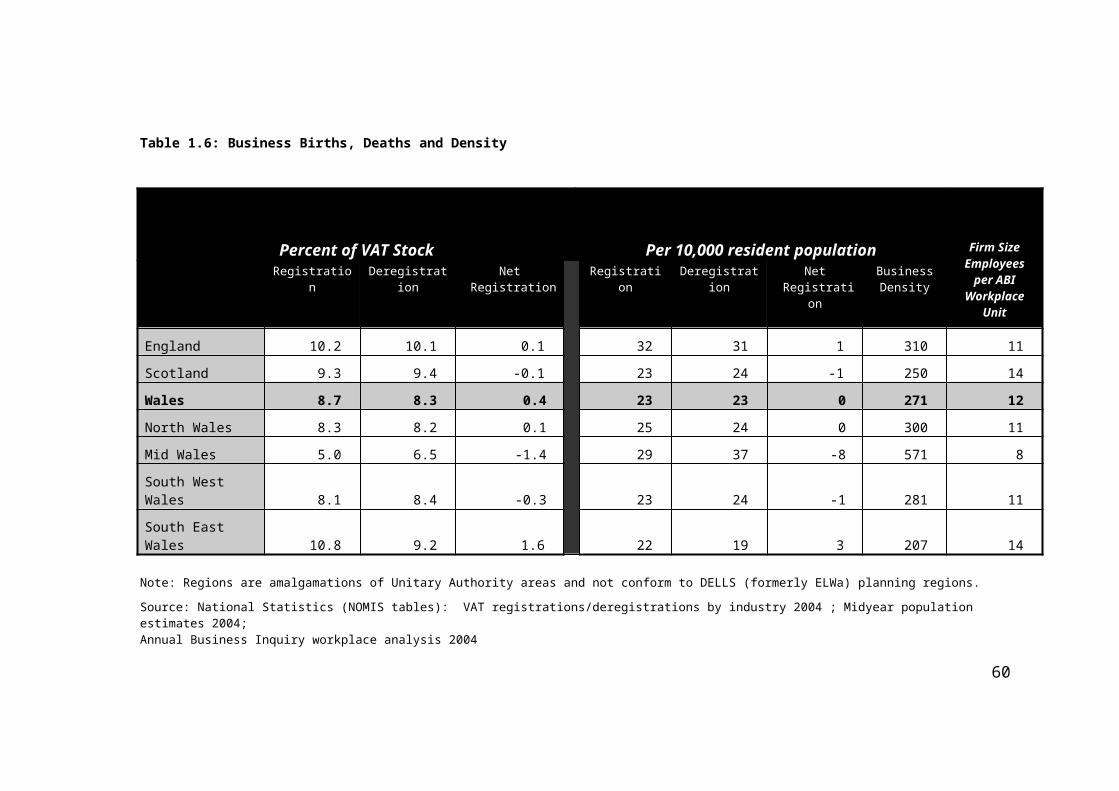
Learning and Labour Market Intelligence for Wales: National Report 2006
training programmes. Schools and further education colleges accounted for the bulk of
(the 77%) participation among the 16-18 age group (Table 2.3).
By age 19-24 the participation rate has virtually halved with just 4 out of 10 engaged in
some form of learning programme. The fall in the participation rate is also
accompanied by a shift away from full-time learning towards part-time study. Full time
learners in this age group are concentrated in higher education, which accounts for
more than one half of 19-24 year old learners. Among the 25-30 year old population,
less than 1 in 5 will be participating in formal learning with part-time students
outnumbering full-time ones by 2:1. Again it is the higher education sector that
accounts for the bulk of full-time learners.
An estimated 85,000 people aged 16-18 year were engaged in education or training in
2003/04. Of these 6% were unemployed. However, of those not engaged in formal
learning or training (32,600 people) 24% were unemployed. A further 6,700 people
were inactive and not learning. In short there is a core of over 14,000 people,
equivalent to 12.5% of the 16-18 population who are not working and not engaged in
any form of learning (Table 2.4). 16
Learning Pathways
Roughly ¾ of learners aged 16-18 are in full-time education – ether at school, a
Further Education (FE) college or in Higher Education (HE). This stage of the learning
process involves further testing and filters individuals into and along particular career
pathways.
In January 2004/05 there were 27,500 pupils aged 16 and over attending maintained
schools in Wales. In that same year 10,373 pupils17 were entered for 2 or more A/AS
levels or advanced GNVQs. Of these, 68% achieved two or more grades A-C and
95% achieved two or more grades A-E. 18
Many of these will progress onto courses at an FE or HE Institution. In all around
112,000 students from Wales enrolled at HE institutions in the UK during 2003/04.
16 The NEET group is discussed further later in the chapter.17 Aged 17 at the start of the academic year18 For further details see statistical bulletin SDR 118/2005 released by NAfW , Nov. 2005
60

Learning and Labour Market Intelligence for Wales: National Report 2006
Almost 80% of these (87,400) were undergraduates and two thirds were studying at
Welsh institutions. Higher Education in Wales is provided in 13 HE institutions, The
Open University, and (to a much lesser extent) in 18 Further Education institutions in
Wales. In 2003/04, the Welsh HE sector had in excess of 120,000 students; 60% were
from Wales, 30% from elsewhere in the UK and 4% from other EU countries.
Moreover,
41% of all students were part-time.
74% of part time students were of Welsh domicile compared to 49% of the full-time
population.
The part-time student population has grown at roughly twice the rate of the full-time
population (6.5% per annum against 3.0%).
This increase in the part time population would appear to be almost entirely
generated within Wales.
Detailed analysis of the HE sector in Wales is beyond the scope of this report and
those requiring further information should consult relevant Assembly/HEFCW
sources.19
Further Education, Community and Work Based Learning
The new Lifelong Learning Wales Records20 (LLWR) provide information relating to
numbers in FE, Community and Work Based learning. The Lifelong Learning Wales
Record (LLWR) is now the sole data collection method from Further Education,
Community Learning and other training providers. Used in conjunction with population
data, crude estimates can be obtained of age specific learning participation outside the
schools and HE sector. These data show that in 2004/05 over 50% 16 and 17 year
olds were undertaking some form of learning activity. From age 18 however there is a
sudden drop in participation with just 18% of 20-24 year olds recorded as learners.
Some of the decline among this group may be attributable to transfers to HE
institutions but the trend is distinctly downwards for all age groups. Among 25-49 year
olds participation is just 13% and 8% for those aged 50-64. Male participation exceeds
19 For example http://www.statswales.wales.gov.uk/ReportFolders/ReportFolders.aspx 20 The LLWR replaces earlier methods of data collection based on Individual Student Records. The LLWR is a live, event-driven database that is maintained continuously. Monthly freezes of data are taken for funding and statistical purposes.
61
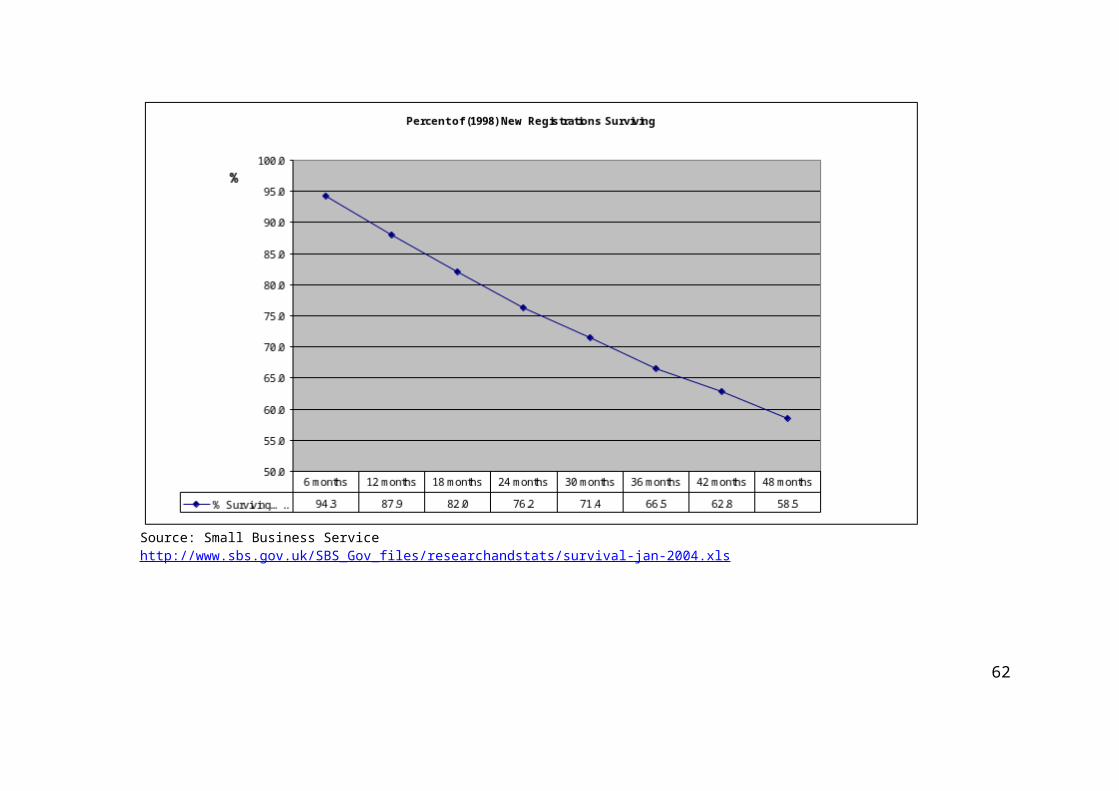
Learning and Labour Market Intelligence for Wales: National Report 2006
that of females from age 18 to 20 when the participation of women overtakes that of
men, creating a sizeable gap before converging at age 65+ (Figure 2.2).
In 2004/05 there were around 300,000 FE, Adult Community and Work Based
Learners in Wales responsible for some 390,000 enrolments. Three quarters of
learners are aged over 20 and there are more learners aged 50 and over than are
aged 18 or below. Non-white ethnic minorities account for 8% of the learning
population with those from the Asian community accounting for almost one half (47%)
of these (Table 2.5).
While there are slightly more young male learners than female ones, women learners
account for 58% of the total learning population. These gender differences are also
observed in the pattern of enrolments, which for the under 20s show a slight gender
bias in favour of males (55% of enrolments). This age group also accounts for the 8
out of 10 of all full-time learning enrolments. However over the age of 19 and both the
gender balance and mode of study change appreciably. Women make up 63% of the
learning population aged 20+ and outnumber men by almost 2:1. Moreover, almost 9
out of 10 women learners (86%) aged 20 and over are part-time learners (Table 2.6).
Over 860,000 learning activities leading to qualifications were undertaken by FE,
Community and Work Based Learners in Wales in 2004/05. Two thirds of these
(569,000) were at FE providers with Key Skills, OCN Credits and Other qualifications
accounting for 80% of them (Figure 2.3). The majority of new job opportunities in
Wales are located in the service economy and in areas such as administration, health
care and social services. Not surprisingly this pattern is also reflected in the subject
choices of students. Exactly one half of the subject learning activities by students in
the FE sector were in IT and Health and Care (Figure 2.4).
The above data may also be arranged so as to show
(a) the subject distribution within a particular qualification and
(b) the qualification levels aimed for within a given subject area.
62

Learning and Labour Market Intelligence for Wales: National Report 2006
So for example, within the FE sector specifically 27.7% of HE level qualifications
aimed for are in Business and Management and one third 32.8% of GNVQ/AVCE
learning activity is in IT (Table 2.7A). However, one third (32.2%) of learning activities
within Business and Management are directed at Key Skills qualifications, while in IT
40% of activities are associated with BTec/OCN/Access qualifications (Table 2.7b).
Adult and Community Learning
Adult and community education learning is about widening participation, social
inclusion and equal opportunities. According to the OECD (2003) adult learning
promotes greater versatility and mobility of workers and should figure more
prominently in the development of lifelong learning strategies. 21 The likelihood that
more people will in future work beyond any notional retirement age also adds further
weight to this view.
Community learning includes an infrastructure for provision to enable people to
engage in learning, outside formal compulsory schooling, for the first time, or to return
to it. It can include classes “in situ” within the community, or learning with a specific
community goal, such as learning programmes to help regenerate an area. It can be
carried out through family learning, formal classes or activities and it can be offered by
a variety of providers, including colleges, voluntary organisations, the local university,
or the local authority.
Data from the LLWR identifies the number of learner enrolments with LEA and FE
community learning providers22. These show that in 2004/05 there were 70,405 such
enrolments in Wales:
Almost all (99.9%) learning activity was on a part time basis
72% of learner enrolments were women
47% of learners were aged 50 or over.
21 In the European context see “Defining Common Issues across Europe for Adult Education”, NFER report to ELWa, Sept 2003.22 Provision submitted to the LLWR by an LEA directly or by an FE provider but where the learning is delivered by an LEA through a partnership, franchise or subcontracted arrangement ('contracted-in' provision).
63

Learning and Labour Market Intelligence for Wales: National Report 2006
BTEC awards, OCN credits and Access diploma/certificates accounted for 39% of the
81,400 qualifications aimed for. The most common subject areas were Arts and Crafts,
Care, Cultural Studies and Humanities (Table 2.8).
Work Based Learning (WBL)
Work Based Learning programmes aim to provide competence based skills required
by those in employment to enhance their employability and career progression. They
also aim to provide young people not in employment with the skills to increase their
employability. During 2004/05 there were just over 67,000 enrolments onto work
based learning in Wales of which:
18% of enrolments were provided by FE institutions and 82% by other training providers
53% of enrolments in work based learning were male
46% were aged 19 or under and 96% were under 50.
69% of learning activities were at levels 1 and 2.
Learning activities in Care (35 per cent), Business Management (15 per cent) and Health (9 per cent) account for over a half of work-based learning provision with specified subjects.
Modern Apprenticeships and Foundation Modern Apprenticeships are the 2 largest programmes accounting for a steady 80% of trainees. Skillbuild is the third largest programme with 10% of trainees23.
Welsh Language Provision
The last decade has marked a substantial change in the way Welsh speakers have
addressed their Welsh language skills. This ranges from experiencing and using
Welsh mainly in a social context to using Welsh in a professional context. At the same
time, more employers and non-Welsh speakers have come to regard bilingual
competences as advantageous.
Research by the Future Skills Wales partnership (FSW, 2003) shows that just over
44% of employers anticipate a future need for Welsh language skills and ¼ of these
required a high or advanced standard of competence. Occupations most likely to 23 http://www.statswales.wales.gov.uk/TableViewer/tableView.aspx?ReportId=1581
64

Learning and Labour Market Intelligence for Wales: National Report 2006
require personnel with Welsh language skills were those which provided a personal
service. This was followed by professional, associate professional and technical
personnel, along with sales and customer service occupations. Comparing the Welsh
language skills required by employers with those of the current workforce, Cwmni
Iaith24 maintain there is a significant Welsh language skills gap in the Principality. After
entrepreneurial skills, IT skills, and management skills, the shortfall in Welsh language
abilities is the 4th largest skills gap.
The Welsh language is taught within the curriculum of maintained schools and in 2005,
14.8% of pupils were taught Welsh as a first language and 84.2% as a second
language. Outside the school sector, the position is somewhat different with just 0.3%
of learning activities delivered exclusively through the medium of Welsh and a further
1.7% of provision being bilingual (Table 2.9).
Workforce Development
Workforce development is a broader concept than education or training alone and
encompasses those interventions (including education and training) that equip
individuals with the knowledge and skills to participate more effectively in the
workplace and in society.
Much of the workforce development activity that occurs takes place within the work
environment and does not lend itself to observation. Data from the APS (2004) and
LFS (2003/04) show the numbers of people who received training (other than
Government-supported work-based learning) in the preceding four weeks before the
survey. These reveal that female employees received more training than men though
that training may be biased in favour of those already well qualified. Of those who
were already qualified to Level 4 and above (categorised by NVQ equivalence –
though most of the qualifications were degrees), 22% of men and 27% of women had
received job-related training in the previous four weeks. For those qualified to Level 3
and below, the corresponding figures are 15% and 21%. These differentials are
remarkably persistent over time and suggest that pre-existing inequities in the
distribution of learning opportunities and skills will tend to be perpetuated.
24 Research into Welsh Language Skills Needs of Employers Operating Statutory and Voluntary Welsh Language Schemes, Cwmni Iaith, ELWa 2004.
65
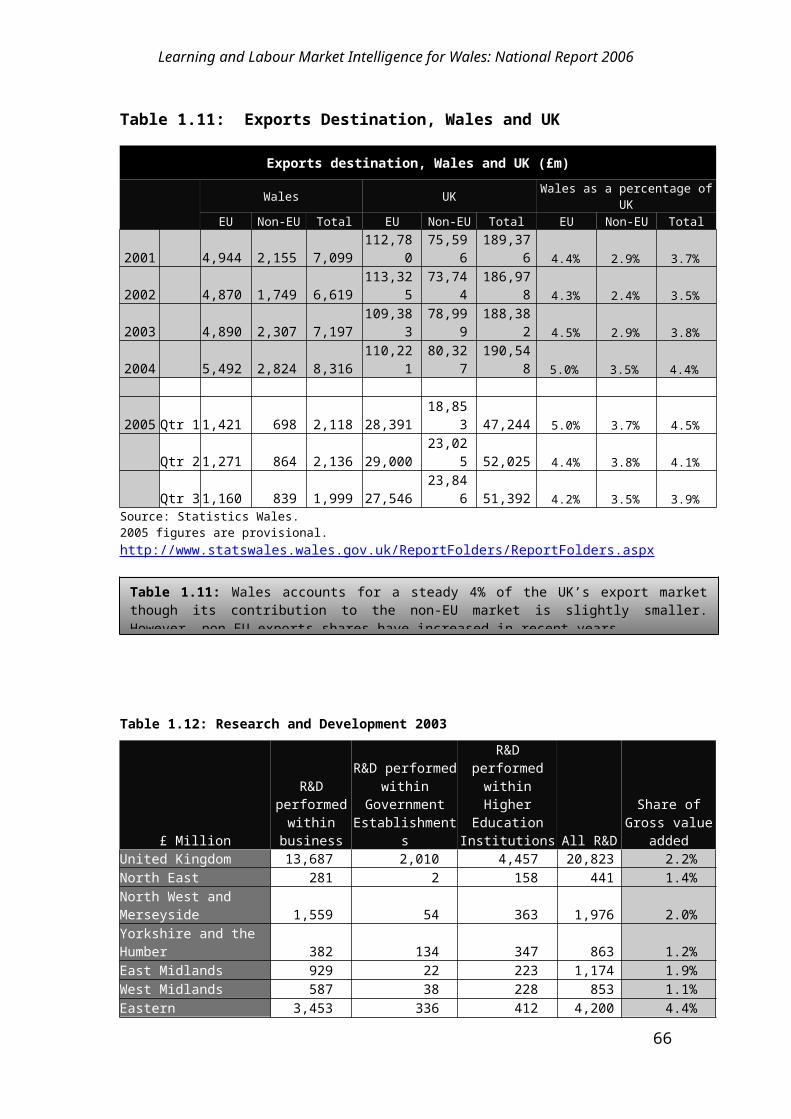
Learning and Labour Market Intelligence for Wales: National Report 2006
The likelihood of receiving training also differs markedly by sector, and this seems to
underlie many of the other differences noted. In the public sector, 24% of staff had
received training in the last four weeks, compared to 14% in the private services. As
the public sector employs a high proportion of women, and a high proportion of highly
qualified workers, this sectoral difference could account for much of the observed
difference in workforce development (Table 2.10).
By UK standards, the incidence of job related training in Wales is high (Table 2.11) but
in order to assess what progress is being made to achieve a better equipped
workforce, it is necessary to consider other attributes. Qualifications act as a proxy for
skill levels by signaling achievement and motivation as well as indicating specific
knowledge. On this measure Wales comes out less well with relatively more low
achievers and fewer high achievers. Although Wales has made real progress in
upskilling its workforce, it also continues to have a large base of people lacking in any
qualifications (Table 2.12).
Basic SkillsIndividuals without adequate literacy and numeracy skills are less able to participate in
learning or training and as a consequence they will have lower levels and a reduced
range of skills. Their potential contribution to economic product of the nation will be
correspondingly reduced. Quite aside from the economic case there are strong social
and community arguments for improved basic skills. Research25 suggests that
individuals with poor basic skills are less able to participate in other domains and are:
less likely to be in good health, and more likely to be depressed.
less likely to be married or cohabiting.
less likely to vote, less interested in politics, and less likely to be involved in
their local community.
more likely to have a higher frequency of being stopped and questioned or
arrested by the police (used as an indicator of involvement in crime).
25Basic Skills and Social Exclusion, Findings from a study of adults born in 1970, Basic Skills Agency 2002, http://www.basic-skills.co.uk/general/documentdownload.php?p=344
66
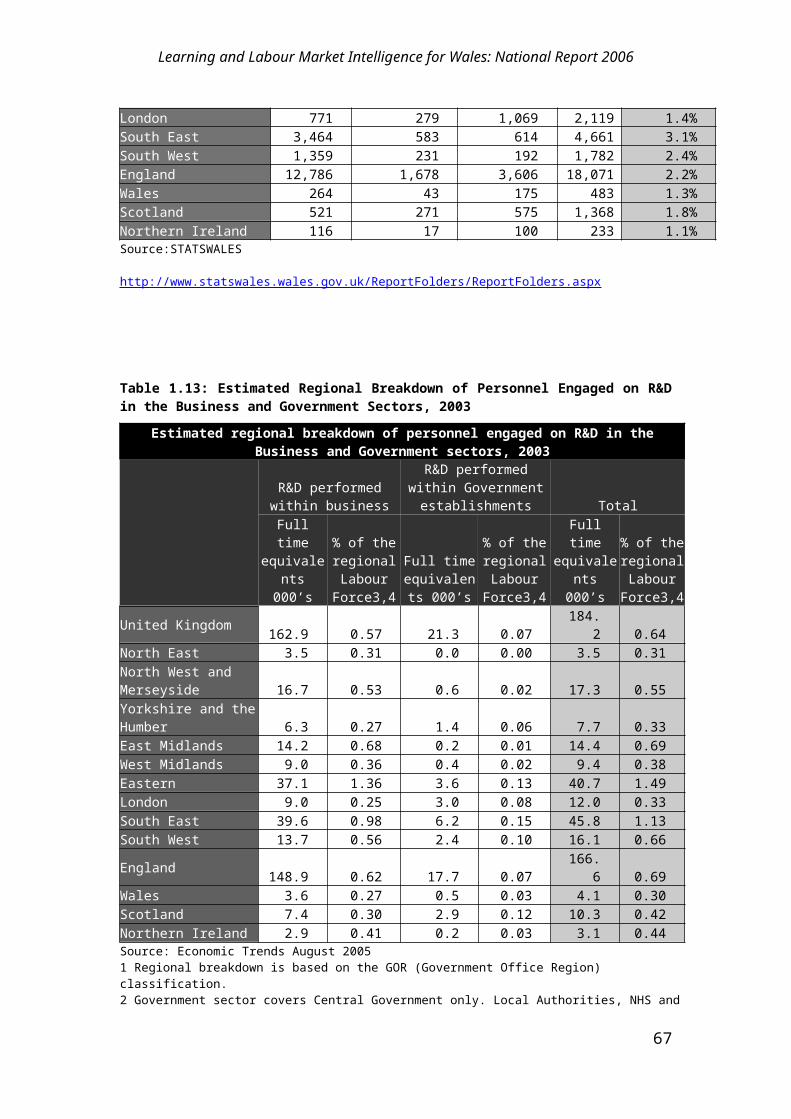
Learning and Labour Market Intelligence for Wales: National Report 2006
less likely to have a bank account, or a range of other financial products such
as insurance policies, pension arrangements or a mortgage.
Poor literacy and numeracy skills have been identified as being among the most
serious barriers to social and economic regeneration in Wales. Latest survey evidence
from the Basic Skills Agency26 indicates that some 440,000 adults (25% of total aged
16-65) in Wales are at entry level27 or below in literacy and almost 1 million people
(53%) do not have Level 1 numeracy skills (Table 2.13). Corresponding proportions
from the all-England survey are 16% and 47%. The survey results give a fairly bleak
assessment of the position in Wales, but particularly alarming are the indications that
adult illiteracy is higher among those who have just left school, than among any other
group under 50 (Figure 2.5 ).
Not unexpectedly literacy levels vary by occupation and poor literacy and numeracy
are more common among less skilled jobs. Fewer than 1 in 10 of those working in
managerial, professional or intermediate occupations are at Entry level or below in
literacy, but more than 4 out of 10 people in routine occupations come into this
category. In the numeracy assessment around 1 in 5 senior managers and
professional occupations are at or below entry level and this increases to 3 out of 4 in
routine occupations (Table 2.14).
An especially important group from the Welsh perspective are small businesses and
own account workers. Barely one half of these have numeracy skills above entry level
though ¾ exceed this threshold in the literacy test.
It is important to point out that the samples above were drawn from a population of
adults aged 16-64 normally resident in Wales. This means that temporary residents
such as seasonal foreign workers may be excluded. Many people are known to enter
the UK to take up low wage, low skill jobs and it is therefore possible that in some
industries / sectors the basic skills gap may be far more extensive than indicated by
the residents based evidence.
26 The National Survey of Adult Basic Skills in Wales, Basic Skills Agency, 2005http://www.basic-skills-wales.org/bsastrategy/en/resources/post_16/the_national_survey_of_adult_basic_skills_in_wales.cfmhttp://www.basic-skills-wales.org/bsastrategy/resources/Survey%20of%20Adult%20Basic%20Skills%20in%20Wales.pdf
27 Entry Level 1 basic skills are considered to be those that a 7 year old should achieve
67
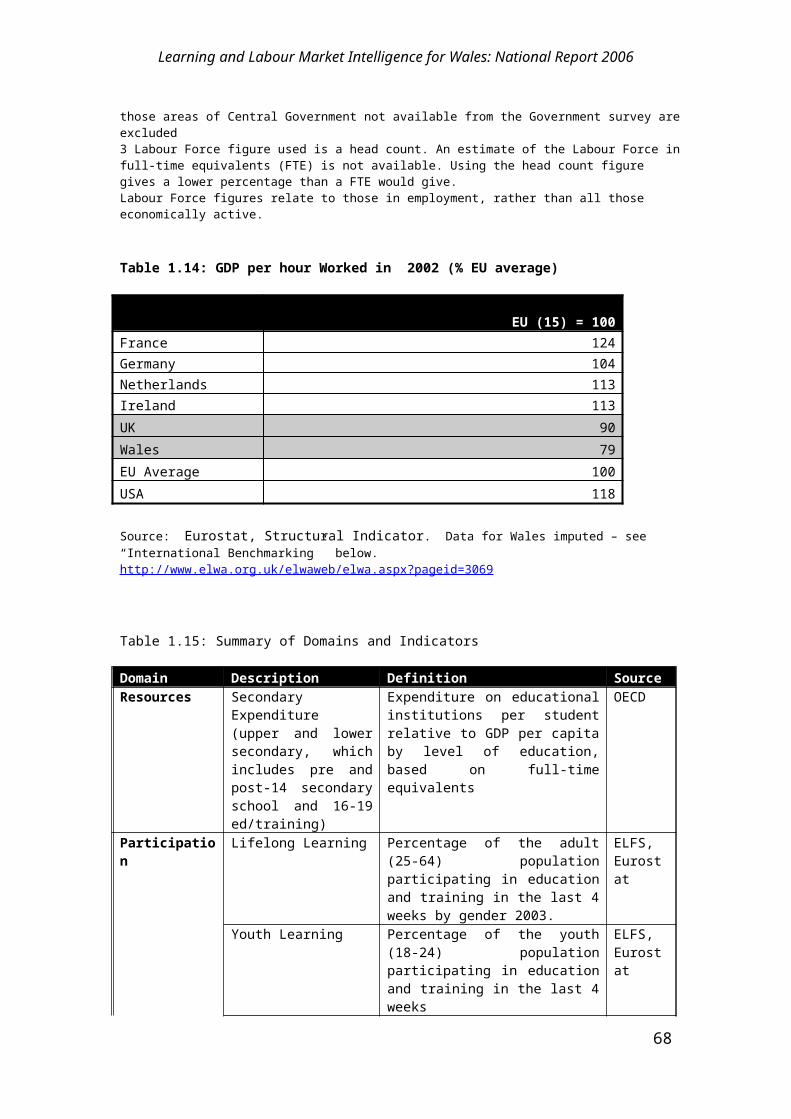
Learning and Labour Market Intelligence for Wales: National Report 2006
When considering basic skills, it has to be borne in mind that Wales has two
languages. Taking account of this the results of the first ever survey on Welsh
language literacy levels amongst Welsh speaking adults has just been published.28
The vast majority of fluent Welsh speakers are at level 1 or above – 79% This
compares favourably with the English literacy surveys (76% at Level 1 or above). Only
5% are at Entry Level 1 or lower. Literacy levels are highest amongst younger (16-24)
Welsh speaking adults with almost three-quarters of this age group being at Level 1 or
higher. However, literacy levels are lower amongst the 35-44 and 60-64 year olds with
half of these two age groups being at Entry Level 3 or lower.
Although the results of the Welsh language basic skills research are encouraging
(inasmuch as deficits are no more acute among Welsh speakers) a report published
by ELWa (NFER, 2003)29 has highlighted the lack of Welsh language support for the
development of key skills, particularly in the workplace. National written key skills tests
in Communication, Application of Number and IT are available in English and Welsh
and pupils in Welsh-medium schools invariably attempt the papers through Welsh.
However in colleges and the workplace, many Welsh-speaking students take the key
skills examinations through the medium of English.
Learner Satisfaction The National Learner Satisfaction Survey 2003 30 was commissioned by ELWa to
obtain measures of learner satisfaction in ELWa-funded provision across Wales, and
to establish benchmarks that could be tracked over time. It found that 7 out of 10 FE
and WBL learners and almost 8 out of 10 ACE learners were extremely or very
satisfied with their learning experience. Reported dissatisfaction rates were very low
at 5% or less (Table 2.15).
Satisfaction is inevitably a somewhat subjective measure, influenced by the disposition
of the learners and by their expectations. In order to investigate the match with
28 Assessing Proficiency In Reading And Writing Welsh, Written Report On Findings, Basic Skills Agency March - September 2004 29 NFER, Basic and Key Skills: A Review of International Literature, ELWA, 200330 Results from the 2003 Survey have been reported in a previous edition of this report. The 2004 survey results are not yet available.
68

Learning and Labour Market Intelligence for Wales: National Report 2006
expectations, learners were asked what they had hoped to achieve by undertaking a
course of learning and how much the experience had helped them in achieving their
objectives.
These responses suggest very different motives for learning (Table 2.16) and stress
the importance of product differentiation in meeting the needs of different groups
(Table 2.17). While WBL respondents were clearly focussed on securing economic
objectives linked to improved career and job prospects, FE respondents and ACE
learners especially, were far more circumspect. This re-enforces a view that the
demand for learning is complex and not entirely driven by economic objectives.
Non Participation in Learning
For every 4 young learners aged 16-24 in Wales there is another one who is not in
employment, education or training (NEET). In Britain an estimated 1.1 million young
people fall into this category and 50,000 of them can be found in Wales. Approximately
70% are aged between 19 and 24, the remaining 30% being 16-18 year olds.
Evidence indicates that the vast majority - 80 per cent - have low qualifications and
little chance of a good job. They are five times as likely as other young people to have
a criminal record and three times as likely to suffer mental health problems. Most are
on benefits, mainly jobseeker's allowance.
However generalisation can be misleading and the NEET group may be quite
complex. To illustrate it is possible to decompose the aggregate statistic into 2 quite
distinct sub groups:
Economically Active Unemployed (and not in education or training)
Economically Inactive (and not in education or training)
This distinction is important for the two groups exhibit very different trend behaviour.
Among 19-24 year olds, economically active NEETS have been decreasing steadily,
but the inactive group has been more erratic. Among 16-18 year olds, both the
economically active and inactive NEETS have been increasing in recent years. Growth
in the latter has been especially striking, rising from 3.8% (of the age group) in
1996/97, to 4.6% in 1999/2000 and 5.7% in 2003/04 (Figure 2.6).
69
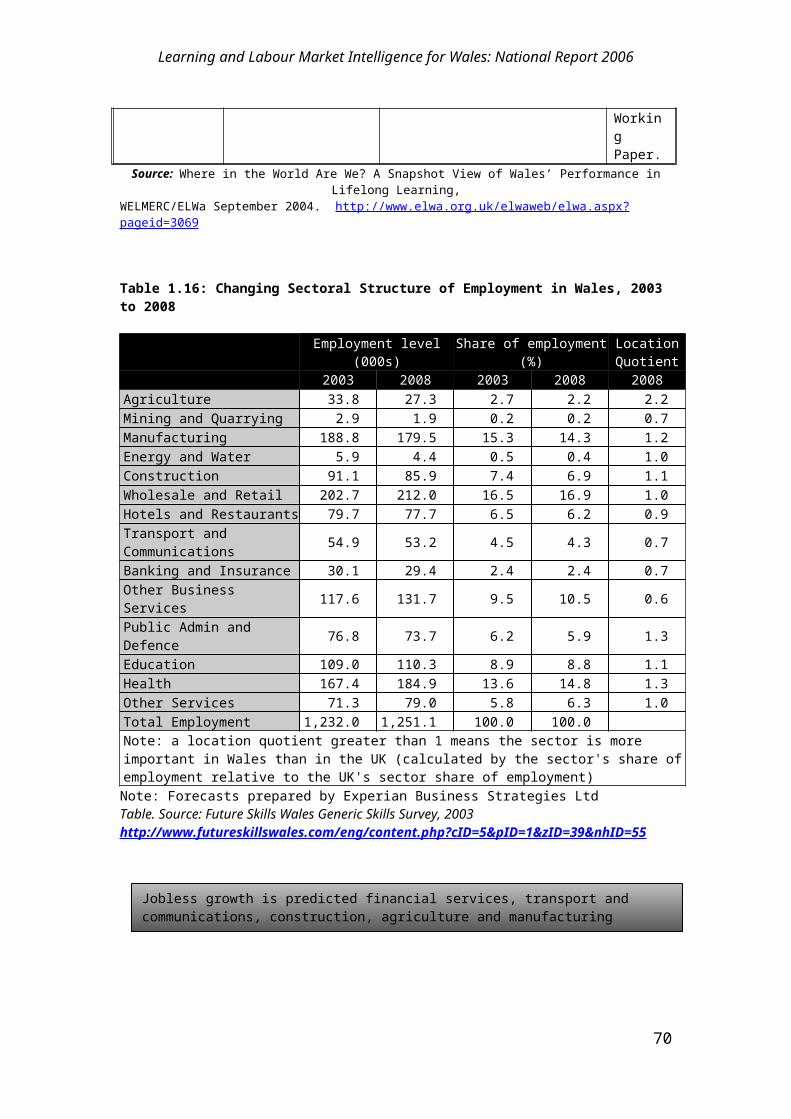
Learning and Labour Market Intelligence for Wales: National Report 2006
There are more male than female NEETs overall, but by age 18, there are more NEET
females. Gender stereotyping may also be an issue and has been identified as a
barrier to learning for male pupils in a number of research studies. In a recent report
by ELWa31 it was suggested that for young males in particular the link between
achievement in school and success in the labour market was not clear-cut, particularly
those working-class.
The point about stereotyping is illustrated by career choices of young people. In the
2003 Future Skills Wales Generic Skills Survey, those out of work were asked which
industries they would like to work in. The most popular for males were Construction
(18%), Manufacturing (13%), Wholesale & Retail (13%) and Transport &
Communications (11%), a number of which are sectors which are currently seen to be
stagnated or in decline. In contrast, the most popular destinations for unemployed
females were Health & Social Work (29%), Wholesale & Retail (19%), Social &
Personal Service activities (17%), Education (14%), predominantly areas of significant
job growth.
Evidently successfully challenging the sex stereotypes that presently exist, would lead
to people expressing less prejudice of what is considered traditionally male or female
occupations, with potentially beneficial social and economic outcomes. However, the
problem of stereotyping is exacerbated by the gender gap in pay. According to the
British Government’s Women & Equality Unit (2005), the British full-time gender pay
gap currently stands at 14.4% of average hourly earnings, meaning that women who
work full-time are paid on average 85.6% of men’s hourly earnings.
ConclusionLearning is a necessary undertaking for securing a range of economic, social and
personal rewards. How much learning is actually being undertaken within society is
difficult to gauge precisely. Notwithstanding conceptual disputes about what
constitutes learning activity, measurement difficulties are compounded by the 31 ELWa Learning Insight – Males Aged 16-24, Sept 2005http://www.elwa.org.uk/elwaweb/doc_bin/Research%20Reports/081105_learning_insight_males_1634.pdf
70

Learning and Labour Market Intelligence for Wales: National Report 2006
considerable diversity observed in the range, intensity and duration of those activities
thought to be valid.
According to the NIACE 2003 survey in Wales, 42% of the adult population were either
currently learning or had recently been engaged in some learning activity. This is an
increase of 3 percentage points since 2002 though whether it is indicative of a trend
towards greater participation in learning in Wales is hard to infer. However set in the
context of a contrary set of figures drawn from the same survey, for England, Scotland
and Northern Ireland and showing a reverse in participation, the data provide an
optimistic account of progress in Wales towards a Learning Country.
There has also been a significant reduction in the number of people who had
undertaken no learning whatsoever since leaving school. The challenge is to maintain
this progress. In this respect there a clear divide between those who participate in
education and training and those who do not. Younger people, those with high levels
of initial education, those in work (especially in higher level occupations and in larger
firms) are far more likely to be engaged in learning than older people, those who leave
school early, and people in lower-skilled manual occupations.
The experience of learning can be a powerful stimulus for future learning. Among
those who have recent learning experience, future learning intentions are high. But
future intentions decay quickly with time. There is also a need to find ways of
sustaining the demand for learning among those who need it most, but are interested
in it least. One quarter of the adult population of Wales are at or below entry level in
literacy.
The numbers of young people who are not in any form of training, education or
employment are of particular concern. Little is known about this group and their future
prospects, in terms of education, training and future employment are likely to remain
poor without significant intervention. The usefulness of NEET as a category for
policymaking is compromised by the fact that this may be a more complex group than
the data superficially suggest.
Participation in learning is notably low among older people, though the need for
learning among this group is likely to increase in the future, especially if as seems
likely, more will remain economically active. Learner satisfaction surveys suggest that
reaching different parts of the population requires identifying with different needs and
71

Learning and Labour Market Intelligence for Wales: National Report 2006
differentiating the learning product accordingly. In Wales (and some parts of the
country more so than others), this raises issues about the role of the Welsh language
in learning provision and assessment.
Table 2.1: Percentage of Adult Learners in Wales, 2004
Percent
Taught Adult Learning
Non-Taught Adult Learning
Taught & Non-Taught Adult Learning
No Adult Learning
Working age people 8.5 19.8 41.7 30.0Working age males 7.0 23.5 40.5 29.1Working age females 10.1 15.9 43.0 30.9
72

Learning and Labour Market Intelligence for Wales: National Report 2006
DDA and Work Limited 6.6 18.8 17.3 57.2Not Disabled 8.9 19.9 46.8 24.4
Source: Annual Population Survey, 2004 (National Statistics).
Figure 2.1: Percent Very Likely/Unlikely to Learn in Future by Learning Status
Source: Moving Forward, Survey on Adult Participation in Learning in Wales, ELWa 2003; Table 11.
Table 2.2: Destinations of Year 11 Pupils at the end of Compulsory Education in Wales
All 1997 1998 1999 2000 2001 2002 2003 2004Continuing in full-time education 70.2% 71.4% 73.5% 74.5% 74.3% 73.3% 73.8% 74.4%Work-based training - non-employed status 6.7% 5.2% 5.6% 5.1% 5.6% 6.4% 6.0% 5.4%Work-based training -employed status 2.5% 3.2% 2.4% 2.2% 2.1% 2.3% 2.4% 2.2%Employed – other 7.7% 7.1% 6.9% 6.4% 6.5% 6.2% 6.8% 6.5%Known not to be in education, training or employment 7.5% 7.3% 6.9% 6.2% 5.7% 6.5% 6.3% 7.0%No response to survey 5.4% 5.8% 4.7% 5.6% 5.8% 3.6% 2.6% 2.6%Left the area 1.6% 2.3% 1.9%Education or training 79.4% 79.8% 81.5% 81.8% 82.0% 82.0% 82.2% 82.0%
73
Current learning promotes future learning intentions – but the process has very short memory.
DDA and Work limited disabled are more than twice as likely as non disabled people to have engaged in no learning activity in the previous 12 months

Learning and Labour Market Intelligence for Wales: National Report 2006
Total number in cohort 36,290 35,651 35,365 35,446 36,924 36,445 38,075 39,104Source: Careers Wales
Table 2.3: Participation of 16-18, 19-24 and 25-30 year olds in Education and Training in Wales, 2003/2004
Persons Percent
16-18 19-24 25-30 16-18 19-24 25-30
Full-time:Schools 28,140 60 0 24.6% 0.0% 0.0%Further Education 28,540 5,450 1,810 25.0% 2.6% 0.9%Higher Education 10,340 47,670 6,280 9.0% 22.5% 3.2% Total 67,010 53,180 8,080 58.6% 25.0% 4.1%Part-timeFurther Education 8,400 14,450 13,120 7.3% 6.8% 6.7%Higher Education 1,940 6,700 7,550 1.7% 3.2% 3.8%Open University 30 640 1,040 0.0% 0.3% 0.5%Total 10,360 21,790 21,710 9.1% 10.3% 11.0%Government supported training for young people(includes college based)
11,070 13,070 2,450 9.7% 6.2% 1.2%
Total learning 88,440 88,040 32,240 77.4% 41.5% 16.4%Total Population 117,000 219,800 190,300 100.0% 100.0% 100.0%Source: STATSWALES http://www.statswales.wales.gov.uk/TableViewer/tableView.aspx?ReportId=769
Table 2.4: Estimated Participation of 16-18 year olds in Education and Training in Wales, by Economic Activity 2003/04
Number
Full-time employed
Part-time employed
ILO Unem-ployed Inactive Total
Full time education 1,400 26,300 4,200 35,200 67,000Part time education 5,700 1,900 1,000 1,800 10,400Training 4,500 2,600 . . 7,100Not in education or training 13,400 4,600 7,900 6,700 32,600Total 24,900 35,300 13,000 43,700 117,000
% Full time education 1.2 22.5 3.6 30.1 57.3
74
Participation of 16-18 year olds in education and training has remained relatively steady (at around 82%) since the beginning of the decade
Participation rates in formal learning are highest among 16-18 year olds and tail off quickly thereafter. 6 out of 10 of 16-18 year olds in Wales were in full-time education with a further 9% in part-time education. By age 19-24 the participation rate has virtually halved and by 25-30 it will have halved again.

Learning and Labour Market Intelligence for Wales: National Report 2006
Part time education 4.9 1.6 0.9 1.5 8.9Training 3.8 2.2 0.0 0.0 6.1Not in education or training 11.5 3.9 6.8 5.7 27.9Total 21.3 30.2 11.1 37.4 100.0Source: http://www.statswales.wales.gov.uk/TableViewer/tableView.aspx
Figure 2.2: Learner Numbers1 as a Percentage of the Population 2004/05
Sources: LLWR 2004/05; Mid Year Population Estimates (National Statistics). Notes: 1. FE, CL and Work Based learners.
75
Just 6% of learners are unemployed while among the 32,600 not involved in learning/training 24% are unemployed. A further 6,700 people are inactive and not learning. This indicates a core of over 12% of all 16-18 year olds who are neither working nor engaged in any form of learning.
Male participation exceeds that of females from age 18 to 20 when the participation of women overtakes that of men, creating a sizeable gap before converging at age 65+.

Learning and Labour Market Intelligence for Wales: National Report 2006
Table 2.5: Learners by Age and Ethnicity 2004/05
AgeNumber in Group
White Black Asian Mixed Other
Refused or Not Known
All Ethnic Groups
16 and under 27,225 155 335 270 75 985 29,05017-19 40,290 370 790 340 200 925 42,91020-24 31,385 375 715 230 240 1,285 34,22525-49 110,005 1,255 2,460 515 795 6,030 121,06050-64 41,560 140 325 75 100 2,720 44,91565 plus 16,795 55 80 15 25 1,290 18,260Not Specified 3,410 35 55 20 20 580 4,125All 270,670 2385 4765 1465 1455 13810 294545Source: LLWR (STATSWALES)http://www.statswales.wales.gov.uk/TableViewer/tableView.aspx?ReportId=2003
AgePercent within Ethnic Group
White Black Asian Mixed Other
Refused or Not Known
All Ethnic Groups
16 and under 10.1 6.5 7.0 18.4 5.2 7.1 9.917-19 14.9 15.5 16.6 23.2 13.7 6.7 14.620-24 11.6 15.7 15.0 15.7 16.5 9.3 11.625-49 40.6 52.6 51.6 35.2 54.6 43.7 41.150-64 15.4 5.9 6.8 5.1 6.9 19.7 15.265 plus 6.2 2.3 1.7 1.0 1.7 9.3 6.2Not Specified 1.3 1.5 1.2 1.4 1.4 4.2 1.4
All 100.0 100.0 100.0 100.0 100.0 100.0 100.0
76
Three quarters of learners are aged over 20 and there are more learners aged 50 and over than are aged 18 or below. Non-white ethnic minorities account for 8% of the learning population with those from the Asian community accounting for almost one half (47%) of these.

Learning and Labour Market Intelligence for Wales: National Report 2006
Table 2.6: Enrolments by Age, Mode, Gender; Wales 2004/05
Number Percent
19 and under 20-49 50+ 19 and
under 20-49 50+
MalesFE/HE and CL: Full-Time 17,040 3,150 180 17.5% 1.6% 0.21%FE/HE and CL: Part-Time
17,470 58,745 28,815 17.9% 29.2% 33.3%
Work Based Learning18,680 15,650 1,175 19.1% 7.8% 1.4%
All Males 53,190 77,550 30,170 54.5% 38.5% 34.9%
FemalesFE/HE and CL: Full Time 16,740 5,195 245 17.1% 2.6% 0.3%FE/HE and CL: Part-Time
15,505 100,760 54,255 15.9% 50.1% 62.8%
Work Based Learning12,200 17,790 1,745 12.5% 8.8% 2.0%
All Females 44,445 123,745 56,245 45.5% 61.5% 65.1%
All Modes and Persons* 97,635 201,295 86,415 100.0% 100.0% 100.0%Source: LLWR Records (STATSWALES): http://www.statswales.wales.gov.uk/TableViewer/tableView.aspx?ReportId=2005
* 4,835 persons of unknown characteristics are omitted from the table.
77
The under 20 age group accounts for the 8 out of 10 of all full-time learning enrolments. However over the age of 19 and both the gender balance and mode of study change appreciably. Women make up 63% of the learning population aged 20+ and outnumber men by almost 2:1. Moreover, almost 9 out of 10 women learners (86%) aged 20 and over are part-time learners

Learning and Labour Market Intelligence for Wales: National Report 2006
78

Learning and Labour Market Intelligence for Wales: National Report 2006
Figure 2.3: Learning Activities by level of study at FE Institutions 2004/05
Source: LLWR (STATSWALES)
79
Key Skills, OCN Credits and Other qualifications accounted for 80% of the total.
Learning and Labour Market Intelligence for Wales: National Report 2006
Figure 2.4: Learning activities by Subject at FEIs 2004/2005
Source: LLWR (STATSWALES)
Note: 28% of subjects were unspecified. The above percentages are based on the distribution of specified activities only.
80
Care was the most popular subject account for almost one quarter of the total. The 3 most popular subject areas were Care, IT and Health making up 50% of the total.
Learning and Labour Market Intelligence for Wales: National Report 2006
Table 2.7: FE Learning Activities at FE providers by subject and qualification type 2004/05(A) Subject Distribution by Qualification (%)
Source: LLWR (STATSWALES)
GNVQ/AVCE
GCSE/VCE AS/A/A2 NVQ
Nat Cert/Dip
First Cert/Dip
Key Skills
Btec/ OCN/Access
HE level Other
All quals
Agriculture -
-
-
1.7
5.4
3.7
-
2.7
-
1.1
1.4
Arts and Crafts 1
4.2
1.2
6.6 -
13.4
0.4
-
5.9
-
1.8
2.9
Built Environment
2.8 -
-
8.1
1.3
0.5
-
1.2
4.2
3.1
2.1
Business Management
11.1
0.2
4.3
8.2
2.5
1.1
8.6
4.4
27.7
3.4
5.1
Care
1.5 -
-
9.0
0.3
0.1
28.4
26.7
-
11.0
17.1
Cultural Studies
0.5
16.4 1
4.7
1.0 -
1.7
-
9.6
-
3.0
4.8
Education
0.1 -
-
0.8
-
-
-
4.4
11.8
2.8
2.3
Engineering
5.0 -
0.8
11.7
4.7
0.3
-
1.1
6.7
2.9
2.3
Environment -
0.3
0.6
0.8
0.2
0.6
-
0.2
-
0.2
0.2
Health 1
5.0
3.1 1
0.4
19.2
6.7
2.0 -
10.3
12.6
9.0
8.3
Hotel and Catering
10.0
0.2
-
8.2
1.7
-
-
0.7
10.9
4.2
2.4
Humanities -
0.5
7.3
-
-
-
-
3.4
-
0.6
1.5
IT 3
2.8
1.5
3.9
0.1
1.4 -
5.2
15.9
5.9
13.3
10.7
Manufacturing
0.1 -
-
5.9
0.6
-
-
0.3
-
0.4
0.7
Media
3.6
0.8
6.7
0.3
6.8
0.1
6.3
4.1 -
0.8
3.1
Mining/Chemicals -
-
-
0.2
-
-
-
0.0
-
0.1
0.1
Performing Arts
1.6
0.5
3.0 -
12.4
3.7
-
1.6
2.5
0.5
1.0
Sales/Marketing
0.3 -
-
9.1
0.6
-
-
0.1
2.5
0.4
0.8
Science/Maths
1.5
25.7 2
0.1
0.3
0.2
0.6
0.4
1.1 -
0.1
2.0
Services to Ind/Commerce
-
-
-
2.0
0.1
-
-
0.1
-
0.3
0.3
Social Sciences -
1.4
15.0
-
-
-
-
0.9
0.8
0.2
1.1
Sports -
0.5
1.7
0.4
0.7
1.5
-
2.7
6.7
1.0
1.2
Transport -
-
-
0.8
-
-
-
0.0
-
0.4
0.2
Not Specified -
47.7
4.8
12.1
40.8
83.5
51.2
2.4
5.0
39.5
28.4
All Subjects 100.0 100.0 100.0 100.0 100.0 100.0 100.0 100.0 100.0 100.0 100.0
81

Learning and Labour Market Intelligence for Wales: National Report 2006
(B) Distribution of Qualifications by Subject (%)
GNVQ/AVCE
GCSE/VCE AS/A/A2 NVQ
Nat Cert/Dip
First Cert/Dip
Key Skills
Btec/ OCN/Access
HE level Other
All quals
Agriculture -
-
-
9.2
4.4
5.4
-
53.1
-
27.8
100.0
Arts and Crafts 5.9
0.7
12.1
-
5.0
0.3
-
53.8
-
22.3
100.0
Built Environment 1.6
-
-
28.2
0.7
0.5
-
15.5
0.2
53.3
100.0
Business Management
2.6
0.1
4.6
11.6
0.6
0.4
32.2
23.4
0.6
24.0
100.0
Care 0.1
-
-
3.8
0.0
0.0
31.5
41.7
-
22.8
100.0
Cultural Studies 0.1
5.7
16.3
1.5
-
0.7
-
53.3
-
22.4
100.0
Education 0.0
-
-
2.6
-
-
-
52.6
0.5
44.1
100.0
Engineering 2.6
-
1.8
36.5
2.2
0.3
-
12.2
0.3
44.1
100.0
Environment -
2.2
15.7
27.8
1.3
5.7
-
20.0
-
27.8
100.0
Health 2.2
0.6
6.7
16.8
0.9
0.5
-
33.4
0.2
38.8
100.0
Hotel and Catering
5.0
0.1
-
24.4
0.8
-
-
7.9
0.5
61.2
100.0
Humanities -
0.6
26.0
-
-
-
-
59.9
-
13.5
100.0
IT 3.7
0.2
2.0
0.1
0.1
-
9.3
40.0
0.1
44.4
100.0
Manufacturing 0.1
-
-
65.2
0.9
-
-
10.6
-
23.1
100.0
Media 1.4
0.5
11.6
0.6
2.4
0.1
38.6
35.9
-
8.9
100.0
Mining/Chemicals -
-
-
23.5
-
-
-
8.8
-
67.6
100.0
Performing Arts 1.9
0.9
15.7
-
13.4
7.2
-
43.0
0.3
17.6
100.0
Sales/Marketing 0.4
-
-
78.6
0.8
-
-
4.2
0.3
15.6
100.0
Science/Maths 0.9
21.9
54.7
0.9
0.1
0.6
3.7
15.2
-
1.8
100.0
Services to Ind/Commerce
-
-
-
50.5
0.3
-
-
7.2
-
41.4
100.0
Social Sciences -
2.0
70.9
-
-
-
-
21.7
0.1
5.3
100.0
Sports -
0.7
7.4
2.5
0.6
2.5
-
57.9
0.6
27.8
100.0
Transport -
-
-
28.5
-
-
-
5.1
-
66.4
100.0
Not Specified -
2.8
0.9
3.1
1.6
5.8
34.2
2.2
0.0
49.3
100.0
All Subjects 1.2
1.7
5.4
7.2
1.1
2.0
19.0
26.8
0.1
35.6
100.0
Source: LLWR (STATSWALES)
82

Learning and Labour Market Intelligence for Wales: National Report 2006
Table 2.8: Number of Learning Activities by Subject and Qualification at Community Learning Providers, 2004/05
GNVQ/AVCE
GCSE/VCE AS/A/A2 NVQ
Nat Cert/Dip
First Cert/Dip
Key Skills
Btec/ OCN/Access
HE level Other All quals
Agriculture -
- -
-
-
-
-
335
-
165 500
Arts and Crafts -
10 15
-
-
-
-
5,665
-
7,095 12,790
Built Environment -
- -
-
-
-
-
315
-
135 450
Business Management
-
- -
-
-
-
-
25
-
175 200
Care -
- -
-
-
-
-
3,940
-
9,390 13,335
Cultural Studies -
50 30
-
-
35
-
9,860
-
7,435 17,410
Education -
- -
-
-
-
-
185
-
1,985 2,170
Engineering -
- -
-
-
-
-
375
-
15 390
Environment -
- -
-
-
-
-
20
-
55 80
Health -
50 20
110
-
30
-
440
-
1,835 2,490
Hotel and Catering
-
- -
-
-
-
-
580
-
1,520 2,100
Humanities -
10 10
-
-
-
-
430
-
250 695
IT -
5 -
-
5
-
-
5,695
-
9,790 15,495
Manufacturing -
- -
-
-
-
-
205
-
275 480
Media -
- -
-
-
-
-
600
-
2,075 2,670
Mining/Chemicals -
- -
-
-
-
-
-
-
- -
Performing Arts -
- 10
-
-
-
-
665
-
1,630 2,305
Sales/Marketing -
- -
-
-
-
-
-
-
5 5
Science/Maths -
60 -
-
-
-
-
120
-
200 380
Services to Ind/Commerce
-
- -
-
-
-
-
-
-
- -
Social Sciences -
10 15
-
-
-
-
80
-
375 475
Sports -
- -
-
-
-
-
-
-
535 535
Transport -
- -
-
-
-
-
-
-
75 75
Not Specified -
255 60
35
20
-
20
1,880
-
4,110 6,385
All Subjects -
445 165
145
25
65
20
31,420
-
49,125 81,410
Source: LLWR (STATSWALES)
Table 2.9: Learning Activities (FE,CL,WBL) and Language of Provision, 2004/05
83
Learning and Labour Market Intelligence for Wales: National Report 2006
Source: LLWR (STATSWALES)
http://www.statswales.wales.gov.uk/TableViewer/tableView.aspx?ReportId=2011
Qualification Type
Number of Learning Activities % of Total Learning Activities
All Provision
Welsh Medium Bilingual
All Provision
Welsh Medium Bilingual
GNVQ/AVCE 6,910 80 250 0.80% 0.01% 0.03%GCSE/VCE 10,020 20 90 1.16% 0.00% 0.01%AS/A/A2 30,650 420 625 3.55% 0.05% 0.07%NVQ 89,855 300 1,875 10.41% 0.03% 0.22%Nat Dip/Cert 6,940 0 130 0.80% 0.00% 0.02%First Dip/Cert 11,425 60 575 1.32% 0.01% 0.07%Key Skills 205,845 185 1,535 23.85% 0.02% 0.18%BTEC/OCN/Access 185,785 940 5,595 21.53% 0.11% 0.65%HE 1,205 0 15 0.14% 0.00% 0.00%Other 314,280 785 4,375 36.42% 0.09% 0.51%
862,915 2790 15,065 100.00% 0.32% 1.75%
84
0.3% of learning activities are delivered exclusively through the medium of Welsh and a further 1.7% of provision is bilingual.

Learning and Labour Market Intelligence for Wales: National Report 2006
Table 2.10: Workforce Development in Wales 2004
Workforce Development
Category Number in Training in last 4 weeks
%
Males NVQ4+ 38,300 22.4Females NVQ4+ 46,600 27.6Males NVQ3 & below 16,900 15.4Females NVQ3 & below 15,800 20.9
Males - managerial & prof. 47,400 18.5Females - managerial & prof 49,900 25.7
Working full-time 150,700 16.1Working part-time 49,300 16.0
In private services 71,200 13.5In production 23,100 11.1In the public sector 93,300 24.4
All working age 200,000 11.5Source: Annual Population Survey 2004; Local Area Labour Force Survey 2003/04
Table 2.11: Workforce Development UK, Wales and ELWa (DELLS) Regions, 2004
Population (working age)
In employment
Training in last 4 weeks
(employed + self empl)
Training as % of employment
England 30,401,000 22,668,000 3,460,000 15.3%Scotland 3,126,000 2,335,000 386,000 16.5%Northern Ireland 1,043,000 705,000 68,000 9.7%Wales 1,746,000 1,243,000 197,000 15.9%
North Wales 380,000 285,000 47,000 16.3%Mid Wales 140,000 103,000 14,000 13.1%
South West Wales 381,000 262,000 39,000 15.0%South East Wales 845,000 592,000 98,000 16.6%
Source: Annual Population Survey 2004, National Statistics
Female employees received more training than men though that training may be biased in favour of those already well qualified.
85

Learning and Labour Market Intelligence for Wales: National Report 2006
Table 2.12: Percentage Qualified to NVQ equivalent levels, UK Regions, 2004
NVQ 4+ NVQ 3 NVQ 2 Below NVQ 2
No
Qualifications
England 27.6 19.4 20.2 32.8 14.1Wales 25.5 19.3 21.4 33.8 17.0Scotland 32.1 20.0 18.2 29.8 15.7N Ireland 24.5 18.2 21.3 36.0 24.3UK 27.8 19.4 20.1 32.7 14.7
Source: STATSWALES
Qualifications act as a proxy for skill levels by signaling achievement and motivation as well as indicating specific knowledge. On this measure Wales has relatively more low achievers and fewer high achievers. Although real progress has been made in upskilling its workforce, there continues to be a large base of people lacking in any qualifications
86
Learning and Labour Market Intelligence for Wales: National Report 2006
Table 2.13: Adult Literacy and Numeracy in Wales: Headline Results
Literacy Numeracy
Entry Level 1 4% 7%Entry Level 2 3% 20%Entry Level 3 18% 26%Level 1 37% 25%Level 2 and above 38% 22%
Source: The National Survey of Adult Basic Skills in Wales, Basic Skills Agency, 2005 (Reproduced in The National Basic Skills Strategy for Wales, Welsh Assembly 2005 - http://www.learning.wales.gov.uk/pdfs/c1505-words-talk-e.pdf)
Figure 2.5: Adult Literacy Assessment by Age: Wales 2004
Source: The National Survey of Adult Basic Skills in Wales (Table 2.3), Basic Skills Agency, 2005 http://www.basic-skills-wales.org/bsastrategy/en/resources/post_16/the_national_survey_of_adult_basic_skills_in_wales.cfm
Adult illiteracy is higher among those who have just left school, than it is among any other group under 50.
87

Learning and Labour Market Intelligence for Wales: National Report 2006
Table 2.14: Adult Literacy and Numeracy by Occupation
Percent within occupation group at or below Entry Level in
Literacy NumeracyHigher Managerial/Professional 8 17Lower Managerial/Professional 10 32Intermediate Occupations 6 46Small Employers/Own Account Workers 24 49Lower Supervisory and Technical Occ 23 51Semi Routine Occupations 30 66Routine Occupations 42 74All Occupations 19 47
Source: The National Survey of Adult Basic Skills in Wales, Basic Skills Agency, 2005http://www.basic-skills-wales.org/bsastrategy/en/resources/post_16/the_national_survey_of_adult_basic_skills_in_wales.cfm
Fewer than 1 in 10 of those working in managerial, professional or intermediate occupations are at Entry level or below in literacy, but more than 4 out of 10 people in routine occupations come into this category. In the numeracy assessment around 1 in 5 senior managers and professional occupations are at or below entry level and this increases to 3 out of in routine occupations. Barely one half of small employers and own account workers have numeracy skills above entry level though ¾ exceed this threshold in the literacy test.
88
Learning and Labour Market Intelligence for Wales: National Report 2006
Table 2.15: Overall Satisfaction with Learning Experience
Percent
Base all learners All learners
FE WBL ACE
Extremely satisfied 27 27 23 37Very satisfied 43 43 46 41Fairly satisfied 22 22 24 16
Total extremely/ very satisfied 70 70 69 78Total satisfied 92 92 93 94Total dissatisfied 5 5 4 4
Source: National Learner Satisfaction Survey for Wales, ELWa, 2003 Some figures may not sum to 100% due to rounding http://www.elwa.org.uk/elwaweb/elwa.aspx?pageid=3069#11
Table 2.16: Learners’ Objectives in undertaking their course
PercentBase all learners All
learnersFE WBL ACE
Improve knowledge of subject 95 95 94 94Gain new skills 93 94 94 91Further your personal development 92 92 93 91Meet new people 83 83 84 87Do something useful with spare time 76 75 81 86Get onto other courses/further your education 74 76 82 57Get more satisfaction from work 74 75 90 51The ability to progress through career generally 73 75 93 41Get a different job/better job 63 65 84 28Learn skills for a job you were doing at time 53 53 79 31
Source: National Learner Satisfaction Survey for Wales, ELWa 2003
Table 2.17: Extent to which course has helped achieve objectives by Type of Provision
%
Helped a lot towards the following objectives:
All learners
FE WBL ACE
Improve knowledge of subject 82 81 81 86Gain new skills 76 73 83 79Further your personal development 66 63 75 75Meet new people 69 68 78 67Get onto other courses/further your education 54 55 59 N/AThe ability to progress through career generally 60 58 68 N/AGet more satisfaction from work 65 63 71 N/ADo something useful with spare time 69 69 64 81Get a different job/better job 51 49 63 N/ALearn skills for a job you were doing at time 61 59 74 N/A
Source: National Learner Satisfaction Survey for Wales, ELWa 2003Base: all those stating each objective.Gaps in the ACE figures (marked by N/A), this is due to low base sizes
89

Learning and Labour Market Intelligence for Wales: National Report 2006
Note: Don’t know and ‘other’ responses are not included. Multiple responses allowed.
Figure 2.6: Percentage Not In Employment, Education of Training by Age Group
Source: StatsWales
http://www.statswales.wales.gov.uk/TableViewer/tableView.aspx
90
Among 19-24 year olds, economically active NEETS have been decreasing stead-ily, but the inactive group has been more erratic. Among 16-18 year olds, both the economically active and inactive NEETS have been increasing in recent years. Growth in the latter has been especially striking, rising from 3.8% (of the age group) in 1996/97, to 4.6% in 1999/2000 and 5.7% in 2003/04

Learning and Labour Market Intelligence for Wales: National Report 2006
Chapter 3
Patterns of Employment, Unemployment and Inactivity
IntroductionThe evaluation of labour market performance is essentially comparative, involving
different regions or countries, or the same region or country over time. It is also
multi-dimensional involving employment, unemployment, inactivity and levels of
remuneration, so that reliance on a single indicator is likely to be inadequate. On the
other hand, using multiple indicators is also problematic, as it is not clear how one
should weight different indicators.32 There is also the question of differential labour
performance across sub-regions as in the Objective One and Three areas within
Wales. Should one only be concerned with labour market improvement over the
whole of Wales or focus also on relative performance within Wales? Studies of the
labour market have tended to focus on either the rate of employment or
unemployment, but particularly in Wales there is a need to consider three labour
market states – employment, unemployment and inactivity.33 Reduced levels of
unemployment may have been achieved at the cost of rising levels of inactivity,
which in part may simply represent hidden unemployment. Therefore, in this chapter
an attempt has been made to adopt a more unified approach.
Patterns of EmploymentOver the period March-May 1999 to March-May 2005 the number of individuals who
were `economically active in Wales grew by 52,000 and those in employment by
86,000, while the number ILO unemployed fell by 34,000 and the number
economically inactive by 15,000 representing an overall strengthening of the labour
market (Table 3.1). For Wales this represented an improvement from 73.8% to 32 For an attempt to overcome these problems see Melanie K. Jones, Dynamic Benchmarking of the Welsh Labour Market, WELMERC Discussion Paper No. 2003-02, University of Wales Swansea, 2003.33 See O’Leary et al., Accounting for Differences in Labour Market Outcomes in Great Britain: A Regional Analysis using the Labour Force Survey, WELMERC Discussion Paper, No. 2005-01, University of Wales Swansea, 2005.The employment rate is the number of people with jobs. It includes people aged 16 and over who did paid work (as an employee or self employed) and those temporarily away from work. It also covers unpaid family workers or those participating in government training schemes. ILO unemployment consists of unemployed peopled aged 16 and over who are without a job, but have actively sought work in the last four weeks and are available to start work in the next two weeks, or who are out of work, have found a job and are waiting to start it in the next two weeks. The economically inactive consist of those who are neither in employment nor unemployed. Included are those who want a job and are seeking work, but are not available to start work, as well as those who do not want a job.
91
Learning and Labour Market Intelligence for Wales: National Report 2006
75.2% in the economic activity rate, from 68.0% to 72.5% in the employment rate,
from 7.5% to 4.6% in the ILO unemployment rate and from 26.2% to 24.8% in the
economic inactivity rate. While each of these rates was inferior to that in the UK as a
whole there was a relative closing of the gap in all of them over this period.
The long-run growth in employment has traditionally favoured women and over the
period between summer 2001 and summer 2003 this remained the case. However,
since then while the male employment rate has continued to increase, the
employment rate for women has begun to decrease. It remains to be determined
whether this represents a fundamental change in the gender distribution of new jobs.
A further change has occurred in the relationship between employment in the LFS
and measures of jobs in workplaces as captured by the Annual Business Inquiry
(ABI) and the Short Term Employer Surveys. Until the middle of 2002 the two types
of survey showed similar employment trends, but thereafter the two series have
diverged with the LFS measure of employment continuing to increase and remaining
at a higher level and the business survey measure falling back before beginning to
rise early in 2003. Whether this divergence is a consequence of differences in
coverage, definitions of employment or the design of the surveys remains open, but
the LFS remains the ONS’s preferred source for the level of employment at the whole
economy level.34
The gender distribution is better considered by age group (Table 3.2). Comparing
first men with women in Wales the employment rate for men is higher than that of
women for age groups from 25 to retirement. The employment rate is highest for
those aged 25 to 34 for males and 35 to 49 for females. It should also be noted that
since hours of work are longer for men than for women, Table 3.2 understates
differences in the gender contribution to total hours worked. Turning to the
comparisons between Wales and the UK as a whole, employment rates are generally
lower in Wales than the UK as a whole. Exceptions are the rates for women for age
groups from 18 to 49, which are marginally higher in Wales.
As outlined in Chapter 1 the employment rate of older workers is becoming
increasingly important as the population ages. A recent study by Hotopp35 finds that
34 See James McNair, The Increase in Employment in Wales during 2002 and 2003, Labour Market Trends, September 2004, pp 347-362.35 Ulrike Hotopp, The Employment Rate of Older Workers: An Econometric Analysis of the Main Influences on Growth since 1993, Labour Market Trends, Vol. 113, No. 02, 2005, pp 73-88.
92

Learning and Labour Market Intelligence for Wales: National Report 2006
after a long period of decline the employment rate of people aged 50 and over has
been increasing since 1993. She concludes that the growth in the employment rate
of older workers is the result of an autoregressive process, positive average earnings
growth and the changing ethnic composition of this age group as a result of a cohort
effect increasing the number of non-whites in this age group. It should be noted that
there are no regional controls included in the estimating equation, so that it is not
known if the same effects hold in Wales.
The Geographical Distribution of EmploymentIt is possible to consider patterns of employment and economic activity by the 40
parliamentary constituencies in Wales based on Local Area Labour Force Survey
data (Table 3.3). For Wales as a whole the employment rate increased slightly and
the non-employment rate correspondingly decreased slightly between 2003 and
2004. At the latter date Merthyr Tydfil & Rhymney recorded the lowest employment
rate (60.3%) and Alyn and Deeside the highest (80.8%). The highest rate of
inactivity was recorded in Merthyr Tydfil and Rhymney (34.9%) and the lowest in Alyn
and Deeside (17.5%). These differences correspond closely with the Objective One
area and the rest of Wales, with the Valleys having the lowest employment and
highest inactivity of any of the parliamentary constituencies.
Figures are also available for economic activity by local authority for April 2004-Mar
2005 (Table 3.4). These reveal that working age employment varied from 63.3% in
Blaenau Gwent to 77.6% in Flintshire. Unemployment rates for economically active
people at working age varied from 2.3% in Wrexham to 7.3% in Blaenau Gwent and
Caerphilly. Around 25.2% of the working age population of Wales were economically
inactive. The highest rate was 32.4% in Merthyr Tydfil and the lowest rate of 20.3%
was in Flintshire.
Recent work by WELMERC36 for the Welsh Assembly Government based on a
survey of 1,300 working age inactive adults in three areas of contrasting interest (the
Valleys, urban hotspots and areas closer to the Welsh average in terms of inactivity)
found in general that there was severe disengagement from the labour market with
around half of the men and nearly half of the women not having worked for ten years
or more. In the case of men the vast majority suffered from long-term sickness, while
36 See D. Blackaby et al., Identifying Barriers to Economic Inactivity in Wales, May 2003 and Part II, A Survey of the Economically Inactive in Three Areas of Special Interest, September 2004, Reports for the Economic Research Unit, Welsh Assembly Government.
93
Learning and Labour Market Intelligence for Wales: National Report 2006
in the case of women the majority looked after the family home. No less than three
quarters of the inactive respondents lived in workless households, and over two-
thirds had no formal qualifications. Of particular concern were young men aged 18-
24 who reported spending on average one quarter of the time between 8.00 am and
4.00 pm watching television, sleeping for over an hour, but no time studying.
Employment by IndustryThe industrial composition of the Welsh labour market differs in certain respects from
that in the UK as a whole. While in both countries according to LFS data the Public
Administration, Education and Health sector is the largest it is more significant in
Wales (30.8% of all employee jobs as opposed to 27.1% in the UK). Second in
Wales is Distribution, Hotels and Restaurants (20.4%) and third Manufacturing
(15.6%). In the UK, Banking, Finance and Insurance is ranked third, but this only
accounts for 10.6% of employment in Wales. The service sector now accounts for
73.2% of employment in Wales (Table 3.5). While in Wales there are some
pronounced differences in the industrial distribution of employment within the four
regions, with Mid Wales standing out as having a bigger Agriculture and Fishing
Sector and smaller Manufacturing and Services sectors than the other three regions;
the Annual Business Inquiry data (Table 3.6) are broadly consistent with those from
the Local Area LFS, but have an even higher concentration in services (79% for
Wales as a whole and no less than 84% in Mid Wales). It should be noted that
differences in the two sources of data may arise from the fact that multiple job
holding will result in separate classifications in the Business Inquiry but be recorded
as a single event in the LFS. It is also believed that respondents to the LFS are less
likely than their employers to identify correctly the sector of industry in which they
work. For example, McNair (2004) suggests that contract cleaners in hospitals
should classify themselves as service sector workers, but may erroneously describe
themselves as working in the health sector when responding to the LFS.
There have been some substantial changes in the industrial distribution between the
Spring quarters of 2004 and 2005 (Table 3.7). Construction employment declined by
9% in Wales, unlike Britain as a whole where employment increased by 4%. In
contrast, there was a larger growth in Wales than in Britain with respect to
employment in Banking, Finance & Business Services (5% compared to 1%).
Employment in Transport and Communications also grew in Wales whereas
employment stayed the same in Britain.
94

Learning and Labour Market Intelligence for Wales: National Report 2006
There are considerable differences in the distribution of educational qualifications
across industries (Table 3.8). No less than 44% of employees in Energy and Water
in 2004-05 were educated to NVQ Level 4 and above, with the corresponding figure
for Manufacturing at 29%. In contrast, the corresponding figure in Banking, Finance
and Insurance, Public Admin, Education and Health, and Distribution, Hotels and
Restaurants was 11%. At the lower end of educational qualifications 74% of
employees in Agriculture and Fishing were educated only to NVQ 2 or below,
compared to 30% in Energy and Water etc.
Employment by Occupation
The quarterly Labour Force Survey showed that professional occupations employed
more individuals with high qualifications. Though, overall, there was a wide spread of
qualifications in each occupation. (Table 3.9)
Thus, Wales has in Winter 2003/4 (UK figures in parentheses)
11.8% of employment as Managers and Senior Official (14.6)
10.8% of employment in Professional Occupations (12.5)
12.7% of employment in Associate Professional and
Technical Occupations (13.7)
11.7% of employment in Administrative and Secretarial
Occupations (12.8)
12.8% of employment in Skilled Trades Occupations (11.5)
8.0% of employment in Personal Service Occupations (7.6)
9.1% of employment in Sales and Customer Service
Occupations (8.1)
9.7% of employment as Process, Plant and Machine
Operatives (7.5)
12.4% of employment in Elementary Occupations (11.6)
In part this reflects the higher incidence of manufacturing employment in Wales. The
growth of employment is, however, concentrated in the higher level occupations,
whilst employment in less skilled occupations is in decline. While there is an
association between occupational level and education, there is a wide spread of
95
Learning and Labour Market Intelligence for Wales: National Report 2006
educational qualifications in each occupational group. Thus 7% of managers and
senior officials have no qualifications and 1% of those in elementary occupations
have a degree or equivalent. There may, however, be jobs of different levels in each
occupational group. Thus a manager in a very small establishment may require
fewer qualifications than a Manager in a very large one.
These broad trends are confirmed by changes in occupational employment 2004-5
(Table 3.10) which show a rapid increase in employment for Managers and Senior
Officials, and Elementary Occupations. Employment in Administrative and
Secretarial occupations approximately remained the same. Employment in all other
occupations declined.
A recent study for the SSDA (Green, Homenidou and Wilson, 2004)37 has projected
changes in SOC occupational groups up to 2012. The largest growth will occur in
personal service occupations, followed by professional occupations, associated
professional and technical occupations, sales and customer services occupations
and managers and senior officials in that order. The greatest decline will be in
elementary occupations, followed by skilled trades, machine and transport operatives
and administration, and clerical services. Thus, growth is largely in non-manual
occupations and decline in manual occupations. Skill and educational requirements
are likely to increase.
Self Employment
There were 149,600 self employed people in Wales in 2004 representing 12% of the
total in employment. (Table 3.11). Self employment is, however, much higher in Mid
Wales where over one quarter of those in employment are self employed, indicating
that self employment is more common in rural areas.
Lindsay and Macauley (2004)38 report that there has been a gradual increase in self
employment since 2001. This increase was general, affecting men and women, full-
time and part-time workers; it was also spread across all regions. Its growth has
been concentrated in two sectors – Banking, Finance and Insurance, reflecting
37 A. Green, K. Homenidou and R. Wilson, Working Futures: Regional Report 2003-04, Institute for Employment Research, University of Warwick, January, 2004.38 C. Lindsay and C. Macaulay, Growth in Self Employment in the UK, Labour Market Trends, October, 2004, pp 399-404.
96

Learning and Labour Market Intelligence for Wales: National Report 2006
redundancies and a consequent move from employment into self employment and in
Construction, reflecting a longer term trend. The rise seems to reflect economic
factors rather than taxation influences or survey effects.
Levels of Earnings
The New Earnings Survey (NES) was published for the last time in 2003 and has
been replaced by the Annual Survey of Hours and Earnings (ASHE), the results of
which have just become available. This gives rise to a discontinuity in earnings data
as estimates of average weekly pay are higher in ASHE than in the NES. Further,
the increase is higher for men than for women, thereby widening the estimated
gender earnings differential. There are also regional effects with the level of earnings
for people working in London rising more than in other regions. This in part is a
consequence of the wider coverage of ASHE.39
Between 2004 and 2005, earnings in Wales rose by 2.2% compared to a 2% rise for
the UK as a whole, so that average earnings in Wales in April 2005 were £454.4, a
figure 12.1% below the UK average (Table 3.12). Within Wales there are substantial
differences in earnings between the Objective One area and the rest of Wales
(Objective Three). In 2005 the gross weekly wage was £464.9 in the Objective Three
area and £446.2 in the Objective One area.
It should, however, be noted that these figures take no account of different price
levels between and within regions and, therefore, do not necessarily point to
differences in the standard of living. Nor do they take into account differences in the
occupation mix, so that they do not necessarily point to differences in pay for like
work. Earnings are lower in Wales partly because it possesses a lower proportion of
high paid jobs and a higher proportion of low paid jobs. It should also be noted that
Wales has one of the smaller gender pay gaps in Britain. In April 2004 Wales had
the third lowest gender pay gap in the UK (85.9%), after the North East (87.8%) and
Northern Ireland (90.6%).40
39 See C. Daffin, An Analysis of Historical ASHE Data 1998 to 2003, Labour Market Trends, December, 2004, pp 493-40 For a fuller discussion of some of these issues see Joanna Bulman, Patterns of Pay: Results of the 2003 New Earnings Survey, Labour Market Trends, December 2003, pp 601-612.
97
Learning and Labour Market Intelligence for Wales: National Report 2006
Of considerable concern is the economic rate of return to education and particularly
to graduates in light of proposals to change funding arrangements for students,
though the Welsh Assembly Government has yet to determine the precise
arrangements for Wales. Returns to graduates continue to be relatively high in the
UK and in Wales and there is no evidence so far that the large expansion in student
numbers has resulted in a large drop in returns, though there is some sign of a
modest downturn for the most recent graduates. A recent WELMERC report41 finds
that while there are some differences in the graduate wage premium, in broad terms
the premia to degrees for those working in Wales are similar to those for the UK as a
whole. Levels of earnings are, however, lower in Wales, reflecting the lower level of
earnings in Wales and an adverse occupational mix in terms of graduate jobs42. It
should also be born in mind that there are substantial differences in the returns to
particular types of degree with business related degrees having much higher rates of
return than other degrees, such as some of the humanities. Rates of return to
‘academic’ qualifications are higher than those to vocational qualifications, even
where they are rated as equivalent under the NVQ framework. Rates of return are
also higher for women than for men, given the type of degree, and whereas men in
Wales fare somewhat worse than their equivalents elsewhere in Britain, women in
Wales fare rather better.
Unemployment and Inactivity
Non-employment has already been discussed in section 2 on Patterns of
Employment. Here the analysis is extended by considering particular examples such
as individuals with low qualifications or disabilities, lone parents, older workers and
members of ethnic minorities. This is then followed by consideration of local and
regional patterns of non-employment, and the performance of Job Centre Plus.
The main distinguishing feature between the Welsh Labour market and that of the UK
as a whole is that unemployment is lower in Wales but economic inactivity higher
(Table 3.13). Between March-May 1999 and March-May 2005 Wales improved its
41 Sloane P., O’Leary N., Murphy P and Blackaby D., Returns to Education: A Survey of Findings, A Report for the Economic Research Unit, Welsh Assembly Government, University of Wales Swansea, Department of Economics and WELMERC, May, 2003.42 O’Leary N.C and Sloane P.J, Rates of Return to Degrees Across British Regions, WELMERC Discussion Paper No 2006-01, University of Wales, Swansea 2006, show that when one adjusts for differences in the cost of living and house prices, returns in Wales do not look out of line with those obtained in other regions
98

Learning and Labour Market Intelligence for Wales: National Report 2006
relative position with regard to both cases of non-employment, but especially so in
the case of unemployment.
(a) Qualifications and Non-Employment
Lack of qualifications is a barrier to employment. Thus if the qualifications of the non-
employed in the Winter of 2004/5 (Table 3.14) are considered it is possible to
observe that those with higher qualifications are under-represented and those with
lower qualifications are over-represented among both the ILO unemployed and the
inactive. Thus, those at NVQ level 4 and above who constitute 23% of all working
age people make up only 13% of the non-employed. However, a higher proportion of
this group retire early, so these figures over-estimate the propensity of this group to
be involuntarily non-employed. Conversely those without any qualifications make up
17% of all working age people, but 32% of the non-employed. Grouping together
those with qualifications below NVQ Level 2, who comprise 39% of all working age
people, it can be observed that 54% are non-employed. It should also be noted that
these figures relate to a period when the demand for labour was relatively high. As
the labour market tightens employers become more prepared to hire labour lacking in
employment skills, so that these figures may present a more favourable picture than
would be the case in the long run.
(b) Disability and Non-employment
Wales has a higher proportion of its population suffering from disability than any
other region in Britain apart from the North and disability has a larger impact on
labour market inactivity in Wales than in any other region. Under the 1995 Disability
Discrimination (DDA) Act people are defined as disabled if they have or have had a
disability which makes it difficult for them to carry out normal day-to-day activities
whether for physical, sensory or mental reasons. It must also be substantial and
have a long-term effect (i.e. 12 months or more). People who meet these
requirements are referred to as DDA disabled. The Labour Force Survey also
distinguishes those disabled who are work-limited in the sense that their disability
affects the type and/or the amount of work that they can do. This group is referred to
as the work-limiting disabled. As shown in Table 3.15 the disabled of any type made
up 22.8% of the working age population of Wales in 2004, and the percentage work-
limited was 18.5%. There is some regional variation in the incidence of work-limiting
disability which ranges from 14% in Mid Wales to 19.8% in South-East Wales.
99
Learning and Labour Market Intelligence for Wales: National Report 2006
The disabled are much less likely to participate in the labour market than the non-
disabled and once there, they may earn less than the non-disabled. Thus while 80%
of the non-disabled were in employment in Wales in 2004, only 25.5% of the disabled
were so, with the disabled employment rate ranging from 21.8% in South-West
Wales to 31% in Mid Wales (Table 3.16). As a consequence no less than 50% of the
economically inactive in Wales and 27% of the unemployed have a disability (Table
3.17).
A recent WELMERC study of the disabled43 found that the most striking difference in
labour market outcomes between the disabled and non-disabled was in labour force
participation rather than earnings. Wales suffers relatively to the rest of Britain in
having the highest proportion of the disabled with mental health and multiple health
problems, both of which have the greatest impact on the probability of being non-
employed. There are striking differences in the participation rates of disabled women
across unitary authorities (rates being significantly lower, for example, in the Valleys),
which if they could be eliminated would substantially improve the relative position of
disabled women. The disabled are more likely to be employed part-time or self
employed than the non-disabled. In general, the labour market disadvantage of
disabled women is greater than that of disabled men in Wales. Both disabled men
and disabled women have on average fewer qualifications than the non-disabled and
the impact of qualifications on employment is higher for the disabled. Accordingly
raising the qualifications of this group could substantially improve their employability.
(c) Older Workers
In 2003 over 60% of those between 50 and retirement age were working in Wales,
nearly 8% less than the UK rate. The lower employment rate of the over 50s reflects
a low level of qualifications, a propensity to acquire health problems as a part of the
ageing process and possibly age discrimination, declining productivity, or
obsolescence of human capital. As shown in Table 3.18 in 2003 a higher proportion
of the over 50s have no qualifications than is the case for Britain as a whole and this 43 See Jones M.K., Latreille P.L. and Sloane P.J., The Role of Disability in Labour Market Outcomes in Wales, Welsh Economic Review, Vol. 16.2, Winter 2004, pp 39-45 and the same authors, Disability, Gender and the Labour Market in Wales, WELMERC Discussion Paper No. 2004-04, University of Wales Swansea, 2004.
100
Learning and Labour Market Intelligence for Wales: National Report 2006
group contains 40% of the total without qualifications. For Wales as a whole this
figure ranges from 38% in South-East Wales to 45% in Mid Wales. This group is
more likely to remain in employment in industries where employment is declining and
less likely to relocate to growth sectors, though it has been argued that structural
change away from manufacturing and towards services may have contributed to an
increase in the employment of older workers, since many service sector jobs are less
demanding in physical terms, offer more flexible hours and have more contact with
customers, where older workers may have a comparative advantage.44
(d) Ethnic MinoritiesAccording to the Labour Force Survey there were 42,700 members of black and
ethnic minority groups of working age in Wales in 2004 (down from 44,000 in 2003).
Of these 24,700 were in employment. The employment for black and ethnic minority
groups was lower than for whites (57.7% compared to 71.6%) which had decreased
from 58.8% a year earlier. The employment gap in Wales is narrower than in Britain
as a whole (Table 3.19).
The non-white population is much smaller in Wales than in the UK as a whole.
According to the 2001 Census 2.1% of the population was non-white compared to
7.9% in the UK as a whole and according to the 2002/03 Annual LFS these figures
had risen to 2.4% and 8.0% respectively. Further, whilst in Wales only 18% of the 22
Unitary Authorities had non-white populations of 2% or greater, in Britain as a whole
the equivalent figure for the 407 local authorities was 48%. Thus not only are there
proportionately fewer non-whites in Wales but they are more highly concentrated
geographically (notably in Cardiff).
(e) The Geographical Distribution of Non-EmploymentPatterns of non-employment varied markedly across the Welsh Unitary Authorities in
2005 with the economic inactivity rate being highest in the Welsh Valleys (Merthyr
Tydfil (32.4%), Neath Port Talbot (32.3%), Blaenau Gwent (31.7%), and Rhondda,
Cynon, Taff (26.8% and) lowest in East Wales with Flintshire (20.3%) lowest of all.
The inclusion of the unemployed only serves to widen these differences (Table 3.20)
However, since 2001 there has been some improvement in these figures, both in
44 See Disney R. and Hawkes D., Why Has Employment Risen Among Older Workers in Britain, in Dickens R., Gregg P. and Wadsworth J., editors, The Labour Market Under New Labour, Palgrave MacMillan, 2003, pp 53-69.
101
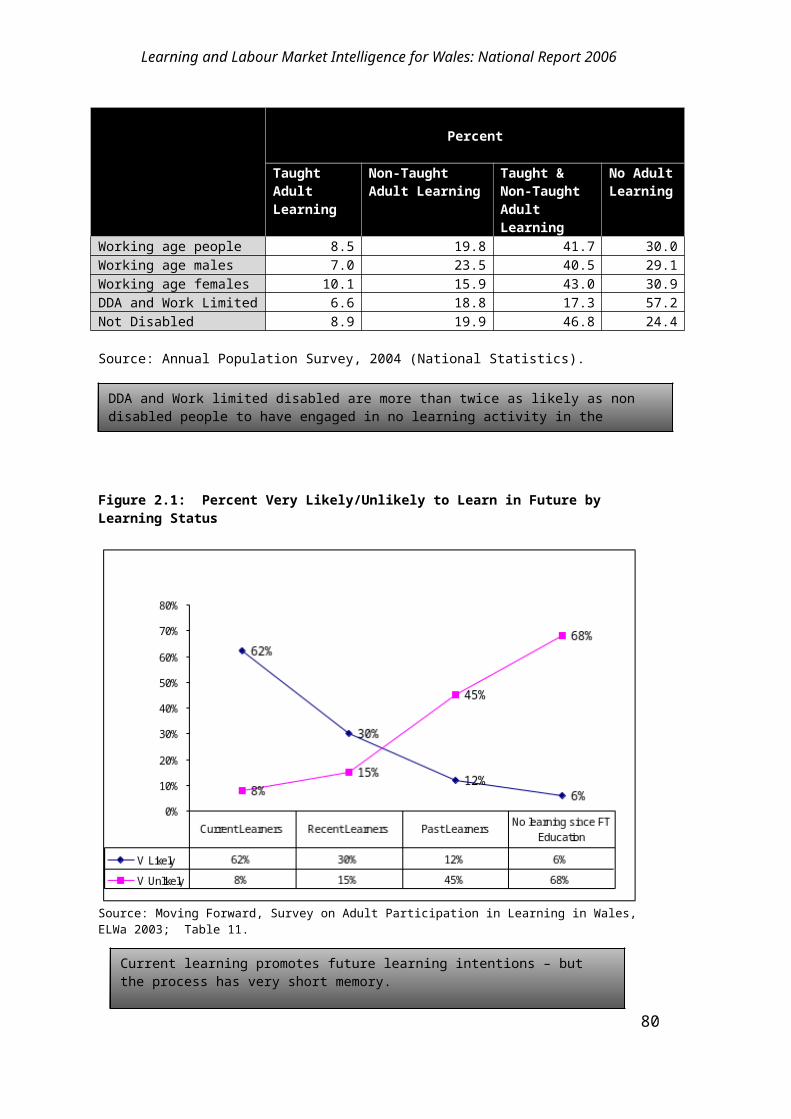
Learning and Labour Market Intelligence for Wales: National Report 2006
inactivity and unemployment rates, which has been shared across the whole of
Wales.
Corresponding to these figures are those for benefit claims – including JSA,
Incapacity Benefit, Disability Allowances and Income Support. Total benefits claims
in August 2005 as a percentage of the population of working age varied from 29% in
Blaenau Gwent to only 10% in Monmouthshire and Powys (Table 3.21). For
sickness and disability benefits alone the range was 22% in Merthyr Tydfil down to
8% in Monmouthshire. It is noticeable that the percentage of lone parent claimants in
several cases exceeds the percentage claiming unemployment benefits (e.g. in
Cardiff, Rhondda Cynon Taff and Torfaen the former is 3% and the latter 2% of the
relevant population), and the total number of lone parent claimants in Wales as a
whole (40,000 now exceeds the number of unemployed claimants – 39,200).45
An important phenomenon is workless households. In Spring 2004 an estimated 3
million working age households had no members in work in the UK, representing
16% of all working age households. The highest rate of worklessness occurred
among lone parent households with children aged under five years old (64%). In
Wales 19% of all household types were workless and the incidence of worklessness
in households with dependant children was also higher than the UK average.46
In March-May 2005 ILO unemployment (the preferred measure of unemployment) in
Wales was 60,000 or 4.6% of the economically active population, compared to 4.8%
in the UK as a whole, reversing the position in 1999 when the rate in Wales was
7.5%, compared to 6.3% in the UK as a whole (Table 3.22). There is considerable
variation in the unemployment rate across Wales. In Table 3.23 data are provided
for the claimant count of Job Seekers’ Allowance, June, 2005 in the 22 Unitary
Authorities. The rate varies between 1.1% in Ceredigion to 4% in Blaenau Gwent. It
should, however, be pointed out that some of these absolute, figures are below the
minimum publishable due to small sample size (1,000 or 2,000 being the minimum
depending on area). The claimant count rate for the whole of Wales has remained
the same since June 2005 (at 2.2%).
45 It should be noted that benefit claims figures exclude partners claimed for – who are benefit recipients rather than claimants. In 2003 the number of partners claimed for in GB was 13% of the number of claimants or 2% of the working age population.46 See A. Walling, Workless Households: Results from the Spring 2004 LFS, Labour Market Trends, November, 2004, pp 435-445.
102
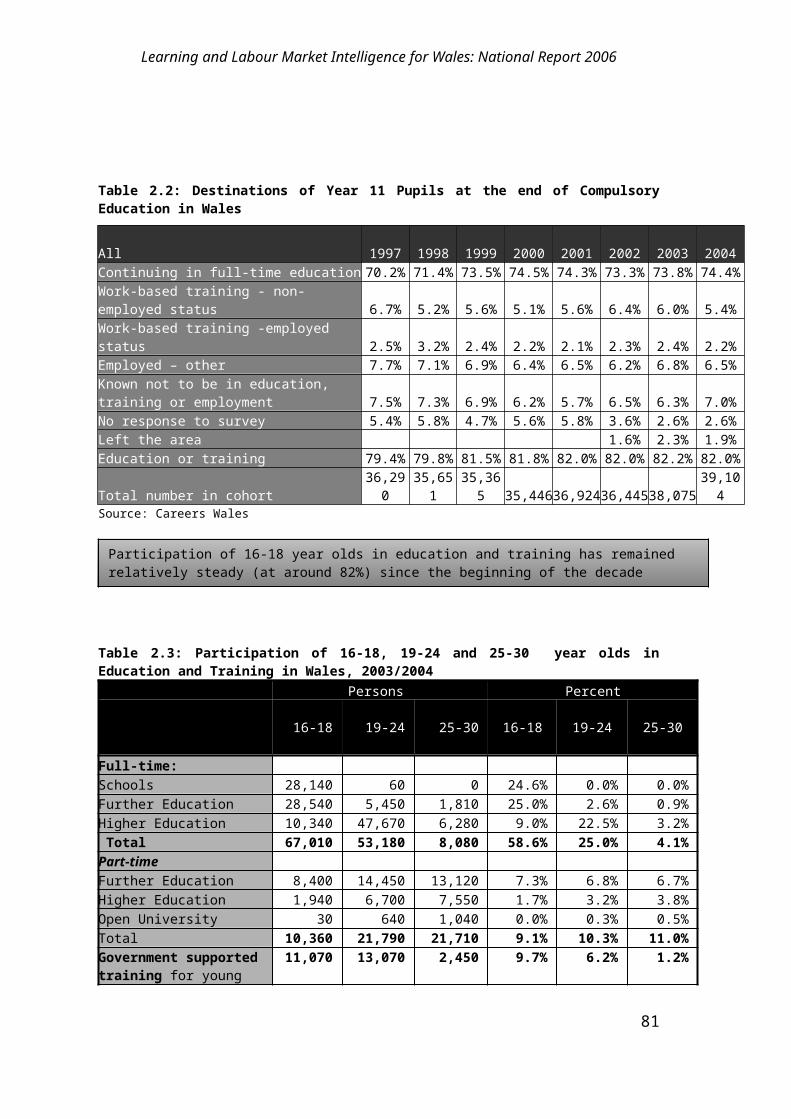
Learning and Labour Market Intelligence for Wales: National Report 2006
New Deal statistics for March 2003 show that Wales was the second most successful
region in securing sustained jobs for both 18-24 year olds unemployed for six months
or more and for longer term unemployed adults. For the younger group 39.6% had
left for a job that lasted for more than three months, compared to 35.2% for Britain as
a whole. For the older age group the figures were 26.6% and 22.6% respectively.
There have been recent improvements to the methods for compiling New Deal
statistics and a summary of people obtaining jobs through the New Deal in the Wales
Job Centre Plus region is contained in Table 3.24. As of May 2005 85.6% of those
entering the New Deal for Young People obtained sustained employment, while the
corresponding figure for New Deal 25 plus was 83.69%.
A new data source that became available in 2003 is Job Centre Plus’s district level
statistics of performance relative to the Performance and Resources agreement.
Whereas in 2003-4 the target overall was missed by 2.9%, in 2004-5 the target was
exceeded by 3.9%, though with considerable variance across districts (Table 3.25).
For lone parents job entries as a proportion of the client base in Wales exceeded that
in Great Britain as a whole (4.8% compared to 3.4%). However Wales’s average has
fallen since 2004 (from 13.9% to 4.8%), similarly, the GB average fell from 10.1% to
3.4%. But this drop is mostly due to a large increase in the customer base (from
55,779 to 179,857 customers in Wales) (Table 3.26). In the case of people with
disabilities, job centres as a proportion of the client base in Wales were only 0.8%,
but this was more than the GB average of 0.5% (Table 3.27). Wales’ performance
comfortably exceeds that of GB in relation to job entries for customers unemployed
for six months or more and for other disadvantaged clients – 25.8% as opposed to
17.7% (Table 3.28). For customers unemployed for less than six months the
difference is more marginal – 7% as opposed to 5% (Table 3.29).
This chapter has already referred to the WELMERC study of inactivity in Wales
already. This research not only points out that economic inactivity is very substantial
in Wales relative to other regions in Britain, but also that it varies significantly across
Wales and so has a geographical dimension. In particular some of the key findings
of the general report were
there are substantial economic differences within Wales between the
Objective One area and the rest of Wales that are reflected in substantial
differences in economic inactivity rates.
103

Learning and Labour Market Intelligence for Wales: National Report 2006
the economically inactive consist of a diverse group – early retired,
students and sick or disabled – that vary in their closeness to the labour
market.
there have been important changes in the composition of inactivity
with a decline in male activity and an increase in female activity, which
has resulted in increasing similarity of participation over the life cycle for
men and women. The growth in inactivity has increasingly been
concentrated on the low skilled and those classified as long-term sick or
disabled.
once economic factors that are likely to influence the incidence of
long-term sickness are accounted for, the incidence of sickness claimants
in Wales remains significantly high, suggesting cultural factors or easy
access to benefits may be operating.
differences in economic inactivity rates between Wales and other
regions are due in part to differences in the composition of populations (a
characteristics effect) and in part due to differences in propensities
towards economic inactivity for individuals with similar characteristics(a
coefficient effect). In most of the regional comparisons made around half
of the observed difference in regional economic inactivity rates cannot be
accounted for by characteristics effects. Different propensities towards
economic inactivity are, therefore, important in Wales and such
differences may be attributed to several causes including cultural
differences, tastes and local demand conditions.
if the incidence of self-reported health problems for men in Wales
were the same as in Great Britain as a whole the percentage point
difference in male economic inactivity rates between the two regions
would fall from 6% to 4% and in the case of women from 5% to 3%.
LFS data suggest that roughly three-quarters of the inactive are
neither seeking work nor want it, which is higher than the comparable
figure for Great Britain as a whole.
(f) Qualifications of the non-employedLow qualifications are a significant indicator in determining the likelihood of an
individual being unemployed or economically inactive. Table 3.30 shows that the
greater proportion of the non-employed have qualifications at NVQ level 2 or below
and just under one-third have no qualifications in the Winter of 2004/05.
Nevertheless, the proportion of the ILO unemployed and the inactive for those with
104

Learning and Labour Market Intelligence for Wales: National Report 2006
no qualifications has fallen since 2004. The proportion of those with NVQ level 4 and
above has remained the same since 2004, however there has been an increase in
the ILO unemployment rate, the inactive and the non-employed. Within the non-
employed the ILO unemployed are more highly qualified than the inactive population.
Correspondingly the employment rates are higher, the higher the qualification (Table
3.31).
The Demand for Skills
Most of what has been discussed above focuses on the supply of labour. But it is
also necessary to consider the employers’ demand for labour as expressed in the
current number employed, hours of work, vacancies and labour cost. Labour
demand is closely linked to the business cycle. Thus during periods of growth firms
may initially respond by increasing the input of labour from their existing workforce,
by increasing paid and unpaid overtime, and only when the additional demand seems
longer term recruit extra workers to produce the higher output required. In the
recession the initial response may be to cut hours and then lay-off workers. Some
workers, who have particular skills which are in short supply may, however, be
hoarded, so that they are readily available when product demand recovers. For
these reasons it may be expected that hours of work fluctuate much more than
numbers employed over the cycle and for employment only to react after a time lag.
Williams (2004)47 suggests that labour demand is likely to become even more
important over the coming years as the UK population ages. As the population of
working age shrinks this is likely to lead to shortages of labour and influence the
location decisions of firms.
Unmet labour demand can be measured in a number of ways.48 The ONS vacancy
surveys ask employers how many vacancies they have for which they are actively
seeking recruitments from outside their organisation. The current series, available
monthly beginning in April 2001 shows clear evidence of seasonality in the number of
vacancies.49 As currently designed it cannot provide estimates below national level,
which limits its usefulness in assessing what is happening in Wales. Job Centre 47 R.D.Williams, The Demand for Labour in the UK, Labour Market Trends, Vol. 112, No. 8, August, 2004, pp 321-380.48 See R.D. Williams, Sources of Data for Measuring Labour Demand, Labour Market Trends, Vol. 112, No. 9, September, 2004, pp 375-383.49 See Helen Treasure Seasonal Adjustment of the Vacancy Survey Data, Labour Market Trends, December 2004, pp 505-508.
105

Learning and Labour Market Intelligence for Wales: National Report 2006
(Plus) vacancy statistics are also available, which record the stock of vacancies
notified to Job Centres by Employers seeking recruits. They account for
approximately 40% of all vacancies. As a measure of unmet demand a series of
unfilled vacancies at Job Centres are available in Labour Market Trends seasonally
adjusted. Thus in Wales these increased from 16,200 in April 1999 to 20,600 in April
2001, suggesting that the labour market was tightening. A second measure of
demand for labour is job density.50 This is defined as the number of filled jobs in an
area (including self employed, government supported trainees and HM forces)
divided by the number of working-age residents in that area. An estimate greater
than one indicates the presence of inward commuting (ignoring multiple-job holding)
and an estimate less than one outward commuting. A third measure is job
separation statistics, which can be divided into voluntary and involuntary separations.
Twice as many people leave a job voluntarily than do so involuntarily (through
redundancy or dismissal). Women are more likely than men to leave a job voluntarily
and less likely to leave one involuntarily. The highest job separation rates are found
in Hotels and Restaurants and the lowest in Education.
In the absence of National Statistics vacancy data for Wales it is necessary to rely on
Job Centre vacancies. These tend to be biased to the less skilled end of the labour
market and so should be interpreted cautiously in relation to occupations and
industries. Therefore, job starts in Wales are examined using data from the Labour
Force Survey 2004-05 Examining first employment starts by occupation (Table 3.32)
it appears that the greatest demand for labour in Wales is at the lower end of the
occupational distribution, but this may reflect greater job turnover here. The largest
number of starts occurred in Elementary Occupations (19.5% of the total). If an
adjustment is made for the size of the stock in these occupational groups then it is
possible to see whether employment is expanding or contracting relative to other
occupational groups. This is, indeed, the case with Elementary Occupations (with a
figure of +5.6 percentage points), but is also true for Sales and Customer Service
Occupations (+4.3 percentage points) and Process, Plant and Machine Operatives
(+0.6 percentage points). This picture is generally supported by the data for starts by
qualification (Table 3.33) Over half the starts are by individuals with qualifications at
NVQ Level 2 or below. There is a lower than expected number of starts at NVQ
Level 4 and above and an above expected number of starts at NVQ Level 2 in terms
of replacement demand, but this may reflect again differences in turnover rates.50 See D. Hastings, Job Densities for Local Areas: A New Indicator, Labour Market Trends, August, 2003, pp 407-413 and the same author, Local Area Jobs Densities; 2002, Labour Market Trends, August, 2004, pp 331-338
106

Learning and Labour Market Intelligence for Wales: National Report 2006
Finally, there are data for employment starts by industry (Table 3.34). Over a quarter
of new starts occurred in Distribution, Hotels and Restaurants and in Public
Administration, Education and Health. But, whereas in the former there was a
positive difference between actual and expected starts (of 6.3 percentage points) in
the latter case the corresponding figure was negative (-7.8 percentage points).
There were also gains in Banking, Finance and Insurance and in Construction, but a
decline in Manufacturing.
Job Density figures are available for 2001, 2002 and 2003 and show little change for
the constituent countries of the UK. Wales has the lowest density of any region 0.74,
compared to 0.84 in England and 0.82 in Scotland. This means that Wales has
fewer conurbations which draw in commuters, than other regions. Within Wales
Cardiff has the highest job density (0.97) and Caerphilly the lowest 0.49 (Table 3.35).
Within Wales job density is much higher in the Objective Three area than in the
Objective One area.
Total workforce hours worked per week, for employees and self employed, not
seasonally adjusted, are reported by region and industry group in Labour Market
Trends. Changes in these will reflect both changes in the number of workers and the
hours worked as an indicator of pressure of demand. Thus in Wales these were 39.1
million in September 2003, 40.1 million in December 2003, 37.1 million in March
2004 and 39.1 million in June 2004. Thus, there is considerable seasonal volatility.51
Another means of meeting greater product demand is increasing labour
productivity.52 This may be measured in a number of ways including productivity per
worker and productivity per hour. Long-term UK productivity growth is around 2%
per annum. In comparison of productivity across counties allowance should be made
for differences in the vintage of the capital stock, in the capital/labour ratio and in the
skill distribution of the workforce.
In Table 3.36 productivity is measured in terms of gross value added per person
employed and in 2003 was only 85% of the UK average. However, within Wales
51 See R.D. Williams, Recent Changes in Hours Worked, Summer, 2003, Labour Market Trends, January 2004, pp 19-24 and Vivienne Avery, Measuring Working Time Arrangements, Labour Market Trends, January 2004, pp 15-17.52 A useful discussion is contained in C. Lindsay, Labour Productivity, Labour Market Trends, November 2004, pp 447-454.
107

Learning and Labour Market Intelligence for Wales: National Report 2006
there are substantial differences in productivity across the NUTS areas with
productivity being much lower in the Objective One area (e.g. Isle of Anglesey – 60%
of the UK average) than in the rest of Wales (e.g. Cardiff and the Vale of Glamorgan
- 122% of the UK average). A study undertaken for the Welsh Assembly
Government on productivity in Wales, using plant level data obtained from the ONS,
concluded that there was no specific ‘Welsh effect’ on manufacturing productivity and
the positive and negative effects of other more general factors (such as plant size
and location) broadly cancelled each other out, so that overall productivity
performance was in fact close to the UK average. However, a related study limited to
services found a less favourable position in Wales, particularly in Construction,
Wholesale, Retail and Other Business Services where there was a preponderance of
smaller plants. It was not possible to determine the extent to which measured
productivity differences were a consequence of regional price effects.
Another mechanism for meeting increasing demands, for quality in particular, is to
offer more training and upgrade skills. A WDA/CBI Regional Economic Trends
Survey for Wales found that marketing, management and customer care were the
key skills in meeting business needs in Wales. Surprisingly numeracy and literacy
were ranked lowest of all (Table 3.37). A smaller proportion of Welsh firms had
offered training over the previous 12 months than was the case in England (60% as
opposed to 64%). Over half of the companies not providing training said there was
no need for it. (Table 3.38).
The Future Skills Wales 2005 Survey53 provides much information on employers’
requirements for generic skills. Eighteen percent of the employers in Wales reported
skills gaps within their workforce (the difference between the skills currently
possessed by employers and what employers require them to have to perform their
jobs satisfactorily). The Wales figure was slightly lower than the most recent figures
recorded in England and Scotland (20% and 21% respectively in 2004 for both
countries), but higher than that most recently recorded for Northern Ireland (13% in
2002). The skills lacking amongst employees with skills gaps were most commonly
thought to be Problem Solving Skills, Customer Handling Skills, and Other Technical
and Practical Skills, as were Team Working Skills and Communication Skills. While
Literacy and Numeracy were not ranked so highly, they were regarded as important
53 Future Skills Wales 2005, Generic Skills Survey Summary Report. The full survey report and other reports, tables and briefings are available from the Future Skills website www.Futureskillswales.com.
108
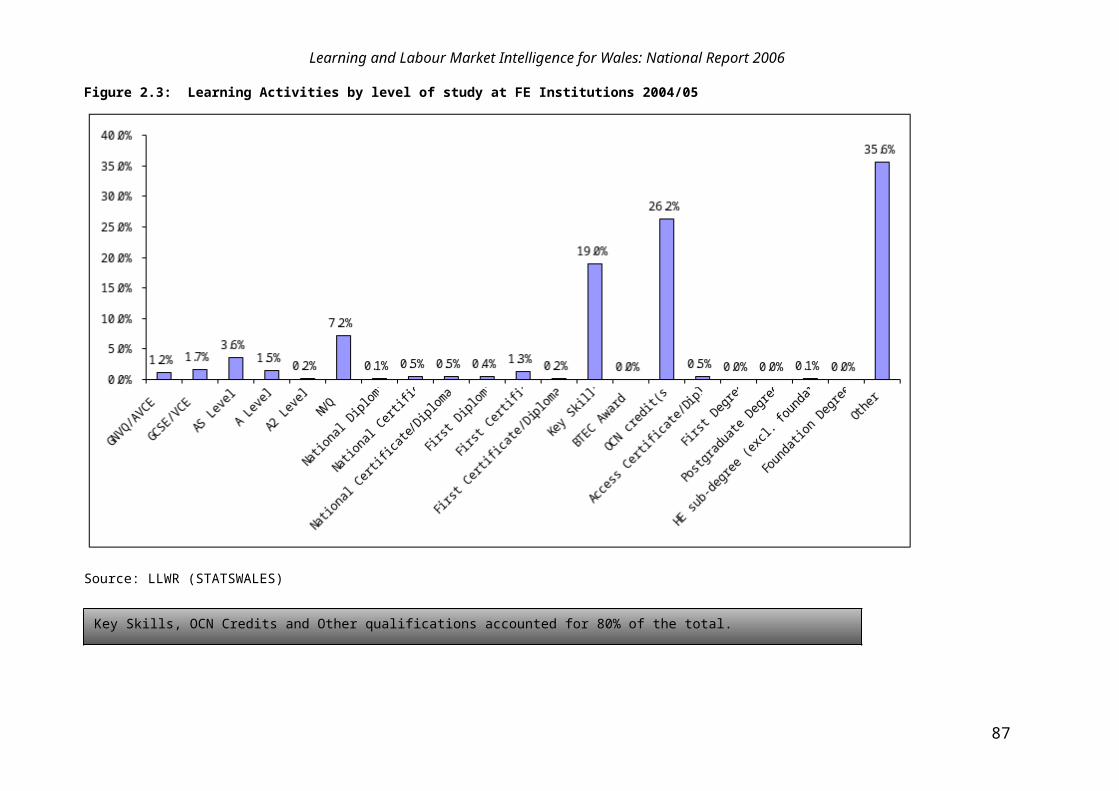
Learning and Labour Market Intelligence for Wales: National Report 2006
by a large majority of employers. Only 10% of employers reported experiencing
hard-to-fill vacancies, (compared to 14% in 2003), and only 4% of employers
reported skill shortage vacancies (compared to 7% in 2003). The picture was similar
to that in England, where skill shortage vacancies were reported at 4% in 2004.
According to the 2005 ELWa Employers Panel Survey, 67% of establishments had
provided on-the-job training in the last year. The most common category of on-the-
job and off-the-job training was ‘other technical/practical skills’. This type of training
was the most prevalent for those classified as associate professional occupations,
skilled trade occupations, and process/plant/machine operatives. When asked what
types of training had been planned for employees ‘other technical/practical skills’
were the most frequently mentioned. However, more than a third mentioned Team
Working (43%), Customer Handling Skills (41%), Communication skills (39%),
Management Skills (37%), Problem Solving Skills (36%) and General IT User Skills
(36%)
ConclusionsAccording to the three main indicators the employment rate, ILO unemployment and
inactivity the Welsh labour market has shown signs of improvement, and this
improvement was shared by both the Objective One area and the rest of Wales, with
the most recent improvement being more marked in the former. While Wales
performance in each of these three rates is inferior to that in Britain as a whole there
has been a relative improvement in Wales. ILO unemployment is now lower in
Wales than in Britain as a whole, but inactivity rates are substantially higher.
The service sector continues to expand in Wales, while manufacturing continues to
decline in terms of employment. As elsewhere in Britain self employment continues
its gradual increase. Earnings levels remain substantially lower than in the rest of
Britain, though recently they have had a faster rate of increase.
Areas of particular concern in Wales are the relative lack of qualifications, the high
rates of disability, the lower employment rate of the over 50s and differential patterns
of non-employment across Unitary Authorities (notably between the Valleys and the
rest of Wales).
109
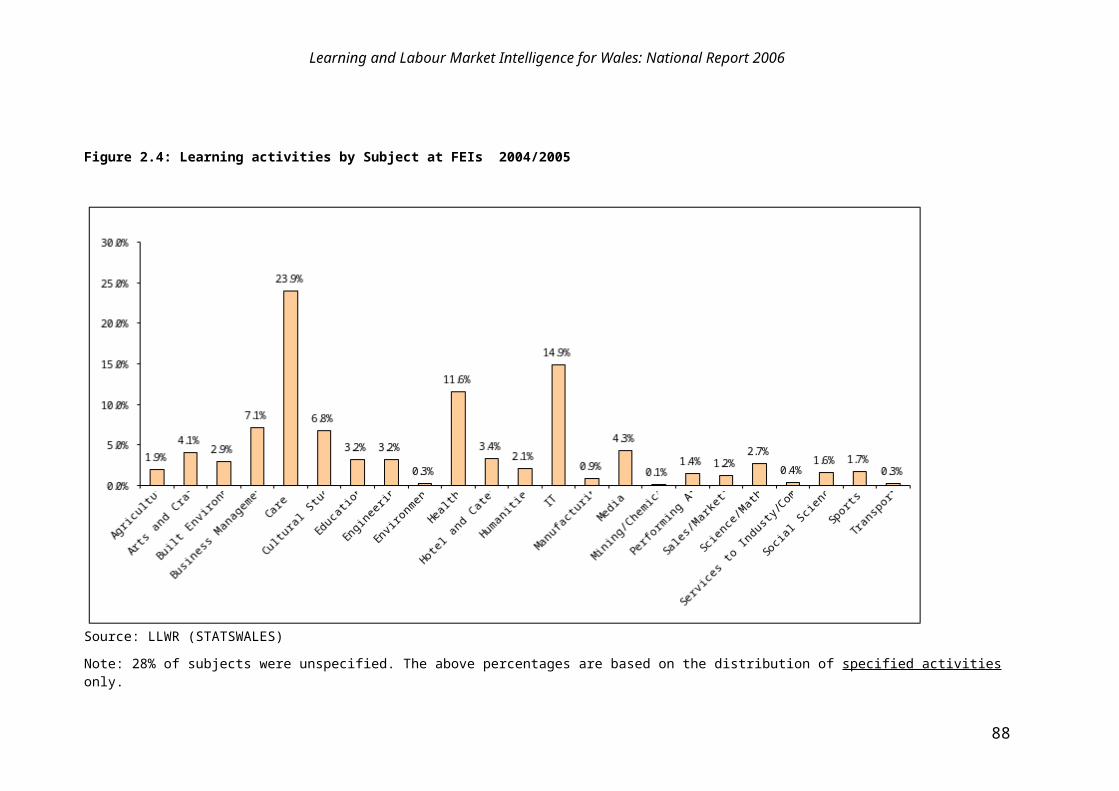
Learning and Labour Market Intelligence for Wales: National Report 2006
110

Learning and Labour Market Intelligence for Wales: National Report 2006
Table 3.1 - Labour Market Statistics, 1999-2005
Labour market statistics
March-May 2005 March-May 1999 Change since 1999
Difference between Wales
and UK
Wales UK Wales UK Wales UK 2005 1999Change in difference
Economically active 1,313,000 27,805,000 1,261,000 27,057,000 52,000 748,000In employment 1,253,000 26,468,000 1,167,000 25,365,000 86,000 1,103,000ILO unemployed 60,000 1,338,000 94,000 1,692,000 -34,000 -354,000Economically inactive 434,000 7,519,000 449,000 7,263,000 -15,000 256,000Economic activity rate 75.2 78.7 73.8 78.8 1.4 -0.1 -3.5 -5 1.5Employment rate 71.7 74.9 68.3 73.9 3.4 1.0 -3.2 -5.6 2.4ILO unemployment rate 4.6 4.8 7.5 6.3 -2.9 -1.5 -0.2 1.2 -1.4Economic inactivity rate 24.8 21.3 26.2 21.2 -1.4 0.1 3.5 5 -1.5These figures are based on the new reweighed Labour Force Survey estimates for 1992-2005All are working ageSource: National Statistics , Labour Force Survey, Spring Quarters. http://www.nomisweb.co.uk
There has been an overall strengthening of the labour market in Wales since 1999. While each of the rates are inferior to that of the UK, there has been a relative closing of the gap over this period.
111

Learning and Labour Market Intelligence for Wales: National Report 2006
Table 3.2: Employment Rate by Age and Gender, Wales, 2005
Employment rate by age and gender, Wales, 2005
Wales UK DifferenceMen16-17 34.1 35.9 -1.818-24 64.8 68.8 -4.025-34 87.6 88.3 -0.735-49 86.9 88.6 -1.750-retirement 63.6 72.3 -8.7 Women16-17 38.6 41.9 -3.318-24 65.3 62.5 2.825-34 75.2 72.6 2.635-49 77.9 76.8 1.150-retirement 63.0 67.9 -4.9
For both men and women the employment rate in Wales disaggregated by age group is generally lower than in the UK. However employment rates for 18 to 49 year old women is slightly higher than in the UK.
Source: National Statistics, Labour market statistics releases Jun-Aug 2005, UK and Wales, http://www.nomisweb.co.uk
112

Learning and Labour Market Intelligence for Wales: National Report 2006
Table 3.3: Patterns of Employment and Economic Inactivity by Parliamentary Constituency, 2004
Patterns of employment and economic inactivity by parliamentary constituency
Employed Non-employed InactiveCynon Valley 66.3 33.7 30.2Rhondda 66.4 33.6 29.6Merthyr Tydfil & Rhymney 60.3 39.7 34.9Llanelli 63.9 36.1 32.7Aberavon 61.0 39.0 32.4Cardiff South & Penarth 69.2 30.8 26.0Blaenau Gwent 64.2 35.8 30.7Neath 67.8 32.2 29.4Ceredigion 68.6 31.4 27.7Caerphilly 65.5 34.5 30.6Islwyn 65.7 34.3 28.2Carmarthen East & Dinefwr 67.3 32.7 28.9Swansea East 69.2 30.8 26.9Swansea West 68.9 31.1 22.5Carmarthen West & South Pembrokeshire 70.7 29.3 25.2Cardiff Central 68.3 31.7 27.8Caernarfon 75.7 24.3 21.3Preseli Pembrokeshire 73.1 26.9 23.6Ynys-Mon 71.3 28.7 24.6Pontypridd 74.8 25.2 21.5Ogmore 70.8 29.2 26.0Torfaen 70.9 29.1 25.3Conwy 72.6 27.4 24.6Delyn 77.1 22.9 20.5Cardiff West 75.2 24.8 21.1Bridgend 76.0 24.0 20.5Clwyd West 73.1 26.9 25.2Vale of Clwyd 74.0 26.0 22.6Meirionnydd Nant Conwy 74.4 25.6 22.3Wrexham 75.5 24.5 23.6Clwyd South 73.4 26.6 23.4Newport East 69.2 30.8 27.3Newport West 70.2 29.8 25.9Gower 77.6 22.4 20.5Monmouth 77.0 23.0 21.1Alyn & Deeside 80.8 19.2 17.5Brecon & Radnorshire 73.8 26.2 23.6Vale of Glamorgan 73.8 26.2 21.5Cardiff North 74.9 25.1 20.3Montgomeryshire 79.1 20.9 19.2Wales 71.2 28.8 25.1
Source: National Statistics , Annual Population Survey, Jan 2004-Dec 2004 http://www.nomisweb.co.uk
Patterns of employment and inactivity are linked to Objective One status with the Valleys in particular having lower employment and higher inactivity than elsewhere.
113

Learning and Labour Market Intelligence for Wales: National Report 2006
Table 3.4: Economic Activity by Unitary Authority, Apr 2004-Mar 2005
Economic Activity by Unitary AuthorityEmployment rate ILO unemployment
rate Economic inactivity
rateAnglesey 71.6 5.2 24.5Gwynedd 73.7 3.3 23.8Conwy 75.6 3.3 21.9Denbighshire 75.9 3.2 21.6Flintshire 77.6 2.7 20.3Wrexham 74.4 2.3 23.8Powys 76.0 2.9 21.7Ceredigion 68.7 5.7 27.2Pembrokeshire 69.9 5.4 26.0Carmarthenshire 68.3 4.7 28.4Swansea 72.3 5.9 23.2Neath Port Talbot 63.8 5.8 32.3Bridgend 74.8 3.4 22.6Vale of Glamorgan 73.7 5.0 22.5Rhondda, Cynon, Taff 69.0 5.7 26.8Merthyr Tydfil 63.6 5.9 32.4Caerphilly 65.8 7.3 29.1Blaenau Gwent 63.3 7.3 31.7Torfaen 70.8 5.4 25.1Monmouthshire 76.6 2.9 21.2Newport 68.9 5.7 27.0Cardiff 71.7 5.0 24.5
Wales 71.3 4.7 25.2
Rates calculated as a percentage of people of working age.Source: National Statistics, Annual Population Survey, http://www.nomisweb.co.uk
These figures correspond to those for parliamentary constituencies, with the Valleys standing out as having particularly low employment and high rates of unemployment and economic inactivity compared to East Wales.
114
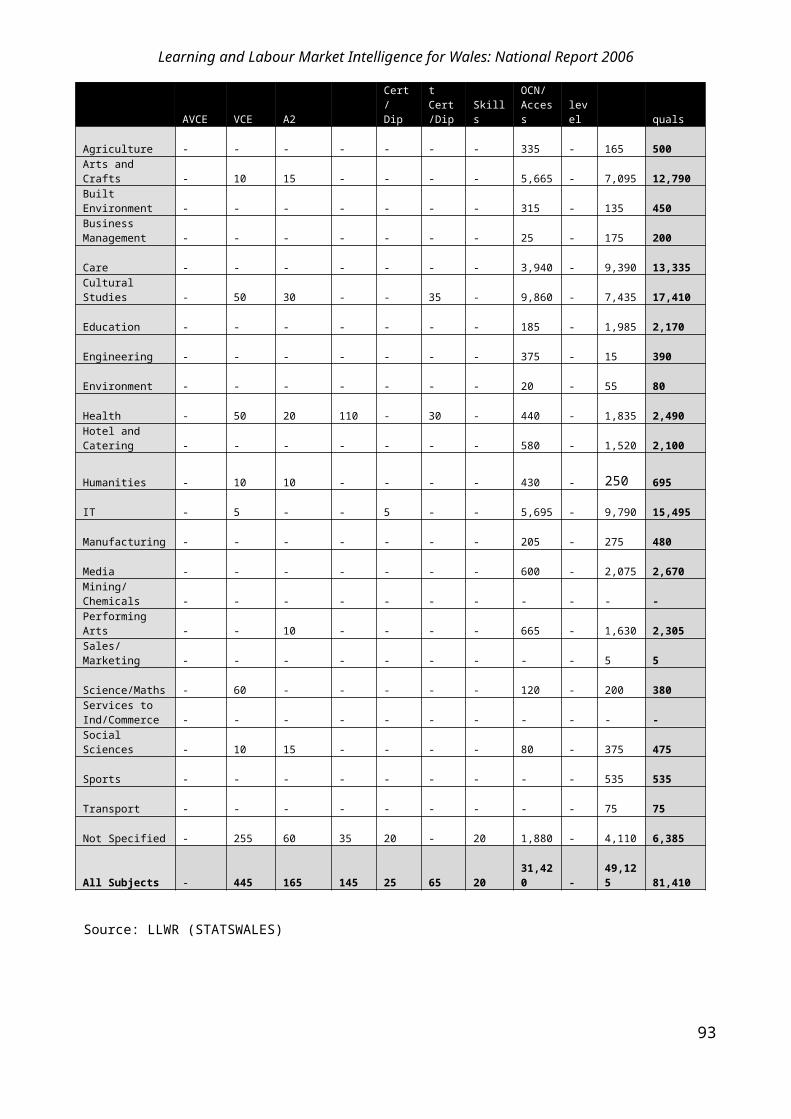
Learning and Labour Market Intelligence for Wales: National Report 2006
Table 3.5: Wales: Employment by Industry 2004
For the whole of Wales, the Public Administration, Education and Health sector is the largest, most significant industry in Wales. Second in Wales is Distribution, Hotels and Restaurants and third Manufacturing.Mid Wales stands out as having a different industrial structure from the rest of Wales, having a much larger Agriculture and Fishing Sector.
Table 3.6: Wales: Employment by Industry – Annual Business Inquiry data, 2004
Wales: employment by industry – Annual Business Inquiry data
South East Wales South West Wales Mid Wales North Wales WalesNo. % No. % No. % No. % No. %
Agriculture & fishing 3,100 0.5 6,000 2.3 9,600 9.3 4,800 1.7 23,500 1.9Energy & water 7,600 1.3 2,100 0.8 1,000 1.0 3,900 1.4 14,500 1.2Manufacturing 100,600 17.0 34,700 13.2 11,500 11.2 47,200 16.6 194,000 15.6Construction 42,000 7.1 21,300 8.1 10,100 9.8 24,600 8.6 98,000 7.9Distribution, hotels & restaurants 116,300 19.6 57,800 22.0 20,800 20.2 58,300 20.4 253,200 20.4Transport & communication 33,100 5.6 15,000 5.7 3,800 3.7 17,200 6.0 69,100 5.6Banking, finance & insurance etc 70,600 11.9 24,100 9.2 8,700 8.5 28,900 10.1 132,300 10.6Public admin, education & health 181,800 30.7 86,100 32.8 30,100 29.3 84,100 29.5 382,100 30.7Other services 35,700 6.0 14,900 5.7 7,200 7.0 15,700 5.5 73,400 5.9Total services 437,600 73.9 197,800 75.4 70,500 68.6 204,200 71.6 910,200 73.2Total in industries 590,800 100 262,000 100 102,800 100 284,700 100 1,240,100 100
These figures relate to percentage of working age in employment Source: National Statistics , Annual Population Survey, Jan 2004-Dec 2004 http://www.nomisweb.co.uk
115

Learning and Labour Market Intelligence for Wales: National Report 2006
South East Wales
South West Wales Mid Wales
North Wales Wales
No. % No. % No. % No. % No. %Agriculture and fishing 540 0 451 0 248 0 352 0 1,591 0Energy and water 3,349 1 938 0 565 1 2,565 1 7,417 1Manufacturing 94,666 16 26,488 11 7,826 11 48,257 19 177,237 15Construction 27,781 5 9,993 4 2,714 4 12,588 5 53,076 5Distribution, hotels and restaurants 133,617 22 58,066 25 17,769 26 67,096 27 276,548 24Transport and communications 29,306 5 12,504 5 2,393 3 9,283 4 53,486 5Banking, finance and insurance, etc 82,605 14 26,846 12 7,678 11 19,102 8 136,231 12Public administration, education & health 192,905 32 85,341 37 25,297 37 77,518 31 381,061 33Other services 31,465 5 11,929 5 4,696 7 14,146 6 62,236 5Total 596,234 100 232,556 100 69,186 100 250,907 100 1,148,883 100Total services 470,655 79 194,686 84 57,833 84 187,145 75 910,319 79
These figures are aggregates from which agriculture class 0100(1992 SIC) have been excluded by the ONS.Source: National Statistics, Annual Business Inquiry Workplace Analysis, Jan 2004-Dec 2004 http://www.nomisweb.co.uk
This survey suggests an even higher concentration of employment in services than the LFS – 79% for Wales as a whole and 84% in Mid Wales.
116

Learning and Labour Market Intelligence for Wales: National Report 2006
Table 3.7: Annual Change in Employment by Industry, Spring 2004-2005
Annual change in employment by industry, Spring 2004-2005
Wales % change GB % change
Manufacturing -6,000 -3% -121,000 -3%
Construction -10,000 -9% 80,000 4%
Services total 10,000 1% 186,000 1%
Distribution etc. 4,000 1% -72,000 -1%
Transport & communications 2,000 3% -2,000 0%
Banking, finance & business services 7,000 5% 34,000 1%
Public administration, education & health 2,000 1% 252,000 3%
Other services -4,000 -5% -27,000 -2%
These figures are based on the new reweighed Labour Force Survey estimates for 1992-2005Source: National Statistics, Labour Force Survey, Spring quarters. http://www.nomisweb.co.uk
Wales diverged in employment trends relative to Great Britain in respect to Construction, Distribution, and Transport and communications.
117

Learning and Labour Market Intelligence for Wales: National Report 2006
Table 3.8: Employment in Industries by Qualification Level 2004-05
Employment in industries by qualification level
NVQ Level 4 and above
%
NVQ Level 3%
Trade Apprentice
ships%
NVQ Level 2%
Below NVQ Level
2%
Other qualificatio
ns%
No qualificatio
ns%
Total below NVQ2
%
Total NVQ2 and
below%
Total NVQ 3
and above
%Agriculture & fishing 12 3 10 16 13 14 31 58 74 16Energy & water 44 23 3 12 7 6 5 18 30 67Manufacturing 29 18 3 13 20 11 6 36 50 47Construction 19 21 7 16 15 8 14 36 52 41Distribution, hotels & restaurants 11 21 7 19 14 8 20 42 62 31Transport & communication 12 17 20 15 14 8 14 36 51 30Banking, finance & insurance etc 11 16 6 25 20 8 14 43 67 27Public admin, education & health 11 15 5 16 14 20 19 53 69 26Other services 38 19 2 19 12 3 6 21 40 58Total services 28 16 5 18 14 7 12 33 51 44Industry classification is Standard Industrial Classification (1992)N.B. All are working age
Source: Data Archive, Quarterly Labour Force Survey Analysis, December 2004 - February 2005 http://www.data-archive.ac.uk/findingData/snDescription.asp?sn=5162
There are wide differences in the requirement for educational qualifications across industries.
118

Learning and Labour Market Intelligence for Wales: National Report 2006
Table 3.9: Occupations in Wales by Qualification Level (academic-based classification), Winter 2004-5
Occupations in Wales by qualification level (academic-based classification)
BaseDegree or equivalent
Higher education
GCE A Level or equiv
GCSE grades A-C or equiv
Other qualifications
No qualification
All 1,255,773 223,545 122,934 293,772 326,527 127,189 149,103Managers and Senior Officials 171,711 40,541 26,834 49,919 33,097 10,807 9,647Professional occupations 134,920 103,527 18,162 7,259 4,707 1,265 0Associate Professional and Technical 152,217 42,999 35,143 37,217 25,931 6,834 3,135Administrative and Secretarial 150,950 14,607 16,860 36,110 63,940 10,741 6,439Skilled Trades Occupations 162,099 2,182 6,963 74,431 30,974 18,733 25,882Personal Service Occupations 96,845 6,094 8,236 20,278 34,590 11,866 15,259Sales and Customer Service Occupations 108,050 7,301 3,344 24,356 43,266 10,259 19,524Process, Plant and Machine Operatives 113,669 3,356 5,393 17,536 31,673 29,410 23,910Elementary Occupations 165,312 2,938 1,999 26,666 58,349 27,274 45,307
Managers and Senior Officials 100 24 16 29 19 6 6Professional occupations 100 77 13 5 3 1 0Associate Professional and Technical 100 28 23 24 17 4 2Administrative and Secretarial 100 10 11 24 42 7 4Skilled Trades Occupations 100 1 4 46 19 12 16Personal Service Occupations 100 6 9 21 36 12 16Sales and Customer Service Occupations 100 7 3 23 40 9 18Process, Plant and Machine Operatives 100 3 5 15 28 26 21Elementary Occupations 100 2 1 16 35 16 27N.B. all are working age
Source: Data Archive, Quarterly Labour Force Survey Analysis, December 2004 - February 2005 http://www.data-archive.ac.uk/findingData/snDescription.asp?sn=5162
Whilst there is a relationship between occupational status and qualifications, there is a wide spread of qualifications in each occupation.
119

Learning and Labour Market Intelligence for Wales: National Report 2006
Table 3.10: Occupational Numbers: Changes in Employment 2004-5
Occupational numbers: Changes in employment 2004-5
Number % of employment
Annual change
Managers and Senior Officials 176,000 13.6 13.5Professional occupations 140,000 10.7 -6.0Associate Professional and Technical 156,000 12.0 -5.5Administrative and Secretarial 156,000 11.9 0.6Skilled Trades Occupations 166,000 12.7 -4.6Personal Service Occupations 102,000 7.8 -4.7Sales and Customer Service Occupations 114,000 8.7 -5.0Process, Plant and Machine Operatives 115,000 8.9 -5.0Elementary Occupations 176,000 13.5 8.0Total 1,301,000 100 -0.6
These figures are based on the new reweighed Labour Force Survey estimates for 1992-2005Source: National Statistics, Labour Force Survey, Spring Quarters. http://www.nomisweb.co.uk
Employment for Managers and Senior Officials, and Elementary Occupations has rapidly increased since 2003.In contrast, employment in most other occupations has declined
120

Learning and Labour Market Intelligence for Wales: National Report 2006
Table 3.11 Self-Employment 2004 in Wales
Self-employment 2004 in Wales
South East Wales
South West Wales Mid Wales North Wales Wales
Self-employed 53,600 32,200 25,800 38,000 149,600Total in employment 592,400 262,200 102,800 285,300 1,242,800% self-employed 9.0 12.3 25.1 13.3 12.0Working age population 844,500 380,700 139,900 380,500 1,745,600% self-employed 6.3 8.5 18.4 10.0 8.6
These figures relate to percentage of working age in employment
Source: National Statistics, Annual Population Survey, Jan 2004-Dec 2004 http://www.nomisweb.co.uk
There are differences in the percentage of working age population who are self-employed across the 4 regions of Wales, with Mid Wales standing out as having a high rate of self employment
121

Learning and Labour Market Intelligence for Wales: National Report 2006
Table 3.12: Full-time Average Gross Weekly Earnings (£), UK regions, 2000 to 20051
Full-time Average Gross Weekly Earnings (£)
Excluding supplementary information2:
Percentagechange
2005 on:2000 2001 2002 2003 2004 2005 2004 2000
United Kingdom 425.1 449.7 472.1 487.1 506.9 517.0 2.0 21.6Great Britain 426.7 451.7 474.3 489.2 509.0 518.7 1.9 21.6England 433.3 459.2 482.0 497.2 517.6 526.1 1.6 21.4North East 372.5 384.0 400.7 409.2 436.4 452.2 3.6 21.4North West 394.6 414.3 434.4 447.7 470.3 479.5 2.0 21.5Yorkshire and the Humber 380.4 396.5 416.8 436.5 456.7 467.2 2.3 22.8East Midlands 379.2 398.2 420.1 436.3 451.1 469.4 4.1 23.8West Midlands 392.8 424.0 433.9 442.3 464.6 475.5 2.3 21.1East 421.7 444.1 464.0 488.3 510.0 512.1 0.4 21.4London 571.6 606.6 641.3 659.0 682.9 697.6 2.2 22.0South East 448.3 477.2 507.5 522.2 537.3 539.0 0.3 20.2South West 385.0 413.4 429.2 449.3 464.5 473.1 1.9 22.9Wales 372.8 385.8 405.2 421.8 444.7 454.4 2.2 21.9Scotland 388.6 411.1 434.6 447.0 460.0 479.6 4.3 23.4Northern Ireland 367.6 381.5 396.8 411.5 433.1 452.2 4.4 23.0
1. The data in this table are based on the average gross weekly earnings (including overtime) of full-time adults whose pay was unaffected by absence.
Source: Annual Survey of Hours and Earnings, Office for National Statistics http://www.statistics.gov.uk/CCI/article.asp?ID=993&Pos=6&ColRank=1&Rank=128 http://www.statistics.gov.uk/StatBase/Product.asp?vlnk=14203
122

Learning and Labour Market Intelligence for Wales: National Report 2006
Table 3.13: Unemployment and Inactivity, Wales and UK 1999-2005
Unemployment and inactivity
March-May 2005 March-May 1999 Change since 1999Difference between
Wales and UKChange in difference
Wales UK Wales UK Wales UK 2005 1999ILO unemployed 60,000 1,338,000 94,000 1,692,000 -34,000 -354,000Economically inactive 434,000 7,519,000 449,000 7,263,000 -15,000 256,000ILO unemployment rate 4.6% 4.8% 7.5% 6.3% -2.9% -1.5% -0.2% 1.2% -1.4%Economic inactivity rate 24.8% 21.3% 26.2% 21.2% -1.4% 0.1% 3.5% 5.0% -1.5%
These figures are based on the new reweighed Labour Force Survey estimates for 1992 to 2005Source: National Statistics, Labour Force Survey, Spring Quarters. http://www.nomisweb.co.uk
ILO unemployment is now lower in Wales than in the UK as a whole, but the inactivity rate remains higher, despite some recent improvements.
123

Learning and Labour Market Intelligence for Wales: National Report 2006
Table 3.14: Qualifications of the Unemployed, Economically Inactive and of the Non-Employed, Winter 2004/05
Qualifications of the Inactive and non-employed
All
pers
ons
ILO
un
empl
oyed
Inac
tive
Non
-em
ploy
ed
% A
ll pe
rson
s
% IL
O
unem
ploy
ed
% In
activ
e
% N
on-
empl
oyed
Base 1,742,449 1742449 1256022 486,427 100 100 100 1001 NVQ Level 4
and above 408,060 408060 346479 61,581 23 23 28 132 NVQ Level 3 266,313 266313 202175 64,138 15 15 16 133
Trade Apprenticeships
86,059 86059 68104 17,955 5 5 5 44 NVQ Level 2 304,742 304742 226780 77,962 17 17 18 165 Below NVQ
Level 2 243,237 243237 175974 67,263 14 14 14 146
Other qualifications
129,668 129668 87407 42,261 7 7 7 97
No qualifications304,370 304370 149103 155,267 17 17 12 32
(5+6+7) Total Below NVQ Level 2 677,275 677,275 412,484 264,791 39 39 33 54
All are working age
Source: Data Archive, Quarterly Labour Force Survey Analysis, December 2004 - February 2005 http://www.data-archive.ac.uk/findingData/snDescription.asp?sn=5162
Those with higher qualifications are under-represented and those with lower qualifications over-represented among both the ILO unemployed and the inactive.
124
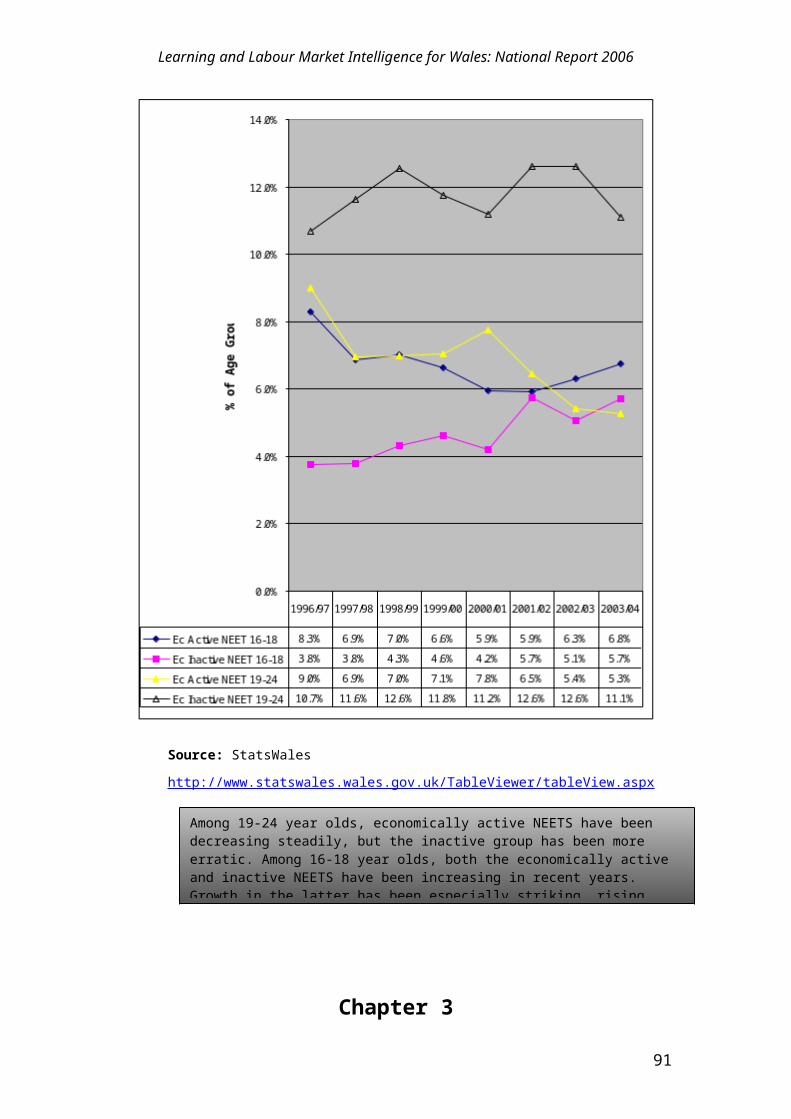
Learning and Labour Market Intelligence for Wales: National Report 2006
Table 3.15: Disability in Wales, 2004
Disability in Wales
South East Wales
South West Wales Mid Wales North Wales Wales
2004
Per
cent
age
of
wor
king
age
po
pula
tion
2004
Per
cent
age
of
wor
king
age
po
pula
tion
2004
Per
cent
age
of
wor
king
age
po
pula
tion
2004
Per
cent
age
of
wor
king
age
po
pula
tion
2004
Per
cent
age
of
wor
king
age
po
pula
tion
Disability No. % No. % No. % No. % No. %DDA disabled and work-limiting disabled
138,800 16.4 61,400 16.1 14,500 10.4 51,000 13.4 265,700 15.2
DDA disabled 39,400 4.7 15,700 4.1 3,900 2.8 15,600 4.1 74,500 4.3
Work-limiting disabled only
29,000 3.4 12,900 3.4 5,000 3.6 10,500 2.8 57,300 3.3
Not disabled 636,900 75.4 290,700 76.4 116,600 83.3 303,400 79.7 1,347,600 77.2
All disabled 207,100 24.5 90,000 23.6 23,400 16.7 77,000 20.3 397,500 22.8
Total 844,100 100 380,700 100 140,000 100 380,500 100 1,745,100 100
Source: National Statistics, Annual Population Survey, Jan 2004-Dec 2004 http://www.nomisweb.co.uk
There is some regional variation in the incidence of work-limiting disability, ranging from 14% in Mid Wales to 19.8% in South East Wales.
125

Learning and Labour Market Intelligence for Wales: National Report 2006
Table 3.16: Disabled Employment Rates, ELWa regions, 2004
Disabled employment rates
South East Wales
South West Wales Mid Wales
North Wales Wales
All disabled (both DDA & also work-limiting) 25.2% 21.8% 31.0% 29.1% 25.5%
Not disabled79.5% 79.0% 78.9% 82.5% 80.0%
Difference-54.3% -57.2% -47.9% -53.4% -54.5%
Source: National Statistics, Annual Population Survey, Jan 2004-Dec 2004 http://www.nomisweb.co.uk
The differences in employment rates between the disabled and the non-disabled are dramatic.
126
Learning and Labour Market Intelligence for Wales: National Report 2006
Table 3.17: Disability, Economic Inactivity and Unemployment, 2004-05
Disability, economic inactivity and unemployment
Economically inactive UnemployedWales Wales
Total 432,758 56,810With a disability 215,190 15,564Percentage with a disability 50% 27%Unemployment is taken from the international definition – claimants of Incapacity Benefit and other disability benefits cannot be unemployed in the claimant count definition.
*Total inactivity and unemployment estimates are different to previous figures because these estimates are taken from the quarterly labour force survey which takes a one quarter cross section to seasonally adjust the data whereas the National Statistics used for previous tables uses four quarter averages.
Source: Data Archive, Quarterly Labour Force Survey Analysis, December 2004 - February 2005 http://www.data-archive.ac.uk/findingData/snDescription.asp?sn=5162
Over half those economically inactive in Wales and over a quarter of these unemployed have a disability.
127

Learning and Labour Market Intelligence for Wales: National Report 2006
Table 3.18: Qualifications for the Working Age Population aged 50 and over, 2003
Qualifications for the working age population aged 50 and over
South East Wales
South West Wales
Mid Wales
North Wales Wales GB
Number aged 50 plus 213,000 107,000 42,000 107,000 469,000 8,722,000
Number aged 50 plus with qualifications below NVQ 2 105,000 50,000 19,000 46,000 222,000 4,049,000
Proportion of 50 plus below NVQ2 49% 45% 43% 47% 46% 49%
Total number with qualifications below NVQ2 (working age)
53,000 148,000 53,000 140,000 692,000 13,542,000
50 plus proportion of those with low qualifications 30% 34% 36% 33% 32% 30%
Number of 50 plus with no qualifications 61,000 28,000 10,000 25,000 125,000 2,102,000
Proportion of 50 plus with no qualifications 29% 27% 23% 24% 27% 24%
Total number with no qualifications 159,000 68,000 22,000 61,000 310,000 5,324,000
50 plus proportion of those with no qualifications 38% 41% 45% 41% 40% 39%
Below NVQ2 = NVQ1 + Other Qualifications + No Qualifications
Source: National Statistics , Welsh Local Area Labour Force Survey 2003 http://www.nomisweb.co.uk
A higher proportion of the over 50s have no qualifications in Wales than in Britain as a whole and 40% of the total without qualifications are in this age category.
128
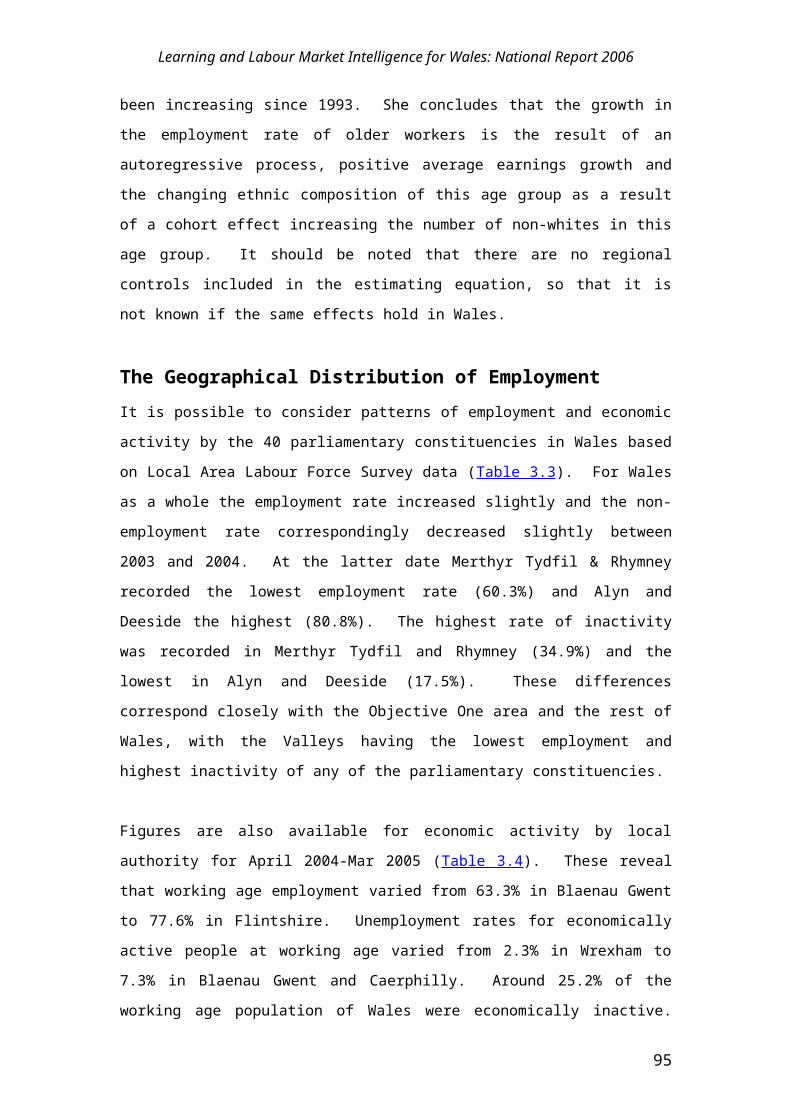
Learning and Labour Market Intelligence for Wales: National Report 2006
Table 3.19: Employment for Black and Minority Ethnic Groups in Wales, 2005
Employment for black and minority ethnic groups in Wales
Wales GB
2005In
employmentEmployment
rate 2001In
employmentEmployment
rateEthnicity Number Number % Number Number %
White 1,703,200 1,220,000 71.6 31,928,600 24,328,300 76.2Black and minority ethnic groups 42,700 24,700 57.7 3,345,200 1,960,800 58.6
Note: Working age only
Source: National Statistics, Annual Population Survey, Apr 2004-Mar 2005http://www.nomisweb.co.uk
While the employment rate for black and ethnic minority groups is substantially below that for whites, the gap is smaller in Wales than in Britain as a whole.
129

Learning and Labour Market Intelligence for Wales: National Report 2006
Table 3.20: Patterns of Non-Employment by UA area, 2005
Patterns of non-employment by UA area
Unitary AuthorityEconomically
inactiveEconomic
inactivity rate Not employedNon-employment
rateAnglesey 9,600 24.5 11200 28.4Blaenau Gwent 13,100 31.7 15100 36.7Bridgend 17,500 22.6 19500 25.2Caerphilly 30,200 29.1 35600 34.2Cardiff 47,200 24.5 54500 28.3Carmarthenshire 28,700 28.4 32100 31.7Ceredigion 13,300 27.2 15300 31.3Conwy 13,400 21.9 14900 24.3Denbighshire 11,900 21.6 13300 24.1Flintshire 18,900 20.3 20800 22.3Gwynedd 16,300 23.8 18000 26.3Merthyr Tydfil 10,800 32.4 12200 36.5Monmouthshire 10,800 21.2 12000 23.5Neath Port Talbot 25,700 32.3 28800 36.2Newport 21,800 27.0 25200 31.1Pembrokeshire 17,300 26.0 20000 30.0Powys 16,100 21.7 17700 24.0Rhondda, Cynon, Taff 36,900 26.8 42600 30.9Swansea 31,000 23.2 36900 27.6Torfaen 13,600 25.1 15800 29.2Vale of Glamorgan 16,300 22.5 19100 26.3Wrexham 19,200 23.8 20600 25.6Wales 439,500 25.2 501500 28.7
These figures relate to percentage of working age in employment
Source: National Statistics, Annual Population Survey, Apr 2004-Mar 2005 http://www.nomisweb.co.uk
Non employment rates vary appreciably across Unitary Authorities, being higher in the Valleys than elsewhere.
130

Learning and Labour Market Intelligence for Wales: National Report 2006
Table 3.21: Patterns of Key Benefit Receipt by UA area, August 2005
Patterns of key benefit receipt by UA area
August 2004 All UnemployedSick &
Disabled Lone Parents Other000s %1 000s %1 000s %1 000s %1 000s %1
Anglesey, Isle of 6.7 17 1.2 3 4.1 11 0.8 2 0.3 1Blaenau Gwent 11.7 29 1.5 4 7.5 21 1.1 3 0.3 1Bridgend 16.2 21 2 3 10.8 15 1.8 2 0.4 1Caerphilly 24.6 24 3.2 3 16.4 17 3 3 0.6 1Cardiff 31.5 15 4.8 2 18.1 10 5.5 3 1.2 1Carmarthenshire 18.1 18 2.2 2 14.1 13 2 2 0.5 1Ceredigion 6.2 13 0.7 1 4.1 9 0.8 2 0.3 1Conwy 10.4 17 1.1 2 6.4 12 1.2 2 0.5 1Denbighshire 9.2 17 1 2 6 12 1.1 2 0.4 1Flintshire 11.7 13 1.6 2 7.3 9 1.9 2 0.3 0Gwynedd 8.8 13 1.1 2 6 9 1.2 2 0.5 1Merthyr Tydfil 9.3 28 0.9 3 6.5 22 0.9 3 0.2 1Monmouthshire 5.4 11 0.8 2 3.6 8 0.6 1 0.2 0Neath Port Talbot 20.5 25 2.1 3 13.7 19 2.5 3 0.5 1Newport 15.4 18 2.2 3 8.5 12 2.6 3 0.5 1Pembrokeshire 11.2 17 1.6 2 6.9 11 1.5 2 0.5 1Powys 8.6 11 1.1 2 5.8 9 0.8 1 0.3 0Rhondda, Cynon, Taff 32.4 23 3.1 2 22.9 18 3.5 3 0.8 1Swansea 25.8 19 3 2 16.8 14 3.2 2 0.8 1Torfaen 10.4 19 0.9 2 6.7 14 1.5 3 0.4 1The Vale of Glamorgan 10.3 14 1.6 2 6.1 10 1.1 2 0.4 1Wrexham 12.5 16 1.4 2 7.9 11 1.5 2 0.5 1WALES 317 18 39.2 2 227.4 13 40 2 10.4 11 Percentage of the population of working age
Key benefits are Jobseeker's Allowance (JSA), Incapacity Benefit (IB), Severe Disablement Allowance, Disability Living Allowance, Income Support and National Insurance credits only (through JSA or IB)
Source: Client Group Analysis of DWP Information Centres, Department for Work and Pensions http://www.dwp.gov.uk/asd/tabtool.asp
The percentage of benefit recipients varies markedly across Unitary Authorities. The percentage of lone parent claimants now exceeds that of unemployment benefit claimants.
131

Learning and Labour Market Intelligence for Wales: National Report 2006
Table 3.22: Unemployment and Inactivity, Wales and UK 1999-2005
Unemployment and inactivity
March-May 2005 March-May 1999 Change since 1999Difference between
Wales and UKChange in difference
Wales UK Wales UK Wales UK 2005 1999ILO unemployed 60,000 1,338,000 94,000 1,692,000 -34,000 -354,000Economically inactive 434,000 7,519,000 449,000 7,263,000 -15,000 256,000ILO unemployment rate 4.6% 4.8% 7.5% 6.3% -2.9% -1.5% -0.2% 1.2% -1.4%Economic inactivity rate 24.8% 21.3% 26.2% 21.2% -1.4% 0.1% 3.5% 5.0% -1.5%
These figures are based on the new reweighed Labour Force Survey estimates for 1992 to 2005
Source: National Statistics, Labour Force Survey, Spring Quarters. http://www.nomisweb.co.uk
Both ILO unemployment and the Economic Activity rate have improved faster in Wales than in the UK as a whole
132
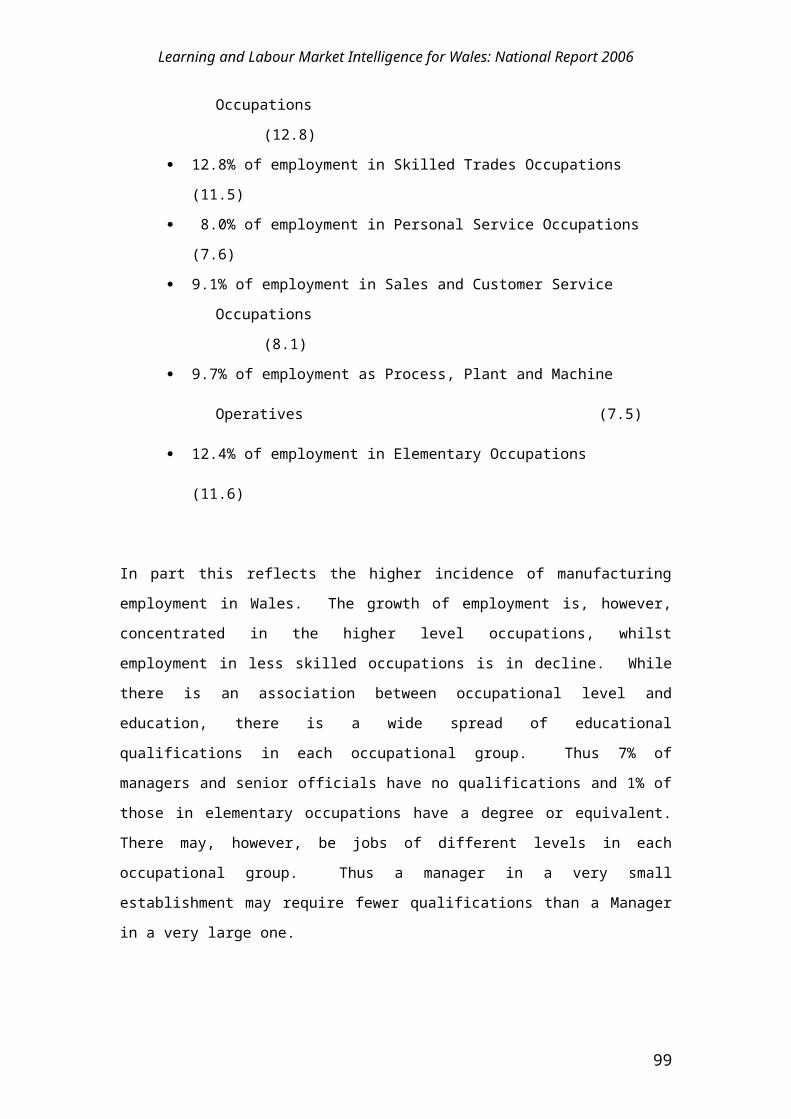
Learning and Labour Market Intelligence for Wales: National Report 2006
Table 3.23: Claimant Count of Jobseeker's Allowance claimants, June 2005
Claimant Count of Jobseeker's Allowance claimants
June 2004 Number Rate %Anglesey 1,214 3.0Blaenau Gwent 1,637 4.0Bridgend 1,848 2.3Caerphilly 2,924 2.8Cardiff 4,649 2.3Carmarthenshire 2,025 2.0Ceredigion 543 1.1Conwy 1,209 1.9Denbighshire 1,060 1.9Flintshire 1,593 1.7Gwynedd 1,559 2.2Merthyr Tydfil 1,163 3.5Monmouthshire 713 1.4Neath Port Talbot 2,090 2.6Newport 2,210 2.6Pembrokeshire 1,501 2.2Powys 1,103 1.5Rhondda, Cynon, Taff 3,631 2.6Swansea 3,235 2.4Torfaen 1,092 2.0Vale of Glamorgan 1,502 2.1Wrexham 1,342 1.7Wales 39,843 2.2Residence-based proportions express the number of claimants resident in an area as a percentage of the working age population resident in that area.
Source: National Statistics, Claimant Count with Rates and Proportions, June 2005 http://www.nomisweb.co.uk
There is considerable variation in the claimant count rate of Job Seekers’ Allowance across the unitary authorities in Wales.
133

Learning and Labour Market Intelligence for Wales: National Report 2006
Table 3.24: Summary of people into jobs through New Deal
New Deal for Young People New Deal 25plus
Enhanced programme
Summary Total
of which, Sustained
(2) Total
of which, Sustained
(2) Totalof which,
Sustained (2)
Total 40,840 34,960 12,510 10,470 8,050 6,600
Characteristics
Gender Male 30,520 26,210 - - 6,860 5,610Female 10,310 8,750 - - 1,190 990
Disability People with Disabilities 6,730 5,670 - - 2,840 2,340
Ethnic Group White 38,610 33,070 - - 7,480 6,120Ethnic Minority Groups, of which 840 690 - - 280 230Black - Caribbean 80 70 - - 30 20Black - African 130 110 - - 50 40Black - Other 70 50 - - 10 10Indian 50 50 - - 20 20Pakistani 100 80 - - 20 20Bangladeshi 70 60 - - 20 10Chinese 30 30 - - 10 10Other 300 250 - - 120 100
Prefer not to say 1,160 990 - - 300 250Not stated/Unknown 230 220 - - 0 0
Age Group 18-24 40,840 34,960 25-29 - - 1,670 1,34030-34 - - 1,630 1,34035-39 - - 1,430 1,17040-44 - - 1,210 99045-49 - - 960 79050-54 - - 700 58055-59 - - 450 38060+ - - 20 20Jobcentre Plus Region: WalesTo May 2005(1) The table counts number of individuals into employment from NDYP and ND25plus. On this basis, a New Dealparticipant on either programme is only ever counted once as starting employment from that programme. If a participanthas a sustained spell of unsubsidised employment after having had a sustained spell of subsidised employment, thenthe unsubsidised employment always takes
134

Learning and Labour Market Intelligence for Wales: National Report 2006
priority.(2) A job from which the participant does not return to JSA within 13 weeks.
Source: Department for Work and Pensions http://www.dwp.gov.uk/asd/asd1/new_deal/ndyp_aug05/wales.asp
135

Learning and Labour Market Intelligence for Wales: National Report 2006
Table 3.25: Jobcentre Plus District performance against Target Profile, 2004-5
Jobcentre Plus District Job Entry PerformancePerformance variance against
Profile Total Points profile April 04 to March 05 April 04 to March 05
National Total 3.9% 7.280,124DistrictNorth West Wales & Powys -14.1% 47,234Bridgend & Rhondda, Cynon Taff 14.0% 91,743Eastern Valleys 2.6% 84,991Swansea Bay 20.4% 57,551West Wales 0.7% 56,570South East Wales 5.0% 41,617Wrexham & North Wales Coast 9.5% 58,747Cardiff & Vale 10.3% 62,503Wales 9.0% 503,165
The sum of district profiles is slightly higher than the national profile due to rounding and the allocation methodology. Total Points achieved includes the additional points awarded for retention and disadvantaged UA districts.
Source: Jobcentre Plus http://www.jobcentreplus.gov.uk/cms.asp?Page=/Home/AboutUs/JobcentrePlusPerformance/2004-5Targets
Job Centre Plus exceeded its performance targets in 2004-5 by nearly 4%
136

Learning and Labour Market Intelligence for Wales: National Report 2006
Table 3.26 : Jobcentre Plus District Performance: Lone Parent Job Entries 2004-05
Jobcentre Plus District Job Entry PerformanceLone Parents
No. of Job Entries Customer base
Job entries as a proportion of client base
GB Total 113,835 3,353,732 3.4%
North West Wales & Powys 580 13,016 4.5%Bridgend & Rhondda, Cynon Taff 1,425 25,351 5.6%Eastern Valleys 1,442 29,399 4.9%Swansea Bay 1,186 23,918 5.0%West Wales 641 16,501 3.9%South East Wales 863 20,202 4.3%Wrexham & North Wales Coast 1,463 22,378 6.5%Cardiff & Vale 1,045 29,092 3.6%Wales 8,645 179,857 4.8%
Participants in New Deal for Lone Parents, and other jobless Lone parents.
Source: Jobcentre Plus :http://www.jobcentreplus.gov.uk/cms.asp?Page=/Home/AboutUs/JobcentrePlusPerformance/2004-5Targets
In relation to Lone Parents Job Centre Plus’s performance in Wales exceeded that in Great Britain as a whole.
137

Learning and Labour Market Intelligence for Wales: National Report 2006
Table 3.27: Jobcentre Plus District Performance: Job Entries by People with Disabilities 2004-05
Jobcentre Plus District Job Entry Performance
People with DisabilitiesNo. of Job
Entries Customer baseJob entries as a proportion
of client baseNational Total 55,515 11,708,716 0.5%DistrictNorth West Wales & Powys 375 67,064 0.6%Bridgend & Rhondda, Cynon Taff 1,823 141,711 1.3%Eastern Valleys 1,500 139,274 1.1%Swansea Bay 791 129,997 0.6%West Wales 649 105,207 0.6%South East Wales 747 81,219 0.9%Wrexham & North Wales Coast 404 116,613 0.3%Cardiff & Vale 621 106,109 0.6%Wales 6910 887194 0.8%
People with disabilities including participants in New Deal for disabled people, disabled people in receipt of incapacity benefit, severe disability allowance income support, invalidity care allowance and bereavement benefit.
Source: Jobcentre Plus http://www.jobcentreplus.gov.uk/cms.asp?Page=/Home/AboutUs/JobcentrePlusPerformance/2004-5Targets
In relation to people with disabilities Job Centre Plus’s performance in Wales was better than that in Britain as a whole.
138

Learning and Labour Market Intelligence for Wales: National Report 2006
Table 3.28: Jobcentre Plus District Performance 2004-05: Job Entries by Long-Term Unemployed Customers
Jobcentre Plus District Job Entry Performance
Customers unemployed for 6 months or more and other disadvantaged Clients
No. of Job Entries
Customer base
Job entries as a proportion of client base
National Total 273,009 1,544,730 17.7%DistrictNorth West Wales & Powys 1,332 8,750 15.2%Bridgend & Rhondda, Cynon Taff 2,240 7,340 30.5%Eastern Valleys 3,078 7,925 38.8%Swansea Bay 2,455 9,270 26.5%West Wales 1,992 7,595 26.2%South East Wales 1,657 6,705 24.7%Wrexham & North Wales Coast 2,042 8,470 24.1%Cardiff & Vale 2,448 10,765 22.7%Wales 17,244 66,820 25.8%
Participants in ND50 plus, ND25+, NDYP, employment zones, other people with a disability who are not participants in NDDP or claiming an inactive benefit, and people in receipt of Jobseekers Allowance for 6 months or more.
Source: Jobcentre Plus http://www.jobcentreplus.gov.uk/cms.asp?Page=/Home/AboutUs/JobcentrePlusPerformance/2004-5Targets
In relation to longer-term unemployed Job Centre Plus’s performance in Wales exceeded that in Britain as a whole.
139

Learning and Labour Market Intelligence for Wales: National Report 2006
Table 3.29: Jobcentre Plus District Performance 2004-05: Job Entries by Long-Term Unemployed Customers
Jobcentre Plus District Job Entry Performance
Customers unemployed for less than 6 months and other disadvantaged Clients
No. of Job Entries Customer base
Job entries as a proportion of client base
Great Britain 234,025 4,688,807 5.0%DistrictNorth West Wales & Powys 1,609 22,369 7.2%Bridgend & Rhondda, Cynon Taff 2,512 34,412 7.3%Eastern Valleys 3,485 40,899 8.5%Swansea Bay 2,069 34,194 6.1%West Wales 2,399 28,301 8.5%South East Wales 1,443 25,766 5.6%Wrexham & North Wales Coast 2,314 33,467 6.9%Cardiff & Vale 2,316 39,057 5.9%Wales 18,147 258,465 7.0%
Participants in ND50 plus, ND25+, NDYP, employment zones, other people with a disability who are not participants in NDDP or claiming an inactive benefit, and people in receipt of Jobseekers Allowance for 6 months or more.
Source: Jobcentre Plus http://www.jobcentreplus.gov.uk/cms.asp?Page=/Home/AboutUs/JobcentrePlusPerformance/2004-5Targets
In relation to the shorter term unemployed Job Centre Plus’s performance in Wales was slightly better than in Britain as a whole.
140

Learning and Labour Market Intelligence for Wales: National Report 2006
Table 3.30: Qualifications of the Unemployed, Economically Inactive and of the Non-Employed, Winter 2004/05
All
pers
ons
ILO
un
empl
oyed
Inac
tive
Non
-em
ploy
ed
All
pers
ons
ILO
un
empl
oyed
Inac
tive
Non
-em
ploy
ed
Base 1,742,449 1742449 1256022 486,427 100 100 100 1001 NVQ Level 4
and above 408,060 408060 346479 61,581 23 23 28 132 NVQ Level 3 266,313 266313 202175 64,138 15 15 16 133
Trade Apprenticeships
86,059 86059 68104 17,955 5 5 5 44 NVQ Level 2 304,742 304742 226780 77,962 17 17 18 165 Below NVQ
Level 2 243,237 243237 175974 67,263 14 14 14 146
Other qualifications
129,668 129668 87407 42,261 7 7 7 97
No qualifications
304,370 304370 149103 155,267 17 17 12 32(5+6+7) Total Below
NVQ Level 2 677,275 677,275 412,484 264,791 39 39 33 54All are Working Age
Source: Data Archive, Quarterly Labour Force Survey Analysis, December 2004 - February 2005 http://www.data-archive.ac.uk/findingData/snDescription.asp?sn=5162
Low qualifications are a significant indicator of the likelihood of an individual being either unemployed or inactive.
141

Learning and Labour Market Intelligence for Wales: National Report 2006
Table 3.31: Employment and Non-Employment Rates by Skill Level 2004-05
Employment and non-employment rates by skill level
Wales % In employment % Non-employedNVQ Level 4 and above 85 15NVQ Level 3 76 24Trade Apprenticeships 79 21NVQ Level 2 74 26Below NVQ Level 2 72 28Other qualifications 67 33No qualifications 49 51
N.B all are working age
Source: Data Archive, Quarterly Labour Force Survey Analysis, December 2004 - February 2005 http://www.data-archive.ac.uk/findingData/snDescription.asp?sn=5162
The higher the level of qualifications the higher the employment rate.
142

Learning and Labour Market Intelligence for Wales: National Report 2006
Table 3.32: Employment Starts by Occupational Category, 2004-05
Employment starts by occupational category, 2004-05
Job starters %
All employees
(stock figure) % DifferenceBase 231,716 100.0 1,103,014 100.0 0.0Administrative and Secretarial 28,456 12.3 146,505 13.3 -1.0Skilled Trades Occupations 16,833 7.3 104,119 9.4 -2.2Sales and Customer Service Occupations 31,999 13.8 104,587 9.5 4.3Process, Plant and Machine Operatives 22,431 9.7 99,902 9.1 0.6Elementary Occupations 45,105 19.5 152,959 13.9 5.6
New Starters are those employees who have started working for their employer since2004.
Source: Data Archive, Quarterly Labour Force Survey Analysis, December 2004 - February 2005 http://www.data-archive.ac.uk/findingData/snDescription.asp?sn=5162
It appears that demand for labour is greater at the lower end of the occupational distribution, but in part this may be a consequence of higher labour turnover.
143

Learning and Labour Market Intelligence for Wales: National Report 2006
Table 3.33: People Starting Employment within the last three months: December 2004 – February 2005, by Qualification
People starting employment within the last three months: December 2004 – February 2005
QualificationsNew
employees %All employees (stock figure) % Difference
All 231,245 100 1,101,749 100.0 0.0NVQ Level 4 and above 53,980 23.3 314,965 28.6 -5.2NVQ Level 3 34,782 15.0 179,693 16.3 -1.3Trade Apprenticeships 9,950 4.3 45,384 4.1 0.2NVQ Level 2 55,311 23.9 205,089 18.6 5.3Below NVQ Level 2 32,691 14.1 157,471 14.3 -0.2Other qualifications 16,536 7.2 73,304 6.7 0.5No qualifications 27,995 12.1 125,843 11.4 0.7
Interpretation. In the Wales labour market, there are substantial numbers of jobs for people with qualifications at NVQ2 and below.However, the difference between the stock and starters figures may also indicate higher turnover at the low qualifications end of the market.
New Starters are those employees who have started working for their employer since2004.
Source: Data Archive, Quarterly Labour Force Survey Analysis, December 2004 - February 2005 http://www.data-archive.ac.uk/findingData/snDescription.asp?sn=5162
Over half the job starts are by individuals with qualifications at NVQ Level 2 and below.
144

Learning and Labour Market Intelligence for Wales: National Report 2006
Table 3.34: Employment Starts by Industry, 2004-05
Industries
New employees %
All employees
(stock figure) % DifferenceBase 231,716 100.0 1,103,014 100.0 0.0Agriculture & Fishing 2,466 1.1 8,499 0.8 0.3Energy & Water 1,885 0.8 15,558 1.4 -0.6Manufacturing 25,209 10.9 172,623 15.7 -4.8Construction 19,222 8.3 56,591 5.1 3.2Distribution, hotels & restaurants 65,452 28.2 242,594 22.0 6.3Transport & Communication 14,321 6.2 62,323 5.7 0.5Banking, finance & insurance etc 28,717 12.4 114,157 10.3 2.0Public admin, education & health 60,336 26.0 373,304 33.8 -7.8Other Services 14,108 6.1 57,365 5.2 0.9Total services 182,934 79 849,743 77 1.9
New Starters are those employees who have started working for their employer since2004.
Source: Data Archive, Quarterly Labour Force Survey Analysis, December 2004 - February 2005 http://www.data-archive.ac.uk/findingData/snDescription.asp?sn=5162
Two sections – Distribution Hotels and Restaurants and Public Administration etc. dominate job starts.
145

Learning and Labour Market Intelligence for Wales: National Report 2006
Table 3.35: Job Density, 2001-03
Area2001 2002 2003
England 0.83 0.84 0.84Scotland 0.82 0.82 0.82Wales 0.73 0.73 0.74Objective One 0.65 0.67 0.68Objective Three 0.86 0.84 0.85
Unitary Authorities2001 2002 2003
Blaenau Gwent 0.54 0.52 0.53Bridgend 0.65 0.69 0.69Caerphilly 0.50 0.51 0.49Cardiff 1.00 0.99 0.97Carmarthenshire 0.66 0.62 0.64Ceredigion 0.76 0.70 0.75Conwy 0.71 0.70 0.72Denbighshire 0.75 0.75 0.76Flintshire 0.72 0.72 0.74Gwynedd 0.75 0.80 0.85Merthyr Tydfil 0.61 0.66 0.62Monmouthshire 0.85 0.80 0.88Neath Port Talbot 0.55 0.60 0.59Newport 0.98 0.92 0.93Pembrokeshire 0.75 0.69 0.72Powys 0.83 0.84 0.89Rhondda, Cynon, Taff 0.58 0.61 0.58Swansea 0.75 0.79 0.85Torfaen 0.73 0.75 0.74Vale of Glamorgan 0.72 0.61 0.64Wrexham 0.74 0.74 0.71
Job Density
Job Density
Jobs densities are calculated on the unrounded totals of jobs and working age population.Numbers of jobs and working age residents are also included.Jobs density is an indicator of labour demand, along with vacancies. It forms part of a local area labour market framework with indicators of labour supply such as employment rates, unemployment rates and claimant count proportions as well as working age benefits and labour costs.
Source: National Statisticshttp://www.statistics.gov.uk/STATBASE/Product.asp?vlnk=10549&More=Y
Wales has the lowest density of any region. Within Wales job density is much higher in the Objective Three area than in the Objective One area.
146

Learning and Labour Market Intelligence for Wales: National Report 2006
Table 3.36: Productivity in Wales 2003
Productivity in Wales
GVA per person employed
NUTS area GVA 2003In
employment – working age
GVA per person employed Index
UK=100 £ million 2003 £Isle of Anglesey 598 28,000 21357 60Gwynedd 1389 50,600 27451 77Conwy and Denbighshire 2072 84,900 24405 68South West Wales 3568 145,900 24455 68Central Valleys 3009 112,000 26866 75Gwent Valleys 3144 133,100 23621 66Bridgend and Neath Port Talbot 2942 105,100 27992 78Swansea 3034 94,400 32140 90Monmouthshire and Newport 3496 96,700 36153 101Cardiff and Vale of Glamorgan 8201 187,500 43739 122Flintshire and Wrexham 4295 132,500 32415 90Powys 1611 56,600 28463 79Wales 37359 1,227,300 30440 85UK 961461* 26,825,100 35842 100
* The UK total excludes any elements of GVA that cannot be assigned to specific regions, i.e. elements that are Extra-regio. It is the total of the English regions and the three devolved administrations and is the most appropriate aggregation to use when making comparisons between the regions and the UK.
Source: National Statistics www.statswales.wales.gov.uk Welsh Local Labour Force Survey . National Statistics http://www.nomisweb.co.uk
Productivity in Wales is much lower than in the UK as a whole, but varies considerably across NUTS areas.
147

Learning and Labour Market Intelligence for Wales: National Report 2006
Table 3.37: Skills that Need Improving in the next 12 months to Meet Business Needs in Wales, 2003
Skills that need improving in the next 12 months to meet business needs
(% companies)
Marketing 39Management 35Customer care 33Selling 28Communications 27IT - Technical support 23Team working 23Technical 20None 17Professional 17Manual 15Problem solving 15Basic ICT 15ICT competence 12Clerical/Secretarial 11Other skills 6Foreign languages 5Numeracy 4Literacy 3
148

Learning and Labour Market Intelligence for Wales: National Report 2006
Table 3.38: Reasons for Not Providing Training, 2003
Reasons for not providing training
(% companies)
Did not need to 52Staff already trained 33Funds not available 25Lack of suitable courses 11No time for staff training 9Only recruit trained workers 8No time for management training 6Did not know training needs 3Staff resist training 3Source: WDA/CBI survey May 2003
149
Related Documents
![VOL.8 No.1 Agustus I 3 A a] |ssN=1693-8305 š, Tüv š](https://static.cupdf.com/doc/110x72/5866e2b61a28abcd408b8f93/vol8-no1-agustus-i-3-a-a-ssn1693-8305-s-tuev-s.jpg)