MIT Center for Real Estate September, 2000 Firm Level Factors that Affect Returns to Real Estate Investment Trusts William B. Strange, mI Duo Tang Thesis, 2000 © Massachusetts Institute of Technology, 2000. This paper, in whole or in part, may not be cited, reproduced, or used in any other way without the written permission of the authors. Comments are welcome and should be directed to the attention of the authors. MIT Center for Real Estate, 77 Massachusetts Avenue, Building W31-310, Cambridge, MA, 02139-4307 (617-253-4373).

Welcome message from author
This document is posted to help you gain knowledge. Please leave a comment to let me know what you think about it! Share it to your friends and learn new things together.
Transcript

MIT Center for Real EstateSeptember, 2000
Firm Level Factors that Affect Returns to RealEstate Investment Trusts
William B. Strange, mIDuo Tang Thesis, 2000
© Massachusetts Institute of Technology, 2000. This paper, in whole or in part, may not be cited,reproduced, or used in any other way without the written permission of the authors. Comments arewelcome and should be directed to the attention of the authors.
MIT Center for Real Estate, 77 Massachusetts Avenue, Building W31-310, Cambridge, MA, 02139-4307(617-253-4373).
FIRM LEVEL FACTORS THAT AFFECT RETURNS TOREAL ESTATE INVESTMENT TRUSTS
By
William B. Strange, III
Bachelor of Arts in Political ScienceSouthern Methodist University, 1971
Juris DoctorGeorge Washington University, 1979
And
Duo Tang
Bachelor of Arts in EnglishHunan Normal University, 1993
Master of Science in FinanceCarroll Graduate School of Management
Boston College, 1996
Submitted to the Department of Urban Studies and Planning in Partial Fulfillment of theRequirements for the Degree of
MASTER OF SCIENCE In Real Estate DevelopmentAt the
Massachusetts Institute of TechnologySeptember 2000
© 2000 William B. Strange, III and Duo TangAll rights reserved
The authors hereby grant to MIT permission to reproduce and to distribute publicly paper andelectronic copies of this thesis document in %7hole or in part.
Signature of Author:Department of Urban Studies anc Planning, August2000
Signature of Author:Department of Urban Studies and Planning, August 2, 2000
Certified by:Ti hy, Astant sor, artment of Urban Studies and PlanningThesisS peris o r
Accepted by:William Wheaton, Chairman Interdepartmental Degree Program in Real Estate Development
1
FIRM LEVEL FACTORS THAT AFFECT RETURNS TOREAL ESTATE INVESTMENT TRUSTS
By
William B. Strange, III
And
Duo Tang
Submitted to the Department of Urban Studies and PlanningOn August 2, 2000 in Partial Fulfillment of the Requirements forThe Degree of Master of Science in Real Estate Development
Abstract:
This thesis examines the historical financial data for publicly traded securities issued byReal Estate Investment Trusts (REITS). The inquiry isolates certain quantifiable firmspecific financial data and organizes that data into pooled, time-series cross-sections.Annual returns to capital are determined for certain equity REITS from 1990 to 1999and are used as the dependent variable in a statistical regression analysis. Theanalysis includes independent variables drawn from a database and includes variablesto adjust results for the impact of macroeconomic factors. In addition, indexes for thebroader markets are identified and included in the regressions to adjust for the impact oftrends in the general market.
Following adjustments for macroeconomic factors and general market trends theregression results identify various firm specific variables that display a statisticallysignificant relationship to relative returns to capital in REIT securities over time.Negative impacts on returns are observed for increases in firm size and for certain debtfeatures such as variable rate debt, unsecured debt, and total debt. Positive impacts onreturns are associated with higher levels of asset growth as well as relatively higherlevels of secured debt and preferred stock. The expected positive correlation of returnswith increases in broader stock market indexes and negative correlation with increasingshort-term interest rates is not displayed. For the period from 1993 to 1999, the dataindicate an inverse correlation of REIT returns to the stock market as represented bythe S&P 500 index and a direct relation with short-term interest rates.
Interpretations of the results are provided in a form that relates the firm leveldeterminates of returns to capital with the history of REITS and their organizational andtax characteristics. Alternatives for further inquiry are identified and implications forinvestors and REIT managers are discussed.
Thesis Advisor: Timothy RiddioughTitle: Assistant Professor
2
Acknowledgements:
Timothy Riddiough, Assistant Professor, Massachusetts Institute of Technology,
Department of Urban Studies and Planning: For his suggestion of this topic, his
continuous encouragement to engage with the data, his insight into the relationship of
financial fundamentals with REITS, and for his ability to skillfully adapt his supervision to
the changing circumstances of the project.
Matthew Ostrower, (formerly Vice President, Pioneer Investment Management; now
affiliated with Morgan Stanley Dean Whitter): For being an extraordinarily generous
resource in our effort to obtain data, and for giving us much more of his time than we
deserved.
Fred Carr, Founder, The Penobscot Group: For his insights and contributions in
describing what REIT analysts really care about.
Duo Tang would like to thank Aiju, Lin, Liang, Liu, Jingbo, Kai, Jing, Hong, Qiong, Kang,
Wei, and Olivier for their love and support and dedicates this thesis in loving memory of
Yugui.
Bill Strange would like to thank Bill Jr., Marjorie, Rachel, Bryan, and Adam for their
generosity and affection. Bill dedicates this thesis in loving memory of Dru.
3

Table of Contents
Abstract 2
Acknowledgements 3
Table of Contents 4
Chapter One: Background 6
Introduction 6
A brief history of REITS 9
REITS and Portfolio Investing 12
Chapter Two: Previous Literature 19
Chapter Three: Methodology 23
Introduction 23
Database 25
Step 1: Identification of Major Variables for the Thesis Study 27
Step 2: Identification of Data Sources 29
Step 3: Querying the Data sources and Thesis Database Creation 30
Step 4: Thesis Database Quality Check 34
Step 5: Importing Data into the Statistical Software 35
Step 6: Establish Regression Analysis Equations 35
Chapter Four: Results and Interpretation 38
Regression Results 38
Findings and Interpretation. 42
All REITS (with year dummy variables) 42
All REITS (with factors for the S & P and T-bills) 46
4

All REITS (without year dummies, S & P or T-bills) 48
All REITS (with S & P and T-bills) by sample range 48
REITS by property focus 51
Potential Bias 51
Chapter Five: Conclusions 53
Basic Interpretation 54
Further Inquiries 55
Final Thoughts 57
Appendix A: All variables included in the database 59
Appendix B: All data points and respective sources 60
Appendix C: All REITS within the database 62
Appendix D: REITS by property focus 66
Bibliography 72
5

FIRM LEVEL FACTORS THAT AFFECT RETURNS
TO
REAL ESTATE INVESTMENT TRUSTS
Chapter One: Background
Introduction
Historically, commercial real estate was most commonly owned by private individuals or
by institutions. Ownership of individual properties was typically concentrated in a single
institution or a relatively small group of individuals. The nature of real estate as a high
cost, durable asset made it particularly desirable as a long-term investment by
organizations such as insurance companies and high net worth individuals. Due to the
relatively high transaction costs and the highly localized nature of the investment, real
estate has never traded as frequently as financial assets such as stocks and bonds.
When real estate does trade, the markets for its transfer have historically been
fragmented and idiosyncratic. As a result, most commentators describe real estate as
an illiquid investment.
6

Though real estate assets are somewhat similar in fundamental character (e.g. a
structure for work or residence), the distinction by location renders real estate much less
than perfectly fungible. Real estate has generally been considered as an inflation
hedge and is virtually impossible to sell "short". Accordingly, real estate evolved into an
asset "class" that most investors considered to be quite separate from other types of
assets. 1
Real estate investors have historically accepted real estate's lack of liquidity and
typically were relatively indifferent to knowing its "value" at every instant in time. The
valuation of real estate was really important to the owner only when they sold the asset
or borrowed money that was secured by the realty. At those times third parties who
were supposedly expert in the details of real estate valuation appraised the property. 2
Appraisals were customized to a particular property and formed the baseline for
negotiation of transactions and for certain regulatory compliance within the insurance
and pension fund industries. In each event the valuation process was under the control
and direction of the owners and provided a relatively smooth pattern of values.
On January 1, 1961, the pattern of both ownership and valuation of real estate began to
change. On that day the Internal Revenue Code first permitted the exemption from
entity level taxation for "real estate investment trusts" (REITS). This action finally
placed real estate on a par with other asset "classes" such as stocks and bonds that for
1 Skeptics argue that there are only two asset "classes": the "risk free" asset and "risky" assets. Oftenthe characterization of any asset as a "class" is generated by those with a vested interest (advisory orbrokerage) in causing clients to commit and maintain investment dollars in that class.2The three typical approaches were: income capitalization, replacement cost (with adjustment fordepreciation) and "comparable" sales.
7

years had enjoyed the ability to be grouped into mutual funds for public trading and be
untaxed at the organizational level so long as current dividends and capital gains were
passed on to the owners of the fund. Prior to this legislation, taxation at both the entity
level and the individual level (coupled with very high marginal rates of taxation) made
public ownership of real estate impractical.
Favorable tax treatment for REITS came at the price of various limitations on ownership
and distribution of income to the shareholders. In addition, certain organizational
constraints on the activities of the trust were established. 3 Over time the details of
REIT regulation have changed, but the fundamental elements of the REIT structure
remain in place. These constraints essentially compel REITS to access public capital
markets frequently by the issuance of debt or equity securities if the REIT desires to
grow its asset base. This tie to the public markets is a fundamental characteristic that
defines the behavior of REITS.
REITS make it possible for real estate assets to be traded and valued within public
markets in the same manner as other financial assets. By issuing shares, the REIT
transforms the nature of real estate ownership in two major respects. First, it is now
possible for the ownership to be fragmented among a large number of different
individuals and organizations and traded frequently with low transaction costs. Second,
the process of trading the REITS shares now renders a market judgment on the value of
the firm and its underlying real estate. The implications of these two changes are quite
3 See Internal Revenue Code sections 856 to 860. For a good summary of REIT structural requirements,see Real Estate Finance and Investment, by Brueggman and Fisher (Irwin/McGraw-Hill, 1997)
8
significant for the understanding of real estate investment in particular as well as for the
structuring of modern diversified investment portfolios. Interestingly, the consequences
of these changes did not become apparent for decades following the creation of REITS
as an alternative form of real estate ownership.
A Brief History of REITS
The growth of REITS immediately after 1961 was less than spectacular. Essentially,
the industry did not have significant size until the late 1960's when REITS began to
issue debt securities in substantial amounts and invest the resulting proceeds in
development loans. REITS made highly leveraged investments without the benefit of
the discipline that was applied to regulated lenders such as banks. This boom lasted
until 1974 and was followed by a significant collapse as a result of a real estate
recession. Many REITS went bankrupt and the few survivors spent years slowly
rebuilding their capital base.
From 1976 until 1983, the REIT industry was relatively flat in terms of asset size. The
inflationary era and easy credit allowed owners and developers significant access to
capital in the private markets. There was no perceived advantage for a public market
vehicle for real estate ownership and the tax laws created incentives for individuals to
own real estate by allowing accelerated depreciation and by permitting passive losses
on real estate to offset ordinary income of owners who often had high marginal personal
9

income tax rates. The entire value of the REIT industry during this time remained about
$7 Billion.
By 1984, REITS began to grow again. Changes in the tax laws eliminated various tax
shelter provisions available to private owners and the national economic boom
stimulated demand for capital to support real estate development. As a result, the mid-
1980's was a period of rapid growth of REITS through both initial public offerings and by
secondary offerings from existing REITS. 4
By the late 1980's, a national real estate recession had affected all forms of real estate
ownership. Falling rents and occupancies coupled with rising expenses to eliminate
substantial real estate equity value. This real estate depression precipitated a liquidity
crisis for most owners of real estate. The liquidity problem was exacerbated by the
national crisis in financial institutions and their regulation. Essentially, the national
savings and loan structure dissolved and the banking and insurance industries withdrew
from financing new real estate development in order to re-capitalize their core
enterprises. During these years, many owners lost assets to foreclosure and institutional
owners experienced negative returns on their real estate investments. REITS
stagnated and declined in total capitalization.
After several years, the fundamental factors affecting real estate values began to
change. Even though fundamentals were favorable, few of the historical investors in
4 For a good overview of REIT history, see: REIT Fact Book: The REIT Concept, 1989, The National RealEstate Investment Trusts, Inc.
10
real estate (e.g. pension funds and insurance companies) had any appetite for more of
the asset "class" that had given them such indigestion for so many years. Since private
capital markets would not fund real estate, the public markets filled the void.5 Beginning
in 1992, the modern era of REITS was born. Over the next several years, private real
estate portfolios were transformed into public securities at a rapid rate. This
transformation was essential to creating some level of liquidity for real estate assets,
and represented the only capital alternative for many owners and developers. 6
Public capital sources infused REITS with cash at a time when national real estate
markets were having a once in a life time "garage sale". Aggressive REITS could
acquire properties that would yield returns much greater than their cost of funds. As a
result, the securities of these entities displayed dramatic gains. The gains were a
response to the significant value created by purchasing properties at a substantial
discount to their inherent value and attracted more investor interest in REIT securities.
Aggregate market capitalization of the REIT industry continued to grow rapidly until late
1997. Then, in 1998, REIT shares dropped in value dramatically when an international
financial crisis brought capital markets to the point of breaking. Those who purchased
REIT securities began to understand that the "low hanging fruit" had been picked.
Since that time, REITS have not enjoyed the comparatively low cost of capital that
fueled their early expansion. In addition, REIT securities have experienced substantial
5 Public markets had recently gained substantial experience with "securitization" of real estate assets as aresult of the savings and loan "crisis". That process essentially created the modem market forCommercial Mortgage Backed Securities (CMBS).6 Vandell, Kerry D., 1998, "Strategic Management of the Apartment Business in a 'Big REIT' World,"National Multifamily Housing.
11
value erosion due to the inability to generate spectacular returns from purchasing
assets at wholesale. As a result, the public capital markets essentially "red-lined" the
industry and REITS ceased to be active competitors to buy properties. During 1998 and
1999, REITS traded at values that represented a substantial discount to the "net asset
value" of their properties. 7
This recent history of volatility in the public markets' valuation of REITS contrasts
sharply with what purports to be a more steady (if modest) record of increasing values
for privately owned real estate. The different paths for aggregate returns on public and
private real estate imply that the price of liquidity is volatility in asset values. Only since
the start of the year 2000, have REITS begun to regain some of their lost value.
REITS and Portfolio Investing
REITS are now within the group of public market securities that are subject to analysis
similar to other securities. The analysis of financial assets and investments is a complex
undertaking. Resources of academia and industry are applied daily to determine where
to invest both individual and firm resources to achieve the best risk adjusted returns. At
the heart of this effort is the attempt to determine the "true" or "inherent" value of an
asset and compare that value with the current market price for the asset. Armed with
this knowledge, one might expect to make a few bucks.
7 "Net asset value" or NAV is a term of art intended to reflect the value of the firms' real estate holdings inthe private asset market. One may consider NAV as the value that would be described by a process oftraditional appraisal.
12

Real assets and financial assets are typically valued on the basis of the discounting of
current and expected future cash flows to determine a net present value. The
estimation of those cash flows and the selection of an appropriate discount rate depend
on countless assumptions. These assumptions are fundamentally grounded on various
macroeconomic factors that affect all entities and also on factors unique to each
particular entity. One articulation of the major categories of macroeconomic
assumptions is as follows:
· Yield spread (the return on the government long bond less the return on the 30-
day Treasury bills)
* Interest rate (change in Treasury bill return)
* Exchange rate (change in the value of the dollar relative to a "basket" of foreign
currencies)
* Real GNP (changes in forecasts of GNP)
* Inflation (changes in the forecast of inflation)
* Market (an adjustment factor embracing the portion of market return not
explained by the 5 macro factors) 8
Essentially, the function of capital markets is to apply the aggregate judgment about
such macroeconomic factors to the circumstances of individual assets (with regard for
their idiosyncratic characteristics) and generate a determination of present value. This
process is applied to individual assets initially. When groups of assets are combined
8 Elton, E. J., M.J. Gruber and J. Mei, "Cost of Capital Using Arbitrage Pricing Theory: A Case Study ofNine New York Utilities," Financial Markets, Institutions, and Instruments, (August 1994) 3, 46-73.
13

into a portfolio, the analysis moves to a higher level. The current approach at that
higher level is often summarized as "modern portfolio theory".
Modern portfolio theory is based on the assumption that there is a direct and
proportional relationship between risk and returns on investments and that the firm level
portion of those risks (i.e. the "idiosyncratic" risks) may be avoided by creation of a
diversified portfolio. Whatever risk remains after diversification is considered to be
"systematic". To attract investors to accept the non-diversifiable, systematic risks, there
must be some promise of a return in excess of that which can be obtained on a risk free
asset. Understanding the appropriate "risk premium" for an investment is the search for
the holy grail of finance. If one knows that premium, one can determine when an asset
is trading at a price that is either too high or too low with respect to the fundamental risk
of owning the asset. To determine that premium, financial theorists create models.
The capital asset pricing model (CAPM) is an early, popular expression of the relation of
risk and return and the consequences of that relationship for the determination of prices
for assets. Essentially, the CAPM assumes that a linear relationship exists between the
returns on an asset and market returns; the expected returns on assets (particularly
securities) within a particular universe are assumed to be a function of the asset's
"beta".9 According to the CAPM, a perfectly diversified portfolio will produce a return
that is given by the macroeconomic fundamentals that affect the value of all assets
(financial and real). The firm specific or idiosyncratic factors affecting returns are
diversified away in a perfectly diversified portfolio. These are the risks that the market
9 An asset's "beta" is determined by comparing the returns to the asset with returns to the overall market.
14
prices when it sets a "required" return for a particular security. The required returns
vary depending on the extent of risk (measured by a security's variance) and the
relation of the individual securities risk with the risk of the market portfolio (as measured
by covariance of the individual security with the market).
The problems with the CAPM in practice have been noted as including the following: it
assumes no transaction costs; it assumes that one can own a "market" portfolio, and it
assumes relatively perfect flow of information. Obviously, the assumptions of the CAPM
are not fulfilled in the real world. In addition, the empirical evidence supporting the
CAPM is not persuasive. 10 Accordingly, when structuring investment portfolios, it is
fair to assume that diversification of idiosyncratic risks is not completely possible.
A more recent explanation of the asset pricing behavior of markets is Arbitrage Pricing
Theory (APT). 11 APT asserts that a potentially infinite number of macroeconomic
factors (including, perhaps, market portfolio returns) operate to explain stock returns.
One study suggests that expected stock returns might be explained by the following
major variables in the economy: (1) changes in the expected inflation, (2) changes in
unexpected inflation, (3) unanticipated change in the term structure of interest rates, (4)
unanticipated change in the risk premium, and (5) the growth rate in industrial
production. 12 Presumably, commercial real estate is subject to the same factors. 13
o1 For a good summary of the past studies that question the CAPM see Chen, S., C. Hsieh, T.W. Vinesand S. Chiou, "Macroeconomic Variables, Firm-Specific Variables and Returns to REITS", Journal of RealEstate Research, (1998)1 Ross, S.A., "The Arbitrage Theory of Capital Asset Pricing", Journal of Economic Theory, 1976, 341-60.
12 Chen, N.F., R. Roll and S.A. Ross, "Economic Forces and the Stock Market", Journal of Business,1986, 59, 383-403.
15
One early study based on REIT data found that 60% of the variation in real estate
returns could be explained through macro economic factors (with nominal interest rates
accounting for 36% of returns). 14
Both the CAPM and APT endeavor to explain security pricing/valuation from the "top
down". Each refers to the view of the relation of a security return to the market portfolio
or to the macro economy. Essentially, both the CAPM and APT assume that
idiosyncratic risks of individual securities may be diversified away within a portfolio. The
remaining systematic risk affects investment returns and presumable is taken into
account by the market pricing mechanism. That mechanism determines the appropriate
risk premium for the components of the portfolio without taking separate account of firm
level factors.
The prior research of securities returns in general suggests that firm specific factors will
have some impact on relative risk adjusted returns and that the effect of these factors
may not be captured by a single factor such as beta or by macroeconomic factors
alone. In particular, it has been suggested that average stock returns over the last 50
years may not be explained by beta, once the factors of size and book to market equity
are considered.15 If the various forms of "top down" valuation are not fully capable of
capturing the impact of firm specific factors on security returns, then analysis of those
13 Ling, D. C. and A. Naranjo, "The Fundamental Determinants of Commercial Real Estate Returns", RealEstate Finance, Winter 1998,14 McCue, Thomas E. and John L. King, "Real Estate Returns and the Macroeconomy: Some EmpiricalEvidence from Real Estate Investment Trust Data, 1972-1991", The Journal of Real Estate Research,Vol. 9, No. 3 (Summer 1994)'5 Fama, E.F. and K.R. French, "The Cross-Section of Expected Stock Retums", Journal of Finance,1992.
16
factors may yield valuable insights. Identification of the firm level variables that affect
relative returns to securities can inform firm management of optimal choices for
allocation of its assets and structure of its liabilities. That information can also grant
investors better skill at forecasting market behavior.
This thesis acknowledges the contribution of "top down" approaches in valuing assets in
general or REITS in particular. However, this thesis elects to explore a "bottom up"
approach to valuation of REIT securities. This approach is based on firm specific
variables that are capable of being expressed in quantifiable terms. This firm level
inquiry is simply a different approach to attempting to understand the process of
valuation of real estate assets by the public markets. This different approach focuses
on the total returns not merely on equity returns. In doing so, this thesis attempts to
structure the analysis to remove the affects of the general market or the macroeconomic
factors.
It is axiomatic that macroeconomic factors materially impact the returns to all real
estate. The macro factors clearly affect REIT returns, but the factors are essentially
beyond the control of the REIT. In addition, macroeconomic factors are difficult to
quantify, ex ante, since they depend upon estimates and predictions about which there
is not unanimity of opinion. Finally, each REIT should experience the same impact of
these factors, though the response of the REIT return to the factors will not necessarily
be the same over time or across REITS. Firm level factors, however, are within the
17

control of the REIT and join with the effects of the general economy to provide the
inputs that are processed by the market in reaching a valuation of the REIT.
Basically, public markets pass judgment on the value of a REIT and its assets every
trading day. The judgment of the market is expressed in a trading price for its shares.
At the end of any period of time, one may sum up the market's judgment and calculate
the return to capital for the REIT. But, the answer of how well the REIT performed in
financial terms is merely a reflection of the markets judgment based on the aggregate of
factors that affect value. It does not disclose what firm level constituent elements, if
any, were relevant to that judgment after accounting for the general economy and
broader markets behavior. This thesis is a search for some of those variables.
18

Chapter Two: Previous Literature
Several papers have examined the complexity of evaluating returns of equity REITS. In
one article it was recognized that returns to equity REITS, though greatly influenced by
movements in the stock and bond markets, remained linked with the performance of the
underlying real estate assets. 16 The differences between reported returns for public
and private real estate were examined in another article and it was concluded that the
reported difference in public and private rates of real estate return was explained by the
fundamentally different valuation methods used in the two markets. 17
Several prior inquiries have been made into the factors affecting real estate returns in
general and into returns on REITS. For example, an examination was made to identify
factors in the overall economy that affect real estate returns.18 In addition, that work
recognized the existence of conditioning factors such as dividend yield and firm size
that were relevant to explaining the risk premium to real estate. Additional inquiry into
the firm level determinates of returns was reflected in an article that identifies the role of
16 Giliberto, S.Michael "Equity Real Estate Investment Trusts and Real Estate Returns," The Journal ofReal Estate Research, Vol. 5, Number 2 (Summer 1990).17 Giliberto, Michael and Anne Mengden, "REITS and Real Estate: Two Markets Reexamined," RealEstate Finance, Spring 1996.18 Ling, David C. and Andy Naranjo, "The Fundamental Determinants of Commercial Real EstateReturns," Real Estate Finance, Winter 1998.
19
several firm level factors in determining risk adjusted returns. 19 If fact the data analysis
of that work implied that 66% of the "excess" returns of REITS might be explained by
firm specific variables and that only 34% of "excess" returns is due to systematic risks.20
The firm level factors that were examined were: debt/equity, FFO payout, EBITDA, FFO
multiple, CAD multiple (cash flow adjusted for depreciation), size (market capitalization),
dividend yield, and percent insider equity. 21 The results indicated that only firm size
had a significant negative correlation with firm specific risk.
Several efforts have been made to identify the significance of such factors. One work
reported on a specific inquiry into equity REIT response to both macroeconomic factors
and firm specific variables. 22 The findings were based on equity REITS during the
period 1978-1994 and examined the firm specific variables of "size" and "book to market
equity". The authors reported that their analysis suggested rejection of the CAPM as
satisfactory explanation for variation of returns over the universe of equity REIT stocks
that were examined. There was a finding of significance of firm size in pricing of the
securities over time.
19 Litt, Jonathan, Jianping (J.P.) Mei, and the Paine Webber REIT Team, "A Risk Adjustment Model forREIT Evaluation," Real Estate Finance, Spring 1999.20 Excess returns are those that exceed the risk free rate and are required to compensate for non-diversifiable risks.21 FFO is funds from operations; EBITDA is earnings before income taxes, depreciation and amortization;CAD is cash flow adjusted for depreciation.22 Chen, Su-Jane, Chengho Hsieh, Timothy W. Vines, and Shur-Nuann Chiou, Macroeconomic Variables,Firm-Specific Variables and Returns to REITS," Journal of Real Estate Research, Vol. 16, No. 3, 1998.
20

More recently an examination was made concerning the impact of size and portfolio
diversity on performance. 23 The work suggested that though the CAPM may explain
time series returns to individual REITS, it would not explain cross-sectional average
returns. The work also concluded that geographic diversification and property type
specialization are related to cross-sectional average returns.
Each of the prior inquiries into firm level determinates of REIT performance was based
on equity returns and addressed a few independent firm level variables. This thesis is
an effort to examine "de-levered" results by focusing on total returns and expand the
number of factors that are subject to analysis. In addition, the data forming the basis for
this thesis covers a longer period of time than some previous studies and encompasses
periods of significant change in underlying macroeconomic factors as well as years of
significant volatility in both REIT securities and stocks in general. In that sense, this
thesis is a logical extension of the prior work of others and attempts to explore new
territory.
The first step in that exploration was to define a universe of firms to be the subject of
analysis. The general intent of this thesis is to examine securities that were issued by
equity REITS that represented a pool of underlying equity real estate assets. The
fundamental character of equity securities is identical to that of commercial real estate
that is privately held or owned by institutions. The underlying assets of each are equity
interests in "real property". Investments in real properties have theoretically unlimited
23 Chen, Jun and Richard Peiser, "The Risk and Return Characteristics of REITS 1993-1997," Real EstateFinance, Spring 1999.
21
upside potential and their downside risk is normally limited to the loss of the entire
investment. In addition, the same factors affect financial performance at the asset level
for both REITS and private owned realty. 24 The difference between the two is
grounded in the fact that REITS have their values determined by the public markets and
private real estate is valued, if at all, by private appraisal. In addition, the REITS have
an overlay of firm level characteristics that complicate the analysis of the valuation
process. In particular, REITS may have liabilities or assets at the firm level that are not
found at the asset level for privately owned realty. In order to examine those factors, a
specific methodology was applied. The next chapter describes that methodology in
detail.
24 "Location, location, location" and "buy low/sell high".
22

Chapter Three: Methodology
Introduction
A fundamental assumption of this thesis is that the return to capital invested in REITS is
a function of the risks of those investments and the potential rewards to those taking the
risks. The reward for risk taking is a return on the investment. The risks of the
investment are the sum total of all factors that impact the return. The equation for that
relationship is:
Return = c + * Xl + 2 * X2 + ... + n* Xn
Where return is the dependent variable, C is constant, 1, 132 ... 13n are coefficients, and
Xi, x2 ... xn are the independent variables. This equation is a theoretical construct that
expresses all the potential universe of factors that bear on the return to a particular
asset. Returns begin with an expected base rate and are adjusted based on additional
variables that affect the investment. The impact of each discrete factor is represented
by the coefficient of the factor and the sign of the coefficient gives the direction of the
impact. This basic relationship is the starting point for a search for determinates of
return.
For a particular real estate asset, the basic determinates of return would include
location, physical condition, agreed cash flows under a lease, the risk free interest rate,
23
growth of the national economy, local competition, and so forth. For REITS, this
equation would capture the cumulative impact of such asset level factors for each
property owned by the REIT. In addition, for REITS, the formula will capture the firm
level factors that operate in collaboration with the asset level variables. Obviously, no
one will ever articulate a comprehensive list of such factors. However, basic economic
and finance theory do permit major determinates of return to be identified and
examined.
Making an examination of determinates of return begins with the question: How does
one measure returns to an asset? In this regard, the primary measure of the reward to
an asset is the concept of aggregating the returns to the all components of the asset.
For individual real estate investments such as an apartment building or a warehouse,
this process involves summing up and discounting the past and expected future cash
flows for the items of income and expense and reaching a total. The total then is
compared to the invested capital and the result is a calculation of return. For securities
such as REITS the process involves looking at the entity level rather than the individual
assets.
The two primary elements that together constitute the total capitalization of the REIT are
equity and debt. The prototypical method for expressing combined returns for equity
and debt is the concept of "Weighted Average Cost of Capital" or "WACC". The formula
for WACC can be expressed as follows:
24
WACC = R a= {(DN) x R d} + {(EN) x R e}
Where R a is the return on the asset, R d is the return on the debt, R e is the return on
the equity, D is the value of the debt, E is the value of the equity and V is the value of
the asset (i.e. the sum of the debt and the equity). The basic concept of WACC forms
the starting point for examination of REIT returns and their determining factors.
In application to the historical data on REITS, the equity component of the basic WACC
formula must be decomposed to reflect the existence of preferred stock and "operating
partnership units" ("OPU's").25 Preferred stock is technically a form of equity, but it also
has characteristics of debt. As a practical matter, OPU's are the functional equivalent of
common shares. The data collected for this thesis includes the portion of firm
capitalization consisting of preferred stock and OPU's as well as the debt and common
shares.
Database
To study the firm level determinates of total return this thesis creates a database by
following a methodology that is composed of the following steps:
25 Issuance of OPU's in exchange for real estate assets is a means of acquiring real estate withoutcausing an immediate taxable event for the seller. OPU's are convertible to common shares of REITstock and have an equity ownership claim.
25

Step Description Data Source/Tool
Step 1 Identify major variables Discussions with industry
professionals and Thesis
Advisor
Step 2 Identify data sources SNL DataSource, Zephyr
Associates, Inc., and IDC
database (via FactSet)
Step 3 Querying Data Sources and Thesis SNL DataSource, Zephyr
Database Creation Associates, Inc., IDC
database (via FactSet),
Microsoft Excel
Step 4 Thesis Database Quality Check Bloomberg, Edgar,
FactSet, and a previous
thesis database
Step 5 Importing Data from Microsoft Microsoft Excel, E-Views
Excel to E-Views Software
Step 6 Establish Regression Analysis E-Views
Equations
These steps are described in this chapter. The following chapter reports and interprets
the results of the analysis performed in accordance with the above methodology.
26

Step 1: Identification of Major Variables for the Thesis Study. Prior to obtaining any
data, a list of major firm level variables was identified. The inquiry of this thesis involves
total returns, so it was necessary to obtain the annual total returns for all firms that are
the subject of this study. (Annual total returns are the dependent variable in the
analysis.) An extensive number of firm level independent variables were identified from
the balance sheet and the income statement. Following further consideration and
analysis, the final list of independent variables was refined to a study list that forms the
basis of the analysis. The entire list of variables obtained is set out in Appendix A.
The study list contains various balance sheet items including various asset and liability
categories, and one income statement item - dividend payout ratio. In addition non-firm
level data were gathered pertaining to the annual Standard and Poor's 500 (S & P)
index total returns and the average annual returns on 90-day U. S. Treasury bills (T-
bills). A summary of the study data is set out below:
Historical Data Period: 1990-1999
Dependent Variable: Total Return (as reflected by the ex post Weighted Average
Cost of Capital.)
Independent Variables: Classified as Group 1 and Group 2 based on whether the
variable is related to total assets excluding accumulated
depreciation or total assets including accumulated depreciation.
The list of variables in each group is as follows:
27
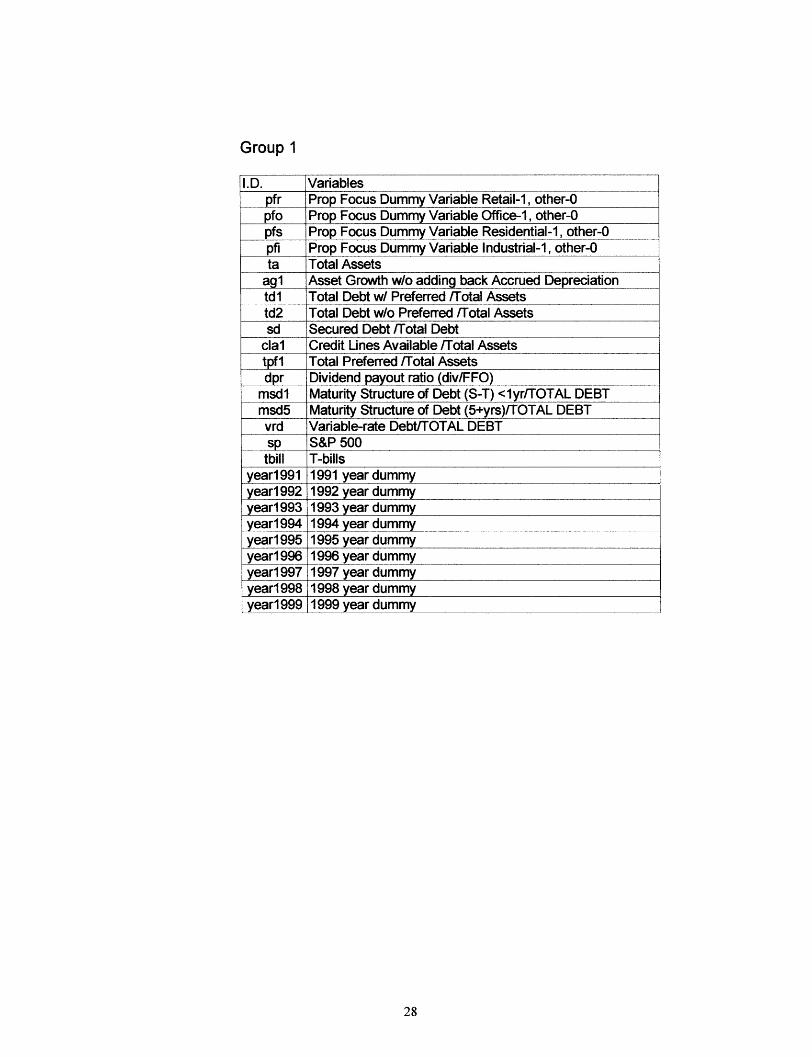
Group 1
I.D. Variablespfr Prop Focus Dummy Variable Retail-I, other-0pfo Prop Focus Dummy Variable Office-1, other-0pfs Prop Focus Dummy Variable Residential-I, other-0pfi Prop Focus Dummy Variable Industrial-1, other-0ta Total Assets
agl Asset Growth w/o adding back Accrued Depreciationtdl Total Debt w/ Preferred /Total Assetstd2 Total Debt w/o Preferred /Total Assetssd Secured Debt /Total Debt
clal Credit Lines Available /Total Assetstpfl Total Preferred /Total Assetsdpr Dividend payout ratio (div/FFO)
msdl Maturity Structure of Debt (S-T) <lyr/TOTAL DEBTmsd5 Maturity Structure of Debt (5+yrs)/TOTAL DEBTvrd Variable-rate Debt/TOTAL DEBTsp S&P 500tbill T-bills
year1991 1991 year dummyyear1992 1992 year dummyyear1993 1993 year dummyyear1994 1994 year dummyyear1995 1995 year dummyyear1996 1996 year dummyyear1997 1997 year dummyyear1998 1998 year dummyyear1999 1999 year dummy
28

Group 2
pfr Prop Focus Dummy Variable Retail-I, other-0pfo Prop Focus Dummy Variable Office-1, other-0pfs Prop Focus Dummy Variable Residential-I, other-0pfi Prop Focus Dummy Variable Industrial-1, other-0
taad Total Assets plus Accrued Depreciationag2 Asset Growth adding back Accrued Depreciationtdpl Total Debt w/ Preferred ITotal Assets plus Accrued Depreciationtdp2 Total Debt w/o Preferred ITotal Assets plus Accrued Depreciationsd Secured Debt /Total Debt
cla2 Credit Lines Available Total Assets plus Accrued Depreciationtpf2 Total Preferred /Total Assets plus Accrued Depreciationdpr Dividend payout ratio (div/FFO)
msdl Maturity Structure of Debt (S-T) <lyr/TOTAL DEBTmsd5 Maturity Structure of Debt (5+yrs)/TOTAL DEBTvrd Variable-rate Debt/TOTAL DEBTsp S&P 500
tbill T-billsyear1991 1991 year dummyyear1992 1992 year dummyyear1993 1993 year dummyyear1994 1994 year dummyyear1995 1995 year dummyyear1996 1996 year dummyyear1997 1997 year dummyyear1998 1998 year dummyyear1999 1999 year dummy
Step 2: Identification of Data Sources: Following discussions with industry
professionals and performance of preliminary data research, SNL DataSource was
identified as the major source for creation of the Thesis Database. The study focused
on public equity REITS tracked by SNL DataSource.
29
Other data sources that were identified include Zephyr Associates, Inc., and IDC
database (via FactSet - an interface software application). Appendix B contains a brief
description of data points within the Thesis Database and respective sources.
Step 3: Querving Data Sources and Thesis Database Creation: The next step involved
a query to the various data sources. The process included selecting specifications,
exporting data from the data sources to a Microsoft Excel workbook, setting up
formulas, and creating the Thesis Database using the spreadsheet application.
Further steps were undertaken to refine the aggregate database to arrive at the final
Thesis Database. The first adjustment involved identifying REITS asset type focus.
Next it was determined to exclude all REITS in the following categories:
· Mortgage (Primary assets are mortgages issued in connection with real estate.)
· Hybrid-(A mixed collection of mortgages and equity real estate holdings)
* Hospitality-(Focus on lodging and resort accommodations.)
* Health Care-(Own health care facilities)
* Corrections-(Own and lease prison facilities)
* Other non-standard focus-(Own timber lands subject to harvesting or antennas
that are rented to communications companies)
* Self-liquidating-(Those with a stated purpose of selling all assets and ceasing
operations.)
* REITS have disappeared due to merger or liquidation-(This limitation was
necessitated by the availability of data from the data base.)
30
* REITS that did not have REIT status for all of the study period (e.g. those that
operated as taxable entities for a substantial period of the study)
Elimination of the above categories of REITS resulted in a universe of entities that were
grouped by investment focus as follows: Office, Residential, Industrial, Retail, and
Other. 26 The "other" category includes: diversified/other, recreation, restaurant, and
self-storage. These groupings facilitate the creation of property focus dummy variables.
The above refinement resulted in 143 REITS included in the Thesis Database for each
year from 1990 to 1999. Although there were 143 REITS in the study group at the end
of 1999, many of the REITS did not exist during the entire study period. The major
years for addition of new REITS were the initial public offering boom of 1993-1994.
The following table illustrates the progressive increase in the number of REITS during
the study period from the base number of 46 in 1990:
26 The source of information for the categories of REITS was the SNL database as well as the REIThandbook. Determination of categories was made effective as of 1999 and was applied to all years ofdata within the study. No attempt was made to correct for changes of category over time. Such changesare not material in number or in absolute value based on the quantity of assets affected.
31

See Appendix C for a complete list of REITS and their stock ticker symbols. Appendix
D contains lists of REITS by property focus.
A second major adjustment to the data was done to create the dependent variable of
total return (WACC). Calculation of this variable was done as follows:
Ra,t= (Re,t x We,t) + (Rd,t X Wd,t) + (Rp,t X Wp,t)
Where
Re: ex post returns on common equity
Rd: ex post returns on debt
32
Year New Cumulative
REITS Total
1991 3 49
1992 2 51
1993 31 82
1994 31 113
1995 3 116
1996 4 120
1997 17 137
1998 6 143
1999 0 143

Rp: ex post returns on preferred equity
We: weight of equity expressed by percentage of average equity capitalization over
average total market capitalization
Wd: weight of debt expressed by percentage of average debt outstanding over
average total market capitalization
Wp: weight of preferred equity expressed by percentage of average preferred equity
capitalization over average total market capitalization
The three components of weighted average total return, including weighted returns of
common equity, weighted returns of debt, and weighted returns of preferred equity were
calculated as follows:
Common Equity:
Re,t = ((prpt-1)+dt)/pt-i
We,t = (Et/(Et+Dt+PPt)
Where:
Pt = stock price at year end t
pt-1= stock price at year end t-1
dt= total dividends in year t
Et= average total equity capitalization at year end t and at year end t-1
Dt= average total debt outstanding at year end t and at year end t-1
PPt= average total preferred equity capitalization year end t and at year end t-1
33
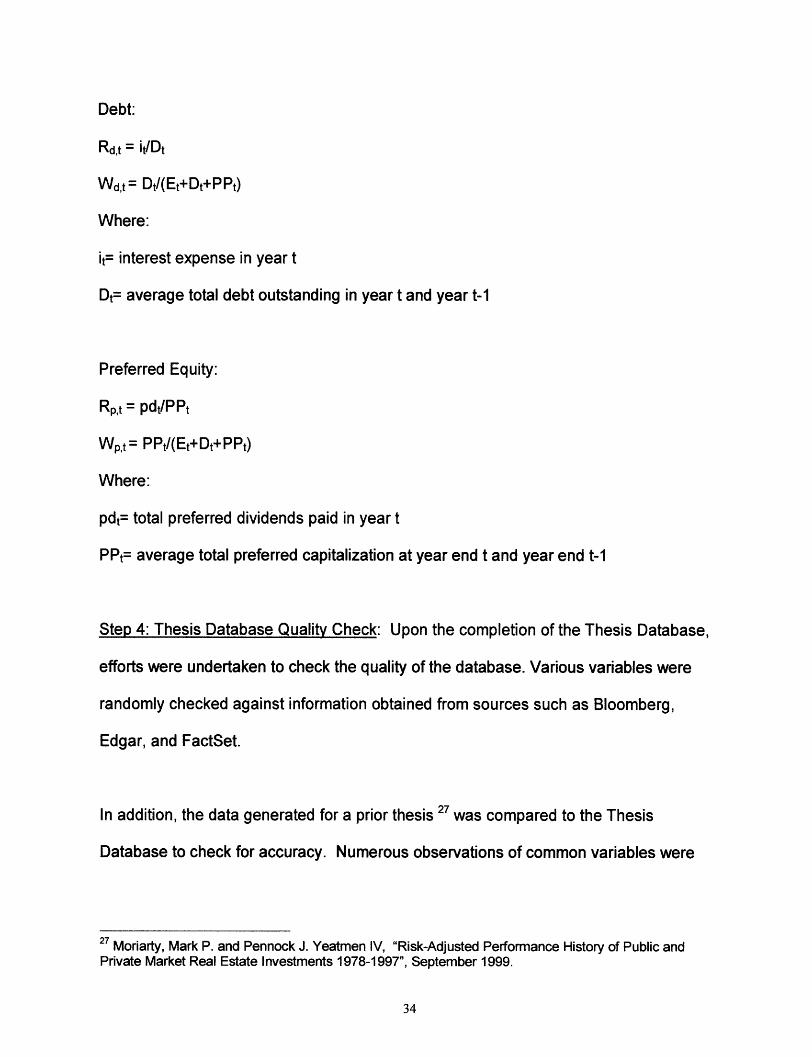
Debt:
Rd,t = it/Dt
Wd,t = Dt/(Et+Dt+P Pt)
Where:
it= interest expense in year t
Dt= average total debt outstanding in year t and year t-1
Preferred Equity:
Rp,t pdt/PPt
Wpt = PPt/(Et+Dt+PPt)
Where:
pdt= total preferred dividends paid in year t
PPt= average total preferred capitalization at year end t and year end t-1
Step 4: Thesis Database Quality Check: Upon the completion of the Thesis Database,
efforts were undertaken to check the quality of the database. Various variables were
randomly checked against information obtained from sources such as Bloomberg,
Edgar, and FactSet.
In addition, the data generated for a prior thesis 27 was compared to the Thesis
Database to check for accuracy. Numerous observations of common variables were
27 Moriarty, Mark P. and Pennock J. Yeatmen IV, "Risk-Adjusted Performance History of Public andPrivate Market Real Estate Investments 1978-1997", September 1999.
34
compared to validate the Thesis Database. After accounting for certain differences in
methodologies, the Thesis Database was determined to be reliable.
Step 5: Importing Data into the Statistical Software: The next step involved importing
the data from Microsoft Excel to an appropriate statistical software application. The
product that was selected is E-Views (version 3.1) 28. Towards this end, a separate
Excel worksheet was created to stack the cross section, time-series data according to
the years (1990-1999).
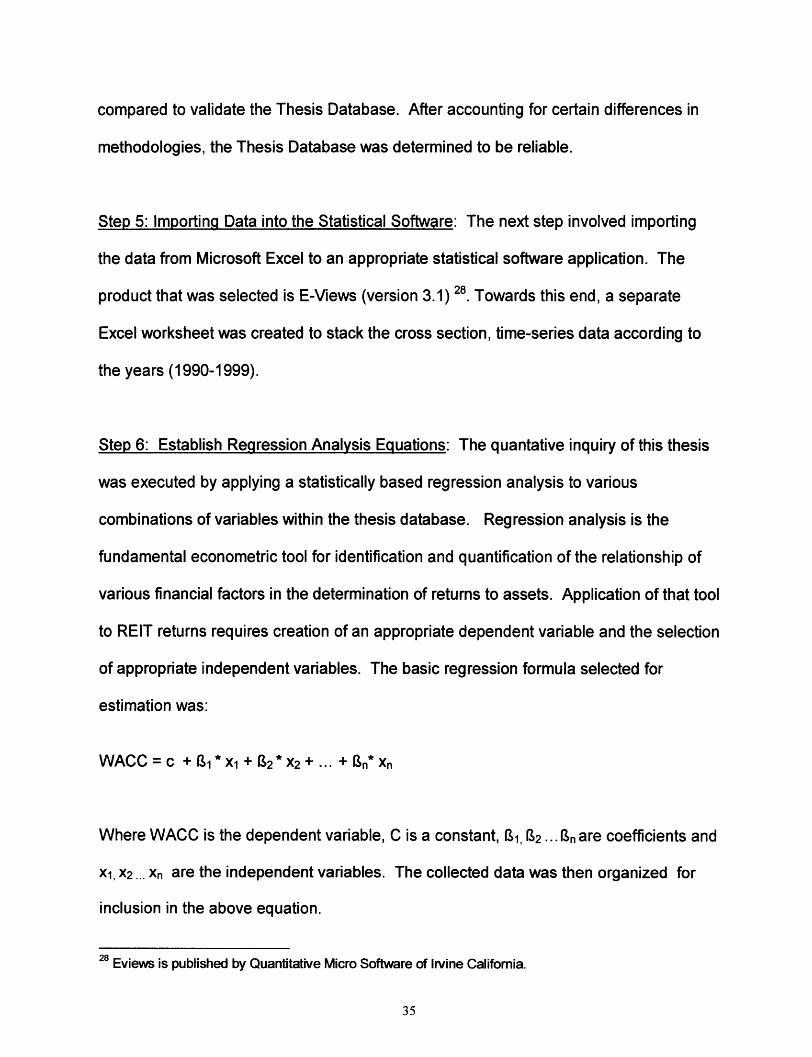
Step 6: Establish Regression Analysis Equations: The quantative inquiry of this thesis
was executed by applying a statistically based regression analysis to various
combinations of variables within the thesis database. Regression analysis is the
fundamental econometric tool for identification and quantification of the relationship of
various financial factors in the determination of returns to assets. Application of that tool
to REIT returns requires creation of an appropriate dependent variable and the selection
of appropriate independent variables. The basic regression formula selected for
estimation was:
WACC = c + 1 * xl + 2 * x 2 + ... + n* Xn
Where WACC is the dependent variable, C is a constant, 1, 132 ... 13n are coefficients and
x1, x2 ... xn are the independent variables. The collected data was then organized for
inclusion in the above equation.
28 Eviews is published by Quantitative Micro Software of Irvine California.
35
The data contained in the Thesis Database were segregated into the two basic groups
described above in step 1. The primary distinction between the groups was the
presence or absence of accumulated depreciation in the capitalization of the REIT. 29
Within each group, property focus dummy variables were added to identify four major
categories of real estate held. Use of property focus dummy variables acts as a risk
control and should eliminate bias in the results due to property focus. Dummy variables
were also set up for each year from 1991 to 1999. Finally, the two data groups were
applied to the dependent variable to test for the presence of a statistically significant
relationship between WACC and those firm specific independent variables within each
group.
The regression analysis was conducted in three basic scenarios. In the first scenario,
the independent variables were applied with the addition of year effect dummy
variables. Use of year dummy variables is intended to adjust the equation results to
isolate the impact of macroeconomic factors. In the second scenario, the independent
variables were used without year dummies but with variables that reflect the total annual
return of the Standard & Poor's 500 Index (S & P) and the 90-day rate on U.S. Treasury
Bills (T-bill) during each of the years of the sample period. Adding the annual returns
for the S & P index and T-bill rates should adjust the regression results to isolate the
29 Depreciation is an accounting concept that is relevant for a number of purposes such as taxation andreporting of income for financial purposes. When one attempts to determine the value of an asset, addingin the depreciation to the "book" value of the asset allows more of an "apples to apples" comparison ofasset values across REITS.
36
impact on returns that is attributable to general market returns. The third scenario was
conducted without any attempt to adjust for macroeconomic factors or market behavior.
Following creation of the variable groups and regression scenarios, regression
equations were estimated for the various relationships of WACC and independent
variables. The estimated equations were structured to eliminate variables within either
group that produced a singular matrix as a result of highly correlated independent
variables. The refined groups of variables were then applied to the different scenarios.
Application of the revised regression formulas to the variables within the Thesis
Database produced various regression results. Results were obtained for all REITS
within the scope of the study as well as for subgroups of REITS based on property
focus. In addition, various different sample time periods were examined. The
regression outputs were considered to be significant if the "t-stat" for a coefficient had
an absolute value of over 1.96 (i.e. significance at a 95% confidence interval). The
following chapter contains the regression outputs and interprets those outputs in light of
the character and history of REITS.
37
Chapter Four: Results and Interpretation
Regression Results
The results and analysis of regressions conducted for all REITS are set in this chapter.
Three basic scenarios were run for all REITS. Each includes dummy variables for
property focus and a common collection of individual variables. The first regression
scenario also includes the year effect dummy variables. The second regression
includes market variables for the historical total returns of the S & P and 90-day T-bill
rate. The third excludes both year dummy variables and market variables. An analysis
and interpretation of the results follows the three regression outputs. 30
30 The regressions for the Group 2 variables produced substantially similar results to those reported forthe Group 1 variables. Detailed regression outputs for Group 2 variables are omitted so as to avoidredundancy.
38
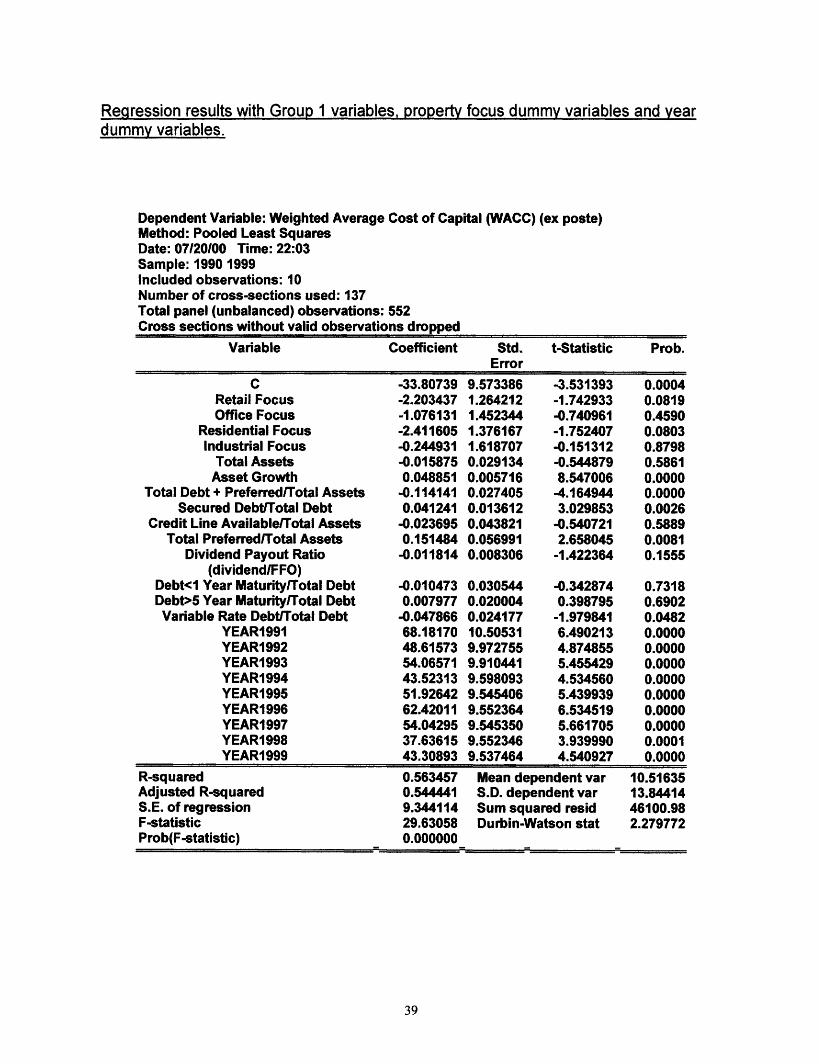
Regression results with Group 1 variables, property focus dummy variables and yeardummy variables.
Dependent Variable: Weighted Average Cost of Capital (WACC) (ex poste)Method: Pooled Least SquaresDate: 07120100 Time: 22:03Sample: 1990 1999Included observations: 10Number of cross-sections used: 137Total panel (unbalanced) observations: 552Cross sections without valid observations dropped
Variable Coefficient Std. t-Statistic Prob.Error
C -33.80739 9.573386 -3.531393 0.0004Retail Focus -2.203437 1.264212 -1.742933 0.0819Office Focus -1.076131 1.452344 -0.740961 0.4590
Residential Focus -2.411605 1.376167 -1.752407 0.0803Industrial Focus -0.244931 1.618707 -0.151312 0.8798
Total Assets -0.015875 0.029134 -0.544879 0.5861Asset Growth 0.048851 0.005716 8.547006 0.0000
Total Debt + Preferred/Total Assets .0.114141 0.027405 -4.164944 0.0000Secured Debt/Total Debt 0.041241 0.013612 3.029853 0.0026
Credit Line Available/Total Assets -0.023695 0.043821 -0.540721 0.5889Total Preferred/Total Assets 0.151484 0.056991 2.658045 0.0081
Dividend Payout Ratio -0.011814 0.008306 -1.422364 0.1555(dividend/FFO)
Debt<1 Year Maturity/Total Debt -0.010473 0.030544 -0.342874 0.7318Debt>5 Year Maturity/Total Debt 0.007977 0.020004 0.398795 0.6902Variable Rate Debt/Total Debt -0.047866 0.024177 -1.979841 0.0482
YEAR1991 68.18170 10.50531 6.490213 0.0000YEAR1992 48.61573 9.972755 4.874855 0.0000YEAR1993 54.06571 9.910441 5.455429 0.0000YEAR1994 43.52313 9.598093 4.534560 0.0000YEAR1995 51.92642 9.545406 5.439939 0.0000YEAR1996 62.42011 9.552364 6.534519 0.0000YEAR1997 54.04295 9.545350 5.661705 0.0000YEAR1998 37.63615 9.552346 3.939990 0.0001YEAR1999 43.30893 9.537464 4.540927 0.0000
R-squared 0.563457 Mean dependent var 10.51635Adjusted R-squared 0.544441 S.D. dependent var 13.84414S.E. of regression 9.344114 Sum squared resid 46100.98F-statistic 29.63058 Durbin-Watson stat 2.279772Prob(F-statistic) 0.000000
,,,~~~~~~~~~~~~~ , , ,,
39

Regression results with Group 1 Variables, property focus dummy variables andvariables for the annual total returns of the S & P and T-bills
Dependent Variable: Weighted Average Cost of Capital (WACC) (ex poste)Method: Pooled Least SquaresDate: 07/20100 Time: 22:12Sample: 1990 1999Included observations: 10Number of cross-sections used: 137Total panel (unbalanced) observations: 552Cross sections without valid observations dropped
Variable Coefficient Std. t-Statistic Prob.Error
C -5.730537 7.440453 -0.770187 0.4415Retail Focus -1.008423 1.658792 -0.607926 0.5435Office Focus -2.270149 1.899258 -1.195282 0.2325
Residential Focus -3.065796 1.800471 -1.702774 0.0892Industrial Focus -0.501500 2.116331 -0.236967 0.8128
Total Assets -0.110567 0.036904 -2.996097 0.0029Asset Growth 0.054289 0.007175 7.566105 0.0000
Total Debt + Preferred/Total Assets -0.176311 0.034978 -5.040599 0.0000Secured Debt/Total Debt 0.045026 0.017763 2.534842 0.0115
Credit Line Available/Total Assets -0.038661 0.056741 -0.681351 0.4959Total Preferred/Total Assets 0.115241 0.074646 1.543818 0.1232
Dividend Payout Ratio (dividendlFFO) -0.010989 0.010890 -1.009079 0.3134Debt<1 Year Maturity/Total Debt -0.030823 0.039608 -0.778193 0.4368Debt>5 Year Maturity/Total Debt 0.036347 0.026156 1.389606 0.1652
Variable Rate Debt/Total Debt -0.079958 0.031525 -2.536331 0.0115S&P 500 Index -0.029065 0.092360 -0.314686 0.7531
90 Day T-bill rate 4.940850 1.689646 2.924193 0.0036R-squared 0.233705 Mean dependent var 10.51635Adjusted R-squared 0.210787 S.D. dependent var 13.84414S.E. of regression 12.29880 Sum squared resid 80924.41F-statistic 10.19776 Durbin-Watson stat 2.152992Prob(F-statistic) 0.000000
,~~~~~~~~~~~~~~~ , , , , _ ,,
40
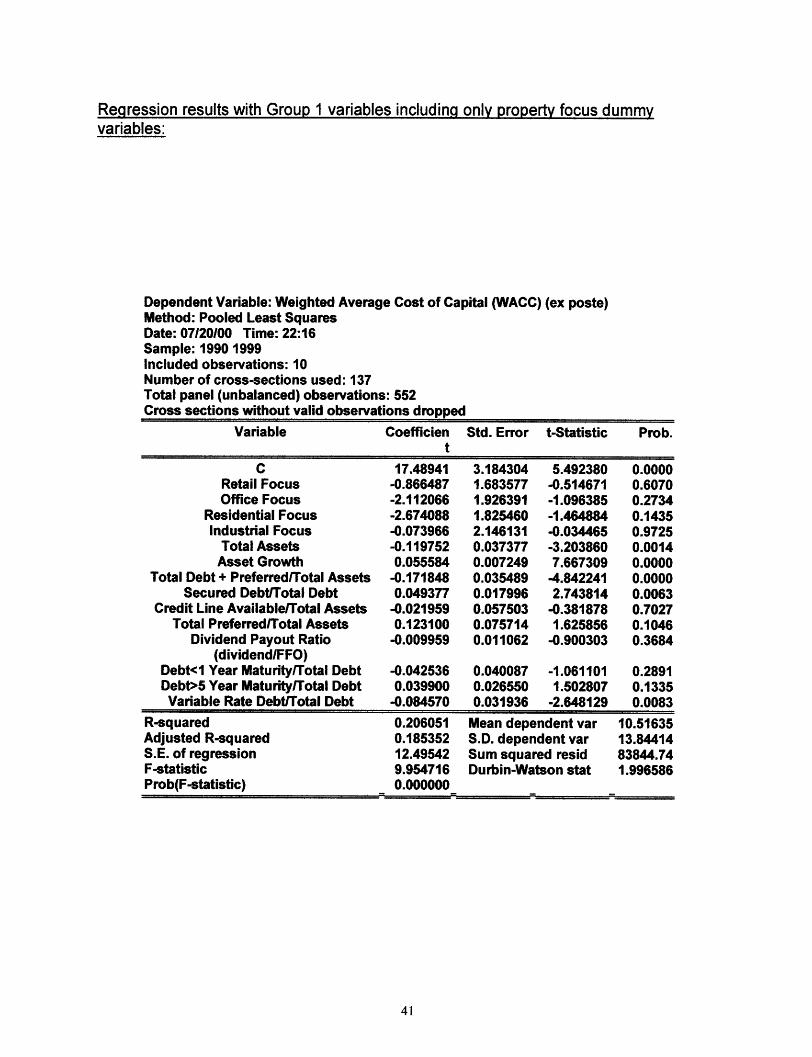
Regression results with Group 1 variables including only property focus dummyvariables:
Dependent Variable: Weighted Average Cost of Capital (WACC) (ex poste)Method: Pooled Least SquaresDate: 07/20100 Time: 22:16Sample: 1990 1999Included observations: 10Number of cross-sections used: 137Total panel (unbalanced) observations: 552Cross sections without valid observations dropped
Variable Coefficien Std. Error t-Statistic Prob.t
C 17.48941 3.184304 5.492380 0.0000Retail Focus -0.866487 1.683577 -0.514671 0.6070Office Focus -2.112066 1.926391 -1.096385 0.2734
Residential Focus -2.674088 1.825460 -1.464884 0.1435Industrial Focus -0.073966 2.146131 -0.034465 0.9725
Total Assets -0.119752 0.037377 -3.203860 0.0014Asset Growth 0.055584 0.007249 7.667309 0.0000
Total Debt + Preferred/Total Assets -0.171848 0.035489 -4.842241 0.0000Secured DebtlTotal Debt 0.049377 0.017996 2.743814 0.0063
Credit Line Available/Total Assets -0.021959 0.057503 -0.381878 0.7027Total Preferred/Total Assets 0.123100 0.075714 1.625856 0.1046
Dividend Payout Ratio -0.009959 0.011062 -0.900303 0.3684(dividend/FFO)
Debt<1 Year Maturity/Total Debt -0.042536 0.040087 -1.061101 0.2891Debt>5 Year Maturity/Total Debt 0.039900 0.026550 1.502807 0.1335Variable Rate Debt/Total Debt -0.084570 0.031936 -2.648129 0.0083
R-squared 0.206051 Mean dependent var 10.51635Adjusted R-squared 0.185352 S.D. dependent var 13.84414S.E. of regression 12.49542 Sum squared resid 83844.74F-statistic 9.954716 Durbin-Watson stat 1.996586Prob(F-statistic) 0.000000
41
Findings and Interpretation
The observations expressed in the above regression outputs may be summarized in a
series of findings. Significant independent variables may have a positive or negative
relationship with total returns. Findings are considered statistically significant at 95%
confidence level if the absolute value reported "t-stat" for the independent variable
exceeds 1.96.
Based on the findings, it is possible to suggest a number of interpretations about the
verdict that the market process has rendered about various firm level factors displayed
by the REITS. The findings and interpretations for all REITS are discussed below.
Findings and interpretations for regressions on pools of REITS based on property focus
are set out following the all REITS discussion. The interpretations of the results are
suggestions based on the nature of the independent variable and its most probable
relevance on the markets judgment of appropriate return to capital. Basically, the
interpretations are an effort to ascribe meaning and rationale to the markets action and
its consequences.
All REITS (with year dummy variables):
Findings: For all REITS, when returns are considered along with property focus and
year dummy variables, the results of the regression reflect a positive impact to returns
attributed to: (i) increasing growth of total firm assets, (ii) increasing proportion of
42

secured debt to total debt, and (iii) increasing ratio of total preferred stock to total
assets. Negative impacts to returns are associated with: (i) increasing magnitude of
total debt (including preferred) to total assets, (ii) increasing share of short-term debt as
a portion of total debt, and (iii) increasing share of variable rate debt as a portion of total
debt.
Interpretation of positive variables:
Asset growth. The consistent contribution to returns based on increasing asset growth
can be attributed to the ability of acquisitive REITS to obtain bargains in the real estate
property market. In addition, growth of the asset base allows for some firm level
economy of scale for organizational level expenses. REITS have in some cases
increased their size by merger with other REITS as well as by engaging in development
opportunities. Capacity to grow by either method is an endorsement of the strategy of
the REIT and brings the reward of higher returns.
Secured debt. The positive impact of secured debt is interesting to note especially in
view of the negative impact of total debt. The most obvious explanation for that result is
that high levels of secured debt may be highly correlated with lower total debt. If that is
the case, then rewarding high relative levels of secured debt is simply the mirror image
of penalizing high levels of total debt.
43

An additional explanation can be based on the differences between secured and
unsecured debt. First, secured debt is typically underwritten based on asset level
fundamentals. The borrower may strategically default on secured debt on an asset-by-
asset basis. This default option has value for the REIT even if the asset is currently
worth more that the amount of the debt.31 Also, secured debt typically exhibits
substantially longer durations than unsecured debt. Creation of secured debt normally
involves transactions costs higher than those of unsecured debt.
Due to these differences, secured debt is part of the long-term capitalization of a REIT.
Unsecured debt is part of a shorter-term capital strategy and is often an interim form of
financing used to fund acquisitions until an equity issuance is possible. The presence of
high levels of unsecured debt represents a peril for returns because of interest rate risk
if the debt must be refinanced in an environment of rising interest rates. In addition,
there is the potential for dilution of existing equity holders if shares must be sold to fund
the payment of the debt. Finally represents a potential claim on all firm assets and thus
there is no option to strategically default on selected assets.
Total Preferred. The positive impact of increasing levels of preferred stock can be
explained by considering the distinctions between preferred stock and debt. If the firm
experiences financial distress, it has greater flexibility to protect cash flows by
suspending payment of preferred dividends. Suspension of preferred dividend
payments is not a default, while failure to pay interest on debt is a default. This
31 In a sense, this option value is analogous to a put or call option on a stock that trades for some valueeven when it is well "out of the money". The major difference with secured debt default options is theirquite lengthy option period (i.e. until the debt is finally due and payable.)
44

increased flexibility accounts for higher returns since the firm is able to pursue valuable
opportunities with a more flexible capital structure.
Interpretation of negative variables.
Total debt with preferred. The negative impact of total debt plus preferred as a
percentage of total assets reflects the markets judgment that the costs of financial
distress outweighing the benefits of leverage. This is particularly true for REITS since
the tax shield of the deductibility of interest expense is not applicable. In addition, the
higher debt levels impair a REITS ability to be opportunistic. Finally, a review of recent
REIT history discloses that the market penalized firms that continued to acquire assets
after the buyers market of the early 1990's came to an end. High debt levels likely
coincide with firms that made purchases that did not yield a positive net present value.
Such purchases were often justified by the short-term "accretive" nature of acquisitions
made when share prices were very high. Over time, the markets punished such ill-
advised purchases and returns fell. (A similar interpretation would apply to the variable
for total debt without preferred.)
Short-term debt. The penalty to returns based on increasing levels of short-term debt
indicates that the costs of interest rate risk and refinancing risk outweigh the benefits of
leverage. Higher short-term debt levels may also be indicia of the inability of the firm to
obtain favorable secured financing and the inability to issue equity at satisfactory prices.
45
Variable debt. Variable rate debt poses the risk of increasing interest rates and the
resulting uncertainty to cash flows. Penalization of returns based on this variable is
likely in view of the reduced ability of the firm to exploit opportunities and the increased
exposure to rising interest rates.
All REITS (with factors for the S&P and T-bills)
Findings: For all REITS, when variables for the annual total returns of the S & P and T-
bills are included in the regression equation, the results indicate consistent positive
impacts on returns for the following variables: (i) asset growth, (ii) secured debt as a
share of total debt and (iii) increasing T-bill rates. Negative impacts were (i) total
assets, (ii) total debt (with preferred) as a share of total assets, and (iii) variable rate
debt as a share of total debt.
Interpretation of positive variables:
Asset growth and Secured Debt: The explanations for these variables would be the
same as those above for the regressions conducted with year dummy variables.
T-bills. The positive impact on returns for rising T-bill rates is of particular interest since
it is often assumed that rising interest rates are a negative to returns because of the
increasing discount rate for cash flows. This is certainly the case for most securities,
especially the ones with relatively high debt levels or significant amounts of short-term
46

debt or variable rate debt. Increasing interest expense and higher discount rates
negatively impact values and returns. Real estate held by REITS is a durable asset that
hedges against inflation. As such, increasing interest rates can positively impact REIT
returns for both market reasons and for reasons associated with the nature of the asset.
When security markets generally are negatively impacted by rising interest rates, REITS
represent a "safe haven" for capital. Sector rotation of capital into REITS during periods
of rising rates can offset the otherwise negative effect on returns. At the asset level,
rising rates retard development of new properties and reduce the risk of overbuilding. 32
This reduction of risk to future rents and occupancy levels of existing assets may well
offset the incremental increase in the rate at which those future cash flows are
discounted. In addition, if rising short-term rates are a sign of inflation, then the inflation
hedging potential of real estate also works to overcome the increase in the rate at which
potential cash flows are discounted.
Interpretation of Negative Variables:
Total assets: The negative impact of increasing total assets evidences a penalty for
large size and implies that the "small firm" effect observed in broader markets also
exists among REITS. The adverse impact of size may relate to the impact of
institutional investor behavior. Past studies have indicated that the preference of
institutional investors for larger capitalization securities coupled with the tendency to buy
32 Uncertainty of future supply is a major risk factor for all real estate.
47

or sell "en mass" would explain the potential for extreme behavior of prices. 33 In view
of the last several years of falling REIT prices, this institutional investor impact probably
explains a portion of this result. In addition, on a more fundamental level, lower returns
for size are logical since greater diversification and potential economies of scale reduce
firm risk.
Variable rate debt and total debt. The interpretation of these factors is the same as set
out above for regressions performed with year dummies.
All REITS (without year dummies, S & P or T-bill)
Findings: The findings for all REITS (without year dummies or S & P index and T-bill
factors) indicate that positive impacts on returns are: (i) asset growth rate, and (ii)
secured debt as a percentage of total debt. Negative impacts were observed for (i) total
assets, (ii) total debt, and (iii) increasing share of variable rate debt.
Interpretation: The interpretation of the above findings is the same as set out above for
the other scenarios.
All REITS (with S & P index and T-bill rates) by sample ranges.
33 Graff, Richard A. and Michael S. Young, "Institutional Investor Impact on Equity REIT Performance",Real Estate Finance, Vol. 14, No. 3, Fall 1997, pp. 31-39.
48
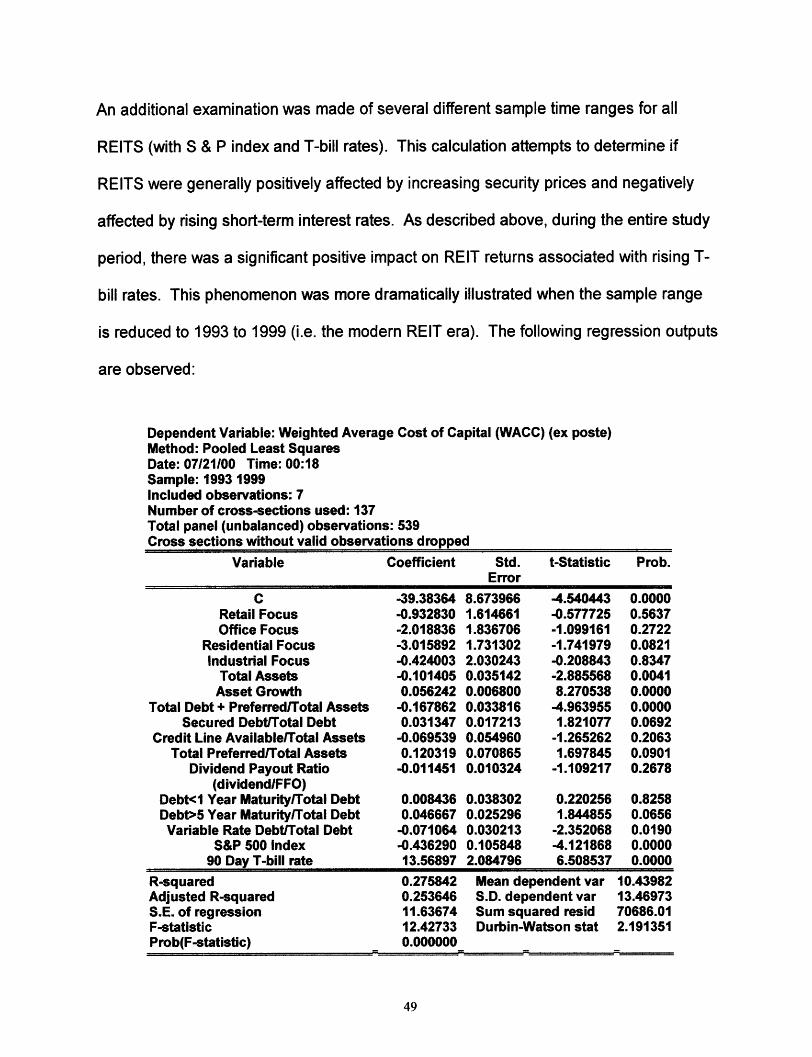
An additional examination was made of several different sample time ranges for all
REITS (with S & P index and T-bill rates). This calculation attempts to determine if
REITS were generally positively affected by increasing security prices and negatively
affected by rising short-term interest rates. As described above, during the entire study
period, there was a significant positive impact on REIT returns associated with rising T-
bill rates. This phenomenon was more dramatically illustrated when the sample range
is reduced to 1993 to 1999 (i.e. the modern REIT era). The following regression outputs
are observed:
Dependent Variable: Weighted Average Cost of Capital (WACC) (ex poste)Method: Pooled Least SquaresDate: 07/21/00 Time: 00:18Sample: 1993 1999Included observations: 7Number of cross-sections used: 137Total panel (unbalanced) observations: 539Cross sections without valid observations dropped
Variable Coefficient Std. t-Statistic Prob.Error
C -39.38364 8.673966 -4.540443 0.0000Retail Focus -0.932830 1.614661 -0.577725 0.5637Office Focus -2.018836 1.836706 -1.099161 0.2722
Residential Focus -3.015892 1.731302 -1.741979 0.0821Industrial Focus -0.424003 2.030243 -0.208843 0.8347
Total Assets -0.101405 0.035142 -2.885568 0.0041Asset Growth 0.056242 0.006800 8.270538 0.0000
Total Debt + Preferred/Total Assets -0.167862 0.033816 -4.963955 0.0000Secured Debt/Total Debt 0.031347 0.017213 1.821077 0.0692
Credit Line Available/Total Assets -0.069539 0.054960 -1.265262 0.2063Total Preferred/Total Assets 0.120319 0.070865 1.697845 0.0901
Dividend Payout Ratio -0.011451 0.010324 -1.109217 0.2678(dividend/FFO)
Debt<1 Year Maturity/Total Debt 0.008436 0.038302 0.220256 0.8258Debt>5 Year Maturity/Total Debt 0.046667 0.025296 1.844855 0.0656Variable Rate Debt/Total Debt -0.071064 0.030213 -2.352068 0.0190
S&P 500 Index -0.436290 0.105848 -4.121868 0.000090 Day T-bill rate 13.56897 2.084796 6.508537 0.0000
R-squared 0.275842 Mean dependent var 10.43982Adjusted R-squared 0.253646 S.D. dependent var 13.46973S.E. of regression 11.63674 Sum squared resid 70686.01F-statistic 12.42733 Durbin-Watson stat 2.191351Prob(F-statistic) 0.000000
49
Findings: The above sample range reflects a very significant negative impact on returns
associated with increases in the broad index for securities markets. A positive impact of
increasing treasure bill rates is also present.
Interpretation: The above findings represent a distinct excursion from the normal
expected relationship of securities to the general market. It would seem that the
explanation is grounded in the fact that, although REITS are securities in a legal sense,
their returns are driven by how REITS capture the underlying fundamentals for the real
estate markets. During the period from 1993 to 1999, REITS initially earned superior
returns, but beginning in late 1997, REITS experienced significant losses in market
value. The resulting diminished returns were experienced during a period of
extraordinary growth in values of other securities. Essentially, REITS were a sector that
was distinctly disfavored by the broader public capital markets. This counter cyclical
behavior is reflected in the above regression and is solid proof that REITS are very
different from ordinary securities. This difference is currently reflected by REIT shares
trading at what most analysts consider to be substantial discounts from the value of the
underlying properties on the private market. At the end of 1999, the public markets
rendered a very pessimistic valuation on REIT securities.
50
REITS by property focus
The above analysis is based on regression results for all REITS. Similar regressions
were performed on subgroups of REITS that were selected according to property type
focus. The groups of independent variables were the same as described in the
preceding section for all REITS. Results were consistent with the results for all REITS.
There were not as many significant variables for each property type, but the trends were
substantially the same. Detailed regression outputs are omitted.
Findings and interpretation. A review of the results for the pools created based on the
concentration of investment in particular property types discloses substantial
consistency with the results of the analysis of all REITS. In almost every group of
variables and scenario of analysis the data imply the same judgment with respect to firm
size, growth rate, and debt. In each instance the negative or positive impact of those
factors is the same as for all REITS as a group. Though results for each scenario or
group, do not uniformly disclose significant impact from identical variables, the trends
are consistent.
Potential Bias
The data used to produce the above results have several aspects that may bias the
regression outputs. First, it should be noted that the data do not include observations
51
for firms that were ceased operation for any reason prior to 1999. The limits of available
data preclude the consideration of firms that merged, failed or surrendered REIT status.
As a result, there may be a survivor bias. Another potential for bias is that the WACC
calculation for each year is based on a firm's average weight of debt, preferred and
equity during that year. The average is based on the prior year-end values for debt,
preferred and equity and the current year-end values for those items. Most independent
variables are based on year-end data for the year under consideration and do not
involve averaging with the prior years values. Finally, the period of the study excludes
all REIT history prior to 1990. This limits the applicability of the findings to the "modern"
REIT era with its particular macroeconomic and market characteristics.
52

Chapter Five: Conclusions
Basic Interpretation
By examining the last 10 years of data reflecting equity REITS returns, it seems clear
that the public markets have rendered judgment on a number of matters. In so doing,
the markets have determined the value of REITS in a process that takes into account all
possible factors. That process is a substantial departure from the classical asset
appraisal process even though both are certainly grounded in the fundamental notion of
discounting cash flows. The markets determination of value is expressed by its ex post
expression of rates of return on capital for individual REITS. The returns are impacted
positively or negatively depending on the differences among the REITS. After adjusting
for macroeconomic variables and for the effects of the general market, it appears that
various firm level variables have a significant impact on total returns to capital. Those
significant factors fall into the general categories of debt, size, and growth.
Debt. The major factor that impacts returns negatively is a high level of debt. In
addition, firms that have shorter duration debt or variable rate debt experience negative
impacts. The rather obvious implication of these results is that the market punishes
REITS with a leveraged capital structure. Though preferred stock operates like debt,
53

markets reward higher levels of preferred stock in the capital structure. This indicates
that rewards in returns are given for having a more flexible "debt" structure.
Why the penalty for debt? A review of the recent history of REITS discloses that great
shareholder value was achieved by acting quickly to take advantage of opportunities in
the asset market. Essentially, REITS functioned as "dealers" and provided liquidity in
an illiquid market. If that opportunity arose again, REITS with high debt levels would be
impaired from maximizing returns. In addition, high debt levels restrict the opportunity
for the REIT to repurchase its own shares when to do so would be advantageous.
Finally, significant amounts of debt are probably correlated with those REITS that
continued high levels of acquisitions after the time to buy had ended. For all of these
reasons, REITS with relatively higher debt levels have earned lower returns.
Size. Larger REITS have lower returns. This result is quite likely related to the lower
risk of diversification by size. In addition, the behavior of institutional investors will
disproportionately impact larger REITS; during the last few years of "depression" in the
REIT sector, large firms experience the downside of that relationship.
Growth. The market rewards asset growth. Firms grow by indirect and direct acquisition
of assets. Direct acquisitions took place during much of the study period. As indicated
in the history section of chapter one, there was a period of extraordinarily successful
buying. Those firms that bought the most bargains were rewarded with higher returns.
In addition, many firms grew by merger with smaller REITS and the market seems to
54
have rewarded these firms as well. These rewards may reflect both certain economies
of scale and the superior management skills of the acquiring firms.
Implications. REITS may achieve better returns by avoiding debt and growing the asset
base. This traditional wisdom is validated by empirical analysis of the historical data for
REITS during the decade of the 1990's.
Further Inquiries
As mentioned earlier in this thesis, there are a theoretically unlimited number of firm
level variables that might be considered in a search for factors that significantly affect
the returns to REITS. A number of major balance sheet factors have been captured
and examined in this thesis. There remain several categories of firm level variables that
can be subject to analysis. These factors include those generally grouped under the
category of "governance", the participation of a REIT in development activity, and the
quality of a REITS ability to communicate with investors (primarily the institutional
investment community).34 Each of these components differs dramatically at the firm
level and doubtlessly affects returns.
Governance. Governance issues with respect to REITS include the matters related to
management compensation, conflicts of interest, the independence of boards of
34 The authors are indebted to Mr. Fred Carr of the Penobscot Group for his articulation of these items asreflecting the current consensus among REIT advisors as to qualitative determinates of relativeperformance.
55
directors, and features affecting mergers and acquisitions.35 Though one might attempt
to define governance and conflict issues in mathematical terms, this thesis does not
attempt that undertaking. 36 A logical extension of this inquiry would be the addition of
governance factors into the groups of variables forming the basis for a regression.
Development. Development activities are an interesting component of the REIT
industry. Classical theory states that the REITS are less than ideally suited to develop
property. The cash demands of development conflict with the payout requirements to
retain REIT status. In addition, the asset holding requirements applicable to REITS
preclude them from becoming merchant builders. The entrepraneural skills essential to
development differ greatly from the more custodial expertise appropriate to managing
existing assets. Finally, the cyclical nature of development makes it difficult for a REIT
to maintain continuity of its development staff over market cycles. Based on these
factors one would expect REITS to avoid development activities unless to do so would
capture some opportunities. Some research indicates that higher returns do exist for
REITS that develop but that risk-adjusted returns are not enhanced.37 Further
examination of the relation of development activity to firm level returns is indicated.
35 For an excellent summary of the factors affecting governance see: Sagalyn, Lynne B., "Conflicts ofInterest in the Structure of REITS", Real Estate Finance, (Summer 1996). Also see: Sirmans, C.F."Research on Corporate Governance", Real Estate Finance (Fall 1997).36 For such an inquiry, see: Friday, H. Swint, "The control and Pricing of Agency Costs in Real EstateInvestment Trusts, Two Essays", Unpublished dissertation, Florida State University, 1997.
37Brounen, D., P.M.A. Eichholtz, and P.M. Kanters, "The effects of Property Development Activities on thePerformance of REITS", Real Estate Finance, Winter 2000.
56

Communications. Information frictions and personal relationships are clearly important
to investment analysis and performance. For REITS in particular, those who
communicate with the investor relations professionals of the various firms often note the
importance of communication quality. Communications with firms take place on a
person-to-person basis (e.g. the analyst's phone call to the CFO) and on a broader
basis such as press releases and websites. Large investors, in particular, often
consider the quality of those communications in determining whether buy or sell a REIT
stock. Good communication fosters credibility and poor communication does the
opposite. Though a quantification of communication quality is an interesting problem,
some sort of inquiry into this factor seems appropriate.
Final Thoughts
REITS are an interesting hybrid of real property assets with the firm level financial and
organizational features. As publicly traded securities, equity REITS are judged daily on
the value of this collective enterprise. Those judgments consider both macroeconomic
factors and firm level factors. Investors often attempt to diversify portfolios to eliminate
firm level risk, but a fully diversified market portfolio is probably unattainable. This is
particularly true in the relatively small universe of public equity REITS. Thus, firm level
factors continue to merit inquiry and consideration by investors and REIT managers.
Data on return to capital for equity REITS from 1990-1999 indicate that negative
impacts to returns include: increasing firm size, increasing levels of debt and reduced
57
debt flexibility. Positive impacts on returns were observed in firms with more rapid
growth of assets and more flexible debt structure. During recent years, REITS have
performed counter-cyclically with broader markets and continue to represent an inflation
hedge.
Investors should consider these factors when they make choices in the structuring of an
investment portfolio. Those responsible for managing REITS, if they are listening to the
markets, should grow their asset base, reduce their debt, and be prepared to
repurchase shares or liquidate assets if the market continues to say there is no current
need for a "dealer" network and that real estate is more valuable on Main Street than on
Wall Street.
58
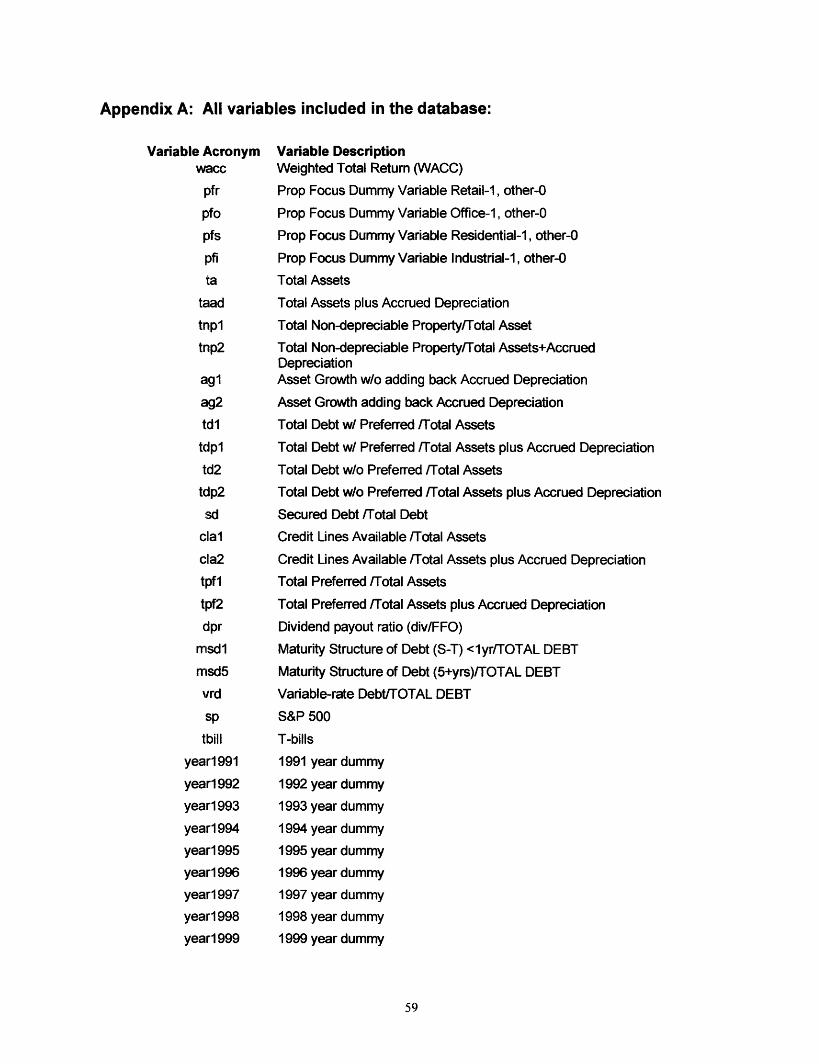
Appendix A: All variables included in the database:
Variable Acronymwacc
pfr
pfopfs
pfita
taadtnpltnp2
aglag2tdl
tdpltd2
tdp2sd
clalcla2tpf1tpf2dpr
msdlmsd5vrdsp
tbillyearl 991year1992year1993year1994year1995year1 996year1997year1998year1999
Variable DescriptionWeighted Total Retum (WACC)Prop Focus Dummy Variable Retail-1, other-0Prop Focus Dummy Variable Office-1, other-0Prop Focus Dummy Variable Residential-I, other-0Prop Focus Dummy Variable Industrial-1, other-0Total AssetsTotal Assets plus Accrued DepreciationTotal Non-depreciable Property/Total AssetTotal Non-depreciable Property/Total Assets+AccruedDepreciationAsset Growth w/o adding back Accrued DepreciationAsset Growth adding back Accrued DepreciationTotal Debt w/ Preferred ITotal AssetsTotal Debt w/ Preferred /Total Assets plus Accrued DepreciationTotal Debt w/o Preferred /Total AssetsTotal Debt w/o Preferred /Total Assets plus Accrued DepreciationSecured Debt /Total DebtCredit Lines Available /Total AssetsCredit Lines Available /Total Assets plus Accrued DepreciationTotal Preferred /Total AssetsTotal Preferred /Total Assets plus Accrued DepreciationDividend payout ratio (div/FFO)Maturity Structure of Debt (S-T) <lyr/TOTAL DEBTMaturity Structure of Debt (5+yrs)/TOTAL DEBTVariable-rate Debt/TOTAL DEBTS&P 500T-bills1991 year dummy1992 year dummy1993 year dummy1994 year dummy1995 year dummy1996 year dummy1997 year dummy1998 year dummy1999 year dummy
59

Appendix B: All data points and respective sources.
Data Item Source Notes
Company Name SNL DataSource
Ticker SNL DataSource
Year of IPO SNL DataSource
Total Debt SNL DataSource
UPREIT Market Capitalization (common+OP) SNL DataSource
Preferred Equity SNL DataSource
Redeemable Preferred SNL DataSource
Trust Preferred SNL DataSource
Total Preferred Thesis Formula
TOTAL CAPITALIZATION (excluding other mezzanine items) Thesis Formula
Previous Year - Total Debt SNL DataSource
Previous Year - UPREIT Market Capitalization (common+OP) SNL DataSource
Previous Year - Preferred Equity SNL DataSourcePrevious Year - Redeemable Preferred SNL DataSource
Previous Year - Trust Preferred SNL DataSource
Previous Year - Total Preferred Thesis Formula
Previous Year - TOTAL CAPITALIZATION (excluding other mezzanine items)Thesis Formula
Average Total Debt Thesis Formula
Average Total UPREIT Market Cap (Common+OP) Thesis Formula
Average Total Preferred Thesis Formula
Average Total Cap (excluding other mezzanine items) Thesis Formula
Interest Expense SNL DataSource
Avg Debt Return Thesis Formula
Avg Total Debt/ Avg Total Cap Thesis Formula
Weighted Debt Return Thesis Formula
Equity Total Return (common+OP) FactSet Data
Avg UPREIT Market Cap / Average Total Cap (common+OP) Thesis Formula
Weighted Equity Return (common+OP) Thesis FormulaPreferred Dividend SNL DataSource
Avg Preferred Return Thesis Formula
Avg Total Preferred/Avg Total Cap Thesis FormulaWeighted Preferred Return Thesis FormulaWeighted Total Return (WACC) Thesis Formula
60
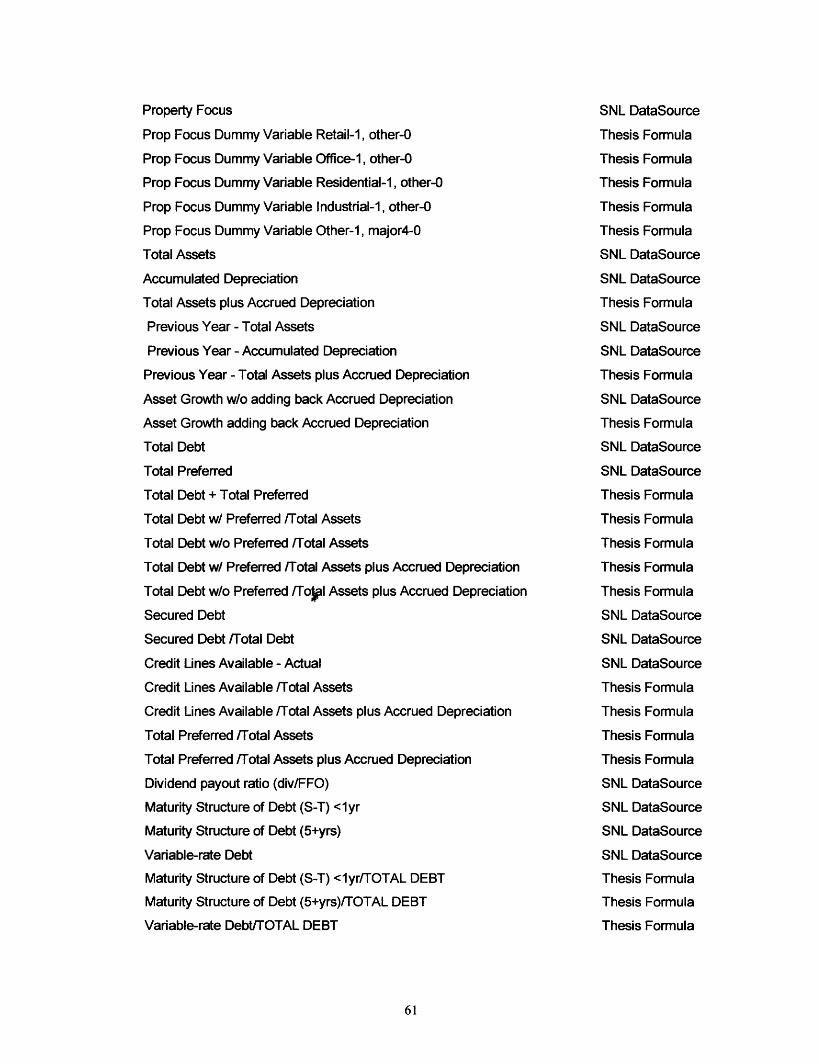
Property Focus
Prop Focus Dummy Variable Retail-I, other-0
Prop Focus Dummy Variable Office-1, other-0
Prop Focus Dummy Variable Residential-I, other-0
Prop Focus Dummy Variable Industrial-1, other-0
Prop Focus Dummy Variable Other-1, major4-0
Total Assets
Accumulated Depreciation
Total Assets plus Accrued Depreciation
Previous Year - Total Assets
Previous Year - Accumulated Depreciation
Previous Year - Total Assets plus Accrued Depreciation
Asset Growth w/o adding back Accrued Depreciation
Asset Growth adding back Accrued Depreciation
Total Debt
Total Preferred
Total Debt + Total Preferred
Total Debt w/ Preferred /Total Assets
Total Debt w/o Preferred /Total Assets
Total Debt w/ Preferred /Total Assets plus Accrued Depreciation
Total Debt wlo Preferred /Tool Assets plus Accrued Depreciation
Secured Debt
Secured Debt /Total Debt
Credit Lines Available - Actual
Credit Lines Available /Total Assets
Credit Lines Available /Total Assets plus Accrued Depreciation
Total Preferred /Total Assets
Total Preferred /Total Assets plus Accrued Depreciation
Dividend payout ratio (div/FFO)
Maturity Structure of Debt (S-T) <1yr
Maturity Structure of Debt (5+yrs)
Variable-rate Debt
Maturity Structure of Debt (S-T) <lyr/TOTAL DEBT
Maturity Structure of Debt (5+yrs)/TOTAL DEBT
Variable-rate Debt/TOTAL DEBT
SNL DataSource
Thesis Formula
Thesis Formula
Thesis Formula
Thesis Formula
Thesis Formula
SNL DataSource
SNL DataSource
Thesis Formula
SNL DataSource
SNL DataSource
Thesis Formula
SNL DataSource
Thesis Formula
SNL DataSource
SNL DataSource
Thesis Formula
Thesis Formula
Thesis Formula
Thesis Formula
Thesis Formula
SNL DataSource
SNL DataSource
SNL DataSource
Thesis Formula
Thesis Formula
Thesis Formula
Thesis Formula
SNL DataSource
SNL DataSource
SNL DataSource
SNL DataSource
Thesis Formula
Thesis Formula
Thesis Formula
61

Appendix C: All REITS within the database.
Company Name TickerAcadia Realty Trust AKRAegis Realty, Inc. AERAgree Realty Corporation ADCAlexandria Real Estate Equities, Inc. AREAMB Property Corporation AMBAmerican Industrial Properties REIT INDAmeriVest Properties Inc. AMVAMLI Residential Properties Trust AMLApartment Investment and Management Company AIVArchstone Communities Trust ASNArden Realty Inc. ARIAsset Investors Corporation AICAssociated Estates Realty Corporation AECAvalonBay Communities Inc. AVBBanyan Strategic Realty Trust BSRTSBedford Property Investors, Inc. BEDBNP Residential Properties, Inc. BNPBoston Properties, Inc. BXPBradley Real Estate, Inc. BTRBrandywine Realty Trust BDNBRE Properties, Inc. BREBurnham Pacific Properties, Inc. BPPCabot Industrial Trust CTRCamden Property Trust CPTCapital Automotive REIT CARSCaptec Net Lease Realty, Inc. CRRRCarrAmerica Realty Corporation CRECBL & Associates Properties, Inc. CBLCenterPoint Properties Trust CNTCenterTrust, Inc. CTACharles E. Smith Residential Realty, Inc. SRWChateau Communities, Inc. CPJChelsea GCA Realty, Inc. CCGColonial Properties Trust CLPCommercial Assets Inc. CAXCommercial Net Lease Realty, Inc. NNN
62

Cornerstone Properties, Inc. CPPCornerstone Realty Income Trust Inc. TCRCorporate Office Properties Trust OFC
Cousins Properties Incorporated CUZCrescent Real Estate Equities Company CEICrown American Realty Trust CWNDevelopers Diversified Realty Corporation DDRDuke-Weeks Realty Corporation DREEastGroup Properties, Inc. EGPEntertainment Properties Trust EPREquity Office Properties Trust EOPEquity One, Inc. EQYEquity Residential Properties Trust EQREssex Property Trust, Inc. ESSFederal Realty Investment Trust FRTFirst Industrial Realty Trust, Inc. FRFirst Union Real Estate Equity and Mortgage Invts. FURFirst Washington Realty Trust, Inc. FRWFranchise Finance Corporation of America FFAGables Residential Trust GBP
General Growth Properties, Inc. GGPGlenborough Realty Trust Incorporated GLBGlimcher Realty Trust GRTGolf Trust of America, Inc. GTAGreat Lakes REIT, Inc. GLGrove Property Trust GVEHighwoods Properties, Inc. HIWHMG/Courtland Properties, Inc. HMGHome Properties of New York, Inc. HMEHorizon Group Properties, Inc. HGPIHRPT Properties Trust HRPIncome Opportunity Realty Investors, Inc. IOTInvestors Real Estate Trust IRETSIRT Property Company IRTJDN Realty Corporation JDNJP Realty, Inc. JPRKeystone Property Trust KTRKilroy Realty Corporation KRC
63

Kimco Realty Corporation KIMKoger Equity, Inc. KEKonover Property Trust, Inc. KPTKranzco Realty Trust KRTLexington Corporate Properties Trust LXPLiberty Property Trust LRYMacerich Company MACMack-Cali Realty Corporation CLIMalan Realty Investors, Inc. MALManufactured Home Communities, Inc. MHCMaxus Realty Trust, Inc. MRTIMGI Properties MGIMid-America Apartment Communities, Inc. MAAMid-Atlantic Realty Trust MRRMills Corporation MLSMission West Properties, Inc MSWMonmouth Real Estate Investment Corporation MNRTANational Golf Properties, Inc. TEENew Plan Excel Realty Trust NXLOne Liberty Properties, Inc. OLPPacific Gulf Properties, Inc. PAGPan Pacific Retail Properties, Inc. PNPParkway Properties, Inc. PKYPennsylvania Real Estate Investment Trust PEIPhilips International Realty Corporation PHRPMC Commercial Trust PCCPost Properties, Inc. PPSPrentiss Properties Trust PPPrice Enterprises, Inc. PRENPrime Group Realty Trust PGEPrime Retail, Inc. PRTProLogis Trust PLDPS Business Parks, Inc. PSBPublic Storage, Inc. PSARamco-Gershenson Properties Trust RPTRealty Income Corporation OReckson Associates Realty Corporation RARegency Realty Corporation REG
64
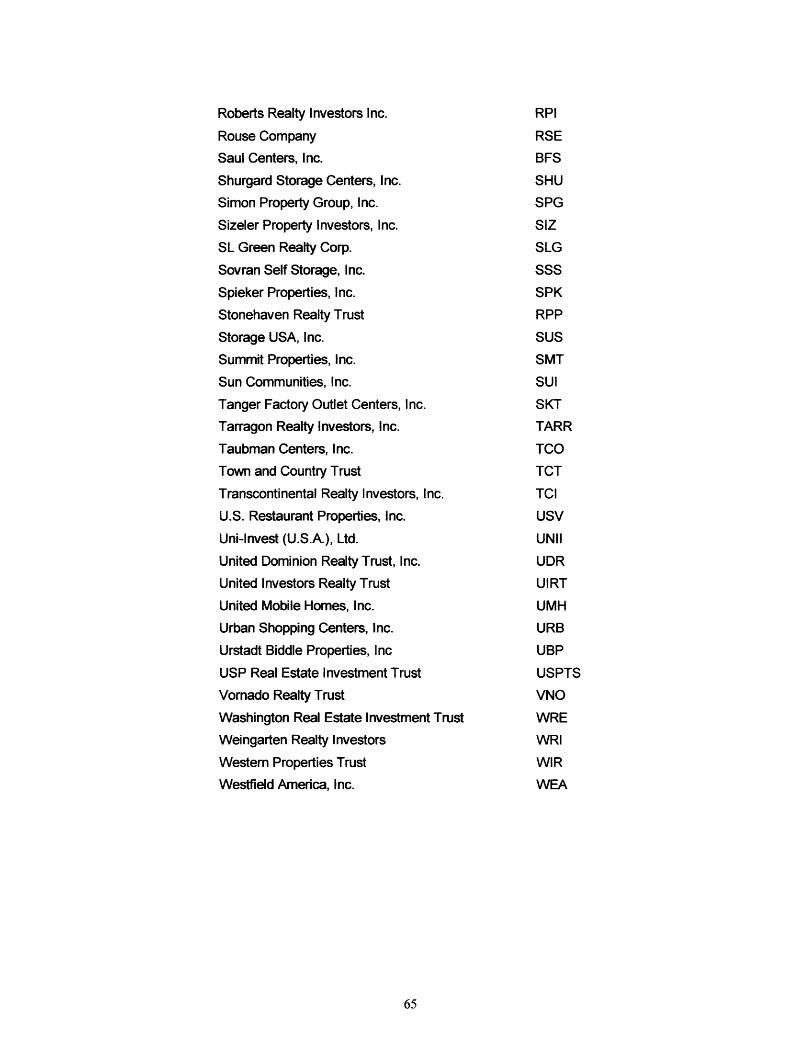
Roberts Realty Investors Inc. RPIRouse Company RSESaul Centers, Inc. BFSShurgard Storage Centers, Inc. SHUSimon Property Group, Inc. SPGSizeler Property Investors, Inc. SIZSL Green Realty Corp. SLGSovran Self Storage, Inc. SSSSpieker Properties, nc. SPKStonehaven Realty Trust RPPStorage USA, Inc. SUSSummit Properties, Inc. SMTSun Communities, Inc. SUITanger Factory Outlet Centers, Inc. SKTTarragon Realty Investors, Inc. TARRTaubman Centers, Inc. TCOTown and Country Trust TCTTranscontinental Realty Investors, Inc. TCIU.S. Restaurant Properties, Inc. USVUni-lnvest (U.S.A.), Ltd. UNIIUnited Dominion Realty Trust, Inc. UDRUnited Investors Realty Trust UIRTUnited Mobile Homes, Inc. UMHUrban Shopping Centers, Inc. URBUrstadt Biddle Properties, Inc UBPUSP Real Estate Investment Trust USPTSVornado Realty Trust VNOWashington Real Estate Investment Trust WREWeingarten Realty Investors WRIWestern Properties Trust WIRWestfield America, Inc. WEA
65

Appendix D: REITS by property focus:
Office REITS:
Company Name TickerAlexandria Real Estate Equities, Inc. AREAmeriVest Properties Inc. AMV
Arden Realty Inc. ARIBedford Property Investors, Inc. BED
Boston Properties, Inc. BXPBrandywine Realty Trust BDNCarrAmerica Realty Corporation CRECornerstone Properties, Inc. CPPCorporate Office Properties Trust OFCCrescent Real Estate Equities Company CEIDuke-Weeks Realty Corporation DRE
Equity Office Properties Trust EOPGreat Lakes REIT, Inc. GLHighwoods Properties, Inc. HIW
HRPT Properties Trust HRPKilroy Realty Corporation KRCKoger Equity, Inc. KEMack-Cali Realty Corporation CLIParkway Properties, Inc. PKYPrentiss Properties Trust PPPrime Group Realty Trust PGE
SL Green Realty Corp. SLGSpieker Properties, Inc. SPKUni-lnvest (U.S.A.), Ltd. UNII
66

Appendix D:
Residential REITS:
Company Name TickerAMLI Residential Properties Trust AMLApartment Investment and Management Company AIVArchstone Communities Trust ASNAsset Investors Corporation AICAssociated Estates Realty Corporation AECAvalonBay Communities Inc. AVBBNP Residential Properties, Inc. BNPBRE Properties, Inc. BRECamden Property Trust CPTCharles E. Smith Residential Realty, Inc. SRWChateau Communities, Inc. CPJCommercial Assets Inc. CAX
Cornerstone Realty Income Trust Inc. TCREquity Residential Properties Trust EQREssex Property Trust, Inc. ESSGables Residential Trust GBP
Grove Property Trust GVEHome Properties of New York, Inc. HMEInvestors Real Estate Trust IRETSManufactured Home Communities, Inc. MHCMid-America Apartment Communities, Inc. MAAPost Properties, Inc. PPSRoberts Realty Investors Inc. RPIStonehaven Realty Trust RPPSummit Properties, Inc. SMTSun Communities, Inc. SUITarragon Realty Investors, Inc. TARRTown and Country Trust TCTUnited Dominion Realty Trust, Inc. UDRUnited Mobile Homes, Inc. UMH
67
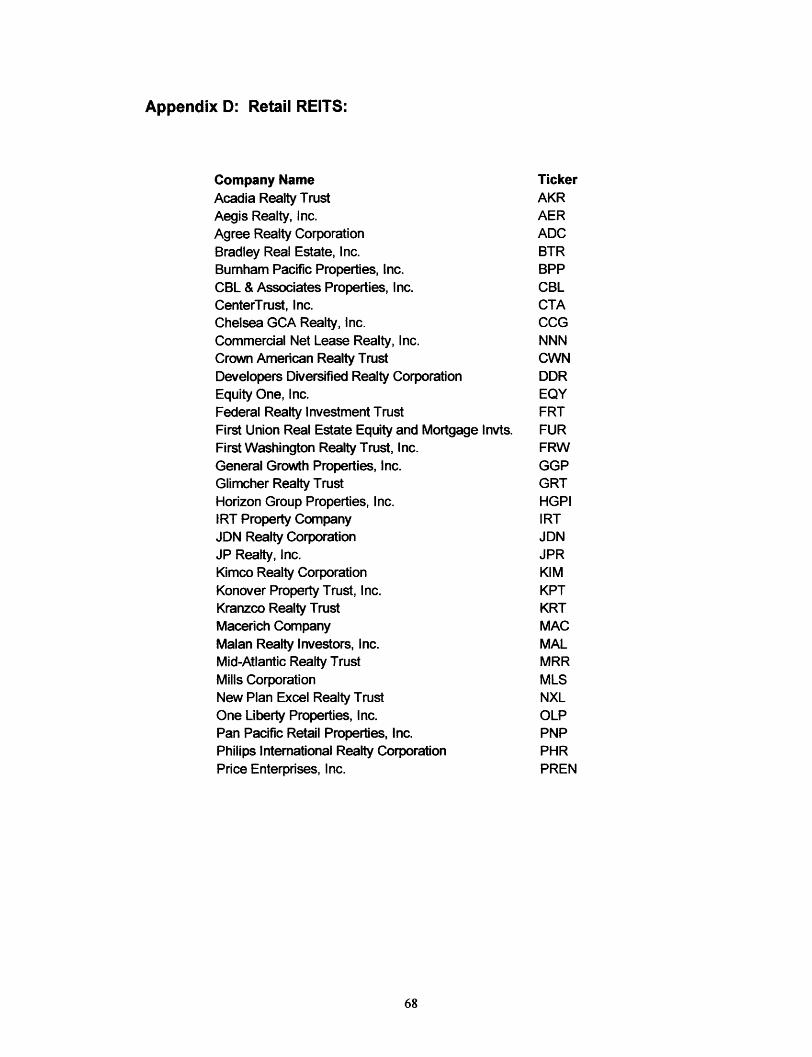
Appendix D: Retail REITS:
Company Name TickerAcadia Realty Trust AKRAegis Realty, Inc. AERAgree Realty Corporation ADCBradley Real Estate, Inc. BTRBurnham Pacific Properties, Inc. BPPCBL & Associates Properties, Inc. CBLCenterTrust, Inc. CTAChelsea GCA Realty, Inc. CCGCommercial Net Lease Realty, Inc. NNNCrown American Realty Trust CWNDevelopers Diversified Realty Corporation DDREquity One, Inc. EQYFederal Realty Investment Trust FRTFirst Union Real Estate Equity and Mortgage Invts. FURFirst Washington Realty Trust, Inc. FRWGeneral Growth Properties, Inc. GGPGlimcher Realty Trust GRTHorizon Group Properties, Inc. HGPIIRT Property Company IRTJDN Realty Corporation JDNJP Realty, Inc. JPRKimco Realty Corporation KIMKonover Property Trust, Inc. KPTKranzco Realty Trust KRTMacerich Company MACMalan Realty Investors, Inc. MALMid-Atlantic Realty Trust MRRMills Corporation MLSNew Plan Excel Realty Trust NXLOne Liberty Properties, Inc. OLPPan Pacific Retail Properties, Inc. PNPPhilips International Realty Corporation PHRPrice Enterprises, Inc. PREN
68
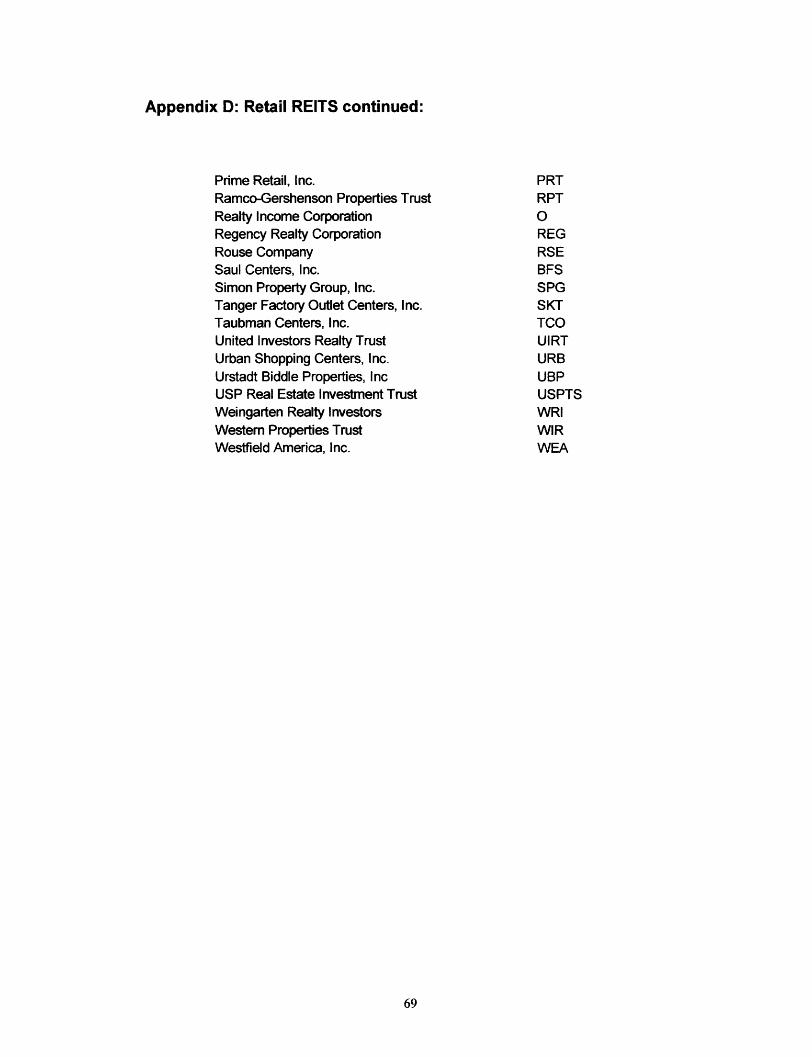
Appendix D: Retail REITS continued:
Prime Retail, Inc. PRTRamco-Gershenson Properties Trust RPTRealty Income Corporation ORegency Realty Corporation REGRouse Company RSESaul Centers, Inc. BFSSimon Property Group, Inc. SPGTanger Factory Outlet Centers, Inc. SKTTaubman Centers, Inc. TCOUnited Investors Realty Trust UIRTUrban Shopping Centers, Inc. URBUrstadt Biddle Properties, Inc UBPUSP Real Estate Investment Trust USPTSWeingarten Realty Investors WRIWestem Properties Trust WIRWestfield America, Inc. WEA
69

Appendix D: Industrial REITS:
Company Name TickerAMB Property Corporation AMBAmerican Industrial Properties REIT INDCabot Industrial Trust CTRCenterPoint Properties Trust CNTEastGroup Properties, Inc. EGPFirst Industrial Realty Trust, Inc. FRKeystone Property Trust KTRLiberty Property Trust LRYMaxus Realty Trust, Inc. MRTIMission West Properties, Inc MSWMonmouth Real Estate Investment Corporation MNRTAPacific Gulf Properties, Inc. PAGProLogis Trust PLDReckson Associates Realty Corporation RA
70
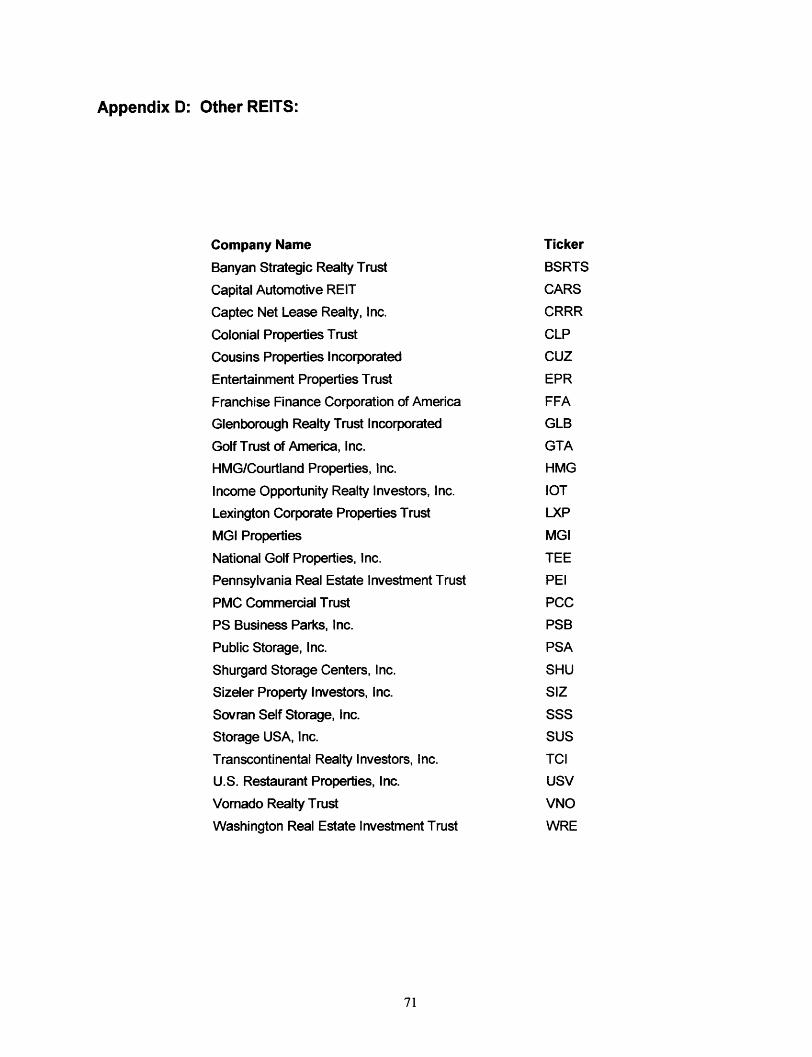
Appendix D: Other REITS:
Company Name TickerBanyan Strategic Realty Trust BSRTS
Capital Automotive REIT CARSCaptec Net Lease Realty, Inc. CRRRColonial Properties Trust CLPCousins Properties Incorporated CUZEntertainment Properties Trust EPRFranchise Finance Corporation of America FFAGlenborough Realty Trust Incorporated GLBGolf Trust of America, Inc. GTAHMG/Courtland Properties, Inc. HMGIncome Opportunity Realty Investors, Inc. IOTLexington Corporate Properties Trust LXPMGI Properties MGINational Golf Properties, Inc. TEEPennsylvania Real Estate Investment Trust PEIPMC Commercial Trust PCCPS Business Parks, Inc. PSBPublic Storage, Inc. PSA
Shurgard Storage Centers, Inc. SHUSizeler Property Investors, Inc. SIZ
Sovran Self Storage, Inc. SSSStorage USA, Inc. SUSTranscontinental Realty Investors, Inc. TCIU.S. Restaurant Properties, Inc. USV
Vornado Realty Trust VNOWashington Real Estate Investment Trust WRE
71

Bibliography:
Brounen, D., P.M.A. Eichholtz, and P.M. Kanters, "The effects of Property DevelopmentActivities on the Performance of REITS", Real Estate Finance, Winter 2000.
Brueggman and Fisher, Real Estate Finance and Investment, Irwin/McGraw-Hill, 1997.
Chen, Jun and Richard Peiser, "The Risk and Return Characteristics of REITS 1993-1997," Real Estate Finance, Spring 1999.
Chen, N.F., R. Roll and S.A. Ross, "Economic Forces and the Stock Market", Journal ofBusiness, 1986.
Chen, Su-Jane, Chengho Hsieh, Timothy W. Vines, and Shur-Nuann Chiou,Macroeconomic Variables, Firm-Specific Variables and Returns to REITS," Journal ofReal Estate Research, Vol. 16, No. 3, 1998.
Elton, E. J., M.J. Gruber and J. Mei, "Cost of Capital Using Arbitrage Pricing Theory: ACase Study of Nine New York Utilities," Financial Markets, Institutions, and Instruments,August 1994.
Fama, E.F. and K.R. French, "The Cross-Section of Expected Stock Returns", Journalof Finance, 1992.
Friday, H. Swint, "The control and Pricing of Agency Costs in Real Estate InvestmentTrusts, Two Essays", Unpublished dissertation, Florida State University, 1997.
Giliberto, S.Michael, "Equity Real Estate Investment Trusts and Real Estate Returns,"The Journal of Real Estate Research, Vol. 5, Number 2, Summer 1990.
Giliberto, Michael and Anne Mengden, "REITS and Real Estate: Two MarketsReexamined", Real Estate Finance, Spring 1996.
Graff, Richard A. and Michael S. Young, "Institutional Investor Impact on Equity REITPerformance", Real Estate Finance, Vol. 14, No. 3, Fall 1997.
Lling, D. C. and A. Naranjo, "The Fundamental Determinants of Commercial RealEstate Returns", Real Estate Finance, Winter 1998.
Litt, Jonathan, Jianping (J.P.) Mei, and the Paine Webber REIT Team, "A RiskAdjustment Model for REIT Evaluation," Real Estate Finance, Spring 1999.
72
McCue, Thomas E. and John L. King, "Real Estate Returns and the Macroeconomy:Some Empirical Evidence from Real Estate Investment Trust Data, 1972-1991", TheJournal of Real Estate Research, Vol. 9, No. 3 Summer 1994.
Moriarty, Mark P. and Pennock J. Yeatmen IV, "Risk-Adjusted Performance History ofPublic and Private Market Real Estate Investments 1978-1997", September 1999.
The National Real Estate Investment Trusts, Inc., REIT Fact Book: The REIT Concept,1989.
Ross, S.A., "The Arbitrage Theory of Capital Asset Pricing", Journal of EconomicTheory, 1976.
Sagalyn, Lynne B., "Conflicts of Interest in the Structure of REITS", Real EstateFinance, Summer 1996.
Sirmans, C.F. "Research on Corporate Governance", Real Estate Finance, Fall 1997.
Vandell, Kerry D., 1998, "Strategic Management of the Apartment Business in a 'BigREIT' World," National Multifamily Housing.
73
Related Documents