© 2004 CEIS, Fondazione Giacomo Brodolini and Blackwell Publishing Ltd, 9600 Garsington Rd., Oxford OX4 2DQ, UK and 350 Main St., Malden, MA 02148, USA. Firm-level Consequences of Large Minimum-wage Increases in the Czech and Slovak Republics Tor Eriksson — Mariola Pytlikova Abstract. After an initial decline in the level of real minimum-wage rates, there were series of unusually large increases in their levels — 70 and 50 per cent — during the years 1999–2002 in the Czech and Slovak Republics, respectively. Using information from matched employee–employer data sets, we look at the impact of minimum-wage hikes on both wages and employment. Our results suggest that there are some, but not substantial, job losses in reaction to minimum-wage hikes and that the impact on firm wages is rather large, implying that further increases of similar magnitude might very well have negative conse- quences for employment. 1. Introduction In this paper, our intention is to examine the consequences of minimum-wage increases on employment and distribution of wages in two transitional economies: the Czech and Slovak Republics. After an initial decline in the level of real minimum-wage rates, in Tor Eriksson, Professor, Department of Economics and Centre for Corporate Performance, Aarhus School of Business, Denmark. E-mail: [email protected]. Mariola Pytlikova (author for correspondence), Ph.D. student, Department of Economics and Centre for Research in Social Integration and Marginalization, Aarhus School of Business, Prismet, Silkeborgvej 2, DK-8000 Aarhus C, Denmark. E-mail: [email protected]. We are grateful to Jingkun Li for research assistance, to the EU Phare ACE 1998 (Contract number P98-103-R) for financial support, and to Trexima for providing the data used in the paper.We would also like to thank Pavel Mrázek for helpful discussions regarding the data and a referee, Daniel Münich, participants at the AEA Econometrics of Wages Conference and participants at the Czech Economic Society Annual Meeting for several helpful comments. LABOUR 18 (1) 75–103 (2004) JEL J31, J42, P31

Welcome message from author
This document is posted to help you gain knowledge. Please leave a comment to let me know what you think about it! Share it to your friends and learn new things together.
Transcript

© 2004 CEIS, Fondazione Giacomo Brodolini and Blackwell Publishing Ltd, 9600 Garsington Rd., Oxford OX4 2DQ, UK and 350 Main St., Malden, MA 02148, USA.
Firm-level Consequences of LargeMinimum-wage Increases in the Czech andSlovak Republics
Tor Eriksson — Mariola Pytlikova
Abstract. After an initial decline in the level of real minimum-wage rates, therewere series of unusually large increases in their levels — 70 and 50 per cent —during the years 1999–2002 in the Czech and Slovak Republics, respectively.Using information from matched employee–employer data sets, we look at theimpact of minimum-wage hikes on both wages and employment. Our resultssuggest that there are some, but not substantial, job losses in reaction tominimum-wage hikes and that the impact on firm wages is rather large, implyingthat further increases of similar magnitude might very well have negative conse-quences for employment.
1. Introduction
In this paper, our intention is to examine the consequences ofminimum-wage increases on employment and distribution of wagesin two transitional economies: the Czech and Slovak Republics.After an initial decline in the level of real minimum-wage rates, in
Tor Eriksson, Professor, Department of Economics and Centre for CorporatePerformance, Aarhus School of Business, Denmark. E-mail: [email protected].
Mariola Pytlikova (author for correspondence), Ph.D. student, Department ofEconomics and Centre for Research in Social Integration and Marginalization,Aarhus School of Business, Prismet, Silkeborgvej 2, DK-8000 Aarhus C,Denmark. E-mail: [email protected].
We are grateful to Jingkun Li for research assistance, to the EU Phare ACE 1998(Contract number P98-103-R) for financial support, and to Trexima for providingthe data used in the paper. We would also like to thank Pavel Mrázek for helpfuldiscussions regarding the data and a referee, Daniel Münich, participants at theAEA Econometrics of Wages Conference and participants at the Czech EconomicSociety Annual Meeting for several helpful comments.
LABOUR 18 (1) 75–103 (2004) JEL J31, J42, P31
both countries there were series of unusually large increases in theirlevels during the years 1999–2002. Thus, in the Czech Republic thenominal minimum wage increased by 35.8, 25, 11.1 and 14 per centin the years 1999, 2000, 2001 and 2002, respectively. Correspond-ing figures for the Slovak Republic in 1999, 2000, 2001 and 2002were 20, 22.2, 11.8 and 13.2 per cent, respectively. This is not theend of story, however, as for the Czech Republic there was another9 per cent increase in the minimum wage from 1 January 2003, andthe current government wants to raise the minimum wage up to50–60 per cent of the average wage by the year 2006. Not surpris-ingly, these legislative steps have generated a heated debate amongpolicy makers and economists about the effects of minimum wageson employment, skill formation and growth during a period of per-sistent increases in the unemployment rate. But so far, to the bestof our knowledge, empirical evidence on the actual consequencesof these significant changes has been lacking.
The effects of minimum-wage increases are part of the perennialcontroversies in economics. Models for competitive markets predictthat minimum-wage hikes lead to employment decreases. However,in the monopsony case higher wages may enable the firm to employmore workers as the firm moves up along its labour supply curve.Owing to the influential book by Card and Krueger (1995) in which,contrary to the accepted wisdom, they report findings of positiveemployment effects of minimum-wage hikes, the monopsony caseand models with monopsonistic features have gained some renewedinterest. Manning (2002) argues that the local labour markets are‘thin’ from the perspective of individual workers and that econo-mists in their analyses should pay more attention to the possibilitythat the companies operate as having monopsony power. He presents evidence on workers’ commuting patterns that suggeststhat local labour markets are indeed ‘thin’ in the geographicaldimension.
Increases in employment are possible also if, as in the cases ofthe Czech and Slovak Republics, the minimum-wage hikes occur ina situation where the minimum wage is close to the level of subsis-tence wage and there are weak incentives for minimum-wage earnersto work. This is because then the minimum-wage hikes may increasethe motivation to work. In addition to employment effects, changesin the minimum wage may also lead to shifts in the entire wage dis-tribution, or in portions thereof; see, for example, Grossman (1983).This less studied effect, which may of course further magnify theemployment effects, may be of some importance in the Czech and
76 Tor Eriksson — Mariola Pytlikova
© CEIS, Fondazione Giacomo Brodolini and Blackwell Publishing Ltd 2004.

Slovak Republics as both countries have a wage tariff system inwhich the lowest tariff wage rate equals the minimum wage.Increases in the latter shift the tariff scale and are thus likely alsoto affect wages above the minimum wage.
Most previous studies have been concerned with fairly smallminimum-wage increases, implying difficulties in distinguishing the employment effects of minimum-wage hikes from other factors.For the same reason, furthermore, it may also be difficult to uneartheffects (if any) on the wage distribution. There are, however, twonotable exceptions in the recent literature: the studies by Castillo-Freeman and Freeman (1991) and Rama (2001), which look at the consequences of large and unforeseen minimum-wage hikes inPuerto Rico and Indonesia, respectively.
Hence, one of the contributions of this paper is to add one addi-tional piece of evidence from a case with large minimum-wageincreases. Another is that we consider two transitional economiesfor which research on these matters is relatively scant. A thirdnovel feature of this paper is that we make use of informationfrom a fairly large linked employee–employer data set, whichallows us to test for whether the impact of minimum-wage hikeson employment and the wage distribution differs across firms,regions and industries. This is potentially interesting since firms,regions and industries differ with respect to factors like skill levelsor firm size, and comparisons of the differences in the impact maythus shed some light on the relevance of the competitive versusmonopsony models. Another reason why differences between firmsare interesting is the key role played by new privately owned andtypically small firms in the marketization process in transitioneconomies.
The following section of this paper describes development of theminimum wage in the Czech and Slovak Republics in detail andprovides additional information on those countries. The thirdsection provides short theory and literature overviews, and Section4 contains the data description. Here we address the question ofwhether the minimum wage actually bites and we look at the extentto which this differs across the two countries. Section 5 presentsresults from the econometric analysis. First we look at the impacton wages and the wage distribution. This is followed by an analy-sis of the employment consequences. All analyses are made at thelevel of the firm. We carry out both analyses of firms in general andof the wages and employment in firms according to size and owner-ship type. Section 6 offers some concluding remarks.
Firm-level Consequences of Large Minimum-wage Increases 77
© CEIS, Fondazione Giacomo Brodolini and Blackwell Publishing Ltd 2004.
2. The development of minimum wages in the Czech and Slovak Republics
In 1992, after 75 years as a common state, Czechoslovakia wassplit into two independent nations, the Czech and the SlovakRepublics, respectively. Until that date, the two republics shared thesame currency, legal system, institutional framework and the firststeps in transforming the economy towards capitalism. Followingthis ‘velvet divorce’ of Czechoslovakia, the countries have chosenquite different paths of economic development.
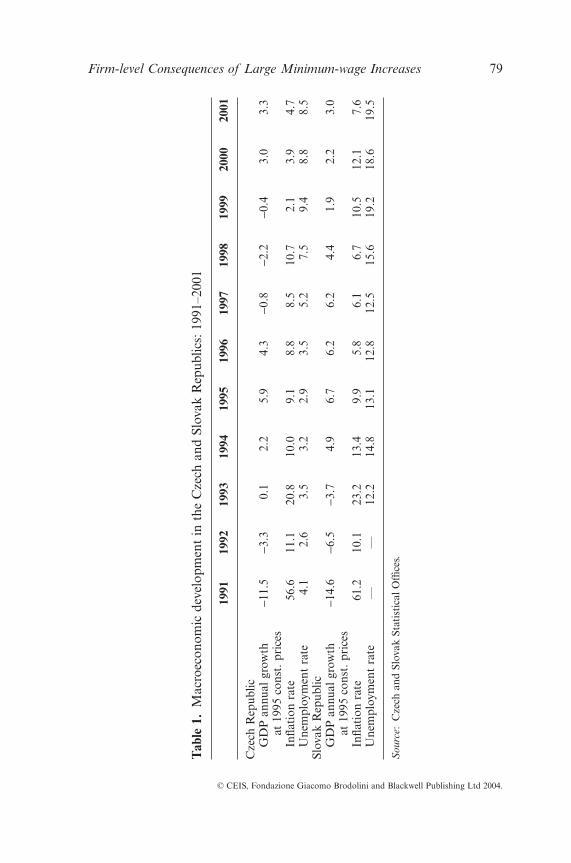
The macroeconomic indicators in Table 1 show that after theinitial decline in GDP during the first 3 (4) years of transition inthe Czech (Slovak) Republic, both economies started to growrapidly. In the Czech Republic, several years of strong economicgrowth were interrupted by an exchange rate crisis in 1997, whichwas followed by an economic recession. Real GDP declined by 2.7percentage points in 1998 and the recession continued in 1999,accompanied by a rapid slowdown in inflation.
In 2000, the Czech economy started to grow again. One of themain reasons for the 1997 crisis was the strong growth in real wages.For most of the early transition years, wage growth in the CzechRepublic exceeded growth in labour productivity (see Table 2). Priorto 1997, the Czech unemployment rate stayed below 4 per cent, aconsiderably lower level than in the other post-communist countriesin Central Europe (as well as in most EU countries). Until recently,the Czech Republic’s labour market was therefore characterized as a ‘miracle’ by numerous observers. After the recession in 1997,however, the situation deteriorated and by the end of 1999 theCzech unemployment rate had reached 9.4 per cent. At the sametime, there are large economic differences between the regions(Fidrmuc, 2001; Pytlikova, 2002).
Development in the Slovak Republic has been rather different.After an initial economic decline in 1993 as a result of the separa-tion, which led to loss of trade and fiscal revenues, Slovakia startedto grow. However, this growth was achieved chiefly through exten-sive government spending which proved to be too generous andeventually resulted in growing external debt. At the same time, theSlovak National Bank pursued tight monetary policies1 to offsetfiscal spending, which led to further slowing of economic growth.
Moreover, the lack of effective bankruptcy procedures, the non-transparent privatization process and the introduction of revital-ization programmes for selected enterprises revealed difficulties
78 Tor Eriksson — Mariola Pytlikova
© CEIS, Fondazione Giacomo Brodolini and Blackwell Publishing Ltd 2004.
Firm-level Consequences of Large Minimum-wage Increases 79
© CEIS, Fondazione Giacomo Brodolini and Blackwell Publishing Ltd 2004.
Tab
le 1
.M
acro
econ
omic
dev
elop
men
t in
the
Cze
ch a
nd S
lova
k R
epub
lics:
1991
–200
1
1991
1992
1993
1994
1995
1996
1997
1998
1999
2000
2001
Cze
ch R
epub
licG
DP
ann
ual g
row
th-1
1.5
-3.3
0.1
2.2
5.9
4.3
-0.8
-2.2
-0.4
3.0
3.3
at 1
995
cons
t.pr
ices
Infla
tion
rat
e56
.611
.120
.810
.09.
18.
88.
510
.72.
13.
94.
7U
nem
ploy
men
t ra
te4.
12.
63.
53.
22.
93.
55.
27.
59.
48.
88.
5Sl
ovak
Rep
ublic
GD
P a
nnua
l gro
wth
-14.
6-6
.5-3
.74.
96.
76.
26.
24.
41.
92.
23.
0at
199
5 co
nst.
pric
esIn
flati
on r
ate
61.2
10.1
23.2
13.4
9.9
5.8
6.1
6.7
10.5
12.1
7.6
Une
mpl
oym
ent
rate
——
12.2
14.8
13.1
12.8
12.5
15.6
19.2
18.6
19.5
Sou
rce:
Cze
ch a
nd S
lova
k St
atis
tica
l Offi
ces.

80 Tor Eriksson — Mariola Pytlikova
© CEIS, Fondazione Giacomo Brodolini and Blackwell Publishing Ltd 2004.
Tab
le 2
.T
he d
evel
opm
ent
ofm
inim
um-w
age
and
othe
r la
bour
mar
ket
mea
sure
s in
the
Cze
ch a
nd S
lova
kR
epub
lics:
1993
–200
1
1993
1994
1995
1996
1997
1998
1999
2000
2001
Cze
ch R
epub
licM
inim
um w
age
(CZ
K)
2,20
02,
200
2,20
02,
500
2,50
02,
650
3,25
04,
000
5,00
03,
600b
4,50
0b
Incr
ease
(pe
r ce
nt)
0.0
0.0
0.0
13.6
0.0
6.0
22.6
11.1
11.1
10.8
b12
.5b
Rea
l MW
199
4 =
100
2,44
42,
200
2,01
62,
104
1,94
11,
858
2,47
33,
000
3,13
2N
et M
W (
CZ
K)
1,90
31,
903
1,90
32,
188
2,18
82,
319
3,11
43,
783
4,18
4M
inim
um s
ubsi
sten
ce w
age
(CZ
K)
1,96
02,
160
2,44
02,
890
3,04
03,
430
3,43
03,
770
3,77
0M
W r
atio
as
perc
enta
ge o
fgr
oss
37.8
31.9
26.9
25.8
23.4
22.7
25.7
29.7
36.3
aver
age
earn
ings
28.4
b33
.4b
Lab
our
prod
ucti
vity
gro
wth
1.7
1.4
3.3
3.7
1.1
-0.6
3.2
5.1
3.9
The
gro
wth
of
gros
s av
erag
e ea
rnin
gs3.
77.
78.
68.
81.
9-1
.16.
02.
62.
2Sl
ovak
Rep
ublic
Min
imum
wag
e (S
KK
)2,
200
2,45
02,
450
2,70
02,
700
3,00
03,
600
4,00
04,
400
4,40
0a4,
920a
Incr
ease
(pe
r ce
nt)
0.0
11.4
0.0
10.2
0.0
11.1
20.0
11.1
11.0
10.0
a8.
0a
Rea
l MW
199
4 =
100
1,98
32,
126
2,12
62,
268
2,31
62,
550
2,73
43,
088
3,40
4N
et M
W (
SKK
)2,
126
2,12
62,
126
2,31
62,
316
2,55
03,
063
3,48
43,
785
Min
imum
sub
sist
ence
wag
e (S
KK
)1,
700
1,70
01,
980
2,18
02,
180
2,41
03,
000
3,00
03,
230
MW
rat
io a
s pe
rcen
tage
of
gros
s 40
.938
.934
.133
.129
.330
.033
.632
.636
.0av
erag
e ea
rnin
gs35
.9a
40.2
a
Not
e:aC
hang
es a
s fr
om 1
Oct
ober
.bC
hang
es a
s fr
om 1
Jul
y.S
ourc
e:C
zech
and
Slo
vak
Stat
isti
cal O
ffice
s;ow
n ca
lcul
atio
ns.
with the restructuring of enterprises. In many cases, privatized busi-nesses have unclear ownership status, and in general firms’ profit-ability has been low.2 Thus, economic growth was not translatedinto employment growth. Rather, there was a strong reduction intotal employment, which declined both in absolute terms and rela-tive to the working-age population. As a consequence, unemploy-ment has remained high since the beginning of the 1990s, varyingbetween 13 and 14 per cent during most of the decade (see Table 1). In 1998, unemployment started to increase again and bythe end of 2001 it had reached 19.5 per cent. In addition, theregional disparities in Slovakia are large, resulting in especially highunemployment rates in areas dominated by heavy industry andagriculture.
2.1 Minimum wages
Minimum wages were first introduced in the 1991 MinimumWage Act. The minimum-wage rate was uniform for all employeesacross the country and was given on an hourly and monthly basis.During the period from 1991 to 1993 it was changed only once, by10 per cent (from CZK2,000 to CZK2,200 in 1992).
Following the split of Czechoslovakia, the economies have fol-lowed different minimum-wage development paths, although bothtook over the previous common legislature. In both countries, theminimum-wage parameters are set by law following preliminary dis-cussions within a tripartite body and are supposed to reflect changesin the development of the average wage, the subsistence wage andinflation. In the early transition years there were very few changesin the level of the minimum wage in both economies, one of themain reasons being the weakness of the trade unions.3 The otherwas the fact that the minimum wage constituted the basis for thedetermination of many social benefits, such as health and pensioninsurance and unemployment benefits. Since parts of the state pay-ments to the social system were derived from minimum-wage levels,governments had an obvious interest in maintaining minimum-wage rates. However, this situation changed during the second partof the 1990s.
In the Czech Republic, most of the above-mentioned links weretransferred to the subsistence wage in 1998.4 The Czech govern-ment’s objective was to increase the minimum wage to 15 per centabove the level of the subsistence wage, and its long-term goal wasto increase it further to at least 50 per cent of the average gross
Firm-level Consequences of Large Minimum-wage Increases 81
© CEIS, Fondazione Giacomo Brodolini and Blackwell Publishing Ltd 2004.

wage. Consequently, the minimum-wage rate began to increase regularly in half-yearly intervals up to January 2003. The minimumwage to average earnings ratio rose from 22.7 per cent in 1998 tothe current 39 per cent.
As another result of this process, in 1999 real minimum wageshad returned to the same level as in 1993. Looking at the relationof minimum-wage development to the subsistence wage, we can alsoobserve the paradox that occurred in the Czech labour market: forseven years the net minimum wage did not exceed the subsistencewage. Consequently, the incentives for the unemployed to acceptlow-paid jobs were weak. Also, the current level of the minimumwage weakens the incentives for unskilled labour to seek employment.
Prior to 1999, in the Slovak Republic, the levels of most of thesocial benefits such as health and pension insurance and unem-ployment benefits were tied to the minimum wage. The realminimum wage declined as the nominal minimum wage clearlylagged behind that of nominal wages and consumer prices. Since1999, the benefits have been linked to the subsistence wage5 and theminimum wage has been growing rapidly, as can be seen from Table2. Despite the series of increases in the minimum wage between1994 and 2001 in the Slovak Republic, the minimum to averagewage ratio is still about the same as in 1993 (40.2 per cent).
Both Czech and Slovak Republics took over the 1991 MinimumSubsistence Amount Act which guarantees individuals or theirhousehold a given minimum level of income, called the subsistencewage. If the income from work (net of taxes), property, sicknessbenefits or pensions is less than the subsistence wage, the state paysthe remaining income.6 Thus, people can obtain the subsistencewage irrespective of whether or not they work. During the secondhalf of the 1990s the net minimum wage in the Czech Republic wasfor several years actually lower than the subsistence wage. Conse-quently, the incentives to accept low-paid job offers were weak.
In both the Czech and the Slovak Republics employers pay apayroll tax of 35 and 38 per cent, respectively, for pension, sickness,unemployment, and health insurance. The employees’ social secu-rity contributions amount to 12.5 and 12 per cent, respectively.Hence, increases in these benefits may affect employers’ wage costsquite significantly.
Both countries have a so-called minimum-wage tariff system.Minimum-wage tariffs represent differentiated minimum rates,which depend on the complexity, responsibility of the job and the
82 Tor Eriksson — Mariola Pytlikova
© CEIS, Fondazione Giacomo Brodolini and Blackwell Publishing Ltd 2004.

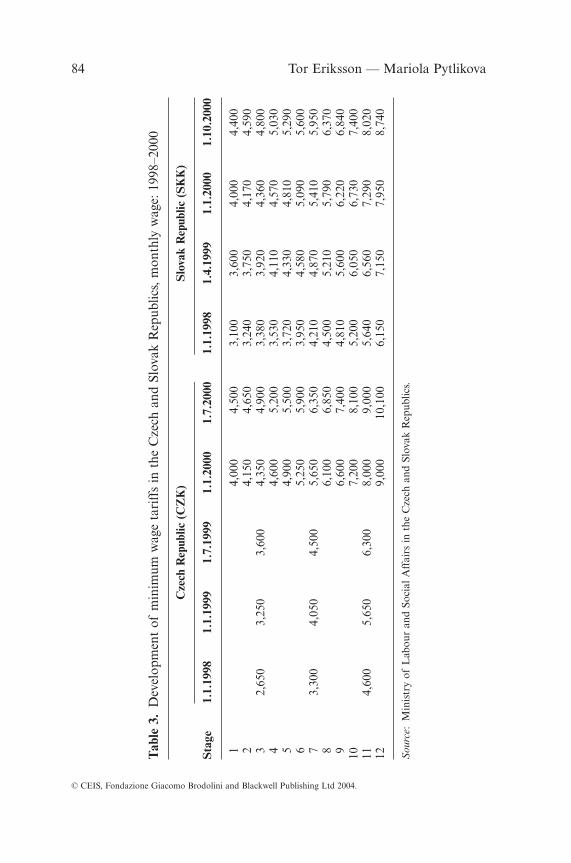
skills required of the employee. The employer ranks the employeewithin the appropriate wage tariff on the basis of a comparison ofthe work type agreed in the employment contract with generallybinding characteristics of wage tariffs. The lowest wage tariff is logi-cally equal to the level of the minimum wage. However, employerscan apply their own system with fewer tariff wage rates (or alsowithout tariff wage rates, as in small enterprises for example). Butthey can only apply the system in such a way that the employee’stotal wage is at least equal to the amount of the minimum-wagerate specified for the type of work he/she is doing. The wage tariffsare important, as increases in the minimum wage automaticallyshift wages up through the tariff scale. Thus, for instance, in therecent collective agreements for 2003 between the employers’ asso-ciations and the unions in the energy sector and in the mining indus-try the parties have agreed to continue to explicitly tie changes inthe wage tariffs to changes in the minimum wage. The developmentof the wage tariffs is shown in Table 3.
During 1993–95 there was a 12-tariff wage system in the CzechRepublic. As from the beginning of 1996 the number of tariff levelswas reduced to three. However, this three-level system did notensure sufficient differences in wages in relation to skills and the dif-ficulty of the job, and therefore the government decided to changethe system and reintroduced the 12-tariff system as from 2000.
In the Slovak Republic, there has been a 12-level wage tariffsystem during the whole transformation period without anychanges in the system. The tariffs have been increased in the sameway as the levels of minimum wage (see Table 3).
3. Previous research
The effects of minimum-wage increases constitute one of themany ongoing controversies in economics. The traditional view onminimum-wage increases stems from the basic competitive labourmarket model in which employers face a perfectly elastic laboursupply curve. According to this model, any increases in wages wouldresult in lay-offs of employees. Thus, the prediction is clear: employ-ment will decrease. However, the competitive model is based onmany simplifying assumptions, which may not be valid in realeconomies. One of them is homogeneity of the workforce. In reality,individuals differ in terms of skills, education, age, and work expe-rience. Another frequently adopted assumption is that individuals
Firm-level Consequences of Large Minimum-wage Increases 83
© CEIS, Fondazione Giacomo Brodolini and Blackwell Publishing Ltd 2004.
84 Tor Eriksson — Mariola Pytlikova
© CEIS, Fondazione Giacomo Brodolini and Blackwell Publishing Ltd 2004.
Tab
le 3
.D
evel
opm
ent
ofm
inim
um w
age
tari
ffs
in t
he C
zech
and
Slo
vak
Rep
ublic
s,m
onth
ly w
age:
1998
–200
0
Cze
ch R
epub
lic (
CZ
K)
Slo
vak
Rep
ublic
(S
KK
)
Sta
ge1.
1.19
981.
1.19
991.
7.19
991.
1.20
001.
7.20
001.
1.19
981.
4.19
991.
1.20
001.
10.2
000
14,
000
4,50
03,
100
3,60
04,
000
4,40
02
4,15
04,
650
3,24
03,
750
4,17
04,
590
32,
650
3,25
03,
600
4,35
04,
900
3,38
03,
920
4,36
04,
800
44,
600
5,20
03,
530
4,11
04,
570
5,03
05
4,90
05,
500
3,72
04,
330
4,81
05,
290
65,
250
5,90
03,
950
4,58
05,
090
5,60
07
3,30
04,
050
4,50
05,
650
6,35
04,
210
4,87
05,
410
5,95
08
6,10
06,
850
4,50
05,
210
5,79
06,
370
96,
600
7,40
04,
810
5,60
06,
220
6,84
010
7,20
08,
100
5,20
06,
050
6,73
07,
400
114,
600
5,65
06,
300
8,00
09,
000
5,64
06,
560
7,29
08,
020
129,
000
10,1
006,
150
7,15
07,
950
8,74
0
Sou
rce:
Min
istr
y of
Lab
our
and
Soci
al A
ffai
rs in
the
Cze
ch a
nd S
lova
k R
epub
lics.
have perfect information about job opportunities. When changingsome of these assumptions, it is clear that the labour supply curveis not perfectly elastic (see Bhaskar et al., 2002; Manning, 2002,2003; Zavodny, 1998, for detailed discussions of how the predictionsare modified).
The alternative view in minimum-wage discussions is that of monopsonistic markets, with the sole employer in the labourmarket exemplifying the extreme case of monopsony. According tothe model’s predictions, the minimum-wage hikes may increaseemployment, since the higher wage enables the monopsonistic firmto hire additional workers as the firm moves up along its laboursupply curve. The traditional monopsony model is neverthelessrather unrealistic, as there is rarely only a single employer in themarket. There are, however, many possible situations between theextremes of perfect competition and pure monopsony, such asoligopsony and monopsonistic competition (see Bhaskar et al.,2002, for a survey).
All this is in line with the perception of labour markets as ‘thin’(Manning, 2003). In reality, there is not usually just a single labourmarket but rather many local labour markets within a geographicalarea. Such a perception of the labour market indicates that workersare not faced with many potential employers within a reasonabledistance.
The fact that some firms may operate in a labour market withemployers having some monopsony power over their workers couldexplain the finding in some recent studies that minimum-wage hikeshave the effect of increasing employment. It is important to notethat all the above-mentioned models predict that high minimumwages will reduce employment. In the countries studied in thecurrent paper, the levels of minimum wages are low, but on the otherhand the changes therein are large.
According to theory, changes in the minimum wage may also leadto shifts in the wage distribution. An increase in the minimum wagenot only raises wages for low-wage workers who remain employed,but the wage effects also ‘spill over’ to workers above (or below) thenew minimum wage. This raises concerns about the impact of theforthcoming minimum-wage increase on wages, and ultimately priceinflation (see, for example, Grossman, 1983). This less-studied effectmay, of course, further magnify the employment effects.
As regards the empirical evidence of the relationship betweenminimum-wage increases and employment, a large body of empiri-cal literature has built up, particularly for the USA. In line with the
Firm-level Consequences of Large Minimum-wage Increases 85
© CEIS, Fondazione Giacomo Brodolini and Blackwell Publishing Ltd 2004.
traditional theoretical approach, many studies have found thatminimum-wage hikes indeed lead to employment decreases (Brown,1988; Brown et al., 1982; Currie and Fallick, 1996; Deere et al.,1995; Kim and Taylor, 1995; Neumark and Wascher, 1992, 1994;Wellington, 1991). Until recently, there was more or less a consen-sus about their direction and the discussion was concerned mainlywith the magnitude of the effects. However, the discussion hasintensified and changed character following the controversial findings of Card (1992a, b), Katz and Krueger (1992), Card andKrueger (1994, 1995), according to which minimum wages are asso-ciated with either no change in employment or even increases inemployment levels. Although these studies have met strong criticismin relation to problems with possible measurement errors andoverall problems with quasi-experiments, they have also pointed outseveral weaknesses in the earlier literature and hence led to a resur-gence of interest in the issue and in finding new testing grounds.
It should be noted that the magnitude of minimum-wageincreases in the USA has typically been rather small. Moreover, theincreases have been infrequent and the coverage incomplete, all of which makes it difficult to distinguish between effects fromminimum-wage changes and from other changes. Also in the caseof EU countries, there has been no big change in minimum-wagelevels and their experiences offer no better opportunities forminimum-wage research (cf. Dolado et al., 1996). An additionalcomplication is the possible endogeneity of minimum-wage in-creases because increases take place during periods of high growth,thereby giving rise to a positive relationship between minimumwages and employment growth (see Neumark and Wascher, 1992,1994). However, this is not the case in the Czech and SlovakRepublics, as the large hikes occurred during years of stagnatingemployment.
There are, however, a few studies that merit attention. Abowd et al. (1999) examined the changes of the real minimum wage andthe subsequent employment outcomes in France and the USA usingmicro-data sets similar to those in our study. They found thatincreases in the minimum wage in France decreased the probabilityof future employment. This is contrary to previous French studiesthat have been based on aggregate time-series data and have foundno dis-employment effect of minimum-wage hikes. Abowd et al.estimate the conditional elasticity of subsequent employment as afunction of the real minimum wage to be -3.2 for 26–30-year-oldFrench men and -4.3 for men in the 31–35 age group.
86 Tor Eriksson — Mariola Pytlikova
© CEIS, Fondazione Giacomo Brodolini and Blackwell Publishing Ltd 2004.
A new source of European evidence is provided by the livelydebated introduction of the minimum wage in the UK in 1999. Tworecent studies have looked at its consequences.7 Stewart (2002) usedlongitudinal data and a difference-in-differences estimator to findno significant adverse employment effects for any of the four demo-graphic groups (youth, adults, men and women) considered in thepaper. Machin et al. (2002) made use of data collected from the resi-dential care homes sector, which is a non-unionized low-pay sector,and consequently likely to be affected by the new legislation. Theyfound a considerable compression of wages at the lower end of thedistribution plus some employment-reduction effects.
Two studies that are particularly interesting from the perspec-tive of the current paper are the analysis of large and unforeseenminimum-wage increases in Puerto Rico and Indonesia by Castillo-Freeman and Freeman (1991) and Rama (2001), respectively.Castillo-Freeman and Freeman (1991) examined the effects ofextending the US minimum wage to the Puerto Rican labour marketin the late 1970s and early 1980s. They show that this minimum-wageincrease had a substantial negative impact on employment in PuertoRico, not because the minimum-wage elasticity of employment washigh, but as a consequence of the large change in the minimum wageto average wage ratio.8
Rama (2001) estimated the effect of doubling the real minimumwage on employment and wage earnings in Indonesia. He found thatthis extraordinary large minimum-wage hike led to an increase inaverage wages in the range of 5–15 per cent and a decrease in urbanemployment in the range of 0–5 per cent. Moreover, he demonstratesthat the employment effects vary considerably by firm size; smallfirms experience substantial decreases in employment, whereas largecompanies in some cases actually increase their workforce.
Minimum-wage developments in the post-communist EasternEuropean countries provide a unique possibility to examine theimpact of minimum wages and changes therein. And yet, to the bestof our knowledge, until now there has been no detailed study onthe effects of minimum wages on the labour markets in transitioneconomies.9
4. Data description
This study is based on a data set derived from a national surveyon labour costs known as the Average Earnings Information System
Firm-level Consequences of Large Minimum-wage Increases 87
© CEIS, Fondazione Giacomo Brodolini and Blackwell Publishing Ltd 2004.

(AEIS) which matches firms and workers. The data set has relativelyrich information about both the workers and their employers. Thedata have been collected on a quarterly basis by a private con-sulting company, Trexima Ltd, on behalf of the Czech and SlovakMinistries of Labour.
The firms are legally obliged to supply Trexima with informationin two files. The first one contains information on the followingemployer characteristics: location, industry, legal settings, type ofownership (private, state, foreign, etc.), size, etc. The second fileincludes worker characteristics such as age, gender, occupation,education, work experience in years and tariffs grade.
In this paper we use data from the fourth quarter of the years1998–2000 for both the Czech and Slovak Republic. We analysedata on 1,049,582 employees in the Czech Republic and 295,210employees in the Slovak Republic in 1998. As regards year 2000, wehave information on 1,056,724 and 345,391 employees in the Czechand Slovak Republics, respectively. For further description of thedata, see Kala (2002).
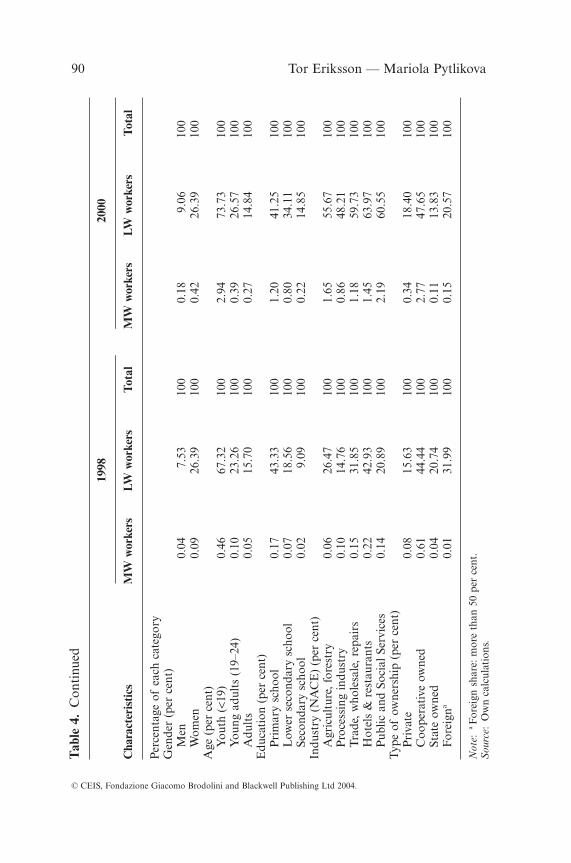
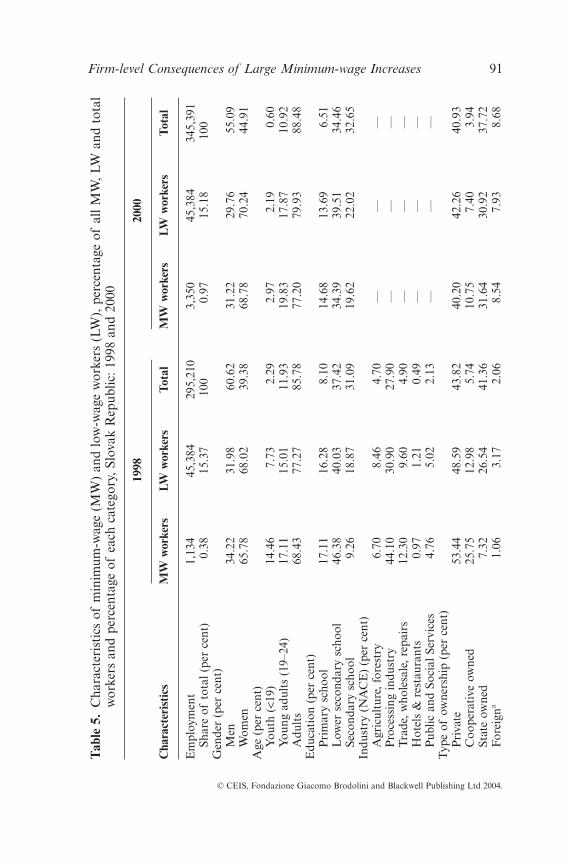
When examining the characteristics of minimum-wage workers,it is useful not to look exclusively at those workers earning exactlythe minimum wage but to consider a somewhat broader range. Weadopt two alternative definitions; firstly, we define ‘minimum-wageworkers’ as workers earning 10 per cent above the minimum-wagelevel or less. Secondly, we adopt the definition of ‘low-wage workers’used by, for example, the OECD: two-thirds of the median wage ofall wage earners.
Tables 4 and 5 provide some descriptive statistics on minimum-and low-paid workers in the Czech and Slovak Republics in theyears 1998 and 2000. Compared with the overall labour force, low-paid workers are clearly over-represented among females, youth andyoung adults. As many as nearly half of these categories belong tothe low paid. The share of low-paid employees decreases with edu-cation. Low-paid workers are most likely to be employed in thesales, agriculture, hotels and restaurants and public administrationsectors. In both countries, low pay is not concentrated in particu-lar regions.
One obvious fact borne out by Tables 4 and 5 is that minimumwages in the Czech and Slovak Republics are not binding in the con-ventional sense. Only a tiny proportion of Czech wage earnersreceives minimum wages (less than 1 per cent). The share is verylow in the Slovak Republic, too. However, in both countries theproportion has almost quadrupled in the late 1990s.
88 Tor Eriksson — Mariola Pytlikova
© CEIS, Fondazione Giacomo Brodolini and Blackwell Publishing Ltd 2004.

Firm-level Consequences of Large Minimum-wage Increases 89
© CEIS, Fondazione Giacomo Brodolini and Blackwell Publishing Ltd 2004.
Tab
le 4
.C
hara
cter
isti
cs o
fm
inim
um-w
age
(MW
) an
d lo
w-w
age
wor
kers
(LW
),pe
rcen
tage
of
all M
W,L
W a
nd t
otal
wor
kers
and
per
cent
age
ofea
ch c
ateg
ory,
Cze
ch R
epub
lic:1
998
and
2000
1998
2000
Cha
ract
eris
tics
MW
wor
kers
LW w
orke
rsTo
tal
MW
wor
kers
LW w
orke
rsTo
tal
Em
ploy
men
t64
317
4,54
21,
044,
640
3,06
617
0,23
01,
056,
724
Shar
e of
tota
l (pe
r ce
nt)
0.06
16.7
110
00.
2916
.11
100
Gen
der
(per
cen
t)M
en31
.73
23.1
451
.34
34.4
730
.80
54.7
6W
omen
68.2
776
.86
48.6
665
.53
69.2
045
.24
Age
(pe
r ce
nt)
You
th (
<19)
6.22
3.36
0.83
2.71
1.22
0.27
You
ng a
dult
s (1
9–24
)19
.75
16.5
511
.89
12.8
215
.68
9.51
Adu
lts
74.0
380
.09
85.2
584
.47
83.0
990
.22
Edu
cati
on (
per
cent
)P
rim
ary
scho
ol17
.11
15.9
06.
131.
080.
670.
26L
ower
sec
onda
ry s
choo
l39
.19
38.4
334
.58
40.6
131
.04
14.6
6Se
cond
ary
scho
ol9.
1813
.37
24.6
49.6
159
.21
64.2
Indu
stry
(N
AC
E)
(per
cen
t)A
gric
ultu
re,f
ores
try
2.80
4.33
2.73
13.9
98.
492.
46P
roce
ssin
g in
dust
ry40
.75
22.2
525
.19
23.6
823
.92
7.99
Tra
de,w
hole
sale
,rep
airs
9.64
7.68
4.03
10.1
89.
322.
51H
otel
s &
res
taur
ants
3.11
2.29
0.89
2.25
1.78
0.45
Pub
lic a
nd S
ocia
l Ser
vice
s3.
271.
831.
477.
183.
570.
95T
ype
ofow
ners
hip
(per
cen
t)P
riva
te34
.21
24.3
226
.01
41.9
441
.30
36.1
6C
oope
rati
ve o
wne
d26
.28
7.04
2.65
30.4
69.
423.
19St
ate
owne
d23
.95
43.4
835
.03
12.2
326
.65
31.0
5F
orei
gna
0.31
6.62
3.46
2.28
5.60
4.39
90 Tor Eriksson — Mariola Pytlikova
© CEIS, Fondazione Giacomo Brodolini and Blackwell Publishing Ltd 2004.
Tab
le 4
.C
onti
nued
1998
2000
Cha
ract
eris
tics
MW
wor
kers
LW w
orke
rsTo
tal
MW
wor
kers
LW w
orke
rsTo
tal
Per
cent
age
ofea
ch c
ateg
ory
Gen
der
(per
cen
t)M
en0.
047.
5310
00.
189.
0610
0W
omen
0.09
26.3
910
00.
4226
.39
100
Age
(pe
r ce
nt)
You
th (
<19)
0.46
67.3
210
02.
9473
.73
100
You
ng a
dult
s (1
9–24
)0.
1023
.26
100
0.39
26.5
710
0A
dult
s0.
0515
.70
100
0.27
14.8
410
0E
duca
tion
(pe
r ce
nt)
Pri
mar
y sc
hool
0.17
43.3
310
01.
2041
.25
100
Low
er s
econ
dary
sch
ool
0.07
18.5
610
00.
8034
.11
100
Seco
ndar
y sc
hool
0.02
9.09
100
0.22
14.8
510
0In
dust
ry (
NA
CE
) (p
er c
ent)
Agr
icul
ture
,for
estr
y0.
0626
.47
100
1.65
55.6
710
0P
roce
ssin
g in
dust
ry0.
1014
.76
100
0.86
48.2
110
0T
rade
,who
lesa
le,r
epai
rs0.
1531
.85
100
1.18
59.7
310
0H
otel
s &
res
taur
ants
0.22
42.9
310
01.
4563
.97
100
Pub
lic a
nd S
ocia
l Ser
vice
s0.
1420
.89
100
2.19
60.5
510
0T
ype
ofow
ners
hip
(per
cen
t)P
riva
te0.
0815
.63
100
0.34
18.4
010
0C
oope
rati
ve o
wne
d0.
6144
.44
100
2.77
47.6
510
0St
ate
owne
d0.
0420
.74
100
0.11
13.8
310
0F
orei
gna
0.01
31.9
910
00.
1520
.57
100
Not
e:aF
orei
gn s
hare
:mor
e th
an 5
0 pe
r ce
nt.
Sou
rce:
Ow
n ca
lcul
atio
ns.
Firm-level Consequences of Large Minimum-wage Increases 91
© CEIS, Fondazione Giacomo Brodolini and Blackwell Publishing Ltd 2004.
Tab
le 5
.C
hara
cter
isti
cs o
fm
inim
um-w
age
(MW
) an
d lo
w-w
age
wor
kers
(LW
),pe
rcen
tage
of
all M
W,L
W a
nd t
otal
wor
kers
and
per
cent
age
ofea
ch c
ateg
ory,
Slov
ak R
epub
lic:1
998
and
2000
1998
2000
Cha
ract
eris
tics
MW
wor
kers
LW w
orke
rsTo
tal
MW
wor
kers
LW w
orke
rsTo
tal
Em
ploy
men
t1,
134
45,3
8429
5,21
03,
350
45,3
8434
5,39
1Sh
are
ofto
tal (
per
cent
)0.
3815
.37
100
0.97
15.1
810
0G
ende
r (p
er c
ent)
Men
34.2
231
.98
60.6
231
.22
29.7
655
.09
Wom
en65
.78
68.0
239
.38
68.7
870
.24
44.9
1A
ge (
per
cent
)Y
outh
(<1
9)14
.46
7.73
2.29
2.97
2.19
0.60
You
ng a
dult
s (1
9–24
)17
.11
15.0
111
.93
19.8
317
.87
10.9
2A
dult
s68
.43
77.2
785
.78
77.2
079
.93
88.4
8E
duca
tion
(pe
r ce
nt)
Pri
mar
y sc
hool
17.1
116
.28
8.10
14.6
813
.69
6.51
Low
er s
econ
dary
sch
ool
46.3
840
.03
37.4
234
.39
39.5
134
.46
Seco
ndar
y sc
hool
9.26
18.8
731
.09
19.6
222
.02
32.6
5In
dust
ry (
NA
CE
) (p
er c
ent)
Agr
icul
ture
,for
estr
y6.
708.
464.
70—
——
Pro
cess
ing
indu
stry
44.1
030
.90
27.9
0—
——
Tra
de,w
hole
sale
,rep
airs
12.3
09.
604.
90—
——
Hot
els
& r
esta
uran
ts0.
971.
210.
49—
——
Pub
lic a
nd S
ocia
l Ser
vice
s4.
765.
022.
13—
——
Typ
e of
owne
rshi
p (p
er c
ent)
Pri
vate
53.4
448
.59
43.8
240
.20
42.2
640
.93
Coo
pera
tive
ow
ned
25.7
512
.98
5.74
10.7
57.
403.
94St
ate
owne
d7.
3226
.54
41.3
631
.64
30.9
237
.72
For
eign
a1.
063.
172.
068.
547.
938.
68

92 Tor Eriksson — Mariola Pytlikova
© CEIS, Fondazione Giacomo Brodolini and Blackwell Publishing Ltd 2004.
Tab
le 5
.C
onti
nued
1998
2000
Cha
ract
eris
tics
MW
wor
kers
LW w
orke
rsTo
tal
MW
wor
kers
LW w
orke
rsTo
tal
Per
cent
age
ofea
ch c
ateg
ory
Gen
der
(per
cen
t)M
en0.
228.
1110
00.
558.
2010
0W
omen
0.64
26.5
610
01.
4823
.74
100
Age
(pe
r ce
nt)
You
th (
<19)
2.43
51.8
810
04.
7855
.48
100
You
ng a
dult
s (1
9–24
)0.
5519
.33
100
1.75
24.8
310
0A
dult
s0.
3113
.85
100
0.84
13.7
110
0E
duca
tion
(pe
r ce
nt)
Pri
mar
y sc
hool
0.81
30.8
910
02.
1831
.93
100
Low
er s
econ
dary
sch
ool
0.48
16.4
510
00.
9617
.40
100
Seco
ndar
y sc
hool
0.11
9.33
100
0.58
10.2
410
0In
dust
ry (
NA
CE
) (p
er c
ent)
Agr
icul
ture
,for
estr
y0.
5527
.66
100
——
—P
roce
ssin
g in
dust
ry0.
6116
.94
100
——
—T
rade
,who
lesa
le,r
epai
rs0.
9630
.29
100
——
—H
otel
s &
res
taur
ants
0.75
37.7
510
0—
——
Pub
lic a
nd S
ocia
l Ser
vice
s0.
8636
.14
100
——
—T
ype
ofow
ners
hip
(per
cen
t)P
riva
te0.
4717
.05
100
0.95
15.6
710
0C
oope
rati
ve o
wne
d1.
7234
.79
100
2.64
28.5
010
0St
ate
owne
d0.
079.
8710
00.
8112
.44
100
For
eign
a0.
2023
.59
100
0.95
13.8
710
0
Not
e:aF
orei
gn s
hare
:mor
e th
an 5
0 pe
r ce
nt.
Sou
rce:
Ow
n ca
lcul
atio
ns.

The minimum wage (in Czechoslovakia) was initially set at a level comparable with that in many capitalist economies. However,minimum wages fell substantially in real terms (in the Czech Repub-lic they fell by about 50 per cent during the years 1992–96). Therewas a curious situation in the Czech Republic between 1993 and1999 in that the net minimum wage was below the minimum sub-sistence wage. In such a situation, minimum-wage earners lackincentives to work. As the minimum wage again exceeded the sub-sistence wage in the late 1990s, this created stronger motives foremployees to work and to supply more hours. Even if the level hadnot fallen so dramatically, minimum wages would probably not havebeen effective anyway, as in the early transition years the authori-ties lacked the resources to enforce them.
This does not mean, however, that minimum wages have had no role to play. As we have seen, in the Czech and Slovak Republicsthe minimum wage constitutes the base level in the scale ofminimum-wage tariffs and thus an increase in it shifts the other tariffwage rates and also, therefore, actual wages. During the periodunder study, 50 (60) per cent of the firms and 608,635 (238,799) ofthe employees in the Czech (Slovak) Republic have applied theminimum-wage tariff system in their wage-setting rules. The remain-ing firms have applied their own systems, but the wages of theiremployees should equal at least the level of the relevant tariff wagerate. Consequently, when the minimum wages in the late 1990s wereelevated to considerably higher levels, one can certainly not rule outthe possibility that minimum wages have had a direct effect on wages,in particular those of low-paid workers, and hence on employment.The next section aims to provide some evidence on this.
5. Estimations of wage and labour demand effects
In order to examine the effects of the minimum-wage changes onchanges in firms’ wages and on their demand for labour, we haveestimated, following Card (1992b), a simple regression model onfirm-level data. As the minimum wages in both the Czech andSlovak Republics are national, we try to capture the effects on firms’wage costs by using a variable that shows the vulnerability of thefirm to changes in the minimum wage.
The model for log wage changes is:
[1]D ln , , , , ,W j t MWI j t X j t j t( ) = + -( ) + -( ) + ( )a b g e1 1
Firm-level Consequences of Large Minimum-wage Increases 93
© CEIS, Fondazione Giacomo Brodolini and Blackwell Publishing Ltd 2004.
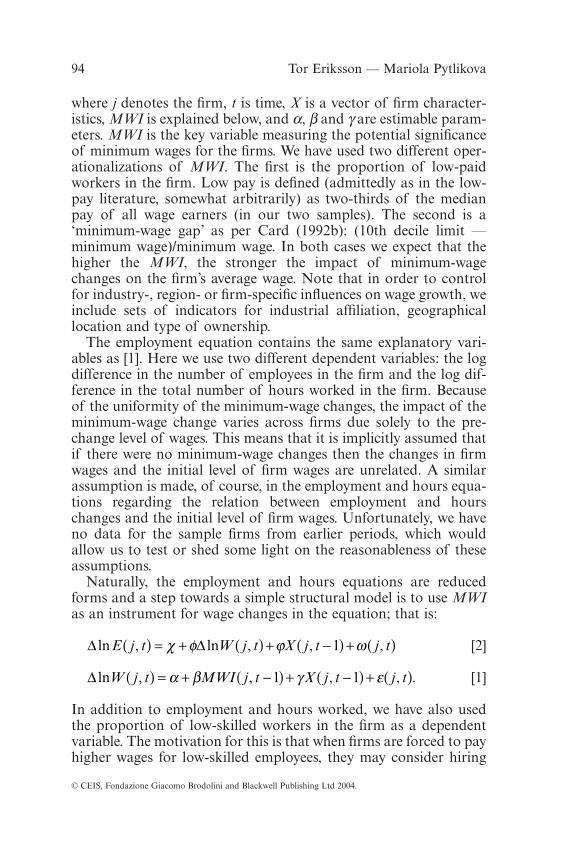
where j denotes the firm, t is time, X is a vector of firm character-istics, MWI is explained below, and a, b and g are estimable param-eters. MWI is the key variable measuring the potential significanceof minimum wages for the firms. We have used two different oper-ationalizations of MWI. The first is the proportion of low-paidworkers in the firm. Low pay is defined (admittedly as in the low-pay literature, somewhat arbitrarily) as two-thirds of the medianpay of all wage earners (in our two samples). The second is a‘minimum-wage gap’ as per Card (1992b): (10th decile limit —minimum wage)/minimum wage. In both cases we expect that thehigher the MWI, the stronger the impact of minimum-wagechanges on the firm’s average wage. Note that in order to controlfor industry-, region- or firm-specific influences on wage growth, weinclude sets of indicators for industrial affiliation, geographicallocation and type of ownership.
The employment equation contains the same explanatory vari-ables as [1]. Here we use two different dependent variables: the logdifference in the number of employees in the firm and the log dif-ference in the total number of hours worked in the firm. Becauseof the uniformity of the minimum-wage changes, the impact of theminimum-wage change varies across firms due solely to the pre-change level of wages. This means that it is implicitly assumed thatif there were no minimum-wage changes then the changes in firmwages and the initial level of firm wages are unrelated. A similarassumption is made, of course, in the employment and hours equa-tions regarding the relation between employment and hourschanges and the initial level of firm wages. Unfortunately, we haveno data for the sample firms from earlier periods, which would allow us to test or shed some light on the reasonableness of theseassumptions.
Naturally, the employment and hours equations are reducedforms and a step towards a simple structural model is to use MWIas an instrument for wage changes in the equation; that is:
[2]
[1]
In addition to employment and hours worked, we have also usedthe proportion of low-skilled workers in the firm as a dependentvariable. The motivation for this is that when firms are forced to payhigher wages for low-skilled employees, they may consider hiring
D ln , , , , .W j t MWI j t X j t j t( ) = + -( ) + -( ) + ( )a b g e1 1
D Dln , ln , , ,E j t W j t X j t j t( ) = + ( ) + -( ) + ( )c f j w1
94 Tor Eriksson — Mariola Pytlikova
© CEIS, Fondazione Giacomo Brodolini and Blackwell Publishing Ltd 2004.

more skilled workers instead. Thus, minimum-wage increases may not only change the level but also the composition of firms’workforces.
We have estimated equations [1] and [2] on all firms and sub-samples consisting of profit and non-profit firms as well as firmswith more and with fewer than 100 employees. The estimationresults for the periods 1998–99 and 1999–2000 for the Czech andSlovak Republics, respectively, are displayed in Tables 6 and 7.10
Beginning with the estimates for the Czech Republic (see Table6) we may note that in both periods, albeit with different strength,the larger the proportion of low-paid workers in a firm, the higherthe increase in the firm’s average wage.11 According to the estima-tions for 1998–99, firms with a higher share of employees on lowpay expanded their employment more than other firms, whereas theopposite is true for the period 1999–2000. The effect on hoursworked in the firm is of negative sign for both periods. It should benoted that the average employment and total hours growth is negative in both periods: -14.4 and -5.1 per cent, and -5.1 and -5.4per cent for employment and hours, respectively. The estimationsemploying the alternative minimum-wage gap variable tell roughlythe same story. The larger the gap, the larger the effect on the firm’saverage wage. Employment and total hours in firms are unaffectedby the minimum-wage increases in the first period and negativelyaffected in the second. One possible interpretation of these resultsis, of course, a ‘monopsonistic’ or ‘thin labour market’ interpreta-tion. One should remember that the real minimum wage was belowthe subsistence wage and that increasing the former providedstronger incentives to work. But then one would expect that theworking hours would react in the same manner, and not move inthe opposite direction. Hence, we think the results are clearly moreconsistent with the notion of a competitive labour market.
The estimates for the Slovak Republic (see Table 7), which arebased on substantially fewer observations, do also clearly show thatthe average wage of firms employing relatively many workers fromthe lower end of the wage distribution is raised more as a conse-quence of hikes in the minimum wage. For the Slovak Republic wefind a negative effect on employment in the first period but no sig-nificant effect in the second period. The impact on hours is less pre-cisely estimated and the estimates indicate, if anything, that theimpact is positive in the second period. In both cases it should benoted that the number of observations in the second period is quitesmall.
Firm-level Consequences of Large Minimum-wage Increases 95
© CEIS, Fondazione Giacomo Brodolini and Blackwell Publishing Ltd 2004.

96 Tor Eriksson — Mariola Pytlikova
© CEIS, Fondazione Giacomo Brodolini and Blackwell Publishing Ltd 2004.
Tab
le 6
.E
ffec
ts o
fm
inim
um-w
age
chan
ges
on fi
rm a
vera
ge w
ages
and
firm
em
ploy
men
t,a
Cze
ch R
epub
lic:1
998–
99an
d 19
99–2
000
Dep
ende
nt v
aria
ble
Dln
in p
ropo
rtio
n of
Dln
in fi
rm’s
ho
urs
wor
ked
bypr
opor
tion
of
wor
kers
w
orke
rs w
ith
basi
cD
ln fi
rm a
vera
ge w
age
Dln
firm
em
ploy
men
tD
ln t
otal
hou
rsw
ith
basi
c ed
ucat
ion
educ
atio
n
1998
–99
1999
–200
019
98–9
919
99–2
000
1998
–99
1999
–200
019
98–9
919
99–2
000
1998
–99
1999
–200
0
Inde
pend
ent
vari
able
:pro
port
ion
oflo
w-p
aid
empl
oyee
s in
firm
Reg
ress
ions
usi
ng t
he t
wo-
thir
ds o
fm
edia
n pa
y va
riab
le a
s a
defin
itio
n of
low
pay
Tota
l0.
121*
**0.
053*
**0.
185*
**-0
.142
***
-0.1
19**
*-0
.124
***
0.10
3-0
.130
-0.0
14*
-0.0
36N
o.of
obs.
(1,7
17;1
,844
)(0
.017
)(0
.014
)(0
.046
)(0
.036
)(0
.040
)(0
.038
)(0
.138
)(0
.097
)(0
.017
)(0
.028
)P
rofit
firm
s0.
069*
**0.
059*
**0.
166*
**-0
.140
**-0
.154
***
-0.1
32**
*-0
.160
-0.0
600.
009
-0.0
47*
No.
ofob
s.(9
89;1
,199
)(0
.024
)(0
.018
)(0
.053
)(0
.045
)(0
.055
)(0
.047
)(0
.129
)(0
.108
)(0
.023
)(0
.034
)N
on-p
rofit
firm
s0.
174*
**0.
016
0.13
5***
-0.1
43**
*-0
.114
**-0
.136
***
0.56
8**
-0.3
30**
-0.0
44*
-0.0
62N
o.of
obs.
(728
;645
)(0
.020
)(0
.022
)(0
.058
)(0
.058
)(0
.057
)(0
.062
)(0
.290
)(0
.182
)(0
.026
)(0
.045
)L
ess
than
100
em
ploy
ees
0.14
2***
0.08
6***
0.02
8-0
.122
**-0
.149
**-0
.117
*-0
.268
***
-0.0
63-0
.030
-0.0
43N
o.of
obs.
(618
;669
)(0
.028
)(0
.026
)(0
.061
)(0
.064
)(0
.060
)(0
.065
)(0
.117
)(0
.045
)(0
.027
)(0
.043
)M
ore
than
100
em
ploy
ees
0.12
0***
0.03
6**
0.28
1***
-0.1
34**
*-0
.101
**-0
.100
**0.
349*
0.14
0***
0.00
1-0
.011
***
No.
ofob
s.(1
,099
;1,1
75)
(0.0
22)
(0.0
18)
(0.0
55)
(0.0
45)
(0.0
56)
(0.0
50)
(0.2
20)
(0.1
65)
(0.0
24)
(0.0
39)
Reg
ress
ions
usi
ng t
he m
inim
um-w
age
gap
vari
able
as
a de
finit
ion
oflo
w p
ayTo
tal
0.05
9***
0.02
5***
-0.0
08-0
.036
***
0.00
4-0
.027
***
0.04
8-0
.055
***
0.00
2-0
.024
***
No.
ofob
s.(1
,782
;1,9
59)
(0.0
04)
(0.0
04)
(0.0
10)
(0.0
10)
(0.0
10)
(0.0
10)
(0.0
34)
(0.0
26)
(0.0
04)
(0.0
08)
Pro
fit fi
rms
0.05
8***
0.02
6***
-0.0
10-0
.041
***
-0.0
08-0
.032
***
0.02
20.
043*
0.00
8*-0
.027
***
No.
ofob
s.(1
,041
;1,3
00)
(0.0
06)
(0.0
05)
(0.0
13)
(0.0
11)
(0.0
13)
(0.0
12)
(0.0
29)
(0.0
27)
(0.0
05)
(0.0
09)
Non
-pro
fit fi
rms
0.04
9***
0.00
6-0
.031
*-0
.050
***
0.01
2-0
.040
**0.
135*
-0.0
83-0
.013
*-0
.026
*N
o.of
obs.
(741
;659
)(0
.006
)(0
.007
)(0
.018
)(0
.020
)(0
.018
)(0
.021
)(0
.087
)(0
.060
)(0
.008
)(0
.015
)L
ess
than
100
em
ploy
ees
0.05
5***
0.03
3*-0
.050
***
-0.0
37**
*-0
.037
**-0
.029
**0.
002
-0.0
36**
*-0
.003
-0.0
30**
*N
o.of
obs.
(661
;756
)(0
.009
)(0
.006
)(0
.018
)(0
.015
)(0
.019
)(0
.016
)(0
.034
)(0
.011
)(0
.008
)(0
.011
)M
ore
than
100
em
ploy
ees
0.06
2***
0.01
4***
0.00
4-0
.041
***
0.02
0*-0
.027
**0.
043
-0.0
510.
002
-0.0
16N
o.of
obs.
(1,1
21;1
,203
)(0
.004
)(0
.005
)(0
.012
)(0
.014
)(0
.012
)(0
.015
)(0
.048
)(0
.049
)(0
.005
)(0
.011
)
Not
es:
aC
ontr
ols
incl
uded
in
the
regr
essi
ons
are:
13 r
egio
nal
dum
mie
s,13
ind
ustr
y du
mm
ies
and
4 du
mm
ies
for
type
of
owne
rshi
p;10
,5
and
1 le
vels
of
confi
denc
e ar
e in
dica
ted
by *
,**
and
***,
resp
ecti
vely
.Sta
ndar
d er
rors
are
in p
aren
thes
es.

Firm-level Consequences of Large Minimum-wage Increases 97
© CEIS, Fondazione Giacomo Brodolini and Blackwell Publishing Ltd 2004.
Tab
le 7
.E
ffec
ts o
fm
inim
um-w
age
chan
ges
on fi
rm a
vera
ge w
ages
and
firm
em
ploy
men
t,a
Slov
ak R
epub
lic:1
998–
99an
d 19
99–2
000
Dep
ende
nt v
aria
ble
Dln
in p
ropo
rtio
n of
Dln
in fi
rm’s
ho
urs
wor
ked
bypr
opor
tion
of
wor
kers
w
orke
rs w
ith
basi
cD
ln fi
rm a
vera
ge w
age
Dln
firm
em
ploy
men
tD
ln t
otal
hou
rsw
ith
basi
c ed
ucat
ion
educ
atio
n
1998
–99
1999
–200
019
98–9
919
99–2
000
1998
–99
1999
–200
019
98–9
919
99–2
000
1998
–99
1999
–200
0
Inde
pend
ent
vari
able
:pro
port
ion
oflo
w-p
aid
empl
oyee
s in
firm
Reg
ress
ions
usi
ng t
he t
wo-
thir
ds o
fm
edia
n pa
y va
riab
le a
s a
defin
itio
n of
low
pay
Tota
l0.
179*
**0.
852*
**-0
.108
*0.
416
-0.0
750.
543
0.03
9-0
.079
0.03
7-0
.086
No.
ofob
s.(5
13;1
19)
(0.0
38)
(0.3
03)
(0.0
40)
(0.6
19)
(0.0
80)
(0.6
41)
(0.0
42)
(0.1
98)
(0.0
54)
(0.1
98)
Pro
fit fi
rms
0.09
5**
1.34
6***
-0.1
46*
1.05
3-0
.099
1.00
10.
066
-0.2
240.
063
-0.2
28N
o.of
obs.
(284
;62)
(0.0
47)
(0.3
94)
(0.0
87)
(0.9
73)
(0.0
97)
(0.9
91)
(0.0
53)
(0.2
97)
(0.0
97)
(0.2
97)
Non
-pro
fit fi
rms
0.35
3***
0.21
6-0
.116
0.07
9-0
.054
0.24
7-0
.091
-0.1
28-0
.089
-0.1
38N
o.of
obs.
(229
;57)
(0.0
64)
(0.4
92)
(0.1
34)
(0.8
97)
(0.1
41)
(4.3
65)
(0.0
69)
(0.2
83)
(0.0
69)
(0.2
83)
Les
s th
an 1
00 e
mpl
oyee
s0.
193*
**1.
236*
-0.1
55*
-0.3
65-0
.108
-0.3
750.
096*
-0.0
700.
091*
-0.0
72N
o.of
obs.
(206
;54)
(0.0
64)
(0.7
11)
(0.0
94)
(0.8
80)
(0.1
28)
(0.9
16)
(0.0
59)
(0.3
07)
(0.0
59)
(0.3
11)
Mor
e th
an 1
00 e
mpl
oyee
s0.
178*
**0.
741*
*-0
.119
1.64
4*-0
.039
1.80
5**
-0.0
190.
006
-0.0
17-0
.021
No.
ofob
s.(3
07;6
5)(0
.049
)(0
.362
)(0
.113
)(0
.860
)(0
.111
)(0
.937
)(0
.060
)(0
.353
)(0
.060
)(0
.353
)R
egre
ssio
ns u
sing
the
min
imum
-wag
e ga
p va
riab
le a
s a
defin
itio
n of
low
pay
Tota
l0.
111*
**0.
269*
**-0
.038
***
0.13
8-0
.010
0.25
0*0.
006
0.00
60.
006
0.00
5N
o.of
obs.
(550
;134
)(0
.008
)(0
.075
)(0
.015
)(0
.147
)(0
.016
)(0
.152
)(0
.008
)(0
.048
)(0
.008
)(0
.048
)P
rofit
firm
s0.
046*
**0.
268*
**-0
.046
**0.
155
-0.0
250.
253
0.01
0-0
.001
0.00
9-0
.004
No.
ofob
s.(3
12;7
5)(0
.012
)(0
.083
)(0
.022
)(0
.182
)(0
.026
)(0
.185
)(0
.013
)(0
.056
)(0
.013
)(0
.056
)N
on-p
rofit
firm
s0.
147*
**0.
187
-0.0
36*
0.20
3-0
.009
0.11
8-0
.002
0.02
4-0
.003
0.02
5N
o.of
obs.
(238
;59)
(0.0
09)
(0.2
54)
(0.0
21)
(0.4
87)
(0.0
21)
(0.5
08)
(0.0
10)
(0.1
52)
(0.0
10)
(0.1
53)
Les
s th
an 1
00 e
mpl
oyee
s0.
129*
**0.
247*
-0.0
23*
0.22
9-0
.007
0.29
20.
007
0.06
50.
006
0.06
6N
o.of
obs.
(238
;66)
(0.0
10)
(0.1
41)
(0.0
15)
(0.1
95)
(0.0
20)
(0.2
07)
(0.0
09)
(0.0
65)
(0.0
09)
(0.0
66)
Mor
e th
an 1
00 e
mpl
oyee
s0.
085*
**0.
302*
**-0
.075
***
0.44
2*0.
006
0.50
7*0.
005
-0.0
960.
005*
-0.0
98N
o.of
obs.
(312
;68)
(0.0
14)
(0.1
23)
(0.0
34)
(0.2
71)
(0.0
33)
(0.2
95)
(0.0
18)
(0.1
10)
(0.0
18)
(0.1
10)
Not
es:
aC
ontr
ols
incl
uded
in t
he r
egre
ssio
ns a
re:9
reg
iona
l dum
mie
s,13
indu
stry
dum
mie
s an
d 4
dum
mie
s fo
r ty
pe o
fow
ners
hip;
10,5
and
1 le
vels
of
confi
denc
e ar
ein
dica
ted
by *
,**
and
***,
resp
ecti
vely
.Sta
ndar
d er
rors
are
in p
aren
thes
es.

Thus, the estimates imply that although the minimum-wage ratesare not binding, increases in them still have an indirect effect onfirms’ wages that is, moreover, rather large. This is clearly borne outby the regression analyses for both countries: the estimated influ-ences on firms’ labour demand are mixed, with the negative onesdominating. Assessing the impact on working hours is morestraightforward, and is found to be negative for the Czech Repub-lic. According to our estimations, the effect of the first largeminimum-wage hikes in 1998–99 on total working hours is negativein the Czech Republic; for the Slovak Republic the working hours’coefficients are positive in the second period.
We next look at whether the impact of minimum-wage hikesdiffers between different types of firms.12 More specifically, ourintention is to examine whether the effects differ between firms thatare operating with a profit motive and those that are not (state-owned firms, cooperatives). Furthermore, we will investigatewhether there are differences between firms of different size in rela-tion to wage and employment effects. This is of some interest assmall firms are likely to be operating in a more competitive environ-ment, leading us to expect a stronger negative effect on employmenthere. On the other hand, larger firms are more likely to fit themonopsony model of the labour market.
We begin by looking at the results for the Czech Republic. A firstobservation is that the size of the firm average wage effect does notdiffer between profit versus non-profit and small versus large firmsin the first period but it does in the second where the effects are sys-tematically larger in profit-motive and small firms. When lookingat the employment effect, it should be noted that labour demanddeveloped quite similarly in profit and non-profit firms between1998 and 2000. For the first period the estimates for changes inemployment differ considerably depending on which low-paymeasure is used. For the second period the employment effect isconsistently negative for all sub-samples. For changes in total hours,the results are similar; here there are negative effects in both typesof firms and no noteworthy differences in their magnitudes. Dis-tinguishing between small and larger firms shows negative employ-ment effects, especially in the second period, and negative hours’effects in both periods. The coefficients in the change-in-hoursequations are larger for smaller firms, but the differences are notstatistically significant.
For the Slovak Republic, the same pattern as for the aggregate isalso found for profit and non-profit firms as well as for small and
98 Tor Eriksson — Mariola Pytlikova
© CEIS, Fondazione Giacomo Brodolini and Blackwell Publishing Ltd 2004.

large firms. For Slovak firms there are some indications that the negative employment impacts are greater in the profit-motive andsmaller firms.
In the two last columns of Tables 6 and 7 we report the resultsfrom estimations with changes in the number or proportion of less-educated employees. The idea is to determine whether this categoryof employees, which makes up a large proportion of the low-paidworkers, is particularly hurt by the increase in minimum wages. Ascan be seen from the tables, in Slovakia there is little evidence ofthe demand for less-educated workers being affected, and for theCzech Republic the results are mixed — some cases of positiveemployment effects and a few small negative hours’ effects.
6. Conclusions
In this paper, we have made use of fairly large and detailed data-bases, collected in an identical way and containing informationfrom two countries: the Czech and Slovak Republics. This allowsus to examine how the internationally large increases in minimumwages — 40 and 30 per cent — in these two countries in the late1990s have affected firms’ wage costs and their labour demand.Clearly, provided the minimum wage were binding, increases of thismagnitude would in most cases lead most economists to expect sub-stantial decreases in employment. But as the increases in both coun-tries took off from very low levels, the minimum wages were bindingonly to a limited extent.
As is well known, increased minimum wages can lead to anincrease in employment if an employer has monopsony in a locallabour market. This can also happen even if there are a fairly large number of potential employers in the market. According toManning (2003) and the evidence presented therein, local labourmarkets are frequently ‘thin’ from the perspective of individualworkers. Thus, companies may very well operate as monopsonies.
The fact that the minimum wages are not binding except for asmall part of the labour market does not mean, however, thatchanges in them do not have important indirect effects. In the caseof the two countries studied here, two mechanisms are worth noting.Firstly, as the minimum wage constitutes the lowest tariff wage ratein the tariff system that underlies wage setting in both countries,increases in the minimum wage potentially affect a non-negligiblepart of the wage distribution. Secondly, and this is the case for the
Firm-level Consequences of Large Minimum-wage Increases 99
© CEIS, Fondazione Giacomo Brodolini and Blackwell Publishing Ltd 2004.
Czech Republic in particular, increasing minimum wages closer to orabove the subsistence wage is likely to strengthen the incentives oflow-paid workers to supply their labour to the market and may rein-force adjustment mechanisms in monopsonistic markets.
A key and very robust result of our econometric analysis is thatthe minimum-wage hikes had a large positive effect on firms’average wages. This effect was stronger in non-profit than in profitfirms. In the Czech Republic the first minimum-wage hikes in1998–99 resulted in higher employment whereas the next hikes wereaccompanied by reductions in firms’ demand for workers. In bothperiods the number of work hours was reduced. In the SlovakRepublic the first hikes gave rise to a decline in firms’ employmentbut no further changes in employment or hours. Thus, for bothcountries, the influences on firms’ labour demand appear to berather mixed. Likewise, in both countries there are no statisticallysignificant differences in the labour demand effects between profitand non-profit firms or between small and medium-sized and largefirms. Finally, we find that, at least in the short run, the minimum-wage increases do not seem to have changed the composition offirms’ workforces very much.
To sum up, the evidence from the Czech and Slovak Republicspresented in this paper indicates that the minimum-wage increasesclearly raise firms’ average wages. The pattern of the estimatedeffects on employment and working hours reflects the fact that ele-vating the minimum wage closer to and above the subsistence wagemotivates low-paid workers to supply more of their labour. The relatively large impact on firms’ average wages indicates that as theminimum wage becomes more binding, those portions of the wagedistribution other than the lowest tail are affected too. A conse-quence of further minimum-wage increases may therefore be thatthe adverse employment effects become larger. Hence, policies com-mitting the government to raise the minimum wage to a certain frac-tion of the average wage, before the consequences of the morerecent minimum-wage hikes are known, may have unintended detri-mental effects.
Notes
1 Monetary policy has been conducted towards the growth of the interest rates.2 See Marcincin and Beblavy (2000) and Lubyova et al. (1999) for an overview
of economic development in Slovakia.
100 Tor Eriksson — Mariola Pytlikova
© CEIS, Fondazione Giacomo Brodolini and Blackwell Publishing Ltd 2004.

3 The unionization rate was and has remained about 20 per cent. In general,employers have taken a strongly negative attitude to the existence of trade unionsin their companies.
4 The minimum wage is currently used as the basis for the general health in-surance contributions for certain categories lacking income from work, such asstudents, unemployed individuals who not eligible for unemployment benefits,women on maternity leave, self-employed individuals, etc.
5 The same changes were made in the Czech Republic 1 year earlier.6 The 1991 Act distinguishes between single-person households and households
with several members.7 Britain had in fact a minimum rate of pay system, where the rates were set by
industry-based wage councils. This system was abolished in 1993. Dickens et al.(1999) examined the wage and employment consequences of changes in theminimum rates. Their results show a significant compression of wage dispersionbut no negative impact on employment.
8 Thus, the result is consistent with both the competitive and the monopsonymodel.
9 For Czechoslovakia, Buchtíková (1995) carried out a simulation in an effort todescribe the effect of a minimum-wage increase on employment and wage distri-bution in some Czechoslovak industries in the early 1990s. However, the simula-tions were not based on estimates of parameters using Czech data and, moreover,the data used in the simulations referred to state enterprises.
10 We have also estimated the wage and employment equations on a pooled dataset including both countries and both periods, obtaining, for the most part, thesame results. The restrictions that the coefficients are equal across the two coun-tries are, however, decisively rejected by the data.
11 Overviews of the development in hourly wage distribution during 1998–2000 for the Czech and Slovak Republics are available from the authors on request.
12 Unfortunately, in some cases the results for the subgroups for the SlovakRepublic have to be based on rather few observations.
References
Abowd J., Kramarz F. and Margolis D. (1999) ‘Minimum Wages and Employmentin France and United States’, Working Paper No. 6996, NBER, Cambridge,MA.
Bhaskar V., Manning A. and To T. (2002) ‘Oligopsony and Monopsonistic Com-petition in Labor Markets’, Journal of Economic Perspectives 16: 155–174.
Brown C. (1988) ‘Minimum Wage Laws: Are they Overrated?’, Journal of Eco-nomic Perspectives 2: 133–147.
Brown C., Gilroy C. and Kohen A. (1982) ‘Time-series Evidence of the Effect ofthe Minimum Wage on Youth Employment and Unemployment’, Journalof Human Resources 18(1): 3–46.
Buchtíková A. (1995) ‘Have Minimum Wages Hit Employment in the Czech Trans-formation?’ in Standing G. and Vaughan-Whitehead D. (eds.) MinimumWages in Central and Eastern Europe: From Protection to Destitution,Budapest: Central European University Press, ILO.
Firm-level Consequences of Large Minimum-wage Increases 101
© CEIS, Fondazione Giacomo Brodolini and Blackwell Publishing Ltd 2004.
Card D. (1992a) ‘Using Regional Variations in Wages to Measure the Effects ofthe Federal Minimum Wage’, Industrial and Labor Relations Review 46(1):22–37.
Card D. (1992b) ‘Do Minimum Wages Reduce Employment? A Case-study ofCalifornia, 1987–89’, Industrial and Labor Relations Review 46(1): 38–54.
Card D. and Krueger A. (1994) ‘Minimum Wages and Employment: A Case Studyof the Fast Food Industry in New Jersey and Pennsylvania’, American Economic Review 84: 772–793.
Card D. and Krueger A. (1995) Myth and Measurement: The New Economics ofthe Minimum Wage, Princeton: Princeton University Press.
Castillo-Freeman A. and Freeman R. (1991) ‘Minimum Wages in Puerto Rico:Textbook Case of a Wage Floor?’, in 43rd Annual Proceedings of the IRRA,Washington, DC: n.p.: 243–253.
Currie J. and Fallick B. (1996) ‘The Minimum Wage and the Employment ofYouth’, Journal of Human Resources 31: 404–428.
Deere D., Murphy K. and Welch F. (1995) ‘Employment and the 1990–91Minimum Wage Hike’, American Economic Review (Papers and Proceed-ings) (May): 232–237.
Dickens R., Machin S. and Manning A. (1999) ‘The Effects of Minimum Wageson Employment: Theory and Evidence from Britain’, Journal of Labor Economics 17(1): 1–23.
Dolado J., Kramarz F., Machin S., Manning A., Margolis D. and Teulings C.(1996) ‘The Economic Impact of Minimum Wages in Europe’, EconomicPolicy No. 23: 319–372.
Fidrmuc J. (2001) ‘Migration and Adjustment to Shocks in Transition Economies’,ZEI Working Paper B23, Centre for European Integration Studies, Bonn.
Grossman J. B. (1983) ‘The Impact of the Minimum Wage on Other Wages’,Journal of Human Resources 18 (Summer): 359–378.
Kala F. (2002) ‘Description of Data ISPV and Source Data of Project’ in GottvaldJ. (ed.) Determinants of Individual Pay and Firm’s Pay Structures in theCzech and Slovak Republics, VSB–Technical University Ostrava.
Katz L. F. and Krueger A. B. (1992) ‘The Effect of the Minimum Wage on theFast Food Industry’, Industrial and Labor Relations Review 46(1): 6–21.
Kim T. and Taylor L. (1995) ‘The Employment Effect in Retail Trade ofCalifornia’s 1988 Minimum Wage Increase’, Journal of Economics and Business Statistics 13: 175–182.
Lubyova M., Ochrankova D. and Vantuch J. (1999) ‘Background Study onEmployment and Labour Market in the Slovak Republic’, European Train-ing Foundation Working Document, Bratislava.
Machin S., Manning A. and Rahman L. (2002) ‘Where the Minimum Wage BitesHard: The Introduction of the UK National Minimum Wage to a LowWage Sector’, Unpublished Working Paper.
Manning A. (2002) ‘The Real Thin Theory: Monopsony in Modern LabourMarkets’, Adam Smith Lecture, EALE Conference, Paris 2002.
Manning A. (2003) Monopsony in Motion: Imperfect Competition in LaborMarkets, Princeton: Princeton University Press.
Marcincin A. and Beblavy M. (eds.) (2000) Economic Policy in Slovakia 1990–1999,RC SFPA, Centre for Social and Media Analysis, Institute for Economicand Social Reforms, Bratislava.
102 Tor Eriksson — Mariola Pytlikova
© CEIS, Fondazione Giacomo Brodolini and Blackwell Publishing Ltd 2004.

Neumark D. and Wascher W. (1992) ‘Employment Effects of Minimum and Sub-minimum Wages: Panel Data on State Minimum Wage Laws’, Industrialand Labor Relations Review 46(1): 55–81.
Neumark D. and Wascher W. (1994) ‘Employment Effects of Minimum and Sub-minimum Wages: Reply to Card, Katz and Krueger’, Industrial and LaborRelations Review 47(3): 497–511.
Pytlikova M. (2002) ‘Wanted: Inter-regional Migration in the Czech Republic’,EALE Conference Paper, Paris 2002.
Rama M. (2001) ‘The Consequences of Doubling the Minimum Wage: The Caseof Indonesia’, Industrial and Labor Relations Review 54: 864–881.
Stewart M. (2002) ‘The Impact of the Introduction of the UK Minimum Wage on the Employment Probabilities of Low Wage Workers’, Working Paper,University of Warwick.
Wellington A. J. (1991) ‘Effects of the Minimum Wage on the Employment Statusof Youths’, Journal of Human Resources 26(1): 27–46.
Zavodny M. (1998) ‘Why Minimum Wage Hikes May Not Reduce Employment’,Federal Reserve Bank of Atlanta Economic Review, 2Q.
Firm-level Consequences of Large Minimum-wage Increases 103
© CEIS, Fondazione Giacomo Brodolini and Blackwell Publishing Ltd 2004.
Related Documents