Accepted Manuscript Firm age, corporate governance, and capital structure choices Robert Kieschnick, Rabih Moussawi PII: S0929-1199(17)30319-X DOI: doi:10.1016/j.jcorpfin.2017.12.011 Reference: CORFIN 1319 To appear in: Journal of Corporate Finance Received date: 17 May 2017 Revised date: 11 November 2017 Accepted date: 8 December 2017 Please cite this article as: Robert Kieschnick, Rabih Moussawi , Firm age, corporate governance, and capital structure choices. The address for the corresponding author was captured as affiliation for all authors. Please check if appropriate. Corfin(2017), doi:10.1016/j.jcorpfin.2017.12.011 This is a PDF file of an unedited manuscript that has been accepted for publication. As a service to our customers we are providing this early version of the manuscript. The manuscript will undergo copyediting, typesetting, and review of the resulting proof before it is published in its final form. Please note that during the production process errors may be discovered which could affect the content, and all legal disclaimers that apply to the journal pertain. ǒŊǖǐƋƚƃ¥ªǚƓ https://freepaper.me/t/429856

Welcome message from author
This document is posted to help you gain knowledge. Please leave a comment to let me know what you think about it! Share it to your friends and learn new things together.
Transcript

Accepted Manuscript
Firm age, corporate governance, and capital structure choices
Robert Kieschnick, Rabih Moussawi
PII: S0929-1199(17)30319-XDOI: doi:10.1016/j.jcorpfin.2017.12.011Reference: CORFIN 1319
To appear in: Journal of Corporate Finance
Received date: 17 May 2017Revised date: 11 November 2017Accepted date: 8 December 2017
Please cite this article as: Robert Kieschnick, Rabih Moussawi , Firm age, corporategovernance, and capital structure choices. The address for the corresponding author wascaptured as affiliation for all authors. Please check if appropriate. Corfin(2017),doi:10.1016/j.jcorpfin.2017.12.011
This is a PDF file of an unedited manuscript that has been accepted for publication. Asa service to our customers we are providing this early version of the manuscript. Themanuscript will undergo copyediting, typesetting, and review of the resulting proof beforeit is published in its final form. Please note that during the production process errors maybe discovered which could affect the content, and all legal disclaimers that apply to thejournal pertain.
https://freepaper.me/t/429856 خودت ترجمه کن :

ACCEP
TED M
ANUSC
RIPT
Firm Age, Corporate Governance, and Capital Structure Choices*
Robert Kieschnick
University of Texas at Dallas
School of Management, SM31
Richardson, Texas 75080
Email: [email protected]
Rabih Moussawi
Villanova University
Villanova School of Business
800 E Lancaster Ave, Bartley 1003
Villanova, PA 19085
Email: [email protected]
* We wish to thank Nina Baranchuk, Alex Edmans, Mark LaPlante, Jeff Netter, Xuhui Pan,
Michael Rebello, Kenneth Singleton, Harold Zhang and an anonymous referee for comments on
prior drafts of this paper.
ACCEPTED MANUSCRIPT
https://freepaper.me/t/429856 خودت ترجمه کن :

ACCEP
TED M
ANUSC
RIPT
Firm Age, Corporate Governance, and Capital Structure Choices
ABSTRACT
Do the effects of corporate governance on corporate capital structure choices change as a public
firm ages? First, we address the direct effects of firm age and governance features on both its
decisions to use debt and how much debt to employ. Our analysis reveals a number of novel
results. While firm age is positively correlated with the use of debt, it is negatively correlated
with how much debt a firm uses. We also find that the effects of firm age on how much debt a
firm uses is primarily due to the interaction between firm age and its governance features. The
more power that insiders possess, the less debt that the firm uses as it ages. We interpret our
evidence as implying that over time, managers allow their risk preferences to dominate their firm
capital structure decisions when they are protected from discipline.
Key words: firm age, corporate governance, capital structure
JEL Code: G32, G34
ACCEPTED MANUSCRIPT
https://freepaper.me/t/429856 خودت ترجمه کن :

ACCEP
TED M
ANUSC
RIPT
1
1. Introduction
Prior research suggests that as a firm grows older many of its features change, and
collectively these influence a number of aspects of its behavior. In terms of a firm’s capital
structure decisions, there are several studies that document how aging firms have more assets-in-
place than growth options, and so justifies their taking on more debt (e.g., Hovakimian, Opler
and Titman (2001), Sundaresan, Wang and Yang (2015), etc.).1
In a different vein, other research suggests that after going public, the appropriateness of
different corporate governance features for aging firms also changes. Filatotchev, Toms and
Wright (2006) argue that as firms age (and particularly after their IPO), their governance (board
composition) needs to change to reflect its different needs.2 More recently, Johnson, Karpoff
and Yi (2016) argue that the costs and benefits of takeover defenses change as the firm ages.
They report evidence that after a firm’s IPO, the costs tend to outweigh the benefits as the firm
ages and is reflected in their valuation, especially in firms that employ the most stringent
defenses. Both of these studies suggest that the effect of these features on a firm’s capital
structure decisions may change as the firm ages as a publicly traded firm.
Given the above points, we are the first study to examine how the age of a firm since its
initial public offering mediates the effects of its governance on the firm’s capital structure
choices. However, to examine this issue we must confront several issues that are poorly
addressed in prior research. First, much of the prior empirical research has used capital structure
measures that violate the concerns raised by Welch (2007, 2011). For example, many empirical
corporate capital structure studies use measures for which equity is not the obverse of debt, or
vice versa. Second, a number of studies use book value measures (e.g., Mehran (1992), etc.) and
fail to recognize that the book value of equity is a plug number in accounting. As a consequence,
book value measures cannot reveal much about a firm’s financing choices except for firms that
have not suffered a loss.
Third, prior research on the influence of corporate governance on corporate capital
structure typically uses capital structure measures that are compositional or fractional variables.
This fact has both statistical and theoretical implications. As pointed out by statisticians (e.g.,
Cox (1996)) and econometricians (e.g., Papke and Wooldridge (1996)), the conditional
1 So accepted is this argument, that it even shows up in textbooks (e.g., Vernimmen et. al. (2005), etc.).
2 While Filatotchew, Toms and Wright discuss the need for the governance of a firm to change over the different
phases of its life cycle, they only provide illustrations of why the composition of the board needs to change.
ACCEPTED MANUSCRIPT
https://freepaper.me/t/429856 خودت ترجمه کن :

ACCEP
TED M
ANUSC
RIPT
2
expectation function for such variables must be nonlinear since these are doubly-bounded
random variables. Unfortunately, the implications of using linear or censored linear regression
models for these data are poorly understood, as evidenced by the continued use of such linear or
censored linear regression models in capital structure studies. When one estimates a linear
regression model for these data, then one is effectively estimating the first order terms of a
Taylor series approximation. Thus, all the higher order terms are now relegated to the error term
which induces endogeneity bias across all the explanatory variables. As a result, one cannot trust
the evidence from estimating linear models for these data either in terms of their parameter
estimates, their standard error estimates, or their assessment of the endogeneity of an explanatory
variable. Since corporate governance is often viewed an endogenous outcome, this last issue is a
critical concern.
Fourth, the vast majority of these studies ignore the evidence that there are firms in their
samples that do not use “debt” as they define debt. This treatment has statistical and theoretical
implications. Statistically, prior research that uses either a censored linear or a linear regression
model for similar data ignores the selection issue. Theoretically, they are ignoring the possibility
that the decision to use ‘debt’ is influenced by different factors and in various ways than the
decision on how much debt to use conditional on the decision to use debt. Consistent with this
concern, prior research (e.g., Strebulaev and Yang (2013)) implies that the governance features
of firms that do not use ‘debt’ are quite different from firms that do. Thus, the failure to address
this aspect of the data raises additional issues in interpreting prior evidence on the influence of
corporate governance on corporate capital structure decisions.
Our paper contributes to the literature by examining the effects of firm age on how
corporate governance influences a firm’s capital structure choices after explicitly addressing the
aforementioned empirical concerns. To do this, we use data on U.S. corporations from 1996 to
2016. Based on our examination of these data, we draw the following major conclusions.
First, firm age, without considering its interaction with different corporate governance
features, is negatively correlated with a firm’s use of debt conditional on its using debt. This
result contrasts with extant arguments about the correlation between firm age and corporate
capital structures. But, as we show, this negative effect is largely due to the interaction between
firm age and its governance features.
ACCEPTED MANUSCRIPT
https://freepaper.me/t/429856 خودت ترجمه کن :
ACCEP
TED M
ANUSC
RIPT
3
Second, consistent with Strebulaev and Yang (2013), we find that the corporate
governance features that significantly influence whether a firm uses debt differ from those that
influence how much debt that the firms uses if it uses debt. More specifically, we find that dual
class firms are more likely to be all equity firms initially, but they are also more likely to use
debt as they age as public corporations. We interpret this evidence to imply that these firms turn
to lower cost sources of external financing to fund their growth since selling new equity might be
more expensive for them.
Third, we find evidence the corporate charter provisions of a firm and its board
composition are correlated with omitted variables in regression models of how much debt
financing that a firm chooses to use conditional on its using debt. In the case of corporate charter
provisions, our evidence is consistent with the evidence in Karpoff, Schonlau and Wehrly
(2017). More importantly, these omitted factors are negatively correlated with the firm’s use of
debt financing and so may account for prior evidence of negative correlations between these
governance features and corporate debt use.
Fourth, we find evidence that as a firm ages, its corporate charter restrictions and board
composition influence its capital structure choices quite differently than they do when the firm is
young. This evidence is consistent with the arguments in Filatotchev, Toms and Wright (2006)
and Johnson, Karpoff and Yi (2016). Further, these changes largely explain why we find that
firm age is negatively correlated with how much debt financing a firm uses.
Altogether, we interpret our evidence as suggesting that as a firm grows older, entrenched
managers are able to let their risk preferences play a greater role in their firm’s capital structure
decisions (e.g., Bertrand and Mullainathan (2003), Morellec (2004), Lewellen (2006), Gow,
Kaplan, Larcker, and Zakolyukina (2016), etc.). To lay out our evidence for the above
conclusions, we organize our paper as follows. Section 2 describes our sample construction and
variable definitions. Section 3 provides our baseline analyses on the issues of concern, and
Section 4 provides evidence on the robustness of our conclusions. Section 5 assesses the
implications of our findings, and Section 6 concludes.
2. Sample Data and Variable Definitions
To construct our sample, we start with the corporations in Compustat with non-negative
total assets or sales between 1996 and 2016. We use this database for our annual and quarterly
ACCEPTED MANUSCRIPT
https://freepaper.me/t/429856 خودت ترجمه کن :

ACCEP
TED M
ANUSC
RIPT
4
accounting data. We then matched these data with data from CRSP to compute certain variables
(e.g., asset volatility). We also match these data with data from the FRED database for inflation
measures, and with before financing tax estimates from John Graham.3
Our corporate governance data is drawn from different databases provided by
Institutional Shareholder Services’ (ISS) RiskMetrics (formerly IRRC). We use RiskMetrics’
Directors database in order to extract board size, composition, and ownership information, and
the RiskMetrics’ governance database to extract information on firms’ corporate charter features.
Unfortunately, ISS’ RiskMetrics provides a new data feed after 2007 that does not include many
of the governance provisions used by Gompers, Ishii, and Metrick (2003) to construct their
Governance Index (Gindex). Consequently, we provide a detailed methodology to reconcile the
governance provisions in the old and new RiskMetrics’ governance datasets in order to construct
a Gindex-type governance index, which is consistent throughout the entire sample time period,
as well as the more parsimonious index proposed by Bebchuk, Cohen, and Ferrell (2009) that
focuses on six prominent governance provisions. As demonstrated in Table 1, the need to use
RiskMetrics data on governance and directors restricts our sample size.
Capital structure measure
Welch (2011) points out that the question of how to measure a firm’s capital structure is
more important than often recognized. Unfortunately, prior empirical capital structure research
has tended to ignore two critical issues. First, studies (e.g., Mehran (1992), etc.) that use book
value measures fail to recognize that book equity is a plug number in accounting that is used to
balance assets and claims on assets and so cannot represent a firm’s equity financing choice.4
This problem not only arises for firms that report negative book equity, but also for firms that
report negative earnings for any given year or firms. Thus, as Trimbath (2001), Welch (2011),
and others point out, book value measures of a firm’s capital structure are questionable measures
for testing theories of capital structure choices.
Second, as Welch (2011) points out, many empirical capital structure studies use
measures for which increases in debt do not necessarily imply increases in equity, or vice versa.
This situation is illustrated by Berger, Ofek and Yermack (1997) and similar studies.
3 We thank John Graham for making these data available for our use. These estimates are based on the
methodology detailed in Graham and Mills (2008). 4 See Pratt and Hirst (2009) or other accounting textbooks for discussion of why this is so.
ACCEPTED MANUSCRIPT
https://freepaper.me/t/429856 خودت ترجمه کن :

ACCEP
TED M
ANUSC
RIPT
5
Because of the above measurement issues, we focus on the following measure of a firm’s
capital structure (MLM): 5
As demonstrated by Figure 1, and like many similar measures, MLM has a large probability mass
at 0 (i.e. LM [0,1) ) – which reflects the presence of “all equity” firms in the sample. This
feature introduces statistical issues that we noted earlier, and discuss further below.
Firm age measures
One can measure firm age as the time between the initial creation of a firm and the
present time (in years). One can measure firm age as the time between its going public and the
present time (also in years). We choose to focus on the second measure of firm age since
Filatotchev, Toms and Wright (2006) and Johnson, Karpoff and Yi (2016) both emphasize the
length of time that a firm has been a public firm as the key feature influencing how firm age
moderates the influence of governance in publicly traded firms. To measure this feature, we
used Jay Ritter’s IPO date,6 Compustat’s first reported fiscal period end date (datadate variable),
and CRSP’s initial listing date (first trading date). Because we derive similar conclusions
regardless of which base year we use, we will simply report estimates of the length of time a firm
has been public based on its CRSP listing information since this produces a larger sample size,
and using the Compustat data in our robustness check since Strebulaev and Yang (2013) use the
dates in Compustat for their firm age measure.
Corporate governance measures
We follow corporate law in identifying the key elements of corporate governance. That
is, we use board size, board composition, and corporate charter/bylaw provisions as the essential
features of corporate governance. A corporation does not exist without having a corporate
charter and requires a board to set corporate policy if it has more than 300 investors. In addition
to these measures, we add whether the CEO is also the chairman of the board since some argue
5 We recognize that there is some controversy over whether preferred stock should be classified as “debt” or
“equity.” To avoid such controversy, we only focus on financing that is either debt or equity. However, including
preferred stock in our measure did not change any of our conclusions. 6 https://site.warrington.ufl.edu/ritter/ipo-data/, we thank Jay Ritter for making his data available to researchers.
ACCEPTED MANUSCRIPT
https://freepaper.me/t/429856 خودت ترجمه کن :

ACCEP
TED M
ANUSC
RIPT
6
that this is a key board feature. Also, we add whether the firm has a dual class structure with a
superior voting share class, since this is typically excluded from standard charter index metrics
and it is an important corporate charter feature.
Board size: We define Board size as the number of directors on the board. This variable is
considered in a number of studies of corporate governance to be negatively correlated with the
strength of board monitoring of management.7 As shown in Table 2, the median board size is 9
board members for our sample.
PIboard: To capture board composition, we use proportion of insiders on board. Specifically,
we compute the fraction of board members who are also managers of the company or family
members of managers of the company. We focus on the proportion of insiders on the board,
rather than the proportion of outsiders (independents) on the board because of the potential
uncertainty about who is truly an outside board member. On average, insiders of the company
represent 19% of the board in our sample.
Gindex: We use Institutional Shareholder Services’ (ISS) RiskMetrics Governance database
(formerly known as the IRRC Takeover Defense database) which provide two separate feeds of
governance provisions. The first feed, the ISS Governance dataset provides the governance
provisions for the largest 1500 companies between 1990 and 2006. Gompers, Ishii and Metrick
(2003) used this database to construct their Gindex measure.
In 2007, a new governance database, known as RiskMetrics governance data, was
released for the year 2007 which resulted from a different collection process and contains
therefore different variables. According to the documentation on Wharton Research Data Service
(WRDS), RiskMetrics data includes an initial comprehensive review of the company bylaws and
charter, while the former IRRC data focused on changes from one vintage to the next. In
particular the new data does not include many of the provisions that were part of the original
IRRC feed.
In order to construct a consistent Gindex-like governance index over the entire sample
period using both feeds of data, we first translate all the RiskMetrics governance provisions into
7 See Hermalin and Weisbach (2003) for a review and further discussion of such studies.
ACCEPTED MANUSCRIPT
https://freepaper.me/t/429856 خودت ترجمه کن :

ACCEP
TED M
ANUSC
RIPT
7
their equivalent dummy variable provisions in the IRRC feed. Then, we use the six state laws
provisions from the 2006 version of the IRRC (Business Combination (Freezeout), Fair Price,
Control Share Acquisition, Recapture of Profits, Control Share Cashout, and Director Duties
(Stakeholder Clause) Law) and populate them for the new data after merging by state. We also
use the state law opt-outs from the new dataset whenever it is available. Provisions that are
missing in the new feed are excluded from the computation of our governance index, in both
sub-periods (1990-2006, and 2007-2017).
Specifically, we exclude the following eight governance provisions that are not in the
new ISS RiskMetrics Governance data: Anti-greenmail provision, Director’s Duties-
Nonfinancial Impact, Director Liability, Director Indemnification, Director Indemnification
Contracts, Compensation Plans, Silver Parachutes, and Pension Parachutes. Gindex therefore
includes the following individual provisions, in addition to the six state laws (net of opt-outs)
mentioned above: blank check preferred stock, classified or staggered board, fair price, limits to
charter amendments, limits to shareholder bylaws amendments, limits to call special meetings,
limits for written consent, supermajority requirements to approve mergers, poison pill, golden
parachutes, unequal voting, cumulative voting (the lack thereof), and confidential voting (the
lack thereof).
Eindex: We follow Bebchuk Cohen and Ferrell (2009) and construct their Eindex metric, which
contains the following six provisions: classified or staggered boards, limits to charter
amendments, limits to shareholder bylaw amendments, supermajority requirements for mergers,
poison pills, and golden parachutes. We use this index in our examination of the robustness of
our baseline evidence that uses the above modified Gindex metric.
Dual class: Prior research (e.g., Daines and Klausner (2001), etc.) suggests that having dual
class stock with differential voting rights is an alternative to the use of restrictive corporate
charter provisions. Since many corporate charter indices do not include this feature, we
construct a dummy variable that takes on the value of 1 if a firm has dual class stock.
CEO-Chair: A number of studies suggest that when the CEO is also the chairman of the board,
that this confers additional power to the CEO and diminishes the ability of the board to monitor
ACCEPTED MANUSCRIPT
https://freepaper.me/t/429856 خودت ترجمه کن :

ACCEP
TED M
ANUSC
RIPT
8
and discipline management. Consequently, we create a dummy variable that takes on the value
of 1 if the CEO is also chairman of the board.
Control variables
While not a focus of our study, we try to control for any factor that robustly explains the
variation in corporate capital structures. For this purpose, we start with Frank and Goyal’s
(2009) identification of different explanatory variables and then adjust their list with information
from subsequent studies (e.g., Lemmon, Roberts, and Zender (2008), etc.). As a result, we use
the following variables as control variables in our study.
Industry median LM: This variable represents the median LM measure for firms in a firm’s
industry. Consistent with Gillan, Hartzell, and Starks (2003) and Gompers, Ishii, and Metrick
(2003), we use Fama and French’s (1997) 48 industry classification when computing industry
medians. One interpretation is that this variable should capture the influence of a firm’s
industry or competitors on its capital structure choices.8 Another interpretation is that it captures
the fitness benchmark of a firm in an evolutionary model of corporate capital structure choices
(see Arce, Cook and Kieschnick (2015)). Please note that we only use the prior median (a pre-
determined measure) and not the current median in our analyses which is consistent with
learning from others’ prior decisions and avoids the reflection problem.
Initial LM: This variable represents the initial capital structure of a sample firm when it first
goes public. The use of a firm’s initial leverage measure is also consistent with the evidence in
Lemmon, Roberts, and Zender (2008). As they note, this variable captures firm fixed effects as
it does not change over time but does across firms. Further, and just as important, it addresses
the initial conditions problem for nonlinear models discussed in Wooldridge (2005) and others.
Ln(Assets) is the natural logarithm of the firm’s total assets. This variable captures the effect of
firm size on a company’s capital structure choices. One interpretation of why firm size matters
8 Because of the controversy of how to interpret this measure, we also excluded it from our analyses and do not find
that this substantially changes our basic conclusions about the effects of firm age, corporate governance, or their
interaction on corporate financing decisions.
ACCEPTED MANUSCRIPT
https://freepaper.me/t/429856 خودت ترجمه کن :

ACCEP
TED M
ANUSC
RIPT
9
is because it captures a firm’s access to capital markets and its associated transaction costs. As a
result, firm size often figures in different financial constraint measures.
Market-to-book ratio is the ratio of the market value of assets to the book value of assets for a
firm. This variable is typically found to be a significant determinant of a firm’s capital structure
and is often interpreted to capture its growth prospects.
Asset tangibility denotes the ratio of inventory and fixed assets to total assets. This variable is
typically found to be a significant determinant of a firm’s capital structure and is often
interpreted to capture its ability to use collateralized debt.
Asset volatility: We follow the logic of Crosbie and Bohn (2003) and derive an estimate of a
firm’s asset volatility that is consistent with the Black/Scholes/Merton option framework for
corporate claims.
Profitability represents the ratio of operating income to total assets. This variable is typically
found to be a significant determinant of a firm’s capital structure and is often interpreted to
capture its operating cash inflows.
Expected inflation rate: We use the 90-day T-bill rate to capture these expectations.9 We
conjecture that this measure better captures market expectations about future inflation, which
Frank and Goyal (2009) find to be a significant influence on corporate capital structure
decisions.
GM marginal tax rate: We use Graham and Mills’ (2008) before financing marginal tax rate as
they provide evidence that it is a statistically significant determinant of a firm’s capital structure.
Appendix 1 provides further information on the construction of the above variables, and Table 1
provides their summary statistics.
9 We did not use the CPI or similar inflation metrics because they are not forward looking measures and we should
expect firms to be forward looking. We also tried Treasury bond rates over different future horizons but derive
similar results and so use this measure as it has been used in prior research.
ACCEPTED MANUSCRIPT
https://freepaper.me/t/429856 خودت ترجمه کن :
ACCEP
TED M
ANUSC
RIPT
10
3. Analysis of Firm Age, Corporate Governance and Capital Structure Choices
We do several things in this section. First, we identify a statistical model that addresses
the statistical issues identified earlier. Second, using this statistical model, we provide a baseline
analysis without considering the potential endogeneity of some of our governance variables. We
do this so our evidence that accounts for such endogeneity issues can be contrasted with this
evidence. Third, we test for the endogeneity of our corporate governance measures using an
approach that is appropriate for the kind of nonlinear models that we employ. Fourth, we
provide a revision of our baseline analysis that accounts for the endogeneity of certain
governance features but not for the effect of firm age on these features. And finally, we provide
a revision of our analysis that accounts for the endogeneity of certain governance features to
incorporate the potential effects of interactions between a firm’s governance features and its age
on its capital structure choices. Together these analyses represent the core contributions of this
study.
3.1. Statistical issues and their theoretical implications
A common practice in most empirical studies on the role of corporate governance in
capital structure decisions is measuring a firm’s capital structure by some fractional or
proportional variable. Specifically, all such studies that we have reviewed define a firm’s capital
structure as a ratio of ‘debt’ to ‘debt’ plus ‘equity’, which by construction is a fractional variable.
Cox (1996), Papke and Wooldridge (1996) and others have shown that the conditional
mean of a fractional or proportional random variables must be nonlinear. Consistent with these
arguments, Cook, Kieschnick and McCullough (2008), Fattouh, Harris and Scaramozzino
(2008), Ramalho and Silva (2009), Ramalho, Ramalho, and Murteira (2011), and others report
evidence that the conditional expectation function for a firm’s capital structure is nonlinear.
One might argue that the typical linear model used in empirical capital structure can be
interpreted as first order Taylor series approximations to a nonlinear surface around the mean.
Such an argument misses two subtle but important concerns: (1) erroneously induced
endogeneity, and (2) erroneously implied homogeneity. To see the first error, one must
recognize that the higher order terms of a Taylor series approximation must form a large part of
the error term in a linear regression model. Consequently, there is will be a correlation between
ACCEPTED MANUSCRIPT
https://freepaper.me/t/429856 خودت ترجمه کن :

ACCEP
TED M
ANUSC
RIPT
11
the error term and each of the included explanatory variables that is likely to be more serious for
the more significant determinants of a firm’s capital structure. Further, it should be clear that
this form of endogeneity bias cannot be addressed by standard instrumental variable methods for
a linear model because any instrument that is correlated with the “suspect” regressor must be
correlated with the “suspect” regressors’ high order terms in the residual. Consequently, it is
unclear what confidence one can have in prior evidence on the effects of corporate governance
on corporate capital structure that used a linear regression model.
The second error arises because linear regression model for these data ignore the fact that
some firms do not use debt in their sample. This feature has two important implications that are
ignored in prior empirical capital structure studies. First, as shown in Capinski and Kopp (2004),
the failure to account for this feature implies that these studies have estimated the wrong
conditional mean of the distribution of firm capital structures. This error can account for the
inference of some studies that firms under-utilize debt given their features. Second, as
Humphreys (2013) points out, these observations are likely the results of economic decisions
driven by separate considerations. In other words, the factors influencing the decision to use
debt may be different from the factors that influence decisions on how much debt to use once the
decision to use debt has been made. Cook, Kieschnick, McCullough (2008) and Ramalho,
Ramalho, and Murteira (2011) examine this issue and provide strong evidence that it is important
to recognize this distinction when examining the factors that influence a firm’s capital structure
choice. These conclusions were reinforced, in the case of corporate governance issues, by a
number of studies (e.g., Strebulaev and Yang (2013)) that suggest that the governance features of
zero leverage firms are quite different from the governance features of non-zero levered firms.
Consequently, we address the above issues by using the two-part quasi-likelihood model
based on Papke and Wooldridge’s (1996, 2008) quasi-likelihood model developed in Ramalho
and Silva (2009) and Ramalho, Ramalho, and Murteira (2011) for these data.10
By doing this we
provide better evidence on which corporate governance features, if any, matter for corporate
capital structure decisions.
10
Using Ospina and Ferrari’s (2010) zero-inflated beta regression model leads us to similar conclusions to those
reported, but we use the quasi-likelihood version to avoid debate over the proper specification of the continuous
component.
ACCEPTED MANUSCRIPT
https://freepaper.me/t/429856 خودت ترجمه کن :

ACCEP
TED M
ANUSC
RIPT
12
3.2 Baseline analyses without correction for endogeneity or interaction effects
We begin our analysis of the effects of corporate governance on corporate capital
structure decisions by ignoring potential endogeneity problems introduced by the use of
governance variables and the potential interaction between firm age and a firm’s governance
features. We do so in order to establish a benchmark against which we can judge how
addressing endogeneity, for example, affects our inferences. We report the results of estimating
our two-part quasi-likelihood model in Table 2. Please note that in this and all subsequent
estimated regression models, we use the lagged values of the regressors. Consequently our
regressors are predetermined variables.
The second column of Table 2 reports the influence of the different regressors on the
probability that a firm uses debt financing, since the second part is conditional on this decision.
One can simply flip the signs of the coefficients to examine the effect of a variable on probability
of a firm being an all equity firm. The reported evidence implies that the likelihood of a firm
using debt is significantly correlated with its industry’s use of debt (+), its initial use of debt (+),
its size (+), its asset tangibility (+), its asset volatility (-), its profitability (-), its board size (+),
and its use of dual class stock (-).
By and large, the evidence on the effects of our control variables on the use of debt are
consistent with the evidence reported in Strebulaev and Yang (2013). What is new or different is
that board size and the dual class stock are significantly correlated with these choices and that a
firm age since going public is not.11
Further, we find that a firm’s industry’s use of debt is a
significant influence on it use of debt. This last result is consistent with firms paying attention to
their competitors past decisions on financing in making their current financing choices.
Next, in column three of Table 2, we turn to examine the evidence on what factors
significantly influences a firm’s decision on how much debt to use conditional on its use of debt.
We find that how much debt financing a firm uses is significantly correlated with its industry’s
use of debt financing (+), its initial use of debt (+), its size (+), its growth prospects (-), its
profitability (-), its asset volatility (-), its tax rate before financing (-), its age (-), its board size (-
), and the proportion of insiders on its board (-). While the sign of the Graham-Mills (2008)
before financing tax rate is the opposite of what they report, it is consistent with the fact that
11
Strebulaev and Yang use a firm age measure based on Compustat presence. When we use this measure, we find it
to be significant at the 10% marginal significance level.
ACCEPTED MANUSCRIPT
https://freepaper.me/t/429856 خودت ترجمه کن :

ACCEP
TED M
ANUSC
RIPT
13
more profitable firms use less debt financing. Of more interest, given the focus of our study, we
find that firm age since going public is negatively correlated with how much debt it uses – which
is inconsistent with the evidence in Hovakimian, Opler and Titman (2001), Sundaresan, Wang
and Yang (2015), etc. How much of this difference is due to our addressing statistical issues that
they ignored is unclear. Regardless, this evidence is more consistent with the evidence Deangelo
and Roll (2015) that older firms appear to value financial flexibility or unused debt capacity.
3.3 Testing for the endogeneity of corporate governance in capital structure decisions
Before we can address how firm age influences the effects of corporate governance on a
firm’s capital structure choices, we have to address the potential endogeneity of our different
corporate governance measures. To address endogeneity issues in nonlinear models, such as
ours, requires a different methodology than is usual in empirical finance with its reliance on
linear models. Two stage prediction methods, which two stage least squares is an example, can
produce biased and inconsistent estimators in nonlinear models (see Terza, Basu and Rathouz
(2008)). To address this concern, we follow Wooldridge (2014) and employ the control function
approach. Terza, Basu and Rathouz (2008) demonstrate this type of estimator provides more
consistent estimates of the parameters than do two stage prediction estimators in nonlinear
models. 12
To implement this approach, one proceeds in two steps. First, you regress the other
regressors on the potentially endogenous variable along with instruments; just as you might with
a two-stage least squares regression. Next, you extract the residuals from this regression, which
becomes the control function for the potentially endogenous variable. And finally, you include
this control function in the primary regression model along with the potentially endogenous
variable. The logic of the control function approach is that this separates out, or controls, that
part of the endogenous variable that is correlated with the error term.13
Of special note, Heckman and Vavarro-Lozano (2004) demonstrate that the control
function approach is more robust to omitted variable problems in estimation than many
alternatives. Specifically, they point out: “Because the method of control functions explicitly
12
See Greene (2017) or Wooldridge (2010) for textbook descriptions of the control function approach to addressing
endogeneity. This approach is now the dominant approach for dealing with endogeneity in semi-parametric and
non-parametric regression models. 13
It is worth noting that the control function approach and two-stage least squares approach produce exactly the
same parameter estimates for an endogenous regressor in a linear model.
ACCEPTED MANUSCRIPT
https://freepaper.me/t/429856 خودت ترجمه کن :

ACCEP
TED M
ANUSC
RIPT
14
models omitted relevant conditioning variables, rather than assuming that there are none, it is
more robust to omitted conditioning variables.” 14
This point is relevant for our study as our
regressors are predetermined variables. Therefore, the likely cause of their being endogenous
variables in our regression models is because of their correlation with omitted variables.
Applying this procedure, we first regress a firm’s ln(Gindex), ln(board size), PIBboard,
Dual class and CEO Chair measures on the other variables included in the regression models
reported in Table 2 along with different instruments, and then use the residuals from these
regressions as control functions. As instruments, we use a set of state dummy variables.
Specifically, we identify if a firm is incorporated in California, Texas, Maryland, Minnesota,
Ohio, Nevada, New York and Pennsylvania.
These choices are reasonable for three reasons. First, state law controls what provisions
might be or might not be included in a corporate charter. Second, there is variation in permitted
ATPs across states. For example, firms incorporated in Texas or California have few state ATPs,
whereas those incorporated in Pennsylvania or Ohio have many state ATPs. Third, the corporate
law of a state likely influences other aspects of its governance. Moreover, there is no reason to
expect that the state in which a firm is incorporated (rather than headquartered) will be correlated
with economic or financial influences on its capital structure choices. For example, a firm with
headquarters in California and incorporated in Delaware is more likely to be influenced in its
financing decisions by companies with headquarters near it geographically, and yet its corporate
governance features are more likely to be influenced by what is permitted by Delaware
corporation law – which is the channel of concern. Note that this argument is consistent with the
evidence in Gao, Ng, Wang (2010) and explains why we cannot use the geography based
instruments used in Karpoff, Schonlau and Wehrly (2017).
With these points in mind, we report in Table 3 the regressions of each of the corporate
governance features that we consider on our control variables, other governance features and
instruments. As might be expected, we observe more of these instruments being significantly
correlated with our ln(Gindex) variable than with our other governance variables. Nevertheless,
we observe significant coefficients for one or more instruments for each of the other governance
variables. Just as importantly, the instruments that are significant differs across governance
14
Heckman and Navarro-Lozano (2004), page 30.
ACCEPTED MANUSCRIPT
https://freepaper.me/t/429856 خودت ترجمه کن :

ACCEP
TED M
ANUSC
RIPT
15
measures. In fact, we can show that incremental F tests are significant at that the 1% marginal
significance level for each governance feature for an appropriate choice of these instruments.
What is particularly interesting about the evidence in Table 3 is that the partial
correlations between these state of incorporation variables and each of our governance features is
statistically significant. For example, firms incorporated in Texas or California have fewer ATPs
in their corporate charters than firms incorporated in other states, and they also tend to have
smaller boards, fewer insiders on their board, less likely to have a CEO be the chairman, and to
use dual class stock. In other words, as conjectured above, the corporate law of a state influences
more than just what is permitted in a corporate charter.
While these results imply that our instruments were relevant, they do not show that they
are exogenous. Unfortunately, there is controversy about whether one can even establish
instrument exogeneity (e.g., Roberts and Whited (2013)). A further complication is that there are
no well-established tests for exogeneity in the kinds of nonlinear models that we estimate. So,
we address this issue in two ways. First, by examining the variability of corporate capital
structures across states and then later, in our robustness section, the robustness of our evidence to
different instruments.
We examine the variability of our corporate capital structure measure both for the U.S.
and for each state and report this evidence in Table 4. This evidence suggests that there is as
much variability in capital structures of firms in each state of incorporation that we identified as
instrument as there is in the whole U.S. and so we do not observe tighter clustering in some of
these states than in the population. Thus, there are as many other influences on the corporate
structure decisions of firms in each state of incorporation as there are in the whole U.S. While
this does not prove that our instruments satisfy the exogeneity requirement, it is certainly
consistent with their doing so.15
Consequently, we will proceed as if our instruments are valid
instruments and examine the robustness of our conclusions to a different set of instruments later.
Given the implied control functions for each of our governance measures, we can now
test if they are exogenous variables in our capital structure regressions. One of the nice features
of the control function approach is that if the control function associated with a governance
measure is statistically significant, then this indicates that the associated governance variable is
15
Remember instrument exogeneity requires an instrument to be uncorrelated with the conditional error. Our
evidence suggests there is a lack of correlation with the unconditional error, which implies the latter.
ACCEPTED MANUSCRIPT
https://freepaper.me/t/429856 خودت ترجمه کن :

ACCEP
TED M
ANUSC
RIPT
16
an endogenous variable in our capital structure regressions. With this point in mind, we
incorporate the control function associated with each of our corporate governance variable into
the two-part regression models reported in Table 2. To make it is easier to see their implications,
we separate the results for estimating their effects on the probability of using debt from the
results on their effects on how much debt a firm uses conditional on its using debt. Table 5
reports the evidence for the factors influencing the likelihood of a firm using debt; whereas Table
6 reports the evidence for the factors influencing how much debt is used by firms that use debt.
Further, to focus attention on what is relevant, we do not report the estimation results for our
control variables and just report the results for the regressors of interest.
The evidence in Table 5 implies that none of the governance measures that we consider
are endogenous variables in the statistical model for whether a firm uses debt or not.
Consequently, we need not worry further about controlling for their endogeneity in the statistical
models for these decisions.
The evidence in Table 6, however, implies that the control functions associated with a
firm’s G-index and the proportion of insiders on its board are endogenous variables in regression
models for decisions on how much debt to use conditional on the use of debt. Interestingly, the
significantly negative sign on the control function associated with a firm’s Gindex is consistent
with the evidence reported in Karpoff, Schonlau and Wehrly (2017).
3.4 Baseline analysis with corrections for the endogeneity of governance features
Taking the above results into account, we re-estimate our two-step quasi-likelihood
model and incorporate control functions for a firm’s modified Gindex and its board composition
into the part focused on the conditional mean capital structure of firms that use debt. We report
these results in Table 7. Since the evidence for the estimated effects of different governance
features on the probability of a firm using debt are similar to those reported in Table 2, we will
focus on the effects of different governance features on the proportion of debt financing used by
firms that use debt financing.
The evidence in the last column of Table 7, which includes the control functions for the
Gindex and board composition, suggests striking changes in the coefficients of different
corporate governance variables. Board size is no longer statistically significant. Further, the
signs on both the modified G-index and the board composition variables are now significantly
ACCEPTED MANUSCRIPT
https://freepaper.me/t/429856 خودت ترجمه کن :

ACCEP
TED M
ANUSC
RIPT
17
positive while the signs on their associated control functions are significantly negative. In other
words, the negative signs on these variables in our earlier regressions were driven by their
correlations with omitted variables. We interpret this evidence as implying that it is omitted
variables that are correlated with these two variables that account for prior evidence of a their
significantly negative correlation with certain firm financing decisions.
Interestingly, these results can explain why these governance variables may appear
insignificant in some studies yet exercise a significantly negative influence in other studies (e.g.,
Garvey and Hanka (1999) versus John and Litov (2010) on the effects of ATPs on capital
structure choice). Effectively they exercise a different influence on the decision to use debt from
that on how much debt to use.
More importantly, they raise the question of what omitted variables might be correlated
with either a firm’s use of charter restrictions on governance or insider dominance on a firm’s
board. One answer provided by prior research to this question is that these governance features
allow managers to emphasize their preferences over a firm’s leverage choices. Since bankruptcy
risk is a largely undiversifiable risk for management and entails both the loss of income as well
as the prospects of finding similar remunerative work, it should be no surprise that managers
would prefer to use less debt financing than managers who face disciplinary pressures to do
otherwise. Such an interpretation is consistent with the arguments and evidence in Lewellen
(2006) and the arguments and evidence in Bebchuk, Cremers and Peyer (2011) on the effects of
CEO power on firm value.
3.5. Addressing the mediating role of firm age on how corporate governance influences
corporate capital structure decisions
The above evidence implies that firm age exercises a completely different influence on
whether a firm uses debt from how much debt that it chooses to use given the decision to use
debt. Whether this also implies that firm age affects how a firm’s governance features influences
these decisions is unclear since the above evidence ignores these interactions. As discussed
earlier, as a firm ages its governance may need to change. If it does not change, then this may
have important consequences for its behavior.
Filatotchev, Toms and Wright (2006), for example, argue that more outside directors
should be on the board to monitor management as it ages, particularly after the firm goes public.
ACCEPTED MANUSCRIPT
https://freepaper.me/t/429856 خودت ترجمه کن :

ACCEP
TED M
ANUSC
RIPT
18
Consequently, one might expect the effect of board composition on a firm’s capital structure
decisions to become more important the longer it has been a publicly traded firm. In a similar
vein, Johnson, Karpoff and Yi (2016) find evidence that the effects of a firm’s takeover
provisions change after it goes public and reduce firm value if they persist. Consequently, one
might expect the influence of either a firm’s charter provisions or its board composition on its
capital structure choices to change as its ages.
To test these arguments, we revise our prior regression models to incorporate the
interaction between our firm age measure and each of our governance variables. We report these
results in Table 8. For the decision to use debt, we find evidence that it is the interaction
between firm age and whether the firm is a dual class firm or not matters the most. To begin,
dual class firms are less likely to use debt but as they age they are more likely to use debt. One
interpretation for this behavior is that dual class firms find it necessary to turn to debt financing
after they go public if they intend to finance growth. One obvious reason for this is they find it
more expensive to sell stock in a firm in which outside shareholders have less say on its
management.
For the choice of how much debt to use given that the firm uses debt, we no longer find
whether a firm is a dual class firms or not, or how long it has been a dual class firm to be
important. Instead, we find the composition of the board and the firm’s charter provision to be
more important. When they are initially traded, firms with more ATPs and insider dominated
boards use more debt than other firms, but as they grow older they use less. This evidence is
consistent with a story in which firms dress up to look good when they go public, but change as
they age. Again, we interpret these results as suggesting that when protected from discipline,
managerial risk preferences play a bigger role in a firm’s leverage decisions as the firm ages.
Before we discuss the implications of our different regressions in more detail, we will
first explore the robustness of our key results.
4. Robustness checks
We examine the robustness our evidence to several variations in how we defined certain
key variables and our choice of instruments. First, the primary alternative to the G-index is the
E-index, developed by Bebchuk, Cohen, and Ferrell (2009). Consequently, we substitute the
ln(Gindex) for ln(Eindex). To do this, we first estimate a control function for this new measure
ACCEPTED MANUSCRIPT
https://freepaper.me/t/429856 خودت ترجمه کن :

ACCEP
TED M
ANUSC
RIPT
19
and then re-estimate a two-part model with the appropriate control functions. We report these
results in Table 9 in a similar manner to which we reported our baseline results in Table 8.
Consistent with our evidence in Table 8, we find that dual class firms are initially less likely to
use debt financing, but as they age, they are more likely to use debt financing. For firms that use
debt, we again see that initially, firms with more restrictive corporate charter provisions and
insider dominates boards use more debt, but as they age, they use less debt. Once again, this
points to the importance of board independence as a firm ages.
Next, we vary how we measure firm age as a public firm. Specifically, we follow
Strebulaev and Yang (2013) and use the number of years that a firm reports financial data on
Compustat as its age. Using this measure, we re-estimate a two-part quasi-likelihood model
similar to the model reported in Table 8. We report these results in Table 10. A perusal of these
results reveal that they are very similar to those reported in Tables 8 and 9. Consequently, our
evidence on the effects of firm age on how corporate governance influences corporate capital
structure choices appears robust to this variation.
Third, we explore the robustness of our evidence to use of a book value measure of a
firm’s capital structure. To do so, we first create a capital structure similar to our market value
measure, but use the book value of equity in place of the market value of equity. Specifically,
we define this book value measure, BLM, as:
To address our concerns with such a measure, we drop all firms that report a negative book value
of equity from the analyses using this measure.
Following the same estimation procedures as before, we estimate a two-part quasi-
likelihood model similar to those reported in Tables 8, 9, and 10 but using dependent variables
based on this book value capital structure measure. We report these results of this new
estimation in Table 11. Since the inferences we draw from these results are the same as we
draw from the evidence in Tables 8, 9 and 10, we view our conclusions about the evidence in
Table 8 as robust to this variation in how we measure a firm’s capital structure.
Finally, we address the robustness of our evidence to the choice of instruments. While
the evidence in Table 3 demonstrated that our instruments were strong instruments, it did not
demonstrate that they satisfied exogeneity requirements. Here, as discussed earlier, we face
several problems. First, there is a lot of debate about whether can even test for exogeneity.
ACCEPTED MANUSCRIPT
https://freepaper.me/t/429856 خودت ترجمه کن :

ACCEP
TED M
ANUSC
RIPT
20
Instead, such literature argues that satisfying the exogeneity requirements depends more on the
argument made for why one’s instruments satisfy this requirement. Because of this argument we
focused in our earlier discussion on reasons why we think that our instruments satisfy this
requirement. Second, there is no generally accepted test for exogeneity in the kinds of quasi-
likelihood models that we estimate. We can compute the residuals and conduct a J test. We did
and the largest J statistics was 1.83, which was insignificant at the 10 percent marginal
significance level. While this evidence is comforting, one must consider it only indicative.
Consequently, we approach this issue in a different way. We created a different set of
instruments and repeat the analyses in Tables 8, 9, 10, and 11 using new control functions based
on these new instruments. We follow the type of approach taken in Karpoff, Schonlau and
Wehrly (2017) and match each sample firm’s governance features with the governance features
of a random firm from the same state but in a different industry. We use these matched
governance features as instruments. We then compute new control functions for a firm’s
modified Gindex and proportion of insiders on the board and estimate the type of specifications
reported in Tables 8, 9, 10 and 11 but using these new control functions. We report these results
in Table 12. This evidence is consistent with the evidence in Tables 8, 9, 10, and 11. The main
difference is that the direct effect of a firm’s modified Gindex on how much debt the firm uses is
less significant than in the prior tables. Regardless, based on the arguments in Stock and Watson
(2011), this evidence suggests that our prior instruments and these instruments are either
correlated with omitted variables in the same way or that both sets of instruments satisfied the
exogeneity requirement. Otherwise, we should have expected a greater deviation in results.
5. Implications of our evidence
We now want to step back and discuss the implications of the evidence in Tables 8, 9, 10,
11, and 12 a bit further. First, we do not find evidence that the corporate governance features
that we consider are endogenous variables in statistical models of the likelihood of a firm using
debt (or similarly, a firm being all equity financed). Since our regressors are pre-determined
variables, this evidence implies that these governance features are not significantly correlated
with omitted variables that also significantly influences the decision to use debt or not use debt.
This conclusion provides some assurance that prior studies that ignored such endogenity provide
reasonable evidence.
ACCEPTED MANUSCRIPT
https://freepaper.me/t/429856 خودت ترجمه کن :

ACCEP
TED M
ANUSC
RIPT
21
Second, of the different corporate governance features that we consider, only the use of
dual class stock has a consistent, statistically significant effect on a firm’s decision to use debt.
Interestingly, when these firms are first publicly traded firms, they are less likely to use debt, or
more likely to be all equity financed. As they age, however, this changes and they become more
likely to use debt. We conjecture that this pattern suggests that they find it to be less costly to
issue debt to fund growth as they become older publicly traded firms.
Third, despite using different instruments, we like Karpoff, Schonlau, and Wehrly (2017),
that a firm’s G-index or E-index are endogenous variables that are correlated with omitted
variables. When firms first begin as publicly traded firms, how much debt they use is positively
correlated with their corporate charter restrictions on takeovers. However, as they age, their use
of debt is negatively correlated with these provisions. Further, it is the omitted variables that are
correlated with a firm’s use of restrictive charter provisions that are significantly and negatively
correlated with their use of debt. One way of interpreting this evidence is that corporate charter
restrictions are not per se value reducing features, but rather they permit behavior that is and
especially as the firm gets older.16
Fourth, we find that the most consistent statistically significant corporate governance
feature affecting a firm’s decision on how much debt to use is its board composition. Further,
like with our corporate charter evidence, we find evidence that it is omitted variables that are
correlated with board composition that exercises the most significant negative influence on how
much debt a firm uses. And just as importantly, we find that initially a firm’s use of debt is
positively correlated with insider dominated boards, but as the firm ages, this relationship
changes and such boards are negatively correlated with how much debt a firm uses.
And finally, we find that the influence of firm age on how much debt it uses is largely
explained by how firm age affects the relationship between the governance of a firm and its
capital structure choices. Given how these changes evolve, we interpret this evidence to imply
that, as a firm ages, entrenched managers are able to let their preferences play a greater role in
their firms’ capital structure choices.
16
Imagine two firms with restrictive corporate charter provisions, in one firm, management uses these features to
pursue high risk or innovative investment and in the other firm, management uses these features to slack off. It is
unobserved behavior of management rather than the corporate charter provisions per se that change the outcomes.
ACCEPTED MANUSCRIPT
https://freepaper.me/t/429856 خودت ترجمه کن :
ACCEP
TED M
ANUSC
RIPT
22
6. Conclusion
Prior research has considered the idea that as a firm grows older many of its features
change, and collectively these influence a number of aspects of its behavior. For example, some
argue that as a firm grows older and converts its growth options into asset-in-place that it will
lever up. Another stream of literature, however, argues that as a firm ages, the influence of its
governance structure on its behavior also changes. Thus, we ask whether the effects of corporate
governance on corporate debt use choices change as a public firm ages.
In order to address this question, we must also address several specification errors in
prior capital structure research. First, consistent with Welch’s (2007, 2011) critiques, ensure that
our capital structure measure implies that an increase in debt financing is associated with a
decrease in equity financing, and vice versa. Second, we address Welch’s other critique that
book value measures of equity are plug values in financial accounting and so do not represent
firm’s choices. Third, we explicitly address Papke and Wooldridge’s (1992) critique of
regressions on fractional or proportional random variables. This critique also implies that prior
endogeneity tests using linear models for these data are invalid. Fourth, we address Cook,
Kieschnick, and McCullough (2008) and Ramalho and Vidigal da Silva (2009) critique of
empirical capital structure models that ignore the selection issue implied by all equity firms.
Fifth, we address endogeneity in nonlinear capital structure models using control function
methods – which prior evidence suggests are less biased than two state prediction methods (e.g.,
2SLS, etc.).
Using data on a sample of U.S. corporations from 1996 through 2016, we derive the
following key conclusions. First, firm age, without considering its interaction with different
corporate governance features, is negatively correlated with a firm’s use of debt conditional on
its using debt financing. This result contrasts with prior arguments and evidence on the
relationship between firm age and it use of financial leverage.
Second, dual class firms are more likely to not use debt financing initially, but are more
likely to use debt as they age as public corporations. We interpret this evidence to imply that
these firms turn to lower cost sources of external financing as they age to fund their growth since
selling new equity might be more expensive for them.
Third, we find evidence the corporate charter provisions of a firm and its board
composition are correlated with omitted variables in regression models of how much debt
ACCEPTED MANUSCRIPT
https://freepaper.me/t/429856 خودت ترجمه کن :

ACCEP
TED M
ANUSC
RIPT
23
financing that a firm chooses to use conditional on its using debt. These omitted factors are
negatively correlated with the firm’s use of debt financing.
Finally, we find evidence that as a firm ages, its corporate charter restrictions and its
board composition influence its capital structure choices quite different than they do when the
firm is young. Further, these changes largely explain why we find that firm age is negative
correlated with how much debt financing a firm uses.
Altogether, we interpret our evidence as suggesting that as a firm grows older as a pubic
firm, governance features associated with managerial entrenchment allow managerial risk
preferences to play a greater role in their firm’s capital structure decisions. This interpretation is
consistent with the arguments and evidence in Bertrand and Mullainathan (2003), Morellec
(2004), Lewellen (2006), Gow, Kaplan, Larcker, and Zakolyukina (2016), etc.
ACCEPTED MANUSCRIPT
https://freepaper.me/t/429856 خودت ترجمه کن :

ACCEP
TED M
ANUSC
RIPT
References
Arce, D., Cook, and R. Kieschnick, 2015, “On the evolution of corporate capital structures,”
Journal of Evolutionary Economics 25 (3), 561-583.
Bebchuk, L., J. Coates IV, and G. Subramanian, 2002, “The Powerful Antitakeover Force of
Staggered Boards: Theory, Evidence and Policy,” Stanford Law Review 54, 887-951.
Bebchuk, L., A. Cohen, and A. Ferrell, 2009, “What Matters in Corporate Governance?,”
Review of Financial Studies 22, 783-827.
Bebchuk, L., M. Cremers, and U. Peyer, 2011, “The CEO pay slice”, Journal of Financial
Economics 102, 199-221.
Berger, P., E. Ofek, and D. Yermack, 1997, “Managerial Entrenchment and Capital Structure
Decisions,” Journal of Finance 52, 1411-1438.
Bertrand, M. and S. Mullainathan, 2003, “Enjoying the Quiet Life? Corporate Governance and
Managerial Preferences,” Journal of Political Economy 111, 1043-1075.
Campbell, H., K. Lins, and A. Roper, 2004, “The effect of capital structure when expected
agency costs are extreme,” Journal of Financial Economics 74, 3-30.
Capinski, M. and E. Kopp, 2004, Measure, Integral and Probability, 2nd
edition, NY: Springer-
Verlag.
Chincarini, L., D. Kim, and F. Moneta, 2016, “The Life Cycle of Beta,” working paper,
http://ssrn.com/abstract=2821852.
Cook, D., R. Kieschnick, and B. McCullough, 2008, “Regression analysis of proportions in
finance with self-selection,” Journal of Empirical Finance 15, 860-867.
Cox, C., 1996, “Nonlinear quasi-likelihood models: applications to continuous proportions,”
Computational Statistics & Data Analysis 21, pp. 449-461.
Cremers, K. and V. Nair, 2005, “Governance Mechanisms and Equity Prices,” Journal of
Finance 60, 2859-2893.
Crosbie, P. and J. Bohn, 2003, “Modeling Default Risk,” Moody’s KMV Company.
Daines, R. and M. Klausner, 2001, “Do IPO Charters Maximize Firm Value? Antitakeover
Protection in IPOs,” Journal of Law, Economics and Organization 17, 83-120.
Deangelo, H. and R. Roll, 2015, “How Stable Are Corporate Capital Structures?,” Journal of
Finance 70, 373-418.
ACCEPTED MANUSCRIPT
https://freepaper.me/t/429856 خودت ترجمه کن :

ACCEP
TED M
ANUSC
RIPT
Fama, E.F. and K. French, 1997, “Industry Costs of Equity,” Journal of Financial Economics 93,
153-194.
Fattouh, B., L. Harris, and P. Scaramozzino, 2008, "Non-Linearity in the Determinants of Capital
Structure: Evidence from UK Firms”. Empirical Economics 34, 417-438.
Filatotchev, I., S. Toms, and M. Wright, 2006,"The firm's strategic dynamics and corporate
governance life-cycle", International Journal of Managerial Finance 2, 256 - 279
Frank, M. and W. Goyal, 2009, “Capital Structure Decisions: Which Factors Are Reliably
Important,” Financial Management, 1-37.
Gao, W., L. Ng, and Q. Wang, 2010, “Does Corporate Headquarters Location Matter for Firm
Capital Structure?”, SSRN: https://ssrn.com/abstract=1700229
Garvey, G. and G. Hanka, 1999, “Capital structure and corporate control: The effect of
antitakeover statutes on firm leverage,” Journal of Finance 54, 519-546.
Gillan, S., J. Hartzell, and L. Starks, 2011, Tradeoffs in Corporate Governance: Evidence from
Board Structures and Charter Provisions, Quarterly Journal of Finance 1, 667-705.
Gompers, P., J. Ishii, and A. Metrick, 2003, “Corporate Governance and Equity Prices,”
Quarterly Journal of Economics 118, 107-155.
Gow, I., S. Kaplan, D. Larcker, and A. Zakolyukina, 2016, CEO Personality and Firm Policies,
Rock Center for Corporate Governance, Working paper series no. 220.
Graham, J., and L. Mills, 2008, “Using Tax Return Data to Simulate Corporate Marginal Tax
Rates,” Journal of Accounting and Economics 46, 366-380.
Greene, W., 2017, Econometric Analysis, 8th
edition, New York: Pearson
Guo, L., P Lach, and S. Mobbs, 2015, Tradeoffs between Internal and External Governance:
Evidence from Exogenous Regulatory Shocks, Financial Management 44, 81-114.
Heckman, J. and S. Navarro-Lozano (2004) Using Matching, Instrumental Variables and Control
Functions to Estimate Economic Choice Models, Review of Economics and Statistics 86, 30 –
57.
Hermalin, B. and M. Weisbach, 2003, “Boards of Directors as an Endogeneously Determined
Institution: A Survey of the Economic Literature,” FRBNY Economic Policy Review 9, 7-26.
Hovakimian, A., T. Opler, and S. Titman, 2001, “The Debt-Equity Choice,” Journal of Financial
and Quantitative Analysis 36, pp. 1-24.
Humphreys, B., 2013, Dealing with Zeros in Economic Data, University of Alberta Department of
Economics working paper.
ACCEPTED MANUSCRIPT
https://freepaper.me/t/429856 خودت ترجمه کن :

ACCEP
TED M
ANUSC
RIPT
John, K. and L. Litov, 2010, “Managerial Entrenchment and Capital Structure: New Evidence,”
Journal of Empirical Legal Studies 7, 693-742.
Johnson, W., J. Karpoff, and S. Yi, 2016, “The Lifecycle of Firm Takeover Defenses,”
University of Washington Foster School of Business working paper,
http://ssrn.com/abstract=2808208
Ju, Parrino, Poteshman, and Weisbach, 2005, “Horses and Rabbits? Trade-Off Theory and
Optimal Capital Structures,” Journal of Financial and Quantitative Analysis 40, 259-281.
Karpoff, J., R. Schonlau, and E. Wehrly, 2017, “Do Takeover Defense Indices Measure
Takeover Deterrence,” Review of Financial Studies 30, 2359-2412.
Lemmon, M. M. Roberts, and J. Zender, 2008, “Back to the Beginning: Persistence and the
Cross-Section of Corporate Capital Structure,” Journal of Finance 63, 1575-1608.
Lewellen, K., 2006, “Financing decisions when managers are risk adverse,” Journal of Financial
Economics 82, 551-590.
Malekzadeh A., V. McWilliams, and N. Sen, 1998, “Antitakeover Amendments, Ownership
Structure, and Managerial Decisions: Effects on R&D Expenditure,” Working Paper.
Mehran, H., 1992, “Executive Incentive Plans, Corporate Control, and Capital Structure,”
Journal of Financial and Quantitative Analysis 27, 539-560.
Morellec, E. 2004, “Can managerial discretion explain observed leverage ratios?”, Review of
Financial Studies 17, 257-294.
Ospina, R. and S. Ferrari, 2010, “Inflated beta distributions,” Statistical Papers 51, 111-126.
Papke, L., and J. Wooldridge, 1996, “Econometric Methods for Fractional Response Variables
with an application to 401(K) Plan Participation Rates,” Journal of Applied Econometrics 11, pp.
619-632.
Papke, L and J. Wooldridge, 2008, “Panel data methods for fractional response variables with an
application to test pass rates,” Journal of Econometrics 145, 121-133.
Pratt, J. and D. Hirst, 2009, Financial Reporting for Managers: A Value Creation Perspective,
New York: John Wiley and Sons, Inc.
Ramalho, J. J. S., & Vidigal da Silva, J., 2009, “A two-part fractional regression model for the
financial leverage decisions of micro, small, medium and large firms,” Quantitative Finance 9,
621-636.
ACCEPTED MANUSCRIPT
https://freepaper.me/t/429856 خودت ترجمه کن :

ACCEP
TED M
ANUSC
RIPT
Ramalho, E., J. Ramalho, J. Murteira, 2011, “Alternative Estimating and Testing Empirical
Strategies for Fractional Regression Models,” Journal of Economic Surveys, 19-68.
Roberts, M. and T. Whited, 2013, “Endogeneity in Empirical Corporate Finance,” Handbook of
the Economics of Finance, Volume 2, Part A, NY: Elsevier.
Strebulaev, I. and B. Yang, 2013, “The mystery of zero-leverage firms,” Journal of Financial
Economics 109, 1-23.
Stock, J. and M. Yogo, 2005, “Testing for Weak Instruments in Linear IV Regression,” Chapter
5 in Identification and Inference in Econometrics Models: Essays in Honor of Thomas J.
Rothenberg, edited by W. K. Andrews and J. Stock, Cambridge: Cambridge University Press.
Stock, J., and M. Watson, 2011, Introduction to Econometrics, 3rd
edition, NY: Addison-Wesley.
Terza, J., A. Basu, and P. Rathouz (2008) Two-stage residual inclusion estimation: Addressing
endogeneity in health econometric modeling, Journal of Health Economics 27, 531-543.
Trimbath, S., 2001, “Lemmings to the Sea: The Inappropriate Use of Financial Ratios in
Empirical Analysis,” http://papers.ssrn.com/paper.taf?abstract_id=270342
Vernimmen, P., P. Quiry, M. Dallocchio, Y. Fur, and A. Salvi, 2005, Corporate Finance: Theory
and Practice, Chichester, G.B.: John Wiley & Sons, Ltd.
Welch, I., 2007, “Common Flaws in Empirical Capital Structure Research,” SSRN working
paper, http://ssrn.com/abstract=931675.
Welch, I., 2011, “Two Common Problems in Capital Structure Research: The Financial Debt-to-
Asset Ratio and Issuing Activity versus Leverage Changes,” International Review of Finance 11,
1-17.
Wooldridge, J., 2005, “Simple solutions to the initial conditions problems in dynamic, nonlinear
panel-data models with unobserved heterogeneity,” Journal of Applied Econometrics 20, 39054.
Wooldridge, J., 2010, Econometric Analysis of Cross Section and Panel Data, 2nd
edition, The
MIT Press.
Wooldridge, J., 2014, “Quasi-maximum likelihood estimation and testing for nonlinear models
with endogenous explanatory variables,” Journal of Econometrics 182, 226-234.
ACCEPTED MANUSCRIPT
https://freepaper.me/t/429856 خودت ترجمه کن :

ACCEP
TED M
ANUSC
RIPT
Table 1
Summary of Sample Statistics
This table presents the descriptive statistics for the key variables used in our study. See Appendix 1 for further
information on the definition of these variables. All variables based on Compustat data are winsorized at the 1%
level.
Variable N Mean Median Std Deviation
MLM 129440 0.2540 0.1804 0.2551
Initial MLM 130654 0.2550 0.2409 0.1346
Industry median MLM 128844 0.2007 0.1148 0.2252
Ln(Assets) 130337 6.0238 5.9641 2.2579
Market-to-book ratio 129629 2.0078 1.3551 1.8600
Asset tangibility 126157 0.2300 0.1353 0.2437
Profitability 126114 0.0325 0.0797 0.2366
Asset volatility 104567 0.4884 0.3869 0.3601
GM marginal tax rate 55860 0.2744 0.3500 0.1236
Expected inflation rate 142760 2.5986 2.1900 2.1947
Firm age 141042 14.9638 10.0000 14.7917
Board size 32123 9.4650 9.0000 2.6943
PIBoard 32123 0.1860 0.1429 0.1071
Dual class 35696 0.0899 0 0.2861
CEO Chair 32123 0.6352 1 0.4814
Gindex 35696 7.2083 7 2.0296
Eindex 35696 2.6165 3 1.3560
ACCEPTED MANUSCRIPT
https://freepaper.me/t/429856 خودت ترجمه کن :

ACCEP
TED M
ANUSC
RIPT
Table 2
Baseline regressions without correction for endogeneity of governance measures See Appendix 1 for definition of variables. MLM represents the ratio of long-term and short-term debt to the sum of
short-term debt plus long-term debt plus the market value of common stock. All regressors are lagged one period.
The two-part regression model is based on Ramalho, Ramalho and Murteira (2011) zero-inflated modification of
Papke and Wooldridge’s (2008) fractional regression model. The variance-covariance was estimated using
Sandwich estimators with correction for clustering on firms. P-values associated with the null hypothesis that the
coefficient equals zero are reported within parentheses.
P(MLM>0) E(MLM|MLM>0)
Constant -3.6801 -0.6388
(0.05) (0.00)
Industry median MLM 1.1550 0.9411
(0.30) (0.00)
Initial MLM 2.7187 1.7100
(0.00) (0.00)
Ln(Assets) 0.7651 0.0857
(0.00) (0.00)
Market-to-book ratio -0.0088 -0.5433
(0.88) (0.00)
Asset tangibility 1.9336 0.2849
(0.00) (0.00)
Profitability -3.2987 -1.4140
(0.00) (0.00)
Asset Volatility -1.4843 -0.6383
(0.00) (0.00)
GM marginal tax rate -0.3180 -0.3662
(0.75) (0.00)
Expected inflation rate 0.3090 -0.0239
(0.21) (0.34)
Firm age 0.0104 -0.0031
(0.15) (0.00)
Ln(board size) 1.2831 -0.1347
(0.00) (0.04)
PIBoard 0.0215 -0.4056
(0.98) (0.01)
Dual class -0.6966 0.0876
(0.02) (0.15)
CEO chairman 0.2746 -0.0282
(0.12) (0.30)
Ln(Gindex) 0.2966 0.0139
(0.31) (0.75)
Year fixed effects Yes Yes
# of obs 15,558 15,558
Chi-Square 435.5 3975
p-value (0.00) (0.00)
ACCEPTED MANUSCRIPT
https://freepaper.me/t/429856 خودت ترجمه کن :

ACCEP
TED M
ANUSC
RIPT
Table 3
Estimation of control functions See Appendix 1 for definition of variables. The state variables (e.g., Texas, etc.) represent dummy variable that
takes on the value 1 if a firm is incorporated in that state. All control variables are lagged one period. The variance-
covariance was estimated using Sandwich estimators with correction for clustering on firms. P-values associated
with the null hypothesis that the coefficient equals zero.
ln(Gindex) ln(board size) PIB CEO
Chair
Dual
class
Ln(board size) 0.186 -0.0604 -0.103 0.0762
(0.00) (0.00) (0.01) (0.02)
PIBoard -0.230 -0.279
-0.357 0.507
(0.00) (0.00)
(0.00) (0.00)
Dual class -0.0652 0.0438 0.0634 -0.00539
(0.00) (0.05) (0.00) (0.87)
CEO Chair 0.0323 -0.0172 -0.00744
-0.00246
(0.00) (0.02) (0.03)
(0.80)
Ln(Gindex)
0.0937 -0.0266 0.0818 -0.0600
(0.00) (0.00) (0.00) (0.00)
California -0.370 -0.0500 -0.00816 -0.0221 -0.0814
(0.00) (0.17) (0.52) (0.82) (0.00)
Texas -0.0277 -0.0332 -0.00732 -0.180 -0.0597
(0.43) (0.38) (0.43) (0.00) (0.00)
Maryland 0.111 -0.0164 0.00960 -0.0167 0.00622
(0.00) (0.73) (0.51) (0.79) (0.86)
Minnesota 0.247 -0.0247 -0.00903 -0.0493 -0.0112
(0.00) (0.27) (0.33) (0.28) (0.67)
Ohio 0.250 0.0826 0.00643 0.0199 0.0492
(0.00) (0.00) (0.50) (0.67) (0.23)
Nevada 0.131 -0.0662 0.0463 -0.0241 -0.0757
(0.00) (0.04) (0.05) (0.70) (0.00)
New York 0.134 0.0302 0.0267 0.0245 0.0563
(0.00) (0.24) (0.00) (0.54) (0.25)
Pennsylvania 0.339 -0.0328 -0.0103 0.0302 -0.00783
(0.00) (0.19) (0.14) (0.51) (0.71)
Controls Yes Yes Yes Yes Yes
Year fixed effects Yes Yes Yes Yes Yes
# of obs 15,550 13,668 13,668 13,668 15,550
F statistic 26.36 41.13 20.46 26.48 30.83
p-value (0.00) (0.00) (0.00) (0.00) (0.00)
ACCEPTED MANUSCRIPT
https://freepaper.me/t/429856 خودت ترجمه کن :

ACCEP
TED M
ANUSC
RIPT
Table 4
Variation in market value leverage measure across states The below table provides the standard deviation of our market value leverage measure, MLM, for each state. MLM
represents the ratio of long-term and short-term debt to the sum of short-term debt plus long-term debt plus the
market value of common stock
State Std Dev State Std Dev State Std Dev
U.S. 0.255
AK 0.229 KY 0.196 OH 0.238
AL 0.183 LA 0.219 OK 0.250
AR 0.190 MA 0.259 OR 0.215
AS 0.004 MD 0.255 PA 0.251
AZ 0.271 ME 0.257 PR 0.212
CA 0.234 MI 0.274 RI 0.259
CO 0.234 MN 0.218 SC 0.273
CT 0.219 MO 0.223 SD 0.201
DC 0.315 MS 0.220 TN 0.243
DE 0.250 MT 0.224 TT 0.219
FL 0.245 NC 0.246 TX 0.253
GA 0.257 ND 0.159 UT 0.219
HI 0.214 NE 0.379 VA 0.250
IA 0.250 NH 0.168 VI 0.312
ID 0.226 NJ 0.235 VT 0.193
IL 0.240 NM 0.248 WA 0.261
IN 0.259 NV 0.271 WI 0.221
KS 0.233 NY 0.232 WV 0.213
WY 0.219
ACCEPTED MANUSCRIPT
https://freepaper.me/t/429856 خودت ترجمه کن :

ACCEP
TED M
ANUSC
RIPT
Table 5
The decision to use debt and the endogeneity of corporate governance Each of the below logistic type regressions represents P(MLM>0) where MLM represents the ratio of long-term and
short-term debt to the sum of short-term debt plus long-term debt plus the market value of common stock. See
Appendix 1 for definition of variables. All regressors except the control functions for different governance
measures are lagged one period. The below is the first part of Ramalho, Ramalho and Murteira (2011) zero-inflated
modification of Papke and Wooldridge’s (2008) fractional regression model. The variance-covariance was
estimated using Sandwich estimators with correction for clustering on firms. P-values associated with the null
hypothesis that the coefficient equals zero are reported within parentheses
P(MLM>0)
Ln(board size) 0.891 3.190 0.653 1.089 1.094
(0.11) (0.17) (0.29) (0.03) (0.03)
PIBoard -0.559 0.0314 -5.360 0.188 0.609
(0.60) (0.98) (0.45) (0.87) (0.63)
Dual class -0.270 -0.406 0.0488 -0.271 -2.927
(0.47) (0.29) (0.93) (0.46) (0.18)
CEO Chair 0.424 0.457 0.416 2.907 0.426
(0.04) (0.03) (0.05) (0.10) (0.04)
Ln(Gindex) 0.517 0.230 0.336 0.253 0.348
(0.59) (0.56) (0.38) (0.50) (0.33)
CF(Gindex) -0.0798
(0.94)
CF(ln(board size)
-2.323
(0.32)
CF(PIBoard)
4.875
(0.49)
CF(CEO Chair)
-2.480
(0.17)
CF(Dual class)
2.717
(0.22)
Controls Yes Yes Yes Yes Yes
Year fixed effects Yes Yes Yes Yes Yes
# of obs 12,818 12,818 12,818 12,818 12,818
Chi-Square 262.8 267.5 264.5 269.9 270.3
p-value (0.00) (0.00) (0.00) (0.00) (0.00)
ACCEPTED MANUSCRIPT
https://freepaper.me/t/429856 خودت ترجمه کن :

ACCEP
TED M
ANUSC
RIPT
Table 6
The use of debt and the endogeneity of corporate governance Each of the below regressions represent E(MLM|MLM>0) where MLM represents the ratio of long-term and short-
term debt to the sum of short-term debt plus long-term debt plus the market value of common stock. See Appendix
1 for definition of regressors. All regressors are lagged one period. Below is the second part of regression models
based on Ramalho, Ramalho and Murteira (2011) zero-inflated modification of Papke and Wooldridge’s (2008)
fractional regression model. The variance-covariance was estimated using Sandwich estimators with correction for
clustering on firms. P-values associated with the null hypothesis that the coefficient equals zero are reported within
parentheses.
E(MLM|MLM>0)
Ln(board size) -0.179 -0.0892 -0.000678 -0.0820 -0.137
(0.02) (0.81) (0.99) (0.30) (0.08)
PIBoard -0.418 -0.472 1.737 -0.343 -0.603
(0.02) (0.01) (0.10) (0.08) (0.01)
Dual class 0.163 0.145 0.00930 0.148 0.418
(0.01) (0.03) (0.92) (0.03) (0.22)
CEO Chair -0.0459 -0.0356 -0.0252 0.401 -0.0356
(0.12) (0.23) (0.39) (0.24) (0.23)
Ln(Gindex) 0.306 0.00103 0.0600 -0.0332 0.0167
(0.03) (0.99) (0.29) (0.56) (0.74)
CF(Gindex) -0.343
(0.02)
CF(ln(board size)
-0.0280
(0.94)
CF(PIBoard)
-2.250
(0.03)
CF(CEO Chair)
-0.439
(0.20)
CF(Dual class)
-0.275
(0.42)
Controls Yes Yes Yes Yes Yes
Year fixed effects Yes Yes Yes Yes Yes
# of obs 12,818 12,818 12,818 12,818 12,818
Chi-Square 3266 3247 3251 3245 3241
p-value (0.00) (0.00) (0.00) (0.00) (0.00)
ACCEPTED MANUSCRIPT
https://freepaper.me/t/429856 خودت ترجمه کن :

ACCEP
TED M
ANUSC
RIPT
Table 7
Baseline regressions with corrections for the endogeneity of governance measures Firm age is measured as the number of years that a firm is on CRSP. MLM represents the ratio of long-term and
short-term debt to the sum of short-term debt plus long-term debt plus the market value of common stock. See
Appendix 1 for definition of variables. CF(*) represents the control function associated with the * governance
measure. All other regressors are lagged one period. The two-part regression model is based on Ramalho, Ramalho
and Murteira (2011) zero-inflated modification of Papke and Wooldridge’s (2008) fractional regression model. The
variance-covariance was estimated using Sandwich estimators with correction for clustering on firms. P-values
associated with the null hypothesis that the coefficient equals zero are reported within parentheses.
P(MLM>0) E(MLM|MLM>0)
Ln(board size) 1.094 -0.0597
(0.03) (0.49)
PIBoard 0.609 1.905
(0.63) (0.07)
Dual class -2.927 0.0205
(0.08) (0.82)
CEO Chair 0.426 -0.0352
(0.04) (0.23)
Ln(Gindex) 0.348 0.377
(0.33) (0.01)
Firm age 0.0142 -0.00190
(0.10) (0.06)
CF(lnGindex)
-0.356
(0.01)
CF(PIBoard)
-2.357
(0.02)
Controls Yes Yes
Year fixed effects Yes Yes
# of obs 12,818 12,818
Chi-square 270.3 3277
p-value (0.00) (0.00)
ACCEPTED MANUSCRIPT
https://freepaper.me/t/429856 خودت ترجمه کن :

ACCEP
TED M
ANUSC
RIPT
Table 8
The interaction between firm age and corporate governance Firm age is measured as the number of years that a firm is on CRSP. LM represents the ratio of long-term and
short-term debt to the sum of short-term debt plus long-term debt plus the market value of common stock. See
Appendix 1 for definition of variables. CF(*) represents the control function associated with the * governance
measure. All other regressors are lagged one period. The two-part regression model is based on Ramalho, Ramalho
and Murteira (2011) zero-inflated modification of Papke and Wooldridge’s (2008) fractional regression model. The
variance-covariance was estimated using Sandwich estimators with correction for clustering on firms. P-values
associated with the null hypothesis that the coefficient equals zero are reported within parentheses.
P(MLM>0) E(MLM|MLM>0)
Ln(board size) 0.562 -0.167
(0.50) (0.19)
PIBoard 2.128 2.315
(0.15) (0.03)
Dual class -2.101 0.0370
(0.00) (0.79)
CEO Chair 0.329 -0.0300
(0.34) (0.62)
Ln(Gindex) 0.189 0.361
(0.71) (0.03)
Firm Age -0.0646 -0.00788
(0.44) (0.26)
Firm Age*Ln(Gindex) 0.00574 -0.000415
(0.80) (0.83)
Firm Age*Ln(board size) 0.0380 0.00349
(0.24) (0.21)
Firm Age*PIBoard -0.110 -0.0196
(0.06) (0.01)
Firm Age*Dual Class 0.0777 9.00e-05
(0.00) (0.98)
Firm Age*CEO Chair -0.00297 -0.000245
(0.83) (0.86)
CF(lnGindex)
-0.350
(0.02)
CF(PIBoard)
-2.241
(0.03)
Controls Yes Yes
Year fixed effects Yes Yes
# of obs 15,468 12,818
Chi-square 423.6 3321
p-value (0.00) (0.00)
ACCEPTED MANUSCRIPT
https://freepaper.me/t/429856 خودت ترجمه کن :

ACCEP
TED M
ANUSC
RIPT
Table 9
The interaction between firm age and corporate governance
with different governance index Firm age is measured as the number of years that a firm is on CRSP. LM represents the ratio of long-term and
short-term debt to the sum of short-term debt plus long-term debt plus preferred stock plus the market value of
common stock. See Appendix 1 for definition of variables. CF(*) represents the control function associated with the
* governance measure. All other regressors are lagged one period. The two-part regression model is based on
Ramalho, Ramalho and Murteira (2011) zero-inflated modification of Papke and Wooldridge’s (2008) fractional
regression model. The variance-covariance was estimated using Sandwich estimators with correction for clustering
on firms. P-values associated with the null hypothesis that the coefficient equals zero are reported within
parentheses.
P(MLM>0) E(MLM|MLM>0)
Ln(board size) 1.0564 -0.1129
(0.23) (0.42)
PIBoard 1.5105 3.5619
(0.37) (0.00)
Dual class -1.9884 0.0776
(0.00) (0.62)
CEO Chair 0.2135 -0.0273
(0.56) (0.66)
Ln(Eindex) -0.1297 0.5168
(0.75) (0.03)
Firm Age -0.0394 -0.0038
(0.60) (0.57)
Firm Age*Ln(Eindex) 0.0151 -0.0013
(0.37) (0.32)
Firm Age*Ln(board size) 0.0221 0.0032
(0.52) (0.26)
Firm Age*PIBoard -0.0802 -0.0178
(0.22) (0.03)
Firm Age*Dual Class 0.0692 -0.0022
(0.02) (0.57)
Firm Age*CEO Chair -0.0014 -0.0001
(0.92) (0.92)
CF(lnEindex)
-0.3940
(0.08)
CF(PIBoard)
-3.3904
(0.00)
Controls Yes Yes
Year fixed effects Yes Yes
# of obs 14,512 11,983
Chi-square 394.1 3099
p-value (0.00) (0.00)
ACCEPTED MANUSCRIPT
https://freepaper.me/t/429856 خودت ترجمه کن :

ACCEP
TED M
ANUSC
RIPT
Table 10
The interaction between firm age and corporate governance
with different firm age measure Similar to Stebulaev and Yang (2013), firm age is based on Compustat data. MLM represents the ratio of long-term
and short-term debt to the sum of short-term debt plus long-term debt plus the market value of common stock. See
See Appendix 1 for definition of variables. CF(*) represents the control function associated with the * governance
measure. All other regressors are lagged one period. The two-part regression model is based on Ramalho, Ramalho
and Murteira (2011) zero-inflated modification of Papke and Wooldridge’s (2008) fractional regression model. The
variance-covariance was estimated using Sandwich estimators with correction for clustering on firms. P-values
associated with the null hypothesis that the coefficient equals zero are reported within parentheses.
P(MLM>0) E(MLM|MLM>0)
Ln(board size) 0.302 -0.220
(0.71) (0.12)
PIBoard 3.800 1.702
(0.02) (0.13)
Dual class -2.149 0.172
(0.01) (0.31)
CEO Chair 0.426 0.0467
(0.25) (0.53)
Ln(Gindex) 0.467 0.444
(0.38) (0.02)
Firm Age -0.0583 -0.00169
(0.21) (0.71)
Firm Age*Ln(Gindex) -0.00865 -0.00379
(0.69) (0.20)
Firm Age*Ln(board size) 0.0563 0.00437
(0.03) (0.13)
Firm Age*PIBoard -0.182 -0.00445
(0.00) (0.67)
Firm Age*Dual Class 0.0842 -0.00533
(0.02) (0.20)
Firm Age*CEO Chair -0.00139 -0.00215
(0.92) (0.23)
CF(lnGindex)
-0.301
(0.05)
CF(PIBoard)
-2.082
(0.04)
Controls Yes Yes
Year fixed effects Yes Yes
# of obs 13,808 10,911
Chi-square 350.3 3170
p-value (0.00) (0.00)
ACCEPTED MANUSCRIPT
https://freepaper.me/t/429856 خودت ترجمه کن :

ACCEP
TED M
ANUSC
RIPT
Table 11
The interaction between firm age and corporate governance
with book leverage measure Firm age is measured as the number of years that a firm is on CRSP. BLM represents the ratio of long-term and
short-term debt to the sum of short-term debt plus long-term debt plus the book value of common stock. See
Appendix 1 for definition of variables. CF(*) represents the control function associated with the * governance
measure. All other regressors are lagged one period. The two-part regression model is based on Ramalho, Ramalho
and Murteira (2011) zero-inflated modification of Papke and Wooldridge’s (2008) fractional regression model. The
variance-covariance was estimated using Sandwich estimators with correction for clustering on firms. P-values
associated with the null hypothesis that the coefficient equals zero are reported within parentheses.
P(BLM>0) E(BLM|BLM>0)
Ln(board size) 0.4531 -0.0104
(0.59) (0.94)
PIBoard 2.1367 2.2590
(0.15) (0.08)
Dual class -2.1190 0.0402
(0.00) (0.82)
CEO Chair 0.3365 -0.0454
(0.33) (0.45)
Ln(Gindex) 0.2280 0.4367
(0.67) (0.02)
Firm Age -0.0664 -0.0029
(0.44) (0.73)
Firm Age*Ln(Gindex) 0.0047 -0.0005
(0.84) (0.83)
Firm Age*Ln(board size) 0.0399 0.0023
(0.23) (0.50)
Firm Age*PIBoard -0.1076 -0.0248
(0.07) (0.01)
Firm Age*Dual Class 0.0798 -0.0005
(0.00) (0.93)
Firm Age*CEO Chair -0.0037 0.0004
(0.80) (0.78)
CF(lnGindex)
-0.4122
(0.01)
CF(PIBoard)
-2.4309
(0.05)
Controls Yes Yes
Year fixed effects Yes Yes
# of obs 15,229 12,623
Chi-Square 415.3 1426
p-value (0.00) (0.00)
ACCEPTED MANUSCRIPT
https://freepaper.me/t/429856 خودت ترجمه کن :

ACCEP
TED M
ANUSC
RIPT
Table 12
The interaction between firm age and corporate governance
with different instruments Firm age is measured as the number of years that a firm is on CRSP. BLM represents the ratio of long-term and
short-term debt to the sum of short-term debt plus long-term debt plus the book value of common stock. See
Appendix 1 for definition of variables. CF2(*) represents the new control function associated with the * governance
measures. All other regressors are lagged one period. The two-part regression model is based on Ramalho, Ramalho
and Murteira (2011) zero-inflated modification of Papke and Wooldridge’s (2008) fractional regression model. The
variance-covariance was estimated using Sandwich estimators with correction for clustering on firms. P-values
associated with the null hypothesis that the coefficient equals zero are reported within parentheses.
P(BLM>0) E(BLM|BLM>0)
Ln(board size) 0.6665 -0.1415
(0.42) (0.27)
PIBoard 1.9524 2.4087
(0.19) (0.03)
Dual class -1.8661 -0.0356
(0.00) (0.78)
CEO Chair 0.2627 -0.0047
(0.44) (0.94)
Ln(Gindex) 0.1480 0.2367
(0.77) (0.10)
Firm Age -0.0593 -0.0075
(0.47) (0.27)
Firm Age*Ln(Gindex) 0.0092 -0.0007
(0.68) (0.72)
Firm Age*Ln(board size) 0.0306 0.0034
(0.35) (0.22)
Firm Age*PIBoard -0.1005 -0.0204
(0.09) (0.01)
Firm Age*Dual Class 0.0597 0.0006
(0.03) (0.85)
Firm Age*CEO Chair 0.0006 -0.0006
(0.97) (0.69)
CF2(lnGindex)
-0.2015
(0.08)
CF2(PIBoard)
-2.3187
(0.03)
Controls Yes Yes
Year fixed effects Yes Yes
# of obs 15,457 12,678
Chi-Square 430.1 3279
p-value (0.00) (0.00)
ACCEPTED MANUSCRIPT
https://freepaper.me/t/429856 خودت ترجمه کن :

ACCEP
TED M
ANUSC
RIPT
Appendix 1: Definitions of Study Variables
All our variables are constructed using Compustat, Execucomp, RiskMetrics Governance, RiskMetrics Directors
databases.
Economic/Financial variables
Asset Tangibility Ratio of Net property, plant and equipment (PPENT) to total assets (AT)
Asset volatility Volatility of the firm’s assets estimated via the KMV model (see Crosbie
and Bohn (2003)) and the SAS code available on WRDS for its estimation.
Expected inflation rate First yearly observation of the 3-month T-bill as a proxy for expected
inflation
Firm age We used different measures: (1) Years since founding, (2) Years on CRSP,
and (3) Years on Compustat.
GM Marginal tax rate Graham and Mill’s before-financing marginal tax rate with imputed values
for missing observations
Initial leverage Initial Compustat leverage (either MLM or BLM) of the firm
Industry leverage Median of either MLM or BLM for different industries by year. We used
Fama and French’s (1997) 48 industry delineations.
MLM [Long-term debt + Short-term debt]/[Long-term debt+Short-term debt +
market value of common stock]
BLM [Long-term debt + Short-term debt + preferred stock]/[Long-term debt +
Short-term debt + book value of common stock]
Ln(Assets) Logarithm of total assets (AT)
Market-to-book Ratio of the market value of assets to the book value of assets and the
book value of assets.
Profitability Ratio of Profit (OIBDP) to Total Assets (AT)
Governance variables
Board size The number of directors on the board derived from RiskMetrics’ director
database
PIBoard Proportion of board accounted for by managers or their family members,
derived from RiskMetrics director database
Dual class A dummy variable that takes on the value 1 if a firm is a dual class firm.
CEO Chair A dummy variable that takes on the value 1 if the CEO is also chairman of
the board
Gindex We modified the Gompers, Ishii, and Metrick (2003) governance index to
account for the change in what charter provisions are reported by ISS’
RiskMetrics.
Eindex This is the index of charter provisions identified in Bebchuk, Cohen and
Ferrell (2009).
ACCEPTED MANUSCRIPT
https://freepaper.me/t/429856 خودت ترجمه کن :
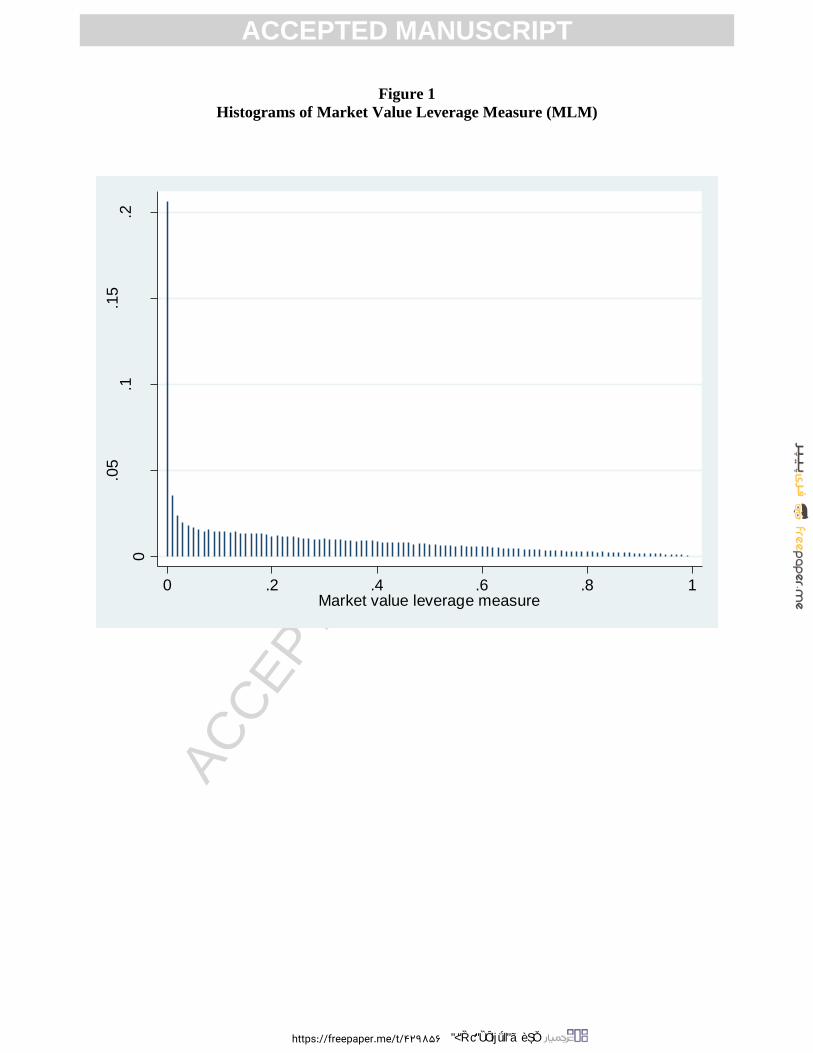
ACCEP
TED M
ANUSC
RIPT
Figure 1
Histograms of Market Value Leverage Measure (MLM)
0
.05
.1.1
5.2
Fra
ction
0 .2 .4 .6 .8 1Market value leverage measure
ACCEPTED MANUSCRIPT
https://freepaper.me/t/429856 خودت ترجمه کن :

ACCEP
TED M
ANUSC
RIPT
Highlights for “Firm Age, Corporate Governance, and Capital Structure Choices”
Corporate leverage is negatively correlated with firm age.
The interaction between firm age and governance explains this negative correlation.
The correlation between firm age and board composition is important.
ACCEPTED MANUSCRIPT
https://freepaper.me/t/429856 خودت ترجمه کن :
Related Documents