Tieto Corporation INTERIM REPORT 25 October 2011, 8.00 am EET 1 (31) © 2011 Tieto Corporation TIETO’s interim report 3/2011 (January–September) – Growth coupled with streamlining actions sustained operating profit July–September highlights Net sales totalled EUR 414.5 (387.1) million, an increase of 7%. Order intake at EUR 177 (486) million. Order backlog at EUR 1 608 (1 465) million at the end of the period. Operating profit (EBIT) amounted to EUR 29.2 (27.7) million, representing an operating margin of 7.1% (7.2). Operating profit excluding one-off items was EUR 34.5 (28.5) million, representing an operating margin of 8.3% (7.4). Profit after taxes was EUR 22.5 (24.4) million. Net cash flow from operations amounted to EUR 40.7 (15.1) million. January–September highlights Net sales totalled EUR 1 338.4 (1 241.5) million, an increase of 8%. Order intake was EUR 1 372 (1 448) million. Operating profit (EBIT) amounted to EUR 72.0 (66.0) million, representing an operating margin of 5.4% (5.3). Operating profit, excluding one-off items, amounted to EUR 82.9 (76.5) million, 6.2% (6.2) of net sales. Profit after taxes was EUR 47.4 (48.1) million. Net cash flow from operations amounted to EUR 79.5 (70.5) million. Outlook for 2011 unchanged For 2011, industry analysts expect growth of 2–4% for the IT services market in Western Europe. In 2011, Tieto expects its net sales to develop in line with the Western European IT services market. Full-year operating profit (EBIT) excluding one-off items is expected to be better than in 2010 (EUR 110.0 million in 2010). Q3/2011 Q3/2010 1–9/ 2011 1–9/ 2010 Net sales, EUR million 414.5 387.1 1 338.4 1 241.5 Change in net sales, % 7 1 8 -2 Operating profit (EBITA), EUR million 31.0 29.6 77.5 71.7 Operating margin (EBITA), % 7.5 7.7 5.8 5.8 Operating profit (EBIT), EUR million 29.2 27.7 72.0 66.0 Operating margin (EBIT), % 7.1 7.2 5.4 5.3 Operating profit (EBIT) excl. one-off items, EUR million 34.5 28.5 82.9 76.5 Operating margin (EBIT) excl. one-off items, % 8.3 7.4 6.2 6.2 Profit after taxes, EUR million 22.5 24.4 47.4 48.1 Net cash flow from operations, EUR million 40.7 15.1 79.5 70.5 EPS, EUR 0.31 0.34 0.66 0.67 Return on equity, 12-month rolling, % 8.9 14.2 8.9 14.2 Return on capital employed, 12-month rolling, % 16.1 18.6 16.1 18.6 Investments, EUR million 11.2 23.6 89.8 72.1 Interest-bearing net debt, EUR million 111.9 96.4 111.9 96.4 Gearing, % 20.4 17.5 20.4 17.5 Personnel on 30 Sep 18 145 17 313 18 145 17 313

Welcome message from author
This document is posted to help you gain knowledge. Please leave a comment to let me know what you think about it! Share it to your friends and learn new things together.
Transcript

Tieto Corporation INTERIM REPORT 25 October 2011, 8.00 am EET 1 (31)
© 2011 Tieto Corporation
TIETO’s interim report 3/2011 (January–September) – Growth coupled with streamlining actions sustained operating profit July–September highlights
Net sales totalled EUR 414.5 (387.1) million, an increase of 7%. Order intake at EUR 177 (486) million. Order backlog at EUR 1 608 (1 465) million at the
end of the period. Operating profit (EBIT) amounted to EUR 29.2 (27.7) million, representing an operating
margin of 7.1% (7.2). Operating profit excluding one-off items was EUR 34.5 (28.5) million, representing an
operating margin of 8.3% (7.4). Profit after taxes was EUR 22.5 (24.4) million. Net cash flow from operations amounted to EUR 40.7 (15.1) million.
January–September highlights
Net sales totalled EUR 1 338.4 (1 241.5) million, an increase of 8%. Order intake was EUR 1 372 (1 448) million. Operating profit (EBIT) amounted to EUR 72.0 (66.0) million, representing an operating
margin of 5.4% (5.3). Operating profit, excluding one-off items, amounted to EUR 82.9 (76.5) million, 6.2%
(6.2) of net sales. Profit after taxes was EUR 47.4 (48.1) million. Net cash flow from operations amounted to EUR 79.5 (70.5) million.
Outlook for 2011 unchanged For 2011, industry analysts expect growth of 2–4% for the IT services market in Western Europe. In 2011, Tieto expects its net sales to develop in line with the Western European IT services market. Full-year operating profit (EBIT) excluding one-off items is expected to be better than in 2010 (EUR 110.0 million in 2010).
Q3/2011 Q3/2010 1–9/ 2011
1–9/ 2010
Net sales, EUR million 414.5 387.1 1 338.4 1 241.5Change in net sales, % 7 1 8 -2Operating profit (EBITA), EUR million 31.0 29.6 77.5 71.7Operating margin (EBITA), % 7.5 7.7 5.8 5.8Operating profit (EBIT), EUR million 29.2 27.7 72.0 66.0Operating margin (EBIT), % 7.1 7.2 5.4 5.3Operating profit (EBIT) excl. one-off items, EUR million 34.5 28.5 82.9 76.5Operating margin (EBIT) excl. one-off items, % 8.3 7.4 6.2 6.2Profit after taxes, EUR million 22.5 24.4 47.4 48.1Net cash flow from operations, EUR million 40.7 15.1 79.5 70.5EPS, EUR 0.31 0.34 0.66 0.67Return on equity, 12-month rolling, % 8.9 14.2 8.9 14.2Return on capital employed, 12-month rolling, % 16.1 18.6 16.1 18.6Investments, EUR million 11.2 23.6 89.8 72.1Interest-bearing net debt, EUR million 111.9 96.4 111.9 96.4Gearing, % 20.4 17.5 20.4 17.5Personnel on 30 Sep 18 145 17 313 18 145 17 313
Tieto Corporation INTERIM REPORT 25 October 2011, 8.00 am EET 2 (31)
© 2011 Tieto Corporation
Ari Karppinen, acting President and CEO: ”Growth continued during the third quarter and our operating profit excluding one-off items improved by EUR 6 million from previous year, and the 8.3% EBIT margin is on a more satisfactory level. This shows that the implemented improvement actions are yielding concrete results. We have been able to increase customer work and decrease quality and administration costs. However, additional improvements are still needed and we are working on these. The most positive development was seen in Finland and the Baltic countries where we were able to turn around the previous quarters’ declining margin development and reached 10%. Scandinavia was another strong area with 14% growth with improving margins. Industry Solutions the best performing business line with solid growth and improved profitability. This year we have focused a lot on developing our offering portfolio. Cloud services and mobility are very much on our and our customers’ agenda and we are launching new interesting services in this area such as Tieto Mobile Shopper which helps retailers to reach the shoppers through smart phones and offer location based services or our new offerings that take SAP and database platforms to the cloud. The overall business environment is still rather stable despite the worsened macroeconomic outlook in Europe. Some signs of customer cautiousness are visible in certain sectors, but we do not expect these to have any material impact on our 2011 performance. We see continuously good demand especially in the manufacturing, energy and healthcare and welfare sectors, and believe this will continue also during the rest of the year.” MARKET DEVELOPMENT The macroeconomic outlook in Europe worsened during the third quarter, but the impacts on the IT services market have been minor so far. There are some signs of reduced IT spending, but the impacts are expected to be seen closer to the year-end or early 2012. Industry analysts’ estimates indicate growth of 2–4% for the Western European IT services market in 2011. Demand for new development projects aiming at enhanced customer services and better management of sales channels is good. Growing use of IT is currently driven by cloud computing and new ways of consuming IT via mobile devices and applications. Companies are still actively developing their ICT infrastructure and application environments. Applications and ICT infrastructure are increasingly moving towards web-based scalable delivery models. Many businesses are taking a hybrid approach to cloud services, i.e. combining cloud services with a variety of legacy systems that continue to support mission-critical processes. As reducing the cost of IT is still on customers’ agendas, the outsourcing of ICT infrastructure, application management and business processes is expected to remain the strongest area. Nordic customers have become more receptive to the use of offshore resources due to the pressure to cut costs. Since local European IT service providers still enjoy the benefits of having greater customer closeness as well as language and cultural affinity, their volumes are expected to see further good growth. However, offshore competition has led to continued price pressure in basic services, keeping margins at a low level. Prices of high value added services are stable or slightly rising. As a result, IT service vendors are seeking to improve margins by increasing offshoring, industrializing their service provision and selling more high value added services. Another challenge is the shortage of certain competences. For example, project managers and architects are in short supply. The need to recruit and retain talent is expected to lead to wage inflation. Healthy demand for IT services is anticipated especially in the manufacturing, healthcare and energy sectors. In the manufacturing sector, stronger demand is based on the need to cut costs
Tieto Corporation INTERIM REPORT 25 October 2011, 8.00 am EET 3 (31)
© 2011 Tieto Corporation
and improve processes and service deliveries. Business intelligence, unified communications and both cloud and mobility solutions are key themes driving demand for IT services. In the healthcare sector, there is a need to renew service production models to reconcile increasing service demand with the declining workforce. In the finance sector, cautiousness has increased on the heels of the weaker economic outlook. Demand is driven by the need for greater regulatory compliance and transparency across processes as well as the launch of new services supporting digital customership. The need to cut spending and to replace old legacy systems also maintains high interest in outsourcing. In telecom R&D, demand has picked up in the network equipment manufacturers segment. The market for mobile devices is turbulent due to fierce competition between device manufacturers seeking to gain market share and launch attractive new products with the latest technology platforms. Some R&D service providers are currently pricing their services aggressively to defend their position. In Finland and the Baltic countries, the IT services market is stable. Customers are investing in services supporting their growth, but at the same time aim to increase efficiency in application management and operations management. The Finnish IT services market is expected to grow by approximately 3% in 2011. In the public sector, budgets were allocated to agencies in late September and the planning of investments continues during the autumn. All agencies need to cut costs, which has affected IT spending negatively. However, in the longer run, productivity improvements will be sought from ICT development and outsourcing. Going forward, growth in the healthcare sector might be curbed due to budget cuts. In Scandinavia, demand for IT services has remained at a healthy level, but customers became somewhat more cautious during the autumn. The Swedish IT market is estimated to grow by close to 4% in 2011. Healthy demand for IT services is expected to continue, especially in the public and energy sectors. There are some signs of an overheated market, resulting in key competence shortages within some areas. Fierce competition puts pressure on prices in basic services, particularly in large centralized procurement processes. In Norway, the market has remained stable and is forecast to grow by 3%. The Danish market is expected to remain weak. In Central Europe & Russia, demand has increased particularly for projects driving cost-efficiency and customer satisfaction. The growth of the Polish and Russian markets is expected to continue at a healthy level, and outsourcing is forecast to grow by double-digit numbers. In Germany, demand is healthy, particularly in the manufacturing and automotive sectors, and the demand for managed services is strong. ORDER BACKLOG The order backlog, which only comprises services ordered with binding contracts, is solid. At the end of the period, the backlog amounted to EUR 1 608 (1 465) million. In total, 24% (26) of the backlog is expected to be invoiced during 2011. During the third quarter, order backlog declined from EUR 1 846 million on 30 June to EUR 1 608 million at the end of the quarter. Tieto signed a large amount of deals during the first half of 2011 which led to an exceptionally high order backlog on 30 June. Partly due to this, the third-quarter order intake declined to EUR 177 (486) million. STREAMLINING ACTIONS In 2010, Tieto announced streamlining actions related to the business structure renewal in Germany. The agreement on these actions was concluded during the second quarter leading to a reduction of approximately 100 full-time employees. One-off costs related to these actions were in line with the company’s estimate. The costs were booked in 2010 and the cash flow effect will materialize during the second half of 2011.

Tieto Corporation INTERIM REPORT 25 October 2011, 8.00 am EET 4 (31)
© 2011 Tieto Corporation
In 2011, the company estimates that it will book close to EUR 20 million in one-off costs related to streamlining actions. Of these costs, approximately half is anticipated to relate to the personnel negotiations started in Finland and Sweden during the second quarter. In Finland, the negotiations concern about 170 employees, and by the end of September, around 60 were made redundant. In Sweden, the negotiations concern about 100 employees of which around 30 were made redundant by the end of September. Voluntary leaves, internal transfers and pension arrangements decrease the amount of redundancies. Negotiations continue during the fourth quarter and part of the positive impact on profitability will materialize in the fourth quarter. In addition, the streamlining actions in Denmark have reduced the number of personnel by more than 60 this year. In total, one-off costs of EUR 10.9 million materialized during the nine-month period. FINANCIAL PERFORMANCE IN JULY–SEPTEMBER During July–September, Tieto signed several midsized and smaller agreements. For example, the company concluded agreements with Stora Enso (collaboration services), Swedbank (Core banking system), Inex Partners (SAP services) and Deutsche Telecom (Technology consulting and digital transformation). Third-quarter net sales rose by 7% and amounted to EUR 414.5 (387.1) million. The stronger currencies, especially the Swedish krona, had a positive EUR 2 million impact on net sales. In local currencies, net sales grew by 6%. Scandinavia was the strongest growing unit, posting growth of 14%, or 12% in local currencies. Both industry solutions and enterprise solutions saw strong growth as customers are transforming their businesses towards digitalized processes and mobile environments. Third-quarter operating profit (EBIT) amounted to EUR 29.2 (27.7) million, representing a margin of 7.1% (7.2). Operating profit includes one-off items of EUR 5.3 (0.8) million, which were mainly related to the personnel restructuring. Operating profit excluding one-off items stood at EUR 34.5 (28.5) million, or 8.3% (7.4) of net sales. The profitability improvement was mainly attributable to the continued net sales growth coupled with the favourable trend in personnel costs. Despite a 5% increase in the number of full-time employees, personnel expenses excluding restructuring costs and currency effects remained at the previous year’s level. The number of personnel has increased in offshore locations, whereas the total number of onshore personnel has declined and, as a result, expenses per employee have declined from the corresponding quarter in 2010. The improvement in profitability was somewhat curbed by higher subcontracting costs, which were up due to volume growth and lack of specific competences. Subcontracting costs excluding currency effects rose by around EUR 7 million, or 21%. Billable hours rose by around 9%, but higher volumes were not fully translated into net sales due to the continued decline in prices, increasing offshoring and some quality costs. However, the increase in subcontracting costs and quality costs was lower than during the first half. Depreciation rose by EUR 4.2 million, of which more than half is attributable to the new mainframe and software agreement, which is described in more detail in the Investments section. The agreement has no material impact on operating profit. Net financial expenses stood at EUR 1.3 (3.4) million in the third quarter. Net interest expenses were EUR 2.0 (1.5) million and net gains from foreign exchange transactions EUR 0.7 (negative 1.6) million. Other financial income and expenses amounted to EUR 0.0 (0.3) million. Third-quarter earnings per share (EPS) totalled EUR 0.31 (0.34).
Tieto Corporation INTERIM REPORT 25 October 2011, 8.00 am EET 5 (31)
© 2011 Tieto Corporation
Financial performance by market unit
Net sales Q3/2011,
EUR million
Net sales Q3/2010,
EUR millionChange,
%
Operating margin
Q3/2011, %
Operating margin
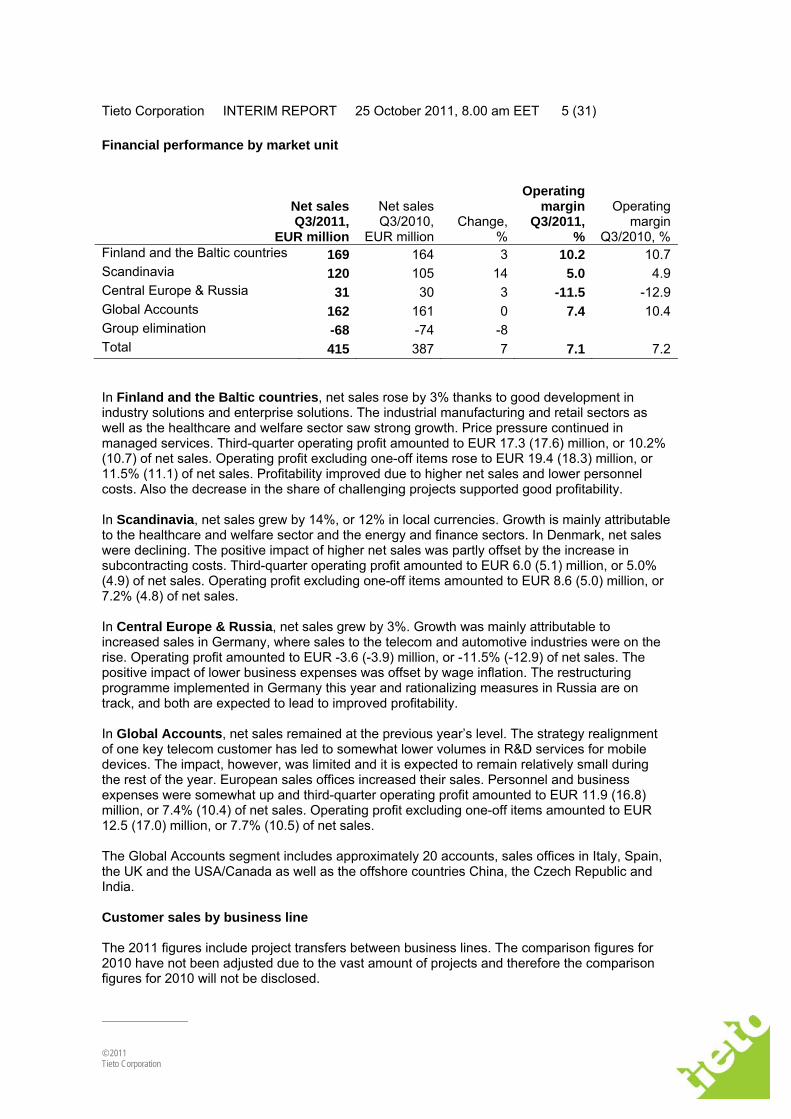
Q3/2010, % Finland and the Baltic countries 169 164 3 10.2 10.7Scandinavia 120 105 14 5.0 4.9Central Europe & Russia 31 30 3 -11.5 -12.9Global Accounts 162 161 0 7.4 10.4Group elimination -68 -74 -8 Total 415 387 7 7.1 7.2 In Finland and the Baltic countries, net sales rose by 3% thanks to good development in industry solutions and enterprise solutions. The industrial manufacturing and retail sectors as well as the healthcare and welfare sector saw strong growth. Price pressure continued in managed services. Third-quarter operating profit amounted to EUR 17.3 (17.6) million, or 10.2% (10.7) of net sales. Operating profit excluding one-off items rose to EUR 19.4 (18.3) million, or 11.5% (11.1) of net sales. Profitability improved due to higher net sales and lower personnel costs. Also the decrease in the share of challenging projects supported good profitability. In Scandinavia, net sales grew by 14%, or 12% in local currencies. Growth is mainly attributable to the healthcare and welfare sector and the energy and finance sectors. In Denmark, net sales were declining. The positive impact of higher net sales was partly offset by the increase in subcontracting costs. Third-quarter operating profit amounted to EUR 6.0 (5.1) million, or 5.0% (4.9) of net sales. Operating profit excluding one-off items amounted to EUR 8.6 (5.0) million, or 7.2% (4.8) of net sales. In Central Europe & Russia, net sales grew by 3%. Growth was mainly attributable to increased sales in Germany, where sales to the telecom and automotive industries were on the rise. Operating profit amounted to EUR -3.6 (-3.9) million, or -11.5% (-12.9) of net sales. The positive impact of lower business expenses was offset by wage inflation. The restructuring programme implemented in Germany this year and rationalizing measures in Russia are on track, and both are expected to lead to improved profitability. In Global Accounts, net sales remained at the previous year’s level. The strategy realignment of one key telecom customer has led to somewhat lower volumes in R&D services for mobile devices. The impact, however, was limited and it is expected to remain relatively small during the rest of the year. European sales offices increased their sales. Personnel and business expenses were somewhat up and third-quarter operating profit amounted to EUR 11.9 (16.8) million, or 7.4% (10.4) of net sales. Operating profit excluding one-off items amounted to EUR 12.5 (17.0) million, or 7.7% (10.5) of net sales. The Global Accounts segment includes approximately 20 accounts, sales offices in Italy, Spain, the UK and the USA/Canada as well as the offshore countries China, the Czech Republic and India. Customer sales by business line The 2011 figures include project transfers between business lines. The comparison figures for 2010 have not been adjusted due to the vast amount of projects and therefore the comparison figures for 2010 will not be disclosed.
Tieto Corporation INTERIM REPORT 25 October 2011, 8.00 am EET 6 (31)
© 2011 Tieto Corporation
Customer sales Q3/2011, EUR million
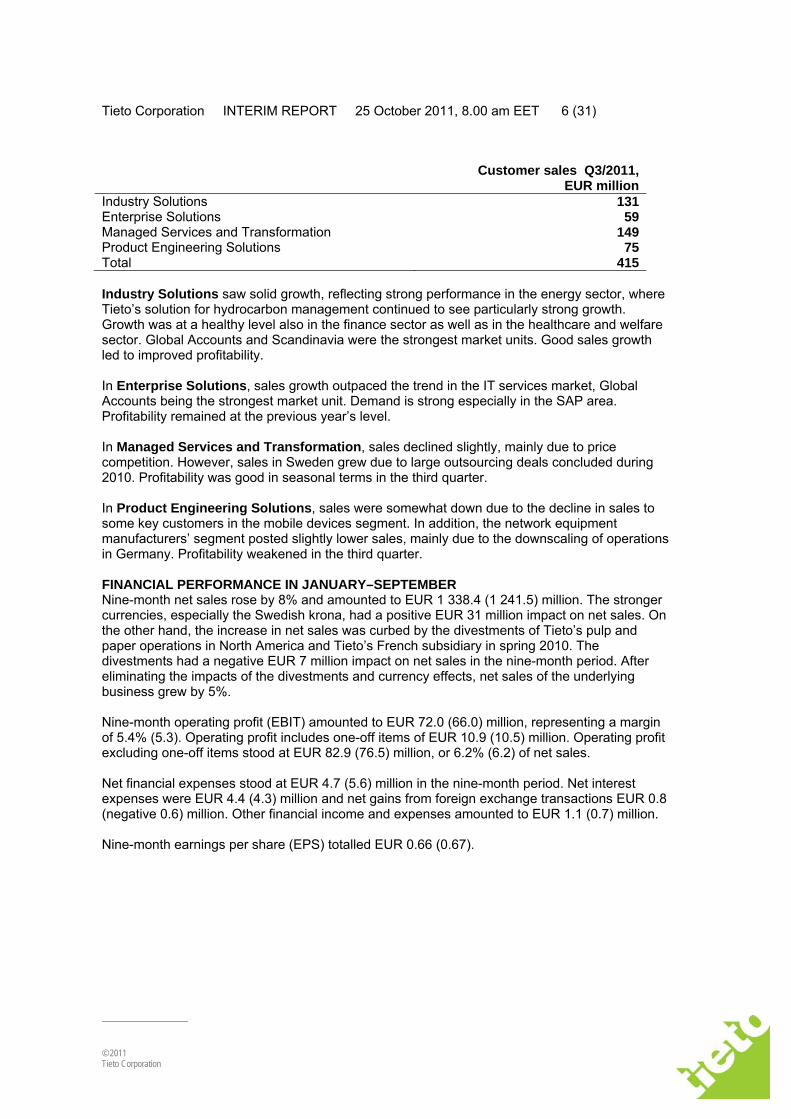
Industry Solutions 131 Enterprise Solutions 59 Managed Services and Transformation 149 Product Engineering Solutions 75 Total 415 Industry Solutions saw solid growth, reflecting strong performance in the energy sector, where Tieto’s solution for hydrocarbon management continued to see particularly strong growth. Growth was at a healthy level also in the finance sector as well as in the healthcare and welfare sector. Global Accounts and Scandinavia were the strongest market units. Good sales growth led to improved profitability. In Enterprise Solutions, sales growth outpaced the trend in the IT services market, Global Accounts being the strongest market unit. Demand is strong especially in the SAP area. Profitability remained at the previous year’s level. In Managed Services and Transformation, sales declined slightly, mainly due to price competition. However, sales in Sweden grew due to large outsourcing deals concluded during 2010. Profitability was good in seasonal terms in the third quarter. In Product Engineering Solutions, sales were somewhat down due to the decline in sales to some key customers in the mobile devices segment. In addition, the network equipment manufacturers’ segment posted slightly lower sales, mainly due to the downscaling of operations in Germany. Profitability weakened in the third quarter. FINANCIAL PERFORMANCE IN JANUARY–SEPTEMBER Nine-month net sales rose by 8% and amounted to EUR 1 338.4 (1 241.5) million. The stronger currencies, especially the Swedish krona, had a positive EUR 31 million impact on net sales. On the other hand, the increase in net sales was curbed by the divestments of Tieto’s pulp and paper operations in North America and Tieto’s French subsidiary in spring 2010. The divestments had a negative EUR 7 million impact on net sales in the nine-month period. After eliminating the impacts of the divestments and currency effects, net sales of the underlying business grew by 5%. Nine-month operating profit (EBIT) amounted to EUR 72.0 (66.0) million, representing a margin of 5.4% (5.3). Operating profit includes one-off items of EUR 10.9 (10.5) million. Operating profit excluding one-off items stood at EUR 82.9 (76.5) million, or 6.2% (6.2) of net sales. Net financial expenses stood at EUR 4.7 (5.6) million in the nine-month period. Net interest expenses were EUR 4.4 (4.3) million and net gains from foreign exchange transactions EUR 0.8 (negative 0.6) million. Other financial income and expenses amounted to EUR 1.1 (0.7) million. Nine-month earnings per share (EPS) totalled EUR 0.66 (0.67).
Tieto Corporation INTERIM REPORT 25 October 2011, 8.00 am EET 7 (31)
© 2011 Tieto Corporation
Financial performance by market unit
Net sales
1–9 /2011, EUR million
Net sales 1–9/2010,
EUR millionChange,
%
Operating margin *
1–9/2011, %
Operating margin
1–9/2010, %
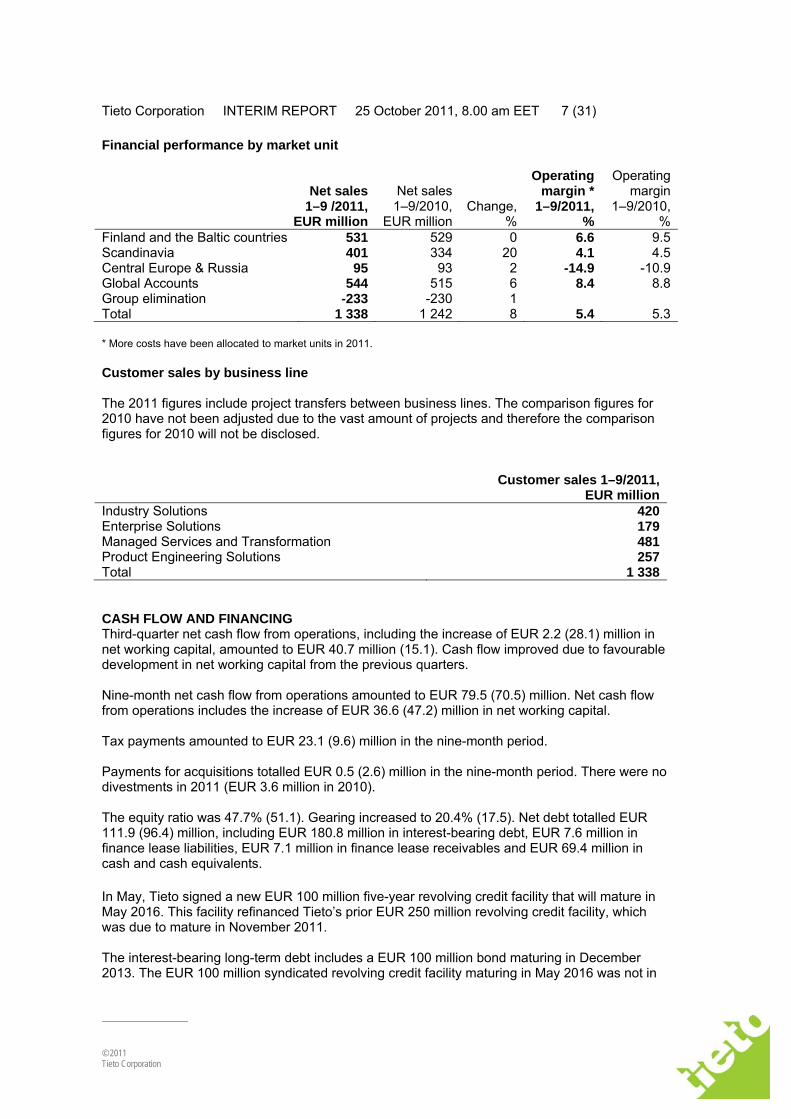
Finland and the Baltic countries 531 529 0 6.6 9.5Scandinavia 401 334 20 4.1 4.5Central Europe & Russia 95 93 2 -14.9 -10.9Global Accounts 544 515 6 8.4 8.8Group elimination -233 -230 1 Total 1 338 1 242 8 5.4 5.3 * More costs have been allocated to market units in 2011. Customer sales by business line The 2011 figures include project transfers between business lines. The comparison figures for 2010 have not been adjusted due to the vast amount of projects and therefore the comparison figures for 2010 will not be disclosed.
Customer sales 1–9/2011, EUR million
Industry Solutions 420Enterprise Solutions 179Managed Services and Transformation 481Product Engineering Solutions 257Total 1 338 CASH FLOW AND FINANCING Third-quarter net cash flow from operations, including the increase of EUR 2.2 (28.1) million in net working capital, amounted to EUR 40.7 million (15.1). Cash flow improved due to favourable development in net working capital from the previous quarters. Nine-month net cash flow from operations amounted to EUR 79.5 (70.5) million. Net cash flow from operations includes the increase of EUR 36.6 (47.2) million in net working capital. Tax payments amounted to EUR 23.1 (9.6) million in the nine-month period. Payments for acquisitions totalled EUR 0.5 (2.6) million in the nine-month period. There were no divestments in 2011 (EUR 3.6 million in 2010). The equity ratio was 47.7% (51.1). Gearing increased to 20.4% (17.5). Net debt totalled EUR 111.9 (96.4) million, including EUR 180.8 million in interest-bearing debt, EUR 7.6 million in finance lease liabilities, EUR 7.1 million in finance lease receivables and EUR 69.4 million in cash and cash equivalents. In May, Tieto signed a new EUR 100 million five-year revolving credit facility that will mature in May 2016. This facility refinanced Tieto’s prior EUR 250 million revolving credit facility, which was due to mature in November 2011. The interest-bearing long-term debt includes a EUR 100 million bond maturing in December 2013. The EUR 100 million syndicated revolving credit facility maturing in May 2016 was not in
Tieto Corporation INTERIM REPORT 25 October 2011, 8.00 am EET 8 (31)
© 2011 Tieto Corporation
use and there were no commercial papers issued under the EUR 250 million commercial paper programme at the end of September. A EUR 50 million bond (private placement) that will mature in July 2012 is reported as a short-term interest-bearing liability. Other long-term interest-bearing loans of EUR 13.7 million were mainly related to an acquisition agreement for mainframes and software. INVESTMENTS Nine-month investments totalled EUR 89.8 (72.1) million, of which EUR 47.5 million relates to the new mainframe and software agreement. Capital expenditure accounted for EUR 89.8 (70.3) million. There were no investments in subsidiary and associated company shares in the nine-month period (EUR 1.8 million in 2010). Tieto signed a new mainframe and software agreement during the first quarter. The new agreement differs from the previous one that expired at the end of 2010. Instead of presenting the software costs under rents, they are presented as depreciation and interest expenses and in the balance sheet as fixed assets and interest-bearing loans. In 2010, the software rents amounted to around EUR 3.4 million for each quarter. The change has no material impact on operating profit. BUSINESS TRANSACTIONS AND MAJOR AGREEMENTS IN JANUARY–SEPTEMBER In February, the Government IT Shared Service Centre, the division of the State Treasury procuring and producing IT services on behalf of the entire central government in Finland, chose Tieto as the supplier of its unified communications and collaboration solution. The solution was built during the spring and will be rolled out this autumn. It will be provided as a service to the whole state administration, with the target of serving 70 000 users. The total value of the contract is over EUR 20 million. In April, Tieto Sweden and Saab AB concluded agreements concerning ICT infrastructure, system development and ASM (Application Service Management). The ASM agreement is new and the other two agreements are extensions of existing contracts. The value of the ICT infrastructure agreement is at least SEK 45 million over a period of three years. The other two contracts are frame agreements. In April, Tieto and I-Teco agreed to pull out of their plans to establish a joint venture company in Russia. The plans were announced in September 2010. In April, Tieto and Itella concluded an agreement on data centre services. The total value of the three-year contract is EUR 14 million. In June, Tieto signed an agreement on the operations of an In Store solution with Apoteket AB, the largest pharmacy chain in Sweden. The agreement is for a period of six years. In June, Inex Partners chose Tieto as the provider of SAP application management services for three and a half years. The total value of the three-year contract is around EUR 12 million. In June, Tieto and Stockholm County Council renewed an agreement on operations management and application management services. The agreement is for a period of three years. In June, Kesko selected Tieto as its capacity and integration service provider. The new agreement covers Kesko's IT infrastructure, integration and SAP servers. Some of the services will be delivered as cloud-based solutions. The value of the three-year contract is approximately EUR 35 million.

Tieto Corporation INTERIM REPORT 25 October 2011, 8.00 am EET 9 (31)
© 2011 Tieto Corporation
In August, Hansel, the central procurement unit of the Finnish Government, selected Tieto as the framework agreement supplier of IT expert services. Under the framework agreement, state units may invite tenders for deliveries from the selected suppliers using a streamlined procedure. In August, Tieto concluded a three-year contract on collaboration services with Stora Enso. The services cover e-mail, directory and instant messaging with voice conferencing services based on the latest Microsoft Office technologies. In September, Tieto and Inex Partners concluded a three-and-a-half-year contract concerning SAP services. The total value of the contract is EUR 12.5 million. In September, Tapiola selected Tieto as its partner for developing internet services and standardizing the technical environment and applications of Tapiola's internet journals. PERSONNEL The number of full-time employees amounted to 18 145 (17 313) at the end of September. Tieto has actively been increasing its resources in global delivery centres. At the end of September, the number of full-time employees in the global delivery centres totalled 7 147 (6 121), or 39% (35) of personnel. Global operations have grown fast, especially in China and India. In onshore locations, the number of personnel has decreased by 200 year-on-year. The 12-month rolling employee turnover stood at 11.8% (8.7%) at the end of September. The average number of fulltime employees was 18 096 (16 934) in the nine-month period. BOARD OF DIRECTORS AND MANAGEMENT In July, the Board of Directors has appointed Kimmo Alkio President and CEO as of 1 November 2011. Alkio joins Tieto from F-Secure Corporation where he has been working as the President and CEO since 2006. Teuvo Salminen was appointed member of Tieto’s Remuneration Committee as of 23 September 2011. He replaces Kimmo Alkio, who resigned from the committee after his appointment as Tieto’s President and CEO in July. SHARES AND SHARE-BASED INCENTIVES Tieto Corporation’s issued and registered share capital on 30 September 2011 totalled EUR 75 841 523 and the number of shares was 72 023 173. At the end of the quarter, the number of shares in the company’s possession totalled 553 700, representing 0.8% of the total number of shares and voting rights. The number of outstanding shares, excluding the shares in the company’s possession, was 71 469 473 at the end of September. FLAGGING ANNOUNCEMENTS On 15 August, Cevian Capital II Master Fund L.P. announced that its aggregate holding in Tieto Corporation had risen above the 10% threshold to 10.2%. Based on the ownership records of Euroclear Finland on 30 September, its holding was 12.7%. EVENTS AFTER THE PERIOD On 13 October, Tieto announced the composition of the Shareholders’ Nomination Board. The composition was determined on the basis of the shareholdings registered in the Finnish and Swedish book-entry systems on 30 September 2011 and is the following: Lars Förberg, Cevian Capital II Master Fund L.P., Kari Järvinen, Solidium Oy, Marianne Nilsson, Swedbank Robur Fonder AB, Hanna Kaskela, Varma Mutual Pension Insurance Company, and

Tieto Corporation INTERIM REPORT 25 October 2011, 8.00 am EET 10 (31)
© 2011 Tieto Corporation
Markku Pohjola, Chairman of the Board of Directors of Tieto Corporation. NEAR-TERM RISKS AND UNCERTAINTIES The rising cost base coupled with price pressure might lead to weak profitability for IT service companies. However, despite continuing price erosion, Tieto assumes that the initiated efficiency and streamlining measures will continue to yield results. The ongoing transformation of the IT sector towards offshore production might create uncertainty among the company’s personnel and poses risks related to the company’s market position and prices. Tieto has, however, steadily increased its offshore resources during the past several years. Typical risks faced by the IT service industry involve the quality of deliveries and related project overruns. Transitions to offshore delivery centres as well as the ongoing organizational change pose risks of project losses and penalties. In some specialist areas, there are signs of a lack of resources and rising attrition. Therefore, the rise in personnel expenses might be higher than agreed in the labour agreements. In Asia, salaries are on the rise, in some areas even at a double-digit rate. Concerns about European economies are arising due to prolonged debt crises. This might lead to economic slowdown and a downturn in the IT services market as well. A comprehensive description of the major long-term risks is available in the Report by the Board of Directors on the company’s website at www.tieto.com. OUTLOOK FOR 2011 UNCHANGED For 2011, industry analysts expect growth of 2–4% for the IT services market in Western Europe. In 2011, Tieto expects its net sales to develop in line with the Western European IT services market. Full-year operating profit (EBIT) excluding one-off items is expected to be better than in 2010 (EUR 110.0 million in 2010). The figures in this report are unaudited. Financial calendar 8 February 2012 Interim report 4/2011 and financial statements bulletin for 2011 Accounting policies in 2011 The interim report has been prepared in accordance with International Accounting Standard (IAS) 34, Interim Financial Reporting, as adopted by the EU. The accounting policies adopted are consistent with those used in the annual financial statements for the year ended on 31 December 2010. The accounting policies, standards, interpretations and amendments taken into use in 2011 are described in the annual financial statements. The effects of the changes are immaterial.
Tieto Corporation INTERIM REPORT 25 October 2011, 8.00 am EET 11 (31)
© 2011 Tieto Corporation
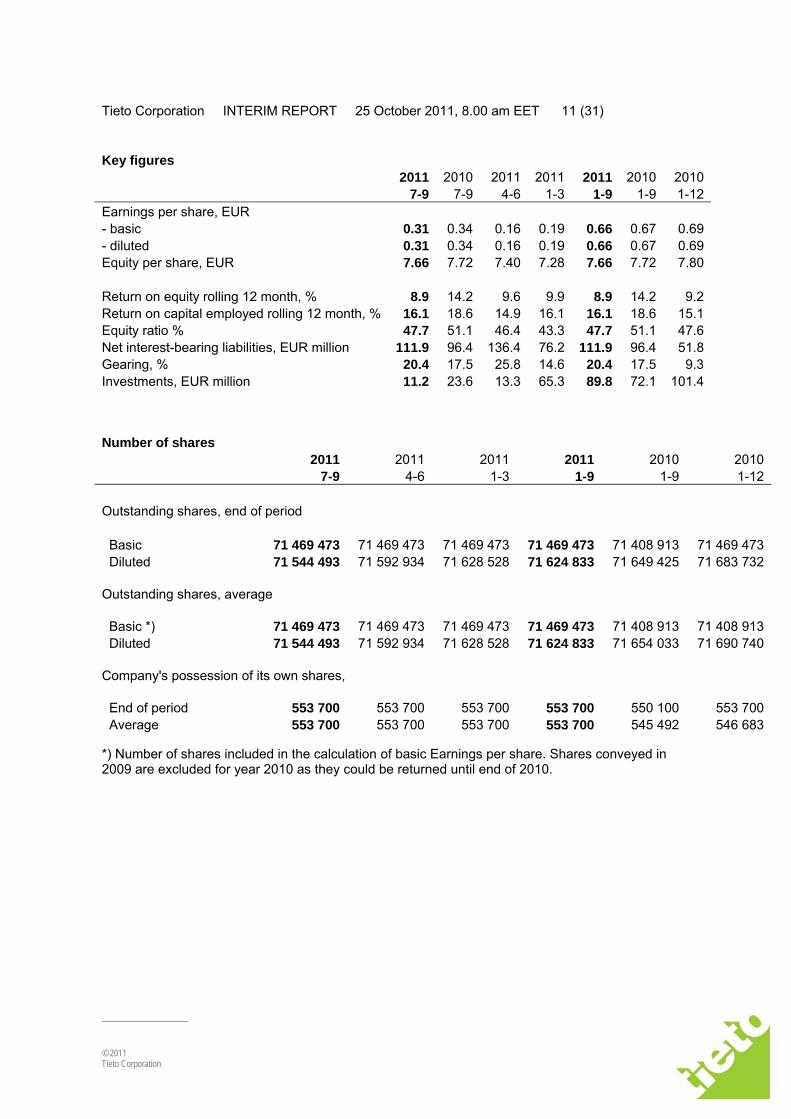
Key figures
2011 2010 2011 2011 2011 2010 2010 7-9 7-9 4-6 1-3 1-9 1-9 1-12Earnings per share, EUR - basic 0.31 0.34 0.16 0.19 0.66 0.67 0.69- diluted 0.31 0.34 0.16 0.19 0.66 0.67 0.69Equity per share, EUR 7.66 7.72 7.40 7.28 7.66 7.72 7.80
Return on equity rolling 12 month, % 8.9 14.2 9.6 9.9 8.9 14.2 9.2Return on capital employed rolling 12 month, % 16.1 18.6 14.9 16.1 16.1 18.6 15.1Equity ratio % 47.7 51.1 46.4 43.3 47.7 51.1 47.6Net interest-bearing liabilities, EUR million 111.9 96.4 136.4 76.2 111.9 96.4 51.8Gearing, % 20.4 17.5 25.8 14.6 20.4 17.5 9.3Investments, EUR million 11.2 23.6 13.3 65.3 89.8 72.1 101.4 Number of shares
2011 2011 2011 2011 2010 2010 7-9 4-6 1-3 1-9 1-9 1-12
Outstanding shares, end of period
Basic 71 469 473 71 469 473 71 469 473 71 469 473 71 408 913 71 469 473 Diluted 71 544 493 71 592 934 71 628 528 71 624 833 71 649 425 71 683 732
Outstanding shares, average Basic *) 71 469 473 71 469 473 71 469 473 71 469 473 71 408 913 71 408 913 Diluted 71 544 493 71 592 934 71 628 528 71 624 833 71 654 033 71 690 740
Company's possession of its own shares, End of period 553 700 553 700 553 700 553 700 550 100 553 700 Average 553 700 553 700 553 700 553 700 545 492 546 683 *) Number of shares included in the calculation of basic Earnings per share. Shares conveyed in 2009 are excluded for year 2010 as they could be returned until end of 2010.

Tieto Corporation INTERIM REPORT 25 October 2011, 8.00 am EET 12 (31)
© 2011 Tieto Corporation
Income statement 2011 2010 2011 2010 Change 2010
7-9 7-9 1-9 1-9 % 1-12Net sales 414.5 387.1 1 338.4 1 241.5 8 1 713.7Other operating income 1.6 3.8 6.1 13.3 -54 17.5Employee benefit expenses 223.7 219.2 759.9 729.5 4 1 017.1Depreciation, amortization and impairment charges 22.1 17.9 67.8 59.1 15 78.5Other operating expenses 141.1 126.1 444.8 400.2 11 563.2Operating profit (EBIT) 29.2 27.7 72.0 66.0 9 72.4Interest and other financial income 4.0 1.7 7.5 8.8 -15 10.6Interest and other financial expenses -6.0 -3.5 -13.0 -13.8 -6 -16.9Net exchange losses/gains 0.7 -1.6 0.8 -0.6 - 0.0Profit before taxes 27.9 24.3 67.3 60.4 11 66.1Income taxes -5.4 0.1 -19.9 -12.3 62 -16.6Net profit for the period 22.5 24.4 47.4 48.1 -1 49.5
Net profit for the period attributable to Shareholders of the Parent company 22.5 24.6 47.4 48.1 -1 49.5 Non-controlling interest 0.0 -0.2 0.0 0.0 - 0.0
22.5 24.4 47.4 48.1 -1 49.5 Earnings per share attributable to the shareholders of the Parent company, EUR Basic 0.31 0.34 0.66 0.67 -1 0.69Diluted 0.31 0.34 0.66 0.67 -1 0.69 Statement of comprehensive income, EUR million Net profit for the period 22.5 24.4 47.4 48.1 -1 49.5Translation difference from the net investment in Swedish subsidiaries (net of tax) -1.4 6.5 -5.2 17.5 -130 20.7Translation differences -1.4 -5.2 -3.9 -0.2 - 1.5Cash flow hedges -1.0 0.6 -0.4 0.5 - -0.1Total comprehensive income 18.7 26.3 37.9 65.9 -42 71.6 Total comprehensive income attributable to Shareholders of the Parent company 18.7 26.3 37.9 65.9 -42 71.6 Non-controlling interest 0.0 0.0 0.0 0.0 - 0.0
18.7 26.3 37.9 65.9 -42 71.6
Tieto Corporation INTERIM REPORT 25 October 2011, 8.00 am EET 13 (31)
© 2011 Tieto Corporation
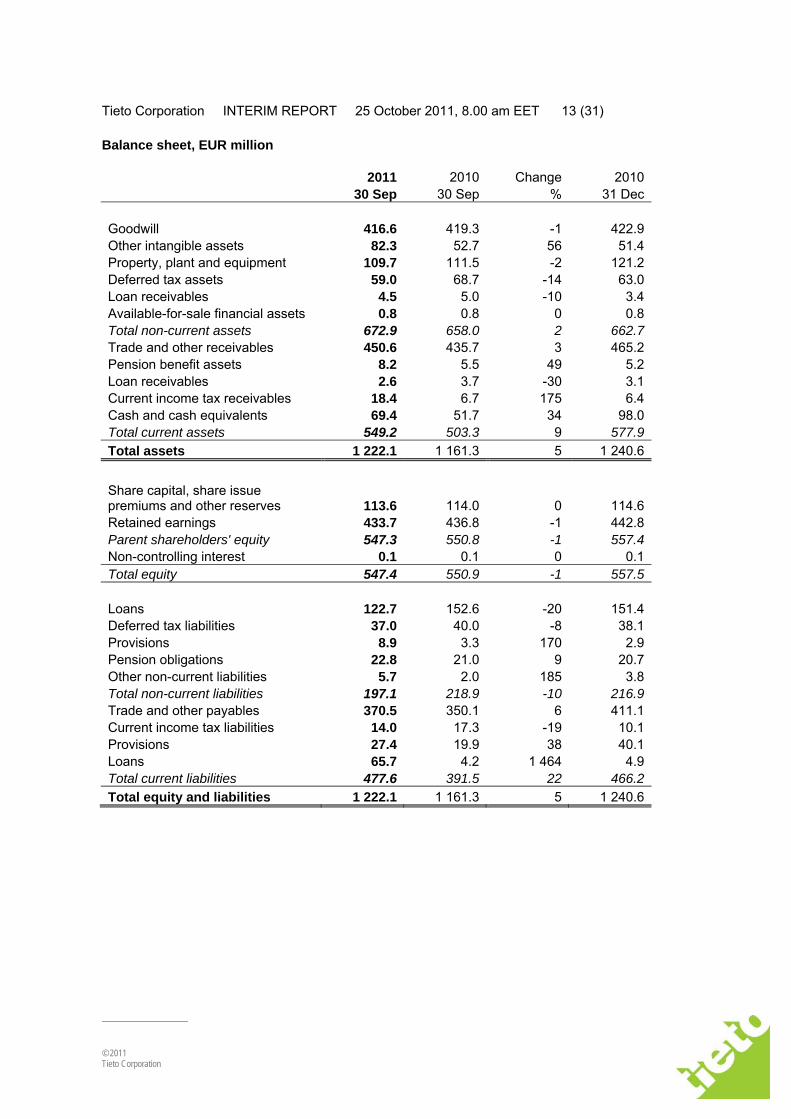
Balance sheet, EUR million
2011 2010 Change 2010 30 Sep 30 Sep % 31 Dec
Goodwill 416.6 419.3 -1 422.9 Other intangible assets 82.3 52.7 56 51.4 Property, plant and equipment 109.7 111.5 -2 121.2 Deferred tax assets 59.0 68.7 -14 63.0 Loan receivables 4.5 5.0 -10 3.4 Available-for-sale financial assets 0.8 0.8 0 0.8 Total non-current assets 672.9 658.0 2 662.7 Trade and other receivables 450.6 435.7 3 465.2 Pension benefit assets 8.2 5.5 49 5.2 Loan receivables 2.6 3.7 -30 3.1 Current income tax receivables 18.4 6.7 175 6.4 Cash and cash equivalents 69.4 51.7 34 98.0 Total current assets 549.2 503.3 9 577.9 Total assets 1 222.1 1 161.3 5 1 240.6
Share capital, share issue premiums and other reserves 113.6 114.0 0 114.6 Retained earnings 433.7 436.8 -1 442.8 Parent shareholders' equity 547.3 550.8 -1 557.4 Non-controlling interest 0.1 0.1 0 0.1 Total equity 547.4 550.9 -1 557.5 Loans 122.7 152.6 -20 151.4 Deferred tax liabilities 37.0 40.0 -8 38.1 Provisions 8.9 3.3 170 2.9 Pension obligations 22.8 21.0 9 20.7 Other non-current liabilities 5.7 2.0 185 3.8 Total non-current liabilities 197.1 218.9 -10 216.9 Trade and other payables 370.5 350.1 6 411.1 Current income tax liabilities 14.0 17.3 -19 10.1 Provisions 27.4 19.9 38 40.1 Loans 65.7 4.2 1 464 4.9 Total current liabilities 477.6 391.5 22 466.2 Total equity and liabilities 1 222.1 1 161.3 5 1 240.6

Tieto Corporation INTERIM REPORT 25 October 2011, 8.00 am EET 14 (31)
© 2011 Tieto Corporation
Net working capital in the balance sheet, EUR million
2011 2010 Change 2011 2011 2010 30 Sep 30 Sep % 31 Mar 30 Jun 31 Dec
Accounts receivable 318.5 292.7 9 345.8 344.1 367.1Other working capital receivables 134.1 141.9 -5 133.5 125.3 101.2Working capital receivables included in assets 452.6 434.6 4 479.3 469.4 468.3
Operative accruals 139.9 142.0 -1 180.6 164.1 173.8Other working capital liabilities 225.9 198.2 14 243.8 218.4 235.8Pension obligations and provisions 59.1 44.2 34 60.9 63.9 63.7Working capital liabilities included in current liabilities 424.9 384.4 11 485.3 446.4 473.3
Net working capital in the balance sheet 27.7 50.2 -45 -6.0 23.0 -5.0
Tieto Corporation INTERIM REPORT 25 October 2011, 8.00 am EET 15 (31)
© 2011 Tieto Corporation
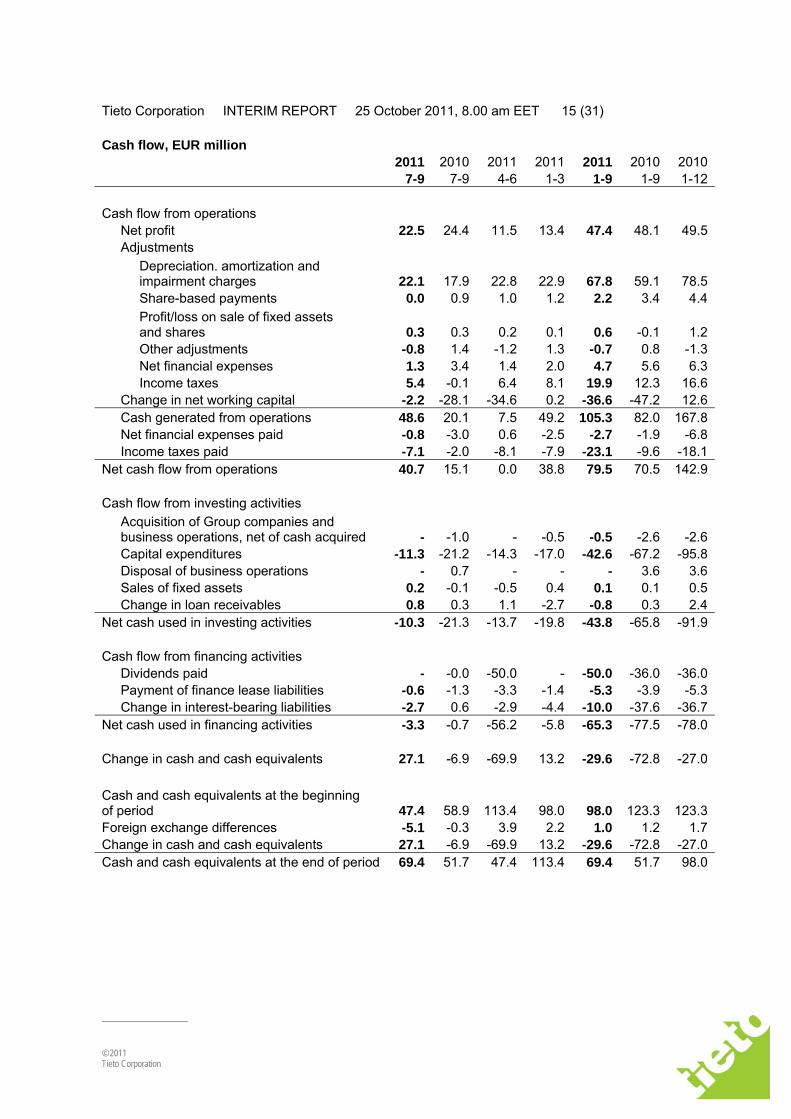
Cash flow, EUR million 2011 2010 2011 2011 2011 2010 2010
7-9 7-9 4-6 1-3 1-9 1-9 1-12
Cash flow from operations Net profit 22.5 24.4 11.5 13.4 47.4 48.1 49.5Adjustments
Depreciation. amortization and impairment charges 22.1 17.9 22.8 22.9 67.8 59.1 78.5Share-based payments 0.0 0.9 1.0 1.2 2.2 3.4 4.4Profit/loss on sale of fixed assets and shares 0.3 0.3 0.2 0.1 0.6 -0.1 1.2Other adjustments -0.8 1.4 -1.2 1.3 -0.7 0.8 -1.3Net financial expenses 1.3 3.4 1.4 2.0 4.7 5.6 6.3Income taxes 5.4 -0.1 6.4 8.1 19.9 12.3 16.6
Change in net working capital -2.2 -28.1 -34.6 0.2 -36.6 -47.2 12.6Cash generated from operations 48.6 20.1 7.5 49.2 105.3 82.0 167.8Net financial expenses paid -0.8 -3.0 0.6 -2.5 -2.7 -1.9 -6.8
Income taxes paid -7.1 -2.0 -8.1 -7.9 -23.1 -9.6 -18.1Net cash flow from operations 40.7 15.1 0.0 38.8 79.5 70.5 142.9
Cash flow from investing activities Acquisition of Group companies and business operations, net of cash acquired - -1.0 - -0.5 -0.5 -2.6 -2.6Capital expenditures -11.3 -21.2 -14.3 -17.0 -42.6 -67.2 -95.8Disposal of business operations - 0.7 - - - 3.6 3.6Sales of fixed assets 0.2 -0.1 -0.5 0.4 0.1 0.1 0.5
Change in loan receivables 0.8 0.3 1.1 -2.7 -0.8 0.3 2.4Net cash used in investing activities -10.3 -21.3 -13.7 -19.8 -43.8 -65.8 -91.9
Cash flow from financing activities Dividends paid - -0.0 -50.0 - -50.0 -36.0 -36.0Payment of finance lease liabilities -0.6 -1.3 -3.3 -1.4 -5.3 -3.9 -5.3
Change in interest-bearing liabilities -2.7 0.6 -2.9 -4.4 -10.0 -37.6 -36.7Net cash used in financing activities -3.3 -0.7 -56.2 -5.8 -65.3 -77.5 -78.0
Change in cash and cash equivalents 27.1 -6.9 -69.9 13.2 -29.6 -72.8 -27.0 Cash and cash equivalents at the beginning of period 47.4 58.9 113.4 98.0 98.0 123.3 123.3Foreign exchange differences -5.1 -0.3 3.9 2.2 1.0 1.2 1.7Change in cash and cash equivalents 27.1 -6.9 -69.9 13.2 -29.6 -72.8 -27.0Cash and cash equivalents at the end of period 69.4 51.7 47.4 113.4 69.4 51.7 98.0

Tieto Corporation INTERIM REPORT 25 October 2011, 8.00 am EET 16 (31)
© 2011 Tieto Corporation
Statement of changes in shareholders' equity, EUR million
Parent shareholders' equity Non-
control-ling
interestTotal
equity
Share capi-
tal
Shareissue
premi-ums and
otherreserves
Ownshares
Trans-lationdiffer-
encies
Cashflow
hedges
Re- tained earn- ings
Total
At 31 Dec 2009 75.8 34.8 -11.6 -44.8 0.0 463.4 517.6 0.7 518.3
Comprehensive income Net profit for the period 48.1 48.1 0.0 48.1Other comprehensive income
Translation difference from the net investment in Swedish subsidiaries (net of tax) 17.5 17.5 17.5Translation difference 3.4 51.0 -54.6 -0.2 -0.2Cash flow hedges 0.5 0.5 0.5Total comprehensive income 3.4 51.0 0.5 11.0 65.9 0.0 65.9
Transactions with owners Share-based payments recognized against equity 3.5 3.5 3.5Dividend -35.7 -35.7 -35.7Changes due to business combinations -0.5 -0.5 -0.2 -0.7Non-controlling interest -0.4 -0.4Total transactions with owners 0.0 0.0 -32.7 -32.7 -0.6 -33.3
At 30 Sep 2010 75.8 38.2 -11.6 6.2 0.5 441.7 550.8 0.1 550.9

Tieto Corporation INTERIM REPORT 25 October 2011, 8.00 am EET 17 (31)
© 2011 Tieto Corporation
Parent shareholders' equity Non-
control-ling
interestTotal
equity
Share capi-
tal
Shareissue
premi-ums and
otherreserves
Ownshares
Trans-lationdiffer-
encies
Cashflow
hedges
Re- tained earn- ings
Total
At 31 Dec 2010 75.8 38.8 -11.6 21.5 -0.1 433.0 557.4 0.1 557.5
Comprehensive income Net profit for the period 47.4 47.4 0.0 47.4
Other comprehensive income
Translation difference from the net investment in Swedish subsidiaries (net of tax) -5.2 -5.2 -5.2Translation difference -1.0 -16.3 13.4 -3.9 -3.9Cash flow hedges -0.4 -0.4 -0.4
Total comprehensive income -1.0 -16.3 -0.4 55.6 37.9 0.0 37.9
Transactions with owners Share-based payments recognized against equity 2.0 2.0 2.0Dividend -50.0 -50.0 -50.0Non-controlling interest 0.0
Total transactions with owners 0.0 0.0 -48.0 -48.0 0.0 -48.0
At 30 Sep 2011 75.8 37.8 -11.6 5.2 -0.5 440.6 547.3 0.1 547.4 EUR 3.5 million has been reclassified from Retained earnings to Translation differences at 31 Dec 2010.

Tieto Corporation INTERIM REPORT 25 October 2011, 8.00 am EET 18 (31)
© 2011 Tieto Corporation
Net sales by market unit, EUR million 2011 2010 Change 2011 2010 Change 2010 7-9 7-9 % 1-9 1-9 % 1-12Finland and the Baltic countries 169 164 3 531 529 0 726Scandinavia 120 105 14 401 334 20 468Central Europe & Russia 31 30 3 95 93 2 126Global Accounts 162 161 0 544 515 6 704Group elimination -68 -74 -8 -233 -230 1 -311Group total 415 387 7 1 338 1 242 8 1 714 Customer sales by market unit, EUR million 2011 2010 Change 2011 2010 Change 2010 7-9 7-9 % 1-9 1-9 % 1-12Finland and the Baltic countries 145 137 6 453 443 2 612Scandinavia 103 87 18 342 280 22 395Central Europe & Russia 25 24 3 75 75 0 101Global Accounts 142 138 2 468 444 5 606Group total 415 387 7 1 338 1 242 8 1 714 Internal sales by market unit, EUR million 2011 2010 Change 2011 2010 Change 2010
7-9 7-9 % 1-9 1-9 % 1-12Finland and the Baltic countries 24 27 -10 78 86 -10 114Scandinavia 17 18 -4 59 54 8 74Central Europe & Russia 7 6 4 21 18 14 25Global Accounts 20 23 -13 76 71 7 98Group total 68 74 -8 233 230 1 311 Sales between segments are carried out at arm's length. Net sales by country, EUR million 2011 Change Share 2010 Share 2010 1-9 % % 1-9 % 1-12Finland 602 1 45 599 48 826Sweden 413 22 31 340 27 479Other 323 7 24 303 24 410Group total 1 338 8 100 1 242 100 1 714

Tieto Corporation INTERIM REPORT 25 October 2011, 8.00 am EET 19 (31)
© 2011 Tieto Corporation
Customer sales by business line, EUR million 2011 2011 7-9 1-9 Industry Solutions 131 420 Enterprise Solutions 59 179 Managed services and transformation 149 481 Product Engineering Solutions 75 257 Group total 415 1 338
The 2011 figures include project transfers between business lines. The comparison figures for 2010 have not been adjusted due to the vast amount of projects and therefore, the comparison figures for 2010 will not be disclosed. Net sales by customer sector, EUR million 2011 2010 Change 2011 2010 Change 2010 7-9 7-9 % 1-9 1-9 % 1-12Telecom 129 131 -2 428 422 1 571Finance 85 82 4 276 261 6 358Industry sectors 200 173 16 635 560 13 785Group total 415 387 7 1 338 1 242 8 1 714 Revenues of EUR 167.5 million (EUR 168.8 million in 2010) are derived from a single external customer during January-September. These revenues are attributable to all reportable segments.
Tieto Corporation INTERIM REPORT 25 October 2011, 8.00 am EET 20 (31)
© 2011 Tieto Corporation
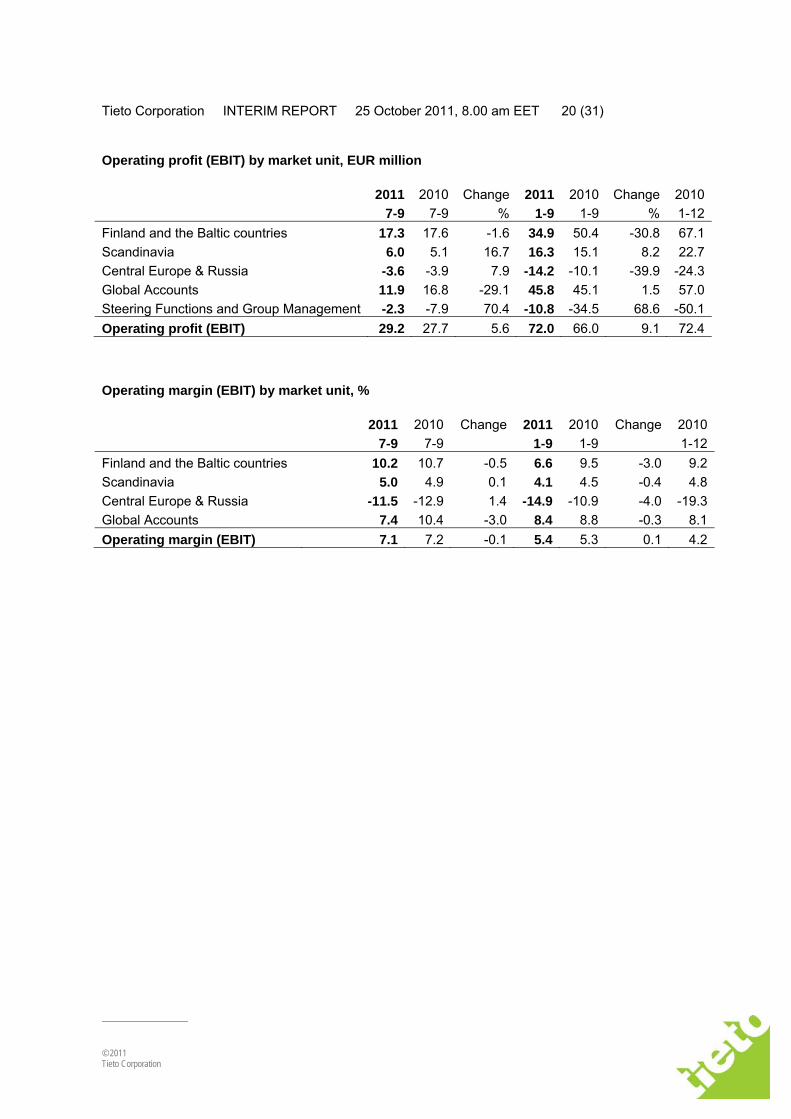
Operating profit (EBIT) by market unit, EUR million 2011 2010 Change 2011 2010 Change 2010 7-9 7-9 % 1-9 1-9 % 1-12Finland and the Baltic countries 17.3 17.6 -1.6 34.9 50.4 -30.8 67.1Scandinavia 6.0 5.1 16.7 16.3 15.1 8.2 22.7Central Europe & Russia -3.6 -3.9 7.9 -14.2 -10.1 -39.9 -24.3Global Accounts 11.9 16.8 -29.1 45.8 45.1 1.5 57.0Steering Functions and Group Management -2.3 -7.9 70.4 -10.8 -34.5 68.6 -50.1Operating profit (EBIT) 29.2 27.7 5.6 72.0 66.0 9.1 72.4 Operating margin (EBIT) by market unit, % 2011 2010 Change 2011 2010 Change 2010 7-9 7-9 1-9 1-9 1-12Finland and the Baltic countries 10.2 10.7 -0.5 6.6 9.5 -3.0 9.2Scandinavia 5.0 4.9 0.1 4.1 4.5 -0.4 4.8Central Europe & Russia -11.5 -12.9 1.4 -14.9 -10.9 -4.0 -19.3Global Accounts 7.4 10.4 -3.0 8.4 8.8 -0.3 8.1Operating margin (EBIT) 7.1 7.2 -0.1 5.4 5.3 0.1 4.2

Tieto Corporation INTERIM REPORT 25 October 2011, 8.00 am EET 21 (31)
© 2011 Tieto Corporation
Personnel by country End of period Average 2011 Change Share 2010 2010 2011 2010
1-9 % % 1-9 1-12 1-9 1-9Finland 5 628 -3 31 5 807 5 776 5 731 5 779Sweden 3 120 6 17 2 948 3 023 3 095 2 946Czech 1 956 6 11 1 841 1 886 1 922 1 757India 1 646 24 9 1 324 1 499 1 602 1 153China 1 306 39 7 942 1 096 1 227 818Poland 1 166 36 6 857 950 1 084 766Germany 909 -13 5 1 040 1 010 978 1 033Latvia 578 -3 3 594 582 580 594Norway 468 -8 3 511 500 484 524Italy 261 12 1 234 232 251 267Great Britain 195 -9 1 214 211 199 238Lithuania 161 -8 1 176 169 160 179Denmark 134 -32 1 197 190 166 209Netherlands 121 -6 1 129 132 126 131Russia 107 -20 1 133 130 116 121Estonia 92 -18 1 112 106 96 118Other 297 16 2 255 265 276 302Group total 18 145 5 100 17 313 17 757 18 096 16 934 Non-current assets by country, EUR million 2011 2010 Change 2010 30 Sep 30 Sep % 31 Dec Finland 134.9 99.0 36 106.6 Sweden 33.6 37.2 -10 38.9 Other 23.6 28.0 -16 27.2 Total non-current assets 192.1 164.2 17 172.7
Goodwill is allocated to the Cash Generating Units, which include several countries and therefore goodwill is not included in the country specific non-current assets shown above.

Tieto Corporation INTERIM REPORT 25 October 2011, 8.00 am EET 22 (31)
© 2011 Tieto Corporation
Capital expenditure by market unit, EUR million 2011 2010 Change 2011 2010 Change 2010 7-9 7-9 % 1-9 1-9 % 1-12Finland and the Baltic countries 7.7 17.8 -57 77.0 46.5 66 68.8Scandinavia 2.2 3.9 -44 6.6 16.7 -60 21.7Central Europe & Russia 1.2 1.0 21 3.7 3.4 8 4.3Global Accounts 0.1 0.9 -89 2.0 3.8 -48 4.7Steering Functions and Group Management 0.0 0.0 - 0.5 0.0 - 0.0Group total 11.1 23.6 -53 89.8 70.3 28 99.5 Depreciation by market unit, EUR million 2011 2010 Change 2011 2010 Change 2010 7-9 7-9 % 1-9 1-9 % 1-12Finland and the Baltic countries 15.1 11.2 34 46.8 32.7 43 44.7Scandinavia 3.1 2.8 11 9.0 7.7 16 10.6Central Europe & Russia 0.8 0.6 25 2.2 1.5 50 2.6Global Accounts 0.9 0.9 5 2.7 2.4 8 3.3Steering Functions and Group Management 0.5 0.6 -14 1.6 1.4 15 2.2Group total 20.3 16.0 27 62.3 45.8 36 63.3 Amortization on allocated intangible assets from acquisitions by market unit, EUR million 2011 2010 Change 2011 2010 Change 2010 7-9 7-9 % 1-9 1-9 % 1-12Finland and the Baltic countries 0.1 0.1 103 0.3 0.1 140 0.4Scandinavia 0.3 0.3 3 0.9 0.9 6 1.2Central Europe & Russia 0.3 0.3 -2 1.0 1.1 -6 1.4Global Accounts 1.1 1.2 -10 3.2 3.4 -6 4.6Steering Functions and Group Management 0.0 0.1 -97 0.0 0.2 -95 0.0Group total 1.8 1.9 -6 5.5 5.7 -3 7.6 Impairment losses by market unit, EUR million 2011 2010 Change 2011 2010 Change 2010 7-9 7-9 % 1-9 1-9 % 1-12Finland and the Baltic countries 0.0 0.0 0 0.0 0.0 0 0.0Scandinavia 0.0 0.0 0 0.0 0.0 0 0.0Central Europe & Russia 0.0 0.0 0 0.0 0.0 0 0.0Global Accounts 0.0 0.0 0 0.0 7.6 -100 7.6Steering Functions and Group Management 0.0 0.0 0 0.0 0.0 0 0.0Group total 0.0 0.0 0 0.0 7.6 -100 7.6
Tieto Corporation INTERIM REPORT 25 October 2011, 8.00 am EET 23 (31)
© 2011 Tieto Corporation
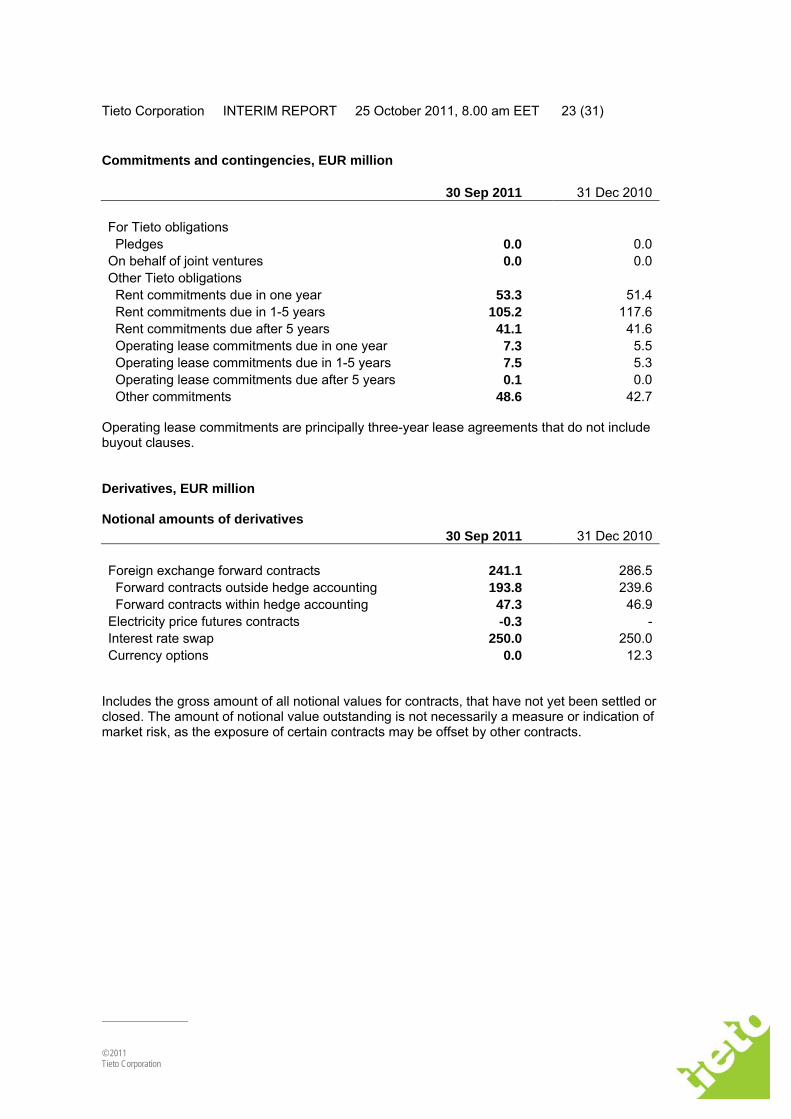
Commitments and contingencies, EUR million 30 Sep 2011 31 Dec 2010
For Tieto obligations Pledges 0.0 0.0 On behalf of joint ventures 0.0 0.0 Other Tieto obligations Rent commitments due in one year 53.3 51.4 Rent commitments due in 1-5 years 105.2 117.6 Rent commitments due after 5 years 41.1 41.6 Operating lease commitments due in one year 7.3 5.5 Operating lease commitments due in 1-5 years 7.5 5.3 Operating lease commitments due after 5 years 0.1 0.0 Other commitments 48.6 42.7
Operating lease commitments are principally three-year lease agreements that do not include buyout clauses. Derivatives, EUR million Notional amounts of derivatives 30 Sep 2011 31 Dec 2010
Foreign exchange forward contracts 241.1 286.5 Forward contracts outside hedge accounting 193.8 239.6 Forward contracts within hedge accounting 47.3 46.9 Electricity price futures contracts -0.3 - Interest rate swap 250.0 250.0 Currency options 0.0 12.3
Includes the gross amount of all notional values for contracts, that have not yet been settled or closed. The amount of notional value outstanding is not necessarily a measure or indication of market risk, as the exposure of certain contracts may be offset by other contracts.

Tieto Corporation INTERIM REPORT 25 October 2011, 8.00 am EET 24 (31)
© 2011 Tieto Corporation
Fair values of derivatives The net fair values of derivative financial instruments at the balance sheet date were: 30 Sep 2011 31 Dec 2010
Foreign exchange forward contracts -1.1 2.0 Electricity price futures contracts 0.2 - Interest rate swaps -0.7 -1.7 Currency options 0.0 0.0
Derivatives are used for economic hedging purposes only.
Gross positive fair values of derivatives: Positive Positive 30 Sep 2011 31 Dec 2010
Foreign exchange forward contracts 1.9 3.9 Forward contracts outside hedge accounting 1.7 3.5 Forward contracts within hedge accounting *) 0.2 0.4 Electricity price futures contracts 0.5 - Interest rate swaps 5.6 2.1 Currency options 0.0 0.0
Gross negative fair values of derivatives: Negative Negative 30 Sep 2011 31 Dec 2010
Foreign exchange forward contracts -3.0 -1.9 Forward contracts outside hedge accounting -2.3 -1.5 Forward contracts within hedge accounting *) -0.7 -0.4 Electricity price futures contracts -0.3 - Interest rate swaps -6.3 -3.7 Currency options 0.0 0.0
*) The amount recognized in equity -0.5 -0.1 The amount that has been booked in the income statement as a result of ineffectiveness of cash flow hedge
0.0 0.0
The hedged highly probable forecast transactions denominated in foreign currency are expected to occur at various dates during the next 12 months.

Tieto Corporation INTERIM REPORT 25 October 2011, 8.00 am EET 25 (31)
© 2011 Tieto Corporation
QUARTERLY FIGURES Key figures
2011 2011 2011 2010 2010 2010 2010 7-9 4-6 1-3 10-12 7-9 4-6 1-3Earnings per share, EUR - basic 0.31 0.16 0.19 0.02 0.34 0.17 0.17- diluted 0.31 0.16 0.19 0.02 0.34 0.17 0.17Equity per share, EUR 7.66 7.40 7.28 7.80 7.72 7.33 7.10Return on equity rolling 12 month, % 8.9 9.6 9.9 9.2 14.2 13.8 13.6Return on capital employed rolling 12 month, % 16.1 14.9 16.1 15.1 18.6 21.1 19.6Equity ratio % 47.7 46.4 43.3 47.6 51.1 48.0 45.8Net interest-bearing liabilities, EUR million 111.9 136.4 76.2 51.8 96.4 89.6 51.9Gearing, % 20.4 25.8 14.6 9.3 17.5 17.1 10.2Investments, EUR million 11.2 13.3 65.3 29.3 23.6 25.2 23.3 Income statement, EUR million
2011 2011 2011 2010 2010 2010 2010 7-9 4-6 1-3 10-12 7-9 4-6 1-3Net sales 414.5 462.3 461.6 472.2 387.1 431.5 422.9Other operating income 1.6 2.8 1.7 4.2 3.8 2.5 7.0Employee benefit expenses 223.7 270.9 265.3 287.6 219.2 255.8 254.5Depreciation, amortization and impairment charges 22.1 22.8 22.9 19.4 17.9 18.2 23.0Other operating expenses 141.1 152.2 151.5 163.0 126.1 140.5 133.6Operating profit (EBIT) 29.2 19.2 23.6 6.4 27.7 19.5 18.8Financial income and expenses -1.3 -1.4 -2.0 -0.7 -3.4 -1.1 -1.1Profit before taxes 27.9 17.8 21.6 5.7 24.3 18.4 17.7Income taxes -5.4 -6.4 -8.1 -4.3 0.1 -6.7 -5.7Net profit for the period 22.5 11.4 13.5 1.4 24.4 11.7 12.0

Tieto Corporation INTERIM REPORT 25 October 2011, 8.00 am EET 26 (31)
© 2011 Tieto Corporation
Balance sheet, EUR million
2011 2011 2011 2010 2010 2010 2010 30 Sep 30 Jun 31 Mar 31 Dec 30 Sep 30 Jun 31 Mar
Goodwill 416.6 418.0 421.3 422.9 419.3 416.2 411.5Other intangible assets 82.3 88.1 93.4 51.4 52.7 53.4 45.0Property, plant and equipment 109.7 116.0 119.5 121.2 111.5 106.3 104.7Other non-current assets 64.3 66.7 67.4 67.2 74.5 63.6 66.1Total non-current assets 672.9 688.8 701.6 662.7 658.0 639.5 627.3Trade receivables and other current assets 479.8 488.5 494.7 479.9 451.6 473.4 461.4Cash and cash equivalents 69.4 47.4 113.4 98.0 51.7 58.9 98.4Total current assets 549.2 535.9 608.1 577.9 503.3 532.3 559.8Assets classified as held for sale - - - - - - 4.4Total assets 1 222.1 1 224.7 1 309.7 1 240.6 1 161.3 1 171.8 1 191.5
Total equity 547.4 528.9 520.3 557.5 550.9 523.6 507.2Non-current loans 122.7 176.4 185.6 151.4 152.6 153.8 155.2Other non-current liabilities 74.4 72.2 66.7 65.5 66.3 61.8 61.3Total non-current liabilities 197.1 248.6 252.3 216.9 218.9 215.6 216.5Trade payables and other current liabilities 384.5 396.1 486.3 421.2 367.4 404.4 427.5Provisions 27.4 35.7 37.7 40.1 19.9 24.6 33.3Current loans 65.7 15.4 13.1 4.9 4.2 3.6 3.3Total current liabilities 477.6 447.2 537.1 466.2 391.5 432.6 464.1Liabilities classified as held for sale - - - - - - 3.7Total equity and liabilities 1 222.1 1 224.7 1 309.7 1 240.6 1 161.3 1 171.8 1 191.5
Tieto Corporation INTERIM REPORT 25 October 2011, 8.00 am EET 27 (31)
© 2011 Tieto Corporation
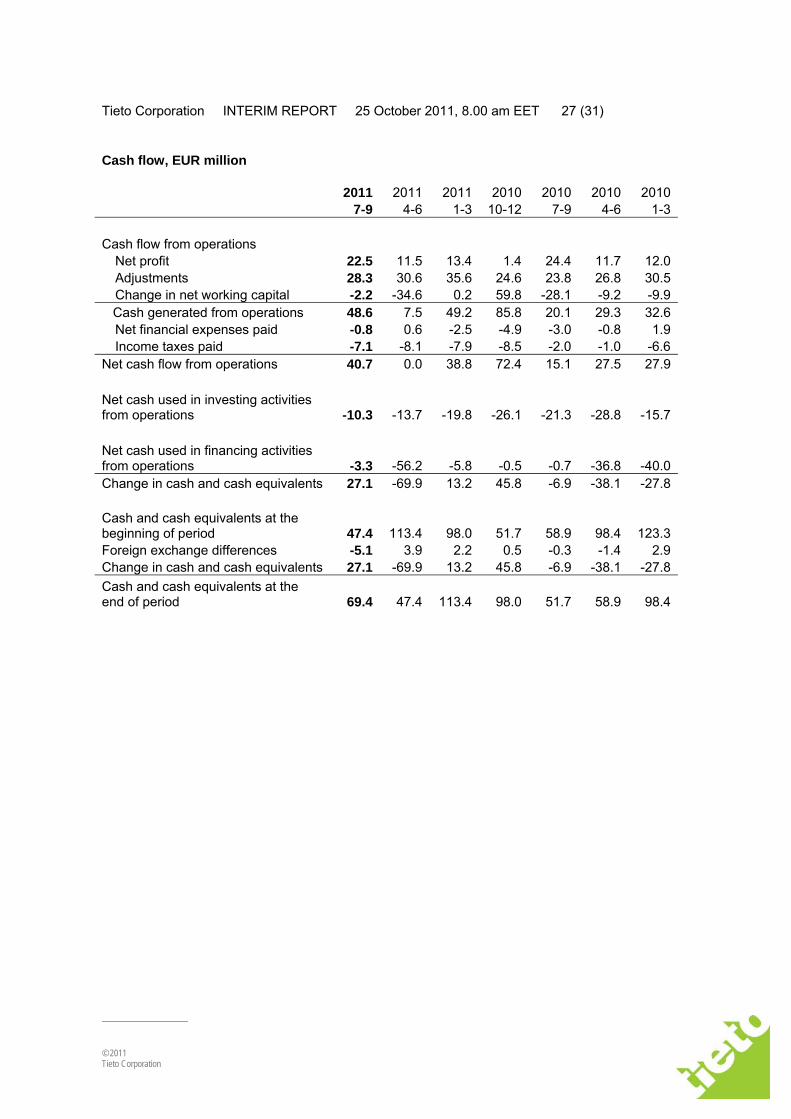
Cash flow, EUR million
2011 2011 2011 2010 2010 2010 2010 7-9 4-6 1-3 10-12 7-9 4-6 1-3
Cash flow from operations Net profit 22.5 11.5 13.4 1.4 24.4 11.7 12.0Adjustments 28.3 30.6 35.6 24.6 23.8 26.8 30.5Change in net working capital -2.2 -34.6 0.2 59.8 -28.1 -9.2 -9.9
Cash generated from operations 48.6 7.5 49.2 85.8 20.1 29.3 32.6Net financial expenses paid -0.8 0.6 -2.5 -4.9 -3.0 -0.8 1.9Income taxes paid -7.1 -8.1 -7.9 -8.5 -2.0 -1.0 -6.6
Net cash flow from operations 40.7 0.0 38.8 72.4 15.1 27.5 27.9
Net cash used in investing activities from operations -10.3 -13.7 -19.8 -26.1 -21.3 -28.8 -15.7
Net cash used in financing activities from operations -3.3 -56.2 -5.8 -0.5 -0.7 -36.8 -40.0Change in cash and cash equivalents 27.1 -69.9 13.2 45.8 -6.9 -38.1 -27.8 Cash and cash equivalents at the beginning of period 47.4 113.4 98.0 51.7 58.9 98.4 123.3Foreign exchange differences -5.1 3.9 2.2 0.5 -0.3 -1.4 2.9Change in cash and cash equivalents 27.1 -69.9 13.2 45.8 -6.9 -38.1 -27.8Cash and cash equivalents at the end of period 69.4 47.4 113.4 98.0 51.7 58.9 98.4

Tieto Corporation INTERIM REPORT 25 October 2011, 8.00 am EET 28 (31)
© 2011 Tieto Corporation
QUARTERLY FIGURES BY SEGMENTS Net sales by market unit, EUR million
2011 2011 2011 2010 2010 2010 2010 7-9 4-6 1-3 10-12 7-9 4-6 1-3Finland and the Baltic countries 169 178 185 197 164 184 181Scandinavia 120 140 141 134 105 118 111Central Europe & Russia 31 33 31 33 30 32 31Global Accounts 162 193 190 189 161 178 175Group elimination -68 -80 -86 -81 -74 -81 -76Group total 415 462 462 472 387 431 423 Customer sales by business line, EUR million
2011 2011 2011 7-9 4-6 1-3Industry Solutions 131 145 144Enterprise Solutions 59 68 52Managed services and transformation 149 158 175Product Engineering Solutions 75 91 90Group total 415 462 462
The 2011 figures include project transfers between business lines. The comparison figures for 2010 have not been adjusted due to the vast amount of projects and therefore, the comparison figures for 2010 will not be disclosed. Net sales by customer sector, EUR million
2011 2011 2011 2010 2010 2010 2010 7-9 4-6 1-3 10-12 7-9 4-6 1-3Telecom 129 151 147 150 131 146 142Finance 85 95 96 97 82 90 88Industry sectors 200 216 219 225 173 194 193Group total 415 462 462 472 387 431 423

Tieto Corporation INTERIM REPORT 25 October 2011, 8.00 am EET 29 (31)
© 2011 Tieto Corporation
Operating profit (EBIT) by market unit, EUR million
2011 2011 2011 2010 2010 2010 2010 7-9 4-6 1-3 10-12 7-9 4-6 1-3Finland and the Baltic countries 17.3 4.2 13.1 16.7 17.6 16.0 16.8Scandinavia 6.0 5.1 4.8 7.6 5.1 5.8 4.2Central Europe & Russia - 3.6 - 5.6 - 5.0 - 14.2 - 3.9 - 4.2 - 2.0Global Accounts 11.9 18.5 15.6 12.0 16.8 16.9 11.4Steering Functions and Group Management - 2.3 - 3.1 - 5.0 - 15.7 - 7.9 - 15.1 - 11.5Operating profit (EBIT) 29.2 19.2 23.6 6.4 27.7 19.5 18.9 Operating margin (EBIT) by market unit, %
2011 2011 2011 2010 2010 2010 2010 7-9 4-6 1-3 10-12 7-9 4-6 1-3Finland and the Baltic countries 10.2 2.4 7.1 8.5 10.7 8.7 9.3Scandinavia 5.0 3.7 3.4 5.7 4.9 4.9 3.7Central Europe & Russia -11.5 -17.1 -15.9 -42.7 -12.9 -13.3 -6.5Global Accounts 7.4 9.6 8.2 6.3 10.4 9.5 6.5Operating margin (EBIT) 7.1 4.1 5.1 1.4 7.2 4.5 4.5

Tieto Corporation INTERIM REPORT 25 October 2011, 8.00 am EET 30 (31)
© 2011 Tieto Corporation
Major shareholders on 30 September 2011
Shares % 1 Cevian Capital 9 153 794 12.7 2 Solidium Oy 7 415 418 10.3 3 Swedbank Robur fonder 3 339 329 4.6 4 Varma Mutual Pension Insurance Co. 2 859 749 4.0 5 Ilmarinen Mutual Pension Insurance Co. 2 528 367 3.5 6 OP-Pohjola Group Central Cooperative 2 418 406 3.4 7 Svenska Litteratursällskapet i Finland 1 764 300 2.4 8 Etera Mutual Pension Insurance Co. 1 613 589 2.2 9 Tapiola Pension 1 430 000 2.0
10 OP-Delta 875 000 1.2 33 397 952 46.4
Nominee registered 22 304 462 30.9 Others 16 320 759 22.7
Total 72 023 173 100.0 Based on the ownership records of Euroclear Finland Oy and Euroclear Sweden AB. For further information, please contact: Lasse Heinonen, CFO, tel. +358 (0)2072 66329, +358 50 393 4950, lasse.heinonen(at)tieto.com Reeta Kaukiainen, VP, Communications and Investor Relations, tel. +358 2072 68711, +358 50 522 0924, reeta.kaukiainen(at)tieto.com

Tieto Corporation INTERIM REPORT 25 October 2011, 8.00 am EET 31 (31)
© 2011 Tieto Corporation
Press conference for analysts and media will be held at Tieto’s premises in Helsinki, address: Aku Korhosen tie 2-6, at 2.30 pm EET (1.30 pm CET. 12.30 pm UK time). The results will be presented in English by Ari Karppinen, acting President and CEO and Lasse Heinonen, CFO. The conference will be webcasted and published live on Tieto's website www.tieto.com/investors and there will be a possibility to present questions online. An on-demand video will be available after the conference.
Tieto publishes financial information in English, Finnish and Swedish. All releases are posted in full on Tieto's website as soon as they are published.
TIETO CORPORATION DISTRIBUTION NASDAQ OMX Helsinki NASDAQ OMX Stockholm Principal Media Tieto is the leading IT service company in Northern Europe providing IT and product engineering services. Our highly specialized IT solutions and services complemented by a strong technology platform create tangible business benefits for our local and global customers. As a trusted transformation partner, we are close to our customers and understand their unique needs. With about 18 000 experts, we aim to become a leading service integrator creating the best service experience in IT, www.tieto.com www.tieto.com
Tieto Corporation Business ID: 0101138-5 Aku Korhosen tie 2−6 PO Box 38 FI-00441 HELSINKI, FINLAND Tel +358 207 2010 Fax +358 2072 68898 Registered office: Helsinki E-mail: [email protected] www.tieto.com
Related Documents