FINITE ELEMENT ANALYSIS OF COMPOSITE MULTICELL BOX GIRDER BRIDGES A DISSERTATION Submitted in partial fulfillment of the requirements for the award of the degree of MASTER OF TECHNOLOGY in CIVIL ENGINEERING (With Specialization in Structural Engineering) By WIANKAR AMOL ARVIND DEPARTMENT OF CIVIL ENGINEERING INDIAN INSTITUTE OF TECHNOLOGY ROORKEE ROORKEE-247 667 (INDIA) JUNE, 2006

Welcome message from author
This document is posted to help you gain knowledge. Please leave a comment to let me know what you think about it! Share it to your friends and learn new things together.
Transcript

FINITE ELEMENT ANALYSIS OF COMPOSITE MULTICELL BOX GIRDER BRIDGES
A DISSERTATION
Submitted in partial fulfillment of the
requirements for the award of the degree
of MASTER OF TECHNOLOGY
in CIVIL ENGINEERING
(With Specialization in Structural Engineering)
By
WIANKAR AMOL ARVIND
DEPARTMENT OF CIVIL ENGINEERING INDIAN INSTITUTE OF TECHNOLOGY ROORKEE
ROORKEE-247 667 (INDIA)
JUNE, 2006

MANKAR AMOL ARVIND
CANDIDATE'S DECLARATION
titre> -0,6417
I hereby certify that the work presented in this dissertation emitted "FINITE
ELEMENT ANALYSIS OF COMPOSITE MULTICELL BOX GIRDER
BRIDGES" in partial fulfillment of the requirement for the award of the degree of
Master of Technology in Civil Engineering with specialization in Structural
Engineering, submitted to the Department of Civil Engineering, Indian Institute of
Technology Roorkee, Roorkee, is an authentic record of my own work carried out during
the period from :July 2005 to June 2006 under the guidance of Dr. Pradeep IThargava,
Professor, Structural Engineering Section, Department of Civil Engineering, Indian
Institute of Technology —Roorkee, Roorkee and Dr. N.M.Bhandari, Professor, Structural
Engineering Section, Department of Civil Engineering, Indian Institute of Technology -
Roorkee, Roorkee, India_
The matter embodied in this dissertation has not been submitted by me for the
award of any other degree.
Date: Jima 2006
Place: Roorkee
CERTIFICATE
This is to certify that the above statement made by the candidate is true to the best of our
knowledge_
\IDLAI °P": Dr. N. M Bhandari Dr.Pradeep Bhargava
Professor Professor
Structural Engineering Section Structural Engineering Section
Department of Civil Engineering Department of Civil Engineering
Inch an Institute of Technology —Roorkee Indian Institute of Technology —Roorkee
Roorkee —247667 Roorkee —247667

ACKNOWLEDGEMENTS
I have great pleasure in expressing my gratitude to my supervisors, Dr. Pradeep Bhargava, Professor, Structural Engineering Section, Department of Civil Engineering,
Indian Institute of Technology —Roorkee and Dr. N. M. Bhandari, Professor, Structural Engineering Section, Department of Civil Engineering, Indian Institute of Technology -
Roorkee, for their esteemed guidance and consistent encouragement throughout the course of this work.
I also express sincere thanks to research scholar Mr. Sanjay Tiwari, Department of Civil
Engineering, IIT Roorkee for his invaluable guidance and generous help throughout the
preparation of this thesis work. My thanks also go to his family for affection and
inspiration during the work.
My sincere heartfelt gratitude to my Parents for their inspiration, support, concern,
encouragement and blessing provided right from my admission to completion of course at
Roorkee.
Date: 30) oe f zoo s Place: Roorkee MANKAR AMOL ARVIND

ABSTRACT
Box girders have gained wide acceptance in freeway and bridge systems due to
their structural efficiency, pleasing aesthetics and economy of construction. When
compared to the open section bridges, the closed box girder bridges need relatively
lower material content, light weight and high bending rigidity and significantly high torsional rigidity and efficient transverse load distribution. The utilities and services can also be provided within the cells.
Unfortunately, Indian designers face a daunting task as the formulation of design codes and guidelines is not even in the infancy stage. Therefore, the designers are
forced to take recourse to state-of-art research and the codes of practice of European or North American countries.
Therefore the present study aims to undertake some aspects of the composite box girder bridges, specifically the composite multi-cell box girders.
Among the refined methods, the FEM is still the most general and comprehensive technique of analysis capturing all aspects affecting the structural response. But it
is too involved and time consuming to be used for routine design purpose. Practical requirement in the design process necessitate a need for a simpler design method.
This thesis work presents an extensive parametric study using the Finite element
method in which twenty four, two-lane and four lane bridges of various geometries
has been analysed. The parameters considered are number of cells, number of lanes, different span lengths and cross bracings. Results from published literature are used to substantiate the analytical modeling. Based on the parametric study, moment and shear distribution factors are deduced for such bridges subjected to
IRC loadings as well as dead load and some design curves are given. An illustrative design example is presented.
Since mechanical shear connectors in composite steel and concrete beams require slip to transmit shear, most composite bridge beams are designed using full-interaction theory because of the complexities of partial-interaction analysis
techniques. However, in the assessment of existing composite bridges this simplification may not be warranted as it is often necessary to extract the greater
capacity and endurance from the structure. This may only be achieved us;
iii

partial-interaction theory which truly reflects the behaviour of the structure. To
check out the effect of partial interaction with finite stiffness of shear connector on
flexural stresses and on interface slip, a bridge-geometry is analyzed for IRC loads.
Results from published literature are used to substantiate the analytical modeling.
A nonlinear analysis of 21-3c-20 bridge with incremental loads for 1RC Class 70R
wheeled vehicle loading and dead load is carried out to check response of how it
behaves depending on the level of load, a bridge may or may not respond non-
linearly due to cracking of concrete or yielding of steel plates. This may result in
excessive permanent deformations, the extent of which should be known prior to
design of bridge. In this case nonlinearities considered are material nonlinearity as
well as geometric nonlinearity. Material nonlinearity is incorporated in the analysis
using nonlinear material model available in ANSYS software. For concrete
Drucker-Prager failure criterion is used while for steel bilinear isotropic hardening
is used as yielding criterion.
iv

CONTENTS
Page Title No
CANDIDATE'S DECLARATION ACKNOWLEDGEMENT ii ABSTRACT iii CONTENTS LIST OF TABLES ix LIST OF FIGURES xi NOMENCLATURE xv
Chapter 1 INTRODUCTION 1 1.1 GENERAL 1 1.2 COMPOSITE BRIDGES 2 1.3 ADVANTAGES OF COMPOSITE CONSTRUCTION 4 1.4 TYPES OF COMPOSITE BRIDGES 4
1.4.1 Plate Girder & Beam Bridges 4 1.4.2 Box Girder Bridges 5
1.4.2.1 Advantages of Box Girder Bridges 5 1.4.2.2 Types of Box Girder Bridges 6
1.5 OBJECTIVES OF THESIS 6 1.6 ORGANISATION OF THESIS 7
Chapter 2 MECHANICS OF BOX GIRDER WITH LITERATURE REVIEW 9 2.1 MECHANICS 9
2.1.1 TORSIONAL SHEAR STRESSES AND TORSIONAL WARPING STRESSES 11
2.1.2 DISTORTION 13 2.1.3 TRANSVERSE BENDING ANALYSIS 16 2.1.4 BUCKLING FAILURE 16
2.1.4.1 Compression Flange 16 2.1.4.2 Webs 17
2.1.5 SHEAR LAG 18

2.1.6 ELASTIC ANALYSIS OF BOX GIRDER BRIDGES
2.1.7 METHODS OF ANALYSIS
19 20
2.1.7.1 GRILLAGE ANALOGY METHOD 21
2.1.7.2 FOLDED PLATE METHOD 23
2.1.7.3 FINITE STRIP METHOD 24
2.1.7.4 ORTHOTROPIC PLATE ANALYSIS 24
2.1.7.5 THIN WALLED CURVED BEAM THEORY 25
2.1.7.6 FINITE ELEMENT METHOD 25
2.2 LITERATURE REVIEW 26
Chapter 3 FINITE ELEMENT MODELING 31
3.1 FINITE ELEMENT ANALYSIS 31
3.2 ANSYS FEATURES AND CAPABILITIES 33
3.3 ELEMENTS DESCRIPTION 34
3.11 SHELL63: Elastic Shell 34
3.3.2 Beam4: 3-D Elastic Beam 36
3.3.3 Mpc184:Multi-Point Constraint Rigid Beam/ Rigid Link 38
3.4 ASSUMPTIONS FOR THE ANALSIS OF SHELLS 40
3.4.1 Constitutive Laws 40
3.5 BOX GIRDER BRIDGE MODELLING IN ANSYS 7 43
3.5.1 Steps in Modeling and Analysis of Box Girder in ANSYS 43
Chapter 4 LOAD DISTRIBUTION FACTORS FOR COMPOSITE BRIDGES 49
4.1 CONCEPT OF DISTRIBUTION FACTOR 49
4.2 PROBLEM DEFINITION 51
4.3 BRIDGE MODELING 52
4.4 VALIDATION OF ANSYS RESULTS WITH
PUBLISHED RESULTS IN LITERATURE 53
4.5 PARAMETRIC STUDY 55
4.6 BRIDGE PROTOTYPES CONSIDERED FOR PARAMETRIC STUDY 56
4.7 LOADING PLACEMENTS 58
4.7.1 Longitudinal Placing 58
vi

4.7.2 Transverse Placing 59
4.7.3 Comparison of design moment and shear
with class A loading 61
4.7.5 Placement of Load on ANSYS model 62
4.8 RESULTS 64
Chapter
4.8.1 DEFLECTION AND STRESS CONTOURS 64
4.8.2 MOMENT AND SHEAR DISTRIBUTION FACTORS 67
4.8.2.1 Comparison of Distribution Factors for SF
(Central lane loading) & (Eccentric lane loading) 71
4.8.3 EFFECTS OF CROSS-BRACING SYSTEMS 73
4.8.4 EFFECT OF SPAN LENGTH 74
4.8.5 DESIGN CURVES FOR MOMENT AND SHEAR DISTRIBUTION 77
4.8.5.1 DESIGN CURVES FOR MDF 77
4.8.5.2 DESIGN CURVES FOR SDF 79
5 NONLINEAR ANALYSIS AND PARTIAL INTERACTION OF SHEAR CONNECTOR 83
5.1 Partial Interaction 83
5.2 Partial Interaction Focal Point Theory 84
5.3 Modeling of Shear Connector 86
5.4 VALIDATION EXAMPLE 90
5.4.1 Details of experimental study [L.C.P. Yam 1972] 90
5.5 Interface Slip Distribution along the Span Of Bridge
for Partial Interaction 92
5.6 Comparison of Stress Results Obtained for 213c20m Bridge 94
5.7 Comparison of Distribution Factors Obtained for 213c20m Bridge 95
5.8 Nonlinear Analysis 96
5.9 Nonlinear material modeling 95
5.9.1 Concrete modeling 95
5.9.2 Steel modeling 97
5.10 ELEMENTS DESCRIPTION 99
5.10.1 BEAM 188: - 3-D Linear Finite Strain Beam
vii

5.10.2 6.8.2 Shell 43: - 3-D Linear Finite Strain Beam 101
5.11 FORCE VS DEFLECTION RELATIONSHIP 104
5.12 COMPARISON OF DISTRIBUTION FACTORS 105
Chapter 6 CONCLUSIONS AND FUTURE WORK 107
REFERENCES
111 APPENDICES
viii

LIST OF TABLES
Table No
4.1
4.2
4.3
4.4
4.5
4.6
4.7
4.8
4.9
4.10
4.11
4.12
4.13
5.1
5.2
Description
Comparison of Experimental study and ANSYS modeling
Sensitivity study
Geometries of Prototype Bridges in Parametric Study
Comparison of design shear and moment
Moment distribution factors (Dead Load)
Moment distribution factors (Central Lane Loadings)
Moment distribution factors (Eccentric Lane Loading)
Shear distribution factors (Dead load)
Shear distribution factors (Central lane loading)
Shear distribution factors (Eccentric lane loading)
Shear distribution factors (Eccentric lane loading)
Effect of cross bracings on moment distribution factors for central lane loading
Effect of cross bracings on moment distribution factors for eccentric lane loading
Comparison of results for interface slip with literature review.
Comparison of stresses for partial interaction
Page No
54
56
57
61
67
68
69
70
71
71
72
73
73
91
94
ix

5.3 Comparison of MDF for Partial and Full interaction 95
5.4 Comparison of MDF for Partial and Full interaction 105

LIST OF FIGURES
Figure No.
2.1
2.2
2.3(a)
2.3(b)
/4
2.5
2.6
2.7
2.8
2.9
3.1
3.2
3.3
3.4
3.5
Description
Idealization of eccentric loading in box girder
Torsion and distortion of rectangular box girder due to vertical forces
Shearing of flanges due to torsion if ends are in the same plane
Warping of a rectangular section due to pure torsion
Force in diagonal members due to distortional component of applied torque
Distortional displacements in a box girder
Out-of-plane distortional stresses in box girders
In-plane distortional warping stresses in box girders
Stresses in Web
Grillage model for a twin-box bridge
SHELL63 Elastic Shell
BEAM4 3-D Elastic Beam
MPC 184 Rigid link/Beam Element
Bridge model in ANSYS
Complete meshed bridge model
Page No
10
10
11
12
13
14
15
16
18
22
34
36
38
45
45
xi

3.6
3.7
4.1
4.2
4.3
4.4
4.5(a)
4.5(b)
4.5(c)
4.5(d)
4.6
4.7(a)
4.7(b)
4.7(c)
4.7(d)
4.8 (a)
4.8 (b)
4.8 (c)
Meshed bridge model cross section in ANSYS
Loaded and constrained bridge model in ANSYS
Cross section of four cell bridge prototype
Cross Sectional details of model
Geometric details of model
Typical STAAD output diagram showing placement of moving load
Two-lane Bridge subjected to two trains of symmetrically placed IRC Class 70R vehicle
Two-lane Bridge subjected to two trains of eccentrically placed IRC Class 70R vehicle
Four-lane Bridge subjected to two trains of centrally placed IRC Class 7011 vehicle
Four-lane Bridge subjected to two trains of eccentrically placed 1RC Class 70R vehicle
Four-node bilinear element two dimensions
Deflection contour plot of the idealized bridge for Dead Load
Deflection contour plot of 21-2c-20 bridge for one train of IRC Class 70R (Centrally Loaded lanes)
Deflection contour plot of 21-2c-20 bridge for Eccentrically Loaded Lanes
Deflection contour plot of 21-2c-20 bridge cross section for Eccentrically Loaded Lanes (front view)
Effect of span length on MDF for central lane loading
Effect of span length on MDF for Eccentric lane loading
Effect of span length on SDF for central lane loading
46
46
49
55
57
59
60
60
60
60
62
65
65
66
66
75
75
76
xii

4.8(d) Effect of span length on SDF for Eccentric lane loading 76
4.9(a) Design curve for 21ane bridges (Outer Girder) 77
4.9(b) Design curve for 2lane bridges (Intermediate Girder) 78
4.9© Design curve for 41ane bridges (Outer Girder) 78
4.9(d) Design curve for 41ane bridges (Intermediate Girder) 79
4.10(a) Design curve for 2lane bridges (Outer Girder) 79
4.10(b) Design curve for 21ane bridges (Intermediate Girder) 80
4.10(c Design curve for 41ane bridges (Outer Girder) 80
4.10(d) Design curve for 41ane bridges (Intermediate Girder) 81
5.1 Strain Distribution 84
5.2 Pictorial view of COMBINE39 88
5.3 Load slip curves for various headed studs in 30N/mm2 91
5.4 Imperial College simple span composite beam. 90
5.5 Interface slip along span of bridge for PI(1) 92
5.6 Interface slip along span of bridge for PI(2) 92
5.7 Interface slip along span of bridge for PI(3) 93
5.8 Mohr-Coulomb and Drucker-Prager yield surfaces 98
5.9 Stress strain relationship for bilinear isotropic hardening 98

5.10 Pictorial view of BEAM188 100
5.11 Pictorial view of SHELL43 102
532 FORCE VS DEFLECTION RELATIONSHIP 104
xiv

NOMENCLATURE
tf Thickness of flange
tw Thickness of web
• Torque
q Shear flow
b Width of rectangular box section
h Depth of rectangular box section
rf Shear Stress
0 Shear angle
L ' Length of rectangular box
°bc Bending stress in compression
Bending stress in tension
G Shear Modulus
MIX ( C Maximum longitudinal stress in flange
C
Average normal longitudinal stress in flange
cr
-
. Ratio of crx /
-
(ma) X
Dx Flexural rigidity in x-direction
Dy Flexural rigidity in y-direction
H Plate torsional rigidity
L Span of bridge
D Depth of bridge section from top of upper flange to bottom of lower flang
A Width of the bridge
B Width of cell
C Width of top flange
F Total depth of bridge cross section
xv

ti Thickness of top flange
t2 Thickness of web
t3 Thickness of bottom flange plate
t4 Thickness of concrete deck
f Clearance between outer edge of wheel and roadway face of kerb
g Clearance between outer edges of passing vehicles
Dms Moment distribution factor carried by the girder
Mmax Longitudianl moment carried by each girder
M Maximum longitudianl moment in a simply supported girder
n Number of idealized girders in a bridge
Dss Shear distribution factor carried by the web
Vmax Maximum reaction under each web
V Maximum reaction force in a simply supported girder
J Torsional constant
I Moment of inertia
E Modulus of elasticity
G3 Torsional rigidity
EI Flexural rigidity
Stress vector
• Strain vector
Poisson's Ratio
'Y Shear strain
• Shear strain
Inc Second moment of transformed concrete area
K, Normal stiffness of shear connector
KT Transverse stiffness of shear connector
VL the longitudinal shear per unit length as stated below
xvi

Ae Area of transformed section on one side of interface
s Interface slip in composite construction
S Spacing of webs in box girder (cell width)
cre Equivalent stress
F Failure load or Yielding load
cc, Mean or hydrostatic stress
{s} Deviatoric stress
[AI] Plastic compliance matrix
Material constant
C Cohesion value for material
xvii

CHAPTER 1 INTRODUCTION
1.1 GENERAL
Box girders have gained wide acceptance in freeway and bridge systems due to their
structural efficiency, pleasing aesthetics and economy of construction. A box girder is
formed when two web plates are joined by a common flange at both the top and the
bottom. The closed cross section of the box in the completed bridge has a torsional
stiffness that may be 100 to more than 1000 times the stiffness of a comparable I-
girder and it is this feature which is the usual reason for choosing a box girder
configuration.
Box girder bridges may have a cross section in the form of a single cell (one box),
multi-spine (separate boxes) or contiguous boxes with common bottom flange. Later
provides greater torsional stiffness than former due to the high efficiency of
contiguous cells in resisting eccentric loading. When compared to the open section
bridges, the closed box girder bridges need relatively lower material content, light
weight and high bending rigidity and significantly high torsional rigidity and efficient
transverse load distribution. The utilities and services can also be provided within the cells.
In the present work an extensive parametric study of steel concrete composite multi-
cell box girder bridges using the finite-element method in which 24 bridges of various
geometries were analyzed. The parameters considered are: number of lanes, number of
cells, span length, and cross bracings. Results from published literature are used to
substantiate the analytical modeling. Based on the parametric study, moment and shear
distribution factors are deduced for such bridges subjected to IRC Class 70R loadings
as well as dead load. And to check out the behaviour of bridge in non-linear range
material nonlinearity is considered for limited bridge geometries with partial
interaction of shear connector. An illustrative design example is also presented to find use of load distribution factors.

1.2 COMPOSITE BRIDGES
Composite structures comprised of steel and concrete are gaining ever increasing
popularity in the bridge construction industry. Steel composite bridges combine the
advantages of steel and concrete bridges: the robustness and the low cost of reinforced
concrete roadway slab and the reduced weight of main girders made of steel. Modem
highway bridges are often subject to tight geometric restrictions, composite steel
concrete box girder bridges combine excellent torsional stiffness with elegance to
fulfill these demands.
Steel beams supporting concrete slabs have been used to form the basic structure of
large number of deck bridges for many years. Since 1945 the number of composite
bridges being built has significantly increased. The pressure of steel shortage in
Germany after the Second World War forced engineers to adopt the most economical
design method available to be able to cope with the large amount of reconstruction of
bridges and buildings destroyed. Now codes of practice in the countries, the
publications of papers describing the results of experimental work and eventually the
publications of text books have all helped to make engineers familiar with the
composite construction. Composite bridge construction is now commonly used for
medium and large span all over the world [Johnson, 1977].
Composite bridges are structures that combine materials like steel, concrete, timber or
masonry in some combination. The behaviour of the composite structure is heavily
influenced by the properties of its component materials. For example, the use of a
concrete slab on a steel girder uses the strength of concrete in compression and the
high tensile strength of steel.
Concrete is weak in tension and steel apart from being costly has the problem of
buckling in compression. By the appropriate combination of the two principal
construction materials, more efficient bridge construction can be achieved than is
possible using the two materials independently. The advantage is gained particularly
when the work specifications is demanding in relation to short construction periods,
functional conditions of high slenderness, the site topography or complex layout in
plan or elevation. In particular the use of self supporting steel systems allows in the
2
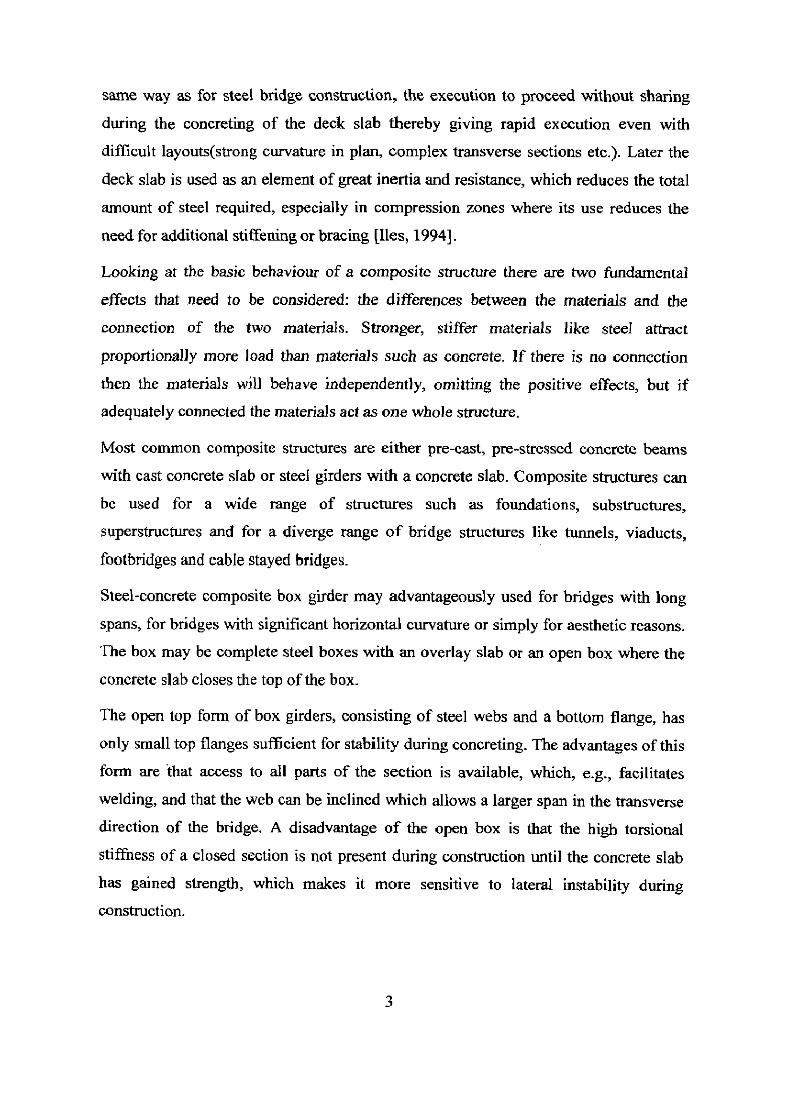
same way as for steel bridge construction, the execution to proceed without sharing
during the concreting of the deck slab thereby giving rapid execution even with
difficult layouts(strong curvature in plan, complex transverse sections etc.). Later the
deck slab is used as an element of great inertia and resistance, which reduces the total
amount of steel required, especially in compression zones where its use reduces the
need for additional stiffening or bracing {Iles, 1994].
Looking at the basic behaviour of a composite structure there are two fundamental
effects that need to be considered: the differences between the materials and the
connection of the two materials. Stronger, stiffer materials like steel attract
proportionally more load than materials such as concrete. If there is no connection then the materials will behave independently, omitting the positive effects, but if
adequately connected the materials act as one whole structure.
Most common composite structures are either pre-cast, pre-stressed concrete beams
with cast concrete slab or steel girders with a concrete slab. Composite structures can
be used for a wide range of structures such as foundations, substructures,
superstructures and for a diverge range of bridge structures like tunnels, viaducts,
footbridges and cable stayed bridges.
Steel-concrete composite box girder may advantageously used for bridges with long
spans, for bridges with significant horizontal curvature or simply for aesthetic reasons. The box may be complete steel boxes with an overlay slab or an open box where the
concrete slab closes the top of the box.
The open top form of box girders, consisting of steel webs and a bottom flange, has
only small top flanges sufficient for stability during concreting. The advantages of this
form are that access to all parts of the section is available, which, e.g., facilitates
welding, and that the web can be inclined which allows a larger span in the transverse
direction of the bridge. A disadvantage of the open box is that the high torsional
stiffness of a closed section is not present during construction until the concrete slab
has gained strength, which makes it more sensitive to lateral instability during construction.
3
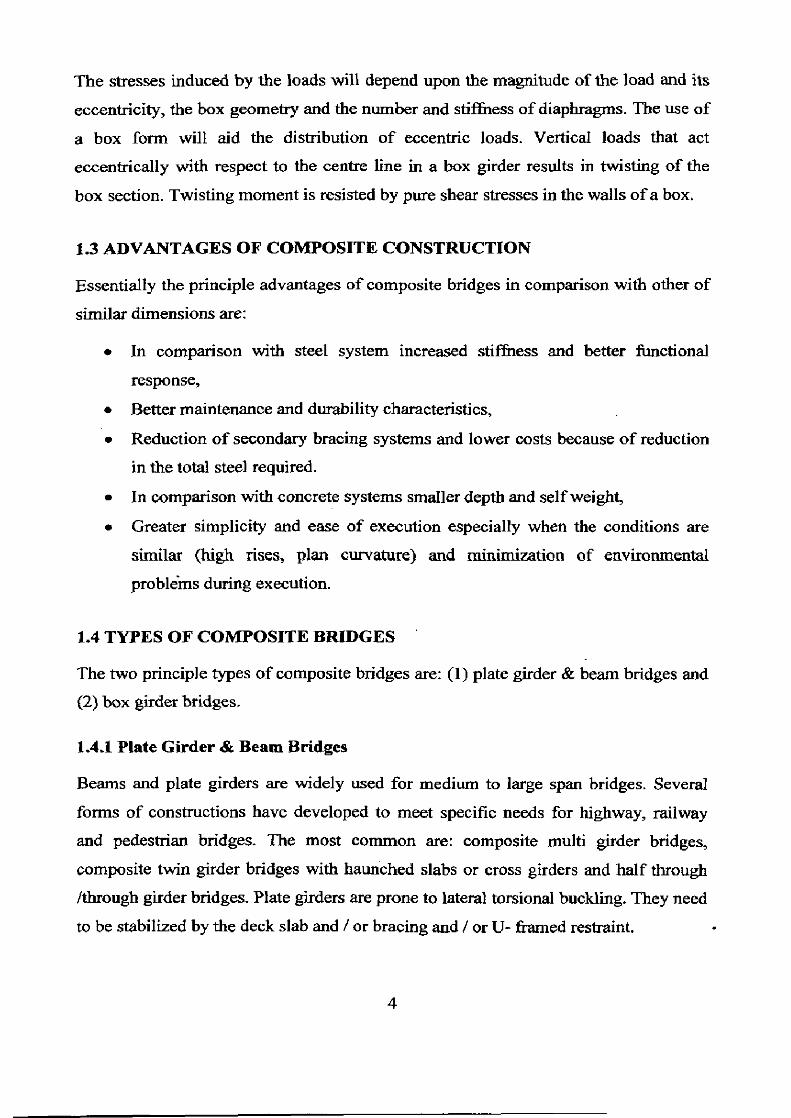
The stresses induced by the loads will depend upon the magnitude of the load and its
eccentricity, the box geometry and the number and stiffness of diaphragms. The use of
a box form will aid the distribution of eccentric loads. Vertical loads that act
eccentrically with respect to the centre line in a box girder results in twisting of the
box section. Twisting moment is resisted by pure shear stresses in the walls of a box.
1.3 ADVANTAGES OF COMPOSITE CONSTRUCTION
Essentially the principle advantages of composite bridges in comparison with other of
similar dimensions are:
• In comparison with steel system increased stiffness and better functional
response,
• Better maintenance and durability characteristics,
• Reduction of secondary bracing systems and lower costs because of reduction
in the total steel required.
• In comparison with concrete systems smaller depth and self weight,
• Greater simplicity and ease of execution especially when the conditions are
similar (high rises, plan curvature) and minimization of environmental
problems during execution
1.4 TYPES OF COMPOSITE BRIDGES
The two principle types of composite bridges are: (1) plate girder & beam bridges and
(2) box girder bridges.
1.4.1 Plate Girder & Beam Bridges
Beams and plate girders are widely used for medium to large span bridges. Several
forms of constructions have developed to meet specific needs for highway, railway
and pedestrian bridges. The most common are: composite multi girder bridges,
composite twin girder bridges with haunched slabs or cross girders and half through
/through girder bridges. Plate girders are prone to lateral torsional buckling. They need
to be stabilized by the deck slab and / or bracing and / or U- framed restraint.
4

1.4.2 Box Girder Bridges
Box girders are suitable for longer spans than I- girders and allow larger span to depth
ratios. Though box girders are usually more expensive than plate girders because they
require more fabrication time, they have, however several advantages over plate
girders which makes their use attractive. The development of electric welding and precision flame cutting, the structural possibilities increased enormously. It is now
possible to design large welded units in a more economical way. e.g., box girders
using the techniques similar to those of ship buildings [Iles, 1994].
The great torsional rigidity makes the box girder particularly appropriate solution where the bridge is curved in horizontal plane. Many bridges on European highways
may serve as examples.
1.4.2.1 Advantages of Box Girder Bridges
The main advantages of box girder bridges are:
• Very high torsional rigidity: In closed box girders, torque is resisted mainly by
Saint-Venant shear stresses because the Saint-Venant torsional stiffness is
normally much greater than the torsional warping stiffness. Composite box
girders only achieve their torsional rigidity after concreting.
• Very wide flanges allow large span to depth ratios.
• A better appearance since the stiffening can remain invisible in the box.
• Very good aerodynamic shape, which is equally important for large suspension
or cable state bridges as in the torsional stiffness.
• A very good adaptability to the most difficult conditions.
• The interior of a box girder bridge is exposed to far less risk of corrosion than
outside, hence interior corrosion protection can be made simpler or even
omitted completely.
5

1.4.2.2 Types of Box Girder Bridges
Cross-section of box girder bridges has different forms: a box girder may have vertical
or inclined webs. It is cheaper to manufacture a girder with vertical webs. This section
shape may be the best solution for a narrow road
A combination of wide decks on short or medium span bride favours inclined webs. In
many cases inclined webs are chosen for aesthetic reasons.
Cross-sections of composite box girder bridges may take the form of multispines or
multicells. The later provides greater torsional stiffness than the former due to high
efficiency of the contiguous cells in resisting eccentric loading.
The use of multicell box girders in bridge deck construction can lead to considerable
economy. This type of construction leads to an efficient torsional stiffness of the
section. Utilities and services can be readily provided within the cells [Sennah, 1999].
1.5 OBJECTIVES OF THESIS
The range and scope of composite bridges is only limited by the imagination of the
designer and he/she must be aware of the additional applications of the structural
mechanics that will make the composite design superior in efficiency and cost to either
reinforced or pre-stressed concrete or steel design solution.
Current Status
Unfortunately, Indian designers face a daunting task as the formulation of design
codes and guidelines is not even in the infancy stage. Therefore, the designers are
forced to take recourse to state-of-art research and the codes of practice of European or North American countries.
The current design practices in North America recommend few analytical methods for
the design of composite multicell box girder bridges, practical requirements in the
design process necessitate a need for a simpler design method.
Therefore the present study aims to undertake some aspects of the composite box
girder bridges, specifically the composite multi-cell box girders.
6

The main objectives of the dissertation work are:
> To investigate the feasibility to carry out Three Dimensional Finite Element
Analysis of Box Girder Bridges using the commercially available software
package ANSYS.
> To conduct a parametric study to examine the key parameters that may
influence the load distribution characteristics of composite concrete-deck steel
multicell box girder bridges under IRC Class 70R loading.
> Deductions of moment as well as shear distribution factors for different
loading conditions which can be helpful for the purpose of design.
> To check out the response of bridge for overloading considering material
nonlinearity.
> To check out the beheviour of bridge with partial interaction of shear
connector.
1.6 ORGANISATION OF THESIS
The thesis comprised of six chapters
Chapter 2 contains Basic Principles of Mechanics of Box Girder which includes the
behaviour of Box Girder bridges under longitudinal bending moment, shear force,
torsion, distortion, shear lag and transverse bending. Methods of analysis for box
girder bridges have also been described. Review of previous is also presented.
Chapter 3 contains FEM principles, constitutive laws, FEM modeling of Box Girder
Bridge, ANSYS features and Capabilities and the description of elements used in
modeling.
Chapter 4 contains concept of Load Distribution Factor, validation of ANSYS results
with experimental study, modeling of bridge prototypes, load placement description
for maximum forces, and results and discussions which include the deduction of load
distribution factors, torsional-to-flexural rigidity effect, effects of key parameters such
7

as number of cells, span length, cross bracings and span-to-depth ratio, on the moment
and shear distribution factors.
Chapter 5 contains results and discussions of partial interaction and non-linear
analysis which includes comparison of results for variations of flexural stresses with
change of transverse stiffness of shear connector, effect of partial interaction on
distribution of loads, load deflection relationship for nonlinear analysis, effect of
nonlinear behaviour on distribution of loads.
Chapter 6 deals with the final conclusion drawn on the basis of work carried out and some suggestion for future research work is also given.
8

CHAPTER 2
MECHANICS OF BOX GIRDER WITH LITERATURE REVIEW
2.1 MECHANICS
Box-girder analysis and design should take into consideration stresses due to
longitudinal bending moment, shear force, torsion, distortion, shear lag and
transverse bending. The instability of flange under compression and web under
shear and plates and stiffened panels is also to be considered.
A general purpose finite element software has to be used to accurately analyze
such a bridge considering all these effects.
The high inplane stiffness is utilized in thin walled structures, such as box girders.
However, the relatively high out of plane flexibility of the plate element render
them vulnerable to buckling and cross-section distortion [Upadyay, 2003].
In a straight box-girder, the effects of gravity load acting eccentric with respect to
section centroid can be modeled as a bending component shown in figure below,
superimposed on the torsional component.
Also the torsional component can be modeled as a uniform torsional component
superimposed on a distortional component as demonstrated in Fig.2.1. The
rectangular thin walled box has a respective depth and width of h and b.
The overall flexure produces longitudinal membrane normal and shear stresses in
the elements. Due to wide thin flanges when the axial load is fed into them by
shear from the webs, the flange distorts in its plane; the plane sections do not
remain plane. This shear lag effect makes the longitudinal flexural stress
distribution, non-uniform across the width of top and bottom flanges against the
uniform stress obtained from mechanics of material approach.
9

Q/2 Q/2 Q/2
•
(a)
co)
(d) Torsion
J
(e) Distortion
(0 Torsional deformation
(g) Distortional deformation
Fig.2.1 Idealization of eccentric loading in box girder
II Ir., , PSI •■
Fig.2.2Torsion and distortion of rectangular box girder due to vertical forces
10
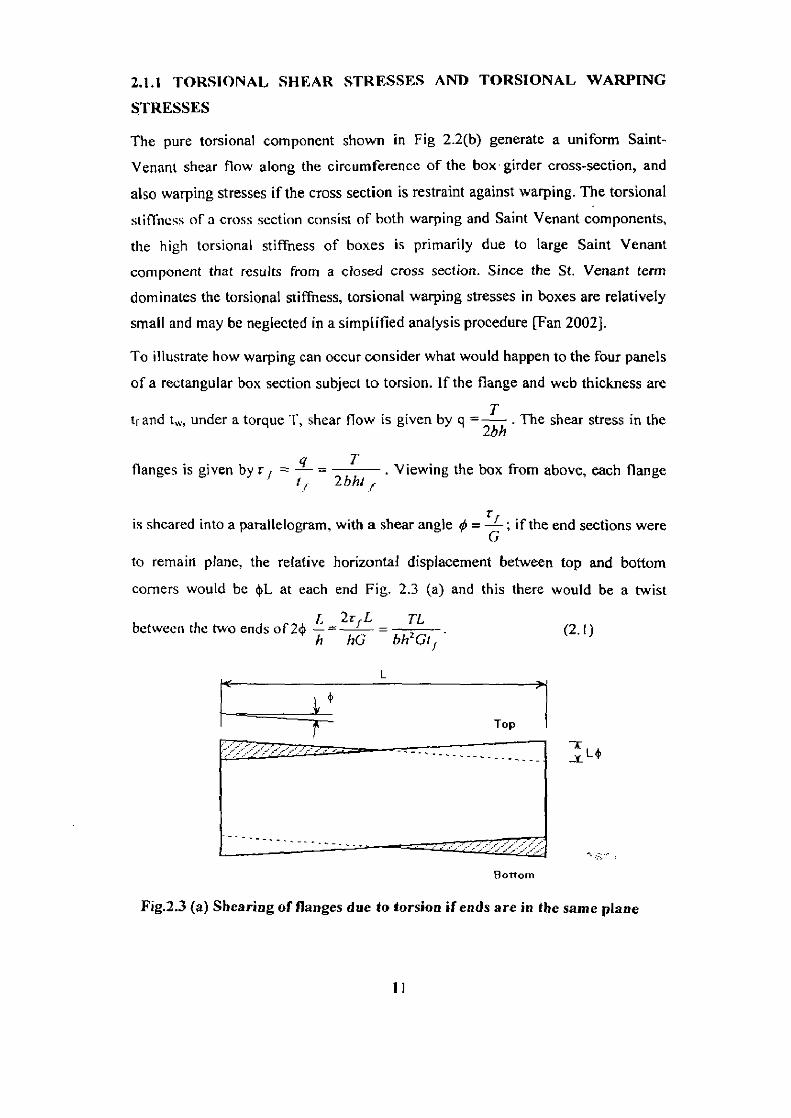
2.1.1 TORSIONAL SHEAR STRESSES AND TORSIONAL WARPING
STRESSES
The pure torsional component shown in Fig 2.2(b) generate a uniform Saint-
Venant shear flow along the circumference of the box girder cross-section, and
also warping stresses if the cross section is restraint against warping. The torsional
stiffness of a cross section consist of both warping and Saint Venant components,
the high torsional stiffness of boxes is primarily due to large Saint Venant
component that results from a closed cross section. Since the St. Venant term
dominates the torsional stiffness, torsional warping stresses in boxes are relatively
small and may be neglected in a simplified analysis procedure [Fan 2002].
To illustrate how warping can occur consider what would happen to the four panels
of a rectangular box section subject to torsion. If the flange and web thickness are
tf and tw, under a torque T, shear flow is given by q --T
. The shear stress in the 2bh
flanges is given by r = 9 = . Viewing the box from above, each flange 2hhi
rf is sheared into a parallelogram, with a shear angle 0 = —; if the end sections were
to remain plane, the relative horizontal displacement between top and bottom
corners would be 41, at each end Fig. 2.3 (a) and this there would be a twist
L 2r between the two ends of 24) – fL – TL (2.1)
h hG bh2G1I
L
P ......... Top
......... .
Bottom
L
Fig.2.3 (a) Shearing of flanges due to torsion if ends are in the same plane
11

Fig.2.3 (b) Warping of a rectangular section due to pure torsion
For a simple uniform box section subjected to pure torsion this warping is
unrestrained and does not give rise to any secondary stresses. But if a box is
supported and torsionally restrained at both ends and then subjected to applied
torque in the middle. The warping is fully restrained in the middle by virtue of
symmetry and torsional warping stresses are generated. Similar restraint occurs in
continuous box sections which arc torsionally restrained at intermediate supports.
The restraint of warping gives rise to longitudinal warping stresses and associated
shear stresses in the same manner as bending effects in each wall of the box. The
shear stresses effectively modify slightly the uniformity of the shear stresses
calculated by the pure torsion theory, usually reducing the stress near corners and
increasing it in the mid panel.
Because maximum combined effects usually occur at the corners, it is conservative
to ignore the warping shear stresses and use simple uniform distribution.
The longitudinal effects on the other hand are greatest at the corners. They need to
be taken into account when considering the occurrence of yield stresses in service
and the stress range under fatigue loading. But since the longitudinal stresses do
not actually participate in the carrying of the torsion, the occurrence of the yield at
the corners and the consequent relief of some or all of these warping stresses
would not reduce the torsional resistance. In simple terms a little plastic
redistribution can be accepted at the ultimate limit state (ULS) and therefore
inclusion of torsional warping stresses in the U.L.S checks is not needed.
12

2.1.2 DISTORTION
The distortion component leads 10 the distortion of the cross section. The
distortion component produces longitudinal warping stresses and transverse
flexural stresses in each clement. The distortional warping stresses can be quite
significant without proper bracing.
Cross-sectional distortion of box girder is induced by the components of the
external torsion loads that do not result in a uniform shear flow on the cross
section. Although the distortional components (as shown in fig 2.2c) of the applied
load yield zero net torque on the cross-section, these components can lead to large
cross-sectional stresses if proper bracing is not provided. Diaphragms or frames
can be provided to restrain distortion where large distortion forces occur, such as at
support positions and at intervals along the box, but in general the distortional
effects must be carried by some other means.
B
T 2D
T
2B
T 28
I
T 2D
Fig.2.4 Force in diagonal members due to distortional component of
applied torque
To illustrate how distortion occurs and is carried between effective restraints,
consider a simply supported box with diaphragms only at supports and which is
subjected to a point load over one web at midspan. Under the distortional forces,
each side of the box bends in its own plane and, provided there is moment
continuity around the corners, out of its plane as well. The deflected shape is
shown in figure.2.5 (Iles 1994).
13

Fig.2.5 Distortional displacements in a box girder
The in plane bending of each side gives rise to longitudinal stresses and strains
which because they are in opposite sense on the opposing forces of the box,
produce warping of the cross section.( in the example shown the end diaphragms
warp out of their planes, while the central plane can be seen to be restrained
against warping by symmetry). The longitudinal stresses are therefore known as
distortional warping stresses. The associated shear stresses are known as
distortional shear stresses.
The bending of the walls of a box, as a result of distortional forces, produces
transverse distortional bending stresses in the box section. In general the
distortional behaviour depends on interaction between the two sorts of behaviour,
the warping and the transverse distortional bending.
A distortional analysis, therefore requires the separation of the distortional
components from the applied torsional loads (as shown in lig 2.2c).
Vlasov (1961) was the first to study distortion of the box girders while
investigating the torsional behavior of thin walled beams with a closed cross
section. Dabrowski (1968) established a more rigorous theory when he developed
the governing equation for box girder distortion and provided solution for several
simple cases. The distortional behavior of box-girders can be understood by
examining how the transverse force components in the distortional loads are
14

resisted in the girder. The distortional components as shown in figure 2.2(c) are
generally resisted by both in plane and out of plane shears in the girder plates.
These two shear components result in different distortional stresses. Figure2.6 (a)
shows the typical distorted shape of the box girders that result in out-of-plane
bending of the plate components. Figure 2.6(b) shows the shear that develop in the
through thickness direction as a result of the distortion. The distortional loads on
the flanges and webs are partially resisted by these through thickness shears that
develop in the plates. Out of plane bending stresses are induced with the
corresponding moments shown in figure 2.6(c).
Fig.2.6 Out-of-plane distortional stresses in box girders
Distortional loads arc also partially resisted by the in plane shears that develop on
cross-sections of the individual plates, as demonstrated in figure 2.7(a). The large
arrow represents the in plane shears that resist the distortional loads that are
represent by the small arrows on the girder plates. The individual plates will
experience in plane bending from these shears and longitudinal bending stresses
may be induced on the cross-section. The longitudinal bending stresses are known
as the distortional warping stresses, and a typical distribution of the warping
stresses in a trapezoidal girder is illustrated in figure 2.7(b).
I5

Fig.2.7 In-plane distortional warping stresses in box girders
Cross sectional distortion can be significantly reduced by providing internal cross
frames that are spaced along the girder length. To be effective, these cross frames
should be properly spaced along the girder length, and must possess sufficient
stiffness. The current design recommendation [Guide (1993), Highway (1982)]
provide some guidelines on the minimum stiffness and spacing requirements for
the cross frames to control the distortional stresses, however, no strength
requirements are provided.
2.1.3 TRANSVERSE BENDING ANALYSIS
Presence of patch loading on top flanges introduces bending moment in the
transverse direction of box girders. This moment can be calculated by doing a
frame analysis of a unit segment of the girder along the length. This moment is
considered in the design of the transverse stiffeners of different panels. The
transverse bending causes membrane stresses in the skin and bending as well as
shear stresses in the transverse stiffeners. In the web panels the transverse stiffener
combined with skin resist the transverse bending effect as beam columns.
The bottom flange skin along with transverse stiffener experience essentially a
small transverse bending.
2.1.4 BUCKLING FAILURE
2.1.4.1 Compression Flange
In addition to considering the load effects in relation to yield strength, the stability
of compression flange must also be considered. Relatively narrow flanges may be
unstiffened. The strength of the flange plate then depends on ordinary panel
16

buckling resistance. It is convenient to express this in design by the determination
of an effective width of the compression flange; this is the width which has the
same resistance, at yield strength as the buckling resistance of the full panel.
Wider flanges are to be provided with longitudinal stiffeners to provide stability
and these are in turn supported at intervals by transverse stiffeners, cross frames or
diaphragms.
Usually the longitudinal stiffeners can be designed using rules which effectively
treat them as struts. For this purpose the transverse members restraining them must
be sufficiently stiff. If the flanges are particularly wide, the transverse stiffeners are
not sufficiently stiff, the flange could have to be treated as a panel stiffened in two
directions and the overall buckling strength determined; this is too complex for
most design purposes.
The compression flange is subjected to longitudinal in-plane compressive stresses
due to overall bending moment, in-plane shear stresses in the flange plates due to
shear force and torsion, flexural stresses in the stiffened flange in the longitudinal
direction between transverse stiffeners due to any locally applied loading. The
buckling strength of the compression flange is thus to be evaluated considering (0
variation of membrane compressive force in the longitudinal direction due to
longitudinal moment gradient (ii) Presence of membrane shear with compression
and (iii) buckling under the following modes:
• Overall buckling of stiffened panel between webs,
• Local buckling of skin in between the stiffeners,
• Torsional flexural buckling of the longitudinal stiffeners,
• Strength of longitudinal stiffener as beam columns.
2.1.4.2 Webs
The determination of the strength of webs in bending and shear follows the same
general rule as for plate girders. Shear buckling resistance of thin webs is improved
by the presence of intermediate stiffeners. Tension field action can develop in the
web in the same way as in plate girders. However, the further increase in tension
field action on account of the bending stiffness of the flange plate is not normally
achievable.
17

Box girder web panels are also stiffened in both the directions. These are generally
subjected to membrane bending and shear stresses.
11.
Fig.2.8 Stresses in Web
The stability of web is to be checked by calculating the buckling strength of the
web under shear and bending independently and then using the interaction between
the two for evaluating buckling under combined action.
Apart from the overall buckling of each panel, the local buckling of each panel,
and the local buckling of the skin elements between stiffeners in the panel are also
to be evaluated. The transverse stiffeners in the webs are to be checked as beam
column to resist the combination of transverse bending moment and the axial
compression due to reaction from the transverse stiffeners in the top flange, caused
by patch load on the top flange [Upadyay, 2003].
Local buckling and post buckling reserve strength of plates are important design
criteria in box-girder bridges carrying large loads over long spans and comprising
of slender plate sections. Flanges and webs in box girders are often reinforced with
stiffeners to allow for efficient use of thin plates. The designer has to find a
combination of plate thickness and stiffener spacing that will result in the most
optimal section with reduced weight and fabrication cost.
2.1.5 SHEAR LAG
The assumption in the simple beam theory, that a section plane and normal to the
neutral axis before bending remains plane and normal after bending, is not valid in
the box section due to shear deformability of the flanges of box girders. Thus the
assumption of normal stress uniformity along width along flange plate is not valid
for certain design situation and may infact lead to serious errors for wide flange
beams. In box beams the resulting shear strains in wide thin flanges might be of
18
magnitude sufficient to cause a lag of central longitudinal displacements of the
flange relative to the same displacements at edges of the flange. This state of non
uniformity of normal longitudinal stress (often referred to as shear lag or sometimes as stress diffusion) is characterized by higher magnitudes of stress at flange web junction.
Based on this observation, design specifications recognize the importance of
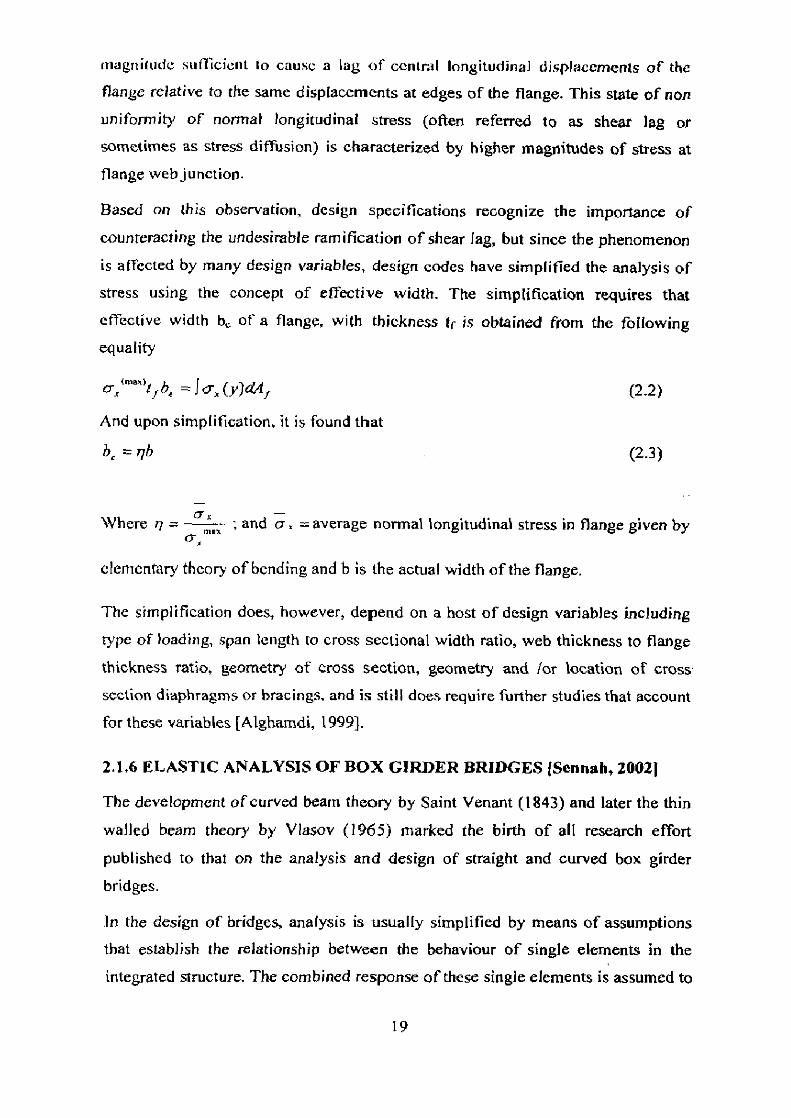
counteracting the undesirable ramification of shear lag, but since the phenomenon is affected by many design variables, design codes have simplified the analysis of stress using the concept of effective width. The simplification requires that effective width be of a flange, with thickness tr is obtained from the following equality
(Tx (y)d41 (2.2)
And upon simplification, it is found that
bg rlb (2.3)
Where n = and cr = average normal longitudinal stress in flange given by ax
elementary theory of bending and b is the actual width of the flange.
The simplification does, however, depend on a host of design variables including
type of loading, span length to cross sectional width ratio, web thickness to flange
thickness ratio, geometry of cross section, geometry and for location of cross section diaphragms or bracings, and is still does require further studies that account for these variables [Alghamdi, 1999).
2.1.6 ELASTIC ANALYSIS OF BOX GIRDER BRIDGES ISennah, 2002]
The development of curved beam theory by Saint Venant (1843) and later the thin
walled beam theory by Vlasov (1965) marked the birth of all research effort
published to that on the analysis and design of straight and curved box girder
bridges.
In the design of bridges, analysis is usually simplified by means of assumptions
that establish the relationship between the behaviour of single elements in the
integrated structure. The combined response of these single elements is assumed to
19
represent the response of the whole structure. The accuracy of such solutions
depends on the validity of the assumptions made.
The Canadian Highway Bridge Design Code, CHBDC 2000; as well as the
AASTHO 1996 have recommended several methods of analysis for only straight
box girder bridges. These methods include orthotropic plate theory, finite
difference technique, grillage analogy, folded plate, finite strip and finite element
technique. Several authors have applied these methods along with thin walled
beam theory to the analysis of straight and curved box girder bridges.
The global analysis determines the bending moment and shears in the main girders
due to applied loading. Since the principal loads are vertical, greatest attentions are
given to moments and shears in the vertical plane, though horizontal loading and
effects must also be considered. However, when box girders are used, two
additional effects must be considered, torsion and distortion. Considerations of
distortional effects may he limited to local regions between intermediate
diaphragms. Torsional eflects must be determined by the global analysis.
2.1.7 METHODS OF ANALYSIS
Methods of analysis for composite bridge decks fall into one of the three groups:
1. Those that treat the bridge as a series of interconnected beams.
2. Those that treat separately the various parts of the box section (flanges,
webs, diaphragms).
3. Those that treat the bridge deck as continuum.
> Those in the first group are the simplest to analyse, since beam theory can
be used for the behaviour of the individual elements. For a single straight
girder a line-beam analysis can be used, provided this takes account of
torsional effects as well as bending effects, but in general .a grillage model
is needed. Such an analysis gives good results for the distribution of
moments and forces in multiple girder structures and when a curved single
beam is modeled as a series of straight elements. However, simple beam
theory does not take account of the cross section or of shear lag effects and
these must be determined separately.
20

9 Analysis in the second group is by use of finite element techniques and
inevitably involves the use of a powerful computer program. Provided
elements are available within the computer program, the analysis is able to
give results which include most of the structural effects, including
distortion and shear lag, but choice of element type and size requires much
experience, and interpretation of the results also requires careful
considerations.
9 The third group applies more exact theoretical modeling techniques.
Examples are treatment of the whole deck as an orthotropic plate and
analysis of folded plate models. However, such techniques can only be able
to represent separately some aspects of the behaviour, the loading therefore
needs to be divided into components such as uniform bending, uniform
torsional, warping torsion and distortion.
These different approaches to box girder bridge idealizations and their limitations
are briefly discussed in the following sections.
2.1.7.1 GRILLAGE ANALOGY METHOD
In a grillage analysis, the structure is idealized as a number of longitudinal and
transverse beam elements in a single horizontal plane, rigidly interconnected at
nodes. Transverse beams may be orthogonal or skewed with respect to the
longitudinal beams. Each beam is allotted a flexural stiffness in the vertical plane
and a torsional stiffness. Vertical loads are applied only at nodes as shown in
figure2.9.
Computer software is used to carry out a matrix stiffness analysis to determine the
displacements (rotations about the two horizontal axes and the vertical
displacement) at each node and the forces (bending moment, torsional moments
and vertical shear forces) in the beams connected to each node. The global
structural action of a box girder bridge can be seen as the essentially separate
actions of the reinforced concrete slab and a series of longitudinal beams which
deflect vertically and twist. The flexural rigidity and torsional stiffness of these
beams are to be assumed realistically. The stiffness of the transverse beams is to be
determined carefully in particular because of their great influence on the
21

Dummy members
(between main beam and transverse elements)
Support
Transverse element
(slab)
distribution of the internal forces. The deck slab can be analyzed separately in the
transverse direction. Hambly and Pennelts (1975) applied the grillage analogy for
multi cellular superstructure by idealizing it as a grid assembly.
Main beam element
/ (box section)
Actual Section
Fig 2.9 Grillage model for a twin-box bridge
Limitations of Grillage Analysis:
• Grillage analysis does not determine warping and distortional effects, nor
the effects of shear lag.
• Local effects under point loads (wheel loads) can only be studied with a
grillage by the use of a fine mesh of beams locally to the load.
• The grillage analysis with skew cross members is difficult to interpret and
gives uncertain results for all except small skews.
22

Canadian Highway Bridge Design Code, CHI3DC 2000, limits the applicability of
this method to box girder bridges and voided slab in which the number of boxes or
cells is greater than two.
2.1.7.2 FOLDED PLATE METHOD
The folded plate method utilizes the plane stress elasticity theory and the classical
two way plate bending theory to determine the membrane stresses and slab
moments in each folded plate member. The folded plate system consists of an
assemblage of longitudinal annular plate elements interconnected at joints along
their longitudinal edges and simply supported at the ends. No intermediate
diaphragms are assumed. Solution of simply supported straight or curved box
bridges is obtained for any arbitrary longitudinal load function by using direct
stiffness harmonic analysis.
limitations of Folded Plate Analysis
• The method is complicated and time consuming.
• The programming effort for the input of three dimensional structures is
huge.
• The inner static system is multiple indeterminate and no more clear.
• The stiffness of different members and the corresponding connection joints
in particular have to be determined exactly for the calculation of realistic
stresses.
• The results are hardly understandable and checkable.
• It is not applicable to skew decks due to coupling between the harmonics.
• To apply the method to a double cellular box girder bridge with one single
internal web, the distortion must be divided into eigen value functions of
deformation.
• For boxes with more internal webs, deformations of the cross section are to
be divided into eigen value functions of deformation.
CHDBC 2000 restricted this method to bridges with support condition closely
equivalent to line supports at both ends of the bridge.
23
2. 1.7.3 FINITE STRIP METHOD The finite strip method may be regarded as a special form of the displacement
formulation of the finite element method. In principle it employs the minimum
total potential energy theorem to develop the relationship between unknown nodal displacement parameters and the applied load. In this method the box girders and
plates are discretised into annular finite strips running from one end support to the
other and connected transversely along there edges by longitudinal nodal lines. The
displacement functions of the finite strips are assumed as a combination of
harmonics varying longitudinally and polynomials varying in the transverse
direction. Compared to finite element method, the finite strip method yields
considerable saving in both computer time and effort, because only a small number
of unknowns are generally required in the analysis. The drawback of the finite strip
method is that the method is limited to simply supported prismatic structures with
simple tine supports.
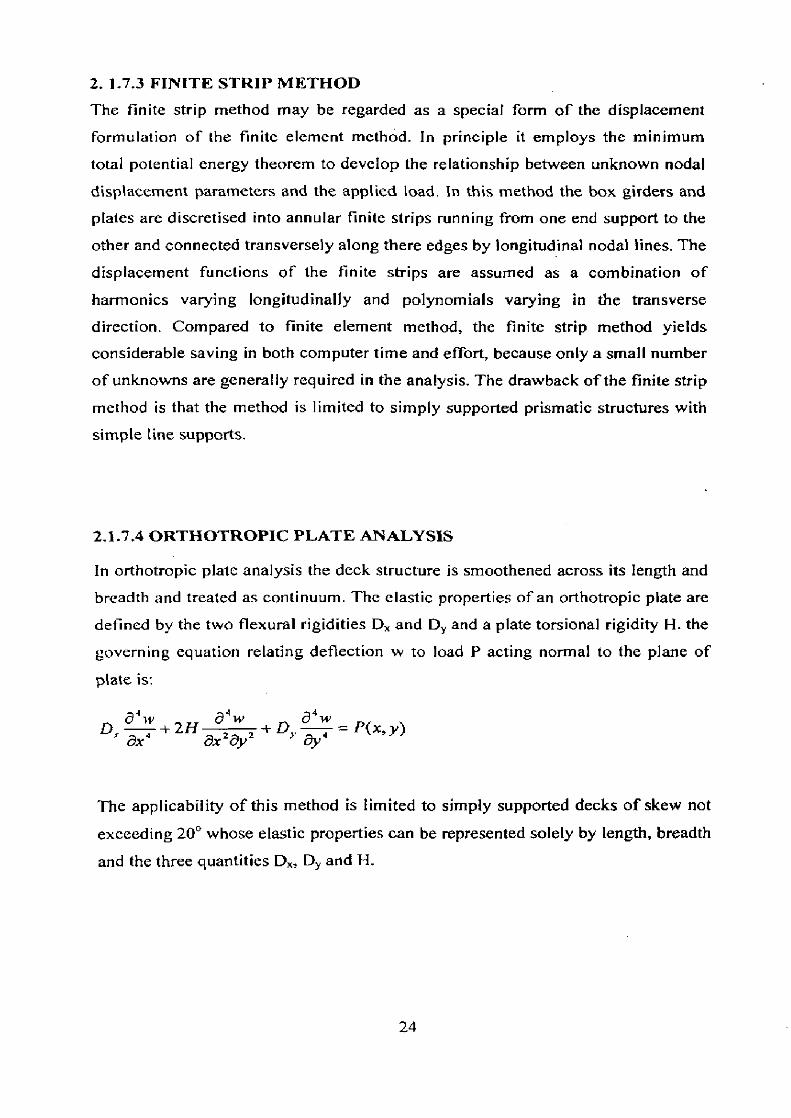
2.1.7.4 ORTHOTROPIC PLATE ANALYSIS
In orthotropic plate analysis the deck structure is smoothened across its length and
breadth and treated as continuum. The elastic properties of an orthotropic plate are
defined by the two flexural rigidities D„ and Dy and a plate torsional rigidity H. the
governing equation relating deflection w to load P acting normal to the plane of
plate is:
a4w a4 a4w — 2H , - P(x, y) ax 4 ax2wayz ay'
The applicability of this method is limited to simply supported decks of skew not
exceeding 20° whose elastic properties can be represented solely by length, breadth
and the three quantities Dx, Dy and H.
24

2.1.7.5 THIN WALLED CURVED BEAM THEORY
The curved beam theory was first established by Saint \tenant in 1843 for the ease
of solid curved beams loaded in a direction normal to their plane of curvature. The
theory is based on usual beam assumptions. Curved beam theory can only provide
the designer with an accurate distribution of the resulting bending moment, torque
and shear at any section of a curved beam if the axial, torsional and bending
rigidities of the section are accurately known. In general the curved beam theory
cannot be applied to curved box girder bridges, because it cannot account for
warping, distortion and bending deformations of the individual wall elements of
the box.
2.1.7.6 FINITE ELEMENT METHOD
During the past two decades, the finite element method is used increasingly and
has rapidly become a very popular technique for the computer solution of almost
any problem of global analysis of bridge deck.
In box girders, the finite element method allows the study of shear lag and the
computation of effective flange widths. It can also analyse local effects in slabs.
The webs, flanges and diaphragms are each divided into a suitable mesh of
elements; the details of the effects which can be revealed depends on the fineness
of the mesh and the capabilities of the element types provided by the program.
Limitations of Finite Element Analysis
• High level of expert time is required for the idealization of the structure.
• The choice of inappropriate elements can be misleading in region of steep
stress gradients, because the conditions of statical equilibrium are not then
necessarily satisfied.
Advantages of Finite Element Analysis
Based on published literature on the elastic analysis of straight and curved box
girder bridges the following comments, pertaining to box girder bridges, are made.
• Among the refined methods, the finite element method is the most
involved and time consuming. However, it is still the most general and
comprehensive technique for the box girder bridge analysis capturing all
25

aspects affecting the structural response. The other methods proved to be
adequate but limited in scope and applicability.
• The effect of different practical support conditions (free and constraints
with respect to thermal effects) can be represented only by the finite
element method.
2.2 LITERATURE REVIEW
Multi-cell Box-Girder Bridges (American Practice)
Prior to 1959, design of straight reinforced concrete multi-cell box girder bridges
for live load was based on a distribution factor approach in which individual (-
sections were assumed to be loaded with a distribution factor of S/5 wheel lines of
H-series AASHTO vehicles, where S represent the spacing in feet between centre
lines of the web. In 1959, California design engineers, who appreciated the large
torsional rigidity of closed cellular sections, suggested to the American Association
of State Highway Officials a change in this distribution factor. Based on this, the
current AASHTO code (AASHT01996) specified the following load distribution
factors for bending moment in straight reinforced concrete box girder bridges S/8
for one lane traffic and S/7 for two or more traffic lanes — where S represents the
cell width in feet. These specified load distribution factors, however, do not give
much information of the behavior of the bridge or the parameters influencing its
response. The National standards of Canada for the design of Highway Bridges
(CSA 1988) adopted the above specified moment distribution factors for straight
multi-cell bridge cross-sections [Sennah, 1999].
Recently, Code of Practice [1.AASHTO (1996), "Standard Specification for
highway bridges," I6thEdition, Washington, D.C. 2. AASHTO (1998), "LRED
Bridge design specifications", 3. Ministry (2000), "Canadians Highway Bridge
Design code.] have adopted the concept of load distribution factor to simplify the
analysis and design of a bridge. Several investigations have been carried out over
30 years as part of the project CURT (Consortium of university Research Team) on
moment distribution in simply supported multi-spine (separate boxes) box girder
bridges. These investigations have formed the basis for the live load distribution
factors in Canadian highway bridge design code (Ministry 2000) as well as in the
26
specifications of the American Association of the state Highway and
Transportation officials (AASHTO 1996). The AASHTO (1998) `LRFD Bridge
Design Code' also refers to the modification factors dealing with continuity in the
case of continuous multi box girder bridges.
The CURT research activity was Followed by the development of first Guide
specifications for horizontally curved Highway Bridges by AASHTO (Guide-
1980). The current AASHTO Guide specification for horizontally curved Highway
Bridges (1993) is primarily based upon research work conducted to prior 1978 and
pertains only to multi-spine composite type of box girders [Sennah, 1999, 2001].
Since then, a significant amount of work has been conducted to enhance the
specifications and to better understand the behavior of all types of box girder
bridges. The results of these various research works are scattered and unevaluated.
A new curved steel bridge research project (CSBR) is currently being conducted
under the auspices of FHWA (Federal Highway Administrations). This project is
expected to provide information on behavior, analysis and design of curved
composite bridges.
A.W. Wegmuller et-.al. (1975) this paper concerned with overload behaviour of
composite bridge. A non-linear finite element analysis is used to determine the
complete state of stress and deformation at any load level of overload. The bridge
response under overloads is investigated, and the effects of some major design
parameter are studied. Among these parameters are: beam size, torsional constant,
slab thickness, Poisson's ratio, yield stress of steel and ratio of transverse to
longitudinal stiffness of the slab. The results obtained from computer analysis
compared with experimental results.
Trukstra and Fain (1978) investigated the effect of warping on the longitudinal
normal stresses and the transverse normal stresses in single cell curved bridges.
Mukherjee and Trikha (1980), using the finite strip method, developed a set of
design coefficients for two lane twin cell curved box girder reinforced concrete
bridges as an aid to practical design of such bridges. The effect of intermediate
diaphragms was not considered in this study.
Davis and Bon (1981) presented a correction factor for curvature for load
distribution in concrete and pre stressed concrete multi cell box girder bridges_ The
27

drawback of the work is that the beneficial effect of the intermediate diaphragms
was not taken into consideration.
Nutt et.-al. (1988), in the first phase of the AASHTO — sponsored national Co-
operative I tighway Research program, proposed a set of equations for moment
distribution in straight reinforced, and pre stressed concrete multi cell box girder
bridges.
natant and Kim (1989) developed, based on experimental investigation,
probabilistic prediction of the confidence limits for long tern, load defections and
for internal forces in pre stressed concrete segmental box girder bridges,
Ho et-.al. (1989) used the finite strip method to analyze straight simply supported,
two cell box girder and rectangular voided slat bridges without intermediate
diaphragms. Empirical expressions and design curves were deducted for the ratio
of longitudinal bending moment to the equivalent beam moment.
Zokaie et.al. (1991): [National Co-operative Highway Research Program
(NCHRP) 1991; Transportation Research Board (TRB)1992], in the second phase,
other moment and shear distribution factors proposed. Their findings form the load
distribution factors for moment and shear currently used by AASHTO (1998) for
straight reinforced concrete multi cell bridges.
Hagen et al. (1994) performed a similar study for minimum mass design based on
buckling constraints of a simple box beam subjected to both pure torsion and
bending.
Farkas and Jarmai (1995) presented a multi objective optimal design method for
welded box beams with respect to the material and fabrication cost, mass and
maximum deflection.
Brighton et-.al. (1996) described a study to determine a live load distribution
factor for a new type of pit cast concrete double cell box girder that was proposed
for a fabricated bridge system with shear keys for rapid construction of short span
bridges.
Sennah and Kennedy (1998 a, b, 1999 a, c) presented empirical expressions for
moment, shear and deflection distribution factors as well as for the maximum
design force in bracing members of simply supported curved composite concrete-
28
deck steel cellular bridges of typical cross sections AASHTO (1996) and CSA
(1998) provide a geometrically defined criterion to establish when a horizontally
curved bridge may he treated as a straight one. Scnnah and Kennedy (1998b,
1999c) examined these limitations in the case of moment and shear in curved
composite multi cell bridges. Further examination may be required for other types
of curved box girder bridges.
R. Serafino et-.al. (2000) developed a new concept of the partial-interaction focal
point and simplified partial-interaction theory to derive a simple procedure for
deriving the partial-interaction flexural stresses from standard and easily obtained
full interaction parameters. Since mechanical shear connectors in composite steel
and concrete beams require slip to transmit shear, most composite bridge beams
are designed as full-interaction because of the complexities of partial-interaction
analysis techniques. However, in the assessment of existing composite bridges this
simplification may not be warranted as it is often necessary to extract the greatest
capacity and endurance from the structure. This may only be achieved using
partial-interaction theory which truly reflects the behaviour of the structure.
Kuan-Chen Fu et-.al. (2003) proposed model for shear connector in the form of
two mutually perpendicular linear springs with normal and tangential stiffness.
Normal stiffness consist of axial stiffness of stud considering it as axial element
and tangential stiffness is evaluated from load slip relationship of shear connector
obtained from push-off test.
Dennis Lam et-.al. (2005) proposed a numerical model using finite element
method to simulate the push-off test. And parametric study is conducted for getting
the load-slip relationship of headed stud shear connector for various concrete grade
and stud diameters.
29

CHAPTER 3
FINITE ELEMENT MODELING
3.1 FINITE ELEMENT ANALYSIS
The name finite element was coined by Clough in 1960. Many new elements for
stress analysis were soon developed. In 1963, finite element analysis acquired
respectability in academia when it was recognized as a form of Reyleigh-Ritz
method. Thus finite element analysis was seen not just as a special trick for stress
analysis but as a widely applicable method having a sound mathematical basis. The
first textbook about finite element analysis appeared in 1967 and today there exists
an enormous quantity of literature about finite element analysis.
General purpose computer programs for finite element analysis emerged in the late
1960's and early 1970's. Since the late 1970's computer graphics of increasing
power have been attached to finite element software, making finite element
analysis attractive enough to be used in actual design. Previously it was so tedious
that it was used mainly to verify a design already completed or to study a structure
that had failed. Computational demands of practical finite element analysis are so
extensive that computer implementation is mandatory. Analyses that involve more
than 100000 degrees of freedom are not uncommon.
Finite element analysis, also called the finite element method, is a method for
numerical solution of field problems. A field problem requires determination of the
spatial distribution of one or more dependent variables. Mathematically a field
problem is described by differential equations or by an integral expression. Either
description may be used to formulate finite elements.
individual finite elements can be visualized as small pieces of a structure. In each
finite element a field quantity is allowed to have only a simple spatial variation,
e.g. described by polynomial terms up to x2 , xy and y2 . The actual variation in the
region spanned by an element is almost certainly more complicated, hence a finite
element analysis provides an approximate solution.
31

in more and more engineering situations today, we find that it is necessary to-
obtain approximate numerical solutions to problems, rather than exact closed-form
soh iOT1S.
Elements are connected at points called nodes and the assemblage of elements is
called a finite element structure. The particular arrangement of elements is called a
mesh. How the finite element method works can be summarized in the following
general terms:
Discretise the continuum. The first step is to divide the continuum or
solution into elements. A variety of element shapes may be used and
different element shapes may be employed in the same solution region.
2. Select interpolation functions. The next step is to assign nodes to each
element and then choose the type of interpolation function to represent the
variation of field variable over the element.
3. Find the element properties. Once the finite element model has been
established the matrix equation expressing the properties of the individual
elements is ready to be determined.
4. Assemble the element properties to obtain the system equations. The
matrix equations expressing the behaviour of the elements must be
combined to form the matrix equations expressing the behaviour of the
entire solution region or system.
Solve the system equations. The assembly process of the preceding step gives a set
of simultaneous equations that can be solved to obtain the unknown nodal values
of the field variable.
Finite element analysis has advantages over most other numerical analysis
methods, including versatility and physical appeal, the major advantages offinite
element analysis can be summarized as:
• Finite element analysis is applicable to any field problem.
• There is no geometrical restriction. The body analysed may have any
shape.
• Boundary conditions and loading conditions are not restricted.
32
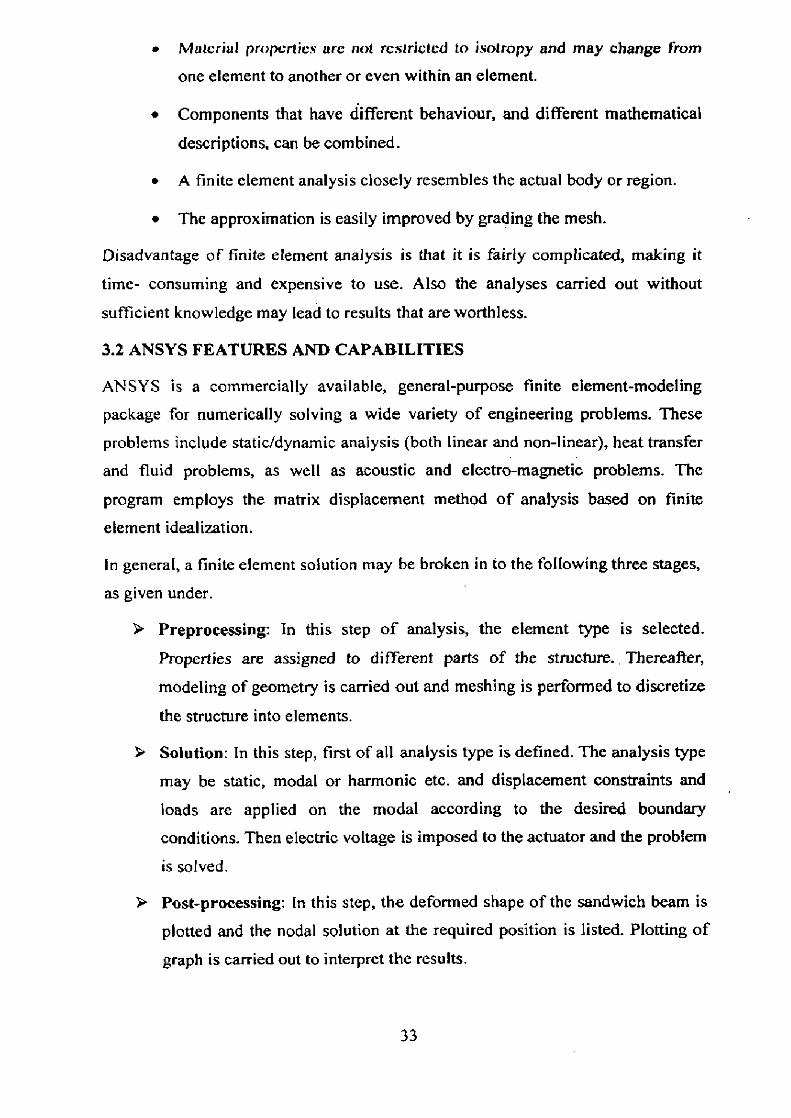
• Material properties arc not restricted to isotropy and may change from
one element to another or even within an element.
• Components that have different behaviour, and different mathematical
descriptions, can be combined.
• A finite element analysis closely resembles the actual body or region.
• The approximation is easily improved by grading the mesh.
Disadvantage of finite element analysis is that it is fairly complicated, making it
time- consuming and expensive to use. Also the analyses carried out without
sufficient knowledge may lead to results that are worthless.
3.2 ANSYS FEATURES AND CAPABILITIES
ANSYS is a commercially available, general-purpose finite element-modeling
package for numerically solving a wide variety of engineering problems. These
problems include static/dynamic analysis (both linear and non-linear), heat transfer
and fluid problems, as well as acoustic and electro-magnetic problems. The
program employs the matrix displacement method of analysis based on finite
element idealization.
In general, a finite element solution may be broken in to the following three stages,
as given under.
> Preprocessing: In this step of analysis, the element type is selected.
Properties are assigned to different parts of the structure.. Thereafter,
modeling of geometry is carried out and meshing is performed to diseretize
the structure into elements.
➢ Solution: In this step, first of all analysis type is defined. The analysis type
may be static, modal or harmonic etc. and displacement constraints and
loads are applied on the modal according to the desired boundary
conditions. Then electric voltage is imposed to the actuator and the problem
is solved.
Post-processing: In this step, the deformed shape of the sandwich beam is
plotted and the nodal solution at the required position is listed. Plotting of
graph is carried out to interpret the results.
33
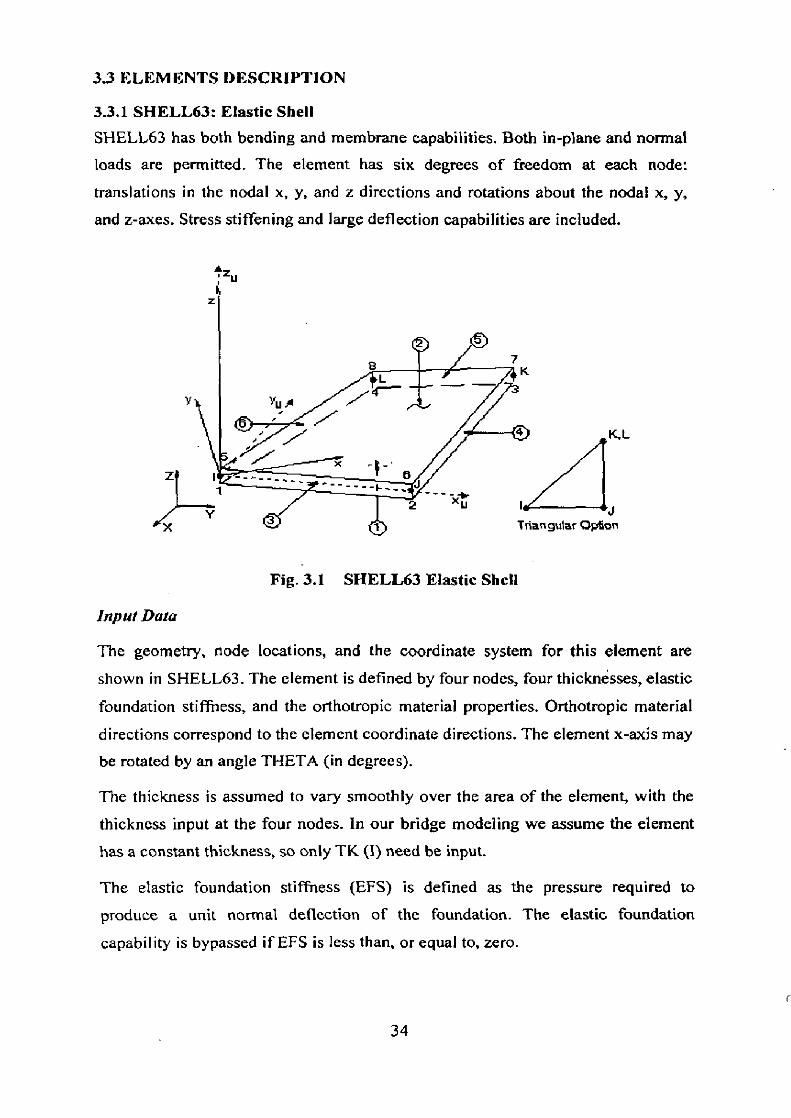
33 ELEMENTS DESCRIPTION
3.3.1 SHELL63: Elastic Shell SHELL63 has both bending and membrane capabilities. Both in-plane and normal loads are permitted. The element has six degrees of freedom at each node:
translations in the nodal x, y, and z directions and rotations about the nodal x, y, and z-axes. Stress stiffening and large deflection capabilities are included.
kr U
Fig. 3.1 SHELL63 Elastic Shell
Input Data
The geometry, node locations, and the coordinate system for this element are shown in SHELL63. The element is defined by four nodes, four thicknesses, elastic
foundation stiffness, and the orthotropic material properties. Orthotropic material
directions correspond to the element coordinate directions. The element x-axis may be rotated by an angle THETA (in degrees).
The thickness is assumed to vary smoothly over the area of the element, with the
thickness input at the four nodes. In our bridge modeling we assume the element has a constant thickness, so only TK (I) need be input.
The elastic foundation stiffness (EFS) is defined as the pressure required to
produce a unit normal deflection of the foundation. The elastic foundation
capability is bypassed if EFS is less than, or equal to, zero.
34
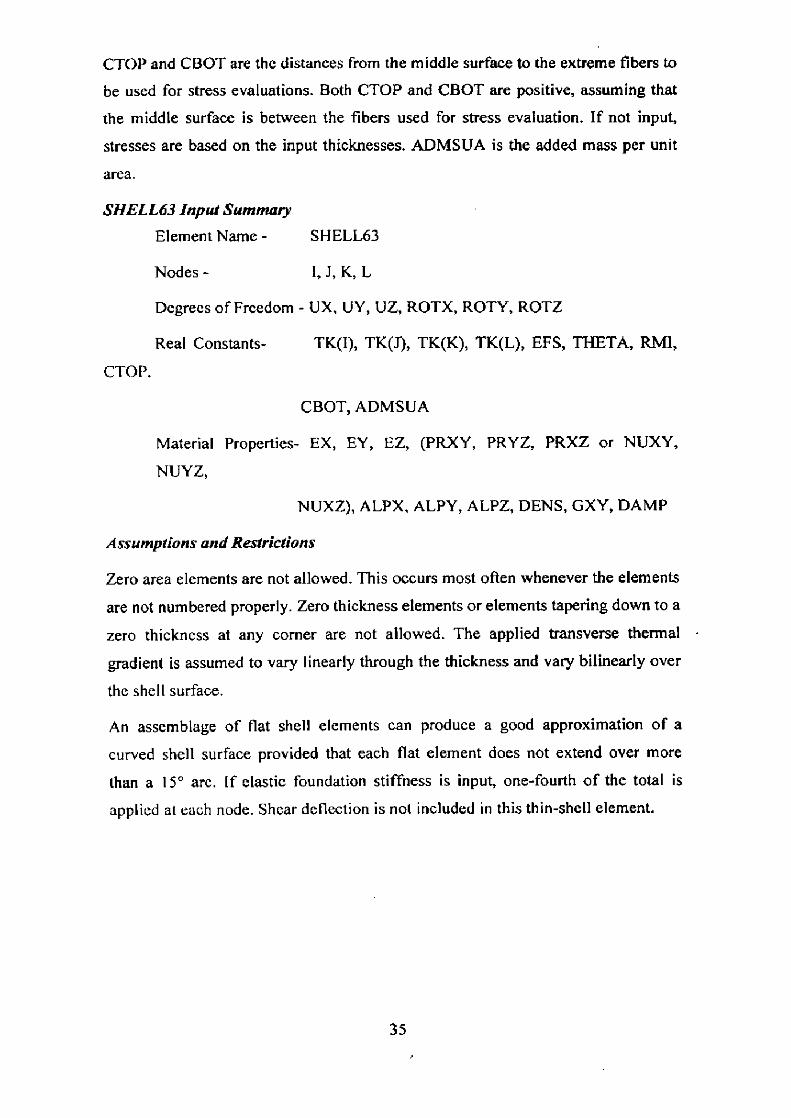
CTOP and CBOT are the distances from the middle surface to the extreme fibers to
be used for stress evaluations. Both CTOP and CBOT are positive, assuming that
the middle surface is between the fibers used for stress evaluation. If not input,
stresses are based on the input thicknesses. ADMSUA is the added mass per unit
area.
SHELL63 Input Summary Element Name - SHELL63
Nodes - K, L
Degrees of Freedom - UX, UY, UZ, ROTX, ROTY, ROTZ
Real Constants- TK(I), TK(J), TK(K), TK(L), EFS, THETA, RMI,
CTOP,
CBOT, ADMSUA
Material Properties- EX, EY, EZ, (PRXY, PRYZ, PRXZ or NUXY,
NUYZ,
NUXZ), ALPX, ALPY, ALPZ, DENS, GXY, DAMP
Assumptions and Restrictions
Zero area elements are not allowed. This occurs most often whenever the elements
are not numbered properly. Zero thickness elements or elements tapering down to a
zero thickness at any corner are not allowed. The applied transverse thermal
gradient is assumed to vary linearly through the thickness and vary bilinearly over
the shell surface.
An assemblage of flat shell elements can produce a good approximation of a
curved shell surface provided that each flat element does not extend over more
than a 15° arc. If elastic foundation stiffness is input, one-fourth of the total is
applied at each node. Shear deflection is not included in this thin-shell element.
35
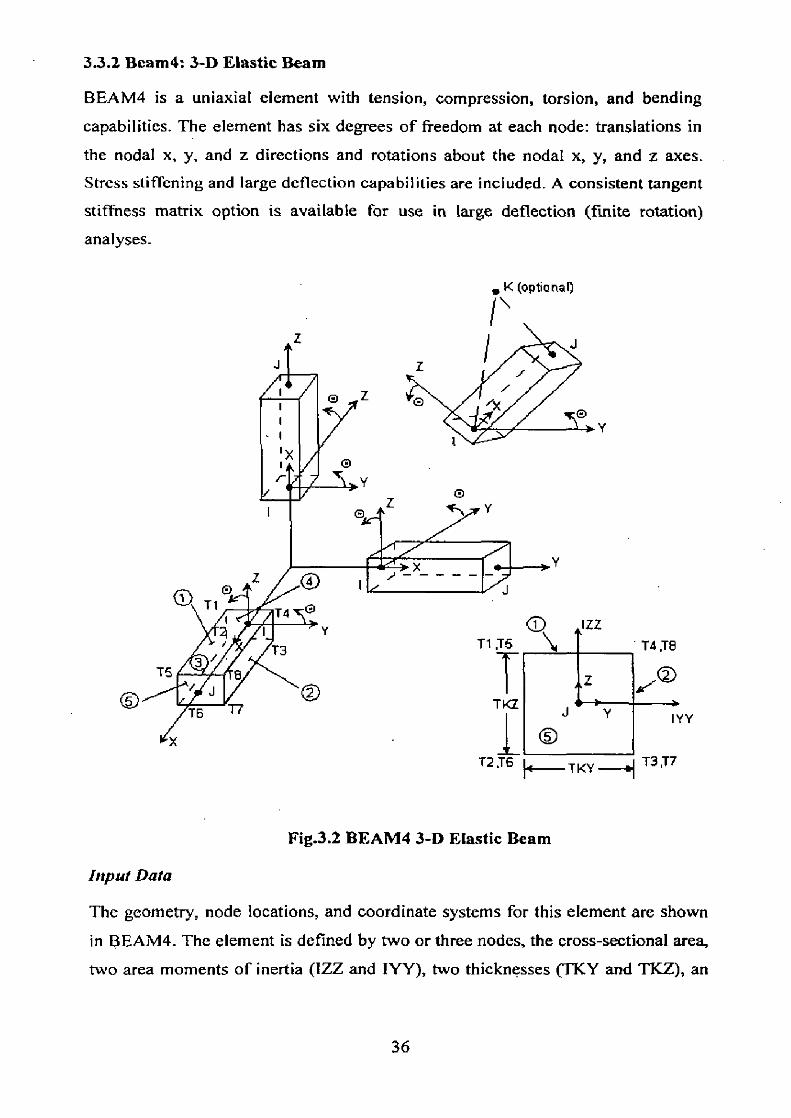
3.3.2 Bcam4: 3-D Elastic Beam
BEAM4 is a uniaxial element with tension, compression, torsion, and bending
capabilities. The element has six degrees of freedom at each node: translations in
the nodal x, y, and z directions and rotations about the nodal x, y, and z axes.
Stress stiffening and large deflection capabilities are included. A consistent tangent
stiffness matrix option is available for use in large deflection (finite rotation)
analyses.
T1 ,T5 ,T13
„SD
TKZ I re
T2 :1-6 14— T KY —el Tan
Fig.3.2 BEAM4 3-13 Elastic Beam
Input Data
The geometry, node locations, and coordinate systems for this element are shown in BEAM4. The element is defined by two or three nodes, the cross-sectional area,
two area moments of inertia (IZZ and IYY), two thicknesses (TKY and TKZ), an
36
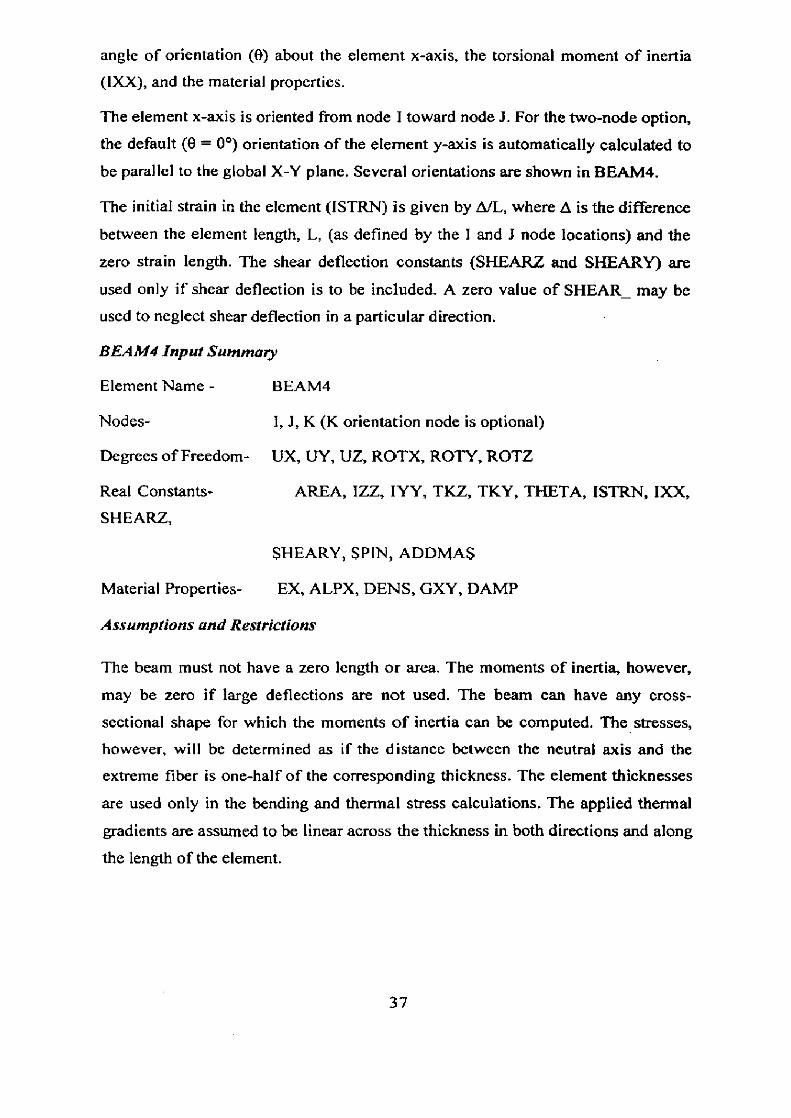
angle of orientation (0) about the element x-axis, the torsional moment of inertia
(DCX), and the material properties.
The element x-axis is oriented from node I toward node J. For the two-node option,
the default (0 = 0°) orientation of the element y-axis is automatically calculated to
be parallel to the global X-Y plane. Several orientations are shown in BEAM4.
The initial strain in the element (ISTRN) is given by A/L, where A is the difference
between the element length, L, (as defined by the I and 3 node locations) and the
zero strain length. The shear deflection constants (SHEARZ and SHEARY) are
used only if shear deflection is to be included. A zero value of SHEAR_ may be
used to neglect shear deflection in a particular direction.
BEAM4 Input Summary
Element Name - BEAM4
Nodes- I, .1, K (K orientation node is optional)
Degrees of Freedom- UX, UY, UZ, ROTX, ROTY, ROTZ
Real Constants- AREA, IZZ, IYY, TKZ, TKY, THETA, ISTRN, IXX,
SHEARZ,
SHEARY, SPIN, ADDMAS
Material Properties- EX, ALPX, DENS, GXY, DAMP
Assumptions and Restrictions
The beam must not have a zero length or area. The moments of inertia, however,
may be zero if large deflections are not used. The beam can have any cross-
sectional shape for which the moments of inertia can be computed. The stresses,
however, will be determined as if the distance between the neutral axis and the
extreme fiber is one-half of the corresponding thickness. The element thicknesses
are used only in the bending and thermal stress calculations. The applied thermal
gradients are assumed to be linear across the thickness in both directions and along
the length of the element.
37
3.3.3 Mpe184: Multi-Point Constraint Rigid Link And Rigid Beam
MPC184 can be used as a rigid constraint between two deformable bodies or as a
rigid component used to transmit forces and moments in engineering applications.
The element can also be used in applications that call for thermal expansion of an
otherwise rigid structure.
mei: 184 Rigid Link Beam Element
Fig-3.3 MPC 184 Rigid link/Beam Element
Depending upon the application, the element can behave as a rigid link or as a
rigid beam. If KEYOPT (1) = 0 (default), then the element is a rigid link element
with three degrees of freedom at each node (translations only). If KEYOPT (1)=1,
then the element has six degrees of freedom at each node (translations and
rotations in x, y, and z directions).
This element is well suited for linear, large rotation, and/or large strain nonlinear
applications.
Input Data
MPCI 84 Rigid Link/Beam Element shows the geometry, node locations, and the
coordinate system for this element. Two nodes define the element. The element x-
axis is oriented from node 1 toward node J. The area of cross section of the element
is assumed to be one unit.
Because the element models a rigid constraint or a rigid component, material
stiffness properties are not required_ When thermal expansion effects are desired,
the coefficient of thermal expansion must be specified. Density must be specified if
the mass of the rigid element is to be accounted for in the analysis. If density is
specified, ANSYS calculates a lumped mass matrix for the element.
38
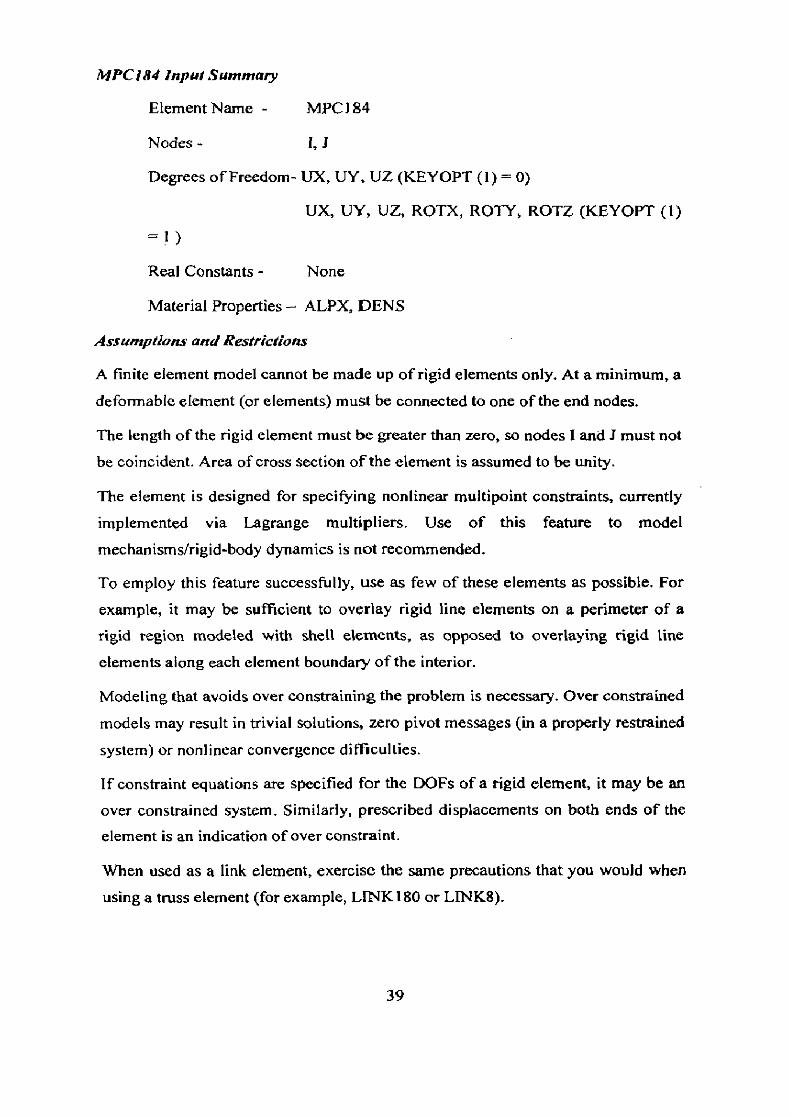
MPC1101 Input Summary
Element Name - MPC184
Nodes - 1, 1
Degrees of Freedom- UX, UY, UZ (KEYOPT (1) = 0)
UX, UY, UZ, ROTX, ROTY, ROTZ (KEYOPT (I) = 1 )
Real Constants - None
Material Properties — ALPX, DENS
Assumptions and Restrictions
A finite element model cannot be made up of rigid elements only. At a minimum, a deformable element (or elements) must be connected to one of the end nodes.
The length of the rigid element must be greater than zero, so nodes I and I must not be coincident. Area of cross section of the element is assumed to be unity.
The element is designed for specifying nonlinear multipoint constraints, currently implemented via Lagrange multipliers. Use of this feature to model mechanisms/rigid-body dynamics is not recommended.
To employ this feature successfully, use as few of these elements as possible. For example, it may be sufficient to overlay rigid line elements on a perimeter of a rigid region modeled with shell elements, as opposed to overlaying rigid line elements along each element boundary of the interior.
Modeling that avoids over constraining the problem is necessary. Over constrained models may result in trivial solutions, zero pivot messages (in a properly restrained
system) or nonlinear convergence difficulties.
If constraint equations are specified for the DOFs of a rigid element, it may be an over constrained system. Similarly, prescribed displacements on both ends of the element is an indication of over constraint.
When used as a link element, exercise the same precautions that you would when using a truss element (for example, LINK180 or LINKS).
39

TviPC184 is valid only for static analyses (linear and nonlinear), and is not
supported for modal or buckling analyses.
3.4 ASSUMPTIONS FOR THE ANALSIS OF SHELLS
In order to deduce the theory of the thin elastic shell from the three dimensional
elasticity, a few simplifying assumptions, known as Love's first approximation, are
used.
These assumptions are stated as follows:
• The thickness of the shell is negligible compared to its radii of curvature.
• The deflection of the shell is small.
• The transverse normal stress is negligible.
• The normal to the reference surface of the shell remains normal to the
deformed surface.
• The normal to the reference surface undergoes negligible change in length
during deformation.
These assumptions arc reasonable, as the shell thickness is assumed small.
3.4.1 Constitutive Laws The stresses are assumed to be of membrane type uniform through out the
thickness. Let o-y be the initial stresses (caused by the pressure). ey denote the
strain. If the two suffixes are the same, these are called direct stresses/strains and if
the suffixes are different, they are called shear stress/strains.
From the symmetry of the 3-D elastic stresses and strains, we obtain
= C I • , 60 = 6 „ (3. I )
The engineering strains yn, y13 andy23 are defined as twice of corresponding tensor
shear strains,
i.e. Y23 = 2623 (3.2)
40

a z3 at 3 Yz3
0-12 7" = G G
611 = qa22 a33 A
I ezz = E an — 114711 a33
I r 833 = La33 1471.1. -4-4722 )1
(3.5)
(3.5)
(3.6)
(3.7)
Yu = 2813
(3.3)
712 = 2e12
(3.4)
Assuming that the material obeys Hooke's Law and is isotropic, the stress-strain
relations for a three-dimensional element are
Where E, G, and v are the elastic modulus, shear modulus, and Poisson's ratio of
the shell material, respectively. Following Love's first approximation, we
substitute 0-33 = y 23 = y„ = 0 to obtain
a = Va22 )
1 ar 822 = vat])
712 = G
Since the stress and strain cannot be put to zero at the same time, we get nonzero
e23,o-23 and a-13 . While a23 and an are obtained from the equations of motions,
the normal strain s33 can be obtained from the following equation:
41

(3.11)
The above equation can be used in calculating the constriction of the shell
thickness during vibration. Solving above Equations for stresses yields
0-11=0 -v2 )(cl I 4- VE22 )
= E (6. + vs ) C722 - 0 1-v
2 ) 22 I I
er12 = G712
(3.12)
(3.13)
(3.14)
The thickness of the shell is small, and hence the three-dimensional stresses can be
integrated over thickness to obtain the two-dimensional stress resultants.
42

3.5 BOX GIRDER BRIDGE MODELLING IN ANSYS 7
Following are the specifications for a typical bridge model that must be known
before the modeling:
• Number of cells
• Number of lanes
• Number of bracings
• Clear carriageway width
• Span of bridge, L
• D, total depth of steel section from top flange to bottom flange, L/D ratio
• Centre to centre cell width
• Top flange width
• Thickness of top flange
• Thickness of web
• Thickness of bottom flange
• Thickness of concrete deck
• Thickness of bracing
• Width of bracing
• Thickness of Diaphragm
• Size of Access holes in Diaphragm
3.5.1 Steps in Modeling and Analysis of Box Girder in ANSYS
Following are the steps to model a composite concrete deck-steel cell bridge on ANSYS7 using GUI:
Step-1 Set preferences Turn on structural.
Step 2 Define element types and options
Choose Shell-elastic 4 node 63 elements, Beam 3D elastic 4, Rigid Nonlinear
MPC184 (with option- rigid beam).
Step 3 Define Real Constants
43

Typical real constants include shell thickness for shell elements and cross-sectional properties for shell elements. For beam element, cross sectional area, thickness and moment of inertia along z and y direction must be given.
Step 4 Define Material Properties Material properties are constitutive properties of material such as modulus of elasticity, poisson's ratio, density and are independent of geometry.
Step 5 Modeling of Bridge cross section
Create key-points in a plane and copy them in the direction normal to plane. Make lines by joining them, create areas through key-points or lines.
Step 6 Glue the Areas Glue the Areas connected at common point.
Step 7 Mesh the Area Mesh the areas after giving proper mesh attributes and element sizes.
Step 8 Create shear connectors and Cross Bracings Create elements between the corresponding nodes of concrete deck (shell element) and top flange (beam element) using MPC (rigid beam). Also cross bracings between nodes of web and bottom flange using beam element.
Step 9 Applying Boundary conditions. Apply boundary conditions as rollers under each web at near end and
hinges at far end.
44

ANSYS JUN C.) :COC.
F:2E:1
EL=ENTS
RF.AL mni
ANSYS' ]LAY 2005
15:50:31 I
Fig 3A Bridge model in ANSYS
Fig 3.5 Complete meshed bridge model (Vector plot with size and shape on)
45

LE13::1":":
Fti, 1. TIL".
ANS
ANSYS
Fig 3.6 Meshed bridge model cross section in ANSYS
Fig 3.7 Loaded and constrained bridge model in ANSYS
46

Step 10 Applying Loads.
This is the most critical step found while applying IRC loading on deck
because of following reasons.
A) These IRC loadings are patch loads,
B) Patch load at any random location can not be given on ANSYS meshed
model.
To get solved this problem a program (CPP) (Appendix-I) has been written
to convert the patch load at any random location on meshed deck of bridge
in to nodal loads. For conversion the shape functions (interpolation
functions) have been used.
Step 1 I Solution
Run analysis as Current LS and analyse the structure for different load
combinations.
Step 12 Post Processing.
Enter the general post processor and read the results. Deformation and
stress values are taken at the required cross section.
This is again an important step in analysis. As a civil engineer we are
interested in integrated values like bending moment and shear force etc. but
the results we get in ANSYS are in the form of stress contours. Again a
program (CPP) (Appendix-II) has been written for getting moment of
resistance of the section by inputting stress listing and geometric details.
47

A
Top-chord
Cross-bracing B
CHAPTER 4
LOAD DISTRIBUTION FACTORS FOR
COMPOSITE BRIDGES
4.1 CONCEPT OF DISTRIBUTION FACTOR
The concept of the distribution factor allows the design engineer to consider the
transverse effect of wheel loads in determining the shear and moments of girders
under the longitudinal as well transverse placement of live loads, thus simplifying
the analysis and design of bridges. According to the approach of the load distribution, maximum shear and moments in bridge are obtained first as if the wheel loads are applied directly to bridge as a beam. The wheels are then moved
transversely across the width of the bridge for the maximum response of individual
girder. The maximum interior and exterior girder moments and web shears are
calculated in each loading case by multiplying by the appropriate live-load
distribution factors [El-Tawil et-al. (2002)].
(a) Cross-section symbols for four-cell bridge
C..411 ro
T - T T ' 4 5
(b) Idealized cellular bridge for moment distribution
Fig. 4.1 CROSS-SECTION OF FOUR CELL BRIDGE PROTOTYPE
49

For the computation of the distribution factors the cellular cross section was divided into I-beam shaped girders as shown in Fig. 4.1(b). Each idealized girder
consisted of the web, steel top flange, concrete deck slab, and steel bottom flange.
MOMENT DISTRIBUTION FACTOR
In order to determine the moment distribution factor, Dims, carried by each girder
of the bridge, the maximum moment, M, was calculated in a simply supported
girder subjected to one train of 1RC Class 70R wheel loads. The longitudinal
moment carried by each girder of the prototype bridge, Mmn, was calculated by
integrating the normal stresses at midspan, determined from the finite-element
analysis of the loaded bridge prototype, taking into account the modification
factors for multilane loading. For computation of bending moment from flexural
normal stresses a program (CPP) (Appendix-II) has been written which requires
input of node coordinates and nodal stress values and gives output of bending moment shared by each girder of composite box.
The moment distribution factor, Dms, was then calculated from the following
relationship:
Almax D,,,s —
SHEAR DISTRIBUTION FACTOR
To calculate the shear distribution factors, Dss, carried by each web, the maximum
reaction force, V, in a simply supported girder, subjected to one train of IRC Class
70R wheeled loads, was determined. The maximum reaction under each web,
was obtained for each bridge prototype from the finite-element analysis. The shear
distribution factor, Dss, was then determined as follows:
At (4.1)
(4.2)

For the preliminary design of bridges AASHTO has given the load distribution
factors for different types of bridge cross section such as, composite steel I girder
bridges, concrete multicell box girder bridges. However, the AASHTO have not
given distribution factors for 'composite multicell box girder bridges'.
For the analysis of composite multicell box girder bridges AASTHO [1998] and
CHBDC [1997] recommend the use of the grillage-analogy method, folded-plate
method, finite-strip method, and finite-element method. Published research on the
subject, [e.g., Scordelis et al. (1985) among others] dealt with analytical and
numerical formulations, while other researchers (Scordelis 1975; Siddiqut and Ng
1988, etc.) conducted experimental studies to investigate the accuracy of the
existing methods of analysis. Several investigators (e.g., NCHRP 1991; Nutt et al.
1988) studied the load distribution in multicell box girder bridges. However, the
aforementioned investigations were confined to reinforced or prestressed concrete
construction, and did not include composite concrete deck-steel construction.
Sennah (Sennah et. al 1999) has conducted an extensive parametric study using
finite element method and has deduced expressions for moment and shear
distribution factors for multicell composite box girder bridges subjected to
AASHTO loading. However, the AASHTO loads being different, their validity for
IRC loading is doubtful. Therefore, load distribution factors for moment and shear
are required for composite cellular bridges subjected to IRC loadings to fill the gap
found in previous studies as well as in bridge codes.
4.2 PROBLEM DEFINITION
The use of multicell box girders in bridge deck construction can lead to
considerable economy. This type of construction leads to an efficient transverse
load distribution, due to the excellent torsional stiffness of the section. Further,
utilities and services can be readily provided within the cells.
In India, there are no design codes or guidelines for composite box girder bridge
design. So, Indian designers are forced to take recourse to state-of-art research or
codes of practice of European or North American Countries. Therefore the present
study aims to undertake some aspects of the composite box girder bridges,
specifically the composite multi-cell box girders.
51

The load distribution factors for moment and shear are required for composite muiticell box girder bridges to fill the gap found in the previous studies as well as
in bridge design codes.
The objective of this study is to conduct a parametric study using finite element
method to examine the key parameters that may influence the load distribution characteristics of composite concrete deck-steel multicell box girder bridges under
IRC loading. Dead load of the bridge was also considered in this study. The
parameters considered herein are number of cells, number of lanes, span length,
and cross-bracings.
The results from an experimental study on a bridge model are used to validate the ANSYS modeling adopted in parametric study.
The data generated from the study is used to deduce design curves for moment as
well as shear distribution factors for different loading conditions to aid in the design of such bridges.
4.3 BRIDGE MODELING
The finite-element method was used in investigating the distribution factors of the
live load moment and shear in twenty four bridge prototypes. The finite element program used is ANSYS 7, developed by ANSYS, Inc. All superstructures were
analyzed in a linearly elastic range. A four-node shell element with six degrees of
freedom at each node was used to model the concrete deck, steel webs, steel
bottom flange, and end diaphragms. The shell elements accounted for both
membrane and bending stiffnesses, and considered in-plane and out-of-plane bending. A three dimensional two-node beam element was adopted to model the steel top flanges, cross bracings and top-chords.
The shell elements in the top flange were connected using multipoint constraint
MPC, type rigid beam, with the elements (flanges) of the web to ensure
compatibility of deformation, while the shell elements in the bottom flange were
connected with the bottom portion of the shell dements of the web for the same purpose. Because of their insignificant flexural and torsional stiffnesses, cross-
bracing and top-chord members are considered as axial members loaded in tension and compression. Two different constraints were used in the modeling, namely, the
52

roller support at one end of the bridge, constraining vertical displacements at the
lower end nodes of each web, and the hinge support at the other end of the bridge,
restricting all possible translations at the lower end nodes of each web. The
multipoint constraint option in the ANSYS software, type BEAM, was used to
connect the shell nodes of the concrete deck slab and the beam element nodes of
the steel top flanges ensuring full interaction between the two, thus modeling the
presence of shear connectors.
The parametric study was based on the following assumptions:
(1) The reinforced concrete deck slab has complete composite action with the top
steel flange of the cells.
(2) All materials are elastic and homogeneous.
(3) Outer web-slope, curbs, and railing are ignored.
(4) The concrete deck slab is considered uncracked.
4.4 VALIDATION OF ANSYS RESULTS WITH PUBLISHED RESULTS IN
LITERATURE
The results from an experimental study on a bridge model [Sennah 1999] are used
to validate the modeling adopted in the parametric study. The details of the above
referred experiment are as below:
Details of Experimental Study [Sennah 1999]:
A composite concrete deck-steel three-cell bridge model was built and tested under
various static loading conditions. The concrete deck was 1 m wide, 50 mm thick,
2.6 in in length, and was supported by three steel cells.
Two diaphragms, 5mm thick, were placed at the extreme end sections. Three
access holes 53 x 53 mm were provided in each diaphragm, one in each cell. Five
cross-bracing and top-chord systems of rectangular cross section, 13 x 5 mm, were
installed at equal intervals from the support lines. To form the steel grid, the webs,
end diaphragms, cross bracings, and top flanges were first clamped into position
53

and then welded to each other. The bottom flange plate was then clamped to the
steel grid and welded to the webs. Stud shear connectors were used with length of
31.8 mm, diameter of 9.5 mm, and spaced 125 mm, with two connectors per line.
Strips of styrofoam sheets, 50mm thick, were used for the concrete stay-in-place
form work between the cells and on the outside of the cells. Small cubes of
styrofoam were placed inside the cells to support the Styrofoam sheets. After
hardening of the concrete, a simpler mechanism was devised to separate the
styrofoam sheets from the bottom of the concrete deck. Two meshes of steel
reinforcement, 100 X 100 X 3.2 mm, were placed over the formwork, followed by
placing the concrete deck slab. The concrete in the deck slab was designed for a
seven-day compressive strength of 41 MPa. All the steel plates in the bridge model
cross section had a modulus of elasticity of 200 GPa. The bridge model was
supported at its ends by an adjustable point support system under each web. Load
cells were installed at the support points to measure the reactions. Strain gauges
and dial gauges were installed on the surface of the bottom flange under each web
at the midspan section. A tie down system was used over each support to prevent
any possible torsional uplift.
The bridge model was tested under the following elastic conditions: two
concentrated loads over each cell at midspan and four concentrated loads over the
webs at midspan. The model was then tested under free-vibration conditions. It
was finally loaded to collapse (Sennah 1998). The bridge model was subjected to
two concentrated loads over the outer cell.
The above bridge was modeled using ANSYS for validation purpose and the
comparison of results has been shown in the table 4.1.
TABLE 4.1 Comparisons of Experimental Study and ANSYS Modeling
Results obtained from Location
W1 Location
W2 Location
W3 Location
W4
Deflection at mid span(mm)
Test 2.75 3.1 3,5 3.95
ANSYS 2.95 3.17 3.45 1 3.77
54

7.1 7. 1‘.
T SSG f7: 2 50- -
• •
ir; .:'del ".f-: %CC! :;'•
1 ;F..= - t -n
T T
• 7 5r:
'
Fig. 4.2 Cross Sectional details of model
Table 4.1 shows a comparison between the experimental and ANSYS results for
the deflection and the reaction distribution under eccentric two concentrated loading applied to the model at the midspan section over locations WI, W2, W3 and W4, shown in Fig. 4.2. Reasonable agreement can be observed between the theoretical and experimental results.
4.5 PARAMETRIC STUDY: -
The parameters considered are: number of cells, number of lanes, span length and cross bracing. However a sensitivity study was first undertaken to determine the different factors that may influence the lateral load distribution. Table 4.2 shows
the results of this sensitivity study. The sensitivity study revealed that changing concrete deck slab thickness or bottom flange thickness has an insignificant effect on both moment and shear distribution. This was also confirmed for moment
distribution elsewhere (Sennah 1999).
55

TABLE 4.2 Sensitivity study
Thickness
of deck
(t4 in mm)
Thickness
of bottom
flange (t3 in
mm)
ME* SDF
Outer
girder
intermediate
girder
Outer
girder
Intermediate
girder
225 12 0.216 0.284 0.148 0.352
250 10 0.218 0.282 0.150 0.350
275 10 0.216 0.284 0.149 0.351
300 8 0.217 0183 0.151 0.349
Therefore, the concrete deck slab thickness is taken 250 mm as a minimum
requirement. It should be noted that the effect of torsional to-flexural rigidity is
implied in studying the effect of number of cells. When changing the number of
cells for a particular bridge width, the thicknesses of the top flanges and the webs
were altered in such a way so as to maintain the same shear stiffness and overall
flexural stiffness of the cross section In , practice, X-type bracings as well as top
chords (lateral ties to the steel top flanges) are made from single or back-to-back
angles. Therefore, the parametric study is done with a span-to-depth ratio of 25
with X-bracings and top-chords having a 100 X 100 mm rectangular cross section.
4.6 BRIDGE PROTOTYPES CONSIDERED FOR PARAMETRIC STUDY:-
For this study, 24 simply supported single-span bridges of different configurations
were used. The basic cross-sectional configurations for the bridges studied are
presented in Table4.3. The symbols used in the first column in Table 4.3 represent
designations of the bridge types considered: 1 stands for lane, c stands for cell, and
the number at the end of the designation represents the span length in meters. For
example, 21-3c-20 denotes a simply supported bridge of two-lane, three-cell and of
20 m span. The cross sectional symbols used in Table 4.3 are shown in Fig. 4.3.
The numbers of lanes were taken as two and four. Number of cells ranged from I
56
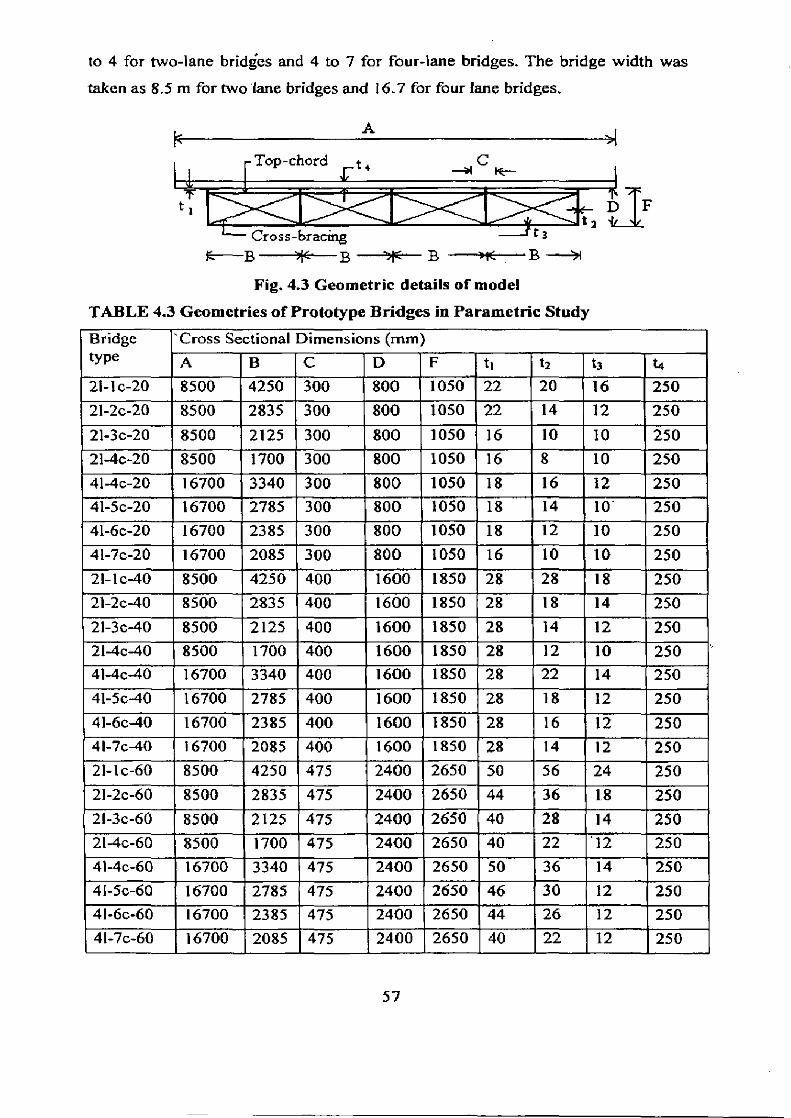
Top-chord t 4 C K-
t 3 B >/: B
t 2
A
Cross-bracing )1c B
to 4 for two-lane bridges and 4 to 7 for four-lane bridges. The bridge width was taken as 8.5 m for two lane bridges and 163 for four lane bridges.
Fig. 4.3 Geometric details of model
TABLE 4 3 Geometries of Prototype Bridges in Parametric Study Bridge 'Cross Sectional Dimensions (mm) type A B C D F t1 t2 t3 t4 21-1c-20 8500 4250 300 800 1050 22 20 16 250 21-2c-20 8500 2835 300 800 1050 22 14 12 250 21-3c-20 8500 2125 300 800 1050 16 10 10 250 21-4c-20 8500 1700 300 800 1050 16 8 10 250 41-4c-20 16700 3340 300 800 1050 18 16 12 250 41-5c-20 16700 2785 300 800 1050 18 14 10 250 41-6c-20 16700 2385 300 800 1050 18 12 10 250 41-7c-20 16700 2085 300 800 1050 16 10 10 250 21- 1 c-40 8500 4250 400 1600 1850 28 28 18 250 21-2c-40 8500 2835 400 1600 1850 28 18 14 250 21-3c-40 8500 2125 400 1600 1850 28 14 12 250 2I-4c-40 8500 1700 400 1600 1850 28 12 10 250 41-4c-40 16700 3340 400 1600 1850 28 22 14 250 41-5c-40 16700 2785 400 1600 1850 28 18 12 250 41-6c-40 16700 2385 400 1600 1850 28 16 12 250 4I-7c-40 I6700 2085 400 1600 1850 28 14 12 250 21-1c-60 8500 4250 475 2400 2650 50 56 24 250 21-2c-60 8500 2835 475 2400 2650 44 36 1. 8 250 21-3c-60 8500 2125 475 2400 2650 40 28 14 250 2I-4c-60 8500 1700 475 2400 2650 40 22 '12 250 41 -4c-60 16700 3340 475 2400 2650 50 36 14 250 41-5c-60 16700 2785 475 2400 2650 46 30 12 250 41-6c-60 16700 2385 475 2400 2650 44 26 12 250 41-7c-60 16700 2085 475 2400 2650 40 22 12 250
57

The ranges of the parameters considered in this study were based on an extensive
survey of actual designed composite box girder bridges (Heins] 978). The moduli
of elasticity of concrete and steel were taken as 27 and 200 GPa, respectively.
Poisson's ratio was assumed as 0.2 for concrete and 0.3 for steel. End diaphragms
were provided at the supports with minimum thickness and the cross bracings were
provided at some interval along the span. The material for the end diaphragms and
the cross bracings were taken to be the same as those for the webs.
The data generated from the study using ANSYS is used to deduce moment as well
as shear distribution factors for different loading conditions to aid in the design of
such bridges.
4.7 LOADING PLACEMENTS
4.7.1 Longitudinal Placing
1RC live loads as well as bridge dead loads were considered. These loads were first
applied on a simply supported girder, with a span equal to that of the bridge
prototype, to determine which case produced maximum moment at midspan or the
maximum shear force at the support. As an illustration Figure 4.4 ( a& b) show the
placement of 7OR wheeled loading for a 20m span bridge. It was found that the
critical moment and shear was noticed for Class 70R wheeled vehicle loading,
therefore, parametric study was done by placing Class 70R wheeled vehicle
loading. Subsequently three loading cases were considered for each bridge
prototype, central and eccentric 1RC Class 7OR loading, and the bridge dead load.
58
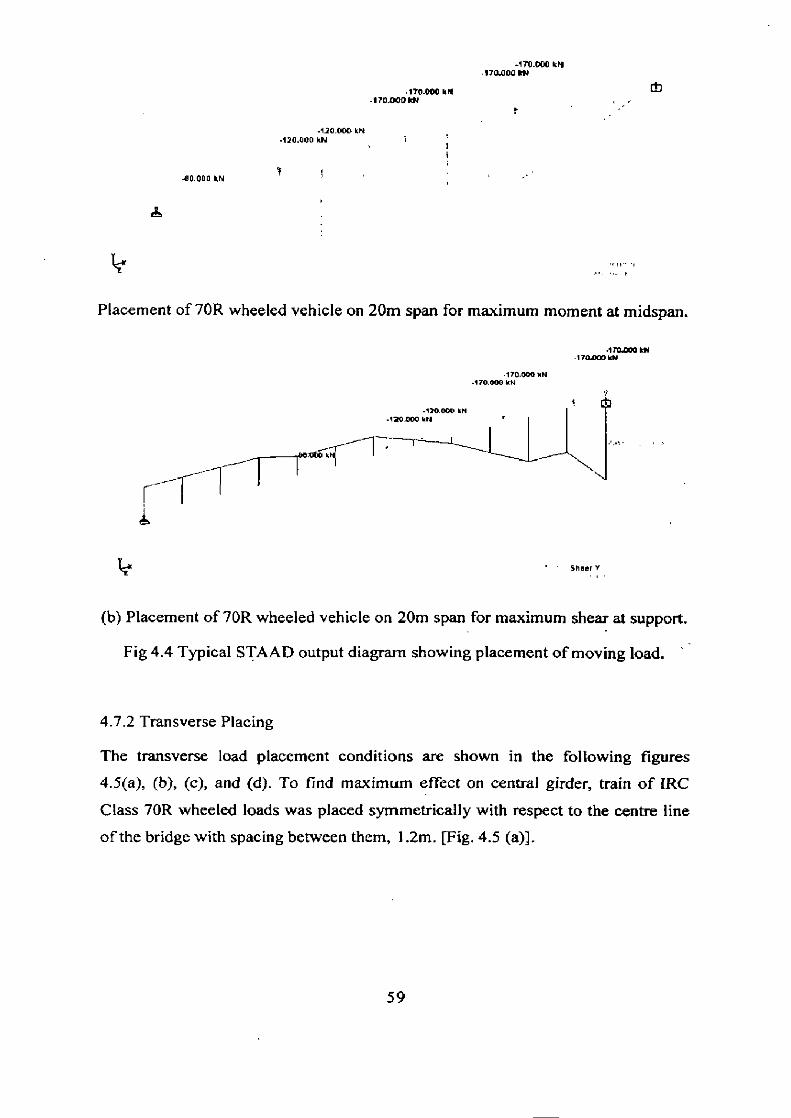
470.000 WI 170.000 kW
.170.000 1.11 -170.000M
-120.000 mg -120.000 kN
40000 kN
Placement of 70R wheeled vehicle on 20m span for maximum moment at midspan.
470.000 MN •170.coo MN
.170.000 MN 470000 kN
' Sheer Y
(b) Placement of 70R wheeled vehicle on 20m span for maximum shear at support.
Fig 4.4 Typical STAAD output diagram showing placement of moving load.
4.7.2 Transverse Placing
The transverse load placement conditions are shown in the following figures 4.5(a), (b), (c), and (d). To find maximum effect on central girder, train of [RC Class 70R wheeled loads was placed symmetrically with respect to the centre line of the bridge with spacing between them, I .2m. [Fig. 4.5 (a)].
59
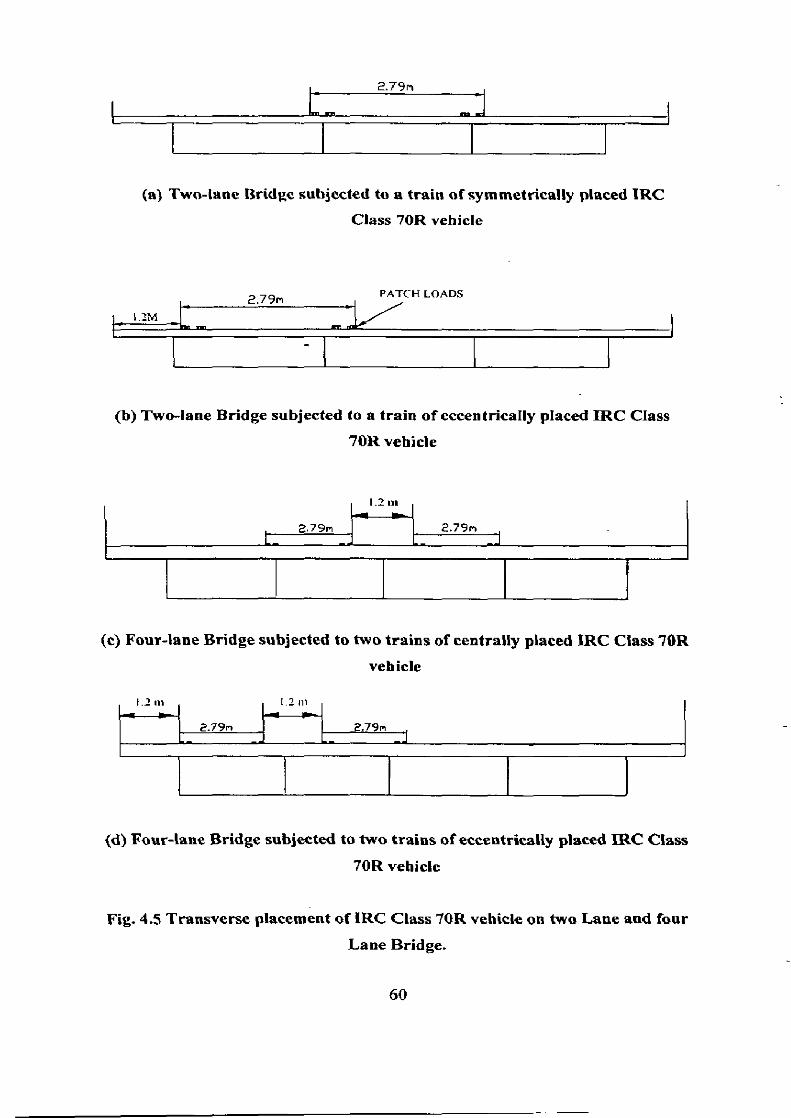
L 2.79n 2.79n
2.79n
(a) Two-lane Bridge subjected to a train of symmetrically placed IRC Class 70R vehicle
2.79n PATCH LOADS
1.2M
(b) Two-lane Bridge subjected to a train of eccentrically placed IRC Class
70R vehicle
1.2 1111
(c) Four-lane Bridge subjected to two trains of centrally placed FRC Class 7OR
vehicle
1.2 In 1.2 in
•
2.79n 2.79m
(d) Four-lane Bridge subjected to two trains of eccentrically placed me Class
70R vehicle
Fig. 4.5 Transverse placement of IRC Class 70R vehicle on two Lane and four
Lane Bridge.
60
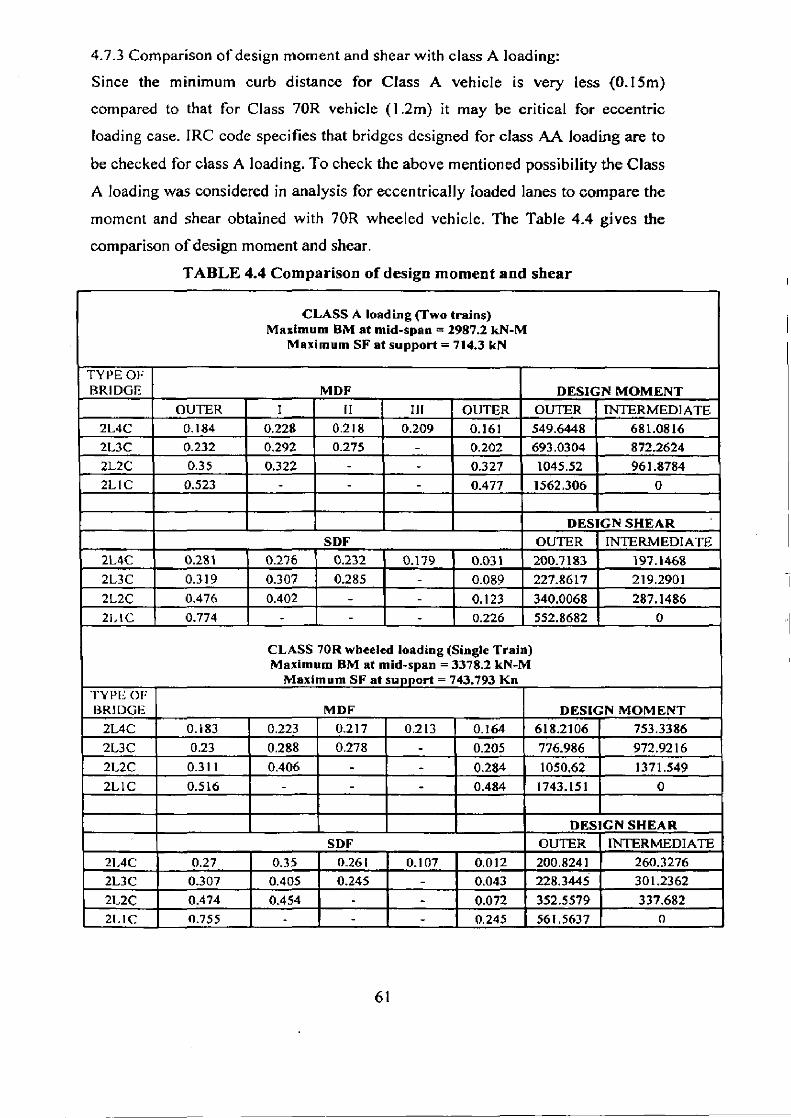
4.7.3 Comparison of design moment and shear with class A loading:
Since the minimum curb distance for Class A vehicle is very less (0.I5m)
compared to that for Class 70R vehicle (1.2m) it may be critical for eccentric
loading case. IRC code specifies that bridges designed for class AA loading are to
be checked for class A loading. To check the above mentioned possibility the Class
A loading was considered in analysis for eccentrically loaded lanes to compare the
moment and shear obtained with 70R wheeled vehicle. The Table 4.4 gives the
comparison of design moment and shear.
TABLE 4.4 Comparison of design moment and shear
CLASS A loading (Two trains) Maximum BM at mid-span = 2987.2 kN-M
Maximum SF at support = 714.3 kN
TYPE OF BRIDGE MDF DESIGN MOMENT
OUTER I II 111 OUTER OUTER INTERMEDIATE 2L4C 0.184 0.228 0.218 0.209 0.161 549.6448 681.0816 2L3C 0.232 0.292 0.275 - 0.202 693.0304 872.2624 2L2C 0.35 0.322 - 0327 1045.52 961.8784 2LIC 0.523 - - 0.477 1562.306 0
DESIGN SHEAR SDF OUTER INTERMEDIATE
2L4C 0.281 0.276 0.232 0.179 0.031 200.7183 197.1468 2L3C 0.319 0.307 0.285 - 0.089 227.8617 219.2901 2L2C 0.476 0.402 - - 0.123 340.0068 287.1486 21, 1 C 0.774 - - - 0.226 552.8682 0
CLASS 7011 wheeled loading (Single Train) Maximum BM at mid-span = 3378.2 kN-M
Maximum SF at support = 743.793 Kn TYPE OF BRIDGE MDF DESIGN MOMENT
2L4C O. i 83 0.223 0.217 0.213 0.164 618.2106 753.3386
2L3C 0.23 0.288 0.278 - 0.205 776.986 972.9216
2L2C 0.311 0.406 - - 0.284 1050.62 1371.549
2LIC 0.516 - - - 0.484 1743.151 0
L DESIGN SHEAR SDF OUTER INTERMEDIATE
2L4C 0.27 0.35 0.261 01 07 0.012 200.8241 260.3276 2L3C 0.307 0.405 0.245 - 0.043 228.3445 301.2362
2L2C 0.474 0.454 - 0.072 352.5579 337.682 21.IC 0.755 - - 0.245 561.5637 0
61

It can he seen that (Table 4.4) 70 R wheeled vehicle governs the design for the
bridge prototypes considered in this study.
4,7.4 Placement of load on ANSYS model: -
The live load was considered as static patch loads in the analysis. It requires
conversion of patch load into nodal load since for an ANSYS meshed model deck
patch load cannot be given at any random location. To calculate it manually it
takes great efforts since the meshed deck of model contains number of nodes
ranging from 775 for 21-1c-20 to 10500 for 4I-7c-60 model of bridge. So a program
(CPP) (Appendix-I) has been written to convert this patch at any random location
in to corresponding nodal loads. Mesh input for this program is given in the form
of node and element listing obtained from ANSYS software.
The load was placed on the ANSYS models by using the FEM principles. The
point loads were distributed on different nodes of the elements of concrete deck of
bridge model with the help of shape functions.
According to the theory of finite element analysis [Cook 2002], shape functions for
the four nodded element can be calculated as:
y a a
Fig. 4.6 Four-node bilinear element two dimensions. Imagine that a dependent variable a> = tb(x,y)is to be interpolated from four
nodal cD, at corners of a rectangle (Fig. 4.6) Here CD has the form
(13= at + a2x a3y a4xy (43)
62

Shape functions are products of the N, of Lagrange's formula, We argue as
follows.
In Fig 4.6, one can linearly interpolate CD along the left edge between nodal values
431 and cl)4 and along the right edge between nodal values 02 and 03. Thus, in
Eqs. 4.4, y replaces X and n = 2 Calling the edge values <1314 and 4:023 , we
have Shape Functions for c1 Elements
b—y 0 -F b+Y 04 4 = 21) 1 26 and
b—y b+y A W23 = 02 -F. W3 2b 2b
Next we linearly interpolate in the x direction between 014 and 0
(4.4)
, a X + x 023 = 014 ± W 2a 2a
Substitution of Eq. 4.4 into Eq. 4.5 yields 0 = INA, where
N = (a — x)(b — y) 4ab
N2 + xXb — y) — 4ab
(4.5)
(4.6)
+ xXb + y) N3 = 4ab
N4 = — x)(b + y) 4ab
One can easily check that each N, = 1 at the coordinates of node i, is zero at other nodes, and that N, + N2 + N3 + N4 = 1 .
The clement associated with Eqs. 4.6 is called "bilinear," as each of its shape
functions is a product of two linear polynomials. Similarly, a nine-node element
(nodes at corners, midsides, and the center) is called "biquadratic," a 16-node
63

element in which four of the nodes are internal is called "bicubic," and so on. Shape functions for all these elements are products of one-dimensional Lagrange
interpolation shape functions. These elements, and analogous elements in three dimensions, are called Lagrange elements. The stresses obtained from ANSYS software were integrated to obtain the moment carried by individual girders.
4.8 RESULTS: -
The analysis of various box girder bridge prototypes was done using ANSYS software package. The stresses obtained from ANSYS software were integrated to
obtain the moment carried by individual girders. The effects of different parameters such as cross-bracings, number of cells, number of lanes and span lengths were studied. Analysis was done for all IRC load cases i.e. Class AA tracked and wheeled, Class 70R tracked and wheeled and Class A vehicle. It was found that the governing case for two lane and four lane bridges for all spans considered in this study is IRC Class 70R wheeled and thus the parameters discussed in this section are with regards to 1RC Class 70R loading.
4.8.1 DEFLECTION AND STRESS CONTOURS:-
Figures 4.7(a&b) show deflection patterns for dead and live load (centrally loaded lanes) respectively. Transverse distribution of deflection can be observed from these two figures. In case of dead load deflection for outer girder is more while for live load intermediate girder will deflect more (comparatively). This effect will get neutralized for combination of dead and live load.
Figures 4.7(c & d) show deflection pattern for live load (eccentrically loaded lanes). Figure 4.7(c) shows isometric view while fig. 4.7(d) show front view of deflected bridge. Both figures show there is some uplifting of unloaded side of deck due to eccentric placement of IRC Class 70R train. In figure 4.7(d) transverse deflection distribution can be closely observed, which assert that deflection will go on reducing from loaded outer girder to unloaded outer girder.
64

-t3 . 4 e55 -10,513 -25.77 -257 0
; :006 13:O :
1:0DA.: SC
STEP•1 VIE al
uri psysen LC .2:3. 715 .S.!Ut =-23.
ANSYS
ANSYS DtL Sti17:CK.
27Mt=1 C
TEW.•1 1;70)
F '113.D
=:111 •-16.
717; 1 2106 1.3: 08: !--0
55; -14.353
-S. 42 -7.176
-3.538 0
Fig. 4.7(a) Deflection contour plot of the idealized bridge for Dead Load
Fig. 4.7(b) Deflection contour plot of 21-2c-20 bridge for one train of IRC
Class 70k (Centrally Loaded lanes).
65

- 754 . IC172
S01:27:Ch
SUE .1 1.17..£=1 IT? (A79) P.S7S4
•17.19S S12: +-17. 712 9:1; 1C -172
ANSYS :UN 9 :DOi
01
ANSYSI :CN 1u:it
501 TN
STE P •1 FITE • :
cc ie.t1 143f.5.0
--11. '12 16;72
-7/76Z
'Cl
Fig. 4.7(e) Deflection contour plot of 21-2c-20 bridge for Eccentrically Loaded
Lanes
Fig. 4.7(d) Deflection contour plot of 21-2c-20 bridge cross section for
Eccentrically Loaded Lanes (front view)
66

4.8.2 MOMENT AND SHEAR DISTRIBUTION FACTORS:-
The results of extensive parametric study on 24 bridge prototypes (listed in Table
4.3) are presented in Table 4.5 to 4.11.
Table 4.5 to 4.7 list the distribution factors for moment due to dead load and live
load (centrally loaded lanes and eccentrically loaded lanes) respectively.
Table 4.8 to 4.11 list the distribution factors for shear due to dead load and live
load (centrally loaded lanes and eccentrically loaded lanes) respectively.
Table 4.5 Moment distribution factors (Dead Load)
Bridge type
Number of cross bracing s
Outer Girder Interior Girders
Outer Girder
I 11 III IV V VI
2I1c 20 5 0.50 - - - - 0.50 21 1c40 7 0.50 - - - - _ 0.50 21 1c 60 11 0.50 - - - - - - 0.50
21 2c 20 5 0.294 0.412 - - - - 0.294 21 2c 40 7 0.304 0.392 - - - - - 0.304 21 2c 60 11 0.310 0.379 - - - - - 0.310
21 3c 20 5 0.214 0.286 0.286 - . - - 0.214 21 3c 40 7 0.224 0.276 0.276 - - - - 0.224 21 3c 60 11 0.251 0.249 0.249 - - - - 0.251
214c 20 5 0.170 0.221 0.220 0.221 - - - 0.170 21 4c 40 7 0.179 0.214 0.214 0.214 - - - 0.179 21 4c 60 11 0.201 0.199 0.199 0.199 - - - 0.201
41 4c 20 5 0.330 0.450 0.440 0.450 - - - 0.330 41 4c 40 7 0.342 0.440 0.436 0.440 - - - 0.342 41 4c 60 11 0.352 0.432 0.430 0.432 - - - 0.352
41 5c 20 5 0.274 0.368 0.358 0.358 0.368 - - 0.274 41 5c 40 7 0.286 0.358 0.356 0.356 0.358 - - 0.286 41 5c 60 11 0.294 0.354 0.318 0.318 0.354 - - 0.294
41 6c 20 5 0.236 0.310 0.304 0.300 0.304 0.310 - 0.236 416c 40 7 0.246 0.304 0.300 0.300 0.300 0.304 - 0.246 416c 60 11 0.254 0.300 0.298 0.298 0.298 0.300 - 0.254
41 7c 20 5 0.208 0.270 0.264 0.260 0.260 0.264 0.270 0.208 41 7c 40 7 0.218 0.262 0.260 0.260 0.260 0.260 0.262 0.218 41 7c 60 11 0.224 0.260 0.258 0.258 0.258 0.258 0.260 0.224
67

Table 4.6 Moment distribution factors (Central Lane Loadings)
Bridge type
Number of cross bracings
Outer Girder Interior Girders
Outer Girder - I II III IV V VI
21 1c 20 5 0.50 - - - 0.50 211040 7 0.50 - - - 0.50 21 1c 60 11 0.50 - - - - 0.50
21 2c 20 5 0.298 0.404 - - - 0.298 21 2c 40 7 0.310 0.380 - - - 0.310 21 2c 60 11 0.341 0.318 - - - 0.341
21 3c 20 5 0.218 0.282 0.282 - - 0.218 21 3c 40 7 0.231 0.269 0.269 - - - 0.231 21 3c 60 11 0.238 0.262 0.262 - - 0.238
214c 20 5 0.175 0.218 0.215 0.218 - 0.175 21 4c 40 7 0.190 0.209 0203 0.209 - 0.190 214c 60 11 0.208 0.196 0.193 0.196 - - - 0.208
41 4c 20 5 0.316 0.452 0.464 0.452 - - 0.316 41 4c 40 7 0,352 0.432 0.430 0.432 - - - 0.352 41 4c 60 11 0.366 0.422 0.422 0.422 - - 0.366
41 5c 20 5 0.264 0.362 0.374 0.374 0.362 - - 0.264 41 5c 40 7 0.296 0.354 0.350 0.350 0.354 - - 0.296 41'5c 60 11 0.306 0.346 0.348 0.348 0.346 - 0.306
4I 6c 20 5 0.226 0.304 0.312 0.318 0.312 0.304 0.226 41 6c 40 7 0.250 0.300 0.298 0.302 0.298 0.300 - 0.250 41 6c 60 11 0.264 0.294 0.294 0.298 0.294 0.294 - 0.264
41 7c 20 5 0.198 0.262 0.268 0.274 0.274 0.268 0.262 0.198 41 7c 4D 7 0.220 0.262 0.258 0.260 0.260 0.258 0,262 0.220 41 7c 60 11 0.230 0.256 0.256 0.258 0.258 0.256 0.256 0.230'
68
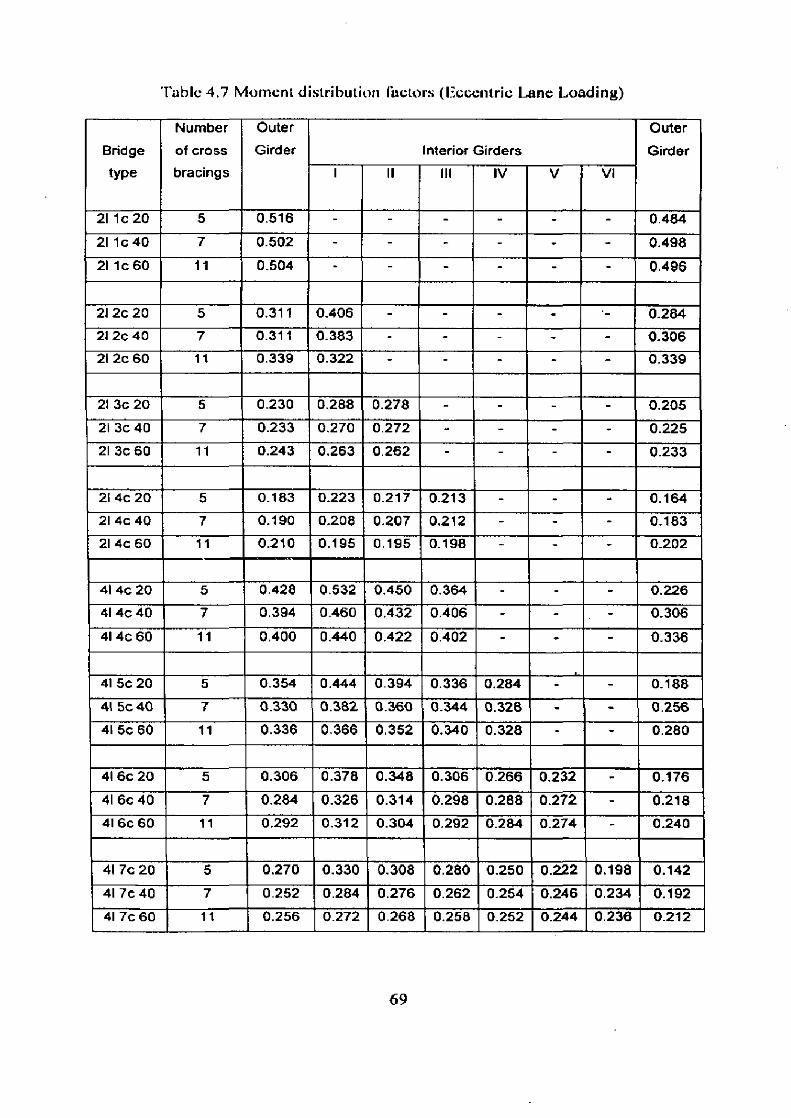
Table 4.7 Moment distribution ruetors (Eccentric Lane Loading)
Bridge type
Number of cross bracings
Outer Girder Interior Girders
Outer Girder
I II III IV V VI
21 1c 20 5 0.516 - - - - - - 0.484 21 1c 40 7 0.502 - - - - .. - 0.498 21 1c 60 11 0.504 - - - - - - 0.498
21 2c 20 5 0.311 0.406 - - - - - 0.284 21 2c 40 7 0.311 0.383 - - - - - 0.306 21 2c 60 11 0.339 0.322 - - - - - 0.339
21 3c 20 5 0.230 0.288 0.278 - - - - 0.205 21 3c 40 7 0.233 0.270 0.272 - - - 0.225 21 3c 60 11 0.243 0.263 0.262 - - - - 0.233
21 4c 20 5 0.183 0.223 0.217 0.213 - - - 0.164 21 4c 40 7 0.190 0.208 0.207 0.212 - - - 0.183 21 4c 60 11 0.210 0.195 0.195 0.198 - 0.202
41 4c 20 5 0.428 0.532 0.450 0.364 - - - 0.226 41 4c 40 7 0.394 0.460 0,432 0.406 - - - 0.306 41 4c 60 11 0.400 0.440 0.422 0.402 - - - 0.336
41 5c 20 5 0.354 0.444 0.394 0.336 0.284 - - 0.188 41 5c 40 7 0.330 0.382 0.360 0.344 0.328 - - 0.256 41 5c 60 11 0.336 0.366 0.352 0.340 0.328 - - 0.280
41 6c 20 5 0.306 0.378 0.348 0.306 0.266 0.232 - 0.176 41 6c 40 7 0.284 0.326 0.314 0.298 0.288 0.272 - 0.218 416c 60 11 0.292 0.312 0.304 0.292 0.284 0.274 - 0.240
41 7c 20 5 0.270 0.330 0.308 0.280 0.250 0.222 0.198 0.142 41 7c 40 7 0.252 0.284 0.276 0.262 0.254 0.246 0.234 0.192 41 7c 60 11 0.256 0272 0.268 0.258 0.252 0.244 0.236 0.212
69
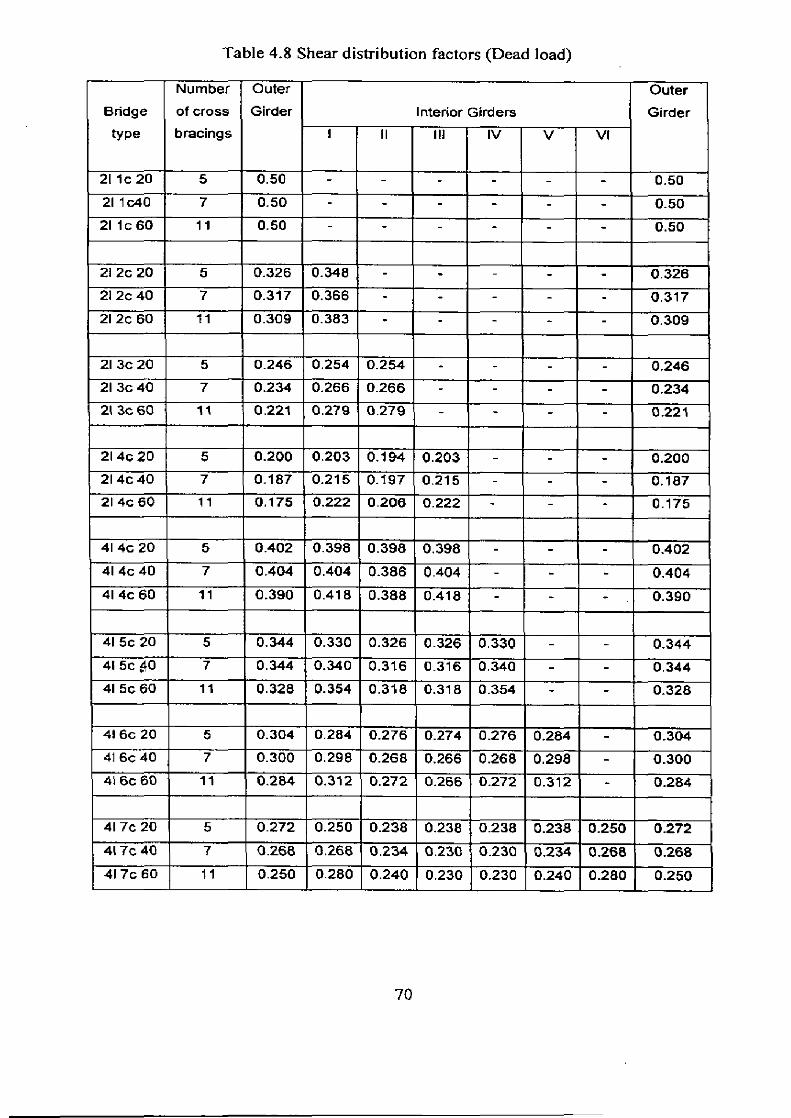
Table 4.8 Shear distribution factors (Dead load)
Bridge type
Number of cross bracings
Outer Girder Interior Girders
Outer Girder
I II III IV V VI
2I1c 20 5 0.50 - 0.50 211c40 7 0.50 - - - 0.50 21 1c 60 11 0.50 - 0.50
21 2c 20 5 0.326 0.348 - - - - 0.326 21 2c 40 7 0.317 0.366 - - - 0.317 21 2c 60 11 0.309 0.383 - - - 0.309
21 3c 20 5 0.246 0.254 0.254 - - - - 0.246 21 3c 40 7 0.234 0.266 0.266 - - - - 0.234 21 3c 60 11 0.221 0.279 0.279 - 0.221
21 4c 20 5 0.200 0.203 0.194 0.203 - - - 0.200 2I 4c 40 7 0.187 0.215 0.197 0.215 - - - 0.187 21 4c 60 11 0.175 0.222 0.206 0.222 - - 0.175
41 4c 20 5 0.402 0.398 0.398 0.398 - - 0.402 41 4c 40 7 0.404 0.404 0.386 0.404 - 0.404 41 4c 60 11 0.390 0.418 0.388 0.418 - - 0.390
41 5c 20 5 0.344 0.330 0.326 0.326 0.330 - 0.344 41 5c 4 t 0 7 0.344 0.340 0.316 0.316 0.340 - 0.344 41 5c 60 11 0.328 0.354 0.318 0.318 0.354 - 0.328
41 6c 20 5 0.304 0.284 0.276 0.274 0.276 0.284 - 0.304 41 6c 40 7 0.300 0.298 0.268 0.266 0.268 0.298 - 0.300 41 6c 60 11 0.284 0.312 0.272 0.266 0.272 0.312 - 0.284
41 7c 20 5 0.272 0.250 0.238 0.238 0.238 0.238 0.250 0.272 417c 40 7 0268 0.268 0234 0.230 0.230 0.234 0.268 0.268 417c 60 11 0.250 0.280 0.240 0.230 0.230 0.240 0.280 0.250
70

4.8.2.1 Comparison of Distribution Factors for SF (Central lane loading) &
SF (Eccentric lane loading)
Table 4.9 Shear distribution factors (central lane loading)
Bridge type
Outer Girder Interior Girders
Outer Girder
I 11 III IV V VI
21 1c 20 0.500 - - - - 0.500
21 2c 20 0240 0.520 - - - - - 0.240
21 3c 20 0.150 0.350 0.350 - .. - 0.150
21 4c 20 0.119 Q.234 0.295 0.234 - - 0.119
41 4c 20 0.160 0.506 0.672 0.506 - - 0.160
41 5c 20 0.132 0.344 0.524 0.524 0.344 - - 0.132
41 6c 20 0.108 0.218 r 0.444 0.460 0.444 0.218 - 0.108 417c 20 0.100 0.158 0.332 0.410 0.410 0.332 0.158 0.100
Table 4.10 Shear distribution factors (eccentric lane loading)
Bridge
type
Outer Girder Interior Girders
Outer
Girder
1 11 Ill IV V VI
21 1c 20 0.755 - - 0.245
21 2c 20 0.474 0.454 - - - - - 0.072
21 3c 20 0.307 0.405 0.245 - - - - 0.043
21 4c 20 0.270 0.350 0.261 0.107 - - - 0.012
41 4c 20 0.554 0.676 0.496 0.156 - - - 0.120
41 5c 20 0.446 0.596 0.556 0.272 0.108 - - 0.002 416c 20 0.450 0.544 0.402 0.372 0.150 0.088 - -0.008 41 7c 20 0.336 0.428 0.442 0.402 0.224 0.104 0.074 -0.008
Comparing the results obtained for distribution factors for shear from central lane
loading and eccentric lane loading, it can be concluded that for outer girder and
first intermediate girder the governing distribution factors are from eccentrically
loaded lanes; so henceforth results of eccentrically loaded lanes are used for further
calculations as these are found more critical.
71

Table 4.11 Shear distribution factors (Eccentric lane loading)
Bridge type
Number of cross bracings
Outer Girder Interior Girders
Outer Girder
I II
-
VI IV V VI
21 1c 20 5 0.755 - - - 0.245 21 1c 40 7 0.792 - 0.208 21 lc 60 11 0.783 - - 0.217
21 2c 20 5 0.474 0.454 - - - - - 0.072 21 2c 40 7 0.476 0.451 - - 0.073 21 2c 60 11 0.489 0,437 - - - - 0.075
21 3c 20 5 0.307 0,405 0.245 - - - - 0.043 21 3c 40 7 0.324 0.403 0.225 - - 0.048 21 3c 60 11 0.353 0.392 0.215 - - 0.080
21 4c 20 5 0.270 0.350 0.261 0.107 - - 0.012 21 4c 40 7 0.250 0.349 0.266 0.120 - 0.016 21 4c 60 11 0.287 0.320 0.230 0.136 - - 0.027
41 4c 20 5 0.554 0.676 0.496 0.156 - 0.120 41 4c 40 7 0.650 0.732 0.506 0.154 - - - -0.042 41 4c 60 11 0.680 0.668 0.462 0.198 - - - -0.008
41 5c 20 5 0.446 0.596 0.556 0.272 0.108 - - 0.002 41 5c 40 7 0.510 0.598 0.530 0.274 0.100 - - -0.010 41 5c 60 11 0.552 0.576 0.468 0.282 0.134 - - -0,014
41 6c 20 5 0.450 0.544 0.402 0.372 0.150 0.088 - -0.008 41 6c 40 7 0.434 0.526 0.454 0.360 0.156 0.084 - -0.016 41 6c 60 11 0.462 0.520 0.424 0.334 0.178 0.096 - -0.016
41 7c 20 5 0.336 0.428 0.442 0.402 0.224 0.104 0.074 -0.008 41 7c 40 7 0.390 0.452 0.398 0.376 0.230 0.110 0.066 -0.020 41 7c 60 11 0.396 0.462 0.388 0.350 0.230 0.124 0.068 -0.018
72

4.8.3 EFFECTS OF CROSS-BRACING SYSTEMS
The torsional stiffness of a box girder results from three components: the Saint-
Vcnant rigidity, the warping rigidity, and the distortional rigidity. Increasing the
flexibility of any of these components reduces the rigidity of the box girder.
Adding bracings between support lines is generally required for stability purposes
at the construction phase. Tables (4.12 & 4.13 ) show the effect of bracings on the
moment distribution between idealized girders for central lane loadings.
Table 4.12 Effect of cross bracings on moment distribution factors for central lane loading
Bridge type
Number of cross bracings between supports
Outer girder Interior Girders Outer
girder I 11 III IV V VI
21 3c 20 0 0.18 0.32 0.32 - - - - 0.18 21 3c 20 1 0.23 0.27 0.27 - - - - 0.23 21 3c 20 2 0.20 0.30 0.30 - - - - 0.20 21 3c 20 3 0.22 0.28 0.28 - - - - 0.22 21 3c 20 5 0.22 0.28 0.28 - - - - 0.22 41 7c 20 0 0.11 0.23 0.31 0.35 0.35 0.31 0.23 0.11 41 7c 20 1 0.20 0.28 0.26 0.26 0.26 0.26 0.28 0.20 4L 7c 20 2 0.14 0.25 029 0.32 0.32 0.28 025 0.14 417c 20 3 0.18 0.28 0.28 0.28 0.28 0.28 0.28 0.16 4I 7c 20 5 0.20 _ 0.26 0.27 0.27 0.27 0.27 0.28 0.20
Table 4.13 Effect of cross bracings on moment distribution factors for eccentric lane loading
Bridge type
Number of cross bracings between supports
Outer girder Interior Girders Outer
girder I II III IV V VI
21 3c 20 0 0.27 0.38 0.25 - - - - 0.10 21 3c 20 1 0.23 0.28 0.27 - - - - 0.22 21 3c 20 2 0.23 0.31 0.28 - - - 0.18 21 3c 20 3 0.23 0.28 0.28 - - - 0.21 213c 20 5 0.23 0.29 0.28 - - - - 0.20 41 7c 20 0 0.28 0.42 0.40 0.34 0.26 0.18 0.10 0.02 41 7c 20 1 0.26 0.32 0.29 0.27 0.26 0.24 0.22 0.12 41 7c 20 2 0.23 0.36 0.35 0.32 0.26 0.20 0.18 0.10 41 7c 20 3 0.24 0.34 0.32 0.28 0.26 0.23 0.20 0.12 41 7c 20 5 0.27 0.33 0.31 0.28 0.25 0.22 0.20 0.14
73

It can be observed that, in cases of bridges with cross bracings the bending moment
increases in the outer girder and decreases in the central girder, while in the case of bridges with eccentric lane loading (Table 4.13) the maximum moment carried by
the loaded outer girder is considerably reduced. As an example, when using five cross- bracing systems the bending moment increases up to a maximum of 81% in the outer girder and decreases by a maximum of 23% in the central girder for the bridge type 41-7c-20, while in the case of bridges with eccentric lane loading
(Table 4.13) the maximum moment carried by the loaded first intermediate girder
(in this case first intermediate girder is considered since minimum curb distance of
Class 70R vehicle is 1.2m and actual toad shared by first intermediate girder instead of outer girder) is considerably reduced by more than 21%.Thus adding cross bracings improves the ability of the cross section to transfer loads from one girder to the adjacent ones.
4.8.4 EFFECT OF SPAN LENGTH:-
From the results of parametric study it became evident that both bending moment and shear force distribution depends on span length of bridge. The figures 4.8(a to
d) show the effect of span length on moment and shear distribution for intermediate and outer girder for two lane and four lane bridges.
The figures shows that for central lane loading contribution of intermediate girder
decreases up to 7% & 9% while for outer girder it increases up to 9% & 19% for span 60m compared to 20m span for moment and shear respectively. For eccentric lane loading also this effect is same this shows as span length increases distribution of shear and moment will try to be even irrespective of location of girder i.e. outer or intermediate girder.
74
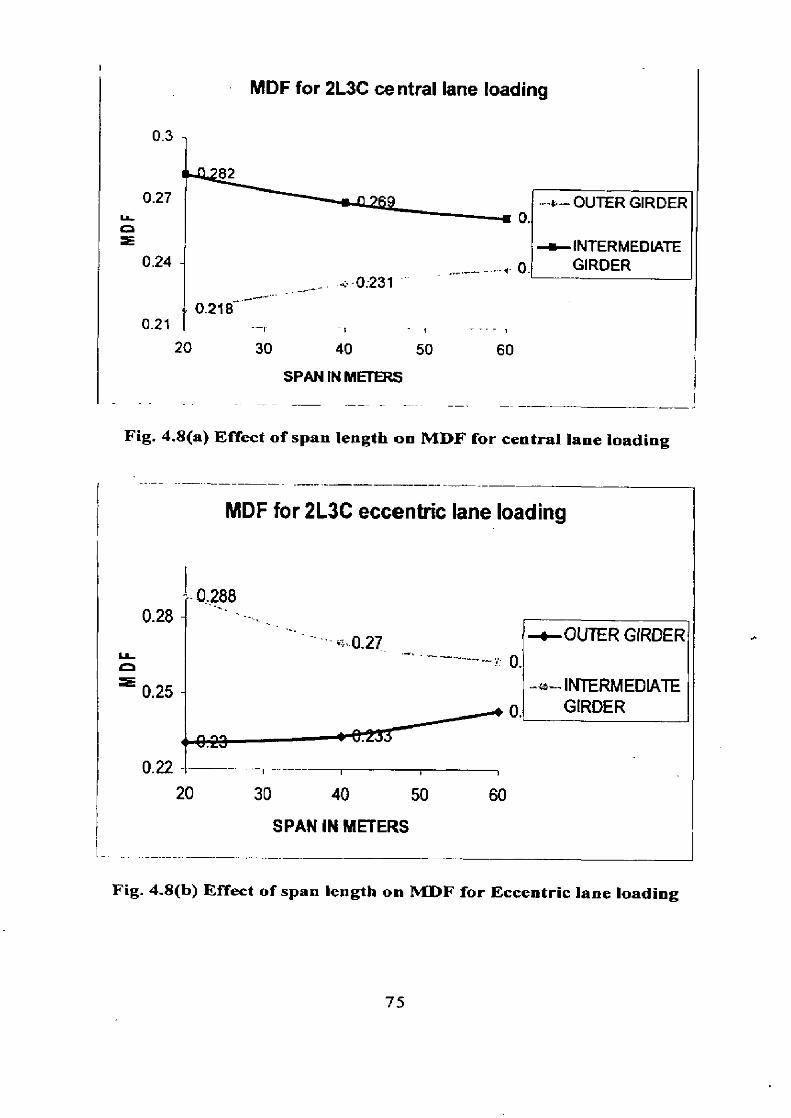
MDF for 2L3C central lane loading
-4.— OUTER GIRDER
—a— INTERMEDIATE GIRDER
0.218
20 30 40 50 60
SPAN IN METERS
0.3
0.27
a 0.24
0.21
Fig. 4.8(a) Effect of span length on min. for central lane loading
MDF for 2L3C eccentric lane loading
0.288
0.28
0.27
OUTER GIRDER
0.25
INTERMEDIATE GIRDER
0.22 20 30 40 50
60
SPAN IN METERS
Fig. 4.8(b) Effect of span length on MDF for Eccentric lane loading
75
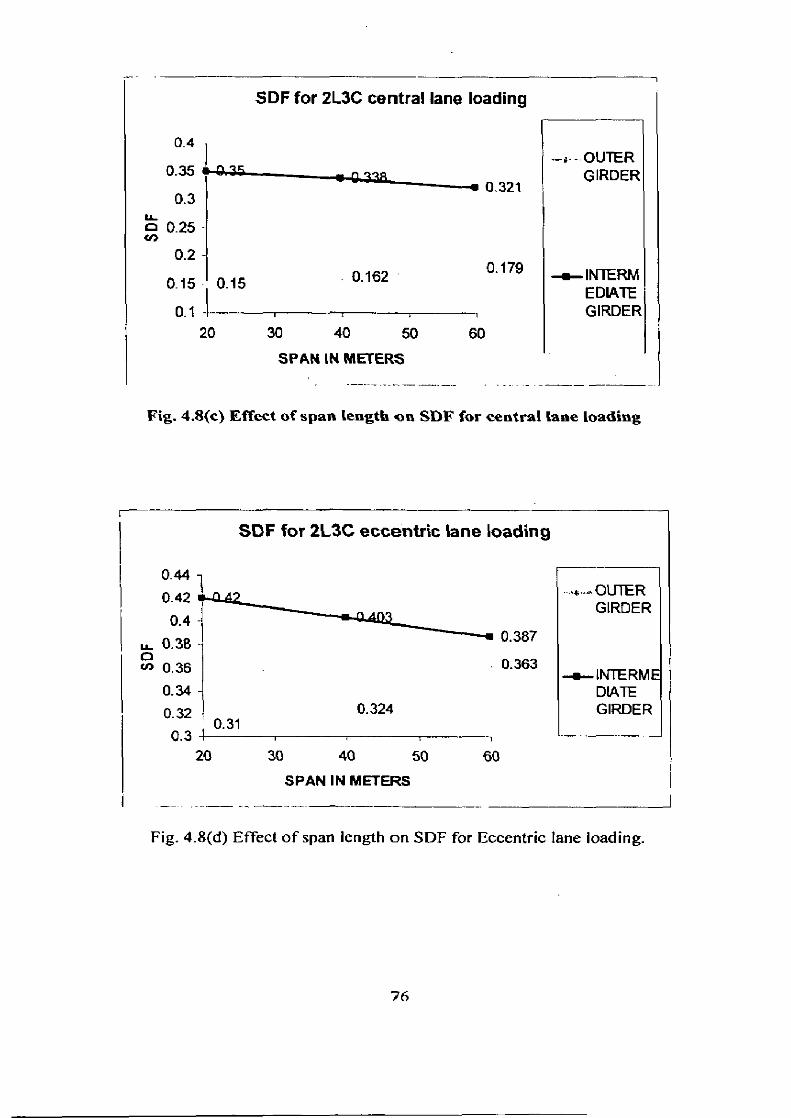
0.4
0.35
0.3 U— 0 0.25 4q
0.2
0.15 0.15
0.1
SDF for 2L3C central lane loading
0.321
0.179 0.162
SDF for 213C eccentric lane loading
u_ 0.38 -
co 0,36 0.34 0.32
0.31 0.3
20 30 40 50 60
SPAN IN METERS
--OUTER GIRDER
--e—INTERME DATE GIRDER
0.387
0.363
0.324
20 30 40 50 60
SPAN IN METERS
--a-- OUTER GIRDER
—0— INTERM EDIATE GIRDER
Fig. 4.8(c) Effect of span length on SDF for central lane loading
Fig. 4.8(d) Effect of span length on SDF for Eccentric lane loading.
76
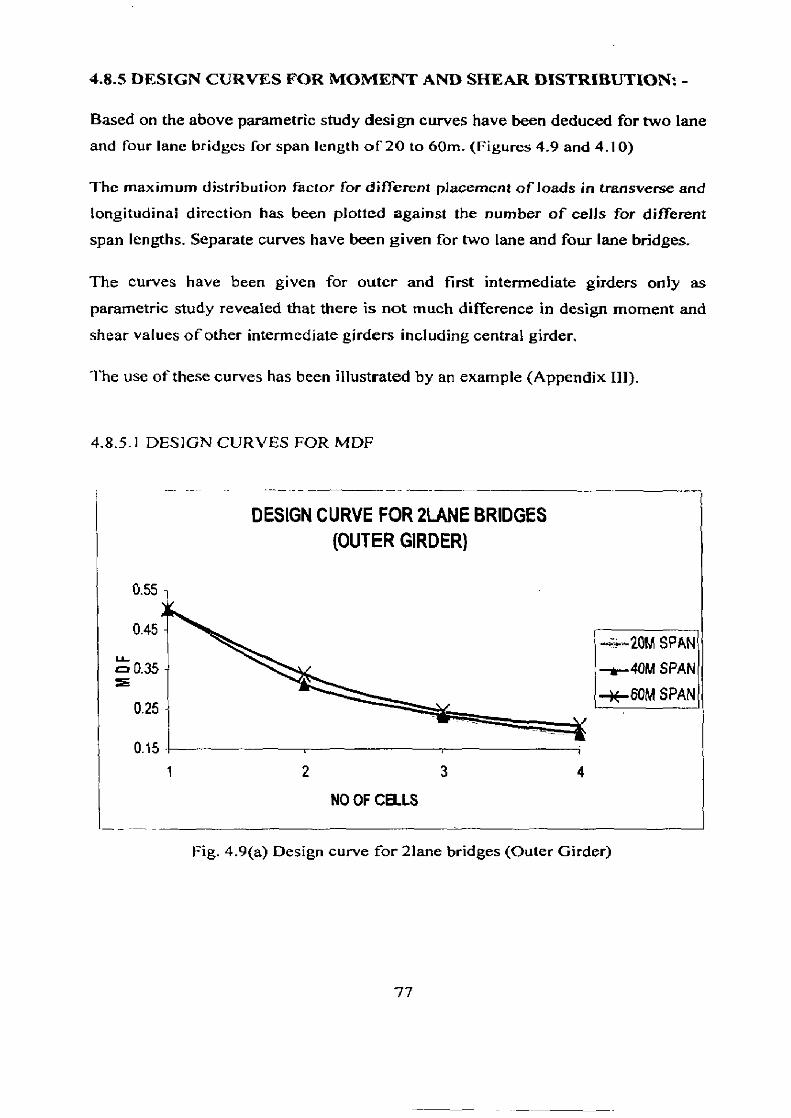
DESIGN CURVE FOR 2LANE BRIDGES (OUTER GIRDER)
0.55 1
0.45
0.35
0.25
0.15 1 2 3
—47-20M SPAN
—t-40M SPAN
—K-60M SPAN
4
NO OF CELLS
4.8.5 DESIGN CURVES FOR MOMENT AND SHEAR DISTRIBUTION: -
Based on the above parametric study design curves have been deduced for two lane
and four lane bridges for span length of 20 to 60m. (Figures 4.9 and 4.10)
The maximum distribution factor for different placement of loads in transverse and
longitudinal direction has been plotted against the number of cells for different
span lengths. Separate curves have been given for two lane and four lane bridges.
The curves have been given for outer and first intermediate girders only as
parametric study revealed that there is not much difference in design moment and
shear values of other intermediate girders including central girder.
The use of these curves has been illustrated by an example (Appendix III).
4.8.5.1 DESIGN CURVES FOR /VIDE
Fig. 4.9(a) Design curve for 2lane bridges (Outer Girder)
77

DESIGN CURVES FOR 4LANE BRIDGES (OUTER GIRDER}
0.45 1
—20M SPAN
—6-40M SPAN
—*-60M SPAN
0.25 4 5 6
NO OF CELLS
7
0.4
U- 0.35
0.3
DESIGN CURVE FOR 2LANE BRIDGES (INTERMEDIATE GIRDER)
0.45
0.35
0.25
- 20M SPAN —4-40M SPAN
—6-60M SPAN
0.15 2
3
4
NO OF CELLS
Fig. 4.9(b) Design curve for 2Iane bridges (Intermediate Girder)
Fig. 4.9(c) Design curve for 41ane bridges (Outer Girder)
78

20M SPAN -w-40M SPAN -7±1-60M SPAN
DESIGNCURVE FOR SOF OF 2LANE BRIDGES(OUTER GIRDER)
0.75
0.65
u- 0.55 CI)
0.45
0.35
0.25
-z-----20M SPAN -6-40M SPAN -*-60M SPAN
1
2 3 4
140 Of CELLS
DESIGN CURVE FOR 4LANE BRIDGES (INTERMEDIATE GIRDER)
5 6 7
NO Of CELLS
Fig. 4.9(d) Design curve for 4lane bridges (Intermediate Girder)
4.8.52 DESIGN CURVES FOR SEW
Fig. 4.10(a) Design curve for 2lane bridges (Outer Girder)
79

---- 20M SPAN-40M SPAN
--zs— 60M SPAN
4 5 6 NO OF CELLS
1-E 0.53 Co
0.43
0.33
0.63 2011/1 SPAN
—6-40M SPAN —)K-60M SPAN
7
DESIGN CURVE FOR SDF OF 4LANE BRIDGES (OUTER GIRDER)
DESIGN CURVE FOR SDF OF 2LANE BRIDGES (INTERMEDIATE GIRDER)
2 3 4 NO OF CELLS
Fig. 4.10(b) Design curve for 2 lane bridges (Intermediate Girder)
Fig. 4.10(c) Design curve for 4lane bridges (Outer Girder)
80
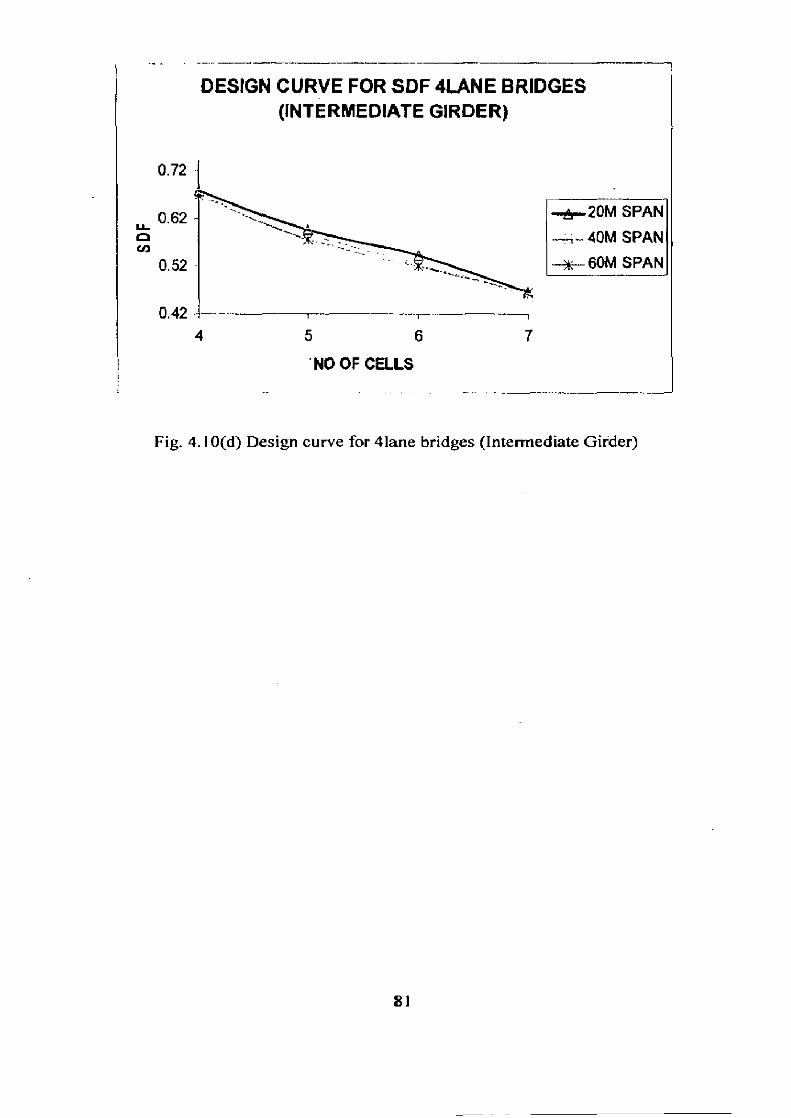
DESIGN CURVE FOR SDF 4LANE BRIDGES (INTERMEDIATE GIRDER)
0.72
4
5 6
7
NO OF CELLS
—6-20M SPAN
.---,-. 40M SPAN
---x-- 60M SPAN
Fig. 4.10(d) Design curve for 4lane bridges (Intermediate Girder)
81

CHAPTER 5
NONLINEAR ANALYSIS AND PARTIAL INTERACTION OF SHEAR CONNECTOR
5.1 Partial Interaction:- The design of structures for bridges is mainly concerned with provision and
support of horizontal load bearing surfaces. Except in long span bridges, these
floors or decks are made up of reinforced concrete, since no other material have
better combination of low cost, high strength and resistance to corrosion, abrasion
and fire.
In conventional composite construction these concrete slabs rest over steel beams
or box girders and supported by them. Under load these two components act
independently and a relative slip occurs at the interface if there is no connection
between them.
The established design methods for reinforced concrete and for structural steel give no help with respect to basic problem of connecting steel to the concrete. The force applied to this connection is mainly but not entirely the longitudinal shear. Since
these connections are region of severe and complex stresses defies accurate analysis and so methods of connection are developed empirically and verified by
tests.
It used to be customary in design the steel work to carry whole weight of concrete
slab and loading on it; but by about 1950 the development of "shear connectors"
had made it practicable to connect the slab to the beam, and so as to obtain the T-
Beam action. Concrete is stronger in compression than in tension and steel in
susceptible to buckling in compression. By composite action between the two, we
can utilize their respective advantages to the fullest extent. [Dennis Lam et-.al.,
ASCE (2005)1
Current composite steel and concrete bridges are designed using MI interaction
theory assuming there is no any relative displacement or slip at interface of
concrete and steel. But results obtained from small scale and full scale tests shown
that slip occurs even under very small loads. S tip occurs because mechanical shear
83

lel i •I '
connector has finite stiffness. Hence the connector must deform before they carry
any load and this is the case of partial interaction.
Since mechanical shear connectors in composite steel and concrete beams require
slip to transmit shear, most composite bridge beams are designed as full-interaction
because of the complexities of partial-interaction analysis techniques. However, in
the assessment of existing composite bridges this simplification may not be
warranted as it is often necessary to extract the greatest capacity and endurance
from the structure. This may only be achieved using partial-interaction theory
which truly reflects the behaviour of the structure.
5.2 Partial Interaction Focal Point Theory R. Seracino, D.J. Oehlers, lvt.F.Yeo developed a new concept [July 2000] of a
partial interaction focal point and extended the classic linear-elastic partial
interaction theory.
1*±CIS <ji I
strain
Fig. 5.1 Strain Distribution
84
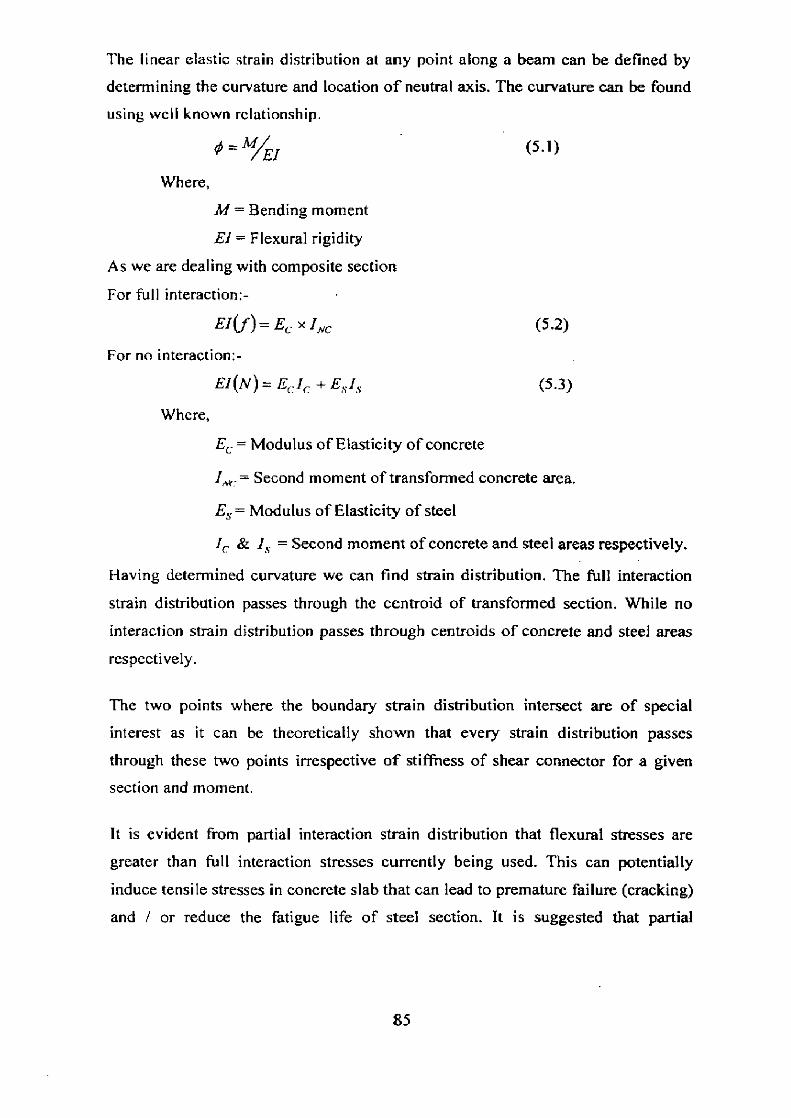
The linear elastic strain distribution at any point along a beam can be defined by determining the curvature and location of neutral axis. The curvature can be found using well known relationship.
° liff/E/ (5.1)
Where,
M= Bending moment
El= Flexural rigidity
As we are dealing with composite section
For full interaction:-
EI`f)=EC x INC (5.2)
For no interacti on:-
E/(N) = Ecic + Esls (5.3)
Where,
Ec = Modulus of Elasticity of concrete
I,,„.= Second moment of transformed concrete area.
Es= Modulus of Elasticity of steel
/c & I s = Second moment of concrete and steel areas respectively.
Having determined curvature we can find strain distribution. The full interaction
strain distribution passes through the centroid of transformed section. While no
interaction strain distribution passes through centroids of concrete and steel areas
respectively.
The two points where the boundary strain distribution intersect are of special
interest as it can be theoretically shown that every strain distribution passes
through these two points irrespective of stiffness of shear connector for a given section and moment.
It is evident from partial interaction strain distribution that flexural stresses are
greater than full interaction stresses currently being used. This can potentially
induce tensile stresses in concrete slab that can lead to premature failure (cracking)
and / or reduce the fatigue life of steel section. It is suggested that partial
85
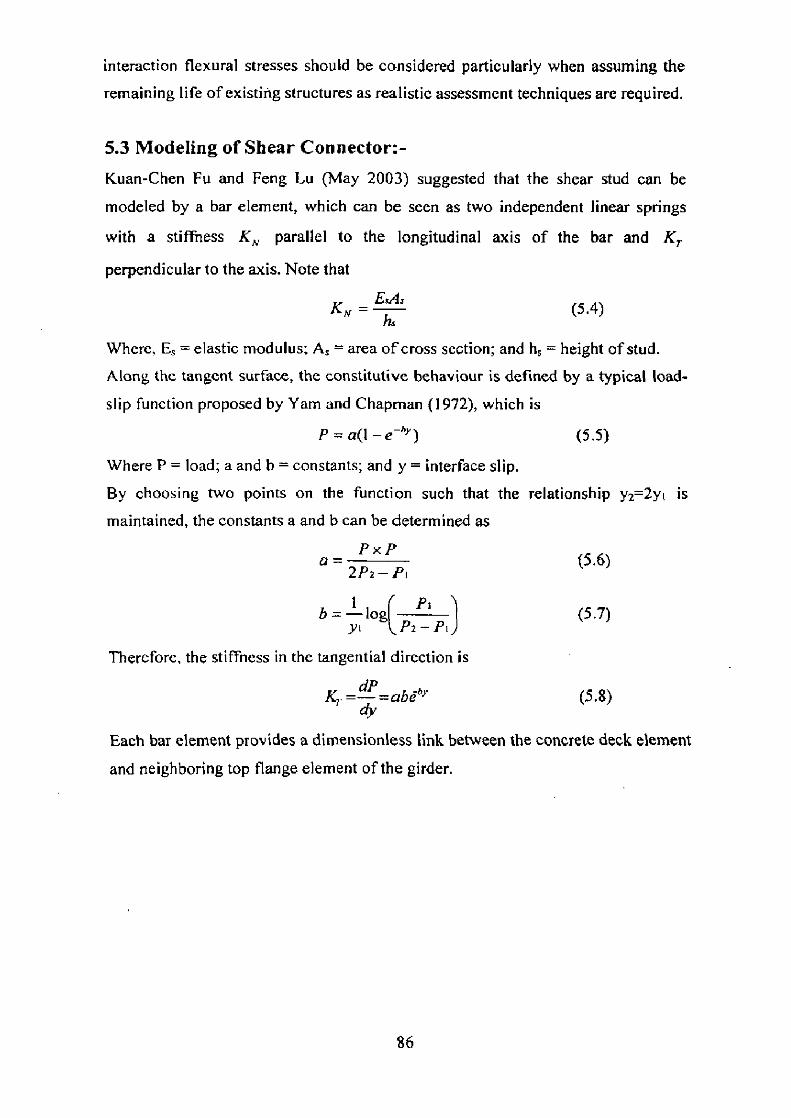
interaction flexural stresses should be considered particularly when assuming the
remaining life of existing structures as realistic assessment techniques are required.
5.3 Modeling of Shear Connector:- Kuan-Chen Fu and Feng Lu (May 2003) suggested that the shear stud can be
modeled by a bar element, which can be seen as two independent linear springs
with a stiffness K M parallel to the longitudinal axis of the bar and Kr
perpendicular to the axis. Note that
K - Eu
(5.4)
Where, Es = elastic modulus; As = area of cross section; and hs = height of stud.
Along the tangent surface, the constitutive behaviour is defined by a typical load-
slip function proposed by Yam and Chapman (1972), which is
P = a(1 -e-h''') (5.5)
Where P = load; a and b = constants; and y = interface slip.
By choosing two points on the function such that the relationship y2=2y, is
maintained, the constants a and b can be determined as
P x P a =
(5.6) 2/32 - Pi
b = —1 log( (5.7) YI P2- PI
Therefore, the stiffness in the tangential direction is
= —dP =abeam''' (5.8) dY
Each bar element provides a dimensionless link between the concrete deck element
and neighboring top flange element of the girder.
86

In the present problem modeling of shear connector is done using three mutually
perpendicular nonlinear springs which constitutes for the stiffness in three directions viz., stiffness parallel to stud longitudinal axis and stiffness perpendicular to longitudinal axis (one parallel to the bridge axis and one
perpendicular to bridge axis). An ANSYS macro has been written in APDL
(ANSYS programming design language) for modeling of the shear connector.
To get a realistic stiffness in transverse direction the spacing between shear
connector is calculated according to IRC: 22-1986. The provisions of code are as follows,
I) For a ratio of h/d equal to or greater than 4.2
Q = 6.08 d2 fck (5.9)
Where,
Q = Allowable safe shear resistance of one shear connector (N) d = Diameter of stud connector (mm)
2) The spacing of shear connectors shall be determined from the formula
EQ P = (5.10)
Where,
VL = the longitudinal shear per unit length as stated below
Q = Safe shear resistance of each shear connector as stated above
V ./let y V L — (5.11)
Where,
V = Vertical shear due to dead load placed after composite section is effective and working live load with impact.
= Area of transformed section on one side of interface
y = Distance of the centroid of the area under consideration from the neutral axis of the composite section.
87

COMBIN39 (Nonlinear Spring)
COMBIN39 is a unidirectional element with nonlinear generalized force-deflection
capability that can be used in any analysis. The element has longitudinal or
torsional capability in 1-D, 2-D, or 3-D applications. The longitudinal option is a uniaxial tension-compression element with up to three degrees of freedom at each node: translations in the nodal x, y, and z directions. No bending or torsion is considered. The torsional option is a purely rotational element with three degrees
of freedom at each node: rotations about the nodal x, y, and z axes. No bending or
axial loads are considered. The element has large displacement capability for which there can be two or three degrees of freedom at each node.
a
.."" , -
. /
C
Fig 5.2 Pictorial view of COMBINE39
Input data The element is defined by two (preferably coincident) node points and a
generalized force-deflection curve. The points on this curve (DI, Fl, etc.) represent
force (or moment) versus relative translation (or rotation) for structural analyses, and heat (or flow) rate versus temperature (or pressure) difference for thermal analyses.
88

Input summery
Element Name - COMBINE39
Nodes - - I, J.
Degrees of Freedom -UX, UY, UZ, ROTX, ROTY, ROTZ, PRES, or TEMP
Assumptions and Restrictions
• If KEYOPT (4) = 0, the element has only one degree of freedom per node.
This degree of freedom defined by KEYOPT (3), is specified in the nodal
coordinate system and is the same for both nodes. KEYOPT (3) also
defines the direction of the force.
• The element assumes only a 1-D action. Nodes I and J may be anywhere in
space (preferably coincident).
• The element is defined such that a positive displacement of node J relative
to node I tends to put the element in tension.
Input for COMBINE39: -
As this element requires force Vs deflection relationship as input for accounting its
transverse stiffness a result presented by Dennis Lam et-.al., ASCE (2005) of push-
off test is taken from literature published.
•
• • •
• •
# - ; ; ••• "It
11_1 13, I . • 1- • • ..1 1::1:
89

5.4 VALIDATION EXAMPLE:
The results from an experimental study on a beam model [L.C.P.Yam 1968] are
used to validate the modeling adopted for current bridge. The details of the above
referred experiment are as below:
5.4.1 Details of Experimental Study IL.C.P. Yam 1972J:
A number of simply supported and continuous composite beams were tested at
Imperial College. One of these specimens is analyzed to validate the models. The
simply supported beam selected from the test series which is loaded at midspan.
The beam consist of as 152mm thick concrete slab and I-section steel girder, 304 x 152mm x 0.196kN/m, connected by 100 uniformly distributed head studs,
19x100mm. The geometric configuration of beam is as shown in figure 6.3 below.
The material properties are steel: E5=2x10⁵MPa, 11r-0.3, Concrete: Esr-3x10⁴MPa, 11=-0.2.
1200
II
3a4
t5-2
ALL DIMENSIONS ARE IN mm
a) Elevation and cross section
90

JUV 25 :0e6 14:03:45
b) Finite Element Idealization.
Fig. 5.4 Imperial College simple span composite beam.
Only one quarter of beam is considered in analysis taking advantage of double
symmetry of the specimen. The finite element mesh is as shown in figure 53. The
interface slip values are compared in the following Table 5.1 for a load of 443kN.
And very good eoincirlemon, with experimental values art observed.
Table 5.1 Comparison of results for interface slip with literature review.
Results from Interface slip (aim)
At midspan At support
At 2.0m from
left hand support
Test 0 0.139 0.508
ANSYS 0 0.151 0A36
91

DISTRIBUTION OF INTERFACE SLIP ALONG SPAN FOR PARTIAL INTERACTION CASE
6 -ME- OUTER GIRDER
- INT.ERMEDIATE GIRDER
07 0 5000 10000 1 5 000 20000
DISTANCE FROM LEFT HAND SUPPORT
INTERFACE SLIP DISTRIBUTION ALONG SPAN FOR TRANSVERSE STIFFNESS IS EQUAL TO 1/10 Di OF
ACTUAL STIFFNESS 375
2.5 -
-0.5 -1.5 - -2.5 -
5 E
a. c.)
—*-- OUTER GIRDER
INTERMEDIATE GIRDER
0 5000 10000 15000 20000
DISTANCE FROM LEFT HAND SUPPORT
55 Interface Slip Distribution along the Span of Bridge for Partial Interaction
Fig 53 Interface slip along span of bridge for PI(1).
Fig 5_6 Interface slip along span of bridge for PI(2).
92
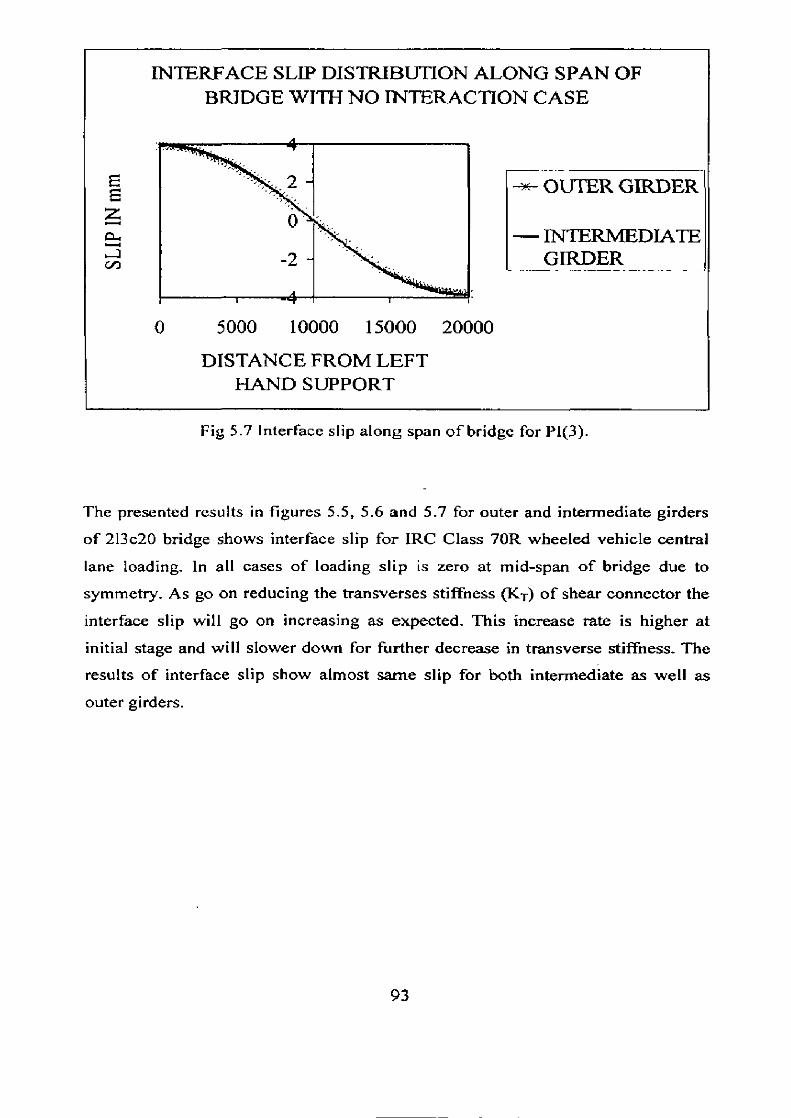
INTERFACE SLIP DISTRIBUTION ALONG SPAN OF BRIDGE WITH NO INTERACTION CASE
E E
a. -2 -
-4 0 5000 10000 15000 20000
DISTANCE FROM LEFT HAND SUPPORT
-5,z- OUTER GIRDER
INTERMEDIATE GIRDER
Fig 5.7 Interface slip along span of bridge for Pl(3).
The presented results in figures 5.5, 5.6 and 5.7 for outer and intermediate girders
of 213c20 bridge shows interface slip for IRC Class 70R wheeled vehicle central
lane loading. In all cases of loading slip is zero at mid-span of bridge due to
symmetry. As go on reducing the transverses stiffness (KT) of shear connector the
interface slip will go on increasing as expected. This increase rate is higher at
initial stage and will slower down for further decrease in transverse stiffness. The
results of interface slip show almost same slip for both intermediate as well as
outer girders.
93
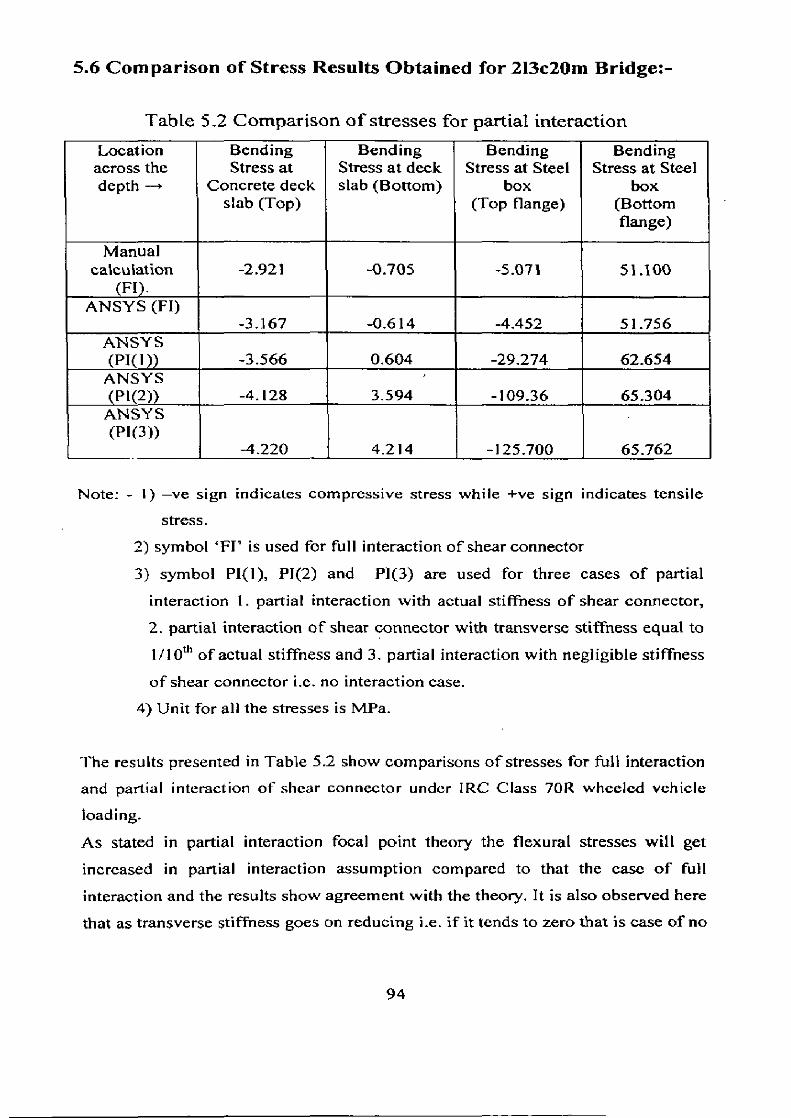
5.6 Comparison of Stress Results Obtained for 213c20m Bridge:-
Table 5_2 Comparison of stresses for partial interaction
Location across the depth ---.
Bending Stress at
Concrete deck slab (Top)
Bending Stress at deck slab (Bottom)
Bending Stress at Steel
box (Top flange)
Bending Stress at Steel
box (Bottom flange)
Manual calculation
(F1). -2.921 -0.705 -5.071 51.100
ANSYS (FI) -3.167 -0.614 -4.452 51.756
ANSYS (MD -3.566 0.604 -29.274 62.654 ANSYS (P1(2)) -4.128 3.594 -109.36 65.304 ANSYS (P1(3))
-4.220 4.214 -125.700 65.762
Note: - I) —ye sign indicates compressive stress while +ye sign indicates tensile
stress.
2) symbol 'FI' is used for full interaction of shear connector
3) symbol PI(1), P1(2) and PI(3) are used for three cases of partial
interaction 1. partial interaction with actual stiffness of shear connector,
2. partial interaction of shear connector with transverse stiffness equal to
1110th of actual stiffness and 3. partial interaction with negligible stiffness
of shear connector i.e. no interaction case.
4) Unit for all the stresses is MPa.
The results presented in Table 5.2 show comparisons of stresses for full interaction
and partial interaction of shear connector under !RC Class 70R wheeled vehicle
loading.
As stated in partial interaction focal point theory the flexural stresses will get
increased in partial interaction assumption compared to that the case of full
interaction and the results show agreement with the theory. It is also observed here
that as transverse stiffness goes on reducing i.e. if it tends to zero that is case of no
94

interaction the results obtained again shows agreement with basic theory of
individual behaviour i.e. stresses in concrete slab at top and bottom will be almost
same but of opposite nature and in steel box also opposite nature of stresses at two
extreme points but not equal since section is not symmetric about horizontal axis.
5.7 Comparison of Distribution Factors Obtained for 213e20m Bridge:-
Table 5.3 Comparison of MDF for Partial and Full interaction.
MDF for Centrally loaded lanes MDF for Eccentrically
loaded lanes
Behaviour of
connector Outer Girder
Intermediate
Girder Outer Girder
Intermediate Girder
Partial
Interaction
(131(1))
0.215 0.285 0.217 0.289
Full
Interaction 0.218 0.282 0.230 0.288
Table 5.3 shows comparison of MDF for partial and full interaction of shear
connector under IRC Class 70R wheeled vehicle for central lane loading as well as
eccentric lane loading.
The moment contribution of outer girder gets reduced by 1.3% and 5.7%, while for
intermediate girder moment contribution increases up to 1% and 0.35% in partial
interaction for centrally loaded lanes and eccentrically loaded lanes respectively. It
can be revealed from the results that there is small difference in contribution of
intermediate and outer girder for partial and full interaction.
95
5.8 Nonlinear Analysis: -
The present sub work consists of nonlinear analysis of 21-3c-20 bridge with
incremental loads for IRC Class 70R wheeled vehicle loading and dead load.
Depending on the level of load, a bridge may or may not respond non-linearly due
to cracking of concrete or yielding of steel plates. This may result in excessive
permanent deformations, the extent of which should be known prior to design of
bridge. In this case nonlinearities considered are material nonlinearity as well as
geometric nonlinearity. Material nonlinearity is incorporated in the analysis using
nonlinear material model available in ANSYS software. For concrete Drucker-
Prager failure criterion is used while for steel bilinear isotropic hardening is used as yielding criterion.
5.9 Nonlinear material modeling: -
5.9.1 Concrete modeling:- The non-linear response of concrete is caused by four major material effects: (1)
cracking of the concrete; (2) aggregate interlock; and (3) time dependent effects
such as creep, shrinkage, temperature, and load history.
In spite of its obvious shortcomings the linear theory of elasticity combined with
criteria defining "failure" of concrete is most commonly used material law for
concrete in reinforced concrete analysis. The linear elastic modeling can be
significantly improved by using the non-linear theory of elasticity.
The Drucker-Prager (DP) option available in ANSYS is applicable to granular
(frictional) material such as soils, rock, and concrete, and uses the outer cone
approximation to the Mohr-Coulomb law. This option uses the Drucker-Prager
yield criterion with either an associated or non-associated flow rule. The yield
surface does not change with progressive yielding, hence there is no hardening rule
and the material is elastic- perfectly plastic.
96

fic x cos 0 o- —
-J3(3— sin 0) (5.15)
The equivalent stress for Drucker-Prager is
o-, = +V {SY [MliSd 2
Where,
1 (ate + 3
= — ko-X -1- aV + a- Z ) = mean or hydrostatic stress.
{s}. deviatoric stress
{M}= plastic compliance matrix.
0 /3 = material constant — 2sin J1(3 sin 0)
(5.12)
(5.13)
(5.14)
Where, 0= angle of internal friction.
The material yield parameter is defined as
Where, c = cohesion value.
The yield criterion is then
F = + 1St [MliSd2 — o- =O (5.16)
This yield surface is cone with material parameters chosen such that it corresponds
to the outer aspices of the hexagonal Mohr-Coulomb yield surface.
97

Fig. 5.8 Mohr-Coulomb and Drucker-Prager yield surfaces.
5.9.2 Steel modeling:-
Plasticity theory provides a mathematical relationship that characterizes the elasto-
plastic response of materials. The yield criterion determines the stress level at
which yielding is initiated. For multi-component stresses, this is represented as a
function of the individual components, f ({a}), which can be interpreted as an
equivalent stress ae. The material will develop plastic strains. If cre is less than ay,
the material is elastic and the stresses will develop according to the elastic stress-
strain relations. The equivalent stress can never exceed the material yield since in
this case plastic strains would develop instantaneously, thereby reducing the stress
to the material yield.
17
Ti a
Fig. 5.9 Stress strain relationship for bilinear isotropic hardening.
98
This option (bilinear isotropic hardening) uses Vonmises yield criterion with
associated flow rule and isotropic (work) hardening.
The equivalent stress is,
{s} [m}{4 And the yield criterion is,
3 } r u
F =[-2
{S7 EM liS}1 —at = 0
(5.17)
(5.18)
For work hardening ak is a function of the amount of plastic work done. For the
case of isotropic plasticity assumed here, cri can be directly determined from
equivalent plastic strain.
5.10 ELEMENTS DESCRIPTION
5.10.1 BEAM 188: - 3-D Linear Finite Strain Beam
BEAM 188 is suitable for analyzing slender to moderately stubby/thick beam
structures. This element is based on Timoshenko beam theory. Shear deformation
effects are included.
BEAM] 88 is a linear (2-node) or a quadratic beam element in 3-13. BEAM188 has
six or seven degrees of freedom at each node first six are three translations and
three rotations one additional is warping magnitude can also be included.
99
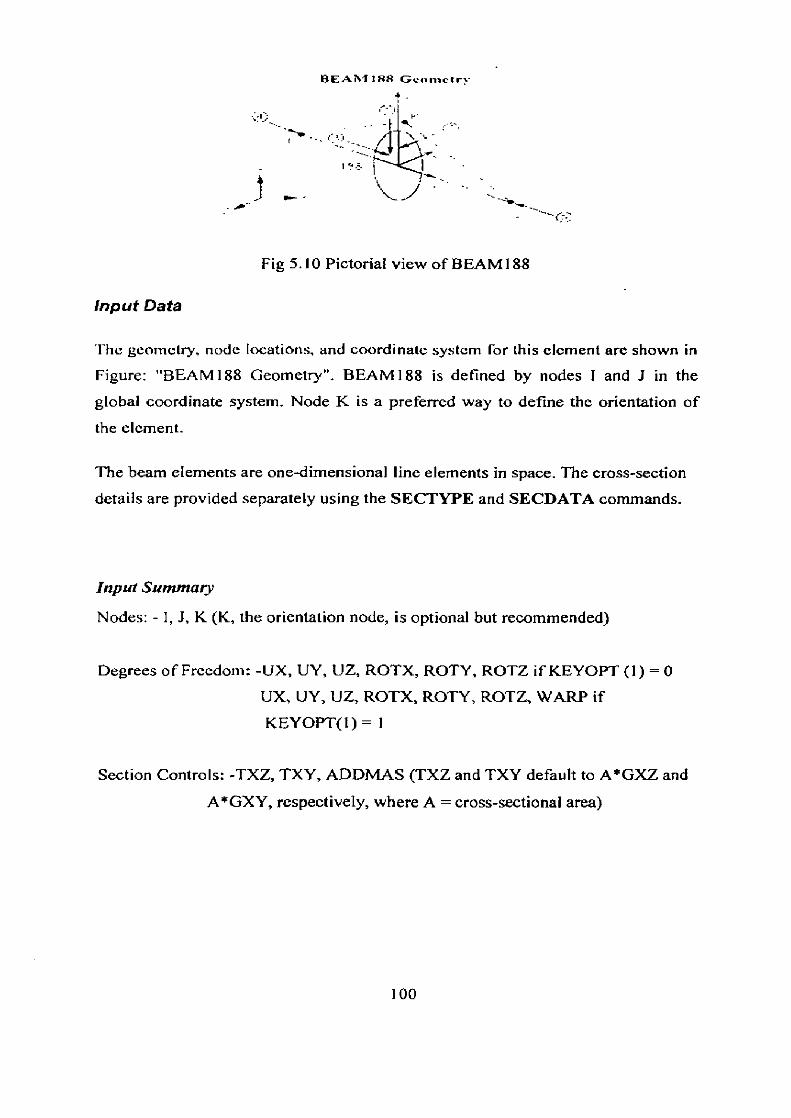
!BEAM 188 Geometry
Fig 5.10 Pictorial view of BEAM1 88
Input Data
The geometry, node locations, and coordinate system for this clement are shown in
Figure: "BEAM188 Geometry". BEAM188 is defined by nodes I and J in the
global coordinate system. Node K is a preferred way to define the orientation of
the element.
The beam elements are one-dimensional line elements in space. The cross-section
details are provided separately using the SECTYPE and SECDATA commands.
Input Summary
Nodes: - 1, J, K (K, the orientation node, is optional but recommended)
Degrees of Freedom: -UX, UY, UZ, ROTX, ROTY, ROTZ if KEYOPT (1) = 0
UX, UY, UZ, ROTX, ROTY, ROTZ, WARP if
KEYOPT(1) = I
Section Controls: -TXZ, TXY, ADDMAS (TXZ and TXY default to A*GXZ and
A*GXY, respectively, where A = cross-sectional area)
1 00
Assumptions and Restrictions
The beam must not have zero length. By default (KEYOPT (1) = 0), the effect of
warping restraint is assumed to be negligible. Cross-section failure or folding is not
accounted for. Rotational degrees of freedom are not included in the lumped mass
matrix if offsets are present.
It is a common practice in civil engineering to model the frame members of a
typical multi-storied structure using a single element for each member. Because of
cubic interpolation of lateral displacement, BEAM4 and BEAM44 are well-suited
for such an approach. However, if BEAM188 is used in that type of application, be
sure to use several elements for each frame member. BEAN1188 includes the
effects of transverse shear.
This element works best with the full Newton-Rapbson solution scheme (that is,
the default choice in solution control). For nonlinear problems that are dominated
by large rotations, it is recommend that PRED, ON is not to be used. [ANSYS].
5.10.2 Shell 43: - 3-D Linear Finite Strain Beam
SHELL43 is well suited to model linear, warped, moderately-thick shell structures.
The element has six degrees of freedom at each node: translations in the nodal x, y,
and z directions and rotations about the nodal x, y, and z axes. The deformation
shapes are linear in both in-plane directions. For the out-of-plane motion, it uses a
mixed interpolation of tensorial components.
The element has plasticity, creep, stress stiffening, large deflection, and large strain
capabilities.
101

SHELL43 Geometry
4
--= Element x-axis if ESYS is not supplied.
x = Element x-axis if ESYS IN supplied.
Fig 5.11 Pictorial view of SHELL43
Input Data
The geometry, node locations, and the coordinate system for this element are
shown in Figure "SHELL43 Geometry". The element is defined by four nodes,
four thicknesses, and the orthotropic material properties. A triangular-shaped
element may be formed by defining the same node number for nodes K and L as
described in Triangle, Prism and Tetrahedral Elements.
Orthotropic material directions correspond to the element coordinate directions. The element coordinate system orientation is as described in Coordinate Systems. The clement x axis may be rotated an angle THETA (in degrees) from the clement x axis toward the element y axis.
The element may have variable thickness. The thickness is assumed to vary
smoothly over the area of the element, with the thickness input at the corner nodes. If the element has a constant thickness, only TK (I) need be input. If the thickness
is not constant, all four thicknesses must be input.
102

Input Summary
Element Name - SHELL43
Nodes - I, J, K,
Degrees of Freedom - UX, UY, UZ, ROTX, ROTY, ROTZ
Real Constants- TK(I), TK(J), TK(K), TK(L), THETA, ZSTIF I , ZSTIF2,
ADMSUA
Material Properties- EX, EY, EZ, (PRXY, PRYZ, PRXZ or NUXY, NUYZ,
NUXZ), ALPX, ALPY, ALPZ, DENS, GXY, DAMP
Assumptions and Restrictions
Zero area elements are not allowed. This occurs most often whenever the elements
are not numbered properly. Zero thickness elements or elements tapering down to a
zero thickness at any corner are not allowed. Under bending loads, tapered
elements produce inferior stress results and refined meshes may be required. Use
of this element in triangular form produces results of inferior quality compared to
the quadrilateral form. However, under thermal loads, when the element is doubly
curved (warped), triangular SHELL43 elements produce more accurate stress
results than do quadrilateral shaped elements. Quadrilateral SHELL43 elements
may produce inaccurate stresses under thermal loads for doubly curved or warped
domains. The applied transverse thermal gradient is assumed to vary linearly
through the thickness. The out-of-plane (normal) stress for this element varies
linearly through the thickness. The transverse shear stresses (SYZ and SXZ) are
assumed to be constant through the thickness. Shear deflections are included.
Elastic rectangular elements without membrane loads give constant curvature
results, i.e., nodal stresses are the same as the centroidal stresses.
Inputs required for the Software for Material modeling:-
Concrete: - For specifying Drucker-Prager failure criterion only three inputs are
required in ANSYS software 1) angle of internal friction = 45'; 2) cohesion=
3kN/m2; 3) flow angle 0' [Diganta Goswami, 2003] additionally inputs required
are modulus of elasticity E(27000MPa); Poisson's ratio Jl (0.2).
103
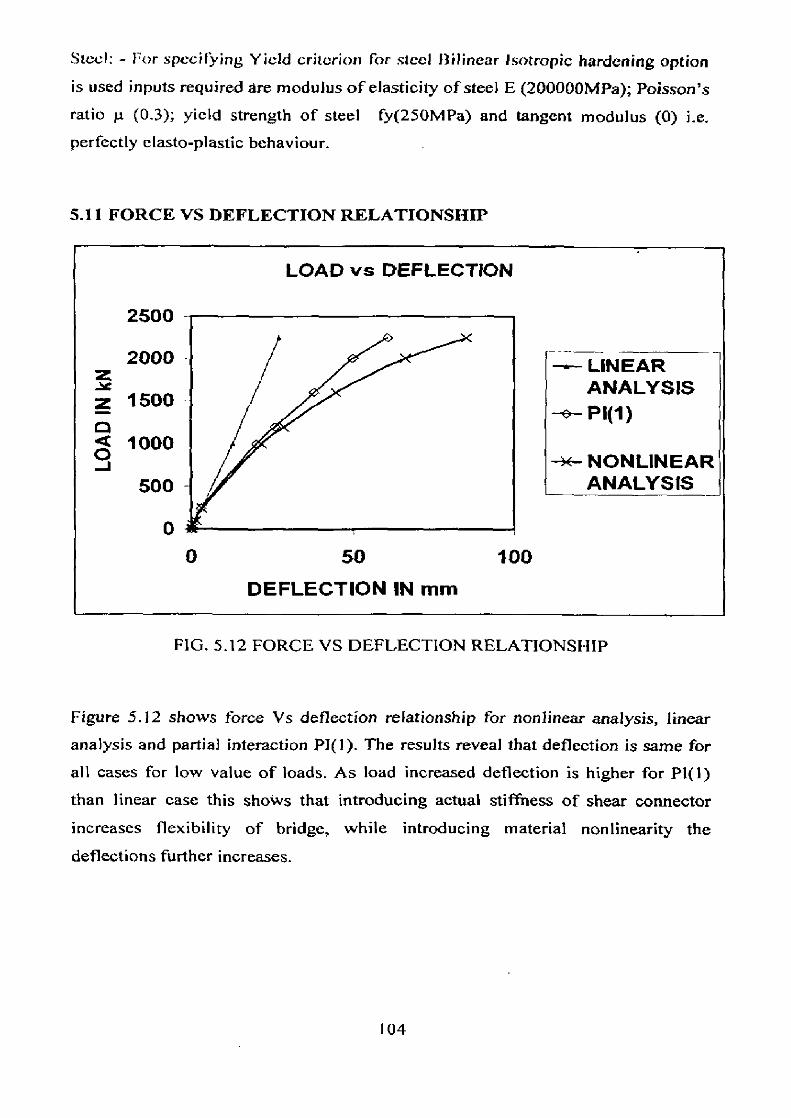
--- LINEAR ANALYSIS
-e-- P1(1)
-4+- NONLINEAR ANALYSIS
LOAD vs DEFLECTION
0
50
100
DEFLECTION IN mm
z
2500
2000
z 1500
1000 —J
500
0
-
-
Steel: - For specifying Yield criterion for steel Bilinear Isotropic hardening option
is used inputs required are modulus of elasticity of steel E (200000MPa); Poisson's ratio u (03); yield strength of steel fy(2501v1Pa) and tangent modulus (0) i.e. perfectly clasto-plastic behaviour.
5.11 FORCE VS DEFLECTION RELATIONSHIP
FIG. 5.12 FORCE VS DEFLECTION RELATIONSHIP
Figure 5.12 shows force Vs deflection relationship for nonlinear analysis, linear analysis and partial interaction P1(1). The results reveal that deflection is same for
all cases for low value of loads. As load increased deflection is higher for P1(1) than linear case this shows that introducing actual stiffness of shear connector
increases flexibility of bridge, while introducing material nonlinearity the
deflections further increases.
104

5.12 COMPARISON OF DISTRIBUTION FACTORS: -
Table 5.4 Comparison of MDF for Partial and Full interaction_
MDF for Centrally loaded lanes
Type of
analysis Outer Girder
intermediate
Girder
Nonlinear 0.208 0.292
Linear
1
0.218 0.282
Table 5.4 shows comparison of MDF for linear and nonlinear analysis under TRC
Class 70R wheeled vehicle for central lane loading. The moment contribution of
outer girder gets reduced by 5%, while for intermediate girder moment
contribution increases up 3.5% in non linear analysis. It can be revealed from the
results that there is small difference in contribution of intermediate and outer girder
for partial and full interaction.
1 05

CHAPTER 6
CONCLUSIONS AND FUTURE WORK
Box girders have gained wide acceptance in freeway and bridge systems due to their
structural efficiency, pleasing aesthetics and economy of construction. Composite
structures comprised of steel and concrete are gaining ever increasing popularity in the
bridge construction industry. Steel composite bridges combine the advantages of steel
and concrete bridges: the robustness and the low cost*f reinforced concrete roadway
slab and the reduced weight of main girders made of steel. Modem highway bridges
are often subject to tight geometric restrictions, composite steel concrete box girder
bridges combine excellent torsional stiffness with elegance to fulfill these demands.
While the current design practices in North America recommend few analytical
methods for the design of composite multicell box girder bridges, practical
requirements in the design process necessitate a need for a simpler design method. In
India, there are no design codes or guidelines for composite box girder bridge design.
In the present study, the analysis of the box girder bridges has been carried out using
ANSYS package, the parameters affecting the load distribution in the box girder
bridges and finally the load distribution factors have been calculated.
From parametric study based on linear elastic theory and assuming full interaction
presented in chapter 2, 3 and 4 of the thesis the following significant conclusions can
be made:
• There is more than 41% & 37% decrease in the moment shared by the
outer girder when the number of cells increases from 2 to 4 in case of two-
lane bridge and 4 to 7 in case of four-lane bridge respectively, while
increase of 46% & 42% in the moment shared by the intermediate girder.
• By increasing the number of bracings from zero to five for 20m span, the
moment carried by the outer girder increases and the moment carried by
intermediate girder decreases for centrally loaded lanes. In case of
eccentrically loaded lanes moment contribution of outer girder reduces and
107
moment contribution of intermediate girder increases. It is revealed from
the study that adding cross bracings improves the ability of the cross
section to transfer loads from one girder to the adjacent ones.
• The moment distribution factors for the intermediate girders are very close
to that of the central girder due to the excellent torsional stiffness of box
girder type of bridge. Therefore, in practice, it is unnecessary to distinguish
between central and intermediate girders.
■ For longer span lengths, the moment distribution factor becomes smaller
for the intermediate girder and larger for the outer girder, thus exhibiting
better moment distribution between girders for two lane as well as four lane bridges.
• The optimum spacing of cross bracing system for two Lane Bridge of 20 m
span is found to be 7m. Reducing the spacing beyond 7 m does not have
any significant effect in the change of distribution factors.
Current composite steel and concrete bridges are designed using full interaction theory
assuming there is no any relative displacement or slip at interface of concrete and steel
because of the complexities of partial-interaction analysis techniques. However, in the
assessment of existing composite bridges this simplification may not be warranted as
it is often necessary to extract the greatest capacity from the structure. Hence an
analysis has been carried out for a bridge superstructure by inclusion of slip in shear
connector. This analysis indicates a significant increase in longitudinal flexural
stresses and deflections when accounting for slip.
A nonlinear finite element model for composite box Girder Bridge is developed using
ANSYS software package. The model considers material nonlinearity in concrete as
well as steel. This FE model for composite box girder bridges provides a rational tool
for the understanding of the behavior of bridge superstructures.
108

SUGGESTIONS FOR FUTURE STUDY:
1. Design expressions for distribution factor for moment and shear can be
evaluated by extending the present study by increasing more number of bridge prototypes and using some statistical means.
2. In depth nonlinear analysis of composite bridges needs to be further explored
to be used for design purposes.
3. Since mechanical shear connectors in composite steel and concrete bridges
require slip to transmit shear, most composite bridges are designed assuming
full-interaction because of the complexities of partial-interaction analysis
techniques. However, in the assessment of existing composite bridges this
simplification may not he warranted as it is often necessary to extract the
greatest capacity from the structure. Partial-interaction theory can be explored to reflect the behaviour of the structure realistically.
109
REFERENCES
1. Alghamdi, S.A., (1999) "On analysis of shear lag in steel box girders." LGP-3-
15, KACST- Riyadh, Saudi Arabia.
2. Bazant, Z. P., and Kim, J. (1989). "Segmental box girder: Deflection
probability and Bayesian updating." J. Struct. Engrg, ASCE, 115(10), 2528-
2547.
3. Brighton, I., Newell, J., and Scanlon, A., (1996). "Live load distribution factors
for double-cell box girder bridges." Proc., 1st Struc. Spec.Conf, Canadian
Society for Civil Engineering, Montreal, Quebec, 419-430.
4. Cook, RD., Malkus, D.S., Plesha, M.E and Witt, R.J.,(2002)."Concepts and
Applications of Finite Element Analysis, 4ed"John Willey and Sons, New
york, 97-99.
5, Dabrowski, R. (1968) Curved thin-walled girders, theory, and analysis,
Cement and Concrete Association, London.
6. Davis, R. E., Bon, V.D., "Transverse distribution of loads in box-girder
bridges. (Vol. 7): Correction for curvature." California Department of
Transportation, Sacramento, Calif., 1981.
7. Dennis, L., and EI-Lobody, E. (2005). "Behaviour of Headed Stud Shear
Connectors in Composite Beam." ASCE 12(1), 96-107
8. Diganta Goswami, (2003), "Ground subsidence due to shallow tunneling in
soft ground.," Ph.D. Dissertation, Indian Institute of Technology Roorkee, at
Roorkee.
9. El-Tawil, S. and. Okeil, A. M.,(2002), "Behaviour and design of curved
composite box girder bridges.,", final project report, Department of Civil and
Environmental Engineering University of Central Florida, Orlando, FL 32816-
2450.
10. Fan, Z. T., and Helwig, T. A. (2002) "Distortional loads and brace forces in
steel box girders." J. Struct. Engg, ASCE, 128(6), 710-718.
111
11. Farkas, J., and Jarmani, K. (1995). "Multiobjective optimal design of welded
box beams." Microcomputers in Civ. Engg, Oxford, 10(4), 249-255.
12. Hambly, E. C. and Pennells, E. (1975). "Grillage analysis applied to cellular
bridge decks." Struct. Eng., 53(7), 267-275.
13. Heins, C. P. (1978). "Box girder bridge design- state-of-the-art." AISC Engrg.
J., 2, 126-142.
14. Ho. S., Cheung, M. S., Ng, S. F., and Yu, T. (1989). "Longitudinal girder
moments in simply supported bridges by the finite strip method." Can. J. Civ.
Engg., Ottawa 16(5), 698-703.
15. Iles, a C., Design Guide For Composite Box Girder Bridges, The Steel
Construction Institute, Ascot, 1994
16. 1RC 22-1986, "Standard Specifications and Code of Practice for Road
Bridges", Section 4 — Composite Construction, The Indian Road Congress, New Delhi.
17. IRC: 5-1998, Standard Specifications and Code of Practice for Road Bridges,
Section I, General Features of Design (Seventh Revision).
18. IRC: 6-2000, Standard Specifications and Code of Practice for Road Bridges,
Section II, Loads and Stresses (Fourth Revision).
19. Johnson, R. P. and Buckby R. J., Composite Structures of Steel and Concrete, Volume 2: Bridges, Collins, London, 1977
20. Kuan-Chen, F., and Feng, L. (2003). "Nonlinear Finite-Element Analysis for
Highway Bridge Superstructures." ASCE Journal of Bridge Engineering, 173-
179
21. L. C. P. Yam and J. C. Chapman, The inelastic behaviour of simply supported
composite beams of steel and concrete. Proc. Inst. Civil Engng 41, 651-683
(1968).
22. Mukherjee, D., and Trikha, D. N., (1980). "Design coefficient for curved box-
girder bridges." Indian Concrete J., Bombay, 54(11), 301-306
23. NCHRP. (1991). "Distribution of wheel loads on highway bridges." NCHRP
12/26-1, Transportation Research Board, National Cooperative Highway
research Program, Washington, D.C., Vol. 1 and 2.
112
24. Nutt, R. V. Schamber, R. A., and Zokaic, '1'. (1988). Distribution of wheel
loads on highway bridges. Transportaion Research Board, NCHRP, Imbsen
and Assoc, Inc., Sacramento, Calif,
25. Ragon, S. A., Gurdal, Z., and Starnes, J.H., Jr. (1994). "Optimisation of
composite box-beam structures including the effect of subcomponent
interaction." Proc., 35th AIAA/ASME/ASCE/AHS/ASC Struct, Struct. Dyn,
and Mat. Conf., Part 2, American Institute of Aeronautics and Astronautics,
N.Y., Vol. 2, 818-828.
26. Scordelis, A. C. (1975) "Analytical and experimental studies of multicell
concrete box girder bridges." Bulletin of the International Association of Shell
and Spatial Structures, Madrid, Spain, 58, 9-22.
27. Scordelis, A. C., Chan, E. C., and Ketchum, M. A. (1985) "Computer program
for prestressed concrete box girder bridges." Rep. No. UCB/SESM 85/02,
University of California, Berkeley, Cal if.
28. Sennah, K. M., and Kennedy, J.B. (1998a) "Moment and shear distribution
factors for straight composite multicell bridges under the Canadian truck
loading." Proc., 5th Int. Conf. of Short and Medium Span Bridges, Canadian
Society for Civil Engineering, Montreal, Quebec, Canada, 345-357.
29. Sennah, K. M., and Kennedy, J.B. (1998b) "Shear distribution in simply
supported curved composite cellular bridges." J. Bridge Engrg., ASCE, 3(2),
47-55.
30. Sennah, K. M., and Kennedy, J.B. (1999a) "Load Distribution Factors for
Composite Multicell Box Girder Bridges." Journal of Bridge Engineering,
4(1), 71-78
31. Sennah, K. M., and Kennedy, J.B. (1999b) "Response of simply supported
composite concrete deck-steel multicell bridges at construction phase." Proc.,
27th Can. Conf. for Civil Engrs., Vol. 1, Canadian Society for Civil
Engineering, Montreal, Quebec, Canada, 175-194.
32. Sennah, K. M., and Kennedy, J.B. (2001) "State of the art in design of curved
box-girder bridges." J. Bridge Engrg., ASCE, 6(3), 159-167.
113
33. Seracino, R., Oehlers, D.J., and Yeo., M.F. (2001). "Partial-interaction
flexural stresses in composite steel and concrete bridge beams." Engineering Structures, 23, 1186-1193
34. Shiu, K. N., and Tabatabai, H. (1994). "Measured thermal response of concrete
box-girder bridges". J.Bridge Engrg., ASCE, in press.
35. Siddiqui, A. H. and Ng, S. F. (1988) "Effect of diaphragms on stress reduction
in box girder bridge sections." Can. J. Civ. Eng., 15(1), 127-135.
36. Trukstra, C. J., and Fam, A. R., (1978) "Behaviour study of curved box
bridges." J. Struct. Div. 104(ST3), 453-462 37. Upadyay, A. and Klayanaraman, V., (2003), "Simplified analysis of FRP box-
girders.", Composite Structures, 59, 21 7-225.
38. Vlasov, V. J., (1961) Thin walled elastic beams, 2" Ed., National Science Foundation, Washington, D.C.
39. Vlasov, V. J., (1965) "Thin walled elastic beams." OTS61-11400, 2nd Ed., National Science Foundation, Washington, D.C.
40. Zokaie, T., Imbsen, R. A., and Osterkamp, T. A., (1991). "Distribution of wheel loads on highway bridges." Transp. Res. Rec. 1290, Transportation
Research Board, Washington, D.C., 119-126.
114

APPENDIX-I The following scripting is done for conservation of patch load into nodal load, which
is used in present study to convert IRC Class 70R wheeled patch loads in to nodal loads. Programming language CPP has been used to for scripting.
Input required for program:- 1) Node listing with its coordinates of mesh on which the patch is to be applied. 2) Element list with connectivity nodes.
These files can directly be taken from ANSYS software and inputted to program. #include<stdio.h>
#include<iostream.h>
#include<conio.h>
#include<math.h>
class node{
public:
int no;
float x,y,z,sx,sy,sz;
};
class snode{
public:
int no;
float x,y,z,sx,sy,sz;
1;
class newsnode{
public:
int no;
float x,y,z,sx,sy,sz;
};
class element{
public:
int eno,em,et,er,es,ee,enl,en2,en3,en4;
};
class selement{
public:
int eno,em,et,er,es,ee,enl,en2,en3,en4;

int main()
{
FILE *fpl,*fp2,*fout;
node n[10000];
element e(10000];
snode sn[10000];
selement se[10000];
newsnode nw[10000];
char str[150];
float
sx,sy,sz,wx,wz,A,B,I1,bb,snxmax,snxmin,snzmax,snzmin,W,ws,w1,w2,xdif,zdif,su
m=0;
int
i = 0,j =0,k-=0,I =0,snn,snnnew,smm,smrnneyv,xxmin,xxmax,zzmin,zzmax,nn,mm,n
no,eno,et,em,es,ee,er,enl,en2,en3,en4;
fp1=fopen("NLIST.lis","r");
fp2=fopen("ELIST.lis","r");
fseek(fp1,0,SEEK_SET);
fgets(str,150,fp1);
while (fgets(str,150,fp1)1=NULL)
{
sscanf(str,"%d %f %f Wor,&n[i).no,&n[i].x,&n[i].y,&n[i].z);
nn=i;
fseek(fp2,0,SEEK_SET);
fgets(str,150,fp2);
while (fgets(str,150,fp2)!=NULL)
{
sscanf(str,"%d %d %d %d %d %d %d %d %d
Wod",&e[j].eno,&e[j].em,&e[j].et,&e[j].er,&e[j].ee,&e[j].es,&e[j].en1,&e[j].en2,8ke
[j].en3,&e[j].en4);
}
j++;
II

mrn=j; fout=fopen("nodel.txt","w");
fprintf(fout,"node no\t\txx\t\tzz\n");
for(i=0;1<nn;i-F-1-) {
fprintf(fout,"0/0-10d %14f %14f \n",n[i].no,n[i].x,n[i].z);
1 fprintf(fout,"element no\tnodel\tnode2\tnode3\tnode4\n"); for(j=0;j<mm;j++)
fprintf(fout,"0/0-10d %7d %7d %7d %7d
\n",e[j].eno,e[j].enl,e[j].en2,e[j].en3,e[j].en4);
fprintf(fout,"Selected nodes \n");
cout«"Enter the no of tyres on Deck"<<endl; cin>>amol;
cout«"Enter the width and length of an element"«endl; cin»bb»11; bb= 596.25; 11=238.095238095;
amol=1;
for(amoll=1;amoll<=amol;amoll+-1-) {
cout«"Enter the co-ordinates of centroid of patch load"<<endl; cin»wx;
wz= 39888;
cout«"Enter the width and length of patch load"<<endi; cin»A»8;
A=360; B=224; cout«"Enter the Toad Magnitude of patch load"<<endl; cin>>W;
W=42.5; ws=WRA*B);
bb= bb/2;
III

11=11/2;
j=0; snn=0;
for(i=0; i<nn;i + +)
{
if(n[i].x<=(wx+A/2)&&n[i].x>=(wx-A/2)&&n[i].z<=(vvz+B/2)&&n[i].z>=(wz-
B/2))
{
sn no=njil.no;
sn[j].x=n[i].x;
sn[j].z=n [1].z;
}
}
snn=j;
if(snn = =0)
{1=0;
for(i=0;i<nn; i++)
{if(n[i].x<=wx81.8‘n[i].z<=wz)
{sn[j].no=n[i].no;
sn[j].x=n[i].x;
sn[j].z=n[i].z;
}
snn=j;
snxmax=sn[0].x;
for(j=1;jcsnn;j++)
if(sn [j].x > =snxmax)
snxmax =sn[j].x;
}
snzmax=sn[0].z;
for(j=1;j<snn;j++)
IV

if(sn[j].z>-=snzmax) snzmax=sn[j].z;
for(i=0;1<snn;i4--E) -(if(snxmax==sn[1].x8teasnzmax==sn[i].z) {sn[0].no=sn[i].no; sn[0].x=sn[i].x; sn[0].z=sn[i].z; }
}
for(i=0;i<mm;i-F-i-) (if(sn[0].no==ern.en1) {sn[1].r-to=e[i].en2; sn[2].no=e[i].en3; sn[3].no=e[i].en4; } }
for(i=0;i<nn;i++) {if(srt[1].no==n[i].no) -(sn[1].no=n[i]kno; sn[1].x=n[i].x; sn[1].z=n[i].z; }
if(sn[2].no==n[i].no) {sn[2].no=n[i].no; sn[2].x=n[i].x; sn[2].z=n[i].z; }
if(srt[3].no==n[i].no) {sn[3].no=n[i].no; sn[3].x=n[i].x; sn[3].z=n[i].z;
}
}
xdif—wx-sn[0].x-bb;
V

zdif=wz-sn[0].z-II;
sum=0;
w1=W*(xdif-bb)*(zdif-II)/(4*bb*11)*-1000; sum=sum+wl;
fprintf(fout,"f, %-10d,fy, %14f \n",sn[0].no,w1);
w1=-W*(xdif+bb)*(zdif-11)/(4*bb*11)*-1000; sum=sum+wl;
fprintf(fout,"f, %-10d,fy, %14f \n",sn[ 1].no,w1);
w1=W*(xdif+bb)*(zdif+11)/(4thb*11)*-1000; sum=sum+wl;
fprintf(fout,"f, %-10d,fy, %14f \n",sn[2].no,w1);
w1=-W*(xdif-bb)*(zdif+11)/(4*bb*I1)*-1000; sum=sum+wl;
fprintf(fout,"f, o/0-10d,fy, %14f \n",sn[3].no,w1);
printf("%f",sum);
snn=0;
}
j=0;
snn=0;
for(i=0;i<nn;i++)
{
if(n[i].x<=(wx+A/2)&&n[i].x>=(wx-A/2)&&n[i].z<=(wz+B/2)&&n[i].z>=1(wz-
B/2))
{
sn[j].no=n[i].no;
sn[j].x=n[i].x;
sn[j].z=n[i].z;
}
snn=j;
if(snn1=0)
{
for(i=0;i<snn;i++)
fprintf(fout,"%-10d 0/6141%14f \n",sn[i].no,sn[i].x,sn[i].z);
snxmax=sn[0].x;
for(j=0;j<snn;j++)
{
if(sn[j].x> =sn[0].x)
VI

snxmax=sn[j].x;
fprintf(fout,"maximum x=0/of \n",snxmax);
snxmin=sn[0].x;
for(j=0;j<snn;j++)
{
if(sn[j].x<=sn[0].x)
snxmin=sn[j].x;
1 fprintf(fout,"minimum x=0/01 \n",snxmin);
snzmax=sn[0].z;
for(j=0;j<snn;j++)
if(sn[j].z>=sn[0].z)
snzmax=sn[j].z;
fprintf(fout,"maximum z=0/of \n",snzmax);
snzmin=sn[0].z;
for(j=0;j<snn;j++)
{
if(snuj.z<=sn[0].z)
snzmin=sn[j].z;
fprintf(fout,"minimum z=0/of \n",snzmin);
j=0;
for(i=0;i<snn;i++)
{
if(sn[i].xt =snxmax&&sn[i].z!=snzmax8asn[i].x1=snxmin&Sisn[i].z1=snzmin)
{
nwujono=sn[1].no;
nvv[j].x=sn[i].x;
nw[j].z=sn[i].z;
}
VI]
snrinew=j;
w1=wsell*bb*4;
fprintf(fout,"New Selected Inner core Nodes for similar loads I \n"); for(i=0;i<snnnew;i++)
fprintf(fout,"0/0-10d %14f %14f \n",nwji].no,nw[i].x,nw[i].z);
fprintf(fout,"f, %-10d,fy, %141 \n",nvv[i].no,-1000*w1);
1=0;
for(i=0;i<snn;i++)
{
if(sn[i].x==snxrnax [ Isn[i].z==snzmax I Isn(q.x==snxminl lsn(i].z==snzmin)
{
nwr_j}.no=sn[i].no;
nvvr_11.x=sn[i].x;
nw[j].z=sn[i].z;
}
snnnew=j;
cout«snnnew«end1; fprintf(fout,"New Selected outer core Nodes for similar loads 2 \n");
for(i=0;i<snnnew;i++)
{if(nw[1].z==snzmin&anw[i].x==snxmax)
{xdif=((wx+A/2)-snxmax);
zdif=(snzmin-(wz-B/2));
w1=ws*xdif*zdif;
suni=0; w2=w1*(2*bb-xdif*0.5)*(zdif*O.5)/(4*bb*11); sum=sum+w2;
fprintf(fout,"Nocie with maximum x& minimum z \n%-10d %141 %14f
\n",nw[1].no,nw[i].x,nw[i].z); fprintf(fout,"f, %-10d, fy, %141 \n",nw[i].no,-1000*w2);
for(j=0;j<mm;j++)
(if(eUl.en4==nw(g.no)
(vv2=((2*bb-xdif/2)*(291-zdif/2)/(4*bb*11))*wl;
fprintf(fout,"f, 0/0-10d, fy, %14f \n",e[i].en1,-1000*w2); sum=sum-Ew2;
w2=((xdif/2)*(2*11-zdif/2)/(4*bb*11))*w1;
VIII
fprintf(fout,"f, %-10d, fy, 0/014f \n",e[j].en2,-1000*w2); sum=sum+w2;
w2=((xdif/2)*(zdif/2)/(4*bb*11))*wl;
fprintf(fout,"f, Wo-10d, fy, %14f \n",e[).en3,-1000*w2); sum=sum+w2;
}
}
if(nw[i].z==snzmax&&nw[i].x==snxmax)
{xdif=((wx+A/2)-snxmax);
zdif=((wz+B/2)-snzmax);
w1=ws*xdif*zdif;
vv2=((2*bb-xdif/2)*(2*11-zdif/2)/(4*bb*H)rwl; sum=sum+w2;
fprintf(fout,"f, Wo-10d, fy, %14f \n",nw[i].no,-1000*w2);
fortj =0 ;j <mm
{if(e[j].en1==nw[i].no)
-{w2=((xdif/2)*(2*11-zdif/2)/(4*bb*11))*w1; sum=sum+w2;
fprintf(fout,"f, 0/0-10d, fy, 0/014f \n",e[j].en2,-1000*w2);
w2=((xdif/2)*(zdif/2)/(4*bb*LI))*wl; sum=sum+w2;
fprintf(fout,"f, 0k-10d, fy, %l4f \n",e[j].en3,-1000*w2);
w2=((2*bb-xdif/2)*(zdif/2)/(4*bb*11))*w1; sum=sum+w2;
fprintf(fout,"f, 0/9-10d, fy, %l4f \n",e[n.en4,-1000*w2);
}
fprintf(fout,"Node with maximum x& maximum z \n%-10d %14f °/4314f
\n\n\n",nw[i].no,nw[i].x,nw[i].z);
}
}
for(i=0;i<snnnew;i++)
{if(nw[i].x==snxmin&Stnw[i].z==snzmin)
{xdif=(snxmin-(wx-A/2));
zdif=(snzmin-(wz-B/2));
wl=ws*xdif*zdif;
w2=((xdif/2)*(zdif/2)/(4*bb*I1))*vv1; sum=sum+w2;
fprintf(fout,"f,c1/0-10d, fy, 01014f \n",nw[i].no,-1000*w2);
for(j=0;j<mm;j++)
IX

{if(e(j].en3=-- nw[i].no)
{w2=((2*bb-xdif/2)*(2*11-zdif/2)/(4*bb*11))*w1; sum=sum+w2;
fprintf(fout,"f, 0/6-10d, fy, %141 \n",e[j].en1,-1000*w2);
w2=((xdif/2)*(2*11-zdif/2)/(4*bb*11))*w1; sum=sum+w2;
fprintf(fout,"f, %-10d, fy, %14f \n",e[j].en2,-1000*w2);
w2=((2*bb-xdif/2)*(zdif/2)/(4*bb*II))*wl., sum=sum+w2;
fprintf(fout,"f, %-10d, fy, %14f \n",e(j).en4,-1000*w2);
}
fprintf(fout,"Node with minimum x& minimum z \n%-10d %14f 1)/014f
\n",nw[i].no,nw[i].x,nw[i].z);
}
if(nw[i].x==snxmin&&nw[i].z==snzmax)
{xdif=(snxmin-(wx-A/2));
zdif=((wz+B/2)-snzmax);
wl=ws*xdif*zdif;
w2=((xdif/2)*(2*11-zdif/2)/(4*bb*Ii))*wl; sum=sum+w2;
fprintf(fout,"f, 13/0-10d, fy, %14f \n",nw[i].no,-1000*w2);
for(j=0;j<mm;j++)
{if(e[j].en2==nw[i].no)
{w2=((2*bb-xdif/2)*(2*11-zdif/2),1(4*bb*11))*w1; sum=sum+w2;
fprintf(fout,"f, %-10d, fy, %14f \n",e[j].en1,-1000*w2);
w2=((xdif/2)*(zdif/2)/(4*bb*Ii)rwl; sum=sum+w2;
fprintf(fout,"f, %-10d, fy, %14f \n",e[j].en3,-1000*w2);
w2=((2*bb-xdif/2)*(zdif/2)/(4*bb*11))*wl; sum=sum+w2;
fprintf(fout,"1, 0/0-10d, fy, %14f \n",e[j].en4,-1000*w2);
}
cout«sum;
fprintf(fout,"Node with minimum x& maximum z \n%-10d %14f %14f
\n\n\n",nw[i].no,nw[i].x,nw[i].z);
}
}II
fclose(fout);
getch();}

APPENDIX-II The following scripting is done for calculation of bending moment from longitudinal
flexural stresses, which is used in present study to calculate bending moment shared
by each of girder of a composite box. Programming language CPP has been used to
for scripting.
Input required for program:-
1) Node listing with its coordinates of cross section under consideration.
2) Nodal stress values.
These files can directly be taken from ANSYS software and inputted to program #include<stdio.h>
#include<iostream.h>
#include<conio.h>
#include<math.h>
class node{
public:
int no;
float x,y,z,sx,sy,sz;
};
int main()
FILE *fpl,*fp2,*fout;
node n[500];
char str[150];
float sx,sy,sz;
int i=0,nn,nno;
fpl=fopen("NLIST.lis","r");
fp2=fopen("PRNSOLlis","r");
fseek(fp1,0,SEEK_SET);
fgets(str,150,fp1);
while (fgets(str,150,fp1)!=NULL)
{
sscanf(str,"%d %f Wof Wof",&n[i].no,&n[ ].x,&n[i].y,&n[i].z);
}
XI

nn=i;
cout«n[I].no<<endl;
fseek(fp2,0,SEEK_SET);
fgets(str,150,fp2);
while (fgets(str,15O,fp2)!=NULL)
{
sscanf(str,"%d %f %f Wor,&nno,&sx,&sy,&sz);
for(i=0;i<nn;i++)
if(n[i).no == nno)
n[i].sx=sx;
nti).sy=sy;
n[i].sz=sz;
}
}
fout=fopen("ol.txt","w");
nn=i;
fprintf(fout,"node no\t\txx\es,tyy\t\tsz\n");
for(i=0;i<nn;i++)
{
printf("0/0-10d °/014f 0/014f %l4f \n",n[i].no,n[i].x,n[i].y,n[i].sz);
fprintf(fout,"0/0-10d %141 %14f %14f \n",n[i].no,n[i].x,n[i].y,n[i].sz);
}
getch();
getch();
class Node
{
public:
float x,y;
double stress,stress2,moment,larm,area,sstress;
int processed;
I;
XII

float A,B,C,D,aa,aal,aa2,t1,t2,t3,t4,wl,da,ufa,lfa,wa,W;
float y,dew,wew,Ifew,aaIew,aa2ew,temp,oriy,Ixx;
int nc=1,nofelements,cnt,nk,mm,j,l;
double totalmoment=0,totalstress,cony,moment;
Node nodes[100];
FILE *fp;
float xx,yy,zz;
frit vl,x;
double stre,sxy,sstre;
double changedc,changedt2,1fl,deckarea,ufarea,wareagarea;
double tarea,deckcg,ufcg,wcg,Ifcg,Es,Ec,m,M,m0[10],m1,m2,m3,m4;
cout«"enter the values: ";
cout<<"\nenter A(total width of deck)";
cin> >A;
cout«"\nB(width of cell)";
cin»B;
cout«"\nW(carriage way width of bridge)";
cin»W;
cout<<"\naa(Overhang of deck)";
cin»aa;
cout«"\nC(width of upper flange)";
cin»C;
cout«"\nD(upper to bottom flange length)";
cin»D;
cout«"\ntl(thickness of upper flange)";
cin»t1;
cout«"\nt2(thickness of web)";
cin>>t2;
cout«"\nt3(thickness of bottom flange)";
cin»t3;
cout«"\nt4(thickness of concrete deck)";
cin»t4;
cout«"\nenter the no of cells";
cin»nc;
aa=(A-nc*I3)12;
XIII
aa2=(A-W)/2;
aal =aa-aa2; nk=(nc-1)*3-1-8; cout<<"enter the no of element divisions for:"; cout«"\nconcrete deck:";
Cirl>>x; dew=13/x; cout«"\nweb:";
cin>>x;
vvew=(D-(tl-Ft3)/2)/x; cout<<"\nlower flange-.";
ci n Ifevv; Ifew =dew ; cout«"\nouter overhang portion:";
cin»x; aa2ew=aa2/x; cout<<"\ninner overhang portion:";
cin»x; aalew=aa1/x; cout<<nenter Es:";
cin»Es; cout<<"enter Ec:";
cin> >Ec;
m=Es/Ec; cout< <"m= "< < m;
changedc=C*m; changedt2=t2*m; If1=(nc*B-1-t2)*m;
deckarea=A*t4;
ufarea=(nc+1)*tl*changedc; warea=(nc-+-1)*(D-t1-t3)*changedt2;
Ifarea=lfl*t3; deckcg=D-i-t4/2;
ufcg=0-t1/ 2; wcg=D/2-t1/24-t3/2;
XIV

Ifcg = t3/ 2;
tarea = (deckarea +ufarea +wa rea +1farea);
oriy=(deckarea*deckcg+ufareatufcg+warea*wcg+Ifarea*Ifcg)/tarea;
cout«''y= "«oriy«endl;
y=D+t4/2-oriy;
w1=D-t143;
Ixx–(deckarea*t4*t4/12+deckarea*y*y)+(ufarea*tl*t1/12+ufareaspow((y-
t4/241/2),2))
+(warea*pow(w1,2)/12+warea*pow((w1/2+tl+t4/2-
y),2))+(lfarea*t3*t3/12+1farea*pow((D+t4/2-0/2-y),2));
cout«" \nIxx="«Ixx«endl;
M=O;
for (j=0;j<nc+1;j++)
{
//moment contributed by deck//
m1=0;
for(i=0;1<nn;1++)
{
if(n[i].y= =0)
{ if(j==0&&n[i].x<=aa)
//if(j==0&&n[i].x<=((A-nc*B)/2+0.5*B))
{
if(n[i].x<=aa2)
{ if(n[i].x==01 1 n[i].x==aa2)
//if((n[i].x—Olin[i].x==((A-nc*B)/2+(j+0.5)*13)))
m1+=n[i].sz*t4*aa2ew/ 2*y;
if(n[i].x!=0&&n[i].x!=aa2)
// if((n[i].x!=08.8m[i].x!=((A-nc*B)/2+(j+0.5)*B)))
m1+ = n[i].sz*t4*aa2ew*y;
}
if(n[i].x>=aa2&&n[i].x<=aa)
{ if(n[i].x==aal I n[i].x==aa2)
//if((n[i].x==01 I n[i].x==((A-nc*B)/2+(j+0.5)*B)))
m1+=n[i].sz*t4*aalew/2*Y;
if(n[i].x!=aa&Stn[i].xl=aa2&&n[1].x!=0)
XV

// if((n[i].x!=0&&n[i].x!=((A-nc*B)/2+(j+0.5)*B)))
n[i].sz*t4*aalew*Y; }
}
if(j==08t&n[0.x< =((A-nc*B)/2+0.5*B)&8in[i].x>=aa)
{ if(n[i].x= =((A-nc*B)/2+(j+0.5)*8) I In[i].x==aa)
m1+=n[i).sz*teclew/2*y;
if(n[i].x!=((A-nc*B)/2+(j+0.5)*B)&8tri[i].x!=aa)
ml+=n[i].sz*t4*dew*y;
}
if01--.0&&j!=nc&&n[1].x>=((A-nct13)/2+(j-0.5)*B)&13m[i].x<=((A-nc*B)/2+(j+0.5)*9))
{
if(n[i].x= =Al infijox==((A-nc*B)/2+(j-0.5)*8)11n[i].x==((A-
nc*B)/2+(j+0.5)*B))
ml+ =n[i].sztt4*dew/2*y;
if(n[i].x!=AMtn[i].x!=((A-nc*B)/2+(j-0.5)*B)&&n[i].x!=((A-
nct8)/2+(j+0.5)*B))
m1+=n[i].sztt4sdew*y;
if(j= =nc&&n[i].x> =(A-aa)&&n[ i].x< =A)
if(n(i).x<=A-aa2)
{
if(n[i].x==A-aa21 ri[i].x= —(A-aa))
m1+=n[i].sz*t4*aalew/2*y;
if(n[i].xt=A-aa2&&n[i].x! =(A-a a))
nn1+=n[i].sz*t4taalewty;
} if(n[i].x> =A-aa2)
if(n[i].x= =A-aa211n[i]:x= =A)
m1+=n[i].sz*t4saa2ew/2*y;
if(n[i].x1=A-aa2&&n[i].x! =A)
XVI
m 1 + = n [I].sz*t4*aa2ew*y;
} }
if(j==nc&&n[i].x>=((A-nc*13)/2+(nc-0.5)*B)&&n[i].x<=A-aa)
{
if(n[i].x==((A-nc*B)/2+(nc-0.5)*B)] I n[i].x==A-aa)
m 1+= n[i].sz*t4*dew/2*y;
if(n[i].x!=((A-nc*B)/2+(nc-0.5)*B)&&n[i].x!=A-aa)
m1+=n[i].sz*t4*dew*y;
}
}
//moment contributed by top flanges//
m2=0;
for(i=0;i<nn;i++)
if(n[i].y==-(t4+t1)12)
if(n[i].x==((A-nc*B)/2+j*B))
m2+=n[i].szttl*C*(y-t4/2-t1/2);
m2+=(n[i]•y-y)*(n[i].sz)*t2*wew/2;
}
}
//moment contributed by bottom flanges//
m3=0;
for(i=0;1<nn;i++)
{ if(n[i].y==-(D-i-t4/2-t3/2))
{
if(j==0&&n[i].-x<=((A-nc*B)/2+0.5*B))
{
if(n[0.x==((A-nc*B)/2))
{ m3+=n[i].sz*t3*Ifery/2*(oriy-t3/2);
m3-=(n[L].y-y)*(n[i].sz)*t2*yvevv;}
XVII

if(n[i].x==((A-nc*B)/2+0.5*B))
m3+=n[i].sz*t3*Ifew/2*(oriy-t3/2);
if(n[i].x‹((A-nc*B)/2+0.5*B)&&n[i].x!=((A-nc*B)/2))
m3+=n[i].sz*t3*Ifew*(oriy-t3/2);
iftil=0&&n[i].x<=((A-nc*E3)/2+(j-1-0.5)*B)&&n[i].x>=((A-nc*E)/2+(j-0.5)*13)) {
if(n[i].x==((A-nc*B)/2+j*B))
-(m3+=n[i].sz*t3*Ifew/2*(oriy-t3/2);
m3-=(n[i].y-y)*(n[i].sz)*t2*wew;}
if(n[i].x==((A-nc*B)/2+(j-0.5)*B))
m3+=n[i].sz*t3*Ifew/2*(oriy-t3/2);
if(n[i].x==((A-nc*B)/2+(j+0.5)*B))
m3+=n[i].sz*t3*Ifew/2*(oriy-t3/2);
if(n[i].x!=((A-nc*B)/21-(j-0.5)*B)&&n[i].x!=((A-
nc*E)/2+(j+0.5)1 3)&&n[0.x!=((A-nc*B)/2+j*B))
m3+=n[i].sz*t3*Ifew*(oriy-t3/2);
}
}
}
m4=0;
//moment contributed by webs//
for(i=0;i<nn;i++)
{
if(n[i].x==((A-nc*B)/2+j*B))
{
if(n[i].y==-(t4+t1/2+wew)&&n[i].y==-(D+t4/2t3/2-wew))
m4+=(n[i].y-y)*(n[i].sz)*t2*wew/2;
else
{if(n[i].y!=0&&n[i].y!=-(D+t4/2-0/2)&&n[i].y1=-(D-I-t4/2))
m4+=(n[i].y-y)*(n[i].sz)*t2*wew;}
}
}
m=-ml-m2+m3-m4;
//cout«"moment contribution of members out of 500kn-m"«endl;
XVIII
cout«"deck="«-m1/(1000000)«endl;
fprintf(fout,"\n %f",-m1/(1000000));
cout«"top flange="«-m2/(1000000)«endl;
fprintf(fout,"\n %f",-m2/(1000000));
cout«"bottom="«m3/(1000000)«endl;
fprintf(fout,"\n "Or,m3/(1000000));
cout«"web="«-m4/(1000000)«endl;
fprintf(fout,"\n %f",-m4/(1000000));
cout«"total moment taken by''«j+1«"th GIRDER ="«m/(1000000)<<endl;
fprintf(fout,"\n Wer,m/(1000000));
getch();
}
for(j=0;j<nn;j++)
cout«"total moment taken by"«j+1<<"th GIRDER ="«mO[j]/(1000000)«endl;
cout«"distribution factor of girder = "«mO[ji/M/1000000«endl;
}
getch();
fclose(fout);
}
XIX

APPENDIX-HI
ILLUSTRATIVE EXAMPLE
Problem: Consider a two lane, three-cell, simply supported bridge with a concrete
deck slab composite with a steel section to be designed according to IRC
specifications. The bridge details are as follows: Span length = 20 m. deck width =
8.5 rn, deck slab thickness = 250 mm, steel plate thicknesses = 16 mm, top flange
width = 300 mm, steel section depth = 800 mm, modulus of elasticity of steel =
2e5 MPa, and modular ratio = 8. Calculate the design moment and shear forces for
this bridge.
Sob• taking the concrete and steel densities as 24 kN/ m3 and78.5 kN/ m3
respectively, the total dead load per meter length for the bridge is 60 kN/m. Based
on this value, the maximum dead load moment at midspan 3000kNm and the
maximum reaction 600 kN.
Applying a train of IRC Class 70R loading on a simply supported girder of
span 20 rn, the maximum moment at the midspan, MLL is 3378.2 kNm and the
maximum reaction, Vu, is 743.79 kN. Considering the dead load to be distributed
to the girders according to their relative stiffness and using the equations
mar
M
D xv — vmaa
V
The moment distribution factors for the outer girder of the bridge can be obtained
as 0214 (Table 5.2) due to dead load and 0.230 (Table5.3) due to wheel loading.
The moment distribution factor for the intermediate or central girders due to dead
load is 0.286 (Table 5.2) and due to live load is 0.288 (Table 5.3).
Shear distribution factor for outer web can be obtained as 0.246 (Table 5.5) for
dead load and 0.307 (Table 5.6) for live load for outer web and 0.254 (Table 5.5)
for dead load and 0.405 (Table 5.6) for live load for intermediate as well as central
web. By multiplying each moment distribution factor by MDL for dead load and by
MLL for live load, the moments carried by each girder are found.
X X I
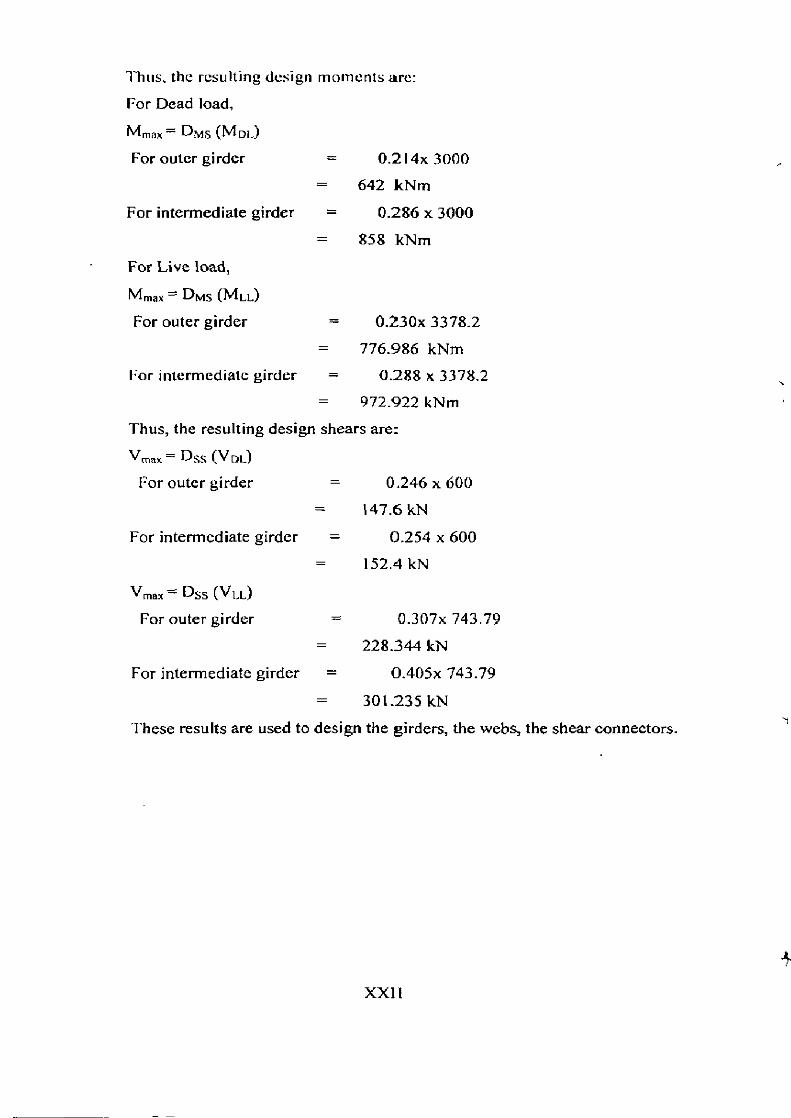
Thus, the resulting design moments are:
For Dead load,
Mmax= DMS (MDI)
For outer girder = 0.214x 3000
- 642 kNm
For intermediate girder = 0.286 x 3000
- 858 kNm
For Live load,
Mmax = DMS (Mta.)
For outer girder
For intermediate girder
0.230x 3378.2
776.986 kNm
0.288 x 3378.2
972.922 kNm
Thus, the resulting design shears are:
Vmax= Dss (Vol]
For outer girder = 0.246 x 600
- 147.6 kN
For intermediate girder = 0.254 x 600
- 152.4 kN
Vmax = Dss (V11)
For outer girder = 0.307x 743.79
- 228.344 kN
For intermediate girder = 0.405x 743.79
301.235 kN
These results are used to design the girders, the webs, the shear connectors.
XXII
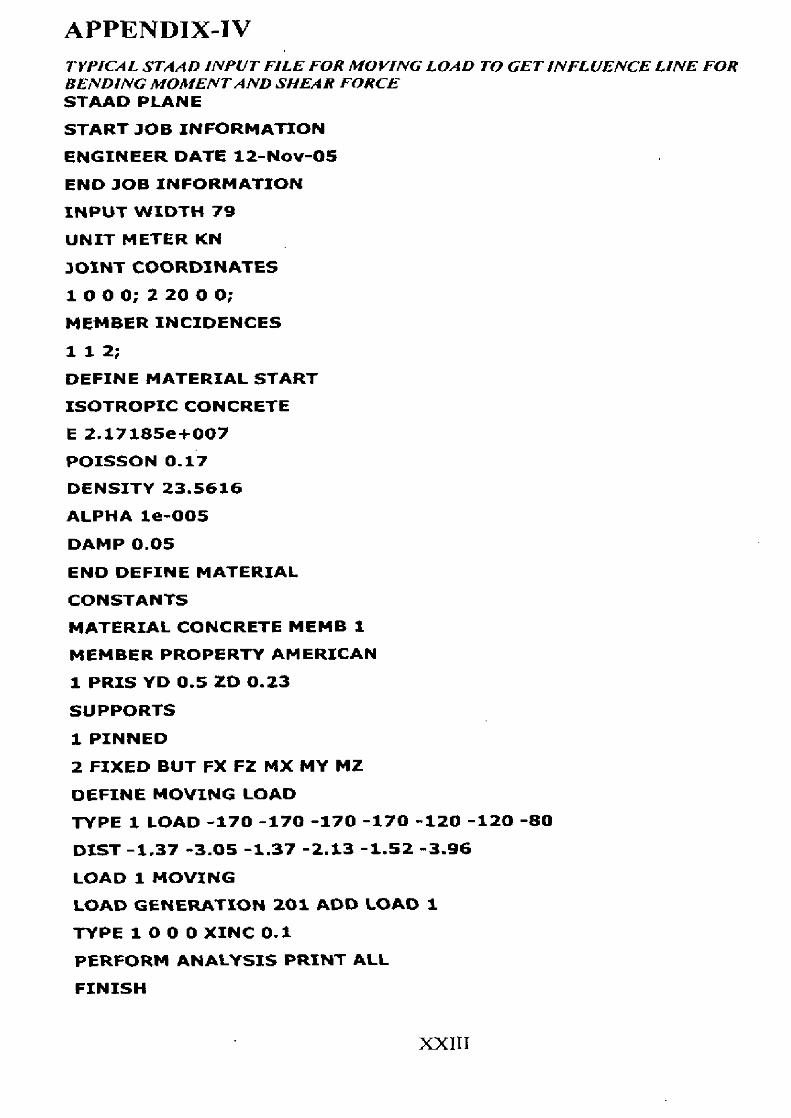
APPENDIX-IV TYPICAL STAAD INPUT FILE FOR MOVING LOAD TO GET INFLUENCE LINE FOR BENDING MOMENT AND SHEAR FORCE STAAD PLANE
START JOB INFORMATION
ENGINEER DATE 12-Nov-05
END JOB INFORMATION
INPUT WIDTH 79
UNIT METER KN
JOINT COORDINATES
1 0 0 0; 2 20 0 0;
MEMBER INCIDENCES
11 2;
DEFINE MATERIAL START
ISOTROPIC CONCRETE
E 2.17185e+007
POISSON 0.17
DENSITY 23.5616
ALPHA 1e-005
DAMP 0.05
END DEFINE MATERIAL
CONSTANTS
MATERIAL CONCRETE MEMB 1
MEMBER PROPERTY AMERICAN
1 PRIS YD 0.5 ZD 0.23
SUPPORTS
1 PINNED
2 FIXED BUT FX F2 MX MY MZ
DEFINE MOVING LOAD
TYPE 1 LOAD -170 -170 -170 -170 -120 -120 -80
DIST -1.37 -3.05 -1.37 -2.13 -1.52 -3.96
LOAD 1 MOVING
LOAD GENERATION 201 ADD LOAD 1
TYPE 1 0 0 0 XINC 0.1
PERFORM ANALYSIS PRINT ALL
FINISH
XXIII
Related Documents