1 Activity-Based Costing in Danish Small and Medium- Sized Enterprises

Welcome message from author
This document is posted to help you gain knowledge. Please leave a comment to let me know what you think about it! Share it to your friends and learn new things together.
Transcript

1
Activity-Based Costing in
Danish Small and Medium-
Sized Enterprises

2
Bachelor Thesis
Jeppe Green Krejberg ________________
Joachim Grøfte Ulfkjær ________________
Nikolay Ivanov Georgiev ________________
Supervisor: Ali Naef Mohammad
Aalborg University
Economics and Business Administration
6th Semester
26/05/2015

3
Thesis Abstract / Summary
This particular project was chosen to be on the topic of Management accounting. It was
learned through lectures that Time-Driven Activity Based Costing is not as widely used at it
should be despite the effectiveness. This inspired the group to look into what small to
medium sized enterprises can do to undertake this model. In order to reach a high level of
discussion, it was decided that a literature review would be done on the subject. On top of
that, it was also decided to make a survey to have independent results that could then be
compared and contrasted to the existing literature.
Literature was collected systematically based on keywords. These keywords were limited
down to find articles based on the adoption of Activity Based Costing. After looking through
the articles, the literature review presented the different contingency factors for the adoption
of Activity Based Costing. These contingencies inspired the questions for the survey which
was performed afterwards. The questions were presented to the subjects as relating to the
allocation of overhead costs. The survey was first focused on the adjusted criteria of Danish
small to medium sized enterprises (20-200 employees). These companies were found on an
online database and in the end the survey was sent out to over 1000 companies all over
Denmark.
The survey resulted in over 100 respondents, where nearly 14% responded that they used
Activity Based Costing or Time-Driven Activity Based Costing. A statistical analysis of the
survey results was then performed. Different tests were made to illustrate the reliability of the
results and to find different correlations associated with the use of Activity Based Costing.
Different connections were made between the questions relating to different contingencies
from the literature review and Activity Based Costing in the independent survey. Other
observations were also made that were not observed in the literature review or in the
statistical analysis. All these different findings were compared, contrasted, and discussed.
From that, a conclusion was able to be formed which presented, which factors were thought
to be the most influential in terms of adopting Activity-Based Costing in small to medium
sized enterprises in Denmark.

4
This research found a significant and strong correlation between the use of ABC and TDABC
and two factors: Complete cost overview within the company and leaders using
acknowledged principles. This shows that ABC and TDABC adoption is significantly
influenced by the companies currently having great cost overview and/or leaders using these
models are considered to be applying theory to practise, so this further contributes to the
discussion of the question of why the model is not applied to more cases. Additionally,
through the descriptive statistics available from the survey, Danish SME’s relevancy to ABC
is discussed, in regards to product variance, IT and others.

5
Table of Contents
1. Introduction ..................................................................................................................................... 7
1.1 Activity-Based Costing in Small and Medium-Sized Enterprises ................................................ 7
1.1.1 Diffusion of Activity-Based Costing ................................................................................... 10
1.2 Problem Formulation .................................................................................................................. 12
1.2.1 Research question ................................................................................................................ 13
1.3 Limitation .................................................................................................................................... 13
2. Methodology ................................................................................................................................. 15
2.1 Paradigms .................................................................................................................................... 15
2.2.1 Structuralism and ontology .................................................................................................. 17
2.2.2 Epistemology of structuralism ............................................................................................. 18
2.3 Method and puzzle solving techniques ....................................................................................... 18
2.3.1 Literature review .................................................................................................................. 18
2.3.2 Survey and techniques ......................................................................................................... 19
2.3.3 Non-response bias ................................................................................................................ 21
3. Theoretical background of Activity-Based Costing ...................................................................... 22
3.1 Time-Driven Activity-Based Costing ......................................................................................... 24
3.2 Development of ABC ................................................................................................................. 25
4. Literature review: Is ABC relevant for SMEs? ............................................................................. 26
4.1 TDABC’s application ................................................................................................................. 26
4.2 Activity-Based Costing’s application in SMEs .......................................................................... 27
4.3 Contingency based theory and ABC ........................................................................................... 29
4.3.1 Organizational size ............................................................................................................... 31
4.3.2 Organizational structure ....................................................................................................... 32
4.3.3 Organizational strategy ........................................................................................................ 33
4.3.4 Organizational culture .......................................................................................................... 34
4.3.5 External uncertainty ............................................................................................................. 34
4.3.6 Technology .......................................................................................................................... 35
5. Analysis of findings ...................................................................................................................... 36
5.1 Hypothesis testing ....................................................................................................................... 39
5.2 Prediction model ......................................................................................................................... 42
6. Discussion ......................................................................................................................................... 43
6.1 Model Flaws vs. Diffusion .......................................................................................................... 44

6
6.2 Most Significant Findings ........................................................................................................... 45
6.3 Contingency factors .................................................................................................................... 47
6.4 Other Relevant Findings ............................................................................................................. 49
6.4.1 Product Variation ................................................................................................................. 50
6.4.2 Product Variation / Cost Overview Correlation ................................................................... 50
6.4.3 IT systems /Cost Overview Correlation ............................................................................... 52
6.4.4 Non-Significant Predictors ................................................................................................... 53
7. Conclusion .................................................................................................................................... 53
8. Future research .............................................................................................................................. 54
8.1 Quantitative ................................................................................................................................. 55
8.2 Qualitative ................................................................................................................................... 56
Bibliography ......................................................................................................................................... 57
7
1. Introduction
With the current level of competitiveness in today’s world, where firms strive to maximize
profits and market share (Karl E. Chase, 2012), managers need methods of improving their
success. One significant part of the firm is the accounting and management of the firm’s
costs. Cost systems are different ways of accounting which a firm can adopt. These systems
differ from company to company, depending on a number of different factors. With proper
implementation of the systems and keeping them up-to-date, previous inconsistencies can be
fixed and possibly lead to a higher marginal profit.
Cost systems have existed for centuries and have been innovated in different ways since then.
Anthony (1989) explains that back in the day, it was often assumed that a company would
only make one product. With little variety, management accounting texts 60 years ago often
didn’t recognize differentiating products. However, the topic has been on the rise in the US,
with the rest of the world catching up. During the mid-1980’s Miller & Vollmann (1985)
emphasized the cost structures of manufacturing firms and their cost allocations. It was
shown how, because of the new more modern environment with diversified support activities
and diversified product portfolios, costs were incorrectly allocated. One of the main factors
for this improper allocation was the use of output volume as a driver for overhead cost.
Now that today’s firms have been growing to the point where their products are becoming
increasingly complex and the range of activities continue to broaden, their overhead costs
also start to increase (Gunasekarn & Sarhadi, 1998).This called for a more advanced costing
methodology. Robert Kaplan and Robin Cooper (1988) popularized a system that would help
companies take all the overhead costs into account, as well as all the activities associated with
them. They named it Activity-Based Costing (ABC).
1.1 Activity-Based Costing in Small and Medium-Sized Enterprises
ABC was originally found to be very complex and expensive for companies; this implies that
not all companies in the world can so easily adopt the system. However, as ABC evolved into
a simpler and more sustainable model, it naturally became more applicable to a wider range
of enterprises. Research has showed that ABC isn’t only relevant for large corporations, but

8
can be beneficial for smaller companies (Hicks, 1999). However, based on the amount of
literature collected for this project, very little has been written on ABC with a focus on
smaller companies.
This paper will concentrate on Small and Medium Sized Enterprises (SMEs) and their
relation to the ABC system. SMEs are defined by the Danish parliament (2005) in two
categories: the Håndværksråd definition (translated: Crafts Council) and the European Union
(EU) criteria. The criteria can be categorized in terms of total revenue and also the number of
employees in the company.
EU Criteria
Criteria Micro Small Medium
Number of
employees
<10 <50 <250
Revenue < 2 million Euros
(around 15 million
DKK)
< 10 million Euros
(around 75 million
DKK)
< 50 million Euros
(around 375 million
DKK)
Table 1 EU - SME criteria (Source: Danish Parliament, 2005)
Håndværksrådet Criteria
Criteria Small Medium
Number of employees <10 <100
Table 2 Håndværksrådets SME criteria (Source: Danish Parliament, 2005)
As seen on the tables above, the criteria for the number of employees differ quite
significantly. Denmarks Statistics (2012) reported that in 2010, that 93% of all Danish
companies in the private sector fell under the category of micro companies, while companies
with over 250 employees accounted for only 0.2%. These numbers arise from the EU criteria
which puts the majority of Danish companies within the definition of micro. Seeing that the
data of Danish companies is skewed in the eyes of the EU, the Håndværksråd came up with
their own definitions that better suit the Danish standards of an SME.
Håndværksrådet is an organization that works with the business community to help SMEs
thrive and secure them the best working conditions, in an environment where larger
9
companies have a lot of influence. Today it is an umbrella organization that represents around
20,000 SMEs within different industries in Denmark (Håndværksrådet, 2015). When taking
into account the EU criteria, it does not adequately reflect the Danish SME standards, but
when taking the criteria of Håndværksrådet into account, it won’t fully coincide with the
papers being analysed in the literature review. Therefore a customized criterion has been
established in order to best suit both situations.
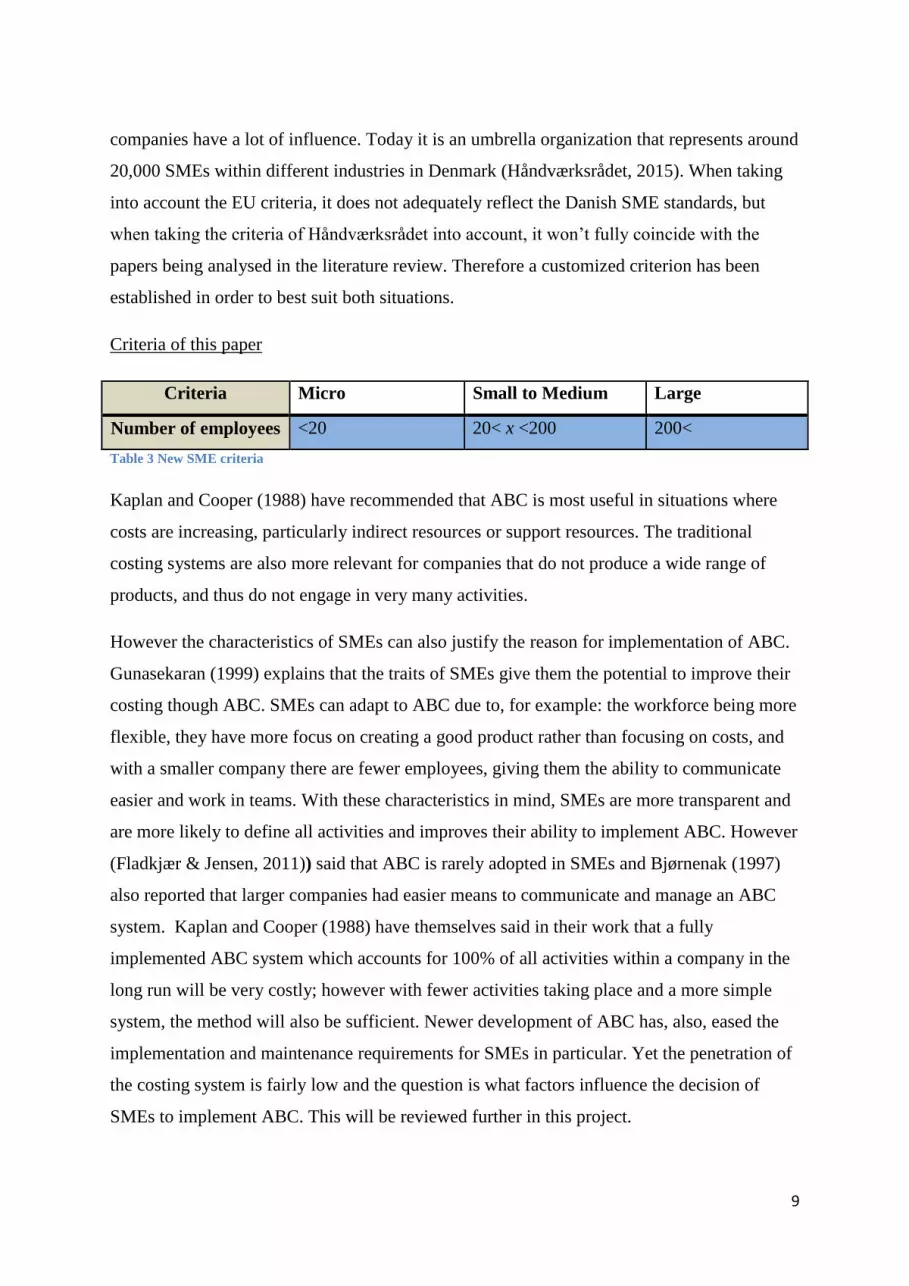
Criteria of this paper
Criteria Micro Small to Medium Large
Number of employees <20 20< x <200 200<
Table 3 New SME criteria
Kaplan and Cooper (1988) have recommended that ABC is most useful in situations where
costs are increasing, particularly indirect resources or support resources. The traditional
costing systems are also more relevant for companies that do not produce a wide range of
products, and thus do not engage in very many activities.
However the characteristics of SMEs can also justify the reason for implementation of ABC.
Gunasekaran (1999) explains that the traits of SMEs give them the potential to improve their
costing though ABC. SMEs can adapt to ABC due to, for example: the workforce being more
flexible, they have more focus on creating a good product rather than focusing on costs, and
with a smaller company there are fewer employees, giving them the ability to communicate
easier and work in teams. With these characteristics in mind, SMEs are more transparent and
are more likely to define all activities and improves their ability to implement ABC. However
(Fladkjær & Jensen, 2011)) said that ABC is rarely adopted in SMEs and Bjørnenak (1997)
also reported that larger companies had easier means to communicate and manage an ABC
system. Kaplan and Cooper (1988) have themselves said in their work that a fully
implemented ABC system which accounts for 100% of all activities within a company in the
long run will be very costly; however with fewer activities taking place and a more simple
system, the method will also be sufficient. Newer development of ABC has, also, eased the
implementation and maintenance requirements for SMEs in particular. Yet the penetration of
the costing system is fairly low and the question is what factors influence the decision of
SMEs to implement ABC. This will be reviewed further in this project.
10
1.1.1 Diffusion of Activity-Based Costing
From the birth of the costing system until recent times, as it will be shown further below,
ABC has had a very turbulent life. Its first idea of being only a costing system has been
rethought and different applications of it have emerged. During its existence, the model has
been through highs and lows, marked by different innovations in the usage of it (Gosselin,
2007). It has been praised and criticized heavily, yet it has been concluded that it is a more
accurate costing method than the traditional costing systems used (Cooper & Kaplan, 1988).
Additionally, its diffusion process (the spread of the costing system) has been very
ambiguous (Gosselin, 1997), which will be shown throughout the paper.
A definition Bjørnenak (1997) uses to define diffusion is given by Webster (1971): “The
social process by which an innovation spreads through a social system over time.” It can be
divided into two sub-categories, which will be examined below.
Relocation diffusion is a sub-category of diffusion, related to how ideas spread through areas,
without necessarily increasing number of adopters. Bjørnenak (1997) elaborates on this
concept through his study which showed a significant number of companies did not have any
knowledge of the ABC system and thus pointed out that there are still issues when it comes to
the supply-side of ABC. One thing that can’t be argued with, though, is that Activity-based
costing is one of the most popular innovations in management accounting in the past 30 years
(Gosselin, 2007). Following its introduction and development in various papers during the
late 80’s by Kaplan and Cooper, ABC started becoming popular among academics. This led
to the innovation spreading rapidly to Europe (Gosselin, 2007). Gosselin (2007) conducted a
study on the number of papers that were written on ABC during the period from 1988 to 2004
and concluded a total of 1477 articles written on the subject for those 17 years. The costing
system has therefore been part of numerous articles; it has been incorporated in most, if not
all, accounting programs and books (Gosselin, 2007) and has been part of the most popular
text books in the UK and USA (Atkinson, et al., 2004) (Hilton, 2005) (Horngren, et al.,
2002).
Therefore, whether or not Bjørnenak’s results are relevant at present time could be taken
under consideration. Even though, the scope of this paper does not cover relocation diffusion
(knowledge) of ABC, it can be assumed from the all of the above that its level is high, though
having in mind the less widened communication channels of SMEs.

11
The table below shows a summary of surveys of several companies in different countries and
the implementation rates of ABC could be examined in relation to the above discussed high
popularity. This is related to the second type of diffusion – Expansion diffusion, which is
related to growth of adopters of a specific innovation, in this case - the rise of adoption
among firms (Bjørnenak, 1997).
Authors Country Adoption rate of ABC
Innes et al. (2000) United Kingdom 17,5%
Bescos et al. (2002) Canada and France 23.1%
Cotton et al. (2003) New Zealand 20,3%
Kianni & Sangeladji (2003) USA 11,8%
Pierce & Brown (2004) Ireland 27,9%
Cohen et al. (2005) Greece 40,9%
Askrarany (2007) Australia 13,7%
Al-Omiri (2007) United Kingdom 29%
Breiley (2008) United Kingdom 5%
Kallunki (2008) Finland 28%
Baird (2008) Australia 42%
Jankala (2012) Finland 12%
(Sandalgaard, et al., 2012) Denmark 10%
Table 4 Developed from Gosselin (2007)1
As it can be seen on the numbers, considering the cost system’s popularity, the low rate of
adoption is clearly illustrated. This creates a paradox that will be addressed in more detail
further down.
1 Gosselin (1997) and Baird (2004) showed that there might be some confusion in the understanding of what
exactly is ABC. Furthermore, Gosselin (2007) also discussed the tendency of ABC non-adopters to be less inclined to answer surveys. All of this would therefore lead to the over-estimation of the rates of implementation.

12
1.2 Problem Formulation
As it can be seen from the surveys conducted, the diffusion process of ABC is not as strong
as one might expect. When the extensive amount of literature on the subject is contrasted to
the implementation rates of ABC it is very easy to see the point of issue. There are two main
suggestions made about why this is so. One of them is that the model is just not appropriate
for most companies, due to its high maintenance and accounting education requirements
(Brown, et al., 2004) . This notion is backed up by the surveys showing companies adopting/
implementing ABC and then abandoning it (Kaplan & Anderson, 2004). The other suggested
explanation is that people don’t know about the costing system (Bjørnenak, 1997). These
reasons could both be particularly true for SMEs, as smaller companies tend to have less
educationally specialized managers and fewer resources (Gunasekaran & Singh, 1999).
Additionally, the past failure of large companies to deal with the costing system has created
the impression that SMEs should not undertake ABC (Hicks, 1999). All this has possibly
contributed to a very low penetration rate in SMEs.
However, as argued about above, ABC is one of the most popular systems out there.
Furthermore, its recent development and the introduction of TDABC have made it more
simplified and reduced its complexity and necessities greatly (Kaplan & Anderson, 2004)
Even so, the diffusion of ABC continues to stay low, especially amongst SMEs (Jänkälä &
Silvola, 2012).This creates, as Gosselin (1997), Kennedy & Affleck-Graves (2001) and
others referred to, an ABC-Paradox.
Trying to understand the sluggish diffusion process, contingency theory began to be
considered appropriate. The limits outlined by Noreen (1991) and the other implications
connected to ABC showed that ABC was not designed for all companies. Therefore,
researchers started examining contingency factors related to adoption of the management
accounting system. These factors are comprised of external and internal criteria that included
size, structure, strategy, culture, technology and perceived external uncertainty that influence
the organization (Chenhall, 2007). Between the start of the contingency criteria research
(around 1995) and present time, many articles have been published on what factors influence
the decision to adopt and implement ABC/TDABC (Gosselin, 2007), which include both
survey and case study analysis. However, very little focus has been given to contingency
factors of influencing the smaller sized enterprises, despite the fact that their contribution to

13
the Global and Danish economies is especially high and increasing and that ABC was argued
to be relevant to smaller enterprises (Hicks, 1999) (Gunasekaran, et al., 1999).
Based on the different issues that ABC is faced with, including diffusion, model flaws, and
relevance to SMEs, this paper will look into contingency theory and examine the linkage
between contingency factors that influence ABC adoption and characteristics of smaller
enterprises. In order to do so, a number of hypotheses will be developed through the literature
review, which will be answered through the analysis of the survey. Additionally, an attempt
to create a framework that would progress the understanding of management accounting
innovations’ diffusion in SMEs will be made.
Based on the problem formulation, this paper’s research question is written below.
1.2.1 Research question
What factors influence the adoption of ABC and TDABC in Danish SMEs?
In relation to this research question, these sub-questions would also need to be answered:
What factors influence the adoption of ABC excluding size variables (non-SME specific)?
Is ABC relevant for SMEs?
1.3 Limitation
A number of limitations have been encountered during the process of writing this project.
These limitations arose both through the collection of literature as well as the independent
study. Due to this research being very general as well, there are a number of things that were
not always taken into account.
To start, this study did not differentiate between the adoption or non-adoption of ABC and
TDABC, where TDABC was proven to be simpler and more applicable to companies who
may not previously have been able to adopt ABC (Kaplan & Anderson, 2004). Also, since
TDABC is a newer concept, the diffusion process was not differentiated between it and that
of ABC, but looked at both collectively, so there is still potential for the widespread success
of TDABC. Management accounting innovations have been discussed to require 4 or 6 stages
of implementation and the same goes for ABC (Hage, 1980) (Kwon & Zmud, 1987) The
14
contingency theory used in this paper is generally related to a specific stage of
implementation; however, this is left outside of the scope of the project and it was not
differentiated between the implementation of the system into individual departments or the
full organization.
In terms of literature collection, a limit was set for the sources not being older than 20 years
old, due to the fact that the information would be more valid to today’s business environment,
despite the development of the system going back further in time. ABC has also developed
and the ABC of 2015 is not the same as when it was created. The chosen papers were also
found to be written about cases of ABC/TDABC in already developed countries, distorting
the potential for the system to be used worldwide. With studies having primarily been carried
out in the US and EU, culture was not an aspect that was looked into very much in terms of
national traits. The culture within different countries could have an effect on the use, but this
would increase the scope too much. Likewise could the culture of employees and the
implementation process be of use, but this is kept as a future research.
Aside from the contingencies that have been researched, the idea of the life-cycle presented
by (Kallunki & Silvola, 2008), which illustrated an alternative way of looking at the
contingencies.
There were two ways of looking at ABC implementation: if companies were fit to adopt the
system, or if the company had experienced success with implementing ABC. The research
question asks what factors influence adoption, so the contingencies presented an idea of what
the companies require to be able to implement, but it does not guarantee the success in the
end.
When it came to the independent study, it was noticed that some of the answers may have
favoured the performance of the leaders. This may have been due to us asking the CEO or
CFO to fill out the survey. However, the answers were still acknowledged as truthful. Some
respondents also wrote to us that the questions were too theory based and expressed their
frustration with that fact, whereas some companies also wrote that since they were not a
production company, they deemed the survey inappropriate for them.
This paper also only focuses on expansion, hierarchical diffusion. It only differentiates
between adopters and non-adopters of ABC. Details of whether a certain unit has considered
15
ABC and abandoned it; or implemented ABC before and abandoned it, etc.; will not be
included in the analysis. Had that question been asked, a better understanding of the diffusion
process of ABC might have been reached. Further on, in the ABC case that has been selected,
the hierarchical category is the natural choice as the diffusion of the costing system has been
observed to be size-sensitive (Innes & Mitchell, 1995). This research also only looked into
the demand side of diffusion, since only the company’s point of view is taken into account,
instead of looking into the suppliers of ABC.
2. Methodology
The methodology of this research consist of three parts; all contributing to the discussions of
the others. For the sake of clarity we differ between the ontological and epistemological
choices and considerations, and the two methods used for solving the research question. The
methods described are natural puzzle solving tools that belong to a certain paradigm, which
we will elaborate further on.
When a researcher tackles a problem, he must first develop a discussion of his philosophy of
science (Kuada, 2012), where the reasoning behind his action is shown and discussed. This
discussion has different purposes: it relates to the type of problem and how the researcher
thinks this can be tackled in the best way possible or “Best practice”. This project handles a
quantitative subject, where the role of the researcher is to test specific hypotheses and the
data collection will often be vast so, as to reach statistical significance. The method of using
quantitative data is also often very specified, as there are certain customs and traditions that
must be held, in order to handle the issue of validity and reliability (Kuada, 2012).This
particular case used data collected from a survey which is considered one of the two main
ways of quantitative data collection, and will then seek to analyze the data statistically in
order to test some hypotheses.
2.1 Paradigms
The usage of paradigm in modern science is largely attributed to Thomas Kuhn with the
development of “The structure of Scientific revolutions” from 1962. In this book Kuhn
defines paradigms as:

16
“Men whose research is based on shared paradigms are committed to the same rules and
standards for scientific practice. That commitment and the apparent consensus it produces
are prerequisites for normal science i.e., for the genesis and continuation of a particular
research tradition.” (Kuhn, 1962)
This definition is still today adopted by many and will also be applied to this research as the
definition of paradigms. What this means is that paradigms are something shared within the
scientific community and it can be ways of doing quantitative research, and other puzzle
solving activities. The paradigms chosen set the standards for the research and it is within
those standards that you find the epistemology and ontology of the research.
Paradigms have since been discussed by many scholars in many different ways, especially the
debate on objectivism and subjectivism, which has created controversy. This has caused a
variety of paradigms to appear, and with them, different ways of classifying them.
Previously, classification was done using the FISI (Functionalism, interpretivism,
structuralism, interactionalism) model, which classified them on a two-dimensional graph.
The same was used for the RRIF (Radical Humanist, Radical Structuralist, Interpretive, and
Functionalist) model of Burell and Morgan (1979). These classification systems were
however criticised for choosing the research from the paradigm, and not letting the scope of
the research justify the choice (Deetz, 1996)
One of the more recent models is that of Arbnor and Bjerke (2009). This framework for
paradigms identifies three approaches: The analytical, the systems and the actors, which
subcategorize all of their nine paradigms. The framework also promoted and discussed the
correlation between paradigms and epistemology and ontology, which will be reviewed in
regard to the specific research question of this research. The analytical approach is the first
and most objective approach. In many ways it is similar to the functionalist’s paradigm,
where there is an objective truth, that the researcher can accurately depict by decomposing a
certain object and putting it back together to create the full picture (Arbnor & Bjerke, 2009).
This approach has met a lot of critique in the field of social science as the tools for gathering
information often requires communicative skill and thus renders the notion of objectivity
invalid. (Deetz, 1996)
17
The actors approach is more like the social constructivists paradigm and it is a subjective
approach that works from the notion that truth is a construction of human interaction, and
thus a subjective truth. This also means that this approach is more inclined to look at how the
interaction that the researcher contributed in was affected, and the idea is then, that a
discussion of this will create the notion of reliability (Arbnor & Bjerke, 2009).
The systems approach is somewhere in between but leaning towards the objective notion that
there is a truth, but the context and content of this truth is constantly changing. This also
means that the systems approach cannot make the assumption that the subject of investigation
is stable. Like the other two approaches there are 3 paradigms within that vary from leaning
towards objectivity to an objective-subjective mixture. The ontology of the paradigms also
differ highly, but This is the paradigm chosen for this research as it includes a level of self-
reflection as imposed by Deetz (1996), which creates the basics for the rest of this
methodological discussion.
2.2.1 Structuralism and ontology
The paradigm could be called structuralism as it has many of the traits that we know from
that paradigm. Structuralism also views the world in systems, and tries to find and explain
possible structures. It has deep roots the philosophy and has some parallels to determinism.
The paradigm as described by Abnor and Bjerke does however take on a more modernized
form of structuralism as it is also mentioned as an inspiration for the systems approach
(Arbnor & Bjerke, 2009). Kuada (2012) defines ontology as describing “… the nature of
what the researcher seeks to know (i.e., the “Knowable” or “Reality”).” The ontology of the
systems approach and the paradigm within is divided as a discussion of ontology is often a
definition of a subjective or objective worldview, and it does not provide a final answer. This
is due to the objective-subjective nature of the systems approach placement on the
continuum, and the fact that even though there is a reality, it is a dynamic one. Instead the
ontology of structuralism is “Reality as mutually dependent fields of information” (Kuada,
2012). What this means is that when trying to comprehend reality, we are looking at
interdependencies and structure in the fields of information. In the specific case it would be to
find the correlations between the ABC-system and the criteria that have been established by
other research.
18
2.2.2 Epistemology of structuralism
Epistemology is defined as how the researcher perceives truth as well as how knowledge is
created. For structuralism where truth is in structures, it means that the researcher is trying to
find answer to a truth. This is important as the structuralism views the duality of truth from
both sides, but tries to establish some rules in the continuously shifting world. And
knowledge is created in doing so.
In this case specifically it is, as mentioned, done by finding correlations, but not only in
through the survey and analysis. The literature review is also created in order to establish and
categorize a system, in which knowledge is created. These structures created can be made up
of almost anything, from cultural structures to organizational leadership structures.
When looking for these structures, and with the duality of structuralism, it is important to
note that almost all research oriented at the epistemology can be used. Structuralism is thus
not limited to quantitative measure, but as it has roots in linguistics, it can also undertake
qualitative research like interviews and bind them together. This research does however not
branch out as our limitation also makes clear. This issue of finding the criteria could however
be done in different ways through the structural paradigm, but the statistical analysis and the
structural equation modelling is, from an economics perspective, a large part of creating the
framework and the structure in the use of ABC.
2.3 Method and puzzle solving techniques
This segment will attempt to portray the methods used in the two main parts of the research;
The literature review that laid the basis for the development of new hypotheses, and the
survey and the techniques used to create validity and reliability.
2.3.1 Literature review
A systematic literature review is a comprehensive framework that takes into account all
relevant literature within certain search parameters, and then attempts to categorize and create
a system in the vast amounts of literature on a certain topic. Denyer & Tranfield (2008)
defines the need as: “For academic evidence to be used by managers it needs to be rendered
accessible, palatable, relevant and useful.” For this Denyer & Tranfield (2008) developed a
framework and a 5 step way of creating this framework. This method will be applied in
creating a systematic literature review (Denyer & Tranfield, 2008).

19
First step in the process was searching peer-review journals from the last 20 years relating to
Activity-Based Costing and Time-drive Activity-Based Costing in English. This provided us
with an initial pool of 3,521, so next we focused on a few key-words in order to diminish the
number of articles. The key-words used were: Implementation (implement/adoption
/application of), SME (small and medium sized enterprises) and criteria (factor). We then
focused on empirical studies and skimmed through the titles and abstracts of 264 articles.
In order to ensure that all relevant theory was recorded we applied the ancestry approach to
multiple articles that provided a detailed relatively new literature review such as: (Baird, et
al., 2007), (Jänkälä & Silvola, 2012) and (Gosselin, 2007). At the end we had 73 articles that
lived up to our criteria. The peer-reviewed part would also require that the journal of
publication was on the list of Bibliometric research indicator (Bibliometrisk
forskningsindikator – Autoritetsliste, 2015) released by Danish university as a way of
classifying journals.
Of those 73 articles, 20 are SME specific and the rest are related to the criteria in general or
the contingencies of adoption of the ABC-model. From that we find that a great number of
these can be subcategorized into a contingency framework developed by Chenhall (2007).
This is a way of systemizing the relevant literature as well as providing supported hypotheses
for further research.
2.3.2 Survey and techniques
In order to answer the hypotheses it was necessary to develop a survey and analyses the
result. The data is gathered using a simple survey method inspired by that of Jänkälä &
Silvola (2012) as well as the survey questions from Sandalgaard, et al. (2012). Lastly to
produce the best result we applied the theories of Van der Stede, et al. (2005) which provides
an overview of studies done on surveying in management accounting research and with that,
a framework for ensuring greater quality in the surveys done.
(1) purpose and design of the survey, (2) population definition and sampling,
(3) survey questions and other research method issues, (4) accuracy of data
entry, and (5) disclosure and reporting.
(Van der Stede, et al., 2005)

20
The purpose has been outlined in the development of the research question, so we will start
with point number 2. The population of consists of Danish SME’s with 20-200 employees.
The actual sampling was done based on 1005 companies with a Danish CVR and between
20-200 employees. However through the survey we found out that the government database
used, might not be 100 % up-to-date as some companies reported having over 200
employees. Further investigation did however show that only 1 of the companies that
answered ‘200+ employees’, did in fact have more than 250. Furthermore we initially used
SME’s in Northern Jutland, as these would be more likely to have a higher response rate, due
to the fact that a lot of the companies are working with Aalborg University. In order to ensure
that this survey would represent Danish companies and not just companies in Northern
Jutland, we randomly selected an additional number of companies from the rest of Denmark,
this will be further discussed in the Non-response bias. We did not differentiate between
public and private companies, but there seems to be possibilities for further investigations as
many publically own companies are applying ABC or TDABC, as part of the public policy.
The questions can be read in appendix A, and constitutes a combination of earlier research
with surveys for contingencies. As mentioned, these were based on (Jänkälä & Silvola, 2012)
and (Sandalgaard, et al., 2012), but as these questions did vary from those two, we followed
the format in order to create new contingency based categories. Furthermore the answers are
on a Likert scale (1-5) except for size (groupings of 20; 20-200) and growth (groupings of 5;
-10-10). When reviewing the answers in the appendix there is a tendency of a skewed normal
distribution, meaning that 1-7 might have given a different more normalized answer as people
would refrain from the extremes (Wakita, et al., 2012).
Point 4 is mainly based on validity and reliability of the results, and for that we will need to
test the actual data for biases, as well as discuss other available data, and if there are
significant differences.
During the statistical analysis the data was attempted to be analyzed from a neutral stance.
This means not committing any “Statistical sins” That are described cleverly by perspectives
to Dante Alighieri’s Inferno in a humorous way (Neurosceptic, 2012). Each “Sin” of
statistical fraud will have a fitting punishment in the nine circles of Scientific Hell. Cumming
(2014) suggests that when testing the hypotheses, p values should not be the only thing
evaluated, and he raises the point that at a significance level of 0.1, 1 in every 10 factors

21
might actually be wrongly assesed. Determining this value is also considered a random task
with huge implications for the study. Therefor the statistical tests of hypotheses should not
only be limited to significant values, but also apply effect size as a tool2. This is further
explained by the need for 10 Events Per predictor Variable (EPV), as this has been a rule of
thumb in order to reduce type I and type II errors (Hosmer, et al., 2013). Events in this case,
are responding companies, but this rule has, however been discussed since, and it has been
established that 6-9 EPV shows that there are possibilities of minor issues (Vittinghoff &
McCulloch, 2006). This study finds an EPV of 6.05 leading to say that there is a possibility of
these errors, that could be solved by collecting more answers.
2.3.3 Non-response bias
In order to discuss the validity and reliability of a survey and the results, it is very important
to look at the biases that might be present. Non-response bias is a huge problem with
surveying, as a lot of people cannot be bothered to answer, and these people might represent a
certain group. That ultimately means that the survey is not representative of the population as
there might be a group with specific answers missing. (Whitehead, et al., 1993)
There are a few ways to calculate a non-response bias; first there can be made a follow-up
survey, where the people who did not answer, are given a shorter version, and then
comparing the answers. This method still relies on people wanting to answer something, but
provides some insight. Another way is to look at the disparity between the people who
answered on second and third mailing round and the people who answered instantaneously.
This way is used by different studies and assumes that the people who were last to answer are
more similar to those who did not answer (Sandalgaard, et al., 2012). Lastly the bias can be
viewed by looking at people who answered the whole survey and people who only answered
part of it. The issue here would be that there might be other reasons for people not wanting to
answer or fill out the whole thing.
This study applies the “last answer” method, and compares the 19 answers received from the
second/third round with the early answers. When testing for the mean, it produces a number
that should be within the confidence interval (α=0,1), and with a value of 0.38 there is not a
reason to think that there is a high non-response bias, however it is still possible given that
the test is based on assumptions. Given the low number of respondents, there is however still
2 In logistic regression the Exp(B) value is assessed as it provides information of how strong the correlation is.

22
a chance that there might be a response bias. One concrete issue could be geographic. As
mentioned earlier, the survey is conducted from Aalborg University; this could mean that
companies in Northern Jutland are more inclined to answer, as many of these companies are
used to working with AAU.
3. Theoretical background of Activity-Based Costing
ABC can be divided up into stages as part of a four-stage model in order to develop a fully
implemented ABC system. Stage I is described as not being able to account for routine tasks.
These systems can be found in newly formed companies who haven’t yet had the chance to
develop further, or even companies who previously had a costing system that was
satisfactory, but due to internal reasons have lost control of their accounting. Some of the
older costing systems are described are described as Stage II standard costing systems, or
traditional costing systems, which were used commonly throughout the world, and are
traceable back to the industrial revolution. These systems are considered by Kaplan and
Cooper (1998) to answer the question of
“How can the organization allocate costs for financial reporting and for department cost
control?” (Kaplan & Cooper, 1988). While this is a necessary question to ask, this way of
allocating costs did not fully describe all the costs that were attributed to the good or service
being sold. These costs can be marketing, delivery or the process of selling the good. Still,
these methods proved to be effective enough, however not fully accurate (Kaplan and
Cooper, 1998).
The ABC system goes beyond the question which Stage II costing systems answers. ABC can
answer: what activities are being undertaken by the company, what each of these activities
and other processes cost, why these activities and processes are necessary for the firm, and
how much each activity needs to be exercised in order to fully satisfy all the stakeholders.
When taking more things into account and approaching the costs and activities in a different
way, the company is able to account for more expenses and is able to map out the entire
organization (Kaplan and Cooper, 1998). ABC became a solution to the widespread problem
of distortion of costs. As ABC was presented, it became one of the most popular innovations
in management accounting in the last decade and has contributed to the development of new

23
specific terminology like cost drivers, activity drivers, activity cost pools, cost objects and
others (Dierks & Cokins, 2000) (Gosselin, 2007).
The two examples of cost system structures below are seemingly identical, but they are
different from each other in fundamental ways. It is the ABC mentality of identifying
processes and all activities associated with those processes, rather than directly allocating
costs, that distinguishes itself from the traditional costing systems.
While Traditional costing systems on Figure I rely on direct labour hours and machine hours
in order to allocate costs, the ABC structure on Figure II identifies every activity in the firm.
The number of activities taking place can up be towards the 100’s or even 1000’s, depending
on the size and/or production volume of the company and can vary from different material
costs to scheduling employee’s shifts (Kaplan & Cooper, 1988).Originally, in order to
determine which activities were taking place, project teams would conduct surveys within the
company and question every employee about what percentage of their time they would spend
on each activity (Atkinson, et al., 2011). These activities are translated into cost drivers,
which quantify the different activities so they can be accounted for, for example ‘supervision’
is converted to ‘labour hours’, or ‘assembly of parts’ is ‘number of parts’. In the end as seen
on Figure II, the different cost drivers are assigned to different cost objects, for example a
particular product or a particular service.
This is an example used by Kaplan and Cooper’s Cost and Effect (1998.).
Figure I Traditional Cost Systems Allocate Overhead Costs to Production Cost (Kaplan & Cooper, 1998)
Figure II ABC Systems Trace Resource Expenses to Activities and Use Activity Cost Drivers for Tracing Activity Costs to Objects (Kaplan & Cooper, 1998.)

24
Simple Factory produces one million pens in one colour. Complex factory also produces one
million pens, however they make 2000 different varieties and each have varying production
volumes; some being part of large scale production (eg. 100,000 units), or specialty pens (eg
100 units). Since Complex Factory requires many more resources to manage all the different
types of pens, they will have much higher overhead costs and thus need to maintain a much
larger set of information. When it comes to applying the situation of Complex Factory to
Stage II costing systems, the costs would be reported in terms of production volume, where
for example 1000 pens out of the total of one million would be 0.1% of the total production
volume, and would therefore have 0.1% of the overhead costs allocated to them. This would
give every different pen produced roughly the same cost per unit as they don’t account for the
many different indirect costs of all the different pens. With the same cost being allocated to
all 2000 different pens, regardless of the volume of production, the true value is distorted and
instead gives a false number.
3.1 Time-Driven Activity-Based Costing
Kaplan & Anderson proposed that many companies were deciding to abandon ABC model
because the costs were too high and employees were irritated by its implementation and
complexity. They also acknowledged difficulty in implementing the model. As an answer to
the issues around ABC, Kaplan & Anderson (2004) introduced “Time-Driven Activity-Based
Costing” (TDABC).
The model was a transition from a “rate-based” approach to a “time-driven” one. In ABC,
cost driver rates were established to assign activity costs to cost objects, whereas under
TDABC these rates were already set on a time basis Kaplan & Anderson (2004) However,
the new model does not solve all the problems with the old model: unused capacity, fixed
costs being considered variable, and others. Nevertheless, the model was perceived as easier
to implement, cheaper and overall less demanding.
In the new system, only two estimates are required – cost per time unit of capacity and unit
times of activity. The first parameter could be obtained when dividing the cost of the
supplying resource by “practical capacity”, which is the time employees have excluding idle
time (suggested 80-85%).The second one could be acquired from interviews or direct
observation. The managers are not required to review how spend their time, but use the

25
practical capacity of the resources (which is a percentage of its theoretical capacity). (Kaplan
& Anderson, 2004)
The ABC system identifies a very broad range of activities compared to the more traditional
systems and leads to more accurate costs. However, with more work going into this method,
it ends up being more expensive and complicated to implement and also requires upkeep.
These factors can also influence which kind of companies choose to adopt this costing system
(Gosselin, 1997).
3.2 Development of ABC
In this section the development of ABC in to a more widely applicable costing system will be
reviewed. A focus will be put on Time-Driven ABC as it (as talked about above) is an
improvement to the original costing system. Additionally, after a brief review of the recently
published existing literature, it is clear to see that not much research has been done on ABC
in relation to TDABC.
Even though it started off as only a costing system, activity costing has undergone significant
changes in its purpose and execution. Researchers and practitioners started looking into the
information of financial and non-financial data that the system provided and recognized that
it could be used for management decisions and evaluations (Gosselin, 2007). Turney (1989)
argued that ABC shouldn’t be only for costing purposes, but should also identify relevant
strategies, improve designs, and making operating activities more efficient should be key
outcomes of the whole ABC package.
Despite the general tendency of praising ABC at the time, there were some that questioned
the effectives of the costing system. (Johnson, 1990) (Johnson, 1992) (Piper, 1990) (Piper,
1991). Noreen (1991) provided some research on when ABC delivers accurate costs. He
provided conditions, which in some cases aren’t met and could explain why managers had
issues using ABC model for decision makings. Issues with the model were outlined further
by Kaplan & Anderson (2004) that focused the maintenance, complexity problems and model
flaws.
As discussed, unlike the traditional ABC, where reported employee time-capacity very
frequently added up to 100%, whereas TDABC allowed for a more accurately estimated
unused capacity. Additionally, the model’s updating became easier and less time consuming.

26
In order to add new activities, management was required to estimate the unit time that it
required (Kaplan & Anderson, 2004). The majority of differences in the model were based on
the previous weaknesses of ABC (Kaplan & Anderson, 2004). As previously mentioned, the
model was presented as a more simplified version of ABC. Kaplan and Anderson (2007b)
presented a case study where 1200 activities were condensed down into 200 processes, which
additionally provides proof of the system’s simplification. Everaert et al. (2008b) argued that
the high cost and time spent on updating the model was reduced due to the time equation,
which is part of the TDABC. Additionally, Kaplan and Anderson (2007a)discussed the
difficulty in gathering data from ERP systems in the old model and promoted TDABC as
more easily compatible with different information systems.
4. Literature review
After the terminology has been explained and the scope of the project has been identified, a
review of existing literature will be made in an attempt to show and explain the application of
ABC in SMEs. Before the main research question is addressed, it is important to answer the
question of whether or not Time-Driven ABC and ABC are relevant to SMEs.
4.1 TDABC’s application
Even though ABC is still relevant and creates value for its users (Stratton, et al., 2009), the
focus of research is falling on TDABC. In recent years a number of researches have been
made on costing system, examining its usefulness in different contextual backgrounds.
Kaplan and Anderson (2007b) discussed the successful implementation of TDABC in
logistics and service companies, which was later acknowledged by Everaert et al. (2008b). It
has been confirmed by research that TDABC is capable of capturing the complexity of
logistic company activities (Bruggeman, et al., 2005). Everaert et al. (2007)
(2008a)conducted a case study on a logistics company and researched whether the company
should continue with ABC implementation or switch to TDABC. The results indicated that
ABC failed to capture all the factors associated with the activities, whereas TDABC could.
Everaert et al. (2008b) examined a Belgian wholesaler and concluded that TDABC was able
to trace logistics operations very accurately, despite their complexity. Furthermore, as
suggested by Kaplan & Anderson (2004), it managed to give information on unnecessary

27
costs. The system was able to provide managers with adequate information on strategic
decisions (Korpunen, et al., 2010) (Öker & Adigüzel, 2010) as well as accurately estimate
product costs (Fladkjær & Jensen, 2011).
However, even after the significant reduction of complexity and time-consumption,
researchers have outlined that companies still have issues with those factors (Ratnatunga, et
al., 2012). Gervais et al. (2010) talked about how data gathering and complexity of
implementation was burdensome. This was backed up (Fladkjær & Jensen, 2011).
The conclusion that could be made from examining the recent literature, however, points
towards the fact that TDABC, compared to ABC, is an improvement in regards to two
different factors. Simplicity - Kaplan and Anderson (2007b) discussed it as being one of the
major features of TDABC, which was later confirmed by Somapa et al. (2012). Its resource
requirements enable people without extensive economical or business education, such as
some SMEs, to be able to handle TDABC. As previously mentioned by Kaplan and
Anderson (2007a), adaptability is when managers don’t need to put as much effort updating
the system. Stout and Propri (2011) confirmed this notion. Furthermore, as the system is very
versatile, it allowed easier linkage to existing information systems (e.g ERP systems) (Kaplan
& Anderson, 2004); (Varila, et al., 2007), which Reddy et al. (2011) also debated as a major
benefit. This clearly also reduced the resources and time required for implementing / adopting
TDABC. What’s more is that it enabled small and medium sized enterprises with not-so-
complex activities at hand to use simple spreadsheets for support as software. (Somapa, et al.,
2012) (Kaplan & Anderson, 2004)
As ABC’s evolution lead to its simplification and maintenance improvements, the general
idea that ABC is only useful for large corporations started to get tested. Even though research
on the implementation of activity-costing in SMEs is not particularly popular, there are a
number of studies that find the relevance and compatibility of the two (Hicks, 1999)
(Gunasekaran, et al., 1999).
4.2 Activity-Based Costing’s application in SMEs
Further down the existing literature on Activity-Based costing in SMEs will be examined.
After analysing several case studies above, it could be argued that Kaplan & Anderson’s
(2004) claims are justified and the improvements to the system are being realized.

28
ABC is found more frequently in large companies than in smaller ones (Bjørnenak, 1997)
(Krumwiede, 1998) (Gosselin, 2007). Due to the difficulties with understanding and
sustaining the system, it was unsurprisingly assumed that ABC is not appropriate for SMEs
(Hicks, 1999). There have also been several arguments against the adoption. SMEs often
face a lack of resources. Inadequate financial, human and technical resources could restrict
companies in engaging in higher complexity models (Roztocki, et al., 2004). Furthermore,
Baxendale (2001) argued that smaller enterprises often gather information only for lenders
and tax purposes, which makes the necessary information to support ABC hard to compile.
Needy et. al. (2000) mentions the additional costs of hiring consultants and the reduced
productivity during the implementation stages (also confirmed by Roztocki, et al., (2004)).
Resistance to change in the employees was also found to be an issue (Bharara & Lee, 1996).
Despite these, even before the popularization of TDABC, there has been evidence that ABC
is appropriate for companies with lesser size and provides benefits for them (Hicks, 1999)
(Bharara & Lee, 1996). As shown in the previous section, the introduction of TDABC only
strengthened that argument. Additionally, implementation procedures have been developed
in aiding the companies with using the system (Gunasekaran, 1999, Bharar & Lee, 1996,
Roztocki, 2004). Moreover, because of the less simple structures and less diversified
activities, smaller companies are able to use spreadsheets, allowing them to capture the
benefits of ABC without complex systems or huge costs (Hicks, 1999, Bharar & Lee, 1996,
Needy, et al., 2000). More recently, Somapa, et al. (2012) conducted a case study towards
TDABC’s usefulness in SMEs, but pointed out the need for IT improvements. Also, Jänkälä
& Silvola, (2012) concluded that SMEs seem to benefit from TDABC, if they are suffering
from decline of growth or have been previously profitable.
Summing up, although SMEs lack the knowledge and resources of bigger companies, they do
make up for more flexibility and simplified requirements. As it can be seen from above, even
though ABC isn’t perfect, some of the major issues of the original model have been
addressed in the new time-driven one. In doing so, it has become more applicable to smaller
enterprises than previously. However, as the problem formulation states, the diffusion of
ABC amongst those units is low. In the next section, a review of the contingency factors that
influence the adoption of management accounting practices will be made, from which a

29
framework will be derived. This will lead into an attempt to find significance between factors
in the framework and the characteristics of SMEs (gathered from the survey conducted).
4.3 Contingency based theory and ABC
Contingency based theory is a large emerging concept within studies of management
accounting, that combines the models like ABC and traditional budgets with contextual
information (Chenhall, 2007). A contingency in management accounting is addressing the
vast possibilities and randomness that characterize every company, and it is in contrast to a
unified theory where there is one answer and one model that applies for every situation. The
concept of contingencies has been applied for over 25 years, during which time the
framework has been developed and applied by different studies, especially relating to
Activity-Based Costing (Gosselin, 1997). The framework’s main contributor has been
Chenhall (1998, 2003, 2004 and 2007) all of which have added to the management control
systems contingencies in different ways.
With the high focus on Activity-Based Costing in current literature proven by this literature
review, it is shown that even though many articles tackle the individual contingencies
(Bruggeman & Slagmulder, 1995) (Kennedy & Affleck-Graves, 2001) and others multiple
contingencies (Baird, et al., 2007) (Jänkälä & Silvola, 2012), no framework, to the
knowledge of the authors, investigates all contingency factors within the same study. These
contingencies have been challenged by the emerging research on Organisational Life Cycle
(OLC) that assesses the adoption of ABC on the stage of the company rather than the actual
contingency factors (Kallunki & Silvola, 2008). This is especially relevant for the size of the
company, as previous studies has concluded that company size has a positive correlation with
adopters of ABC. Kallunki & Silvola (2008) did however conclude that the OLC has a
correlation independent of size, meaning that a smaller company in the same stage of the life
cycle would be as likely to adopt ABC as a larger sized company. These findings do not
however affect the contingencies, but merely add to the question of company sizes
Through the litterature review for this study, it was found that a large part of the studies
contributes in a way to the contingency framework. This has then been used to create a
framework, catagorizing the different areas of which the articles contributes to:

30
Contingency Factors Literature
Organizational Size (Brierley, 2008) (Krumwiede, 1998), (Bjørnenak,
1997) (Brown, et al., 2004) (Chenhall, 2004)
(Kallunki & Silvola, 2008)(Baird et al., 2004) (Innes
& Mitchell, 1995) (Major & Hopper, 2005) (Al-Omiri
& Drury, 2007)
Organizational Structure (Gosselin, 1997) (Kallunki & Silvola, 2008)
(Anderson, 1995)
Organizational Strategy (Cooper & Kaplan, 1998) (Bjørnenak, 1997)
(Brown et al., 2004) (Brierley, 2008) (Krumwiede,
1998) (Gosselin, 1997) (Innes & Mitchell, 1995)
(Kennedy & Affleck-Graves, 2001) (Chenhall &
Langfield-Smith, 1998)(Baird, et al., 2007) (Kallunki
& Silvola, 2008) (Schoute, 2011)
(Shields, 1995) (Al-Omiri & Drury, 2007)
Organizational Culture (Malmi, 1997) (Baird, et al., 2007) (Baird, et al.,
2004)(McGowan, 1998) (Anderson & Young, 1999)
(Arnaboldi & Lapsley, 2005) (Major & Hopper,
2005)(Brown, et al., 2004) (Brewer, 1998) (Shields,
1995) (Vieira & Hoskin, 2002)
External Uncertainty (Mia & Clarket, 1999) (Cooper & Kaplan, 1998)
(Anderson, 1995) (Anderson, et al., 2002) (Arnaboldi
& Lapsley, 2005) (Kallunki & Silvola, 2008) (Al-
Omiri & Drury, 2007) (Jänkälä & Silvola, 2012)
(Cardinaels, et al., 2004)
Technology (Ittner, et al., 2002) (Askarany, et al., 2007)
(Bruggeman & Slagmulder, 1995) (Krumwiede, 1998)
(Anderson, 1995)(Arnaboldi & Lapsley, 2005)
(Shields, 1995) (Somapa, et al., 2012)
Table 5 Framework for literature in contingency factors

31
This framework will be used as a basis for developing the hypothesees under each segment as
well as an explanation of how the relevant contributions have been made.
4.3.1 Organizational size
Organizational size is one of the most researched and developed areas in ABC litterature.
This could be due to the straightforwardness of the research, as it requires only a few
questions that can easily be answered with only limited knowledge of the company. The
relationship between size and sophisticated control systems was first touched upon by
Khandwalla (1977), where the research stated that a large organisation undertakes complex
activities and that formalisation of procedures are more beurocatric. In relation to more recent
ABC related litterature Innes & Mitchell (1995) found that bigger companies had a higher
ABC adoption rate. This research was however focused on companies with either above or
below a turnover of 223$ million, so the proportions were high.
Later studies showed the relationsship in smaller companies as well, but addressed the need
for a certain size. This was done by Bjørnenak (1997) as an example, in a study of diffusion
of the ABC model that has since been used as a base for a lot of the recent research.
Bjørnenak (1997) addresed the fact that the system demands resources to be applied, and thus
needs a certain size. This is furthermore the reason for selecting companies with at least 20
employees in the following survey.
Studies of organizational size vary in their approach as some look mostly at the turnover or
other financial measures such as sales (Al-Omiri & Drury, 2007) (Innes & Mitchell, 1995)
(Krumwiede, 1998) (Baird, et al., 2004) while others use number of employees (Brown, et
al., 2004) (Kallunki & Silvola, 2008) as well or the Organisational Life Cycle as mentioned
earlier. This is one of the most debated factors, as Kallunki and Silvola (2008) found that size
is only part of OLC and thus the life cycle should be focused over size. This also creates the
relevance for further research into SME’s like that of Jänkälä & Silvola (2012). With the
question of size, the question of growth also emerges, and this has been implemented in many
of the forementioned studies of organisational size, but there does seem to be some
discrepancies.Kallunki and Silvola (2008) uses the financial aspects of growth to show what
stage of the life cycle the company is in, however employee growth showcases some of the
same tendencies.
32
Given the above mentioned research, a few hypotheses can be developed in order to further
examine organizational size. The same will be done for the following contingencies.
H1A There is a positive relationship between the probability of a company using
ABC and the organizational size.
H1B There is a positive relationship between the probability of a company using
ABC and the company growth in employees.
4.3.2 Organizational structure
Gosselin (1997) wrote in regards to Activity-Based costing that: “Organizational structure
influences the capability of an organization to implement innovations.” This means that there
should be correlation between the organizational structure and the use of ABC, and
furthermore it seems that mechanistic structures are more likely to be successful in the
implementation of ABC (Gosselin, 1997). This mechanistic structure meant that the company
would or should at least be more likely to implement ABC when it is centralized and
formalized. Gosselin (1997) also found a direct correlation between vertical differentiation
and the use of ABC.
This research also builds on earlier studies, which showed that innovative businesses were
more open to undertake new management accounting systems. This has also been shown by
Chenhall (2007), but this was for management accounting tools in general.
Kallunki & Silvola (2008) further explored the strategy associated with the organizational life
cycle, and their findings also pointed towards that companies in a mature state were more
likely to apply more sophisticated cost systems, and these companies also showed a more
formal and bureaucratic organizational structure than that of companies in growth. There is,
however, some level of ambiguity in some of the research done in the area. Anderson (1995)
showed that there was both a positive and negative effect of centralizing. The negative effect
was that the centralized decisions limited new ideas and new costing systems from entering
the organization. This was a case study of General Motors and it showed some of the
considerations of the managers in regards to applying a new costing system. Even with
anecdotal evidence there seems to be some things that are still not clear in regards to
organizational structure. This leads to the hypotheses:

33
H2A: There is a positive relationship between the probability of a company using
ABC and the structure being formal
H2B: There is a positive relationship between the probability of a company using
ABC and the structure being centralized
4.3.3 Organizational strategy
When looking into the purpose of ABC we see a great deal of strategic decisions benefitting
from the model. ABC provides a lot of information and based on that information the strategy
can be made (Cooper & Kaplan, 1998). This means that if a company provides customized
production, ABC has a high value to see what product provides the highest profits and thus
where to focus (Schoute, 2011). This was also a conclusion made by Krumwiede (1998) in a
study of complexity on manufacturing and costing systems, as well as a few others (Chenhall
& Langfield-Smith, 1998) (Gosselin, 1997).
The second major part of organizational strategy in ABC literature is based on the ability of
ABC to find problems in product costs (Cooper & Kaplan, 1998), and this has created a
ground for the research of strategies. Many of the studies that investigate the company
strategy find that cost leaders are more prone to using ABC (Kallunki & Silvola, 2008) (Al-
Omiri & Drury, 2007) (Shields, 1995). These conclusions were made by looking at the use of
Just-In-Time production (JIT) and the use of LEAN that both seemed to be correlated with
the use of ABC. There is, however, another strategy than just cost-leadership. The prospector
strategy was associated with the ABC by Gosselin (1997). This part is highly controversial as
both sides have findings and arguments that support a certain hypothesis. Gosselin (1997)
suggest that rising companies driven by innovation and aggressive strategies are more likely
to undertake new costing systems as well in order to gain an edge. Kallunki & Silvola (2008)
argues that companies are more likely to pursue ABC when reach maturity and focus on cost
leadership, as that is one of the main functions of the ABC. The question can also be related
to that of Bjørnenak (1997) as he shows that the diffusion process has influence on the ABC,
but other studies have shown that some companies apply ABC only to revert back after some
time (Kaplan & Anderson, 2004). There seems to be two main ideas about why companies
aren’t using ABC; first that the diffusion process is at a lower stage and second that the
framework has issues that means that not all companies can apply it. This will be further
reviewed in the discussion.
34
H3A: There is a positive relationship between the probability of a company using
ABC and the use of product differentiation
H3B: There is a positive relationship between the probability of a company using
ABC and companies ability to be cost leaders
4.3.4 Organizational culture
Organizational culture is a broad term and thus the research in the area is very diverse. Malmi
(1997) established that many of the problems that affected the ABC implementation were a
product of resistance from within the company. This resistance was both amongst leaders, as
well as employees and it was the finding that culture has huge influence on the adoption of
ABC (Baird, et al., 2004) (Baird, et al., 2007). The first step to change the culture is the
leadership change (Gosselin, 1997), but some studies have undertaken the task of evaluating
employee perception and the correlation with ABC (McGowan & Klammer, 1997) (Baird, et
al., 2007) (Vieira & Hoskin, 2002) (Major & Hopper, 2005). However, as the employee
perception is harder to evaluate given the scope of this study, the leadership is to be evaluated
first.
In order to look at the resistance within the organization it is important for the management to
appear open and innovative, so that new ideas like ABC can be accepted by management in
the first step. ABC is as mentioned one of the most supplied costing systems (Gosselin,
2007), and at the same time it is recommended by many books for higher education as
previously mentioned. This would mean that leaders who use recommended principles would
be more likely to adopt ABC.
H4A There is a positive relationship between the probability of a company using
ABC and the management wanting to appear innovative.
H4B There is a positive relationship between the probability of a company using
ABC and the management applying recomended management accounting
principles.
4.3.5 External uncertainty
External uncertainty is one of the more discussed factors, both in regards to ABC, as well as
in contingency theory in general (Chenhall, 2007). Competition, in particular, has been

35
adopted as a huge part of undertaking new management control system and has thus been the
focus of a number of studies (e.g. (Cooper & Kaplan, 1998) (Mia & Clarket, 1999)
(Anderson, 1995)). All studies listed above in table 5 under external uncertainty have an
element of competition, but it does vary in what way. Cardinaels, et al. (2004) is one of the
only studies that focuses more on the uncertainty than the competitive factor, and of course
the competition is part of uncertainty, as the information is asymmetric. The study by Jänkälä
& Silvola (2012) is one of the more recent studies that shows that SMEs with a high
competitive enviroment have used ABC to a greater extent than companies without this high
external pressure. Oppisite to previous contingency factors there seems to be a consensus
within ABC litterature that percieved competition is positively correlated with the use of
ABC.
Competition is divided into sub-catagories as the term is very broad. It can be percieve by
using Porters Five Forces in combination with certain elements of the Pest analysis. This
leaves us with percieved enviromental uncertainty (PEU); a combination of the external
factors that appears to influence the percieved competition (Duncan, 1972).
H5A There is a positive relationship between the probability of a company using
ABC and the Percieved Enviromental Uncertainty (PEU)
4.3.6 Technology
ABC is, as mentioned, a very comprehensive framework, and thus companies using ABC
have higher expenditures towards IT systems than non-adopters (Ittner, et al., 2002). This
also means that companies with high level of IT systems will have an easier adoption as
shown by many other studies (Shields, 1995) (Krumwiede, 1998) etc.
Chenhall (2007) explains technology will have a close relasionship with the size, as bigger
companies tend to have more extensive IT systems and thus are better suited for new
management tools. Another point made is that technology has a level of uncertainty as it
constantly developes and when comparing the IT systems today with those of (Shields,
1995), one would see huge differences. The development of new software has been a
paradigmshift allowing small companies to undertake cheap solutions capable of handling
vast amounts of data. This has given the opportunity for many companies to implement ABC
as newer reseach shows (Askarany, et al., 2007) (Somapa, et al., 2012). One of the newest
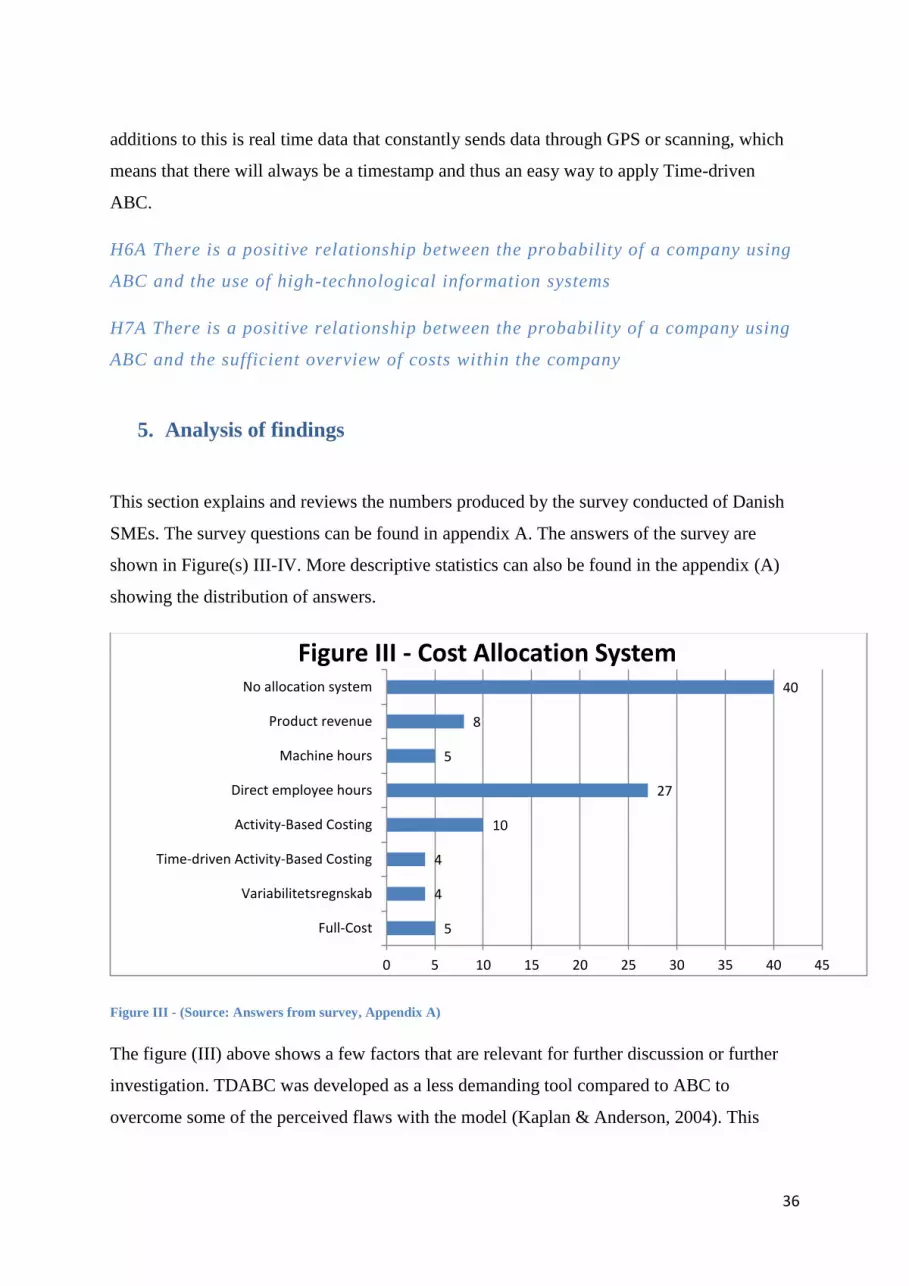
36
additions to this is real time data that constantly sends data through GPS or scanning, which
means that there will always be a timestamp and thus an easy way to apply Time-driven
ABC.
H6A There is a positive relationship between the probability of a company using
ABC and the use of high-technological information systems
H7A There is a positive relationship between the probability of a company using
ABC and the sufficient overview of costs within the company
5. Analysis of findings
This section explains and reviews the numbers produced by the survey conducted of Danish
SMEs. The survey questions can be found in appendix A. The answers of the survey are
shown in Figure(s) III-IV. More descriptive statistics can also be found in the appendix (A)
showing the distribution of answers.
Figure III - (Source: Answers from survey, Appendix A)
The figure (III) above shows a few factors that are relevant for further discussion or further
investigation. TDABC was developed as a less demanding tool compared to ABC to
overcome some of the perceived flaws with the model (Kaplan & Anderson, 2004). This
5
4
4
10
27
5
8
40
0 5 10 15 20 25 30 35 40 45
Full-Cost
Variabilitetsregnskab
Time-driven Activity-Based Costing
Activity-Based Costing
Direct employee hours
Machine hours
Product revenue
No allocation system
Figure III - Cost Allocation System
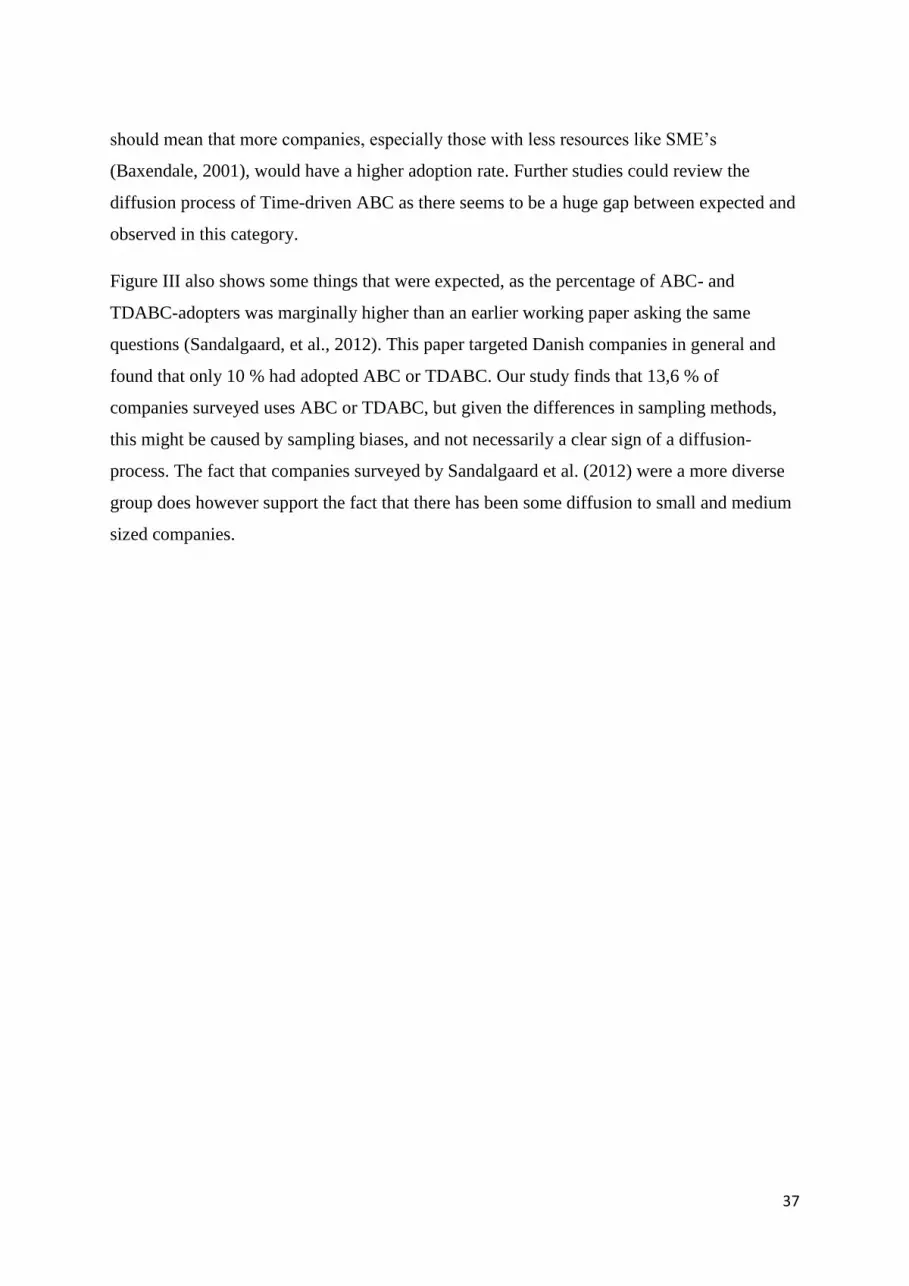
37
should mean that more companies, especially those with less resources like SME’s
(Baxendale, 2001), would have a higher adoption rate. Further studies could review the
diffusion process of Time-driven ABC as there seems to be a huge gap between expected and
observed in this category.
Figure III also shows some things that were expected, as the percentage of ABC- and
TDABC-adopters was marginally higher than an earlier working paper asking the same
questions (Sandalgaard, et al., 2012). This paper targeted Danish companies in general and
found that only 10 % had adopted ABC or TDABC. Our study finds that 13,6 % of
companies surveyed uses ABC or TDABC, but given the differences in sampling methods,
this might be caused by sampling biases, and not necessarily a clear sign of a diffusion-
process. The fact that companies surveyed by Sandalgaard et al. (2012) were a more diverse
group does however support the fact that there has been some diffusion to small and medium
sized companies.

38
Figure IV - Mean of answers from survey (Source: Answers from survey, Appendix D)
As it can be seen from Figure III only 13.6 % of the SMEs that were surveyed use ABC or
TDABC. This leads to a further discussion of whether this is caused by issues with the model
or simply from lack of relocation diffusion, which, as previously mentioned, is the spread of
new ideas. In either case there seems to be a tendency in Danish SMEs to either use a direct
allocation or not even doing a systematic allocation. Furthermore, it can be observed that the
answers seem to depict the companies in a very positive manner. This might be partially due
to the CFOs and
3,83
2,21
4,44
2,46
3,54
3,24
4,22
3,45
3,52
3,78
4,00
4,05
3,64
3,99
4,06
0,00 1,00 2,00 3,00 4,00 5,00
Struktur og ledelse [Decision process at top leaders]
Struktur og ledelse [The leadership is very formal]
Struktur og ledelse [Easy contact to nearest leader]
Strategi [We provide products/services that differ in…
Strategi [We want to be cost leaders]
Konkurrence [Direct competitors]
Konkurrence [customers needs and preferences]
Konkurrence [The technological developement]
Konkurrence [The economic tendencies ]
Konkurrence [The legal and political enviroment]
Kultur [Leaders are open to new systems]
Kultur [Leaders want to appear innovative]
Kultur [Leaders apply recognized models]
Teknologi [The company uses modern IT]
Teknologi [The company has a complete overview of…
Figure IV- Mean of answers

39
CEOs being the majority of the ones answering the questions. This could be the factor for the
outliers top and bottom in “Easy contact to nearest leader” (4,44) and “The leadership is very
formal” (2,21), however, the answers from people having a different role within the company
do not stand out significantly in these categories. It could however be a focus point for further
research.
Using a simple Pearson correlation it is possible to get a preliminary view of where to direct
the attention of the logistic regression3. There is a linear correlation between the adopters of
ABC/TDABC and “Decisions are made from above”, “Leaders are open to new ideas”,
“Leaders rely on acknowledge principles” and the “economic market”. This provides an idea
of where to look in further testing of the hypotheses, and it is interesting that one of the most
addressed issues regarding adoption of ABC – Size, is not one of the main factors in this test.
To continue a logistic regression is made with adoption as the dependent variable. The results
of this test can be seen below in table 7.
5.1 Hypothesis testing
The logistic regression evaluates each factor in the model, in order to find the most
significant variable, as well as the best predictor variable that might influence the probability
of adoption the most. The model is using the “Enter” mode where all variables are entered at
the same time rather than step-wise, since it is assumed, given the literature review, that they
all influence the companies to adopt or not adopt.
3 A Pearson correlation is a simple linear model that searches for small correlations between two factors at a
time
Table 6 - Pearson Correlation of survey (Source: Answers from survey, Appendix B)

40
Table 7 Logistic regression of survey (Source: Answers from survey, Appendix D)
What we see is that there are a few significant variables. Employee change seems to be the
first significant factor (α=0,1). However, there are some issues with this, as it is not a linear
scale or Likert scale like the rest. It can also be found from Exp(B)=,112 that we are dealing
with a weak correlation and thus not necessarily a good predictor variable of the model. At
the same time it seems to be negatively correlated, so the H1B will still be rejected, as an
increase in number of employees will have a lower probability of the company using ABC or
TDABC.
The next significant factor is “Leaders Principles”; the question is if leaders are applying
principles that correlate with theory. This factor shows a very high correlation, and it seems
to be the best predictor variable in the model. This makes sense as the question implies that
leaders are using theory, and theory recommends ABC in most cases. It could also be

41
attributed to the fact that these CFOs and CEOs who answered the survey, do, in fact, know
that ABC is acknowledged by many as a superior model. This is shown by the fact that H4B
is accepted – “There is a positive relationship between the probability of a company using
ABC and the management applying recomended management accounting principles”. And as
it can be seen from Exp(B) =13.884, a company with leaders using recommended accounting
principles are almost 14 times more likely to use ABC.
Modern IT also shows a weak correlation just within our confidence interval. It is at the same
time negative, meaning that H6A will be rejected, as it hypothesises a positive correlation. It
is suprising that a low level of IT has a higher probability of ABC and it is contraditory to
theory. One explanation could lie in the fact that a developed and modern IT-system has
better alternatives to ABC as they might apply different uses of IT-systems, and theory
mostly finds that the implementation process is easier for companies with modern IT-systems
(Krumwiede, 1998). H6B “sufficient overview of costs” however, has a significant
correlation and also serves as one of the most important predictor variables with
Exp(B)=4,617 meaning that a company with a high cost overview has a high probability of
using ABC or TDABC, and thus H6B is accepted. This is to be expected as ABC/TDABC
provides the company with a good overview of costs and thus the companies using the model,
would answer higher on the likert scale (1-5).
In order to answer H5A, Percieved Enviromental Uncertainty, a new variable4 has to be made
and implemented into the model. This can be seen in the appendix C, but the result does not
vary from this test where every factor is reviewed individually. Only one is significant and
that is technological development, it is however at a decreasing probability meaning that a
higher technological development means a lower probability of the company using ABC.
There are a few other mentionable factors that might not be significant but still serve as a
highly valued predictor variable for the model. Leadership innovation (Exp(B)=4.355), direct
competition (Exp(B)=5.649) and economic market (Exp(B)=9.382 all seem to have a vary
high correlation with adobtion of ABC or TDABC, but as these are not significant at the 0.05
level the hypotheses are still not accepted, but they will be discussed further in the discussion
of results. As explained in the methodology p-values are to some extend misleading and there
is a high level of randomness when reviewing multiple factors. Therefore, it is important also
4 PEU is a combination of all external variables that are described in the literature review
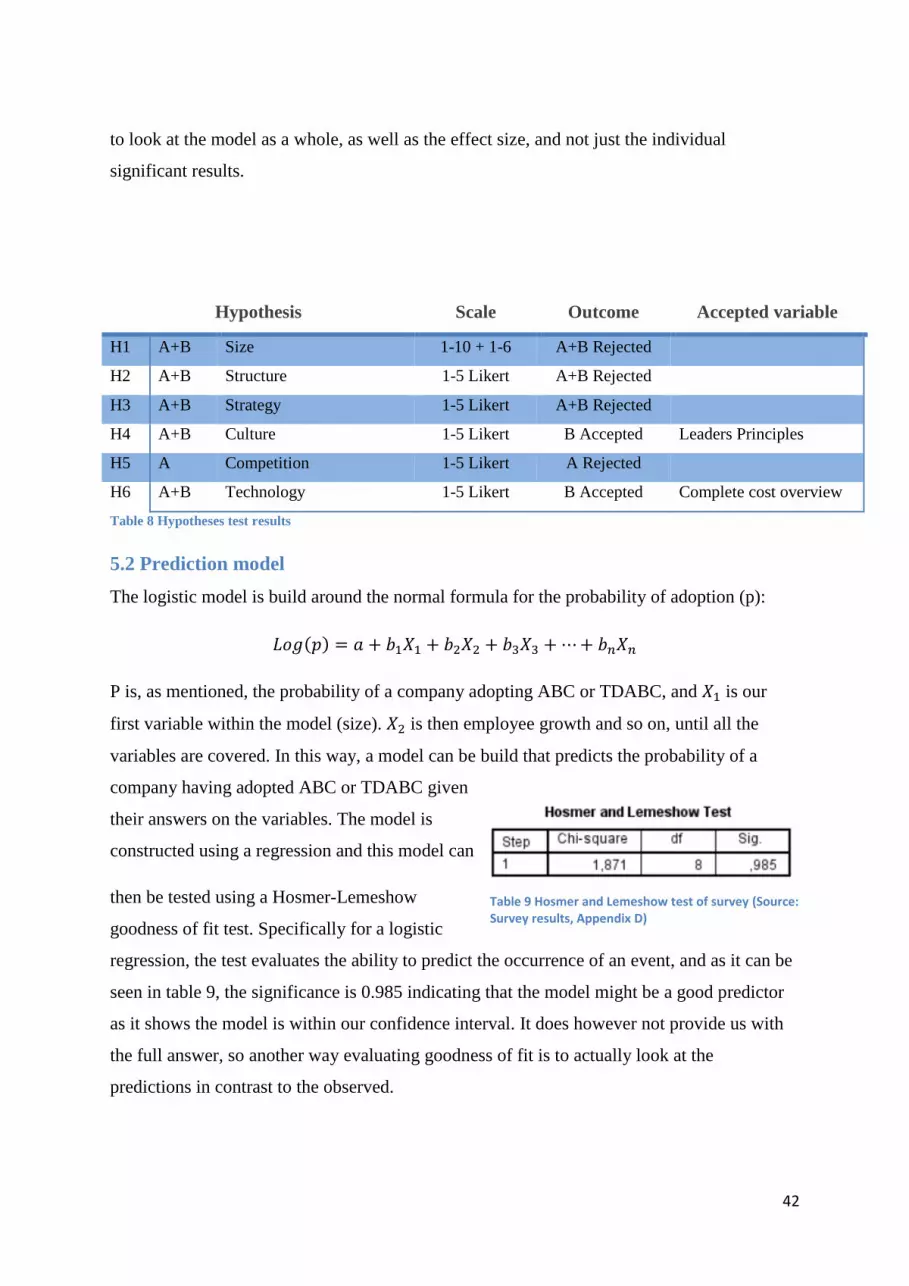
42
to look at the model as a whole, as well as the effect size, and not just the individual
significant results.
Hypothesis Scale Outcome Accepted variable
H1 A+B Size 1-10 + 1-6 A+B Rejected
H2 A+B Structure 1-5 Likert A+B Rejected
H3 A+B Strategy 1-5 Likert A+B Rejected
H4 A+B Culture 1-5 Likert B Accepted Leaders Principles
H5 A Competition 1-5 Likert A Rejected
H6 A+B Technology 1-5 Likert B Accepted Complete cost overview
Table 8 Hypotheses test results
5.2 Prediction model
The logistic model is build around the normal formula for the probability of adoption (p):
𝐿𝑜𝑔(𝑝) = 𝑎 + 𝑏1𝑋1 + 𝑏2𝑋2 + 𝑏3𝑋3 +⋯+ 𝑏𝑛𝑋𝑛
P is, as mentioned, the probability of a company adopting ABC or TDABC, and 𝑋1 is our
first variable within the model (size). 𝑋2 is then employee growth and so on, until all the
variables are covered. In this way, a model can be build that predicts the probability of a
company having adopted ABC or TDABC given
their answers on the variables. The model is
constructed using a regression and this model can
then be tested using a Hosmer-Lemeshow
goodness of fit test. Specifically for a logistic
regression, the test evaluates the ability to predict the occurrence of an event, and as it can be
seen in table 9, the significance is 0.985 indicating that the model might be a good predictor
as it shows the model is within our confidence interval. It does however not provide us with
the full answer, so another way evaluating goodness of fit is to actually look at the
predictions in contrast to the observed.
Table 9 Hosmer and Lemeshow test of survey (Source: Survey results, Appendix D)

43
Table 10 Model predictions of survey (Source: Survey results, Appendix D)
The table (10) above shows the observed and the predicted adopters and non-adopters and it
is a very good indicator of our model. It shows that in 94.7 % of all the numbers, the model
managed to predict the correct number (Non-adopters: 0, adopters: 1). This is considered a
very high amount and it provides the basis for further research of the whole contingency
model, as it would appear to have a high capability to predict the use of ABC and TDABC.
These findings build a foundation for furthering the discussion of the result, as there seems to
be indications of a model for the use of ABC and TDABC in Danish SMEs, and when using
contingency theory, this could, combined with future research, help companies determine if
ABC is right for them. This study does not evaluate if the companies are successful with
ABC, but future research could incorporate this into the contingency model.
6. Discussion
The literature review applied contingency theory to ABC literature, which created a
framework of categorized studies that contributed and showed the correlations between
adoptions and contingency factors. The survey reviewed these factors in Danish SMEs and
with those two sets of information; now, a discussion can take place. It will assess the
individual factors and find connections between them, as well as comparing those findings to
the results of the study in order to draw a conclusion.
It is important to note that even though a study has been undertaken, when compared to the
results of the literature review, the survey results might not support those of the literature
review and vice versa. This is due to the study merely being one more among a sea of others,

44
as well as being focused on Danish SMEs, so the sample might not have identical results.
One example of the difference of this study is the criteria for the companies (20-200
employees) who participated. With the employee criteria being smaller than that of the EU
which considers the average of many more companies, the results can differentiate as
mentioned before.
The research performed in this paper based the questions on some of the contingencies from
the literature review. After the statistical analysis a few points were found to be significant to
ABC adoption, and these can then be compared to the findings of the literature review.
6.1 Model Flaws vs. Diffusion
There is no denying that ABC is a popular system, based on the number of articles written
(Gosselin, 2007) and the incorporation of ABC in many textbooks, despite many abandoning
it/not taking it on (Kaplan & Anderson, 2004). It is therefore important to discuss this
paradox as a part of either being an unsuitable model or companies simply not knowing about
it.
When it comes to the case of diffusion, the study performed by Bjørnenak (1997) gives a
clear indication of the respondent’s knowledge of ABC. He reported that 29% of all
respondents did not have knowledge of the model. That number tells us that the majority still
had knowledge, where 40% adopted it and 31% had knowledge, but chose still not to adopt.
These numbers could tell us that it is a case of both diffusion and a model flaw where around
the same percentage of companies knew about it but didn’t adopt, and didn’t have any
knowledge. However, what should also be noted is the age of Bjørnenak’s study. It is nearly
20 years old and was published close to when ABC was first being introduced. Considering
this, the diffusion process of ABC may at this point be far more widespread, but these
numbers can also be compared to the independent study.
Based on the study from this paper of 103 respondents, 14 people used ABC (13.6%),
however the question of ABC knowledge was not asked. For the sake of a larger sample size,
this may have been beneficial, since Gosselin (2007) argued that non-adopters of ABC are
less likely to respond to surveys about ABC, so most ABC adoption rates are overstated. The

45
majority of the respondents (38.8%) answered that they had ‘no allocation’ system in place. It
can be assumed that of those 38.8%, some of them did not have knowledge of allocation
systems, whereas one could also assume that the rest did in fact have ABC knowledge but
chose not to adopt it (47.6%).
When it comes to companies having knowledge, but choosing not to adopt, it could then be a
question of a model flaw, which incorporates both problems with the ABC system and the
contingencies of the companies. Earlier in this discussion, the relevance of ABC for SMEs
was pointed out when SMEs were noted to have a limited variation of products, as well as
having limited financial resources to maintain such a complex and expensive system. The
relevance is also seen in the literature collection for this project, since the number of papers
focusing on ABC in SMEs is very little in comparison to larger firms. Contingency theory
and the findings of this study suggests that some companies might not fit the model, and thus
it could be that ABC is close to a stage of saturation, while TDABC would still, given that it
is a younger concept, have a long way to go.
Combining the results own our own study with that of Bjørnenak (1997), it can be assumed
that the case of diffusion vs. model flaws is almost equally influential when it comes to the
paradox of ABC.
6.2 Most Significant Findings
6.2.1 Leaders Use Acknowledged Principles
The participants of the study who adopted ABC were most likely to also have leaders who
use acknowledged principles. This question was in regards to organizational culture, and
when looking into the contingency factor in the literature review, leaders were more
influential (Gosselin, 1997). Malmi (1997) revealed that employees can resist change, but
when a new leader is implemented, change is easier to go through with and in terms of SMEs,
ABC might be easier to implement from the beginning which may have been done by the
surveyed companies. Leaders in Smaller companies are also able to directly supervise and
have easier means of influencing their employees due to the flat structure, in comparison to a
larger structure such as a machine bureaucracy where tasks run through the chain of
46
command (Mintzberg, 1980).
6.2.2 Employee Change
While the change in the number of employees was significant in the statistical analysis, the
Exp(B) value, as the predictor variable, was one of the lowest values and is therefore a
different predictor. In terms of the study, hypothesis H1B was rejected despite the fact that a
lot of literature suggested a positive correlation. The issue here is the way that change is
measured: with a negative change scoring low and a positive change scoring higher. When
the variable is changed to measure the degree of change, this would give a score of 1-3,
where 3 is change to a larger degree, both in a positive and negative direction. This is
however not supported as much by theory even though it was suggested in relations to
financial measures (Al-Omiri & Drury, 2007).
6.2.3 Complete Cost Overview
An adequate cost overview also appeared to be of significance in terms of ABC adoption, as
well as being highly valued in the predictor value. Overview is an important part of ABC and
is also what makes it so special. However this is also a characteristic of SMEs, as many of
them do not have a large, if any, number of differentiated products, and with more processes
taking place, the overhead costs become more distorted (Bjørnenak, 1997). This was also
proven to be true in the study as the question of providing differentiated products was one of
the most disagreed with on the Likert scale. This causes a problem when it comes to the
relevance of SMEs and ABC, because when there isn’t a great need for ABC then SMEs
won’t always adopt it. However when taking the previous culture aspect of acknowledged
principles into account, adopting ABC at an early stage when the company is still young and
small can be beneficial as the company grows and takes on more activities (Kallunki &
Silvola, 2008).
Although the cost overview is associated with ABC, the question of causality comes into
play. It is whether those companies who have complete cost overview turn to ABC, or it
could be companies who have a complete cost overview as a result of adopting ABC.

47
6.2.4 Modern IT
With ABC being very complex to adopt as well as maintain, one would assume that the
technology is up-to-date, and while there was significance in the logistic regression, the
predictor value was not very high. With ABC having a large load of information (Kaplan &
Cooper, 1998), IT can prove to be beneficial, especially for smaller companies who do not
have as large of a turnover as the more typical ABC adopters (larger companies), however the
systems needed are often more expensive (Ittner, et al., 2002), but there may be potential for
SMEs in the future (Askarany, et al., 2007) (Somapa, et al., 2012) . This study does however
find a negative correlation to modern IT. There are many possible explanations for this fact,
and as previously mentioned some small companies might use the cheap modern IT as a
substitute for ABC fitting into the supply and demand model of Bjørnenak (1997).
6.2.5 External Uncertainty: Technological development
As mentioned just before, the paradigm shift for companies to be taking advantage of the
developing technology is something that benefits them (Chenhall, 2007). This in turn will
increase competitiveness in that field, since companies know that their competitors (Mia &
Clarket, 1999). Competition within technological development was found to be relevant to
ABC adoption according to the study; however it had a negative correlation, meaning that an
increase in the technological development would decrease the chances of the company
adopting. This is also the reason for rejecting the hypothesis and there is no apparent
explanation for this, it could be an issue with smaller companies not being aware of
technological developments and thus answering based on information flaws.
6.3 Contingency factors
Much of the information in the literature that was reviewed drew out this paper’s list of
contingency factors and pointed out the most influential criteria for SMEs. The literature
review left us with organizational size, organizational structure, organizational strategy,
organizational culture, external uncertainty and technology.
When it comes to organizational size, the literature review pointed towards the fact that the
larger the company, the higher the rate of adoption for more complex costing systems, such
as ABC. Size is also one of the main aspects of the research question. Although the study
deemed organizational size as insignificant, it is a clear factor to look into when it comes to
48
answering the research question. Literature indicates that smaller companies may not have a
large enough turnover to afford and maintain a fully implemented ABC system, but at the
same time small companies may not be big enough to greatly differentiate their products and
therefore don’t always have the need to adopt the system. Furthermore, even though the size
variables in the model used weren’t significant, Bjornenak (1997) discussed the hierarchical
diffusion of ABC. This would mean that small and medium sized companies are very far
down in the diffusion process and would be delayed with adopting ABC. When relating this
study to a recent similar one (Sandalgaard, et al., 2012), it could be seen that there’s a
percent increase in usage of ABC, even though the paper doesn’t discriminate towards
company size. Another possible and straight forward explanation to the insignificance of size
could be that the size range chosen for this study was not wide enough to be influential.
Additionally, this may be a question of the life cycle of the company (Kallunki & Silvola,
2008). If this is the case, many of the factors should be edited to fit Kallunki and Silvola’s
idea of life cycle, and it is definitely a point of interest for future research.
The information on structure of an organization points towards mechanistic and bureaucratic
structures with standardized and routine tasks being helpful for undertaking complex systems
such as ABC (Gosselin, 1997). What is important to note is that these structures are often
related to having larger volumes of production, which is also associated with more employees
and processes (Mintzberg, 1980), as well as the use of ABC. Another finding from Gosselin
(2007) pointed towards the fact that new/innovative structures have easier means of taking on
advanced systems like ABC seeing as they are flexible, which can also correlate with the
study, since respondents of the SMEs replied that the leaders using acknowledged principles
use ABC.5
One of the more relevant aspects of ABC is that it is famous for accounting for all the
activities taking place in the firm, while traditional systems are more inaccurate. Kaplan and
Cooper’s (1998) example showed that when it comes to having multiple processes taking
place, or differentiating products, ABC becomes more relevant. This point ties in with what
was mentioned earlier about having more processes being associated with larger companies,
and also questions the relevance of SMEs. When a company starts undertaking more
activities, having a cost leader strategy goes hand in hand with ABC implementation and can 5 Organic structured companies have an easier time implementing AA/ ACA (the beginning phases of ABC). This
will not be elaborated on due to limitations of scope, but could be reviewed as future research.

49
be beneficial as the information load grows (Kallunki & Silvola, 2008), but this strategy was
insignificant in the study of Danish SMEs.
Literature on organizational culture and ABC points towards leadership being an influence
and also drew the hypothesis of leaders wanting to appear innovative, but mostly when there
is a chance to start fresh i.e. a new leader who can influence the employees and not have to
change in the middle and face resistance (Baird, et al., 2004) (Baird, et al., 2007). In the case
of the study, the most relevant significant finding to ABC was the fact that the leaders use
acknowledged principles. This is also backed up with Gosselin (2007) who found that rising
companies who were innovative would take on the system.
Different studies list in different ways that the external environment plays a part in the use of
ABC. ABC is innovative and allows for better accounting and the innovative SMEs that
adopt it from the start gives them a competitive advantage (Jänkälä & Silvola, 2012).
However, the descriptive statistics of the survey point towards the Danish external
environment being very influential on SMEs, the point was not portrayed as being significant
in regards to adoption of ABC.
The literature review showed that in general, larger companies are associated with having
more expensive IT systems. However, since we are living through a time where technology is
allowing for easier access to information, SMEs could soon take great advantage of this.
Furthermore Kaplan and Anderson (2004) argue that TDABC is easier to connect to IT
systems. Newer sources reveal that IT has given more companies the chance of implementing
ABC (Askarany, et al., 2007) (Somapa, et al., 2012), however with this being ongoing
process, this may be why the SMEs in the study were not likely to have ABC and modern IT
systems. The relationship between cost overview, ABC and IT will also be discussed in the
next section.
6.4 Other Relevant Findings
After discussing the significant findings of the logistic regression model as well as the
descriptive statistics, the statistically non-significant results will be discussed further down.
This will involve both a discussion of the survey answers and their relationship to ABC
adoption, and high odds-ratio predictors. Furthermore, some factors that did not seem to be
relevant in our model will be compared to the existing theory and elaborated on.

50
Additionally, some conclusions that were not derived from our regression model will be
debated and contrasted with the use of the “New Statistics” approach in this paper.
6.4.1 Product Variation
Product Variations is one of the variables that were considered to be the most solid predictors
of adoption of ABC as explained previously. Cooper (1989) argues that in most of cases,
product variation leads to higher overhead costs, which, as previously talked about, is what
the traditional costing systems fail to portray accurately. ABC is superior to Traditional
costing systems in that sense and is an evident choice in this situation. Additionally, Cooper
(1988b) suggests firms should consider ABC under these circumstances.
Even so, in the regression model conducted, the variable did not show any sign of influence
on the adoption of ABC in SMEs. It actually showed a negative correlation to the adoption of
ABC. This, of course, could be related back to our limitation of sample variance or statistical
errors. The outcome is also inconsistent with a number of studies conducted already on cost
leadership and product variation. However, it must be considered that contingency factor’s
influence on adoption haven’t been applied to SMEs before (to the authors’ knowledge) and
the general theory is most likely not generally applicable.
However when the influence on adoption is set aside, a very interesting point to look at is the
survey results for Product Variation in the Danish SMEs. From these results, it can be seen
that the mean answer for Product Variation is 2.46 on the Likert scale. This indicates a
tendency of low product differentiation. This raises the question of whether or not ABC is
relevant for Danish SMEs again. Despite our literature review on ABC relevance to SMEs, it
is important to realize that most studies cannot be generalized (which is actually the idea
from which contingency theory came to be). A company with little to no variation in its
products/ services (and in our case, with small size as well) would not have essential needs of
a complicated costing system and, most likely, wouldn’t have any significant variable costs.
6.4.2 Product Variation / Cost Overview Correlation
Continuing the discussion on product variation and ABC applicability to SMEs and ABC, it
is relevant to discuss whether the companies actually need any more cost overview that is
provided by ABC. Examining the surveys, the high level of cost overview becomes visible.
The average of companies that do not have ABC and answered that they have a complete cost
overview is 4.01 on the Likert scale. This indicates a very high understanding of the costs in

51
the company and gives a very straight forward point as to why the diffusion of ABC in
Danish SMEs might be low. Even without ABC, it seems the small sized companies that are
mostly with low product differentiation seem to have a grasp of their costs.
Figure V Comparison of frequencies from Product differentiation and Complete cost overview(Source: Survey
results, Appendix D)
In Appendix B of this paper the Pearson correlation between Product Variation and Cost
Overview can be observed. In figure V a visualization of the answers given (where on the
horizontal axis the Likert scale is shown and on the vertical one the number of answers) can
be observed, which gives a better overview of the situation. The natural assumption one
might make is that with lesser product to be handled, the easier and, therefore higher, the cost
overview would be. However, it can be seen that there seems to be no significant correlation
between the two, which opens the door for some more research on this issue. This can be
related back to sample bias. It is, of course, notable that Product Variation isn’t necessarily
related to low overhead costs or high cost overview. A company can easily have low product
diversity, but high amounts of overhead, which would mean this papers conclusion, could be
relevant in practice.
Even though product variation did not end up being significant in the conducted models, the
descriptive statistics behind it helped explain the understanding of ABC diffusion and the
possible reasoning behind the (non-)adoption of the costing system in Danish SMEs.
1
8 11
45
36
0
10
20
30
40
50
1 2 3 4 5
Frequencies of Product differentiation and CCO
Product differentiation Complete cost overview

52
6.4.3 IT systems /Cost Overview Correlation
This section will elaborate more on relationship between IT systems and high cost overview, which
was touched on in the analysis. As discussed previously, IT systems for SMEs might be acting as
alternatives to ABC and provide the necessary additional cost information ABC would deliver. After
reviewing the correlation between the two factors (IT systems and Cost Overview), a very high
significance is identified, with a Pearson correlation of 0.526. In the graph below, a visualization of
the survey answers related to those two variables can be seen. Again, in the vertical axis, the number
of answers can be seen, whereas on the horizontal one, the distribution on the Likert scale is shown.
Figure VI Comparison of frequencies of Modern It and Complete cost overview(Source: Survey results, Appendix D)
From the descriptive statistics available, derived from the surveys, it can also be seen that smaller
sized companies with advanced IT systems in Denmark seem to be a substantial amount (3.99
averages on the Likert scale). Apart from the contingencies influencing adoption that have been
examined, this could be considered a possible reason for the diffusion of ABC, which is elaborated
below.
In this study a size range of 20 to 200 has been used in selecting the survey participants. Within such
small sized companies, it is quite likely that managers just don’t require complicated costing systems.
Additionally, from the previous section the low amount of product differentiation was discussed. In
such circumstances, it might be the cases that managers could simply rely on advanced IT systems to
accurately identify costs. Furthermore, in SMEs, managers are presumably very frequently involved
in the daily operation of the company and would most likely be aware of certain product’s (e.g.) high
maintenance. Although ABC might be theoretically more relevant for situations of inaccurately
0
10
20
30
40
50
1 2 3 4 5
Frequencies of IT and CCO
Modern IT Complete cost overview

53
allocated costs, in practice, SME managers with proper information provided by advanced IT might
be a more viable solution. This might be reflected in the correlation of IT and Cost Overview shown
above, as companies with a higher level of IT seem to have a better cost overview.
6.4.4 Non-Significant Predictors
As mentioned previously, new statistics have changed the way of hypothesis testing and thus
allowing for more predictor variables. It means that it is not just the level of significance that
matter, but also the effect size of the specific variable (Cumming, 2014). This means that the
variables: Economic market, Direct competition and Leaders are innovative are all variables
that have a great influence on the statistical analysis. The requirements for a certain variable
to satisfy a hypothesis is a significance level below 0.05 or 5%, so the hypotheses of these
variables cannot be confirm, but at the same time there is a strong correlation to these
variables even if it is not significant. This add further value to the model as it has proven to
be able to predict if a company has implemented ABC or TDABC at a rate of almost 94 %.
Economic market has an effect size of Exp(B)=9.382 so the model as a whole is very much
determined by an insignificant variable.
7. Conclusion
This paper adds to the already massive amount of research done on ABC, but brings the
combination of a contingency framework to the table, as well as further elaboration of the
diffusion of ABC in small and medium sized Danish companies. Through a categorization of
the current literature as well as a related survey, it has been established that contingency
theory has a huge role in the use and development of ABC. By conducting a logistic
regression on the contingency framework two variables were identified, that influenced the
adoption of ABC in Danish SMEs. The data of the survey can also serve as an indication of
how widespread ABC and TDABC are, and thus where the supply of these models could be
increased. The diffusion of TDABC in SMEs, in particular, should be a focus, as research has
shown it to be promising alongside the normal ABC-model for many Danish companies
(Fladkjær & Jensen, 2011).
The main findings of this paper are related to two main contingency factors that influence the
adoption of ABC in small and medium sized enterprises in Denmark: Technology and
54
Culture. More specifically, the model used resulted in Cost Overview and Leader’s Principles
being positively correlated, significant variables. These two elements are a very central part
of recent ABC research (Baird, Harrison, & Reeve, 2007) (Fladkjær & Jensen, 2011) and
along with this paper’s conclusions; pragmatic steps could be embarked on to aid companies
interested in ABC. The factors in question are rather volatile, as they are more easily changed
in comparison to (e.g.) size or structure of the company. While those two contingencies
corresponded with the survey results, the literature review also pointed out other directly
relevant contingencies that were also discussed. In the case of ABC, a new IT-system as well
as a person with ABC Know-how can be introduced into the company, to help with the
implementation phase.
Additionally, the descriptive statistics available from the conducted survey provide valuable
information on the Danish SME’s condition. After the analysis of this data, this paper
discusses the relevancy of the costing system in the study’s context. Low product
differentiation, informal structures and already high cost overview are theoretically argued to
make ABC less appealing to SMEs, considering the additional costs related to
implementation. Also, a high correlation between Advanced IT and High Cost Overview is
found, and the implications in relation to ABC have been discussed.
A very thorough literature review of existing peer reviewed studies from the last 20 years on
both “ABC diffusion factors” and “ABC in SMEs” could provide future research with a
foundation and an adequate overview of the studies.
Lastly this study contributes with a model that can predict the use of ABC in Danish SMEs
with a very high precision (94% accuracy). This could aid a future development of an actual
implementation framework, as some variables seem to be highly correlated with the use of
ABC.
8. Future research
Through a review of available literature, as well as a study on the use of ABC in Danish
SMEs, there has been established a few shortcomings in the literature, as well as some ideas
for the future of ABC literature. Additionally, the influence of contingency factors on ABC
adoption in (Danish) SMEs is not a developed area and, to the authors’ knowledge, no such
55
research has been developed before. This opens up for possibility on many future research
opportunities and further development of the model. The use of ABC has been paired with
other terms, sometimes crossing the fields of study like diffusion theory, which has its origin
in sociology (Bjørnenak, 1997). The same is present for contingency theory, lagging effects
and the cultural aspects of the company. All of these are different areas that have been further
developed over the last few years to compliment the theory of ABC and TDABC.
Furthermore, future research can develop on the outlined limitations of this project.
8.1 Quantitative
This study contributes to the contingency theory of ABC, and suggests that a preliminary
review of a company in regards to the use of ABC, could undertake a contingency based
evaluation in order to assess the capabilities of the company, and if the model might fit.
However, in order to make ABC work, it is necessary to further develop the contingencies,
and also see the relationship differences in small and larger companies. A comparative study
of two different populations could aid to see some of the largest differences.
Given the new developed IT-systems that are more efficient, as well as cheaper than ever
before, more focus could be laid on the technological structure of different companies. More
precisely, it would presumably benefit smaller companies when the price of implementation
is low, so technological development is a highly discussed topic and should be further
developed. This could be combined with a cultural aspect. Many researchers have applied a
“Champion” within a company, a person who knows about ABC and has experience, and this
has shown great result (Anderson, 1995). This is once again part of the success of ABC,
which is a very pressing issue, as some companies fail to see the benefit of the extensive
models. A concrete suggestion related to this study could be reviewing the success of ABC in
Danish SME’s given the contingencies. Another could be to simply use only success factors
and then create a similar study with a survey of ABC-adopters and non-adopters, and the find
companies that could be successful with implementing ABC. Another future development of
this study could be to separate the contingency factors into separate stages of implementation,
described in the Limitations. Lastly, an idea could be to replicate this study to strengthen or
disprove the statistical analysis used. Many other possible paths towards development can be
taken and the Limitation section of this paper can be used for other ideas.

56
8.2 Qualitative
In this study it was found that two respondents have previously used Time-driven Activity-
Based Costing, but have decided to abandon it. This is of course a very important piece of
information for future research, as it shows the potential for an upcoming qualitative research
showcasing the abandonment of TDABC like it has been done with ABC. This could help to
further develop the model, as it would seem that TDABC is not completely free of issues. It
could also be done as a quantitative study, but given the low response rate and low number of
abandoners, it would be very hard to collect enough data to produce a statistically significant
result

57
Bibliography
Al-Omiri, M., & Drury, C. (2007). Organizational and behavioral factors influencing the adoption and
success of ABC in the UK. Cost Management, 38.
Anderson, S. W. (1995). A framework for assessing cost management system changes: the case of
activity based costing implementation at General Motors. Journal of Management Accounting
Research, 1-51.
Anderson, S. W., & Young, S. M. (1999). The impact of contextual and process factors on the
evaluation of activity-based costing systems. Accounting, Organizations and Society, 525-
559.
Anderson, S. W., Hesford, & J. W., &. Y. (2002). Factors influencing the performance of activity
based costing teams: a field study of ABC model development time in the automobile
industry. Accounting, Organizations and Society, 195-211.
Anthony. (1989). Reminiscences about management accounting. Journal of Management Accounting
Research , 1, 1-20.
Arbnor, I., & Bjerke, B. (2009). Methodology for creating business knowledge (3. ed.). Sage
Publication.
Arnaboldi, M., & Lapsley, I. (2005). Activity based costing in Healthcare: a UK case study. Research
in Healthcare Financial Management, 61-75.
Askarany, D., Smith, M., & Yazdifar, H. (2007). Technological innovations, activity based costing
and satisfaction. Journal of Accounting - Business & Management, 53-63.
Atkinson, A. A., Kaplan, R. S., & Young, S. M. (2004). Management accounting. Prentice Hall.
Atkinson, A. A., Kaplan, R. S., Matsumura, E. M., & Young, S. M. (2011). Management Accounting:
Information for Decision Making and Strategy Execution (6th udg.). New Jersey : Pearson
Education.
Baird, K., Harrison, G., & Reeve, R. (2007). Success of activity management practices: the influence
of organizational and cultural factors. Accounting and finance.
Baxendale, S. (2001). Activity-Based Costing for the Small Business. A Primer. Business Horizons
41, 61-68.
58
Bharara, A., & Lee, C. (1996). Implementation of an activity-based costing system in a small
manufacturing company. International Journal of Production Research, 1109–1130.
Bjørnenak, T. (1997). Diffusion and accounting : the case of ABC in Norway. Management
Accounting Research, 3 – 17.
Brewer, P. C. (1998). National culture and activity-based costing systems: a note. Management
Accounting Research, 241-260.
Brierley, J. A. (2008). An examination of the factors influencing the level of consideration for
activity-based costing. International Journal of Business and Management, 58-66.
Brown, D. A. (12020). adoption somehting. journal of niggers.
Brown, D. A., Booth, P., & Giacobbe, F. (2004). Technological and organizational influences on the
adoption of activity-based costing in Australia. Accounting and Finance, 329–356.
Bruggeman, W., & Slagmulder, R. (1995). The impact of technological change on management
accounting. Management Accounting Research, 241-252.
Bruggeman, W., Everaert, P., Anderson, S. R., & Levant, Y. (2005). Modeling Logistics Costs using
Time-Driven ABC: A Case in a Distribution Company. (Working Paper) Faculty of
Economics and Business Administration, Ghent University.
Burell, g., & Morgan, G. (1979). Sociological Paradigm and Organisational Analysis. Heinemann.
Cardinaels, E., & Ierland, D. v. (2007). Smart Ways to Assess Customers Customer Profit. Cost
Management, 26.
Cardinaels, E., Roodhooft, F., & Warlop, L. (2004). The Value of Activity-Based Costing in
Competitive Pricing Decisions. Journal of Management Accounting Research, 133.
Chenhall, R. H. (2003). Management control systems design within its organizational context:
findings from contingency-based research and directions for the future. Accounting,
Organizations and Society, 127-168.
Chenhall, R. H. (2004). The role of cognitive and affective conflict in the early implementation of
activity-based cost management. Behavioral Research in Accounting, 19-44.
Chenhall, R. H. (2006). Theorizing Contingencies in Management Control Systems Research.
Handbook of management accounting research.
59
Chenhall, R. H. (2007). Theorizing Contingencies in Management Control Systems Research.
Handbook of Management Accounting Research.
Chenhall, R. H., & Langfield-Smith, K. (1998). The relationship between strategic priorities,
management techniques and management accounting: an empirical investigation using a
systems approach. Accounting, Organizations and Society, 243-264.
Davilla, A., Foster, G., & Li, M. (2009). Reasons for management control systems adoption: insight
from product development systems choice by early-stage entrepreneurial companies.
Accounting, Organization and Society.
Deetz, S. (1996). Describing Differences in Approaches to Organization Science: Rethinking Burrell
and Morgan and Their Legacy. Organization science Col. 7 No. 2.
Denyer, D., & Tranfield, D. (2008). Producing a systematic review. London: The Sagde Handbook of
Organizational Reseach Methods.
Dierks, P., & Cokins, G. (2000). Glossary of activity-based management. Bedford.
Duncan, R. B. (1972). Characteristics of Organizational Environments and Perceived Environmental
Uncertainty. Administrative science quarterly.
Everaert, P., Bruggeman, W., & De Creus, G. (2008a). Sanac Inc.: From ABC to time-driven ABC
(TDABC) – An instructional case. Journal of Accounting Education, 26(3), 118–154.
Everaert, P., Bruggeman, W., De Creus, G., & Moreels, K. (2007). SANAC Logistics. Time
Equations to Capture Complexity in Logistics Processes”,. Harvard Business Press, 165–178.
Everaert, P., W., B., Sarens, G., Anderson, S., & Levant, Y. (2008b). Cost modeling in logistics using
time-driven ABC: Experiences from a wholesaler. International Journal of Physical
Distribution & Logistics Management, 38(3), 172–191.
Ezzamel, M., Willmott, H., & Worthington, F. (2004). Accounting and management-labour relations:
the politics of production in the 'factory with a problem'. Accounting, Organizations and
Society, 269-302.
Fei, Z. Y., & R., I. C. (2010). Factors influencing Activity-Based Costing Succes: A Research
Framework. International Journal of Trade, Economics and Finance.
Fladkjær, H., & Jensen, E. (2011). The ABC-paradox: Is Time Driven ABC Relevant for Small and
Medium Sized Enterprises (SME)? Working Paper.

60
Foster, G., & Swenson, D. W. (1997). Measuring the success of activity-based cost management and
its determinants. Journal of Management Accounting Research, 109-144.
Gervais, M., Levant, Y., & Ducrocq, C. (2010). Time-Driven Activity-Based Costing (TDABC): An
Initial Appraisal through a Longitudinal Case Study. Th e Journal of Applied Management
Accounting Research, 8(2), 20.
Gosselin, M. (1997). The effect of strategy and organizational structure on the adoption and
implementation of activity-based costing. Accounting, Organizations and Society, 105-122.
Gosselin, M. (2007). A Review of Activity-Based Costing - Technique, Implementation and
Consequences. Handbook of Management Accounting Research, 641-647.
Gunasekaran, A., & Singh, D. (1999). Design of Activity-Based Costing in a Small Company: A Case
Study. Computers and Industrial Engineering, 413-416.
Gunasekaran, A., Marri, H. B., & Grieve, R. J. (1999). Activity-Based Costing in Small and Medium
Enterprises. Computers and Industrial Engineering, 407-411.
Gunasekaran, A., MarriR, H. B., & Grieve, J. (1999). Justification and implementation of activity
based costing in small and medium-sized enterprises. Logistics Information Management, 386
- 394.
Gunasekaran, A., McNeil, R., & Singh, D. (2000). Activity-based management in a small company: A
case study. Production Planning & Control, 391-399.
Gunasekarn, A., & Sarhadi, M. (1998). Implementation of Activity-Based Costing in manufacturing.
International Journal of Production Economics, 56-57, 231-242.
Hage, J. (1980). Theories of organizations: form, process and transformation. New York, NY: Wiley.
Hicks, D. T. (1999). Yes, ABC Is for Small Business, Too. Journal of Accountancy, 41-43.
Hilton, R. W. (2005). Managerial accounting: creating value in a dynamic business environment.
NewYork: McGraw-Hill/Irwin.
Horngren, C., Bhimani, A., Datar, S., & Foster, G. (2002). Management and cost accounting. London,
UK: Prentice-Hall.
Hosmer, D. H., Lemeshow, S., & Sturdivant, R. X. (2013). Applied logistic regression (3. udg.).
Wiley.

61
Håndværksrådet. (2015). Om Håndværksrådet. Håndværksrådet.
Innes, J., & Mitchell, F. (1995). A survey of activity-based costing in the U.K.'s largest companies.
Management Accounting Research, 137-153.
Ittner, C. D. (1999). Activity-based costing concepts for quality improvement. European Management
Journal, 492-500.
Johnson, H. T. (1990). Beyond product costing: a challenge to cost management’s conventional
wisdom. Cost Management, 4, 15–21.
Johnson, H. T. (1992). It’s time to stop overselling ABC. Management Accounting, 74, 26–35.
Jong No, J., & Kleiner, B. H. (1997). How to implement activity-based costing. Logistics Information
Management, 68 - 72.
Jänkälä, S., & Silvola, H. (2012). Lagging Effects of the Use of Activity-Based. Journal of Small
Business Management.
Kallunki, J.-P., & Silvola, H. (2008). The effect of organizational life cycle stage on the use of
activity-based costing. Management Accounting Research, 62-79.
Kaplan, R. S., & Anderson, S. R. (2004). Time-driven Activity-Based Costing. Harvard Business
Review.
Kaplan, R. S., & Cooper, R. (1988). Measure costs right: make the right decisions. Harvard Business
Review, 66, 96–103.
Kaplan, R. S., & Cooper, R. (1998.). Cost and Effect: Using Integrated Cost Systems to Drive
Profitability and Performance. Boston: Harvard Business School Press.
Kaplan, R., & Anderson, S. (2007a). The innovation of time-driven activity-based costing. Journal of
cost management, 21(2), 5–15.
Kaplan, R., & Anderson, S. (2007b). Time-driven activity-based costing: a simpler and more powerful
path to higher profits. Harvard Business Press.
Kennedy, T., & Affleck-Graves, J. (2001). The impact of activity-based costing techniques on firm
performance. Journal of Management Accounting Research, 19-45.
Khandwalla, P. N. (1977). The design of organizations. Harcourt Brace Jovanovich.
62
Korpunen, H., Mochan, S., & Uusitalo, J. (2010). An activity-based costing method for sawmilling.
Forest Products Journal, 60(5), 420–431.
Krumwiede, K. R. (1998). The implementation stages of activity-based costing and the impact of
contextual and organizational factors. Journal of Management Accounting Research, 239.
Kuada, J. (2012). Reseach Methodology: A project guide for university students. Samfundslitteratur.
Kuhn, T. (1962). The structure of scientific revolutions. University press of Chicago.
Kwon, T. H., & Zmud, R. W. (1987). Unifying the fragmented models of information systems
implementation. New York,: Wiley.
Laitinen, E. K. (2001). Management Accounting Change in Small Technology Companies: Towards a
Mathematical Model for Technology Firm. Management Accounting Research, 507-541.
Major, M., & Hopper, T. (2005). Managers divided: implementing ABC in a Portuguese
telecommunications company. Management Accounting Research, 205-229.
Malmi, T. (1997). Towards explaining activity-based costing failure: accounting and control in a
decentralized organization. Management Accounting Research, 459-480.
McGowan, A. S. (1998). Perceived benefits of ABCM implementation. Accounting Horizons, 31-50.
McGowan, A. S., & Klammer, T. P. (1997). Satisfaction with activity-based cost management
implementation. Journal of Management Accounting Research, 217-237.
Mia, L., & Clarket, B. (1999). Market competition, management accounting systems and business unit
perfromance. Management Accounting Research, 137-1 58.
Miller, J. G., & Vollmann, T. E. (1985). The hidden factory. Harvard Business Review, 63, 142–150.
Mintzberg, H. (1980). Structure in 5's: A synthesis of the Research on Organization Design.
Management Science Vol. 26, 322-341.
Moores, K., & Yuen, S. (2001). Management Accounting Systems and Organizational Configuration:
A Life-Cycle Perspective. Accounting, Organizations and Society, 351-389.
Needy, K. L., Bidanda, B., & Gulsen, M. (2000). A Model to Develop, Assess, and Validate an
Activity-Based Costing Systems for Small Manufacturers. Engineering Management Journal,
31.

63
Needy, L. K., Nachtmann, H., Roztock, N., Warner, R. C., & Bidanda, B. (2003). Implementing
Activity-Based Costing Systems in Small Manufacturing Firms: A Field Study. Engineering
Management Study, 3–10.
Noreen, E. (1991). Conditions under which activity-based cost systems provide relevant costs.
Journal of Management, 3, 159–168.
Parlament, D. (2005). Små og mellemstore virksomheder - definition af små og mellemstore
virksomheder samt administrative byrder. Copenhagen: Danish Parlament.
Piper, J. A. (1990). Testing ABC logic. Management Accounting, 69, 37.
Piper, J. A. (1991). ABC relevance not found. Management Accounting, 69, 42–44.
Ratnatunga, J., Tse, M., & Balachandran, K. (2012). Cost Management in Sri Lanka: A Case Study on
Volume, Activity and Time as Cost Drivers. The International Journal of Accounting, 47(3),
281–301.
Reddy, K., Venter, H., & Olivier, M. (2011). Using time-driven activity-based costing to manage
digital forensic readiness in large organisations. Information Systems Frontiers, 1–17.
Roztocki, N., Porter, J. D., Thomas, R. M., & Needy, L. K. (2004). A Procedure for Smooth
Implementation of Activity-Based Costing in Small Companies. Engineering Management
Journal, 19-27.
Sandalgaard, N., Bjerregaard, L. D., & Østergaard, K. (2012). Budgetpraksis i danske
produktionsvirksomheder (working paper). Department of business and management .
Schoute, M. (2011). The relationship between product diversity, usage of advanced manufacturing
technologies and activity-based costing adoption. The british accounting review.
Shields, D. (1995). An empirical analysis of firms' implementation experiences with activity-based
costing. Journal of Management Accounting Research, 148-161.
Somapa, S., Cools, M., & Dullaert, W. (2012). Unlocking the potential of time-driven activity-based
costing for small logistics companies. International Journal of Logistics Research and
Applications, 303-322.
Statistik, D. (2012). Generel Firmastatisktik: Nyt fra Danmarks Statisktik: Nr. 425. Danmarks
Statistik.
64
Stout, D., & Propri, J. (2011). Implementing Time-Driven Activity-Based Costing at a Medium-Sized
Electronics Company. Management Accounting Quarterly, 12(3), 1–11.
Stratton, W., Desproches, D., Lawson, R., & Hatch, T. (2009). Activity-Based Costing: Is It Still
Relevant? Management Accounting Quarterly, 10(3).
Turney, P. B. (1989). Using activity-based costing to achieve manufacturing excellence. Cost
Management, 4, 22–31.
Van der Stede, W. A., Young, S. M., & Chen, C. X. (2005). Assessing the quality of evidence in
empirical management accounting research: The case of survey studies. Accounting,
Organizations and society.
Varila, M., Seppänen, M., & Suomala, P. (2007). Detailed cost modelling: a case study in warehouse
logistics. International Journal of Physical Distribution & Logistics, 37(3), 184–200.
Vieira, R., & Hoskin, K. (2002). Power, discourses and accounting change: the implementation of
activity based costing in a Portuguese bank. Paper presented at the IX International Congress
of costs Florianópolis, Brazil.
Vittinghoff, E., & McCulloch, C. E. (2006). Relaxing the Rule of Ten Events per Variable in Logistic
and Cox Regression.
Wakita, T., Ueshima, N., & Noguchi, H. (2012). Psychological Distance Between Categories in the
Likert Scale: Comparing Different Numbers of Options. Educational and psychological
measurements.
Webster, F. (1971). Communication and Diffusion Processes in Industrial Markets. European Journal
of Marketing, 4, 178 – 188.
Whitehead, J. C., Groothuis, P. A., & Blomquist, G. C. (1993). Testing for non-response and sample
selection bias in contingent valuation. Economic Letters.
Öker, F., & Adigüzel, H. (2010). Time-driven activity-based costing: An implementation in a
manufacturing company. Journal of Corporate Accounting & Finance, 22(1), 75–92.

65
Appendix A – Answers and questions
Hvad er din rolle i virksomheden? / Position in company
Adm. Direktør (CEO) 36 34.6
%
Økonomichef (CFO) 49 47.1
%
Anden Lederrolle 11 10.6
%
Andet 8 7.7 %
Hvilken metode benyttes til at fordele indirekte produktionsomkostninger? / Cost allocation system
Full-Cost (ikke baseret på aktivitets niveau) 5 4.9 %
Variabilitetsregnskab 4 3.9 %
Time-driven Activity-Based Costing 4 3.9 %
Activity-Based Costing 10 9.7 %
Direkte løntimer 27 26.2 %
Maskintimer 5 4.9 %
Produkter/produktliniers omsætning 8 7.8 %
Opgøres ikke 40 38.8 %
Har i (virksomheden) tidligere benyttet en af følgende metoder til fordeling af indirekte omkostninger / Previous use of cost allocation system
Full-Cost 6 6.7 %
Variabilitetsregnskab 3 3.4 %

66
Time-driven Activity-Based Costing 3 3.4 %
Activity-Based Costing 6 6.7 %
Direkte løntimer 18 20.2 %
Maskintimer 5 5.6 %
Produkter/produktliniers omsætning 4 4.5 %
Opgøres ikke 45 50.6 %
Antallet af medarbejdere i virksomheden / Number of employees
20-40 44 42.7 %
41-60 24 23.3 %
61-80 8 7.8 %
81-100 10 9.7 %
101-120 4 3.9 %
121-140 4 3.9 %
141-160 0 0 %
161-180 1 1 %
181-200 0 0 %
200< 8 7.8 %
Ved ikke 0 0 %
Stigning/fald i antallet af medarbejdere det sidste regnskabsår/ Increase/decrease of number of employees
Fald på over 10 3 3 %
Fald på 6-10 2 2 %
Fald på 0-5 25 24.8 %
Stigning på 0-5 55 54.5 %
Stigning på 6-10 9 8.9 %
Stigning på over 10 6 5.9 %
Ved ikke 1 1 %
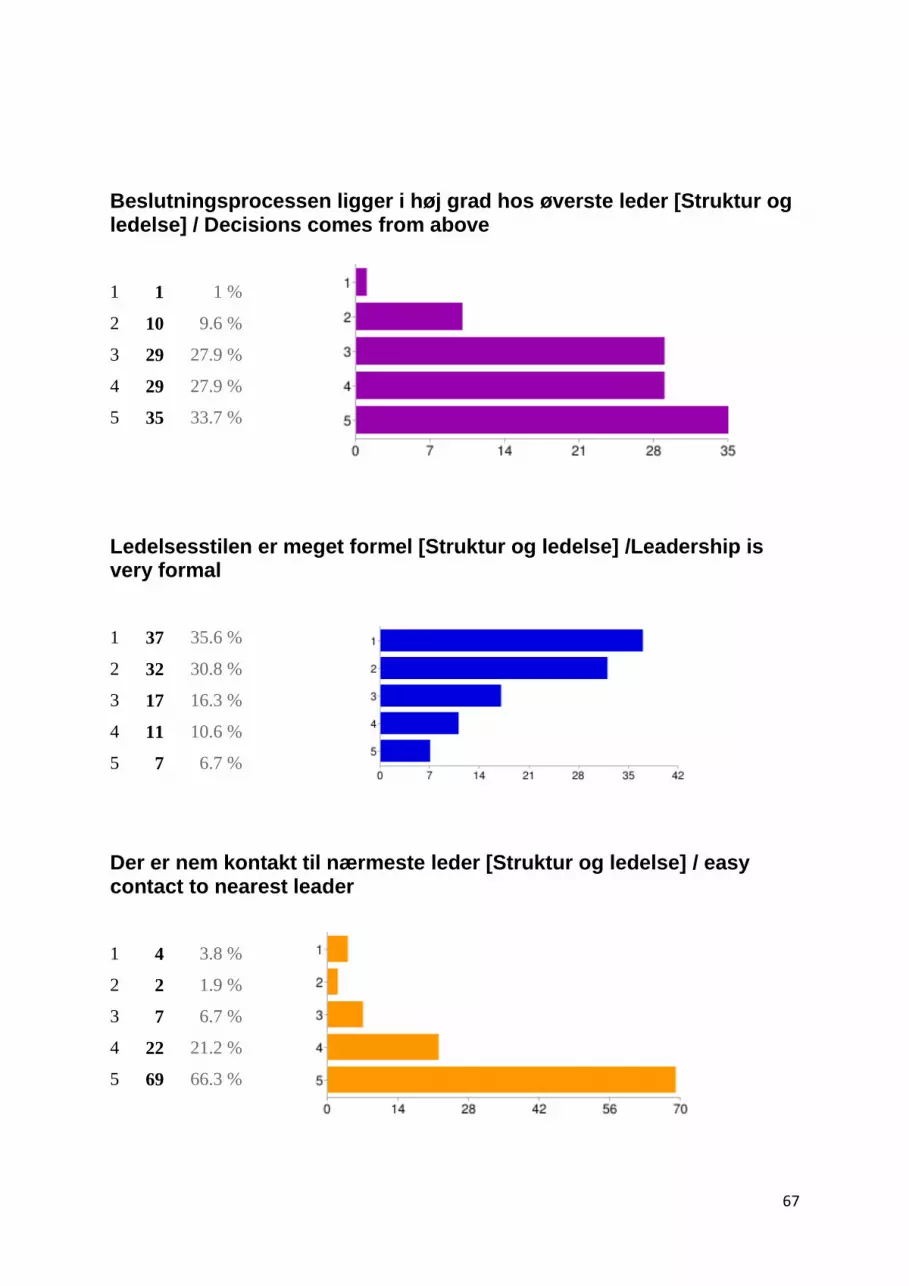
67
Beslutningsprocessen ligger i høj grad hos øverste leder [Struktur og ledelse] / Decisions comes from above
1 1 1 %
2 10 9.6 %
3 29 27.9 %
4 29 27.9 %
5 35 33.7 %
Ledelsesstilen er meget formel [Struktur og ledelse] /Leadership is very formal
Der er nem kontakt til nærmeste leder [Struktur og ledelse] / easy contact to nearest leader
1 4 3.8 %
2 2 1.9 %
3 7 6.7 %
4 22 21.2 %
5 69 66.3 %
1 37 35.6 %
2 32 30.8 %
3 17 16.3 %
4 11 10.6 %
5 7 6.7 %
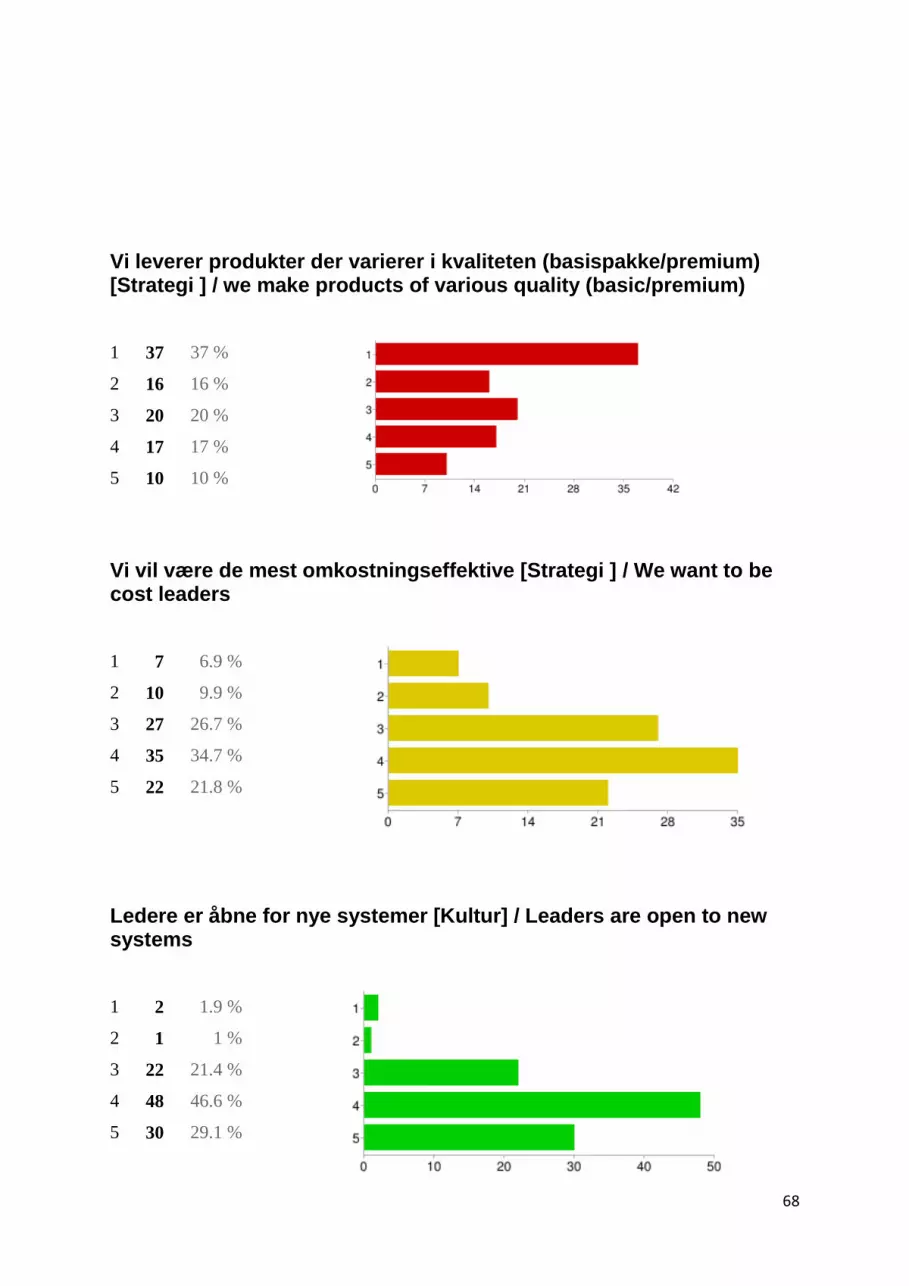
68
Vi leverer produkter der varierer i kvaliteten (basispakke/premium) [Strategi ] / we make products of various quality (basic/premium)
Vi vil være de mest omkostningseffektive [Strategi ] / We want to be cost leaders
1 7 6.9 %
2 10 9.9 %
3 27 26.7 %
4 35 34.7 %
5 22 21.8 %
Ledere er åbne for nye systemer [Kultur] / Leaders are open to new systems
1 2 1.9 %
2 1 1 %
3 22 21.4 %
4 48 46.6 %
5 30 29.1 %
1 37 37 %
2 16 16 %
3 20 20 %
4 17 17 %
5 10 10 %

69
Lederne vil gerne fremstå som nytænkende [Kultur] / Leaders want to appear innovative
1 1 1 %
2 2 1.9 %
3 19 18.4 %
4 50 48.5 %
5 31 30.1 %
Lederne anvender anerkendte principper [Kultur] / Leaders using acknowledged principles
1 1 1 %
2 13 12.7 %
3 26 25.5 %
4 43 42.2 %
5 19 18.6 %
Virksomheden anvender moderne IT-systemer [Teknologi] / The company is using a modern IT-system
1 2 2 %
2 7 6.9 %
3 18 17.6 %
4 38 37.3 %
5 37 36.3 %

70
Virksomheden har et fyldestgørende overblik over omkostninger [Teknologi] / The company has a full cost overview
1 1 1 %
2 8 7.8 %
3 11 10.8 %
4 46 45.1 %
5 36 35.3 %
Direkte konkurrenters markedsaktiviteter [Konkurrence] / Direct competitors influence
Kundernes behov og præferencer [Konkurrence] / Customer needs and præferences
1 4 3.9 %
2 1 1 %
3 10 9.8 %
4 41 40.2 %
5 46 45.1 %
1 14 13.7 %
2 12 11.8 %
3 22 21.6 %
4 43 42.2 %
5 11 10.8 %
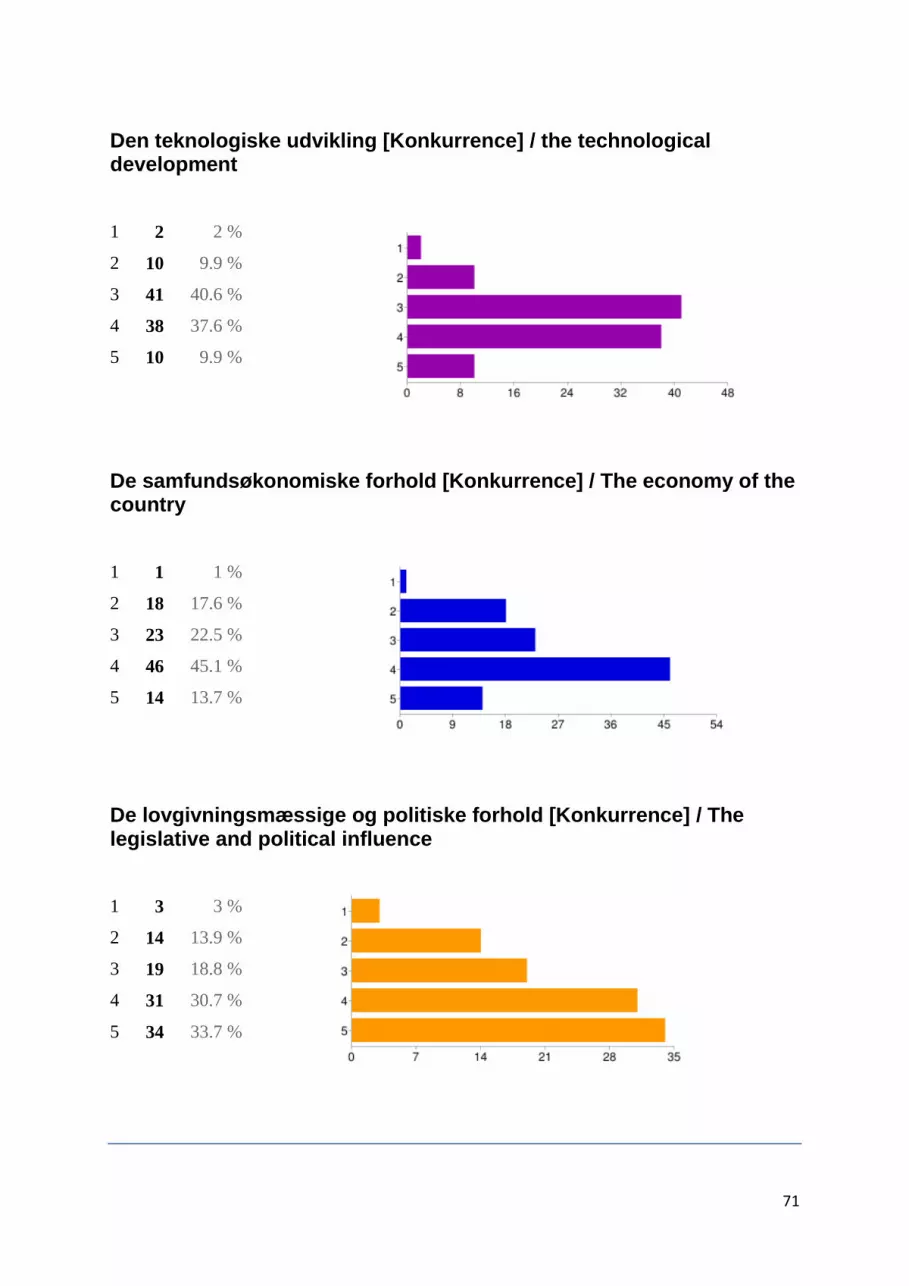
71
Den teknologiske udvikling [Konkurrence] / the technological development
De samfundsøkonomiske forhold [Konkurrence] / The economy of the country
De lovgivningsmæssige og politiske forhold [Konkurrence] / The legislative and political influence
1 2 2 %
2 10 9.9 %
3 41 40.6 %
4 38 37.6 %
5 10 9.9 %
1 1 1 %
2 18 17.6 %
3 23 22.5 %
4 46 45.1 %
5 14 13.7 %
1 3 3 %
2 14 13.9 %
3 19 18.8 %
4 31 30.7 %
5 34 33.7 %

72
Appendix B – Pearson correlation

73
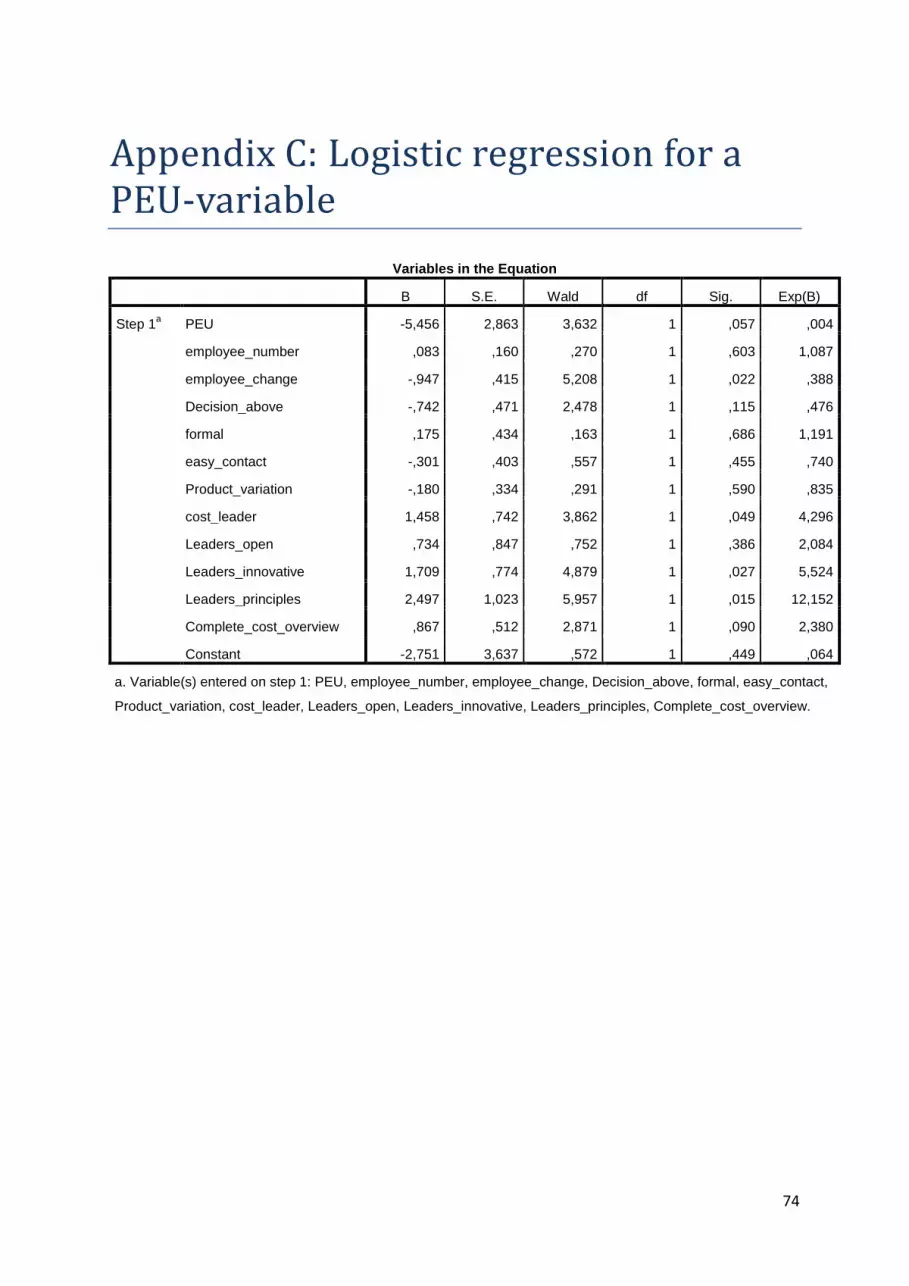
74
Appendix C: Logistic regression for a PEU-variable
Variables in the Equation
B S.E. Wald df Sig. Exp(B)
Step 1a PEU -5,456 2,863 3,632 1 ,057 ,004
employee_number ,083 ,160 ,270 1 ,603 1,087
employee_change -,947 ,415 5,208 1 ,022 ,388
Decision_above -,742 ,471 2,478 1 ,115 ,476
formal ,175 ,434 ,163 1 ,686 1,191
easy_contact -,301 ,403 ,557 1 ,455 ,740
Product_variation -,180 ,334 ,291 1 ,590 ,835
cost_leader 1,458 ,742 3,862 1 ,049 4,296
Leaders_open ,734 ,847 ,752 1 ,386 2,084
Leaders_innovative 1,709 ,774 4,879 1 ,027 5,524
Leaders_principles 2,497 1,023 5,957 1 ,015 12,152
Complete_cost_overview ,867 ,512 2,871 1 ,090 2,380
Constant -2,751 3,637 ,572 1 ,449 ,064
a. Variable(s) entered on step 1: PEU, employee_number, employee_change, Decision_above, formal, easy_contact,
Product_variation, cost_leader, Leaders_open, Leaders_innovative, Leaders_principles, Complete_cost_overview.
Related Documents