Tel-Aviv University Raymond and Beverly Sackler Faculty of Exact Sciences The Blavatnik School of Computer Science Fingerprints Image Spoof Detection and Classification by Tatiana Barsky The dissertation submitted in partial fulfillment of the requirements for the degree of Master of Science Prepared under the supervision of Prof. Yehezkel Yeshurun January 2009 Shebat 5769

Welcome message from author
This document is posted to help you gain knowledge. Please leave a comment to let me know what you think about it! Share it to your friends and learn new things together.
Transcript
Tel-Aviv University
Raymond and Beverly Sackler Faculty of Exact
Sciences
The Blavatnik School of Computer Science
Fingerprints Image Spoof
Detection and Classification
by
Tatiana Barsky
The dissertation submitted in partial fulfillment of the requirements for thedegree of
Master of Science
Prepared under the supervision ofProf. Yehezkel Yeshurun
January 2009 Shebat 5769

Acknowledgments
I would like to express my gratitude to prof. Yehezkel Yeshurun for hisguidance and help throughout the research.
I am deeply indebted to my parents, Maria and Stanislav, for their stim-ulating support and their essential help. I would like to give my specialthanks to my husband Roman, whose help, patience and love enabled me tocomplete this work. I thank all my family, especially Malvina, Vladimir, andIra, for their encouragement and faith. I thank my son, Ethan, for his goodbehavior in the critical moments of the research.
I also thank all the people who helped me to collect and process thefingerprints.
3
Abstract
Biometric identification is gaining more and more recognition as a leadingtechnology for identity management and security systems. This inevitablyis followed by numerous methods that are aimed at breaking those securitymeasures. In this paper we address the problem of fingerprints spoofing,that is, the usage of counterfeit elastic fingerprints. Based on image featuresextracted from 2D fingerprints images, we present several novel algorithmsthat classify fingerprints images as real or fake, and demonstrate their perfor-mance on a fingerprints database. We conclude that it is possible to achievea relatively high level of confidence using our approach.
5
Contents
Abstract 5
Abbreviations and Notations 14
1 Introduction 17
1.1 Background . . . . . . . . . . . . . . . . . . . . . . . . . . . . 171.2 Related work . . . . . . . . . . . . . . . . . . . . . . . . . . . 191.3 The Proposed Approach . . . . . . . . . . . . . . . . . . . . . 191.4 Paper outline . . . . . . . . . . . . . . . . . . . . . . . . . . . 20
2 ACL model 23
2.1 Design . . . . . . . . . . . . . . . . . . . . . . . . . . . . . . . 232.2 CEA Description . . . . . . . . . . . . . . . . . . . . . . . . . 252.3 Classifiers Description . . . . . . . . . . . . . . . . . . . . . . 30
3 Smart ACL model 33
3.1 Design . . . . . . . . . . . . . . . . . . . . . . . . . . . . . . . 333.2 ACL vs. Smart ACL . . . . . . . . . . . . . . . . . . . . . . . 33
4 Experiment Scope 35
5 ACL Results 37
5.1 Weak Bayesian classifiers . . . . . . . . . . . . . . . . . . . . . 375.2 SVM . . . . . . . . . . . . . . . . . . . . . . . . . . . . . . . . 375.3 k-NN . . . . . . . . . . . . . . . . . . . . . . . . . . . . . . . . 385.4 Decision Tree . . . . . . . . . . . . . . . . . . . . . . . . . . . 385.5 Linear Discriminant Analysis . . . . . . . . . . . . . . . . . . 39
6 Smart ACL Results 43
6.1 Weak Bayesian classifiers . . . . . . . . . . . . . . . . . . . . . 436.2 SVM . . . . . . . . . . . . . . . . . . . . . . . . . . . . . . . . 436.3 k-NN . . . . . . . . . . . . . . . . . . . . . . . . . . . . . . . . 43
7

6.4 Decision Tree . . . . . . . . . . . . . . . . . . . . . . . . . . . 446.5 Linear Discriminant Analysis . . . . . . . . . . . . . . . . . . 44
7 Conclusion 49
A CaptureEssentials 51
B Gummy Preparation 55
8
List of Figures
1.1 Examples of fingerprints . . . . . . . . . . . . . . . . . . . . . 211.2 AFAS block diagram . . . . . . . . . . . . . . . . . . . . . . . 22
5.1 Decision tree . . . . . . . . . . . . . . . . . . . . . . . . . . . . 405.2 Decision tree error rate graph . . . . . . . . . . . . . . . . . . 41
6.1 CEA algorithms performance . . . . . . . . . . . . . . . . . . 456.2 CEA5—example of bad CEA . . . . . . . . . . . . . . . . . . . 47
A.1 CaptureEssentials—screenshot of a fingerprint acquisition . . . 51
9

List of Tables
5.1 CEA Weak Bayesian classifiers . . . . . . . . . . . . . . . . . . 385.2 Statistical measures of LDA and SVM classifiers in ACL . . . 395.3 Comparison of sensitivity and specificity in k-NN classifier for
various k-NN parameters. . . . . . . . . . . . . . . . . . . . . 40
6.1 Statistical measures of SVM classifier in ACL and Smart ACL 446.2 Comparison of LDA and SVM classifiers in Smart ACL . . . . 466.3 Error rates of CEAs in Smart ACL . . . . . . . . . . . . . . . 46
11

List of Algorithms
1 CEA1 . . . . . . . . . . . . . . . . . . . . . . . . . . . . . . . 272 CEA2 . . . . . . . . . . . . . . . . . . . . . . . . . . . . . . . 273 CEA3 . . . . . . . . . . . . . . . . . . . . . . . . . . . . . . . 274 CEA4A. . . . . . . . . . . . . . . . . . . . . . . . . . . . . . . 285 CEA4B. . . . . . . . . . . . . . . . . . . . . . . . . . . . . . . 286 CEA5. . . . . . . . . . . . . . . . . . . . . . . . . . . . . . . . 287 CEA7AA. . . . . . . . . . . . . . . . . . . . . . . . . . . . . . . 298 CEA7AB. . . . . . . . . . . . . . . . . . . . . . . . . . . . . . . 299 CEA7CA. . . . . . . . . . . . . . . . . . . . . . . . . . . . . . . 2910 CEA7CB. . . . . . . . . . . . . . . . . . . . . . . . . . . . . . . 29
13
Abbreviations and Notations
AFAS — Automatic Fingerprint AuthenticationSystem
AFIS — Automatic Fingerprint IdentificationSystem
ACL — Anti-counterfeit Level
CEA — Characteristics Extraction Algorithm
FAR — False Positive Rate
FRR — False Rejection Rate
Sensitivity — 1 − FRR. Proportion of correctly clas-sified actual positives
Specificity — 1 − FAR. Proportion of correctly clas-sified actual negatives
Positive Predictive Value —Correctly classified actual positives
Positive classified samples
Negative Predictive Value —Correctly classified actual negatives
Negative classified samples
Positive Likelihood —Sensitivity
(1 − Specificity)
Negative Likelihood —(1 − Sensitivity)
Specificity
Prevalence —Actual positives
Total number of samples
Error Rate —Incorrectly classified samples
Total number of samples
14
CER — Crossover Error Rate
Correct Rate — 1 − Error Rate
Inconclusive Rate —Non-classified samples
Total number of samples
Over-fitting — Fitting a statistical model that has toomany parameters. An absurd and falsemodel may fit perfectly if the modelhas enough complexity by comparisonto the amount of data available.
Curse of the Dimensionality — Exponential growth of hypervolume asa function of dimensionality [1]
DOS — Denial of Service
FBI — Federal Bureau of Investigation
EER — Equal Error Rate
BSI — The German Federal Office for Infor-mation Security
RBF — Radial Basis Function
LOOCV — leave-one-out cross-validation
15
Chapter 1
Introduction
Contemporary achievements in scanning and imaging technology gave a boostto the increasing demands for biometric authentication. In today’s world ad-vanced biometric authentication methods gain an exceptional significance.Reliable identity recognition is one of the most challenging and critical tomany security, business, and civilian processes. Perhaps the most fundamen-tal problem with all biometrics is the enormous difficulty of preventing anidentity theft. In the event that an attacker manages to steal your biometricdata, you risk being disenfranchised from that system forever.
1.1 Background
Authentication of a person is verifying his identity. Traditionally commonforms of security authentication are based on what you have (like ID card)and what you know (for example PIN or password). Biometric authenti-cation is a relatively new form. Biometrics refers to automatic recognitionof an individual based on her behavioral and/or physiological characteris-tics, such as a fingerprint, iris and face, and, more recently, palm veins andtyping rhythms. Companies, producing biometric scanners, claim for userfriendliness of biometric identification. Unlike passwords, a fingerprint oriris cannot be lost or forgotten, and the owner does not have to invent astrong biometric. However, if a biometric characteristic is stolen or spoofed,it makes much more inconvenience to its owner. He cannot change his irisor fingerprint as easy as he can change a password. Unlike having severalpasswords for different systems, a biometric characteristic is unique. Oncespoofed, all the systems, protected by that characteristic, are compromised.For more drawbacks of biometric methods see [2].
Fingerprints are the oldest biometric sign of identity. The skin on the
17
inside of a finger is covered with a pattern of ridges and valleys. Everyperson is believed to have unique fingerprints [3]. This makes fingerprintssuitable for verification of the identity of their owner.
There are two types of fingerprint-based biometric systems in terms oftheir utilization: Automatic Fingerprint Authentication System (AFAS, seeFigure 1.2) and Automatic Fingerprint Identification System (AFIS) [4]. InAFAS an input is an identity and a fingerprint image; the output is answerof ‘Yes’ or ‘No’ indicating whether the input image belongs to the personwhose identity is provided. The system compares the input image with theone addressed by the identity in the database. In AFIS the input is just afingerprint and the output is a list of identities of persons that can have thegiven fingerprint and a score for each identity indicating similarity betweenthe two fingerprints (for details see [4]).
Is it secure to use AFAS? Beyond possible network attacks describedand researched in [5], an identity falsification using artificial fingerprints ispossible—spoofing ; as a different kind of system abuse, one can deny hisauthentication claiming that his fingerprint was spoofed, etc. (a comprehen-sive list of possible attacks is presented by Matsumoto at al. in [6]). Manyresearches consider the spoofing problem showing various ways to counter-feit the AFAS with artificial finger (for example [6], [7], [8]). Many fin-gerprint scanners suppliers claim for improbability of spoofing their system(ScienceGL software, The Surround Imager, TST Group). In response, pos-sible solutions to the spoofing problem were proposed from the industry andthe academia fields (for example [9]). Many research papers recommendcombination of what you know and who you are methods, i.e. fingerprintauthentication with another method such as PIN, password, etc.
One of quickly growing trends is using AFAS in conjunction with smart-cards. A smartcard is any pocket-sized or smaller card with embedded inte-grated circuits. The standard perception of a smartcard is a microprocessorcard of credit card dimensions with various tamper-resistant properties. Asmartcard may store an encrypted digital certificate issued from the PublicKey Infrastructure (PKI) along with any other relevant information aboutthe card holder. A smartcard is a declared identity in Figure 1.2, identityinformation stored on a smartcard addresses a previously enrolled fingerprintimage stored in the database.
Applying AFAS in conjunction with smartcards gives the highest securitylevel, combining three known tactics of what you have, what you know, andwho you are. AFAS pursues reliability in verifying person identity. AFASusually requires information about card holder and physical fingerprint asits input. Smartcards, storing an encrypted digital signature issued fromthe PKI along with relevant information about the card holder, augment
18
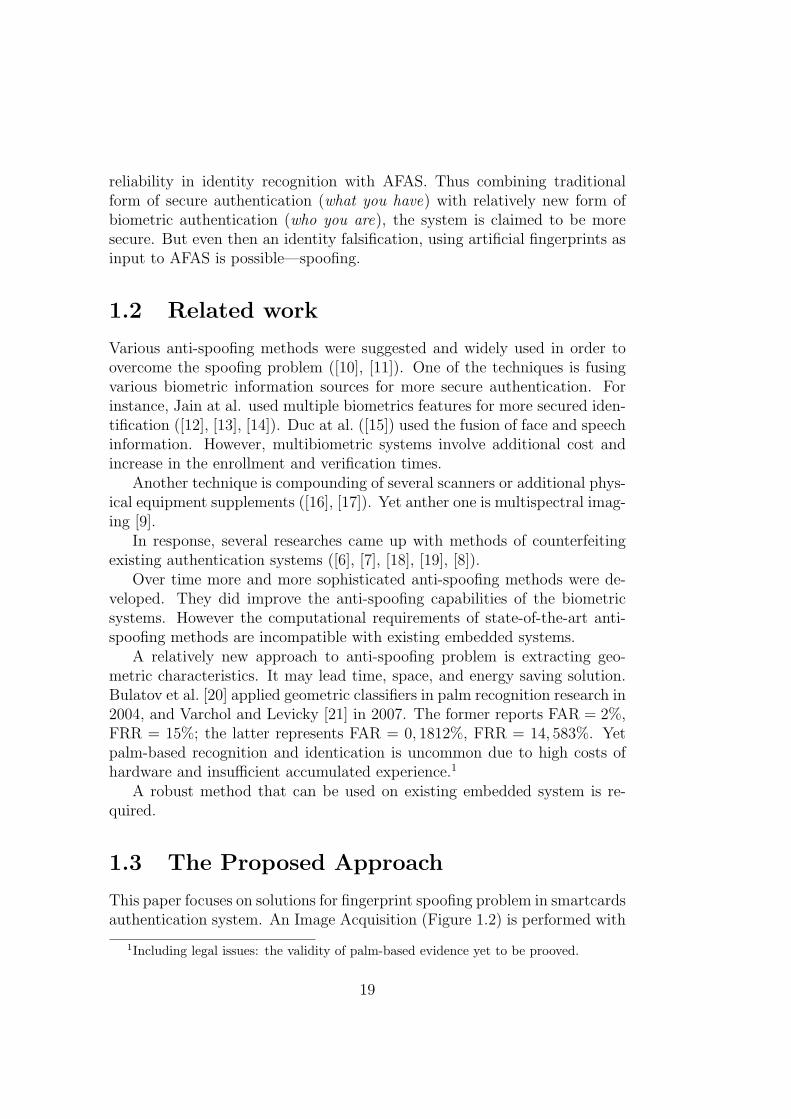
reliability in identity recognition with AFAS. Thus combining traditionalform of secure authentication (what you have) with relatively new form ofbiometric authentication (who you are), the system is claimed to be moresecure. But even then an identity falsification, using artificial fingerprints asinput to AFAS is possible—spoofing.
1.2 Related work
Various anti-spoofing methods were suggested and widely used in order toovercome the spoofing problem ([10], [11]). One of the techniques is fusingvarious biometric information sources for more secure authentication. Forinstance, Jain at al. used multiple biometrics features for more secured iden-tification ([12], [13], [14]). Duc at al. ([15]) used the fusion of face and speechinformation. However, multibiometric systems involve additional cost andincrease in the enrollment and verification times.
Another technique is compounding of several scanners or additional phys-ical equipment supplements ([16], [17]). Yet anther one is multispectral imag-ing [9].
In response, several researches came up with methods of counterfeitingexisting authentication systems ([6], [7], [18], [19], [8]).
Over time more and more sophisticated anti-spoofing methods were de-veloped. They did improve the anti-spoofing capabilities of the biometricsystems. However the computational requirements of state-of-the-art anti-spoofing methods are incompatible with existing embedded systems.
A relatively new approach to anti-spoofing problem is extracting geo-metric characteristics. It may lead time, space, and energy saving solution.Bulatov et al. [20] applied geometric classifiers in palm recognition research in2004, and Varchol and Levicky [21] in 2007. The former reports FAR = 2%,FRR = 15%; the latter represents FAR = 0, 1812%, FRR = 14, 583%. Yetpalm-based recognition and identication is uncommon due to high costs ofhardware and insufficient accumulated experience.1
A robust method that can be used on existing embedded system is re-quired.
1.3 The Proposed Approach
This paper focuses on solutions for fingerprint spoofing problem in smartcardsauthentication system. An Image Acquisition (Figure 1.2) is performed with
1Including legal issues: the validity of palm-based evidence yet to be prooved.
19
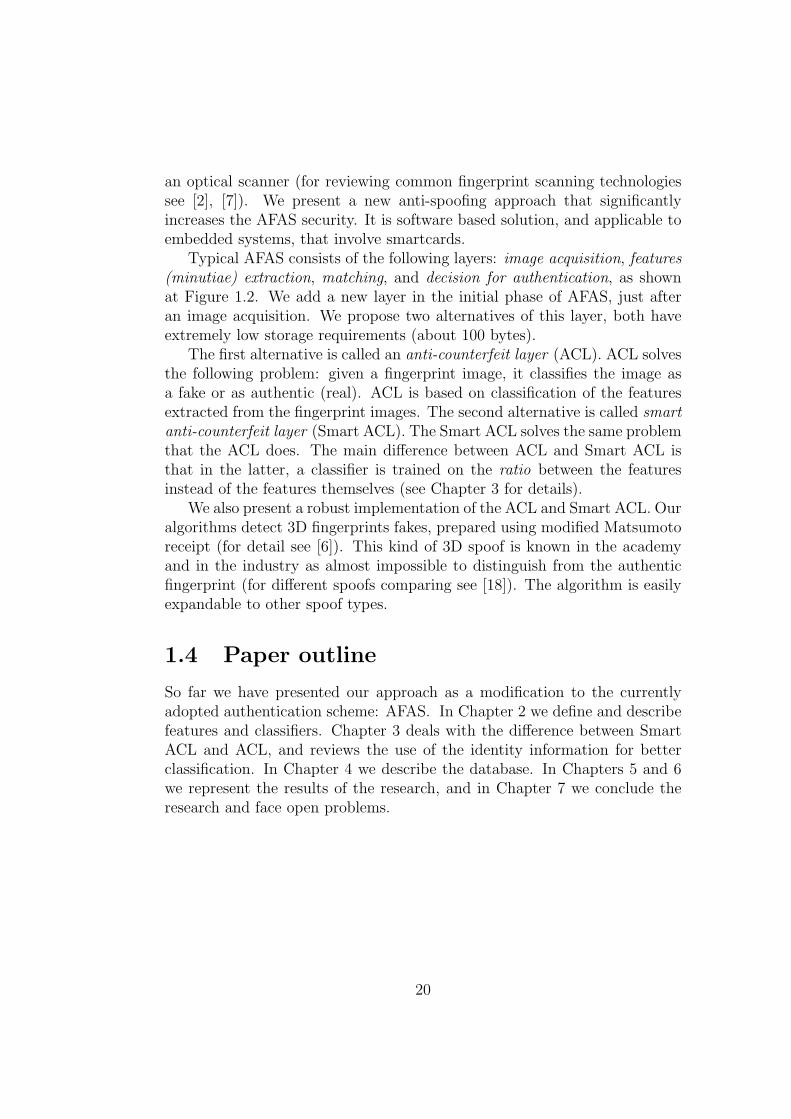
an optical scanner (for reviewing common fingerprint scanning technologiessee [2], [7]). We present a new anti-spoofing approach that significantlyincreases the AFAS security. It is software based solution, and applicable toembedded systems, that involve smartcards.
Typical AFAS consists of the following layers: image acquisition, features(minutiae) extraction, matching, and decision for authentication, as shownat Figure 1.2. We add a new layer in the initial phase of AFAS, just afteran image acquisition. We propose two alternatives of this layer, both haveextremely low storage requirements (about 100 bytes).
The first alternative is called an anti-counterfeit layer (ACL). ACL solvesthe following problem: given a fingerprint image, it classifies the image asa fake or as authentic (real). ACL is based on classification of the featuresextracted from the fingerprint images. The second alternative is called smartanti-counterfeit layer (Smart ACL). The Smart ACL solves the same problemthat the ACL does. The main difference between ACL and Smart ACL isthat in the latter, a classifier is trained on the ratio between the featuresinstead of the features themselves (see Chapter 3 for details).
We also present a robust implementation of the ACL and Smart ACL. Ouralgorithms detect 3D fingerprints fakes, prepared using modified Matsumotoreceipt (for detail see [6]). This kind of 3D spoof is known in the academyand in the industry as almost impossible to distinguish from the authenticfingerprint (for different spoofs comparing see [18]). The algorithm is easilyexpandable to other spoof types.
1.4 Paper outline
So far we have presented our approach as a modification to the currentlyadopted authentication scheme: AFAS. In Chapter 2 we define and describefeatures and classifiers. Chapter 3 deals with the difference between SmartACL and ACL, and reviews the use of the identity information for betterclassification. In Chapter 4 we describe the database. In Chapters 5 and 6we represent the results of the research, and in Chapter 7 we conclude theresearch and face open problems.
20
(a) (b)
(c) (d)
(e) (f)
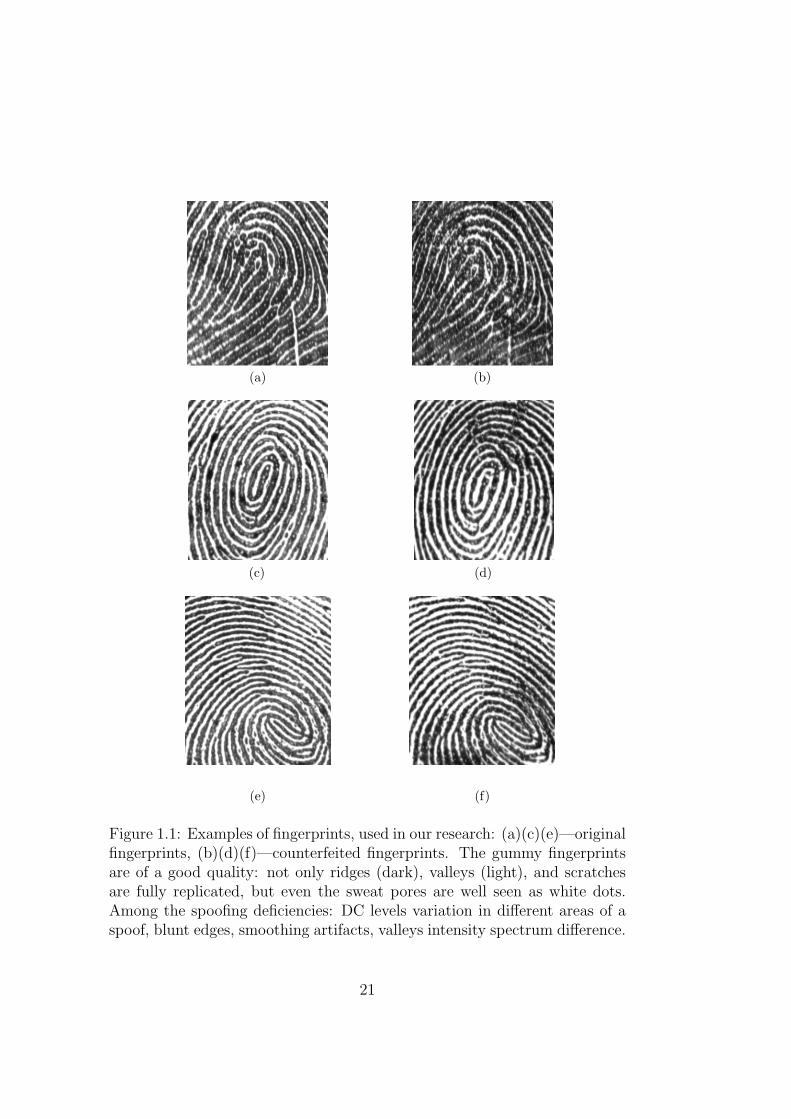
Figure 1.1: Examples of fingerprints, used in our research: (a)(c)(e)—originalfingerprints, (b)(d)(f)—counterfeited fingerprints. The gummy fingerprintsare of a good quality: not only ridges (dark), valleys (light), and scratchesare fully replicated, but even the sweat pores are well seen as white dots.Among the spoofing deficiencies: DC levels variation in different areas of aspoof, blunt edges, smoothing artifacts, valleys intensity spectrum difference.
21
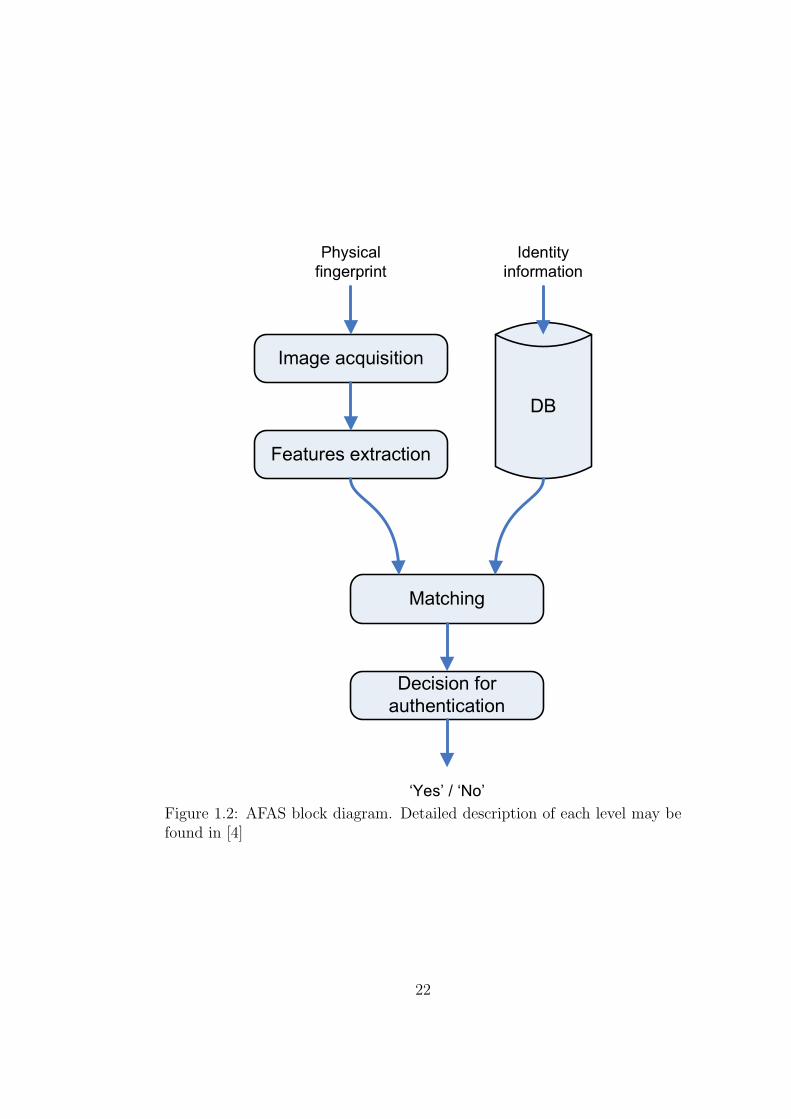
Figure 1.2: AFAS block diagram. Detailed description of each level may befound in [4]
22
Chapter 2
ACL model
2.1 Design
The anti-counterfeit layer (ACL) detects whether a fraudulent fingerprint isgiven as an input, without referencing the fingerprint owner identity. ACL isapplied before feature extraction layer in AFAS, right after image capturinglayer (see Figure 1.2). Detecting a fake fingerprint at such an early stageeliminates the need to access the database, and consequentially prevents aDOS attack.
Compared to AFAS, ACL does not attempt to verify whether an inputfingerprint belongs to the declared identity. Compared to AFIS, ACL doesnot match an input fingerprint against a database of previously enrolledfingerprints. ACL’s unique goal is to distinguish an original fingerprint fromits spoof.
ACL is comprised of two steps:
1. features extraction,
2. classification.
Features are defined as follows.Let I be an image of fingerprint, I ∈ ℑ. Let’s define a characteristics
extraction algorithm (henceforth CEA), or feature, as a function CEA(ℑ) =⇒ℜ. Let’s denote the number of CEAs in the ACL by n.
The calibration of CEAs is a part of the enrollment process1. of fingerprintauthentication. In the enrollment step, human’s fingerprint is preprocessed
1Enrollment process in AFAS is the process of registering subjects with their fingerprinttemplate in the database. Positive and negative enrollments exist. The purpose of thepositive enrollment is construction of a centralized or distributed database with eligiblemembers. The purpose of the negative enrollment is construction of a centralized databaseof members ineligible for some application. For more information see [22]
23
with each of the involved CEAs. Each CEA yields a scalar vi, which isaggregated into the resulting training vector, Vtr = vi|
ni=1. Vtr is used as an
input to the high-level classifier.
During the verification step2 , the fingerprint in question is preprocessedwith the same set of CEAs. A resulting verification vector Vver, |Vver| = n,is classified. The final answer is fake or real.
The above definition of CEA, may be easily extended to a weak Bayesianclassifier, namely CEA(ℑ) =⇒ {fake, real}, by applying a threshold3 on vi.This was our initial implementation of the the classifiers, and it served as abasis for the algorithms comparison.
Comparison criteria for CEAi are FRR and FAR, defined as follows:
FRR = p(S|G) =p(G|S)p(S)
p(G|S)p(S) + p(G|G)p(G), (2.1)
FAR = p(G|S) =p(S|G)p(G)
p(S|G)p(G) + p(S|S)p(S), (2.2)
where
p(S) a priori probabilities of a real fingerprint in the training set4,
p(G) a priori probabilities of a fake fingerprint in the training set,
p(S) a posteriori probabilities of a real fingerprint in the training set,
p(G) a posteriori probabilities of a fake fingerprint in the training set.
The number of CEAs is not limited. Additional CEA, based on new spoofcharacteristics, may be easily appended, thus ensuring the ACL adaptabilityand expandability. Each CEA should answer the layer requirements.
2In the verification step the similarity between the enrolled data and the input datais examined. In general, there are three steps involved in the verification process, thoseare image preprocessing, minutiae extraction, and minutiae matching. ACL comes afterthe image preprocessing step, before minutiae extraction and matching, thus increasingsecurity by preventing DOS attacks.
3The threshold is based on EER measure, which leads to a non robust system. However,CEA serves only as a starting operating point for further classification.
4Strictly speaking, p(S) is an a priory probability of a real fingerprint in the test set.However, this information is not usually available in a causal system, and thus a prioritrain set probabilities are used, as in [23].
24
Main ACL requirements are:
1. low computational cost, which yields fast results,
2. storage effectiveness,
3. low equipment cost—CEA works with a single image from an opticalscanner.
Currently, seven sets of CEAs have been implemented and tested on thedatabase described in Chapter 4. Each CEA exploits a different artificialspoof characteristic, like smoothness of a spoof, variance of DC levels in thedifferent areas of a spoof, valleys and ridges width ratio, pores frequency, andvalleys intensity spectrum.
However, running a single CEAi classifier may not yield satisfactory re-sults for high-security systems. Being computationally and storage effective,CEAi suffers from relatively high FRR and FAR values, which leads to over-all low separability. As a measure to increase the former we denote a highlevel classifier, which effectively combines the CEAi and produces a singleoutput based on the results of CEAs. By CEAs combining, we expect andincrease probability of the correct classification to the fake or real clusters.
We experimented with four classifiers: Support Vector Machine (SVM),k-NN learning (k-NN), Decision Tree learning, and Linear Discriminant Anal-ysis (LDA). All supervised learning techniques, besides the k-NN, may betrained offline, thus the ACL assures the efficiency: the enrollment processremains fast; and a classifier’s update may be done after enrolling any num-ber of new users. Detailed analysis of classifiers error rates can be found inChapter 5.
2.2 CEA Description
Most of the CEAs work on some part of an input image, thus boostingperformance. Partial image is either a patch—2D image part, or a grid—aset of 1D lines extracted from the input image. There are several ways tocreate a grid: random rows and columns, random rows, random columns,random lines. All images were adjusted so that their size and DC level willnot affect the results.
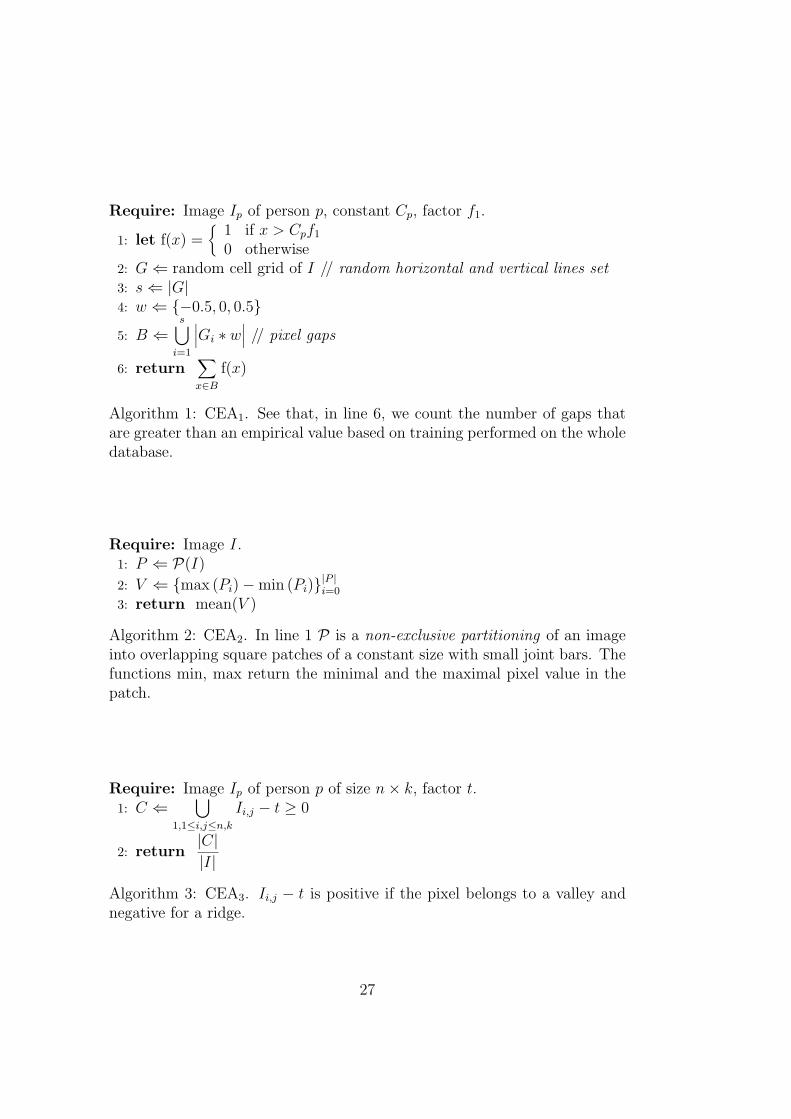
Algorithm 1 shows the CEA1 outline. The algorithm objective is to eval-uate the dissimilarities in the gray-levels of ridges and valleys in a real finger-print compared to those of a spoof. The algorithm randomly chooses vertical
25
and horizontal lines from an image, yielding a grid. Then it sums the num-ber of gradients of the neighbour pixels in each grid line that are above theempirical value based on training on the whole finger images database.
Algorithm 2 shows CEA2. The algorithm partitions an image into over-lapping square patches of a constant size with small joint bars. Then, for eachpatch, the difference between the value of a pixel with maximal gray-level inthe patch and the pixel with minimal one is calculated, yielding vector V .The output is a mean of the vector V .
Algorithm 3 shows CEA3. The algorithm evaluates the ratio between thevalleys and ridges widths in an image. The valleys in the images of originalfingerprints are perceived wider by a human eye. The pixel intensity abovethe threshold t represents a valley, the intensity below the threshold—a ridge.The output is the valleys pixel count ratio.
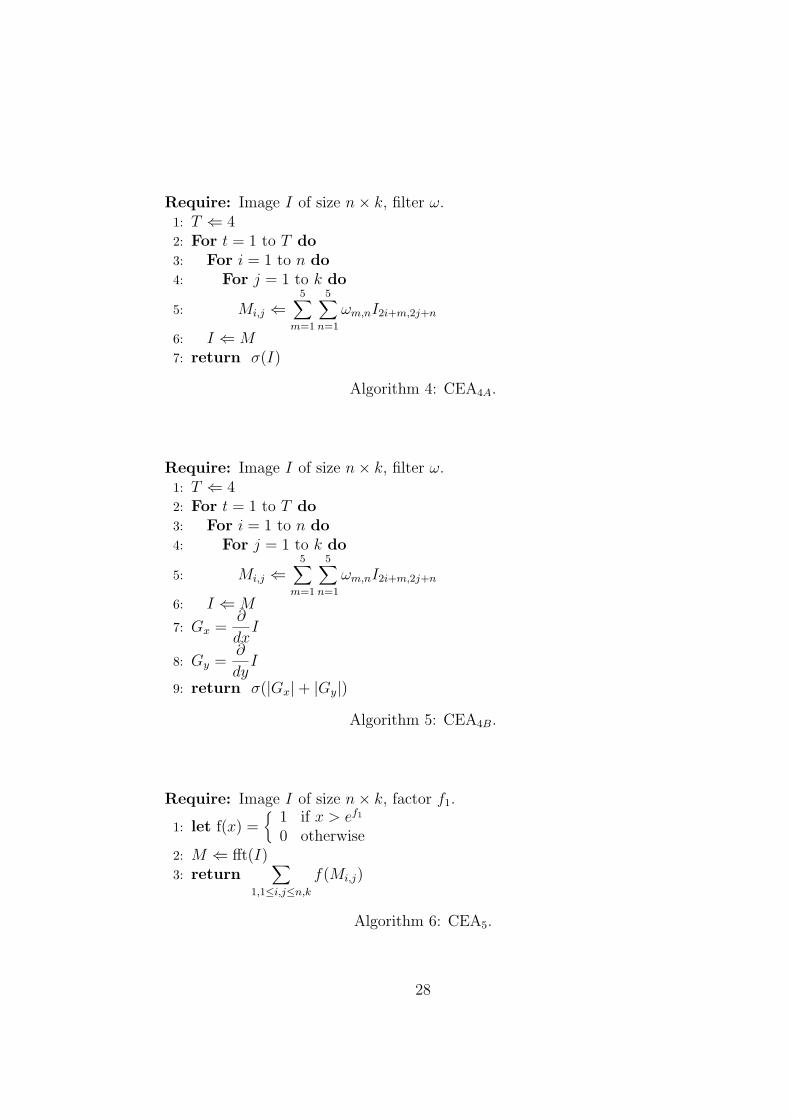
Algorithm 4 and Algorithm 5 show CEA4A and CEA4B. The algorithmsintend to detect bright regions (stains) in a spoof image. They apply reduceoperator of Gaussian pyramids5 up to hierarchy level 4, yielding a smallimage with gray-levels corresponding to lower frequencies. CEA4A outputsa standard deviation of the image. CEA4B calculates a pixels neighborhooddifference matrix and outputs its standard deviation.
Algorithm 6 shows CEA5. The algorithm objective is detection of thevalley width homogeneousness. Valleys of spoofs are less continuous thenvalleys of the real fingerprints: the discontinuities are artifacts originatedin the process of spoof making. The algorithm transforms an image to afrequency space. The frequencies above f1 are high enough to designatesharp transitions.
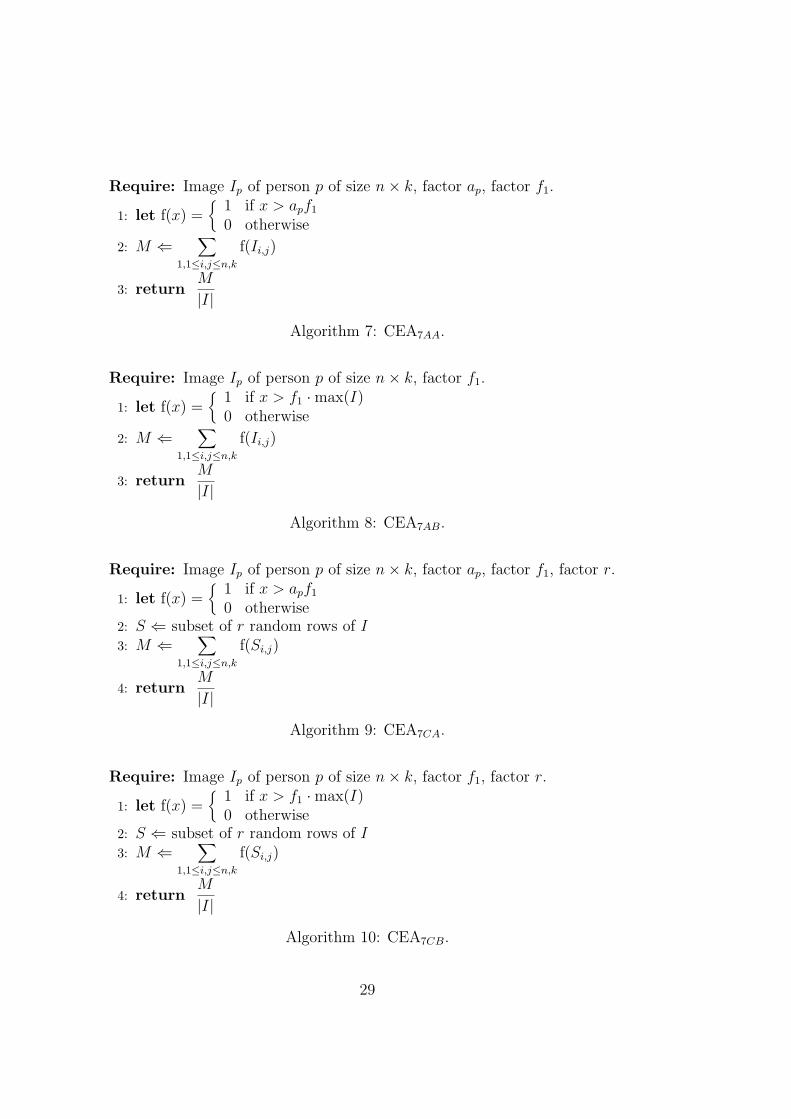
Algorithm 7 and Algorithm 9 show CEA7AA and CEA7CA. The algorithmsfocus on the following observation: gray-level distribution histograms may besliced to several ranges, while with the real fingerprints some slices are moreconcentrated than the others. The reason is the difference in pressure of thereal finger on the scanner platen compared to the artificial finger pressure.The pixels with the gray-level above ap are dominant in the image. ap differsfor each subject in the database.
CEA7AA is applied to the complete image while CEA7CA uses similartechnique but is applied to a rows subset of the image. Table 5.1 and Table 6.3show that performance of these two CEA is similar, while the latter is lesscomputationally intensive. The same is true for CEA7AB ( Algorithm 8) andCEA7CB (Algorithm 10).
5Each iteration of reduce operator takes as its input an image of the size [k, k], applies
a Gaussian filter ω with the parameters n and σ, and reduces it to be of the size
[
k
2,k
2
]
.
Both n and σ are the result of training on the whole finger images database.
26
Require: Image Ip of person p, constant Cp, factor f1.
1: let f(x) ={
1 if x > Cpf1
0 otherwise2: G ⇐ random cell grid of I // random horizontal and vertical lines set3: s ⇐ |G|4: w ⇐ {−0.5, 0, 0.5}
5: B ⇐s
⋃
i=1
∣
∣
∣Gi ∗ w∣
∣
∣ // pixel gaps
6: return∑
x∈B
f(x)
Algorithm 1: CEA1. See that, in line 6, we count the number of gaps thatare greater than an empirical value based on training performed on the wholedatabase.
Require: Image I.1: P ⇐ P(I)
2: V ⇐ {max (Pi) − min (Pi)}|P |i=0
3: return mean(V )
Algorithm 2: CEA2. In line 1 P is a non-exclusive partitioning of an imageinto overlapping square patches of a constant size with small joint bars. Thefunctions min, max return the minimal and the maximal pixel value in thepatch.
Require: Image Ip of person p of size n × k, factor t.1: C ⇐
⋃
1,1≤i,j≤n,k
Ii,j − t ≥ 0
2: return|C|
|I|
Algorithm 3: CEA3. Ii,j − t is positive if the pixel belongs to a valley andnegative for a ridge.
27
Require: Image I of size n × k, filter ω.1: T ⇐ 42: For t = 1 to T do
3: For i = 1 to n do
4: For j = 1 to k do
5: Mi,j ⇐5
∑
m=1
5∑
n=1
ωm,nI2i+m,2j+n
6: I ⇐ M
7: return σ(I)
Algorithm 4: CEA4A.
Require: Image I of size n × k, filter ω.1: T ⇐ 42: For t = 1 to T do
3: For i = 1 to n do
4: For j = 1 to k do
5: Mi,j ⇐5
∑
m=1
5∑
n=1
ωm,nI2i+m,2j+n
6: I ⇐ M
7: Gx =∂
dxI
8: Gy =∂
dyI
9: return σ(|Gx| + |Gy|)
Algorithm 5: CEA4B.
Require: Image I of size n × k, factor f1.
1: let f(x) ={
1 if x > ef1
0 otherwise2: M ⇐ fft(I)3: return
∑
1,1≤i,j≤n,k
f(Mi,j)
Algorithm 6: CEA5.
28
Require: Image Ip of person p of size n × k, factor ap, factor f1.
1: let f(x) ={
1 if x > apf1
0 otherwise
2: M ⇐∑
1,1≤i,j≤n,k
f(Ii,j)
3: returnM
|I|
Algorithm 7: CEA7AA.
Require: Image Ip of person p of size n × k, factor f1.
1: let f(x) ={
1 if x > f1 · max(I)0 otherwise
2: M ⇐∑
1,1≤i,j≤n,k
f(Ii,j)
3: returnM
|I|
Algorithm 8: CEA7AB.
Require: Image Ip of person p of size n × k, factor ap, factor f1, factor r.
1: let f(x) ={
1 if x > apf1
0 otherwise2: S ⇐ subset of r random rows of I
3: M ⇐∑
1,1≤i,j≤n,k
f(Si,j)
4: returnM
|I|
Algorithm 9: CEA7CA.
Require: Image Ip of person p of size n × k, factor f1, factor r.
1: let f(x) ={
1 if x > f1 · max(I)0 otherwise
2: S ⇐ subset of r random rows of I
3: M ⇐∑
1,1≤i,j≤n,k
f(Si,j)
4: returnM
|I|
Algorithm 10: CEA7CB.
29
2.3 Classifiers Description
SVM
A Support Vector Machine (SVM) is a set of supervised learning methods,used for the classification. SVM performs classification by constructing an n-dimensional hyperplane that optimally separates the data into two categories:fake or real. Viewing vectors Vver of the training set6 as two clusters of vectorsin an n-dimensional space, SVM constructs a separating hyperplane in thatspace that maximizes the margin between the two data sets. To calculatethe margin, two parallel hyperplanes are constructed, one on each side of theseparating hyperplane in such a way that maximizes the distance between thedata sets. We use a 10-fold cross validation in order to overcome the possibleover-fitting problem (see Chapter 5). In our case the 10-fold cross-validationlooses only 10% of the data, but is about 80 times more efficient than leave-one-out cross-validation (LOOCV). We conclude that our statistical modeldoes not suffer from the over-fitting problem.
k-NN
The k-nearest neighbors algorithm (k-NN) is a method for classification ob-jects based on closest training examples in the feature space. k-NN is atype of lazy learning where the function is only approximated locally and allthe computation is deferred until the classification. The k-nearest neighborsalgorithm is amongst the simplest of all machine learning algorithms. A fin-gerprint is classified by a majority vote of its neighbors in CEA space, withthe object being assigned to the most common class amongs its k nearestneighbors. We choose k to be an odd number, thus avoiding tied votes. k-NN classifier is usually used as one of the heuristics of feature extraction inpattern analysis. To utilize the k-NN computational efficiency we apply itas a high level classifier and compare the error rates of low computationallyintensive high level classifiers with the high computationally intensive ones.
Classification Tree
Classification trees are used to predict membership of objects in the classesof a categorical dependent variable from their measurements on one or morepredictor variables. Classification tree analysis is one of the main techniquesused in data mining. The goal of our classification trees is to predict responseson a categorical dependent variable {real, fake}. As such, the technique have
6See Section 2.1 for Vver and n definitions
30
much in common with the traditional methods of Discriminant Analysis. InChapter 5 we compare the results of a classification tree with that of lineardiscriminant analysis. The flexibility of classification trees makes them anattractive analysis alternative in cases where theoretical and distributionalassumptions of the traditional methods are not met, and this typically is thecase with fingerprints. But as an exploratory technique, or as a techniqueof last resort when traditional methods fail, classification trees are, in theopinion of many researchers, unsurpassed [24].
Discriminant Analysis
One of the simplest techniques to solve our problem is Linear DiscriminantAnalysis (LDA). The problem is defined as follows: find an hyper-plane inthe hyper-space of Vvers, where projection of the train data is well-separatedinto two clusters [23]. Despite the fact that LDA is mostly used as a rem-edy for curse dimensionality, decreasing the features set for the classificationtechnique, we use it as an independent classification technique. It is simpleand less computationally intensive comparing to SVM and classification tree.We show in Chapter 5 that LDA results in our case are comparable to thoseof SVM, and classification tree.
31
Chapter 3
Smart ACL model
3.1 Design
Compared to ACL, Smart ACL solves a different problem: given a fingerprintimage and the identity of the fingerprint owner, the layer’s output is anindication whether the input image is a spoof. Informally, Smart ACL usesthe previously extracted characteristics with relevant identity information forthe verification purposes.
Smart ACL’s design is similar to the ACL’s. Yet, Smart ACL differs fromthe ACL by using the declared identity of the fingerprint owner. Smart ACLimproves the correctly classified fakes rate by training the classifier on theratio of CEA output for real and fake fingerprints of all enrolled identities.
In the enrollment step, human’s fingerprint is preprocessed with each ofthe involved CEAs. Each CEA yields a scalar vi, which is aggregated intothe resulting vector Vtr = vi|
ni=1. Vtr is saved in database (or on a smartcard).
During the verification step, the fingerprint in question is preprocessedwith the same set of CEAs. Lets denote a result vector Vver, |Vver| = n. Theclassification is performed on the vector
{
Vveri
Vtri
}n
i=1
·
3.2 ACL vs. Smart ACL
ACL defines a single cut-off training vector for all the enrolled persons, whilethe Smart ACL defines one such vector for each enrolled person. Thereforethe resolution of Smart ACL is expected to be higher. Contrary to otheranti-counterfeit applications, in our case we do know person’s identity at theverification step.
33
Chapter 4
Experiment Scope
The database consist of heterogeneous population, including pianists andthose occupied in manual labour, young and elderly people. It includes 784images of 24 people, ages 18 to 85, male and female. 11 people are above 40years old; 14 people are occupied in manual labour.
Each fingerprint was captured by the L SCAN 100 CrossMatch opticalscanner. The scanner dynamic range is 8 bits, 256 gray scales maximum andthe scanning resolution is 500 dpi. The scanner contains an optical scatteringsensor: only the light scattered by the contacting finger ridges is receivedby the camera while all the other light is absorbed by passing through theglass surface. The scanner complies to international AFIS standard—theFBI’s Electronic Fingerprint Transmission Specification 7.1. The GermanFederal Office for Information Security (BSI) has certified this scanner for itsoutstanding image quality. Large scale voter registration programs in Africaused this scanner; 5,000 units were installed in the e-passport enrollmentsystem in Germany. Figure 1.1 shows some examples of scanned fingerprints.
The images of the fingerprints were acquired using a specially writtenapplication, CaptureEssentials. The application is written mainly in VisualC++, using the scanner’s dynamically-linked libraries. The application hasthe capabilities of choosing best acquisition parameters, like contrast, andprovides automatic means of acquisition multiple images from a single person.More details are provided in the Appendix A.
Each spoof was prepared by Matsumoto et al. concept spoof [6]. Fig-ure 1.1 shows the examples of the spoofs we have prepared. Artificial fingershave been created from the casts using gelatin, commonly used for confec-tionery. Matsumoto et al. termed these artificial fingers as gummy. Ap-pendix B provides more details on the modeling technique. All commercialAFAS systems tested in [6] enrolled a gummy fingerprint. FAR of verifica-tion gummy fingerprints in their tests ranged from 68%–100% (for detailed
35

description see [6] and [18]). As widely recognised, the gummy spoofs are themost difficult to detect, thus many researches use them in their tests (Fordetails see [25], [26]).
The other advantages of using Matsumoto et al. gummy spoofs in ourtests are their availability and reduced as well as possession of less amountof artifacts than in other spoofing methods. The process of preparation ofgummy spoofs is simple enough to be performed at home. However it takesover 2 hours to prepare one spoof. Comparing to other spoofs, Matsumotogummies do not suffer from aliasing (especially compared with gummies inthe report [8]).
36
Chapter 5
ACL Results
5.1 Weak Bayesian classifiers
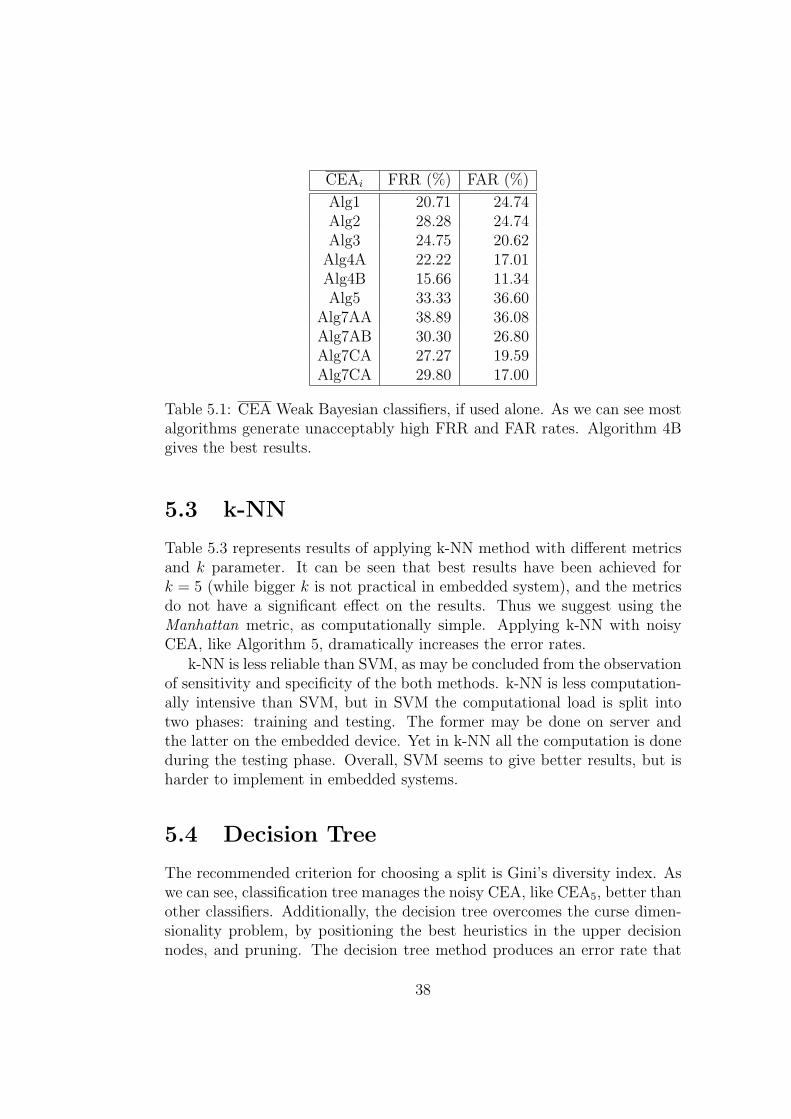
Table 5.1 shows the result of classification of the raw CEAs. The error ratesin the table may be used as a reference for further comparison to the highlevel classification techniques results. We see that the only requirement forCEA is that it can classify with FRR and FAR rates below 30%. CEA5 usedin our experiments as a noisy heuristic, in order to check the stability of thedifferent high level classification methods.
5.2 SVM
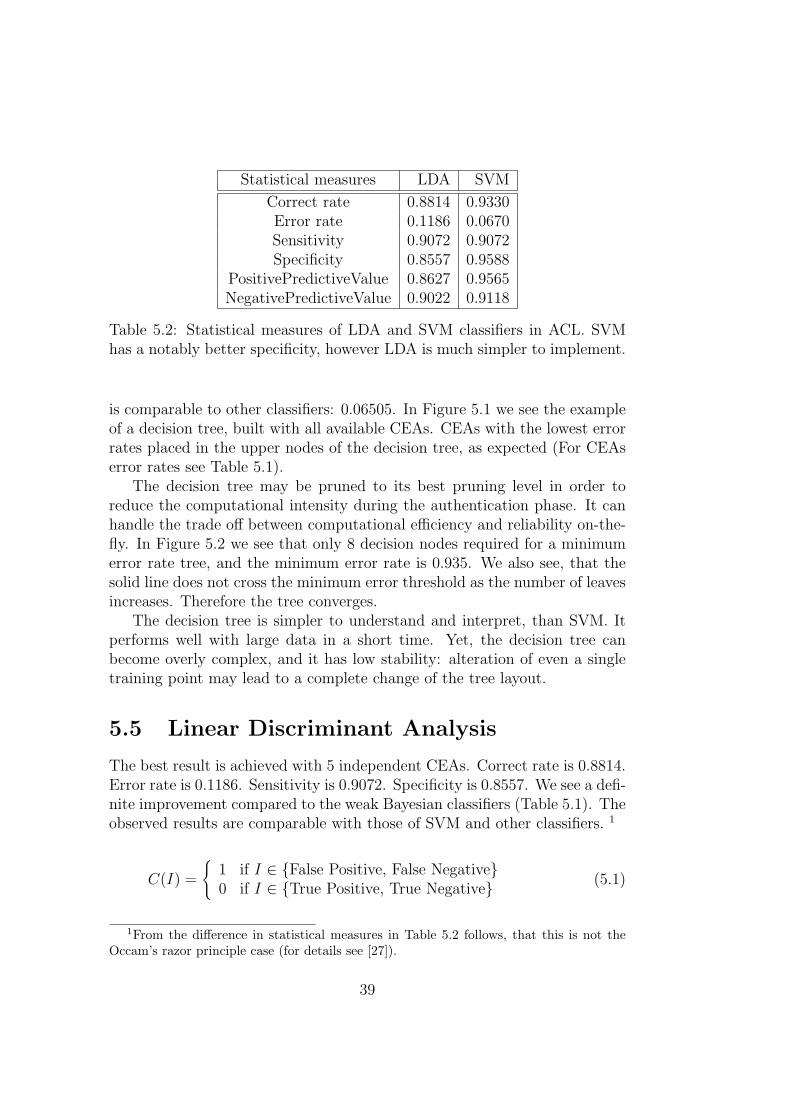
The best result has been achieved with 5 independent CEAs. Correctnessrate is 0.9330. Error rate is 0.0670. Sensitivity is 0.9072. Specificity is 0.9588.We see a definite improvement compared to a weak Bayesian classifiers.
We have tried several different kernels: linear, quadratic, polynomial withdifferent degrees. The recommended kernel function is the Radial Basis Func-tion (RBF) with σ = 1. The only method used to find a separating planewas the Least Squares method.
It should be noted that we put a special emphasis on the higher speci-ficity, as this is a basic requirement for the secured anti spoofing algorithms.Relatively low sensitivity may lead to rejects of authentic fingerprints, butusually this acceptable in high security applications.
37
CEAi FRR (%) FAR (%)
Alg1 20.71 24.74Alg2 28.28 24.74Alg3 24.75 20.62
Alg4A 22.22 17.01Alg4B 15.66 11.34Alg5 33.33 36.60
Alg7AA 38.89 36.08Alg7AB 30.30 26.80Alg7CA 27.27 19.59Alg7CA 29.80 17.00
Table 5.1: CEA Weak Bayesian classifiers, if used alone. As we can see mostalgorithms generate unacceptably high FRR and FAR rates. Algorithm 4Bgives the best results.
5.3 k-NN
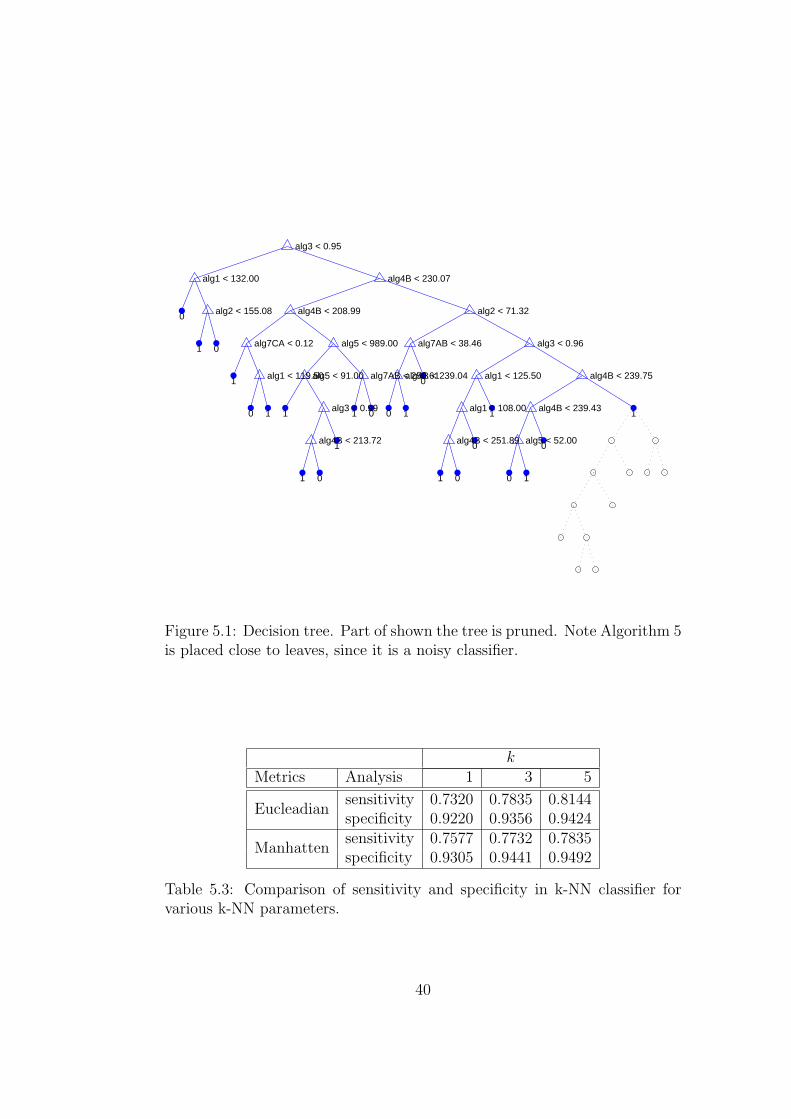
Table 5.3 represents results of applying k-NN method with different metricsand k parameter. It can be seen that best results have been achieved fork = 5 (while bigger k is not practical in embedded system), and the metricsdo not have a significant effect on the results. Thus we suggest using theManhattan metric, as computationally simple. Applying k-NN with noisyCEA, like Algorithm 5, dramatically increases the error rates.
k-NN is less reliable than SVM, as may be concluded from the observationof sensitivity and specificity of the both methods. k-NN is less computation-ally intensive than SVM, but in SVM the computational load is split intotwo phases: training and testing. The former may be done on server andthe latter on the embedded device. Yet in k-NN all the computation is doneduring the testing phase. Overall, SVM seems to give better results, but isharder to implement in embedded systems.
5.4 Decision Tree
The recommended criterion for choosing a split is Gini’s diversity index. Aswe can see, classification tree manages the noisy CEA, like CEA5, better thanother classifiers. Additionally, the decision tree overcomes the curse dimen-sionality problem, by positioning the best heuristics in the upper decisionnodes, and pruning. The decision tree method produces an error rate that
38
Statistical measures LDA SVM
Correct rate 0.8814 0.9330Error rate 0.1186 0.0670Sensitivity 0.9072 0.9072Specificity 0.8557 0.9588
PositivePredictiveValue 0.8627 0.9565NegativePredictiveValue 0.9022 0.9118
Table 5.2: Statistical measures of LDA and SVM classifiers in ACL. SVMhas a notably better specificity, however LDA is much simpler to implement.
is comparable to other classifiers: 0.06505. In Figure 5.1 we see the exampleof a decision tree, built with all available CEAs. CEAs with the lowest errorrates placed in the upper nodes of the decision tree, as expected (For CEAserror rates see Table 5.1).
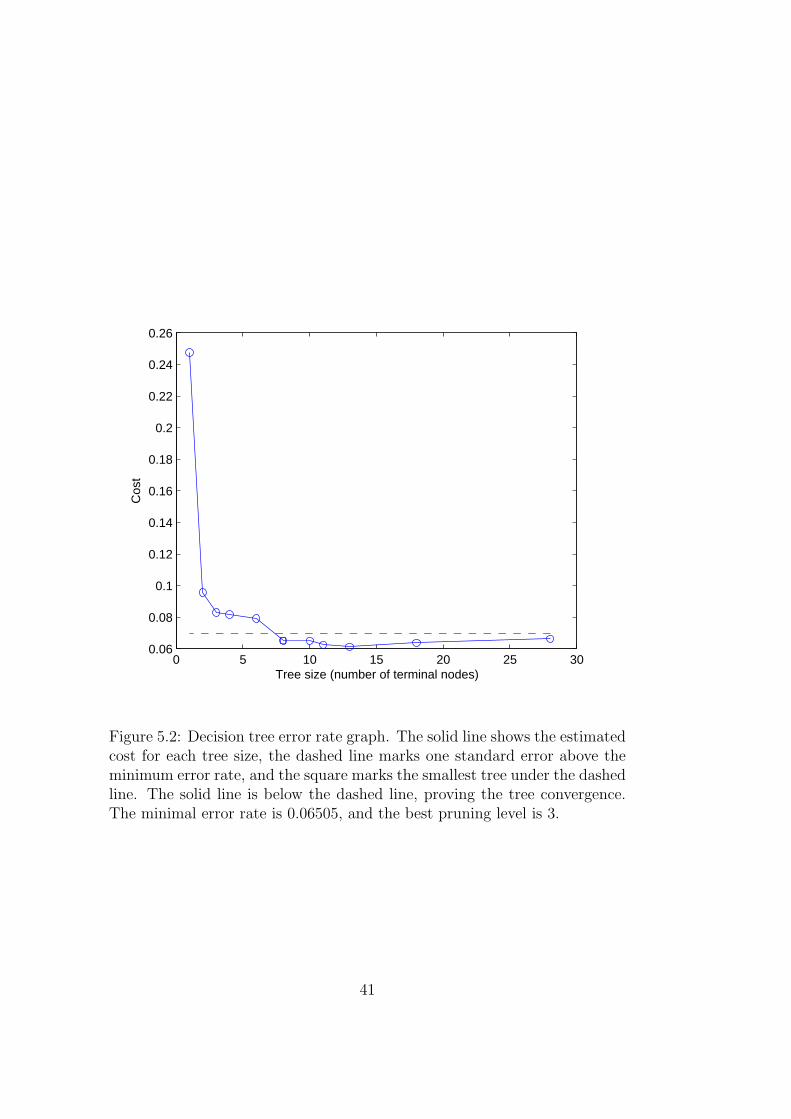
The decision tree may be pruned to its best pruning level in order toreduce the computational intensity during the authentication phase. It canhandle the trade off between computational efficiency and reliability on-the-fly. In Figure 5.2 we see that only 8 decision nodes required for a minimumerror rate tree, and the minimum error rate is 0.935. We also see, that thesolid line does not cross the minimum error threshold as the number of leavesincreases. Therefore the tree converges.
The decision tree is simpler to understand and interpret, than SVM. Itperforms well with large data in a short time. Yet, the decision tree canbecome overly complex, and it has low stability: alteration of even a singletraining point may lead to a complete change of the tree layout.
5.5 Linear Discriminant Analysis
The best result is achieved with 5 independent CEAs. Correct rate is 0.8814.Error rate is 0.1186. Sensitivity is 0.9072. Specificity is 0.8557. We see a defi-nite improvement compared to the weak Bayesian classifiers (Table 5.1). Theobserved results are comparable with those of SVM and other classifiers. 1
C(I) =
{
1 if I ∈ {False Positive, False Negative}0 if I ∈ {True Positive, True Negative}
(5.1)
1From the difference in statistical measures in Table 5.2 follows, that this is not theOccam’s razor principle case (for details see [27]).
39
0
1 0
1 0
0 1 1 1 0 0 1 1 1
1 0 0
1 0 1 0 0 1
alg3 < 0.95
alg1 < 132.00 alg4B < 230.07
alg2 < 155.08 alg4B < 208.99 alg2 < 71.32
alg7CA < 0.12 alg5 < 989.00 alg7AB < 38.46 alg3 < 0.96
alg1 < 119.50 alg5 < 91.00 alg7AB < 250.61 alg4B < 239.04 alg1 < 125.50 alg4B < 239.75
alg3 < 0.99 alg1 < 108.00 alg4B < 239.43
alg4B < 213.72 alg4B < 251.89 alg5 < 52.00
Figure 5.1: Decision tree. Part of shown the tree is pruned. Note Algorithm 5is placed close to leaves, since it is a noisy classifier.
k
Metrics Analysis 1 3 5
Eucleadiansensitivity 0.7320 0.7835 0.8144specificity 0.9220 0.9356 0.9424
Manhattensensitivity 0.7577 0.7732 0.7835specificity 0.9305 0.9441 0.9492
Table 5.3: Comparison of sensitivity and specificity in k-NN classifier forvarious k-NN parameters.
40
0 5 10 15 20 25 300.06
0.08
0.1
0.12
0.14
0.16
0.18
0.2
0.22
0.24
0.26
Tree size (number of terminal nodes)
Cos
t
Figure 5.2: Decision tree error rate graph. The solid line shows the estimatedcost for each tree size, the dashed line marks one standard error above theminimum error rate, and the square marks the smallest tree under the dashedline. The solid line is below the dashed line, proving the tree convergence.The minimal error rate is 0.06505, and the best pruning level is 3.
41

Chapter 6
Smart ACL Results
6.1 Weak Bayesian classifiers
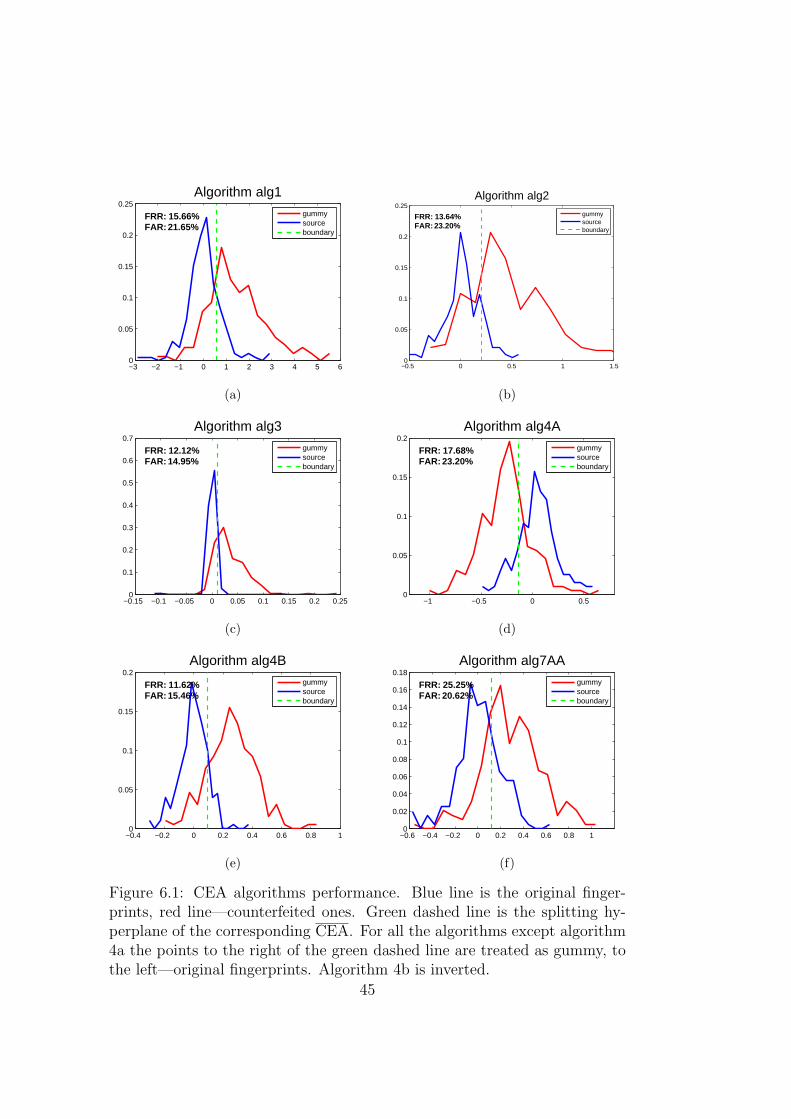
Figure 6.1 and Figure 6.2 show CEAs—weak Bayesian classifiers. Noteworthyto remind, that CEAs used solely as heuristics for higher level classification.The plots show the distribution functions of human fingerprints (blue line)and fake fingerprints (red line). The green line is the classification thresholdof the weak Bayesian classifiers.
Table 6.3 shows CEAs error rates. Comparing results in Table 6.3 andresults shown in Table 5.1 reveals that Smart ACL weak Bayesian classifiersare better than ACL weak Bayesian classifiers.
6.2 SVM
The best result is achieved with 5 independent CEAs. Correctness rate is0.9439. The recommended kernel function is a quadratic or RBF with σ = 1.We see a definite improvement compared to the Smart ACL weak Bayesianclassifiers (Tables 6.1 and 6.3). Table 6.1 shows an improvement in sensitivityand specificity measures compared to those of SVM-based ACL. Remember-ing that (FAR = 1− Specificity), for Smart ACL with SVM classifier we getFAR = 0.0101, and for ACL we achieve FAR = 0.0412. Hence, Smart ACLreduces the FAR by factor 4.
6.3 k-NN
As we saw in Section 5.3, best results for k-NN-based ACL are FRR = 0.1856and FAR = 0.0576 using Eucleadean metrics and k = 5. With Smart ACL
43
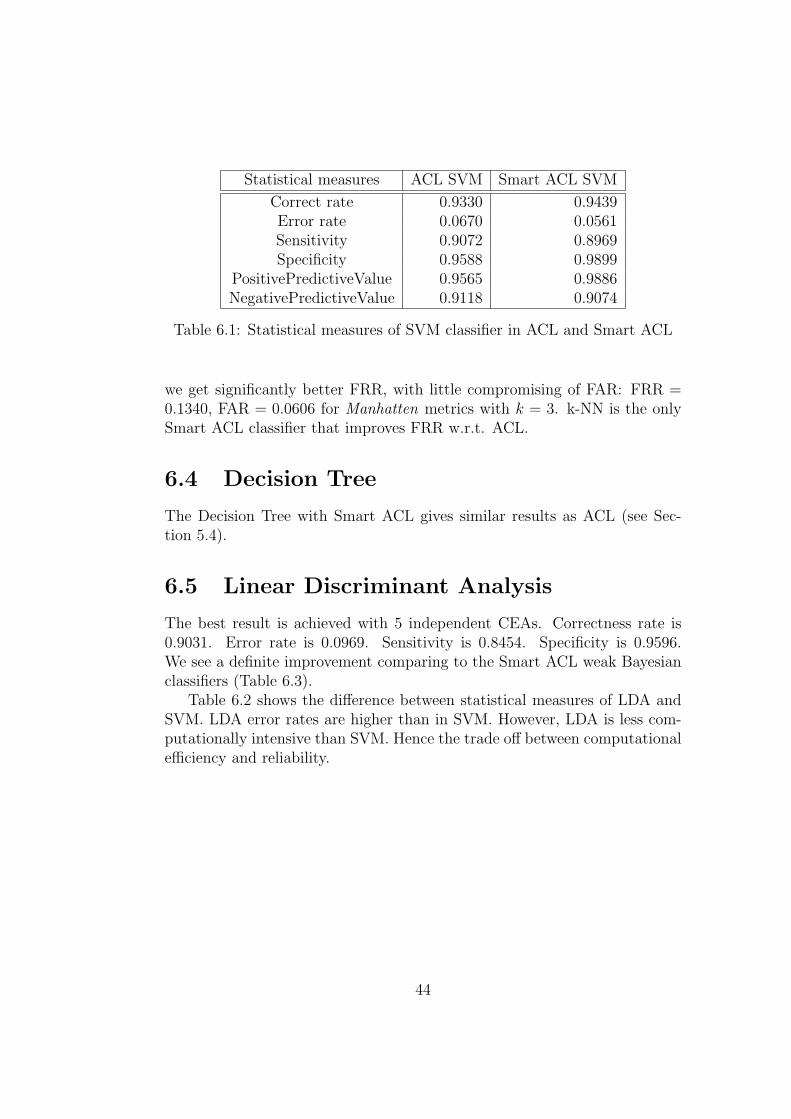
Statistical measures ACL SVM Smart ACL SVM
Correct rate 0.9330 0.9439Error rate 0.0670 0.0561Sensitivity 0.9072 0.8969Specificity 0.9588 0.9899
PositivePredictiveValue 0.9565 0.9886NegativePredictiveValue 0.9118 0.9074
Table 6.1: Statistical measures of SVM classifier in ACL and Smart ACL
we get significantly better FRR, with little compromising of FAR: FRR =0.1340, FAR = 0.0606 for Manhatten metrics with k = 3. k-NN is the onlySmart ACL classifier that improves FRR w.r.t. ACL.
6.4 Decision Tree
The Decision Tree with Smart ACL gives similar results as ACL (see Sec-tion 5.4).
6.5 Linear Discriminant Analysis
The best result is achieved with 5 independent CEAs. Correctness rate is0.9031. Error rate is 0.0969. Sensitivity is 0.8454. Specificity is 0.9596.We see a definite improvement comparing to the Smart ACL weak Bayesianclassifiers (Table 6.3).
Table 6.2 shows the difference between statistical measures of LDA andSVM. LDA error rates are higher than in SVM. However, LDA is less com-putationally intensive than SVM. Hence the trade off between computationalefficiency and reliability.
44
−3 −2 −1 0 1 2 3 4 5 60
0.05
0.1
0.15
0.2
0.25Algorithm alg1
FRR: 15.66%FAR: 21.65%
gummysourceboundary
(a)
−0.5 0 0.5 1 1.50
0.05
0.1
0.15
0.2
0.25Algorithm alg2
FRR: 13.64%FAR: 23.20%
gummysourceboundary
(b)
−0.15 −0.1 −0.05 0 0.05 0.1 0.15 0.2 0.250
0.1
0.2
0.3
0.4
0.5
0.6
0.7Algorithm alg3
FRR: 12.12%FAR: 14.95%
gummysourceboundary
(c)
−1 −0.5 0 0.50
0.05
0.1
0.15
0.2Algorithm alg4A
FRR: 17.68%FAR: 23.20%
gummysourceboundary
(d)
−0.4 −0.2 0 0.2 0.4 0.6 0.8 10
0.05
0.1
0.15
0.2Algorithm alg4B
FRR: 11.62%FAR: 15.46%
gummysourceboundary
(e)
−0.6 −0.4 −0.2 0 0.2 0.4 0.6 0.8 10
0.02
0.04
0.06
0.08
0.1
0.12
0.14
0.16
0.18Algorithm alg7AA
FRR: 25.25%FAR: 20.62%
gummysourceboundary
(f)
Figure 6.1: CEA algorithms performance. Blue line is the original finger-prints, red line—counterfeited ones. Green dashed line is the splitting hy-perplane of the corresponding CEA. For all the algorithms except algorithm4a the points to the right of the green dashed line are treated as gummy, tothe left—original fingerprints. Algorithm 4b is inverted.
45
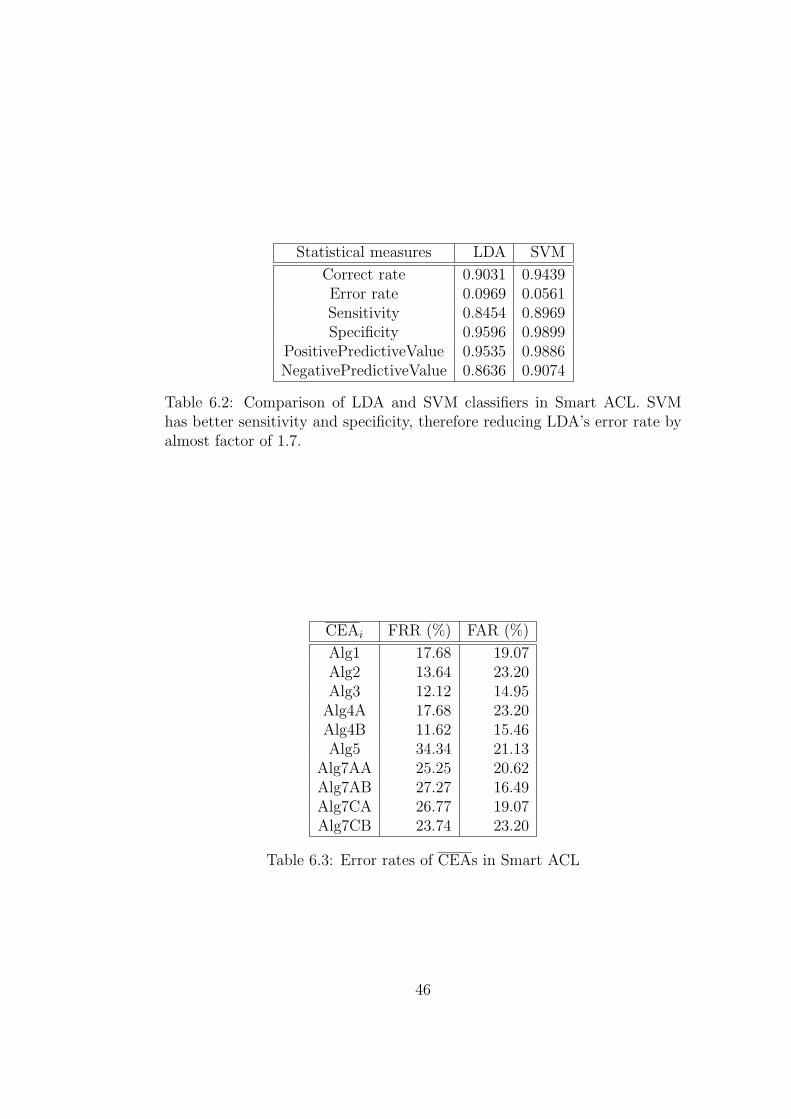
Statistical measures LDA SVM
Correct rate 0.9031 0.9439Error rate 0.0969 0.0561Sensitivity 0.8454 0.8969Specificity 0.9596 0.9899
PositivePredictiveValue 0.9535 0.9886NegativePredictiveValue 0.8636 0.9074
Table 6.2: Comparison of LDA and SVM classifiers in Smart ACL. SVMhas better sensitivity and specificity, therefore reducing LDA’s error rate byalmost factor of 1.7.
CEAi FRR (%) FAR (%)
Alg1 17.68 19.07Alg2 13.64 23.20Alg3 12.12 14.95
Alg4A 17.68 23.20Alg4B 11.62 15.46Alg5 34.34 21.13
Alg7AA 25.25 20.62Alg7AB 27.27 16.49Alg7CA 26.77 19.07Alg7CB 23.74 23.20
Table 6.3: Error rates of CEAs in Smart ACL
46
−1 −0.5 0 0.5 1 1.5 20
0.05
0.1
0.15
0.2
0.25
0.3
0.35Algorithm alg5
FRR: 34.34%FAR: 21.13%
gummysourceboundary
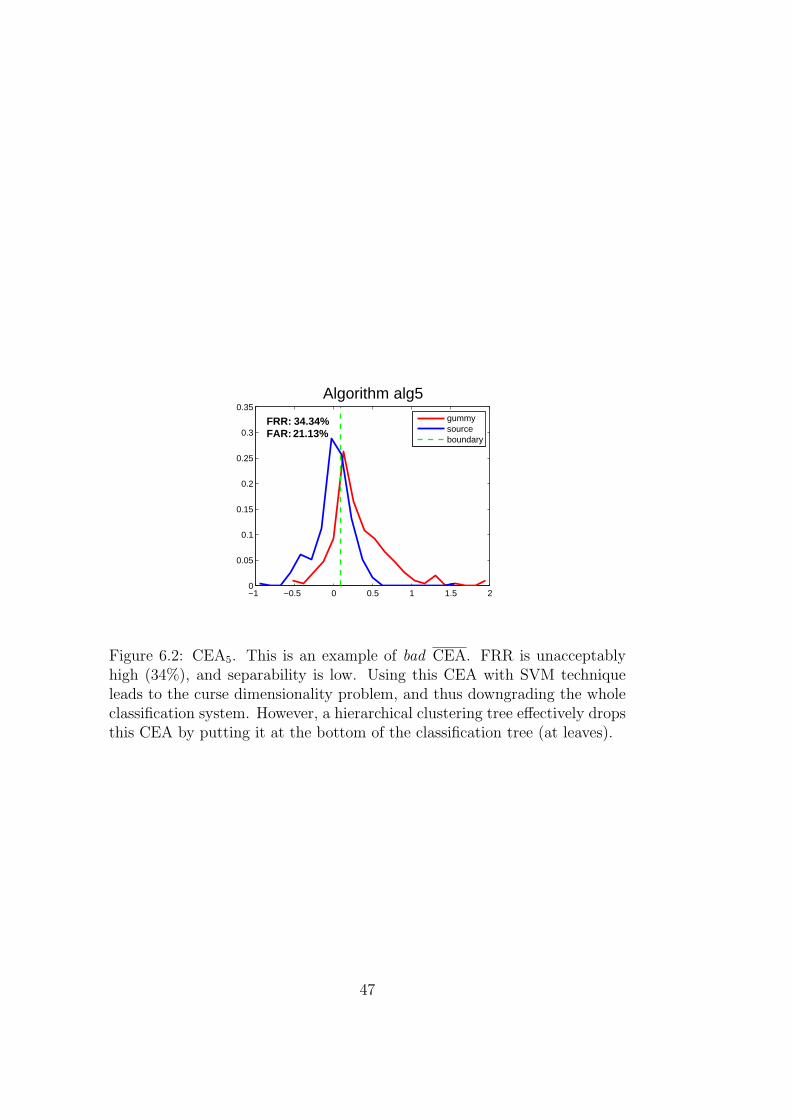
Figure 6.2: CEA5. This is an example of bad CEA. FRR is unacceptablyhigh (34%), and separability is low. Using this CEA with SVM techniqueleads to the curse dimensionality problem, and thus downgrading the wholeclassification system. However, a hierarchical clustering tree effectively dropsthis CEA by putting it at the bottom of the classification tree (at leaves).
47
Chapter 7
Conclusion
In this paper a new, anti-counterfeiting layer in AFAS is defined. We presenttwo different implementations of the layer, ACL and Smart ACL. Both solu-tions bear the following advantages:
Expandability—new features may be easily added;
Extensibility—other spoofing methods may be detected;
Embeddability—algorithms are mostly time- and space-efficient, and thussuitable for embedded applications;
Reliability—most classifiers yield high specificity.
Simulation and results were presented for a database of real and counterfeitedfingerprints. Comparative analysis between the different techniques revealsthe following findings:
• Increased number of features leads to curse of dimensionality. If newfeatures are added to the system we recommend to apply LDA beforethe main classifier in order to reduce the dimensionality.
• There are various classifiers with different detection capabilities, thatmay be chosen for each specific application.
• Most classifiers enable fine-tuning with the trade-off between sensitiv-ity and specificity, although high specificity with reasonable sensitivityseems to be the most suitable fingerprint identification systems.
• k-NN was used as a classifier, however it may instead be used as afeature (CEA), as it is computationally effective.
49

While we have demonstrated the efficiency of our method, we still plan toimprove it by including additional information that reflects the best classifi-cation method for each person, as opposed to the regular averaging approach.Preliminary results we have suggested that the performance of the systemcould indeed be substantially increased.
50
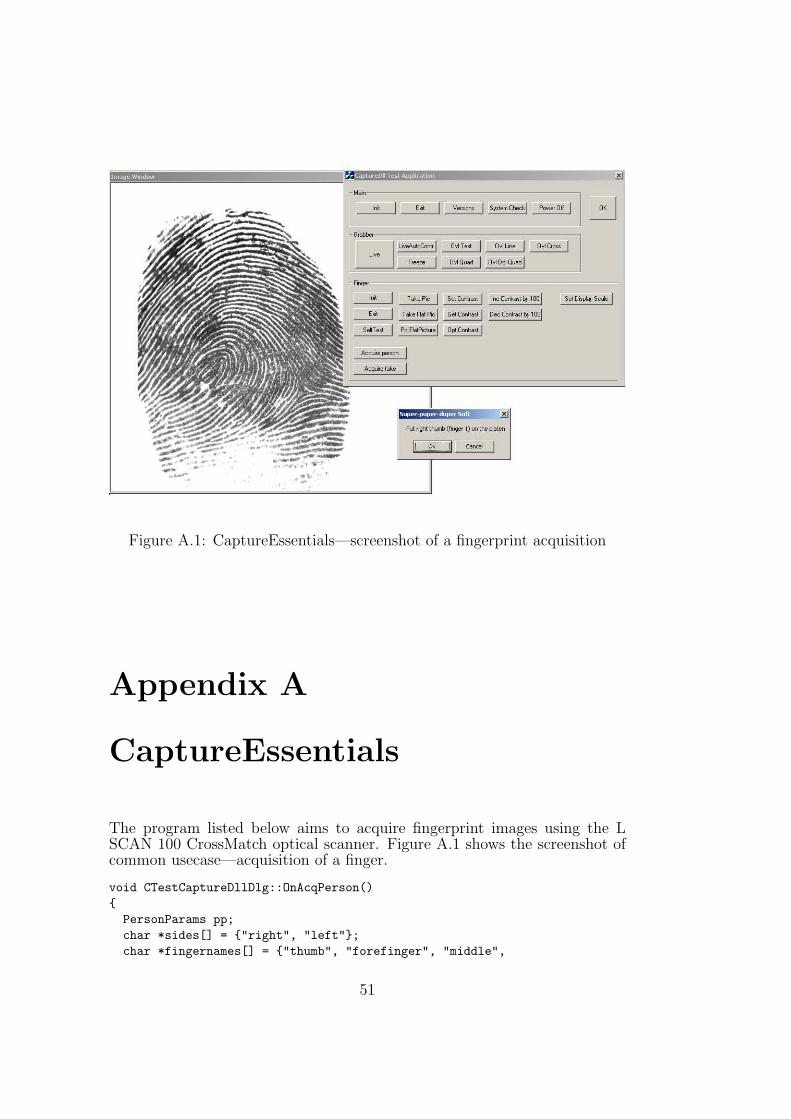
Figure A.1: CaptureEssentials—screenshot of a fingerprint acquisition
Appendix A
CaptureEssentials
The program listed below aims to acquire fingerprint images using the LSCAN 100 CrossMatch optical scanner. Figure A.1 shows the screenshot ofcommon usecase—acquisition of a finger.
void CTestCaptureDllDlg::OnAcqPerson()
{
PersonParams pp;
char *sides[] = {"right", "left"};
char *fingernames[] = {"thumb", "forefinger", "middle",
51
"ring", "minimus"};
if (pp.DoModal() == IDOK) // The user selected OK button, not cancel
{
for (int side = 0; side < 2; side++) {
for (int finger = 0; finger < 5; finger++) {
int res = GetOneFinger(fingernames[finger], finger+1,sides[side],
pp.m_from, pp.m_step, pp.m_to, (const char*)pp.m_dir,
(const char*)pp.m_name);
if (res != 0)
goto stop;
}
}
}
stop:
;
}
int CTestCaptureDllDlg::GetOneFinger(char *fingername, int finger_num,
char *side, int from, int step, int to,
const char *dir, const char *name, int trial) {
char buf[1000] = "";
char trial_buf[1000] = "";
char filename[1000];
char dir_tocreate[1000] = "";
char trial_filename_buf[1000] = "";
if (trial != -1) {
sprintf(trial_filename_buf, "_%02d", trial);
sprintf(trial_buf, " - trial %d", trial);
}
sprintf(buf, "Put %s %s (finger %d) on the platen%s",
side, fingername, finger_num, trial_buf);
sprintf(dir_tocreate, "%s\\%s", dir, name);
CreateDirectory(dir_tocreate, NULL);
if (MessageBox(buf,"Super-puper-duper Soft", MB_OKCANCEL) == IDOK) {
for (int contr = from; contr <= to; contr += step) {
ILM_FINGER_setContrast(contr);
sprintf(buf, "Don’t move finger! Contrast=%d", contr);
GrabberOvltext(1, 0, buf, 20, false, true);
sprintf(filename, "%s\\%s_%c_%d_%04d%s.bmp", dir_tocreate, name,
toupper(side[0]), toupper(finger_num), contr,
trial_filename_buf);
FingerTakeFlatpic(filename, true);
ILM_GRABBER_live( m_ImgWnd.m_hWnd, DisplayImage( true ));
}
sprintf(buf, "Don’t move finger! Contrast=OPTM");
GrabberOvltext(1, 0, buf, 20, false, true);
ILM_FINGER_optimizeContrast( OPT_CONTRAST );
sprintf(filename, "%s\\%s_%c_%d_%4s%s.bmp", dir_tocreate, name,
toupper(side[0]), finger_num, "OPTM", trial_filename_buf);
52
FingerTakeFlatpic(filename, true);
ILM_GRABBER_live( m_ImgWnd.m_hWnd, DisplayImage( true ));
GrabberOvltext(400, 1, buf, 20, false, false);
}
else
return -1;
return 0;
}
void CTestCaptureDllDlg::OnAcqFake()
{
FakeParams fp;
char *sides[] = {"right", "left"};
char *fingernames[] = {"thumb", "forefinger", "middle",
"ring", "minimus"};
if (fp.DoModal() == IDOK) // The user selected OK button, not cancel
{
for (int trial = 0; trial < fp.m_numoftrials; trial++) {
int side = fp.m_hand;
int finger = fp.m_finger;
int res = GetOneFinger(fingernames[finger], finger+1,
sides[side], fp.m_from, fp.m_step, fp.m_to,
(const char*)fp.m_dir, (const char*)fp.m_name,
trial);
if (res != 0)
goto stop;
}
}
stop:
;
}
53

Appendix B
Gummy Preparation
As were mentioned in Chapter 4 we use the Matsumoto at al. concept spoof preparing [6].We adjusted the materials for molds and artificial fingers so that the materials can beaccessed in Israel. The material used for molds is a ”Morph-plast”1; the material used forartificial fingers is gelatine powder made from fish bones2. The main difficulty in artificialfingers preparing is bubbling of the gelatine. Matsumoto at al. recommend repeatedlyheating and cooling the gelatine by the microwave oven. We observed that microwaveheating increases the bubbles in the fish-bones gelatine. The solution is repeatedly heatingand cooling of the gelatine with bain-marie on the gas stove. The other difficulty is findingthe proper temperature for the warming gelatine. The gelatine has to be a liquid, but nottoo warm as for melting the plastic mold.
1may be ordered at eBay for £22may be bought in most grocery stores in Israel
55
Bibliography
[1] R. Bellman. Adaptive Control Processes: A Guided Tour. Princeton University Press,1961.
[2] M. Kakona. Drawbacks of biometric methods. Technical report, ICZ, 2001. Availableonline at http://home.i.cz/kakl/biometrics/DrawbacksofBiometricMethods.
htm.
[3] H.C. Lee and R.E. Gaensslen. Advances in Fingerprint Technology. Elsevier, NewYork, 1991.
[4] S. B. Lee and S. Tsutsui. Intelligent biometric techniques in fingerprint and facerecognition. CRC Press, Inc., Boca Raton, FL, USA, 1999.
[5] S. Jain. Digital watermarking techniques: A case study in fingerprints and faces. InProceedings of Indian conference on computer vision, graphics, and image processing,pages 139–144, 2000.
[6] T. Matsumoto, H. Matsumoto, K. Yamada, and S. Hoshino. Impact of artificialgummy fingers on fingerprint systems. In Proceedings of SPIE: Optical Security andCounterfeit Deterrence Techniques IV, 2002, volume 4677, pub-SPIE:adr, 2002. pub-SPIE.
[7] Ton van der Putte and Jeroen Keuning. Biometrical fingerprint recognition: don’t getyour fingers burned. In Proceedings of the fourth working conference on smart cardresearch and advanced applications on Smart card research and advanced applications,pages 289–303, Norwell, MA, USA, 2001. Kluwer Academic Publishers.
[8] starbug. How to fake fingerprints? Technical report, Chaos Computer Club e.V,October 2004. Available online at http://www.ccc.de/biometrie/fingerabdruck_kopieren.xml?language=en.
[9] K. A. Nixon, R. K. Rowe, M. S. Ennis, and S. P. Corcoran. Spoof detection usingmultispectral fingerprint imaging without enrollment. In Proceedings of BiometricsSymposium (BSYM2005), 2005.
[10] David Zhang and Anil K. Jain, editors. Biometric Authentication, First InternationalConference, ICBA 2004, Hong Kong, China, July 15-17, 2004, Proceedings, volume3072 of Lecture Notes in Computer Science. Springer, 2004.
[11] David Zhang and Anil K. Jain, editors. Advances in Biometrics, International Con-ference, ICB 2006, Hong Kong, China, January 5-7, 2006, Proceedings, volume 3832of Lecture Notes in Computer Science. Springer, 2006.
57
[12] Arun Ross, Anil K. Jain, and Jian Z. Qian. Information fusion in biometrics. LectureNotes in Computer Science (A longer version appears in Pattern Recognition Letters,Vol. 24, Issue 13, pp. 2115-2125, September, 2003., 2091:354–359, 2001.
[13] Lin Hong and Anil Jain. Integrating faces and fingerprints for personal identification.IEEE transactions on pattern analysis and machine intelligence, 20:1295–1307, 1998.
[14] Anil K. Jain, Lin Hong, and Yatin Kulkarni. A multimodal biometric system us-ing fingerprint, face, and speech. Technical Report MSU-CPS-98-32, Department ofComputer Science, Michigan State University, East Lansing, Michigan, November1998. Posted also at AVBPA99.
[15] Benoit Duc, Elizabeth Saers Bigiin, C Josef Bigiin D, Gilbert Maitre, and StefanFischer. Fusion of audio and video information for multi modal person authentication.Pattern Recognition Letters, 18:835–843, 1997.
[16] K. K. Veeramachaneni, L. A. Osadciw, and P. K. Varshney. Adaptive multimodalbiometric fusion algorithm using particle swarm. In B. V. Dasarathy, editor, Societyof Photo-Optical Instrumentation Engineers (SPIE) Conference Series, volume 5099of Society of Photo-Optical Instrumentation Engineers (SPIE) Conference Series,pages 211–221, April 2003.
[17] G. Parziale and E. Diaz-Santana. The surround imagerTM: a multi-camera touchlessdevice to acquire 3d rolled-equivalent fingerprints. In Proceedings of InternationalConference on Biometrics, pages 244–250, 2006.
[18] S.A.C. Schuckers. Spoofing and anti-spoofing measures. Information Security Tech-nical Report, 7(4):56–62, 2002.
[19] L. Thalheim and J. Krissler. Body check: Biometric access protection devices andtheir programs put to the test. In in c’t Magazin fur Computer und Technik, page114, 2002.
[20] Yaroslav Bulatov, Sachin Jambawalikar, Piyush Kumar, and Saurabh Sethia. Proc.1st internat. conf. on biometric authentication (icba). In Zhang and Jain [10], pages753–759.
[21] P. Varchol and D. Levicky. Using of hand geometry in biometric security systems.Radioengineering, 16(4):82–87, 2007.
[22] Ruud M. Bolle, Jonathan H. Connell, Sharath Pankanti, Nalini K. Ratha, and An-drew W. Senior. Guide to Biometrics. SpringerVerlag, 2003.
[23] R. O. Duda and P. E. Hart. Pattern Classification and Scene Analysis. John Willey& Sons, New Yotk, 1973.
[24] Thomas Hill and Pawel Lewicki. Statistics: Methods and Applications : a Compre-hensive Reference for Science, Industry, and Data Mining. StatSoft, Inc., 2006.
[25] Wei-Yun Yau, Hoang-Thanh Tran, Eam Khwang Teoh, and Jian-Gang Wang. Fakefinger detection by finger color change analysis. In Seong-Whan Lee and Stan Z.Li, editors, ICB, volume 4642 of Lecture Notes in Computer Science, pages 888–896.Springer, 2007.
58

[26] O.G. Martinsen, S. Clausen, J.B. Nysaether, and S. Grimnes. Utilizing characteristicelectrical properties of the epidermal skin layers to detect fake fingers in biometricfingerprint systems a pilot study. Biomedical Engineering, IEEE Transactions on,54(5):891–894, 2007.
[27] Imad Y. Hoballah and Pramod K. Varshney. An information theoretic approachto the distributed detection problem. IEEE Transactions on Information Theory,35(5):988–994, 1989.
59
Related Documents