Fingerprint Identification - Feature Extraction, Matching, and Database Search Asker M. Bazen Final version: August 19, 2002

Welcome message from author
This document is posted to help you gain knowledge. Please leave a comment to let me know what you think about it! Share it to your friends and learn new things together.
Transcript

Fingerprint Identification - Feature Extraction,Matching, and Database Search
Asker M. Bazen
Final version: August 19, 2002


Contents
Voorwoord v
1 Introduction 11.1 Definitions . . . . . . . . . . . . . . . . . . . . . . . . . . . . . . . . . . . . 21.2 Applications . . . . . . . . . . . . . . . . . . . . . . . . . . . . . . . . . . . 51.3 Challenges . . . . . . . . . . . . . . . . . . . . . . . . . . . . . . . . . . . . 91.4 Outline . . . . . . . . . . . . . . . . . . . . . . . . . . . . . . . . . . . . . 10
I Feature Extraction 15
2 Directional Field Estimation 172.1 Introduction . . . . . . . . . . . . . . . . . . . . . . . . . . . . . . . . . . . 182.2 Directional Field Estimation . . . . . . . . . . . . . . . . . . . . . . . . . . 192.3 Computational Aspects . . . . . . . . . . . . . . . . . . . . . . . . . . . . . 242.4 Experimental Results . . . . . . . . . . . . . . . . . . . . . . . . . . . . . . 252.5 Conclusions . . . . . . . . . . . . . . . . . . . . . . . . . . . . . . . . . . . 26
3 Singular Point Extraction 293.1 Introduction . . . . . . . . . . . . . . . . . . . . . . . . . . . . . . . . . . . 303.2 Singular Point Extraction . . . . . . . . . . . . . . . . . . . . . . . . . . . . 313.3 Orientation of Singular Points . . . . . . . . . . . . . . . . . . . . . . . . . 353.4 Experimental Results . . . . . . . . . . . . . . . . . . . . . . . . . . . . . . 373.5 Conclusions . . . . . . . . . . . . . . . . . . . . . . . . . . . . . . . . . . . 41
4 Segmentation of Fingerprint Images 434.1 Introduction . . . . . . . . . . . . . . . . . . . . . . . . . . . . . . . . . . . 444.2 Feature Extraction . . . . . . . . . . . . . . . . . . . . . . . . . . . . . . . . 444.3 Direct Feature Classification . . . . . . . . . . . . . . . . . . . . . . . . . . 484.4 Segmentation using Hidden Markov Models . . . . . . . . . . . . . . . . . . 544.5 Conclusions and Recommendations . . . . . . . . . . . . . . . . . . . . . . 56
5 Minutiae Extraction 595.1 Introduction . . . . . . . . . . . . . . . . . . . . . . . . . . . . . . . . . . . 605.2 Traditional Minutiae Extraction . . . . . . . . . . . . . . . . . . . . . . . . . 605.3 Minutiae Extraction Using Genetic Programming . . . . . . . . . . . . . . . 675.4 Minutiae Extraction Using Reinforcement Learning . . . . . . . . . . . . . . 68

ii CONTENTS
5.5 Evaluation of Minutiae Extraction Algorithms . . . . . . . . . . . . . . . . . 745.6 Conclusions . . . . . . . . . . . . . . . . . . . . . . . . . . . . . . . . . . . 75
II Matching 77
6 Elastic Minutiae Matching Using Thin-Plate Splines 796.1 Introduction . . . . . . . . . . . . . . . . . . . . . . . . . . . . . . . . . . . 806.2 Elastic Deformations . . . . . . . . . . . . . . . . . . . . . . . . . . . . . . 806.3 The Matching Algorithm . . . . . . . . . . . . . . . . . . . . . . . . . . . . 836.4 Experimental Results . . . . . . . . . . . . . . . . . . . . . . . . . . . . . . 866.5 Conclusions . . . . . . . . . . . . . . . . . . . . . . . . . . . . . . . . . . . 90
7 Likelihood Ratio-Based Biometric Verification 917.1 Introduction . . . . . . . . . . . . . . . . . . . . . . . . . . . . . . . . . . . 927.2 Biometric System Errors . . . . . . . . . . . . . . . . . . . . . . . . . . . . 947.3 Optimality of Likelihood Ratios . . . . . . . . . . . . . . . . . . . . . . . . 967.4 Experimental Results . . . . . . . . . . . . . . . . . . . . . . . . . . . . . . 997.5 Conclusions . . . . . . . . . . . . . . . . . . . . . . . . . . . . . . . . . . . 104
8 Correlation-Based Fingerprint Matching 1058.1 Introduction . . . . . . . . . . . . . . . . . . . . . . . . . . . . . . . . . . . 1068.2 Correlation-Based Fingerprint Matching . . . . . . . . . . . . . . . . . . . . 1068.3 Experimental Results . . . . . . . . . . . . . . . . . . . . . . . . . . . . . . 1148.4 Conclusions . . . . . . . . . . . . . . . . . . . . . . . . . . . . . . . . . . . 117
9 An Intrinsic Coordinate System for Fingerprint Matching 1199.1 Introduction . . . . . . . . . . . . . . . . . . . . . . . . . . . . . . . . . . . 1209.2 Regular Regions . . . . . . . . . . . . . . . . . . . . . . . . . . . . . . . . . 1219.3 Intrinsic Coordinate System . . . . . . . . . . . . . . . . . . . . . . . . . . 1229.4 Minutiae Matching in the ICS . . . . . . . . . . . . . . . . . . . . . . . . . 1239.5 Preliminary Results . . . . . . . . . . . . . . . . . . . . . . . . . . . . . . . 1249.6 Conclusions . . . . . . . . . . . . . . . . . . . . . . . . . . . . . . . . . . . 125
III Database Search 127
10 Classification 12910.1 Introduction . . . . . . . . . . . . . . . . . . . . . . . . . . . . . . . . . . . 13010.2 Henry Classes . . . . . . . . . . . . . . . . . . . . . . . . . . . . . . . . . . 13010.3 Conclusions . . . . . . . . . . . . . . . . . . . . . . . . . . . . . . . . . . . 132
11 Indexing Fingerprint Databases 13311.1 Introduction . . . . . . . . . . . . . . . . . . . . . . . . . . . . . . . . . . . 13411.2 Indexing Features . . . . . . . . . . . . . . . . . . . . . . . . . . . . . . . . 13411.3 Combining Features . . . . . . . . . . . . . . . . . . . . . . . . . . . . . . . 13711.4 Experimental Results . . . . . . . . . . . . . . . . . . . . . . . . . . . . . . 13911.5 Conclusions . . . . . . . . . . . . . . . . . . . . . . . . . . . . . . . . . . . 143

CONTENTS iii
12 Conclusions and Recommendations 14512.1 Conclusions . . . . . . . . . . . . . . . . . . . . . . . . . . . . . . . . . . . 14512.2 Recommendations . . . . . . . . . . . . . . . . . . . . . . . . . . . . . . . . 147
A Equivalence of DF Estimation Methods 151
B Equivalence of Coh and Str 155
C Rotation of Singular Points 157
D Gabor Filtering 159
E Thin-Plate Splines 163E.1 Interpolating Thin-Plate Splines . . . . . . . . . . . . . . . . . . . . . . . . 163E.2 Approximating Thin-Plate Splines . . . . . . . . . . . . . . . . . . . . . . . 165
F Gaussian Approximation of Error Rates 167
References 171
Summary 179
Samenvatting 181
Biography 183
List of Publications 185


Voorwoord
Gedurende mijn promotie heb ik een een aantal jaar kunnen werken aan een volledig zelfvormgegeven onderzoek. In deze periode heb ik erg veel geleerd, zowel vakinhoudelijk alsook daar buiten, maar daarnaast heb ik ook een geweldige tijd gehad. Hierbij wil ik graagvan de gelegenheid gebruik maken om de mensen te bedanken die aan het succes van mijnpromotie hebben bijgedragen.
Allereerst wil ik mijn promotoren Kees Slump en Otto Herrmann, die deze opdrachtmogelijk hebben gemaakt, bedanken. Daarnaast mijn begeleider en assistent-promotor SabihGerez. Met hem heb ik altijd lange discussies gevoerd, die er voor hebben gezorgd dat nieuweideeen van alle kanten kritisch werden bekeken en nog net iets scherper werden geformuleerd.Verder natuurlijk alle medewerkers en studenten van de leerstoel SAS-NT, die de perfecte(werk-)sfeer hebben gecreeerd.
Ook wil ik de studenten bedanken die door middel van een opdracht hebben meegewerktaan mijn promotieonderzoek. Gerben Verwaaijen heeft gewerkt aan een correlatie-gebaseerdvingerafdruk herkenningssysteem, Pieter van der Meulen heeft een genetisch programmeer-omgeving ontworpen die Han Schipper heeft toegepast op minutiae extraction, Johan de Boeren Eelke blok hebben gewerkt aan het indexeren van databases, Bart Blaauwendraad aanenhancement, Samuael Jonathan aan het gebruik van commerciele SDKs en Stefan Kleinheeft onderzoek gedaan naar segmentatie.
Verder wil ik Martijn van Otterlo bedanken voor de samenwerking op het gebied van re-inforcement learning, Marc Schrijver voor de talloze discussies over allerlei onderwerpen,Raymond Veldhuis voor de ideeen en samenwerking op het gebied van segmentatie en like-lihood ratios, en Mannes Poel en Leo Veelenturf voor hun inbreng bij de toepassing van CItechnieken. Daarnaast wil ik Anton Kuip en Harry Kip van NEDAP bedanken voor het delenvan hun ervaringen met de toepassing van vingerafdruk herkenning in praktijk situaties, ende praktische problemen die zich in zulk soort situaties voor doen.
Ten slotte wil ik natuurlijk Anja en Elbert bedanken voor hun fantastische steun tijdensdeze periode.
Asker BazenEnschede, 19 augustus 2002


Chapter 1
Introduction
Recognition of persons on the basis of biometric features is an emerging phenomenon in oursociety [Jai99b, Zha02]. It has received increasing attention in recent years due to the needfor security in a wide range of applications, such as replacement of the personal identifica-tion number (PIN) in banking and retail business, security of transactions across computernetworks, high-security wireless access, televoting, and admission to restricted areas. Moreexamples of applications are given in Section 1.2.
Traditional systems to verify a person’s identity are based on knowledge (secret code) orpossession (ID card). However, codes can be forgotten or overheard, and ID cards can belost or stolen, giving impostors the possibility to pass the identity test. The use of featuresinseparable from a person’s body significantly decreases the possibility of fraud. Furthermorebiometry can offer user-convenience in many situations, as it replaces cards, keys, and codes.
Many such biometric features can be distinguished: fingerprint, iris, face, voice, hand ge-ometry, retina, handwriting, gait, and more. For several reasons, the fingerprint is consideredone of the most practical features. Fingerprints are easily accessible, recognition requiresminimal effort on the part of the user, it does not capture information other than strictly nec-essary for the recognition process (such as race, health, etc.), and provides relatively goodperformance. Another reason for its popularity is the relatively low price of fingerprint sen-sors. PC keyboards and smart cards with built-in fingerprint sensors are already available onthe market, and the sensors can be integrated easily in wireless hardware.
Even though many academic and commercial systems for fingerprint recognition exist,the large number of publications on this subject shows the need for further research on thesubject so as to improve the reliability and performance of the systems. As this chapter willclarify, techniques to process fingerprints for recognition purposes are far from mature inspite of the extensive research already done in this field. The first Fingerprint VerificationCompetition (FVC2000) [Mai02] has shown that many factors may decrease the recognitionperformance. Noise in the captured fingerprint image, elastic distortion of the skin whenpressing the sensor, the partial image of a finger, large fingerprint databases: all these factorsmake it difficult for fingerprint recognition algorithms to achieve high performance.
2 CHAPTER 1. INTRODUCTION
For wide application and user-acceptance of fingerprint recognition, improvement of therecognition performance is still necessary. New algorithms may reduce the error rates tolevels that are acceptable for application of biometric authentication, and enable the use oflow-cost sensors that can be integrated easily in wireless hardware or smart cards. Next,users will accept biometrics as a part of modern society if they have experienced the benefitsof reliable and high-quality biometric systems.
This chapter is organized as follows. First, Section 1.1 discusses some basic issues anddefinitions in fingerprint recognition. Section 1.2 then presents a number of applicationsand summarizes the experience gained in live situations. Finally, Section 1.3 lists variouschallenges in fingerprint recognition, and Section 1.4 presents an overview of this thesis.
1.1 Definitions
This section provides an overview of the relevant issues and definitions related to finger-print recognition. It provides background knowledge for understanding the applications andoverview that are presented in the rest of this chapter.
1.1.1 Verification, Identification, and Classification
Several problems, with their associated algorithms and systems, can be defined in the con-text of fingerprint recognition, being verification, identification, and classification. The termrecognition is used in a general sense and encompasses all three kinds of tasks. Althoughthese definitions may conflict with the definitions that are used in other research areas, in thisthesis I will use the terms that are commonly used in fingerprint recognition.
Verification (or authentication) systems use fingerprint technology to verify the claimedidentity of a person. Such systems receive two inputs: the claimed identity of the personrequesting authentication (usually a username or smart card) and the live-scanned fingerprintof that person. The claimed identity is used to retrieve a reference fingerprint stored in adatabase and is matched (compared) against the currently offered fingerprint (the test finger-print). This results in a measure of similarity, on which the verification decision is based.
Identification systems identify a person based on a fingerprint. Such systems receive onlyone input, namely the live-scanned query fingerprint. A database is searched for a match-ing fingerprint, which is also referred to as one-to-many matching. A person is identified ifa matching fingerprint is found in the database. The system assigns the identity that corre-sponds to the matching fingerprint to the person that requests identification. On the otherhand, if no matching fingerprint is found in the database, the person is rejected. For bothverification and identification systems, enrollment is an important step. This is the process oftaking reference fingerprints of all users and storing these in the database for comparison.
The task of a Classification system is to determine which class (or group) the input finger-print belongs to. These systems also receive only a single fingerprint as input. A well-knownset of categories is formed by the Henry classes [Hen00], which are discussed in Chapter 10.
1.1. DEFINITIONS 3
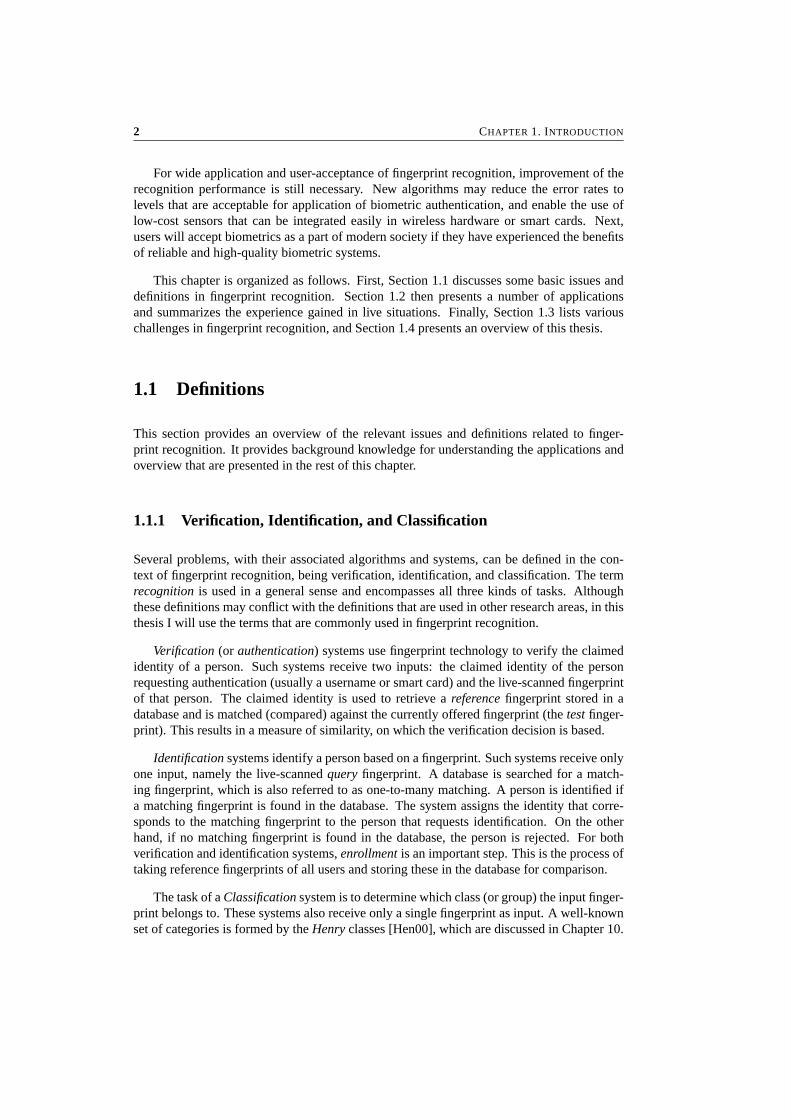
(a) Distributions (b) ROC
Figure 1.1: Match and non-match distributions and ROC.
These consist of five classes related to global fingerprint patterns. Classification can be aninitial step in an identification task as it reduces the number of database entries to be searched.
1.1.2 Error Measures
In verification and identification systems, matching is an important step. This is the com-parison of one particular fingerprint to another one. The result is either a ‘match’ or a ‘non-match’. This is often achieved by assigning a numeric value, corresponding to a measureof similarity, to the result of the comparison, followed by the use of a decision function orthreshold to convert this value to a match/non-match decision.
In general, the distributions of the similarity values of genuine attempts (matching finger-prints) and impostor attempts (non-matching fingerprints) cannot be separated completely bya threshold. Instead, the distributions overlap to some extent, resulting in matching errors.This is illustrated in Figure 1.1(a). Two fingerprints are deemed to match if their similarityscore exceeds the threshold, while they are deemed to originate from a different finger if theirscore is below the threshold.
The matching performance of fingerprint verification systems is measured by two errormeasures [Way99, Mai02]. The false acceptance rate (FAR) is the probability that the systemoutputs ‘match’ for fingerprints that are not from the same finger, as shown by the dark- grayarea in Figure 1.1(a). The false rejection rate (FRR) is the probability that the system outputs‘non-match’ for fingerprints that originate from the same finger. This is shown by the light-gray area in the figure. Currently available commercial systems perform at approximatelyFAR = 10−4 and FRR = 10−2 on high-quality databases. However, for more realisticfingerprint databases, the performance easily drops below FAR = 10−2 and FRR = 5 · 10−2.
In most systems, the performance can be controlled by a parameter such as the threshold
4 CHAPTER 1. INTRODUCTION
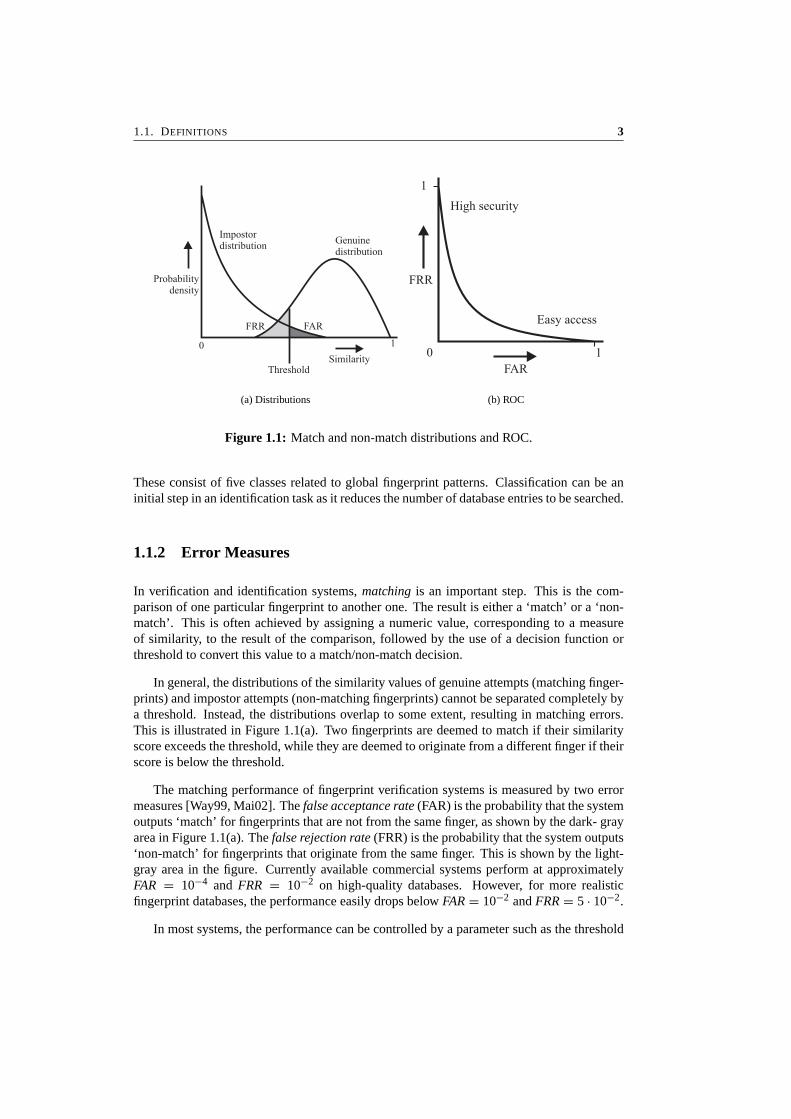
(a) DF and SPs. The core isindicated by the circle and thedelta by the cross
(b) Minutiae
Figure 1.2: Fingerprint with directional field, singular points, and minutiae.
mentioned above. The variation in performance for different parameter settings can be visu-alized by plotting FAR against FRR. This plot, shown in Figure 1.1(b), is called the receiveroperating curve (ROC). The threshold can be tuned to meet the requirements of the applica-tion for which the system is used. Some systems may require very high security (a very lowFAR), while other systems may need to provide easy access (a low FRR). The equal errorrate (EER) is given by the specific point on the ROC where FAR and FRR are equal.
Achieving low error rates in an identification system is much harder than it is in a ver-ification system. Consider the identification of a fingerprint in a database of n = 10, 000entries and an identification system that matches the query fingerprint to all entries in thedatabase. The high-performance matching algorithm with FAR = 10−4 will find on averagen · FAR = 1 false match in this database. Furthermore, the probability of false acceptanceover the entire database can be computed as: FAR1:n = 1 − (1 − FAR)n = 0.63. Obviously,this is unacceptable for any identification system.
1.1.3 Fingerprint Features
A fingerprint is a pattern of curving line structures called ridges, where the skin has a higherprofile than its surroundings, which are called the valleys. In most fingerprint images, theridges are black and the valleys are white.
Due to all kinds of noise and distortions, fingerprints cannot be matched simply by takingthe cross-correlation or the Euclidean distance of the gray scale images. This is solved tosome extent by extracting features from the fingerprints that are more robust to the distortions.Commonly used features are:

1.2. APPLICATIONS 5
• The directional field (DF) is defined as the local orientation of the ridge-valley struc-tures. It describes the coarse structure, or basic shape, of a fingerprint and is calculatedon a regular grid in the fingerprint. An example of a DF is given in Figure 1.2(a).
• The singular points (SPs) are the discontinuities in the directional field. Two types ofSP exist. According to Henry [Hen00], a core is the uppermost point of the innermostcurving ridge, and a delta is a point where three ridge flows meet. In some fingerprints,the SPs fall outside the image area. The SPs are indicated in the DF of Figure 1.2(a).
• The minutiae provide the details of the ridge-valley structures. Automatic fingerprintrecognition systems use the two elementary types of minutiae that exist, being ridge-endings and bifurcations. Sometimes composite types of minutiae such as lakes orshort ridges are also used. In Figure 1.2(b), the minutiae are indicated with smallcircles.
In most fingerprint recognition systems, the directional field is used for enhancement ofthe fingerprint and, together with the singular points, for classification, while the minutiae areused for matching.
1.2 Applications
This section presents a number of applications of fingerprint recognition. Since I have notbeen involved in these applications myself, but discussed them with the actual implementers,these examples are somewhat anecdotal. They are included to give an overview of possi-ble application of fingerprint recognition. Physical access control, computer login and key-less lockers have been implemented by NEDAP1, while the now defunct company Interstratperformed experiments with biometric smart cards. Various specific aspects and practicalexperience with fingerprint recognition systems are discussed in this section as well. Moreapplications and implementation issues can for instance be found in [Ash00].
1.2.1 Physical Access Control
Physical access control to buildings or restricted areas is one of the earliest applications ofbiometric techniques. The goal of this traditional application is to provide high securityaccess control. We will discuss two situations in which fingerprints are used for physicalaccess control.
The first situation is the more traditional setting. A bank in France has introduced fin-gerprint verification for access by its employees at remote locations. This particular situationinvolves a small number of employees who use the technology frequently, namely for eachtime that they require access. The users are highly motivated. They agree with the need forsecurity measurements (the fingerprint recognition system replaces secret access codes), andthey accept that secure access may take some more time. Since only a small number of peopleuse the system, considerable time can be spent in training and enrollment.
1http://www.nedap.com/

6 CHAPTER 1. INTRODUCTION
The second application is situated in a city in the Netherlands, where the local authoritieshave decided to use fingerprint verification for access to specific departments of the city hall.In this case, the goal is to provide a secure environment for the maintenance of various kindsof information and files. The motivation is that citizens expect from their government thattheir information is safe.
For most departments, fingerprints are only required for access outside of working hours.During working hours, there are many employees, and strangers will not be able to obtainaccess without being noticed. Therefore, an ID card is enough to obtain access during theday. Within the computer department, fingerprint access applies around the clock, sinceaccess to the computer systems is much more critical.
Initially during this Dutch city hall experiment, the performance of the fingerprint verifi-cation system was somewhat disappointing. Access was refused for reasons that were unclearto the users, and employees did not receive enough help to resolve these problems. However,improved communication and training of operators and users has led to an acceptable situa-tion.
1.2.2 Login to Computer Network
Since access to information requires not only physical presence but also access to computersystems, the city decided to secure its computer network by means of fingerprint login. Allcomputers were equipped with a smart card reader and a fingerprint sensor. For login fromdifferent locations at a central network, both an ID card and a fingerprint are required. Fur-thermore, access via the Internet is also supported so as to enable teleworking at home. Com-puter access represents a situation that is much more controlled than access to a building.Furthermore, feedback of the image acquisition can be given on the computer screen. There-fore, the performance level of the system is much higher than in the large-scale physicalaccess control experiment.
1.2.3 Key-less Lockers
Many swimming pools have lockers where swimmers can leave their valuables. Traditionallockers require the swimmer to carry the key during swimming. As this is quite inconvenient,the use of a fingerprint to replace the key is an attractive alternative. Furthermore, it wouldsimplify the management of the locker system. Key-less lockers have been tested in severalpilot projects. The lockers are installed in a swimming pool as an alternative to key-operatedlockers. In a typical setting, a group of 100 lockers are jointly controlled by a computer thatis connected to a fingerprint sensor. Figure 1.3 shows a photo of part of such a system.
This application presents several special challenges. First, the recognition of wet fingersgives rise to various problems. Fingerprint images from wet fingers lead to decreased imagequality. This problem is enlarged by the fact that the layer of fat at the surface of the skinis reduced by an extended stay in the (chloride-enhanced) water. Various fingerprint sensorswere used, but none of them yielded a satisfactory image quality. Also, water causes theskin to fit less tightly around the finger, resulting in above-average elastic distortions of the
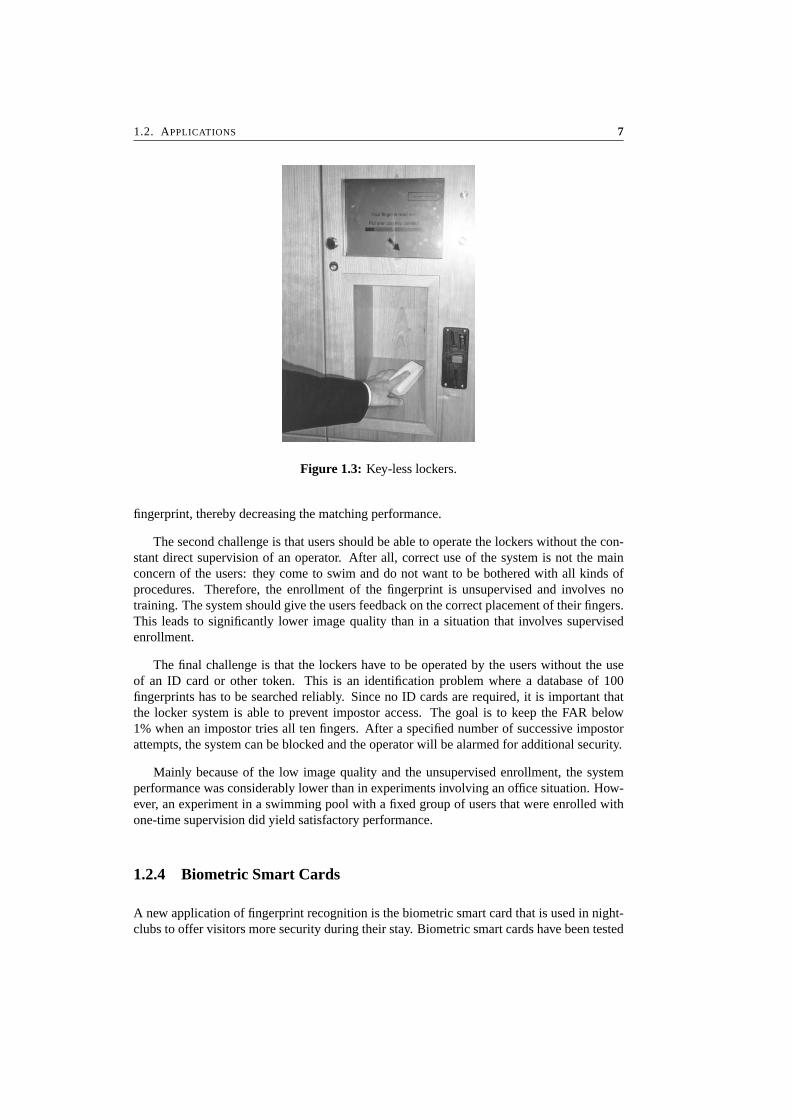
1.2. APPLICATIONS 7
Figure 1.3: Key-less lockers.
fingerprint, thereby decreasing the matching performance.
The second challenge is that users should be able to operate the lockers without the con-stant direct supervision of an operator. After all, correct use of the system is not the mainconcern of the users: they come to swim and do not want to be bothered with all kinds ofprocedures. Therefore, the enrollment of the fingerprint is unsupervised and involves notraining. The system should give the users feedback on the correct placement of their fingers.This leads to significantly lower image quality than in a situation that involves supervisedenrollment.
The final challenge is that the lockers have to be operated by the users without the useof an ID card or other token. This is an identification problem where a database of 100fingerprints has to be searched reliably. Since no ID cards are required, it is important thatthe locker system is able to prevent impostor access. The goal is to keep the FAR below1% when an impostor tries all ten fingers. After a specified number of successive impostorattempts, the system can be blocked and the operator will be alarmed for additional security.
Mainly because of the low image quality and the unsupervised enrollment, the systemperformance was considerably lower than in experiments involving an office situation. How-ever, an experiment in a swimming pool with a fixed group of users that were enrolled withone-time supervision did yield satisfactory performance.
1.2.4 Biometric Smart Cards
A new application of fingerprint recognition is the biometric smart card that is used in night-clubs to offer visitors more security during their stay. Biometric smart cards have been tested
8 CHAPTER 1. INTRODUCTION
in a large-scale experiment in 15 nightclubs in the Netherlands. Visitors of the clubs had topurchase a membership card which stores a photograph and a fingerprint. In order to obtainaccess to the clubs, their face and fingerprint were verified.
A person causing trouble at a nightclub is removed. To offer security to the other visitors,such a person is added to a blacklist and will not have access to the nightclub for a specifiedperiod of time. Since all participating nightclubs have a joint blacklist, the person is alsodenied access to the other clubs.
New users have to be verified against the blacklist. Since suspended users may try topurchase a membership card under a false name, a fingerprint identification system is used.The identification problem is especially difficult since suspended users do not want to berecognized and may try to cause elastic deformation of their fingerprints. To deal with thisissue, the FRR must be kept very low.
1.2.5 Practical Experience
This section summarizes the experience that was gained by the application of fingerprintrecognition in live situations. Fingerprint recognition is harder to install than face, handgeometry, or iris recognition. The application of such methods is far less sensitive to handlingby untrained users and other interfering factors. However, fingerprint recognition can beapplied with the very small and cheap sensors that are on the market for this technology.
The performance of a fingerprint verification system highly depends on the situation inwhich it is used. In the high-security bank situation, employees are well-trained and acceptthe fact that they have to use the system conscientiously. The system thus performs well.Computer login is also an application in a controlled situation. The login procedure takessome time anyway, and employees are relatively patient as they are sitting at their desk.Therefore, this application does not cause many problems either. However, for physical ac-cess control, people may be in a hurry, or they may be cold, wet, or sweaty because of weatherconditions. As a result, they may be too impatient for careful acquisition of their fingerprints.On top of that, it takes much more time and organization to train large groups of people. Insuch situations, the employer must be committed to make the system a success and willing tospend time to explain the system, to train the users, and to offer continuous support.
Enrollment is another critical issue. If the enrolled fingerprints are not of high quality,system performance decreases significantly. Therefore, enough time has to be taken for theenrollment. Especially when the enrollment is unsupervised, feedback of the acquisitionprocess is important. Users need to know whether they have to press harder or to place theirfingers differently on the sensor.
Most verification systems use an ID card to store the claimed identity of a user. In thissituation, achievement of an extremely low FAR is not a critical issue. Impostor attemptsoccur only sporadically, since the impostor first has to get access to a valid ID card. If anattempt is made with a stolen ID card that has not been reported as missing yet, the fingerprintverification serves as an additional barrier. In such a case, an FAR level of 1% is satisfactory,while most algorithms offer an FAR of 10−3 or better.

1.3. CHALLENGES 9
Achievement of a low FRR is much bigger problem. If the FRR is too high, many userswill not obtain access without knowing why. Although false rejection can also occur withhigh-quality fingerprints, the main cause of rejection of a fingerprint is its poor image quality(see Figure 5.2 on page 61). The poor-quality fingerprint is rejected before matching withthe template, and those cases are not included in the performance figures of the softwareapplication. However, users experience such rejection as unjust.
It is generally recognized that a small percentage of the human population has very poorquality fingerprints (typically 1% to 5%) [Pra01]. If those fingerprints are included in thematching performance figures, the distribution of the genuine matching score, which is shownin Figure 1.1(a), will become bimodal. It will show an additional peak near zero, caused bythe poor-quality fingerprints. This will result in a heightened FRR, which cannot be resolvedby means of threshold settings. The only solution is to increase the image quality by meansof better sensors or enhancement algorithms.
A final remark on live biometric systems is that a backup system has to be constructed.A backup system is needed not only when the fingerprint recognition system is out of order,but also to apply to users who are denied access by the system. Backup possibilities mayconsist of a code that can be used as alternative to the fingerprints, or the physical presenceof operator or security staff to provide correct user access.
1.3 Challenges
Analysis of the shortcomings and error types of current fingerprint recognition systems iden-tifies three principal algorithmic challenges in fingerprint recognition that will be addressedin this thesis:
• robust feature extraction from low-quality fingerprints,
• matching fingerprints that are affected by elastic distortions,
• classification methods for efficient search of fingerprints in a database.
Since this thesis focusses on algorithmic aspects of fingerprint recognition, some impor-tant problems that fall outside the scope of this thesis. Examples of the issues that will not beaddressed are:
• sensor technology,
• detection of faked fingerprints,
• user acceptance.
10 CHAPTER 1. INTRODUCTION
1.4 Outline
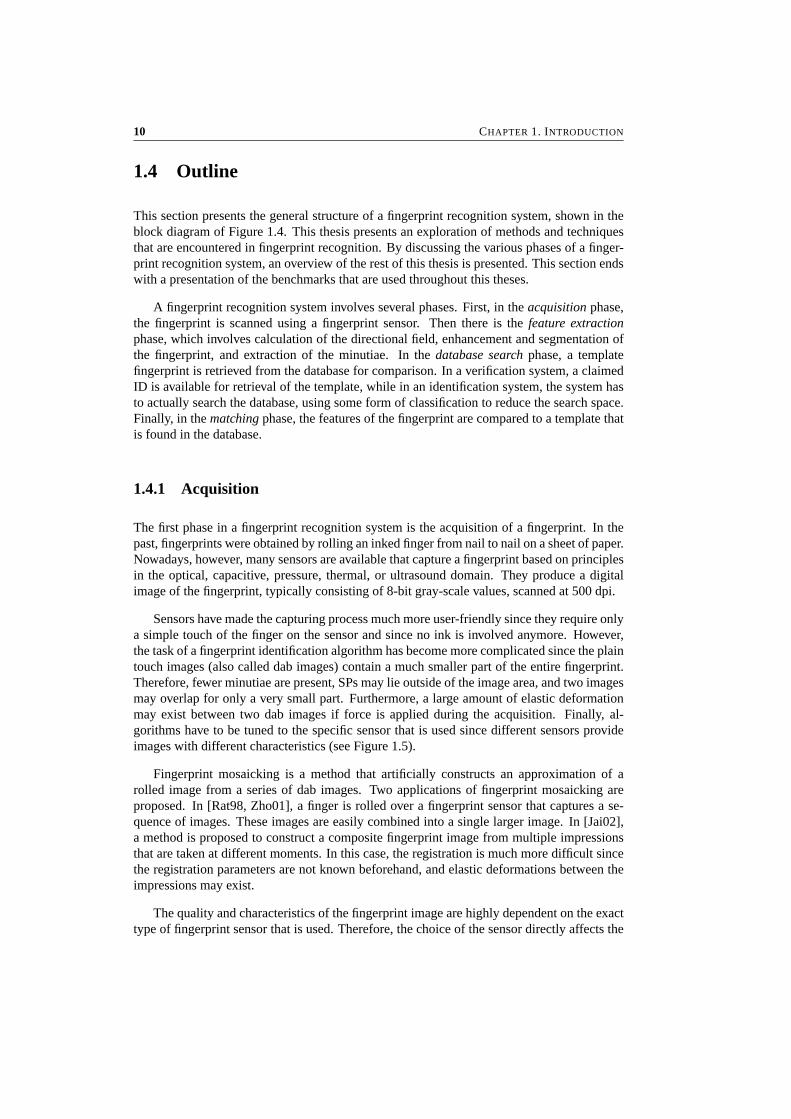
This section presents the general structure of a fingerprint recognition system, shown in theblock diagram of Figure 1.4. This thesis presents an exploration of methods and techniquesthat are encountered in fingerprint recognition. By discussing the various phases of a finger-print recognition system, an overview of the rest of this thesis is presented. This section endswith a presentation of the benchmarks that are used throughout this theses.
A fingerprint recognition system involves several phases. First, in the acquisition phase,the fingerprint is scanned using a fingerprint sensor. Then there is the feature extractionphase, which involves calculation of the directional field, enhancement and segmentation ofthe fingerprint, and extraction of the minutiae. In the database search phase, a templatefingerprint is retrieved from the database for comparison. In a verification system, a claimedID is available for retrieval of the template, while in an identification system, the system hasto actually search the database, using some form of classification to reduce the search space.Finally, in the matching phase, the features of the fingerprint are compared to a template thatis found in the database.
1.4.1 Acquisition
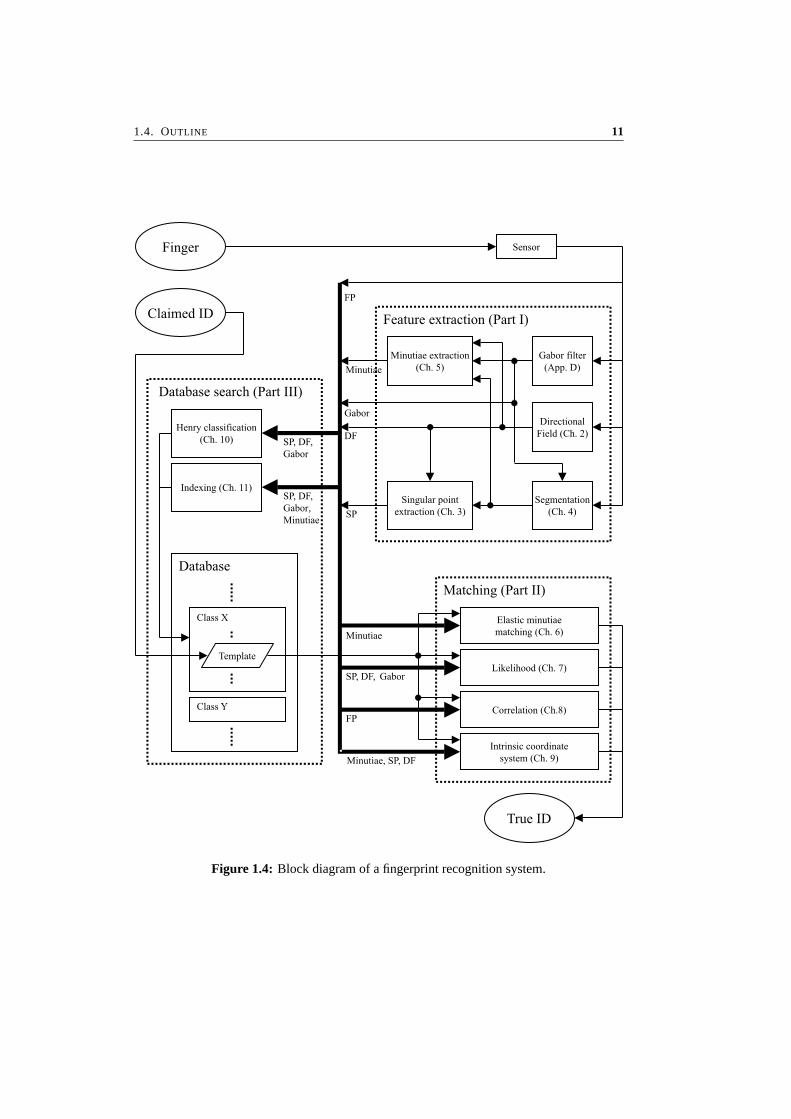
The first phase in a fingerprint recognition system is the acquisition of a fingerprint. In thepast, fingerprints were obtained by rolling an inked finger from nail to nail on a sheet of paper.Nowadays, however, many sensors are available that capture a fingerprint based on principlesin the optical, capacitive, pressure, thermal, or ultrasound domain. They produce a digitalimage of the fingerprint, typically consisting of 8-bit gray-scale values, scanned at 500 dpi.
Sensors have made the capturing process much more user-friendly since they require onlya simple touch of the finger on the sensor and since no ink is involved anymore. However,the task of a fingerprint identification algorithm has become more complicated since the plaintouch images (also called dab images) contain a much smaller part of the entire fingerprint.Therefore, fewer minutiae are present, SPs may lie outside of the image area, and two imagesmay overlap for only a very small part. Furthermore, a large amount of elastic deformationmay exist between two dab images if force is applied during the acquisition. Finally, al-gorithms have to be tuned to the specific sensor that is used since different sensors provideimages with different characteristics (see Figure 1.5).
Fingerprint mosaicking is a method that artificially constructs an approximation of arolled image from a series of dab images. Two applications of fingerprint mosaicking areproposed. In [Rat98, Zho01], a finger is rolled over a fingerprint sensor that captures a se-quence of images. These images are easily combined into a single larger image. In [Jai02],a method is proposed to construct a composite fingerprint image from multiple impressionsthat are taken at different moments. In this case, the registration is much more difficult sincethe registration parameters are not known beforehand, and elastic deformations between theimpressions may exist.
The quality and characteristics of the fingerprint image are highly dependent on the exacttype of fingerprint sensor that is used. Therefore, the choice of the sensor directly affects the
1.4. OUTLINE 11
Database
Class X
Class Y
Gabor filter
(App. D)
Directional
Field (Ch. 2)
Singular point
extraction (Ch. 3)
Minutiae extraction
(Ch. 5)
Feature extraction (Part I)
Database search (Part III)
Matching (Part II)
Elastic minutiae
matching (Ch. 6)
Likelihood (Ch. 7)
Sensor
Henry classification
(Ch. 10)
Indexing (Ch. 11)
Segmentation
(Ch. 4)
Template
Correlation (Ch.8)
Intrinsic coordinate
system (Ch. 9)
Finger
Claimed ID
True ID
SP, DF,
Gabor
SP, DF,
Gabor,
Minutiae
Minutiae
SP, DF, Gabor
FP
Minutiae, SP, DF
FP
Minutiae
DF
Gabor
SP
Figure 1.4: Block diagram of a fingerprint recognition system.
12 CHAPTER 1. INTRODUCTION
(a) Inked (b) Capacitive
(c) Optical (d) Optical
Figure 1.5: Fingerprint images that are acquired by different sensors.

1.4. OUTLINE 13
recognition performance, and the recognition algorithms have to be adapted to the specificfingerprint sensor that is used. Fingerprint sensor technology itself is not addressed in thisthesis.
1.4.2 Feature Extraction
The next phase in a fingerprint recognition system is the feature extraction from fingerprintimages, which is discussed in Part I of this thesis. First, Chapter 2 discusses the estimationof the directional field from fingerprint images and Chapter 3 deals with a method for theextraction of singular points from the directional field. Next, Chapter 4 discusses segmen-tation of fingerprint images, which is the partitioning of the image in a foreground area thatcan be used for recognition purposes, possibly a low quality region, and a noisy backgroundarea. Finally, Chapter 5 presents minutiae extraction algorithms. Traditional image process-ing based minutiae extraction is discussed and two alternative learning agent based methodsare presented. Each of the subsequent stages in the other parts makes use of some of thefeatures that are presented in Part I.
1.4.3 Matching
Part II deals with matching fingerprints. Four different matching algorithms are discussed,and in practice, one of them has to be chosen. First, Chapter 6 presents an elastic minutiaematching algorithm. This algorithm is able to estimate and reverse elastic deformations infingerprints by means of thin-plate splines. Next, Chapter 7 proposes a likelihood ratio-based algorithm for matching the directional field and Gabor response (see Appendix D) offingerprints. Then, Chapter 8 provides an algorithm for matching fingerprints by means ofsegments from the original gray-scale fingerprint, without any feature extraction. Finally,Chapter 9 presents an intrinsic coordinate system that provides a shape and elastic distortioninvariant representation of the minutia locations, but for which a matching algorithm has notbeen developed yet. Because of performance considerations, only the matching approachesof Chapters 6 and 7 will be used in practice.
1.4.4 Database Search
Part III discusses methods for searching fingerprint databases efficiently. The techniques thatare developed in this part are only used in identification system. First, Chapter 10 discussesHenry classification. It is shown that this provides no sufficient solution for searching largedatabases. Next, Chapter 11 presents indexing methods that provide a much better alternativefor this task.
1.4.5 Benchmarks
We have tried as much as possible to use the same databases for benchmarking the perfor-mance of all algorithms throughout this thesis. For this task, we have chosen Database 2 of
14 CHAPTER 1. INTRODUCTION
the fingerprint verification competition 2000 (FVC2000) [Mai00, Mai02].
Before the summer of 2000, there was no common benchmark for assessing the per-formance of fingerprint recognition systems. Therefore, it was very hard to compare theresults that were presented in various papers. Most databases that were used then consistedof scanned images of inked fingerprints. However, the characteristics of these fingerprint im-ages is quite different from the images that are acquired by the digital sensors that are used inautomatic fingerprint recognition system. After the summer of 2000, more and more authorsswitched to the FVC2000 database as benchmark for their algorithms. In August 2002, theFVC2002 database will released, acquired by new state-of-the-art fingerprint sensors.
The FVC2000 database consists of 4 different databases. Three of those are acquiredby different fingerprint sensors (1 capacitive and 2 optic sensors) and one is generated syn-thetically [Cap00a]. Each database contains 880 fingerprints, originating from 110 differentfingers of untrained volunteers (they did not receive extensive instructions how to place theirfingers etc. to simulate a situation that is encountered in practice) who have all provided 8prints of the same finger. The database that we use most of the time (Database 2) is capturedby a capacitive sensor at 500 dpi, providing 8-bit gray-scale images of 364 by 256 pixels.
At the time of the actual competition, 80 fingerprints (8 prints of 10 fingers) were pro-vided for training purposes before submitting the matching algorithms. The other 800 printswere used for testing. Now, all 880 prints can be used to test a fingerprint recognition al-gorithm. For one-to-one matching, each fingerprint can be matched against 7 other prints.After removing the double matches, 3080 valid matching experiments remain. For testingthe impostor characteristics, usually only the first print of each ID is used. Each fingerprintof the 110 that are available can be matched to 109 other fingerprints, which results in 5995non-matching experiments after removal of the double matches.

Part I
Feature Extraction


Chapter 2
Directional Field Estimation
Abstract
This chapter discusses the estimation of a high resolution directional field of fingerprints.Traditional methods are compared to a new method, based on principal component analysis.The method is adapted to compute the directional field and its coherence in each pixel. Bycombining a non-uniform window with efficient filter techniques, the method can also beused to estimate a block directional field with higher accuracy, without being computationalmuch more complex. Parts of this chapter have been published in [Baz00a] and [Baz02d].
18 CHAPTER 2. DIRECTIONAL FIELD ESTIMATION
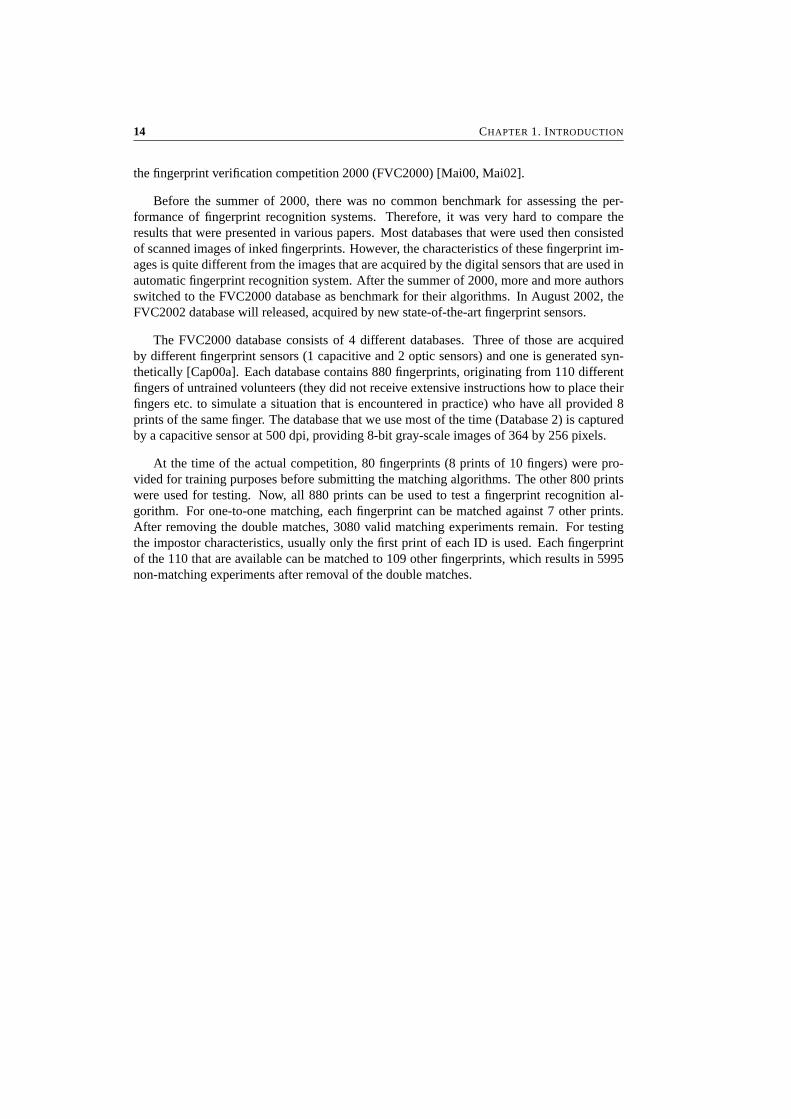
(a) Fingerprint (b) Directional field
Figure 2.1: Examples of a fingerprint, and its directional field. The orientation of the smalllines represents the estimated direction, while the length of the lines gives an indication ofthe certainty.
2.1 Introduction
In Figure 2.1(a), a fingerprint is depicted. The information carrying features in a fingerprintare the line structures, called ridges and valleys. In this figure, the ridges are black andthe valleys are white. It is possible to identify two levels of detail in a fingerprint. Thedirectional field (DF), shown in Figure 2.1(b), describes the coarse structure, or basic shape,of a fingerprint. It is defined as the local orientation of the ridge-valley structures. Theminutiae provide the details of the ridge-valley structures, like ridge-endings and bifurcations.
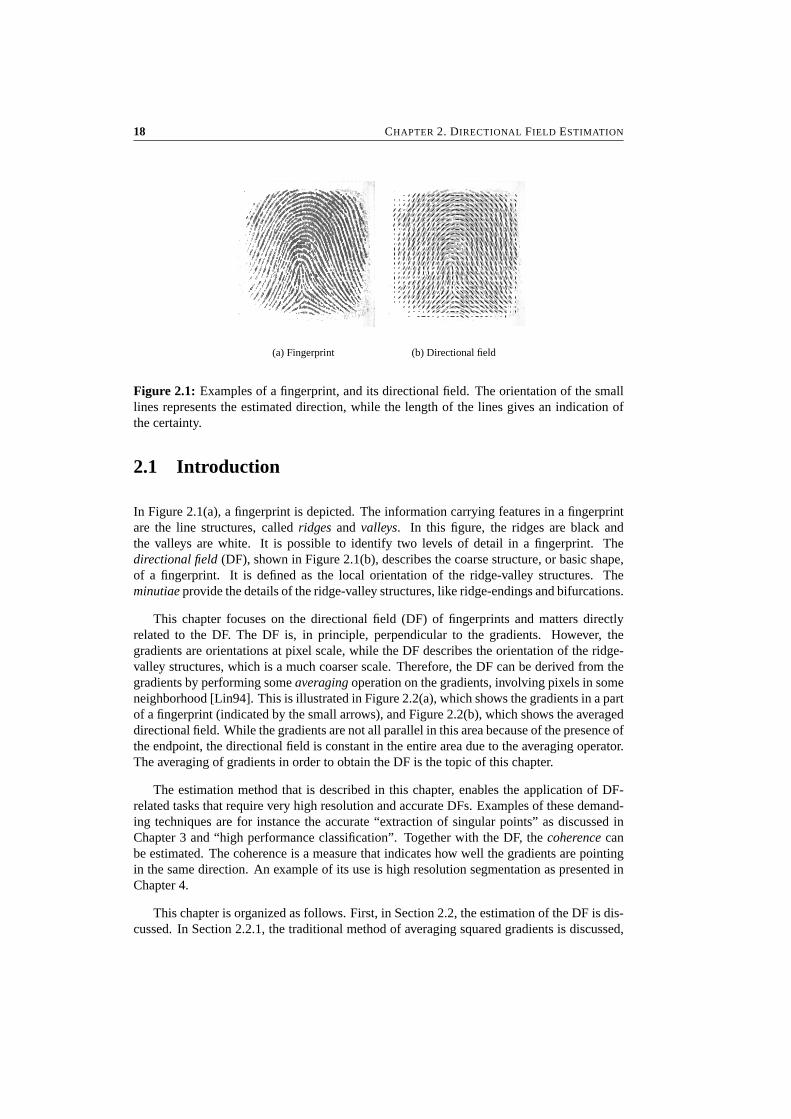
This chapter focuses on the directional field (DF) of fingerprints and matters directlyrelated to the DF. The DF is, in principle, perpendicular to the gradients. However, thegradients are orientations at pixel scale, while the DF describes the orientation of the ridge-valley structures, which is a much coarser scale. Therefore, the DF can be derived from thegradients by performing some averaging operation on the gradients, involving pixels in someneighborhood [Lin94]. This is illustrated in Figure 2.2(a), which shows the gradients in a partof a fingerprint (indicated by the small arrows), and Figure 2.2(b), which shows the averageddirectional field. While the gradients are not all parallel in this area because of the presence ofthe endpoint, the directional field is constant in the entire area due to the averaging operator.The averaging of gradients in order to obtain the DF is the topic of this chapter.
The estimation method that is described in this chapter, enables the application of DF-related tasks that require very high resolution and accurate DFs. Examples of these demand-ing techniques are for instance the accurate “extraction of singular points” as discussed inChapter 3 and “high performance classification”. Together with the DF, the coherence canbe estimated. The coherence is a measure that indicates how well the gradients are pointingin the same direction. An example of its use is high resolution segmentation as presented inChapter 4.
This chapter is organized as follows. First, in Section 2.2, the estimation of the DF is dis-cussed. In Section 2.2.1, the traditional method of averaging squared gradients is discussed,
2.2. DIRECTIONAL FIELD ESTIMATION 19
(a) Gradients (b) Directional field
Figure 2.2: Detailed area in a fingerprint: (a) the gradients, indicated by the small arrows,and (b) the averaged directional field.
while in Section 2.2.2, a new method based on principal component analysis (PCA) is pro-posed. In Appendices A and B, a proof is given that both methods are exactly equivalent andit is shown that the coherence, which is a measure for the local strength of the directionalfield, can be elegantly expressed in the two eigenvalues that are computed for the PCA. InSection 2.3, some computational aspects of DF estimation are discussed. Furthermore, it isshown that the high-resolution DF can be used to obtain more accurate block-DF estimates.Finally, in Section 2.4, experiments are presented where the theory is applied to fingerprintscontained in one of the databases used for the Fingerprint Verification Competition 2000[Mai00]. In that section, some practical aspects of the algorithms are discussed as well. Ex-periments that evaluate the DF extraction by the number of false and missed singular pointsare presented in Chapter 3.
2.2 Directional Field Estimation
Various methods to estimate the DF from a fingerprint image are known from literature.They include matched-filter approaches [Dre99, Wil94, Kar96], methods based on the high-frequency power in three dimensions [O’G89], 2-dimensional spectral estimation methods[Wil94] and micropatterns that can be considered binary gradients [Kaw84]. These ap-proaches do not provide as much accuracy as gradient-based methods, mainly because ofthe limited number of fixed possible orientations. This is especially important in case theDF is used for tasks like tracing flow lines. The gradient-based method was introduced in[Kas87] and adopted by many researchers (see e.g. [Rao92, Rat95, Jai97b, Per98]).
The elementary orientations in the image are given by the gradient vector[Gx (x, y) G y(x, y)]T , which is defined as:

20 CHAPTER 2. DIRECTIONAL FIELD ESTIMATION
[Gx (x, y)
G y(x, y)
]= sign(Gx )∇ I (x, y) = sign(
∂ I (x, y)
∂x)
[∂ I (x,y)
∂x∂ I (x,y)
∂y
](2.1)
where I (x, y) represents the gray-scale image, and the gradient is calculated by means of aconvolution with the derivative of a Gaussian window. The first element of the gradient vectorhas been chosen to be always positive. The reason for this choice is that in the DF, whichis perpendicular to the gradient, opposite directions indicate equivalent orientations. It isillustrated in Figure 2.2 that some averaging operation has to be performed on the gradients,which are distributed over a large range of directions as indicated by the small arrows, inorder to obtain the smooth DF.
2.2.1 Averaging Squared Gradients
This section discusses the problems that are encountered with averaging gradients and thetraditional solution of averaging squared gradients. First, the general idea behind averagingsquared gradients is presented and then, an analysis of the results of this method is given.Apart from the estimation of the DF, this section also discusses the coherence, which providesa measure for the strength or certainty of the estimated orientation.
Intuitive Analysis
Gradients cannot directly be averaged in a local neighborhood, since opposite gradient vectorswill then cancel each other, although they indicate the same ridge-valley orientation. This iscaused by the fact that local ridge-valley structures remain unchanged when rotated over 180degrees [Per98]. Since the gradient orientations are distributed in a cyclic space ranging from0 to π , and the average orientation has to be found, another formulation of this problem isthat the ‘π -periodic cyclic mean’ has to be computed.
In [Kas87], a solution to this problem is proposed by doubling the angles of the gradientvectors before averaging. After doubling the angles, opposite gradient vectors will pointin the same direction and therefore will reinforce each other, while perpendicular gradientswill cancel. After averaging, the gradient vectors have to be converted back to their single-angle representation. The ridge-valley orientation is then perpendicular to the direction of theaverage gradient vector.
In the algorithm version discussed in this chapter, not only the angle of the gradients isdoubled, but also the length of the gradient vectors is squared. This can also be expressedby considering the gradient vectors as complex numbers that are squared. This has the effectthat strong orientations have a higher vote in the average orientation than weaker orientations,equivalent to the L2 norm. Furthermore, this approach results in the least complex expres-sions. However, other choices, like for instance setting all lengths to unity [Per98], are foundin the literature as well.
In [Kas87], also a method is proposed to use the squared gradients for computation of thestrength of the orientation. This measure, which is called the coherence, measures how well

2.2. DIRECTIONAL FIELD ESTIMATION 21
all squared gradient vectors share the same orientation. If they are all parallel to each other,the coherence is 1 and if they are equally distributed over all directions, the coherence is 0.
Formal Analysis
In this section, the intuitive analysis that was given in the previous section is formalized. Thegradient vectors are first estimated using Cartesian coordinates, in which a gradient vector isgiven by [Gx G y]T . For doubling the angle and squaring the length, the gradient vector isconverted to ”polar” coordinates, in which it is given by [Gρ Gϕ]T . This conversion is givenby:
[Gρ
Gϕ
]=[ √
G2x + G2
y
tan−1 G y/Gx
](2.2)
Note that − 12π < Gϕ ≤ 1
2π is a direct consequence of the fact that Gx is always positive.The gradient vector is converted back to its Cartesian representation by:
[Gx
G y
]=[
Gρ cos Gϕ
Gρ sin Gϕ
](2.3)
Using trigonometric identities, an expression for the squared gradient vectors[Gs,x Gs,y]T that does not refer to Gρ and Gϕ , is found:
[Gs,x
Gs,y
]=[
G2ρ cos 2Gϕ
G2ρ sin 2Gϕ
]=[
G2ρ(cos2 Gϕ − sin2 Gϕ)
G2ρ(2 sin Gϕ cos Gϕ)
]=[
G2x − G2
y2Gx G y
](2.4)
This result can also be obtained directly by using the equivalence of ‘doubling the angleand squaring the length of a vector’ to ‘squaring a complex number’:
Gs,x + j · Gs,y = (Gx + j · G y)2 = (G2
x − G2y) + j · (2Gx G y) (2.5)
Next, the average squared gradient [Gs,x Gs,y]T can be calculated. It is averaged in alocal neighborhood, using a not necessary uniform window W :
[Gs,x
Gs,y
]=[ ∑
W Gs,x∑W Gs,y
]=[ ∑
W G2x − G2
y∑W 2Gx G y
]=[
Gxx − G yy
2Gxy
](2.6)
In this expression,

22 CHAPTER 2. DIRECTIONAL FIELD ESTIMATION
Gxx =∑W
G2x (2.7)
G yy =∑W
G2y (2.8)
Gxy =∑W
Gx G y (2.9)
are estimates for the variances and crosscovariance of Gx and G y , averaged over the windowW . Now, the average gradient direction �, with −1
2π < � ≤ 12π , is given by:
� = 1
2� (Gxx − G yy, 2Gxy
)(2.10)
where � (x, y) is defined as:
� (x, y) =
tan−1(y/x) x ≥ 0tan−1(y/x) + π for x < 0 ∧ y ≥ 0tan−1(y/x) − π x < 0 ∧ y < 0
(2.11)
and the average ridge-valley direction θ , with −12π < θ ≤ 1
2π , is perpendicular to �:
θ ={
� + 12π for � ≤ 0
� − 12π � > 0
(2.12)
An expression for the gradients after squared averaging is given in Appendix A.
The coherence of the squared gradients can also be expressed using the same notations.The coherence Coh is given by [Kas87]:
Coh =∣∣∑
W [Gs,x Gs,y]T∣∣∑
W
∣∣[Gs,x Gs,y]T∣∣ =
√(Gxx − G yy)2 + 4G2
xy
Gxx + G yy(2.13)
as will be shown in Appendix B.
If all squared gradient vectors are pointing in exactly the same direction, the sum of themoduli of the vectors equals the modulus of the sum of the vectors, resulting in a coherencevalue of 1. On the other hand, if the squared gradient vectors are equally distributed in alldirections, the length of the sum of the vectors will equal 0, resulting in a coherence valueof 0. In between these two extreme situations, the coherence will vary between 0 and 1, thusproviding the required measure.

2.2. DIRECTIONAL FIELD ESTIMATION 23
2.2.2 Principal Component Analysis
This chapter proposes a second method to estimate the directional field from the gradients,which is based on principal component analysis (PCA). PCA computes a new orthogonalbase given a multi-dimensional data set such that the variance of the projection on one of theaxes of this new base is maximal, while the projection on the other one is minimal. It turnsout that the base is formed by the eigenvectors of the autocovariance matrix of this data set[The92].
When applying PCA to the autocovariance matrix of the [Gx G y]T gradient vectors, itprovides the 2-dimensional Gaussian joint probability density function of these vectors. Themain direction of the gradients can be calculated from this function.
The estimate of the autocovariance matrix C of the gradient vector pairs is given by:
C =[
Gxx Gxy
Gxy G yy
]=∑W
[G2
x Gx G y
Gx G y G2y
](2.14)
In this estimate, the assumption is made that the gradient vectors are zero-mean, i.e.
E[Gx ] = E[G y] = 0 (2.15)
in a window W in the given fingerprint. This is true in any window in which the finger-print has a constant mean gray value. Then, the gradient is defined as the difference of twovalues that have the same expectation. Therefore, the expectation of the gradient is zero.The requirement of constant mean is reasonable in windows that contain a small number ofridge-valley transitions.
The longest axis v1 of the 2-dimensional joint probability density function is given bythe eigenvector of the autocovariance matrix that belongs to the largest eigenvalue λ1. Thisaxis corresponds to the direction in which the variance of the gradients is largest, and soto the ‘average’ gradient orientation. The ridge-valley orientations are perpendicular to thisaxis, and therefore given by the shortest axis v2. This is the direction of the eigenvector thatbelongs to the smallest eigenvalue λ2. The average ridge-valley orientation θ is given by:
θ = � v2 (2.16)
An expression for v2 is given in Appendix A.
The “strength” Str of the orientation can be defined as a simple function of the two eigen-values. In order to limit the strength between 0 and 1, it is defined by:
Str = λ1 − λ2
λ1 + λ2(2.17)
24 CHAPTER 2. DIRECTIONAL FIELD ESTIMATION
Again, if all gradients are pointing in the same direction, λ2 = 0 and Str = 1, while in caseof a uniform distribution over all angles, λ1 = λ2 and Str = 0.
Both methods appear to be exactly equivalent. In Appendix A a proof is given that theDF estimates are equal by showing that the gradient that is obtained by squared averaging isan eigenvector of autocovariance matrix C. In Appendix B, it is shown that the coherenceCoh, calculated using the squared gradient method (see Equation 2.13) and the strength Str(see Equation 2.17) are exactly equal as well. A similar result has been presented in [Big91].
2.3 Computational Aspects
For efficient calculation of the DF and the coherence in each pixel in the fingerprint image,one should not use either of the two basic methods. Instead, first Equations 2.7 to 2.9 areused for estimation of Gxx , G yy and Gxy , and subsequently Equations A.22 and B.5 areused for calculation of the DF and the coherence. If those are calculated for all pixels in theimage, the summations over W reduce to linear filter operations, which can be implementedvery efficiently. On a 500 MHz Pentium III computer, an efficient C++ implementation forcalculation of the DF and the coherence takes approximately 300 ms of processing time for afingerprint of 300 by 300 pixels.
For most DF-related tasks, a high resolution estimate that estimates the DF and coherencein each pixel is not needed. Instead, a simple block-directional field (BDF) with blocks offor instance 8 × 8 pixels provides sufficient spatial resolution. The classical way to estimatea BDF is to partition the image into blocks and estimate Gxx , G yy and Gxy as the average ofthe block. Sometimes, overlapping blocks are used for additional noise suppression.
However, this processing method causes artefacts and noise in the DF estimate, which inturn may create false singular points. This problem can be understood better by consideringit as a decimation (subsampling) problem, which is known from multi-rate signal processing[Pro92]. Averaging within a block with a uniform window W does not suppress the high-frequency noise that is present in the gradients sufficiently. This results in aliasing artefactsthe BDF estimate. There are two causes for the problem: the shape of the averaging filter isuniform and its length is equal to the decimation rate. This can be solved by decoupling thesize and the shape of the averaging filter W from the subsampling rate.
We propose the use of an alternative BDF calculation method that is based on the high-resolution DF. In each block, Gxx , G yy and Gxy are estimated by means of decimation ofthe high-resolution DF. Scale-space theory tells that averaging with a Gaussian window Wminimizes the amount of artefacts that are introduced by subsampling [Lin94]. This willimprove the quality of the DF and reduce the number of false singular points considerably.
From multi-rate signal processing, it is known that the filtering and decimation steps canbe implemented very efficiently using polyphase filters by interchanging the order of deci-mation and filtering [Pro92]. The computational complexity of the filtering step in variousDF estimation methods is summarized in Table 2.1. Using the optimal calculation scheme,which first separates the filter and then applies a polyphase implementation, the calculationof an 8 × 8 BDF is predicted to take only 10 ms on a 500 MHz Pentium III. Compared

2.4. EXPERIMENTAL RESULTS 25
Table 2.1: Complexity of the filtering step in DF estimation. The size of the fingerprint isN by M pixels, the decimation rate is d, the standard deviation of the Gaussian window is σ
and the region of support of the filter ranges from −nσ to nσ .Method ComplexityTraditional BDF N MNaive HR DF 4n2σ 2 N MSeparable HR DF 4nσ N MHR BDF (first polyphase, then separation) 4nσd−1 N MHR BDF (first separation, then polyphase) 2nσd−1 N M
to the traditional BDF estimation algorithm, the computational complexity increases with afactor 2nσ/d , where σ is the standard deviation of the Gaussian window, n is the numberof standard deviations that is used as support for the window, and d is the decimation rate.For the parameter values that we use (σ = 6, n = 3, and d = 8), the cost of the moreaccurate estimate is a factor 4.5 in computational complexity, independent of the size of thefingerprint.
2.4 Experimental Results
In this section, experiments are presented in which the previously derived results are appliedto a number of fingerprints. It will be shown that application of these methods enables theestimation of very accurate and high resolution DFs.
Since there exists no clear ground truth for the DF of fingerprints, objective error mea-sures cannot be constructed. Therefore, it is difficult to evaluate the quality of a DF estimatequantitatively. Alternatively, the quality of a DF estimate can be measured indirectly. This isdone in Chapter 3 by counting the number of false and missed singular points.
Most authors process fingerprints blockwise [Kar96, Jai97b]. This means that the direc-tional field is not calculated for all pixels individually. Instead, the average DF is calculated inblocks of, for instance, 16 by 16 pixels. In this section, the processing is carried out pixelwise,leading to a high resolution and accurate DF estimate.
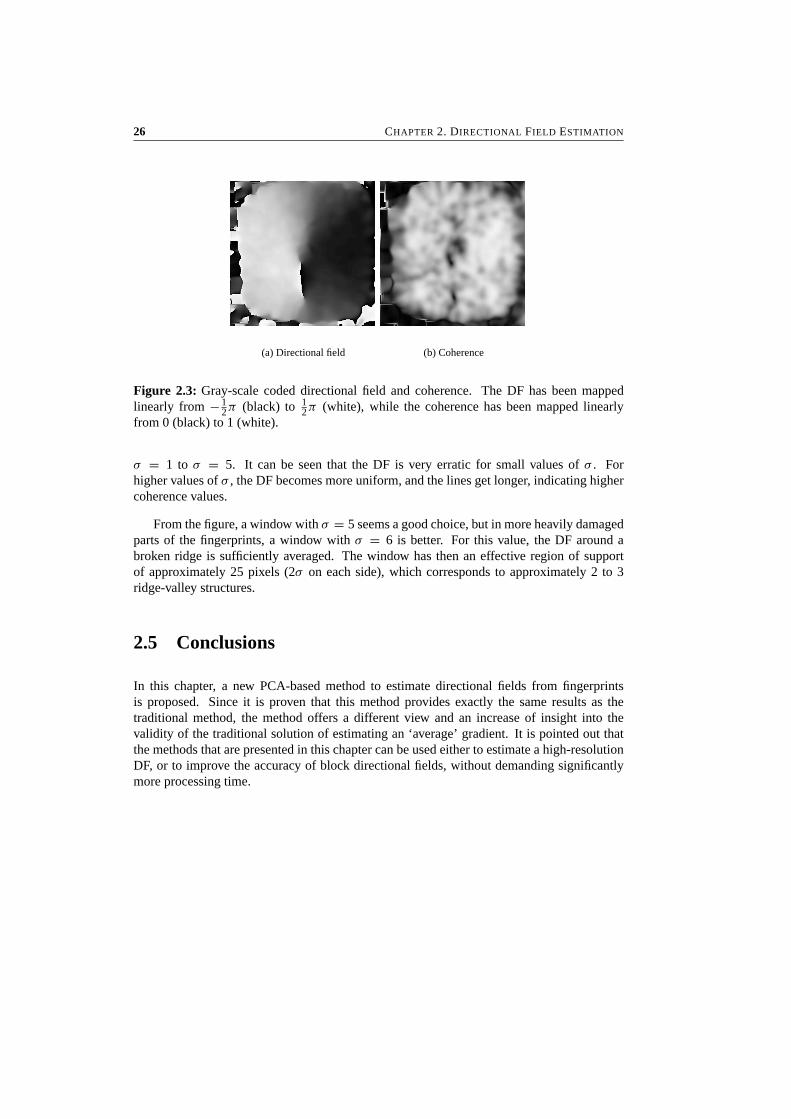
The first experiment considers the fingerprint of Figure 2.1. Although the DF is onlyshown at discrete steps in Figure 2.1(b), it is estimated for each pixel. This is illustrated inthe gray-scale coded Figure 2.3(a). In that figure, the angles in the range of −1
2π to 12π
have uniformly been mapped to the gray levels from black to white. The figure is somewhatchaotic at the borders, since those are areas that consist of noise. However, as shown inFigure 2.3(b), the coherence is very low in these noisy areas [Baz00a]. In this figure, blackindicates Coh = 0, while white indicates Coh = 1.
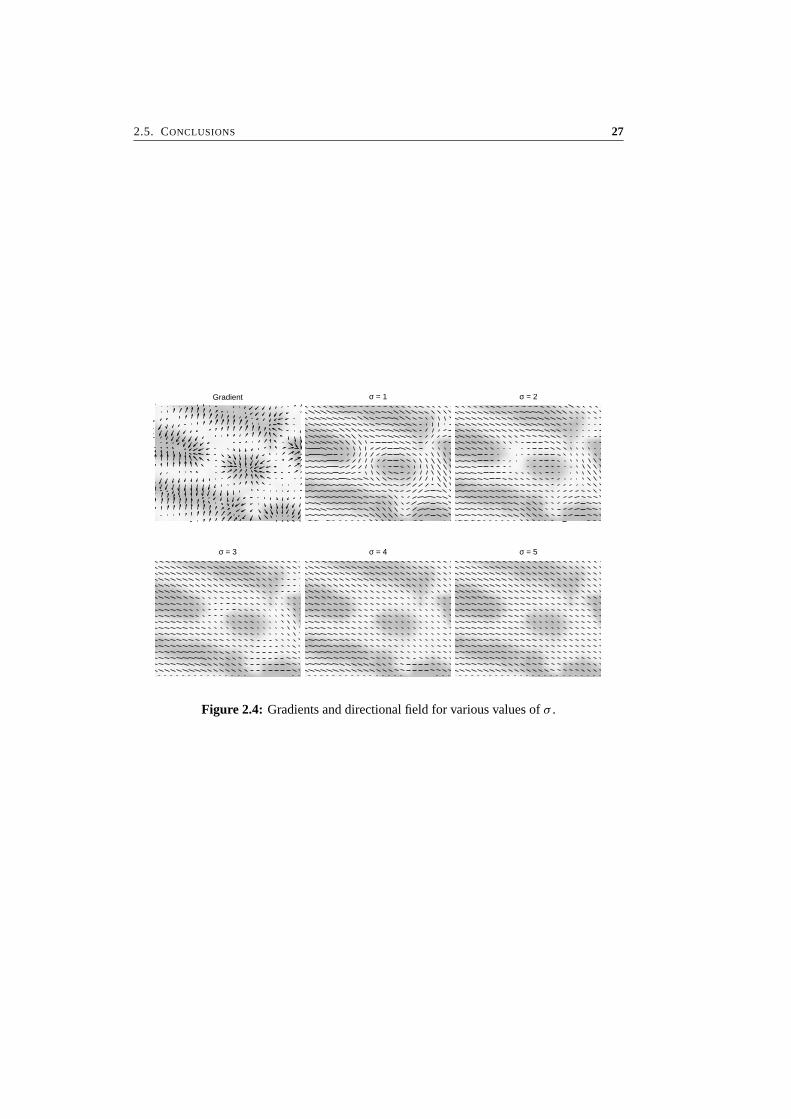
Next, an experiment is carried out to illustrate the effects of the choice of the window W .We have chosen a Gaussian window, in accordance with the scale-space theory [Lin94]. InFigure 2.4, the DF in a small segment of 25 × 20 pixels is shown. This segment containsa broken ridge that is almost horizontal. In this experiment, σ is chosen in the range from
26 CHAPTER 2. DIRECTIONAL FIELD ESTIMATION
(a) Directional field (b) Coherence
Figure 2.3: Gray-scale coded directional field and coherence. The DF has been mappedlinearly from − 1
2π (black) to 12π (white), while the coherence has been mapped linearly
from 0 (black) to 1 (white).
σ = 1 to σ = 5. It can be seen that the DF is very erratic for small values of σ . Forhigher values of σ , the DF becomes more uniform, and the lines get longer, indicating highercoherence values.
From the figure, a window with σ = 5 seems a good choice, but in more heavily damagedparts of the fingerprints, a window with σ = 6 is better. For this value, the DF around abroken ridge is sufficiently averaged. The window has then an effective region of supportof approximately 25 pixels (2σ on each side), which corresponds to approximately 2 to 3ridge-valley structures.
2.5 Conclusions
In this chapter, a new PCA-based method to estimate directional fields from fingerprintsis proposed. Since it is proven that this method provides exactly the same results as thetraditional method, the method offers a different view and an increase of insight into thevalidity of the traditional solution of estimating an ‘average’ gradient. It is pointed out thatthe methods that are presented in this chapter can be used either to estimate a high-resolutionDF, or to improve the accuracy of block directional fields, without demanding significantlymore processing time.
2.5. CONCLUSIONS 27
Gradient σ = 1 σ = 2
σ = 3 σ = 4 σ = 5
Figure 2.4: Gradients and directional field for various values of σ .


Chapter 3
Singular Point Extraction
Abstract
The subject of this chapter is singular point detection. An efficient algorithm is proposedthat extracts singular points from a high-resolution directional field. The algorithm is basedon the Poincare index and provides a consistent binary decision that is not based on post-processing steps like applying a threshold on a continuous resemblance measure for singularpoints. Furthermore, a method is presented to estimate the orientation of the extracted sin-gular points. The accuracy of the methods is illustrated by experiments on a live-scannedfingerprint database. Parts of this chapter have been published in [Baz01b] and [Baz02d].
30 CHAPTER 3. SINGULAR POINT EXTRACTION
(a) Fingerprint (b) Singular points
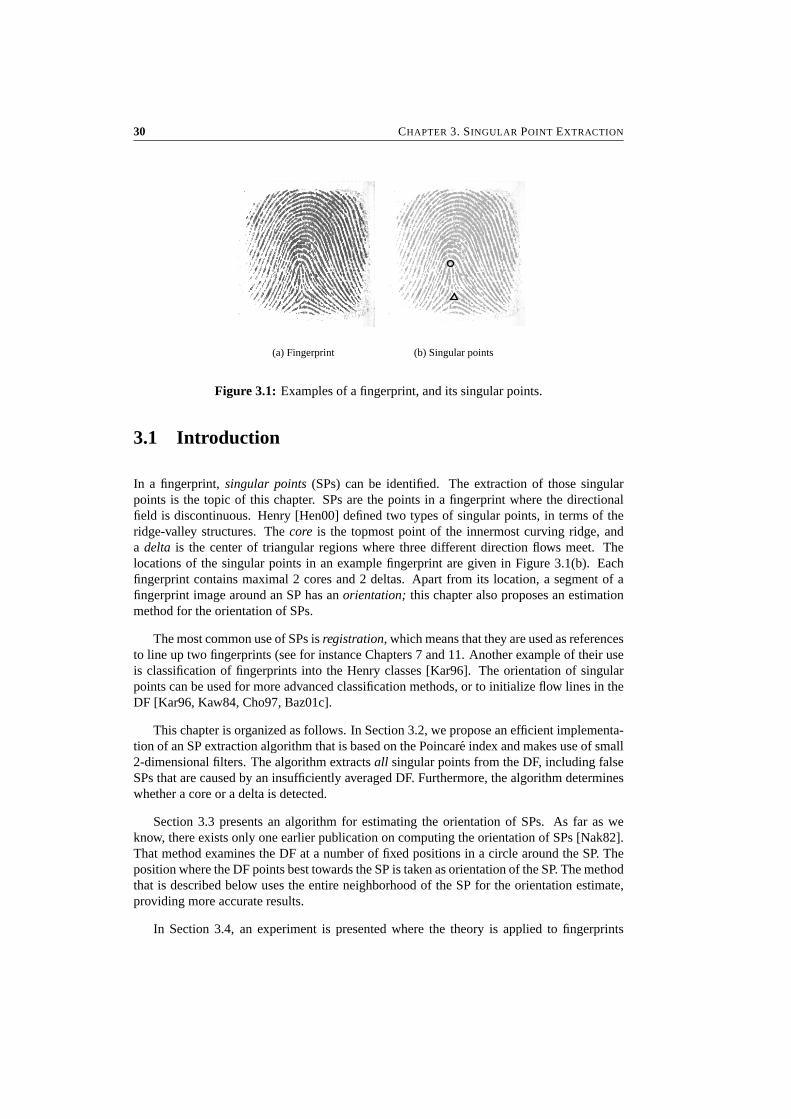
Figure 3.1: Examples of a fingerprint, and its singular points.
3.1 Introduction
In a fingerprint, singular points (SPs) can be identified. The extraction of those singularpoints is the topic of this chapter. SPs are the points in a fingerprint where the directionalfield is discontinuous. Henry [Hen00] defined two types of singular points, in terms of theridge-valley structures. The core is the topmost point of the innermost curving ridge, anda delta is the center of triangular regions where three different direction flows meet. Thelocations of the singular points in an example fingerprint are given in Figure 3.1(b). Eachfingerprint contains maximal 2 cores and 2 deltas. Apart from its location, a segment of afingerprint image around an SP has an orientation; this chapter also proposes an estimationmethod for the orientation of SPs.
The most common use of SPs is registration, which means that they are used as referencesto line up two fingerprints (see for instance Chapters 7 and 11. Another example of their useis classification of fingerprints into the Henry classes [Kar96]. The orientation of singularpoints can be used for more advanced classification methods, or to initialize flow lines in theDF [Kar96, Kaw84, Cho97, Baz01c].
This chapter is organized as follows. In Section 3.2, we propose an efficient implementa-tion of an SP extraction algorithm that is based on the Poincare index and makes use of small2-dimensional filters. The algorithm extracts all singular points from the DF, including falseSPs that are caused by an insufficiently averaged DF. Furthermore, the algorithm determineswhether a core or a delta is detected.
Section 3.3 presents an algorithm for estimating the orientation of SPs. As far as weknow, there exists only one earlier publication on computing the orientation of SPs [Nak82].That method examines the DF at a number of fixed positions in a circle around the SP. Theposition where the DF points best towards the SP is taken as orientation of the SP. The methodthat is described below uses the entire neighborhood of the SP for the orientation estimate,providing more accurate results.
In Section 3.4, an experiment is presented where the theory is applied to fingerprints
3.2. SINGULAR POINT EXTRACTION 31
120 130 140 150 160 170 180
145
150
155
160
165
170
175
180
185
190
195
200
(a) Core
130 140 150 160 170 180
215
220
225
230
235
240
245
250
255
260
265
270
(b) Delta
Figure 3.2: Segments of a fingerprint that contain a singular point.
contained in one of the databases used for the Fingerprint Verification Competition 2000[Mai00]. In that section, some practical aspects of the algorithms are discussed as well.
3.2 Singular Point Extraction
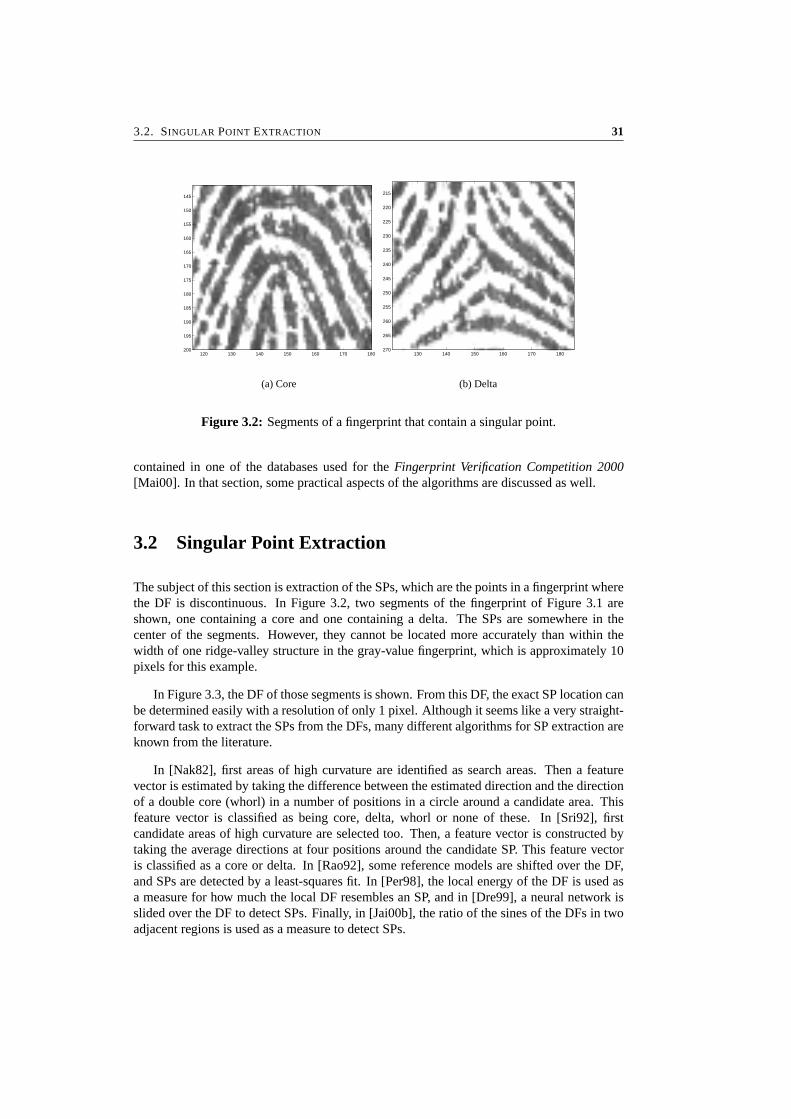
The subject of this section is extraction of the SPs, which are the points in a fingerprint wherethe DF is discontinuous. In Figure 3.2, two segments of the fingerprint of Figure 3.1 areshown, one containing a core and one containing a delta. The SPs are somewhere in thecenter of the segments. However, they cannot be located more accurately than within thewidth of one ridge-valley structure in the gray-value fingerprint, which is approximately 10pixels for this example.
In Figure 3.3, the DF of those segments is shown. From this DF, the exact SP location canbe determined easily with a resolution of only 1 pixel. Although it seems like a very straight-forward task to extract the SPs from the DFs, many different algorithms for SP extraction areknown from the literature.
In [Nak82], first areas of high curvature are identified as search areas. Then a featurevector is estimated by taking the difference between the estimated direction and the directionof a double core (whorl) in a number of positions in a circle around a candidate area. Thisfeature vector is classified as being core, delta, whorl or none of these. In [Sri92], firstcandidate areas of high curvature are selected too. Then, a feature vector is constructed bytaking the average directions at four positions around the candidate SP. This feature vectoris classified as a core or delta. In [Rao92], some reference models are shifted over the DF,and SPs are detected by a least-squares fit. In [Per98], the local energy of the DF is used asa measure for how much the local DF resembles an SP, and in [Dre99], a neural network isslided over the DF to detect SPs. Finally, in [Jai00b], the ratio of the sines of the DFs in twoadjacent regions is used as a measure to detect SPs.

32 CHAPTER 3. SINGULAR POINT EXTRACTION
140 145 150 155 160
162
164
166
168
170
172
174
176
178
180
(a) Core
145 150 155 160 165
232
234
236
238
240
242
244
246
248
250
(b) Delta
Figure 3.3: Directional fields.
These methods all provide somewhat unsatisfactory results, since they are not capableof consistently extracting the singular points. Instead of providing a Boolean output thatindicates whether an SP is present at some location or not, they produce a continuous outputthat indicates how much the local DF resembles an SP. Postprocessing steps, like thresholdsand heuristics, are necessary to interpret the outputs of the algorithms and to make the finaldecisions.
The method that is presented in this section is based on the Poincare index, which wasfirst introduced in fingerprint recognition by [Kaw84]. The Poincare index can be explainedusing the DFs that are depicted in Figure 3.3. Following a counter-clockwise closed contouraround a core in the DF and adding the differences between the subsequent angles results ina cumulative change in the orientation of π and carrying out this procedure around a deltaresults in −π . However, when applied to locations that do not contain an SP, the cumulativeorientation change will be zero.
Although the Poincare index provides the means for consistent detection of SPs, the ques-tion arises how to calculate this measure. Apart from the problem of how to calculate cumu-lative orientation changes over contours efficiently, a choice has to be made on the optimalsize and shape of the contour. A possible implementation is described in [Hon99]. That paperclaims that, in a fingerprint that is scanned at 500 dpi, a square curve with a length of 25 pix-els is optimal. A smaller curve results in spurious detections, while a larger curve may ignorecore-delta pairs which are close to each other. If the postprocessing step finds a connectedarea of more than 7 pixels in which the Poincare index is ≥ π , a core or delta is detected. Incase of an area that is larger than 20 connected pixels, 2 cores are detected.
In the implementation that is proposed in this chapter, choices of the size and shape of thecontour do not have to be made. Postprocessing steps are not necessary and the cumulativeorientation changes over contours are implemented efficiently in small 2-dimensional filters.The method computes for each individual pixel whether it is an SP, and is therefore capableof detecting SPs that are located only a few pixels apart. This property is especially usefulfor the extraction of SPs from block-directional fields (BDFs), which estimate one directionfor each n × n block. Special care has to be taken that high-resolution DFs are sufficiently

3.2. SINGULAR POINT EXTRACTION 33
140 145 150 155 160
162
164
166
168
170
172
174
176
178
180
(a) Core
145 150 155 160 165
232
234
236
238
240
242
244
246
248
250
(b) Delta
Figure 3.4: Squared directional fields.
averaged such that spurious SPs are eliminated beforehand, as the SP-extraction algorithmwill detect all SPs present in the DF of a given resolution.
The algorithm first takes the squared directional field (SDF). This eliminates the step ofπ which is encountered in the DF between the orientations θ = 1
2π and θ = − 12π . Then, the
Poincare indexes is equal to 2π for a core, −2π for a delta and 0 an area without any SP. Theorientation of the SDF, denoted by 2θ , is depicted in Figure 3.4 for the areas around SPs.
Summing the changes in orientation corresponds to summing the gradients of the squaredorientation. The gradient vector J can be efficiently precalculated for the entire image by:
[Jx (x, y)
Jy(x, y)
]= ∇2θ(x, y) =
[∂2θ(x,y)
∂x∂2θ(x,y)
∂y
](3.1)
In the calculation of the discrete version of this gradient, both components of J should becalculated ‘modulo 2π ’, such that they are always between −π and π . This makes the tran-sition from 2θ = −π to 2θ = π continuous or, in other words, the orientation is consideredto be cyclic. The gradient vectors of the squared orientation around both singular points areshown in Figure 3.5.
The next step is the application of Green’s Theorem, which states that a closed line-integral over a vector field can be calculated as the surface integral over the rotation of thisvector field:
∮∂ A
wx dx + wydy =∫∫
Arot[wx wy]T dxdy =
∫∫A
(∂wy
∂x− ∂wx
∂y
)dxdy (3.2)
where x and y define the coordinate system, A is the area, ∂ A is the contour around this areaand [wx wy]T is the vector field. This theorem is discretized in order to applied it to thesummation of the gradients of the squared orientation over the contour:
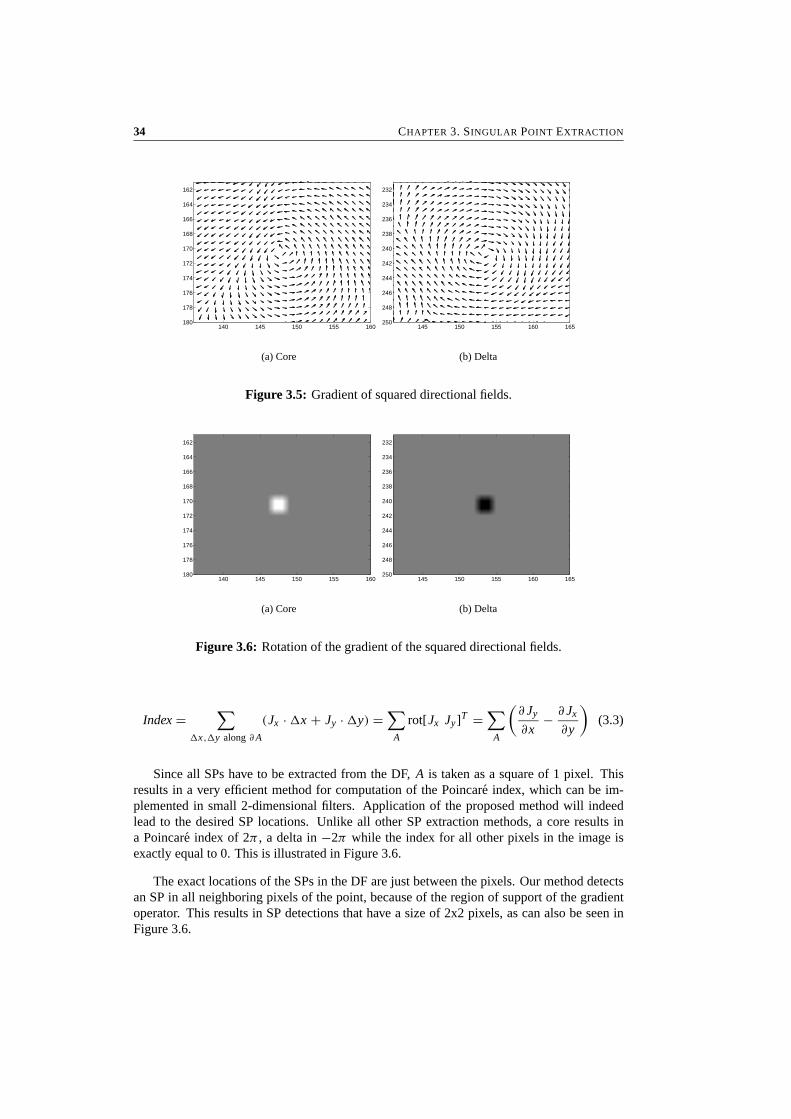
34 CHAPTER 3. SINGULAR POINT EXTRACTION
140 145 150 155 160
162
164
166
168
170
172
174
176
178
180
(a) Core
145 150 155 160 165
232
234
236
238
240
242
244
246
248
250
(b) Delta
Figure 3.5: Gradient of squared directional fields.
140 145 150 155 160
162
164
166
168
170
172
174
176
178
180
(a) Core
145 150 155 160 165
232
234
236
238
240
242
244
246
248
250
(b) Delta
Figure 3.6: Rotation of the gradient of the squared directional fields.
Index =∑
x,y along ∂ A
(Jx · x + Jy · y) =∑
A
rot[Jx Jy]T =∑
A
(∂ Jy
∂x− ∂ Jx
∂y
)(3.3)
Since all SPs have to be extracted from the DF, A is taken as a square of 1 pixel. Thisresults in a very efficient method for computation of the Poincare index, which can be im-plemented in small 2-dimensional filters. Application of the proposed method will indeedlead to the desired SP locations. Unlike all other SP extraction methods, a core results ina Poincare index of 2π , a delta in −2π while the index for all other pixels in the image isexactly equal to 0. This is illustrated in Figure 3.6.
The exact locations of the SPs in the DF are just between the pixels. Our method detectsan SP in all neighboring pixels of the point, because of the region of support of the gradientoperator. This results in SP detections that have a size of 2x2 pixels, as can also be seen inFigure 3.6.

3.3. ORIENTATION OF SINGULAR POINTS 35
140 145 150 155 160
162
164
166
168
170
172
174
176
178
180
(a) Core
145 150 155 160 165
232
234
236
238
240
242
244
246
248
250
(b) Delta
Figure 3.7: Reference models of singular points.
3.3 Orientation of Singular Points
The second subject of this chapter is the estimation of the orientations ϕ of the segmentsaround the extracted SPs. This is the angle over which an image of an SP has been rotatedfrom a standard upright orientation. The method that is described here, makes use of thesquared gradient vectors in the neighborhood of an SP, both for the image to be analyzed andfor a reference SP. First, reference models of the DFs around standard cores and deltas areconstructed. For a core at (x, y) = (0, 0), the reference model that describes the SDF is givenby:
SDFcore,ref = (y,−x)√x2 + y2
(3.4)
and for a delta at (x, y) = (0, 0), it is given by:
SDFdelta,ref = (−y,−x)√x2 + y2
(3.5)
Note that |SDFcore,ref| = |SDFdelta,ref| = 1 for all (x, y). The DFs that are associated withthese SDF models are shown in Figure 3.7.
The SDF in the neighborhood of a core, repeated in Figure 3.8(a), ideally looks like thereference model in Figure 3.8(b). The usefulness of the squared gradients is caused by thefact that, when the gray-scale image rotates around the core, all components of the SDFrotate over the same angle, as shown in Appendix C. Therefore, using the complex notationfor a two-element vector, the model of a core that has rotated over an angle ϕ, is given by areference model with all its components multiplied by e jϕ .
SDFcore,ϕ = SDFcore,ref · e jϕ (3.6)
36 CHAPTER 3. SINGULAR POINT EXTRACTION
140 145 150 155 160
162
164
166
168
170
172
174
176
178
180
(a) SDF around core
140 145 150 155 160
162
164
166
168
170
172
174
176
178
180
(b) SDF around reference core
140 145 150 155 160
162
164
166
168
170
172
174
176
178
180
(c) Orientation estimate
Figure 3.8: Processing steps in the calculation of the orientation of a core.
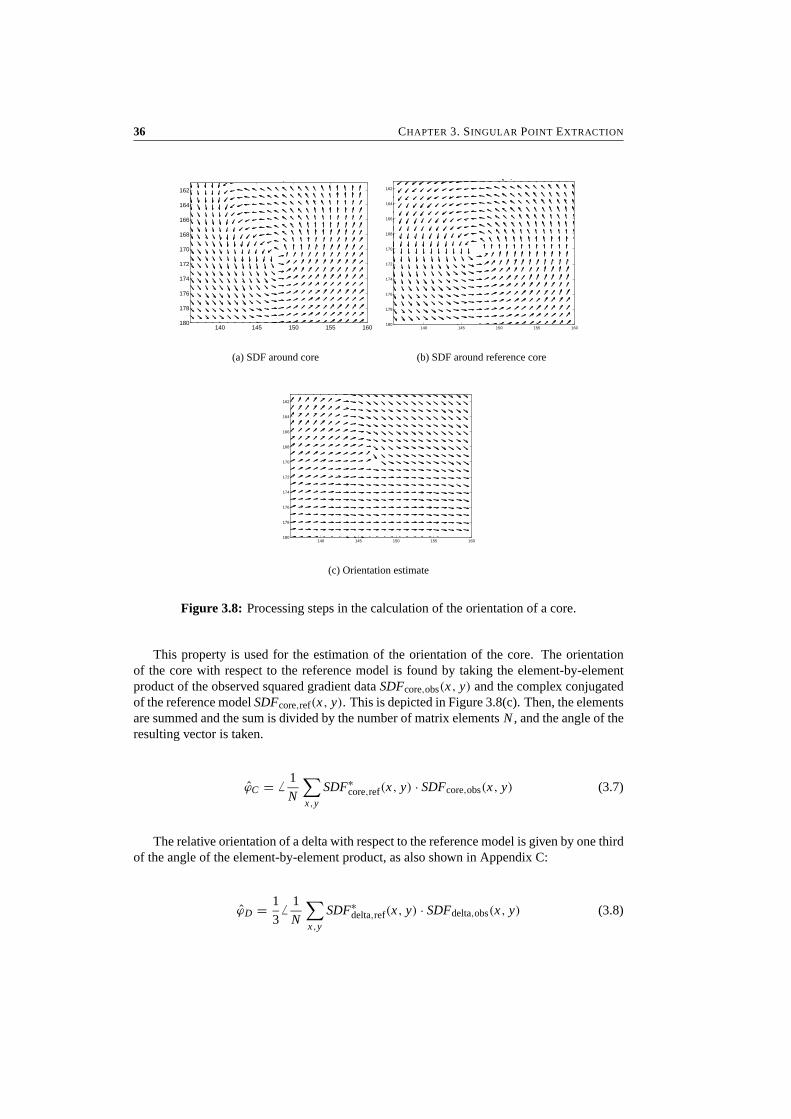
This property is used for the estimation of the orientation of the core. The orientationof the core with respect to the reference model is found by taking the element-by-elementproduct of the observed squared gradient data SDFcore,obs(x, y) and the complex conjugatedof the reference model SDFcore,ref(x, y). This is depicted in Figure 3.8(c). Then, the elementsare summed and the sum is divided by the number of matrix elements N , and the angle of theresulting vector is taken.
ϕC = � 1
N
∑x,y
SDF∗core,ref(x, y) · SDFcore,obs(x, y) (3.7)
The relative orientation of a delta with respect to the reference model is given by one thirdof the angle of the element-by-element product, as also shown in Appendix C:
ϕD = 1
3� 1
N
∑x,y
SDF∗delta,ref(x, y) · SDFdelta,obs(x, y) (3.8)

3.4. EXPERIMENTAL RESULTS 37
The averaging operator provides an accurate and unbiased estimate for the orientations ϕC
and ϕD . If the observed core is exactly a rotated version of the reference core, the orientationestimate gives:
ϕC = � 1
N
∑x,y
SDF∗core,ref(x, y) · SDFcore,ref(x, y) · e jϕ
= � 1
N
∑x,y
∣∣SDFcore,ref(x, y)∣∣2 · e jϕ (3.9)
= � e jϕ = ϕ
When applying the orientation estimate to the core of Figure 3.2, it is found to be rotated4 degrees clockwise with respect to the reference core of Figure 3.7, while the delta of Fig-ure 3.2 is found to be rotated 8 degrees counter-clockwise with respect to the reference deltaof Figure 3.7. This corresponds to the estimates that were made by visual inspection.
3.4 Experimental Results
In this section, experiments are presented in which the previously derived results are appliedto a large number of fingerprints. It will be shown that application of these methods enablesthe estimation of very accurate and high resolution DFs, accurate SP locations and correctorientations of the singular points.
We have run our experiments on the second database of the FVC2000 contest [Mai00].This database contains fingerprint images that are captured by a capacitive sensor with aresolution of 500 pixels per inch. This means that two adjacent ridges are located 8 to 12pixels apart. In this database, 110 untrained individuals are enrolled, each with 8 prints of thesame finger.
The proposed algorithm makes use of small 2-dimensional filters. Because of the efficientalgorithm, extraction of the SPs from a 300×300 DF takes 150 ms on a 500 MHz Pentium IIImachine. It is expected to take less than 5 ms to extract the SPs from a 8 × 8 BDF of afingerprint of 300 × 300 pixels.
In Section 3.4.1, the number of false SPs is used as a measure for the quality of a DFestimate. Then, Section 3.4.2 presents experimental results on the orientation estimation ofthe SPs.
3.4.1 Singular Point Extraction
In Section 3.2, it has been shown that the SP extraction method correctly extracts SPs fromthe smooth DF of Figure 3.3. This was also illustrated in Figure 3.1(b) for the fingerprint ofFigure 3.1(a). In this section, the question will be answered how well the method performson a larger set of DFs that are estimated from real fingerprints.
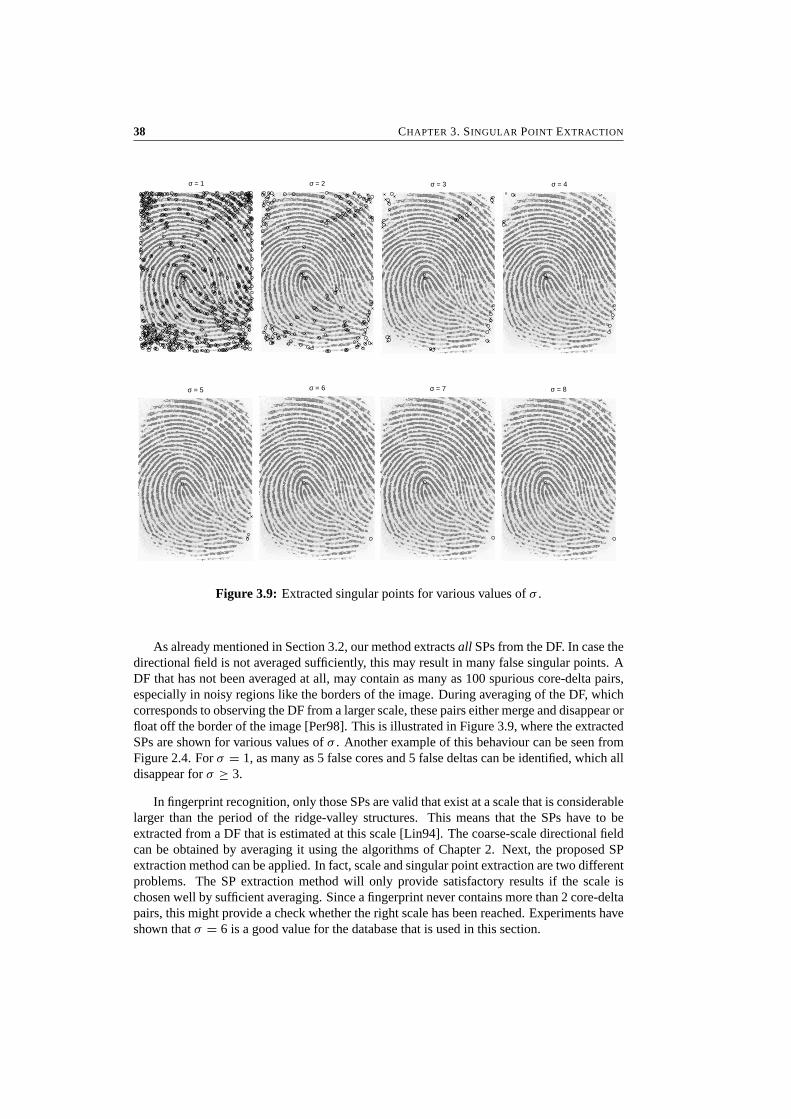
38 CHAPTER 3. SINGULAR POINT EXTRACTION
σ = 1 σ = 2 σ = 3 σ = 4
σ = 5 σ = 6 σ = 7 σ = 8
Figure 3.9: Extracted singular points for various values of σ .
As already mentioned in Section 3.2, our method extracts all SPs from the DF. In case thedirectional field is not averaged sufficiently, this may result in many false singular points. ADF that has not been averaged at all, may contain as many as 100 spurious core-delta pairs,especially in noisy regions like the borders of the image. During averaging of the DF, whichcorresponds to observing the DF from a larger scale, these pairs either merge and disappear orfloat off the border of the image [Per98]. This is illustrated in Figure 3.9, where the extractedSPs are shown for various values of σ . Another example of this behaviour can be seen fromFigure 2.4. For σ = 1, as many as 5 false cores and 5 false deltas can be identified, which alldisappear for σ ≥ 3.
In fingerprint recognition, only those SPs are valid that exist at a scale that is considerablelarger than the period of the ridge-valley structures. This means that the SPs have to beextracted from a DF that is estimated at this scale [Lin94]. The coarse-scale directional fieldcan be obtained by averaging it using the algorithms of Chapter 2. Next, the proposed SPextraction method can be applied. In fact, scale and singular point extraction are two differentproblems. The SP extraction method will only provide satisfactory results if the scale ischosen well by sufficient averaging. Since a fingerprint never contains more than 2 core-deltapairs, this might provide a check whether the right scale has been reached. Experiments haveshown that σ = 6 is a good value for the database that is used in this section.
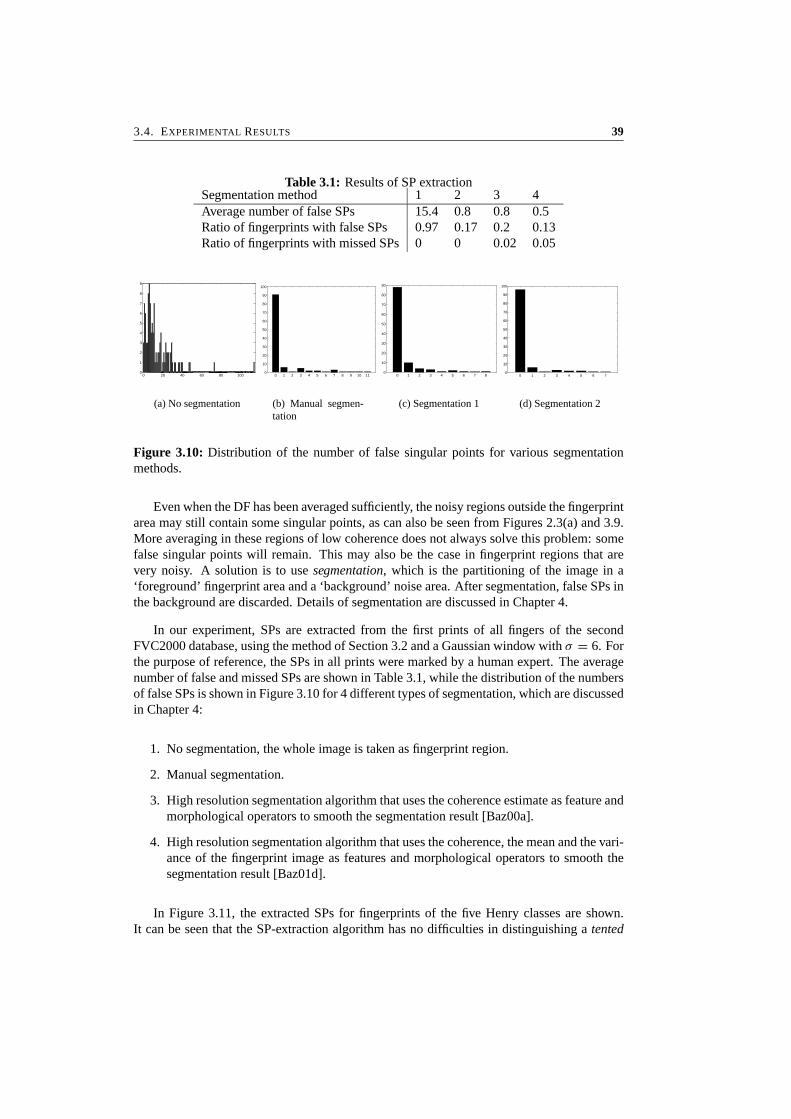
3.4. EXPERIMENTAL RESULTS 39
Table 3.1: Results of SP extractionSegmentation method 1 2 3 4Average number of false SPs 15.4 0.8 0.8 0.5Ratio of fingerprints with false SPs 0.97 0.17 0.2 0.13Ratio of fingerprints with missed SPs 0 0 0.02 0.05
0 20 40 60 80 1000
1
2
3
4
5
6
7
8
9
(a) No segmentation
0 1 2 3 4 5 6 7 8 9 10 110
10
20
30
40
50
60
70
80
90
100
(b) Manual segmen-tation
0 1 2 3 4 5 6 7 80
10
20
30
40
50
60
70
80
90
(c) Segmentation 1
0 1 2 3 4 5 6 70
10
20
30
40
50
60
70
80
90
100
(d) Segmentation 2
Figure 3.10: Distribution of the number of false singular points for various segmentationmethods.
Even when the DF has been averaged sufficiently, the noisy regions outside the fingerprintarea may still contain some singular points, as can also be seen from Figures 2.3(a) and 3.9.More averaging in these regions of low coherence does not always solve this problem: somefalse singular points will remain. This may also be the case in fingerprint regions that arevery noisy. A solution is to use segmentation, which is the partitioning of the image in a‘foreground’ fingerprint area and a ‘background’ noise area. After segmentation, false SPs inthe background are discarded. Details of segmentation are discussed in Chapter 4.
In our experiment, SPs are extracted from the first prints of all fingers of the secondFVC2000 database, using the method of Section 3.2 and a Gaussian window with σ = 6. Forthe purpose of reference, the SPs in all prints were marked by a human expert. The averagenumber of false and missed SPs are shown in Table 3.1, while the distribution of the numbersof false SPs is shown in Figure 3.10 for 4 different types of segmentation, which are discussedin Chapter 4:
1. No segmentation, the whole image is taken as fingerprint region.
2. Manual segmentation.
3. High resolution segmentation algorithm that uses the coherence estimate as feature andmorphological operators to smooth the segmentation result [Baz00a].
4. High resolution segmentation algorithm that uses the coherence, the mean and the vari-ance of the fingerprint image as features and morphological operators to smooth thesegmentation result [Baz01d].
In Figure 3.11, the extracted SPs for fingerprints of the five Henry classes are shown.It can be seen that the SP-extraction algorithm has no difficulties in distinguishing a tented
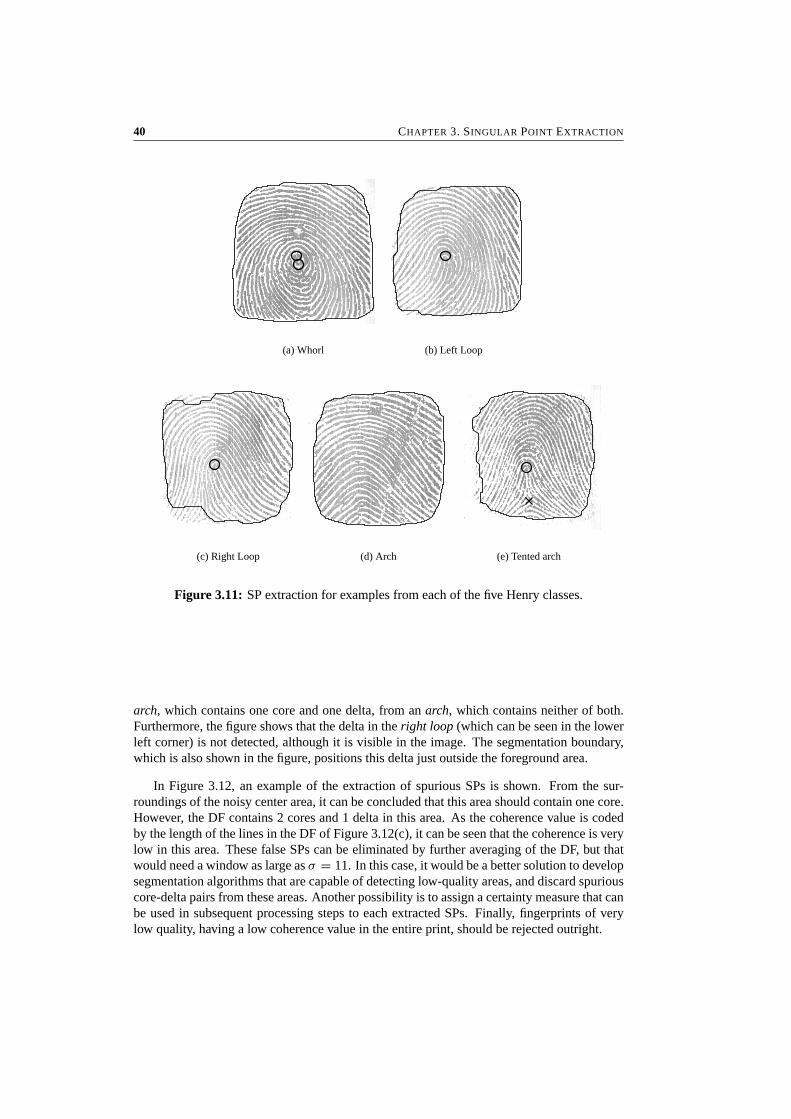
40 CHAPTER 3. SINGULAR POINT EXTRACTION
(a) Whorl (b) Left Loop
(c) Right Loop (d) Arch (e) Tented arch
Figure 3.11: SP extraction for examples from each of the five Henry classes.
arch, which contains one core and one delta, from an arch, which contains neither of both.Furthermore, the figure shows that the delta in the right loop (which can be seen in the lowerleft corner) is not detected, although it is visible in the image. The segmentation boundary,which is also shown in the figure, positions this delta just outside the foreground area.
In Figure 3.12, an example of the extraction of spurious SPs is shown. From the sur-roundings of the noisy center area, it can be concluded that this area should contain one core.However, the DF contains 2 cores and 1 delta in this area. As the coherence value is codedby the length of the lines in the DF of Figure 3.12(c), it can be seen that the coherence is verylow in this area. These false SPs can be eliminated by further averaging of the DF, but thatwould need a window as large as σ = 11. In this case, it would be a better solution to developsegmentation algorithms that are capable of detecting low-quality areas, and discard spuriouscore-delta pairs from these areas. Another possibility is to assign a certainty measure that canbe used in subsequent processing steps to each extracted SPs. Finally, fingerprints of verylow quality, having a low coherence value in the entire print, should be rejected outright.
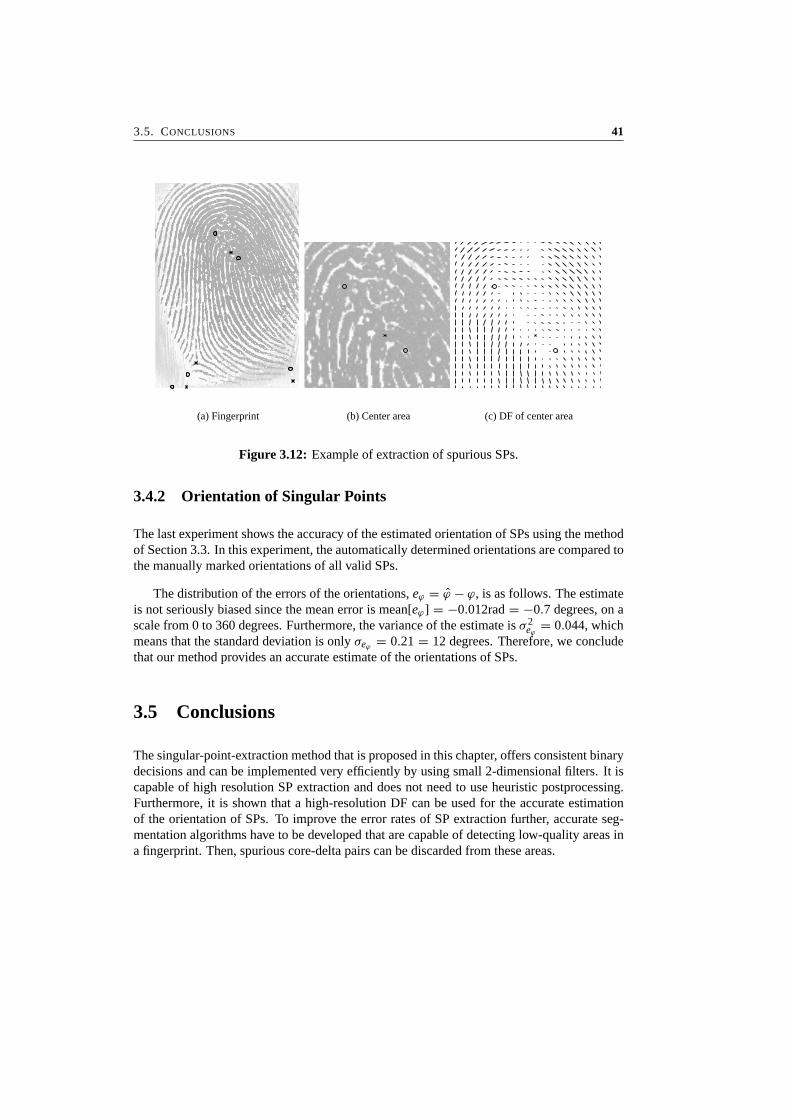
3.5. CONCLUSIONS 41
(a) Fingerprint (b) Center area (c) DF of center area
Figure 3.12: Example of extraction of spurious SPs.
3.4.2 Orientation of Singular Points
The last experiment shows the accuracy of the estimated orientation of SPs using the methodof Section 3.3. In this experiment, the automatically determined orientations are compared tothe manually marked orientations of all valid SPs.
The distribution of the errors of the orientations, eϕ = ϕ − ϕ, is as follows. The estimateis not seriously biased since the mean error is mean[eϕ] = −0.012rad = −0.7 degrees, on ascale from 0 to 360 degrees. Furthermore, the variance of the estimate is σ 2
eϕ= 0.044, which
means that the standard deviation is only σeϕ = 0.21 = 12 degrees. Therefore, we concludethat our method provides an accurate estimate of the orientations of SPs.
3.5 Conclusions
The singular-point-extraction method that is proposed in this chapter, offers consistent binarydecisions and can be implemented very efficiently by using small 2-dimensional filters. It iscapable of high resolution SP extraction and does not need to use heuristic postprocessing.Furthermore, it is shown that a high-resolution DF can be used for the accurate estimationof the orientation of SPs. To improve the error rates of SP extraction further, accurate seg-mentation algorithms have to be developed that are capable of detecting low-quality areas ina fingerprint. Then, spurious core-delta pairs can be discarded from these areas.

Chapter 4
Segmentation of FingerprintImages
Abstract
An important step in automatic fingerprint recognition is the segmentation of fingerprint im-ages. The task of a fingerprint segmentation algorithm is to decide which part of the imagebelongs to the foreground, originating from the contact of a fingertip with the sensor andused for further processing, and which part to the background, which is the noisy area at theborders of the image.
In this chapter, two algorithms for the segmentation of fingerprints are proposed. Thefirst method uses three pixel features, being the coherence, the mean and the variance. Anoptimal linear classifier has been trained for the classification per pixel into foreground orbackground, while morphology has been applied as postprocessing to obtain compact clus-ters and to reduce the number of classification errors. The second method uses the Gaborresponse as additional feature, a third class for low quality regions, and hidden Markov mod-els (HMMs) for context-dependent classification.
Human inspection has shown that the proposed methods provide accurate segmentationresults. The first method misclassifies 7% of the pixels while the postprocessing furtherprovides compact region estimates. The second method misclassifies 10% of the blocks, butneeds no postprocessing. Experiments have shown that the proposed segmentation methodsand manual segmentation perform equally well in rejecting false fingerprint features from thenoisy background. Parts of this chapter have been published in [Baz01d] and [Kle02].

44 CHAPTER 4. SEGMENTATION OF FINGERPRINT IMAGES
4.1 Introduction
An important step in an automatic fingerprint recognition system is the segmentation of fin-gerprint images. Segmentation is the decomposition of an image into its components. Acaptured fingerprint image usually consists of two components, which are called the fore-ground and the background. The foreground is the component that originated from the con-tact of a fingertip with the sensor. The noisy area at the borders of the image is called thebackground. Some segmentation algorithms also define some part of the foreground as lowquality area. The task of the fingerprint segmentation algorithm is to decide which part ofthe image belongs to the foreground, which part to the background, and which part is a lowquality area.
Accurate segmentation is especially important for the reliable extraction of features likeminutiae and singular points. Most feature extraction algorithms extract many false featureswhen applied to the noisy background or low quality area. Therefore, the main goal of thesegmentation algorithm is to discard the background and low quality areas, and thus reducethe number of false features.
Several approaches to fingerprint image segmentation are known from literature. In[Meh87], the fingerprint is partitioned in blocks of 16 × 16 pixels. Then, each block isclassified according to the distribution of the gradients in that block. In [Meh89], this methodis extended by excluding blocks with a gray-scale variance that is lower than some threshold.In [Rat95] the gray-scale variance in the direction orthogonal to the orientation of the ridgesis used to classify each 16×16 block. In [Jai97c], the output of a set of Gabor filters is used asinput to a clustering algorithm that constructs spatially compact clusters. In this chapter, fin-gerprint images are segmented based on multiple features, using two different classificationmethods.
This chapter is organized as follows. First, Section 4.2 discusses pixel feature extraction,which is the basis of our segmentation algorithms. Next, Section 4.3 presents a direct pixelfeature classifier that is equipped with post-processing methods for the reduction of classifi-cation errors. Finally, Section 4.4 presents a segmentation algorithm that is based on hiddenMarkov models.
4.2 Feature Extraction
The first step in the development of an algorithm for fingerprint image segmentation is theselection of useful pixel or block features. Note that the term ‘feature’ is used here to refer toproperties of individual pixels whereas it was used earlier to refer to properties of the entire(foreground) image (such as the list of minutiae locations). In the rest of this chapter, thecorrect meaning of ‘feature’ should become clear from the context. For each pixel or block inthe fingerprint image, the pixel features are extracted, and each block is classified accordingto the extracted feature values.
From many alternatives, we have selected four features that contain useful informationfor segmentation. These features are the coherence, the local mean, the local variance or

4.2. FEATURE EXTRACTION 45
standard deviation, and the Gabor response of the fingerprint image. Instead of using pureblock-wise processing, the smoothing window that is used for noise reduction and the blocksize are decoupled as explained in Section 2.3. For noise reduction, the features are aver-aged by a Gaussian window W with σ = 6, providing a combination of both localized andsmoothly changing features.
1. The coherence gives a measure how well the gradients are pointing in the same di-rection. Since a fingerprint mainly consists of parallel line structures, the coherencewill be considerably higher in the foreground than in the background. In a window Waround a pixel, the coherence is defined as:
Coh =∣∣∑
W (Gs,x , Gs,y)∣∣∑
W
∣∣(Gs,x , Gs,y)∣∣ =
√(Gxx − G yy)2 + 4G2
xy
Gxx + G yy(4.1)
where (Gs,x , Gs,y) is the squared gradient, Gxx = ∑W G2
x , G yy = ∑W G2
y , Gxy =∑W Gx G y and (Gx , G y) is the local gradient. More information on the coherence can
be found in Section 2.2.
2. The average gray value is the second pixel feature that is useful for the segmentationof fingerprint images. For most fingerprint sensors, the ridge-valley structures can beapproximated by black and white lines, while the background, where the finger doesnot touch the sensor, is rather white. This means that the mean gray value in theforeground is in general lower, i.e. darker gray, than it is in the background. Using I asthe intensity of the image, the local mean for each pixel is given by:
Mean =∑W
I (4.2)
3. The variance or standard deviation is the third pixel feature that can be used. In general,the variance of the ridge-valley structures in the foreground is higher than the varianceof the noise in the background. The variance is for each pixel given by:
Var =∑W
(I − Mean)2 (4.3)
and the standard deviation by
Std = √Var (4.4)
4. The Gabor response is the smoothed sum of the absolute values of the fingerprint im-ages that have been filtered by the complex Gabor filter, as discussed in Appendix D.It can be interpreted as the local standard deviation of the fingerprint image after en-hancement. Therefore, the Gabor response is expected to be higher in the foregroundregion.
The characteristics of these features in a fingerprint of high quality are shown in Fig-ure 4.1, while the features in a fingerprint with a low quality region are shown in Figure 4.2.
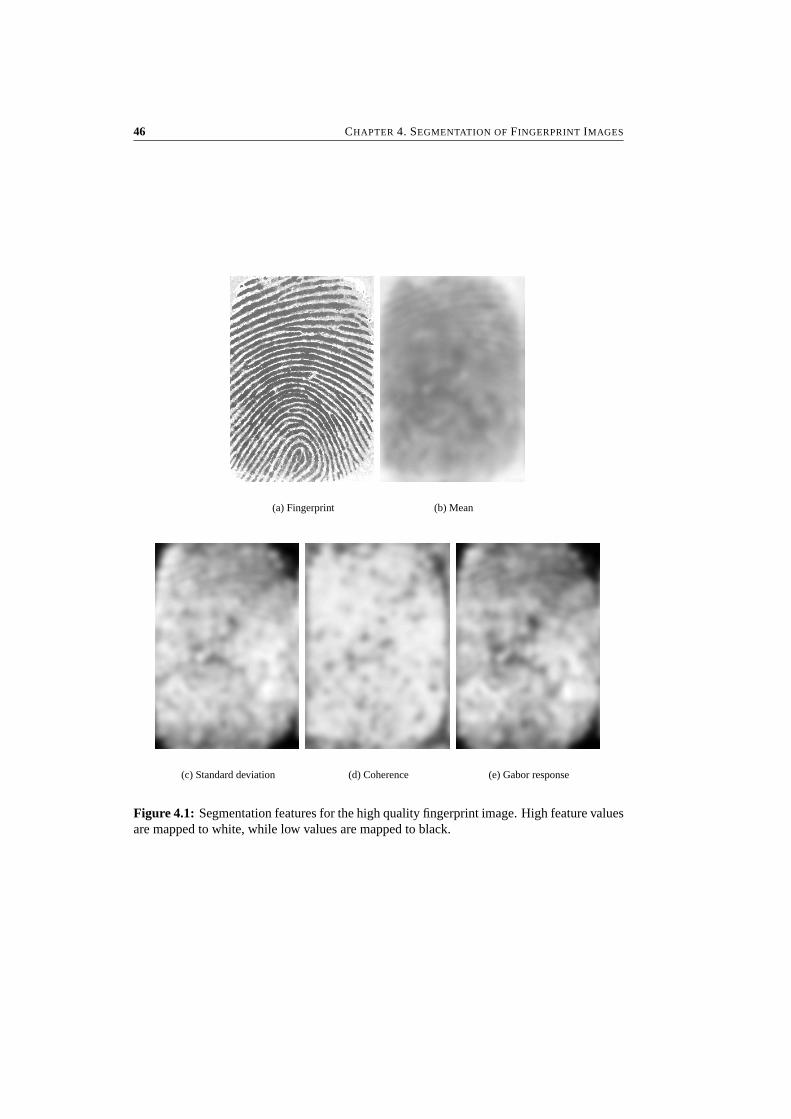
46 CHAPTER 4. SEGMENTATION OF FINGERPRINT IMAGES
(a) Fingerprint (b) Mean
(c) Standard deviation (d) Coherence (e) Gabor response
Figure 4.1: Segmentation features for the high quality fingerprint image. High feature valuesare mapped to white, while low values are mapped to black.
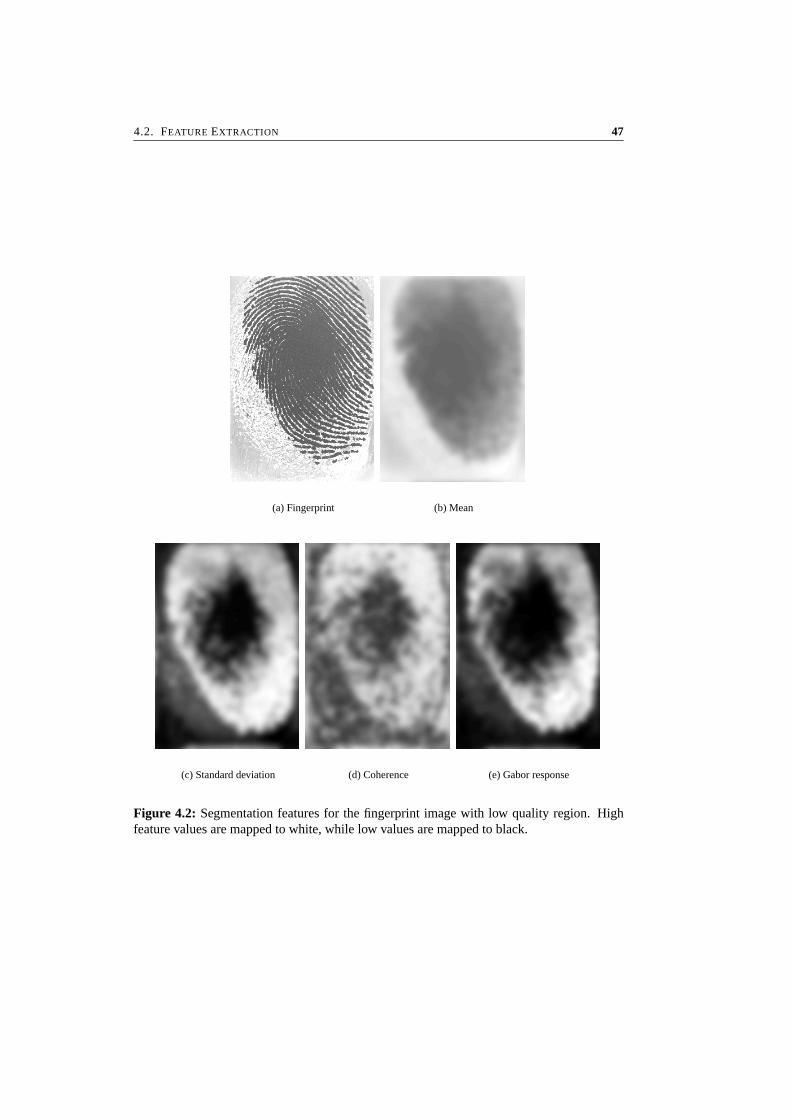
4.2. FEATURE EXTRACTION 47
(a) Fingerprint (b) Mean
(c) Standard deviation (d) Coherence (e) Gabor response
Figure 4.2: Segmentation features for the fingerprint image with low quality region. Highfeature values are mapped to white, while low values are mapped to black.
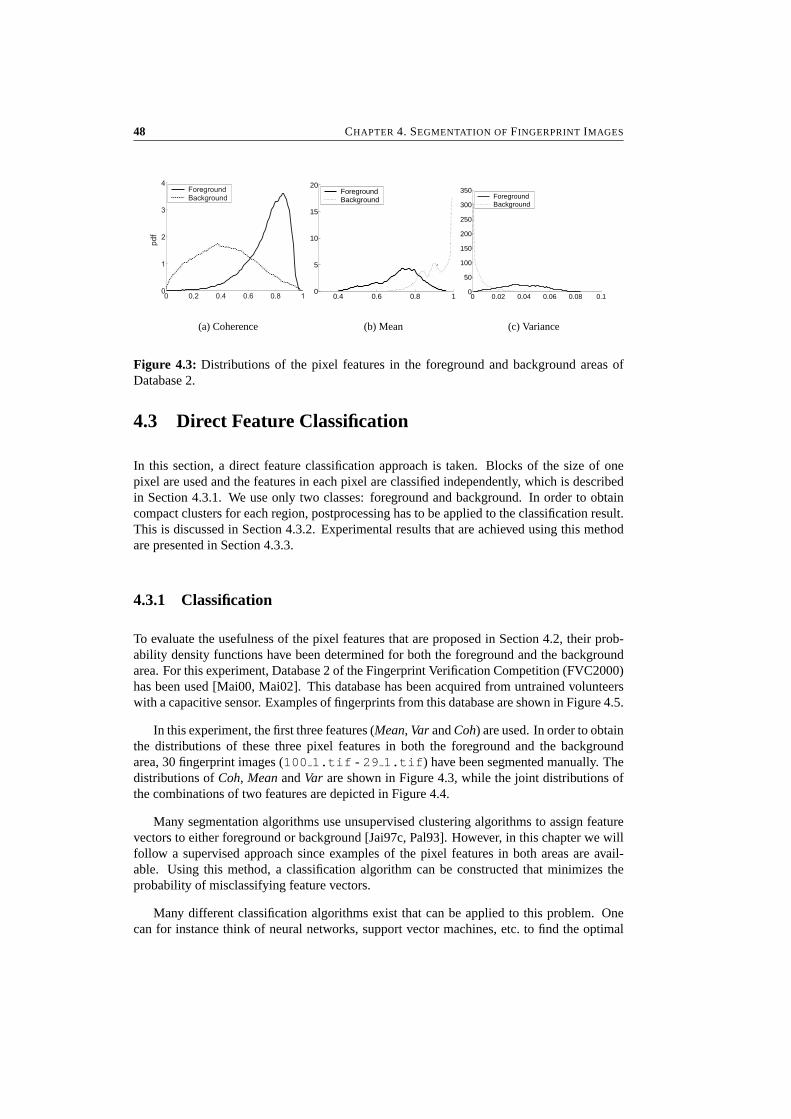
48 CHAPTER 4. SEGMENTATION OF FINGERPRINT IMAGES
(a) Coherence
0.4 0.6 0.8 10
5
10
15
20ForegroundBackground
(b) Mean
0 0.02 0.04 0.06 0.08 0.10
50
100
150
200
250
300
350ForegroundBackground
(c) Variance
Figure 4.3: Distributions of the pixel features in the foreground and background areas ofDatabase 2.
4.3 Direct Feature Classification
In this section, a direct feature classification approach is taken. Blocks of the size of onepixel are used and the features in each pixel are classified independently, which is describedin Section 4.3.1. We use only two classes: foreground and background. In order to obtaincompact clusters for each region, postprocessing has to be applied to the classification result.This is discussed in Section 4.3.2. Experimental results that are achieved using this methodare presented in Section 4.3.3.
4.3.1 Classification
To evaluate the usefulness of the pixel features that are proposed in Section 4.2, their prob-ability density functions have been determined for both the foreground and the backgroundarea. For this experiment, Database 2 of the Fingerprint Verification Competition (FVC2000)has been used [Mai00, Mai02]. This database has been acquired from untrained volunteerswith a capacitive sensor. Examples of fingerprints from this database are shown in Figure 4.5.
In this experiment, the first three features (Mean, Var and Coh) are used. In order to obtainthe distributions of these three pixel features in both the foreground and the backgroundarea, 30 fingerprint images (100 1.tif - 29 1.tif) have been segmented manually. Thedistributions of Coh, Mean and Var are shown in Figure 4.3, while the joint distributions ofthe combinations of two features are depicted in Figure 4.4.
Many segmentation algorithms use unsupervised clustering algorithms to assign featurevectors to either foreground or background [Jai97c, Pal93]. However, in this chapter we willfollow a supervised approach since examples of the pixel features in both areas are avail-able. Using this method, a classification algorithm can be constructed that minimizes theprobability of misclassifying feature vectors.
Many different classification algorithms exist that can be applied to this problem. Onecan for instance think of neural networks, support vector machines, etc. to find the optimal

4.3. DIRECT FEATURE CLASSIFICATION 49
0 0.2 0.4 0.6 0.8 10.4
0.5
0.6
0.7
0.8
0.9
1
coherence
mea
n
ForegroundBackground
(a) Coherence - Mean
0 0.2 0.4 0.6 0.8 10
0.02
0.04
0.06
0.08
coherence
varia
nce
ForegroundBackground
(b) Coherence - Variance
0.4 0.6 0.8 10
0.02
0.04
0.06
0.08
mean
varia
nce
ForegroundBackground
(c) Mean - Variance
Figure 4.4: Joint distributions of the pixel features for foreground and background areas ofDatabase 2.
decision boundaries [Jai00a]. However, since we want to apply the classifier to all pixels in afingerprint image, we prefer a classification algorithm that has low computational complexity.We have therefore chosen to use a linear classifier, which tests a linear combination of thefeatures, given by:
v = wT x = w0 + w1Coh + w2Mean + w3Var (4.5)
where v is the value to be tested, w = [w0 w1 w2 w3]T is the weight vector and x =[1 Coh Mean Var]T is the feature vector. Then, using class ω1 for the foreground, class ω0for the background and ω for the assigned class, the following decision function is applied:
ω ={
ω1 if wT x > 0ω0 if wT x ≤ 0
(4.6)
This classifier essentially tests the output of a linear neuron of which the output is givenby v = wT x [Hay99]. This classifier is trained by first setting the desired responses d. Here,we choose dω1 = 1 and dω0 = −1. Then, the error e is given by:
e = d − wT x (4.7)
and the neuron can be trained by the LMS algorithm [Hay99]. This algorithm adapts theweight vector w according to:
w(n + 1) = w(n) + η(n)x(n)e(n) (4.8)
For better convergence, a decreasing learning rate is used. More specifically, we use thesearch-then-converge schedule:
η(n) = η0
1 + n/τ(4.9)
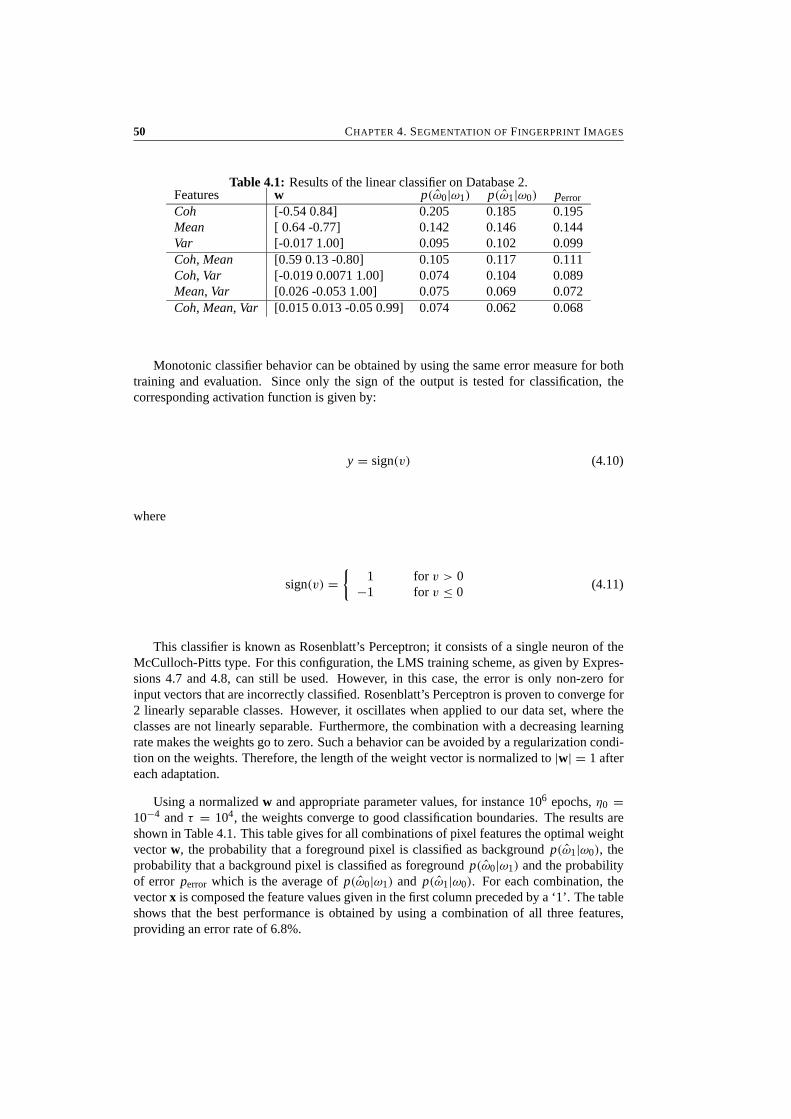
50 CHAPTER 4. SEGMENTATION OF FINGERPRINT IMAGES
Table 4.1: Results of the linear classifier on Database 2.Features w p(ω0|ω1) p(ω1|ω0) perror
Coh [-0.54 0.84] 0.205 0.185 0.195Mean [ 0.64 -0.77] 0.142 0.146 0.144Var [-0.017 1.00] 0.095 0.102 0.099Coh, Mean [0.59 0.13 -0.80] 0.105 0.117 0.111Coh, Var [-0.019 0.0071 1.00] 0.074 0.104 0.089Mean, Var [0.026 -0.053 1.00] 0.075 0.069 0.072Coh, Mean, Var [0.015 0.013 -0.05 0.99] 0.074 0.062 0.068
Monotonic classifier behavior can be obtained by using the same error measure for bothtraining and evaluation. Since only the sign of the output is tested for classification, thecorresponding activation function is given by:
y = sign(v) (4.10)
where
sign(v) ={
1 for v > 0−1 for v ≤ 0
(4.11)
This classifier is known as Rosenblatt’s Perceptron; it consists of a single neuron of theMcCulloch-Pitts type. For this configuration, the LMS training scheme, as given by Expres-sions 4.7 and 4.8, can still be used. However, in this case, the error is only non-zero forinput vectors that are incorrectly classified. Rosenblatt’s Perceptron is proven to converge for2 linearly separable classes. However, it oscillates when applied to our data set, where theclasses are not linearly separable. Furthermore, the combination with a decreasing learningrate makes the weights go to zero. Such a behavior can be avoided by a regularization condi-tion on the weights. Therefore, the length of the weight vector is normalized to |w| = 1 aftereach adaptation.
Using a normalized w and appropriate parameter values, for instance 106 epochs, η0 =10−4 and τ = 104, the weights converge to good classification boundaries. The results areshown in Table 4.1. This table gives for all combinations of pixel features the optimal weightvector w, the probability that a foreground pixel is classified as background p(ω1|ω0), theprobability that a background pixel is classified as foreground p(ω0|ω1) and the probabilityof error perror which is the average of p(ω0|ω1) and p(ω1|ω0). For each combination, thevector x is composed the feature values given in the first column preceded by a ‘1’. The tableshows that the best performance is obtained by using a combination of all three features,providing an error rate of 6.8%.
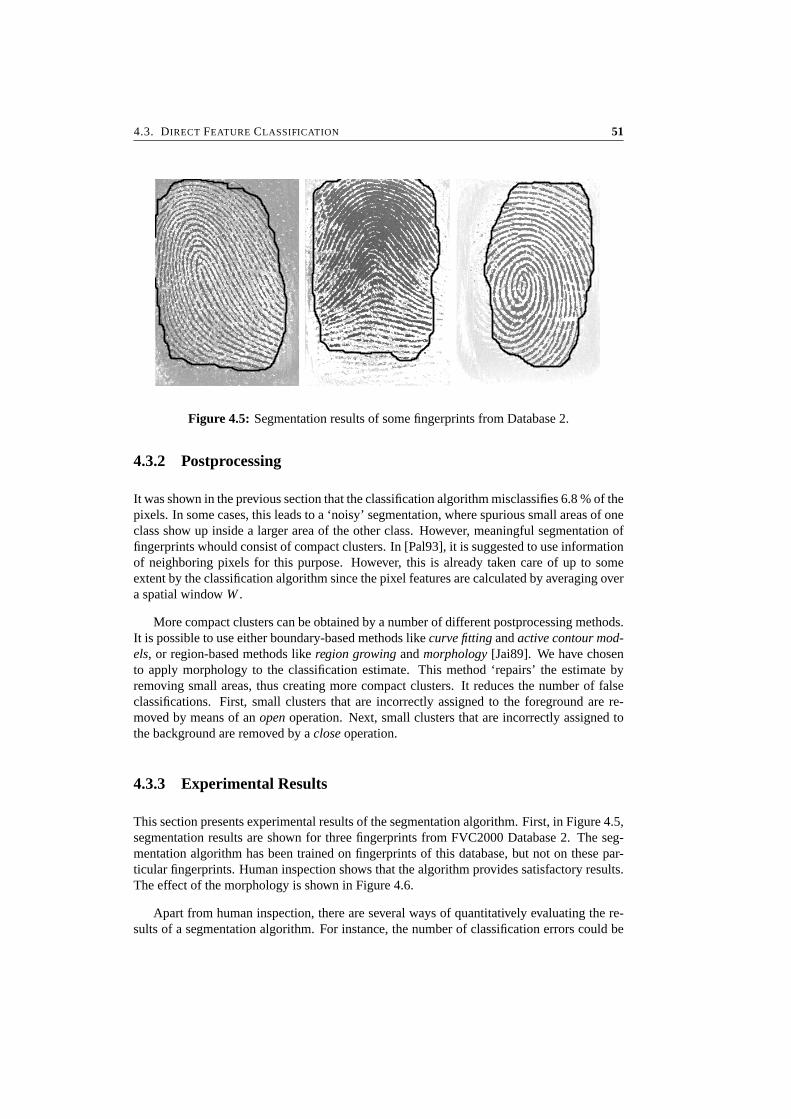
4.3. DIRECT FEATURE CLASSIFICATION 51
Figure 4.5: Segmentation results of some fingerprints from Database 2.
4.3.2 Postprocessing
It was shown in the previous section that the classification algorithm misclassifies 6.8 % of thepixels. In some cases, this leads to a ‘noisy’ segmentation, where spurious small areas of oneclass show up inside a larger area of the other class. However, meaningful segmentation offingerprints whould consist of compact clusters. In [Pal93], it is suggested to use informationof neighboring pixels for this purpose. However, this is already taken care of up to someextent by the classification algorithm since the pixel features are calculated by averaging overa spatial window W .
More compact clusters can be obtained by a number of different postprocessing methods.It is possible to use either boundary-based methods like curve fitting and active contour mod-els, or region-based methods like region growing and morphology [Jai89]. We have chosento apply morphology to the classification estimate. This method ‘repairs’ the estimate byremoving small areas, thus creating more compact clusters. It reduces the number of falseclassifications. First, small clusters that are incorrectly assigned to the foreground are re-moved by means of an open operation. Next, small clusters that are incorrectly assigned tothe background are removed by a close operation.
4.3.3 Experimental Results
This section presents experimental results of the segmentation algorithm. First, in Figure 4.5,segmentation results are shown for three fingerprints from FVC2000 Database 2. The seg-mentation algorithm has been trained on fingerprints of this database, but not on these par-ticular fingerprints. Human inspection shows that the algorithm provides satisfactory results.The effect of the morphology is shown in Figure 4.6.
Apart from human inspection, there are several ways of quantitatively evaluating the re-sults of a segmentation algorithm. For instance, the number of classification errors could be
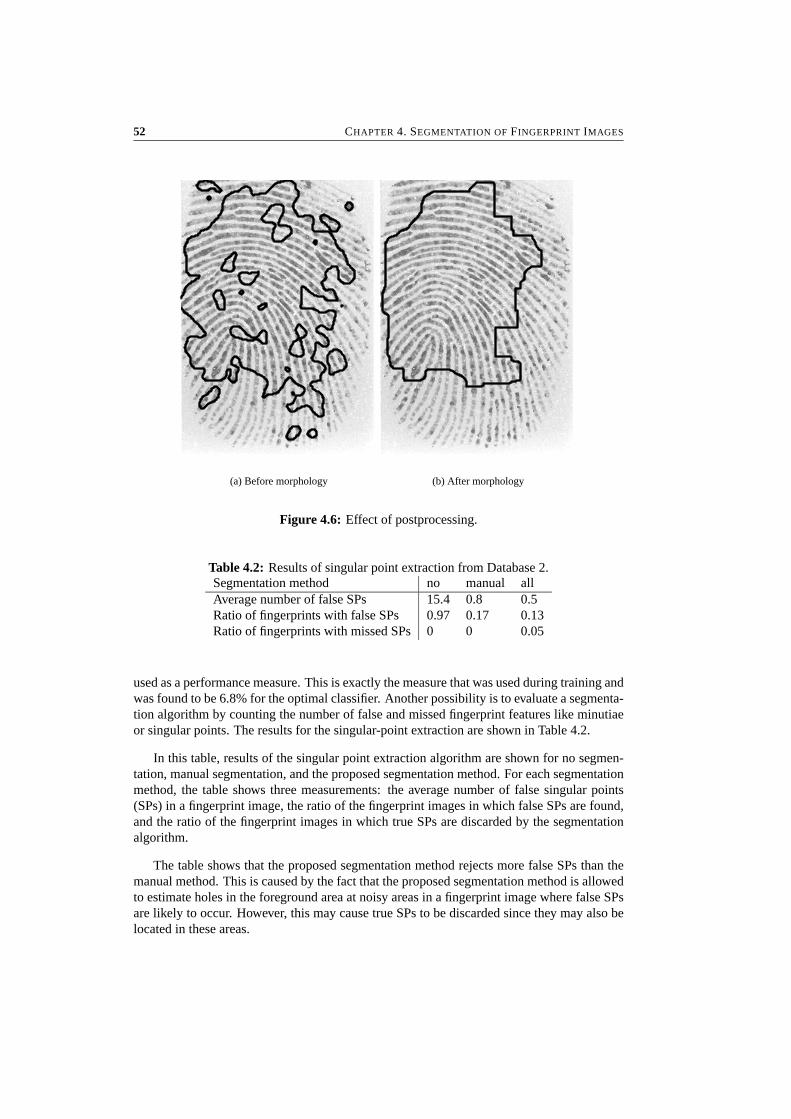
52 CHAPTER 4. SEGMENTATION OF FINGERPRINT IMAGES
(a) Before morphology (b) After morphology
Figure 4.6: Effect of postprocessing.
Table 4.2: Results of singular point extraction from Database 2.Segmentation method no manual allAverage number of false SPs 15.4 0.8 0.5Ratio of fingerprints with false SPs 0.97 0.17 0.13Ratio of fingerprints with missed SPs 0 0 0.05
used as a performance measure. This is exactly the measure that was used during training andwas found to be 6.8% for the optimal classifier. Another possibility is to evaluate a segmenta-tion algorithm by counting the number of false and missed fingerprint features like minutiaeor singular points. The results for the singular-point extraction are shown in Table 4.2.
In this table, results of the singular point extraction algorithm are shown for no segmen-tation, manual segmentation, and the proposed segmentation method. For each segmentationmethod, the table shows three measurements: the average number of false singular points(SPs) in a fingerprint image, the ratio of the fingerprint images in which false SPs are found,and the ratio of the fingerprint images in which true SPs are discarded by the segmentationalgorithm.
The table shows that the proposed segmentation method rejects more false SPs than themanual method. This is caused by the fact that the proposed segmentation method is allowedto estimate holes in the foreground area at noisy areas in a fingerprint image where false SPsare likely to occur. However, this may cause true SPs to be discarded since they may also belocated in these areas.
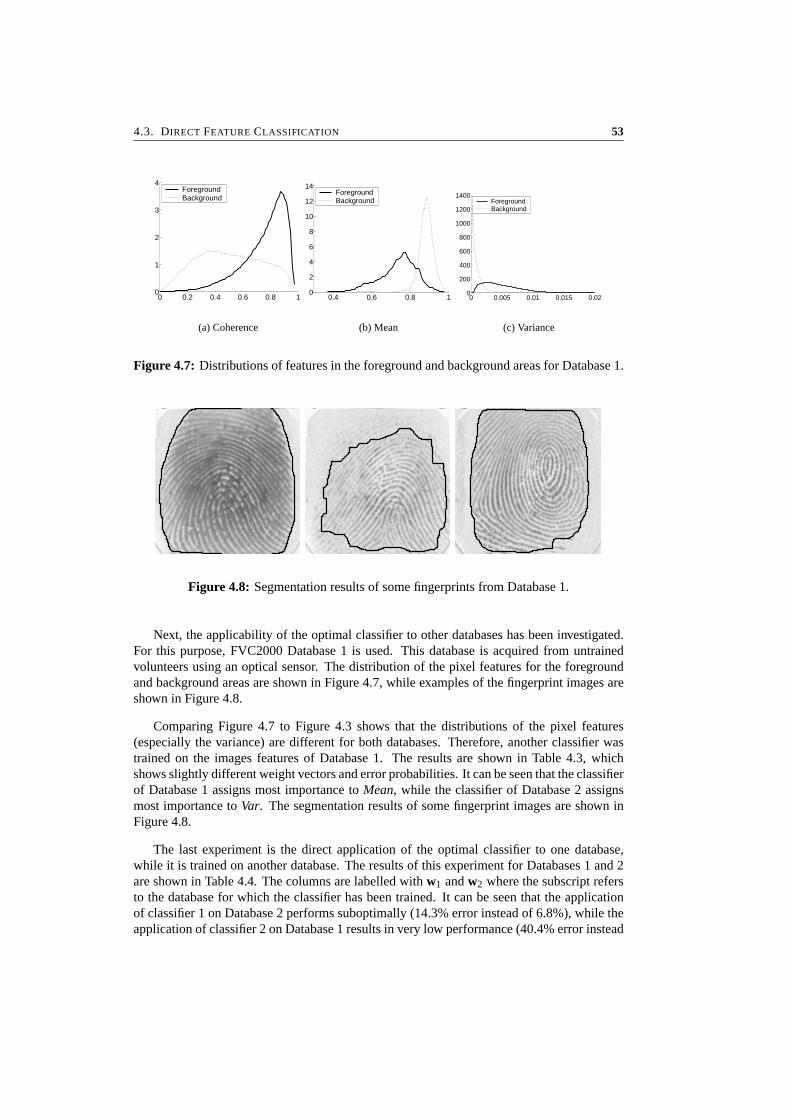
4.3. DIRECT FEATURE CLASSIFICATION 53
0 0.2 0.4 0.6 0.8 10
1
2
3
4ForegroundBackground
(a) Coherence
0.4 0.6 0.8 10
2
4
6
8
10
12
14ForegroundBackground
(b) Mean
0 0.005 0.01 0.015 0.020
200
400
600
800
1000
1200
1400ForegroundBackground
(c) Variance
Figure 4.7: Distributions of features in the foreground and background areas for Database 1.
Figure 4.8: Segmentation results of some fingerprints from Database 1.
Next, the applicability of the optimal classifier to other databases has been investigated.For this purpose, FVC2000 Database 1 is used. This database is acquired from untrainedvolunteers using an optical sensor. The distribution of the pixel features for the foregroundand background areas are shown in Figure 4.7, while examples of the fingerprint images areshown in Figure 4.8.
Comparing Figure 4.7 to Figure 4.3 shows that the distributions of the pixel features(especially the variance) are different for both databases. Therefore, another classifier wastrained on the images features of Database 1. The results are shown in Table 4.3, whichshows slightly different weight vectors and error probabilities. It can be seen that the classifierof Database 1 assigns most importance to Mean, while the classifier of Database 2 assignsmost importance to Var. The segmentation results of some fingerprint images are shown inFigure 4.8.
The last experiment is the direct application of the optimal classifier to one database,while it is trained on another database. The results of this experiment for Databases 1 and 2are shown in Table 4.4. The columns are labelled with w1 and w2 where the subscript refersto the database for which the classifier has been trained. It can be seen that the applicationof classifier 1 on Database 2 performs suboptimally (14.3% error instead of 6.8%), while theapplication of classifier 2 on Database 1 results in very low performance (40.4% error instead

54 CHAPTER 4. SEGMENTATION OF FINGERPRINT IMAGES
Table 4.3: Results of the linear classifier on Database 1.Features w p(ω0|ω1) p(ω1|ω0) perror
Coh [0.82 -0.57] 0.279 0.247 0.263Mean [-0.76 0.65] 0.110 0.115 0.113Var [1.00 -0.0018] 0.155 0.122 0.139Coh, Mean, Var [0.027 -0.77 0.061 0.63] 0.104 0.103 0.103
Table 4.4: Error probabilities of the classifiers on databases that they are not trained on.w1 w2
Database 1 0.103 0.404Database 2 0.143 0.068
of 10.3%). Therefore, it can be concluded that a classifier always has to be trained on thatspecific fingerprint sensor characteristics that it has to be applied to.
4.4 Segmentation using Hidden Markov Models
An alternative to the morphological postprocessing is the use of hidden Markov models(HMMs) which are widely used in speech recognition [Rab89]. This method takes into ac-count the context, or surroundings, for each feature vector to be classified. Using estimationsof the probability of class transitions and the conditional feature distributions, the segmen-tation is found that maximizes the likelihood of these observations. For the segmentationmethod that is proposed in this section, a third class, representing low-quality regions, is usedto improve the usefulness of the segmentation results.
4.4.1 Hidden Markov Models
A hidden Markov model (HMM) is a model that describes the statistical properties of a systemthat generates a signal. At each time instance, the system is in one state of a number of pos-sible states. The system generates an output signal of which the probability density functiondepends on the current state. However, only the output signal can be observed, while the ac-tual states are hidden for the observer. At the transitions between the time instances, the stateof the system may change according to a state transition matrix that contains probabilities forall state transition.
An HMM can be used to find the most likely state sequence, given the sequence of outputvalues. First the HMM has to be trained, using labelled data. From the data, the transitionprobabilities can be estimated directly by counting. For the simplest model, the output proba-bility densities can be modelled by a Gaussian function, which can also be estimated directlyfrom the set of data per state. If more complex HMMs are used, containing for instancemore states per class or Gaussian mixtures as probability density functions, more advancedestimation methods, like the EM algorithm, have to be used.
4.4. SEGMENTATION USING HIDDEN MARKOV MODELS 55
Table 4.5: Confusion matrix for HMM segmentation.FG BG LQ
FG 0.8851 0.0400 0.2062BG 0.0522 0.8936 0.1866LQ 0.0627 0.0663 0.6072
Given a trained HMM and an output sequence, the most likely state sequence can befound by means of the Viterbi algorithm [Rab89]. The Viterbi algorithm is a recursion thatmakes use of the Markov properties of the system: the next state is only dependent of thecurrent state, and not of all previous states. Given the optimal state sequences up to all statesat the previous time instance, the state transition probabilities, and the current observation,the Viterbi algorithm determines the optimal state sequences up to all possible current states.Applying this optimization to the entire sequence gives the optimal state sequence.
4.4.2 Segmentation using HMMs
An HMM can be used for classification of sequences of feature vectors by letting the hiddenstates represent the classes and the outputs the feature vectors. In fingerprint image seg-mentation, sequences of blocks have to be classified, and the context of a block providesimportant additional information. Therefore, hidden Markov models are well suited for thistask. Although HMMs have been applied to other image segmentation problems successfully,approaches for their application to fingerprint segmentation are not known from the literature.
For complexity reasons, we have chosen a 1-dimensional approach (complexity linear inthe size of the image) instead of a full 2-dimensional HMM (complexity exponential in thesize of the image) [Li00], which may give better segmentation performance. The HMMs areused to classify the blocks in each row of the fingerprint image.
4.4.3 Experimental Results
The three areas (foreground, background and low-quality) have been labelled manually in 20fingerprints, using a block size of 8 by 8 pixels. From this training data, the state transitionprobability matrix and the Gaussian probability density functions of the features have beenestimated. Next, the trained HMM was used for classification.
The best results were obtained by using all the features that are discussed in Section 4.2.The addition of other features, like for instance DCT coefficients, did not improve the perfor-mance. The confusion matrix over a test set of another 20 manually labelled fingerprints isgiven in Table 4.5, where ‘FG’ indicates foreground, ‘BG’ indicates background, ‘LQ’ indi-cates the low quality region. The plain letters indicate the true class and the letters with a hatindicate the estimated class.
Although the confusion matrix is not significantly better than the confusion matrix with-out the use of HMMs (which is obtained by setting the values in the transition matrix all

56 CHAPTER 4. SEGMENTATION OF FINGERPRINT IMAGES
equal), the shape of the areas fits the manual segmentation better, and the number of isolatedmisclassifications is reduced. An example of the results is shown in Figure 4.9. The maindifferences between both segmentations are the incorrect low quality areas at the transitionsbetween foreground and background in the direct classification, which vanish when usingHMM segmentation. Furthermore, the shape of the low quality region is slightly more reg-ular for the HMM segmentation. The minimal differences in the confusion matrices of bothmethods can be explained by inaccuracies in the exact location of the area borders in themanually labelled examples. A solution would be to define don’t-care regions in between theclasses.
4.5 Conclusions and Recommendations
In this chapter, two algorithms for the segmentation of fingerprints are proposed. The firstmethod uses three pixel features, being the coherence, the mean and the variance. An opti-mal linear classifier has been trained for the classification per pixel into foreground or back-ground, while morphology has been applied as postprocessing to obtain compact clusters andto reduce the number of classification errors. The second method uses the Gabor response asadditional feature, an additional class for low quality regions and HMMs for context depen-dent classification.
Human inspection has shown that the proposed methods provide accurate segmentationresults. The first method misclassifies 7% of the pixels while the postprocessing furtherprovides compact region estimates. The second method misclassifies 10% of the blocks,and obtains compact clusters from the data statistics instead of using postprocessing. Ex-periments have shown that the proposed segmentation methods and manual segmentationperform equally well in rejecting false fingerprint features from the noisy background.
The performance of the direct feature classification method may be improved by choosinga better suited classifier. The performance of the HMM based method can be improved byseveral adaptations. First, more realistic probability density functions can be considered thansingle Gaussian densities. One can for instance think of Gaussian mixtures for this purpose.Furthermore, more states can be used per class, representing for instance the orientations ofthe ridge lines in the fingerprint. This may help estimating more accurate output probabilitydensity functions and constrain the transition matrix to only valid transitions.
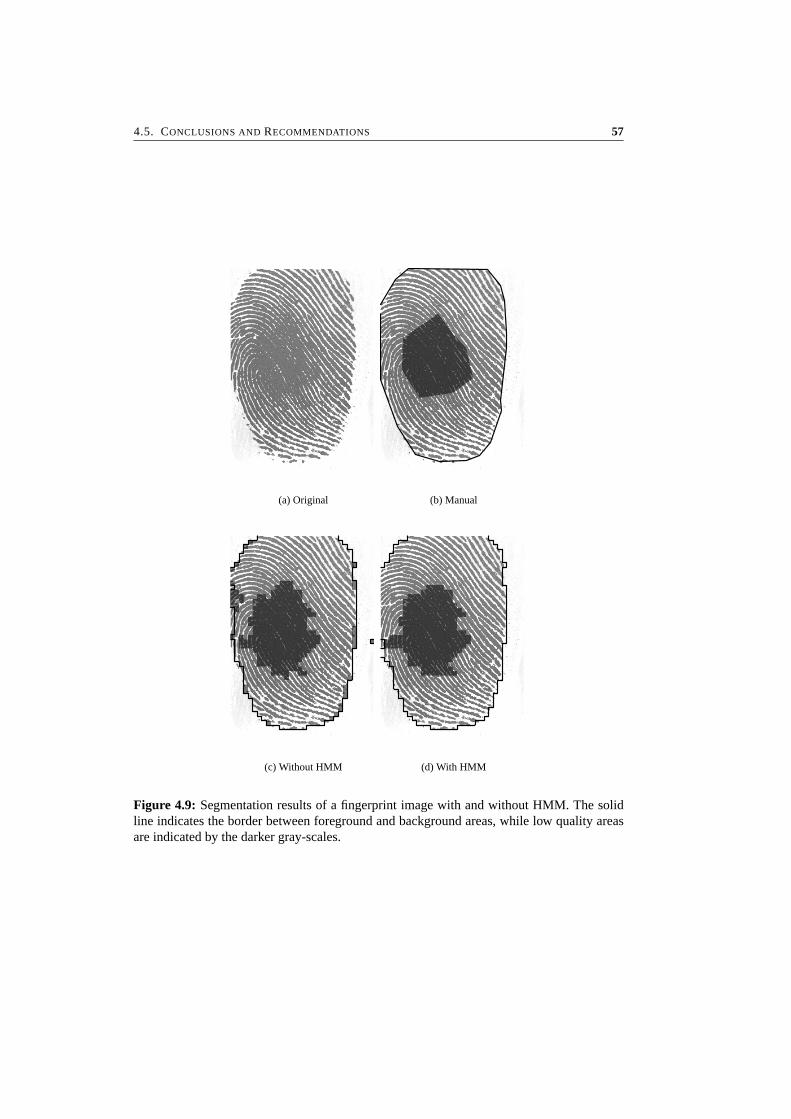
4.5. CONCLUSIONS AND RECOMMENDATIONS 57
(a) Original (b) Manual
(c) Without HMM (d) With HMM
Figure 4.9: Segmentation results of a fingerprint image with and without HMM. The solidline indicates the border between foreground and background areas, while low quality areasare indicated by the darker gray-scales.


Chapter 5
Minutiae Extraction
Abstract
This chapter discusses the extraction of minutiae from a gray-scale fingerprint image. This isa crucial step since the minutiae are the basis of most fingerprint matching systems. First, thetraditional approach is discussed, and improvements in computational complexity and extrac-tion performance are proposed. Next, two alternative approaches are presented that are basedon learning image exploring agents, that use genetic programming and reinforcement learn-ing respectively. It turns out that the traditional approach provides the best quality minutiaeextraction. Part of the traditional approach has been published in [Baz02a], the genetic pro-gramming approach has been published in [Meu00, Meu01] and the reinforcement learningapproach has been published in [Baz01e].
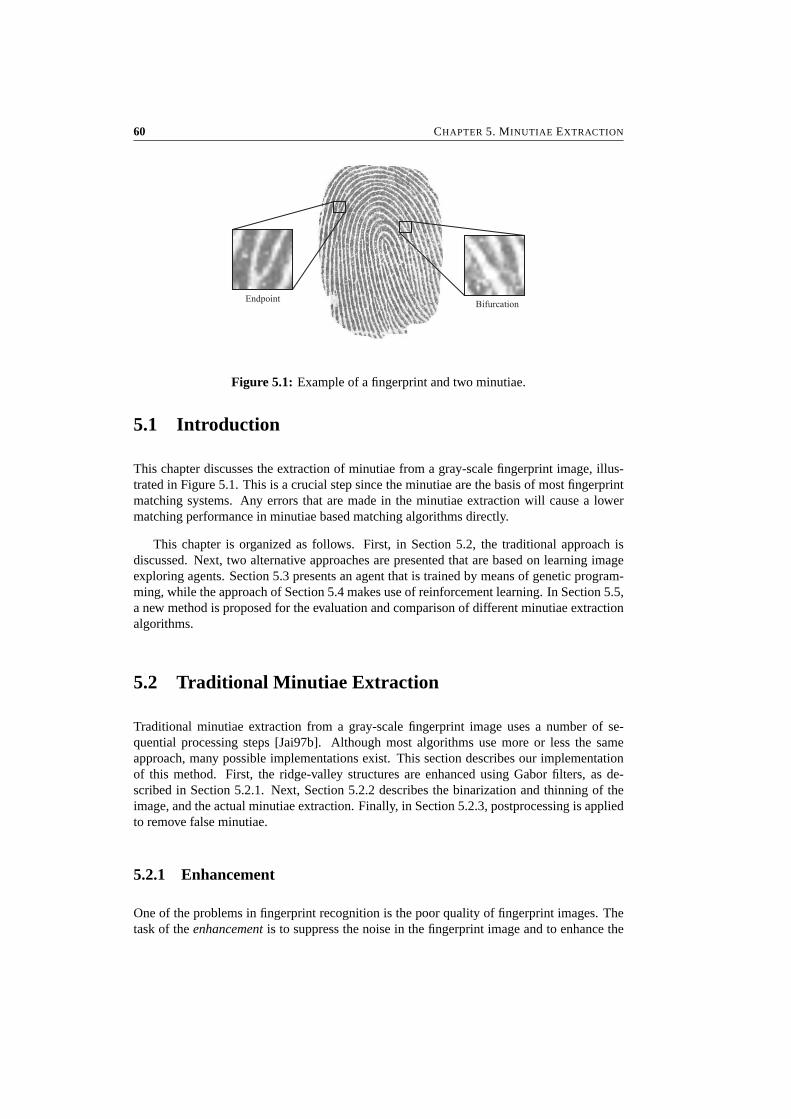
60 CHAPTER 5. MINUTIAE EXTRACTION
EndpointBifurcation
Figure 5.1: Example of a fingerprint and two minutiae.
5.1 Introduction
This chapter discusses the extraction of minutiae from a gray-scale fingerprint image, illus-trated in Figure 5.1. This is a crucial step since the minutiae are the basis of most fingerprintmatching systems. Any errors that are made in the minutiae extraction will cause a lowermatching performance in minutiae based matching algorithms directly.
This chapter is organized as follows. First, in Section 5.2, the traditional approach isdiscussed. Next, two alternative approaches are presented that are based on learning imageexploring agents. Section 5.3 presents an agent that is trained by means of genetic program-ming, while the approach of Section 5.4 makes use of reinforcement learning. In Section 5.5,a new method is proposed for the evaluation and comparison of different minutiae extractionalgorithms.
5.2 Traditional Minutiae Extraction
Traditional minutiae extraction from a gray-scale fingerprint image uses a number of se-quential processing steps [Jai97b]. Although most algorithms use more or less the sameapproach, many possible implementations exist. This section describes our implementationof this method. First, the ridge-valley structures are enhanced using Gabor filters, as de-scribed in Section 5.2.1. Next, Section 5.2.2 describes the binarization and thinning of theimage, and the actual minutiae extraction. Finally, in Section 5.2.3, postprocessing is appliedto remove false minutiae.
5.2.1 Enhancement
One of the problems in fingerprint recognition is the poor quality of fingerprint images. Thetask of the enhancement is to suppress the noise in the fingerprint image and to enhance the
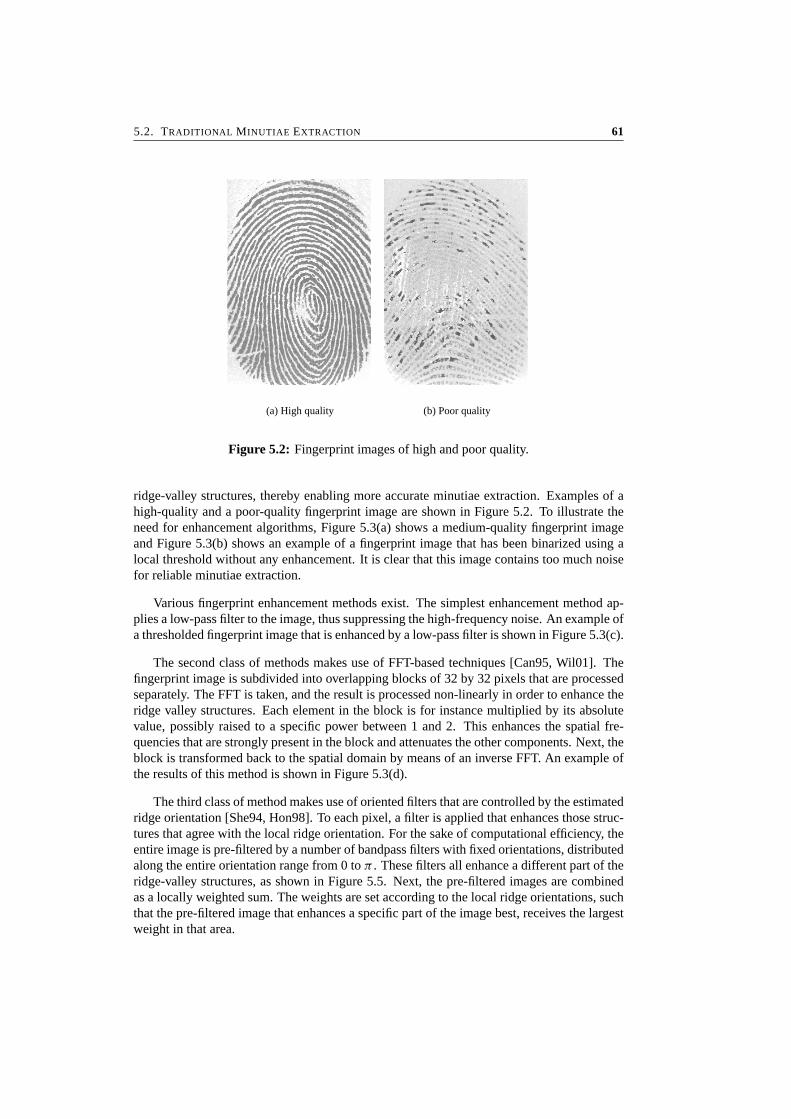
5.2. TRADITIONAL MINUTIAE EXTRACTION 61
(a) High quality (b) Poor quality
Figure 5.2: Fingerprint images of high and poor quality.
ridge-valley structures, thereby enabling more accurate minutiae extraction. Examples of ahigh-quality and a poor-quality fingerprint image are shown in Figure 5.2. To illustrate theneed for enhancement algorithms, Figure 5.3(a) shows a medium-quality fingerprint imageand Figure 5.3(b) shows an example of a fingerprint image that has been binarized using alocal threshold without any enhancement. It is clear that this image contains too much noisefor reliable minutiae extraction.
Various fingerprint enhancement methods exist. The simplest enhancement method ap-plies a low-pass filter to the image, thus suppressing the high-frequency noise. An example ofa thresholded fingerprint image that is enhanced by a low-pass filter is shown in Figure 5.3(c).
The second class of methods makes use of FFT-based techniques [Can95, Wil01]. Thefingerprint image is subdivided into overlapping blocks of 32 by 32 pixels that are processedseparately. The FFT is taken, and the result is processed non-linearly in order to enhance theridge valley structures. Each element in the block is for instance multiplied by its absolutevalue, possibly raised to a specific power between 1 and 2. This enhances the spatial fre-quencies that are strongly present in the block and attenuates the other components. Next, theblock is transformed back to the spatial domain by means of an inverse FFT. An example ofthe results of this method is shown in Figure 5.3(d).
The third class of method makes use of oriented filters that are controlled by the estimatedridge orientation [She94, Hon98]. To each pixel, a filter is applied that enhances those struc-tures that agree with the local ridge orientation. For the sake of computational efficiency, theentire image is pre-filtered by a number of bandpass filters with fixed orientations, distributedalong the entire orientation range from 0 to π . These filters all enhance a different part of theridge-valley structures, as shown in Figure 5.5. Next, the pre-filtered images are combinedas a locally weighted sum. The weights are set according to the local ridge orientations, suchthat the pre-filtered image that enhances a specific part of the image best, receives the largestweight in that area.
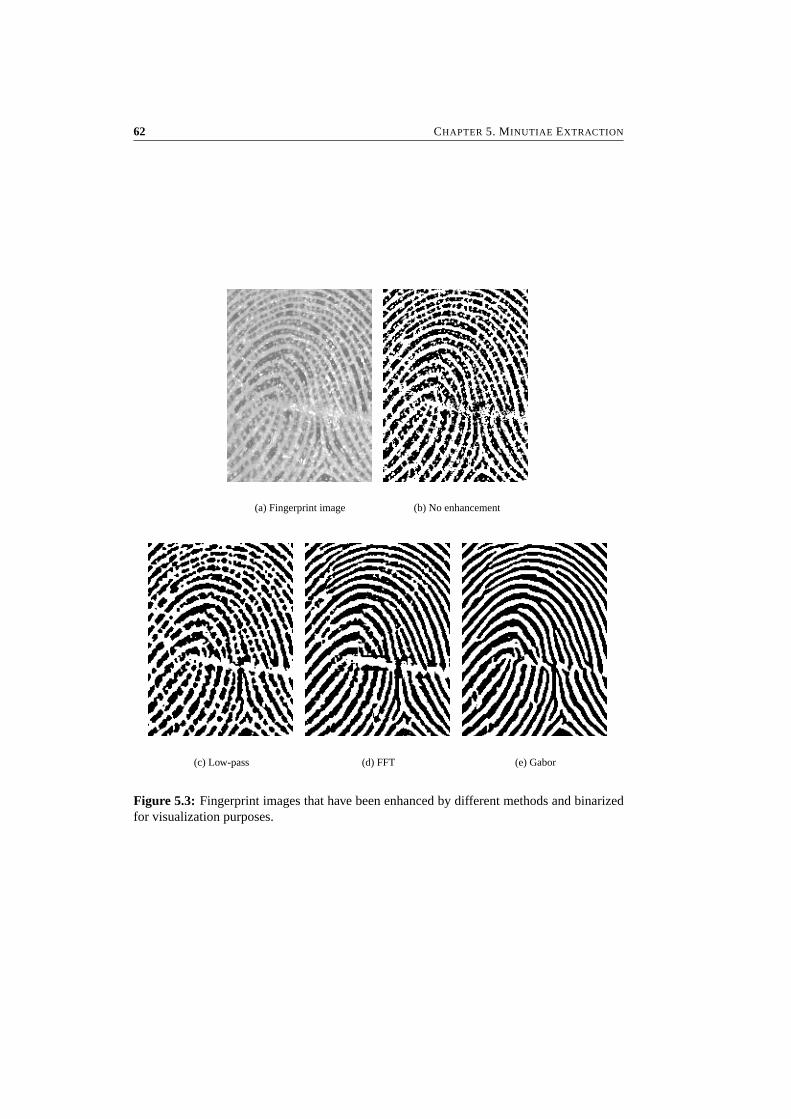
62 CHAPTER 5. MINUTIAE EXTRACTION
(a) Fingerprint image (b) No enhancement
(c) Low-pass (d) FFT (e) Gabor
Figure 5.3: Fingerprint images that have been enhanced by different methods and binarizedfor visualization purposes.
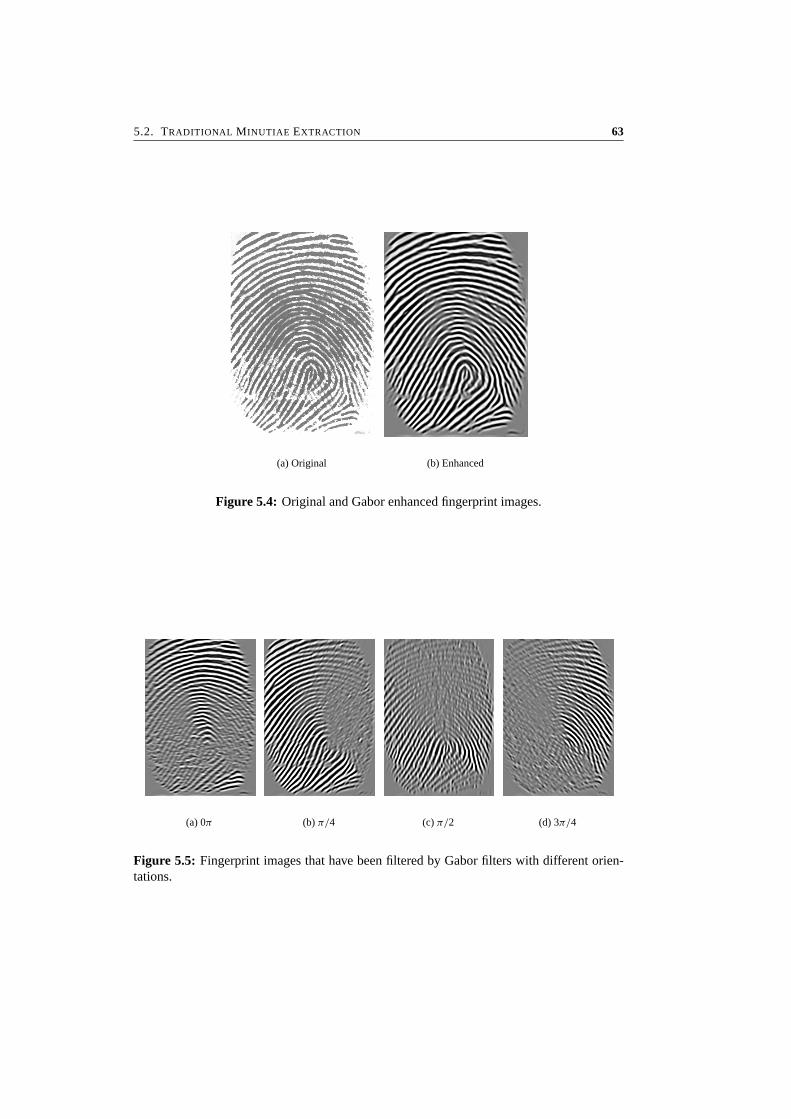
5.2. TRADITIONAL MINUTIAE EXTRACTION 63
(a) Original (b) Enhanced
Figure 5.4: Original and Gabor enhanced fingerprint images.
(a) 0π (b) π/4 (c) π/2 (d) 3π/4
Figure 5.5: Fingerprint images that have been filtered by Gabor filters with different orien-tations.
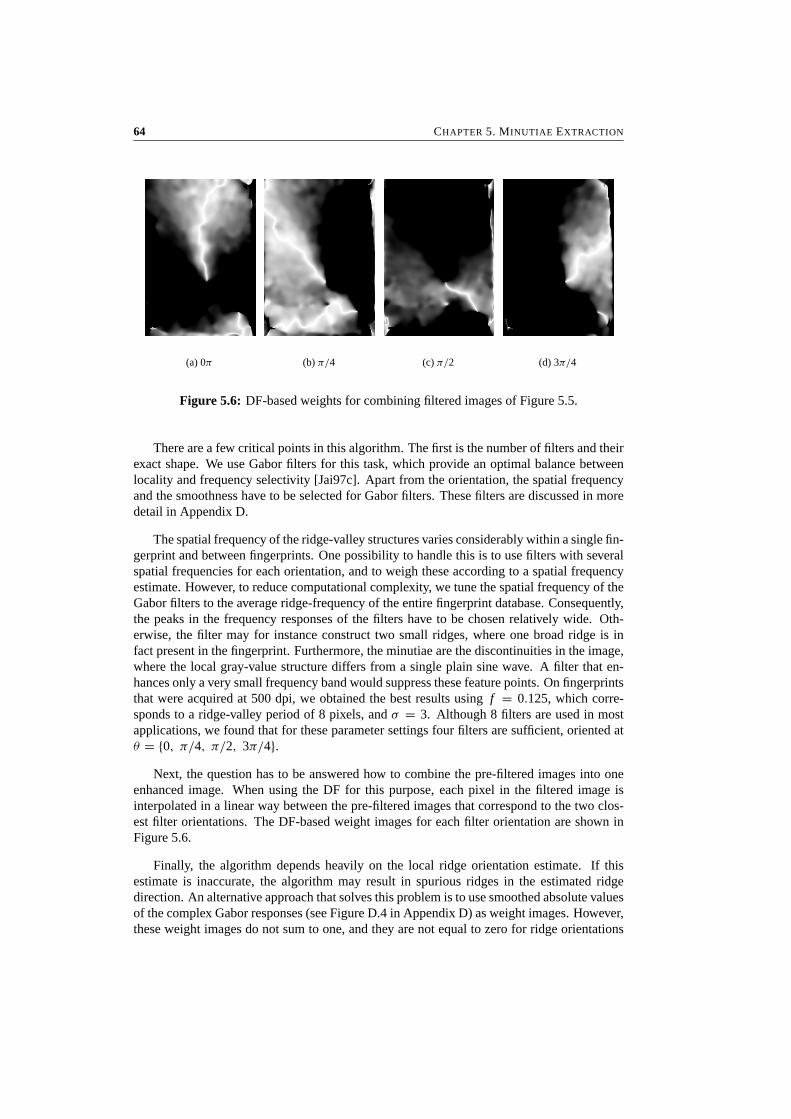
64 CHAPTER 5. MINUTIAE EXTRACTION
(a) 0π (b) π/4 (c) π/2 (d) 3π/4
Figure 5.6: DF-based weights for combining filtered images of Figure 5.5.
There are a few critical points in this algorithm. The first is the number of filters and theirexact shape. We use Gabor filters for this task, which provide an optimal balance betweenlocality and frequency selectivity [Jai97c]. Apart from the orientation, the spatial frequencyand the smoothness have to be selected for Gabor filters. These filters are discussed in moredetail in Appendix D.
The spatial frequency of the ridge-valley structures varies considerably within a single fin-gerprint and between fingerprints. One possibility to handle this is to use filters with severalspatial frequencies for each orientation, and to weigh these according to a spatial frequencyestimate. However, to reduce computational complexity, we tune the spatial frequency of theGabor filters to the average ridge-frequency of the entire fingerprint database. Consequently,the peaks in the frequency responses of the filters have to be chosen relatively wide. Oth-erwise, the filter may for instance construct two small ridges, where one broad ridge is infact present in the fingerprint. Furthermore, the minutiae are the discontinuities in the image,where the local gray-value structure differs from a single plain sine wave. A filter that en-hances only a very small frequency band would suppress these feature points. On fingerprintsthat were acquired at 500 dpi, we obtained the best results using f = 0.125, which corre-sponds to a ridge-valley period of 8 pixels, and σ = 3. Although 8 filters are used in mostapplications, we found that for these parameter settings four filters are sufficient, oriented atθ = {0, π/4, π/2, 3π/4}.
Next, the question has to be answered how to combine the pre-filtered images into oneenhanced image. When using the DF for this purpose, each pixel in the filtered image isinterpolated in a linear way between the pre-filtered images that correspond to the two clos-est filter orientations. The DF-based weight images for each filter orientation are shown inFigure 5.6.
Finally, the algorithm depends heavily on the local ridge orientation estimate. If thisestimate is inaccurate, the algorithm may result in spurious ridges in the estimated ridgedirection. An alternative approach that solves this problem is to use smoothed absolute valuesof the complex Gabor responses (see Figure D.4 in Appendix D) as weight images. However,these weight images do not sum to one, and they are not equal to zero for ridge orientations

5.2. TRADITIONAL MINUTIAE EXTRACTION 65
that are orthogonal to the filter orientation. Human inspection indicates that this results in lesssuppression of the noise. For these reasons, use of the DF as weight image provides betterresults than use of the absolute value of the complex Gabor response.
5.2.2 Minutiae extraction
After enhancement (and segmentation), the minutiae have to be extracted. For this purpose,the image is first binarized by a thresholding operation. This converts each gray-scale pixelvalue to a binary value (black or white). A dynamic threshold has to be applied, which meansthat the threshold is adjusted to the local characteristics of the image, thus compensating fordifferences in image intensity.
Next, the binarized image is thinned. This is a morphological operation that reduces thewidth of each ridge to a single pixel, thus creating a skeleton of the image. We use a veryefficient thinning algorithm that codes each 3 by 3 pixel neighborhood in a 9-bit integer. Thisnumber is used as index into a lookup table that contains the binary value after the currentthinning step. Two different lookup tables that both take care of a different thinning directionare used iteratively, until the image has converged to its final skeleton. Our thinning algorithmis inspired by the thinning algorithm that is supplied with Matlab, but it replaces 3 lookuptable operations, 3 binary ‘and’s and 1 binary ‘not’ with only 1 lookup table operation.
The next phase is the actual minutiae detection in the skeleton image. For this task, againa lookup table operation is used for efficiency. In this table, endpoints are defined as blackpixels that have only one black pixel in their 3 by 3 neighborhood, while bifurcations havethree black pixels that are pairwise unconnected in their 3 by 3 neighborhood.
5.2.3 Postprocessing
Although many false minutiae are suppressed in the skeletons of enhanced fingerprint images,in general those skeletons still contain a number of false minutiae. The objective of postpro-cessing is to eliminate those false minutiae from the skeleton image, while maintaining thetrue ones.
Many postprocessing methods have been proposed in literature, see for instance [Xia91,Hun93, Far99, Kim01]. Most algorithms operate on the ridge skeleton, verifying the validityof minutiae that are extracted using standard minutiae extraction algorithms. Heuristics havebeen constructed that are able to remove minutiae that originate from frequently occurringdefects such as ridge-breaks, bridges, spurs, short ridges, and islands or holes, which areshown in Figure 5.7.
For instance, to repair a broken ridge, the heuristic ‘two endpoints are connected if theyare closer than a specified distance and facing each other’ can be used. Such a heuristicis constructed for each type of false minutiae structure. The most important tool for theseheuristics is the tracing of skeleton ridges. An example of a skeleton image and its minutiaebefore and after postprocessing is shown in Figure 5.8.
Another approach is the verification of minutiae in the original gray-scale image by means
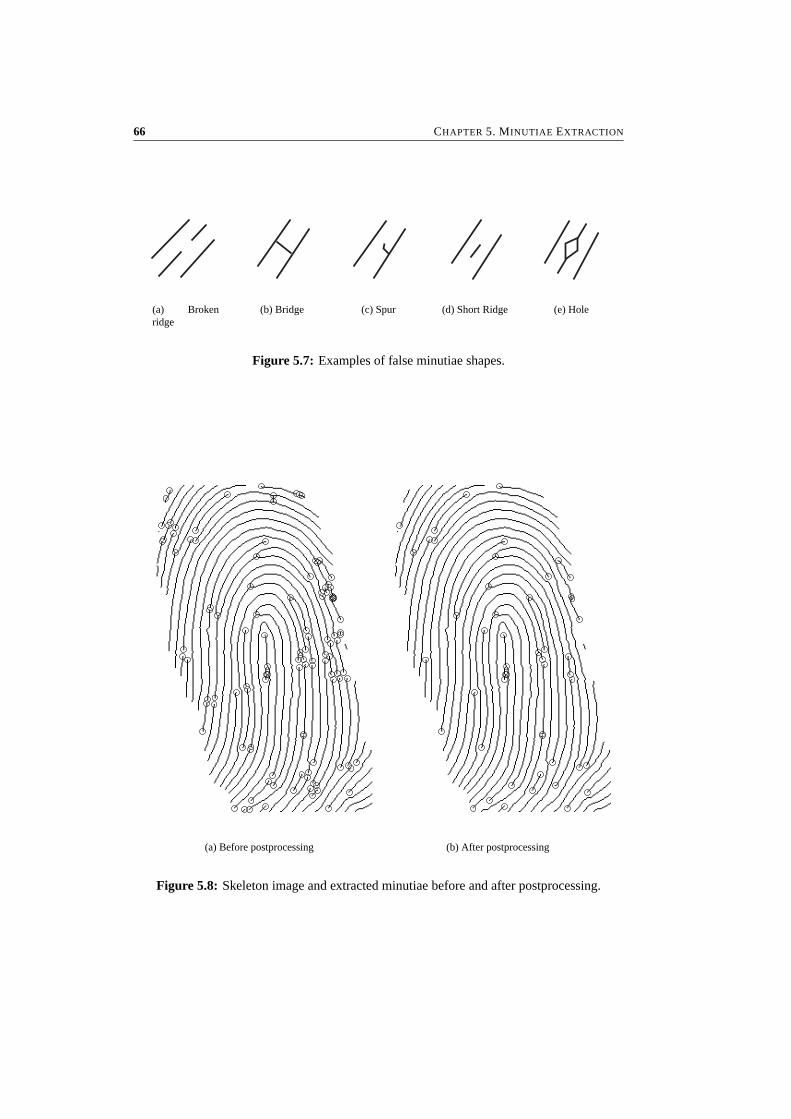
66 CHAPTER 5. MINUTIAE EXTRACTION
(a) Brokenridge
(b) Bridge (c) Spur (d) Short Ridge (e) Hole
Figure 5.7: Examples of false minutiae shapes.
(a) Before postprocessing (b) After postprocessing
Figure 5.8: Skeleton image and extracted minutiae before and after postprocessing.

5.3. MINUTIAE EXTRACTION USING GENETIC PROGRAMMING 67
of neural networks. Again, the potential minutiae are first detected by a standard minutiaeextraction algorithm. The minutiae neighborhood is then taken from the gray-scale imageand normalized, for example with respect to orientation, and enhanced. In [Pra00], this 32by 32 neighborhood is directly fed to a learning vector quantizer (LVQ) or a Kohonen neuralnetwork. In [Mai99] the neighborhood is first reduced to a feature vector of 26 elements bymeans of a Karhunen-Loeve transform, after which it is classified by a multi-layer perceptron.
5.3 Minutiae Extraction Using Genetic Programming
In this section, an image exploring agent is developed by means of genetic programming.The goal of the agent is to follow the ridge lines in the fingerprint and to stop at minutiae.First, genetic programming is described shortly in Section 5.3.1. Next, in Section 5.3.2,experiments are presented where an agent learns to perform its task.
5.3.1 Genetic Programming
Genetic programming (GP) [Koz92, Koz94, Koz99] is a method to automatically search forcomputer programs that perform a specific task, using the principle of survival of the fittest.GP works with a population of individuals: programs that can possibly solve the given prob-lem. The first generation of this population is created randomly. Then, all programs areevaluated by applying them to typical problem instances. This results in a fitness measurebeing assigned to each program. The programs that have the highest fitness, have the highestprobability to participate as parents in the creation of new individuals in the next generation.This process repeats until a satisfactory solution is found or a fixed number of generations isreached. When executed on a single PC, solving a real-life problem may take several days ofprocessing time.
For the application of GP to the minutiae extraction problem, we have developed our ownGP environment. This GP environment is called Poor Man’s Distributed Genetic Program-ming (PMDGP), as it is designed to make use of existing heterogeneous hardware ratherthan expensive dedicated homogeneous hardware that has to be purchased for the purposeof GP. The environment performs tasks like: population management, genetic operators andevaluation of the programs. Furthermore, it provides a framework for implementation of theproblem-specific part. Using object-oriented methods, the environment is designed to offera high degree of flexibility and ease of use. The GP environment uses distributed fitnessevaluation, which can be used on existing computer networks. The system is optimized forefficiency of distribution. Detailed descriptions of PMDGP can be found in [Meu00, Meu01].
5.3.2 Experiments and Conclusions
The goal of the experiments is to let GP develop an image exploring agent (IEA) [Kop99].An IEA walks through a picture by continuously repeating its program and will terminatewhen it has found a region of interest (ROI). In this case the ROI is a ridge ending. So when
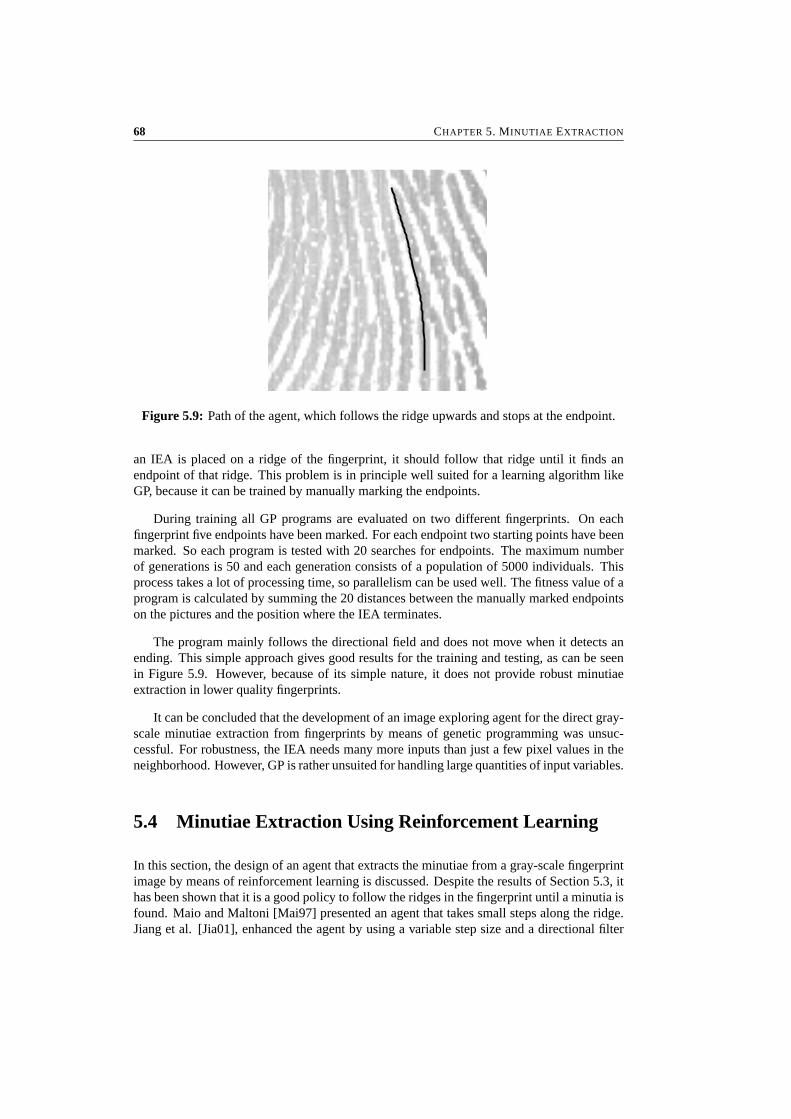
68 CHAPTER 5. MINUTIAE EXTRACTION
Figure 5.9: Path of the agent, which follows the ridge upwards and stops at the endpoint.
an IEA is placed on a ridge of the fingerprint, it should follow that ridge until it finds anendpoint of that ridge. This problem is in principle well suited for a learning algorithm likeGP, because it can be trained by manually marking the endpoints.
During training all GP programs are evaluated on two different fingerprints. On eachfingerprint five endpoints have been marked. For each endpoint two starting points have beenmarked. So each program is tested with 20 searches for endpoints. The maximum numberof generations is 50 and each generation consists of a population of 5000 individuals. Thisprocess takes a lot of processing time, so parallelism can be used well. The fitness value of aprogram is calculated by summing the 20 distances between the manually marked endpointson the pictures and the position where the IEA terminates.
The program mainly follows the directional field and does not move when it detects anending. This simple approach gives good results for the training and testing, as can be seenin Figure 5.9. However, because of its simple nature, it does not provide robust minutiaeextraction in lower quality fingerprints.
It can be concluded that the development of an image exploring agent for the direct gray-scale minutiae extraction from fingerprints by means of genetic programming was unsuc-cessful. For robustness, the IEA needs many more inputs than just a few pixel values in theneighborhood. However, GP is rather unsuited for handling large quantities of input variables.
5.4 Minutiae Extraction Using Reinforcement Learning
In this section, the design of an agent that extracts the minutiae from a gray-scale fingerprintimage by means of reinforcement learning is discussed. Despite the results of Section 5.3, ithas been shown that it is a good policy to follow the ridges in the fingerprint until a minutia isfound. Maio and Maltoni [Mai97] presented an agent that takes small steps along the ridge.Jiang et al. [Jia01], enhanced the agent by using a variable step size and a directional filter

5.4. MINUTIAE EXTRACTION USING REINFORCEMENT LEARNING 69
for noise suppression. This results in a rather complex system, especially since robustness isrequired. A much simpler solution is to use a agent that learns the task. By using a variety oftraining examples, a robust system can be obtained. In the approach of this section, the agentis trained by means of reinforcement learning (RL).
In this section we show that reinforcement learning can be used for minutiae detectionin fingerprint matching. We propose a more robust approach, in which an autonomous agentwalks around in the fingerprint and learns how to follow ridges in the fingerprint and howto recognize minutiae. The agent is situated in the environment, the fingerprint, and usesreinforcement learning to obtain an optimal policy. Multi-layer perceptrons are used forovercoming the difficulties of the large state space. By choosing the right reward structureand learning environment, the agent is able to learn the task. One of the main difficulties isthat the goal states are not easily specified, for they are part of the learning task as well. Thatis, the recognition of minutiae has to be learned in addition to learning how to walk over theridges in the fingerprint. Results of successful first experiments are presented.
The rest of this Section is organized as follows. In Section 5.4.1, reinforcement learningis explained. In Section 5.4.2, it is discussed how to apply RL to the problem of minutiaeextraction. Finally, in Section 5.4.3, some experimental results are presented.
5.4.1 Reinforcement Learning
Reinforcement learning (RL) [Kae96, Sut98] is a learning technique in domains where thereis no instructive feedback, as in supervised learning, but only evaluative feedback. Agentsare trained by rewarding (both positive and negative), expressed in terms of real numbers.
In short, a RL agent learns in the following way. First, it perceives a state st . Then, on thebasis of its experience, it chooses its best action or, with a small probability, a random action,action at . This action is rewarded by the environment with reinforcement rt , after which theagent perceives the newly entered state st+1. This interaction continues until the agent entersa terminal state, i.e. its episode ends. Terminal states are either states in which the agent’sgoal is satisfied, or states in which the episode is terminated externally, possibly because ofan illegal action. One of the main difficulties is that non-zero rewards are usually sparse andare sometimes only given at the end of the episode.
The goal of the agent is to maximize its reward by learning the optimal policy, i.e. amapping from states to actions. This can be done by learning value functions. Value functionsreflect the expected cumulative reward the agent receives by following its policy. In RL, onegenerally uses two kinds of value functions: V : S → R (state values) and Q : S × A → R
(state-action values). In this section we use the latter to reflect the expected cumulative rewardresulting from executing action a in state s and thereafter following the policy. This mappingis approximated on the basis of interaction with the environment. The policy can easily befound by choosing in each state the action that maximizes the Q-value, i.e. the greedy action.
Q-Learning is a commonly used off-policy algorithm for learning the action values. In thissection, however, we use the related algorithm Sarsa1 [Rum94, Sut98], which is an on-policytemporal difference (TD) algorithm:
1Sarsa stands for State-Action-Reward-State-Action, which are the necessary elements for performing the update
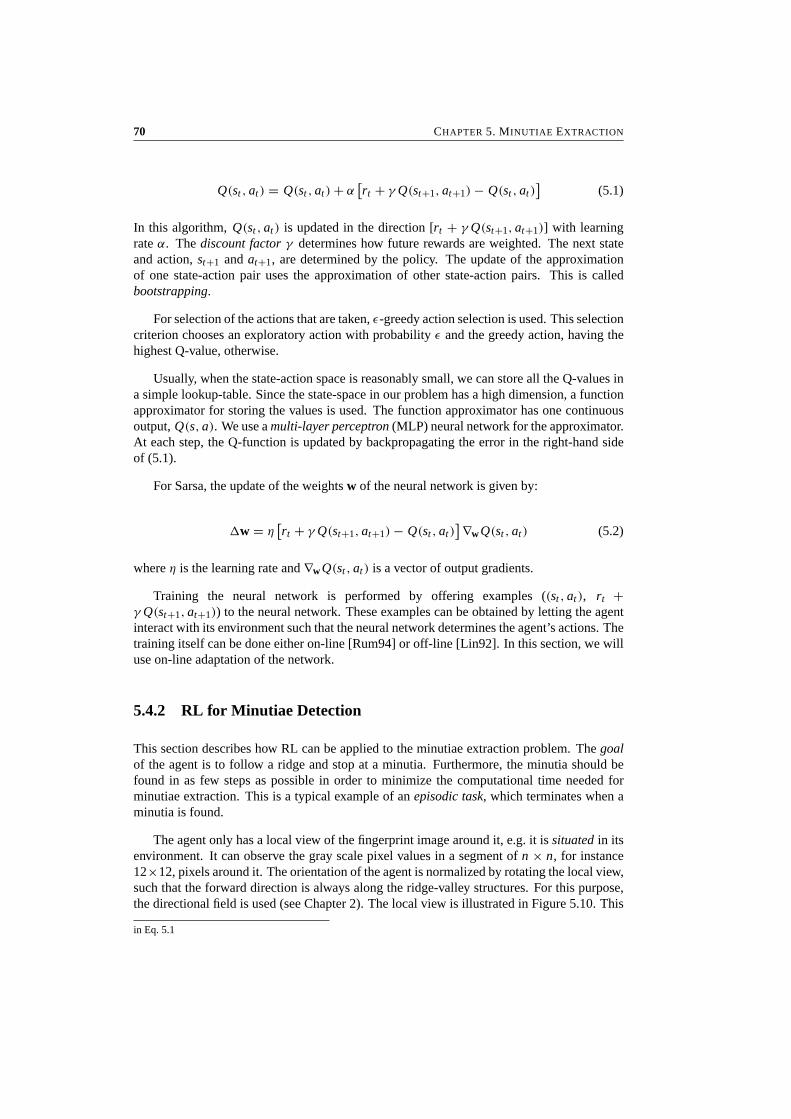
70 CHAPTER 5. MINUTIAE EXTRACTION
Q(st , at ) = Q(st , at ) + α[rt + γ Q(st+1, at+1) − Q(st , at )
](5.1)
In this algorithm, Q(st , at ) is updated in the direction [rt + γ Q(st+1, at+1)] with learningrate α. The discount factor γ determines how future rewards are weighted. The next stateand action, st+1 and at+1, are determined by the policy. The update of the approximationof one state-action pair uses the approximation of other state-action pairs. This is calledbootstrapping.
For selection of the actions that are taken, ε-greedy action selection is used. This selectioncriterion chooses an exploratory action with probability ε and the greedy action, having thehighest Q-value, otherwise.
Usually, when the state-action space is reasonably small, we can store all the Q-values ina simple lookup-table. Since the state-space in our problem has a high dimension, a functionapproximator for storing the values is used. The function approximator has one continuousoutput, Q(s, a). We use a multi-layer perceptron (MLP) neural network for the approximator.At each step, the Q-function is updated by backpropagating the error in the right-hand sideof (5.1).
For Sarsa, the update of the weights w of the neural network is given by:
w = η[rt + γ Q(st+1, at+1) − Q(st , at )
]∇w Q(st , at ) (5.2)
where η is the learning rate and ∇w Q(st , at ) is a vector of output gradients.
Training the neural network is performed by offering examples ((st , at ), rt +γ Q(st+1, at+1)) to the neural network. These examples can be obtained by letting the agentinteract with its environment such that the neural network determines the agent’s actions. Thetraining itself can be done either on-line [Rum94] or off-line [Lin92]. In this section, we willuse on-line adaptation of the network.
5.4.2 RL for Minutiae Detection
This section describes how RL can be applied to the minutiae extraction problem. The goalof the agent is to follow a ridge and stop at a minutia. Furthermore, the minutia should befound in as few steps as possible in order to minimize the computational time needed forminutiae extraction. This is a typical example of an episodic task, which terminates when aminutia is found.
The agent only has a local view of the fingerprint image around it, e.g. it is situated in itsenvironment. It can observe the gray scale pixel values in a segment of n × n, for instance12×12, pixels around it. The orientation of the agent is normalized by rotating the local view,such that the forward direction is always along the ridge-valley structures. For this purpose,the directional field is used (see Chapter 2). The local view is illustrated in Figure 5.10. This
in Eq. 5.1
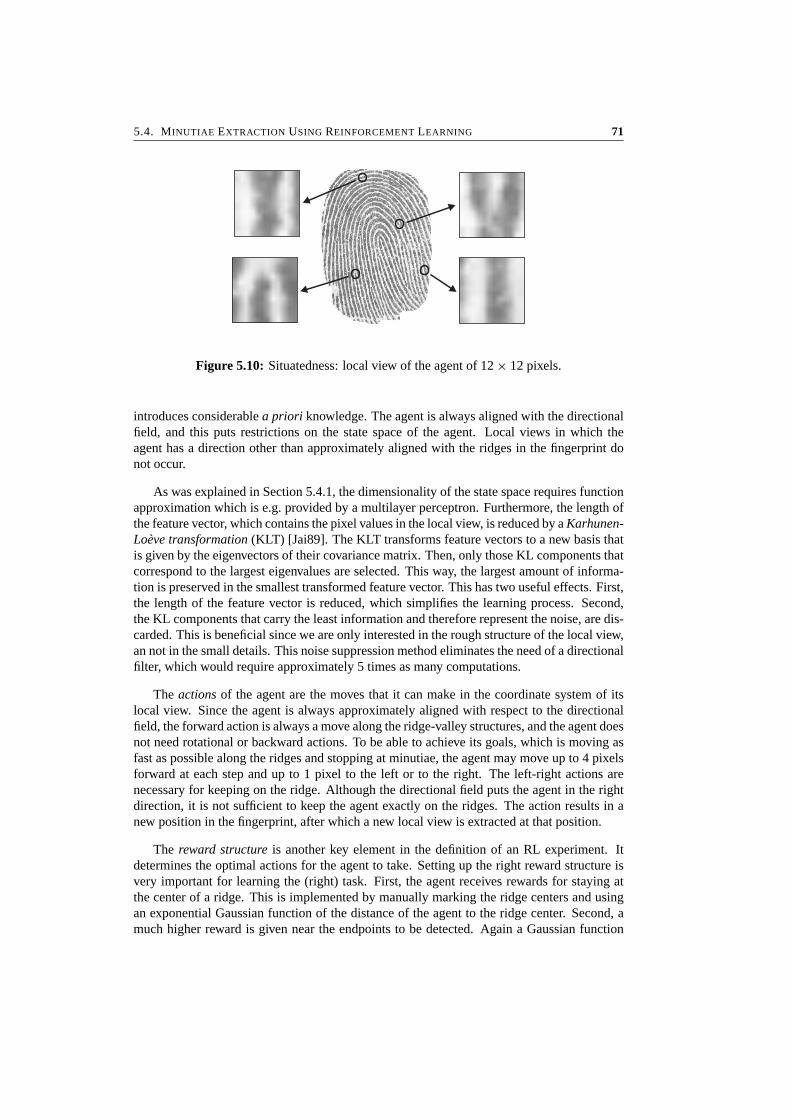
5.4. MINUTIAE EXTRACTION USING REINFORCEMENT LEARNING 71
Figure 5.10: Situatedness: local view of the agent of 12 × 12 pixels.
introduces considerable a priori knowledge. The agent is always aligned with the directionalfield, and this puts restrictions on the state space of the agent. Local views in which theagent has a direction other than approximately aligned with the ridges in the fingerprint donot occur.
As was explained in Section 5.4.1, the dimensionality of the state space requires functionapproximation which is e.g. provided by a multilayer perceptron. Furthermore, the length ofthe feature vector, which contains the pixel values in the local view, is reduced by a Karhunen-Loeve transformation (KLT) [Jai89]. The KLT transforms feature vectors to a new basis thatis given by the eigenvectors of their covariance matrix. Then, only those KL components thatcorrespond to the largest eigenvalues are selected. This way, the largest amount of informa-tion is preserved in the smallest transformed feature vector. This has two useful effects. First,the length of the feature vector is reduced, which simplifies the learning process. Second,the KL components that carry the least information and therefore represent the noise, are dis-carded. This is beneficial since we are only interested in the rough structure of the local view,an not in the small details. This noise suppression method eliminates the need of a directionalfilter, which would require approximately 5 times as many computations.
The actions of the agent are the moves that it can make in the coordinate system of itslocal view. Since the agent is always approximately aligned with respect to the directionalfield, the forward action is always a move along the ridge-valley structures, and the agent doesnot need rotational or backward actions. To be able to achieve its goals, which is moving asfast as possible along the ridges and stopping at minutiae, the agent may move up to 4 pixelsforward at each step and up to 1 pixel to the left or to the right. The left-right actions arenecessary for keeping on the ridge. Although the directional field puts the agent in the rightdirection, it is not sufficient to keep the agent exactly on the ridges. The action results in anew position in the fingerprint, after which a new local view is extracted at that position.
The reward structure is another key element in the definition of an RL experiment. Itdetermines the optimal actions for the agent to take. Setting up the right reward structure isvery important for learning the (right) task. First, the agent receives rewards for staying atthe center of a ridge. This is implemented by manually marking the ridge centers and usingan exponential Gaussian function of the distance of the agent to the ridge center. Second, amuch higher reward is given near the endpoints to be detected. Again a Gaussian function
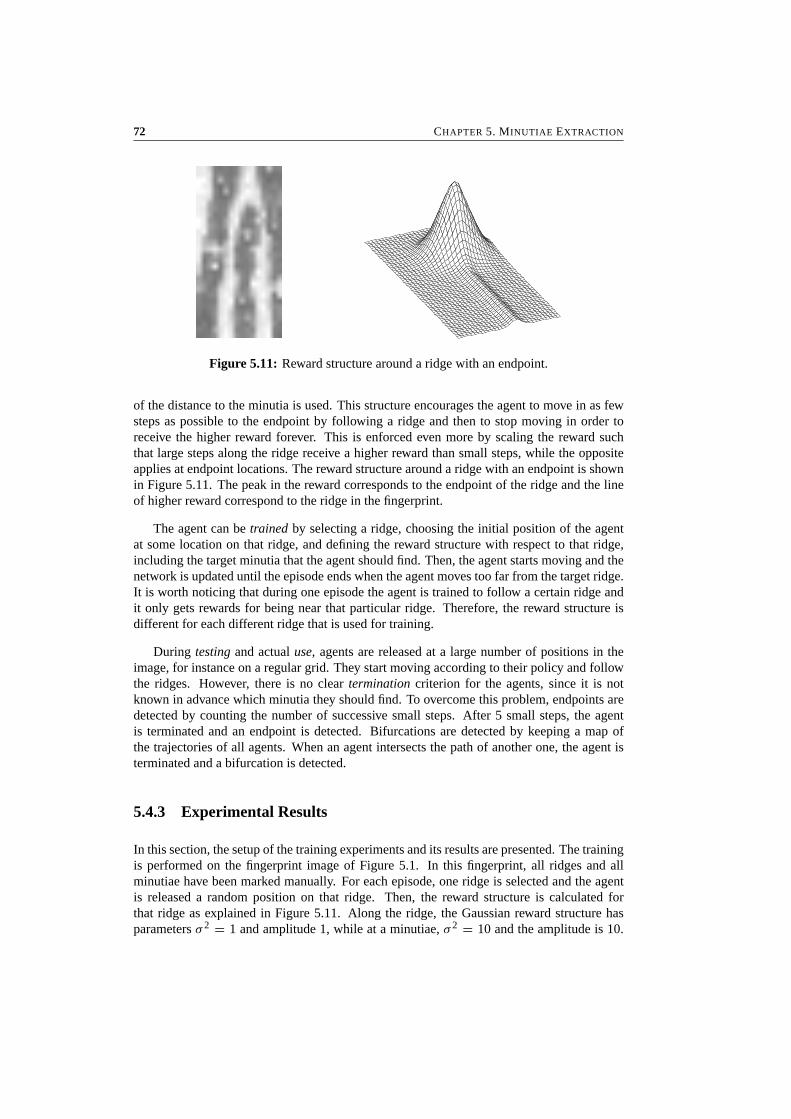
72 CHAPTER 5. MINUTIAE EXTRACTION
Figure 5.11: Reward structure around a ridge with an endpoint.
of the distance to the minutia is used. This structure encourages the agent to move in as fewsteps as possible to the endpoint by following a ridge and then to stop moving in order toreceive the higher reward forever. This is enforced even more by scaling the reward suchthat large steps along the ridge receive a higher reward than small steps, while the oppositeapplies at endpoint locations. The reward structure around a ridge with an endpoint is shownin Figure 5.11. The peak in the reward corresponds to the endpoint of the ridge and the lineof higher reward correspond to the ridge in the fingerprint.
The agent can be trained by selecting a ridge, choosing the initial position of the agentat some location on that ridge, and defining the reward structure with respect to that ridge,including the target minutia that the agent should find. Then, the agent starts moving and thenetwork is updated until the episode ends when the agent moves too far from the target ridge.It is worth noticing that during one episode the agent is trained to follow a certain ridge andit only gets rewards for being near that particular ridge. Therefore, the reward structure isdifferent for each different ridge that is used for training.
During testing and actual use, agents are released at a large number of positions in theimage, for instance on a regular grid. They start moving according to their policy and followthe ridges. However, there is no clear termination criterion for the agents, since it is notknown in advance which minutia they should find. To overcome this problem, endpoints aredetected by counting the number of successive small steps. After 5 small steps, the agentis terminated and an endpoint is detected. Bifurcations are detected by keeping a map ofthe trajectories of all agents. When an agent intersects the path of another one, the agent isterminated and a bifurcation is detected.
5.4.3 Experimental Results
In this section, the setup of the training experiments and its results are presented. The trainingis performed on the fingerprint image of Figure 5.1. In this fingerprint, all ridges and allminutiae have been marked manually. For each episode, one ridge is selected and the agentis released a random position on that ridge. Then, the reward structure is calculated forthat ridge as explained in Figure 5.11. Along the ridge, the Gaussian reward structure hasparameters σ 2 = 1 and amplitude 1, while at a minutiae, σ 2 = 10 and the amplitude is 10.
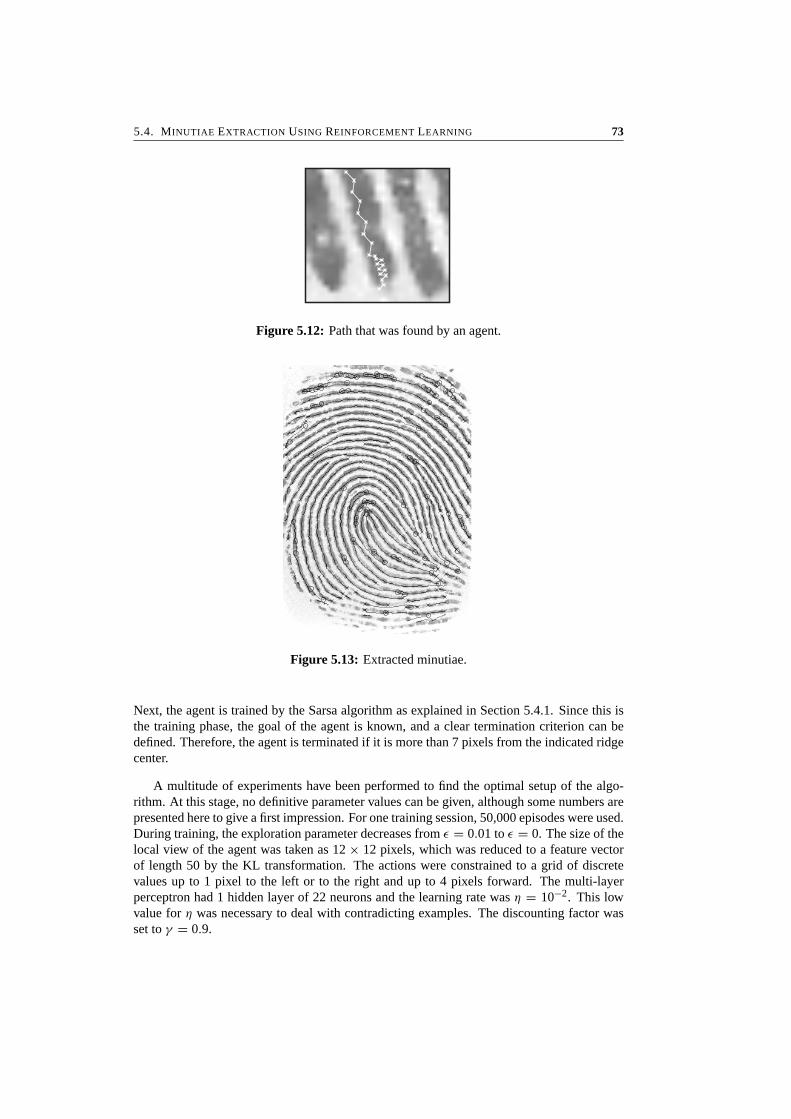
5.4. MINUTIAE EXTRACTION USING REINFORCEMENT LEARNING 73
Figure 5.12: Path that was found by an agent.
Figure 5.13: Extracted minutiae.
Next, the agent is trained by the Sarsa algorithm as explained in Section 5.4.1. Since this isthe training phase, the goal of the agent is known, and a clear termination criterion can bedefined. Therefore, the agent is terminated if it is more than 7 pixels from the indicated ridgecenter.
A multitude of experiments have been performed to find the optimal setup of the algo-rithm. At this stage, no definitive parameter values can be given, although some numbers arepresented here to give a first impression. For one training session, 50,000 episodes were used.During training, the exploration parameter decreases from ε = 0.01 to ε = 0. The size of thelocal view of the agent was taken as 12 × 12 pixels, which was reduced to a feature vectorof length 50 by the KL transformation. The actions were constrained to a grid of discretevalues up to 1 pixel to the left or to the right and up to 4 pixels forward. The multi-layerperceptron had 1 hidden layer of 22 neurons and the learning rate was η = 10−2. This lowvalue for η was necessary to deal with contradicting examples. The discounting factor wasset to γ = 0.9.
74 CHAPTER 5. MINUTIAE EXTRACTION
Testing was performed on other fingerprints as described in Section 5.4.2. Starting pointshave been selected at a regular grid and the agents follow their policy until termination. Hu-man inspection of the results, shown in Figures 5.12 and 5.13, indicates that the agent followsthe ridges and that all minutiae have been detected. The agent takes relatively large stepsalong the ridges, while the step size decreases near the endpoints. Furthermore, it intersectsits own path at bifurcations. However, the figure also shows a number of false minutiae.These might be eliminated by further training of the agent on other fingerprints and fine-tuning of the parameters. Another possibility is the application of post-processing techniquesto eliminate false minutiae structures.
5.4.4 Conclusions
In this section we showed that reinforcement learning is a useful and intuitive way to tacklethe problem of robust minutiae extraction from fingerprints. This new combination is nowin its proof-of-concept phase. It has been shown that an adaptive agent can be trained towalk along the ridges in a fingerprint and mark minutiae when encountered. The systemuses straightforward reinforcement learning techniques. There is still much room for finetuning parameters and algorithms. An experimental study on a variety of parameters andother learning algorithms, like Q(λ)-learning, is recommended.
The use of value-based RL algorithms can turn out to be not the best choice in our appli-cation. The similar local views on different places on the ridges create a kind of partially-observable state representation, which did not cause severe problems in our case though. Itmight be better to search directly for a policy by using policy gradient [Sut00] methods or touse relative Q-values instead.
5.5 Evaluation of Minutiae Extraction Algorithms
Unfortunately, no common benchmarks are available in the literature for assessing the qualityof minutiae extraction methods. To fill this lack of a common procedure, a method is proposedin this section that can be used well in practice. It does not require manual labelling of groundtruth minutiae, it is based on the functional requirements to minutiae extraction algorithms,i.e. it evaluates the consistency of the extracted minutiae over different prints of the samefinger, and it provides maximal feedback of the types of extraction errors that are made. Foreach extracted minutia, it indicates whether it is a false, missed, displaced or genuine minutia.First, the two naive methods are discussed in Section 5.5.1. Then, a new method is proposedin Section 5.5.2.
5.5.1 Naive Methods
At first thought, two simple methods, both featuring other disadvantages, can be used. Thefirst method is to extract all minutiae from a large test set of fingerprints manually. The minu-tiae extraction algorithm is applied to this set, and the number of false and missed minutiae
5.6. CONCLUSIONS 75
is counted. Additionally, statistics of the displacements of genuine minutiae can be collected.This method has two clear disadvantages. First, it involves a lot of manual labelling, whichis not the most favorite job of many researchers. Second, this method selects the algorithmthat best approximates the subjective, manually determined, ground truth. However, this par-ticular algorithm may not achieve the best matching performance. For matching purposes,consistency of the extracted minutiae is more important.
The second method is to compare different minutiae extraction algorithms functionally.The minutiae extraction algorithms are evaluated by combining them with the same minutiaematching algorithm. The combination that achieves the best fingerprint matching perfor-mance apparently used the best minutiae extraction algorithm. Again, two disadvantages ofthis method can be identified. First, the evaluation of a small change in the minutiae ex-traction algorithm requires an extensive matching experiment, which may take several hours.Second, the only feedback of this method is which algorithm is superior, without details ofthe numbers and types of minutiae extraction errors that made in specific situations.
5.5.2 Elastic Method
The method that is proposed here, combines parts of both methods that are described above.It first extracts the minutiae sets from a number of different prints of the same finger. Next,the minutiae sets are matched by the elastic minutiae matching algorithm that is proposed inChapter 6. Finally, correspondences and differences between the elastically registered minu-tiae sets are used to classify the minutiae as false, missed, displaced or genuine. This methodcannot be used without the elastic matching algorithm, which compensates for elastic defor-mations. For a rigid matching algorithm, minutiae displacements due to elastic deformationswould dominate the errors in the minutiae extraction.
The proposed method combines the advantages of both naive methods, without beingsubject to their disadvantages. It does not require manual labelling of ground truth minutiae, itis based on the functional requirements to minutiae extraction algorithms, i.e. it evaluates theconsistency of the extracted minutiae over different prints of the same finger, and it providesmaximal feedback of the types of extraction errors that are made: for each extracted minutia,it indicates whether it is a false, missed, displaced or genuine minutia.
The different minutiae extraction methods that are discussed in this chapter, have notyet been optimized and evaluated extensively using the proposed method. Instead, initialestimates of the parameters have been determined by manual inspection, while some fine-tuning has been done using matching performance experiments. However, for more extensiveevaluation and fine-tuning, the proposed method should be used.
5.6 Conclusions
At the moment, traditional minutiae extraction is the preferred method, compared to otherapproaches. The approach that has been proposed in this chapter combines an efficient im-plementation of Gabor enhancement, binarization, thinning, extraction and heuristic postpro-

76 CHAPTER 5. MINUTIAE EXTRACTION
cessing, which leads to satisfactory results. Enhancement techniques and segmentation toremove background and low-quality areas remain critical issues to be solved. Other chal-lenges may include the reconstruction of low-quality areas for minutiae extraction from thoseregions.
Two alternative minutiae extraction methods have been investigated. The approach thatuses reinforcement learning performs at a lower level than the traditional method, while theapproach that uses genetic programming is not robust at all.

Part II
Matching


Chapter 6
Elastic Minutiae Matching UsingThin-Plate Splines
Abstract
This chapter presents a novel minutiae matching method that describes elastic distortionsin fingerprints by means of a thin-plate spline model, which is estimated using a local and aglobal matching stage. After registration of the fingerprints according to the estimated model,the number of matching minutiae can be counted using very tight matching thresholds. Fordeformed fingerprints, the algorithm gives considerably higher matching scores compared torigid matching algorithms, while only taking 100 ms on a 1 GHz P-III machine. Furthermore,it is shown that the observed deformations in practice are different from those described by thetheoretical model that is proposed in the literature. Parts of this chapter have been publishedin [Baz02e], [Baz02b], and [Baz02c].
80 CHAPTER 6. ELASTIC MINUTIAE MATCHING USING THIN-PLATE SPLINES
6.1 Introduction
The topic of this chapter is fingerprint matching, which is the task of comparing a test fin-gerprint that is provided by the user, to a template fingerprint that is provided earlier, duringenrollment. Most fingerprint matching systems are based on the minutiae, which are the end-points and bifurcations of the elevated line structures in the fingerprint that are called ridges.A minutiae-based fingerprint matching system roughly consists of two stages. In the minu-tiae extraction stage, the minutiae are extracted from the gray-scale fingerprint, while in theminutiae matching stage, two sets of minutiae are compared in order to decide whether thefingerprints match. This chapter deals with the compensation of elastic distortions to improvethe performance of minutiae matching.
In minutiae matching, two stages can be distinguished. First, registration aligns both fin-gerprints as well as possible. Most algorithms use a combination of translation, rotation andscaling for this task. In the rest of this chapter, one global transformation for the whole finger-print that is based on rotation, translation and scaling only will be called rigid. A non-rigidtransformation for registration will be called elastic. After registration, the matching scoreis determined by counting the corresponding minutiae pairs that are present in both finger-prints. Two minutiae correspond if a minutia from the test set is located within a boundingbox or tolerance zone around a minutia from the template set. The matching score, which isa number in the range from 0 to 1, is calculated as the number of matched minutiae dividedby the total number of minutiae.
Unfortunately, there are a lot of complicating factors in minutiae matching. First of all,both sets may suffer from false, missed and displaced minutiae, caused by imperfections inthe minutiae extraction stage. Second, the two fingerprints to be compared may originatefrom a different part of the same finger, which means that both sets overlap only partially.Third, the two prints may be translated, rotated and scaled with respect to each other. Thefourth problem is the presence of non-linear elastic deformations (also called plastic distor-tions) in the fingerprints, which is the most difficult problem to solve. The method that isproposed in this chapter solves all these problems, while specifically addressing the elasticdeformations.
This chapter is organized as follows. First, in Section 6.2, elastic deformations are dis-cussed and an overview is given of other matching methods that try to deal with them. Next,in Section 6.3, an elastic minutiae matching algorithm is proposed that estimates a defor-mation model and uses this model for improved minutiae matching. Finally, in Section 6.4,experimental results of the elastic minutiae matching algorithm are given.
6.2 Elastic Deformations
Elastic distortions are caused by the acquisition process itself. During capturing, the 3-dimensional elastic surface of a finger is pressed onto a flat sensor surface. This 3D-to-2Dmapping of the finger skin introduces non-linear distortions, especially when forces are ap-plied that are not orthogonal to the sensor surface. This is especially a realistic situation whendealing with non-cooperative users that deliberately apply excessive force in order to create
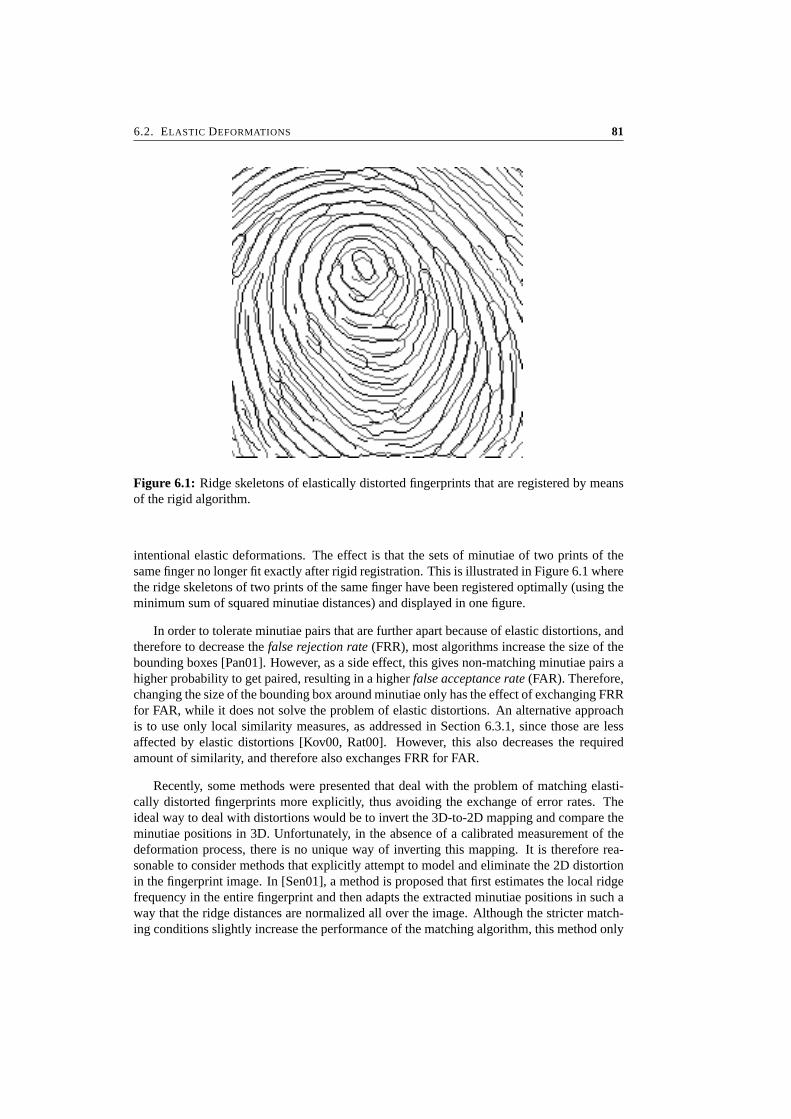
6.2. ELASTIC DEFORMATIONS 81
Figure 6.1: Ridge skeletons of elastically distorted fingerprints that are registered by meansof the rigid algorithm.
intentional elastic deformations. The effect is that the sets of minutiae of two prints of thesame finger no longer fit exactly after rigid registration. This is illustrated in Figure 6.1 wherethe ridge skeletons of two prints of the same finger have been registered optimally (using theminimum sum of squared minutiae distances) and displayed in one figure.
In order to tolerate minutiae pairs that are further apart because of elastic distortions, andtherefore to decrease the false rejection rate (FRR), most algorithms increase the size of thebounding boxes [Pan01]. However, as a side effect, this gives non-matching minutiae pairs ahigher probability to get paired, resulting in a higher false acceptance rate (FAR). Therefore,changing the size of the bounding box around minutiae only has the effect of exchanging FRRfor FAR, while it does not solve the problem of elastic distortions. An alternative approachis to use only local similarity measures, as addressed in Section 6.3.1, since those are lessaffected by elastic distortions [Kov00, Rat00]. However, this also decreases the requiredamount of similarity, and therefore also exchanges FRR for FAR.
Recently, some methods were presented that deal with the problem of matching elasti-cally distorted fingerprints more explicitly, thus avoiding the exchange of error rates. Theideal way to deal with distortions would be to invert the 3D-to-2D mapping and compare theminutiae positions in 3D. Unfortunately, in the absence of a calibrated measurement of thedeformation process, there is no unique way of inverting this mapping. It is therefore rea-sonable to consider methods that explicitly attempt to model and eliminate the 2D distortionin the fingerprint image. In [Sen01], a method is proposed that first estimates the local ridgefrequency in the entire fingerprint and then adapts the extracted minutiae positions in such away that the ridge distances are normalized all over the image. Although the stricter match-ing conditions slightly increase the performance of the matching algorithm, this method only
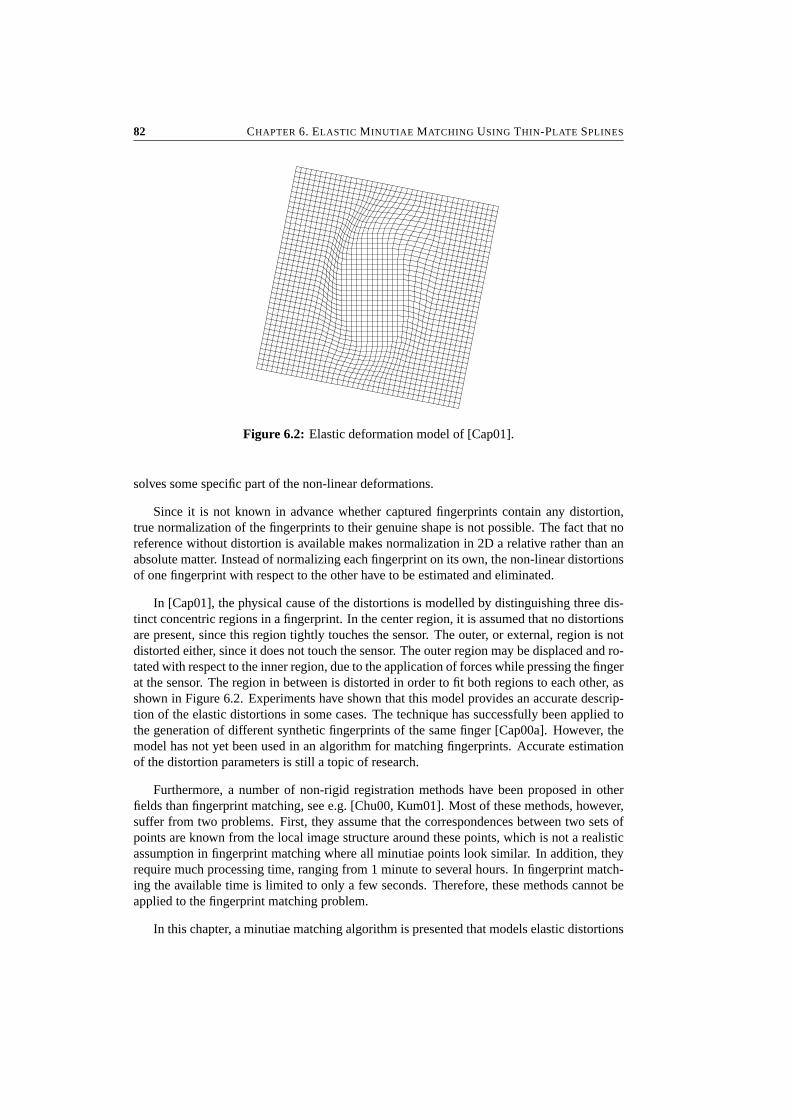
82 CHAPTER 6. ELASTIC MINUTIAE MATCHING USING THIN-PLATE SPLINES
Figure 6.2: Elastic deformation model of [Cap01].
solves some specific part of the non-linear deformations.
Since it is not known in advance whether captured fingerprints contain any distortion,true normalization of the fingerprints to their genuine shape is not possible. The fact that noreference without distortion is available makes normalization in 2D a relative rather than anabsolute matter. Instead of normalizing each fingerprint on its own, the non-linear distortionsof one fingerprint with respect to the other have to be estimated and eliminated.
In [Cap01], the physical cause of the distortions is modelled by distinguishing three dis-tinct concentric regions in a fingerprint. In the center region, it is assumed that no distortionsare present, since this region tightly touches the sensor. The outer, or external, region is notdistorted either, since it does not touch the sensor. The outer region may be displaced and ro-tated with respect to the inner region, due to the application of forces while pressing the fingerat the sensor. The region in between is distorted in order to fit both regions to each other, asshown in Figure 6.2. Experiments have shown that this model provides an accurate descrip-tion of the elastic distortions in some cases. The technique has successfully been applied tothe generation of different synthetic fingerprints of the same finger [Cap00a]. However, themodel has not yet been used in an algorithm for matching fingerprints. Accurate estimationof the distortion parameters is still a topic of research.
Furthermore, a number of non-rigid registration methods have been proposed in otherfields than fingerprint matching, see e.g. [Chu00, Kum01]. Most of these methods, however,suffer from two problems. First, they assume that the correspondences between two sets ofpoints are known from the local image structure around these points, which is not a realisticassumption in fingerprint matching where all minutiae points look similar. In addition, theyrequire much processing time, ranging from 1 minute to several hours. In fingerprint match-ing the available time is limited to only a few seconds. Therefore, these methods cannot beapplied to the fingerprint matching problem.
In this chapter, a minutiae matching algorithm is presented that models elastic distortions

6.3. THE MATCHING ALGORITHM 83
by means of a thin-plate spline model, based on the locations and orientations of the extractedminutiae. This model is used to normalize the shape of the test fingerprint with respect to thetemplate. It is therefore able to deal with elastically distorted fingerprints. As a consequence,the distances between the corresponding minutiae are much smaller and tighter boundingboxes can be used in the counting stage. This results in an algorithm that is able to decreaseFAR and FRR simultaneously.
6.3 The Matching Algorithm
The elastic minutiae matching algorithm estimates the non-linear transformation model intwo stages. The local matching that is presented in Section 6.3.1 determines which minutiaecould possibly form a matching pair, based on local similarity measures. Without the localmatching stage, each minutia in the test set could correspond to each minutia in the templateset. This means that a problem with too many degrees of freedom would have to be solved inthe subsequent global matching stage, that is presented in Section 6.3.2. The global matchingstage uses the possible correspondences to estimate a global non-rigid transformation thatis used to register the two fingerprints. After registration, the corresponding minutiae arecounted using bounding boxes that can be chosen rather strictly since the distance betweencorresponding minutiae after elastic registration is small.
6.3.1 Local Matching
The first step in the proposed matching algorithm is the comparison of local structures. Thesestructures can be compared easily since they contain few minutiae in a small area. In addition,since the structures originate from only a small area in a fingerprint, they are unlikely to beseriously deformed by elastic distortions. The local matching algorithm was inspired by theapproach that was described in [Jia00].
Each minutia m in the template and test fingerprints is described by parameters (x, y, θ),where (x, y) are the pixel coordinates of the minutia and θ is the orientation of the minutia.The orientation is estimated by tracing the ridges that leave the minutia (1 ridge for an end-point and 3 ridges for a bifurcation) over some distance and quantizing the obtained ridgedirections to either the directional field [Baz02d] or the opposite direction. For an endpoint,this directly gives the orientation and for a bifurcation, the orientation that occurs twice is se-lected. This is illustrated in Figure 6.3. The matching algorithm does not distinguish betweentypes of minutiae, because these can be easily interchanged by noise or pressure differencesduring acquisition. However, their orientations remain unchanged when this occurs.
Each minutia defines a number of local structures, which are called minutia neighbor-hoods. A minutia neighborhood consists of the minutia itself and two neighboring minu-tiae. When the reference minutia is called m0 and its closest neighbors with increasing dis-tance from m0 are m1, m2, . . . , mn−1, with n the number of minutiae, the neighborhoods{m0, m1, m2}, {m0, m1, m3} and {m0, m2, m3} are selected for each minutiae. Compared toselecting only one neighborhood, this provides more robustness in the local matching stagewith respect to false and missing minutiae.

84 CHAPTER 6. ELASTIC MINUTIAE MATCHING USING THIN-PLATE SPLINES
Figure 6.3: Estimation of the minutiae orientation.
The local matching algorithm compares each minutia neighborhood in the test fingerprintto each minutia neighborhood in the template fingerprint. First, the two structures are alignedusing a least squares algorithm that determines the optimal rotation, translation and scaling.Next, the scaling, the sum of the squared distances between the corresponding minutiae andthe differences of orientation are used to measure the similarity of the two minutia neigh-borhoods. If the structures are considered to match, the pair of minutia neighborhoods andthe transformation (t, r, s), consisting of translation t = (tx , ty), rotation r and scaling s, isstored.
After each minutia neighborhood in the test fingerprint has been compared to each minutianeighborhood in the template fingerprint, a list of corresponding minutia neighborhood pairsis obtained. Note that this list does not contain all true correspondences and that inclusionin this list does not necessarily indicate a true correspondence. However, its size gives a firstindication of the degree of similarity of the two fingerprints.
6.3.2 Global Matching
The next step is the determination of the global transformation that optimally registers thetwo fingerprints. This is called the global matching stage. From the list of local similarities,the global transformation is determined that is consistent with the largest number of matchingminutia neighborhood pairs. In general, this transformation also selects the largest number ofmatching minutiae pairs from the entire minutiae sets.
Several strategies to determine the optimal global transformation from the list of localtransformations exist. Those methods mainly differ in handling the difficulty of false and con-tradictory local matches. In [Jia00], the transformation of the single minutia neighborhoodpair that matches best, is taken. However, using more information of other local matcheswill certainly improve the accuracy of the registration. Another possibility is to quantize the
6.3. THE MATCHING ALGORITHM 85
local registration parameters into bins and construct an accumulator array that counts all oc-currences of each quantized registration. Next, the bin that occurs most is selected, and theaverage of all registrations in that bin is taken. This strategy roughly corresponds to the workof [Jai97b], although that method is not based on matching local minutia neighborhoods.
The method that is proposed here, achieves further improvement by determining the opti-mal registration parameters from the positions of the matching minutia neighborhoods insteadof averaging the individual registration parameters. First, the largest group of pairs that shareapproximately the same registration parameters is selected. This is achieved by determiningfor each matching pair the number of pairs of which the registration parameters differ lessthan a certain threshold. Next, the transformation (t, r, s) that optimally registers the selectedminutiae in the test set to the corresponding minutiae in template set is calculated in a leastsquares sense.
However, when applying this registration, elastically deformed fingerprints will not beregistered well, as shown in Figure 6.1, simply because an accurate rigid registration (t, r, s)does not exist. This has to be compensated for in the counting stage. It has been reported in[Pan01] that for 97.5% of the minutiae to match, a threshold on the Euclidean distance of twominutiae of r0 = 15 pixels has to be used in 500 dpi fingerprints. As a consequence, minutiaein a rather large part of the image (25% of the image for 30 minutiae in a 300 × 300 image)are considered to match even when they actually do not match.
In order to allow stricter matching, i.e. a smaller value of r0, elastic registration has to beused to compensate for elastic distortions. A transformation that is able to represent elasticdeformations is the thin-plate spline (TPS) model [Boo89]. This model has not been ap-plied earlier to fingerprint recognition. The TPS model describes the transformed coordinates(x ′, y′) both independently as a function of the original coordinates (x, y):
x ′ = fx (x, y) (6.1)
y′ = fy(x, y) (6.2)
Given the displacements of a number of landmark points (for fingerprint recognition, theminutiae can be used as such), the TPS model interpolates those points, while maintainingmaximal smoothness. The smoothness is represented by the bending energy of a thin metalplate. At each landmark point (x, y), the displacement is represented by an additional z-coordinate, and, for each point, the thin metal plate is fixed at position (x, y, z). The bendingenergy is given by the integral of the second order partial derivatives over the entire surfaceand can be minimized by solving a set of linear equations. Therefore, the TPS parameterscan be found very efficiently. The TPS model for one of the transformed coordinates is givenby parameter vectors a = [a1 a2 a3]T and w = [w1 · · · wn]T :
f (x, y) = a1 + a2x + a3 y +n∑
i=1
wiU (|Pi − (x, y)|) (6.3)
where U (r) = r2 log r is the basis function, a defines the affine part of the transformation,w gives an additional non-linear deformation, Pi are the landmarks that the TPS interpolates,
86 CHAPTER 6. ELASTIC MINUTIAE MATCHING USING THIN-PLATE SPLINES
and n is the number of landmarks. More details on the estimation of thin-plate splines isgiven in Appendix E.
In [Roh99], a method is presented to estimate approximating thin-plate splines. Thesesplines do not exactly interpolate all given points, but are allowed to approximate them infavor of a smoother transformation. The smoothness is controlled by a parameter λ, whichweights the optimization of landmark distance and smoothness. For λ = 0, there is fullinterpolation, while for very large λ, there is only an affine transformation left. More detailson approximating thin-plate splines is given in Appendix E.
In fingerprint matching, it is essential to use approximating thin plate splines, since thisintroduces some insensitivity to errors. For instance, minutiae may be displaced a few pixelsby the minutiae extraction algorithm or false local matches may be included into the globalmatching stage. Interpolating TPS will include these displacement errors into the registrationexactly, resulting in strange un-smooth transformations and incorrect extrapolations. Obvi-ously, a smoother transformation that does not take all small details into account is muchmore robust. In that case, the TPS registration represents the elastic distortions, while in thecounting stage, the threshold r0 takes care of local minutiae displacements.
The TPS model is fitted in a number of iterations. First, an initial model is fitted tothe minutiae in the minutia neighborhood pairs that were found in the local matching stage.Next, the corresponding minutiae in both sets, differing in location and orientation less thana threshold, are determined and a new model is fitted to those corresponding minutiae. Thisis repeated with a decreasing threshold r0 until the model has converged to its final state.This iterative process improves the quality of the non-linear registration considerably andincreases the matching score significantly. Finally, the matching score S is calculated by:
S = n2match
n1 · n2(6.4)
where nmatch is the number of matching minutiae, n1 the number of minutiae in the test fin-gerprint and n2 the number of minutiae in the template fingerprint. This expression providesthe best balance between false rejection and false acceptance for fingerprints that contain onlya small number of minutiae. The match or non-match decision is then taken by comparingthe matching score to a threshold.
Figure 6.4 shows the two deformed fingerprints after registration by means of thin-platesplines. The figure clearly shows the much more accurate registration with respect to theleftmost part. This means that a much lower threshold r0 can be used in the counting stage,leading to a considerably lower false acceptance rate.
6.4 Experimental Results
The proposed algorithm has been evaluated by applying it to Database 2 of FVC2000[Mai00, Mai02] and training Database 1 of FVC2002. The FVC2000 database consists of880 capacitive 8-bit gray-scale fingerprints, 8 prints of each of 110 distinct fingers. The im-
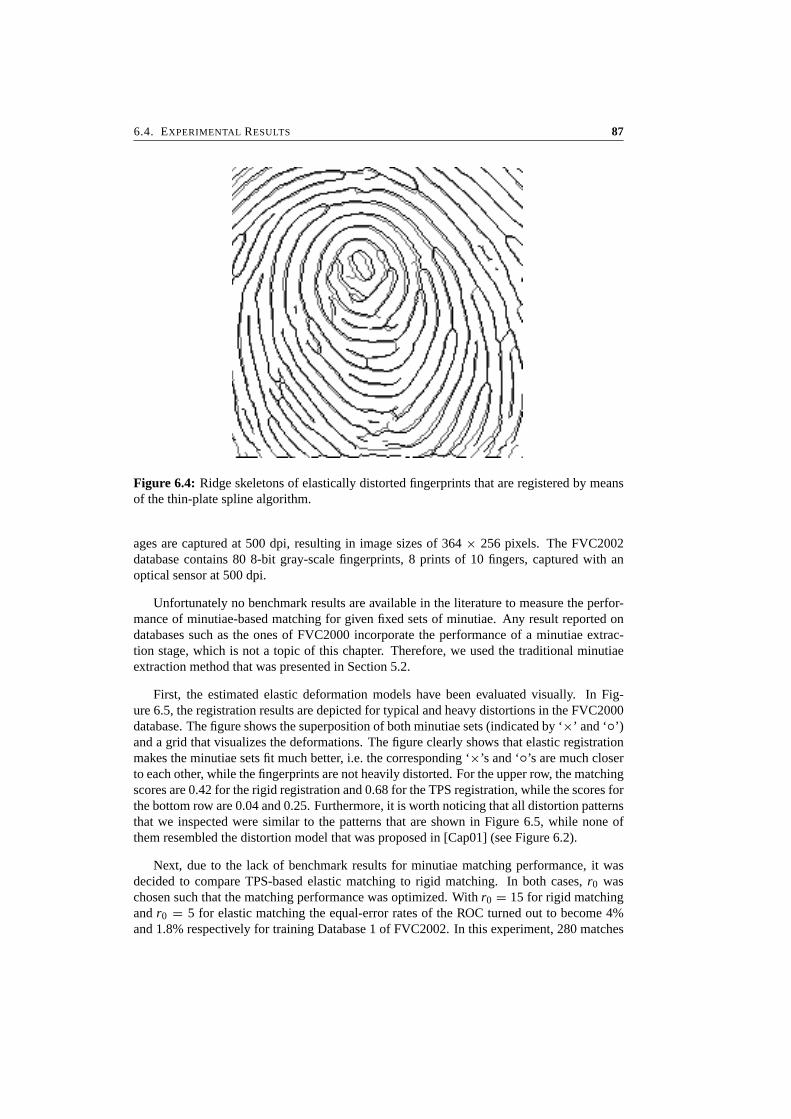
6.4. EXPERIMENTAL RESULTS 87
Figure 6.4: Ridge skeletons of elastically distorted fingerprints that are registered by meansof the thin-plate spline algorithm.
ages are captured at 500 dpi, resulting in image sizes of 364 × 256 pixels. The FVC2002database contains 80 8-bit gray-scale fingerprints, 8 prints of 10 fingers, captured with anoptical sensor at 500 dpi.
Unfortunately no benchmark results are available in the literature to measure the perfor-mance of minutiae-based matching for given fixed sets of minutiae. Any result reported ondatabases such as the ones of FVC2000 incorporate the performance of a minutiae extrac-tion stage, which is not a topic of this chapter. Therefore, we used the traditional minutiaeextraction method that was presented in Section 5.2.
First, the estimated elastic deformation models have been evaluated visually. In Fig-ure 6.5, the registration results are depicted for typical and heavy distortions in the FVC2000database. The figure shows the superposition of both minutiae sets (indicated by ‘×’ and ‘◦’)and a grid that visualizes the deformations. The figure clearly shows that elastic registrationmakes the minutiae sets fit much better, i.e. the corresponding ‘×’s and ‘◦’s are much closerto each other, while the fingerprints are not heavily distorted. For the upper row, the matchingscores are 0.42 for the rigid registration and 0.68 for the TPS registration, while the scores forthe bottom row are 0.04 and 0.25. Furthermore, it is worth noticing that all distortion patternsthat we inspected were similar to the patterns that are shown in Figure 6.5, while none ofthem resembled the distortion model that was proposed in [Cap01] (see Figure 6.2).
Next, due to the lack of benchmark results for minutiae matching performance, it wasdecided to compare TPS-based elastic matching to rigid matching. In both cases, r0 waschosen such that the matching performance was optimized. With r0 = 15 for rigid matchingand r0 = 5 for elastic matching the equal-error rates of the ROC turned out to become 4%and 1.8% respectively for training Database 1 of FVC2002. In this experiment, 280 matches
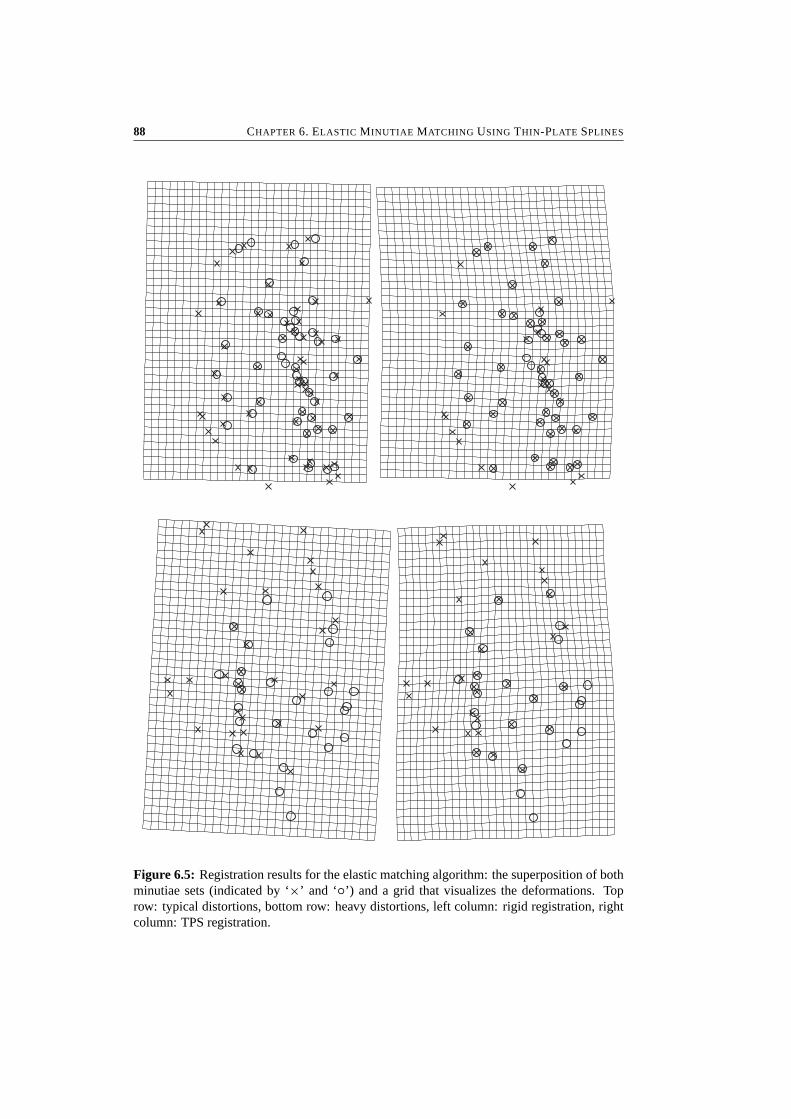
88 CHAPTER 6. ELASTIC MINUTIAE MATCHING USING THIN-PLATE SPLINES
Figure 6.5: Registration results for the elastic matching algorithm: the superposition of bothminutiae sets (indicated by ‘×’ and ‘◦’) and a grid that visualizes the deformations. Toprow: typical distortions, bottom row: heavy distortions, left column: rigid registration, rightcolumn: TPS registration.
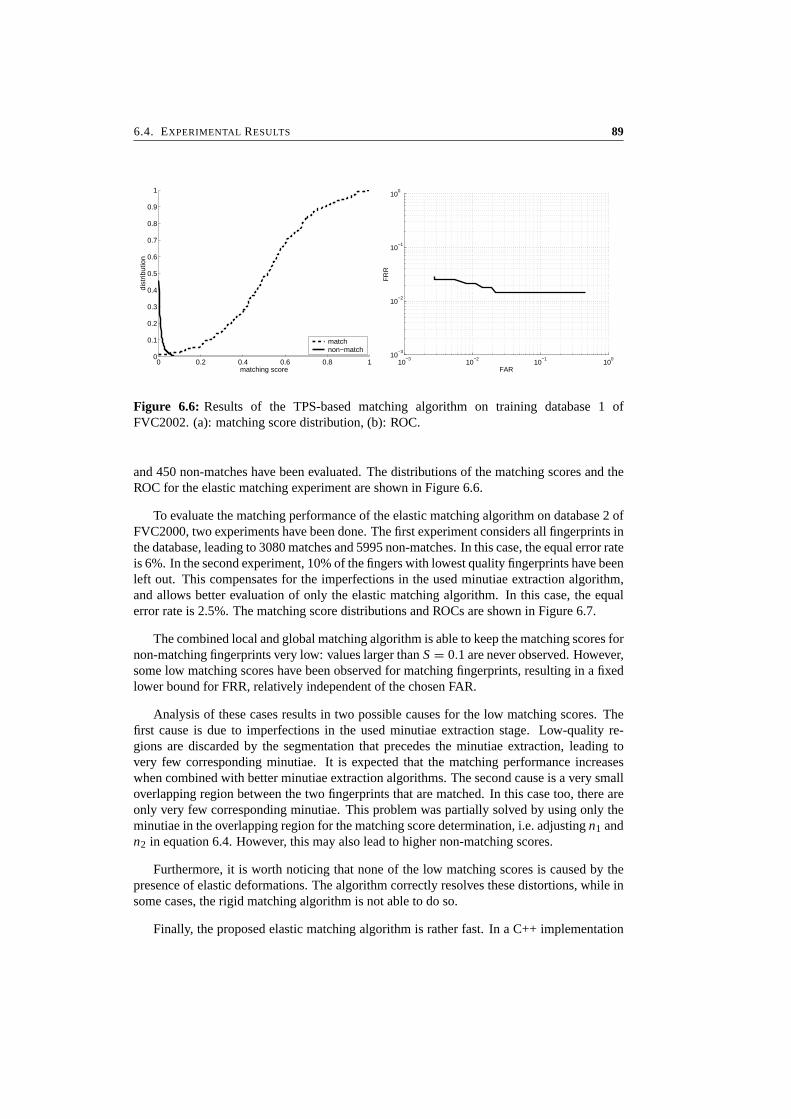
6.4. EXPERIMENTAL RESULTS 89
0 0.2 0.4 0.6 0.8 10
0.1
0.2
0.3
0.4
0.5
0.6
0.7
0.8
0.9
1
matching score
dist
ribut
ion
matchnon−match
10−3
10−2
10−1
100
10−3
10−2
10−1
100
FAR
FR
R
Figure 6.6: Results of the TPS-based matching algorithm on training database 1 ofFVC2002. (a): matching score distribution, (b): ROC.
and 450 non-matches have been evaluated. The distributions of the matching scores and theROC for the elastic matching experiment are shown in Figure 6.6.
To evaluate the matching performance of the elastic matching algorithm on database 2 ofFVC2000, two experiments have been done. The first experiment considers all fingerprints inthe database, leading to 3080 matches and 5995 non-matches. In this case, the equal error rateis 6%. In the second experiment, 10% of the fingers with lowest quality fingerprints have beenleft out. This compensates for the imperfections in the used minutiae extraction algorithm,and allows better evaluation of only the elastic matching algorithm. In this case, the equalerror rate is 2.5%. The matching score distributions and ROCs are shown in Figure 6.7.
The combined local and global matching algorithm is able to keep the matching scores fornon-matching fingerprints very low: values larger than S = 0.1 are never observed. However,some low matching scores have been observed for matching fingerprints, resulting in a fixedlower bound for FRR, relatively independent of the chosen FAR.
Analysis of these cases results in two possible causes for the low matching scores. Thefirst cause is due to imperfections in the used minutiae extraction stage. Low-quality re-gions are discarded by the segmentation that precedes the minutiae extraction, leading tovery few corresponding minutiae. It is expected that the matching performance increaseswhen combined with better minutiae extraction algorithms. The second cause is a very smalloverlapping region between the two fingerprints that are matched. In this case too, there areonly very few corresponding minutiae. This problem was partially solved by using only theminutiae in the overlapping region for the matching score determination, i.e. adjusting n1 andn2 in equation 6.4. However, this may also lead to higher non-matching scores.
Furthermore, it is worth noticing that none of the low matching scores is caused by thepresence of elastic deformations. The algorithm correctly resolves these distortions, while insome cases, the rigid matching algorithm is not able to do so.
Finally, the proposed elastic matching algorithm is rather fast. In a C++ implementation
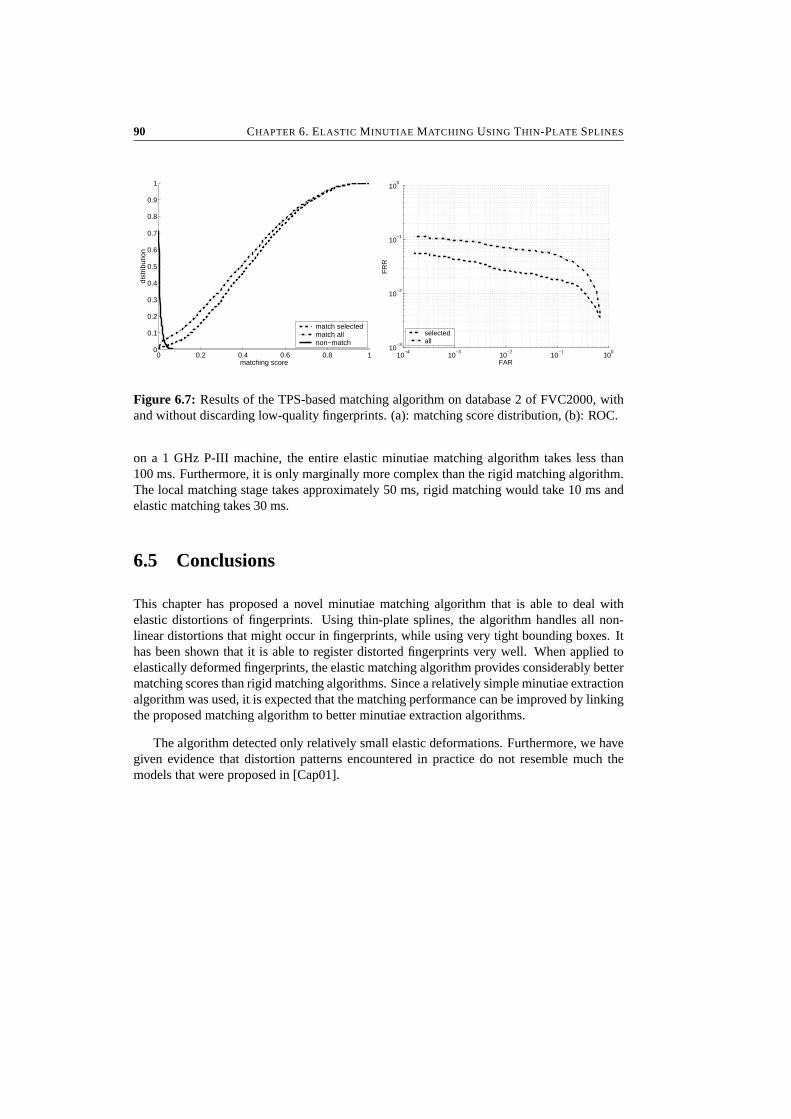
90 CHAPTER 6. ELASTIC MINUTIAE MATCHING USING THIN-PLATE SPLINES
0 0.2 0.4 0.6 0.8 10
0.1
0.2
0.3
0.4
0.5
0.6
0.7
0.8
0.9
1
matching score
dist
ribut
ion
match selectedmatch allnon−match
10−4
10−3
10−2
10−1
100
10−3
10−2
10−1
100
FAR
FR
R
selectedall
Figure 6.7: Results of the TPS-based matching algorithm on database 2 of FVC2000, withand without discarding low-quality fingerprints. (a): matching score distribution, (b): ROC.
on a 1 GHz P-III machine, the entire elastic minutiae matching algorithm takes less than100 ms. Furthermore, it is only marginally more complex than the rigid matching algorithm.The local matching stage takes approximately 50 ms, rigid matching would take 10 ms andelastic matching takes 30 ms.
6.5 Conclusions
This chapter has proposed a novel minutiae matching algorithm that is able to deal withelastic distortions of fingerprints. Using thin-plate splines, the algorithm handles all non-linear distortions that might occur in fingerprints, while using very tight bounding boxes. Ithas been shown that it is able to register distorted fingerprints very well. When applied toelastically deformed fingerprints, the elastic matching algorithm provides considerably bettermatching scores than rigid matching algorithms. Since a relatively simple minutiae extractionalgorithm was used, it is expected that the matching performance can be improved by linkingthe proposed matching algorithm to better minutiae extraction algorithms.
The algorithm detected only relatively small elastic deformations. Furthermore, we havegiven evidence that distortion patterns encountered in practice do not resemble much themodels that were proposed in [Cap01].
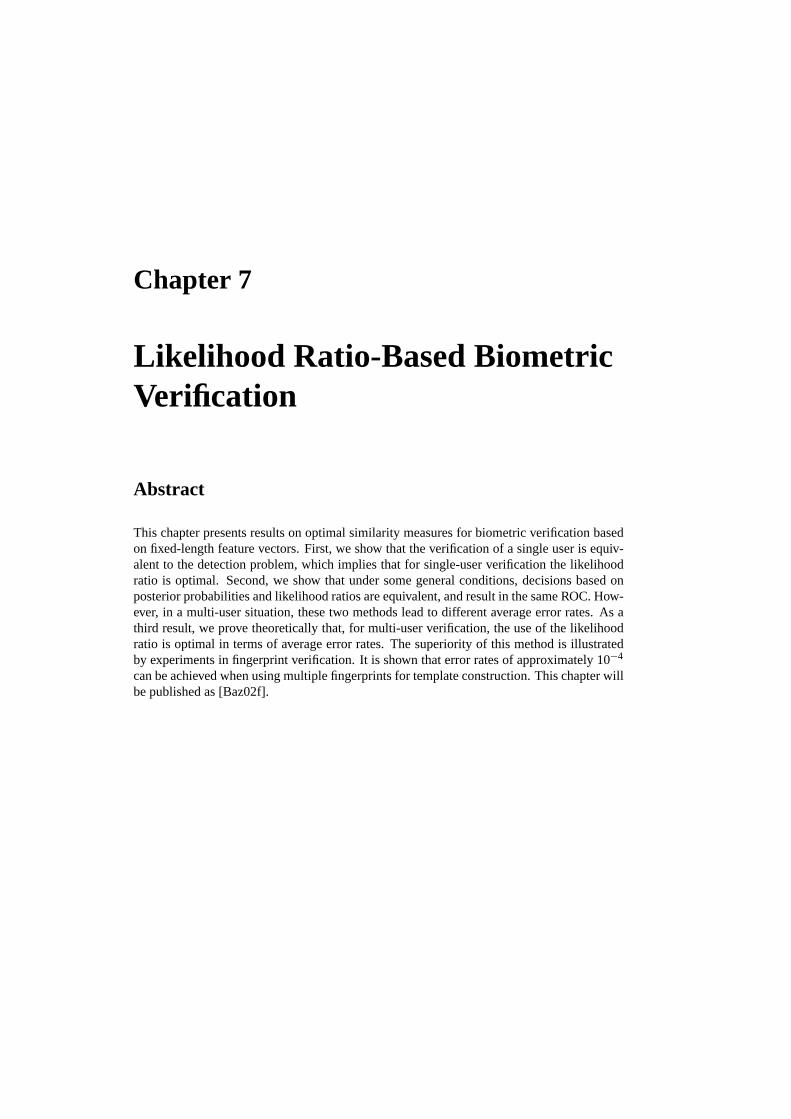
Chapter 7
Likelihood Ratio-Based BiometricVerification
Abstract
This chapter presents results on optimal similarity measures for biometric verification basedon fixed-length feature vectors. First, we show that the verification of a single user is equiv-alent to the detection problem, which implies that for single-user verification the likelihoodratio is optimal. Second, we show that under some general conditions, decisions based onposterior probabilities and likelihood ratios are equivalent, and result in the same ROC. How-ever, in a multi-user situation, these two methods lead to different average error rates. As athird result, we prove theoretically that, for multi-user verification, the use of the likelihoodratio is optimal in terms of average error rates. The superiority of this method is illustratedby experiments in fingerprint verification. It is shown that error rates of approximately 10−4
can be achieved when using multiple fingerprints for template construction. This chapter willbe published as [Baz02f].
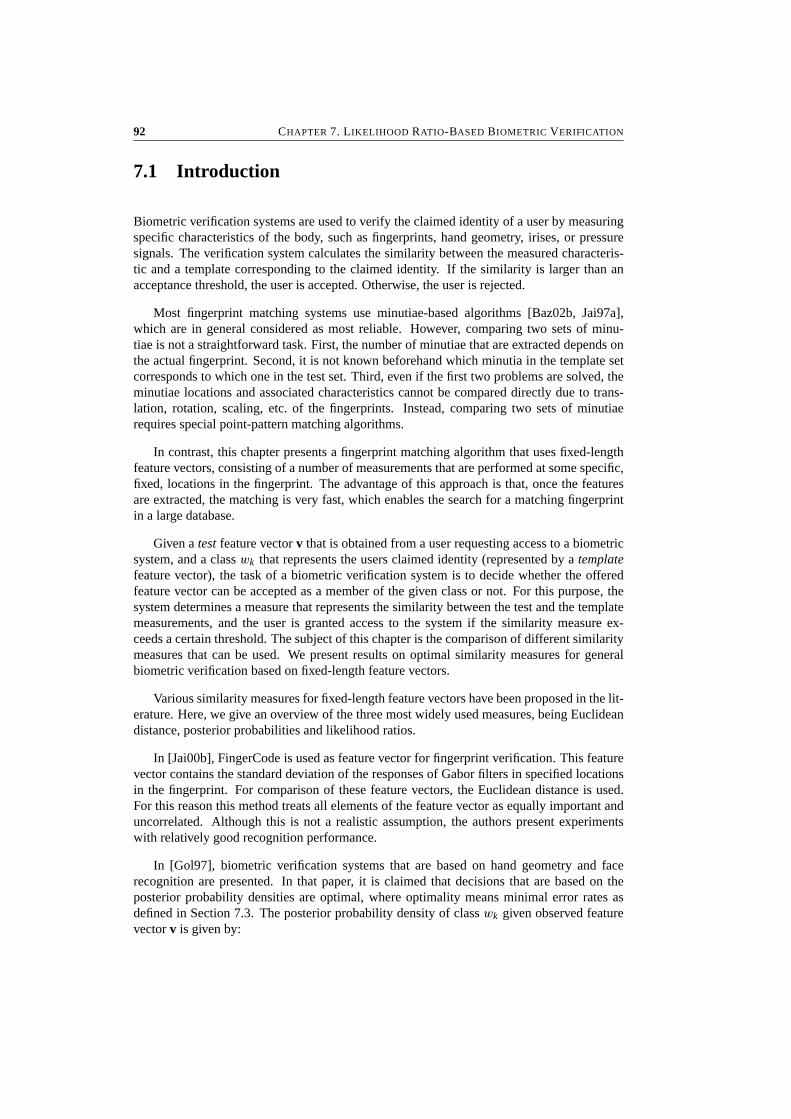
92 CHAPTER 7. LIKELIHOOD RATIO-BASED BIOMETRIC VERIFICATION
7.1 Introduction
Biometric verification systems are used to verify the claimed identity of a user by measuringspecific characteristics of the body, such as fingerprints, hand geometry, irises, or pressuresignals. The verification system calculates the similarity between the measured characteris-tic and a template corresponding to the claimed identity. If the similarity is larger than anacceptance threshold, the user is accepted. Otherwise, the user is rejected.
Most fingerprint matching systems use minutiae-based algorithms [Baz02b, Jai97a],which are in general considered as most reliable. However, comparing two sets of minu-tiae is not a straightforward task. First, the number of minutiae that are extracted depends onthe actual fingerprint. Second, it is not known beforehand which minutia in the template setcorresponds to which one in the test set. Third, even if the first two problems are solved, theminutiae locations and associated characteristics cannot be compared directly due to trans-lation, rotation, scaling, etc. of the fingerprints. Instead, comparing two sets of minutiaerequires special point-pattern matching algorithms.
In contrast, this chapter presents a fingerprint matching algorithm that uses fixed-lengthfeature vectors, consisting of a number of measurements that are performed at some specific,fixed, locations in the fingerprint. The advantage of this approach is that, once the featuresare extracted, the matching is very fast, which enables the search for a matching fingerprintin a large database.
Given a test feature vector v that is obtained from a user requesting access to a biometricsystem, and a class wk that represents the users claimed identity (represented by a templatefeature vector), the task of a biometric verification system is to decide whether the offeredfeature vector can be accepted as a member of the given class or not. For this purpose, thesystem determines a measure that represents the similarity between the test and the templatemeasurements, and the user is granted access to the system if the similarity measure ex-ceeds a certain threshold. The subject of this chapter is the comparison of different similaritymeasures that can be used. We present results on optimal similarity measures for generalbiometric verification based on fixed-length feature vectors.
Various similarity measures for fixed-length feature vectors have been proposed in the lit-erature. Here, we give an overview of the three most widely used measures, being Euclideandistance, posterior probabilities and likelihood ratios.
In [Jai00b], FingerCode is used as feature vector for fingerprint verification. This featurevector contains the standard deviation of the responses of Gabor filters in specified locationsin the fingerprint. For comparison of these feature vectors, the Euclidean distance is used.For this reason this method treats all elements of the feature vector as equally important anduncorrelated. Although this is not a realistic assumption, the authors present experimentswith relatively good recognition performance.
In [Gol97], biometric verification systems that are based on hand geometry and facerecognition are presented. In that paper, it is claimed that decisions that are based on theposterior probability densities are optimal, where optimality means minimal error rates asdefined in Section 7.3. The posterior probability density of class wk given observed featurevector v is given by:

7.1. INTRODUCTION 93
p(wk |v) = p(v|wk) · p(wk)
p(v)(7.1)
where p(v|wk) is the probability density of the feature vectors given class wk , p(wk) is theprobability density of the class wk , and p(v) is the prior probability density of the featurevectors. The feature vector v is accepted as member of the template class if its posteriorprobability density exceeds a threshold t ∈ [0, tmax].
On the other hand, in detection theory it is known since long that the use of likelihoodratios is asymptotically optimal [Tre68]. In detection, a given feature vector has to be classi-fied as originating from a predefined situation (the presence of some object to be detected) ornot. Since the detection problem is in some sense equivalent to the verification problem thatis considered here, it is to be expected that using likelihood ratios for biometric verificationis optimal as well. The likelihood ratio L(v) is given by:
L(v) = p(v|wk)
p(v|wk)(7.2)
where p(v|wk) is the probability of v, given v is not a member of class wk . Since we assumemany classes, exclusion of a single class wk does not change the distribution of the featurevector v. Therefore, the distribution of v, given v is not a member of wk , equals the priordistribution of v:
p(v|wk) = p(v) (7.3)
and the likelihood ratio is given by
L(v) = p(v|wk)
p(v)(7.4)
In this framework, a test feature vector v is accepted as member of the template class ifits likelihood ratio exceeds a threshold t ∈ [0,∞〉. The acceptance region Ak,t and rejectionregion Rk,t can be defined in the feature space V:
Ak,t = {v ∈ V | L(v) ≥ t} (7.5)
Rk,t = {v ∈ V | L(v) < t} (7.6)
The probability density functions in Expressions 7.4 and 7.1 are in practice usually mod-elled by multidimensional Gaussian distributions. More details of that case are given inAppendix F.
This chapter focusses on likelihood ratio-based biometric verification, and on the differ-ences in verification performance between posterior probability-based and likelihood ratio-based biometric systems. In Section 7.2, the general expressions for biometric system errors

94 CHAPTER 7. LIKELIHOOD RATIO-BASED BIOMETRIC VERIFICATION
are derived. Next, the optimality of likelihood ratio-based decisions is proved in Section 7.3.Then, Section 7.4 presents experimental results on fingerprint verification, confirming that us-ing likelihood ratios instead of posterior probability densities decreases the error rates, eventhough the feature vectors are the same for both decision methods.
7.2 Biometric System Errors
In this section, we derive expressions for the system errors, using likelihood ratio-based de-cisions, as a function of the probability density functions of the feature vectors.
7.2.1 False rejection rate
The false rejection rate (FRR) measures the probability that a feature vector is rejected as amember of some class, although it does originate from that class. For a specific class wk anda given threshold t , FRRk(t) is given by:
FRRk(t) = P(v ∈ Rk,t |v ∈ wk) =∫
Rk,t
p(v|wk)dv (7.7)
Since Ak,t + Rk,t = V, this can also be written as:
FRRk(t) = 1 −∫
Ak,t
p(v|wk)dv (7.8)
The (average) overall false rejection rate FRR(t) is found by integrating over all classes:
FRR(t) =∫
WFRRk(t) · p(wk)dwk (7.9)
where W is the space of all classes. The summation over all (discrete) classes is representedby a (continuous) integral to indicate the infinite number of classes.
7.2.2 False acceptance rate
The false acceptance rate (FAR) measures the probability that a feature vector is accepted asa member of some class, although it does not originate from that class. For a specific classwk and a given a threshold t , FARk(t) is given by:
FARk(t) = P(v ∈ Ak,t | v ∈ wi , i �= k) =∫
Ak,t
p(v)dv (7.10)

7.2. BIOMETRIC SYSTEM ERRORS 95
where again p(v|wk) = p(v) is used. Then, the (average) global false acceptance rate FAR(t)is found by integrating over all classes.
FAR(t) =∫
WFARk(t) · p(wk)dwk (7.11)
7.2.3 Receiver operating curve
The dependence of both error rates on the threshold can be visualized in a plot of FRR againstFAR for varying threshold values, which is called the receiver operating curve (ROC). In thissection, we derive an expression that describes the trade off between FAR and FRR for alikelihood ratio-based verification system. This derivation proceeds similar to the work in[Gol97] for posterior probabilities.
Let Ak,t be the acceptance region of class wk for threshold t and Ak,t−t the acceptanceregion of the same class for threshold t −t . If the threshold decreases, the acceptance regionincreases. Let Ak,t be the difference region
Ak,t = Ak,t−t − Ak,t (7.12)
for each v in the difference region we can write:
∀v ∈ Ak,t : t − t ≤ L(v) ≤ t (7.13)
By substituting Expression 7.4, this can be written as:
∀v ∈ Ak,t : (t − t) · p(v) ≤ p(v|wk) ≤ t · p(v) (7.14)
By integrating over the difference region:
(t − t) ·∫
Ak,t
p(v)dv ≤∫
Ak,t
p(v|wk)dv ≤ t ·∫
Ak,t
p(v)dv (7.15)
and introducing the differences in false acceptance rate and false rejection rate when thethreshold decreases from t to t − t :
FRRk(t) = −∫
Ak,t
p(v|wk)dv (7.16)
FARk(t) =∫
Ak,t
p(v)dv (7.17)

96 CHAPTER 7. LIKELIHOOD RATIO-BASED BIOMETRIC VERIFICATION
we obtain:
(t − t) · FARk(t) ≤ −FRRk(t) ≤ t · FARk(t) (7.18)
By letting t → 0, the inequalities become equalities, and FRRk(t) and FARk(t) go tozero as well. Then, we can write:
dFRRk(t)
dFARk(t)= −t (7.19)
which is a general result that describes the tradeoff between FAR and FRR for a likelihoodratio based decision system. The same expression has been derived in [Tre68] using othermethods.
7.3 Optimality of Likelihood Ratios
In this section, we prove that, for verification based on fixed-length feature vectors, the useof the likelihood ratio is optimal in terms of average overall error rates. In this context,optimality is defined as the lowest FAR for a given FRR, or alternatively the lowest FRR fora given FAR. First, we consider the less complex case of single-user verification, where thesystem has to decide whether or not an input feature vector originates from the only user thatis known to the system.
7.3.1 Single-User Verification
For single-user verification, there is one fixed distribution p(v|wk) of feature vectors from thegenuine user and one fixed distribution p(v) of feature vectors from impostors. This situationis equivalent to the detection problem, which implies that the likelihood ratio is optimal forsingle-user verification [Tre68].
The relation between the likelihood ratio and the posterior probability, which is derivedfrom Expressions 7.1 and 7.4, is given by:
p(wk |v) = p(wk) · L(v) (7.20)
Since there is only one user in the system, p(wk) is a constant, and both methods provide thesame error rates if the thresholds tp for posterior probability density and tL for likelihood ratioare set to tp = p(wk) · tL . This means that for single-user verification, both methods providethe same ROC, with a different threshold parameterization along the curve. This is shown inFigure 7.1, for instance by observing the leftmost curve, with the associated threshold valuesfor both methods.
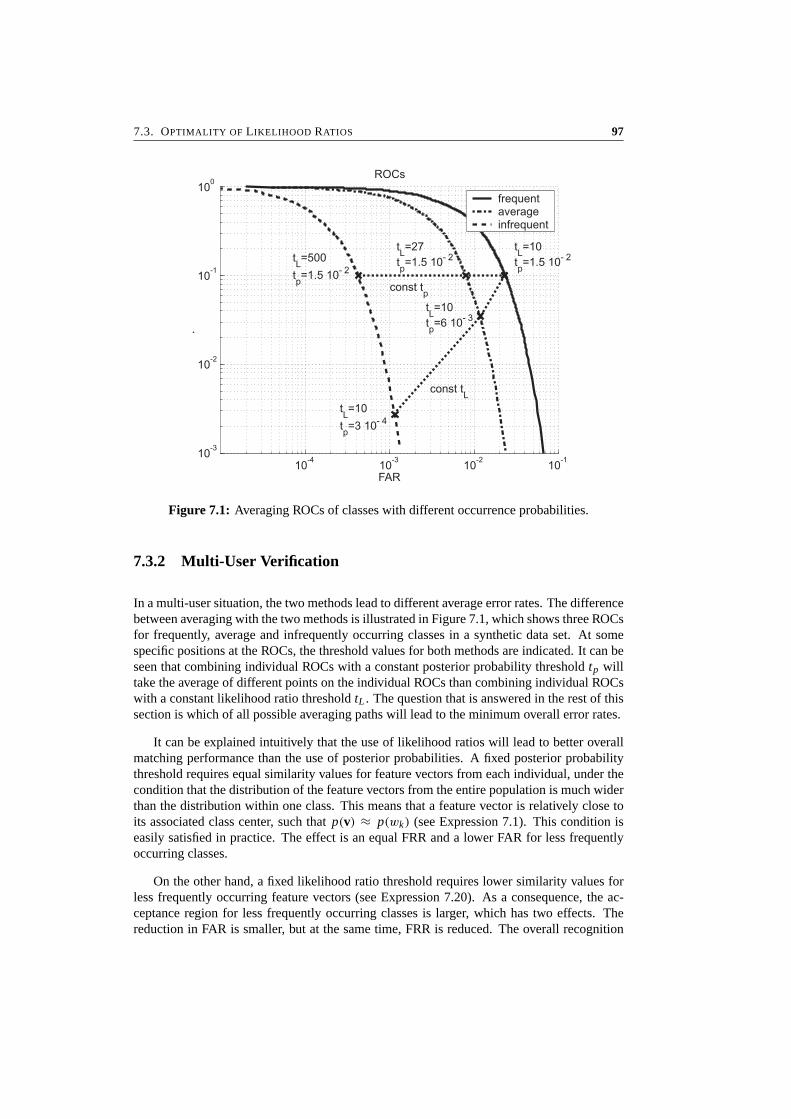
7.3. OPTIMALITY OF LIKELIHOOD RATIOS 97
Figure 7.1: Averaging ROCs of classes with different occurrence probabilities.
7.3.2 Multi-User Verification
In a multi-user situation, the two methods lead to different average error rates. The differencebetween averaging with the two methods is illustrated in Figure 7.1, which shows three ROCsfor frequently, average and infrequently occurring classes in a synthetic data set. At somespecific positions at the ROCs, the threshold values for both methods are indicated. It can beseen that combining individual ROCs with a constant posterior probability threshold tp willtake the average of different points on the individual ROCs than combining individual ROCswith a constant likelihood ratio threshold tL . The question that is answered in the rest of thissection is which of all possible averaging paths will lead to the minimum overall error rates.
It can be explained intuitively that the use of likelihood ratios will lead to better overallmatching performance than the use of posterior probabilities. A fixed posterior probabilitythreshold requires equal similarity values for feature vectors from each individual, under thecondition that the distribution of the feature vectors from the entire population is much widerthan the distribution within one class. This means that a feature vector is relatively close toits associated class center, such that p(v) ≈ p(wk) (see Expression 7.1). This condition iseasily satisfied in practice. The effect is an equal FRR and a lower FAR for less frequentlyoccurring classes.
On the other hand, a fixed likelihood ratio threshold requires lower similarity values forless frequently occurring feature vectors (see Expression 7.20). As a consequence, the ac-ceptance region for less frequently occurring classes is larger, which has two effects. Thereduction in FAR is smaller, but at the same time, FRR is reduced. The overall recognition

98 CHAPTER 7. LIKELIHOOD RATIO-BASED BIOMETRIC VERIFICATION
performance can be optimized by choosing the right trade-off between these two effects.
Next, we prove that using likelihood ratios in multi-user verification is optimal. First,define ϕ(L|wk) as the probability density function of the likelihood ratio of an observationvector v that is taken from the true class wk . Also, define ϕ(L|wk) as the probability densityfunction of the likelihood ratio of an observation vector v that is not taken from the true classwk . For these probability density functions, the following well-known relation holds [Tre68]:
ϕ(L|wk) = L · ϕ(L|wk) (7.21)
The error rates FRR and FAR for class wk , as a function of the threshold t , are given by
FRRk(t) =∫ t
0ϕ(L|wk)d L (7.22)
and
FARk(t) =∫ ∞
tϕ(L|wk)d L (7.23)
Next, we find expressions for the average FRR(t (wk)) and FAR(t (wk)) with a class-dependent threshold t (wk) by integrating over all classes:
FRR(t (wk)) =∫
Wp(wk)
∫ t (wk )
0ϕ(L|wk)d L dwk (7.24)
FAR(t (wk)) =∫
Wp(wk)
∫ ∞
t (wk )
ϕ(L|wk)d L dwk (7.25)
For optimal verification performance, the question is how to choose the threshold t as afunction of wk , such that the resulting ROC is minimal. This is solved by Lagrange optimiza-tion, see for instance [Moo00]. The objective is to minimize FRR, subject to the conditionof a constant FAR. The threshold is chosen as t = topt(wk) + ε f (wk), where topt(wk) is theoptimal threshold, f (wk) is some function of wk , ε is a small constant, and some specificvalue for FAR is chosen as additional condition. Then:
J =∫
Wp(wk)
∫ topt(wk )+ε f (wk )
0ϕ(L|wk)d L dwk
+ λ
[∫W
p(wk)
∫ ∞
topt(wk )+ε f (wk )
ϕ(L|wk)d L dwk − FAR(t)
](7.26)
has to be minimized by setting the derivative with respect to ε to zero:

7.4. EXPERIMENTAL RESULTS 99
∫W
p(wk)ϕ(topt(wk) + ε f (wk)|wk) f (wk)dwk −
λ
∫W
p(wk)ϕ(topt(wk) + ε f (wk)|wk) f (wk)dwk = 0 (7.27)
By realizing that this expression must hold for any f (wk), the integrals over all wk can beomitted. Furthermore, since topt is optimal, ε is equal to zero, which further simplifies theexpression to:
ϕ(topt(wk)|wk) − λϕ(topt(wk)|wk) = 0 (7.28)
Applying Expression 7.21 results in:
topt(wk)ϕ(topt(wk)|wk) − λϕ(topt(wk)|wk) = 0 (7.29)
which, by dividing both sides by ϕ(topt(wk)|wk) and rearranging the expression, gives:
topt(wk) = λ (7.30)
Since λ is a constant, the optimal threshold topt(wk) is constant too, independent of wk .Therefore, using a constant likelihood ratio threshold when averaging over the classes givesthe optimal verification results.
7.4 Experimental Results
In this section, results of fingerprint matching experiments are presented. The proposed sim-ilarity measures, being Euclidean distance, posterior probabilities and likelihood ratios, havebeen evaluated by applying them to Database 2 of FVC2000 [Mai02]. The FVC2000 databaseconsists of 880 8-bit gray-scale fingerprints, 8 prints of each of 110 different fingers. The im-ages are captured with a capacitive sensor at 500 dpi, resulting in image sizes of 364 by 256pixels.
7.4.1 Feature Vectors
We use two types of feature vectors that are extracted from the gray scale fingerprint images.The first feature vector is the squared directional field that is defined in Chapter 2, which iscalculated at a regular grid of 11 by 11 points with spacings of 8 pixels and is centered atthe core point (see Chapter 3). At each position in the grid, the squared directional field iscoded in a vector of two elements. The resulting feature vector of length 242 is reduced todimension 100 by principal component analysis over the entire population.

100 CHAPTER 7. LIKELIHOOD RATIO-BASED BIOMETRIC VERIFICATION
For approximately 10% of the fingerprints, the automatic core point extraction failed andfor those fingerprints, the location of the core point was adjusted manually. The automaticcore point extraction errors could be resolved by two related methods. First, feature vectorscould be extracted at many regularly spaced locations from the fingerprint. That one featurevector that results in the highest matching score is used. This solution is inspired by the fea-ture space correlation method that is described in [Ros02b]. Second, feature vectors could beextracted at each location where a (possibly false) core is detected. Again the best matchingfeature vector is used. This would save a lot of processing time compared to the first method.
The second feature vector is the Gabor response of the fingerprint, which is discussed inAppendix D. After substraction of the local mean, the fingerprint image is filtered by a set offour complex Gabor filters, which are given by:
hGabor(x, y) = exp
(− x2 + y2
2σ 2
)exp ( j2π f (x sin θ + y cos θ)) (7.31)
The orientations θ are set to 0, π/4, π/2, and 3π/4, the spatial frequency is set to f =0.125, which corresponds to a ridge-valley period of 8 pixels, and the width of the filter isset to σ = 3. The absolute values of the output images are taken, which are subsequentlyfiltered by a Gaussian window with σ = 6. Next, samples are taken at a regular grid of11 by 11 points with spacings of 8 pixels and centered at the core point. The resultingfeature vector of length 484 is reduced to dimension 200 by principal component analysis ofthe entire population. This feature vector is inspired by FingerCode [Jai00b], but it can becalculated more efficiently since a rectangular grid is used rather than a circular one (see also[Jai01, Ros02a]), and it performs slightly better.
7.4.2 Matching Experiments
To enable calculation of the posterior probability density and likelihood ratio, we assumeGaussian probability density functions with unequal means but equal covariance matrices forthe feature vectors from all individual classes. This covariance matrix represents the differ-ences between multiple prints of the same finger, like noise, partial impressions, and elasticdeformations. Another Gaussian probability density function is assumed for the feature vec-tors of the entire population, representing the differences between individual fingerprints. Forboth feature vectors, the inter class and intra class covariance matrices have been determinedfrom the fingerprints in our database. Then the matching scores of 3080 genuine attemptsand 5995 impostor attempts have been recorded.
The use of equal intra class covariance matrices for all users is motivated by the fact thatin a biometric system in practice, only one feature vector is available as template. Therefore,no user dependent covariance matrix can be determined, and the best approximation possibleis to use the average covariance matrix for all users.
There are a few motivations for using Gaussian distributions for the feature vectors. Ingeneral, measurements of natural features tend to a Gaussian distribution. Furthermore, asthe dimension of the feature vectors is reduced by principal component analysis, the fea-
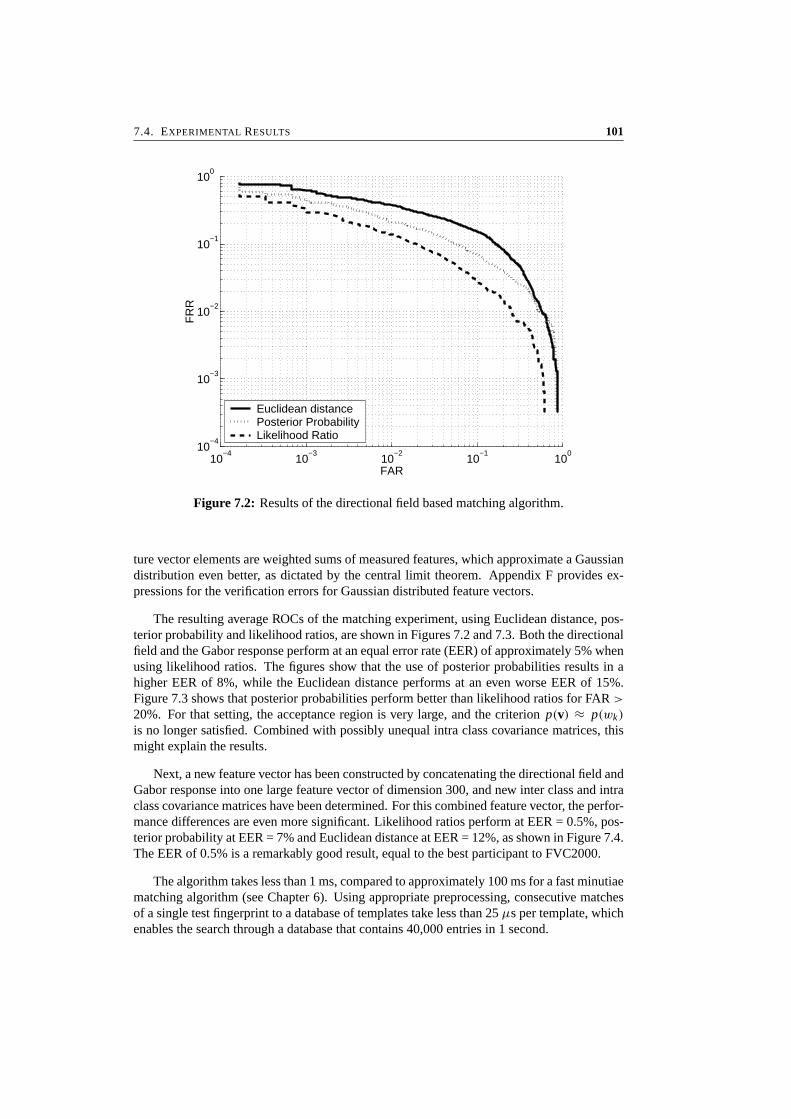
7.4. EXPERIMENTAL RESULTS 101
10−4
10−3
10−2
10−1
100
10−4
10−3
10−2
10−1
100
FAR
FR
R
Euclidean distancePosterior ProbabilityLikelihood Ratio
Figure 7.2: Results of the directional field based matching algorithm.
ture vector elements are weighted sums of measured features, which approximate a Gaussiandistribution even better, as dictated by the central limit theorem. Appendix F provides ex-pressions for the verification errors for Gaussian distributed feature vectors.
The resulting average ROCs of the matching experiment, using Euclidean distance, pos-terior probability and likelihood ratios, are shown in Figures 7.2 and 7.3. Both the directionalfield and the Gabor response perform at an equal error rate (EER) of approximately 5% whenusing likelihood ratios. The figures show that the use of posterior probabilities results in ahigher EER of 8%, while the Euclidean distance performs at an even worse EER of 15%.Figure 7.3 shows that posterior probabilities perform better than likelihood ratios for FAR >
20%. For that setting, the acceptance region is very large, and the criterion p(v) ≈ p(wk)
is no longer satisfied. Combined with possibly unequal intra class covariance matrices, thismight explain the results.
Next, a new feature vector has been constructed by concatenating the directional field andGabor response into one large feature vector of dimension 300, and new inter class and intraclass covariance matrices have been determined. For this combined feature vector, the perfor-mance differences are even more significant. Likelihood ratios perform at EER = 0.5%, pos-terior probability at EER = 7% and Euclidean distance at EER = 12%, as shown in Figure 7.4.The EER of 0.5% is a remarkably good result, equal to the best participant to FVC2000.
The algorithm takes less than 1 ms, compared to approximately 100 ms for a fast minutiaematching algorithm (see Chapter 6). Using appropriate preprocessing, consecutive matchesof a single test fingerprint to a database of templates take less than 25 µs per template, whichenables the search through a database that contains 40,000 entries in 1 second.
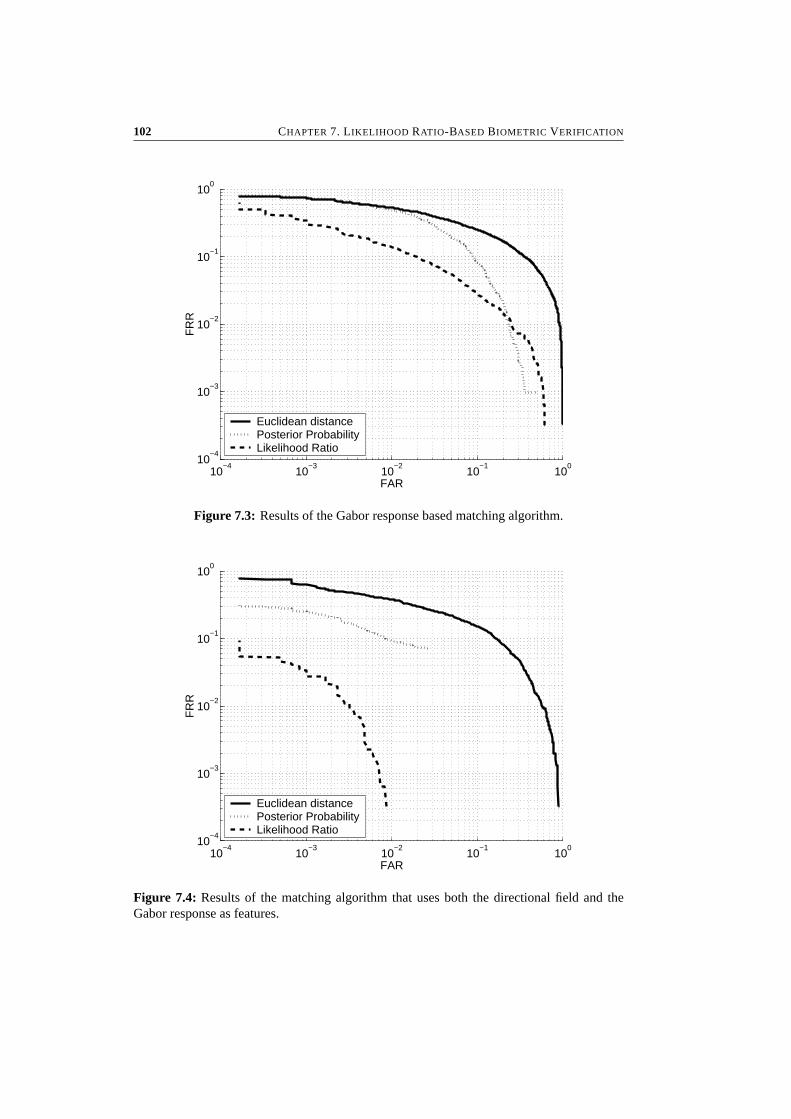
102 CHAPTER 7. LIKELIHOOD RATIO-BASED BIOMETRIC VERIFICATION
10−4
10−3
10−2
10−1
100
10−4
10−3
10−2
10−1
100
FAR
FR
R
Euclidean distancePosterior ProbabilityLikelihood Ratio
Figure 7.3: Results of the Gabor response based matching algorithm.
10−4
10−3
10−2
10−1
100
10−4
10−3
10−2
10−1
100
FAR
FR
R
Euclidean distancePosterior ProbabilityLikelihood Ratio
Figure 7.4: Results of the matching algorithm that uses both the directional field and theGabor response as features.
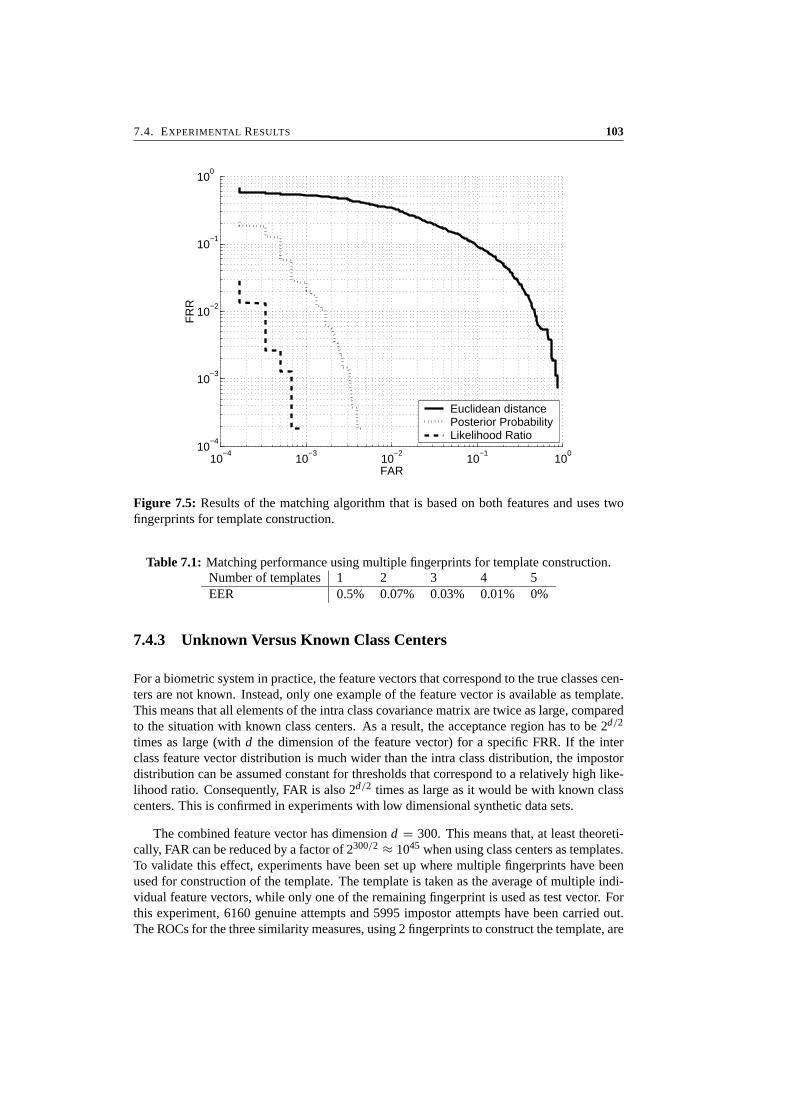
7.4. EXPERIMENTAL RESULTS 103
10−4
10−3
10−2
10−1
100
10−4
10−3
10−2
10−1
100
FAR
FR
R
Euclidean distancePosterior ProbabilityLikelihood Ratio
Figure 7.5: Results of the matching algorithm that is based on both features and uses twofingerprints for template construction.
Table 7.1: Matching performance using multiple fingerprints for template construction.Number of templates 1 2 3 4 5EER 0.5% 0.07% 0.03% 0.01% 0%
7.4.3 Unknown Versus Known Class Centers
For a biometric system in practice, the feature vectors that correspond to the true classes cen-ters are not known. Instead, only one example of the feature vector is available as template.This means that all elements of the intra class covariance matrix are twice as large, comparedto the situation with known class centers. As a result, the acceptance region has to be 2d/2
times as large (with d the dimension of the feature vector) for a specific FRR. If the interclass feature vector distribution is much wider than the intra class distribution, the impostordistribution can be assumed constant for thresholds that correspond to a relatively high like-lihood ratio. Consequently, FAR is also 2d/2 times as large as it would be with known classcenters. This is confirmed in experiments with low dimensional synthetic data sets.
The combined feature vector has dimension d = 300. This means that, at least theoreti-cally, FAR can be reduced by a factor of 2300/2 ≈ 1045 when using class centers as templates.To validate this effect, experiments have been set up where multiple fingerprints have beenused for construction of the template. The template is taken as the average of multiple indi-vidual feature vectors, while only one of the remaining fingerprint is used as test vector. Forthis experiment, 6160 genuine attempts and 5995 impostor attempts have been carried out.The ROCs for the three similarity measures, using 2 fingerprints to construct the template, are

104 CHAPTER 7. LIKELIHOOD RATIO-BASED BIOMETRIC VERIFICATION
shown in Figure 7.5, and the equal error rates for likelihood ratios with 1 to 5 fingerprints fortemplate construction are shown in Table 7.1. The table shows that the performance gain inpractice is not as large as it is in theory. But still, the matching performance can be increasedenormously by using multiple fingerprints for template construction.
Two more remarks have to be made on this subject. First, the performance is evaluated in adatabase of 880 fingerprints, using approximately 6000 genuine and 6000 impostor attempts.In this evaluation set, error rates smaller than 0.1% cannot be estimated reliably. Therefore,the 0% in Table 7.1 does not mean that we have implemented the perfect biometric system, butonly that it made no errors on our database. Second, the practical performance gain of usingmultiple feature vectors for template construction is smaller than the theoretic gain since theinter class covariance matrix is not much wider than the intra class covariance matrix for mostof the elements of the feature vector. Therefore, the assumption of a constant p(v) is not truein practice, and the performance gain is smaller than predicted.
7.5 Conclusions
In this chapter, we have shown that the verification of a single user is equivalent to the detec-tion problem, which implies that, for single-user verification, the likelihood ratio is optimal.We have also shown that, in single-user verification, decisions based on posterior probabilityand likelihood ratio are equivalent, and result in the same ROC. However, in a multi-usersituation, the two methods lead to different average error rates. As a third result, we haveproven theoretically that, for multi-user verification, the use of the likelihood ratio is optimalin terms of average error rates.
The superiority of the likelihood based similarity measure is illustrated by experimentsin fingerprint verification. It is shown that error rates of approximately 10−4 can be achievedwhen using multiple fingerprints for template construction. Since the algorithm is extremelyfast, it can be used to search through large fingerprint databases. For automatic application ofthe algorithm, improvements have to be made in the automatic extraction of the core point.This could be circumvented by trying all detected cores, but that would slow down a databasesearch.
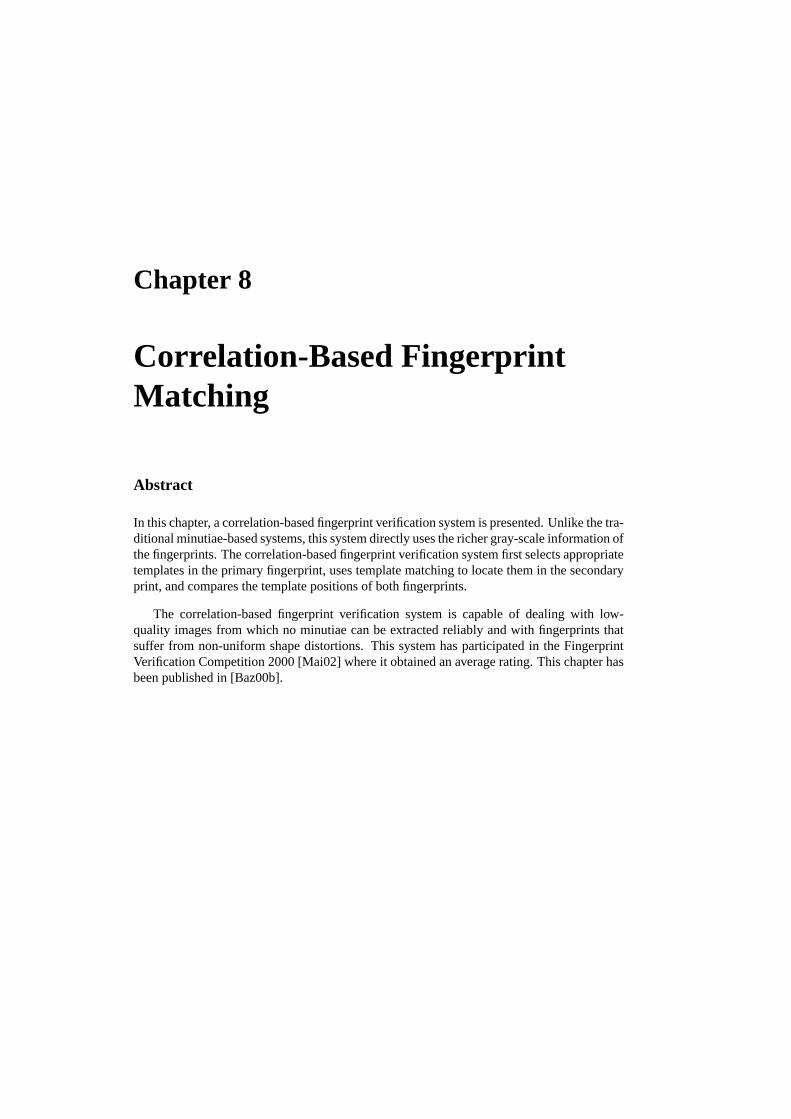
Chapter 8
Correlation-Based FingerprintMatching
Abstract
In this chapter, a correlation-based fingerprint verification system is presented. Unlike the tra-ditional minutiae-based systems, this system directly uses the richer gray-scale information ofthe fingerprints. The correlation-based fingerprint verification system first selects appropriatetemplates in the primary fingerprint, uses template matching to locate them in the secondaryprint, and compares the template positions of both fingerprints.
The correlation-based fingerprint verification system is capable of dealing with low-quality images from which no minutiae can be extracted reliably and with fingerprints thatsuffer from non-uniform shape distortions. This system has participated in the FingerprintVerification Competition 2000 [Mai02] where it obtained an average rating. This chapter hasbeen published in [Baz00b].

106 CHAPTER 8. CORRELATION-BASED FINGERPRINT MATCHING
8.1 Introduction
Most fingerprint verification systems follow a minutiae-based approach. Apart from the pres-ence of elastic deformations, the main drawback of the minutiae-based approach is the errorpropagation from the minutiae extraction to the decision stage. In general, the extractedminutiae templates contain a number of defects such as false, missed and displaced minutia,especially in low-quality fingerprints.
In order to deal with some of the problems of the minutiae-based approach, we havechosen an alternative approach. Instead of only using the minutiae locations, our methoddirectly uses the (locally normalized) gray-level information from the fingerprint image, sincea gray-level fingerprint image contains much richer, more discriminatory, information thanonly the minutiae locations. Those locations only characterize a small part of the local ridge-valley structures [Pra00, Jai00b, Mai99].
This chapter is organized as follows. First, Section 8.2 introduces the correlation-basedfingerprint matching system. This section also provides an analysis of the theoretical errorrates of the system. Then, Section 8.3 presents some experimental results and compares theseto the theoretical errors.
8.2 Correlation-Based Fingerprint Matching
The correlation-based fingerprint verification system has been inspired by [Rod99]. It firstselects characteristic templates (small segments) in the primary fingerprint. Then, templatematching is used to find the positions in the secondary fingerprint at which the templatesmatch best. Finally, the template positions in both fingerprints are compared in order to makethe decision whether the prints match. In this chapter, the template fingerprint will be calledthe primary fingerprint an the test fingerprint will be called the secondary fingerprint in orderto avoid confusion with the ‘templates’ that are used in the correlation.
8.2.1 Template Selection
The first step in the template matching algorithm is the selection of appropriate templates.This is a crucial step, since good templates will be easily localized in the secondary print atthe right position, while low-quality templates will not. More generally, the templates shouldbe uniquely localized in the secondary fingerprint. The template should fit as well as possibleat the correct location, but as badly as possible at other locations.
The first template property to consider is the size of the templates. There must be anoptimal template size, as can be seen from two extreme situations. When the entire finger-print is taken as template, any attempt to align specific corresponding positions will lead tomisalignments at other positions due to shape distortions. On the other hand, if templates ofonly 1 by 1 pixel are chosen, it is clear that the templates do not offer enough distinction.Experiments have shown that a template size of 24 by 24 pixels is a good compromise.

8.2. CORRELATION-BASED FINGERPRINT MATCHING 107
The second problem in selecting the right templates is which template positions to chose.Research has shown for instance, that a template that contains only parallel ridge-valley struc-tures cannot be located very accurately in the secondary fingerprint. In this paper, three tem-plate selection criteria are proposed, being minutiae-based, coherence-based and correlation-based.
Minutiae-Based Template Selection
As mentioned before, templates that only contain parallel ridge-valley structures do not offermuch distinction. On the other hand, when a template contains one or more minutiae, it willbe much easier to find the correct location in the secondary print. Using this assumption,one possible approach to select template locations is to extract minutiae from the fingerprintimage and to define templates around the minutiae locations.
A drawback of this technique is that it suffers from most of the problems of minutiae-based systems. Still, many false minutiae are extracted, causing at least a part of the templatesto be rather unreliable.
Coherence-Based Template Selection
The coherence of an image area is a measure that indicates how well the local gradients arepointing in the same direction. In areas where the ridge-valley structures are only parallellines, the coherence is very high, while in noisy areas, the coherence is low as shown inChapter 2.
Templates that are chosen in regions of high coherence values cannot be located reliablyin a second fingerprint [Sch00]. However, at locations around minutiae, more different gray-scale gradient orientations are present, resulting in a significantly lower coherence. Therefore,the coherence can be used as an appropriate measure that indicates the presence of minutiaeas well as a measure that indicates how well a template can be located in the secondaryfingerprint.
At first sight, this template selection criterion seems to conflict with segmentation, dis-cussed in Chapter 4. While segmentation chooses the regions of low coherence values asnoise or background areas, now the regions that have low coherence values have to be chosenas reliable templates. However, this contradiction is solved by the notion of scale [Lin94].Segmentation selects a large, closed area as foreground, in which holes and other irregu-larities are filled. Instead, the coherence based template selection only searches for localcoherence dips in this foreground area.
The drawback of this method is that noisy areas show coherence dips as well, while theseare certainly not reliable templates. This problem may be solved by using appropriate filters.

108 CHAPTER 8. CORRELATION-BASED FINGERPRINT MATCHING
Correlation-Based Template Selection
The third method satisfies the template requirements most directly. In this method, templatesare selected by checking how well they fit at other locations in the same fingerprint. If a tem-plate fits almost as well at another location as it does at its original location, it is not a usefultemplate. However, if a template fits much worse at all other locations in the fingerprint, itis a template that offers a lot of distinction. Therefore, the ratio of fit at a template’s originallocation to the fit at the next best location can be used as a template selection criterion.
Since the correlation-based checking is carried out by means of template matching, thismethod consumes a lot of computational power. This makes it a less attractive method touse. However, it is for instance possible to combine this approach with the previous twomethods. In that case, candidate template locations are extracted by one of the methods ofthe previous subsections. Then, the correlation characteristics of those locations are checkedas an additional selection criterion.
8.2.2 Template Matching
Once the templates have been selected in the primary fingerprint, their corresponding posi-tions in the secondary fingerprint have to be found. This can be done using standard templatematching techniques.
The template is shifted pixelwise over the secondary print. At each position, the gray-level distance between the template and the corresponding area in the secondary print isdetermined by summing the squared gray-level differences for each pixel in the template.After having shifted the template over the entire finger, the location where the distance isminimal is chosen as the corresponding position of the template in the second fingerprint.
This is a very computationally demanding technique. However, there are possibilities tospeed up the process. When both the template and the fingerprint are normalized (we havechosen: E[Ix,y] = 0 and Var[Ix,y] = 1, where Ix,y is the gray-scale image at pixel (x, y)), aconvolution, or filter, can be used instead. For this method, it is required that these conditionsdo not only hold globally for the whole image, but also locally for each area in the image. Ifthe size of the fingerprint is chosen appropriately, a 2-dimensional FFT can be used for evenmore efficiency [Ver00].
As result of the template matching, for each template position in the primary fingerprint,the corresponding, or best matching, template position in the secondary print is obtained.
8.2.3 Classification of Template Positions
The fingerprint matching algorithm, based on two sets of template positions, uses two de-cision stages. First, elementary decisions are made by classifying the individual templateposition pairs to be matching or not. Then, the information of all template pairs is merged inorder to make a final decision whether the primary and secondary fingerprint match or not.

8.2. CORRELATION-BASED FINGERPRINT MATCHING 109
x p1 x p
2
y p1
y p2
T p1
T p2
x p12
y p12
ρp12
ϕp12
(a) Primary fingerprint
xs1 xs
2
ys1
ys2
T s1
T s2
xs12
ys12
ρs12
ϕs12
(b) Secondary fingerprint
Figure 8.1: Relative template positions, tolerating translations.
Elementary Decisions
After template matching, there are two sets of corresponding template locations (xp, yp) and(xs, ys), where x = [x1, . . . , xn]T and y = [y1, . . . , yn]T are the coordinates of the templatesand the superscripts p and s refer to the primary and secondary fingerprints. Now, for all ntemplate pairs, a decision has to be made whether the positions correspond to each other:
(xsi , ys
i )?≈ (x p
i , y pi ) for 1 ≤ i ≤ n (8.1)
Directly examining the difference of both template coordinate pairs would only allowsome fixed translation in x and y directions. Template pairs that are some more translatedwith respect to each other would be classified as non-matching. In order to deal with thetranslations, relative template positions (RTPs) are used instead. Now, the test becomes:
[(xs
i , ysi ) − (xs
j , ysj )] ?≈
[(x p
i , y pi ) − (x p
j , y pj )]
for 1 ≤ i, j ≤ n, i �= j (8.2)
or
(xsi j ,ys
i j )?≈ (x p
i j ,y pi j ) for 1 ≤ i, j ≤ n, i �= j (8.3)
using the notations that are illustrated in Figure 8.1. Instead of comparing n template posi-tions, now n(n − 1)/2 RTPs are classified, of which n − 1 are independent.
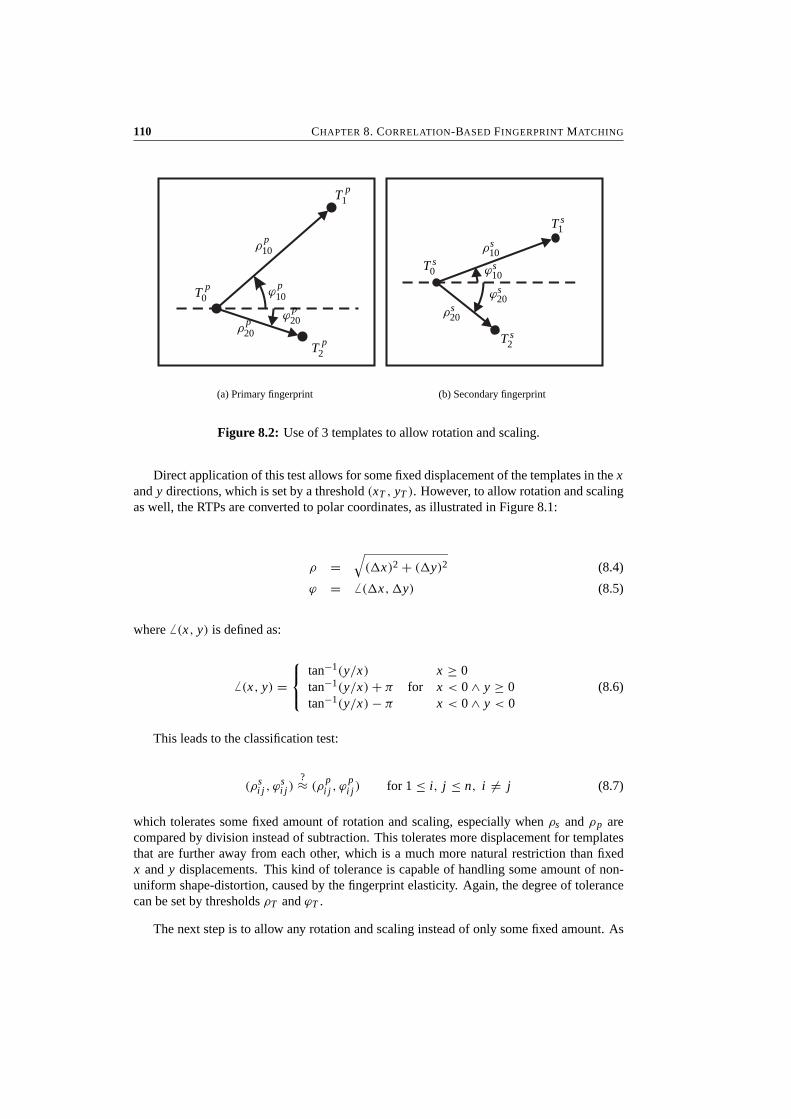
110 CHAPTER 8. CORRELATION-BASED FINGERPRINT MATCHING
T p0
T p1
T p2
ρp10
ρp20
ϕp10
ϕp20
(a) Primary fingerprint
T s0
T s1
T s2
ρs10
ρs20
ϕs10
ϕs20
(b) Secondary fingerprint
Figure 8.2: Use of 3 templates to allow rotation and scaling.
Direct application of this test allows for some fixed displacement of the templates in the xand y directions, which is set by a threshold (xT , yT ). However, to allow rotation and scalingas well, the RTPs are converted to polar coordinates, as illustrated in Figure 8.1:
ρ =√
(x)2 + (y)2 (8.4)
ϕ = � (x,y) (8.5)
where � (x, y) is defined as:
� (x, y) =
tan−1(y/x) x ≥ 0tan−1(y/x) + π for x < 0 ∧ y ≥ 0tan−1(y/x) − π x < 0 ∧ y < 0
(8.6)
This leads to the classification test:
(ρsi j , ϕ
si j )
?≈ (ρpi j , ϕ
pi j ) for 1 ≤ i, j ≤ n, i �= j (8.7)
which tolerates some fixed amount of rotation and scaling, especially when ρs and ρp arecompared by division instead of subtraction. This tolerates more displacement for templatesthat are further away from each other, which is a much more natural restriction than fixedx and y displacements. This kind of tolerance is capable of handling some amount of non-uniform shape-distortion, caused by the fingerprint elasticity. Again, the degree of tolerancecan be set by thresholds ρT and ϕT .
The next step is to allow any rotation and scaling instead of only some fixed amount. As

8.2. CORRELATION-BASED FINGERPRINT MATCHING 111
(a) Matching fingerprints (b) Non-matching fingerprints
Figure 8.3: Scatter diagrams of the (ln ρs/ρp, φs − φp) pairs.
illustrated in Figure 8.2, a third template is used to obtain the test that is not only fixed fortranslation of the template positions, but for rotation and scaling as well:
(ϕsji − ϕs
ki , ρsji/ρ
ski )
?≈ (ϕpji − ϕ
pki , ρ
pji/ρ
pki )
for 1 ≤ i, j, k ≤ n, i �= j �= k (8.8)
However, there is one practical drawback to this method. The template locations areobtained by means of template matching. If a template is scaled or rotated more than someconstant, it is not possible anymore to localize it in the secondary image. Furthermore, thesame holds, to some extent, for scaling. This makes the tolerance of any amount of rotationand scaling less useful.
Since the test of Expression 8.7 uses one more independent classification than the test ofExpression 8.8, and the last step does not add much value, we adopt the test of Expression 8.7for the rest of the paper. The scatter diagrams of the (ln ρs
i j/ρpi j , ϕs
i j − ϕpi j ) pairs, both for
matching fingerprints and for non-matching prints, are given in Figure 8.3. These pairs areclassified by applying an elliptical threshold:
ln
ρsi j
ρpi j
ρT
2
+(
ϕsi j − ϕ
pi j
ϕT
)2
< 1 (8.9)
where ρT and ϕT are the parameters determining the shape of the ellipse.
The result of this procedure is a match or non-match classification for all n(n − 1)/2template combinations. The probability that an RTP is classified non-matching while theprints match, is given by p(ω0,T |ω1,F ), while the probability that a template distance is

112 CHAPTER 8. CORRELATION-BASED FINGERPRINT MATCHING
classified matching while the prints actually do not match is denoted by p(ω1,T |ω0,F ). Here,the subscripts T and F denote template and fingerprint respectively.
The thresholds that provide the best discrimination of matching and non-matching RTPs,give for this database:
p(ω0,T |ω1,F ) = 0.2 (8.10)
p(ω1,T |ω0,F ) = 0.02 (8.11)
Combining Elementary Decisions
We now have to classify the two fingerprints as being a match or not. This decision is basedon n(n − 1)/2 relative template positions. This can be solved using the theory of Bernoulliexperiments, which combine n independent experiments using binominal distribution. Theprobability P(X = k) for k positive outcomes when doing n independent experiments thatall have a probability of success p is given by:
P(X = k) =(
n
k
)pk(1 − p)n−k (8.12)
where
(n
k
)= n!
k! (n − k)!(8.13)
is the binominal coefficient and n! denotes factorial.
The n(n − 1)/2 RTPs are certainly not independent. If we choose one template as refer-ence, all template positions are fixed by only n − 1 distances, while all other distances can becalculated. Therefore, only n − 1 independent RTPs are available.
The choice of the reference template is rather important. If one template is not localizedat the right position in the secondary fingerprint, and this template is chosen as referencetemplate, all RTPs will be classified non-matching. This results in a false rejection of thefingerprint. Therefore, we chose the reference template as the one that has the most RTPmatches.
Once the reference template has been chosen, there are n − 1 RTPs that are in principleindependent. This means that the combination of all RTP matches can be considered as aBernouilli experiment, and Expression 8.12 can be applied. A threshold kT is set for the finalfingerprint match or non-match classification, resulting in:
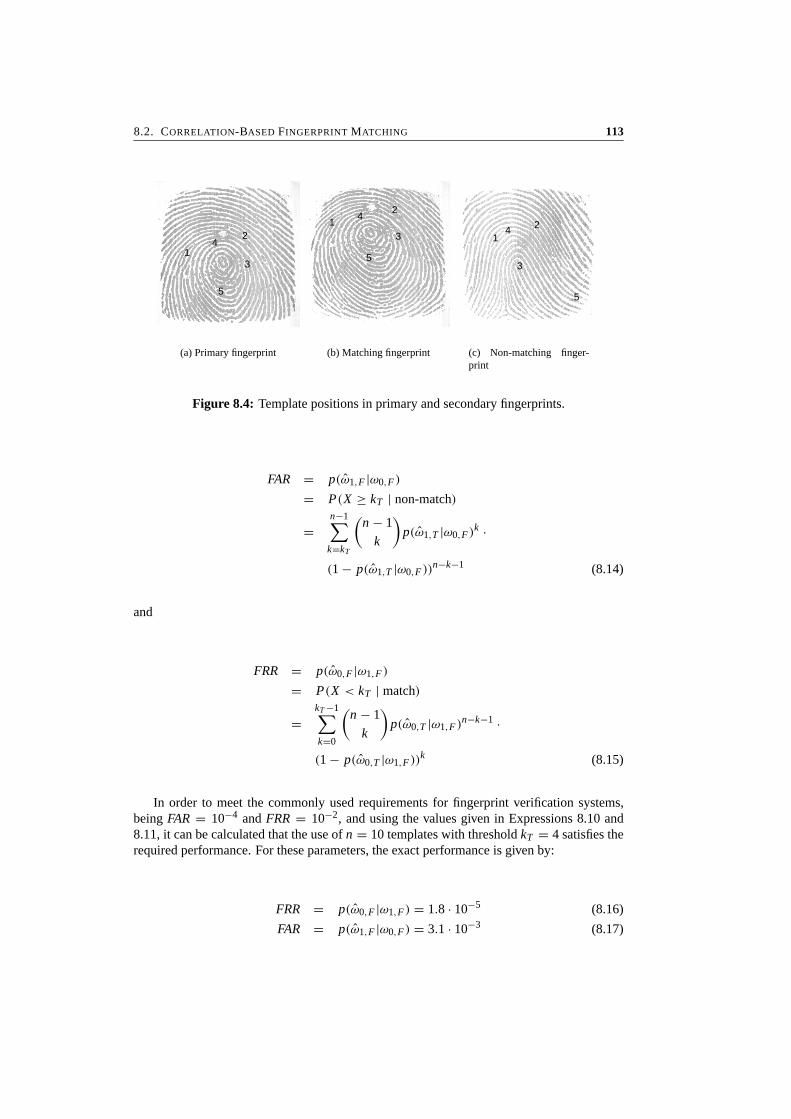
8.2. CORRELATION-BASED FINGERPRINT MATCHING 113
1
2
3
4
5
(a) Primary fingerprint
12
3
4
5
(b) Matching fingerprint
12
3
4
5
(c) Non-matching finger-print
Figure 8.4: Template positions in primary and secondary fingerprints.
FAR = p(ω1,F |ω0,F )
= P(X ≥ kT | non-match)
=n−1∑
k=kT
(n − 1
k
)p(ω1,T |ω0,F )k ·
(1 − p(ω1,T |ω0,F ))n−k−1 (8.14)
and
FRR = p(ω0,F |ω1,F )
= P(X < kT | match)
=kT −1∑k=0
(n − 1
k
)p(ω0,T |ω1,F )n−k−1 ·
(1 − p(ω0,T |ω1,F ))k (8.15)
In order to meet the commonly used requirements for fingerprint verification systems,being FAR = 10−4 and FRR = 10−2, and using the values given in Expressions 8.10 and8.11, it can be calculated that the use of n = 10 templates with threshold kT = 4 satisfies therequired performance. For these parameters, the exact performance is given by:
FRR = p(ω0,F |ω1,F ) = 1.8 · 10−5 (8.16)
FAR = p(ω1,F |ω0,F ) = 3.1 · 10−3 (8.17)

114 CHAPTER 8. CORRELATION-BASED FINGERPRINT MATCHING
An example of the results of this method, using only 5 templates, is given in Figure 8.4.The figure shows that for matching prints, indeed the relative template positions are aboutequal, while for non-matching prints, they are completely different.
8.2.4 Discussion of the Method
The correlation-based fingerprint verification that is proposed in this section, is compared tothe traditional minutiae-based methods. The advantage of the correlation-based method are:
• The method uses the much richer gray-level information of the fingerprint image in-stead of only positions of minutiae.
• The method is also capable of dealing with fingerprints of low image quality fromwhich no minutiae can be extracted reliably.
• False and missed minutiae do not decrease the matching performance.
• Unlike the minutiae templates, the template locations are already paired, which resultsin much simpler matching methods. During minutiae matching, it is not known inadvance which minutiae from both sets should correspond.
• The first decision stage only classifies relative template positions. This method tol-erates non-uniform local shape distortions in the fingerprint, unlike the minutiae tem-plates for which the optimal global transform is searched.
The disadvantages of the correlation-based fingerprint verification method are:
• Template matching is a method that demands a rather high computational power, whichmakes the method less applicable for real time applications. On the other hand, moreand more hardware solutions becomes available for this task.
• The method is at the moment not capable of dealing with rotations of more than about10 degrees. This is caused by the fact that, for larger rotations, the templates do notmatch well anymore, causing incorrect positions to be found. A solution to this prob-lem is rotating the templates and then performing the matching again. However, this isa solution that requires a lot of additional computational power.
• Problems might arise if the minutiae-based or coherence-based template selectionmethods are used while 2 minutiae surroundings can not be distinguished. In thiscase, there is a possibility that template matching will find the incorrect template posi-tion, which degrades the matching performance. Use of the correlation-characteristictemplate selection will solve this problem.
8.3 Experimental Results
The correlation based fingerprint verification system that is described in this paper has par-ticipated in FVC2000, a Fingerprint Verification Competition [Mai00] which was part of the

8.3. EXPERIMENTAL RESULTS 115
ICPR2000 conference. This section will present some of the results of this competition aswell as a discussion how to interpret these results.
8.3.1 Experiment Setup
Although many research groups have developed fingerprint verification algorithms, only afew benchmarks are available. Developers usually perform tests over self-collected databases,since in practice, the only available sets are the NIST databases, containing thousands ofscanned inked impressions of fingers. Since these images significantly differ from thoseacquired electronically, they are not well-suited for testing on-line fingerprint systems.
FVC2000 [Mai02] attempts to establish a first common benchmark, allowing companiesand academic institutions to compare performance and track improvement in their fingerprintrecognition algorithms unambiguously. However, the databases used in this contest have notbeen acquired in a real environment according to a formal protocol and the images originatefrom sensors that are not native to the participating systems. Therefore, FVC2000 is not anofficial performance certification of the participating systems, but it should be considered asa technology evaluation.
The system performance is evaluated on images from four different fingerprint databases.Three of these databases are acquired by various sensors, low-cost and high-quality, opticaland capacitive. The fourth database is synthetically generated using the approach describedin [Cap00a]. All databases contain 8 prints of 110 different fingers, so 880 fingerprints intotal. All prints were captured by untrained volunteers, resulting in fingerprints ranging fromhigh quality to very low quality.
Of all fingerprints, 8 prints of 10 fingers were distributed to the participants to tune theiralgorithms to the databases. The algorithms were tested using the other 100 fingers.
For each database, an FAR and an FRR test is performed. For the FAR test, the first printof each finger is matched against the first print of all other fingers, leading to 4,950 impostorattempts. For the FRR test, each print of each finger is matched against all other prints of thesame finger, leading to 2,800 genuine attempts.
8.3.2 Experimental Results
In the Fingerprint Verification Competition 2000 this system obtained an average rating.Some charts, showing performance measures for the first database, are given in Figure 8.5.The discrete distribution is caused by the fact that the competition required a confidence mea-sure between 0 and 1, indicating how well 2 fingerprints match. The confidence measure ofour method is the quotient of the number of matching RTPs and the maximum number ofmatching RTPs that is possible, causing a distribution that consists of n discrete peaks.
One interesting measure is the equal error rate (EER) of the system, which is the operatingmode of the system for which FAR and FRR are equal. For this database, the EER was 7.98%.
The correlation based fingerprint verification system consumes relatively much CPU time.
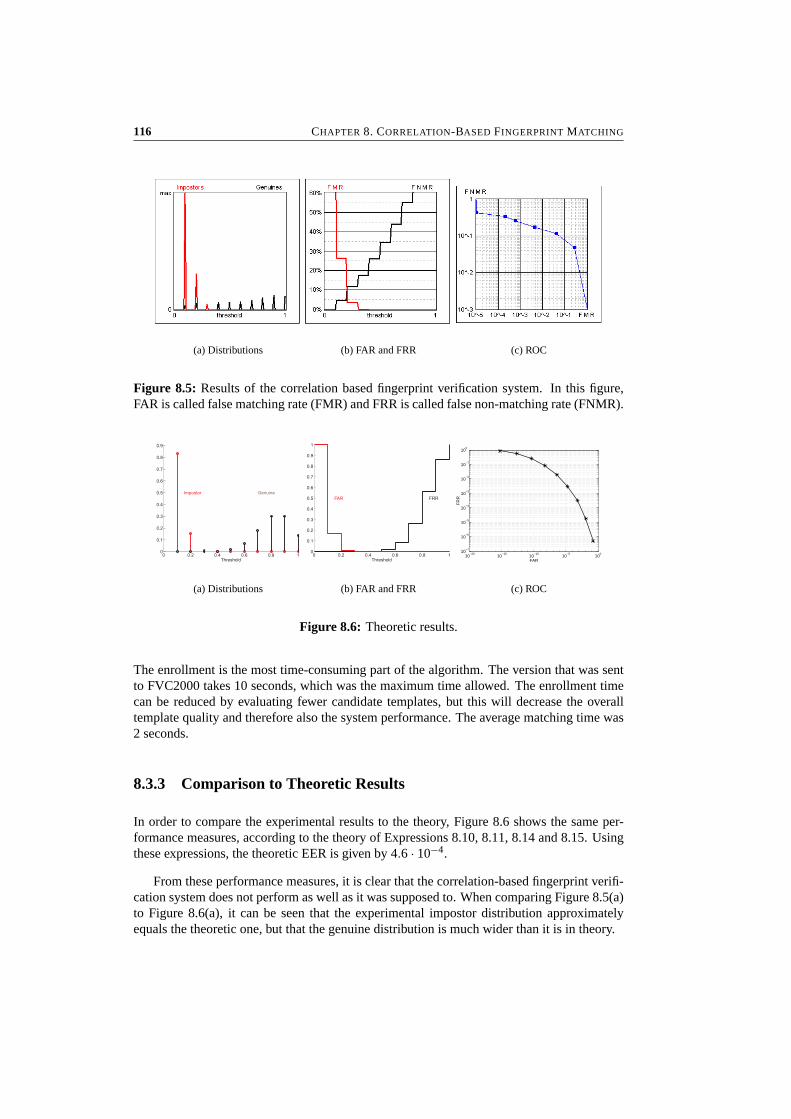
116 CHAPTER 8. CORRELATION-BASED FINGERPRINT MATCHING
(a) Distributions (b) FAR and FRR (c) ROC
Figure 8.5: Results of the correlation based fingerprint verification system. In this figure,FAR is called false matching rate (FMR) and FRR is called false non-matching rate (FNMR).
(a) Distributions (b) FAR and FRR
10−20
10−15
10−10
10−5
100
10−7
10−6
10−5
10−4
10−3
10−2
10−1
100
FAR
FR
R
(c) ROC
Figure 8.6: Theoretic results.
The enrollment is the most time-consuming part of the algorithm. The version that was sentto FVC2000 takes 10 seconds, which was the maximum time allowed. The enrollment timecan be reduced by evaluating fewer candidate templates, but this will decrease the overalltemplate quality and therefore also the system performance. The average matching time was2 seconds.
8.3.3 Comparison to Theoretic Results
In order to compare the experimental results to the theory, Figure 8.6 shows the same per-formance measures, according to the theory of Expressions 8.10, 8.11, 8.14 and 8.15. Usingthese expressions, the theoretic EER is given by 4.6 · 10−4.
From these performance measures, it is clear that the correlation-based fingerprint verifi-cation system does not perform as well as it was supposed to. When comparing Figure 8.5(a)to Figure 8.6(a), it can be seen that the experimental impostor distribution approximatelyequals the theoretic one, but that the genuine distribution is much wider than it is in theory.
8.4. CONCLUSIONS 117
The deviation of the genuine distribution can be explained by the fact that the RTPs are notindependent for genuine matches, while this was assumed by using the binominal distributionof Expression 8.12. The most probable cause of the lower genuine scores is the rotation offingerprints. If two fingerprints are rotated more than about 10 degrees with respect to eachother, template matching cannot localize some of the templates correctly. This causes thedependent RTPs to be classified incorrectly.
This situation certainly exists for some pairs of fingerprints in the databases. The finger-prints are specified to have a rotation of -15 to +15 degrees from normal, which means thatrelative rotations up to 30 degrees might appear in these databases.
A possible solution to this problem is the determination of the relative rotation of twofingerprints, using for instance the singular points. Once the rotation is known, it can becompensated, after which the correlation based fingerprint verification algorithm can be ap-plied directly.
8.4 Conclusions
The correlation-based fingerprint verification system that was presented in this chapter pro-vides a very simple and direct solution to the fingerprint matching problem. Unlike theminutiae-based systems, this approach does not require much preprocessing. As a conse-quence, there will be no errors introduced in these steps.
The system uses the much richer gray-level information of a fingerprint image. It iscapable of dealing with low image quality fingerprints and missed and spurious minutiae.Due to the paired templates, the decision stage is much simpler and it is able to deal withsome non-uniform shape-distortion problems.
Experiments have shown that the correlation based fingerprint verification system per-forms approximately as well as other types of systems. The performance of the system canbe enhanced by solving the problem of fingerprints that show more than some amount ofrotation with respect to each other.

Chapter 9
An Intrinsic Coordinate Systemfor Fingerprint Matching
Abstract
In this chapter, an intrinsic coordinate system is proposed for fingerprints. First the fingerprintis partitioned in regular regions, which are regions that contain no singular points. In eachregular region, the intrinsic coordinate system is defined by the directional field. When usingthe intrinsic coordinates instead of pixel coordinates, minutiae are defined with respect totheir position in the directional field. The resulting intrinsic minutiae coordinates can be usedin a elastic distortion-invariant fingerprint matching algorithm. Elastic distortions, caused bypressing the 3-dimensional elastic fingerprint surface on a flat sensor, now deform the entirecoordinate system, leaving the intrinsic minutiae coordinates unchanged. Therefore, match-ing algorithms with tighter tolerance margins can be applied to obtain better performance.This chapter has been published in [Baz01c] and [Baz01a].

120 CHAPTER 9. AN INTRINSIC COORDINATE SYSTEM FOR FINGERPRINT MATCHING
9.1 Introduction
The first step in a fingerprint recognition system is to capture the print of a finger by a finger-print sensor. In this capturing process, the 3-dimensional elastic surface of a finger is pressedon a flat sensor surface. This 3D-to-2D mapping of the finger skin introduces distortions,especially when forces are applied that are not orthogonal to the sensor surface. The effect isthat the sets of minutiae of two prints of the same finger no longer fit exactly. The ideal wayto deal with distortions would be to invert the 3D-to-2D mapping and compare the minutiaepositions in 3D. Unfortunately, in the absence of a calibrated measurement of the deformationprocess, there is no unique way of inverting this mapping.
Instead of modeling the distortions, most minutiae matching techniques use local similar-ity measures [Jia00], or allow some amount of displacement in the minutiae matching stage[Jai97b]. However, decreasing the required amount of similarity not only tolerates small elas-tic distortions, but increases the false acceptance rate (FAR) as well. It is therefore reasonableto consider methods that explicitly attempt to model and eliminate the distortion. Such meth-ods can be expected to be stricter in the allowed displacement during minutiae matching. Asa consequence, the FAR can be decreased without increasing the false rejection rate (FRR).
As far as we know, the only paper that explicitly addresses elastic distortions is [Cap01].In that paper, the physical cause of the distortions is modeled by distinguishing three distinctconcentric regions in a fingerprint. In the center region, no distortions are present, since thisregion tightly fits to the sensor. The outer, or external, region is not distorted either, sinceit does not touch the sensor. The outer region may be displaced and rotated with respect tothe inner region, due to the application of forces while pressing the finger at the sensor. Theregion in between is distorted in order to fit both regions to each other.
Experiments have shown that this model provides an accurate description of the elasticdistortions in some cases. The technique has successfully been applied to the generation ofmany synthetic fingerprints of the same finger [Cap00a]. However, the model has not yetbeen used in an algorithm for matching fingerprints. Accurate estimation of the distortionparameters is still a topic of research. Furthermore, the prints cannot be truly normalized bythe model, since it only describes relative distortions.
In this chapter, an alternative approach is proposed, using a linked multilevel descriptionof the fingerprint. The coarse level of this description is given by the directional field. The DFdescribes the orientation of the local ridge-valley structures, thus modeling the basic shape ofthe fingerprint. We use the high-resolution DF estimate (presented in Chapter 2) that is basedon the averaging of squared gradients. The features at the detailed level of the fingerprint aregiven by the minutiae. Instead of the common practice of treating the DF and the minutiae astwo separate descriptions, of which one is used for classification and the other for matching,we propose a link between these two levels, by defining the intrinsic coordinate system of afingerprint.
The intrinsic coordinate system of a fingerprint is defined by the DF. One of its axesruns along the ridge-valley structures, while the other is perpendicular to them. Using theintrinsic coordinate system, minutiae positions can be defined with respect to positions inthe DF, instead of using the pixel coordinates as minutiae locations, thus providing a morenatural representation. If a fingerprint undergoes elastic distortions, the distortions do influ-
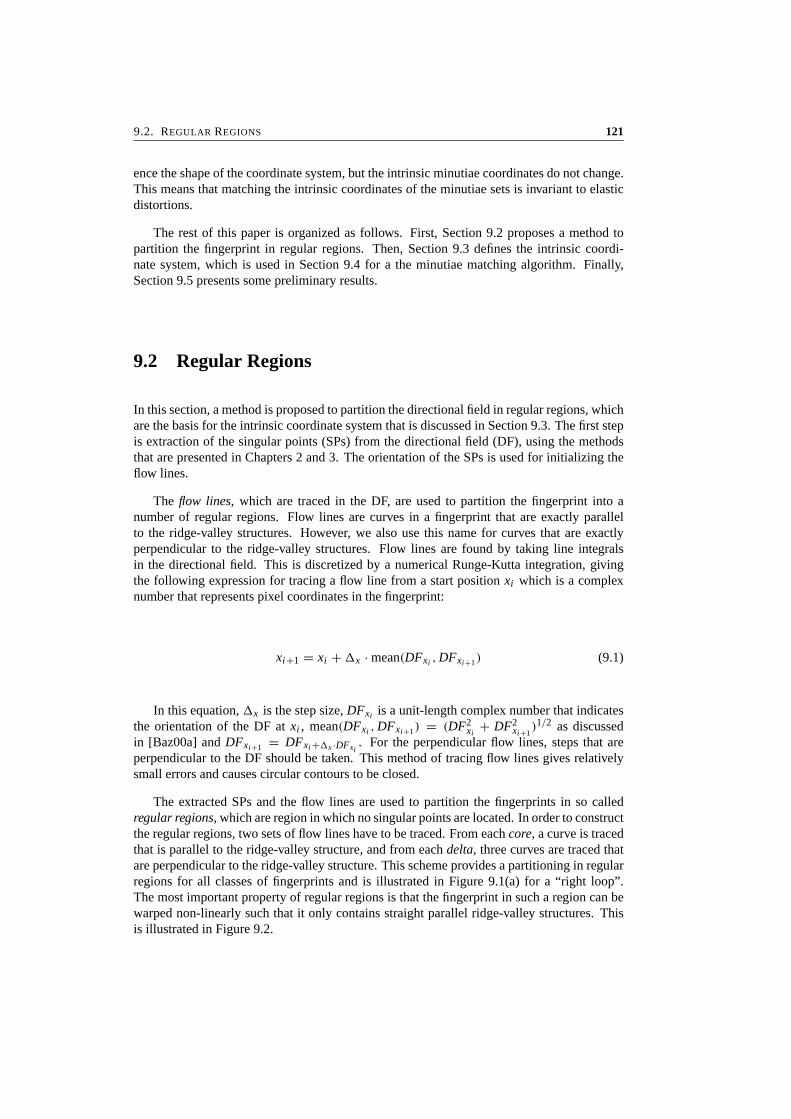
9.2. REGULAR REGIONS 121
ence the shape of the coordinate system, but the intrinsic minutiae coordinates do not change.This means that matching the intrinsic coordinates of the minutiae sets is invariant to elasticdistortions.
The rest of this paper is organized as follows. First, Section 9.2 proposes a method topartition the fingerprint in regular regions. Then, Section 9.3 defines the intrinsic coordi-nate system, which is used in Section 9.4 for a the minutiae matching algorithm. Finally,Section 9.5 presents some preliminary results.
9.2 Regular Regions
In this section, a method is proposed to partition the directional field in regular regions, whichare the basis for the intrinsic coordinate system that is discussed in Section 9.3. The first stepis extraction of the singular points (SPs) from the directional field (DF), using the methodsthat are presented in Chapters 2 and 3. The orientation of the SPs is used for initializing theflow lines.
The flow lines, which are traced in the DF, are used to partition the fingerprint into anumber of regular regions. Flow lines are curves in a fingerprint that are exactly parallelto the ridge-valley structures. However, we also use this name for curves that are exactlyperpendicular to the ridge-valley structures. Flow lines are found by taking line integralsin the directional field. This is discretized by a numerical Runge-Kutta integration, givingthe following expression for tracing a flow line from a start position xi which is a complexnumber that represents pixel coordinates in the fingerprint:
xi+1 = xi + x · mean(DFxi , DFxi+1) (9.1)
In this equation, x is the step size, DFxi is a unit-length complex number that indicatesthe orientation of the DF at xi , mean(DFxi , DFxi+1) = (DF2
xi+ DF2
xi+1)1/2 as discussed
in [Baz00a] and DFxi+1 = DFxi +x ·DFxi. For the perpendicular flow lines, steps that are
perpendicular to the DF should be taken. This method of tracing flow lines gives relativelysmall errors and causes circular contours to be closed.
The extracted SPs and the flow lines are used to partition the fingerprints in so calledregular regions, which are region in which no singular points are located. In order to constructthe regular regions, two sets of flow lines have to be traced. From each core, a curve is tracedthat is parallel to the ridge-valley structure, and from each delta, three curves are traced thatare perpendicular to the ridge-valley structure. This scheme provides a partitioning in regularregions for all classes of fingerprints and is illustrated in Figure 9.1(a) for a “right loop”.The most important property of regular regions is that the fingerprint in such a region can bewarped non-linearly such that it only contains straight parallel ridge-valley structures. Thisis illustrated in Figure 9.2.
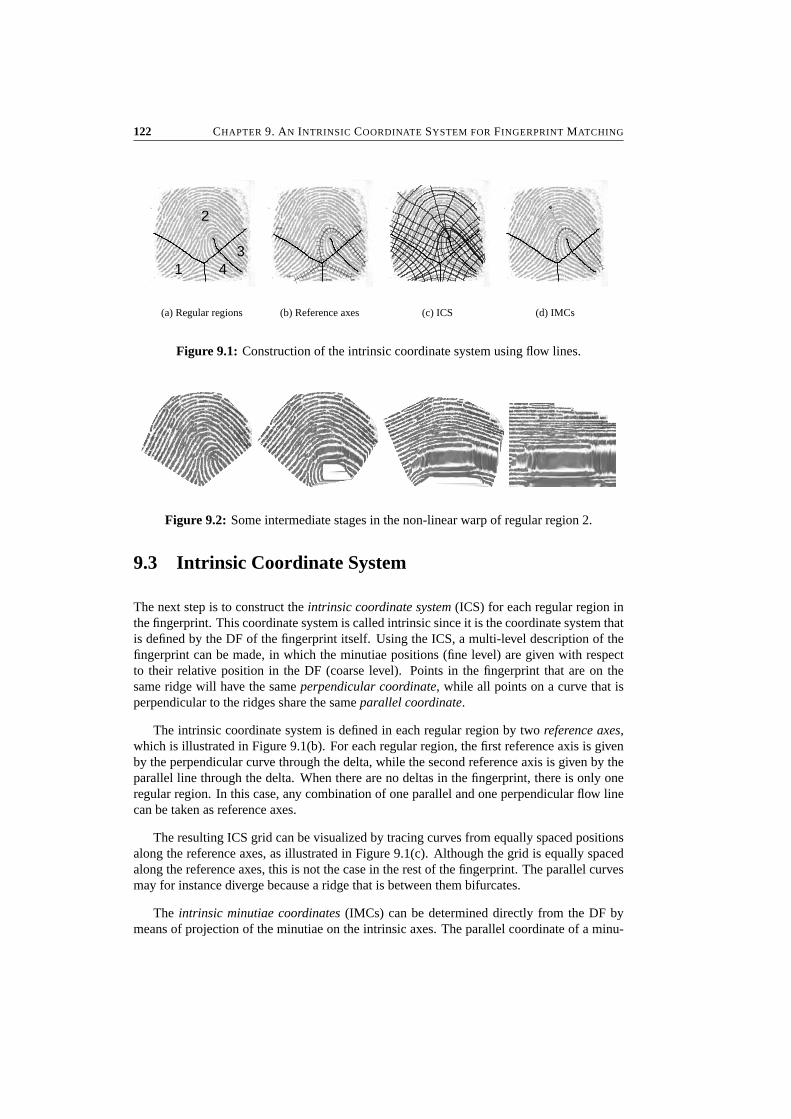
122 CHAPTER 9. AN INTRINSIC COORDINATE SYSTEM FOR FINGERPRINT MATCHING
1
2
34
(a) Regular regions
perp
perp
perp
parpar
par
(b) Reference axes (c) ICS (d) IMCs
Figure 9.1: Construction of the intrinsic coordinate system using flow lines.
Figure 9.2: Some intermediate stages in the non-linear warp of regular region 2.
9.3 Intrinsic Coordinate System
The next step is to construct the intrinsic coordinate system (ICS) for each regular region inthe fingerprint. This coordinate system is called intrinsic since it is the coordinate system thatis defined by the DF of the fingerprint itself. Using the ICS, a multi-level description of thefingerprint can be made, in which the minutiae positions (fine level) are given with respectto their relative position in the DF (coarse level). Points in the fingerprint that are on thesame ridge will have the same perpendicular coordinate, while all points on a curve that isperpendicular to the ridges share the same parallel coordinate.
The intrinsic coordinate system is defined in each regular region by two reference axes,which is illustrated in Figure 9.1(b). For each regular region, the first reference axis is givenby the perpendicular curve through the delta, while the second reference axis is given by theparallel line through the delta. When there are no deltas in the fingerprint, there is only oneregular region. In this case, any combination of one parallel and one perpendicular flow linecan be taken as reference axes.
The resulting ICS grid can be visualized by tracing curves from equally spaced positionsalong the reference axes, as illustrated in Figure 9.1(c). Although the grid is equally spacedalong the reference axes, this is not the case in the rest of the fingerprint. The parallel curvesmay for instance diverge because a ridge that is between them bifurcates.
The intrinsic minutiae coordinates (IMCs) can be determined directly from the DF bymeans of projection of the minutiae on the intrinsic axes. The parallel coordinate of a minu-
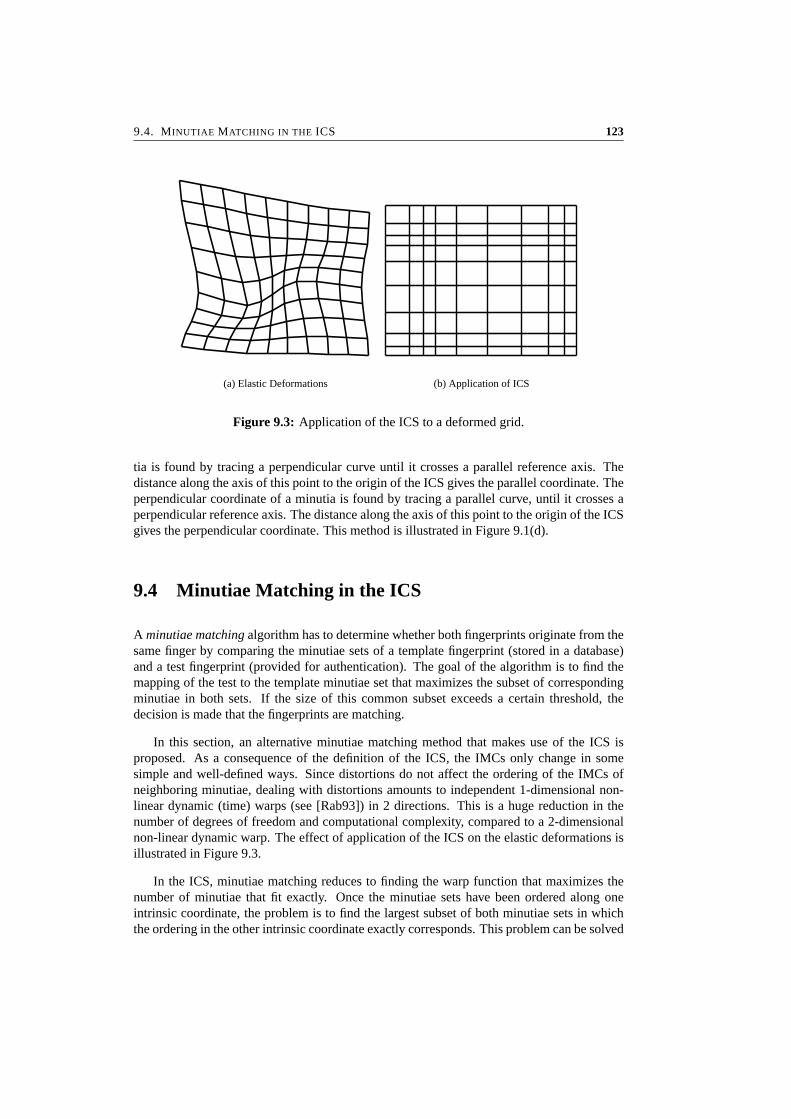
9.4. MINUTIAE MATCHING IN THE ICS 123
(a) Elastic Deformations (b) Application of ICS
Figure 9.3: Application of the ICS to a deformed grid.
tia is found by tracing a perpendicular curve until it crosses a parallel reference axis. Thedistance along the axis of this point to the origin of the ICS gives the parallel coordinate. Theperpendicular coordinate of a minutia is found by tracing a parallel curve, until it crosses aperpendicular reference axis. The distance along the axis of this point to the origin of the ICSgives the perpendicular coordinate. This method is illustrated in Figure 9.1(d).
9.4 Minutiae Matching in the ICS
A minutiae matching algorithm has to determine whether both fingerprints originate from thesame finger by comparing the minutiae sets of a template fingerprint (stored in a database)and a test fingerprint (provided for authentication). The goal of the algorithm is to find themapping of the test to the template minutiae set that maximizes the subset of correspondingminutiae in both sets. If the size of this common subset exceeds a certain threshold, thedecision is made that the fingerprints are matching.
In this section, an alternative minutiae matching method that makes use of the ICS isproposed. As a consequence of the definition of the ICS, the IMCs only change in somesimple and well-defined ways. Since distortions do not affect the ordering of the IMCs ofneighboring minutiae, dealing with distortions amounts to independent 1-dimensional non-linear dynamic (time) warps (see [Rab93]) in 2 directions. This is a huge reduction in thenumber of degrees of freedom and computational complexity, compared to a 2-dimensionalnon-linear dynamic warp. The effect of application of the ICS on the elastic deformations isillustrated in Figure 9.3.
In the ICS, minutiae matching reduces to finding the warp function that maximizes thenumber of minutiae that fit exactly. Once the minutiae sets have been ordered along oneintrinsic coordinate, the problem is to find the largest subset of both minutiae sets in whichthe ordering in the other intrinsic coordinate exactly corresponds. This problem can be solved

124 CHAPTER 9. AN INTRINSIC COORDINATE SYSTEM FOR FINGERPRINT MATCHING
by dynamic programming as described below. Usually, the next step would be to determinethe warp function that interpolates the points that were found. However, since we are onlyinterested in the number of matching minutiae, this step does not have to be performed.
The set of minutiae of the primary fingerprint is given by a = [a1, . . . , am]. A minutiaai of this set is described by its parallel coordinate x(ai ) and perpendicular coordinate y(ai ).The set is sorted by x(ai ). In the same way, b describes the n minutiae of the secondaryfingerprint. The problem is to find the longest series [(ai1 , b j1), . . . , (aik , b jk )] with 1 ≤ i1 <
· · · < ik ≤ m and 1 ≤ j1 < · · · < jk ≤ n such that a criterion of local similarity is satisfied:
aik − aik−1 ≈ bik − bik−1 (9.2)
Consider the partial solution λ(i, j), representing the longest series of minutiae pairs thathas (ai , b j ) as the last pair in the series. This means that λ(i, j) can be constructed recursivelyby adding (ai , b j ) to the longest of all series λ(k, l), with k < i and l < j , behind which thepair fits:
λ(i, j) = λ(k, l) + (ai , b j ) (9.3)
with k and l chosen to maximize the length of λ(i, j). Using the starting conditions λ(1, j) =[(a1, b j )] and λ(i, 1) = [(ai , b1)], the final solution is the longest of all calculated partialsolutions λ(i, j).
9.5 Preliminary Results
Although the elastic distortion-invariant minutiae matching algorithm is not yet operational,this section is meant to show the potential of our algorithm. In order to make the matchingresult only dependent on the ability to deal with elastic distortions, and not on the minutiae ex-traction algorithm, the minutiae were extracted by human inspection. After cross-validationof both sets, 77 corresponding minutiae were in the two prints of the same finger that areshown in Figure 9.4(a) and 9.4(b).
In Figure 9.4(c), the sets have been aligned as well as possible, using only translation,rotation and scaling. In the figure, corresponding minutiae are connected by a line. The fig-ure clearly shows that, although the two minutiae sets fit exactly at the center of the print,they do not fit very well in the rest of the fingerprint. Under these distortions, the displace-ments required to tolerate corresponding minutiae is larger than the distance between someneighboring minutiae. Therefore, tolerance of small displacements is not a solution in thiscase. For a reasonable tolerance, only 24 matching minutiae pairs are found, out of 77 truematching minutiae pairs.
When the ICS is used, the perpendicular ordering is preserved since the parallel linesexactly follow the ridge-valley structures. However, the elastic distortions can influence theparallel ordering. Especially the parallel coordinate of minutiae near the core are less reliable.Nevertheless, over 70 correctly ordered minutiae pairs can be found using the ICS.

9.6. CONCLUSIONS 125
(a) Fingerprint 1 (b) Fingerprint 2 (c) Superimposed
Figure 9.4: Minutiae sets located in the ICSs of two fingerprints of the same finger.
9.6 Conclusions
In this chapter, the intrinsic coordinate system of a fingerprint is presented. It is defined by thedirectional field of the fingerprint itself. The locations of minutiae are insensitive to elasticdistortions if they are given in this intrinsic coordinate system. It is shown how minutiae-based matching is drastically simplified when minutiae are characterized by means of theirintrinsic coordinates.


Part III
Database Search


Chapter 10
Classification
Abstract
Classification of fingerprint images can be used as a first step in fingerprint identificationsystems. All template fingerprints are classified, and a test fingerprint is matched only to thetemplate fingerprints of the corresponding class. This reduces the number of matches thatis required, and therefore the processing time and error rate. This chapter summarizes theso called “Henry classification” system. However, given the presence of classification errorsand the limited reduction of the number of required matches, even for perfect classification,Henry classification is more an issue of academic interest and backward compatibility thanof practical use. Part of this chapter has been published in [Boe01] and [Baz02a].
130 CHAPTER 10. CLASSIFICATION
10.1 Introduction
The task of a classification systems is to determine to which class or category the input fin-gerprint belongs. Classification is an important first step in any identification system. Thetask of a fingerprint identification system is to find the fingerprint in a database that matches aquery fingerprint. A naive identification system would simply compare the given fingerprintto all entries in the database. However, for databases of a realistic size, two closely relatedproblems are encountered when applying this approach. Since many matches are performed,the required processing time will be excessive, and the performance will be inadequate. Thisis illustrated by a simple example, using the system penetration coefficient P , which measuresthe expected number of comparisons to be made [Way99].
P = E[number of comparisons]
n(10.1)
Consider the identification of a fingerprint in a database of n = 10,000 entries. The naivematching system compares the query fingerprint to all entries in the database, so P = 1.Since the probability of false acceptance is larger than zero, the search cannot be stopped ifa matching fingerprint is found, and the best matching fingerprint is chosen. A fast matchingalgorithm, requiring only tmatch = 100 milliseconds per match, needs almost 17 minutes forthis task, and a matching algorithm with a very good performance of FAR = 10−4 will findon average n · FAR = 1 false match in this database. Furthermore, the probability of falseacceptance over the entire database can be computed as: FAR1:n = 1 − (1 − FAR)n = 0.63.Obviously, these performance figures are unacceptable for any identification system.
To reduce these problems, classification is used [Way99]. In the absence of classificationerrors, this technique is known as hashing. All fingerprints in the database are classified.They are stored per class in separate databases. The query fingerprint is also classified andis only matched to the ni fingerprints in that part of the database that contains fingerprints ofthe corresponding class i . The effect is two-fold, as illustrated when we carry on with theprevious example. Assume that the fingerprints are classified into 100 equal-size classes andthat therefore ni = 100 for all i . The processing time will thus come down to 10 s, and theaverage number of false matches will be ni · FAR = 0.01 and FAR1:ni = 10−2. Howeverstate-of-the-art fingerprint identification systems cannot identify 100 distinct classes. There-fore, the size of the fingerprint database is limited to a few hundred entries for reasonableperformance and identification time [Cap00c].
10.2 Henry Classes
A well-known set of categories is formed by the Henry classes. They consist of five classesrelated to global fingerprint patterns, based on the structure of the directional field. Examplesof fingerprints from the five Henry classes (whorl, left loop, right loop, arch, and tented arch)are shown in Figure 10.1. Sometimes, a 4-class Henry classification is used, where arch andtented arch are combined into a single class. On the other hand, it is also possible to definemore than five classes, for example adding pocketed loops, double loops, and scars.
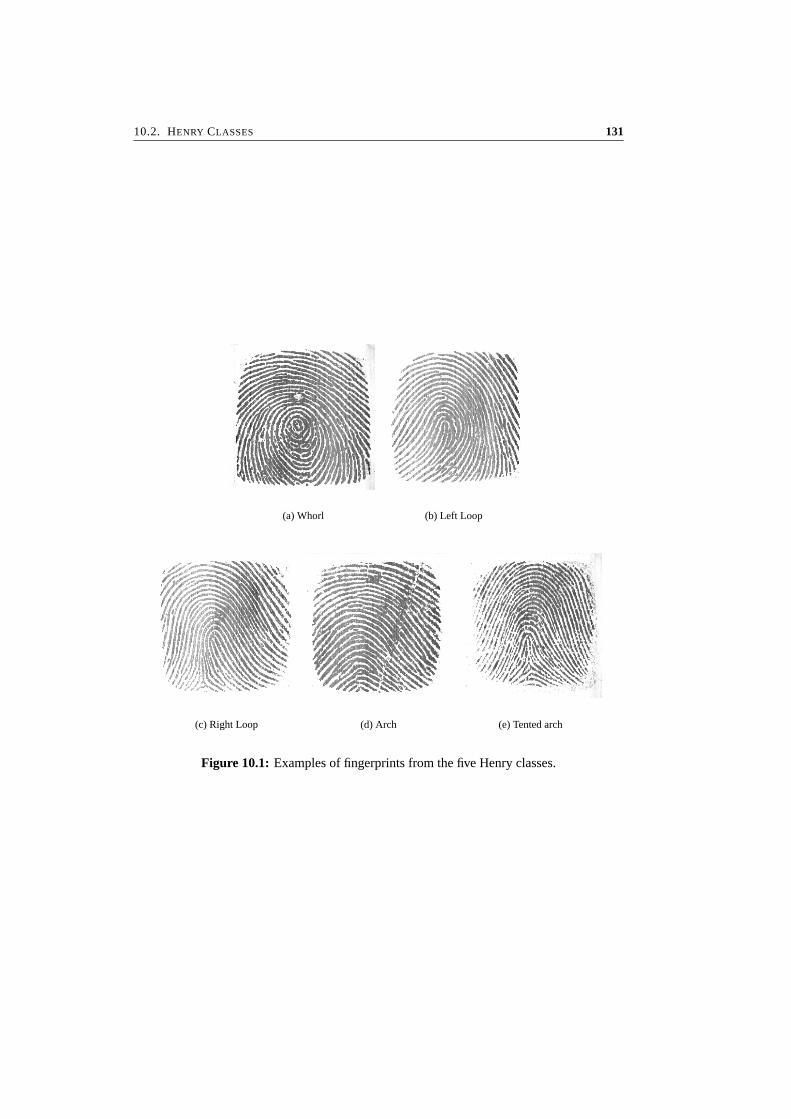
10.2. HENRY CLASSES 131
(a) Whorl (b) Left Loop
(c) Right Loop (d) Arch (e) Tented arch
Figure 10.1: Examples of fingerprints from the five Henry classes.
132 CHAPTER 10. CLASSIFICATION
Many ways to classify fingerprints to one of the Henry classes are known from literature.In [Kar96], fingerprints are classified in the Henry classes by examining the relative positionsof the singular points. In [Cap99], a graph of homogeneous regions in the directional fieldis constructed and the graph is classified. In [Jai99a], FingerCode (see Section 11.2.2) isused as a feature vector for Henry classification. The most popular classification approach isthe application of principal component analysis (PCA) or Karhunen-Loeve transform (KL)[Hay99] to the block directional field (BDF) estimate [Can95]. Each element in the BDFis represented by a vector of two components that points in the direction of the local ridgeorientation. The resulting vectors are concatenated to form a feature vector. Next, the dimen-sionality of this feature vector is reduced by the application of PCA. This method removesthe redundancy and noise, while maintaining the maximum amount of information in thefeature vector. The resulting small feature vector is classified by a neural network. Multiplefingerprint classifiers can be combined to improve their performance [Cap00b].
There are two reasons why Henry classification is not able to reduce the size of thedatabase to be searched very much. First, there are only five Henry classes and 90% of allfingerprints belongs to only three classes. Without classification errors, this would reduce thenumber of possible matches to approximately 30% of the original, thus allowing a databasesize of three times as large as without classification for the same processing times and errorrates.
Second, the state-of-the-art classifiers at the moment perform at an error rate of about 6%for the Henry classes [Cap00b]. This means that for 6% of the query prints, the correspondingprint is not found correctly in the database due to classification errors. Alternatively, 20% ofthe query fingerprints is rejected for classification, resulting in an error rate of 1%. The effectof the rejection is that for 20% of the fingerprints the entire database has to be searched, while1% of the prints still remains non-identified due to classification errors. From these figures,one can conclude that the practical value of Henry classification is limited.
10.3 Conclusions
A naive identification system matches the query fingerprint to each template in the database.This results in unacceptable processing times and error rates for databases of only moderatesizes. Classification can be used as a first selection mechanism to reduce the number ofmatches that is required. However, traditional Henry classification is not able to provideenough reduction of the size of the database to be searched in order to be of practical use.
The fact that there is still much research on Henry classification can be explained by thefact that it is an interesting classification problem. Since many approaches are known fromthe literature, it has become an issue of academic interest. Furthermore, many existing finger-print databases are partitioned according to the Henry classification. To use those databaseswithout re-processing them for use with better applicable classification schemes, automaticHenry classification still has to be used.

Chapter 11
Indexing Fingerprint Databases
Abstract
In a fingerprint identification system, a person is identified only by his fingerprint. To accom-plish this, a database is searched by matching all entries to the given fingerprint. However,the maximum size of the database is limited, since each match takes some amount of timeand has a small probability of error. A solution to this problem is to reduce the number offingerprints that have to be matched. This is achieved by extracting features from the finger-prints and first matching the fingerprints that have the smallest feature distance to the queryfingerprint. Using this indexing method, modern systems are able to search databases up to afew hundred fingerprints.
In this chapter, three possible fingerprint indexing features are discussed: the registereddirectional field estimate, FingerCode and minutiae triplets. It is shown that indexing schemesthat are based on these features, are able to search a database more effectively than a simplelinear scan. Next, a new indexing scheme is constructed that is based on combining thesefeatures. It is shown that this scheme results in a considerably better performance than theschemes that are based on the individual features or on more naive methods of combining thefeatures, thus allowing much larger fingerprint databases to be searched. Part of this chapterhas been published in [Boe01].
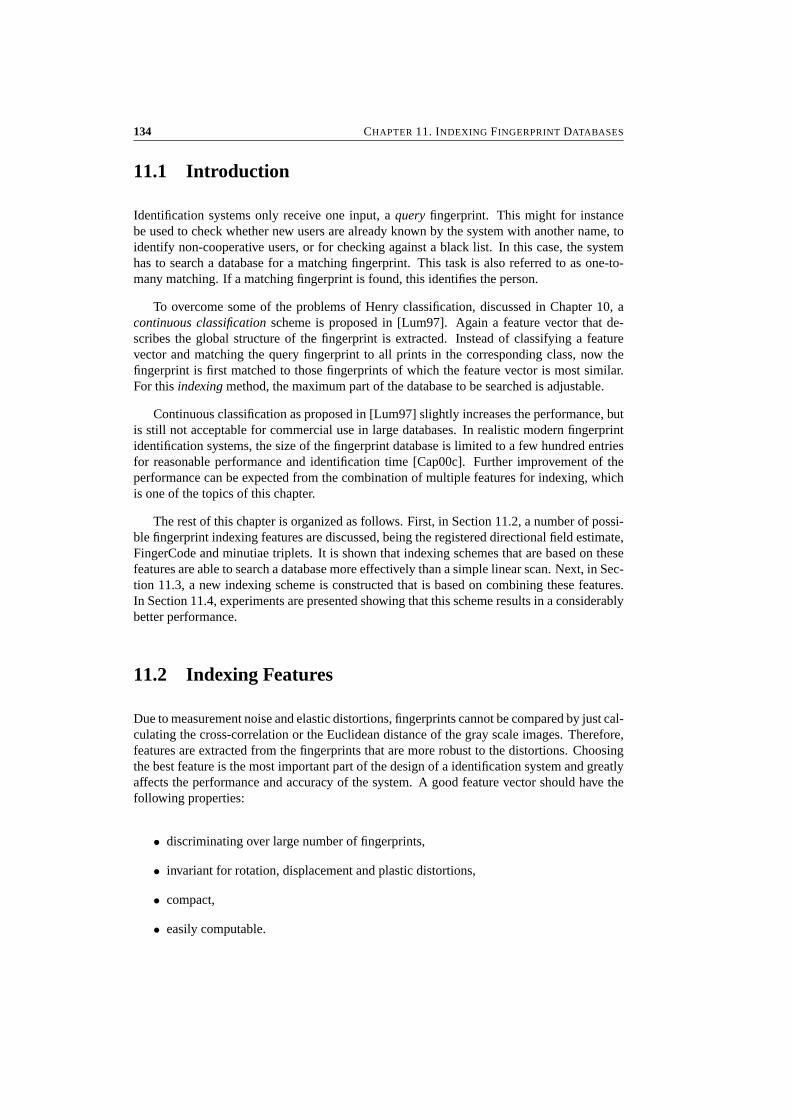
134 CHAPTER 11. INDEXING FINGERPRINT DATABASES
11.1 Introduction
Identification systems only receive one input, a query fingerprint. This might for instancebe used to check whether new users are already known by the system with another name, toidentify non-cooperative users, or for checking against a black list. In this case, the systemhas to search a database for a matching fingerprint. This task is also referred to as one-to-many matching. If a matching fingerprint is found, this identifies the person.
To overcome some of the problems of Henry classification, discussed in Chapter 10, acontinuous classification scheme is proposed in [Lum97]. Again a feature vector that de-scribes the global structure of the fingerprint is extracted. Instead of classifying a featurevector and matching the query fingerprint to all prints in the corresponding class, now thefingerprint is first matched to those fingerprints of which the feature vector is most similar.For this indexing method, the maximum part of the database to be searched is adjustable.
Continuous classification as proposed in [Lum97] slightly increases the performance, butis still not acceptable for commercial use in large databases. In realistic modern fingerprintidentification systems, the size of the fingerprint database is limited to a few hundred entriesfor reasonable performance and identification time [Cap00c]. Further improvement of theperformance can be expected from the combination of multiple features for indexing, whichis one of the topics of this chapter.
The rest of this chapter is organized as follows. First, in Section 11.2, a number of possi-ble fingerprint indexing features are discussed, being the registered directional field estimate,FingerCode and minutiae triplets. It is shown that indexing schemes that are based on thesefeatures are able to search a database more effectively than a simple linear scan. Next, in Sec-tion 11.3, a new indexing scheme is constructed that is based on combining these features.In Section 11.4, experiments are presented showing that this scheme results in a considerablybetter performance.
11.2 Indexing Features
Due to measurement noise and elastic distortions, fingerprints cannot be compared by just cal-culating the cross-correlation or the Euclidean distance of the gray scale images. Therefore,features are extracted from the fingerprints that are more robust to the distortions. Choosingthe best feature is the most important part of the design of a identification system and greatlyaffects the performance and accuracy of the system. A good feature vector should have thefollowing properties:
• discriminating over large number of fingerprints,
• invariant for rotation, displacement and plastic distortions,
• compact,
• easily computable.

11.2. INDEXING FEATURES 135
In this section, a number of possible features that can be used for indexing fingerprintdatabases are discussed.
11.2.1 Directional Field
The most straightforward feature that describes the shape of a fingerprint is to use the direc-tional field estimate directly. In order to keep the feature vector relatively small, the DF iscalculated blockwise, which means that only one DF value is calculated in each block of forinstance 16 × 16 pixels.
Each element in the DF is represented by a vector of 2 components that points in thedirection of the local ridge orientation. The SDF is used, in order to give orthogonal orien-tations the largest distance. The resulting vectors are concatenated to form a feature vector.Next, the dimensionality of this feature vector is reduced by the application of the principalcomponent analysis (PCA) or Karhunen-Loeve transform (KL) [Hay99]. This method re-moves the redundancy and noise, while maintaining the maximum amount of information inthe feature vector. We have found that a feature vector length of 30 gives the best results forDatabase 2 of FVC2000.
It is important that the DF estimates are registered well, which means that they are ex-actly aligned. For this task, the uppermost core is used. However, in some cases, this mightnot be easy to achieve. First, live-scanned fingerprints only capture a small area of the entirefingerprint. Therefore, some singular points may fall outside the actual image. Second, anarch (see Figure 10.1(d) on page 131) does not contain any singular points, and an alterna-tive registration point has to be defined. Third, a DF that is estimated from a low-qualityfingerprint image, may contain a number of false SPs. They can possibly be eliminated byhigh-resolution segmentation methods, as discussed in Chapter 4.
Similar feature vectors have been used by other researchers as well for fingerprint classifi-cation. In [Can95], this feature vector is the input for a probablistic neural network for Henryclassification. In [Cap00c], this feature vector is used for indexing databases. However, amulti-space Karhunen-Loeve (MKL) approach is used for calculation of the distances to theHenry classes, and this new feature vector is used for indexing the database.
11.2.2 FingerCode
The second feature vector we will use for indexing is the FingerCode [Jai99a, Jai00b]. Thismethod filters the fingerprint image by a bank of Gabor filters that are tuned to differentorientations. Next, the fixed-length feature vector, which is called FingerCode, is computedas the standard deviation in a number of sectors, which is indicative of the overall ridgeactivity in a certain orientation in that sector. The authors expect that this feature vectorcaptures both global and local characteristics of the fingerprint image.
Calculation of the FingerCode from a fingerprint image is done as follows. First the refer-ence point is determined. Again, the uppermost core can be used. Then, the fingerprint image

136 CHAPTER 11. INDEXING FINGERPRINT DATABASES
Figure 11.1: FingerCode: region of interest around the core, divided in 48 sectors.
is filtered by a bank of Gabor filters (see Appendix D) that are oriented in eight directions1.Finally, for each filtered image the standard deviation of the gray values is computed in anumber of predefined sectors around the reference point. The vector of standard deviations iscalled FingerCode.
For the calculation of FingerCode, 8 values of θ are chosen that are equally spaced from0 to π with respect to the x-axis. The value for σ is determined empirically and set toapproximately half the inter-ridge distance. Before the filtering is applied, the fingerprintimage is normalized to compensate for intensity variations due to pressure variations.
Around the core, 3 concentric circular regions of 20 pixels wide, which is approximatelytwice the inter-ridge distance, are defined and each region is divided in 16 sectors. Thisis illustrated in Figure 11.1. The immediate region around the core is not used, becausethe sectors would be too small and would not have enough pixels to calculate a reliablestandard deviation. The standard deviations of each filtered image in each sector form the384-dimensional feature vector that is called the FingerCode. An example FingerCode isshown in Figure 11.2, where each disk corresponds to one filtered image.
FingerCode has already been used in a fingerprint matching system [Jai00b] and for theclassification of fingerprints in Henry classes [Jai99a], using a two-stage classifier which usesa K-nearest neighbor classifier in the first stage and a set of neural networks in the secondstage. In this paper, we will demonstrate the use of FingerCode as a feature for indexingfingerprint databases.
11.2.3 Minutiae Triplets
The third feature vector is based on minutiae triplets. The algorithm has been proposed in[Ger97] and slightly adapted in [Bha01]. The algorithm first identifies all minutiae tripletsin a fingerprint. Each triplet defines a triangle, from which various geometric features areextracted. One can for instance use the length of the sides, the angles, etc. Next, the similarity
1In Chapters 5 and 7 we used only four directions and the absolute value of the Gabor response. However, thisresearch was performed earlier, and uses the original version of FingerCode as described in [Jai99a, Jai00b]
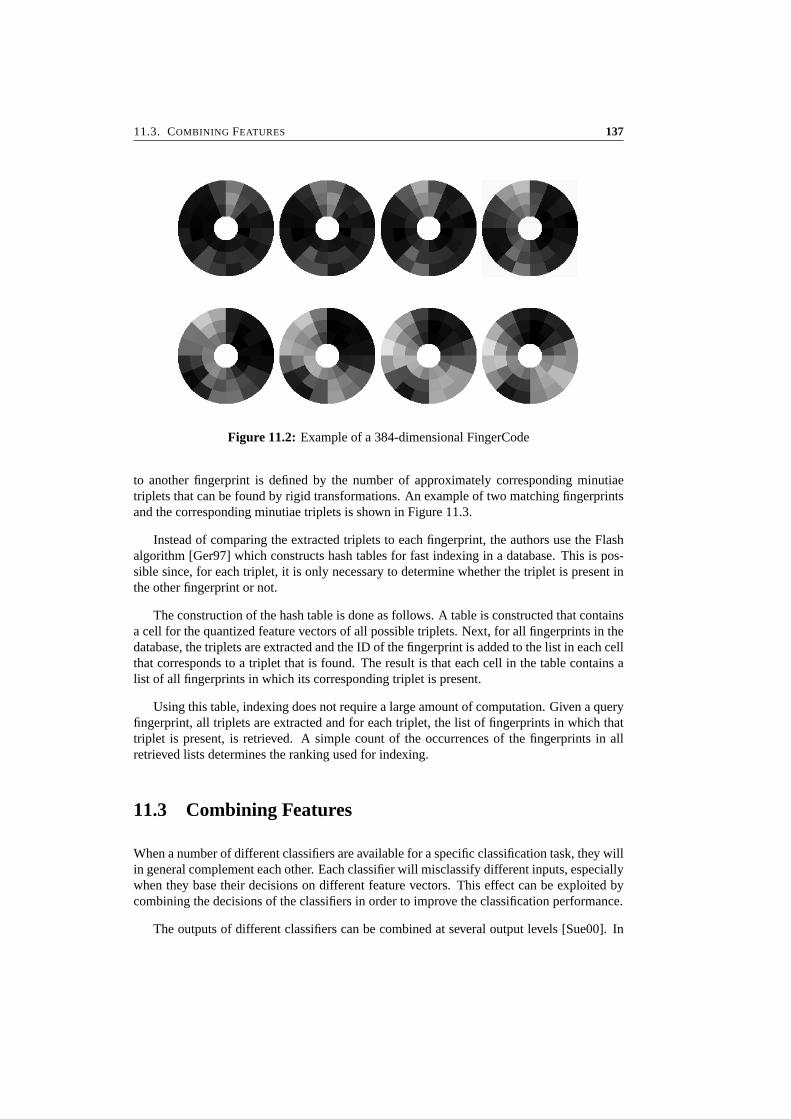
11.3. COMBINING FEATURES 137
Figure 11.2: Example of a 384-dimensional FingerCode
to another fingerprint is defined by the number of approximately corresponding minutiaetriplets that can be found by rigid transformations. An example of two matching fingerprintsand the corresponding minutiae triplets is shown in Figure 11.3.
Instead of comparing the extracted triplets to each fingerprint, the authors use the Flashalgorithm [Ger97] which constructs hash tables for fast indexing in a database. This is pos-sible since, for each triplet, it is only necessary to determine whether the triplet is present inthe other fingerprint or not.
The construction of the hash table is done as follows. A table is constructed that containsa cell for the quantized feature vectors of all possible triplets. Next, for all fingerprints in thedatabase, the triplets are extracted and the ID of the fingerprint is added to the list in each cellthat corresponds to a triplet that is found. The result is that each cell in the table contains alist of all fingerprints in which its corresponding triplet is present.
Using this table, indexing does not require a large amount of computation. Given a queryfingerprint, all triplets are extracted and for each triplet, the list of fingerprints in which thattriplet is present, is retrieved. A simple count of the occurrences of the fingerprints in allretrieved lists determines the ranking used for indexing.
11.3 Combining Features
When a number of different classifiers are available for a specific classification task, they willin general complement each other. Each classifier will misclassify different inputs, especiallywhen they base their decisions on different feature vectors. This effect can be exploited bycombining the decisions of the classifiers in order to improve the classification performance.
The outputs of different classifiers can be combined at several output levels [Sue00]. In
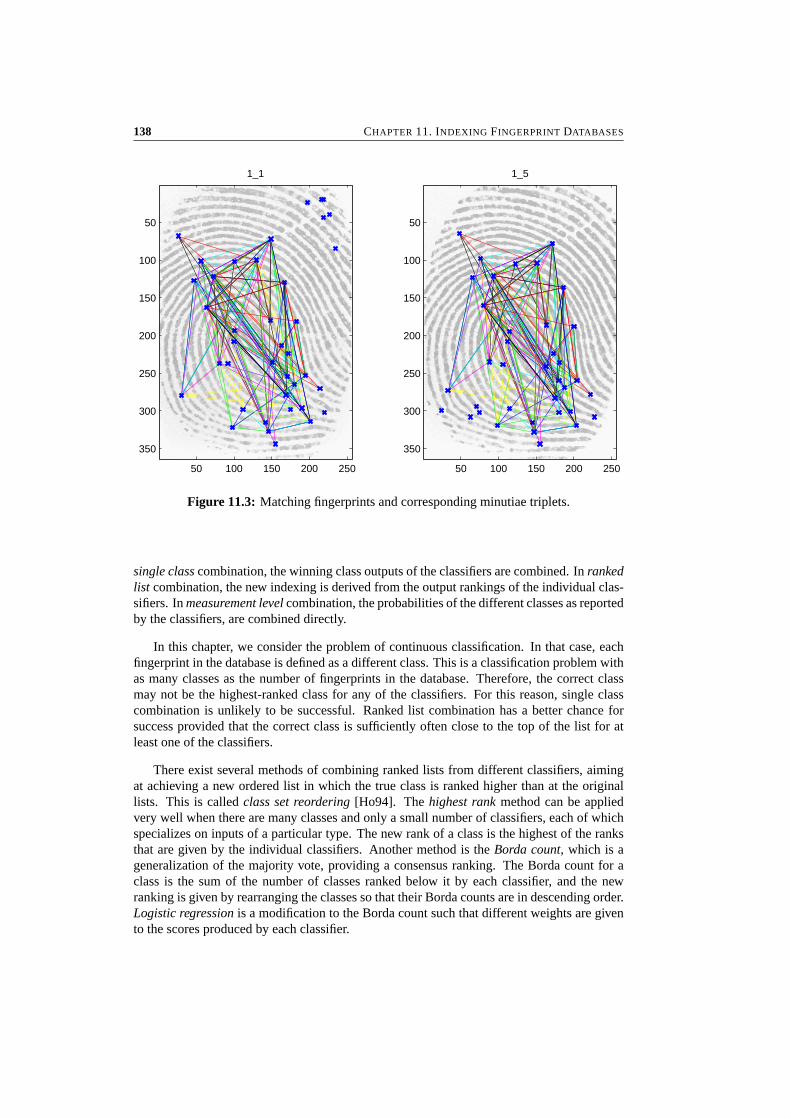
138 CHAPTER 11. INDEXING FINGERPRINT DATABASES
1_1
50 100 150 200 250
50
100
150
200
250
300
350
1_5
50 100 150 200 250
50
100
150
200
250
300
350
Figure 11.3: Matching fingerprints and corresponding minutiae triplets.
single class combination, the winning class outputs of the classifiers are combined. In rankedlist combination, the new indexing is derived from the output rankings of the individual clas-sifiers. In measurement level combination, the probabilities of the different classes as reportedby the classifiers, are combined directly.
In this chapter, we consider the problem of continuous classification. In that case, eachfingerprint in the database is defined as a different class. This is a classification problem withas many classes as the number of fingerprints in the database. Therefore, the correct classmay not be the highest-ranked class for any of the classifiers. For this reason, single classcombination is unlikely to be successful. Ranked list combination has a better chance forsuccess provided that the correct class is sufficiently often close to the top of the list for atleast one of the classifiers.
There exist several methods of combining ranked lists from different classifiers, aimingat achieving a new ordered list in which the true class is ranked higher than at the originallists. This is called class set reordering [Ho94]. The highest rank method can be appliedvery well when there are many classes and only a small number of classifiers, each of whichspecializes on inputs of a particular type. The new rank of a class is the highest of the ranksthat are given by the individual classifiers. Another method is the Borda count, which is ageneralization of the majority vote, providing a consensus ranking. The Borda count for aclass is the sum of the number of classes ranked below it by each classifier, and the newranking is given by rearranging the classes so that their Borda counts are in descending order.Logistic regression is a modification to the Borda count such that different weights are givento the scores produced by each classifier.
11.4. EXPERIMENTAL RESULTS 139
Another interesting concept in combining ranked lists is class set reduction. There aretwo methods of class set reduction that both aim at reducing the number of classes in theoutput list without losing the true class. The first method determines for each classifier theworst ranking ever given to the true class in the training set. When using the classifier, classesthat receive a lower rank than this threshold are discarded. The second method determinesfor each training example the best ranking over all classifiers and stores that value with thebest classifier. Then, for each classifier, the worst of all best rankings is determined. Eachpossible class is discarded if its ranking is worse than this threshold for each classifier.
Combination of the classifier outputs at the measurement level provides even more infor-mation than combining ranked lists. In [Kit98] it has been shown that the sum rule, whichsums or averages the posterior probabilities of the classes, is the most robust combinationmethod for multiple classifiers. However, one difficulty arises when applying this combi-nation rule to classifiers that do not output posterior probabilities. This is the case with theclassifiers we use, which output distance and similarity measures. These quantities first haveto be transformed to posterior probabilities before the combination rule can be applied.
In [Cap00b], the combination of the measurement level outputs of different classifiershas been applied to indexing fingerprint databases. In that paper, two indexing features arecombined by taking a weighted average of a non-linear function of the two feature-distances.It has been shown that this increases the performance of the indexing scheme. However, theincrease of performance is only significant for small parts of the database to be searched.When higher matching rates are required, the combination does not perform better than theindividual classifiers.
11.4 Experimental Results
We have run our experiments on Database 2 of the FVC2000 contest [Mai00, Mai02]. Thisdatabase contains fingerprint images that are captured by a capacitive sensor with a resolutionof 500 pixels per inch, resulting in images of 364 × 256 pixels in 8 bit gray-scale. In thisdatabase, 110 untrained individuals are enrolled, each with 8 prints of the same finger. Thefirst of these prints is used to construct the database, while the other seven prints are used totest the classification performance.
Since our singular point detection algorithm [Baz01b, Baz02d] still detects some falsesingular points, the registration points that are used in the DF-based and FingerCode algo-rithms have been validated manually. In 13% of the fingerprints, the registration point hasbeen corrected, while 1% of the fingerprints has been rejected in which no registration pointcould be found.
11.4.1 Single Features
The results of the identification of the remaining 7 prints per finger (one has been used toconstruct the database), using the three indexing features of Section 11.2, are shown in Fig-ure 11.4. The vertical axis depicts the cumulative percentage of prints which are correctly
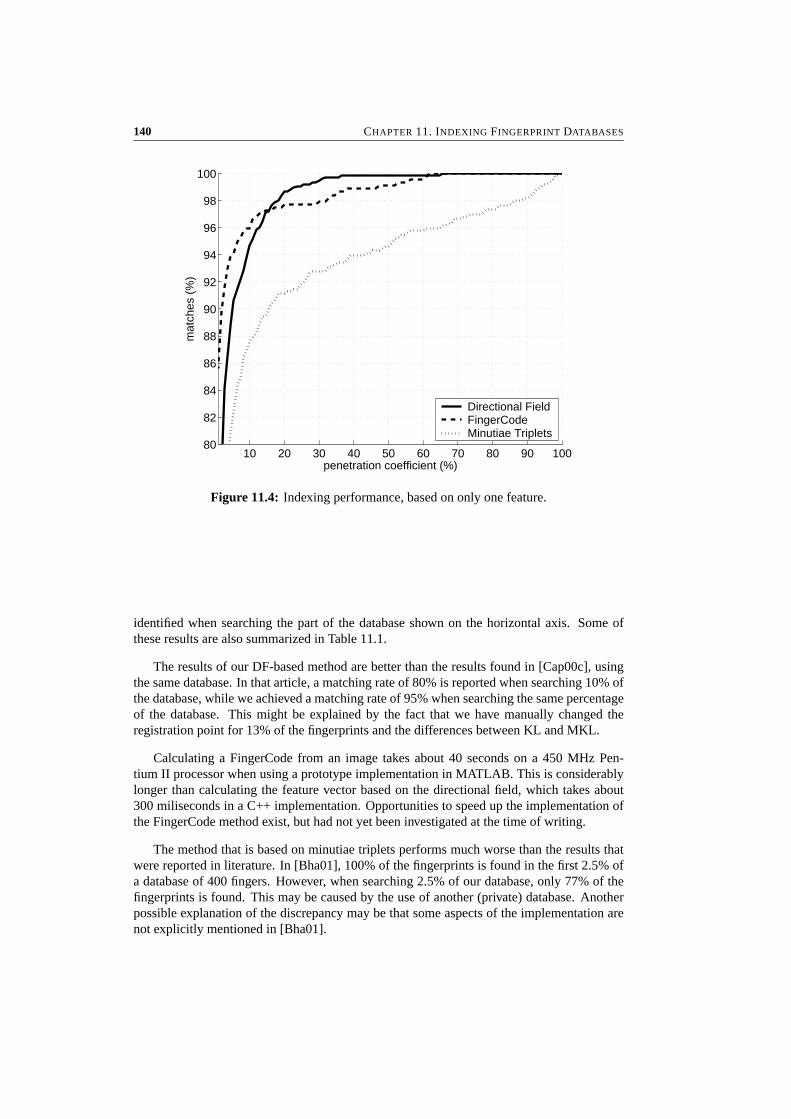
140 CHAPTER 11. INDEXING FINGERPRINT DATABASES
10 20 30 40 50 60 70 80 90 10080
82
84
86
88
90
92
94
96
98
100
penetration coefficient (%)
mat
ches
(%
)
Directional FieldFingerCodeMinutiae Triplets
Figure 11.4: Indexing performance, based on only one feature.
identified when searching the part of the database shown on the horizontal axis. Some ofthese results are also summarized in Table 11.1.
The results of our DF-based method are better than the results found in [Cap00c], usingthe same database. In that article, a matching rate of 80% is reported when searching 10% ofthe database, while we achieved a matching rate of 95% when searching the same percentageof the database. This might be explained by the fact that we have manually changed theregistration point for 13% of the fingerprints and the differences between KL and MKL.
Calculating a FingerCode from an image takes about 40 seconds on a 450 MHz Pen-tium II processor when using a prototype implementation in MATLAB. This is considerablylonger than calculating the feature vector based on the directional field, which takes about300 miliseconds in a C++ implementation. Opportunities to speed up the implementation ofthe FingerCode method exist, but had not yet been investigated at the time of writing.
The method that is based on minutiae triplets performs much worse than the results thatwere reported in literature. In [Bha01], 100% of the fingerprints is found in the first 2.5% ofa database of 400 fingers. However, when searching 2.5% of our database, only 77% of thefingerprints is found. This may be caused by the use of another (private) database. Anotherpossible explanation of the discrepancy may be that some aspects of the implementation arenot explicitly mentioned in [Bha01].
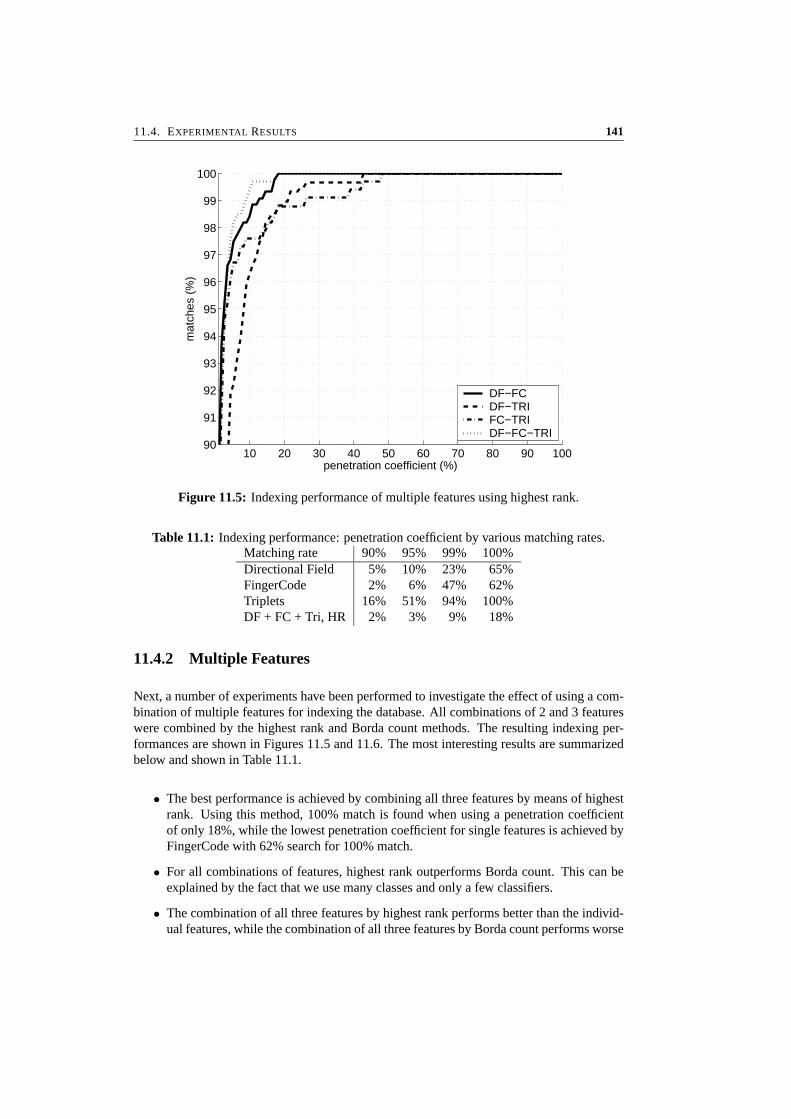
11.4. EXPERIMENTAL RESULTS 141
10 20 30 40 50 60 70 80 90 10090
91
92
93
94
95
96
97
98
99
100
penetration coefficient (%)
mat
ches
(%
)
DF−FCDF−TRIFC−TRIDF−FC−TRI
Figure 11.5: Indexing performance of multiple features using highest rank.
Table 11.1: Indexing performance: penetration coefficient by various matching rates.Matching rate 90% 95% 99% 100%Directional Field 5% 10% 23% 65%FingerCode 2% 6% 47% 62%Triplets 16% 51% 94% 100%DF + FC + Tri, HR 2% 3% 9% 18%
11.4.2 Multiple Features
Next, a number of experiments have been performed to investigate the effect of using a com-bination of multiple features for indexing the database. All combinations of 2 and 3 featureswere combined by the highest rank and Borda count methods. The resulting indexing per-formances are shown in Figures 11.5 and 11.6. The most interesting results are summarizedbelow and shown in Table 11.1.
• The best performance is achieved by combining all three features by means of highestrank. Using this method, 100% match is found when using a penetration coefficientof only 18%, while the lowest penetration coefficient for single features is achieved byFingerCode with 62% search for 100% match.
• For all combinations of features, highest rank outperforms Borda count. This can beexplained by the fact that we use many classes and only a few classifiers.
• The combination of all three features by highest rank performs better than the individ-ual features, while the combination of all three features by Borda count performs worse
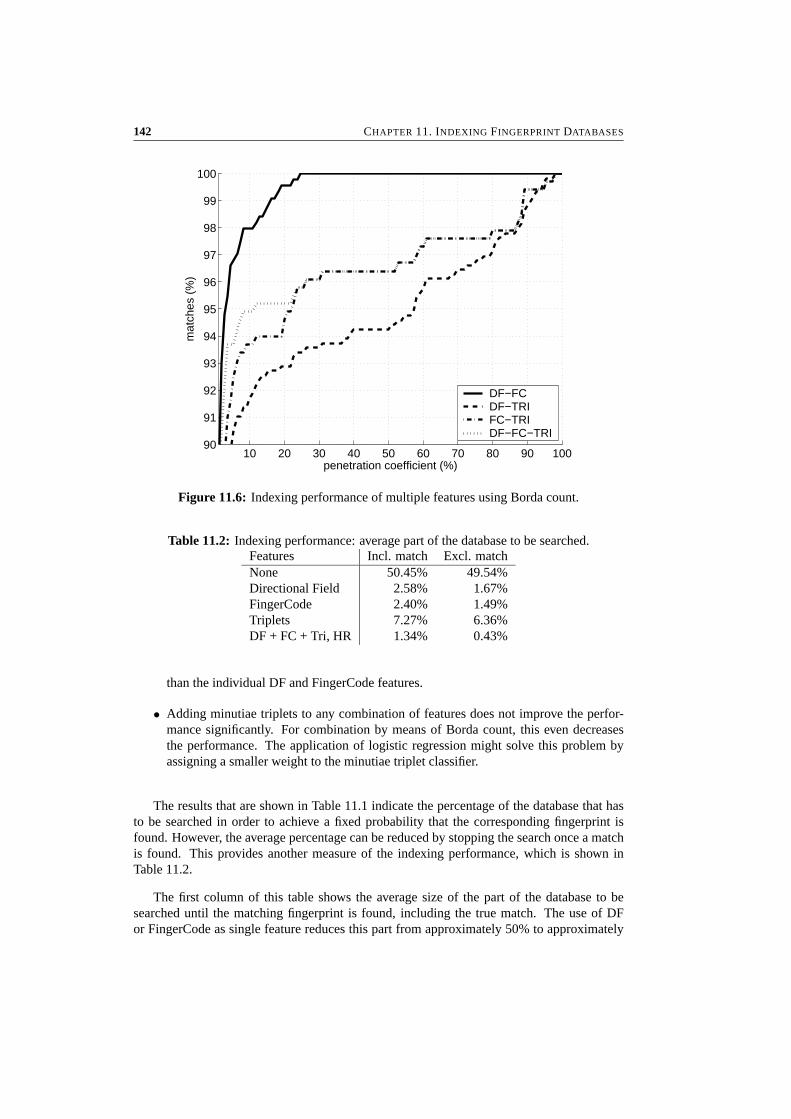
142 CHAPTER 11. INDEXING FINGERPRINT DATABASES
10 20 30 40 50 60 70 80 90 10090
91
92
93
94
95
96
97
98
99
100
penetration coefficient (%)
mat
ches
(%
)
DF−FCDF−TRIFC−TRIDF−FC−TRI
Figure 11.6: Indexing performance of multiple features using Borda count.
Table 11.2: Indexing performance: average part of the database to be searched.Features Incl. match Excl. matchNone 50.45% 49.54%Directional Field 2.58% 1.67%FingerCode 2.40% 1.49%Triplets 7.27% 6.36%DF + FC + Tri, HR 1.34% 0.43%
than the individual DF and FingerCode features.
• Adding minutiae triplets to any combination of features does not improve the perfor-mance significantly. For combination by means of Borda count, this even decreasesthe performance. The application of logistic regression might solve this problem byassigning a smaller weight to the minutiae triplet classifier.
The results that are shown in Table 11.1 indicate the percentage of the database that hasto be searched in order to achieve a fixed probability that the corresponding fingerprint isfound. However, the average percentage can be reduced by stopping the search once a matchis found. This provides another measure of the indexing performance, which is shown inTable 11.2.
The first column of this table shows the average size of the part of the database to besearched until the matching fingerprint is found, including the true match. The use of DFor FingerCode as single feature reduces this part from approximately 50% to approximately
11.5. CONCLUSIONS 143
2.5% of the database, while the combination of features further reduces the size of the parti-tion to less than 1.5%.
However, this part includes the actual matching fingerprint, which occupies 0.9% of adatabase of 110 fingerprints. Only the number of non-matching prints that have to be matchedare responsible for the increased FAR. This percentage is reduced to less than 0.5% of thedatabase by combining multiple features. Compared to a simple linear search, this allows thesize of databases to be 100 times as large, while maintaining the same FAR and FRR.
11.5 Conclusions
In this chapter, three possible fingerprint indexing features have been discussed: the registereddirectional field estimate, FingerCode and minutiae triplets. It has been shown that indexingschemes that are based on these features are able to search a database more effectively than asimple linear scan.
Next, a new indexing scheme has been constructed that is based on combining thesefeatures. It has been shown that especially the highest rank combination of DF, FingerCodeand minutiae triplets results in a considerably better performance than the schemes that arebased on the individual features. Compared to a simple linear search, this allows the sizeof databases to be 100 times as large, while maintaining the same FAR and FRR. A furtherimprovement might be achieved by using logistic regression as combination rule and by theadditional use of class set reduction.
A number of possibilities for improving the performance of fingerprint database indexingexist. First, other features could be added, like for instance the absolute value of the complexGabor response on a rectangular grid, as defined in Appendix D and applied in Chapter 7 tothe matching problem. Second, the Euclidean distance (as proposed for FingerCode [Jai00b])can be replaced by likelihood ratios, as proposed in Chapter 7 for verification.


Chapter 12
Conclusions andRecommendations
This thesis focusses on three principal challenges in fingerprint recognition: robust featureextraction from low-quality fingerprints, matching elastically deformed fingerprints, and ef-ficient search of fingerprints in a database. Research into these challenges has yielded im-provements for most of them, as will be pointed out in Section 12.1. A few directions forfurther research into fingerprint recognition are presented in Section 12.2.
12.1 Conclusions
In this thesis, the matching performances of three different fingerprint recognition config-urations have been evaluated. The correlation based system of Chapter 8 participated inFVC2000, resulting in an equal error rate of EER = 10%. The elastic minutiae matching sys-tem of Chapter 6 participated in FVC2002, resulting in EER = 2% on the training database.The fixed-length feature vector-based system of Chapter 7 has been tested on the FVC2000databases, resulting in EER = 0.5%. Unfortunately, there was no time to integrate all com-ponents into a system that could be tested in a real-life situation. That would certainly revealweaknesses that have not been found in the laboratory on test databases.
The best fingerprint recognition system that can be constructed from the work of thisthesis combines two matching algorithms: the elastic minutiae matching and the fixed-lengthfeature vector matching. Since the features of both algorithms (minutiae sets and fixed-lengthfeature vectors) are virtually uncorrelated, the equal error rate of this system is expected tobe somewhere in the range from 10−3 to 10−4. If multiple prints of the same finger areused for template construction, using simple averaging of the fixed-length feature vectors andelastic mosaicking methods for the minutiae sets (see Section 12.2.2), the equal error rate isexpected to be smaller than 10−5. Furthermore, large databases can be searched reliably withthis system by first applying the fixed-length feature vectors as selection phase and then theelastic minutiae matching as matching phase.
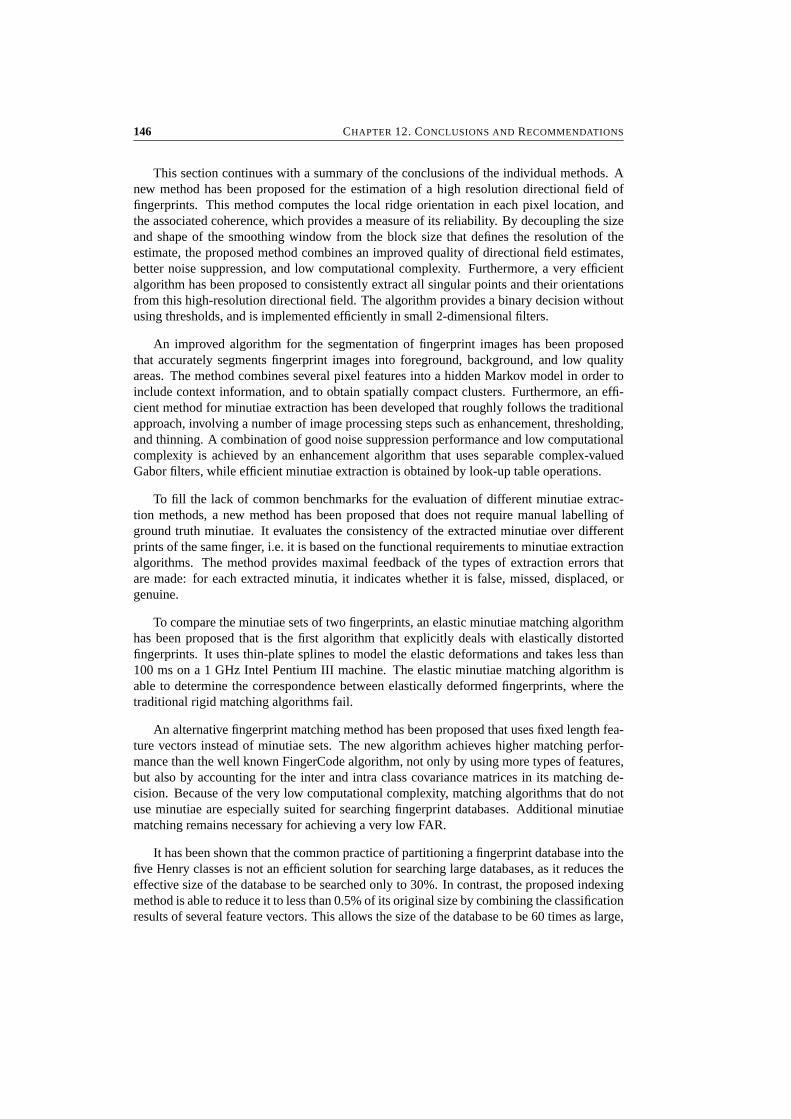
146 CHAPTER 12. CONCLUSIONS AND RECOMMENDATIONS
This section continues with a summary of the conclusions of the individual methods. Anew method has been proposed for the estimation of a high resolution directional field offingerprints. This method computes the local ridge orientation in each pixel location, andthe associated coherence, which provides a measure of its reliability. By decoupling the sizeand shape of the smoothing window from the block size that defines the resolution of theestimate, the proposed method combines an improved quality of directional field estimates,better noise suppression, and low computational complexity. Furthermore, a very efficientalgorithm has been proposed to consistently extract all singular points and their orientationsfrom this high-resolution directional field. The algorithm provides a binary decision withoutusing thresholds, and is implemented efficiently in small 2-dimensional filters.
An improved algorithm for the segmentation of fingerprint images has been proposedthat accurately segments fingerprint images into foreground, background, and low qualityareas. The method combines several pixel features into a hidden Markov model in order toinclude context information, and to obtain spatially compact clusters. Furthermore, an effi-cient method for minutiae extraction has been developed that roughly follows the traditionalapproach, involving a number of image processing steps such as enhancement, thresholding,and thinning. A combination of good noise suppression performance and low computationalcomplexity is achieved by an enhancement algorithm that uses separable complex-valuedGabor filters, while efficient minutiae extraction is obtained by look-up table operations.
To fill the lack of common benchmarks for the evaluation of different minutiae extrac-tion methods, a new method has been proposed that does not require manual labelling ofground truth minutiae. It evaluates the consistency of the extracted minutiae over differentprints of the same finger, i.e. it is based on the functional requirements to minutiae extractionalgorithms. The method provides maximal feedback of the types of extraction errors thatare made: for each extracted minutia, it indicates whether it is false, missed, displaced, orgenuine.
To compare the minutiae sets of two fingerprints, an elastic minutiae matching algorithmhas been proposed that is the first algorithm that explicitly deals with elastically distortedfingerprints. It uses thin-plate splines to model the elastic deformations and takes less than100 ms on a 1 GHz Intel Pentium III machine. The elastic minutiae matching algorithm isable to determine the correspondence between elastically deformed fingerprints, where thetraditional rigid matching algorithms fail.
An alternative fingerprint matching method has been proposed that uses fixed length fea-ture vectors instead of minutiae sets. The new algorithm achieves higher matching perfor-mance than the well known FingerCode algorithm, not only by using more types of features,but also by accounting for the inter and intra class covariance matrices in its matching de-cision. Because of the very low computational complexity, matching algorithms that do notuse minutiae are especially suited for searching fingerprint databases. Additional minutiaematching remains necessary for achieving a very low FAR.
It has been shown that the common practice of partitioning a fingerprint database into thefive Henry classes is not an efficient solution for searching large databases, as it reduces theeffective size of the database to be searched only to 30%. In contrast, the proposed indexingmethod is able to reduce it to less than 0.5% of its original size by combining the classificationresults of several feature vectors. This allows the size of the database to be 60 times as large,

12.2. RECOMMENDATIONS 147
while maintaining the same processing time and error rates, compared to the situation whereHenry classes are used.
The state-of-the-art in fingerprint recognition research can be summarized as follows.Continuous research is performed on fingerprint sensors, aiming at higher image quality andthe development of smaller and less expensive sensors. Feature extraction algorithms performat a satisfactory level for high quality fingerprints, while they often fail when applied tolow quality fingerprints. Given accurately extracted features, matching performs well, butsearching large databases still remains one of the bigger challenges.
12.2 Recommendations
Despite the achievements of this project, a number of problems remain to be solved in fin-gerprint recognition. Further research should focus on three specific issues: robust featureextraction from low quality fingerprints, construction of robust templates by the integrationof information from multiple prints of the same finger, and issues related to large databases.This section gives an exploration of the possible approaches to these issues.
12.2.1 Feature Extraction
This section proposes a method for robust feature extraction from low quality fingerprintsin three processing steps: segmentation, reconstruction of the directional field, and recon-struction of the gray-scale image. As a basis for the second and third processing steps, itis essential to obtain very accurate estimates of the foreground, background and low qualityareas of the fingerprint images. In our experience, hidden Markov model based segmentationmethods have the highest potential. The performance of these methods can be improved fur-ther by several adaptations. First, instead of using a Gaussian probability density function foreach class, more realistic probability density functions can be considered, such as Gaussianmixtures. Second, more states can be used per class, representing for instance the orientationsof the ridges in the fingerprint. This may help to estimate more accurate output probabilitydensity functions and constrain the transition matrix. Third, two dimensional hidden Markovmodels can be used to provide more accurate context information.
Once accurate segmentation is achieved, the directional field is reconstructed in the lowquality regions. Directional field estimation methods perform well when applied to finger-prints of reasonable quality, but the occurrence of very low quality areas or scars, etc. maylead to inaccurate results. In these regions, the gradient distribution may be dominated bythose defects, which contain gray-scale gradients that are much stronger than the gradientscaused by the ridge-valley structures. These defects inevitably result in the detection of falsesingular points and a lower performance in the image enhancement and indexing stages.
A solution to the problem of inaccurate directional field estimates is the model-basedreconstruction of the directional field in the low quality areas. For reconstruction purposes,two types of models can be used. First, statistical models that are trained on many examples ofobserved data can be used to estimate the most likely values of missing data, see for instance

148 CHAPTER 12. CONCLUSIONS AND RECOMMENDATIONS
[Tur91]. Second, specific directional field models, like the ones proposed in [She93, Viz96,Ara02], can be fitted to the data in the high quality regions, and provide the missing values.An open question remains how to estimate those models efficiently.
Given an accurate estimate of the directional field in low quality areas, the gray-scale im-age can be reconstructed in those areas, enabling the reliable extraction of additional minu-tiae. A decrease in the number of missed minutiae results in better matching performance andlower rejection rates. For the reconstruction of the gray-scale image, methods can be usedthat are similar to the generation of synthetic fingerprints [Cap00a]. One can think of Gaborfilters that are controlled by the directional field, AM-FM reaction-diffusion [Pat01, Act01],or autoregressive filters [Vel90]. It is essential that the reconstructed directional field is highlyaccurate. Otherwise, the reconstruction methods will create spurious ridge-valley structures,resulting in false minutiae, and consequently a decrease of the matching performance.
12.2.2 Robust Templates
It has been shown in Chapter 7 that a large increases in matching performance can be achievedby the integration of multiple prints of one finger into one template in order to reduce the vari-ance of the template. Since the feature vectors that are used in that chapter are already alignedsufficiently, the combination of multiple feature vectors is no more than a simple averagingoperation, which reduces the intra class variation that is present in the template. Combinationof templates that consist of minutiae sets are much more complicated. Since those templatesrepresent the entire fingerprint area instead of one small part of it, two templates of the samefinger will overlap only partially. Furthermore, elastic deformations prohibit a perfect fit ofthe overlapping area, as shown in Chapter 6.
Two methods for combining minutiae sets exist [Jai02]. The first method registers theminutiae sets, and uses the correspondences between the sets to create a new set. The secondmethod, called mosaicking, combines the gray-scale fingerprint images after registration, andextracts a new minutiae set from the combined image. For both methods, elastic deforma-tions of the fingerprints reduce the quality of the combined minutiae sets. These problemscan be solved by applying the elastic minutiae matching algorithm, which eliminates partialmisalignments. The combined template not only contains more reliable minutiae informa-tion, but also contains less elastic deformation by averaging the elastic deformations of allcontributing fingerprints.
12.2.3 Large Databases
The use of large fingerprint databases gives rise to two kinds of problems. The first problem isthat most algorithms have been trained (or optimized) on a relatively small database. For in-stance the widely used FVC2000 databases contain only 110 individuals each (of which only10 are used for training in the actual competition). Therefore, the algorithms have experi-enced only a very small part of the variations in fingerprints that will occur in practice, whichresults in sub-optimal matching performance. A possible solution is to continue training ofthe matching algorithms online, while functioning in practice.

12.2. RECOMMENDATIONS 149
The second problem is the performance of classification or indexing algorithms, whichare needed to search the databases reliably. State-of-the-art algorithms can be used to searchdatabases that contain up to a few hundred fingerprints with acceptable error rates and com-putational time. However, for wide commercial application of fingerprint identification, al-gorithms that can handle much larger databases (containing for instance up to 100,000 fin-gerprints) are needed.
The indexing performance is limited by two causes. First, false singular points cause mis-alignment errors in the extracted indexing feature vectors. Using the methods that are pro-posed in Chapter 7 in combination with the reconstructed directional field probably eliminatesmost of these problems. The second type of errors is caused by the limited discriminatingpower of the feature vectors that are used for indexing. To improve the discriminating power,the grid sizes that are used for feature extraction can be enlarged and research is needed toother types of features that can be added. Finally, cluster algorithms can be used for efficientsearch strategies in very large databases.
After successful research in the proposed directions, fingerprint recognition systems willbe less sensitive to low quality fingerprint images and will support identification in largedatabases. These achievements will enable much wider commercial application of fingerprintrecognition.


Appendix A
Equivalence of DF EstimationMethods
We prove that the squared gradient method and the PCA-based method for the estimation ofthe DF are exactly equivalent. The proof starts by deriving the inverse of Equation 2.4, whichwas given to be:
[Gs,x
Gs,y
]=[
G2x − G2
y2Gx G y
](A.1)
Substituting the lower part of this expression, which is given by
G y = Gs,y
2Gx(A.2)
into the upper part, given by
Gs,x = (G2x − G2
y) (A.3)
gives
G4x − Gs,x G2
x − 1
4Gs,y = 0 (A.4)
Solving this for Gx gives:

152 APPENDIX A. EQUIVALENCE OF DF ESTIMATION METHODS
Gx =
12
√2Gs,x + 2
√G2
s,x + G2s,y
− 12
√2Gs,x + 2
√G2
s,x + G2s,y
12
√2Gs,x − 2
√G2
s,x + G2s,y
− 12
√2Gs,x − 2
√G2
s,x + G2s,y
(A.5)
The second and fourth solutions can be eliminated since Gx is always positive. Further-
more, since√
G2s,x + G2
s,y ≥ Gs,x , the third solution results in the square root of a negative
number. Therefore, only the first solution is valid:
Gx = 1
2
√2Gs,x + 2
√G2
s,x + G2s,y (A.6)
The next step is to consider the squared gradients, averaged over the window W and tosubstitute, according to Equation 2.6:
Gs,x = Gxx − G yy (A.7)
Gs,y = 2Gxy (A.8)
The average gradients, derived from the averaged squared gradients, are:
Gx = 1
2
√2Gs,x + 2
√Gs,x
2 + Gs,y2
=√
1
2(Gxx − G yy) + 1
2
√(Gxx − G yy)2 + 4G2
xy (A.9)
and
G y = Gs,y
2Gx= Gxy
Gx= Gxy√
12 (Gxx − G yy) + 1
2
√(Gxx − G yy)2 + 4G2
xy
(A.10)
Now, it will be shown that the vector:
[Gx
G y
]= 1
c·[
12 (Gxx − G yy) + 1
2
√(Gxx − G yy)2 + 4G2
xy
Gxy
](A.11)

153
with:
c =√
1
2(Gxx − G yy) + 1
2
√(Gxx − G yy)2 + 4G2
xy (A.12)
is an eigenvector of autocovariance matrix C, which is defined in Equation 2.14. This willprove that both methods are equivalent. For the eigenvectors of C, the following expressionmust hold:
C · V = V · � (A.13)
where the columns of V are the eigenvectors of C and ��� is the diagonal matrix of the cor-responding eigenvalues. This expression must also hold for one eigenvector v1 with corre-sponding eigenvalue λ1:
C · v1 = λ1 · v1 (A.14)
In order to show this, [Gx G y]T is substituted for v1
v1 =[
Gx
G y
](A.15)
in the left-hand side of Equation A.14. This gives:
C · v1 =[
Gxx Gxy
Gxy G yy
]· 1
c·[
12 (Gxx − G yy) + 1
2
√(Gxx − G yy)2 + 4G2
xy
Gxy
]
= 1
c· Gxx
(12 (Gxx − G yy) + 1
2
√(Gxx − G yy)2 + 4G2
xy
)+ G2
xy
Gxy
(12 (Gxx − G yy) + 1
2
√(Gxx − G yy)2 + 4G2
xy
)+ GxyG yy
(A.16)
This must be equal to λ1 · [Gx , G y]T . Calculating λ1 from the upper half of these expres-sions, we find:
λ1 =Gxx
(12 (Gxx − G yy) + 1
2
√(Gxx − G yy)2 + 4G2
xy
)+ G2
xy
12 (Gxx − G yy) + 1
2
√(Gxx − G yy)2 + 4G2
xy
(A.17)
which, by multiplying numerator and denominator by 12 (Gxx − G yy) −
12
√(Gxx − G yy)2 + 4G2
xy , can be simplified to:

154 APPENDIX A. EQUIVALENCE OF DF ESTIMATION METHODS
λ1 = 1
2(Gxx + G yy) + 1
2
√(Gxx − G yy)2 + 4G2
xy (A.18)
From the lower half of these expressions we find:
λ1 =Gxy
(12 (Gxx − G yy) + 1
2
√(Gxx − G yy)2 + 4G2
xy
)+ GxyG yy
Gxy(A.19)
which can be easily simplified to:
λ1 = 1
2(Gxx + G yy) + 1
2
√(Gxx − G yy)2 + 4G2
xy (A.20)
Since both expressions give the same result for λ1, [Gx , G y]T is an eigenvector of C.Therefore, both methods are exactly equivalent.
It is not difficult to derive the second eigenvector v2 and its corresponding eigenvalue λ2:
v1 =[
12 (Gxx − G yy) + 1
2
√(Gxx − G yy)2 + 4G2
xy
Gxy
](A.21)
v2 =[
12 (Gxx − G yy) − 1
2
√(Gxx − G yy)2 + 4G2
xy
Gxy
](A.22)
λ1 = 1
2(Gxx + G yy) + 1
2
√(Gxx − G yy)2 + 4G2
xy (A.23)
λ2 = 1
2(Gxx + G yy) − 1
2
√(Gxx − G yy)2 + 4G2
xy (A.24)
Note that λ1 is always larger than or equal to λ2 confirming that the average gradientangle is aligned with v1. The DF, which is perpendicular to the gradient is aligned with v2.

Appendix B
Equivalence of Coh and Str
By substituting Equations A.23 and A.24, Str is given by:
Str = λ1 − λ2
λ1 + λ2(B.1)
=√
(Gxx − G yy)2 + 4G2xy
Gxx + G yy
On the other hand, Coh is given by:
Coh =∣∣∑
W (Gs,x , Gs,y)∣∣∑
W
∣∣(Gs,x , Gs,y)∣∣ (B.2)
where, by substituting Equation 2.4,
∣∣∣∣∣∑W
(Gs,x , Gs,y)
∣∣∣∣∣ =√√√√(∑
W
Gs,x
)2
+(∑
W
Gs,y
)2
=√√√√(∑
W
G2x − G2
y
)2
+(∑
W
2Gx G y
)2
(B.3)
=√
(Gxx − G yy)2 + 4G2xy
and

156 APPENDIX B. EQUIVALENCE OF Coh AND Str
∑W
∣∣(Gs,x , Gs,y)∣∣ =
∑W
√G2
s,x + G2s,y
=∑W
√(G2
x − G2y)
2 + (2Gx G y)2
=∑W
√G4
x + 2G2x G2
y + G4y (B.4)
=∑W
√(G2
x + G2y)
2
=∑W
G2x + G2
y
= Gxx + G yy
Therefore, the coherence of the averaging method is given by:
Coh =√
(Gxx − G yy)2 + 4G2xy
Gxx + G yy(B.5)
which proves the equivalence of Coh and Str.

Appendix C
Rotation of Singular Points
It can be proved that
SDFcore,ϕ = SDFcore,ref · e jϕ (C.1)
by using polar notation (ρs, φs) instead of (x, y) for a position in the reference model of theSPs. The orientation of the SDF is given by:
2θcore,ref(ρs, φs) = φs + 1
2π (C.2)
and the DF is given by:
θcore,ref(ρs, φs) = 1
2φs + 1
4π (C.3)
The problem is to determine the SDF at position (ρs, φs) after rotation of the referencemodel over an angle ϕ. The sample point at (ρs, φs) after the rotation is located at (ρs, φs −ϕ)
before the rotation:
θcore,ref(ρs, φs − ϕ) = 1
2(φs − ϕ) + 1
4π (C.4)
The rotation adds ϕ to the orientation at the sample point:
θcore,ϕ(ρs, φs) = 1
2(φs − ϕ) + 1
4π + ϕ (C.5)
Now, the rotated DF can be converted back to the rotated SDF:

158 APPENDIX C. ROTATION OF SINGULAR POINTS
2θcore,ϕ(ρs, φs) = (φs + 1
2π) + ϕ = 2θcore,ref(ρs, φs) + ϕ (C.6)
which completes the proof. From the formula it becomes obvious that the SDF model of acore has to be rotated over 2π in order to obtain the original model.
Following the same procedure for a delta, it can be proved that
SDFcore,ϕ = SDFcore,ref · e j3ϕ (C.7)
Now, the orientation of the SDF is given by:
2θdelta,ref(ρs, φs) = −φs + 1
2π (C.8)
Following the same procedure as for the core gives:
θdelta,ϕ(ρs, φs) = −1
2(φs − ϕ) + 1
4π + ϕ (C.9)
and:
2θdelta,ϕ(ρs, φs) = (−φs + 1
2π) + 3ϕ = 2θdelta,ref(ρs, φs) + 3ϕ (C.10)
This corresponds to the fact that a delta has to be rotated over 23π in order to obtain the
original model.

Appendix D
Gabor Filtering
This appendix deals with Gabor filtering of images. A Gabor filter is a bandpass filter thatenhances some spatial frequencies and attenuates the others. The real valued Gabor filter isdefined by the point-wise multiplication of a cosine with a Gaussian window:
hRe(x, y) = exp
(− x2 + y2
2σ 2
)cos 2π f (x sin θ + y cos θ) (D.1)
where θ is the orientation, f the spatial frequency and σ the standard deviation of the Gaus-sian window. The frequency response of the Gabor filter contains two Gaussian peaks at( f cos θ, f sin θ) and (− f cos θ,− f sin θ).
The complex Gabor filter is given by:
hCx(x, y) = exp
(− x2 + y2
2σ 2
)exp ( j2π f (x sin θ + y cos θ)) (D.2)
such that
Re [hCx(x, y)] = hRe(x, y) (D.3)
Use of the complex Gabor filter offers two advantages. First, the complex Gabor filtercan be applied much more efficiently than the real Gabor filter because it is separable into apart that is only dependent on x and a part that is only dependent on y.

160 APPENDIX D. GABOR FILTERING
h(x, y) = hrow(x) · hcol(y) (D.4)
hrow(x) = exp
(− x2
2σ 2
)exp ( j2π f x sin θ) (D.5)
hcol(y) = exp
(− y2
2σ 2
)exp ( j2π f y cos θ) (D.6)
Using this property, its response can be calculated by consecutive application of a rowand a column filter, instead of a full matrix filter. Next, the response of the real filter can beobtained by taking the real part of the complex response.
For σ = 3 and and x and y ranging from −3σ to 3σ , the real Gabor filter requires 19·19 =361 multiplications and additions per pixel, while the complex Gabor filter requires only4 · 19 = 76 multiplications and additions per pixel. This is an improvement in computationalcomplexity of more than a factor 4.
The second advantage of complex Gabor filtering is that not only the real part of the re-sponse can be used, but the imaginary part as well. Combining them to the absolute responseis especially useful, since this provides a measure for the amplitude of the response. Thismeasure can be used as an alternative to the local standard deviation of the real part of theresponse, which is for instance used in FingerCode [Jai99a, Jai00b] and for segmentationpurposes [Jai97c]. Use of the absolute value requires a smaller smoothing filter and providesbetter indexing and matching performance.
Figure D.1 shows a fingerprint image, the accumulated real and absolute components ofthe Gabor response and the smoothed absolute component. Figure D.2 shows the real compo-nents of the fingerprint image that is filtered by Gabor filters with four different orientations,and Figure D.3 shows the corresponding absolute components. Finally, Figure D.4 shows thesmoothed absolute values of the same fingerprint.
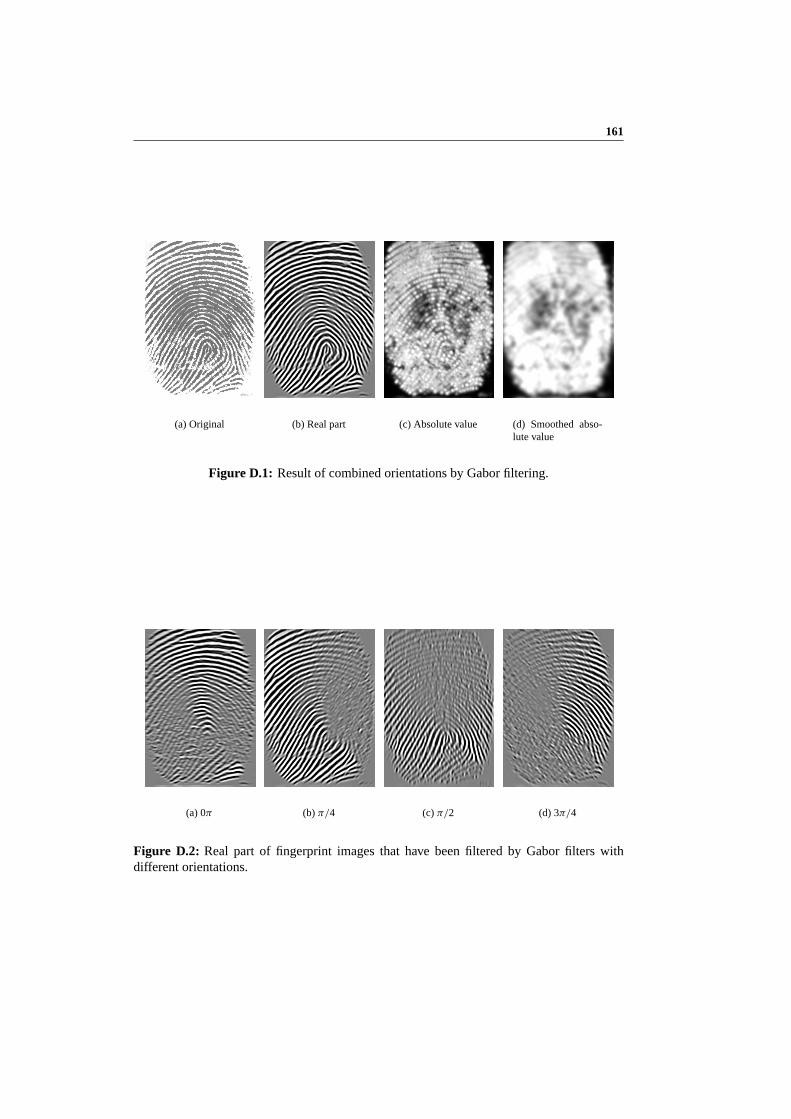
161
(a) Original (b) Real part (c) Absolute value (d) Smoothed abso-lute value
Figure D.1: Result of combined orientations by Gabor filtering.
(a) 0π (b) π/4 (c) π/2 (d) 3π/4
Figure D.2: Real part of fingerprint images that have been filtered by Gabor filters withdifferent orientations.
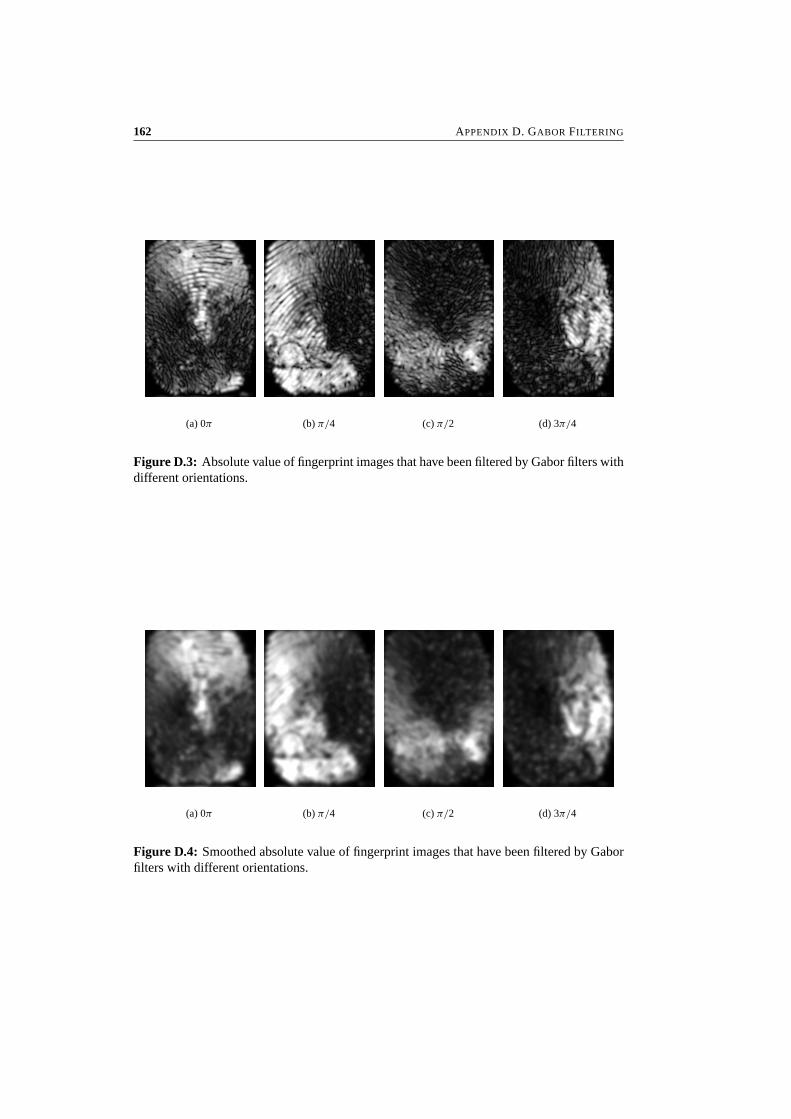
162 APPENDIX D. GABOR FILTERING
(a) 0π (b) π/4 (c) π/2 (d) 3π/4
Figure D.3: Absolute value of fingerprint images that have been filtered by Gabor filters withdifferent orientations.
(a) 0π (b) π/4 (c) π/2 (d) 3π/4
Figure D.4: Smoothed absolute value of fingerprint images that have been filtered by Gaborfilters with different orientations.

Appendix E
Thin-Plate Splines
This appendix describes the estimation of thin-plate spline (TPS) model parameters. TheTPS model provides a non-linear transformation, defined by 2 sets of corresponding land-mark points that are extracted from 2 images. The TPS model describes the transformedcoordinates x ′ and y′ independently as a function of the original coordinates (x, y):
x ′ = fx (x, y) (E.1)
y′ = fy(x, y) (E.2)
and gives a transformation for each point in the images.
Two different types of TPS parameter estimation methods can be distinguished. In[Boo89], interpolating thin-plate splines are presented, which find a transformation that ex-actly maps one set of landmark points on to the other set. On the other hand, in [Roh99],approximating thin-plate splines are presented. These splines define a transformation thatdoes not exactly interpolate all given landmark points, but is allowed to approximate them infavor of a smoother transformation.
E.1 Interpolating Thin-Plate Splines
Given the displacements of a number of landmark points, the TPS transformation interpolatesthose points, while maintaining maximal smoothness. The smoothness is represented by thebending energy of a thin metal plate. At each landmark point (x, y), the displacement isrepresented by an additional z-coordinate, and, for each point, the thin metal plate is fixed atposition (x, y, z). The bending energy Jb is given by the integral of the second order partialderivatives over the entire surface:

164 APPENDIX E. THIN-PLATE SPLINES
Jb =∫∫
(∂2 f
∂x2
)2
+ 2
(∂2 f
∂x∂y
)2
+(
∂2 f
∂y2
)2 dxdy (E.3)
The TPS model for one of the transformed coordinates (choose for instance x) is givenby parameter vectors a, w and Pi :
x ′ = fx (x, y) = a1 + a2x + a3 y +n∑
i=1
wiU (|Pi − (x, y)|) (E.4)
where U (r) = r2 log r is the basis function, a defines the affine part of the transformation,w gives an additional non-linear deformation, and the Pi are the landmarks that the TPSinterpolates.
For each coordinate, the bending energy of Eq. E.3 can be minimized by solving a set oflinear equations:
Kw + Pa = v (E.5)
PT w = 0 (E.6)
where
w = [wx (1) wx (2) · · · wx (n)]T (E.7)
v = [qx (1) qx (2) · · · qx (n)]T (E.8)
a = [ax (1) ax (2) ax (3)]T (E.9)
P =
1 px (1) py(1)
1 px (2) py(2)...
......
1 px (n) py(n)
(E.10)
K =
U (P1, P1) U (P1, P2) · · · U (P1, Pn)
U (P2, P1). . .
......
. . ....
U (Pn, P1) · · · · · · U (Pn, Pn)
(E.11)
Pi = (px (i), py(i)) is the set of landmark points in the first image, px (i) is the x-coordinateof point i in set Pi , Qi = (qx (i), qy(i)) is the set of corresponding points in the secondimage, and n is the number of landmark points.
This set of equations can be solved very efficiently, as described in [Boo89]. Using block-matrices

E.2. APPROXIMATING THIN-PLATE SPLINES 165
L =[
K PPT O
](E.12)
Y =[vT | 0 0 0
]T(E.13)
where O is a 3 × 3 matrix of zeros, the TPS parameters are found by:
[wT | aT
]T = L−1Y (E.14)
Alternatively, the parameters for both x- and y-coordinates can be found simultaneouslyby:
[wT
x aTx
wTy aT
y
]T
= L−1[
vTx 0 0 0
vTy 0 0 0
]T
(E.15)
E.2 Approximating Thin-Plate Splines
In [Roh99], a method is presented to estimate approximating thin-plate splines. These splinesdo not exactly interpolate all given landmark points, but are allowed to approximate them infavor of a smoother transformation. The smoothness is controlled by a parameter λ, whichprovides a weight between the optimization of landmark distance and smoothness. For λ = 0,there is full interpolation, while for very large λ, there is only an affine transformation left,which is the smoothest transformation possible.
E.2.1 Anisotropic approximation
To represent anisotropic landmark errors, a covariance matrix �i is constructed for eachlandmark, representing the distribution of the landmark errors. In this case, Jλ has to beminimized:
Jλ = Ja + λ · Jb (E.16)
where Ja is the approximation error, given by:
Ja = 1
n
n∑i=1
(qi − f (pi ))T �−1
i (qi − f (pi )) (E.17)
To minimize this expression, a block-diagonal matrix W−1 is constructed from the co-variance matrices �i :

166 APPENDIX E. THIN-PLATE SPLINES
W−1 = diag{�1, . . . , �n} (E.18)
The TPS parameters are found by solving the system of equations
(K + λW−1)w + Pa = v (E.19)
PT w = 0 (E.20)
where in K, each element Ki j is replaced with Ki j I2 with I2 the 2 × 2 identity matrix, eachPi j is replaced with Pi j I2, such that
K =
U (P1, P1) 0 · · · U (P1, Pn) 00 U (P1, P1) · · · 0 U (P1, Pn)...
.... . .
......
U (Pn, P1) 0 · · · U (Pn, Pn) 00 U (Pn, P1) · · · 0 U (Pn, Pn)
(E.21)
P =
1 0 px (1) 0 py(1) 00 1 0 px (1) 0 py(1)...
......
......
...
1 0 px (n) 0 py(n) 00 1 0 px (n) 0 py(n)
(E.22)
and w, v and a are adjusted such that
w = [wx (1) wy(1) · · · wx (n) wy(n)]T (E.23)
v = [qx (1) qy(1) · · · qx (n) qy(n)]T (E.24)
a = [ax (1) ay(1) · · · ax (n) ay(n)]T (E.25)
E.2.2 Isotropic approximation
Alternatively, for equal isotropic errors at all landmarks, only K has to be adjusted, and aslightly changed version of Eq. E.15, in which K is replaced by K + λI, can be used to solvethe following system of equations
(K + λI)w + Pa = v (E.26)
PT w = 0 (E.27)
where I is the n × n identity matrix.
Appendix F
Gaussian Approximation of ErrorRates
Assume that the different observed feature vectors v that are generated by class wk , have amulti-dimensional Gaussian distribution with dimension d, mean ck and covariance matrix�E , independent of the class. Then, the conditional probability density p(v|wk) is given by
p(v|wk) = n(ck, �E ) (F.1)
= 1
(2π)d/2 · |�E |1/2· exp
(−1
2(v − ck)
T �−1E (v − ck)
)(F.2)
Furthermore, assume that the centers ck of classes wk have a Gaussian distribution with zeromean (which can be guaranteed by subtraction of the mean) and covariance matrix �M . Then,p(ck) is given by:
p(ck) = n(0, �M ) (F.3)
= 1
(2π)d/2 · |�M |1/2· exp
(−1
2cT
k �−1M ck
)(F.4)
The prior probability density function p(v) of all patterns is given by:
p(v) =∫
Wp(v|wk)p(wk) dwk
=∫
Vn(ck, �E ) · n(0, �E ) dck (F.5)

168 APPENDIX F. GAUSSIAN APPROXIMATION OF ERROR RATES
Under the condition that the distribution over the entire population is much wider than thedistribution within one class,
|�E | � |�M | (F.6)
p(v) is equal to p(ck), given by:
p(v) = n(0, �M ) (F.7)
= 1
(2π)d/2 · |�M |1/2· exp
(−1
2vT �−1
M v)
(F.8)
Using the acceptance condition L(v) ≥ t , and Expression 7.4 for L(v), an expression forthe acceptance region Ak,t can be derived:
p(v|wk) ≥ t · p(v) (F.9)
By substituting the Gaussian probability density functions F.2 and F.8, we obtain:
1
(2π)d/2 · |�E |1/2· exp
(−1
2(v − ck)
T �−1E (v − ck)
)
≥ t · 1
(2π)d/2 · |�M |1/2· exp
(−1
2vT �−1
M v)
(F.10)
or
exp
(−1
2(v − ck)
T �−1E (v − ck) + 1
2vT �−1
M v)
≥ t ·( |�E |
|�M |)1/2
(F.11)
By taking the natural logarithm and multiplying both sides by -2, we obtain:
(v − ck)T �−1
E (v − ck) − vT �−1M v ≤ − log
(t2 · |�E |
|�M |)
(F.12)
and the acceptance region is given by:
Ak,t = {v ∈ V | (v − ck)T �−1
E (v − ck) ≤ β2(t)} (F.13)
with

169
β2(t) = − log
(t2 · |�E |
|�M |)
+ vT �−1M v (F.14)
For threshold values that correspond to a relatively high likelihood ratio, v is relatively closeto ck , and v can be replaced with ck in Expression F.14. Then, β is independent of v, and Ak,t
is an ellipsoid region with a Mahalanobis distance less than β from the class center ck .
Now, the error rates can be calculated by substituting Expression F.13 into 7.8 and 7.10.To transform the multidimensional integrals into one-dimensional integrals, we use the vol-ume Vol(r, �) of a ellipsoid that is defined by covariance matrix � and Mahalanobis distancer , which is given by [Gol97]:
Vol(r, �) = Vunit · |�|1/2 · rd (F.15)
with Vunit a constant that depends on the dimension d of the space
Vunit =
π1/2
(d/2)!d even
2dπ(d−1)/2(d − 1)/2
d!d odd
(F.16)
Using
d Vol(r, �) = Vunit · |�|1/2 · d · sd−1 ds (F.17)
and Expression 7.8, the false rejection rate is given by:
FRRk(t) = 1 −∫ β(t)
0p(v|wk)d Vol(r, �)
= 1 −∫ β(t)
0
1
(2π)d/2 |�E |1/2exp(−s2/2)Vunit|�E |1/2dsd−1 ds (F.18)
= 1 − Vunit · d
(2π)d/2·∫ β(t)
0exp(−s2/2) · sd−1ds
which corresponds to a χ2 distribution with d degrees of freedom.
Using Expression 7.10 and assuming p(v) constant within class wk , the false acceptancerate is given by:
FARk(t) = p(v) · Vunit · |�E |1/2 · βd(t) (F.19)

170 APPENDIX F. GAUSSIAN APPROXIMATION OF ERROR RATES
These expressions for the theoretic error rates can be calculated relatively easily. Exper-iments show that they provide a very accurate estimate of the error rates for low dimensions(d < 10), while the experimental results deviate from the predicted values for higher dimen-sions. This can be explained by the fact that p(v) cannot be assumed constant within classwk anymore.
References
[Act01] S.T. Actor, D.P. Mukherjee, J.P. Havlicek, and A.C. Bovik. Oriented TextureCompletion by AM-FM Reaction-Diffusion. IEEE Trans. Image Processing,10(6):885–896, June 2001.
[Ara02] J.L. Araque, M. Baena, and P.R. Vizcaya. Synthesis of Fingerprint Images. InProc. ICPR 2002, Quebec City, Canada, August 2002.
[Ash00] J. Ashbourn. Biometrics: Advanced Identity Verification. Springer-Verlag, Lon-don, 2000.
[Baz00a] A.M. Bazen and S.H. Gerez. Directional Field Computation for FingerprintsBased on the Principal Component Analysis of Local Gradients. In Proc. ProR-ISC2000, 11th Annual Workshop on Circuits, Systems and Signal Processing,Veldhoven, The Netherlands, November 2000.
[Baz00b] A.M. Bazen, G.T.B. Verwaaijen, L.P.J. Veelenturf, B.J. van der Zwaag, and S.H.Gerez. A Correlation-Based Fingerprint Verification System. In Proc. ProR-ISC2000, 11th Annual Workshop on Circuits, Systems and Signal Processing,Veldhoven, The Netherlands, November 2000.
[Baz01a] A.M. Bazen and S.H. Gerez. The Construction of an Intrinsic Coordinate Systemfor Fingerprint Matching. In Proc. ASCI Conference 2001, pages 337–344, May2001.
[Baz01b] A.M. Bazen and S.H. Gerez. Extraction of Singular Points from Directional Fieldsof Fingerprints. In Mobile Communications in Perspective, Proc. CTIT Workshopon Mobile Communications, pages 41–44, University of Twente, Enschede, TheNetherlands, February 2001.
[Baz01c] A.M. Bazen and S.H. Gerez. An Intrinsic Coordinate System for FingerprintMatching. In Proc. 3rd Int. Conf. Audio- and Video-Based Biometric Person Au-thentication (AVBPA 2001), pages 198–204, June 2001.
[Baz01d] A.M. Bazen and S.H. Gerez. Segmentation of Fingerprint Images. In Proc.ProRISC2001, 12th Annual Workshop on Circuits, Systems and Signal Process-ing, Veldhoven, The Netherlands, November 2001.
[Baz01e] A.M. Bazen, M. van Otterlo, S.H. Gerez, and M. Poel. A Reinforcement LearningAgent for Minutiae Extraction from Fingerprints. In Proc. BNAIC 2001, pages329–336, Amsterdam, October 2001.

172 REFERENCES
[Baz02a] A.M. Bazen and S.H. Gerez. Achievements and Challenges in Fingerprint Recog-nition. In D. Zhang, editor, Biometric Solutions for Authentication in an e-World,pages 23–57. Kluwer, 2002.
[Baz02b] A.M. Bazen and S.H. Gerez. Elastic Minutiae Matching by means of Thin-PlateSpline Models. In Proc. ICPR 2002, Quebec City, August 2002.
[Baz02c] A.M. Bazen and S.H. Gerez. Fingerprint Matching by Thin-Plate Spline Mod-elling of Elastic Deformations. Pattern Recognition, 2002. Submitted.
[Baz02d] A.M. Bazen and S.H. Gerez. Systematic Methods for the Computation of the Di-rectional Field and Singular Points of Fingerprints. IEEE Trans. PAMI, 24(7):905–919, July 2002.
[Baz02e] A.M. Bazen and S.H. Gerez. Thin-Plate Spline Modelling of Elastic Deformationsin Fingerprints. In Proc. SPS 2002, pages 205–208, Leuven, Belgium, March2002.
[Baz02f] A.M. Bazen and R.N.J. Veldhuis. Likelihood Ratio-Based Biometric Verification.In Proc. ProRISC 2002, 13th Annual Workshop on Circuits, Systems and SignalProcessing, Veldhoven, The Netherlands, November 2002.
[Bha01] B. Bhanu and X. Tan. A Triplet Based Approach for Indexing of FingerprintDatabase for Identification. In J. Bigun and F. Smeraldi, editors, Proc. 3rd Int.Conf. Audio- and Video-Based Biometric Person Authentication (AVBPA 2001),pages 205–210, Halmstad, Sweden, June 2001.
[Big91] J. Bigun, G.H. Granlund, and J. Wiklund. Multidimensional Orientation Estima-tion with Applications to Texture Analysis and Optical Flow. IEEE Trans. PAMI,13(8):775–790, August 1991.
[Boe01] J. de Boer, A.M. Bazen, and S.H. Gerez. Indexing Fingerprint Databases Basedon Multiple Features. In Proc. ProRISC2001, 12th Annual Workshop on Circuits,Systems and Signal Processing, Veldhoven, The Netherlands, November 2001.
[Boo89] F.L. Bookstein. Principal Warps: Thin-Plate Splines and the Decomposition ofDeformations. IEEE Trans. PAMI, 11(6):567–585, June 1989.
[Can95] G.T. Candela, P.J. Grother, C.I. Watson, R.A. Wilkinson, and C.L. Wilson.PCASYS - A Pattern-level Classification Automation System for Fingerprints.Technical Report NISTIR 5647, NIST, April 1995.
[Cap99] R. Cappelli, A. Lumini, D. Maio, and D. Maltoni. Fingerprint Classification byDirectional Image Partitioning. IEEE Trans. PAMI, 21(5):402–421, May 1999.
[Cap00a] R. Cappelli, A. Erol, D. Maio, and D. Maltoni. Synthetic Fingerprint-Image Gen-eration. In Proc. ICPR2000, 15th Int. Conf. Pattern Recognition, Barcelona, Spain,September 2000.
[Cap00b] R. Cappelli, D. Maio, and D. Maltoni. Combining Fingerprint Classifiers. InProc. First International Workshop on Multiple Classifier Systems (MCS2000),pages 351–361, Cagliari, June 2000.
REFERENCES 173
[Cap00c] R. Cappelli, D. Maio, and D. Maltoni. Indexing Fingerprint Databases for Efficient1:N Matching. In Proc. Sixth Int. Conf. on Control, Automation, Robotics andVision (ICARCV2000), Singapore, December 2000.
[Cap01] R. Cappelli, D. Maio, and D. Maltoni. Modelling Plastic Distortion in FingerprintImages. In Proc. ICAPR2001, Second Int. Conf. Advances in Pattern Recognition,Rio de Janeiro, March 2001.
[Cho97] M.M.S. Chong, T.H. Ngee, and R.K.L. Gay. Geometric Framework for FingerprintImage Classification. Pattern Recognition, 30(9):1475–1488, 1997.
[Chu00] H. Chui and A. Rangarajan. A New Algorithm for Non-Rigid Point Matching. InProc. CVPR, volume 2, pages 40–51, June 2000.
[Dre99] G.A. Drets and H.G. Liljenstrom. Fingerprint Subclassification: A Neural Net-work Approach. In L.C. Jain, U. Halici, I. Hayashi, S.B. Lee, and S. Tsutsui, edi-tors, Intelligent Biometric Techniques in Fingerprint and Face Recognition, pages109–134. CRC Press, Boca Raton, 1999.
[Far99] A. Farina, Z.M. Kovacs-Vajna, and A. Leone. Fingerprint minutiae extractionfrom skeletonized binary images. Pattern Recognition, 32(5):877–889, 1999.
[Ger97] R.S. Germain, A. Califano, and S. Colville. Fingerprint Matching Using Trans-formation Parameter Clustering. IEEE Computational Science and Engineering,4(4):42–49, 1997.
[Gol97] M. Golfarelli, D. Maio, and D. Maltoni. On the error-reject trade-off in biometricverification systems. IEEE Trans. PAMI, 19(7):786–796, July 1997.
[Hay99] S. Haykin. Neural Networks, A Comprehensive Foundation. Prentice Hall Inter-national, Inc., Upper Saddle River, NJ, 1999.
[Hen00] E.R. Henry. Classification and Uses of Finger Prints. Routledge, London, 1900.
[Ho94] T.K. Ho, J.J. Hull, and S.N. Srihari. Decision Combination in Multiple ClassifierSystems. IEEE Trans. PAMI, 16(1):66–75, January 1994.
[Hon98] L. Hong, Y. Wan, and A. Jain. Fingerprint image enhancement: Algorithm andperformance evaluation. IEEE Trans. PAMI, 20(8):777–789, August 1998.
[Hon99] L. Hong and A.K. Jain. Classification of Fingerprint Images. In Proc. 11th Scan-dinavian Conference on Image Analysis, Kangerlussuaq, Greenland, June 1999.
[Hun93] D.C.D. Hung. Enhancement and Feature Purification of Fingerprint Images. Pat-tern Recognition, 26(11):1661–171, 1993.
[Jai89] A.K. Jain. Fundamentals of Digital Image Processing. Prentice-Hall, EnglewoodCliffs, NJ, 1989.
[Jai97a] A.K. Jain, L. Hong, and R. Bolle. On-line fingerprint verification. IEEE Trans.PAMI, 19(4):302–314, April 1997.
[Jai97b] A.K. Jain, L. Hong, S. Pankanti, and R. Bolle. An Identity-Authentication SystemUsing Fingerprints. Proc. of the IEEE, 85(9):1365–1388, September 1997.

174 REFERENCES
[Jai97c] A.K. Jain and N.K. Ratha. Object detection using Gabor filters. Pattern Recogni-tion, 30(2):295–309, February 1997.
[Jai99a] A. K. Jain, S. Prabhakar, and L. Hong. A Multichannel Approach to FingerprintClassification. IEEE Trans. PAMI, 21(4):348–359, April 1999.
[Jai99b] A.K. Jain, R. Bolle, and S. Pankanti. Biometrics - Personal Identification in aNetworked Society. Kluwer Academic Publishers, Boston, 1999.
[Jai00a] A.K. Jain, R.P.W. Duin, and J. Mao. Statistical Pattern Recognition: A Review.IEEE Trans. PAMI, 22(1), January 2000.
[Jai00b] A.K. Jain, S. Prabhakar, L. Hong, and S. Pankanti. Filterbank-Based FingerprintMatching. IEEE Trans. Image Processing, 9(5):846–859, May 2000.
[Jai01] A.K. Jain, A. Ross, and S. Prabhakar. Fingerprint Matching Using Minutiae andTexture Features. In Proc. Int. Conf. on Image Processing (ICIP), Greece, October2001.
[Jai02] A.K. Jain and A. Ross. Fingerprint Mosaicking. In Proc. Int. Conf. on AcousticSpeech and Signal Processing (ICASSP), Orlando, Florida, May 2002.
[Jia00] X. Jiang and W.Y. Yau. Fingerprint Minutiae Matching Based on the Local andGlobal Structures. In Proc. ICPR2000, 15th Int. Conf. Pattern Recognition, vol-ume 2, pages 1042–1045, Barcelona, Spain, September 2000.
[Jia01] X. Jiang, W.Y. Yau, and W. Ser. Detecting the fingerprint minutiae by adaptivetracing the gray-level ridge. Pattern Recognition, 34(5):999–1013, May 2001.
[Kae96] L.P. Kaelbling, M.L. Littman, and A.W. Moore. Reinforcement Learning: A Sur-vey. Journal of Artificial Intelligence Research, 4:237–285, 1996.
[Kar96] K. Karu and A.K. Jain. Fingerprint classification. Pattern Recognition, 29(3):389–404, 1996.
[Kas87] M. Kass and A. Witkin. Analyzing Oriented Patterns. Computer Vision, Graphics,and Image Processing, 37(3):362–385, March 1987.
[Kaw84] M. Kawagoe and A. Tojo. Fingerprint Pattern Classification. Pattern Recognition,17(3):295–303, 1984.
[Kim01] S. Kim, D. Lee, and J. Kim. Algorithm for Detection and Elimination of FalseMinutiae in Fingerprint Images. In J. Bigun and F. Smeraldi, editors, Proc. AVBPA,volume 2091 of LNCS, pages 235–240, Halmstad, Sweden, June 2001. Springer.
[Kit98] J. Kittler, M. Hatef, R.P.W. Duin, and J. Matas. On combining classifiers. IEEETrans. PAMI, 20(3):226–239, March 1998.
[Kle02] S. Klein, A.M. Bazen, and R.N.J. Veldhuis. Fingerprint Image SegmentationBased on Hidden Markov Models. In Proc. ProRISC 2002, 13th Annual Work-shop on Circuits, Systems and Signal Processing, Veldhoven, The Netherlands,November 2002.

REFERENCES 175
[Kop99] M. Koppen and B. Nickolay. Design of Image Exploring Agent Using GeneticProgramming. Fuzzy Sets and Systems, 103(2):303–315, April 1999.
[Kov00] Z.M. Kovacs-Vajna. A Fingerprint Verification System Based on TriangularMatching and Dynamic Time Warping. IEEE Trans. PAMI, 22(11):1266–1276,November 2000.
[Koz92] John R. Koza. Genetic Programming: On the Programming of Computers byMeans of Natural Selection. MIT Press, 1992.
[Koz94] John R. Koza. Genetic Programming II: Automatic Discovery of Reusable Pro-grams. MIT Press, Cambridge Massachusetts, May 1994.
[Koz99] John R. Koza, David Andre, Forrest H. Bennett III, and Martin Keane. GeneticProgramming III: Darwinian Invention and Problem Solving. Morgan Kaufman,April 1999.
[Kum01] S. Kumar, M. Sallam, and D. Goldgof. Matching Point Features under SmallNonrigid Motion. Pattern Recognition, 34(12):2353–2365, December 2001.
[Li00] J. Li, A. Najmi, and R.M. Gray. Image Classification by a Two-DimensionalHidden Markov Model. IEEE Trans. Signal Proc., 48(2):517–533, February 2000.
[Lin92] L.J. Lin. Self-improving Reactive Agents Based On Reinforcement Learning,Planning and Teaching. Machine Learning Journal, 8(3/4), 1992. Special Issueon Reinforcement Learning.
[Lin94] T. Lindeberg. Scale-Space Theory in Computer Vision. Kluwer Academic Pub-lishers, Boston, 1994.
[Lum97] A. Lumini, D. Maio, and D. Maltoni. Continuous versus exclusive classificationfor fingerprint retrieval. Pattern Recognition Letters, 18(10):1027–1034, 1997.
[Mai97] D. Maio and D. Maltoni. Direct Gray-Scale Minutiae Detection in Fingerprints.IEEE Trans. PAMI, 19(1):27–39, January 1997.
[Mai99] D. Maio and D. Maltoni. Minutiae Extraction and Filtering from Gray-Scale Im-ages. In L.C. Jain et al., editor, Intelligent Biometric Techniques in Fingerprintand Face Recognition, pages 155–192. CRC Press LLC, 1999.
[Mai00] D. Maio, D. Maltoni, R. Cappelli, J.L. Wayman, and A.K. Jain. FVC2000: Fin-gerprint Verification Competition. Biolab internal report, University of Bologna,Italy, September 2000. available from http://bias.csr.unibo.it/fvc2000/.
[Mai02] D. Maio, D. Maltoni, R. Cappelli, J.L. Wayman, and A.K. Jain. FVC2000: Finger-print Verification Competition. IEEE Trans. PAMI, 24(3):402–412, March 2002.
[Meh87] B.M. Mehtre, N.N. Murthy, S. Kapoor, and B. Chatterjee. Segmentation of Finger-print Images Using the Directional Image. Pattern Recognition, 20(4):429–435,1987.
[Meh89] B.M. Mehtre and B. Chatterjee. Segmentation of Fingerprint Images - a CompositeMethod. Pattern Recognition, 22(4):381–385, 1989.
176 REFERENCES
[Meu00] P.G.M. van der Meulen, A.M. Bazen, and S.H. Gerez. A Distributed Object-Oriented Environment for the Application of Genetic Programming to Signal Pro-cessing. In Proc. ProRISC 2000, Veldhoven, The Netherlands, November 2000.
[Meu01] P.G.M. van der Meulen, H. Schipper, A.M. Bazen, and S.H. Gerez. PMDGP: ADistributed Object-Oriented Genetic Programming Environment. In Proc. ASCIConference 2001, pages 484–491, May 2001.
[Moo00] T.K. Moon and W.C. Stirling. Mathematical Methods and Algorithms for SignalProcessing. Prentice Hall, Upper Saddle River, NJ, 2000.
[Nak82] O. Nakamura, K. Goto, and T. Minami. Fingerprint classification by directionaldistribution patterns. Systems, Computers, Controls, 13(5):81–89, 1982.
[O’G89] L. O’Gorman and J.V. Nickerson. An Approach to Fingerprint Filter Design. Pat-tern Recognition, 22(1):29–38, 1989.
[Pal93] N.R. Pal and S.K. Pal. A Review on Image Segmentation Techniques. PatternRecognition, 26(9):1277–1294, 1993.
[Pan01] S. Pankanti, S. Prabhakar, and A. K. Jain. On the Individuality of Fingerprints. InProc. Computer Vision and Pattern Recognition (CVPR), Hawaii, December 2001.
[Pat01] M.S. Pattichis, G. Panayi, A.C. Bovik, and S.P. Hsu. Fingerprint ClassificationUsing and AM-FM Model. IEEE Trans. Image Processing, 10(6):951–954, June2001.
[Per98] P. Perona. Orientation diffusions. IEEE Trans. Image Processing, 7(3):457–467,March 1998.
[Pra00] S. Prabhakar, A.K. Jain, J. Wang, S. Pankanti, and R. Bolle. Minutia Verificationand Classification for Fingerprint Matching. In Proc. ICPR2000, 15th Int. Conf.Pattern Recognition, Barcelona, Spain, September 2000.
[Pra01] S. Prabhakar. Fingerprint Classification adn Matching Using a Filterbank. PhDthesis, Michigan State University, 2001.
[Pro92] J.G. Proakis, C.M. Rader, F. Ling, and C.L. Nikias. Advanced Digital SignalProcessing. Macmillan Publishing Company, NY, 1992.
[Rab89] L.R. Rabiner. A Tutorial on Hidden Markov Models and Selected Applications inSpeech Recognition. Proc. of the IEEE, 77(2):257–286, February 1989.
[Rab93] L. Rabiner and B.H. Juang. Fundamentals of Speech Recognition. Signal Process-ing Series. Prentice Hall, Englewood Cliffs, NJ, 1993.
[Rao92] A.R. Rao and R.C. Jain. Computerized Flow Field Analysis: Oriented TextureFields. IEEE Trans. PAMI, 14(7):693–709, July 1992.
[Rat95] N. Ratha, S. Chen, and A. Jain. Adaptive flow orientation based feature extractionin fingerprint images. Pattern Recognition, 28:1657–1672, Nov. 1995.
[Rat98] N.K. Ratha, J.H. Connell, and R.M. Bolle. Image mosaicing for rolled fingerprintconstruction. In Proc. 14th ICPR, pages 1651–1653, vol. 2, 1998.
REFERENCES 177
[Rat00] N.K. Ratha, R.M. Bolle, V.D. Pandit, and V. Vaish. Robust fingerprint authenti-cation using local structural similarity. In Proc. 5th IEEE Workshop Appl. Comp.Vision, pages 29–34, 2000.
[Rod99] A.R. Roddy and J.D. Stosz. Fingerprint Feature Processing Techniques andPoroscopy. In L.C. Jain, U. Halici, I. Hayashi, S.B. Lee, and S. Tsutsui, edi-tors, Intelligent Biometric Techniques in Fingerprint and Face Recognition, pages37–105. CRC Press, 1999.
[Roh99] K. Rohr, M. Fornefett, and H.S. Stiehl. Approximating Thin-Plate Splines forElastic Registration: Integration of Landmark Errors and Orientation Attributes.In Proc. 16th Int. Conf. Information Processing in Medical Imaging, LNCS 1613,pages 252–265, Hungary, June 1999.
[Ros02a] A. Ross, A.K. Jain, and J. Reisman. A Hybrid Fingerprint Matcher. In Proc. ICPR2002, Quebec City, Canada, August 2002.
[Ros02b] A. Ross, J. Reisman, and A.K. Jain. Fingerprint Matching Using Feature SpaceCorrelation. In M. Tistarelli, J. Bigun, and A.K. Jain, editors, Biometric Authen-tication, Int. ECCV 2002 Workshop, volume 2359 of LNCS, pages 48–57, Copen-hagen, Denmark, June 2002. Springer-Verlag.
[Rum94] G.A. Rummery and M. Niranjan. On-Line Q-Learning using Connectionist Sys-tems. Technical Report CUED/F-INFENG/TR 166, Cambridge University, Engi-neering Department, 1994.
[Sch00] M. Schrijver, A.M. Bazen, and C.H. Slump. On the Reliability of Template Match-ing in Biomedical Image Processing. In Proc. SPS2000, IEEE Benelux SignalProcessing Chapter, Hilvarenbeek, The Netherlands, March 2000.
[Sen01] A.W. Senior and R. Bolle. Improved Fingerprint Matching by Distortion Removal.IEICE Trans. Inf. and Syst., Special issue on Biometrics, E84-D(7):825–831, July2001.
[She93] B.G. Sherlock and D.M. Monro. A Model for Interpreting Fingerprint Topology.Pattern Recognition, 26(7):1047–1055, 1993.
[She94] B.G. Sherlock, D.M. Monro, and K. Millard. Fingerprint Enhancement by Di-rectional Fourier Filtering. IEE Proc.-Vis. Image Signal Process., 141(2):87–94,April 1994.
[Sri92] V.S. Srinivasan and N.N. Murthy. Detection of Singular Points in FingerprintImages. Pattern Recognition, 25(2):139–153, 1992.
[Sue00] C.Y. Suen and L. Lam. Multiple Classifier Combination Methodologies for Dif-ferent Output Levels. In J. Kittler and F. Roli, editors, Proc. MCS 2000, pages52–56, 2000.
[Sut98] R.S. Sutton and A.G. Barto. Reinforcement Learning: An Introduction. MIT Press,Camebridge, Massachusetts, 1998.
[Sut00] R.S. Sutton, D. McAllester, S. Singh, and Y. Mansour. Policy Gradient Methodsfor Reinforcement Learning with Function Approximation. In Advances in NeuralInformation Processing Systems 12, pages 1057–1063. MIT Press, 2000.

178 REFERENCES
[The92] C.W. Therrien. Discrete Random Signals and Statistical Signal Processing. Pren-tice-Hall, Upper Saddle River, NJ 07458, USA, 1992.
[Tre68] H.L. Van Trees. Detection, estimation, and modulation theory. Wiley, New York,1968.
[Tur91] M. Turk and A. Pentland. Eigenfaces for Recognition. Journal of Cognitive Neu-roscience, 3(1):71–86, 1991.
[Vel90] R.N.J. Veldhuis. Restoration of Lost Samples in Digital Signals. Prentice HallInternational, UK, 1990.
[Ver00] G.T.B. Verwaaijen. Fingerprint Authentication. Master’s thesis, Faculty of Elec-trical Engineering, University of Twente, Enschede, The Netherlands, May 2000.EL-S&S-002N00.
[Viz96] P. Vizcaya and L. Gerhardt. A Nonlinear Orientation Model for Global Descriptionof Fingerprints. Pattern Recognition, 29(7):1221–1231, 1996.
[Way99] J.L. Wayman. Error rate equations for the general biometric system. IEEERobotics and Automation Magazine, 6(1):35–48, March 1999.
[Wil94] C.L. Wilson, G.T. Candela, and C.I. Watson. Neural Network Fingerprint Classi-fication. J. Artificial Neural Networks, 1(2):203–228, 1994.
[Wil01] A.J. Willis and L. Myers. A cost-effective fingerprint recognition system for usewith low-quality prints and damaged fingertips. Pattern Recognition, 34(2):255–270, 2001.
[Xia91] Q. Xiao and H. Raafat. Fingerprint Image Postprocessing: a Combined Statisticaland Structural Approach. Pattern Recognition, 24(10):985–992, 1991.
[Zha02] D. Zhang. Biometric Solutions for Authentication in an e-World. Kluwer Aca-demic Publishers, 2002. To be published.
[Zho01] J. Zhou, D. He, G. Rong, and Z.Q. Bian. Effective Algorithm for Rolled Finger-print Construction. Electronics Letters, 37(8):492–494, April 2001.
Summary
Recognition of persons on the basis of biometric features is an emerging phenomenon in oursociety. The use of features physically connected to a person’s body significantly decreasesthe possibility of fraud. Furthermore biometry can offer user-convenience in many situations,as it replaces cards, keys, and codes. The fingerprint is considered one of the most practi-cal features, since it is user friendly, provides good performance, and uses sensors that arerelatively inexpensive and that can be integrated easily in wireless hardware.
A fingerprint is a pattern of curving line structures, where the skin has a higher profile thanits surroundings. These structures are called ridges and valleys. Commonly used features thatare extracted from the fingerprint image are the directional field, the singular points and theminutiae. The directional field is defined as the local orientation of the ridge-valley structures.It describes the coarse structure, or basic shape, of a fingerprint. The singular points are thediscontinuities in the directional field. A fingerprint contains at most four singular points,which can be used for registration purposes. The minutiae provide the details of the ridge-valley structures. Two elementary types of minutiae exist: ridge endings and bifurcations. Atypical fingerprint contains 20 to 50 minutiae, which can be used for matching purposes.
Two types of fingerprint recognition systems can be distinguished, being verification andidentification systems. Verification systems use fingerprint technology to verify the claimedidentity of a user. The user offers his identity and a test fingerprint to the system, and thetest fingerprint is matched against a reference fingerprint that is retrieved from a database.The verification decision is based on the resulting measure of similarity, or matching score.Identification systems, on the other hand, require only a query fingerprint as input. The personis identified by searching a database for a matching fingerprint.
The distributions of the matching scores of genuine and impostor attempts overlap tosome extent. This results in two kinds of errors, that together measure the performance ofa fingerprint recognition system. The false acceptance rate is the probability that the systemoutputs ‘match’ for fingerprints that are not from the same finger. The false rejection rate isthe probability that the system outputs ‘non-match’ for fingerprints that originate from thesame finger.
This thesis focusses on three principal challenges in fingerprint recognition: robust fea-ture extraction from low-quality fingerprints, matching elastically deformed fingerprints, andefficient search of fingerprints in a database. Research into these topics has yielded improve-ments for most of these challenges, resulting in a system that provides increased fingerprintrecognition performance.

180 SUMMARY
A fingerprint recognition system involves several phases. In the acquisition phase, thefingerprint is scanned using a fingerprint sensor that is in general based on optical or capac-itive principles. This results is a digital gray-scale image that is processed in the subsequentphases. The quality and characteristics of the fingerprint image are highly dependent on theexact type of sensor that is used. Therefore, the choice of the sensor directly affects therecognition performance, and the recognition algorithms have to be adapted to the specificfingerprint sensor that is used.
The feature extraction phase involves the calculation of various characteristics of the fin-gerprint that are used for matching and database search. In this work, new methods areproposed for accurate estimation of the directional field, for the consistent extraction of sin-gular points, and estimation of their orientation, for more accurate segmentation of finger-print images, for the efficient enhancement of fingerprint images, and for the extraction of theminutiae.
In the matching phase, the features of the test fingerprint are compared to a templatethat is retrieved from a database. This thesis presents the first elastic minutiae matchingalgorithm that explicitly deals with elastically deformed fingerprints. Additionally, a veryefficient matching algorithm is proposed that uses fixed length feature vectors instead ofminutiae sets.
Identification systems have to compare the query fingerprint to all fingerprints in theirdatabase. However, the computational time and the probability of false acceptance increasewith larger numbers of matches. To reduce the number of matches that have to be performed,identification systems use some form of classification. After classifying the query finger-prints and all fingerprints in the database, the query fingerprint is only matched against thefingerprints of the corresponding class. In this work, an alternative database indexing methodis used that considers each fingerprint as a distinct class. Candidate fingerprints are selectedin decreasing order of probability from the database, for matching against the query finger-print. By combining multiple types of features, this method is able to reduce the effectivesize of the database to be searched to less than 0.5% of its original size. This enables the useof databases that are 100 times larger than in the situation without indexing.
Samenvatting
De herkenning van personen op basis van biometrische kenmerken is een steeds belang-rijker fenomeen in onze samenleving. Het gebruik van kenmerken die fysisch met hetlichaam verbonden zijn vermindert de mogelijkheden voor fraude. Daarnaast kan biometriegebruiksvriendelijkheid bieden door pasjes, sleutels and codes te vervangen. De vingeraf-druk is een van de meest praktische kenmerken omdat deze gebruiksvriendelijk is, een goedeprestaties levert, en relatief goedkope sensoren gebruikt die eenvoudig in mobiele hardwarekan worden geintegreerd.
Een vingerafdruk bestaat uit een patroon van gekromde lijnstrukturen waar de huid ietshoger ligt dan direct er naast. Deze strukturen worden ridges en valleys genoemd. Veel ge-bruikte kenmerken die uit een plaatje van een vingerafdruk kunnen worden afgeleid zijn hetrichtingsveld, de singuliere punten en de minutiae. Het richtingsveld geeft de lokale orien-tatie van de lijnen weer. Hiermee wordt de globale struktuur of basisvorm van de vinger-afdruk beschreven. De singuliere punten zijn de discontinuiteiten in het richtingsveld. Eenvingerafdruk bevat maximaal vier singuliere punten die kunnnen worden gebruikt voor hetuitlijnen. De minutiae geven de details van de ridge-valley strukturen. Er bestaan twee ele-mentaire typen minutiae: eindpunten en splitsingen. Meestal bevat een vingerafdruk 20 tot50 minutiae, welke worden gebruikt voor het vergelijken.
Er kunnen twee typen vingerafdrukherkenningssystemen worden onderscheiden:verificatie- en identificatiesystemen. Verificatiesystemen gebruiken vingerafdruk-kerkenningstechnieken om de geclaimde identiteit van een gebruiker te controleren. Degebruiker biedt zijn identiteit en een test-vingerafdruk aan aan het systeem, en de test-vingeradruk wordt vergeleken met een referentie-vingerafdruk die uit een database wordtgehaald. De beslissing is gebaseerd op de resulterende gelijkheidsmaat of matching score.Identificatiesystemen vragen alleen om een vingerafdruk. Een persoon wordt geidentificeerddoor een database to doorzoeken naar een gelijke vingerafdruk.
De verdelingen van de matching scores van geautoriseerde personen en indringeres over-lappen enigszinds. Hierdoor ontstaan twee soorten fouten, die samen de prestatie van eenvingerafdrukherkenningssysteem bepalen. De false acceptance rate is de kans dat een in-dringer wordt geaccepteerd, en de false rejection rate is de kans dat een geautoriseerd persoonwordt afgewezen.
Dit proefschrift richt zich op de drie belangrijkste uitdagingen in de vingerafdruk-herkenning: robuste kenmerkextractie uit vingerafdrukken van slechte kwaliteit, het vergelij-ken van elastisch vervormde vingerafdrukken, en het efficient doorzoeken van databases. Het
182 SAMENVATTING
onderzoek heeft verbeteringen voor het merendeel van de uitdagingen opgeleverd, wat kanleiden tot een beter presterend systeem.
In een vingerafdrukherkenningssystem kunnen verschillende fasen worden onderschei-den. In de opname fase wordt de vingerafdruk gescanned met behulp van een sensor diemeestal is gebaseerd op optische of capacitieve principes. Dit resulteert in een digitaal grijs-waarden-plaatje waar verder mee wordt gewerkt in de volgende fasen. De kwaliteit en karak-teristieken van het plaatje zijn erg afhankelijk van het type sensor dat wordt gebruikt. Daarombeinvloedt de sensor de prestatie direct, en moeten de verdere fasen worden afgestemd op despecifieke sensor eigenschappen.
De kenmerkextractie fase omvat de berekening van de verschillende kenmerken van defingerafdruk die bij het vergelijken en zoeken worden gebruikt. In dit proefschrift wordennieuwe methoden voorgesteld voor de nauwkeurige schatting van het richtingsveld, voor hetconstistent detecteren van de singuliere punten en hun orientatie, voor de segmentatie vanfingerafdrukken, voor het verbeteren van de kwaliteit van de plaatjes, en voor het extraherenvan de minutiae.
In de vergelijkingsfase worden de kenmerken van de test-afdruk vergeleken met de tem-plate die uit een database wordt verkregen. Dit proefschrift presenteert het eerste elastischeminutiae matching algoritme, dat expliciet rekening houdt met elastisch vervormde vinger-afdrukken. Daarnaast wordt een erg efficient algoritme gepresenteerd dat kenmerk vectorenvan vaste lengte gebruikt in plaast van minutiae.
Identificatiesystemen moeten een vingerafdruk vergelijken met alle vingerafdrukken inhun database. Echter, de benodigde rekentijd en de foutkans worden groter bij het doen vanmeer vergelijkingen. In dit proefschrift wordt indexing methode gebruikt die een beter al-ternatief biedt voor de veelgebruikte Henry classificatie. Elke vingerafdruk wordt gebruiktals een aparte classe, en deze worden met dalende waarschijnlijkheid vergeleken met degevraagde vingerafdruk. Door verschillende typen kenmerken te combineren, wordt het mo-gelijk databases te doorzoeken die 100 maal groter zijn dan zonder het gebruik van dezetechniek mogelijk is.
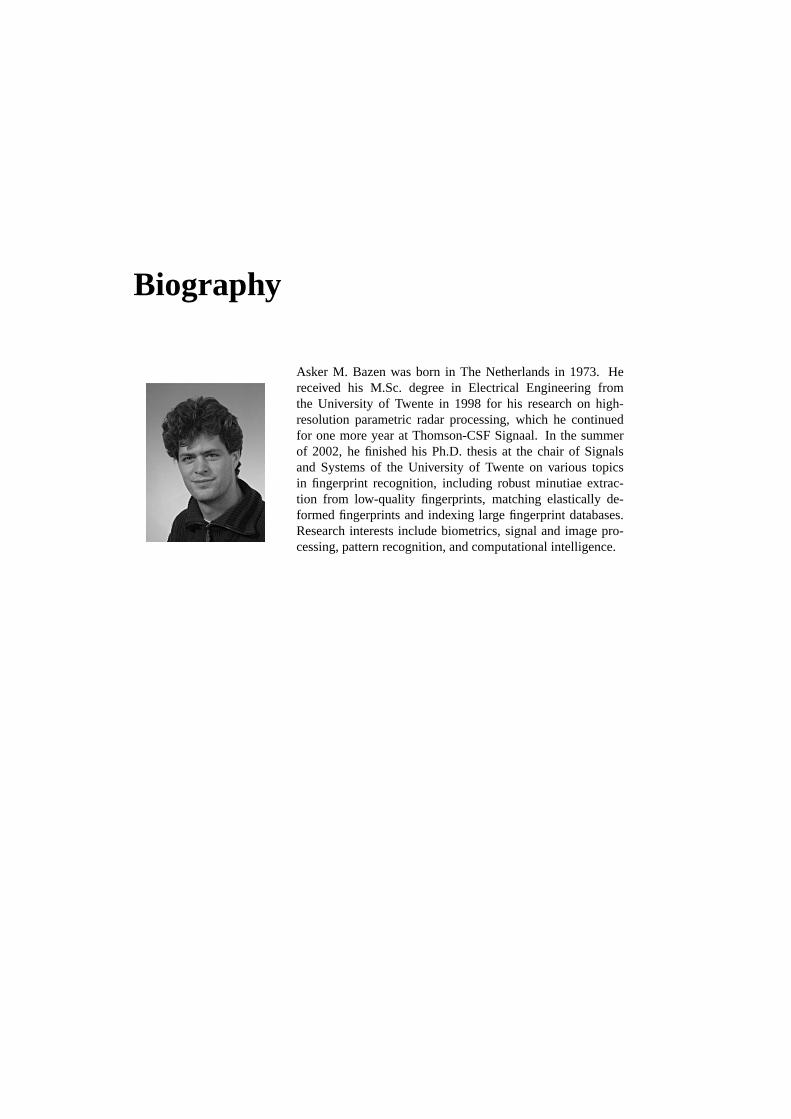
Biography
Asker M. Bazen was born in The Netherlands in 1973. Hereceived his M.Sc. degree in Electrical Engineering fromthe University of Twente in 1998 for his research on high-resolution parametric radar processing, which he continuedfor one more year at Thomson-CSF Signaal. In the summerof 2002, he finished his Ph.D. thesis at the chair of Signalsand Systems of the University of Twente on various topicsin fingerprint recognition, including robust minutiae extrac-tion from low-quality fingerprints, matching elastically de-formed fingerprints and indexing large fingerprint databases.Research interests include biometrics, signal and image pro-cessing, pattern recognition, and computational intelligence.


List of Publications
[1] A.M. Bazen and R.N.J. Veldhuis. Likelihood ratio-based biometric verification. In Proc.ProRISC 2002, 13th Annual Workshop on Circuits, Systems and Signal Processing,Veldhoven, The Netherlands, November 2002.
[2] S. Klein, A.M. Bazen, and R.N.J. Veldhuis. Fingerprint image segmentation based onhidden Markov models. In Proc. ProRISC 2002, 13th Annual Workshop on Circuits,Systems and Signal Processing, Veldhoven, The Netherlands, November 2002.
[3] A.M. Bazen and S.H. Gerez. Fingerprint matching by thin-plate spline modelling ofelastic deformations. Pattern Recognition, 2002. Submitted.
[4] A.M. Bazen and S.H. Gerez. Achievements and challenges in fingerprint recognition.In D. Zhang, editor, Biometric Solutions for Authentication in an e-World, pages 23–57.Kluwer, 2002.
[5] A.M. Bazen and S.H. Gerez. Systematic methods for the computation of the directionalfield and singular points of fingerprints. IEEE Trans. PAMI, 24(7):905–919, July 2002.
[6] A.M. Bazen and S.H. Gerez. Elastic minutiae matching by means of thin-plate splinemodels. In Proc. ICPR 2002, Quebec City, August 2002.
[7] A.M. Bazen and S.H. Gerez. Thin-plate spline modelling of elastic deformations infingerprints. In Proc. SPS 2002, pages 205–208, Leuven, Belgium, March 2002.
[8] A.M. Bazen and S.H. Gerez. Segmentation of fingerprint images. In Proc. ProR-ISC2001, 12th Annual Workshop on Circuits, Systems and Signal Processing, Veld-hoven, The Netherlands, November 2001.
[9] J. de Boer, A.M. Bazen, and S.H. Gerez. Indexing fingerprint databases based on mul-tiple features. In Proc. ProRISC2001, 12th Annual Workshop on Circuits, Systems andSignal Processing, Veldhoven, The Netherlands, November 2001.
[10] A.M. Bazen, M. van Otterlo, S.H. Gerez, and M. Poel. A reinforcement learning agentfor minutiae extraction from fingerprints. In Proc. BNAIC 2001, pages 329–336, Ams-terdam, October 2001.
[11] A.M. Bazen and S.H. Gerez. An intrinsic coordinate system for fingerprint matching. InProc. 3rd Int. Conf. Audio- and Video-Based Biometric Person Authentication (AVBPA2001), pages 198–204, June 2001.
186 LIST OF PUBLICATIONS
[12] A.M. Bazen and S.H. Gerez. The construction of an intrinsic coordinate system forfingerprint matching. In Proc. ASCI Conference 2001, pages 337–344, May 2001.
[13] P.G.M. van der Meulen, H. Schipper, A.M. Bazen, and S.H. Gerez. PMDGP: A dis-tributed object-oriented genetic programming environment. In Proc. ASCI Conference2001, pages 484–491, May 2001.
[14] A.M. Bazen and S.H. Gerez. Extraction of singular points from directional fields offingerprints. In Mobile Communications in Perspective, Proc. CTIT Workshop on Mo-bile Communications, pages 41–44, University of Twente, Enschede, The Netherlands,February 2001.
[15] A.M. Bazen and S.H. Gerez. Directional field computation for fingerprints based on theprincipal component analysis of local gradients. In Proc. ProRISC2000, 11th AnnualWorkshop on Circuits, Systems and Signal Processing, Veldhoven, The Netherlands,November 2000.
[16] A.M. Bazen, G.T.B. Verwaaijen, L.P.J. Veelenturf, B.J. van der Zwaag, and S.H. Gerez.A correlation-based fingerprint verification system. In Proc. ProRISC2000, 11th AnnualWorkshop on Circuits, Systems and Signal Processing, Veldhoven, The Netherlands,November 2000.
[17] P.G.M. van der Meulen, A.M. Bazen, and S.H. Gerez. A distributed object-orientedenvironment for the application of genetic programming to signal processing. In Proc.ProRISC 2000, Veldhoven, The Netherlands, November 2000.
[18] A.M. Bazen. De complexiteit van vingerafdrukidentificatie. In Proc. Keys of the Future,pages 33–38, Enschede, The Netherlands, September 2000.
[19] A.M. Bazen and S.H. Gerez. Computational intelligence in fingerprint identification. InProc. SPS2000, IEEE Benelux Signal Processing Chapter, Hilvarenbeek, The Nether-lands, March 2000.
[20] M. Schrijver, A.M. Bazen, and C.H. Slump. On the reliability of template matchingin biomedical image processing. In Proc. SPS2000, IEEE Benelux Signal ProcessingChapter, Hilvarenbeek, The Netherlands, March 2000.
[21] M. Heskamp, C.H. Slump, A.M. Bazen, and M.J. Bentum. On signal processing algo-rithms to mitigate the influence of wireless communication on the performance of thewsrt. In Proc. ProRISC2000, 11th Annual Workshop on Circuits, Systems and SignalProcessing, Veldhoven, The Netherlands, December 2000.
[22] A.M. Bazen and C.H. Slump. Generalizations of the normalized prediction error. InProc. ProRISC99, 10th Annual Workshop on Circuits, Systems and Signal Processing,pages 631–642, Nov. 1999.
[23] A.M. Bazen. Hoge resolutie radar met adaptieve clutter onderdrukking. De Vonk,17(8):14–20, 1999.
[24] H.E. Wensink and A.M. Bazen. On automatic clutter identification and rejection. InProc. 5th Int. Conf. on Radar Syst. (Radar 99), Brest, France, May 1999.

LIST OF PUBLICATIONS 187
[25] H.E. Wensink and A.M. Bazen. On radar detection with automatic clutter rejection. InProc. High Resolution Radar Techniques, pages 18–1 – 18–10, Granada, Spain, March1999.
[26] H.E. Wensink and A.M. Bazen. On stochastic parametric modelling of radar sea clutterfor identification purposes. In Proc. Physics in Signal and Image Processing (PSIP ’99),pages 80–85, Paris, France, January 1999.
Related Documents