1. INTRODUCTION Fines and dust resulting from blasting operations sometimes become both an environmental issue and an economical loss for the producers. Dust is a gen- eral term-fine particles (below 75 micron range) that are suspended in the atmosphere. Dust is formed when fine particles become entrained in the atmosphere by the turbulent action of wind, by the mechanical disturbance of fine materials, or through the release of particulate-rich gaseous emissions. In reality fines may be useful or detriment to the oper- ation. Most often less fines generation is needed in overburden blasting, aggregate production or in steel grade limestone production (where anything less than 40/30mm size is not used) and often this material becomes waste. Whereas in situations where material is further crushed and processed, it is better to break the material by blasting to the smallest size (Mine to Mill concept–JKMRC, 1998). Even in later situation dust continues to be a matter of concern. Fines and dust resulting from mining operations is a serious nuisance and a health hazard to mine workers and population living in the vicinity of a mine. Though the blasting dust cloud is raised for few minutes but most of the dust settles in and around mining area and some of it is dispersed before settling down. Depending on meteorological conditions this dust can disperse to substantial dis- tances endangering health of communities. Some of the settled dust is raised again by mining activi- ties for example by travelling vehicles. Damage to vegetation and agriculture is possible. Modern surface mining often involves huge ton- nages thus increasing potential for greater dust ha- zard. Blasting is carried out in most mines, produc- ing very large quantities of fines/dust. In aggregate production, amount of fines produced ranges be- tween 20%-40% (Mitchell et al, 2008, Poscoe et al., 2008). Mines have to face the problem of storage and use of fines. It is important to achieve the goal of reduced fines generation. Two steps are needed to reduce the nuisance resulting from blasting — generate less fines/dust during blasting and then reduce the dispersion of dust which gets air- borne. Fines/dust generation and dispersion are in- fluenced by blast design parameters and execution (Bhandari et al, 2004). The fine material is assumed to originate from a cylindrical crushed zone around the blast hole, within which particles are generated by the crushing of the rock due to comprehensive- shear failure (Kanchibotla et al, 1999). The radius of zone is assumed as the distance from the blast hole zone to the point where radial stresses exceed the compressive strength of rock mass. However, Svahn, (2003) and others have shown that much of the fines generated in blasting do not originate in the crushed zone around the blasthole. Efforts are Fines and Dust Generation and Control in Rock Fragmentation by Blasting Sushil Bhandari, Earth Resource Technology Consultants, Jodhpur, India ABSTRACT: Fine materials resulting from blasting have varied utilization. Sometimes fines are consi- dered useful in further metallurgical and chemical processing, while at other times fines are rejected and be- come economical waste as well as environmental problem. Some fines get air borne and are dispersed as dust. Considerable work has been carried out about reducing or increasing fines in blasting. It has been pro- posed by many researchers that fines originate from crushed zone near the hole. Based on small scale blasting tests, it is shown that fines not only come from the crushed zone but are also dependent on other parameters such as the burden. Blast parameters and geology also influence them. Appropriate blasting can reduce gener- ation of fines and ejection of dust and fines during blasting. Another step is to stop fines getting air borne. Modelling of dust plume and difficulties in measurements to quantify dust dispersal through a particular area are de- scribed. Also practical examples of dust dispersal methods are given.

Welcome message from author
This document is posted to help you gain knowledge. Please leave a comment to let me know what you think about it! Share it to your friends and learn new things together.
Transcript
1. INTRODUCTION Fines and dust resulting from blasting operations
sometimes become both an environmental issue and an economical loss for the producers. Dust is a gen-eral term-fine particles (below 75 micron range) that are suspended in the atmosphere. Dust is formed when fine particles become entrained in the atmosphere by the turbulent action of wind, by the mechanical disturbance of fine materials, or through the release of particulate-rich gaseous emissions. In reality fines may be useful or detriment to the oper-ation. Most often less fines generation is needed in overburden blasting, aggregate production or in steel grade limestone production (where anything less than 40/30mm size is not used) and often this material becomes waste. Whereas in situations where material is further crushed and processed, it is better to break the material by blasting to the smallest size (Mine to Mill concept–JKMRC, 1998). Even in later situation dust continues to be a matter of concern. Fines and dust resulting from mining operations is a serious nuisance and a health hazard to mine workers and population living in the vicinity of a mine. Though the blasting dust cloud is raised for few minutes but most of the dust settles in and around mining area and some of it is dispersed before settling down. Depending on meteorological conditions this dust can disperse to substantial dis-
tances endangering health of communities. Some of the settled dust is raised again by mining activi-ties for example by travelling vehicles. Damage to vegetation and agriculture is possible.
Modern surface mining often involves huge ton-nages thus increasing potential for greater dust ha-zard. Blasting is carried out in most mines, produc-ing very large quantities of fines/dust. In aggregate production, amount of fines produced ranges be-tween 20%-40% (Mitchell et al, 2008, Poscoe et al., 2008). Mines have to face the problem of storage and use of fines. It is important to achieve the goal of reduced fines generation.
Two steps are needed to reduce the nuisance resulting
from blasting — generate less fines/dust during blasting
and then reduce the dispersion of dust which gets air-
borne. Fines/dust generation and dispersion are in-fluenced by blast design parameters and execution (Bhandari et al, 2004). The fine material is assumed to originate from a cylindrical crushed zone around the blast hole, within which particles are generated by the crushing of the rock due to comprehensive-shear failure (Kanchibotla et al, 1999). The radius of zone is assumed as the distance from the blast hole zone to the point where radial stresses exceed the compressive strength of rock mass. However, Svahn, (2003) and others have shown that much of the fines generated in blasting do not originate in the crushed zone around the blasthole. Efforts are
Fines and Dust Generation and Control in Rock Fragmentation by Blasting Sushil Bhandari, Earth Resource Technology Consultants, Jodhpur, India
ABSTRACT: Fine materials resulting from blasting have varied utilization. Sometimes fines are consi-dered useful in further metallurgical and chemical processing, while at other times fines are rejected and be-come economical waste as well as environmental problem. Some fines get air borne and are dispersed as dust. Considerable work has been carried out about reducing or increasing fines in blasting. It has been pro-posed by many researchers that fines originate from crushed zone near the hole. Based on small scale blasting tests, it is shown that fines not only come from the crushed zone but are also dependent on other parameters such as the burden. Blast parameters and geology also influence them. Appropriate blasting can reduce gener-ation of fines and ejection of dust and fines during blasting. Another step is to stop fines getting air borne. Modelling of dust plume and difficulties in measurements to quantify dust dispersal through a particular area are de-
scribed. Also practical examples of dust dispersal methods are given.
needed to understand the process of fines/eration and dispersion. Laboratory blasting experments carried out by Bhandari (1975a and b), Bhandari (1983), Bhandari and Badal (1990), Badal (1990) have been reassessed. Size distribution has been analyzed by Ouchterlony (2011) brec function which throws important generation of fines. During the intervening period there has been new understanding of mechanism of rock fracture and fragmentation ( Fourney, 1993, Bhandari, 1997, Liu and Kastabnis, 1997) appropriate to find explanation to observationabout fines - a part of fragmentation to which less attention was paid at the time of experimentationThis would help in steps to be laid oufines/dust generation and dispersal for practical blasting operations. Experiments were carried out at full scale in limestone mines and simultaneoussurements of dust plume dispersal, fragmentation, displacement were recorded. Modelingmovement also helps in getting some ideas for cotrolling dust generation and dispersal.
2. GENERATION OF FINE FRAGMENTS
An occasional problem lies in the realistic assesment of fines. It is felt that these fines can be geneated both by the equipment loading the rock, and through weak binding material between mineral grains in addition to the intensive crushing of rock around the boreholes during blasting. Within the rsearch project, “Less fines production in aggregate and industrial minerals industry”, which was funded by the European Union, Moser (2005) states that Europe is consuming 2.25 billion tons of blasted rock, 80% being building industry aggregate and industrial minerals. Out of this blasted material 1015% cannot be sold, being too fine i.e. smaller than 4 mm. In favour of fines to benefit the SAG (Semi Autogenous grinding) mill throughput, Grundstrom et al. (2001) state that the blast fragmentation afects mill throughput and finer ROM (Run of Mine) from modified blasts increased the mill throughput substantially. Similarly, Kanchibotla et al. (1998) witnessed primary crusher product size reduction and significant increase in throughput due to the generation of more fines, achieved by changing the powder factor.
2.1 Crushed Zone Model Considerable research work has been going on
with regards to fines generation and size distribtion (Hagan1979, Moser2005, Mitchel et al, 2008, Damenegas, 2008, Djordjevic, 1999). Several els have been used for fragment size distribuThe models used are Kuz-Ram Modelham, 1987), Crushed Zone Model of JKMRCet al, 1998, Kanchibotla et al, 1999, Oned
fines/dust gen-blasting experi-
ments carried out by Bhandari (1975a and b), Bhandari (1983), Bhandari and Badal (1990), Badal
stribution has 2011) using Swe-
important light on the During the intervening period
new understanding of mechanism of Fourney, 1993,
Bhandari, 1997, Liu and Kastabnis, 1997) and it is explanation to observations
a part of fragmentation to which less of experimentation.
out to reduce fines/dust generation and dispersal for practical
carried out at simultaneous mea-
fragmentation, odeling of plume
also helps in getting some ideas for con-
GENERATION OF FINE FRAGMENTS
An occasional problem lies in the realistic assess-can be gener-
equipment loading the rock, and through weak binding material between mineral grains in addition to the intensive crushing of rock around the boreholes during blasting. Within the re-search project, “Less fines production in aggregate
s industry”, which was funded ) states that
Europe is consuming 2.25 billion tons of blasted rock, 80% being building industry aggregate and industrial minerals. Out of this blasted material 10-
o fine i.e. smaller than 4 mm. In favour of fines to benefit the SAG (Semi
ous grinding) mill throughput, Grundstrom et al. (2001) state that the blast fragmentation af-fects mill throughput and finer ROM (Run of Mine)
the mill throughput substantially. Similarly, Kanchibotla et al. (1998) witnessed primary crusher product size reduction and significant increase in throughput due to the generation of more fines, achieved by changing the
Considerable research work has been going on with regards to fines generation and size distribu-
Hagan1979, Moser2005, Mitchel et al, 2008, Several mod-
have been used for fragment size distribution. Ram Model (Cunning-
of JKMRC (Scott , Onederra et al.,
2004)) and KCO model combining extended Kzram and Swebrac function (and b). There are significant differences in the moel predictions for the finer ranges in the fragment size distribution curve while the differences are rduced in the course range. Kanchibotla et al. (1998) pointed out that the Kuz-Ram model underestimates the contribution of fines. In the case of the finer fractions, it is hypothesized that they are produced by the pulverizing or crushing action of the explsive in a blasthole. The crushedeach blasthole is determined based on the peak blathole pressure and strength of the rock. this has been generally believed to be the major
source, no one has so far been able to prove it, as it
was not known where inside the bench such material
originates. How the blasting process can be refined to pr
vide the optimum feed size range for the crushing circuit fines in the blast muckpileof investigations (Scott et al, 1998(1998) state that rock in the crushed zone is asumed to be completely pulverizedfines, which are assumed to be less than 1mm in size. The coarse part of the distribution is predicted using the conventional uniformity index based on blast design parameters proposed by Cunningham (1987) while the finer part is based on the percetage assumed pulverized around t
2.2 Test parameters and data collection Small scale blasting tests were carried out in
bench shaped cement mortar and granite blocks
study effect of variation of burden on fragmentation
and utilization of energy (Bhandari, 1975a, Bhand
ri, 1975b). Detonating cord (5.3g/m)
long cylindrical charges either
two/three simultaneously blasted holes.
were carried out using gun powder as an explosive
Figure 1 Sized fragments of 20, 25,30,35, 40, 45 and 50
mm burdens placed in vertcal rows for small to largest sizes,
combining extended Ku-zram and Swebrac function (Ouchterlony, 2005a
fferences in the mod-el predictions for the finer ranges in the fragment size distribution curve while the differences are re-
Kanchibotla et al. (1998) Ram model underestimates
the case of the finer fractions, it is hypothesized that they are produced by the pulverizing or crushing action of the explo-
. The crushed zone radius around determined based on the peak blas-
of the rock. Although
this has been generally believed to be the major
source, no one has so far been able to prove it, as it
was not known where inside the bench such material
How the blasting process can be refined to pro-range for the crushing
ines in the blast muckpile has been subject (Scott et al, 1998). Kojovic et al.
(1998) state that rock in the crushed zone is as-pulverized to generate
to be less than 1mm in size. The coarse part of the distribution is predicted using the conventional uniformity index based on blast design parameters proposed by Cunningham (1987) while the finer part is based on the percen-tage assumed pulverized around the borehole.
ameters and data collection
Small scale blasting tests were carried out in
ement mortar and granite blocks to
study effect of variation of burden on fragmentation
(Bhandari, 1975a, Bhanda-
(5.3g/m) was used as
charges either single hole or
two/three simultaneously blasted holes. Some tests
using gun powder as an explosive
Sized fragments of 20, 25,30,35, 40, 45 and 50
for small to largest sizes,
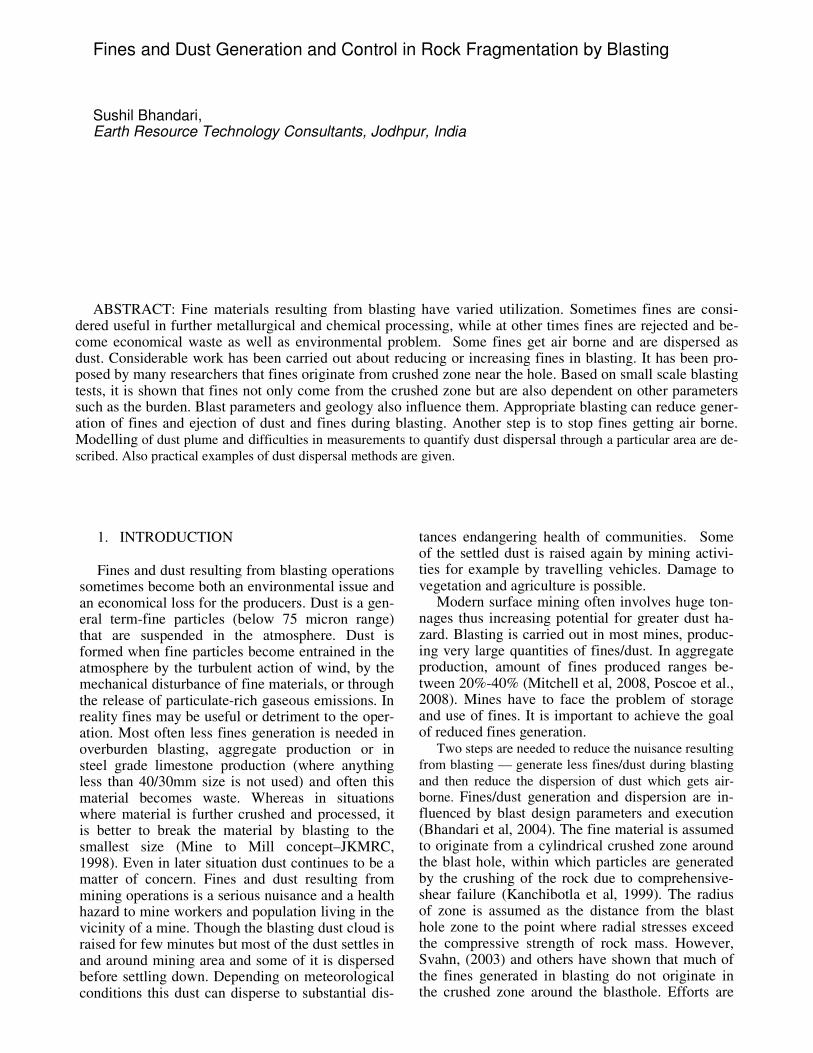
charge. In some granite blocks, simulated joint was created parallel to face with three fillers namely air, plaster of Paris and cement. Bhandari (1983), Bhandari and Badal (1990) and Badal others have studied fragmentation on reduced scale in different orientations of joints and on producscale. Bhandari (1975 a & b) distinguished between optimum breakage burden and optimumtion burden (Figure 1). At the optimum breakage burden, maximum volume or mass of rock but the fragmentation obtained is not essentially aceptable as it has greater fines and some largeboulders. This was shown by laboratory scale blasing where it was found that optimum fragmentation burden was 30-40% less than the optimum breakage burden. In small scale blasting tests, Figure 1 shows that smaller burdens produce very high amount of fines with lesser values at optimum fragmentation burdens. A typical Swebrec distribution ments obtained in tests is given in Figure 2.timum breakage burden though the rock broken vlume is maximum but there are boulders and fines.
Figure 2 Showing size distribution using Swebre
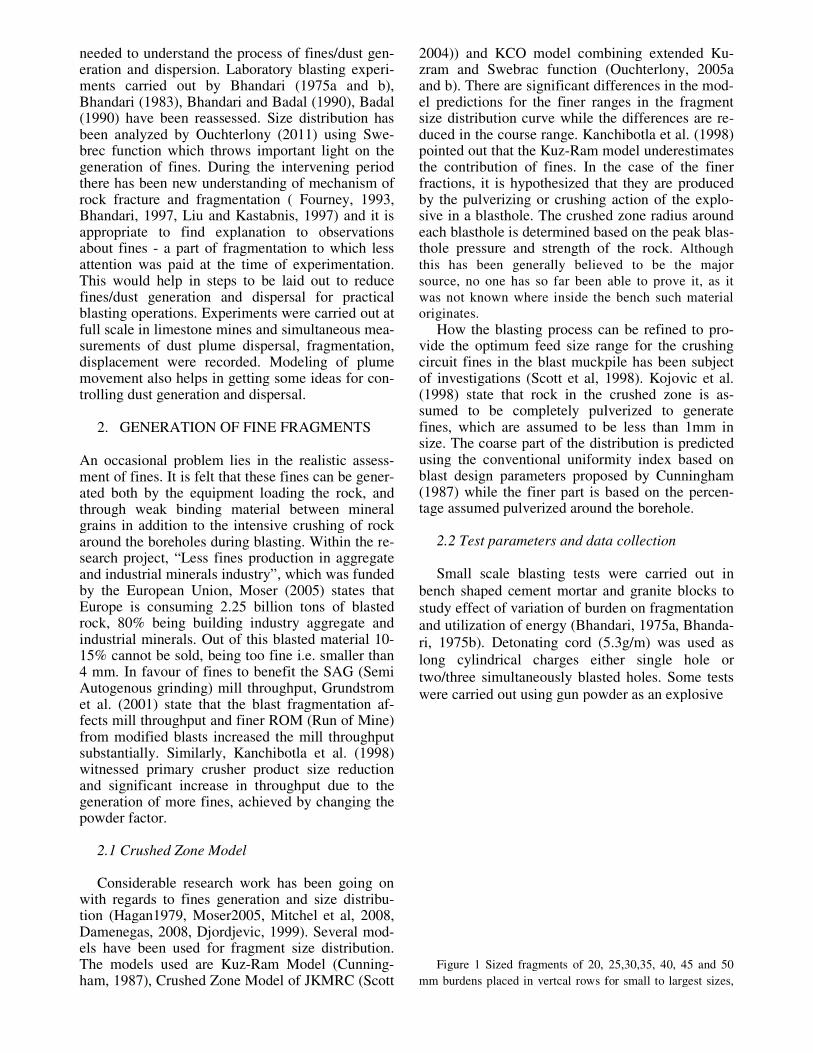
At lower burden, amount of fines is highertest indicates a significant influence of burden (Ouchterlony, 2011) on the amount of fines3). The mass of -3.33 mm fines is denoted by f (g), the burden by B (mm) and the spacing by S (mm). There is no significant dependence on sthere was a zone that followed the CrushModel lines (admittedly JKMRC use -1 mm fines) and thus was based on the initial blasthole pressure,then we would have no dependence on the burdenIf the crushed zone was the only zone of origin of fines then significant influence of burden would not have been there. Amount of fines producedholes is almost three times that is produced from single hole that means fines are not dependent on crushed zone alone. It is suggested that microstructural damage by stress waves help in branching of radiating cracks propagating under gas action.Further, Liu and Kastabnis (1998) explain that two
charge. In some granite blocks, simulated joint e fillers namely
Bhandari (1983), (1990) and
on reduced scale and on production
uished between optimum breakage burden and optimum fragmenta-
. At the optimum breakage volume or mass of rock is broken
but the fragmentation obtained is not essentially ac-and some large
boulders. This was shown by laboratory scale blast-that optimum fragmentation
40% less than the optimum breakage Figure 1 shows
smaller burdens produce very high amount of es with lesser values at optimum fragmentation
istribution of frag-igure 2. At op-
he rock broken vo-but there are boulders and fines.
using Swebrec
At lower burden, amount of fines is higher. F-a significant influence of burden
on the amount of fines (Figure 3.33 mm fines is denoted by f (g),
the burden by B (mm) and the spacing by S (mm). pendence on spacing. If
there was a zone that followed the Crushed Zone 1 mm fines)
based on the initial blasthole pressure, we would have no dependence on the burden.
If the crushed zone was the only zone of origin of fines then significant influence of burden would not
fines produced from 3 that is produced from
single hole that means fines are not dependent on It is suggested that micro-
in branching of radiating cracks propagating under gas action.
explain that two
zones of damage are formed by different mchanisms. Immediately after the detonation of the explosive charge, a thin layer of rock material cofining the explosive charge fails and forms a crushed zone. The rock mass outsidzone is again experience two damage zones. The lower damage zone is formed by tensile failure iduced by two tensile failures and by reflected stress waves. At crater depth (burden)mum value there is excessive damage becauscoalesce causing excessive fracture of material that has been crushed. At crater depth greater than optmum burden reflected damage zone disappears and thus less fractured and fragmented rock. Similar observations about fines and burden were
made with regard to granite blocks (Bhandari,
1975a) and in homogeneous limestone blocks
al, 1990). At smaller burdens,
scabbing and also create micro cracking
of existing cracks along with crushing near the hole.
Low explosive tests show fines with
of boulders (Figure 4). The amo
from granite tests (everything else being the same) is
about twice the amount from mo
the uniaxial compressive strength of granite (172.
is more than three times higher than that (49,6 MPa) of
the mortar. According to crushed zone model (CZM)
lower compressive strength rock
higher amount of fines.
Stress wave action also has important influence on the generation of fines. At lower burden stresswaves are predominantly acting and hence a large generation of fines occurs as stress waves have animportant role in the generationstructural cracks and thus fines. When the role of stress waves was further investigathat at lower burdens mass of fines is much higher.
Figure 3 Fines generated vs burden during single and
multihole experiments
zones of damage are formed by different me-chanisms. Immediately after the detonation of the explosive charge, a thin layer of rock material con-fining the explosive charge fails and forms a crushed zone. The rock mass outside the crushed zone is again experience two damage zones. The lower damage zone is formed by tensile failure in-duced by two tensile failures and by reflected stress waves. At crater depth (burden) smaller than opti-
there is excessive damage because of coalesce causing excessive fracture of material that has been crushed. At crater depth greater than opti-mum burden reflected damage zone disappears and thus less fractured and fragmented rock.
Similar observations about fines and burden were
th regard to granite blocks (Bhandari,
limestone blocks (Bad-
, stress waves cause
micro cracking, extension
isting cracks along with crushing near the hole.
show fines with large amount
The amount of -3,33 mm fines
granite tests (everything else being the same) is
about twice the amount from mortar tests, despite that
the uniaxial compressive strength of granite (172.4 MPa)
more than three times higher than that (49,6 MPa) of
the mortar. According to crushed zone model (CZM)
rock should have given
Stress wave action also has important influence At lower burden stress
waves are predominantly acting and hence a large generation of fines occurs as stress waves have an important role in the generation of more micro-
fines. When the role of stress waves was further investigated then it showed
fines is much higher.
urden during single and
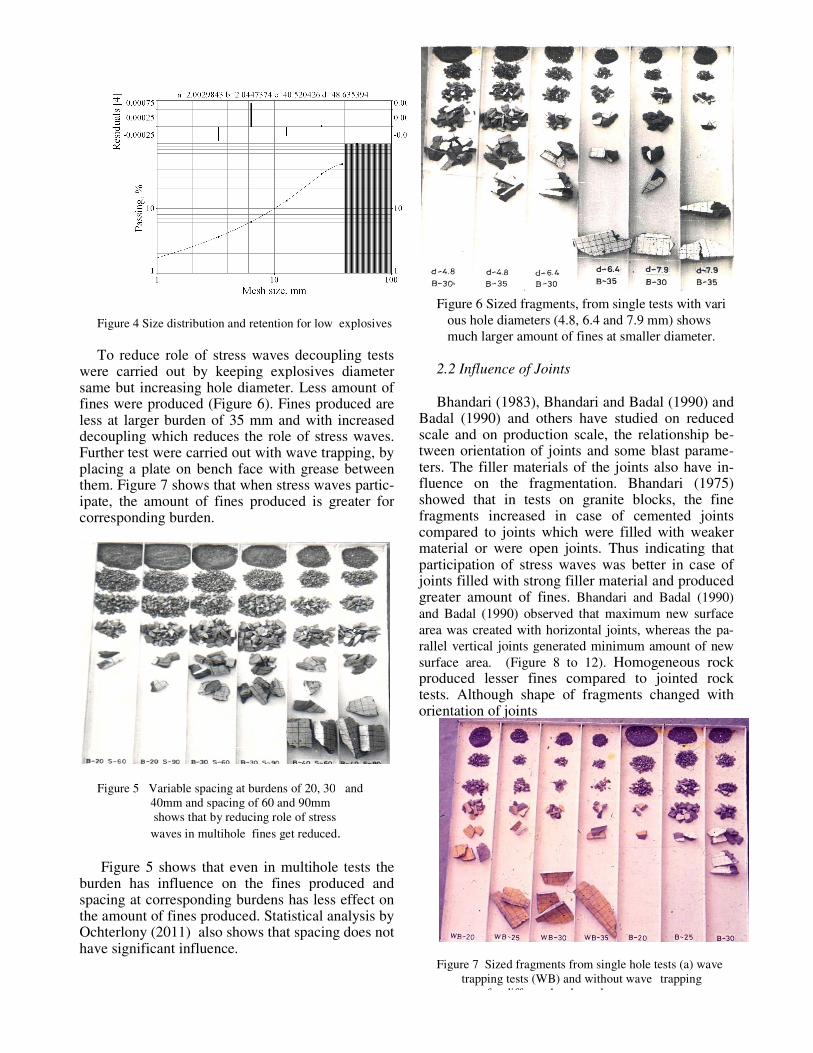
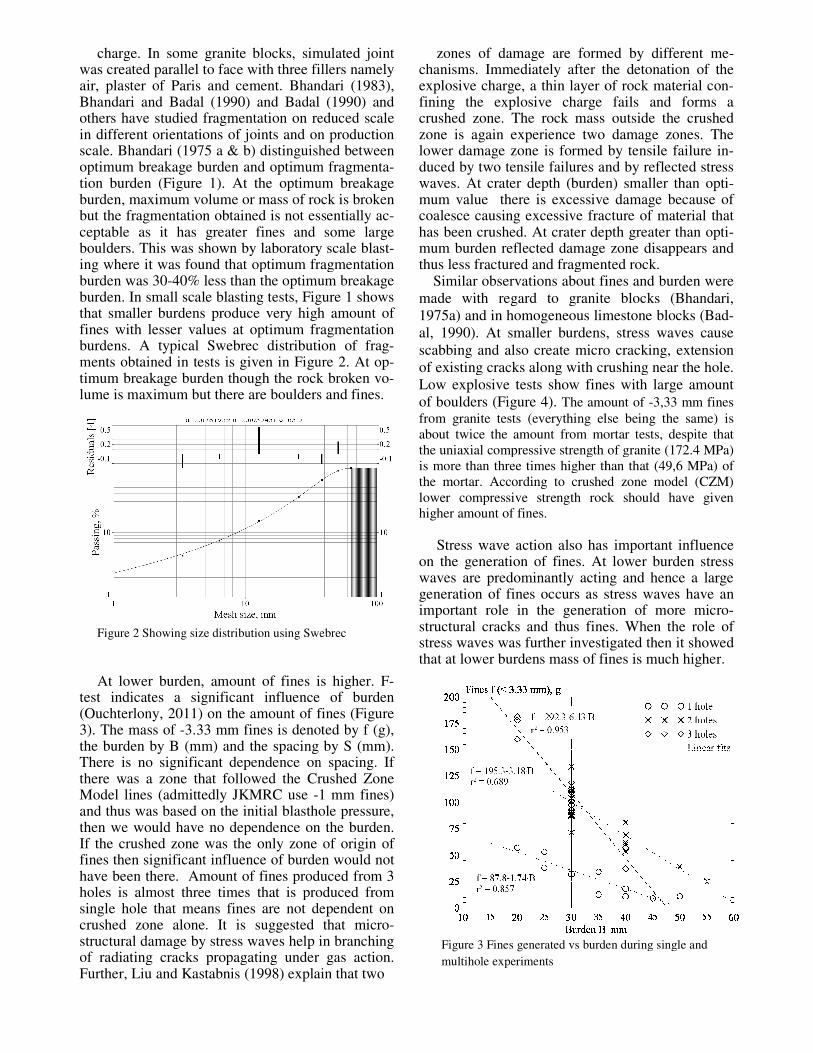
Figure 4 Size distribution and retention for low
To reduce role of stress waves decoupling
were carried out by keeping explosives diameter same but increasing hole diameter. Less amount of fines were produced (Figure 6). Fines produced are less at larger burden of 35 mm and with decoupling which reduces the role of stress waves.Further test were carried out with wave trappingplacing a plate on bench face with grease them. Figure 7 shows that when stress waves partiipate, the amount of fines produced is greater for corresponding burden.
Figure 5 Variable spacing at burdens of 20, 30
40mm and spacing of 60 and 90mm
shows that by reducing role of stress
waves in multihole fines get reduced
Figure 5 shows that even in multihole tests the
burden has influence on the fines produced and spacing at corresponding burdens has less effect on the amount of fines produced. Statistical analysis by Ochterlony (2011) also shows that spacing doeshave significant influence.
Size distribution and retention for low explosives
decoupling tests were carried out by keeping explosives diameter
ess amount of Fines produced are
with increased tress waves.
Further test were carried out with wave trapping, by placing a plate on bench face with grease between
stress waves partic-is greater for
ariable spacing at burdens of 20, 30 and
40mm and spacing of 60 and 90mm
shows that by reducing role of stress
multihole fines get reduced.
Figure 5 shows that even in multihole tests the produced and
spacing at corresponding burdens has less effect on the amount of fines produced. Statistical analysis by
(2011) also shows that spacing does not
Figure 6 Sized fragments, from
ous hole diameters (4.8, 6.4 and 7.9 mm) shows
much larger amount of fines at smaller diameter
2.2 Influence of Joints
Bhandari (1983), Bhandari and Badal (1990) and Badal (1990) and others have studied on reduced scale and on production scale, the tween orientation of joints and some blast paramters. The filler materials of the joints also have ifluence on the fragmentation. Bhandari (1975) showed that in tests on granite blocks,fragments increased in case of cemented joincompared to joints which were filled with weaker material or were open joints. Thus indicating thatparticipation of stress waves was better in case of joints filled with strong filler material and produced greater amount of fines. Bhandari and Badal (1
and Badal (1990) observed that maximum new surface
area was created with horizontal joints, whereas the p
rallel vertical joints generated minimum amount of new
surface area. (Figure 8 to 12).
produced lesser fines compared to jointetests. Although shape of fragments changed with orientation of joints
Figure 7 Sized fragments from single hole tests
trapping tests (WB) and without wave
tests for different burden values
Sized fragments, from single tests with vari
ous hole diameters (4.8, 6.4 and 7.9 mm) shows
much larger amount of fines at smaller diameter.
Bhandari (1983), Bhandari and Badal (1990) and Badal (1990) and others have studied on reduced scale and on production scale, the relationship be-tween orientation of joints and some blast parame-ters. The filler materials of the joints also have in-
ntation. Bhandari (1975) showed that in tests on granite blocks, the fine
increased in case of cemented joints compared to joints which were filled with weaker material or were open joints. Thus indicating that participation of stress waves was better in case of
led with strong filler material and produced Bhandari and Badal (1990)
and Badal (1990) observed that maximum new surface
joints, whereas the pa-
rallel vertical joints generated minimum amount of new
(Figure 8 to 12). Homogeneous rock produced lesser fines compared to jointed rock tests. Although shape of fragments changed with
Sized fragments from single hole tests (a) wave
(WB) and without wave trapping
tests for different burden values
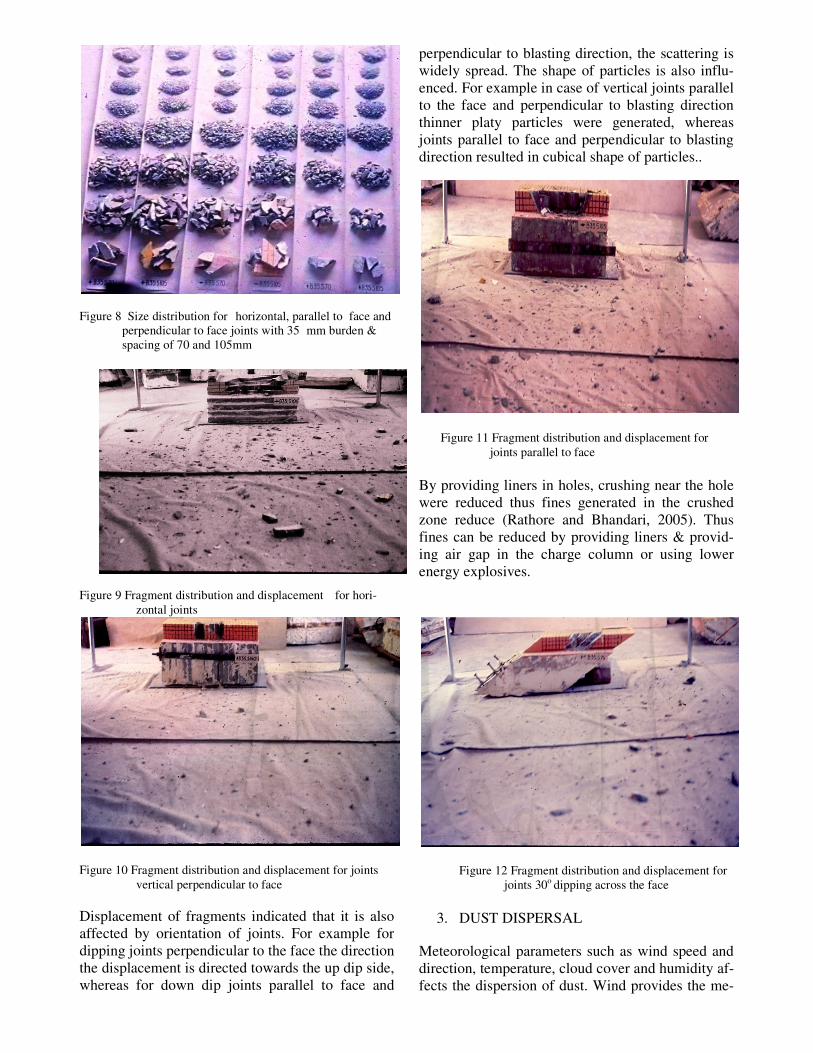
Figure 8 Size distribution for horizontal, parallel to face and
perpendicular to face joints with 35 mm burden &
spacing of 70 and 105mm
Figure 9 Fragment distribution and displacement for hori-
zontal joints
Figure 10 Fragment distribution and displacement for joints
vertical perpendicular to face
Displacement of fragments indicated that it is also
affected by orientation of joints. For example for
dipping joints perpendicular to the face the direction
the displacement is directed towards the up dip side,
whereas for down dip joints parallel to face and
perpendicular to blasting direction, the scattering is
widely spread. The shape of particles is also influ-
enced. For example in case of vertical joints parallel
to the face and perpendicular to blasting direction
thinner platy particles were generated, whereas
joints parallel to face and perpendicular to blasting
direction resulted in cubical shape of particles..
Figure 11 Fragment distribution and displacement for
joints parallel to face
By providing liners in holes, crushing near the hole
were reduced thus fines generated in the crushed
zone reduce (Rathore and Bhandari, 2005). Thus
fines can be reduced by providing liners & provid-
ing air gap in the charge column or using lower
energy explosives.
Figure 12 Fragment distribution and displacement for
joints 30o dipping across the face
3. DUST DISPERSAL
Meteorological parameters such as wind speed and
direction, temperature, cloud cover and humidity af-
fects the dispersion of dust. Wind provides the me-
chanical energy for particle entrainment. A certain
minimum wind velocity, often-called threshold
wind velocity is required, before the dust particles
raised in the atmosphere or lying on the surface
gin to move. Above this level, particle entrainment
may be expected to depend strongly on wind veloc
ty. Atmospheric stability affects dispersion of the
emission plume, determining the extent of the ve
tical and horizontal, transverse and axial spreading
of the emitted particulates (Evans et al, 1981,
Chock, 1997). Atmospheric stability depends upon
the extent of solar insulation, cloudiness and wind
speed. These factors determine vertical thermal gr
dient and corresponding atmospheric turbulence.
Stability is both seasonal and diurnal. For long
dust dispersion estimates, an average estimate of
stability condition is desirable.
Soil moisture content affects the cohesive forc
between soil particles and thus their entrainment.
Above certain soil moisture content, the particle
may be bound together so tightly that no fugitive
emissions may be expected. Moisture affects coh
siveness differently for different soils. For long
term emission estimates, average soil moisture co
tent is needed along with frequency of precipitation.
In both cases one needs to carry out dust sampling. 3.1 Experimental measurements
Measurement of dust resulting from blasting has been very difficult work. This is required because it is important to see effectiveness of control meaures. Experiments were conducted at opencast mine site at Sanu Limestone Mines – Jaisalmer, pmeasurement of particulate matter (P.M.particles were made with the help of high volume dust samplers. High volume air samplers were used for the estimation of the mass (g) of thgiven volume of air (V.τ), where V is the known rate at which air is drawn through the apparatus and τ is the duration of sampling process
Hence, good correlation between dust cloud spread and the intensity of the turbulence exists irespective of the condition of the surface reference and stability. This is a significant result, in the theretical modeling of the dispersing puff of dust cloud. Therefore, wind measurement and at blast site are of great importance in the dispersion process.
Five instruments were laid out in downwind drection at safe distance from the blast. Three weron the path central line of expected (1
st
plume path. Transverse to 3rd
instrumentstruments are kept at equal distance on either side
chanical energy for particle entrainment. A certain
called threshold
before the dust particles
raised in the atmosphere or lying on the surface, be-
gin to move. Above this level, particle entrainment
may be expected to depend strongly on wind veloci-
ty. Atmospheric stability affects dispersion of the
ing the extent of the ver-
tical and horizontal, transverse and axial spreading
(Evans et al, 1981,
. Atmospheric stability depends upon
the extent of solar insulation, cloudiness and wind
e vertical thermal gra-
dient and corresponding atmospheric turbulence.
Stability is both seasonal and diurnal. For long-term
dust dispersion estimates, an average estimate of
Soil moisture content affects the cohesive forces
between soil particles and thus their entrainment.
Above certain soil moisture content, the particles
may be bound together so tightly that no fugitive
emissions may be expected. Moisture affects cohe-
siveness differently for different soils. For long-
rm emission estimates, average soil moisture con-
tent is needed along with frequency of precipitation.
In both cases one needs to carry out dust sampling.
Measurement of dust resulting from blasting has rk. This is required because it
ss of control meas-were conducted at opencast mine
Jaisalmer, physical measurement of particulate matter (P.M.10) dust
high volume High volume air samplers were used
) of the SPM in a is the known
rate at which air is drawn through the apparatus and
Hence, good correlation between dust cloud spread and the intensity of the turbulence exists ir-respective of the condition of the surface reference and stability. This is a significant result, in the theo-retical modeling of the dispersing puff of dust cloud. Therefore, wind measurement and σ values
in the dispersion
laid out in downwind di-stance from the blast. Three were
st, 3
rd & 5
th)
instrument, two in-struments are kept at equal distance on either side.
2.2 Experiments at Sanu Mines
Experimental studies were carried out at Sanu L
mestone mines. This mine is located in western part
of Rajasthan in Thar Desert. The limestone belongs
to Khuila formation of Eocene age. The area is d
prived of the overburden except in the northern r
gion where a layer of 2-4 m top soil exists. Lime
tone horizon is of 15-20 m thickness and is further
divided into hard, compact bouldary limestone and
chalky limestone. Steel grade lime stone is
duced which is available in top layer only which is
1 to 5 m thick. The lower limestone
ment grade. Steel mills need limestone of a partic
lar size. There is size restriction; in general anything
below 30 mm is of no use. This mate
back in the mine or sold at lower price.
there is need to reduce generation o
Drill holes are of 120mm diameter holes for a depth
ranging from 4.0m – 5.0m. The usual blast param
ters are 3.0m of spacing and 2.5m of burden. These
holes were blasted using ANFO and aluminized
slurry explosives as bottom charge. Detonating cord
and cord relays were used. Five blasts were co
ducted where dust measurements were carried out
and blast results including fragment sizes were an
lysed using Wipfrag software. Measurements of the
dust were made at various distances from the point
of blast. Table 1 gives details of blasts and results
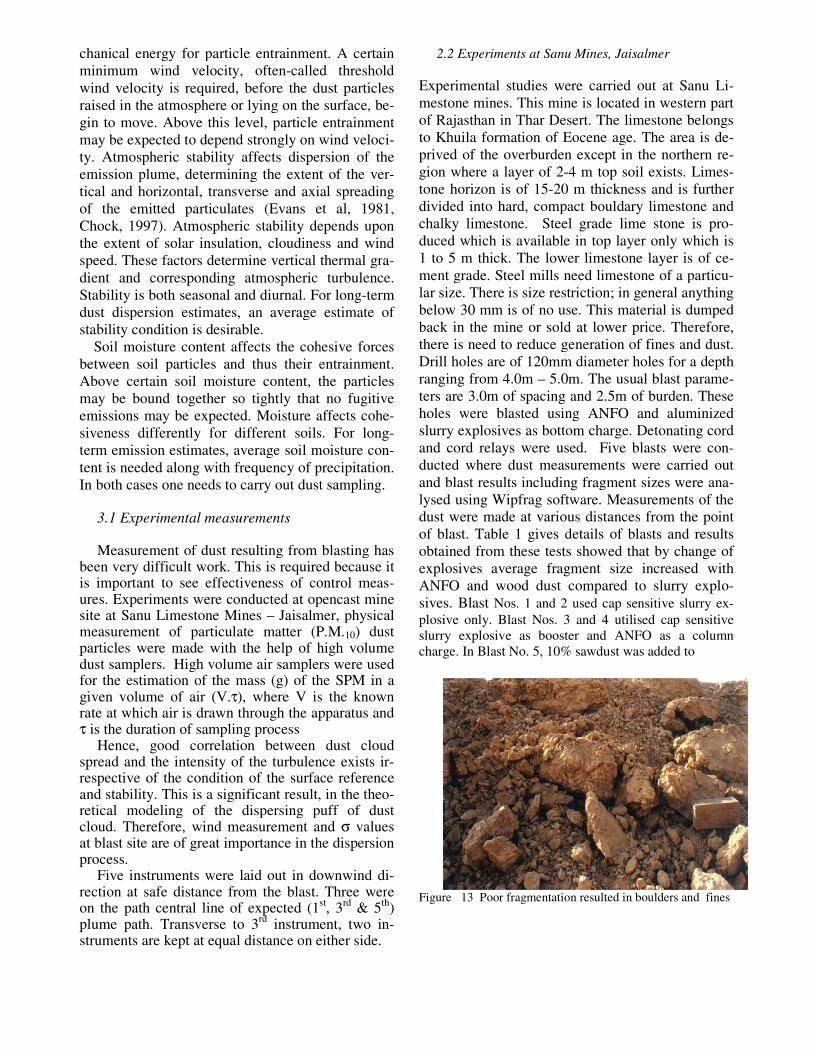
obtained from these tests showed that
explosives average fragment size increased with
ANFO and wood dust compared to slurry expl
sives. Blast Nos. 1 and 2 used cap sensitive slurry e
plosive only. Blast Nos. 3 and 4 utilised cap sensitive
slurry explosive as booster and ANFO as a col
charge. In Blast No. 5, 10% sawdust was added to
Figure 13 Poor fragmentation result
ines, Jaisalmer
Experimental studies were carried out at Sanu Li-
mestone mines. This mine is located in western part
of Rajasthan in Thar Desert. The limestone belongs
to Khuila formation of Eocene age. The area is de-
prived of the overburden except in the northern re-
4 m top soil exists. Limes-
20 m thickness and is further
divided into hard, compact bouldary limestone and
ne. Steel grade lime stone is pro-
duced which is available in top layer only which is
lower limestone layer is of ce-
grade. Steel mills need limestone of a particu-
lar size. There is size restriction; in general anything
below 30 mm is of no use. This material is dumped
back in the mine or sold at lower price. Therefore,
there is need to reduce generation of fines and dust.
re of 120mm diameter holes for a depth
5.0m. The usual blast parame-
ters are 3.0m of spacing and 2.5m of burden. These
re blasted using ANFO and aluminized
slurry explosives as bottom charge. Detonating cord
used. Five blasts were con-
ducted where dust measurements were carried out
fragment sizes were ana-
lysed using Wipfrag software. Measurements of the
dust were made at various distances from the point
le 1 gives details of blasts and results
from these tests showed that by change of
explosives average fragment size increased with
ANFO and wood dust compared to slurry explo-
Nos. 1 and 2 used cap sensitive slurry ex-
Nos. 3 and 4 utilised cap sensitive
slurry explosive as booster and ANFO as a column
last No. 5, 10% sawdust was added to
resulted in boulders and fines
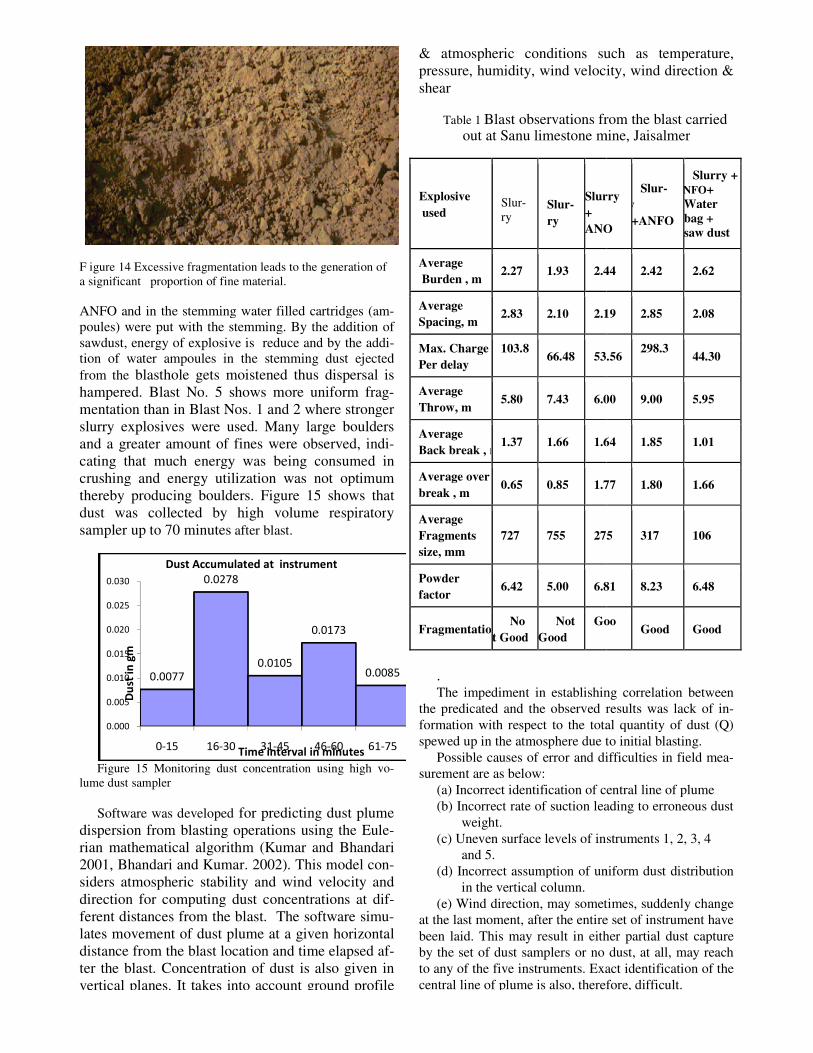
F igure 14 Excessive fragmentation leads to the generation of
a significant proportion of fine material.
ANFO and in the stemming water filled cartridges (a
poules) were put with the stemming. By the addition of
sawdust, energy of explosive is reduce and by the add
tion of water ampoules in the stemming dust ejected
from the blasthole gets moistened thus dispersal is
hampered. Blast No. 5 shows more uniform fra
mentation than in Blast Nos. 1 and 2 where stronger
slurry explosives were used. Many large boulders
and a greater amount of fines were observed, ind
cating that much energy was being consumed in
crushing and energy utilization was not optimum
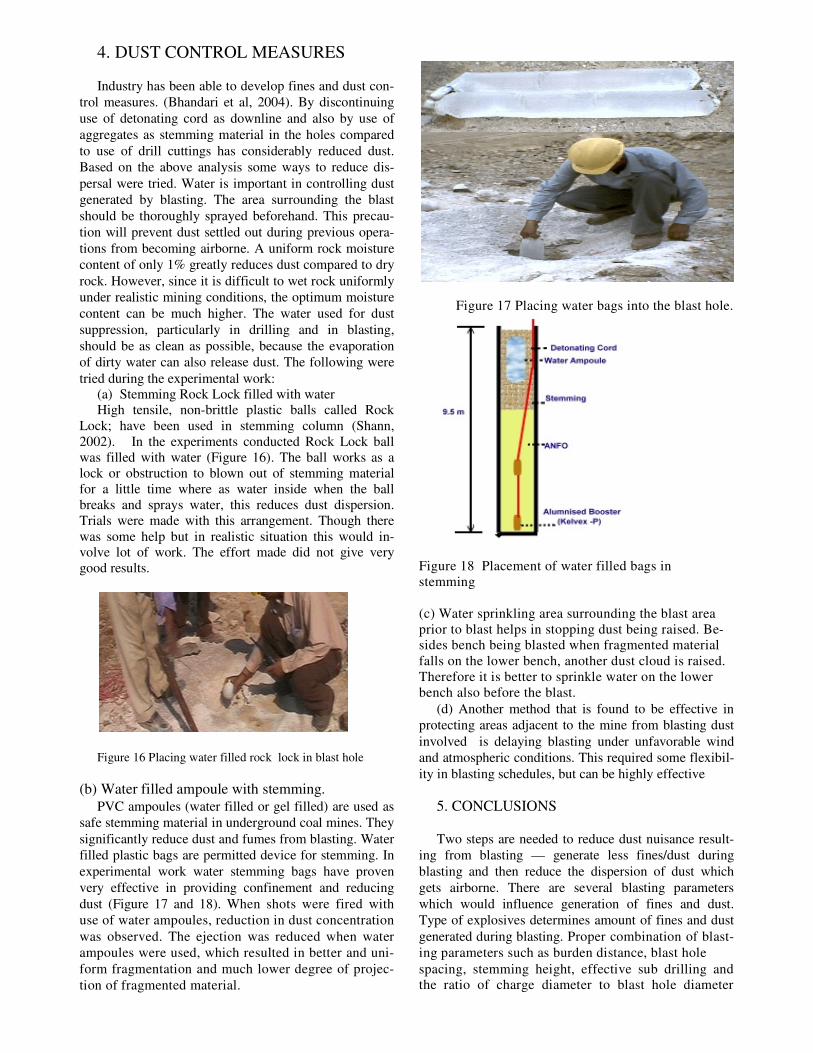
thereby producing boulders. Figure 15 shows that
dust was collected by high volume respirator
sampler up to 70 minutes after blast.
Figure 15 Monitoring dust concentration using high v
lume dust sampler
Software was developed for predicting dust plume
dispersion from blasting operations using the Eul
rian mathematical algorithm (Kumar and Bhandari
2001, Bhandari and Kumar. 2002). This model co
siders atmospheric stability and wind velocity and
direction for computing dust concentrations at di
ferent distances from the blast. The software
lates movement of dust plume at a given horizontal
distance from the blast location and time elapsed a
ter the blast. Concentration of dust is also given in
vertical planes. It takes into account ground profile
0.0077
0.0278
0.0105
0.0173
0.000
0.005
0.010
0.015
0.020
0.025
0.030
0-15 16-30 31-45 46
Du
st i
n g
m
Time interval in minutes
Dust Accumulated at instrument
the generation of
NFO and in the stemming water filled cartridges (am-
with the stemming. By the addition of
reduce and by the addi-
stemming dust ejected
blasthole gets moistened thus dispersal is
hampered. Blast No. 5 shows more uniform frag-
mentation than in Blast Nos. 1 and 2 where stronger
slurry explosives were used. Many large boulders
observed, indi-
cating that much energy was being consumed in
crushing and energy utilization was not optimum
Figure 15 shows that
dust was collected by high volume respiratory
Monitoring dust concentration using high vo-
for predicting dust plume
dispersion from blasting operations using the Eule-
(Kumar and Bhandari
This model con-
siders atmospheric stability and wind velocity and
direction for computing dust concentrations at dif-
The software simu-
lates movement of dust plume at a given horizontal
distance from the blast location and time elapsed af-
dust is also given in
vertical planes. It takes into account ground profile
& atmospheric conditions such as temperature,
pressure, humidity, wind velocity, wind direction &
shear
Table 1 Blast observations from the blast out at Sanu limestone mine, Jaisalmer
. The impediment in establishing correlation between
the predicated and the observed results was lack of i
formation with respect to the total quantity of dust (Q)
spewed up in the atmosphere due to initial blasting.
Possible causes of error and difficulties in field me
surement are as below:
(a) Incorrect identification of central line of plume
(b) Incorrect rate of suction leading to erroneous dust
weight.
(c) Uneven surface levels of instruments 1, 2, 3, 4
and 5.
(d) Incorrect assumption of uniform dust distribution
in the vertical column.
(e) Wind direction, may sometimes, suddenly change
at the last moment, after the entire set of instrument have
been laid. This may result in either part
by the set of dust samplers or no dust, at all, may reach
to any of the five instruments. Exact identification of the
central line of plume is also, therefore, difficult.
0.0173
0.0085
46-60 61-75Time interval in minutes
Dust Accumulated at instrument
Explosive
used
Slur-
ry
Slur-
ry
Slurry
+
ANO
Average
Burden , m 2.27 1.93 2.44
Average
Spacing, m 2.83 2.10 2.19
Max. Charge
Per delay
103.8
66.48 53.56
Average
Throw, m 5.80 7.43 6.00
Average
Back break , m 1.37 1.66 1.64
Average over
break , m 0.65 0.85 1.77
Average
Fragments
size, mm
727 755 275
Powder
factor 6.42 5.00 6.81
FragmentationNo
t Good
Not
Good
Goo
& atmospheric conditions such as temperature,
pressure, humidity, wind velocity, wind direction &
Blast observations from the blast carried out at Sanu limestone mine, Jaisalmer
The impediment in establishing correlation between
the predicated and the observed results was lack of in-
formation with respect to the total quantity of dust (Q)
spewed up in the atmosphere due to initial blasting.
Possible causes of error and difficulties in field mea-
(a) Incorrect identification of central line of plume
rate of suction leading to erroneous dust
(c) Uneven surface levels of instruments 1, 2, 3, 4
(d) Incorrect assumption of uniform dust distribution
) Wind direction, may sometimes, suddenly change
last moment, after the entire set of instrument have
been laid. This may result in either partial dust capture
or no dust, at all, may reach
to any of the five instruments. Exact identification of the
lso, therefore, difficult.
Slurry
ANO
Slur-
ry
+ANFO
Slurry +
ANFO+
Water
bag +
saw dust
2.44 2.42 2.62
2.19 2.85 2.08
53.56 298.3
44.30
6.00 9.00 5.95
1.64 1.85 1.01
1.77 1.80 1.66
275 317 106
6.81 8.23 6.48
GooGood Good
4. DUST CONTROL MEASURES Industry has been able to develop fines and dust con-
trol measures. (Bhandari et al, 2004). By discontinuing
use of detonating cord as downline and also by use of
aggregates as stemming material in the holes compared
to use of drill cuttings has considerably reduced dust.
Based on the above analysis some ways to reduce dis-
persal were tried. Water is important in controlling dust
generated by blasting. The area surrounding the blast
should be thoroughly sprayed beforehand. This precau-
tion will prevent dust settled out during previous opera-
tions from becoming airborne. A uniform rock moisture
content of only 1% greatly reduces dust compared to dry
rock. However, since it is difficult to wet rock uniformly
under realistic mining conditions, the optimum moisture
content can be much higher. The water used for dust
suppression, particularly in drilling and in blasting,
should be as clean as possible, because the evaporation
of dirty water can also release dust. The following were
tried during the experimental work:
(a) Stemming Rock Lock filled with water
High tensile, non-brittle plastic balls called Rock
Lock; have been used in stemming column (Shann,
2002). In the experiments conducted Rock Lock ball
was filled with water (Figure 16). The ball works as a
lock or obstruction to blown out of stemming material
for a little time where as water inside when the ball
breaks and sprays water, this reduces dust dispersion.
Trials were made with this arrangement. Though there
was some help but in realistic situation this would in-
volve lot of work. The effort made did not give very
good results.
Figure 16 Placing water filled rock lock in blast hole
(b) Water filled ampoule with stemming.
PVC ampoules (water filled or gel filled) are used as
safe stemming material in underground coal mines. They
significantly reduce dust and fumes from blasting. Water
filled plastic bags are permitted device for stemming. In
experimental work water stemming bags have proven
very effective in providing confinement and reducing
dust (Figure 17 and 18). When shots were fired with
use of water ampoules, reduction in dust concentration
was observed. The ejection was reduced when water
ampoules were used, which resulted in better and uni-
form fragmentation and much lower degree of projec-
tion of fragmented material.
Figure 17 Placing water bags into the blast hole.
Figure 18 Placement of water filled bags in
stemming
(c) Water sprinkling area surrounding the blast area
prior to blast helps in stopping dust being raised. Be-
sides bench being blasted when fragmented material
falls on the lower bench, another dust cloud is raised.
Therefore it is better to sprinkle water on the lower
bench also before the blast. (d) Another method that is found to be effective in
protecting areas adjacent to the mine from blasting dust
involved is delaying blasting under unfavorable wind
and atmospheric conditions. This required some flexibil-
ity in blasting schedules, but can be highly effective
5. CONCLUSIONS Two steps are needed to reduce dust nuisance result-
ing from blasting — generate less fines/dust during
blasting and then reduce the dispersion of dust which
gets airborne. There are several blasting parameters
which would influence generation of fines and dust.
Type of explosives determines amount of fines and dust
generated during blasting. Proper combination of blast-
ing parameters such as burden distance, blast hole
spacing, stemming height, effective sub drilling and
the ratio of charge diameter to blast hole diameter
may give reduced fines. To achieve the goal of re-
duced dust proper explosive type, blast parameters, in-
itiation sequence, and charge distribution need to be
tailored in such a way that they produce optimum size
distribution of fragments. Generation of dust gets af-
fected by many geological and blasting parameters. Dust
dispersal needs to be prevented even if blast generated
fines have particles which can be raised as dust. Predic-
tion of dust plume movement and use of water to prevent
dust dispersal can be made.
6. ACKNOWLEDGEMENT Finn Ouchterlony analysed data presented in S
Bahndari (1975), S Bhandari and R. Badal (1990)
publications. Comments and questions raised by him
have immensely helped and are acknowledged with
gratitude.
7. References
Badal, R., (1990) Studies on Rock Fragmentation by blasting
of rock with discontinuities, University of Jodhpur, 1990, 215
Bhandari, S. (1975a) Studies on Fragmentation of Rock by
Blasting. Ph.D. Thesis, University of New South Wales, 201p.
Bhandari, S. (1975b) Burden and Spacing Relationship in the
Design of Blasting Patterns, 16th Symposium on Rock Me-
chanics, University of Minnesota, pp 333-343.
Bhandari S., (1983) Influence of Joint Directions in Blasting,
9th Annual Conference on Explosives and Blasting Tech-
niques, Dallas, February, pp 359-369
Bhandari, S. (1997), Engineering Rock Blasting Operations
A.A. Balkema Publishers, Rotterdam, Netherlands / Brook-
field, U.S.A.; 370p
Bhandari, S. and Badal, R. (1990) Relationships Between
Joint Directions and Blasting Parameters, Proc 3rd Interna-
tional Symposium on Rock Fragmentation by Blasting, Bris-
bane, 26–31 August 1990 pp225–231. AusIMM Publ Park-
ville
Bhandari, S. and Kumar, P. (2002) Modelling of Near Source
Dust Dispersal after Surface Mine Blast in Weak Wind over
Undulated Terrain in Tropical Conditions, , APCOM– Appli-
cation of Computers and Operations Research in The Minerals
Industry SME, Phoenix, Arizona, USA;
Kumar, P. and Bhandari, S. (2001) Modelling Dust Dispersal
near Source after Opencast Mine Blast in Weak Wind Condi-
tions over Flat Terrain in Tropical Conditions, Explo 2001
Conference, Hunters Valley
Chock D.P. (1997) A Simple Line-Source Model for Disper-
sion Near Roadways. Atmospheric Environment Vol. 12, pp
823-829
Cunningham, C. (1987), Fragmentation Estimations and The
Kuz-Ram Model – Four Years On. Proceedings 2nd
Interna-
tional Symposium on Rock Fragmentation by Blasting, Au-
gust 23-26, 1987. Colorado. pp 450, 480, 481.
Dameneges, V. (2008): Fragmentation Analysis of optimized
blasting rounds in the Aitic Mines- Effect of Specific charge,
Masters Thesis, Department of Civil and Environmental Engi-
neering, Lulea University of Technology, 117 p.
Djordjevic, N. (1999). Two-component model of blast frag-
mentation. Fragblast. South African Institute of Mining and
Metallurgy, Johannesburg. pp213
Evans J.S., Spedden S.E. and Cooper D.W. (1981) A Study of
the Relationship between Wind Speed and Total Suspended
Particulate Levels, Journal of the Air Pollution Control Asso-
ciation. Vol. 31, No. 4, pp 395-396.
Fourney, W.L. (1993) Mechanisms of rock fragmentation by
blasting. Comprehensive Rock Engineering Principles, Prac-
tice andProjects, vol 4. Oxford: Pergamon Press,. p. 39–69.
Grundstrom, C. Kanchibotla, S. S., Jankovichk A. and Thorn-
ton, D. (2001). “Blast Fragmentation for Maximising the Sag
Mill Throughput at Porgera Gold Mine”, International Society
of Explosives Engineers 2001G Volume 1. pp 213.
Hagan, T.N. (1979), The control of fines through improved
blast design, Proc. Aust. Inst. Mech. & Metal. pp 9.
Jenkins, S.S., Floyd, J., “Stemming enhancement tests”, Gen-
eral Proc. of ISEE, 2000G, Vol. 2, p 191-204.
JKMRC, (1998). Optimisation of Mine Fragmentation for
Downstream Processing, Final Report, AMIRA P483 project
Kanchibotla S.S., Valery W. and Morrell, S. (1999), Model-
ling fines in blast fragmentation and its impact on crushing
and grinding, Proc. Explo-99 Conf. Kalgoorlie, Nov. Kojovic, T., Kanchibotla, S.S., Poetschka and Chapman, J.
1998. “The Effect of Blast Design on the Lump: Fines Ratio at
Marandoo Iron Ore Operartions”. Mine to Mill conference
1998, Brisbane, Qld.. pp 150.
Liu, L. and Katsabanis, P. D., (1998) A numerical description
of the formation of a crater in rock blasting, CIM Bulletin,
Vol. 91, No. 1023, pp 75-81.
Mitchell, C.J., Mitchell, P., Pascoe, R.D., (2008). Quarry fines
minimisation: can we really have 10mm aggregate with no
fines? In: Scott, P.W., Walton, G. (Eds.), Proceedings of the
14th Extractive Industry Geology Conference. EIG Confe-
rences td, pp. 37–44.
Moser, P, (2005). Less Fines in aggregate and industrial min-
erals production - Results of an European research project, in
Proceedings 3rd
EFEE World Conference on Explosives and
blasting (Ed. R. Holmberg) pp 567-574
Onederra, I.; Esen, S.; Jankovic, A. (2004), Estimation of fines
generated by blasting – applications for the mining and quarrying in-
dustries Mining Technology, Volume 113, Number 4, , pp. 237-
247(11)
Ouchterlony, F. (2005a)., The Swebrec function: linking
fragmentation by blasting and crushing. Mining Technology
(Transactions of the Institute of Mining and Metallurgy A
114:A29-A44.
Ouchterlony, F, (2005b). What does the fragment size distri-
bution from blasting look like? in Proceedings 3rd
EFEE
World Conference on Explosives and Blasting (Ed:R Holm-
berg) pp 189-199 (EFEE: England).
Ouchterlony, F., (2011). Personal correspondence regarding
size distribution of fragment distribution in small scale blast-
ing. E-mail: [email protected]
Pascoe R.D, Mitchell C.J, Mitchell P. (2008) Quarry fines mi-
nimisation: Can we really have 10mm aggregate with no
fines? 14th Extractive Industry Geology Conference, Edin-
burgh, 14th - 17th Jun 2006, 2008, pages 37-44.
Shann, P.C., (2002) Stemming arrangement and method for
blast holes patent US006386111B1, May 14,.
Svahn, V, (2003). Generation of fines in bench blasting. Li-
centiate thesis, Department of Geology, Chalmers University
of Technology: Gothenburg.87 p
Scott, A., David, D., Alvarez, O. and Veloso, L. 1998. Manag-
ing Fines Generation in the Blasting and Crushing Operations
at Cerro Colorado Mine”. Mine to Mill Conference 1998,
Brisbane, Qld.
Rathore, S.S. and Bhandari, S. (2005), Controlled Fracture
Growth by Blasting While Protecting Damages to Remaining
Rock, Rock Mechanics and Rock Engineering, Springer,
Wien, December
Related Documents