This is a preprint version of the article. Find the published journal article at http://dx.doi.org/10.1016/j.csr.2012.01.009 1 Fine sediment transport model for river influenced microtidal shelf seas with application to the Thermaikos Gulf (NW. Aegean Sea) Katerina Kombiadou a , Yannis N. Krestenitis b a Laboratory of Maritime Engineering and Maritime Works, Civil Engineering Department, Aristotle University of Thessaloniki, 54124, Thessaloniki, Greece, e-mail: [email protected] b Laboratory of Maritime Engineering and Maritime Works, Civil Engineering Department, Aristotle University of Thessaloniki, 54124, Thessaloniki, Greece, e-mail: [email protected] Corresponding author: Katerina Kombiadou, Division of Hydraulics and Environmental Engineering, Civil Engineering Department, Aristotle University of Thessaloniki, University campus, 54124, Thessaloniki, Greece, tel.: +302310995877, fax: +302310995649, e-mail: [email protected] This is a preprint version of the article published in Continental Shelf Research 36 (2012) 41–62 (doi:10.1016/j.csr.2012.01.009) Please find the Published journal article at http://dx.doi.org/10.1016/j.csr.2012.01.009 Abstract Modelling the transport of fine sediments in the marine environment is a highly complex task with a broad field of application. Various processes take place and interact with one another to determine the movement of fine sedimentary particles in the aquatic domain. Amongst these processes stratification significantly affects the vertical propagation of a sedimentary plume, especially in areas of freshwater influence, with the possibility of matter entrapment and accumulation along the interface; this possibility is higher the finer the sedimentary matter is. The proposed modelling approach describes the physical processes that take place in the water column (advection, dispersion, coagulation, settling, effects of stratification), at the boundary of the seabed (benthic shear) and the mass- exchanges between the two (deposition, consolidation, resuspension, erosion). The Fine Sediment Transport Model was applied in the gulf of Thermaikos (NW Aegean Sea), an area of significant freshwater and riverine sediment inflow, considering the major rivers of the domain as sources of particulate matter. The results were, generally, in agreement with available in-situ measurements of suspended particulate matter. In cases of significant deviations between simulation and measurement, the source of the error did not lie within the modelling approach, but was due to the considered input parameters. The investigation revealed the existence of transport and sedimentation patterns related to the riverine source of the material and the individual parts of the gulf. The sedimentation rates were estimated at 18, 7 and 3 mm/y locally at the outflows of Aliakmon, Axios and Pinios respectively, while the areas of high sediment accumulation coincided with locations where the benthic material ranges from very fine to fine silt. Keywords: Cohesive sediment; modelling; Thermaikos gulf; river-borne sediment; sedimentation; stratification

Welcome message from author
This document is posted to help you gain knowledge. Please leave a comment to let me know what you think about it! Share it to your friends and learn new things together.
Transcript
This is a preprint version of the article. Find the published journal article at http://dx.doi.org/10.1016/j.csr.2012.01.009
1
Fine sediment transport model for river influenced microtidal shelf seas with application to the Thermaikos
Gulf (NW. Aegean Sea)
Katerina Kombiadoua, Yannis N. Krestenitisb a Laboratory of Maritime Engineering and Maritime Works, Civil Engineering Department, Aristotle University of Thessaloniki, 54124, Thessaloniki, Greece, e-mail: [email protected] b Laboratory of Maritime Engineering and Maritime Works, Civil Engineering Department, Aristotle University of Thessaloniki, 54124, Thessaloniki, Greece, e-mail: [email protected]
Corresponding author: Katerina Kombiadou, Division of Hydraulics and Environmental Engineering, Civil Engineering Department, Aristotle University of Thessaloniki, University campus, 54124, Thessaloniki, Greece, tel.: +302310995877, fax: +302310995649, e-mail: [email protected]
This is a preprint version of the article published in Continental Shelf Research 36 (2012) 41–62 (doi:10.1016/j.csr.2012.01.009)
Please find the Published journal article at http://dx.doi.org/10.1016/j.csr.2012.01.009
Abstract
Modelling the transport of fine sediments in the marine environment is a highly complex task with a broad field of application. Various processes take place and interact with one another to determine the movement of fine sedimentary particles in the aquatic domain. Amongst these processes stratification significantly affects the vertical propagation of a sedimentary plume, especially in areas of freshwater influence, with the possibility of matter entrapment and accumulation along the interface; this possibility is higher the finer the sedimentary matter is. The proposed modelling approach describes the physical processes that take place in the water column (advection, dispersion, coagulation, settling, effects of stratification), at the boundary of the seabed (benthic shear) and the mass-exchanges between the two (deposition, consolidation, resuspension, erosion). The Fine Sediment Transport Model was applied in the gulf of Thermaikos (NW Aegean Sea), an area of significant freshwater and riverine sediment inflow, considering the major rivers of the domain as sources of particulate matter. The results were, generally, in agreement with available in-situ measurements of suspended particulate matter. In cases of significant deviations between simulation and measurement, the source of the error did not lie within the modelling approach, but was due to the considered input parameters. The investigation revealed the existence of transport and sedimentation patterns related to the riverine source of the material and the individual parts of the gulf. The sedimentation rates were estimated at 18, 7 and 3 mm/y locally at the outflows of Aliakmon, Axios and Pinios respectively, while the areas of high sediment accumulation coincided with locations where the benthic material ranges from very fine to fine silt.
Keywords: Cohesive sediment; modelling; Thermaikos gulf; river-borne sediment; sedimentation; stratification
This is a preprint version of the article. Find the published journal article at http://dx.doi.org/10.1016/j.csr.2012.01.009
2
1. Introduction
The prognosis of the movement of fine sedimentary plumes in the marine environment is a highly complex task. The motion of the plumes is the result of interactions between the physical phenomena that control the propagation of sedimentary plumes, which extend from the microscale of the cohesive floc to the macroscale of the hydrodynamic domain. The field of application of such modelling mainly includes investigation of the processes of sediment transport and sedimentation in coastal areas from materials that enter the water column due to physical processes (i.e. sediment supply from rivers, physical erosion and aeolian transported dust) or anthropogenic activities (i.e. artificial erosion, disposal of dredged material). Indirectly, however, such prognoses also provide indications concerning the trophic state of the marine environment, due to the ability of sediments to confine the production zone of the water column through the increase of turbidity, on the one hand, and pollutants absorbed onto the aggregates’ surface (Eisma, 1993; Partheniades, 2009; Towner, 1993; Wang and Pinardi, 2002), on the other. These pollutants are gradually released to the marine environment and their kind varies and depends on the source of the material. Sediments, thus, affect primary production and the distribution of pollutants in the column and the seabed. In the case of riverine sediment supply, the potentially harmful materials related to cohesive sediments are, typically, nutrients (mainly nitrates), originating from drainage of agricultural activities, or even toxic substances in cases of areas affected by industrial residues. Moreover, deposited heavy metals can enter the water column through erosion of the seabed, while iron and nutrients can be introduced to the marine environment from the atmosphere during settling of aeolian transported dust (Guerzoni et al., 1999). Thus, the simulation of the transport of fine-grained matter in the aquatic environment also provides indirect information regarding the transport of pollutants that are associated with these sedimentary materials. Furthermore, phytoplanktonic cells can be entrapped in cohesive flocculates during coagulation of fine sedimentary matter in estuarine areas; this would lead to their removal from suspension through settling and their potential death (Beaulieu et al., 2005).
Therefore, the transport of cohesive sediments in coastal and deltaic areas has significant impacts on both the economy, in fields related to the coastal zone, like navigation, tourism, aquiculture, etc and on the quality of the marine environment, since the inflow of fine-grained materials can affect the trophic state, the primary production and the level of hazardous substances in the water column. Consequently, the knowledge of the transport of fine sedimentary plumes in the marine environment is of great interest and, at the same time, the plumes’ movement is the result of the combined effects and interactions of various physical processes. Conducting laboratory experiments for the case of fine sediments is practically unfeasible, due to downscaling issues, but also due to their high cost. The cost of in-situ measurements for long-term monitoring projects is even greater and cannot address the need for forecast of the sediment distribution in the field. The employment of mathematical models, with the collaboration of in-situ measurements for calibration and validation, enables the study of this kind of complex phenomena (Toorman, 2001).
Circulation determines the transport of particulate matter in the marine environment through advection and dispersion; the shear of the flow in the column affects the process of coagulation and settling, while the benthic shear controls the removal of matter from suspension and the mobilisation of sediment from the bed. The vertical movement of fine suspended sediments is highly affected by the stratification of the water column (Scully and Friedrichs, 2003) that can lead to sedimentary plumes with significantly reduced gravitational acceleration (Lewis, 1997). The Stokes’ settling velocity is insufficient to describe the outflow of mass from most riverine plumes (McCool and Parsons, 2004). In cases of stratification due to salinity gradients, which applies in most deltaic areas, the ambient stratification can attenuate the particles’ setting velocity, as well as their vertical dispersion, resulting to the accumulation of particles along the halocline, until the area becomes gravitationally unstable (Chen, 1997; Parsons et al., 2001). Recent experimental studies demonstrated that even in cases that the density profile of the water column corresponds to stable conditions, with values increasing with depth, the hydrostatic stability of the system is not guaranteed (Kunze, 2003; Malashetty and Gaikward, 2002; Sorkin et al., 2002), since inhomogeneities in the density field can lead to transporting water masses that initiate a process of matter-removal from suspension.
These considerations were taken into account for the formulation of the Fine Sediment Transport Model (FSTM); this paper focuses on the presentation of FSTM regarding the main parameterisations used, the structure and the effectiveness of the model to reproduce the physical phenomena that control the fate of fine particulate matter in the marine environment. FSTM was applied in a microtidal gulf of the eastern Mediterranean Sea (Thermaikos Gulf in the NW Aegean Sea) that receives significant amounts of freshwater and riverine fine sediment inflow. Results from two simulations are compared with available in-situ measurements of suspended particulate matter concentrations, aiming at the validation of the proposed modelling approach. These simulations are also used to investigate and discuss sediment transport and deposition patterns in the gulf and the driving mechanisms that control them.
This is a preprint version of the article. Find the published journal article at http://dx.doi.org/10.1016/j.csr.2012.01.009
3
The characteristics of Thermaikos gulf related to morphology, freshwater and river-borne sediment input, hydrodynamics and grain size distribution are presented in the following (section 2). Section 3 includes the presentation of FSTM in terms of mathematical expressions, structure and input parameters. Modelling results from two simulation periods are presented and discussed in section 4 and the conclusions of the present work are drawn in section 5. Finally, the effectiveness of the parameterization of the effects of stratification to the vertical movement of sedimentary plumes is tested using in-situ measurements of physical parameters from Thermaikos and through sensitivity experiments that are presented in the two appendices of the paper.
2. Characteristics of the application area (Thermaikos Gulf)
2.1 Morphological and hydrological features
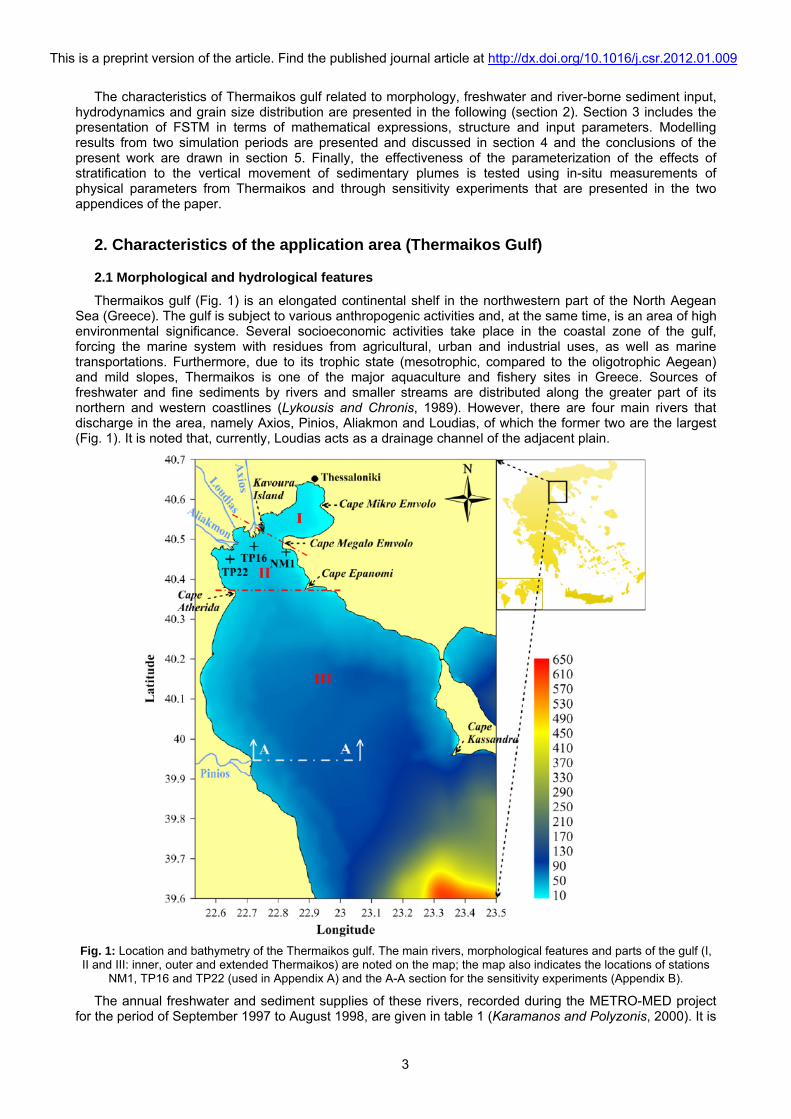
Thermaikos gulf (Fig. 1) is an elongated continental shelf in the northwestern part of the North Aegean Sea (Greece). The gulf is subject to various anthropogenic activities and, at the same time, is an area of high environmental significance. Several socioeconomic activities take place in the coastal zone of the gulf, forcing the marine system with residues from agricultural, urban and industrial uses, as well as marine transportations. Furthermore, due to its trophic state (mesotrophic, compared to the oligotrophic Aegean) and mild slopes, Thermaikos is one of the major aquaculture and fishery sites in Greece. Sources of freshwater and fine sediments by rivers and smaller streams are distributed along the greater part of its northern and western coastlines (Lykousis and Chronis, 1989). However, there are four main rivers that discharge in the area, namely Axios, Pinios, Aliakmon and Loudias, of which the former two are the largest (Fig. 1). It is noted that, currently, Loudias acts as a drainage channel of the adjacent plain.
Fig. 1: Location and bathymetry of the Thermaikos gulf. The main rivers, morphological features and parts of the gulf (I, II and III: inner, outer and extended Thermaikos) are noted on the map; the map also indicates the locations of stations
NM1, TP16 and TP22 (used in Appendix A) and the A-A section for the sensitivity experiments (Appendix B).
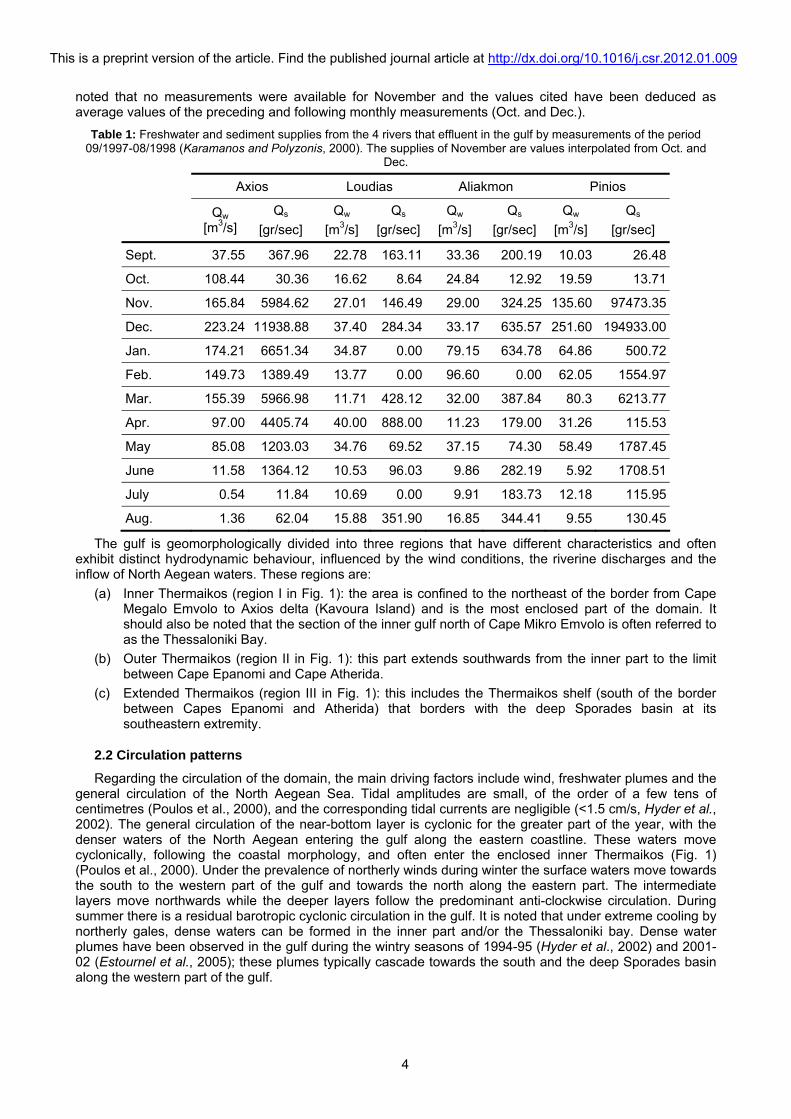
The annual freshwater and sediment supplies of these rivers, recorded during the METRO-MED project for the period of September 1997 to August 1998, are given in table 1 (Karamanos and Polyzonis, 2000). It is
This is a preprint version of the article. Find the published journal article at http://dx.doi.org/10.1016/j.csr.2012.01.009
4
noted that no measurements were available for November and the values cited have been deduced as average values of the preceding and following monthly measurements (Oct. and Dec.).
Table 1: Freshwater and sediment supplies from the 4 rivers that effluent in the gulf by measurements of the period 09/1997-08/1998 (Karamanos and Polyzonis, 2000). The supplies of November are values interpolated from Oct. and
Dec.
Axios Loudias Aliakmon Pinios
Qw
[m3/s] Qs
[gr/sec]
Qw
[m3/s]
Qs
[gr/sec]
Qw
[m3/s]
Qs
[gr/sec]
Qw
[m3/s]
Qs
[gr/sec]
Sept. 37.55 367.96 22.78 163.11 33.36 200.19 10.03 26.48
Oct. 108.44 30.36 16.62 8.64 24.84 12.92 19.59 13.71
Nov. 165.84 5984.62 27.01 146.49 29.00 324.25 135.60 97473.35
Dec. 223.24 11938.88 37.40 284.34 33.17 635.57 251.60 194933.00
Jan. 174.21 6651.34 34.87 0.00 79.15 634.78 64.86 500.72
Feb. 149.73 1389.49 13.77 0.00 96.60 0.00 62.05 1554.97
Mar. 155.39 5966.98 11.71 428.12 32.00 387.84 80.3 6213.77
Apr. 97.00 4405.74 40.00 888.00 11.23 179.00 31.26 115.53
May 85.08 1203.03 34.76 69.52 37.15 74.30 58.49 1787.45
June 11.58 1364.12 10.53 96.03 9.86 282.19 5.92 1708.51
July 0.54 11.84 10.69 0.00 9.91 183.73 12.18 115.95
Aug. 1.36 62.04 15.88 351.90 16.85 344.41 9.55 130.45
The gulf is geomorphologically divided into three regions that have different characteristics and often exhibit distinct hydrodynamic behaviour, influenced by the wind conditions, the riverine discharges and the inflow of North Aegean waters. These regions are:
(a) Inner Thermaikos (region I in Fig. 1): the area is confined to the northeast of the border from Cape Megalo Emvolo to Axios delta (Kavoura Island) and is the most enclosed part of the domain. It should also be noted that the section of the inner gulf north of Cape Mikro Emvolo is often referred to as the Thessaloniki Bay.
(b) Outer Thermaikos (region II in Fig. 1): this part extends southwards from the inner part to the limit between Cape Epanomi and Cape Atherida.
(c) Extended Thermaikos (region III in Fig. 1): this includes the Thermaikos shelf (south of the border between Capes Epanomi and Atherida) that borders with the deep Sporades basin at its southeastern extremity.
2.2 Circulation patterns
Regarding the circulation of the domain, the main driving factors include wind, freshwater plumes and the general circulation of the North Aegean Sea. Tidal amplitudes are small, of the order of a few tens of centimetres (Poulos et al., 2000), and the corresponding tidal currents are negligible (<1.5 cm/s, Hyder et al., 2002). The general circulation of the near-bottom layer is cyclonic for the greater part of the year, with the denser waters of the North Aegean entering the gulf along the eastern coastline. These waters move cyclonically, following the coastal morphology, and often enter the enclosed inner Thermaikos (Fig. 1) (Poulos et al., 2000). Under the prevalence of northerly winds during winter the surface waters move towards the south to the western part of the gulf and towards the north along the eastern part. The intermediate layers move northwards while the deeper layers follow the predominant anti-clockwise circulation. During summer there is a residual barotropic cyclonic circulation in the gulf. It is noted that under extreme cooling by northerly gales, dense waters can be formed in the inner part and/or the Thessaloniki bay. Dense water plumes have been observed in the gulf during the wintry seasons of 1994-95 (Hyder et al., 2002) and 2001-02 (Estournel et al., 2005); these plumes typically cascade towards the south and the deep Sporades basin along the western part of the gulf.
This is a preprint version of the article. Find the published journal article at http://dx.doi.org/10.1016/j.csr.2012.01.009
5
2.3 Sediment grain-size distribution
The surface sediments of Thermaikos are of terrigenous origin (Poulos, 2009) and range from mud to sandy mud in the northern and western areas of the domain, while the eastern part of the continental shelf is occupied by coarser sediments that are classified as sandy mud (Karageorgis and Anagnostou, 2001). These sandy deposits are characterised as relict sands, deposited during the last glacial period (Poulos, 2009; Karageorgis and Anagnostou, 2001; Lykousis and Chronis, 1989). Sedimentation in the inner and western parts of the gulf is largely controlled by freshwater and sediment fluxes (Poulos et al., 2000) and the accumulation of the finer fraction along the northern and western parts of the gulf indicates that deposition is mainly affected by the proximity of the location to the riverine sources, the general circulation and the topography of Thermaikos (Karageorgis and Anagnostou, 2001; Lykousis et al., 1981). The depositional trends of fine sediment from the 4 rivers of the area are also investigated by the results of FSTM and more discussion on the subject is provided in section 4 (paragraph 4.1.2).
3. Model description and input data
3.1 General
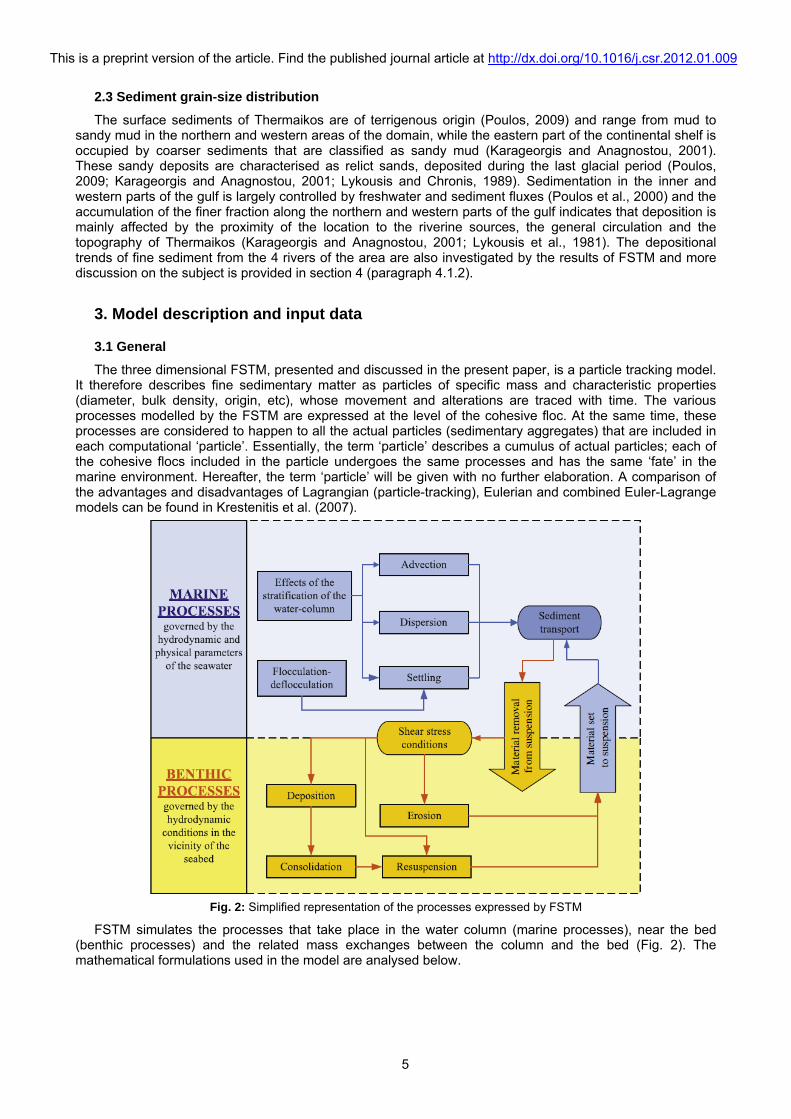
The three dimensional FSTM, presented and discussed in the present paper, is a particle tracking model. It therefore describes fine sedimentary matter as particles of specific mass and characteristic properties (diameter, bulk density, origin, etc), whose movement and alterations are traced with time. The various processes modelled by the FSTM are expressed at the level of the cohesive floc. At the same time, these processes are considered to happen to all the actual particles (sedimentary aggregates) that are included in each computational ‘particle’. Essentially, the term ‘particle’ describes a cumulus of actual particles; each of the cohesive flocs included in the particle undergoes the same processes and has the same ‘fate’ in the marine environment. Hereafter, the term ‘particle’ will be given with no further elaboration. A comparison of the advantages and disadvantages of Lagrangian (particle-tracking), Eulerian and combined Euler-Lagrange models can be found in Krestenitis et al. (2007).
Fig. 2: Simplified representation of the processes expressed by FSTM
FSTM simulates the processes that take place in the water column (marine processes), near the bed (benthic processes) and the related mass exchanges between the column and the bed (Fig. 2). The mathematical formulations used in the model are analysed below.
This is a preprint version of the article. Find the published journal article at http://dx.doi.org/10.1016/j.csr.2012.01.009
6
3.2 Marine processes
Based on the random walk method, the three-dimensional (x, y and z) displacement of a particle (i) is:
,
ii i
ii i
ii s i w i Kv
dxu u
dtdy
v vdtdz
w w F w Fdt
(1)
In the former set of equations, the right hand side includes the deterministic and stochastic (fluctuating) displacements that express advection and dispersion, respectively. The terms in brackets are the seawater velocities at the location of the particle; the particle’s settling velocity (ws,i) also participates to the vertical constituent of the deterministic displacement. The fluctuating components are defined by the corresponding horizontal and vertical dispersion coefficients (KH and KV, respectively), following the equation:
61,1
61,1
Hi i
Vi
Ku v rnd
dt
Kw rnd
dt
(2)
where rnd[-1,1] is a random number that ranges from -1 to +1. Horizontal dispersion was modelled using the Smagorinski formula (Mellor, 1996). The vertical dispersion coefficient, KV, is defined by the values of the horizontal coefficient, KH, and the ratio of the vertical to the horizontal discretisation (O’ Brien, 1986):
2 22
2
1
2i i i i
H
V H
u v u vK C dx dy
x x y y
dzK K
dx dy
(3)
FW and FKv in the equation of vertical movement of the particle (last formula in eqs. 1) are the deterministic and stochastic momentum damping functions. These functions express the effects of the stability of the stratification of the water column to the vertical propagation of sedimentary plumes and are based on the theory of double diffusion, through the stability ratio parameter (Rp); Rp, is the quotient of the gradient of the stabilising physical parameter (T or S) to the gradient of the destabilising one, expressed in units of density:
salt fingering
diffusive layering
1 1
p
w w
w w
Tz
SzR
Sz
Tz
T S
(4)
Where ρw is the seawater density, α is the thermal expansion coefficient and β is the haline contraction coefficient. As indicated by eq. 4, in cases of a warm, salty layer overlying a colder and fresher one (stratification prone to salt fingering instability) the ratio equals the thermal to the haline contributions to the density profile. The opposite holds in cases of a cool and fresh layer that overlies a warmer and saltier (stratification prone to diffusive layering instability).
The susceptibility of the column to diffusive instabilities increases with decreasing values of Rp, (and vice versa) down to the value of 1, for which the stratification destabilises rapidly. Therefore, high values of the stability ratio express high gravitational stability of the column (Kerr and Kuiper, 1997; Schmid et al., 2004; Yoshida and Nagashima, 2003). Double diffusive instabilities occur within the range 1<Rp<10 (Kelley et al., 2003; Schladow et al., 1992; Schmid et al., 2004), while flows characterised by Rp≥10 are highly stable, with
This is a preprint version of the article. Find the published journal article at http://dx.doi.org/10.1016/j.csr.2012.01.009
7
settling rates of fine sedimentary plumes of the order of a few centimetres per hour (Schladow et al., 1992). Based on the above, the threshold value of Rp=10 was chosen as the criterion for inhibition of double diffusive instabilities and, therefore, for the indication of a highly stable column. It should be noted that the validity of this critical value for the stability ratio was tested using field measurements of salinity, temperature and density from monitoring stations in the Thermaikos gulf (presented in Appendix A). The investigation showed that the stability ratio is highly correlated with the Brunt Väisälä frequency:
g d
Ndz
(5)
The stability ratio is used in the FSTM as an indicator for the locations of strong stratification in the column. In these locations the vertical deterministic and stochastic displacements are damped through the equations FW and FKv, respectively:
1 , 10 0.18
,0.91 , 10
p
δw
p p
R γF
δγR R
(6)
1 , 10
, 0.03exp , 10
p
Kvp p
RF κ
κ R R
(7)
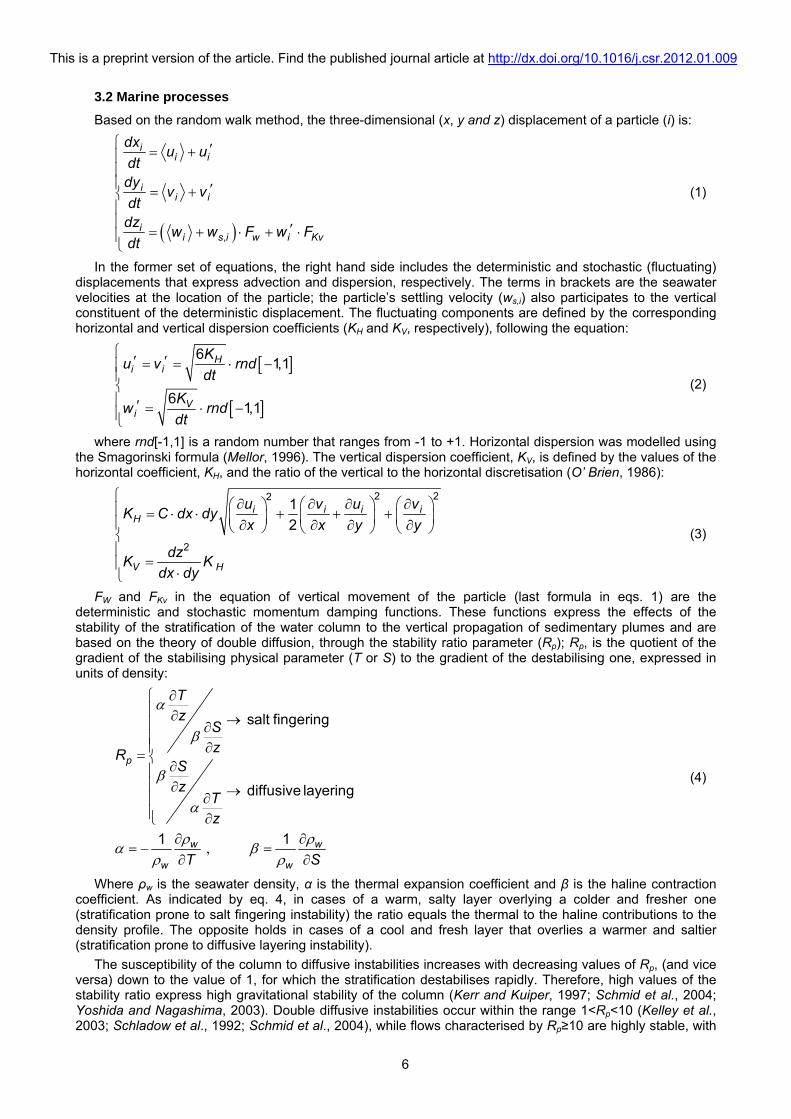
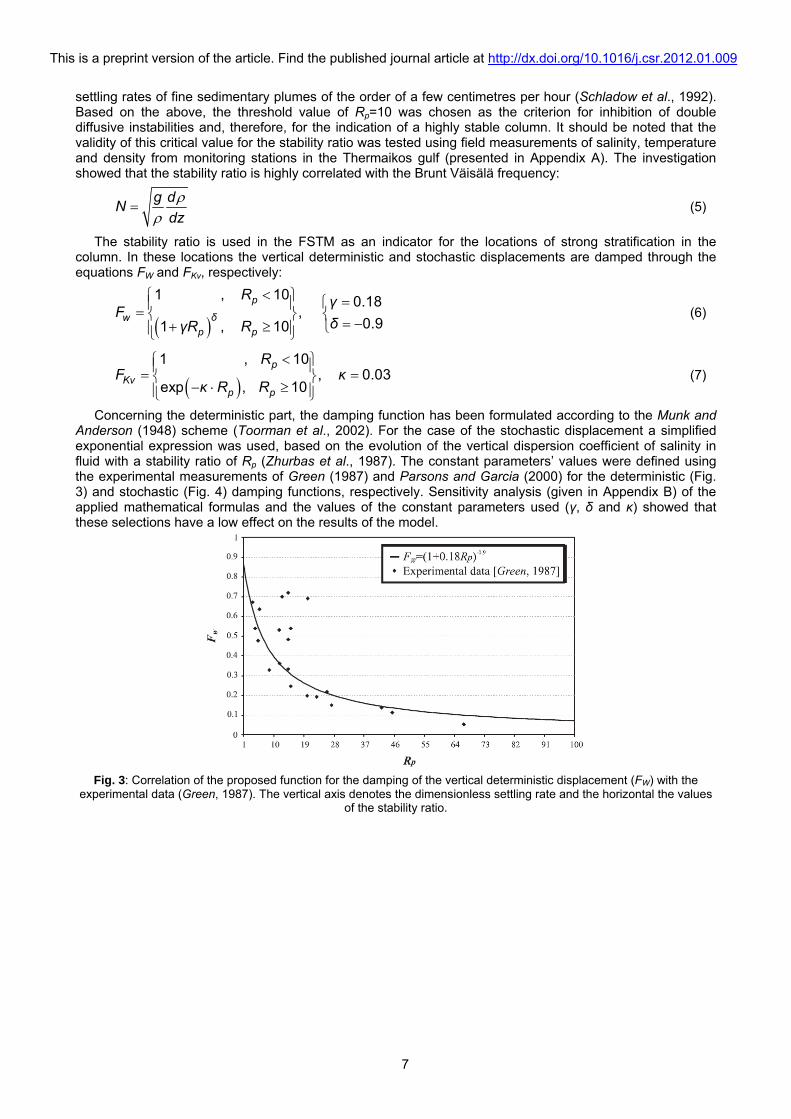
Concerning the deterministic part, the damping function has been formulated according to the Munk and Anderson (1948) scheme (Toorman et al., 2002). For the case of the stochastic displacement a simplified exponential expression was used, based on the evolution of the vertical dispersion coefficient of salinity in fluid with a stability ratio of Rp (Zhurbas et al., 1987). The constant parameters’ values were defined using the experimental measurements of Green (1987) and Parsons and Garcia (2000) for the deterministic (Fig. 3) and stochastic (Fig. 4) damping functions, respectively. Sensitivity analysis (given in Appendix B) of the applied mathematical formulas and the values of the constant parameters used (γ, δ and κ) showed that these selections have a low effect on the results of the model.
Fig. 3: Correlation of the proposed function for the damping of the vertical deterministic displacement (FW) with the
experimental data (Green, 1987). The vertical axis denotes the dimensionless settling rate and the horizontal the values of the stability ratio.
This is a preprint version of the article. Find the published journal article at http://dx.doi.org/10.1016/j.csr.2012.01.009
8
Fig. 4: Correlation of the proposed function for the damping of the vertical stochastic displacement (FKv) with the experimental data (Parsons and Garcia, 2000). The vertical axis denotes the dimensionless settling rate and the
horizontal the values of the stability ratio.
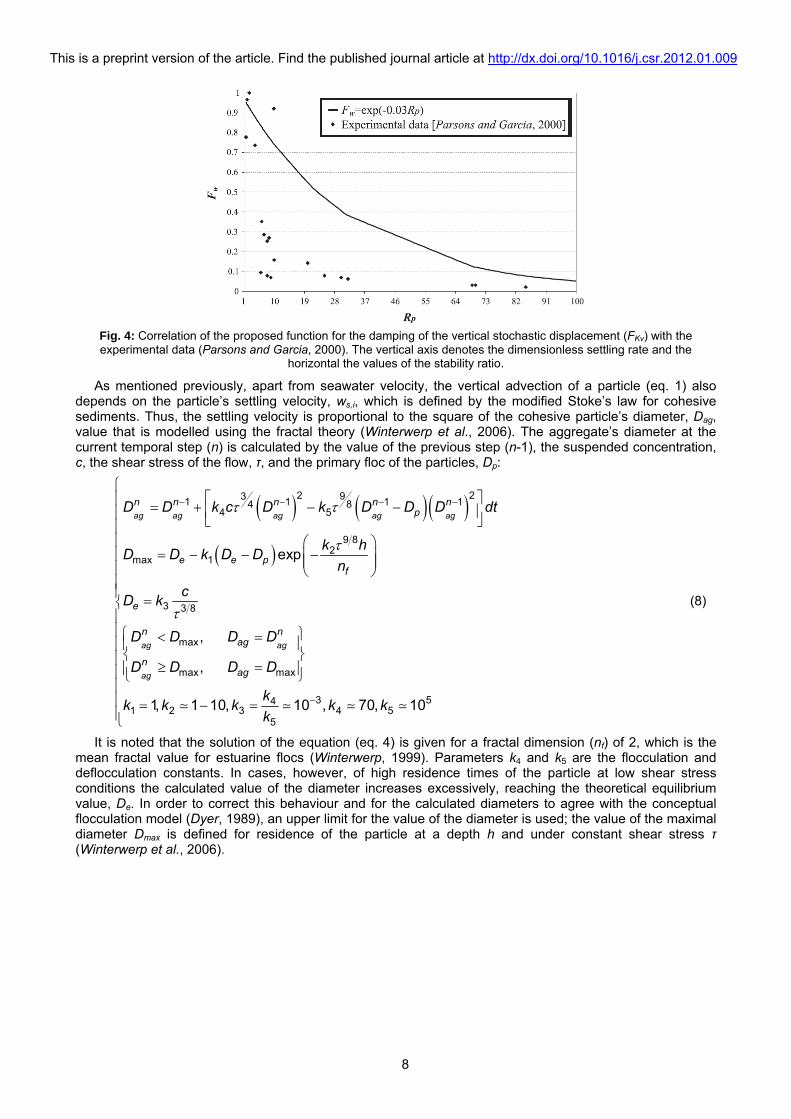
As mentioned previously, apart from seawater velocity, the vertical advection of a particle (eq. 1) also depends on the particle’s settling velocity, ws,i, which is defined by the modified Stoke’s law for cohesive sediments. Thus, the settling velocity is proportional to the square of the cohesive particle’s diameter, Dag, value that is modelled using the fractal theory (Winterwerp et al., 2006). The aggregate’s diameter at the current temporal step (n) is calculated by the value of the previous step (n-1), the suspended concentration, c, the shear stress of the flow, τ, and the primary floc of the particles, Dp:
2 2931 1 1 1844 5
9 82
max 1
3 3 8
max
max max
341 2 3 4 5
5
exp
,
,
1, 1 10, 10 , 70, 10
ag ag ag ag ag
ag ag
ag
n n n n np
e e pf
e
n nag
nag
D D k c D k D D D dt
k hD D k D D
n
cD k
D D D D
D D D D
kk k k k k
k
5
(8)
It is noted that the solution of the equation (eq. 4) is given for a fractal dimension (nf) of 2, which is the mean fractal value for estuarine flocs (Winterwerp, 1999). Parameters k4 and k5 are the flocculation and deflocculation constants. In cases, however, of high residence times of the particle at low shear stress conditions the calculated value of the diameter increases excessively, reaching the theoretical equilibrium value, De. In order to correct this behaviour and for the calculated diameters to agree with the conceptual flocculation model (Dyer, 1989), an upper limit for the value of the diameter is used; the value of the maximal diameter Dmax is defined for residence of the particle at a depth h and under constant shear stress τ (Winterwerp et al., 2006).
This is a preprint version of the article. Find the published journal article at http://dx.doi.org/10.1016/j.csr.2012.01.009
9
3.3 Benthic processes
The processes taking place at the level of the bed are largely controlled by the local shear. The stress at the marginal grid cell of the bed (km) is calculated taking into consideration the possibility of density gradients existing near the bed. At the same time the velocity gradient is defined explicitly, by the velocity profile (Krestenitis et al., 2007):
2
13
1 2
1 100
3 4
2
b w
tkm
t
km km km
km
u
Uu F z
z
F Ri
U U UU
z dz
(9)
In the above set of equations, U is the horizontal velocity (resultant of u and v), κ the Von Karman constant and Ri the gradient Richardson number.
Reaching the marginal grid of the bed, in cases when the shear stress is less than the critical value τcr,dep, defined with respect to the particle’s settling velocity for particle deposition, the particles can deposit onto the bed. (Krestenitis et al., 2007):
2, ,
5
5 4,
4
0.008 , 5 10
0.008 0.02 log 4.3 ,5 10 5 10
0.028 , 5 10
cr dep w cr dep
s
cr dep s s
s
u
w
u w w
w
(10)
After depositing onto the seabed, the process of shelf-weight consolidation begins. During this process, the critical shear stress for particle resuspension, τcr,res, is considered to evolve exponentially with the time the particle remains in deposition (td):
, , , , 1 expcr res cr dep cr er cr dep dn t (11)
Therefore, the critical value for resuspension of a deposited particle ranges between the corresponding values for deposition (τcr,dep) and erosion (τcr,er), at the temporal points of particle deposition (td=0) and after full consolidation (td=tfc), respectively. The constant n [T-1] depends on the time considered for full consolidation of a particle (tfc) and its theoretical value is:
lim exp 0dt td fc
n t n (12)
Accepting an approximation of 0 to the third decimal point as sufficient, the exponential term gives the following value for the consolidation rate constant, n:
17exp 0 0.001 [ ]fc
fc
n t n Tt
(13)
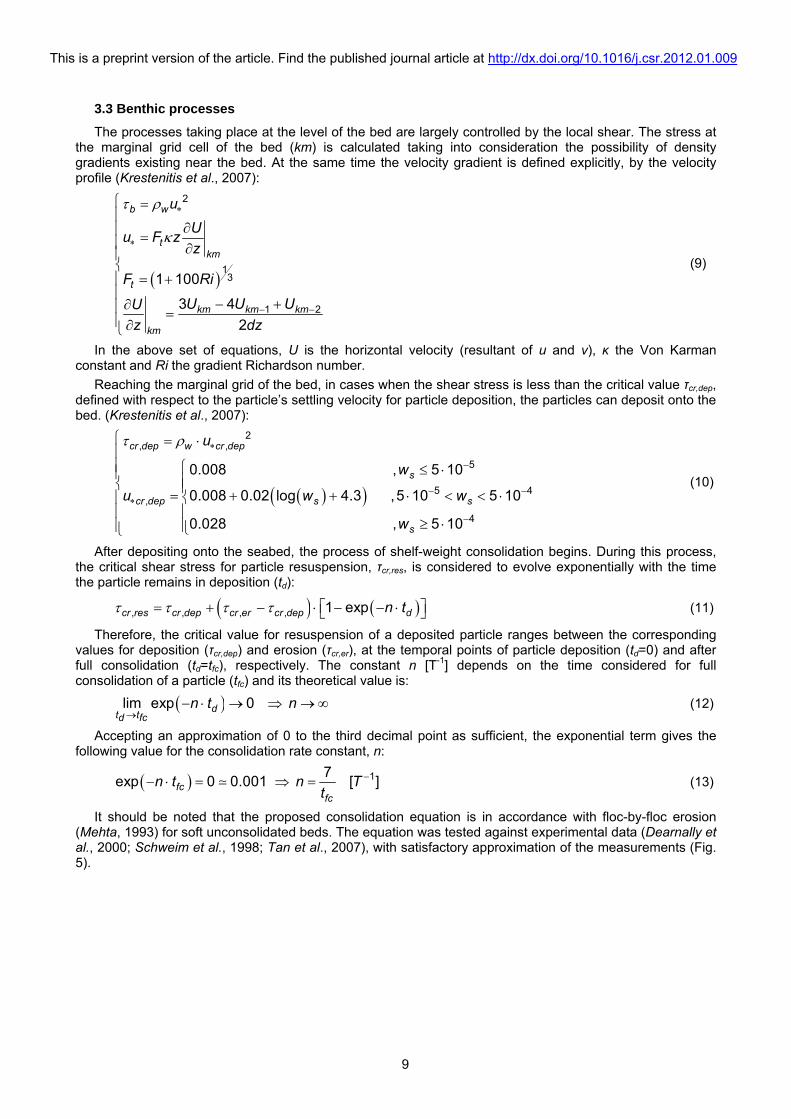
It should be noted that the proposed consolidation equation is in accordance with floc-by-floc erosion (Mehta, 1993) for soft unconsolidated beds. The equation was tested against experimental data (Dearnally et al., 2000; Schweim et al., 1998; Tan et al., 2007), with satisfactory approximation of the measurements (Fig. 5).
This is a preprint version of the article. Find the published journal article at http://dx.doi.org/10.1016/j.csr.2012.01.009
10
Fig. 5: Comparison of the consolidation equation with the experimental data of Schweim et al., (1998), Tan et al., (2007)
and Dearnally et al. (2000).
For the erosion of cohesive, consolidated beds, the hypothesis of homogenous bed was adopted:
,
,
b cr erM
cr er
(14)
The related critical shear stress, τcr,er, and erosion rate constant, εΜ, values are usually determined experimentally. Various factors affect the values of these parameters, ranging from the characteristics of the bed (mud fraction, structure, stress history, biological activity etc) to the measurement method (in-situ or laboratory) and the instrumentation used. In the absence of widely applicable mathematical formulae, mean values have been considered for these parameters (Krestenitis et al., 2007).
3.4 Boundary conditions
Two types of boundary conditions are used by FSTM; reflection is applied at the surface, the bed and ‘dry’ grid cells and radiation at the open boundaries of the domain. More specifically, the particles are reflected to their previous vertical position in cases when buoyant forces lead them to positions over the free surface (in the atmosphere). Particles that reach the seabed and cannot deposit due to shear conditions are also reflected in the vertical sense. In cases when the horizontal movement of a particle leads it to a ‘dry’ cell (land), the particle is reflected in one or both horizontal directions. If a particle is led to locations outside the domain though an open boundary, the particle is allowed to escape the field towards the open sea and is excluded from the following computational cycles.
3.5 Domain of application
FSTM was applied in the extended Thermaikos gulf, in an aquatic domain that extends southwards to latitude 39°36’N and eastwards to longitude 23°30’E. The bathymetry reaches depths of approximately 650 m at the borders of the deep Sporades Basin (Fig. 1). The computational grid is horizontally curvilinear, with a horizontal spacing of dx=dy=1/60° and a fixed vertical step of dz=2 m. It should be noted that the effect of waves was not taken into account by the simulations, since at the applied level of discretisation (minimal depths ~20m) the wave influence is negligible.
3.6 Input data
Sediment supplies, seawater velocities (u, v) and physical parameters (S, T) are input variables of FSTM. The considered input sediment time-series are provided below, along with information regarding the North Aegean Sea (NAS) hydrodynamic model (Kourafalou and Tsiaras, 2007) that was used for the circulation-related (u, v, S, T) input data of FSTM.
3.6.1 Input sediment supplies
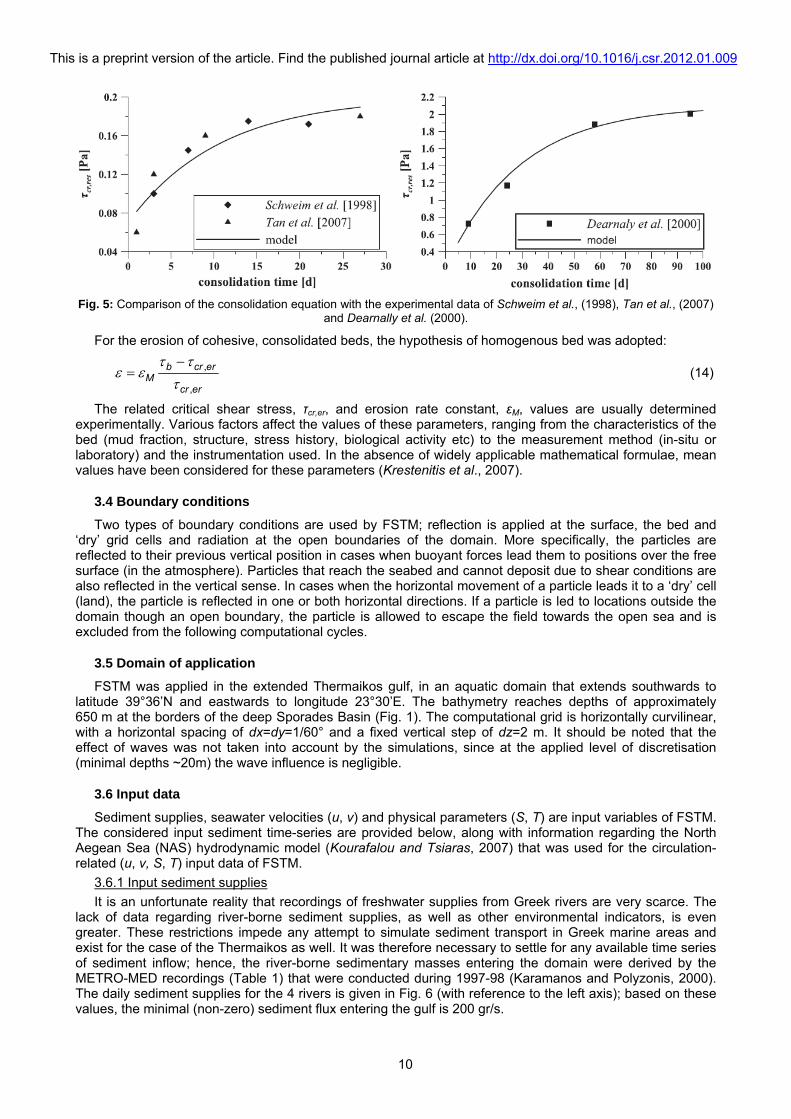
It is an unfortunate reality that recordings of freshwater supplies from Greek rivers are very scarce. The lack of data regarding river-borne sediment supplies, as well as other environmental indicators, is even greater. These restrictions impede any attempt to simulate sediment transport in Greek marine areas and exist for the case of the Thermaikos as well. It was therefore necessary to settle for any available time series of sediment inflow; hence, the river-borne sedimentary masses entering the domain were derived by the METRO-MED recordings (Table 1) that were conducted during 1997-98 (Karamanos and Polyzonis, 2000). The daily sediment supplies for the 4 rivers is given in Fig. 6 (with reference to the left axis); based on these values, the minimal (non-zero) sediment flux entering the gulf is 200 gr/s.
This is a preprint version of the article. Find the published journal article at http://dx.doi.org/10.1016/j.csr.2012.01.009
11
Assuming that new particles are introduced to the flow every 6 hours the typical particle mass used in FSTM was set to 4320 kg. The corresponding temporal evolution of particles entering the domain is plotted by the same curves (Fig. 6), with reference to the right axis. It should be noted that the effect of the selected typical mass (4320 kg) on the results of FSTM was investigated through two experimental simulations of the same conditions (Krestenitis et al., 2007). More specifically, the same input data time-series (hydrodynamic data and sediment supplies) were used in these simulations, but the selected particle mass was different. The one simulation considered particle mass equal to 4320 kg and the other 1440 kg, that is equal to the mass considered in the present paper and 1/3 of this value. The results of the 2 experiments varied insignificantly regarding the distribution of particulate matter in the domain and, therefore, the selection of 4320 kg was considered appropriate for the case of the river-borne sediments entering the domain of the Thermaikos. Regarding the characteristic diameter of the river-borne matter, the value of 3 μm was selected, since the riverine material is characterised as very fine silt and clay (Kourafalou et al., 2004), thus ranging from 2 to 3.9 μm (McLane, 1995).
Fig. 6: Time-series of daily sediment supplies [gr/s] (left axis) and inflowing particles (right axis) from the 4 rivers
affecting the Thermaikos gulf.
3.6.2 Hydrodynamic input data
The input hydrodynamic data required by FSTM include seawater velocities (u and v) and physical parameters (S and T); these data were obtained by the North Aegean Sea (NAS) model (Kourafalou and Tsiaras, 2007). The NAS model is a high resolution, sigma-coordinate, free surface, hydrodynamic model (dx=dy=1/60°, 25 vertical sigma-levels), which is based on the Princeton Ocean Model (POM). NAS is one-way nested to the coarser (1/30° by 1/30°) intermediate Aegean Levantine Eddy Resolving Model (ALERMO, Sofianos et al., 2006), receiving both initial and boundary conditions.
The horizontal resolution and grid of FSTM and NAS are the same; in the vertical direction, the transition from the sigma coordinates of NAS to the Cartesian coordinates of FSTM is performed using appropriate transformations and linear interpolations. It should be noted that the vertical seawater velocity (w) is derived by the corresponding values of the horizontal velocities and applying the mass conservation principle for each cell of the FSTM grid; at the surface the no-slip condition is applied, since FSTM does not take into account free surface elevation.
4. Results and Discussion
Two different periods were simulated by the FSTM in terms of different hydrodynamic input data (obrtained from NAS); these include the Perpetual Year (PY) and the period from September 3rd, 2001 to August 31st, 2002 (S01A02). The PY input data were derived by forcing of NAS with historical, climatological input data, whereas for the S01A02 run NAS used atmospheric input data from the POSEIDON system (Papadoloulos et al., 2002; Soukissian et al., 2002). Results from these simulations are presented and discussed in the following sections.
It should be restated that the same time-series of river-borne sedimentary masses (Fig. 6) was used for both PY and S01A02, since no other data are available. Initial conditions of the simulations were that of zero suspended and deposited matter in the domain. Naturally, the time step selected for the simulations (dt=720 s) ensures the conservation of mass in the simulations.
This is a preprint version of the article. Find the published journal article at http://dx.doi.org/10.1016/j.csr.2012.01.009
12
4.1 PY results
The hydrodynamic input data of PY (Kourafalou and Tsiaras, 2007) are based on climatological forcing conditions and, essentially, represent the typical circulation conditions of the gulf. Therefore the results of PY provide an overview regarding the ‘typical’ seasonal variability of fine sediment in the Thermaikos gulf. Based on the above, PY was selected for the investigation of transport and sedimentation patterns in the gulf with respect to the riverine origin of matter and for the determination of sedimentation rates (section 4.1.2); comparison of the PY results with field measurements is presented in the following section.
4.1.1 Comparison with in-situ data
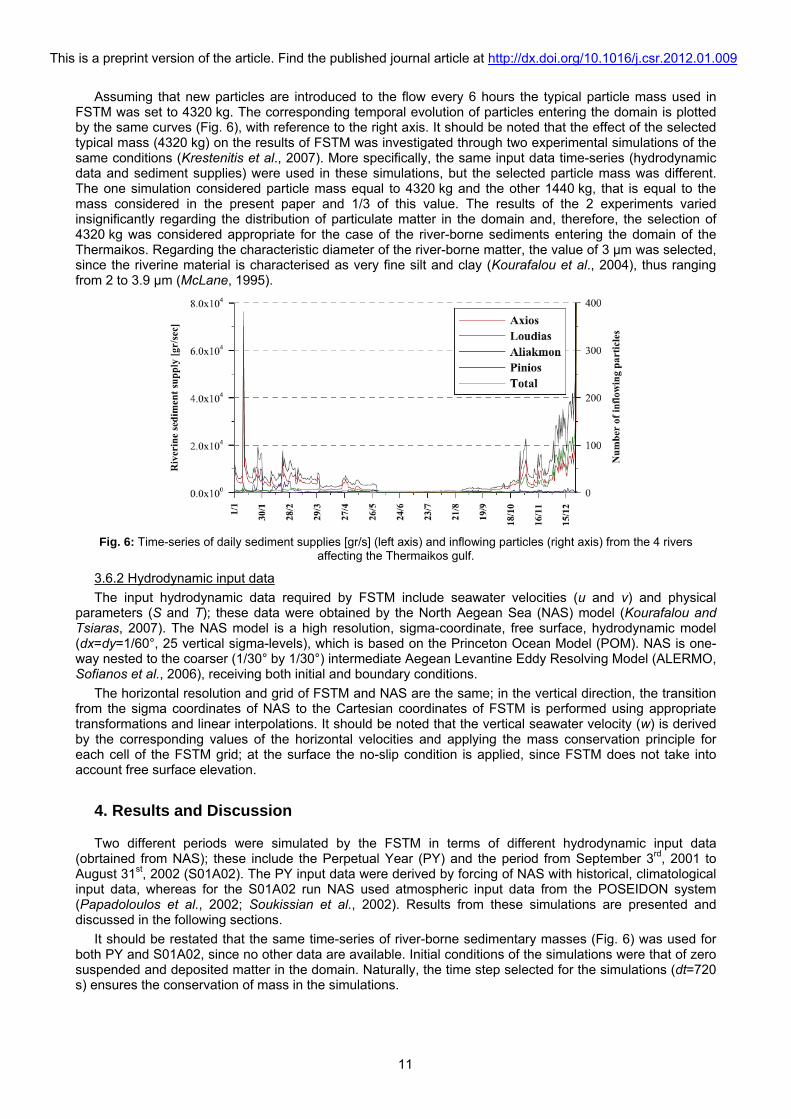
In the framework of the METRO-MED project, four oceanographic surveys were conducted (05/97, 07/97, 02/98 and 09/98), during which Suspended Particulate Matter (SPM) concentrations were defined after water sampling in a network of 70 stations. The recorded Surface Nefeloid Layer (SNL) and Bottom Nefeloid Layer (BNL) concentrations during these 4 surveys are presented in Fig. 7 (Karageorgis and Anagnostou, 2003); given that the sediment inflow used in FSTM simulations (Fig. 6) is based on recordings of the same project and in lack of specific circulation data for the period in question (1997-98), these in-situ measurements were compared with simulated concentrations of PY (Fig. 8). It can be noted that the morphology of the simulated SNL and BNL concentrations is generally close to the corresponding measured values; the maximal concentrations are in agreement with the ones cited by Karageorgis and Anagnostou (2003), in terms of location and value. However there are locations in the domain where the in-situ measurements and FSTM outputs present differences, which are discussed below. In order to avoid repetitive citations in the text, it is noted that all measured values cited in the following part of the present section are after Karageorgis and Anagnostou (2003).
Fig. 7: SNL and BNL concentrations from four oceanographic surveys during the METRO-MED project framework: May
1997 (a and e), July 1997 (b and f), February 1998 (c and g) and September 1998 (d and f), after Karageorgis and Anagnostou (2003) (Reproduced by permission of the American Geophysical Union).
Regarding spring conditions (May 1997), FSTM effectively predicts the SNL distribution near the mouths of Axios and Aliakmon (Figs. 7a and 8a), with maximal values of the order of 6 mg/lt south of Aliakmon; the expansion of the SNL plume reaches the eastern coastline of Thermaikos and enters the inner gulf (region I in Fig. 1) in both distributions. FSTM did not predict SNL formation in the Thessaloniki Bay (north of Cape Mikro Emvolo), which could, however, be attributed to surficial outflows from the urban and suburban areas. The maximal concentrations off Pinios (3.2 mg/lt) closely approximate the measured ones (3.5 mg/lt), but with the simulated plume in the location presenting substantially lower expansion; the southward expansion of the plume is also clearly underestimated by the model. Concerning the BNL distribution (Figs. 7e and 8e), it can be noted that the morphology of the simulated formation is close to that of the actual measurements; the most significant difference between the two is that that FSTM failed to reproduce BNL concentrations along the eastern part (between Cape Epanomi and Kassandra) and that the maximal concentrations near the Pinios delta were slightly underestimated by the model.
This is a preprint version of the article. Find the published journal article at http://dx.doi.org/10.1016/j.csr.2012.01.009
13
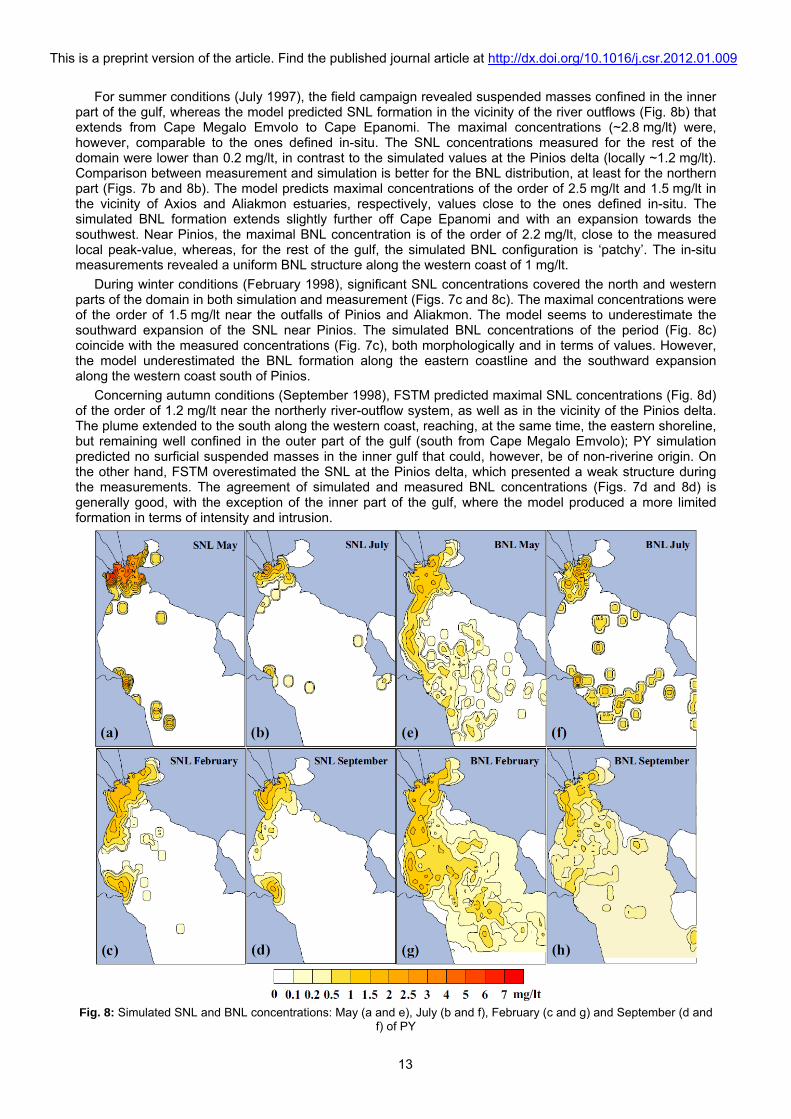
For summer conditions (July 1997), the field campaign revealed suspended masses confined in the inner part of the gulf, whereas the model predicted SNL formation in the vicinity of the river outflows (Fig. 8b) that extends from Cape Megalo Emvolo to Cape Epanomi. The maximal concentrations (~2.8 mg/lt) were, however, comparable to the ones defined in-situ. The SNL concentrations measured for the rest of the domain were lower than 0.2 mg/lt, in contrast to the simulated values at the Pinios delta (locally ~1.2 mg/lt). Comparison between measurement and simulation is better for the BNL distribution, at least for the northern part (Figs. 7b and 8b). The model predicts maximal concentrations of the order of 2.5 mg/lt and 1.5 mg/lt in the vicinity of Axios and Aliakmon estuaries, respectively, values close to the ones defined in-situ. The simulated BNL formation extends slightly further off Cape Epanomi and with an expansion towards the southwest. Near Pinios, the maximal BNL concentration is of the order of 2.2 mg/lt, close to the measured local peak-value, whereas, for the rest of the gulf, the simulated BNL configuration is ‘patchy’. The in-situ measurements revealed a uniform BNL structure along the western coast of 1 mg/lt.
During winter conditions (February 1998), significant SNL concentrations covered the north and western parts of the domain in both simulation and measurement (Figs. 7c and 8c). The maximal concentrations were of the order of 1.5 mg/lt near the outfalls of Pinios and Aliakmon. The model seems to underestimate the southward expansion of the SNL near Pinios. The simulated BNL concentrations of the period (Fig. 8c) coincide with the measured concentrations (Fig. 7c), both morphologically and in terms of values. However, the model underestimated the BNL formation along the eastern coastline and the southward expansion along the western coast south of Pinios.
Concerning autumn conditions (September 1998), FSTM predicted maximal SNL concentrations (Fig. 8d) of the order of 1.2 mg/lt near the northerly river-outflow system, as well as in the vicinity of the Pinios delta. The plume extended to the south along the western coast, reaching, at the same time, the eastern shoreline, but remaining well confined in the outer part of the gulf (south from Cape Megalo Emvolo); PY simulation predicted no surficial suspended masses in the inner gulf that could, however, be of non-riverine origin. On the other hand, FSTM overestimated the SNL at the Pinios delta, which presented a weak structure during the measurements. The agreement of simulated and measured BNL concentrations (Figs. 7d and 8d) is generally good, with the exception of the inner part of the gulf, where the model produced a more limited formation in terms of intensity and intrusion.
Fig. 8: Simulated SNL and BNL concentrations: May (a and e), July (b and f), February (c and g) and September (d and
f) of PY
This is a preprint version of the article. Find the published journal article at http://dx.doi.org/10.1016/j.csr.2012.01.009
14
The differences between simulated and measured concentrations of suspended masses in the gulf are attributed to the lack of a specific simulation of the hydrodynamic conditions for the period from 1997-98. For instance, in the simulated SNL distribution for July 1997, the plume extended in the outer part, whereas the actual SNL structure appeared well confined in the inner gulf, probably under the influence of strong southerlies; this result can only be reproduced by the model using appropriate hydrodynamic forcing. Moreover, the METRO-MED monitoring stations were distributed in the gulf in a network that was denser in the northern part and became coarser towards the south. The mean distances between stations ranged from approximately 10 km in the inner part, to 15 km in the outer part and to 20 km in the southern extended Thermaikos. Thus, the monitoring stations’ grid was much sparser than the one of the computational domain (~2 km); this means that spatial differences in simulated SPM concentrations that produce small-scale SPM variations could not be confirmed by the in-situ recordings, which inevitably appear more uniform, especially in the southern part. Sedimentary particle sources other than the rivers of the area, such as the atmosphere or other surficial outflows (i.e. streams, surficial rain-wash), could also be factors leading to SNL underestimation by FSTM.
4.1.2 Sedimentation
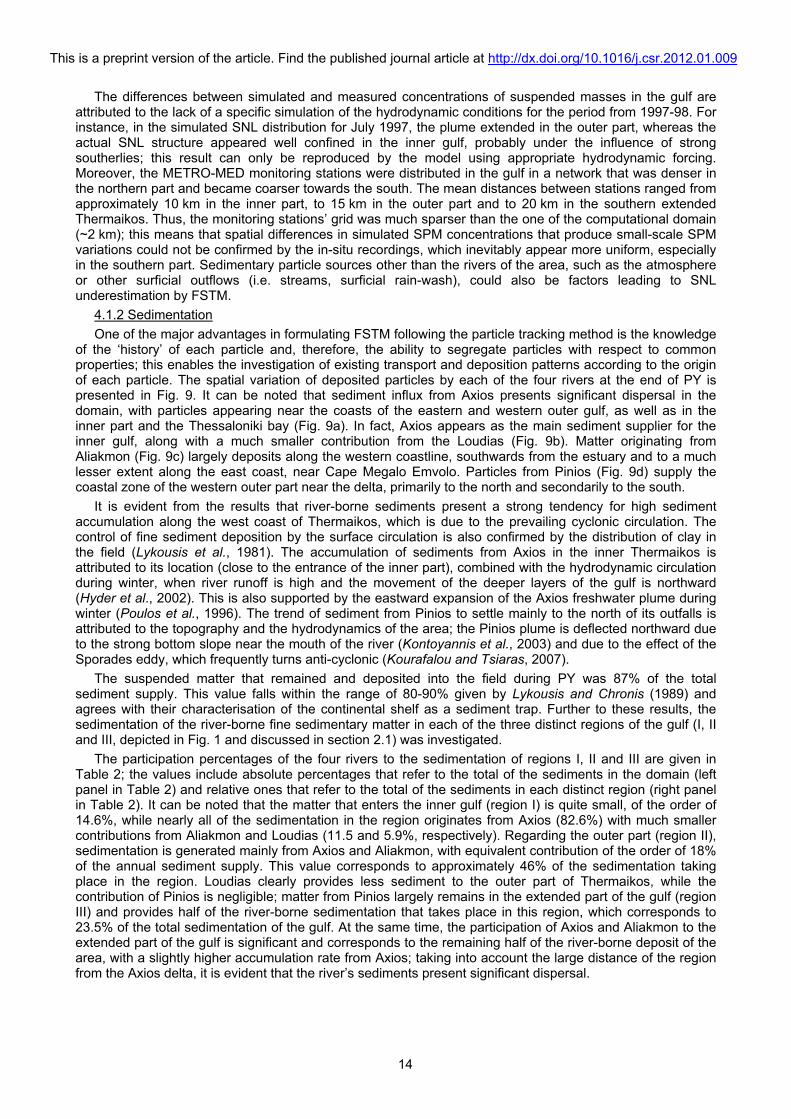
One of the major advantages in formulating FSTM following the particle tracking method is the knowledge of the ‘history’ of each particle and, therefore, the ability to segregate particles with respect to common properties; this enables the investigation of existing transport and deposition patterns according to the origin of each particle. The spatial variation of deposited particles by each of the four rivers at the end of PY is presented in Fig. 9. It can be noted that sediment influx from Axios presents significant dispersal in the domain, with particles appearing near the coasts of the eastern and western outer gulf, as well as in the inner part and the Thessaloniki bay (Fig. 9a). In fact, Axios appears as the main sediment supplier for the inner gulf, along with a much smaller contribution from the Loudias (Fig. 9b). Matter originating from Aliakmon (Fig. 9c) largely deposits along the western coastline, southwards from the estuary and to a much lesser extent along the east coast, near Cape Megalo Emvolo. Particles from Pinios (Fig. 9d) supply the coastal zone of the western outer part near the delta, primarily to the north and secondarily to the south.
It is evident from the results that river-borne sediments present a strong tendency for high sediment accumulation along the west coast of Thermaikos, which is due to the prevailing cyclonic circulation. The control of fine sediment deposition by the surface circulation is also confirmed by the distribution of clay in the field (Lykousis et al., 1981). The accumulation of sediments from Axios in the inner Thermaikos is attributed to its location (close to the entrance of the inner part), combined with the hydrodynamic circulation during winter, when river runoff is high and the movement of the deeper layers of the gulf is northward (Hyder et al., 2002). This is also supported by the eastward expansion of the Axios freshwater plume during winter (Poulos et al., 1996). The trend of sediment from Pinios to settle mainly to the north of its outfalls is attributed to the topography and the hydrodynamics of the area; the Pinios plume is deflected northward due to the strong bottom slope near the mouth of the river (Kontoyannis et al., 2003) and due to the effect of the Sporades eddy, which frequently turns anti-cyclonic (Kourafalou and Tsiaras, 2007).
The suspended matter that remained and deposited into the field during PY was 87% of the total sediment supply. This value falls within the range of 80-90% given by Lykousis and Chronis (1989) and agrees with their characterisation of the continental shelf as a sediment trap. Further to these results, the sedimentation of the river-borne fine sedimentary matter in each of the three distinct regions of the gulf (I, II and III, depicted in Fig. 1 and discussed in section 2.1) was investigated.
The participation percentages of the four rivers to the sedimentation of regions I, II and III are given in Table 2; the values include absolute percentages that refer to the total of the sediments in the domain (left panel in Table 2) and relative ones that refer to the total of the sediments in each distinct region (right panel in Table 2). It can be noted that the matter that enters the inner gulf (region I) is quite small, of the order of 14.6%, while nearly all of the sedimentation in the region originates from Axios (82.6%) with much smaller contributions from Aliakmon and Loudias (11.5 and 5.9%, respectively). Regarding the outer part (region II), sedimentation is generated mainly from Axios and Aliakmon, with equivalent contribution of the order of 18% of the annual sediment supply. This value corresponds to approximately 46% of the sedimentation taking place in the region. Loudias clearly provides less sediment to the outer part of Thermaikos, while the contribution of Pinios is negligible; matter from Pinios largely remains in the extended part of the gulf (region III) and provides half of the river-borne sedimentation that takes place in this region, which corresponds to 23.5% of the total sedimentation of the gulf. At the same time, the participation of Axios and Aliakmon to the extended part of the gulf is significant and corresponds to the remaining half of the river-borne deposit of the area, with a slightly higher accumulation rate from Axios; taking into account the large distance of the region from the Axios delta, it is evident that the river’s sediments present significant dispersal.
This is a preprint version of the article. Find the published journal article at http://dx.doi.org/10.1016/j.csr.2012.01.009
15
Fig. 9: Spatial variation of deposited particles according to their riverine origin: Axios (a), Loudias (b), Aliakmon (c) and
Pinios (d)
Table 2: Percentages of absolute and relative sedimentation of each river in the three regions of the gulf
River participation to the total
sedimentation of the gulf [%]
Relative river participation to the
sedimentation of each region [%]
River Region I Region IΙ Region IΙΙ Region I Region IΙ Region IΙΙ
Axios 12.09% 18.61% 12.12% 82.59% 47.97% 26.02%
Loudias 0.86% 1.95% 1.54% 5.91% 5.02% 3.32%
Aliakmon 1.68% 17.65% 9.38% 11.50% 45.50% 20.15%
Pinios 0.00% 0.58% 23.53% 0.00% 1.51% 50.52%
TOTAL 14.63% 38.79% 46.58% 100.00% 100.00% 100.00%
To further investigate the spreading of the riverine matter, relative percentages of deposition that refer to the total of the sediment supply of each river are given in Table 3. For Axios it can be noted that half of its material remains and settles in the outer part (II), while the remaining sediment equally supplies the coastal areas of the inner and outer gulf. Therefore, the ‘possibility’ of a particle from Axios to deposit within a radius of 17 km (~9 n.m.) south of the estuary is of the order of 50%. Similar behaviour is exhibited by sediments from Loudias, with a reduction of the depositing tendency in the inner part. More than half of the total sediment supply of Aliakmon is trapped and led to deposition in region II; the supply that enters the inner part is very small (~6%) but the southward expansion of sediment along the western coastline, beyond Cape Atherida, is significant (~33%). As expected from its location, the sedimentation from Pinios takes place
This is a preprint version of the article. Find the published journal article at http://dx.doi.org/10.1016/j.csr.2012.01.009
16
almost exclusively (~98%) in the outer part of the gulf and a very small part of the sediment supply reaches further north to deposit in region II.
Table 3: Percentages of sedimentation of each river in the regions of the gulf
River Region
Axios Loudias Aliakmon Pinios
Ι 28.23% 19.83% 5.86% 0.00%
ΙΙ 43.46% 44.72% 61.47% 2.42%
ΙΙΙ 28.30% 35.45% 32.68% 97.58%
TOTAL 100.00% 100.00% 100.00% 100.00%
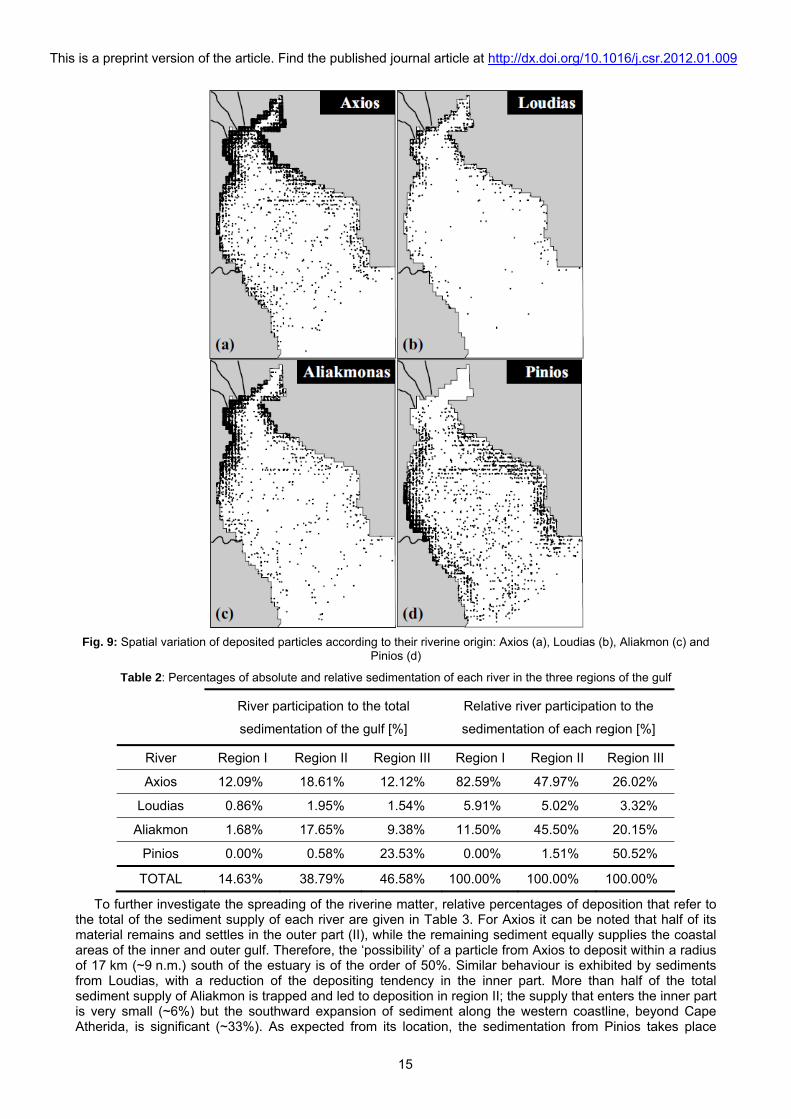
The river-borne sedimentation rate in the gulf was also calculated from the results of PY (Fig. 10a); the calculated values range from 18 mm/y locally at the mouth of Aliakmon, 7 mm/y at the outfalls of Axios and 3 mm/y near the Pinios delta. The sediment accumulation rates along the western coastline drop to 0.2 mm/y at seaward distances between 1.5 and 7 km. It should be noted that the maximal sedimentation rates of Pinios (~7 mm/y) are detected at a distance of approximately 10 km north of the delta. The rates in the inner gulf are generally low and range from 3 mm/y at Cape Megalo Emvolo to 0.2 mm/y in the inner Thermaikos and at a distance of 2-4 km from the coast. These calculated rates are close to corresponding values defined after core sampling; Anagnostou et al. (1998) estimated rates of 6-9 mm/y for the delta of Axios, while a posterior field work (Karageorgis et al., 2005) reported sedimentation rates of the order of 8.83±1.54 mm/y and 1.8±0.26 mm/y for the deltaic areas of Axios and Pinios, respectively.
Comparing the areas of significant sedimentation (Fig. 10a) with the mean sediment diameter of benthic material of Thermaikos (Fig. 10b) it can be noted that there is generally good agreement of the areas of high deposition with the minimal sediment diameters in the domain. High sedimentation rates appear along the western coastline, where the mean diameter ranges from 5 to 10 μm. In the eastern coastal zone of the outer Thermaikos, where the coarsest grains are found, the depositional trend of fine matter appears decreasing towards the south, indicating low settling of riverine sediments. Especially for the eastern part south from Cape Epanomi (Fig. 1) that is occupied by an extensive belt of relict sands (discussed briefly in section 2.3), the results of FSTM show that practically no deposition of river-borne sediments takes place in the area. These findings are in absolute accordance with previous work regarding sedimentation pathways and the origin of the sand belt in the eastern part of the shelf (Lykousis et al., 1981; Lykousis and Chronis, 1989; Karageorgis and Anagnostou, 2001).
Fig. 10: Sedimentation rates (a) and mean diameter of benthic material (b, after Kombiadou and Krestenitis (2011); the
image is reproduced with permission of Elsevier Science)
This is a preprint version of the article. Find the published journal article at http://dx.doi.org/10.1016/j.csr.2012.01.009
17
4.1.3 Discussion
In the present part of the paper, the results of PY are used to discuss the effects of stratification, sediment supplies and hydrodynamics on matter transport in the gulf. The effect of stratification on the formation of SNLs in the gulf was investigated comparing the results of PY with a simulation of the same conditions, but with no damping of the vertical movement of particles (Fw and FKv in eq. 1 were taken equal to 1.0). Comparison of the results showed that the inclusion of stratification affected modelling results mainly during the colder months of high riverine outflows, from September to March. During the warm period (April to August), practically no differences existed in SNL distributions between the two simulations (with and without vertical damping). Therefore, haline stratification seems to play a more important part to the entrapment of fine sediments in the upper layers of the column and the formation of SNLs than thermal stratification. The low effect of stratification during warmer months is due to the fact that higher temperatures near the surface produce a downward thermal diffusive flux that decreases the stability induced by the halocline in the areas affected by riverine plumes. Thus, the SNL formations of February and September 1998 (Figs. 7c and d) are attributed to the combined effects of haline stratification and high sediment supplies. On the other hand, the much higher SNL concentrations of May 1997 (Fig. 7a) are most likely due to the elevated sediment supplies; the total riverine sediment influx during May 1997 reached 3.14 t (Table 1), a value which is the highest of all the 4 surveying periods (Fig. 7). The expansion of SNLs in the gulf is largely controlled by hydrodynamics; the predominant cyclonic circulation of surface waters, enhanced by northerlies during winter, controls the southward expansion of BNLs along the western coast and (Figs. 7c and 8c). Under the influence of strong south winds, mostly present during summer, the SNL formation can become confined in the northern part of the gulf (Figs. 7a and 8a) and can the enter inner enclosed Thermaikos.
The results of FSTM showed that the particles suspended near the bed originated from the rivers, while natural erosion of the consolidated bed was not recorded in the simulations. Resuspension of recently deposited particles occurred mainly in the low depth areas near the deltas. Based on these observations, it can be deduced that the formation of BNLs in the gulf of Thermaikos is due to inhibition of settling by the, generally low, near-bed currents and, to a lesser extent, due to local resuspension of ‘fluffy’, recently deposited, material. These conclusions regarding the origin and mechanisms controlling BNL formation in Thermaikos agree with those of Zervakis et al. (2005) and Karageorgis and Anagnostou (2001). The simulations showed that BNLs in Thermaikos can be formed quite fast, since the average time needed for a particle to reach the benthic layer is between 1 and 3 days. BNLs are generally found in the northern deltaic zone and the area along the western coastline (Figs. 7 and 8), driven and maintained in suspension by the counter-clockwise movement of the deeper layers.
4.2 S01A02 results
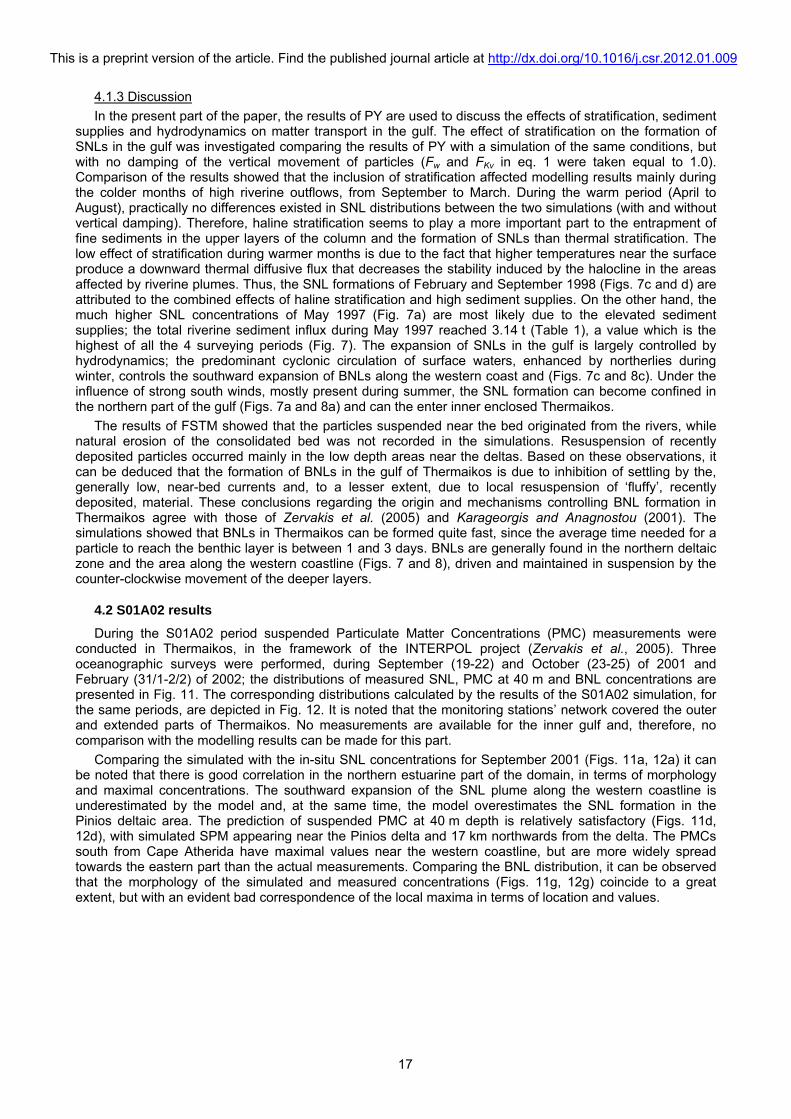
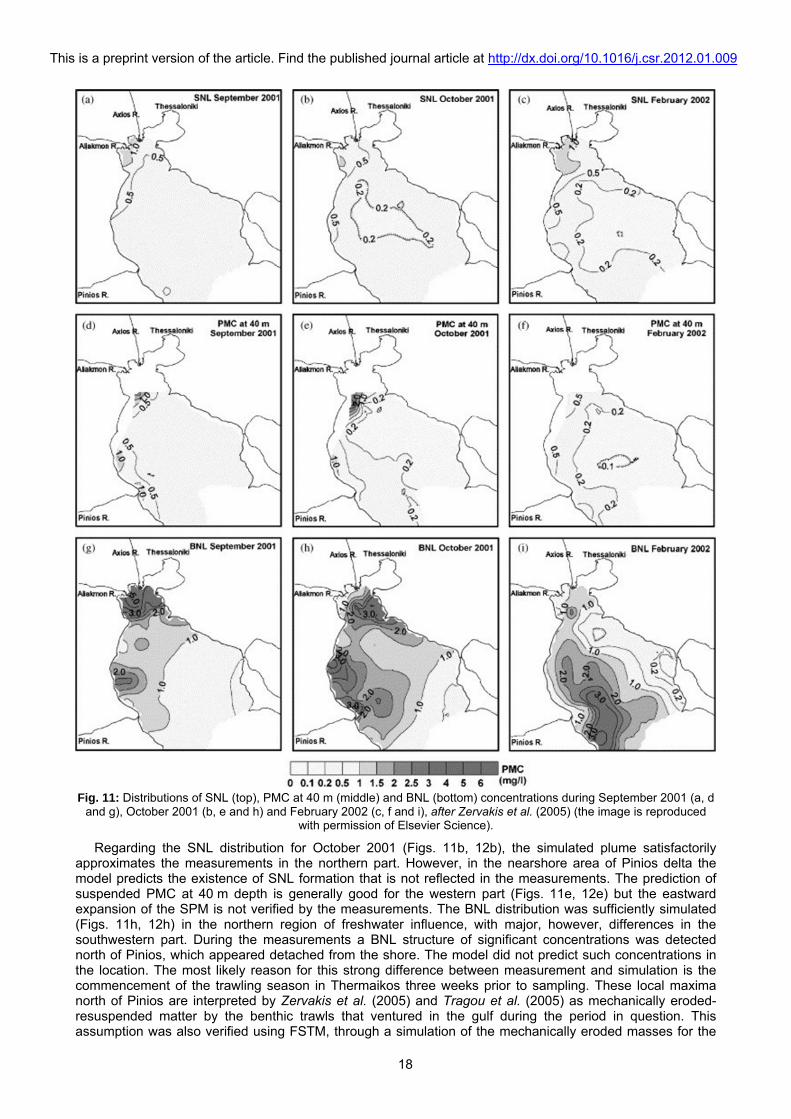
During the S01A02 period suspended Particulate Matter Concentrations (PMC) measurements were conducted in Thermaikos, in the framework of the INTERPOL project (Zervakis et al., 2005). Three oceanographic surveys were performed, during September (19-22) and October (23-25) of 2001 and February (31/1-2/2) of 2002; the distributions of measured SNL, PMC at 40 m and BNL concentrations are presented in Fig. 11. The corresponding distributions calculated by the results of the S01A02 simulation, for the same periods, are depicted in Fig. 12. It is noted that the monitoring stations’ network covered the outer and extended parts of Thermaikos. No measurements are available for the inner gulf and, therefore, no comparison with the modelling results can be made for this part.
Comparing the simulated with the in-situ SNL concentrations for September 2001 (Figs. 11a, 12a) it can be noted that there is good correlation in the northern estuarine part of the domain, in terms of morphology and maximal concentrations. The southward expansion of the SNL plume along the western coastline is underestimated by the model and, at the same time, the model overestimates the SNL formation in the Pinios deltaic area. The prediction of suspended PMC at 40 m depth is relatively satisfactory (Figs. 11d, 12d), with simulated SPM appearing near the Pinios delta and 17 km northwards from the delta. The PMCs south from Cape Atherida have maximal values near the western coastline, but are more widely spread towards the eastern part than the actual measurements. Comparing the BNL distribution, it can be observed that the morphology of the simulated and measured concentrations (Figs. 11g, 12g) coincide to a great extent, but with an evident bad correspondence of the local maxima in terms of location and values.
This is a preprint version of the article. Find the published journal article at http://dx.doi.org/10.1016/j.csr.2012.01.009
18
Fig. 11: Distributions of SNL (top), PMC at 40 m (middle) and BNL (bottom) concentrations during September 2001 (a, d
and g), October 2001 (b, e and h) and February 2002 (c, f and i), after Zervakis et al. (2005) (the image is reproduced with permission of Elsevier Science).
Regarding the SNL distribution for October 2001 (Figs. 11b, 12b), the simulated plume satisfactorily approximates the measurements in the northern part. However, in the nearshore area of Pinios delta the model predicts the existence of SNL formation that is not reflected in the measurements. The prediction of suspended PMC at 40 m depth is generally good for the western part (Figs. 11e, 12e) but the eastward expansion of the SPM is not verified by the measurements. The BNL distribution was sufficiently simulated (Figs. 11h, 12h) in the northern region of freshwater influence, with major, however, differences in the southwestern part. During the measurements a BNL structure of significant concentrations was detected north of Pinios, which appeared detached from the shore. The model did not predict such concentrations in the location. The most likely reason for this strong difference between measurement and simulation is the commencement of the trawling season in Thermaikos three weeks prior to sampling. These local maxima north of Pinios are interpreted by Zervakis et al. (2005) and Tragou et al. (2005) as mechanically eroded-resuspended matter by the benthic trawls that ventured in the gulf during the period in question. This assumption was also verified using FSTM, through a simulation of the mechanically eroded masses for the
This is a preprint version of the article. Find the published journal article at http://dx.doi.org/10.1016/j.csr.2012.01.009
19
trawling period of 2001 to 2002 and after superposition of these results with the S01A02 run (Kombiadou and Krestenitis, 2011). The synthesis of trawling-induced and river-borne BNLs significantly improved the convergence between simulated measured BNLs, confirming that the origin of the formation in question is related to the trawling activity in the area.
Fig. 12: Distributions of SNL (top), PMC at 40 m (middle) and BNL (bottom) concentrations during September 2001 (a, d
and g), October 2001 (b, e and h) and February 2002 (c, f and i) from the results of S01A02 run.
For February 2002, the predicted SNL distribution (Figs. 11b, 12b) is generally good in terms of morphology and values in the northern part. The southward expansion of the plume along the western coast is also well approximated by the model, but in the vicinity of Pinios the SNL structure is, once again, greatly
This is a preprint version of the article. Find the published journal article at http://dx.doi.org/10.1016/j.csr.2012.01.009
20
overestimated. Even though the convergence of the PMC at 40 m (Figs. 11f, 12f) is very good, the agreement of the BNL structure (Figs. 11i, 12i) is evidently very poor; the local BNL maxima detected in the southwestern part of the gulf are attributed by Zervakis et al. (2005) to dense water formation that took place in the Thessaloniki bay approximately 2 weeks prior to the survey (Estournel et al., 2005). This dense water plume moved towards the south and is capable of sweeping significant masses of SPM near the bed. Therefore, these local maxima most probably originate from material from Axios and Aliakmon that were entrapped in the dense water plume and were transported southwards. The morphology of the simulated BNL in the northern part is satisfactory, but the values are, as expected, very different from the measured ones, due to depletion by the cascading dense water masses. The dense water formation was been predicted by the NAS hydrodynamic model and, therefore, its effects could not be reflected by FSTM; hence, this dissimilarity is not due to errors in the cohesive sediment transport modelling.
Finally, it should be noted that there were no available data regarding the riverine sediment supply during the simulation period. Thus, another reason for divergences between measurement and simulation is the data of sedimentary matter themselves entering the domain at the location of the source.
Conclusions
In the present paper, a comprehensive mathematical model of the physical processes of the continental shelf that control the transport of cohesive sedimentary matter in the marine environment is presented. Fine Sediment Transport Model (FSTM) is a particle-tracking model that describes the processes that take place in the water column, including advection and dispersion by the currents, flocculation and deflocculation of the fine sediment particles, related changes in settling rates and the effects of highly stratified environments on the vertical propagation of particles, the processes that take place near the bed that are largely controlled by the benthic shear and the corresponding mass exchanges between the column and the seabed, including deposition of particles and gradual self-weight consolidation, the possibility of resuspension of deposited particles and of introduction of new particles from the bed due to erosion by the currents. The parameterisation of the effects of the stratification to the vertical movement of sedimentary particles was included using the theory of double diffusion; a threshold value of the stability ratio (Rp=10) was used for the determination of the parts of the column that are highly stratified and, therefore, locations where the vertical propagation of fine sedimentary plumes is inhibited. This critical value, which is widely applied and cited, was tested using recorded profiles of physical parameters with very good results (Appendix A). In cases where this threshold value is exceeded, the vertical deterministic and stochastic velocities of the particles are damped through functions that were fitted to experimental measurements; the sensitivity of the proposed damping functions was low, regarding both the constant parameters involved and the type of the function itself (Appendix B).
The FSTM was applied in the Thermaikos gulf and was tested against all available in-situ measurements (METRO-MED and INTERPOL projects) for the area of interest. Taking into account that only specific recordings of river-borne sediment supplies and hydrodynamic data (outputs of the NAS hydrodynamic model) were available, it follows that simulated and measured SPM distributions would inevitably present dissimilarities. In cases of extreme differences, like the BNL distributions of October 2001 and February 2002, it was substantiated that these strong dissimilarities were due to factors that were not taken into account in the simulations, like trawling activity and dense water formation. In other cases the convergence of the FSTM results with the in-situ recordings was either good or presented differences that were not excessive. For the Pinios River the SNL distribution was overestimated by the model in all the recordings of S01A02; this could indicate the reduction of the river’s sediment supplies compared to the period of 1997-1998, used in the simulation. In contrast, the SPM distribution of the northern estuarine part was satisfactory in most cases. Sedimentary sources other than the four major rivers of the area, like the atmosphere or other surficial outflows, could also be responsible for SNL underestimation by FSTM. Overall, and taking into consideration the aforementioned restrictions posed by the available input data, the performance of FSTM is considered satisfactory.
The investigation showed that SNLs are formed in Thermaikos during periods of high riverine discharges and, therefore, haline stratification and high sediment inflow from the rivers. The main driving mechanisms that control the sediment pathways include wind forcing and the predominant circulation of the surface waters. Based on the simulations, natural erosion of the consolidated bed is very limited and the BNL formation in the domain is largely due to inhibition of settling of SPM and resuspension of ‘fluffy’ (recently deposited) matter by the, generally low, near- bed currents. It should be noted that mechanical erosion of the bed by benthic trawls (Kombiadou and Krestenitis, 2011; Zervakis et al., 2005) and strong forcing events, like dense water formation during winter (Estournel et al., 2005; Zervakis et al., 2005), can significantly affect the BNL distribution in the gulf. Typically, however, BNLs are present in the northern deltaic zone of the gulf and along the western coastline, transported and maintained in suspension by the cyclonic movement of the
This is a preprint version of the article. Find the published journal article at http://dx.doi.org/10.1016/j.csr.2012.01.009
21
deeper layers. These locations are also the areas of high sedimentation in the gulf. The sedimentation rates in the gulf are estimated by FSTM at 18, 7 and 3 mm/y locally at the outflows of Aliakmon, Axios and Pinios, respectively. The maximal sedimentation rates of Pinios (~7 mm/y) were detected at a distance of approximately 10 km NW from the estuary, while the deposits in the inner Thermaikos were generally low.
The simulations showed the existence of transport and sedimentation patterns in the domain, related to the riverine origin of the material. Axios appears as the main sediment supplier for the inner part of the gulf, with a much smaller contribution by Loudias. For the outer part, Axios and Aliakmon contribute equally to the sedimentation of the area. However, due to topography, sediments from Axios present higher dispersal in the domain than those from Aliakmon, which deposit mainly to the south, along the western coastline. Matter from Pinios settles along the west coast of the extended Thermaikos, with a higher sediment accumulation north from the delta. 87% of the total river-borne sediment supply remained and deposited within the boundaries of the domain, estimation consistent with the characterisation of the continental shelf of Thermaikos as a sediment trap (Lykousis and Chronis, 1989).
Acknowledgements
The authors would like to thank the reviewers for their comments and their constructive criticism that enhanced the quality of the paper. We are also grateful to Mr. Konstantinos Tsiaras from the Hellenic Centre for Marine Research (HCMR) for kindly providing the results of the NAS model during our collaboration in the MFSTEP European Program (EVK3-CT-2002-00075).
References
Anagnostou, C., Kaberi, E., Karageorgis, A., Kontogiannis, H., Krassakopoulou, E., Pagou, K., Pavlidou, A., Stavrakakis, S., 1998. Matter transfer in a land-shelf basin system: NW Aegean area-Mediterranean Sea, Proc. Inter. Workshop on Environmental Biochemistry, New Delhi.
Beaulieu, S.E., Sengco, M.R., Anderson, D.M., 2005. Using clay to control harmful algal blooms: deposition and resuspension of clay/algal flocs, Harmful Algae, 4(1), 123-138.
Cacuci, D.G., 2003. Sensitivity and uncertainty analysis theory, Chapman & Hall/CRC, Washington, U.S.A.
Chen, C.F., 1997. Particle flux through sediment fingers, Deep-Sea Res. Pt I, 44(9-10), 1645–1654.
Dearnaley, M.P., Roberts, W., Jones, S., Leureur, K.C., Lintern, D.G., Merckelbach, L.M., Sills, C.G., Toorman, E.A., Winterwerp, J.C., 2002. Measurement and modelling of the properties of cohesive sediment deposits, in: Winterwerp, J.C., Kranenburg, C. (Eds.), Fine Sediment Dynamics in the Marine Environment, Elsevier Science, Amsterdam, pp. 57-73.
Dyer, K.R., 1989. Sediment processes in estuaries: future research requirements, J. Geoph. Res., 94(C10), 14327-14339.
Eisma, D., 1993. Suspended matter in the aquatic environment, Springer-Verlag, Heidelberg, Germany.
Estournel, C., Zervakis, V., Marsaleix, P., Papadopoulos, A., Auclair, F., Perivoliotis, L., Tragou, E., 2005. Dense water formation and cascading in the Gulf of Thermaikos (North Aegean), from observations and modelling, Cont. Shelf Res., 25 (19-20), 2366-2386.
Green, Th., 1987. The importance of double diffusion to the settling of suspended material, Sedimentology, 34, 319-331.
Guerzoni, S., Chester, R., Dulac, F., Herut, B., Loÿe-Pilot, M., Measures, C., Migon, C., Molinaroli, E., Moulin, C., Rossini, P., Saydam, C., Soudine, A., Ziveri, P., 1999. The role of atmospheric deposition in the biogeochemistry of the Mediterranean Sea, Progr. Oceanogr., 44, 147–190.
Hyder, P., Simpson, J., Christopoulos, S., Krestenitis, Y., 2002. The seasonal cycles of stratification and circulation in the Thermaikos Gulf Region Of Freshwater Influence (ROFI), north-west Aegean, Cont. Shelf Res., 22, 2573–2597.
Karageorgis, Α., Anagnostou, Ch., 2003. Seasonal variation in the distribution of suspended particulate matter in the northwest Aegean Sea, J. Geoph. Res., 108(C8), 3274, doi:10.1029/2002JC001672.
Karageorgis, Α.P., Anagnostou, C.L., Kaberi, H., 2005. Geochemistry and mineralogy of the NW Aegean Sea surface sediments: implications for river runoff and anthropogenic impact, Appl. Geochem., 20(1), 69-88.
Karamanos, H., Polyzonis, E., 2000. Thermaikos Gulf: the adjacent land area and its potentiality for the freshwater, sediment and pollutant supply, in: Final Scientific Report of the EU-MAST-III ELOISE Project METRO-MED, Part B: Specific topics, CT 960049, pp. 55-67

This is a preprint version of the article. Find the published journal article at http://dx.doi.org/10.1016/j.csr.2012.01.009
22
Kelley, D.E., Fernando, H.J.S., Gargett, A.E., Tanny, J., Özsoy, E., 2003. The diffusive regime of double-diffusive convection, Progr. Oceanogr., 56, 461–481.
Kerr, R.C., Kuiper, G.S., 1997. Particle settling through a diffusive-type thermohaline staircase in the ocean, Deep-Sea Res. Pt I, 44(3), 399-412.
Kontoyannis, H., Kourafalou, V.H., Papadopoulos, V., 2003. Seasonal characteristics of the hydrology and circulation in the northwest Aegean Sea (eastern Mediterranean): Observations and modeling, J. Geoph. Res., 108(C9), 3302, doi: 10.1029/2001JC001132.
Kombiadou, K., Krestenitis, Y.N., 2011. Simulating the fate of mechanically eroded masses in the Thermaikos Gulf, Cont. Shelf Res., 31, 817-831.
Kourafalou, V.H., Savvidis, Y.G., Krestenitis, Y.N., Koutitas, C.G., 2004. Modelling studies on the processes that influence matter transfer on the Gulf of Thermaikos (NW Aegean Sea), Cont. Shelf Res., 24(2), 203-222.
Kourafalou, V.H., Tsiaras, K., 2007. A nested circulation model for the North Aegean Sea, Ocean Sci., 3, 1-16.
Krestenitis, Y.N., Kombiadou, K.D., Savvidis, Y.G., 2007. Modelling the cohesive sediment transport in the marine environment: the case of Thermaikos Gulf, Ocean Sci., 3, 91–104.
Krestenitis, Y.N., Kombiadou, K., Androulidakis, I., 2006. Physical characteristics of the water masses of the gulf of Thessaloniki, in: Monitoring the quality of the marine environment of the Thessaloniki gulf (Thermaikos 2004): Final Technical Report, Athens, pp. 11-56, in Greek.
Kunze, E., 2003. A review of oceanic salt-fingering theory, Progr. Oceanogr. 56, 399–417.
Lewis, R., 1997. Dispersion in estuaries and coastal waters, John Wiley & Sons Ltd, England.
Lykousis, V., Chronis, G., 1989. Mechanisms of sediment transport and deposition: Sediment sequences and accumulation during the Holocene on the Thermaikos plateau, the continental slope, and basin (Sporadhes basin), northwestern Aegean Sea, Greece, Mar. Geol., 87, 15-26.
Lykousis, V., Collins, M.B., Ferentinos, G., 1981. Modern sedimentation in the NW Aegean Sea, Mar. Geol., 43, 111-130
Malashetty, M.S., Gaikwad, S.N., 2002. Effect of cross diffusion on double diffusive convection in the presence of horizontal gradients, Int. J. Eng. Sc., 40(7), 773-787.
McCool, W.W., Parsons, J.D., 2004. Sedimentation from buoyant fine-grained suspensions, Cont. Shelf Res., 24, 1129–1142.
McLane, M., 1995. Sedimentology, Oxford University Press, New York.
Mehta, A.J., 1993. Hydraulic behaviour of fine sediment, in: Abbott, M.B., Price, W.A. (Eds.), Estuarial and Harbour Engineer’s Reference Book, Chapman and Hall, London, pp. 577-584.
Mellor, G.L., 1996. Introduction to physical oceanography, Princeton University, New Jersey.
Munk, W.H., Anderson, E.R., 1948. Notes on the theory of the thermocline, J. Mar. Res., 3, 276-295.
O’ Brien, J.J., 1986. The diffusive problem, in: O’ Brien, J.J. (Ed.), Advanced physical oceanographic numerical modelling, NATO ASI series, D. Reidel Publication Company, pp. 127-144.
Papadopoulos, A., Katsafados, P., Kallos, G., Nickovic, S., 2002. The Weather Forecasting System for Poseidon – an overview, J. Atmos. Ocean Sci., 8(2), 219–237.
Parsons, J. D., Bush, J.W.M., Syvitski, J.P.M., 2001. Hyperpycnal plume formation from riverine outflows with small sediment concentrations, Sedimentology, 48(2), 465–478.
Parsons, J.D., Garcia, M.H., 2000. Enhanced sediment scavenging due to double-diffusive convection, J. Sediment. Res., 70(1), 47-52.
Partheniades, E., 2009. Cohesive sediments in open channels: properties, transport and applications, Butterworth-Heinemann, Bulrington, U.S.A.
Poulos, S.E., Collins, M.B., Shaw, H., 1996. Deltaic sedimentation, Including Clay Mineral Distribution Patterns Associated with Small Mountainous Rivers and Shallow Marine Embayments of Greece (SE Alpine Europe), J. Coastal Res., 12(4), 940-952.
Poulos S.E, Chronis G.Th, Collins M.B, Lykousis V., 2000, Thermaikos Gulf Coastal System, NW Aegean Sea: an overview of water/sediment fluxes in relation to air–land–ocean interactions and human activities, J. Mar. Sys., 25(1), 47-76.
Poulos, S.E., 2009. Origin and distribution of the terrigenous component of the unconsolidated surface sediment of the Aegean floor: A synthesis, Cont. Shelf Res., 29(16), 2045-2060.
Saltelli, A., Tarantola, S., Campolongo F., Ratto, M., 2004. Sensitivity analysis in practice: a guide to assessing scientific models, John Willey & Sons Ltd, West Sussex, England.
This is a preprint version of the article. Find the published journal article at http://dx.doi.org/10.1016/j.csr.2012.01.009
23
Schladow, S.G., Thomas, E., Koseff, J.R., 1992. The dynamics of intrusions into a thermohaline stratification, J. Fluid Mech., 236, 127-165.
Schmid, M., Lorke, A., Dinkel, Ch., Tanyileke, G., Wüest, A., 2004. Double-diffusive convection in Lake Nyos, Cameroon, Deep-Sea Res. Pt I, 51, 1097–1111.
Schweim, C., Bouchard, J.P., Welzel, J., Spork, V., Köngeter, J., 1998. Sediment management during reservoir depletion - Experimental investigations of mud siltation and resuspension, paper presented at 7th International Symposium on River Sedimentation, Hong Kong, China.
Scully, M.E., Friedrichs, C.T., 2003. The influence of asymmetries in overlying stratification on near-bed turbulence and sediment suspension in a partially mixed estuary, Ocean Dynam., 53, 208-219.
Sofianos, S., Skliris, N., Mantziafou, A., Lascaratos, A., Zodiatis, G., Lardner, R., Hayes, D., Georgiou, G., 2006. Nesting operational forecasting models in the Eastern Mediterranean: active and slave mode, Ocean Science Discussions, 3, 1225-1254
Sorkin, A., Sorkin, V., Leizerson, I., 2002. Salt fingers in double-diffusive systems, Physica A, 303, 13–26.
Soukissian, T.H., Chronis, G.T., Nittis, K., Diamanti, Ch., 2002. Advancement of Operational Oceanography in Greece: The Case of the Poseidon System, J. Atmos. Ocean Sci., 8(2), 93 - 107.
Tan, G., Wang, J., Shu, C., Lai, Y., 2007. Effects of consolidation time and particle size on scour rates of cohesive sediment, J. Hydrodyn., 19(2), 160-164.
Toorman, E.A., 2001. Cohesive sediment transport modeling: European perspective, in: McAnally W.H., Mehta, A.J. (Eds.), Coastal and Estuarine Fine Sediment Processes, Proceedings in Marine Science vol. 3, Elsevier, pp. 1-18.
Toorman, E.A., Bruens, A.W., Kranenburg, C., Winterwerp, J.C., 2002. Interaction of suspended cohesive sediment and turbulence, in: Winterwerp, J.C., Kranenburg, C. (Eds.), Fine Sediment Dynamics in the Marine Environment, Proceedings in Marine Science vol. 5, Elsevier, pp. 7-23.
Towner, J.V., 1993. Contaminants in estuarine sediments, in: Abbott, M.B., Price, W.A. (Eds.), Estuarial and Harbour Engineer’s Reference Book, Chapman and Hall, London, pp. 585-596.
Tragou, E., Zervakis, V., Papageorgiou, E., Stavrakakis, S., Lykousis, V., 2005. Monitoring the physical forcing of resuspension events in the Thermaikos Gulf—NW Aegean during 2001–2003, Cont. Shelf Res., 25(19-20), 2315-2331.
Wang, X.H., Pinardi, N., 2002. Modeling the dynamics of sediment transport and resuspension in the northern Adriatic Sea, J. Geoph. Res., 107(C12), 3225, doi:10.1029/2001JC001303
Winterwerp, J.C., 1999, On the dynamics of high-concentrated mud suspensions, Judels Brinkman & Ammerlaan, Delft.
Winterwerp, J.C., Manning, A.J., Martens, C, de Mulder, T., Vanlede, J., 2006. A heuristic formula for turbulence-induced flocculation of cohesive sediment, Estuar. Coast. Shelf Sci., 68, 195-207.
Yoshida, J., Nagashima, H., 2003. Numerical experiments on double-diffusive intrusions in the ocean and their relation to laboratory experiments, Progr. Oceanogr. 56, 549-557.
Zervakis, V., Karageorgis, A.P., Kontoyiannis, H., Papadopoulos V., Lykousis, V., 2005. Hydrology, circulation and distribution of particulate matter in Thermaikos Gulf (NW Aegean Sea), during September 2001–October 2001 and February 2002, Cont. Shelf Res. 25(19-20), 2332–2349.
Zhurbas, V.M., Kuzmina, N.P., Kulsha, Y., 1987. Step-like stratification of the ocean thermocline from transformations associated with thermohaline salt finger intrusions (numerical experiment), Oceanology 27, 277–281, English translation.
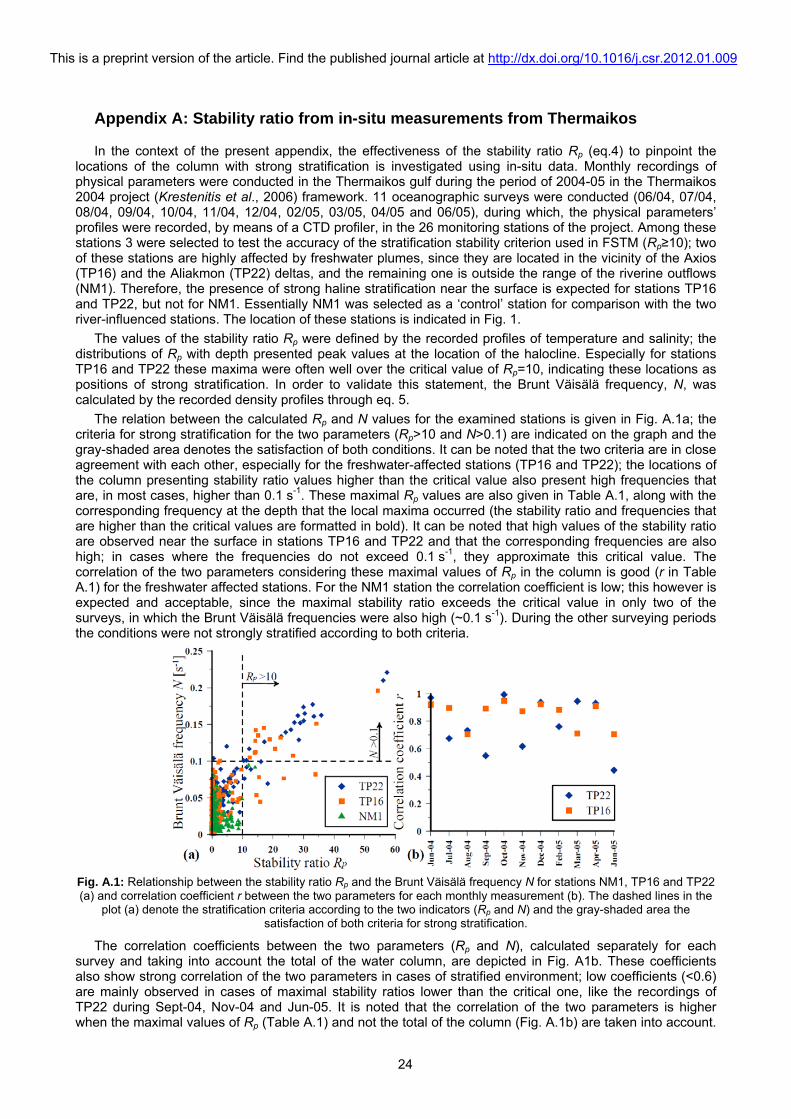
This is a preprint version of the article. Find the published journal article at http://dx.doi.org/10.1016/j.csr.2012.01.009
24
Appendix A: Stability ratio from in-situ measurements from Thermaikos
In the context of the present appendix, the effectiveness of the stability ratio Rp (eq.4) to pinpoint the locations of the column with strong stratification is investigated using in-situ data. Monthly recordings of physical parameters were conducted in the Thermaikos gulf during the period of 2004-05 in the Thermaikos 2004 project (Krestenitis et al., 2006) framework. 11 oceanographic surveys were conducted (06/04, 07/04, 08/04, 09/04, 10/04, 11/04, 12/04, 02/05, 03/05, 04/05 and 06/05), during which, the physical parameters’ profiles were recorded, by means of a CTD profiler, in the 26 monitoring stations of the project. Among these stations 3 were selected to test the accuracy of the stratification stability criterion used in FSTM (Rp≥10); two of these stations are highly affected by freshwater plumes, since they are located in the vicinity of the Axios (TP16) and the Aliakmon (TP22) deltas, and the remaining one is outside the range of the riverine outflows (NM1). Therefore, the presence of strong haline stratification near the surface is expected for stations TP16 and TP22, but not for NM1. Essentially NM1 was selected as a ‘control’ station for comparison with the two river-influenced stations. The location of these stations is indicated in Fig. 1.
The values of the stability ratio Rp were defined by the recorded profiles of temperature and salinity; the distributions of Rp with depth presented peak values at the location of the halocline. Especially for stations TP16 and TP22 these maxima were often well over the critical value of Rp=10, indicating these locations as positions of strong stratification. In order to validate this statement, the Brunt Väisälä frequency, N, was calculated by the recorded density profiles through eq. 5.
The relation between the calculated Rp and N values for the examined stations is given in Fig. A.1a; the criteria for strong stratification for the two parameters (Rp>10 and N>0.1) are indicated on the graph and the gray-shaded area denotes the satisfaction of both conditions. It can be noted that the two criteria are in close agreement with each other, especially for the freshwater-affected stations (TP16 and TP22); the locations of the column presenting stability ratio values higher than the critical value also present high frequencies that are, in most cases, higher than 0.1 s-1. These maximal Rp values are also given in Table A.1, along with the corresponding frequency at the depth that the local maxima occurred (the stability ratio and frequencies that are higher than the critical values are formatted in bold). It can be noted that high values of the stability ratio are observed near the surface in stations TP16 and TP22 and that the corresponding frequencies are also high; in cases where the frequencies do not exceed 0.1 s-1, they approximate this critical value. The correlation of the two parameters considering these maximal values of Rp in the column is good (r in Table A.1) for the freshwater affected stations. For the NM1 station the correlation coefficient is low; this however is expected and acceptable, since the maximal stability ratio exceeds the critical value in only two of the surveys, in which the Brunt Väisälä frequencies were also high (~0.1 s-1). During the other surveying periods the conditions were not strongly stratified according to both criteria.
Fig. A.1: Relationship between the stability ratio Rp and the Brunt Väisälä frequency N for stations NM1, TP16 and TP22 (a) and correlation coefficient r between the two parameters for each monthly measurement (b). The dashed lines in the
plot (a) denote the stratification criteria according to the two indicators (Rp and N) and the gray-shaded area the satisfaction of both criteria for strong stratification.
The correlation coefficients between the two parameters (Rp and N), calculated separately for each survey and taking into account the total of the water column, are depicted in Fig. A1b. These coefficients also show strong correlation of the two parameters in cases of stratified environment; low coefficients (<0.6) are mainly observed in cases of maximal stability ratios lower than the critical one, like the recordings of TP22 during Sept-04, Nov-04 and Jun-05. It is noted that the correlation of the two parameters is higher when the maximal values of Rp (Table A.1) and not the total of the column (Fig. A.1b) are taken into account.
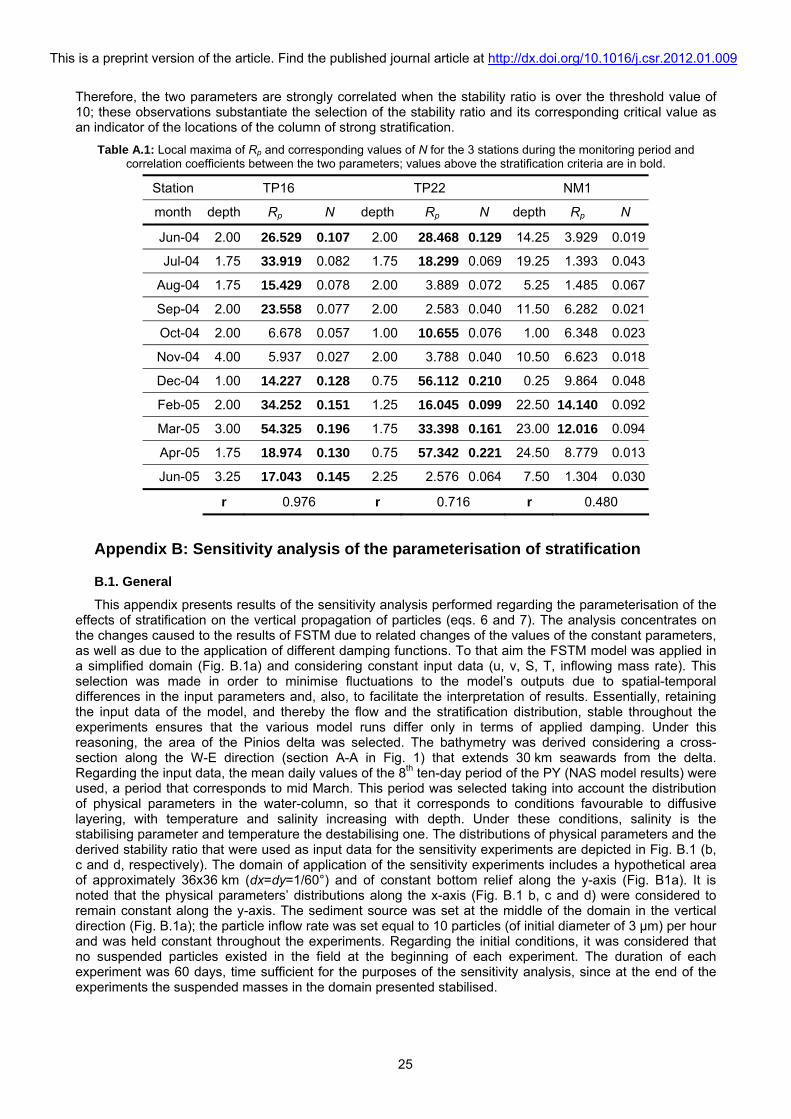
This is a preprint version of the article. Find the published journal article at http://dx.doi.org/10.1016/j.csr.2012.01.009
25
Therefore, the two parameters are strongly correlated when the stability ratio is over the threshold value of 10; these observations substantiate the selection of the stability ratio and its corresponding critical value as an indicator of the locations of the column of strong stratification.
Table A.1: Local maxima of Rp and corresponding values of N for the 3 stations during the monitoring period and correlation coefficients between the two parameters; values above the stratification criteria are in bold.
Station TP16 TP22 NM1
month depth Rp N depth Rp N depth Rp N
Jun-04 2.00 26.529 0.107 2.00 28.468 0.129 14.25 3.929 0.019
Jul-04 1.75 33.919 0.082 1.75 18.299 0.069 19.25 1.393 0.043
Aug-04 1.75 15.429 0.078 2.00 3.889 0.072 5.25 1.485 0.067
Sep-04 2.00 23.558 0.077 2.00 2.583 0.040 11.50 6.282 0.021
Oct-04 2.00 6.678 0.057 1.00 10.655 0.076 1.00 6.348 0.023
Nov-04 4.00 5.937 0.027 2.00 3.788 0.040 10.50 6.623 0.018
Dec-04 1.00 14.227 0.128 0.75 56.112 0.210 0.25 9.864 0.048
Feb-05 2.00 34.252 0.151 1.25 16.045 0.099 22.50 14.140 0.092
Mar-05 3.00 54.325 0.196 1.75 33.398 0.161 23.00 12.016 0.094
Apr-05 1.75 18.974 0.130 0.75 57.342 0.221 24.50 8.779 0.013
Jun-05 3.25 17.043 0.145 2.25 2.576 0.064 7.50 1.304 0.030
r 0.976 r 0.716 r 0.480
Appendix B: Sensitivity analysis of the parameterisation of stratification
B.1. General
This appendix presents results of the sensitivity analysis performed regarding the parameterisation of the effects of stratification on the vertical propagation of particles (eqs. 6 and 7). The analysis concentrates on the changes caused to the results of FSTM due to related changes of the values of the constant parameters, as well as due to the application of different damping functions. To that aim the FSTM model was applied in a simplified domain (Fig. B.1a) and considering constant input data (u, v, S, T, inflowing mass rate). This selection was made in order to minimise fluctuations to the model’s outputs due to spatial-temporal differences in the input parameters and, also, to facilitate the interpretation of results. Essentially, retaining the input data of the model, and thereby the flow and the stratification distribution, stable throughout the experiments ensures that the various model runs differ only in terms of applied damping. Under this reasoning, the area of the Pinios delta was selected. The bathymetry was derived considering a cross-section along the W-E direction (section A-A in Fig. 1) that extends 30 km seawards from the delta. Regarding the input data, the mean daily values of the 8th ten-day period of the PY (NAS model results) were used, a period that corresponds to mid March. This period was selected taking into account the distribution of physical parameters in the water-column, so that it corresponds to conditions favourable to diffusive layering, with temperature and salinity increasing with depth. Under these conditions, salinity is the stabilising parameter and temperature the destabilising one. The distributions of physical parameters and the derived stability ratio that were used as input data for the sensitivity experiments are depicted in Fig. B.1 (b, c and d, respectively). The domain of application of the sensitivity experiments includes a hypothetical area of approximately 36x36 km (dx=dy=1/60°) and of constant bottom relief along the y-axis (Fig. B1a). It is noted that the physical parameters’ distributions along the x-axis (Fig. B.1 b, c and d) were considered to remain constant along the y-axis. The sediment source was set at the middle of the domain in the vertical direction (Fig. B.1a); the particle inflow rate was set equal to 10 particles (of initial diameter of 3 μm) per hour and was held constant throughout the experiments. Regarding the initial conditions, it was considered that no suspended particles existed in the field at the beginning of each experiment. The duration of each experiment was 60 days, time sufficient for the purposes of the sensitivity analysis, since at the end of the experiments the suspended masses in the domain presented stabilised.
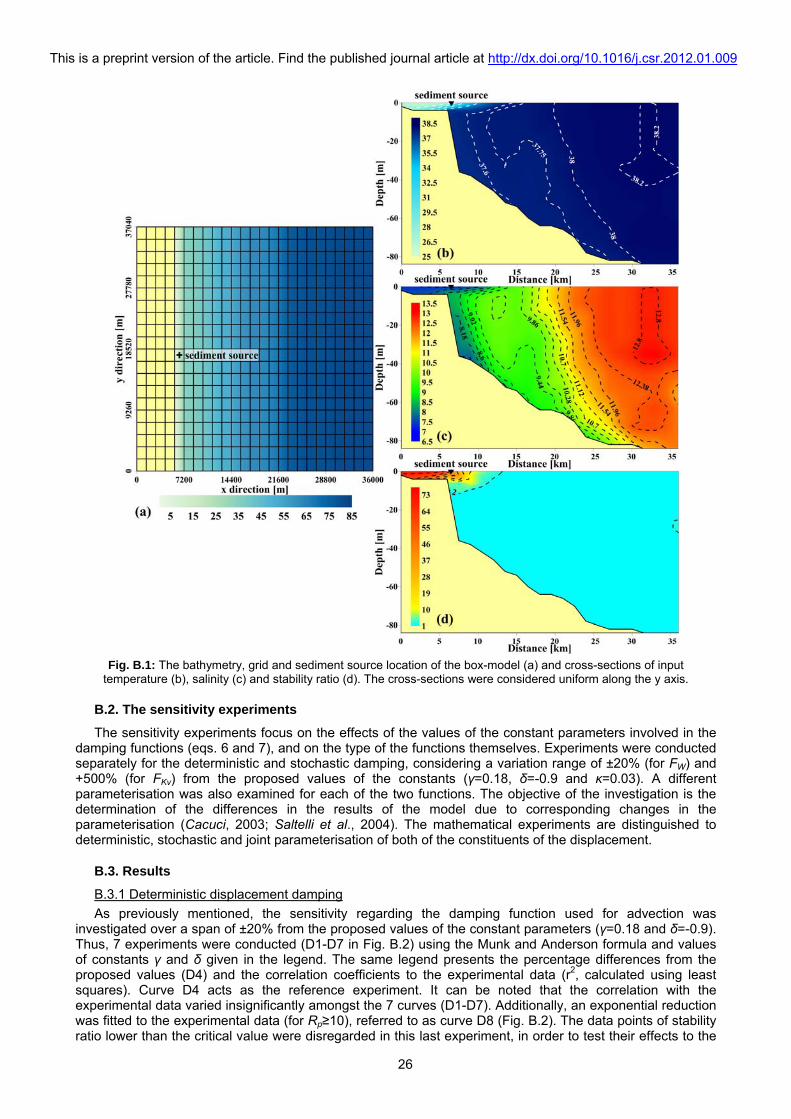
This is a preprint version of the article. Find the published journal article at http://dx.doi.org/10.1016/j.csr.2012.01.009
26
Fig. B.1: The bathymetry, grid and sediment source location of the box-model (a) and cross-sections of input
temperature (b), salinity (c) and stability ratio (d). The cross-sections were considered uniform along the y axis.
B.2. The sensitivity experiments
The sensitivity experiments focus on the effects of the values of the constant parameters involved in the damping functions (eqs. 6 and 7), and on the type of the functions themselves. Experiments were conducted separately for the deterministic and stochastic damping, considering a variation range of ±20% (for FW) and +500% (for FKv) from the proposed values of the constants (γ=0.18, δ=-0.9 and κ=0.03). A different parameterisation was also examined for each of the two functions. The objective of the investigation is the determination of the differences in the results of the model due to corresponding changes in the parameterisation (Cacuci, 2003; Saltelli et al., 2004). The mathematical experiments are distinguished to deterministic, stochastic and joint parameterisation of both of the constituents of the displacement.
B.3. Results
B.3.1 Deterministic displacement damping
As previously mentioned, the sensitivity regarding the damping function used for advection was investigated over a span of ±20% from the proposed values of the constant parameters (γ=0.18 and δ=-0.9). Thus, 7 experiments were conducted (D1-D7 in Fig. B.2) using the Munk and Anderson formula and values of constants γ and δ given in the legend. The same legend presents the percentage differences from the proposed values (D4) and the correlation coefficients to the experimental data (r2, calculated using least squares). Curve D4 acts as the reference experiment. It can be noted that the correlation with the experimental data varied insignificantly amongst the 7 curves (D1-D7). Additionally, an exponential reduction was fitted to the experimental data (for Rp≥10), referred to as curve D8 (Fig. B.2). The data points of stability ratio lower than the critical value were disregarded in this last experiment, in order to test their effects to the
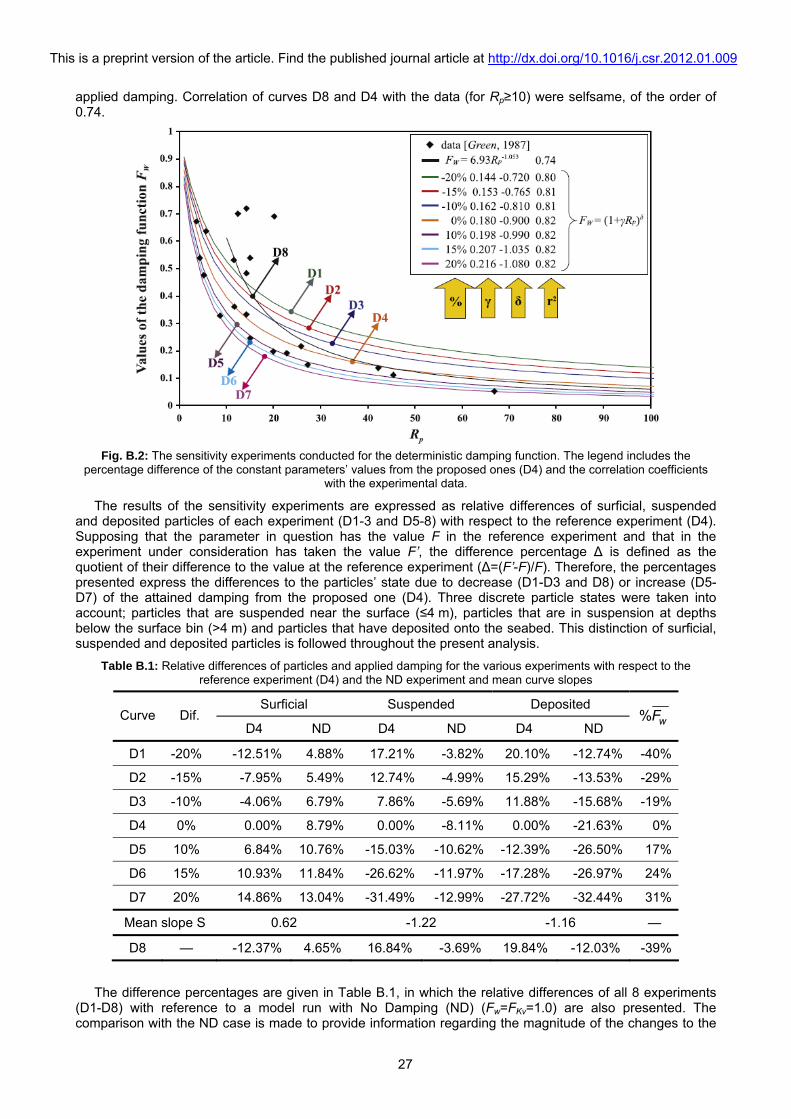
This is a preprint version of the article. Find the published journal article at http://dx.doi.org/10.1016/j.csr.2012.01.009
27
applied damping. Correlation of curves D8 and D4 with the data (for Rp≥10) were selfsame, of the order of 0.74.
Fig. B.2: The sensitivity experiments conducted for the deterministic damping function. The legend includes the
percentage difference of the constant parameters’ values from the proposed ones (D4) and the correlation coefficients with the experimental data.
The results of the sensitivity experiments are expressed as relative differences of surficial, suspended and deposited particles of each experiment (D1-3 and D5-8) with respect to the reference experiment (D4). Supposing that the parameter in question has the value F in the reference experiment and that in the experiment under consideration has taken the value F’, the difference percentage ∆ is defined as the quotient of their difference to the value at the reference experiment (∆=(F’-F)/F). Therefore, the percentages presented express the differences to the particles’ state due to decrease (D1-D3 and D8) or increase (D5-D7) of the attained damping from the proposed one (D4). Three discrete particle states were taken into account; particles that are suspended near the surface (≤4 m), particles that are in suspension at depths below the surface bin (>4 m) and particles that have deposited onto the seabed. This distinction of surficial, suspended and deposited particles is followed throughout the present analysis.
Table B.1: Relative differences of particles and applied damping for the various experiments with respect to the reference experiment (D4) and the ND experiment and mean curve slopes
Surficial Suspended Deposited Curve Dif.
D4 ND D4 ND D4 ND % wF
D1 -20% -12.51% 4.88% 17.21% -3.82% 20.10% -12.74% -40%
D2 -15% -7.95% 5.49% 12.74% -4.99% 15.29% -13.53% -29%
D3 -10% -4.06% 6.79% 7.86% -5.69% 11.88% -15.68% -19%
D4 0% 0.00% 8.79% 0.00% -8.11% 0.00% -21.63% 0%
D5 10% 6.84% 10.76% -15.03% -10.62% -12.39% -26.50% 17%
D6 15% 10.93% 11.84% -26.62% -11.97% -17.28% -26.97% 24%
D7 20% 14.86% 13.04% -31.49% -12.99% -27.72% -32.44% 31%
Mean slope S 0.62 -1.22 -1.16 —
D8 — -12.37% 4.65% 16.84% -3.69% 19.84% -12.03% -39%
The difference percentages are given in Table B.1, in which the relative differences of all 8 experiments (D1-D8) with reference to a model run with No Damping (ND) (Fw=FKv=1.0) are also presented. The comparison with the ND case is made to provide information regarding the magnitude of the changes to the

This is a preprint version of the article. Find the published journal article at http://dx.doi.org/10.1016/j.csr.2012.01.009
28
results of FSTM due to the parameterisation of stratification. It can be noted that the system’s response is significantly linear, with the reduction of the momentum damping (D1-D3 and D8) to result in a decrease of surficial particles and an increase of particles suspended at greater depths and of deposited ones. The exact opposite behaviour is observed in cases where the damping is increased (D5-D7). This finding is considered significant and fully justifiable, since it is both logical and anticipated the increase in damping of the deterministic velocity to cause an increase of the particles that remain in the surface layer and a corresponding decrease of the ones that have passed at deeper layers, due to a ‘lack’ of particles in these depths. The decrease of suspended and deposited particles is, in fact, a delayed response of the system due to increased particle entrapment in the upper layers, combined with an increase of the particles that escaped the domain through the open boundaries. The relative percentages of particles ‘lost’ from the domain range from -4.3% for D1 to +6.7% for D7, related to the reference experiment (linear response to the transition from D1 to D7, with a slope of 0.27). The same percentages with reference to the ND case vary from 7.7% to 20%. It should be restated, at this point, that the terms increase and decrease are relative and are used with respect to the reference experiment (D4 or ND) and that the sediment supply was continuous for the duration of the experiments.
The relative differences of the experiments, with reference to D4, range between 15%, 30% and 25% for surficial, suspended and deposited particles, respectively, for a change in values of the constant parameters’ of the order of 20%. It is noted that there is a slight deviation between anti-symmetrical points (e.g. between -20% and +20%). This is due to the non-linearity of the damping equation, as reflected in the
changes of the attained damping (% wF in Table B.1), always with respect to the reference curve, D4. The
low fluctuation range of the results reveals the low sensitivity of the parameterisation to the values of the constant parameters of the deterministic velocity damping equation. The same is true for the exponential reduction experiment, D8, for which the differences are similar to the D1 curve, since the relative change of
attained damping of the two experiments is akin (% ~ 40%wF ). Compared to the ND case, the relative
differences range between +4.6% and +13% for surficial, -3.7% and -13% for suspended and between -12% and -32.5% for deposited particles.
B.3.2 Stochastic displacement damping
As mentioned in the analysis of FSTM, the stochastic particle velocity damping function was based on the formulation of Zhurbas et al. (1987) (eq. 7) and the constant, κ, was set to 0.03. In context of the sensitivity analysis, the effects of increasing the proposed value up to +500% and the effects of using a Munk-Anderson type equation on the results of the model are investigated. A total of 5 experiments were conducted, depicted by curves S1 to S5 (the initial deriving from the term stochastic) in Fig. B.3. The considered damping function, the percentage increase of the constant parameter to the proposed one (%) and the correlation with the experimental data (r2) are given in the legend. Again, the new parameterisation (S5) was fitted to the experimental data that present Rp value over the critical value (Rp≥10). The reference experiment in this case is S1. Correlation with the experimental data varied significantly amongst the 5 curves.
As for the previous case, the relative differences of the number of particles in each of the three examined states (surface, suspension, deposition) were defined with respect to the reference experiment (S1); these values are given in Table B.2, along with the comparison of the experiments with the ND scenario and the
relative increase of attained damping (% KvF ) for each curve. The relationship between the attained
damping and the changes to the modelling results was strongly non-linear, due to the stochastic nature of the dispersion process; the amplitude of the stochastic velocity decreases with increasing damping (transition from curve S1 to S5), but the stochastically defined direction of the displacement leads to random fluctuations of the modelling results. It is expected that the distribution of particles in the domain will be different in case of repetitive simulations of the same experiment, due to the stochasticity of the movement. Therefore, the significant part of the analysis is the range of the relative differences with respect to the input parameters of each experiment. Although the standard deviation of the relative differences is high, the average value is almost negligible (Table B.2). The maximum values of these differences (including the standard deviation) are around ±12.5%, ±5% and ±15% for surficial, suspended and deposited particles respectively. Taking into account that these extreme values correspond to an increase of 84% of the applied damping from the proposed one, it is evident that the sensitivity of the parameterisation, to the value of the constant κ of the exponential formula and to the type of the equation itself, is very low. Compared to the ND case the differences are even lower, ranging between ±9%, ±4% and ±5% for surficial, suspended and deposited particles, respectively. It is noted that the number of particles that escaped the domain through the open boundaries also presented a non-linear response to the variation of the applied damping and low fluctuations, of the order of ±5%.
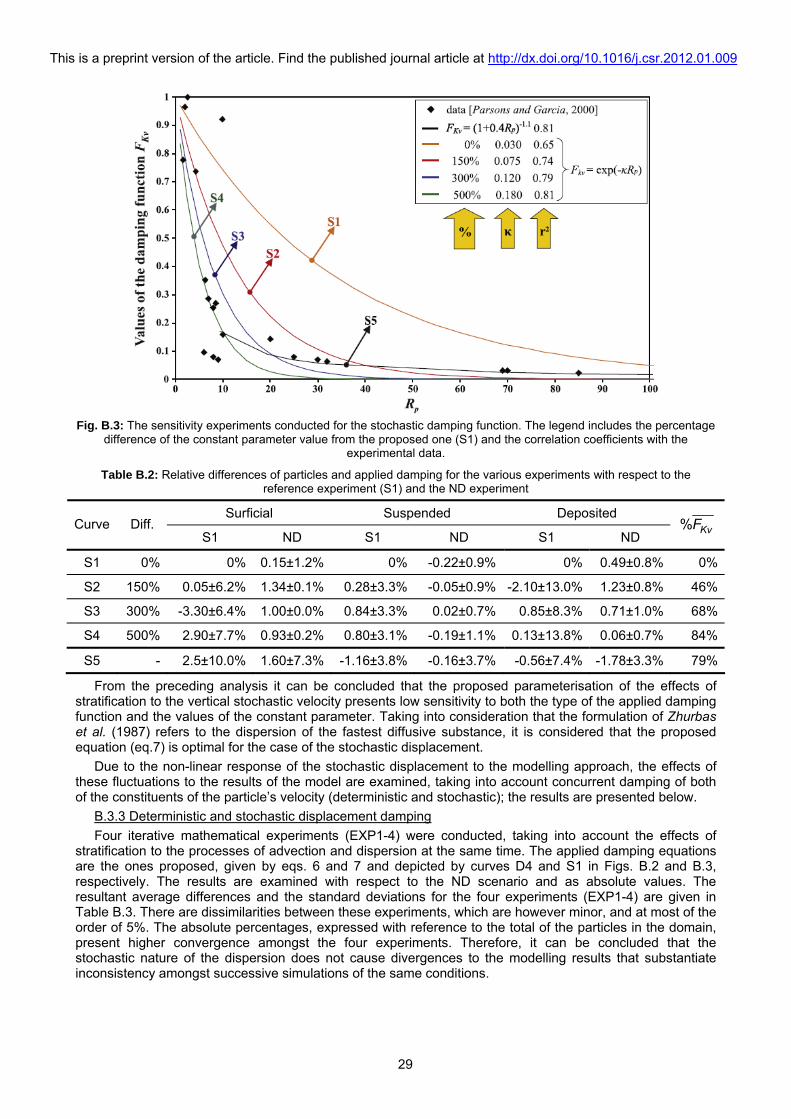
This is a preprint version of the article. Find the published journal article at http://dx.doi.org/10.1016/j.csr.2012.01.009
29
Fig. B.3: The sensitivity experiments conducted for the stochastic damping function. The legend includes the percentage
difference of the constant parameter value from the proposed one (S1) and the correlation coefficients with the experimental data.
Table B.2: Relative differences of particles and applied damping for the various experiments with respect to the reference experiment (S1) and the ND experiment
Surficial Suspended Deposited Curve Diff.
S1 ND S1 ND S1 ND % KvF
S1 0% 0% 0.15±1.2% 0% -0.22±0.9% 0% 0.49±0.8% 0%
S2 150% 0.05±6.2% 1.34±0.1% 0.28±3.3% -0.05±0.9% -2.10±13.0% 1.23±0.8% 46%
S3 300% -3.30±6.4% 1.00±0.0% 0.84±3.3% 0.02±0.7% 0.85±8.3% 0.71±1.0% 68%
S4 500% 2.90±7.7% 0.93±0.2% 0.80±3.1% -0.19±1.1% 0.13±13.8% 0.06±0.7% 84%
S5 - 2.5±10.0% 1.60±7.3% -1.16±3.8% -0.16±3.7% -0.56±7.4% -1.78±3.3% 79%
From the preceding analysis it can be concluded that the proposed parameterisation of the effects of stratification to the vertical stochastic velocity presents low sensitivity to both the type of the applied damping function and the values of the constant parameter. Taking into consideration that the formulation of Zhurbas et al. (1987) refers to the dispersion of the fastest diffusive substance, it is considered that the proposed equation (eq.7) is optimal for the case of the stochastic displacement.
Due to the non-linear response of the stochastic displacement to the modelling approach, the effects of these fluctuations to the results of the model are examined, taking into account concurrent damping of both of the constituents of the particle’s velocity (deterministic and stochastic); the results are presented below.
B.3.3 Deterministic and stochastic displacement damping
Four iterative mathematical experiments (EXP1-4) were conducted, taking into account the effects of stratification to the processes of advection and dispersion at the same time. The applied damping equations are the ones proposed, given by eqs. 6 and 7 and depicted by curves D4 and S1 in Figs. B.2 and B.3, respectively. The results are examined with respect to the ND scenario and as absolute values. The resultant average differences and the standard deviations for the four experiments (EXP1-4) are given in Table B.3. There are dissimilarities between these experiments, which are however minor, and at most of the order of 5%. The absolute percentages, expressed with reference to the total of the particles in the domain, present higher convergence amongst the four experiments. Therefore, it can be concluded that the stochastic nature of the dispersion does not cause divergences to the modelling results that substantiate inconsistency amongst successive simulations of the same conditions.

This is a preprint version of the article. Find the published journal article at http://dx.doi.org/10.1016/j.csr.2012.01.009
30
Table B.3: Relative differences of particles with respect to the reference conditions (ND) and absolute values of the particle percentages in each state for the four experiments
Relative differences Absolute particle percentages EXP Surficial Suspended Deposited Surficial Suspended Deposited
1 4.0±7.3% -0.4±3.2% -3.7±13.0% 14.7±4.5% 25.1±16.3% 60.2±19.5%
2 4.1±7.2% -1.5±2.8% -6.0±11.3% 14.9±4.9% 25.3±16.6% 59.8±20.4%
3 4.1±6.2% -0.6±2.8% -0.6±13.3% 14.5±4.3% 24.7±16.1% 60.8±19.0%
4 5.3±5.5% -1.4±3.1% -5.7±10.1% 15.0±4.5% 25.3±16.5% 59.7±19.7%
B.4 Concluding comments
The extensive analysis performed to investigate the model’s sensitivity to the proposed damping equations confirmed the low sensitivity of the results to the values of the constants of the proposed damping equations, as well as to the form of the applied damping functions. Especially for the case of the deterministic displacement the response of the system was found to be strongly linear. The response of particle distribution with depth to the variations of the applied damping was reasonable and physically interpretable. Application of a different equation, on the one hand, failed to increase the correlation to the experimental data and, on the other, affected the results to a minor extent. For the case of the stochastic velocity the sensitivity to the applied damping was particularly low. Even though changing the type of stochastic damping equation significantly improved the approximation of the experimental data, the variations caused to the modelling results were still minor. The response to the changes of the applied damping was strongly non-linear, due to the stochastic nature of the dispersion that causes rather random variations to the results of the model. However, these variations are low and do not cause inconsistencies in FSTM modelling results; repetitive simulations of the same field conditions presented small differences in their results.
Related Documents