ORIGINAL ARTICLE Fine Particulate Matter Air Pollution, Proximity to Traffic, and Aortic Atherosclerosis Ryan W. Allen, a Michael H. Criqui, b Ana V. Diez Roux, c Matthew Allison, b Steven Shea, d Robert Detrano, e Lianne Sheppard, f,g Nathan D. Wong, h Karen Hinckley Stukovsky, g and Joel D. Kaufman f Background: The initiation and acceleration of atherosclerosis is hypothesized as a physiologic mechanism underlying associations between air pollution and cardiovascular effects. Despite toxicologic evidence, epidemiologic data are limited. Methods: In this cross-sectional analysis we investigated exposure to fine particulate matter (PM 2.5 ) and residential proximity to major roads in relation to abdominal aortic calcification, a sensitive indi- cator of systemic atherosclerosis. Aortic calcification was measured by computed tomography among 1147 persons, in 5 US metropol- itan areas, enrolled in the Multi-Ethnic Study of Atherosclerosis. The presence and quantity of aortic calcification were modeled using relative risk regression and linear regression, respectively, with adjustment for potential confounders. Results: We observed a slightly elevated risk of aortic calcification (RR 1.06; 95% confidence interval 0.96 –1.16) with a 10 g/m 3 contrast in PM 2.5 . The PM 2.5 -associated risk of aortic calcification was stronger among participants with long-term residence near a PM 2.5 monitor (RR 1.11; 1.00 –1.24) and among participants not recently employed outside the home (RR 1.10; 1.00 –1.22). PM 2.5 was not associated with an increase in the quantity of aortic calcification (Agatston score) and no roadway proximity effects were noted. There was indication of PM 2.5 effect modification by lipid-lowering medica- tion use, with greater effects among users, and PM 2.5 associations were observed most consistently among Hispanics. Conclusions: Although we did not find persuasive associations across our full study population, associations were stronger among participants with less exposure misclassification. These findings support the hypothesis of a relationship between particulate air pollution and systemic atherosclerosis. (Epidemiology 2009;20: 254 –264) E pidemiologic studies have demonstrated that long-term exposure to ambient air pollution, especially fine partic- ulate matter (PM 2.5 ), is associated with cardiovascular mor- bidity and mortality. 1 Recent evidence suggests that particles and other pollutants generated by traffic may be important contributors to the cardiovascular effects of air pollution. 2–4 The initiation and acceleration of atherosclerosis has been hypothesized as a physiologic pathway through which particles exert cardiovascular effects. 1,5,6 Acute air pollution exposure has been linked to pulmonary and systemic inflam- mation 7,8 and repeated inflammatory responses may lead to accelerated atherosclerosis. 5,9 There is toxicologic evidence of a link between PM exposure and atherosclerosis. 10 –12 However, there is only lim- ited cross-sectional epidemiologic evidence of a relationship between air pollution and atherosclerosis in humans. In Los Angeles, Kunzli et al 13 studied 859 adult participants from the baseline assessment of 2 clinical trials and examined carotid intima-media thickness in relation to PM 2.5 con- centrations interpolated to participants’ zip code centroids. They reported a 4% increase in intima-media thickness associated with a 10-g/m 3 contrast in PM 2.5 . Greater effect estimates were reported for those taking lipid-low- ering medications, women, and those 60 years or older. A recent investigation of 4494 persons in Germany found that proximity to major roads was associated with in- creases in coronary artery calcification, and PM 2.5 was associated with coronary artery calcification among indi- viduals who had not worked full-time in the previous 5 years. 4 The strongest roadway associations were among men and less-educated participants. Using data from the Multi-Ethnic Study of Atherosclerosis (MESA), we re- cently analyzed PM 2.5 and PM 10 exposure in relation to coronary artery calcium, carotid intima-media thickness, and ankle-brachial index. 14 We found significant associa- tions only for carotid intima-media thickness. Submitted 9 February 2008; accepted 27 May 2008; posted 5 January 2009. From the a Faculty of Health Sciences, Simon Fraser University, Burnaby, BC, Canada; b Department of Family and Preventive Medicine, Univer- sity of California at San Diego, San Diego, CA; c Department of Epide- miology, University of Michigan, Ann Arbor, MI; d Departments of Medicine and Epidemiology, Columbia University, New York, NY; e Department of Radiological Sciences, University of California at Irvine, Irvine, CA; f Department of Environmental and Occupational Health Sciences, University of Washington, Seattle, WA; g Department of Bio- statistics, University of Washington, Seattle, WA; and h Department of Cardiology, University of California at Irvine, Irvine, CA. Supported by grants N01-HC-95159 –N01-HC-95161, N01-HC-95163–N01- HC-95165, and N01-HC-95169 from the National Heart, Lung, and Blood Institute (NHLBI), and grants HL72403 (NHLBI), ES013195 and K24ES013195 (NIEHS), and R830543 and R831697 (US EPA). Correspondence: Ryan Allen, Simon Fraser University, 8888 University Drive, Burnaby, BC V5A 1S6, Canada. E-mail: [email protected]. Copyright © 2009 by Lippincott Williams & Wilkins ISSN: 1044-3983/09/2002-0254 DOI: 10.1097/EDE.0b013e31819644cc Epidemiology • Volume 20, Number 2, March 2009 254

Welcome message from author
This document is posted to help you gain knowledge. Please leave a comment to let me know what you think about it! Share it to your friends and learn new things together.
Transcript
ORIGINAL ARTICLE
Fine Particulate Matter Air Pollution, Proximity to Traffic,and Aortic Atherosclerosis
Ryan W. Allen,a Michael H. Criqui,b Ana V. Diez Roux,c Matthew Allison,b Steven Shea,d
Robert Detrano,e Lianne Sheppard,f,g Nathan D. Wong,h Karen Hinckley Stukovsky,g
and Joel D. Kaufmanf
Background: The initiation and acceleration of atherosclerosis ishypothesized as a physiologic mechanism underlying associationsbetween air pollution and cardiovascular effects. Despite toxicologicevidence, epidemiologic data are limited.Methods: In this cross-sectional analysis we investigated exposureto fine particulate matter (PM2.5) and residential proximity to majorroads in relation to abdominal aortic calcification, a sensitive indi-cator of systemic atherosclerosis. Aortic calcification was measuredby computed tomography among 1147 persons, in 5 US metropol-itan areas, enrolled in the Multi-Ethnic Study of Atherosclerosis.The presence and quantity of aortic calcification were modeled usingrelative risk regression and linear regression, respectively, withadjustment for potential confounders.Results: We observed a slightly elevated risk of aortic calcification(RR � 1.06; 95% confidence interval � 0.96–1.16) with a 10 �g/m3
contrast in PM2.5. The PM2.5-associated risk of aortic calcification wasstronger among participants with long-term residence near a PM2.5
monitor (RR � 1.11; 1.00–1.24) and among participants not recentlyemployed outside the home (RR � 1.10; 1.00–1.22). PM2.5 was notassociated with an increase in the quantity of aortic calcification(Agatston score) and no roadway proximity effects were noted. Therewas indication of PM2.5 effect modification by lipid-lowering medica-tion use, with greater effects among users, and PM2.5 associations wereobserved most consistently among Hispanics.Conclusions: Although we did not find persuasive associationsacross our full study population, associations were stronger amongparticipants with less exposure misclassification. These findings
support the hypothesis of a relationship between particulate airpollution and systemic atherosclerosis.
(Epidemiology 2009;20: 254–264)
Epidemiologic studies have demonstrated that long-termexposure to ambient air pollution, especially fine partic-
ulate matter (PM2.5), is associated with cardiovascular mor-bidity and mortality.1 Recent evidence suggests that particlesand other pollutants generated by traffic may be importantcontributors to the cardiovascular effects of air pollution.2–4
The initiation and acceleration of atherosclerosis hasbeen hypothesized as a physiologic pathway through whichparticles exert cardiovascular effects.1,5,6 Acute air pollutionexposure has been linked to pulmonary and systemic inflam-mation7,8 and repeated inflammatory responses may lead toaccelerated atherosclerosis.5,9
There is toxicologic evidence of a link between PMexposure and atherosclerosis.10–12 However, there is only lim-ited cross-sectional epidemiologic evidence of a relationshipbetween air pollution and atherosclerosis in humans. In LosAngeles, Kunzli et al13 studied 859 adult participants from thebaseline assessment of 2 clinical trials and examinedcarotid intima-media thickness in relation to PM2.5 con-centrations interpolated to participants’ zip code centroids.They reported a 4% increase in intima-media thicknessassociated with a 10-�g/m3 contrast in PM2.5. Greatereffect estimates were reported for those taking lipid-low-ering medications, women, and those 60 years or older. Arecent investigation of 4494 persons in Germany foundthat proximity to major roads was associated with in-creases in coronary artery calcification, and PM2.5 wasassociated with coronary artery calcification among indi-viduals who had not worked full-time in the previous 5years.4 The strongest roadway associations were amongmen and less-educated participants. Using data from theMulti-Ethnic Study of Atherosclerosis (MESA), we re-cently analyzed PM2.5 and PM10 exposure in relation tocoronary artery calcium, carotid intima-media thickness,and ankle-brachial index.14 We found significant associa-tions only for carotid intima-media thickness.
Submitted 9 February 2008; accepted 27 May 2008; posted 5 January 2009.From the aFaculty of Health Sciences, Simon Fraser University, Burnaby,
BC, Canada; bDepartment of Family and Preventive Medicine, Univer-sity of California at San Diego, San Diego, CA; cDepartment of Epide-miology, University of Michigan, Ann Arbor, MI; dDepartments ofMedicine and Epidemiology, Columbia University, New York, NY;eDepartment of Radiological Sciences, University of California at Irvine,Irvine, CA; fDepartment of Environmental and Occupational HealthSciences, University of Washington, Seattle, WA; gDepartment of Bio-statistics, University of Washington, Seattle, WA; and hDepartment ofCardiology, University of California at Irvine, Irvine, CA.
Supported by grants N01-HC-95159–N01-HC-95161, N01-HC-95163–N01-HC-95165, and N01-HC-95169 from the National Heart, Lung, andBlood Institute (NHLBI), and grants HL72403 (NHLBI), ES013195 andK24ES013195 (NIEHS), and R830543 and R831697 (US EPA).
Correspondence: Ryan Allen, Simon Fraser University, 8888 UniversityDrive, Burnaby, BC V5A 1S6, Canada. E-mail: [email protected].
Copyright © 2009 by Lippincott Williams & WilkinsISSN: 1044-3983/09/2002-0254DOI: 10.1097/EDE.0b013e31819644cc
Epidemiology • Volume 20, Number 2, March 2009254

Our objective was to build on this nascent under-standing of the relationship between air pollution andatherosclerosis in humans. Here we report the results of across-sectional analysis of the relationship between bothPM2.5 concentrations and residential proximity to majorroadways and atherosclerosis of the abdominal aortaamong a multiethnic group of individuals in 5 metropolitanareas in the United States.
Although initially investigated as a marker of periph-eral vascular disease, calcification of the aorta has emerged asa measure of systemic atherosclerosis.15 Atherosclerosis ofthe aorta is associated with atherosclerosis of the carotid andcoronary arteries16–18 and with cardiovascular mortality andmorbidity.19–22 In addition, aortic calcification is associatedwith many traditional cardiovascular risk factors includingage, smoking, total cholesterol, hypertension, and diabetesmellitus.18,23–26 Lipid-lowering therapy has been found toslow the progression of abdominal aortic plaques,27 and thereis evidence that the development of atherosclerosis in womenaccelerates after menopause.18 The prevalence and extent ofabdominal aortic calcium is generally greater than coronaryartery calcium for both sexes after age 50.18,28 The lowerfrequency of 0 values for aortic calcification makes it a usefulmeasure in epidemiologic studies.
METHODSAortic calcification data, information on potential con-
founders, and participants’ residence locations were collectedas part of MESA29 and 2 MESA ancillary studies: the MESAAortic Calcium Study and the MESA Neighborhood Study.The study design and data collection methods for MESA havebeen previously described.29 In summary, 6814 men andwomen aged 45–84 years and without clinical cardiovasculardisease representing 4 ethnic groups (black, Chinese, His-panic, and white) were recruited starting in 2000 from 6 areasin the United States: Baltimore City and Baltimore County,MD; Chicago, IL; Forsyth County (Winston-Salem), NC; LosAngeles County, CA; Manhattan and the Bronx, NY; and St.Paul, MN. Participants were recruited using a variety ofpopulation-based approaches including lists of area residents(all sites), Health Care Financing Administration lists of arearesidents (for participants 65 years and older at all sites), arearesidents enrolled in a union health plan (New York), andrandom digit dialing (New York and Los Angeles). Fourclinical examinations were conducted at about 18-monthintervals. Each examination included a variety of assessmentsand measurements of cardiovascular risk factors, as well asthe administration of questionnaires to assess personal his-tory, behaviors, and socioeconomic characteristics. All of theparticipating centers’ institutional review boards approvedthe study and all study participants gave informed consent.
Abdominal Aortic CalciumA group of 1965 MESA participants were randomly
selected from all but the Maryland center for enrollment inthe MESA Aortic Calcium ancillary study. Scanning centersassessed abdominal aortic calcification by computed tomog-raphy (CT) using either an electron-beam CT or multidetectorCT scanner. Certified technologists scanned all participantsover phantoms of known physical calcium concentration.Scanning teams attempted to include the segment of the aortabetween its bifurcation and a point 8-cm cephalad to thebifurcation by scanning between the superior plate of the firstsacral vertebra and a point 15-cm cephalad.
A single radiologist read and assessed all CT scans at acentral reading center (LA Biomedical Research Institute atHarbor-UCLA in Torrance, CA) by using an interactivescoring system similar to that used by Yaghoubi et al.30 Thereader-work station interface identified and quantified calci-fication from images calibrated using readings of the calciumphantom. The quantitative measure of interest for analysiswas the Agatston score of the abdominal aorta.31
Although aortic calcification was quantified from onlya single scan, Budoff et al32 recently reported on the repro-ducibility of calcium scores from the thoracic aorta in MESA.Interscan variability (ie, different scan, same reader) was17%–18%, interreader variability (ie, same scan, differentreader) was 3%–7%, and intrareader variability (ie, samescan, same reader) was 0.4%–1.4%.
Residence LocationsA subset of MESA participants who agreed to partici-
pate in the MESA Neighborhood ancillary study had theirresidential addresses at baseline geocoded into a latitude/longitude location. Geocoding was conducted using the year2006 TeleAtlas Dynamap/2000 road network. The percentageof addresses that were successfully geocoded was 97%, andranged from 93% in New York to 99% in St. Paul.
Exposure AssessmentOur exposure assessment approach was intended to cap-
ture exposure to both urban background PM2.5 and traffic-generated pollutant concentrations.3 The background PM2.5
concentration within urban areas is generally spatiallyhomogeneous,33 whereas the concentrations of traffic-gener-ated pollutants vary on a much smaller spatial scale.34,35 Be-cause of a lack of routine pollution monitoring near roads,residential proximity to major roads is frequently used asa surrogate for traffic exposure in epidemiologic studies ofcardiovascular and respiratory effects.2– 4 This approach issupported by data showing that the concentrations oftraffic pollutants decay sharply as a function of distancefrom the roadway’s edge.36,37
We assigned PM2.5 exposure based on the averageconcentrations over the 2-year period from October 2000through September 2002. Concentrations over this period are
Epidemiology • Volume 20, Number 2, March 2009 Air Pollution, Proximity to Traffic, and Aortic Atherosclerosis
© 2009 Lippincott Williams & Wilkins 255

assumed to be representative of longer-term past exposures.This averaging period was selected because the US nationalPM2.5 monitoring network was fully deployed beginning in2000 and aortic CT scans were begun in September 2002.PM2.5 data were obtained from the Environmental ProtectionAgency’s Aerometric Information Retrieval System. Moni-toring sites were included if they met the following criteria:(1) a monitoring objective of “population exposure,” “re-gional transport,” or “general/background”; and (2) at least50% data reporting in each of the 8 3-month periods over theaveraging time of interest. The number of PM2.5 monitorsmeeting the above criteria and located within 50 km of astudy participant’s residence ranged from 3 in ForsythCounty, NC to 21 in Chicago. In cities with at least 10monitoring sites (Chicago, Los Angeles, and New York),we used universal kriging to interpolate the 2-year averagePM2.5 concentration to the participants’ residence loca-tions. Exposures in St. Paul and Forsyth County were as-signed based on inverse distance weighting (1/distance2). The
average (�standard deviation �SD�) distance from partici-pants’ residences to the nearest PM2.5 monitor in each cityranged between 2.2 � 1.1 km in New York and 7.1 � 4.5 kmin Forsyth County. The maximum distance from any partic-ipant’s residence to the closest PM2.5 monitor was 21.0 km;therefore, no participants were excluded based on distance tothe nearest monitor.
We assigned traffic exposure by using a binary variablebased on residential proximity to major roads. Participantswere considered exposed to traffic pollution if they residedwithin 100 m of the centerline of a highway or within 50 mof the centerline of a major arterial road, where road typeswere defined using the TeleAtlas road network’s classifica-tion system. We defined highways as those with feature classcodes A1 or A2 and major arterial roads as those with featureclass A3. Our roadway distance criteria of 50 and 100 m wereselected to be consistent both with 2 previous investigationsof traffic pollution-related health effects2,3 and with data onpollutant concentrations as a function of distance from roads.
TABLE 1. Summary Statistics (Mean � SD or Percent) for Participant Characteristics and Exposure Variables
VariableChicago
(n � 270)Los Angeles
(n � 188)New York(n � 275)
St. Paul(n � 234)
Winston-Salem(n � 180)
All(n � 1147)
Age (y) 65.9 � 9.3 65.8 � 9.9 65.9 � 9.4 65.5 � 9.2 66.2 � 9.7 65.9 � 9.4
Female (%) 51 48 56 46 51 50
Ethnicity (%)
Black 26 8 29 0 41 21
Chinese 27 23 �1 0 0 10
Hispanic 0 47 50 37 0 27
White 47 22 21 63 59 42
Annual income (%)
�$20,000 8 34 31 17 14 20
$20,000–49,999 30 36 42 50 38 39
�$50,000 62 31 28 33 48 41
Education (%)
�High school graduate 4 30 30 12 7 17
High school graduate 34 45 42 64 57 47
College graduate 62 25 28 24 36 36
BMI (kg/m2) 26.4 � 4.7 28.2 � 5.4 28.9 � 5.7 29.6 � 4.7 28.5 � 5.2 28.3 � 5.3
BMI �30 (%) 16 30 38 43 34 32
Diabetes (%) 10 21 16 16 15 15
SBP (mm Hg) 121.2 � 19.9 124.4 � 21.2 125.1 � 20.9 123.3 � 20.5 129.4 � 22.3 124.4 � 21.0
DBP (mm Hg) 69.2 � 10.2 67.8 � 10.1 70.6 � 9.5 70.0 � 9.4 69.9 � 9.5 69.6 � 9.8
HDL (mg/dL) 57.8 � 17.9 50.1 � 15.4 52.6 � 15.1 49.6 � 13.2 50.3 � 14.0 52.4 � 15.6
LDL (mg/dL) 110.1 � 30.2 114.6 � 31.4 111.1 � 33.4 115.3 � 31.7 107.9 � 29.6 111.8 � 31.5
Lipid-lowering medications (%) 22 26 27 29 24 26
Antihypertension medications (%) 40 48 49 42 54 46
Smoking (pack-y) 12.3 � 23.9 7.1 � 15.4 10.7 � 19.5 13.3 � 21.1 21.5 � 53.4 12.7 � 28.6
Smoking status (%)
Never 50 55 52 47 45 50
Former 40 37 39 39 42 39
Current 9 9 10 14 13 11
PM2.5 (�g/m3) 16.0 � 0.3 22.8 � 0.9 15.5 � 0.4 10.9 � 0.1 15.3 � 0.3 15.8 � 3.6
Near road (%) 29 16 58 21 19 31
Allen et al Epidemiology • Volume 20, Number 2, March 2009
© 2009 Lippincott Williams & Wilkins256
All roadway proximity calculations, interpolation of PM2.5
concentrations, and PM2.5 exposure assignments were con-ducted using ArcGIS 9 (ESRI, Redlands, CA).
Data ReductionA total of 1879 participants had a valid abdominal aortic
CT scan and an address that was successfully geocoded. Weremoved 196 participants without complete data on the follow-ing potential confounders: age, sex, race/ethnicity, body massindex (BMI), smoking status, smoking history (ie, pack-years),diabetes, education, income, blood pressure, blood lipid concen-trations, and medication use. To minimize exposure misclassi-fication under the assumption that our exposure assignmentsrepresent long-term past exposures, we excluded an additional555 participants who had not lived in the same area for at least10 years before MESA examination 1, when addresses forgeocoding were obtained. The final group of residentially stableparticipants included 1147 persons (Table 1). In our sensitivityanalysis we used multiple imputation methods (SAS PROC MI andPROC MIANALYZE) to include the 122 residentially stable par-ticipants with missing covariate data and to estimate PM2.5 androadway proximity effects among the full group of 1269 residen-tially stable participants.
Data AnalysisBecause abdominal aortic calcification was not detect-
able in every study participant, we selected a priori a 2-partmodeling approach consistent with previous MESA analy-ses.38 First, we modeled the relative risk of having anydetectable calcification among the full group of participants.For common outcomes, relative risk regression is desirablebecause it prevents misinterpretation of odds ratios.39 Theprobability of a nonzero calcification score was modeledusing the GENMOD procedure in SAS (SAS 9.1, Cary, NC).We used a log link and a Gaussian error model with robuststandard errors; this approach was necessary to avoid con-vergence problems associated with a binomial error model.
Relative risks are based on the exponent of the model’scoefficients. In our sensitivity analysis, we also used a mod-ified Poisson regression with robust error variance.40
The second analysis step was a multiple linear regres-sion of the log-transformed Agatston score among those withany calcification (Table 2). We report these results as thepercent change in the Agatston score. All PM2.5 effect esti-mates for both modeling steps are reported per 10-�g/m3
exposure contrast. In our sensitivity analysis, we also mod-eled the Agatston score among all participants by adding 1before log-transforming.
With the exception of residential location, which wascollected only at study entry (examination 1), all subject-specific data used in this analysis were collected during theexamination in which the abdominal CT scan was performed(2 or 3). Our fully adjusted models included age, sex, race/ethnicity, BMI, smoking status (never, former, current), pack-years of smoking, diabetes (treated or untreated diabetesbased on 2003 American Diabetes Association fasting crite-ria), education (�high school degree, high school graduate orequivalent, and college graduate), annual income (�$20,000,$20,000–$49,999, and �$50,000), blood lipid concentration(high-density, and low-density lipids), blood pressure (sys-tolic and diastolic), and medications (lipid lowering andantihypertensives).
From the literature we identified potential effect modifiers,and as part of our exploratory analyses we tested for heteroge-neity in the PM2.5 and near road effects by sex,13,41 age,13,41
diabetes,8,42 obesity (BMI �30 kg/m2),8 the use of lipid-lower-ing medications,13 education,43 and income.44 In addition, theinclusion of multiple race/ethnicities is a major strength of thiscohort, and we explored effects within each race/ethnic group.We conducted several sensitivity analyses to evaluate the impacton the effect estimates of our modeling approach, exposureassessment methods, and participant inclusion criteria. We alsoevaluated the impact of employment status on our estimates;
TABLE 2. Abdominal Aortic Calcium Summary Statistics by City and CT Scanner
City ScannerScanner
TechnologyNo. Participants
ScannedScans With Detectable
Calcium (%)
Median (25%–75%)Agatston
Score (if >0)
Mean (�SD)Log-Transformed
Agatston Score (if >0)
Chicago Imatron C-150 EBT 270 191 (71) 634 (149–2361) 6.25 � 1.86
Los Angeles Imatron C-150 EBT 188 145 (77) 994 (234–2877) 6.51 � 1.74
New York Imatron C-150 EBT 236 153 (65) 557 (126–2003) 6.08 � 1.95
Siemens sensations 64 MDCT 39 33 (85) 626 (282–2180) 6.58 � 1.66
St. Paul Siemens S4 volume zoom MDCT 137 108 (79) 1199 (162–3740) 6.64 � 1.82
Siemens sensations 16 MDCT 97 80 (82) 812 (209–3032) 6.57 � 1.76
Winston-Salem GE lightspeed MDCT 180 141 (78) 1297 (248–3129) 6.60 � 1.83
All EBT EBT 694 489 (71) 750 (151–2293) 6.27 � 1.86
All MDCT MDCT 453 362 (80) 1026 (233–3129) 6.60 � 1.79
All 1147 851 (74%) 836 (166–2680) 6.41 � 1.84
EBT indicates electron-beam CT; MDCT, multidetector CT.
Epidemiology • Volume 20, Number 2, March 2009 Air Pollution, Proximity to Traffic, and Aortic Atherosclerosis
© 2009 Lippincott Williams & Wilkins 257

because we used residence location to assign exposure, ourexposure estimates may have been more accurate for those notworking outside the home. Participants were considered em-ployed if they reported working or volunteering at any studyexamination up to the time of the abdominal CT scan. Partici-pants who were unemployed, retired, or homemakers at eachstudy examination up to the time of the abdominal CT scan wereconsidered not employed.
RESULTSSummary statistics of participant characteristics and exposure
variables are presented in Table 1. The average age (�SD) of studyparticipants was 65.9 � 9.4 years (range, 46–88) and was similaracross cities. Whites comprised approximately 40% of the cohortand were the only racial/ethnic group represented in all cities.Blacks and Hispanics each comprised about 1 quarter of the cohort,and Chinese-Americans about 10%. Los Angeles was the only citywith a significant number of participants from all 4 racial/ethnicgroups. Some differences in socioeconomic status (as indicated byincome and education) among cities were observed, with the lowestoverall socioeconomic status in Los Angeles and the highest inChicago. About 40% of the participants were former smokers and10% were current smokers. Employment/volunteer status was as-sessed from baseline to the time of the abdominal CT scan (anaverage duration of 2.7 years; range, 1.1–4.8 years); 63% of allparticipants (68% of men and 58% of women) worked or volun-teered during this period.
Estimates of individual PM2.5 exposure ranged from10.6–24.7 �g/m3 (the US National Ambient Air QualityStandard for annual average PM2.5 concentration is 15 �g/m3). There was considerable variability in estimated PM2.5
exposure between cities (ranging from a mean of 10.9 �g/m3
in St. Paul to 22.8 �g/m3 in Los Angeles), but very littlewithin-city variability (Table 1). In fact, 98% of the totalvariance in PM2.5 exposure was between cities. This lack ofwithin-city variability in exposure is due to both the spatialhomogeneity of PM2.5 concentrations and the fact that thestudy participants were clustered in relatively small geo-graphic areas. Because not all racial/ethnic groups werepresent in St. Paul, blacks (14.4–23.2 �g/m3) and Chinese(14.3–24.4 �g/m3) had smaller ranges of PM2.5 exposure thanHispanics (10.7–24.7 �g/m3) and whites (10.6–24.3 �g/m3).Overall, 31% of the cohort was classified as living near amajor road, ranging from 16% in Los Angeles to 58% in NewYork. PM2.5 exposures were similar for participants living“near” (n � 350; mean PM2.5 � 15.6 � 2.8 �g/m3) and “far”(n � 797; mean PM2.5 � 15.9 � 3.9 �g/m3) from majorroads because our PM prediction approach did not accountfor roadway proximity.
CT Scanner TechnologyOverall, abdominal aortic calcification was detected on
74% of the CT scans (Table 2). The electron-beam scannersdetected calcium on 71% (489 of 694) of scans, whereas 80%
(362 of 453) of scans from the multidetector CT scannersdetected calcium (�2 � 12.8; P � 0.001). The mean � SDlog-transformed Agatston score from electron-beam and multi-detector scanners were 6.27 � 1.86 and 6.60 � 1.79, respec-tively (P � 0.01, 2-sample t test). These differences in bothcalcium prevalence and Agatston score persisted after adjust-ment for important risk factors. We therefore determined it wasnecessary to adjust for scanner technology in all models. Ad-justing for scanner technology was preferable to adjusting forindividual scanner because the former allowed us to retain thefull between-city PM2.5 exposure contrast. Participants scannedusing electron-beam technology had higher mean PM2.5 concen-trations (17.7 � 3.2 �g/m3 vs. 13.0 � 2.2 �g/m3) and residedmore frequently near a major road (36% vs. 23%) than thosescanned on multidetector CT machines.
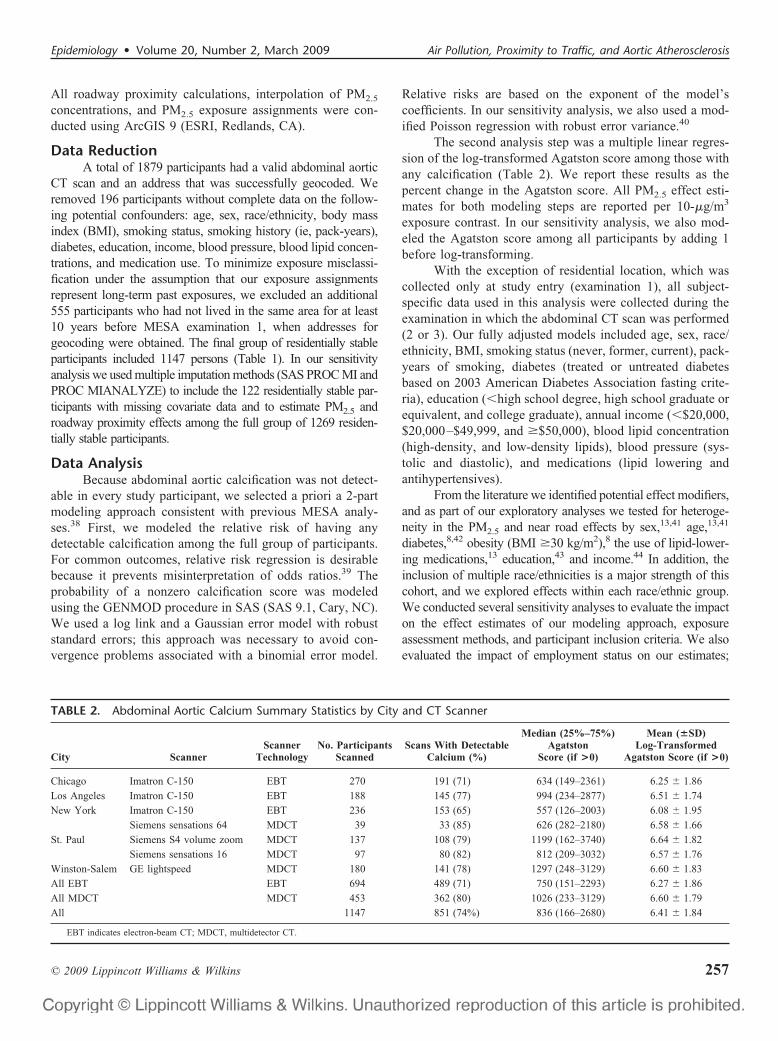
Detectable Abdominal Aortic CalciumWe estimated the risk of nonzero Agatston score in 6 models
with increasing adjustment for confounders (Fig. 1). In the crudemodel (adjusting only for CT scanner technology) PM2.5 wasassociated with elevated risk of calcification (RR � 1.15; 95%confidence interval � 1.02–1.29). The PM2.5 effect estimate re-mained elevated (RR � 1.09–1.11) under increasing adjustment forcovariates until blood lipids, blood pressure, and medications wereincluded in the model (models 1–4 in Fig. 1). The inclusion ofblood lipids and lipid-lowering medications attenuated the effectestimate to 1.07 (0.98–1.17), and the estimate relative risk wasfurther attenuated (RR � 1.06; 0.96–1.16) after also adjusting forblood pressure and use of antihypertensive medications. Adjust-ment for age and antihypertensive medications caused the greatestattenuation of the PM2.5 effect estimate from the crude (scannertechnology only) model (Fig. 1). Use of a modified Poissonregression approach had little impact on the fully adjustedPM2.5 (RR � 1.06; 0.95–1.19) and roadway proximityeffect estimates. No associations were found betweenaortic calcification and proximity to roads.
As part of our exploratory analyses, we estimated PM2.5
and roadway proximity effects after stratifying by several factors(Fig. 2). There was a trend of an increasing roadway proximityeffect with increasing income (trend P � 0.01) and someindication of differences in PM2.5 effect after stratifying by sex(greater effect among women, interaction P � 0.13) and lipid-lowering medication use (greater effect among users, interactionP � 0.13). PM2.5 was associated with elevated risks of calcifi-cation among women (RR � 1.14; 1.00–1.30; n � 578),persons older than 65 years (RR � 1.10; 1.01–1.19; n �602), users of lipid-lowering medications (RR � 1.14;1.00 –1.30; n � 293), and Hispanics (RR � 1.22; 1.03–1.45; n � 311). A near-road effect was found amongparticipants earning over $50,000 per year (RR � 1.09;1.00 –1.19; n � 466).
We conducted several sensitivity analyses. After imputingmissing covariates we estimated an elevated PM2.5 relative riskamong the complete group of 1269 residentially stable partici-
Allen et al Epidemiology • Volume 20, Number 2, March 2009
© 2009 Lippincott Williams & Wilkins258
pants (RR � 1.08; 0.98–1.19). We also evaluated the sensitivityof the effect estimates to several factors hypothesized to affectPM2.5 exposure accuracy, including our a priori criteria forresidential stability (�10 years) and proximity to a PM2.5 mon-itor (all participants included) (Table 3). More restrictive criteriaresulted in greater point estimates, and among participants re-siding at their current address for at least 20 years and within 10km of a PM2.5 monitor (n � 689) the estimated PM2.5 relativerisk was 1.11 (1.00–1.24). PM2.5 relative risks were also ele-vated among participants who did not work from baseline to thetime of the CT scan (RR � 1.10; 1.00–1.22; n � 424) andparticipants who did not reside near a major road (RR � 1.10;0.99–1.23; n � 797).
As an alternative to kriging and inverse distanceweighting, we estimated effects after assigning PM2.5 expo-
sure for all participants by using the concentration measuredat the monitor nearest the residence. This approach had littleimpact on the estimates (PM2.5 RR � 1.05; 0.96–1.15). Wealso modeled the relative risk of being in the top quartile ofAgatston score (ie, Agatston score �1806); no effects werenoted for PM2.5 (RR � 1.20; 0.94–1.53) or residing near amajor road (1.04; 0.89–1.22).
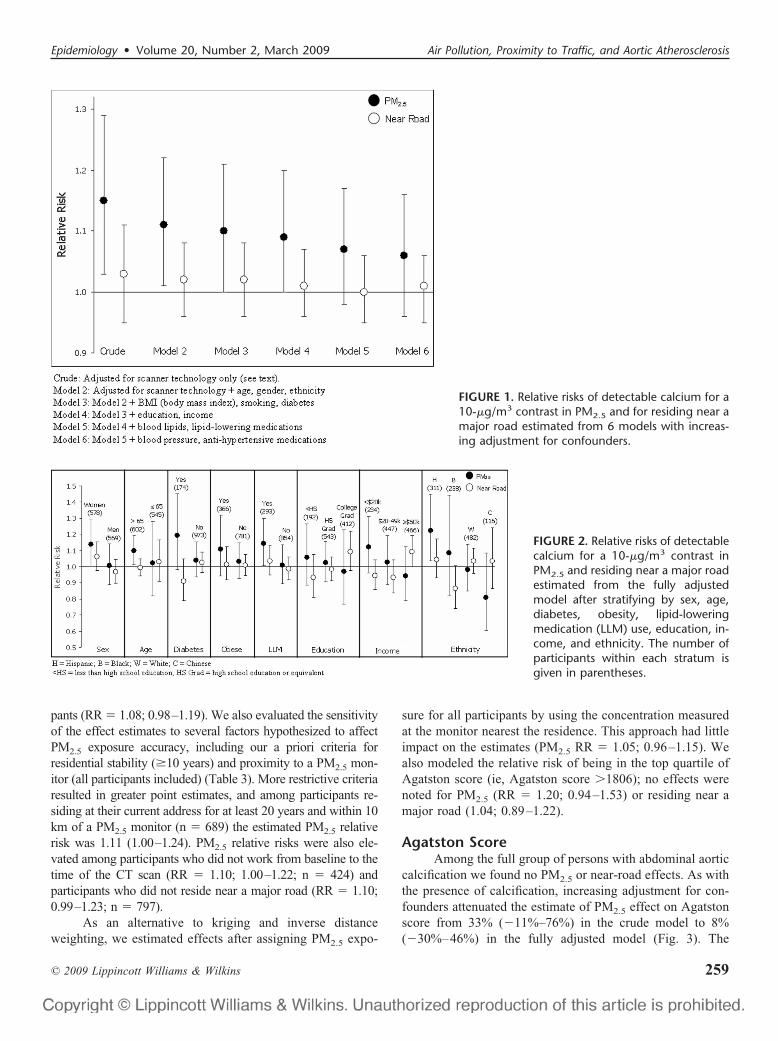
Agatston ScoreAmong the full group of persons with abdominal aortic
calcification we found no PM2.5 or near-road effects. As withthe presence of calcification, increasing adjustment for con-founders attenuated the estimate of PM2.5 effect on Agatstonscore from 33% (�11%–76%) in the crude model to 8%(�30%–46%) in the fully adjusted model (Fig. 3). The
FIGURE 1. Relative risks of detectable calcium for a10-�g/m3 contrast in PM2.5 and for residing near amajor road estimated from 6 models with increas-ing adjustment for confounders.
FIGURE 2. Relative risks of detectablecalcium for a 10-�g/m3 contrast inPM2.5 and residing near a major roadestimated from the fully adjustedmodel after stratifying by sex, age,diabetes, obesity, lipid-loweringmedication (LLM) use, education, in-come, and ethnicity. The number ofparticipants within each stratum isgiven in parentheses.
Epidemiology • Volume 20, Number 2, March 2009 Air Pollution, Proximity to Traffic, and Aortic Atherosclerosis
© 2009 Lippincott Williams & Wilkins 259
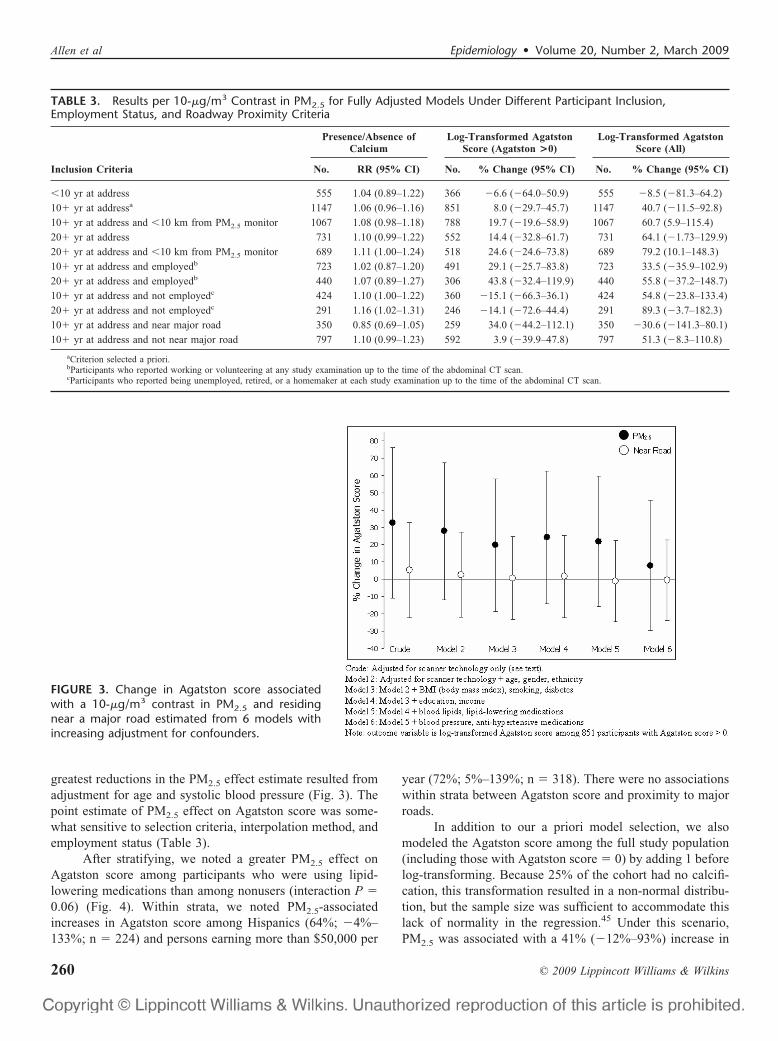
greatest reductions in the PM2.5 effect estimate resulted fromadjustment for age and systolic blood pressure (Fig. 3). Thepoint estimate of PM2.5 effect on Agatston score was some-what sensitive to selection criteria, interpolation method, andemployment status (Table 3).
After stratifying, we noted a greater PM2.5 effect onAgatston score among participants who were using lipid-lowering medications than among nonusers (interaction P �0.06) (Fig. 4). Within strata, we noted PM2.5-associatedincreases in Agatston score among Hispanics (64%; �4%–133%; n � 224) and persons earning more than $50,000 per
year (72%; 5%–139%; n � 318). There were no associationswithin strata between Agatston score and proximity to majorroads.
In addition to our a priori model selection, we alsomodeled the Agatston score among the full study population(including those with Agatston score � 0) by adding 1 beforelog-transforming. Because 25% of the cohort had no calcifi-cation, this transformation resulted in a non-normal distribu-tion, but the sample size was sufficient to accommodate thislack of normality in the regression.45 Under this scenario,PM2.5 was associated with a 41% (�12%–93%) increase in
TABLE 3. Results per 10-�g/m3 Contrast in PM2.5 for Fully Adjusted Models Under Different Participant Inclusion,Employment Status, and Roadway Proximity Criteria
Inclusion Criteria
Presence/Absence ofCalcium
Log-Transformed AgatstonScore (Agatston >0)
Log-Transformed AgatstonScore (All)
No. RR (95% CI) No. % Change (95% CI) No. % Change (95% CI)
�10 yr at address 555 1.04 (0.89–1.22) 366 �6.6 (�64.0–50.9) 555 �8.5 (�81.3–64.2)
10� yr at addressa 1147 1.06 (0.96–1.16) 851 8.0 (�29.7–45.7) 1147 40.7 (�11.5–92.8)
10� yr at address and �10 km from PM2.5 monitor 1067 1.08 (0.98–1.18) 788 19.7 (�19.6–58.9) 1067 60.7 (5.9–115.4)
20� yr at address 731 1.10 (0.99–1.22) 552 14.4 (�32.8–61.7) 731 64.1 (�1.73–129.9)
20� yr at address and �10 km from PM2.5 monitor 689 1.11 (1.00–1.24) 518 24.6 (�24.6–73.8) 689 79.2 (10.1–148.3)
10� yr at address and employedb 723 1.02 (0.87–1.20) 491 29.1 (�25.7–83.8) 723 33.5 (�35.9–102.9)
20� yr at address and employedb 440 1.07 (0.89–1.27) 306 43.8 (�32.4–119.9) 440 55.8 (�37.2–148.7)
10� yr at address and not employedc 424 1.10 (1.00–1.22) 360 �15.1 (�66.3–36.1) 424 54.8 (�23.8–133.4)
20� yr at address and not employedc 291 1.16 (1.02–1.31) 246 �14.1 (�72.6–44.4) 291 89.3 (�3.7–182.3)
10� yr at address and near major road 350 0.85 (0.69–1.05) 259 34.0 (�44.2–112.1) 350 �30.6 (�141.3–80.1)
10� yr at address and not near major road 797 1.10 (0.99–1.23) 592 3.9 (�39.9–47.8) 797 51.3 (�8.3–110.8)
aCriterion selected a priori.bParticipants who reported working or volunteering at any study examination up to the time of the abdominal CT scan.cParticipants who reported being unemployed, retired, or a homemaker at each study examination up to the time of the abdominal CT scan.
FIGURE 3. Change in Agatston score associatedwith a 10-�g/m3 contrast in PM2.5 and residingnear a major road estimated from 6 models withincreasing adjustment for confounders.
Allen et al Epidemiology • Volume 20, Number 2, March 2009
© 2009 Lippincott Williams & Wilkins260

Agatston score across all participants in the fully adjustedmodel (Fig. 5). Again, the PM2.5 effect estimate was greateramong lipid-lowering medication users than nonusers (inter-action P � 0.05). There was also evidence of increasingroadway effect with increasing education (P for trend � 0.06)and income (P for trend � 0.05). Within strata we observedPM2.5-related increases in Agatston score among personsolder than 65 years (75%; 8%–143%; n � 602), persons withdiabetes (149%; 29%–270%; n � 174), users of lipid-lower-ing medications (121%; 25%–217%; n � 293), and Hispanics(141%; 45%–236%; n � 311) (Fig. 5). Roadway proximitywas associated with a 63% increase in Agatston score (13%–112%; n � 466) among persons earning more than $50,000per year.
In sensitivity analyses, after imputing missing covari-ates PM2.5 was associated with a 49% increase in Agatstonscore (1%–100%). The PM2.5 effect estimates were sensitiveto exposure misclassification. Among participants residing attheir current address for at least 20 years and within 10 km ofa PM2.5 monitor (n � 689), PM2.5 was associated with a 79%
increase in Agatston score (10%–148%). Estimates of PM2.5
effect were also elevated among participants not residing neara major road (51%; �8%–111%; n � 797) (Table 3).
DISCUSSIONThis is the first effort to study the association between
abdominal aortic calcification, a sensitive measure of sys-temic atherosclerosis, and an environmental exposure. Wedid not find consistent associations between PM2.5 concen-trations and the prevalence or extent of calcification across allparticipants in our fully adjusted models. However, there wasevidence that our PM2.5 effect estimates were affected byexposure misclassification. The increased point estimate forparticipants residing within 10 km of a PM2.5 monitor sug-gests that exposure error introduced by spatially interpolatingmeasured concentrations may have affected our estimates.Similarly, although we were able to assess employment statusover only a relatively short period (from baseline to the CTscan), PM2.5 point estimates were elevated among partici-pants who did not work or volunteer outside the home during
FIGURE 4. Change in Agatston scoreassociated with a 10-�g/m3 contrastin PM2.5 and for residing near a majorroad estimated from the fully ad-justed model after stratifying by sex,age, diabetes, obesity, LLM use, edu-cation, income, and ethnicity: partic-ipants with nonzero calcium. Thenumber of participants within eachstratum is given in parentheses.
FIGURE 5. Change in Agatston scoreassociated with a 10-�g/m3 contrastin PM2.5 and for residing near a majorroad estimated from the fully ad-justed model after stratifying by sex,age, diabetes, obesity, LLM use, edu-cation, income, and ethnicity: all par-ticipants. The number of participantswithin each stratum is given in paren-theses.
Epidemiology • Volume 20, Number 2, March 2009 Air Pollution, Proximity to Traffic, and Aortic Atherosclerosis
© 2009 Lippincott Williams & Wilkins 261

this period. This is consistent with the recent findings ofHoffmann et al,4 who reported greater PM2.5 and roadwayeffects on coronary artery calcification among participantswho had not been working full-time during the previous 5years. Our PM2.5 effects using a residential stability criterionof 20 years suggest that our a priori criterion of 10 years mayhave been inadequate, given the long time scale over whichatherosclerosis develops. Finally, PM2.5 exposure may havebeen more accurate among participants not residing near amajor road, as these participants’ exposures may be lessaffected by local PM sources or street canyon effects.
We conservatively adjusted for several factors that maybe on the physiologic pathway between air pollution andatherosclerosis, including blood lipids6 and blood pres-sure,46,47 and, as surrogates, the use of lipid-lowering andantihypertensive medications. Thus, our conservative a priorimodel choice may have over adjusted the coefficients; amodel that did not adjust for these variables (model 4 in Fig.1) estimated the PM2.5-associated relative risk of aortic cal-cification to be 1.09 (1.00–1.20).
Unlike Hoffmann et al,4 who reported an associationbetween chronic exposure to traffic pollution and coronaryatherosclerosis,4 we found no associations between residen-tial proximity to major roads and presence or extent of aorticcalcification. If an association between traffic exposure andatherosclerosis does exist, there are at least 2 possible expla-nations for our inability to detect it. First, we relied on theroad classification system in the TeleAtlas database, whichdescribes the type of road but not the traffic volume. Second,there is evidence that concentrations of traffic pollution de-crease with elevation above the roadway.48 Therefore, par-ticipants residing in high-rise buildings near major roads mayhave been misclassified. In summary, our lack of findings inrelation to traffic may be due to exposure misclassificationinherent in the relatively crude roadway category and resi-dential proximity approach.
In exploratory stratified analyses, the most consistentevidence of PM2.5 effect modification across modeling sce-narios was the use of lipid-lowering medications (interactionP values: 0.03–0.13), with greater effects among users. Thisresult is consistent with the previous study of air pollutionand atherosclerosis in Los Angeles,13 although no such effectmodification was observed in a previous analysis of coronaryartery calcification, carotid intima-media thickness, and an-kle-brachial index in the MESA cohort.14 The use of lipid-lowering medication may act as a surrogate for risk ofatherosclerosis even in a cohort without prior cardiovasculardisease, although interpretation of this finding in a cross-sectional analysis is complicated by the fact that duration ofmedication use was not considered, and lipid-lowering med-ication slows the progression of abdominal aortic plaques,and may therefore, reduce progression of calcification.27
Within some subgroups we noted stronger PM2.5 asso-ciations with detectable calcification and Agatston score. Themost robust effects were among Hispanics. Although racial orethnic differences in air pollution exposure have been inves-tigated,49,50 there is little prior evidence that race or ethnicitymodify air pollution cardiovascular effects.41,51 In this anal-ysis, not all ethnic groups were represented in every city,although whites and Hispanics had similar exposure gradi-ents. No PM2.5 effects were noted for whites under anymodeling scenario. Hispanics had the highest rates of obesity(45% vs. 27% of non-Hispanics) and diabetes (22% vs. 13%)of any racial/ethnic group; both of these characteristics arehypothesized to modify PM effects on cardiovascular out-comes. In a panel study, Dubowsky et al8 reported thatdiabetes and obesity both modified the effect of short-termPM2.5 exposures on systemic inflammation, and time-seriesstudies provide evidence that diabetes modifies the effect ofPM on cardiovascular hospitalizations42 and mortality.52 It ispossible that in our analysis, Hispanic ethnicity acted as asurrogate for combinations of other potentially importanteffect modifiers. The PM2.5-associated relative risk of aorticcalcification among participants who are both obese anddiabetic was 1.38 (0.98–1.95; n � 84), and Hispanics weredisproportionately represented in this subgroup (39 of 84participants). Exposure misclassification is another possibleexplanation for heterogeneity in PM2.5 effect estimates. His-panic participants lived closer to PM2.5 monitors than anyother racial/ethnic group (average distance: 4.2 � 2.7 km forHispanics vs. 5.7 � 3.2 km for non-Hispanics), and 67% ofnon-Hispanics were employed between baseline and CT scan,compared with only 54% of Hispanics.
In a prior analysis of MESA data PM exposures werepositively, but not significantly, associated with coronaryartery calcification.14 One important difference between aor-tic calcification and coronary artery calcification is that theformer is generally more prevalent, especially among womenand those older than 50.18,28 In this analysis 74% of partici-pants had detectable aortic calcification, whereas in the pre-vious MESA air pollution analysis the prevalence of coronaryartery calcification was only 50%.14 Relative to coronaryartery calcification, abdominal aortic calcification has notbeen as extensively studied as a cardiovascular risk factor.Nevertheless, an association between air pollution and aorticatherosclerosis would have important public health implica-tions because aortic calcifications have been linked to in-creased risk of cardiovascular disease,20 coronary heart dis-ease,20 stroke,22 and congestive heart failure.19 To put themagnitude of our point estimates into context, the relativerisk of detectable aortic calcification (1.06 for a 10-�g/m3
contrast in PM2.5) is about equal to the point estimate asso-ciated with a 3-year increase in age, but smaller than the risksamong former smokers (RR � 1.15; 1.08–1.22) and currentsmokers (RR � 1.22; 1.11–1.34).
Allen et al Epidemiology • Volume 20, Number 2, March 2009
© 2009 Lippincott Williams & Wilkins262

Some limitations in our analysis should be noted. First,abdominal aortic calcification represents a different vascular bedthan the coronary or carotid arteries, so associations between airpollution and calcification may not directly reflect processes intarget organs associated with heart or cerebrovascular disease.Second, this was a cross-sectional analysis that relied primarilyon exposure contrasts between cities. Although we made use ofa rich dataset to control for potential confounders, we cannot ruleout the possibility of residual confounding by other factors thatvary regionally. Our exposure assessment approach relied on thestrong assumption that the 2-year average PM2.5 was represen-tative of longer-term past exposures. We were able to assess therelationship only between calcification and this relatively recentexposure information, even though the development of calcifi-cation is a long-term process that may be affected by airpollution exposures over the full lifetime. Moreover, as previ-ously mentioned, we attempted to capture within-city variationsin traffic pollution concentrations by using a residential proxim-ity approach. However, this approach is a fairly crude surrogatefor actual traffic volumes, and errors in geocoded locations orvertical concentration gradients may have also contributed touncertainty in the estimates of exposure to traffic-generatedpollution. Finally, different CT scanners were used between, and in2 cases within, field centers. We found that multidetector CTscanners were more likely to detect aortic calcification, and reportedhigher Agatston scores when calcification was detected, than elec-tron-beam scanners. Although we attempted to correct for this effectin the statistical analyses, these technological differences may havehad some impact on our results.
In conclusion, we did not find strong PM2.5 or roadwayassociations with abdominal aortic calcification across our full studypopulation. However, PM2.5 associations among participants leastaffected by exposure misclassification (those living near PM2.5
monitors for at least 20 years and those not working outside thehome) support the hypothesis of a relationship between particulateair pollution and systemic atherosclerosis.
ACKNOWLEDGMENTSThe authors thank the other investigators, the staff, and
the participants of the MESA study for their valuable contri-butions. A full list of participating MESA investigators andinstitutions can be found at http://www.mesa-nhlbi.org.
REFERENCES1. Pope CA, Dockery DW. Health effects of fine particulate air pollution:
lines that connect. J Air Waste Manag Assoc. 2006;56:709–742.2. Finkelstein MM, Jerrett M, Sears MR. Traffic air pollution and mortality
rate advancement periods. Am J Epidemiol. 2004;160:173–177.3. Hoek G, Brunekreef B, Goldbohm S, et al. Association between mor-
tality and indicators of traffic-related air pollution in the Netherlands: acohort study. Lancet. 2002;360:1203–1209.
4. Hoffmann B, Moebus S, Mohlenkamp S, et al. Residential exposure totraffic is associated with coronary atherosclerosis. Circulation. 2007;116:489–496.
5. Mills NL, Tornqvist H, Robinson SD, et al. Air pollution and athero-thrombosis. Inhal Toxicol. 2007;19:81–89.
6. Donaldson K, Stone V, Seaton A, et al. Ambient particle inhalation and
the cardiovascular system: potential mechanisms. Environ Health Per-spect. 2001;109:523–527.
7. Ruckerl R, Ibald-Mulli A, Koenig W, et al. Air pollution and markers ofinflammation and coagulation in patients with coronary heart disease.Am J Respir Crit Care Med. 2006;173:432–441.
8. Dubowsky SD, Suh H, Schwartz J, et al. Diabetes, obesity, and hyper-tension may enhance associations between air pollution and markers ofsystemic inflammation. Environ Health Perspect. 2006;114:992–998.
9. Ross R. Mechanisms of disease–Atherosclerosis–An inflammatory dis-ease. New Eng J Med. 1999;340:115–126.
10. Suwa T, Hogg JC, Quinlan KB, et al. Particulate air pollution inducesprogression of atherosclerosis. J Am Coll Cardiol. 2002;39:935–942.
11. Chen LC, Nadziejko C. Effects of subchronic exposures to concentratedambient particles (CAPs) in mice: V. CAPs exacerbate aortic plaquedevelopment in hyperlipidemic mice. Inhal Toxicol. 2005;17:217–224.
12. Sun QH, Wang AX, Jin XM, et al. Long-term air pollution exposure andacceleration of atherosclerosis and vascular inflammation in an animalmodel. J Am Med Assoc. 2005;294:3003–3010.
13. Kunzli N, Jerrett M, Mack WJ, et al. Ambient air pollution and atheroscle-rosis in Los Angeles. Environ Health Perspect. 2005;113:201–206.
14. Diez Roux AV, Auchincloss A, Green TL, et al. Long-term exposure toambient particulate matter and prevalence of subclinical atherosclerosisin the Multienthic Study of Atherosclerosis. Am J Epidemiol. 2008;167:667–675.
15. Allison MA, Cheung P, Criqui MH, et al. Mitral and aortic annularcalcification are highly associated with systemic calcified atherosclero-sis. Circulation. 2006;113:861–866.
16. Khoury Z, Schwartz R, Gottlieb S, et al. Relation of coronary arterydisease to atherosclerotic disease in the aorta, carotid, and femoralarteries evaluated by ultrasound. Am J Cardiol. 1997;80:1429–1433.
17. Oei HH, Vliegenthart R, Hak AE, et al. The association betweencoronary calcification assessed by electron beam computed tomographyand measures of extracoronary atherosclerosis: the Rotterdam CoronaryCalcification Study. J Am Coll Cardiol. 2002;39:1745–1751.
18. Allison MA, Criqui MH, Wright CM. Patterns and risk factors forsystemic calcified atherosclerosis. Arterioscler Thromb Vasc Biol. 2004;24:331–336.
19. Walsh CR, Cupples LA, Levy D, et al. Abdominal aortic calcify depositsare associated with increased risk for congestive, heart failure: theFramingham Heart Study. Am Heart J. 2002;144:733–739.
20. Wilson PW, Kauppila LI, O’Donnell CJ, et al. Abdominal aortic calcificdeposits are an important predictor of vascular morbidity and mortality.Circulation. 2001;103:1529–1534.
21. Witteman JC, Kok FJ, Vansaase J, et al. Aortic Calcification As APredictor Of Cardiovascular Mortality. Lancet. 1986;2:1120–1122.
22. Hollander M, Hak AE, Koudstaal PJ, et al. Comparison between mea-sures of atherosclerosis and risk of stroke: the rotterdam study. Stroke.2003;34:2367–2372.
23. Jayalath RW, Mangan SH, Golledge J. Aortic calcification. Eur J VascEndovasc Surg. 2005;30:476–488.
24. Takasu J, Takanashi K, Naito S, et al. Evaluation of morphological-changes of the atherosclerotic aorta by enhanced computed-tomography.Atherosclerosis. 1992;97:107–121.
25. van der Meer IM, del Sol AI, Hak AE, et al. Risk factors for progressionof atherosclerosis measured at multiple sites in the arterial tree: therotterdam study. Stroke. 2003;34:2374–2379.
26. Wagenknecht LE, Langefeld CD, Freedman BI, et al. A comparison ofrisk factors for calcified atherosclerotic plaque in the coronary, carotid,and abdominal aortic arteries: the diabetes heart study. Am J Epidemiol.2007;166:340–347.
27. Yonemura A, Momiyama Y, Fayad ZA, et al. Effect of lipid-loweringtherapy with atorvastatin on atherosclerotic aortic plaques detected bynoninvasive magnetic resonance Imaging. J Am Coll Cardiol. 2005;45:733–742.
28. Kuller LH, Matthews KA, Sutton-Tyrrell K, et al. Coronary and aorticcalcification among women 8 years after menopause and their premeno-pausal risk factors: the healthy women study. Arterioscler Thromb VascBiol. 1999;19:2189–2198.
29. Bild DE, Bluemke DA, Burke GL, et al. Multi-ethnic study of athero-sclerosis: objectives and design. Am J Epidemiol. 2002;156:871–881.
30. Yaghoubi S, Tang W, Wang S, et al. Offline assessment of atheroscle-
Epidemiology • Volume 20, Number 2, March 2009 Air Pollution, Proximity to Traffic, and Aortic Atherosclerosis
© 2009 Lippincott Williams & Wilkins 263

rotic coronary calcium from electron beam tomograms. Am J CardImaging. 1995;9:231–236.
31. Agatston AS, Janowitz WR, Hildner FJ, et al. Quantification of coro-nary-artery calcium using ultrafast computed-tomography. J Am CollCardiol. 1990;15:827–832.
32. Budoff MJ, Takasu J, Katz R, et al. Reproducibility of CT measurementsof aortic valve calcification, mitral annulus calcification, and aortic wallcalcification in the multi-ethnic study of atherosclerosis. Acad Radiol.2006;13:166–172.
33. Goswami E, Larson T, Lumley T, et al. Spatial characteristics of fineparticulate matter: identifying representative monitoring locations inSeattle, Washington. J Air Waste Manag Assoc. 2002;52:324–333.
34. Hoek G, Meliefste K, Cyrys J, et al. Spatial variability of fine particleconcentrations in three European areas. Atmos Environ. 2002;36:4077–4088.
35. Smargiassi A, Baldwin M, Pilger C, et al. Small-scale spatial variabilityof particle concentrations and traffic levels in Montreal: a pilot study. SciTotal Environt. 2005;338:243–251.
36. Gilbert NL, Woodhouse S, Stieb DM, et al. Ambient nitrogen dioxideand distance from a major highway. Sci Total Environ. 2003;312:43–46.
37. Zhu YF, Hinds WC, Kim S, et al. Concentration and size distribution ofultrafine particles near a major highway. J Air Waste Manag Assoc.2002;52:1032–1042.
38. Bild DE, Detrano R, Peterson D, et al. Ethnic differences in coronarycalcification: the multi-ethnic study of atherosclerosis (MESA). Circu-lation. 2005;111:1313–1320.
39. Robbins AS, Chao SY, Fonseca VP. What’s the relative risk? A methodto directly estimate risk ratios in cohort studies of common outcomes.Ann Epidemiol. 2002;12:452–454.
40. Zou GY. A modified poisson regression approach to prospective studieswith binary data. Am J Epidemiol. 2004;159:702–706.
41. Zeka A, Zanobetti A, Schwartz J. Individual-level modifiers of theeffects of particulate matter on daily mortality. Am J Epidemiol. 2006;163:849–859.
42. Zanobetti A, Schwartz J. Are diabetics more susceptible to the health
effects of airborne particles? Am J Respir Crit Care Med. 2001;164:831–833.
43. Krewski D, Burnett RT, Goldberg MS, et al. Overview of the reanalysisof the Harvard six cities study and American cancer society study ofparticulate air pollution and mortality. J Toxicol Environ Health-Part A.2003;66:1507–1551.
44. Finkelstein MM, Jerrett M, DeLuca P, et al. Relation between income,air pollution, and mortality: a cohort study. Canad Med Assoc J.2003;169:397–402.
45. Lumley T, Diehr P, Emerson S, et al. The importance of the normalityassumption in large public health data sets. Annu Rev Public Health.2002;23:151–169.
46. Brook RD. You are what you breathe: evidence linking air pollution andblood pressure. Curr Hypertens Rep. 2005;7:427–434.
47. Auchincloss AH, Roux AVD, Dvonch JT, et al. Associations betweenrecent exposure to ambient fine particulate matter and blood pressure inthe multi-ethnic study of atherosclerosis (MESA). Environ Health Per-spect. 2008;116:486–491.
48. Restrepo C, Zimmerman R, Thurston G, et al. A comparison of ground-level air quality data with New York State Department of EnvironmentalConservation monitoring stations data in South Bronx, New York.Atmos Environ. 2004;38:5295–5304.
49. Buzzelli M, Jerrett M. Racial gradients of ambient air pollution exposurein Hamilton, Canada. Environ Plan A. 2004;36:1855–1876.
50. Houston D, Wu J, Ong P, et al. Structural disparities of urban traffic inSouthern California: Implications for vehicle-related air pollution expo-sure in minority and high-poverty neighborhoods. J Urban Aff. 2004;26:565–592.
51. Zanobetti A, Schwartz J. Race, gender, and social status as modifiers ofthe effects of PM10 on mortality. J Occup Environ Med. 2000;42:469–474.
52. Bateson TF, Schwartz J. Who is sensitive to the effects of particulate airpollution on mortality? A case-crossover analysis of effect modifiers.Epidemiology. 2004;15:143–149.
Allen et al Epidemiology • Volume 20, Number 2, March 2009
© 2009 Lippincott Williams & Wilkins264
Related Documents


