Erwin Kohler Findings from the Tire/Pavement Noise Study at the UC Pavement Research Center Part of Caltrans Quiet Pavement Research (QPR) program San Luis Obispo, CA July 23 rd , 2007

Welcome message from author
This document is posted to help you gain knowledge. Please leave a comment to let me know what you think about it! Share it to your friends and learn new things together.
Transcript

Erwin Kohler
Findings from the Tire/Pavement Noise Study at the UC Pavement
Research CenterPart of Caltrans Quiet Pavement Research (QPR) program
San Luis Obispo, CAJuly 23rd, 2007
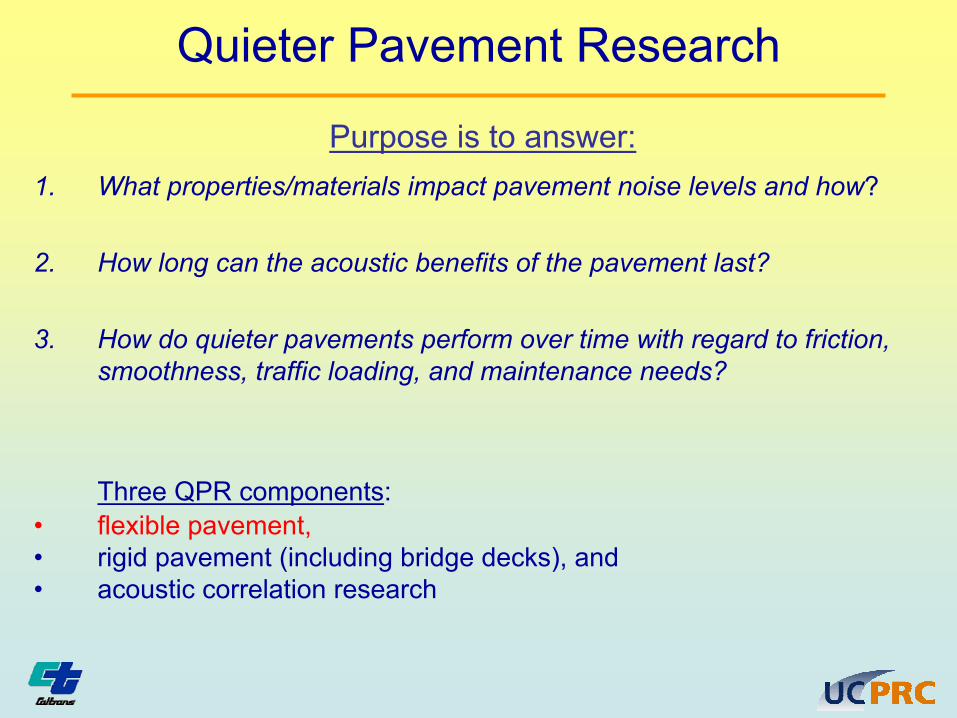
Quieter Pavement Research
1. What properties/materials impact pavement noise levels and how?
2. How long can the acoustic benefits of the pavement last?
3. How do quieter pavements perform over time with regard to friction, smoothness, traffic loading, and maintenance needs?
Three QPR components: • flexible pavement,• rigid pavement (including bridge decks), and • acoustic correlation research
Purpose is to answer:

UCPRC QPR Experiment Design
• 80 pavement sections throughout California– 23 “Environmental” sections– 57 Regular sections
Pav. Type
Age
Rainfall
Traffic H L H L H L H L H L H L H L H L H L H L H L H L H L H L H L H L H L H L H L H L H L H L H L H L
DIS
T/C
TY/R
TE/K
P
03-P
LA-8
0-1.
4/2.
601
-LAK
-29-
R37
.3/R
37.6
04-C
C-6
80-2
3.9/
24.9
05-S
CR
-152
-7.6
/8.0
04
-Mrn
-101
-0.0
/2.5
(NB&
SB)
04-S
on-1
21-3
.4/7
.3(N
B&SB
)(+)
04-S
Cl-2
37-R
3.8/
7.10
(+)
08-S
Bd-3
8-S0
.0/R
5.0
04-M
rn-3
7-12
.1/1
4.4(
EB&W
B)(+
)01
-ME
N-1
-0.1
/15.
2 (S
tant
ec/c
ored
)04
-SC
l-237
-R1.
0/2.
303
-Sac
-16-
6.9/
20.7
03
-Pla
-80-
14.3
/33.
301
-MEN
-20-
R37
.9/4
3.0
06-T
UL-
99-4
2.0/
47.0
06-T
UL-
63-1
9.8/
R30
.1
03-S
ac-5
0-16
.10/
17.3
010
-Am
a-49
-14.
7/17
.607
-LA-
710-
6.8/
9.7
06-T
ul-6
5-21
/29
(Sta
ntec
/cor
ed)
04-N
ap-1
28-5
.1/7
.4 (E
.B. o
nly)
04-S
Cl-8
5-1.
9/4.
708
-SB
D-5
8-R
0.0/
5.3
01-M
EN-2
0-R
37.9
/43.
004
-SC
l-280
-R0.
0/R
2.7
06-T
UL-
63-1
9.8/
R30
.1
04-M
rn-1
01-1
8.9/
23.1
(NB
only
)04
-Son
-1-0
.0/8
.4 (N
B&S
B)(+
)08
-Riv
-15-
33.8
/38.
405
-SLO
-46-
R10
.8/R
22.0
04-M
rn-1
01-2
.5/8
.5 (a
s-bu
it)10
-Cal
-4-0
/18.
807
-LA-
60-R
25.4
/R30
.5(s
tant
ec)
07-V
en-3
4-4.
3/6.
3
01-M
EN-2
0-R
37.9
/43.
006
-FR
E-99
-10.
7/15
.907
-LA-
138-
60.2
/61.
6 03
-ED
-50-
17.3
/18.
303
-ED
-50-
18.5
/20.
3 (a
s-bu
ilt)
06-K
ER-9
9-R
29.5
/R31
.0 (o
nly
SB)
04-S
OL-
113-
0.1/
18.0
04-S
M-2
80-9
.6/1
0.8
01
-Men
-1-2
0.8/
38.7
(S
tant
ec/c
ored
)04
-Ala
-92-
6.6/
8.8
06-K
ER
-65-
R0.
0/2.
9 (S
tant
ec/c
ored
)01
-Lak
e-20
-45.
8/46
.501
-Men
-101
-37.
4/38
.801
-Men
-101
-50.
8/ 5
1.5
01-H
UM
-101
-111
.1/1
11.5
01-M
en-2
0-21
.19/
21.6
901
-Men
-20-
22.1
8 /2
2.68
H H H
L H H
H L H L H L H L H L H L H L H L
-4 year-8 year
H L H L H L H L
<1 year 1-4 years 5-8 years <1 yea
F mixes
<1 year 1-4 years 5-8 years <1 year 1-4 years 5-8 years <1 year 1-4 years 5-8 years
RAC-O RAC-GOGAC DGAC

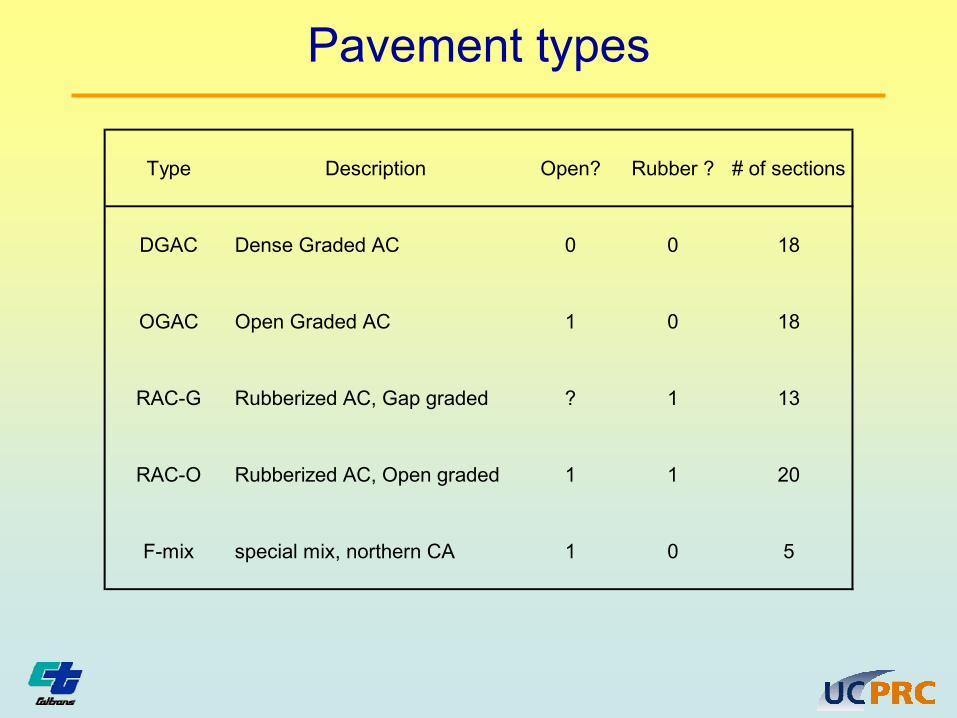
Pavement types
Type Description Open? Rubber ? # of sections
DGAC Dense Graded AC 0 0 18
OGAC Open Graded AC 1 0 18
RAC-G Rubberized AC, Gap graded ? 1 13
RAC-O Rubberized AC, Open graded 1 1 20
F-mix special mix, northern CA 1 0 5

Data collection
Collect Cores
Friction (microtexture)
Permeability
Condition Survey
Macrotexture
Smoothness (IRI)
Pavement/ tire noise
Aggregate Gradation (sizes)
Sound absorption
Air Void Content
Thickness
Traffic closureTraffic speed Laboratory
Cores #1 and #2 Cores #3 and #4 Cores #9 and #10 Cores #11 and #12
Core #3
Core #4
Core #5
Core #6Friction and permeability
zones
Center of the lane
Wheelpath
Direction of traffic
25m between cores
3.6m
150m long test section
Cores #5 and #6 Cores #7 and #8
Detail segment

Work in a traffic closure
Traffic Control: Caltrans Maintenance
Condition survey: cracks & distresses, pictures
Cores: drill, extract, label, backfill
Friction: BP (& DFT)
Permeability: epoxy seal, place, pour water, time


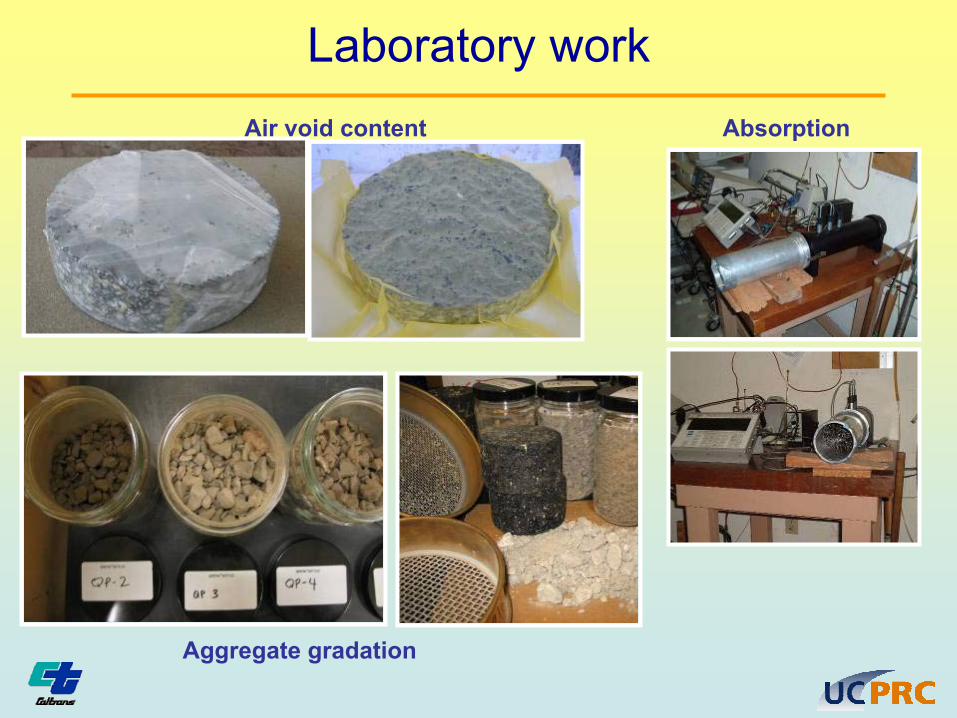
Laboratory workAir void content Absorption
Aggregate gradation

OBSI, SRTT conversion
Aquatred vs SRTT Comparison
0
2
4
6
8
10
12
1497 98 99 10
0
101
102
103
104
105
106
107
108
More
0
2
4
6
8
10
12
14
97 98 99
100 101 102 103 104 105 106 107 108More
y = 0.9286x + 5.067R2 = 0.9645
90.0
92.0
94.0
96.0
98.0
100.0
102.0
104.0
106.0
92.0 94.0 96.0 98.0 100.0 102.0 104.0 106.0 108.0
Aquatred
SRTT
Aquatred
SRTT
~2.44

Ranges (histogram)
0
5
10
15
20
0.5 3.5 6.5 9.5 12.5
Age
0
5
10
15
20
25
297 675 1052 1430 More
MPD,microns
0
5
10
15
20
3 7 11 16 20
Air Voids (%)
02468
101214
97 98 99 100 101 102 103 104 105
OBSI (SRTT)

QPR questions
• What properties/materials impact pavement noise levels and how?
1. Pavement type2. Age3. Air void4. Texture (MPD)5. Thickness
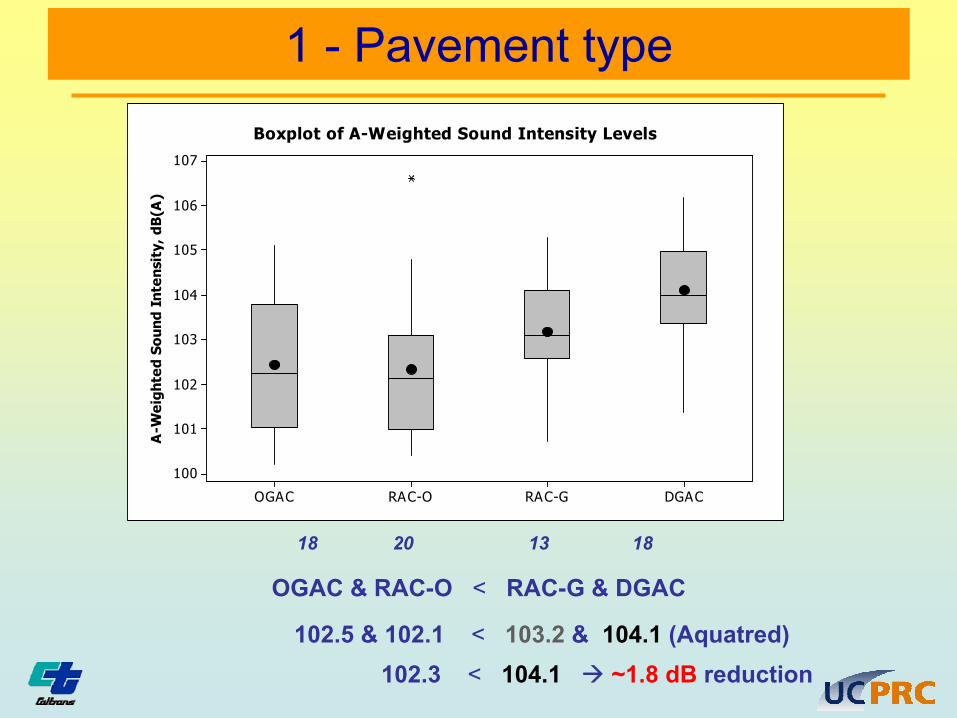
1 - Pavement type
A-W
eigh
ted
Soun
d In
tens
ity,
dB
(A)
DGACRAC-GRAC-OOGAC
107
106
105
104
103
102
101
100
Boxplot of A-Weighted Sound Intensity Levels
OGAC & RAC-O < RAC-G & DGAC
102.5 & 102.1 < 103.2 & 104.1 (Aquatred)102.3 < 104.1 ~1.8 dB reduction
18 20 13 18

2 - Age
A-W
eigh
ted
Soun
d In
tens
ity,
dB
(A)
Pavement TypeAge Category
DGACRAC-GRAC-OOGAC>41-4<1>41-4<1>41-4<1>41-4<1
107
106
105
104
103
102
101
100
Boxplot of A-Weighted Sound Intensity Levels
DGAC : highest OBSI OGAC & RAC-O : similar OBSIRAC-G :usually higher noise levels than open graded mixes, except when <1 year

Age
Age (years)
A-W
eigh
ted
Soun
d In
tens
ity
Leve
ls,d
B(A
)
14121086420
107
106
105
104
103
102
101
100
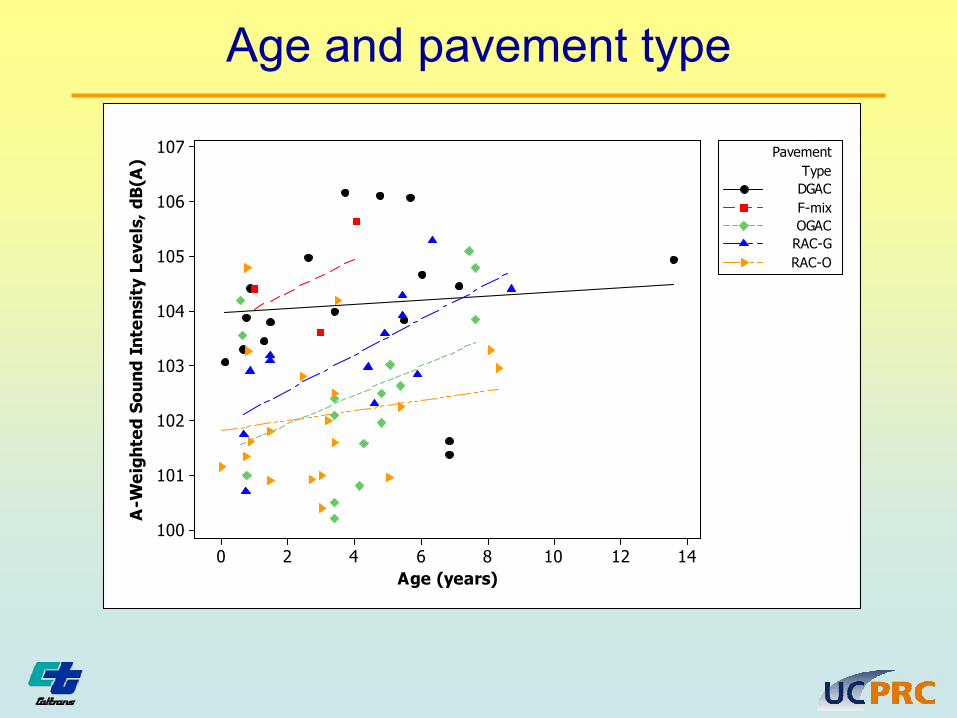
Age and pavement type
Age (years)
A-W
eigh
ted
Soun
d In
tens
ity
Leve
ls, d
B(A
)
14121086420
107
106
105
104
103
102
101
100
DGACF-mixOGACRAC-GRAC-O
TypePavement

Age
Age
A-W
eigh
ted
Soun
d In
tens
ity
Leve
ls, d
B(A
)
14121086420
107
106
105
104
103
102
101
100
01
CodePavement
Scatterplot of A-Weighted Sound Intensity Levels
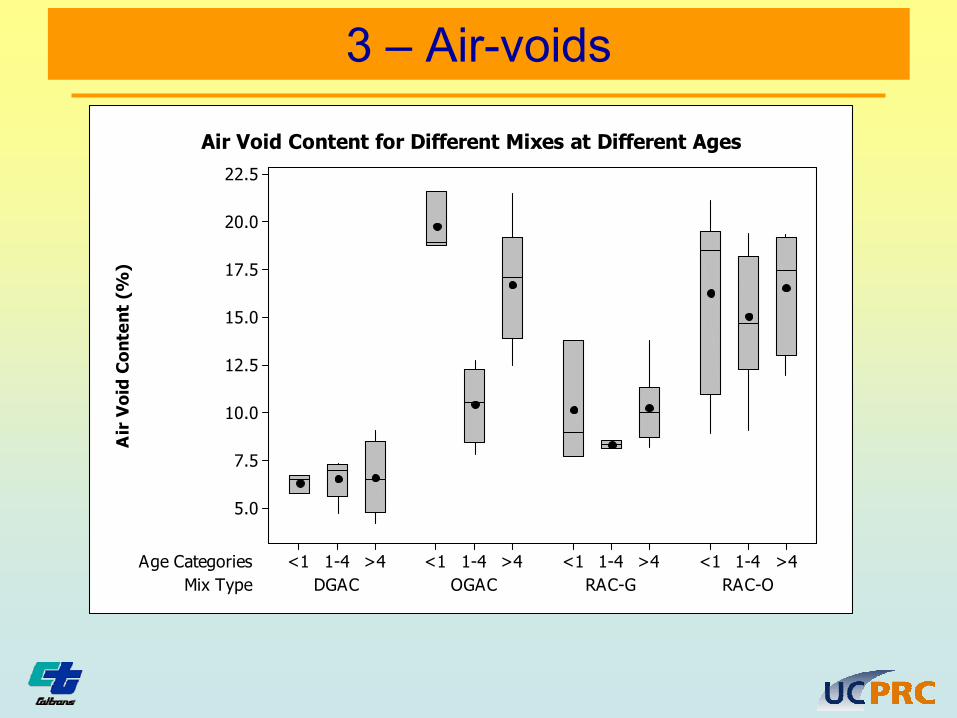
3 – Air-voidsA
ir V
oid
Con
tent
(%
)
Mix TypeAge Categories
RAC-ORAC-GOGACDGAC>41-4<1>41-4<1>41-4<1>41-4<1
22.5
20.0
17.5
15.0
12.5
10.0
7.5
5.0
Air Void Content for Different Mixes at Different Ages

Air voids
AV Content (%)
A-W
eigh
ted
Soun
d In
tens
ity
Leve
ls, d
B(A
)
22.520.017.515.012.510.07.55.0
107
106
105
104
103
102
101
100

Air voids
AV Content(%)
A-W
eigh
ted
Soun
d In
tens
ity
Leve
ls, d
B(A
)
22.520.017.515.012.510.07.55.0
107
106
105
104
103
102
101
100
DGACF-mixOGACRAC-GRAC-O
TypePavement

Air voids
Air Void Content (%)
A-W
eigh
ted
Soun
d In
tens
ity,
dB
(A)
22.520.017.515.012.510.07.55.0
107
106
105
104
103
102
101
100
01
CodePavement
Scatterplot of A-Weighted Sound Intensity versus Air Void Content (%)
DGAC : Air voids reduce OBSIOGAC : it is already good, does not matter

4 – Texture (MPD)
MPD (microns)
A-W
eigh
ted
Soun
d In
tens
ity
Leve
ls,d
B(A
)
20001750150012501000750500
107
106
105
104
103
102
101
100
01
CodePavement
DGAC & OGAC : lower MPD is better smaller aggregates

MPD
AV Content (%)
MP
D (
mic
rons
)
22.520.017.515.012.510.07.55.0
2000
1750
1500
1250
1000
750
500
lower MPD is better but it’s achieved at the expense of air voids

5- Thickness
Surface Layer Thickness (mm)
A-W
eigh
ted
Soun
d In
tens
ity
Leve
ls, d
B(A
)
120100806040200
107
106
105
104
103
102
101
100
DGACF-mixOGACRAC-GRAC-O
TypePavement

Thickness
Surface Layer Thickness (mm)
A-W
eigh
ted
Soun
d In
tens
ity
,dB
(A)
120100806040200
107
106
105
104
103
102
101
100
01
CodePavement
Scatterplot of A-Weighted Sound Intensity vs Surface Layer Thickness
DGAC : insensitive to thickness (maybe louder with thickness)OGAC : unless greater than 55 to 60mm, thickness doesn’t matter

10 close-up pictures
Sections QP10 to QP20
Database rages
Age : 1 – 14 years
OBSI(SRTT) : 98 - 104 dBA
MPD : 300 – 1800 microns
Air void : 3 – 22 %

QP10 07VEN34W5.9
RAC-G
Age=5
OBSI (SRTT) = 101.8
MPD = 889
AV = 10.2

QP11 07LA60E26.3
DGAC
Age=7
OBSI (SRTT) = 101.9
MPD = 652
AV = 5.5

QP12 08SBD58E4.2
RAC-O
Age=5
OBSI (SRTT) = 99.9
MPD = 1346.8
AV = 19.3

QP13 08SBD38E2.2
OGAC
Age=5
OBSI (SRTT) = 100.1
MPD = 1291
AV = 17.7

QP14 08RIV15S33.7
RAC-G
Age=5
OBSI (SRTT) = 100.1
MPD = 849
AV = 11.6

QP15 07LA138E61.3
DGAC
Age=<1
OBSI (SRTT) = 100.9
MPD = 638
AV = 6.7

QP16 04ALA92E7.7
DGAC
Age= 14
OBSI (SRTT) = 102.4
MPD = 1059
AV = 9.1

QP17 10AMA49S16.4
RAC-O
Age= 3
OBSI (SRTT) = 101.7
MPD = 1287
AV = 18.3

QP18 10CAL4W15.6
RAC-G
Age= 6
OBSI (SRTT) = 102.7
MPD = 1466
AV = 9.9

QP19 05SLO46W21.0
RAC-G
Age= 4
OBSI (SRTT) = 99.9
MPD = 758
AV = 10.7

QP20 05SCr152E7.9
OGAC
Age= <1
OBSI (SRTT) = 101.7
MPD = 1255
AV = 21.6

Model for Sound Intensity (OBSI)
• Multicollinearity: Principal factor analysis & Principal Components Regression
OBSI = 101 - 1.26 (A) + 0.664 (B) - 0.352 (C) + 0.00262 (MPD)
• Factors- 1.26 A: “Flow Variables” [AV (%) , Cu , F.M. , Code, Thickness ]
+ 0.664 B: “Surface Roughness” [Raveling, IRI, Age]
- 0.352 C: “Durability” [IRI, Cracks, Age]
+ 0.00262 MPD
• R-Sq = 52.8%, all factors significant at 95% confidence level

Conclusions
• OGAC is quieter than DGAC (~2dB)• Increasing air voids reduces OBSI for DGAC. OGAC
insensitive.– Affects high frequencies
• Increasing MPD increases OBSI (stronger for OGAC)– Affects low frequencies
• Rubber inclusion did not have a noticeable effect
• 80 sections was a small sample for the number of variables considered in this study
• A model was developed

Practical Recommendation
• At this time, the best approach is to use thin layers of OGAC or RAC-O with small aggregates
– Thin. Lower cost– OGAC or RAC-O. Better than RAC-G (longer benefit).
Quieter than DGAC– Small aggregates
Lower air voids (but still open). Good for durabilityLower MPD. Good for noise reduction at low frequencies
Related Documents