From Value to Vision: Reimagining the Possible with Data Analytics What makes companies that are great at analytics different from everyone else By MIT Sloan Management Review and SAS Institute In collaboration with RESEARCH REPORT SPRING 2013 FINDINGS FROM THE 2013 DATA & ANALYTICS GLOBAL EXECUTIVE STUDY AND RESEARCH REPORT

Welcome message from author
This document is posted to help you gain knowledge. Please leave a comment to let me know what you think about it! Share it to your friends and learn new things together.
Transcript
From Value to Vision: Reimagining the Possible with Data AnalyticsWhat makes companies that are great at analytics different from everyone elseBy MIT Sloan Management Review and SAS Institute
In collaboration with
RESEARCH REPORT
SPRING 2013
FINDINGS FROM THE 2013 DATA & ANALYTICS GLOBAL EXECUTIVE STUDY AND RESEARCH REPORT
Portions of this report previously appeared in “Innovating With Analytics,” MIT Sloan Management Review, Volume 54, no. 1 (Fall 2012) 47-52.
Copyright © MIT, 2013. All rights reserved.
Get more on data and analytics from MIT Sloan Management Review:
Visit our site at http://sloanreview.mit.edu/data-analytics
Get the free data and analytics newsletter at http://sloanreview.mit.edu/news-analytics2013
Contact us to get permission to distribute or copy this report at [email protected] or 877-727-7170.
AUTHORS
DAVID KIRON is the executive
editor of MIT Sloan Management
Review’s Big Ideas initiatives.
He can be reached at dkiron@
mit.edu.
RENEE BOUCHER FERGUSON is
the Data & Analytics contributing
editor at MIT Sloan Management
Review, researching the current
and new analytical approaches
that change how executives make
decisions and innovate. She can
be reached at [email protected].
PAMELA KIRK PRENTICE is the
chief research officer at SAS
Institute Inc., specializing in
deriving insights from qualitative
and quantitative information
to help address key business
issues. She can be reached at
Martha Mangelsdorf, Editorial Director, MIT Sloan Management Review
Max Harless, Graphic Designer, MIT Sloan Management Review
Malene Haxholdt, Global Analytics Marketing Manager, SAS Institute Inc.
CONTRIBUTORS

2 / Introduction
3 / Signs of an Analytics RevolutionCASE STUDY: Oberweis Dairy
4 / Three Ways to Compete with Analytics CASE STUDY: Caesars Entertainment
6 / The Analytical Innovators•MindsetandCulture
•KeyActions
•Outcomes:PowerShiftstoThosewithInsight
11 / On Becoming an Analytical Innovator•TheAnalyticallyChallenged
•TheAnalyticsPractitioners
17 / Conclusion
CONTENTSRESEARCH REPORT SPRING 2013
18 AbouttheResearch 19 Acknowledgments
MOREFROMMITSMRONDATA&ANALYTICS REIMAGININGTHEPOSSIBLEWITHDATAANALYTICS•MIT SLOAN MANAGEMENT REVIEW 1

How organizations capture, create and use data is changing the way we work and live. This big idea, which is
gaining currency among executives, academics and business analysts, reflects a growing belief that we are on
the cusp of an analytics revolution that may well transform how organizations are managed, and also trans-
form the economies and societies in which they operate.
Among companies, this revolution has several dimensions. First, companies have more data to use than ever
before, at a volume and with a variety that are unparalleled in human history. Second, by using internal and ex-
ternal data, companies are beginning to understand patterns of consumer activity that had once been impossible
to perceive or act upon. And third, companies are using new analytic tools and services to understand their own
operations and behavior at a much finer level of detail, enabling new questions to be asked and answered.
At the vanguard of this revolution are companies that are using analytics to compete and to innovate.
Understanding these companies gives insight into both the direction and the pace of the analytics revolu-
tion. Lessons about what hurdles these companies face and how they are addressing them suggest a path
forward for many other companies.
As part of a multiyear research initiative, MIT Sloan Management Review is partnering with SAS Institute
Inc. to better understand companies that are shaping (and are being shaped by) this analytics revolution. In
2012, we conducted a survey of more than 2,500 respondents in two dozen industries. Fifty-five percent of the
respondents were executives at the vice president/director level or above. The survey included over 30 detailed
questions about how organizations are using data to advance their business objectives. We also interviewed 29
academics and senior information technology executives at a diverse group of companies, including eBay,
Inc., Kaiser Permanente, LinkedIn Corporation, Neiman Marcus, Inc., PayPal, Inc., PepsiCo, and Southern
California Edison Company.
Fully 67% of survey respondents report that their companies are gaining a competitive edge from their
use of analytics. Among this group, we identified a set of companies that are relying on analytics both to gain
a competitive advantage and to innovate. These Analytical Innovators constitute leaders of the analytics rev-
olution. They exist across industries, vary in size and employ a variety of business models. They also share a
distinctive orientation toward data and analytics that includes three key characteristics:
1. A widely shared belief that data is a core asset that can be used to enhance operations, customer ser-
vice, marketing and strategy
2. More effective use of more data for faster results
3. Support for analytics by senior managers who embrace new ideas and are willing to shift power and
resources to those who make data-driven decisions
This report provides an in-depth look at Analytical Innovators, including their beliefs, practices and out-
comes. Our profile of this group provides insights into what success factors are currently required to excel in
today’s analytics revolution. In addition, we offer a framework that shows how other companies — regard-
less of their analytical sophistication — can become more like Analytical Innovators.
S P E C I A L R E P O R T R E I M A G I N I N G T H E P O S S I B L E W I T H D A T A A N A L Y T I C S
INTRODUCTION
2 MIT SLOAN MANAGEMENT REVIEW•SASINSTITUTEINC. MOREFROMMITSMRONDATA&ANALYTICS
MOREFROMMITSMRONDATA&ANALYTICS REIMAGININGTHEPOSSIBLEWITHDATAANALYTICS•MIT SLOAN MANAGEMENT REVIEW 3
Signs of an Analytics Revolution
Increasingly, top thinkers in academia and business believe that analytics, especially analytics con-
nected with big data, is going to be a driving force in our economy and society in the next 10 to 20
years. This belief is being matched with action in the public and private sectors.
In February 2013, MIT Sloan launched a digital economy initiative to explore how digital tech-
nologies are influencing both productivity and employment, declaring, “The digitization of the
economy is one of the most critical issues of our time.”1 The broad use of analytics is an important
factor in the development of the emergent digital economy.
This view is supported by General Electric Company executives Peter Evans and Marco Annunziata, who
argue that the “industrial Internet” — a system of machine-to-machine sensors — will add $10 trillion to $15
trillion in economic benefit to the global gross domestic product through 2030.2 GE is putting its money
where its mouth is, investing $1 billion in developing the talent, software and analytic tools to better identify
when machines need fixing or replacement.3
A recent study of senior executives at Fortune 500 companies found that 85% of those organizations had
launched big data initiatives.4 Intel announced a five-year, $12.5 million partnership with MIT to create a
research center that will focus on big data. The state of Massachusetts, host to more than 100 companies that
employ more than 12,000 people in big data-related businesses, has launched a public-private Big Data Con-
sortium to grow its innovation economy.5 In 2011, big data companies received more than $350 million in
venture capital.6
Alex “Sandy” Pentland, director of the Human Dynamics group at the MIT Media Lab, argues that as we
move into a society driven by big data, “most of the ways that we think about the world change in a rather
dramatic way”:
This is the first time in human history that we have the ability to see enough about ourselves that we can
hope to actually build social systems that work qualitatively better than the systems we’ve always had. …
S P E C I A L R E P O R T R E I M A G I N I N G T H E P O S S I B L E W I T H D A T A A N A L Y T I C S
From Value to Vision:
Reimagining the Possible with Data Analytics

4 MIT SLOAN MANAGEMENT REVIEW•SASINSTITUTEINC. MOREFROMMITSMRONDATA&ANALYTICS
S P E C I A L R E P O R T R E I M A G I N I N G T H E P O S S I B L E W I T H D A T A A N A L Y T I C S
We can potentially design companies, organi-
zations, and societies that are more fair, stable
and efficient as we get to really understand
human physics at this fine-grain scale. This
new computational social science offers incred-
ible possibilities.7
While much of the promise of data and analytics
is couched in terms of “big data,” some suggest that
today’s big data will likely become just tomorrow’s
data.8 If we are to achieve anything close to the
promise of big data (or data), it will need to become,
as one research report says, “a key basis of competi-
tion, underpinning new waves of productivity
growth, innovation, and consumer surplus.”9
And this is precisely what our research team and
others are beginning to see in the market. Companies
that are leading the analytics revolution are already
making data and analytics a source of competitive
differentiation. In 2012, the MIT Center for Digital
Business, along with research sponsor Capgemini
Consulting, completed a two-year study with more
than 400 companies to determine which companies
were achieving a “digital advantage” over industry
peers through their use of analytics, social media,
mobile and embedded devices. The study found that
companies that do more with digital technologies —
and support their digital investments with leadership
and governance capabilities — are 26% more profit-
able than their industry peers, and outperform
average industry performance by 6% to 9%.10
Companies that many of us deal with every day
are already making use of data to advance a variety
of business goals and to help consumers:
Kaiser Permanente collects petabytes of health in-
formation on its 8-million-plus members, a
fantastic amount. Some of this data was used in an
FDA-sponsored study to identify risks with Vioxx,
Merck’s pain medication, which was pulled shortly
after the research identified a greater risk of heart
attack in a subset of the patient population.
Southern California Edison is collecting hourly
(rather than monthly) data on customer usage
from new digital smart meters in millions of resi-
dences. It will soon be monitoring and giving
frequent feedback to customers about their energy
use, a significant benefit for energy grid manage-
ment and customer service.
�Pepsi has an ordering algorithm that lowers the
rate of inventory out-of-stocks. The company
shares information from this application with
partners and retailers, improving its relationships
with key stakeholders.
Three Ways to Compete with Analytics
You don’t have to lead the analytics revo-
lution to create value from analytics.
This past year, two-thirds of our survey
respondents said they are gaining a com-
petitive advantage from their use of analytics. (See
Figure 1: Finding Competitive Advantage with Ana-
lytics.) This represents a significant jump from our
2011 Global Executive Survey (58%) and an even
larger jump from the 2010 survey (37%). Other
research supports this trend.11
Companies that gain a competitive edge with
analytics can be found at all levels of technological
sophistication. At one end are traditional compa-
nies like Illinois-based Oberweis Dairy, which have
older technologies but add new analytics talent.
(See case study on next page.) At the other end are
companies like LinkedIn, which include analytics as
part of their corporate DNA but still find new ways
to capitalize on analytic insights.
In 2006, LinkedIn had 8 million users, but some-
thing wasn’t clicking: Users weren’t seeking
connections, a key component of success, at the ex-
pected rate. Reid Hoffman, the company’s cofounder
(and current executive chairman), brought in Jona-
than Goldman, who has a background in physics, to
FIGURE 1: FINDING COMPETI-TIVE ADVANTAGE WITH ANALYTICS The percentage of companies that create a competitive advantage with analytics is trending upwards.
37%
58%67%
2010 2011 2012
Percentage believing that business analytics creates a competitive advantage in their organization
MOREFROMMITSMRONDATA&ANALYTICS REIMAGININGTHEPOSSIBLEWITHDATAANALYTICS•MIT SLOAN MANAGEMENT REVIEW 5
test different ways to encourage members to link to
one another. Goldman came up with the algorithm
that would become the “People You May Know”
function on LinkedIn’s homepage — arguably one
of the site’s key user benefits today.12
Because the product team initially did not see
value in the algorithm, Hoffman suggested Gold-
man run a test on LinkedIn pages in the form of an
advertisement: “Find out what happened to your
former colleagues or classmates.” The result was a
staggering 30% click-through rate in an industry
that views click-through rates of 1% to 3% as a suc-
cess. LinkedIn raced ahead of its competitors.
Some of the more traditional companies strug-
gling in mature industries are increasingly turning
to analytics for insights that provide an edge. A case
in point is in the pharmaceutical sector, where
companies have found themselves challenged by
their payers, the largest managed-care customers or
governments.
Milkmen,glassbottles,door-to-doorservice.Insomeways,notmuchhaschangedatOberweisDairy,Inc.from
itsfoundingattheturnofthelastcentury.Milkisstillprocuredfromlocaldairyfarms.Dairyproductsareadditive-free.Milkisdeliveredinglassbottlestocustomers’doorsteps,althoughnowadaysOberweisuses refrigerated trucks rather than horse-drawn milk carts.
In other ways, everything is changing at the nearly 100-year-old company.
What started as an Illinois farmer selling his surplus milk to neigh-bors in 1915 is now an analytics-savvy company with revenues approaching$100million.OberweisDairyhasthreedistributionchan-nels: home delivery, with thousands of customers; retail, with 47 corporate and franchise stores; and wholesale, to regional and na-tionalgrocerychainslikeTarget.In2012,thecompanybeganlookingtoexpandfromitsMidwesternrootstotheEasternSeaboard.
AtOberweis,theusualapproachtoregionalexpansionwastobring together operations executives to figure out the best configura-tionfortheseresources.Thistimewasdifferent.
Thistime,CEOJoeOberweisbroughttothestrategytableanexecutivewithjustthreeyears’experienceatthecompany,BruceBedford,vicepresidentofmarketinganalyticsandconsumerin-sights.Hehadbeenbroughtonboardin2009toinjectsomeanalyticalthinkingintothefamily-runcompany.However,hewasarelatively unknown figure to the operations executives. According to Bedford,onthedayofthestrategymeeting:
The CEO invited a large number of operational decision makers — literally, people who manage the company’s drivers and transfer centers. When I got to the meeting I said, “Hey, there are some things I’d like you to consider beyond just operations. I’d like you to think about our customers, particularly the cus-tomers that we currently have, who are great candidates for our service. And then let’s also evaluate customers that we’ve spent a lot of money to acquire in the past, that didn’t ulti-mately turn out to be great customers.”
BedfordtooktheteamthroughhisanalysisofOberweis’stargetcustomer segments using data sets based on community-level
demographic information. Contrary to the company’s conventional wis-dom,hehaddiscoveredthattheso-calledBeamerandBirkenstockgroup — liberal, high-income, established couples living leisurely life-styles—weren’tagoodfitforOberweis’shigh-endretaildairyproducts. Analytics essentially shattered the company’s preconceived notions about its target market.
OnceBedforddemonstratedthepossibilitiesofutilizingdataana-lytics to segment the customer market, the meeting shifted from tactical, focusing on operations — how many trucks and transfer centers would be required and where they should be located — to strategic, stepping back to define the target market. “From a market-er’spointofview,thisseemstomakeperfectsense,”saidBedford.“Butitdidn’tnecessarilymakesenseinitiallytopeopleinthatroom.Becausethat’snothowtheythink.”
Oberweis’sexpansionplansarenowbeingdrivenbyanalytics.Moreimportantly,Bedfordsays,thecompany’sdecisionmakersarethinkingabout using data analytics within their own areas of expertise:
I’ve started to see people now say, “Wait a second, you know what, this analytic stuff, there’s some power here, and maybe I should take the time to learn a little bit more about what Bruce is doing that maybe I could do.” They’re saying, “I’m not sure what I should be asking about, but let me at least ask if there’s something that I should ask about.”
It comes down to having a number of people who don’t or-dinarily use analytics stop and see the light bulb go off. The change is cultural, and to a point now where people want to ac-quire a better understanding of analytics tools because they can see that there is real benefit.
TheOberweisstorycallsattentiontohowanalyticscantransformeven the most traditional of companies. Indeed, the dairy company lacksmodernERPsystems(althoughitisplanningastate-of-the-artERPimplementation)andcontinuestoprocessmuchofitsinventorybyhand.YetwhenitsCEOgaveanalyticsaseatatthestrategytableandoperations executives subsequently began using analytics to make business decisions, the company did not merely move on from its geo-graphicalroots—Oberweisreinventedhowitwouldcompete.
CASE STUDY: Oberweis Dairy

6 MIT SLOAN MANAGEMENT REVIEW•SASINSTITUTEINC. MOREFROMMITSMRONDATA&ANALYTICS
S P E C I A L R E P O R T R E I M A G I N I N G T H E P O S S I B L E W I T H D A T A A N A L Y T I C S
For example, AstraZeneca Group found that its
payers were combining data from the pharmaceu-
tical giant’s clinical trials with proprietary data to
conduct comparative-effectiveness studies. Payers,
in effect, knew more about AstraZeneca’s drug
performance data in some situations than Astra-
Zeneca itself did. This gave them a distinct
advantage in negotiating payments. It also made it
difficult for AstraZeneca to get its drugs repre-
sented on national and country formularies, the all
important drug approval lists from which physi-
cians prescribe medications. How did AstraZeneca
respond to this competitive disadvantage? It built
up its own analytics program, partnering with
IMS Health in Europe and U.S.-based HealthCore,
a clinical outcomes research subsidiary of health
insurer WellPoint Inc. The partnerships have
become a crucial tool in AstraZeneca’s negotia-
tions with payers.
In some markets, once a company finds a unique
way to use data to gain an advantage, competitors
quickly jump on the bandwagon and level the playing
field. Simply obtaining an advantage from analytics is
not enough in these cases; insights must be revital-
ized again and again to sustain a competitive edge.
The story of the Oakland Athletics offers a telling
example. In 2002, despite being handicapped with
the most significant salary constraint in Major
League Baseball, Oakland A’s general manager Billy
Beane built a winning team through an innovative
use of analytics. He bucked conventional wisdom
and began looking at previously ignored player sta-
tistics. This story — popularized in Michael Lewis’s
book Moneyball: The Art of Winning an Unfair
Game and the movie starring Brad Pitt — ends on a
happy note, with the A’s winning their division and
going to the playoffs.13
But over time, other teams copied Beane’s meth-
ods, and the A’s lost the competitive edge they had
initially gained with analytics. It was only after team
management created new analytical metrics that
the A’s returned to the playoffs in 2012, after a five-
year hiatus.14 The moral: Organizations need to find
new ways to apply analytics to refashion the advan-
tage they gain from data.
Analytics is not just about generating insights
and getting those insights to the right people. To sus-
tain the long-term success of data-driven innovation,
it is necessary to continually revise one’s analytical
approach in order to generate insights that lead to
new innovation and competitive advantage.
The Analytical Innovators
While many companies are begin-
ning to cultivate benefits from
their use of analytics, organiza-
tions that are getting the most
value have a distinct approach. In this section, we
introduce the Analytical Innovators, contrast their
behaviors with other companies and discuss how these
differences matter to organizational performance.
The concept of Analytical Innovators emerged when
we combined responses to two of our survey questions,
one about creating a competitive advantage with analyt-
ics and one about using analytics to innovate.15 We then
CASE STUDY: Caesars Entertainment
Another dimension of the analytics revolution is balancing intuition with ana-lyticalinsights.Decision-makers,especiallyinthecontextofstrategicjudgment, often need to strike the right balance between a course of action suggestedbydataandadifferentcourseofactionindicatedbyintuition.Onone hand, there is a clear sense in which the distinction between intuition and dataisfalse:Manyjudgmentsmustbemadeaboutwhichdatatouseandhowtointerpretitinorderfordatatobecomeinsightsinthefirstplace.Buton the other hand, as analytical insights grow in number and influence within anorganization,theneedtoputtheseinsightsintoabroadercontextwillbe-come even more important.
CaesarsEntertainmentCorporationisacaseinpoint.LedbychairmanandCEOGaryLoveman—aformerHarvardBusinessSchoolprofessorwithadoctorateineconomicsfromMIT—CaesarswasofferedthechancetobidonagamblingconcessioninMacau,China,in2006.Theaskingpriceoftheconcessionwas$900million.Loveman,whohadestablishedareputationforhimself by profitably using analytics to fine-tune customer segments and build effective loyalty programs, ran the numbers but couldn’t produce a valu-ationanywherenear$900million.Hedeclinedtobid.Theglobalfinancialcrisishitthenextyear—butnotinMacau,whichenjoyedagrowthexplosion.CaesarsboughtagolfpropertyinMacauin2007forcloseto$600millioninthehopesofturningitintoagamingproperty.UnfortunatelyforCaesars,nomore gambling concessions have been (or are likely to be) issued to foreign investors.OneofCaesars’competitorsisnowprofitingmorefromitsproper-tiesinMacauthanfromitspropertiesinLasVegas.
LovemanhasbeenopenabouthismisstepsinMacau.“Youhadtohaveakind of intuitive courage, and I am not well-suited to those kinds of decisions,” he said in 2010.i“Bigmistake.Iwaswrong,Iwasreallywrong.”

MOREFROMMITSMRONDATA&ANALYTICS REIMAGININGTHEPOSSIBLEWITHDATAANALYTICS•MIT SLOAN MANAGEMENT REVIEW 7
grouped respondents into three distinct levels of analyt-
ics sophistication according to how they responded to
both questions. (See Figure 2: Analytical Innovators —
A Small Group of Analytics Leaders.)
Analytical Innovators are those respondents
who strongly agree that analytics has helped im-
prove their organizations’ ability to innovate and
say that analytics has helped create a competitive
advantage to a great extent. Analytics Practitioners
are utilizing data, mostly to address tactical and
operational issues, but are not innovating with ana-
lytics at the same level as Analytical Innovators. And
Analytically Challenged organizations are strug-
gling to use data beyond basic reporting and
marketing applications.
Analytical Innovators are distinguished by sev-
eral key characteristics: their mindset and culture,
their actions and their outcomes.
Mindset and CultureMore than other companies, Analytical Innovators
have developed an analytical mindset that supports
the use of data and analytics across a wide range of
corporate activities. They tend to view data as a core
asset; they challenge the status quo; they believe in
the possible; and they are open to new ways of
thinking.
Data as a Core Asset: It’s Cultural Several execu-
tives in our interview series described data as a core
asset — in their companies, analytical insights are
part of the culture of the organization and are uti-
lized in strategic decisions, both large and small.
Analytics determines products and services, project
success or failure, and the allocation of resources.
Employees, whether data-oriented or not, utilize
these insights in their decision-making processes.
Neel Sundaresan, senior director and head of
eBay Research Labs, describes the role of analytic
insights at eBay:
Everybody in the organization — whether you
are a technical person, a researcher or an engi-
neer, a product manager, a businessperson, or
an analyst — has to be data-driven. Now, not
everybody has to look at data, but everybody
has to understand data at some level. A lot of
data is coming from the behavior of millions of
people on our site. So, being able to understand
and get your head around that data is really
important. You can think of it as an attitude
change in all grades of people.”
Michael Johnson, director of the utility for care
data analysis at Kaiser Permanente, describes how
analytics permeates healthcare delivery:
With our electronic medical record system,
we’ve become much more data driven and an-
alytics oriented. Pretty much every actor in the
care delivery system is using the same record
and entering information in the same place.
That allows us to do some remarkable things
with regard to thinking about where and how
members should receive care, and how to im-
prove the flow of information, while at the
same time lowering costs.
New Ways of Thinking Sixty percent of Analyti-
cal Innovators “strongly agree” that they are open
to new ideas that challenge the status quo, a view
that is weakly represented among other companies.
(See Figure 3: Open to New Ideas.)
A perfect example of an Analytical Innovator
company with this mindset is online dating service
Match.com. The evolution of analytics has changed
how the company thinks about everything it does,
according to its CEO, Mandy Ginsberg:
Everything that we do is driven by analytics.
We literally test every page, every new feature
— there’s nothing that we do where we don’t
understand the impact of what we’ve done.
Match.com has become much smarter in
the past four years. We’ve grown the data and
analytics team considerably compared to some
of the other areas of our business. We realized
FIGURE 2: ANALYTICAL INNOVATORS — A SMALL GROUP OF ANALYTICS LEADERSRespondents are at various levels of analytics sophistication.
Analytical Innovators
Analytical Practitioners
Analytically Challenged
11%
29%
60%

8 MIT SLOAN MANAGEMENT REVIEW•SASINSTITUTEINC. MOREFROMMITSMRONDATA&ANALYTICS
S P E C I A L R E P O R T R E I M A G I N I N G T H E P O S S I B L E W I T H D A T A A N A L Y T I C S
that we needed to double down in this area,
and we started getting smarter and smarter
about decisions.
Match.com has been around for 18 years,
and that is both a benefit and a curse because
we had old infrastructure and old ways of
doing things, and had to adapt, versus a com-
pany like Zynga who is so fresh and new and
everything they do is as a data driven company.
In fact, I would say a company like Zynga is a
data company that happens to do games. We’re
a dating company that happens to be good at
analytics, but it went in that reverse order. It’s
shocking how far we’ve come.
Analytical Innovators use different language
than other types of companies to talk about analyt-
ics. In response to an open-ended survey question,
Analytically Challenged managers often referred to
their analytics capabilities in terms of “we can’t” or
“we don’t.” Analytics Practitioners frequently de-
scribed their analytics capabilities in practical
terms, such as solving problems or increasing effi-
ciencies. In stark contrast, Analytics Innovators
describe their analytics capabilities in terms of “rei-
magining” or “rethinking.”
Key Actions Compared to the other groups, Analytical Innovators
report that they use more of their data, use it to obtain
more timely answers, collaborate more with analytics
and are more effective throughout the information
value chain. In short, Analytical Innovators use data
and analytics much differently than everyone else.
Getting Real-Time Answers and Developing Products More Quickly We asked respondents to
rank the top three uses of analytics in their organiza-
tions and found that the groups diverged on several
key applications. For Analytical Innovators, the No. 1
use of analytics is to make real-time decisions. For
other groups, the top answer was reducing costs. The
next top use of analytics among Analytical Innova-
tors is increasing customer understanding, followed
by accelerating the development of new products.
(See Figure 4: Analytical Innovators Use Analytics
Differently Than Other Companies.)
Sam Hamilton, vice president of data at PayPal,
describes how analytics has influenced that compa-
ny’s real-time decision making:
We have gone from report creation that takes
weeks or months to deliver, to self-service, real-
time data analysis. And we have gone from data
analysis done by a small group of analysts to
data-driven decisions throughout PayPal, done
by most of the staff. All of this has progressively
shrunk the latency of time to value of data.
In our interviews, we asked executives from
companies that had many of the earmarks of Ana-
lytical Innovators how analytics was influencing
their product development life cycle. The com-
ments of eBay’s Neel Sundaresan were typical:
Increasingly (Internet-based) products are getting
improved and improvised as they get used. As
these products get used at scale, they generate a lot
of user behavioral data. This provides the oppor-
tunity to enhance these products as users use them
and create analytics-driven learning products.
Think about the product life cycles now and
those from a few years ago. Before you would
probably have a product release every year, every
two years, and you’re waiting for the next revi-
sion to be released with enhancements, whereas
now it’s just happening all the time. Releases?
There is no well-defined product release.
Use More of Their Own Data Analytical Innova-
tors use more of their data than other companies.
They are nearly three times more likely to say they
use a great deal or all of their data than Analytically
Challenged organizations do, which are the least ef-
FIGURE 3: OPEN TO NEW IDEASMost Analytical Inno-vators strongly agree with the statement: My organization is open to new ideas that challenge the status quo.
Analytical Innovators
Analytical Practitioners
Analytically Challenged
Stronglydisagree
Somewhatdisagree
Somewhatagree
Stronglyagree
“My organization is open to ideas and approaches that challenge current practices.”
0% 20% 40% 60% 80% 100%

MOREFROMMITSMRONDATA&ANALYTICS REIMAGININGTHEPOSSIBLEWITHDATAANALYTICS•MIT SLOAN MANAGEMENT REVIEW 9
fective at using analytics for competitive advantage
and innovation. More generally, we saw a strong
correlation between how much a given company
uses analytics to create competitive advantage and
advance innovation, and how much of their data
that company uses. (See Figure 5: Analytical Inno-
vators Use More of the Data They Collect.)
LinkedIn is among the few companies that uti-
lizes virtually all of its data. Every web request the
company gets generates a transaction, and every
transaction has some information and value associ-
ated with it, according to Deepak Agarwal,
LinkedIn’s director of relevance science:
While carefully respecting the privacy of our
LinkedIn members’ data, every single bit of
information is eventually used. The raw data
gets transformed in very complex ways, allow-
ing for members’ data to remain private and
anonymized. There are many different ana-
lysts and data scientists who analyze this data,
create different groupings of the data, create
different aggregates of the data, look at differ-
ent kinds of numbers on different user
subpopulations and then glean insights
from them. That’s what ultimately goes into
improving the relevance of our products.
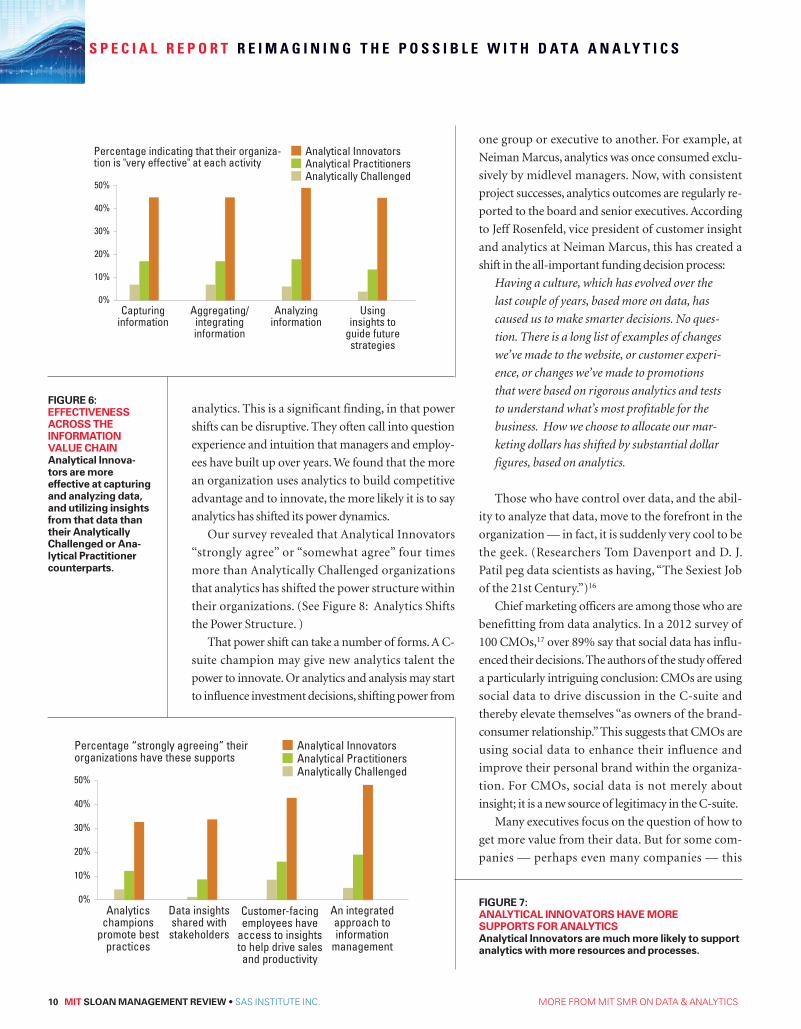
More Effective Throughout the Information Value Chain Analytical Innovators are also more
effective than other companies at each step of the
information value chain. (See Figure 6: Effective-
ness Across the Information Value Chain.)
Compared to Analytically Challenged organiza-
tions, Analytical Innovators are more than twice as
effective capturing information, nearly three times
as effective at analyzing information and three
times as effective at using insights to guide strategy.
Beyond the basics of capturing and analyzing
information, Analytical Innovators are much more
likely to support their analytics activities with an in-
tegrated approach to information management that
disseminates insights to customer-facing employees
and to partners and suppliers. Analytical Innova-
tors bolster their efforts to share knowledge and
insights through champions who promote best
practices. And they are much more likely than other
groups to have these key supports in place. (See Fig-
ure 7: Analytical Innovators Have More Supports
for Analytics.)
Outcomes: Power Shifts to Those with Insight One distinguishing characteristic of Analytical Inno-
vators is also a compelling theme that emerged during
our research: Analytical Innovators report a power
shift in their organization because of their use of
50%
40%
30%
20%
10%
0%Reduce
enterprise costs
Improve resource
allocations
Percentage indicating this activity as a main use of analytics
Increase customer
under-standing
Make real-time decisions
Identify new
markets
Accelerate development
of new products / services
Analytical InnovatorsAnalytical PractitionersAnalytically Challenged
Analytical Innovators
Analytical Practitioners
Analytically Challenged
Notmuch
Some A greatdeal
Allof it
How much of the data generated by your organization does your organization use?
0% 20% 40% 60% 80% 100%
FIGURE 5: ANALYTICAL INNOVATORS USE MORE OF THE DATA THEY COLLECTAnalytical Innovators tend to know why they are collecting data and how to use it.
FIGURE 4: ANALYTICAL INNOVATORS USE ANALYTICS DIFFERENTLY THAN OTHER COMPANIESMaking real-time decisions is the No. 1 use of analytics among Analytical Innovators, compared to cost reduc-tion for other groups.
10 MIT SLOAN MANAGEMENT REVIEW•SASINSTITUTEINC. MOREFROMMITSMRONDATA&ANALYTICS
S P E C I A L R E P O R T R E I M A G I N I N G T H E P O S S I B L E W I T H D A T A A N A L Y T I C S
analytics. This is a significant finding, in that power
shifts can be disruptive. They often call into question
experience and intuition that managers and employ-
ees have built up over years. We found that the more
an organization uses analytics to build competitive
advantage and to innovate, the more likely it is to say
analytics has shifted its power dynamics.
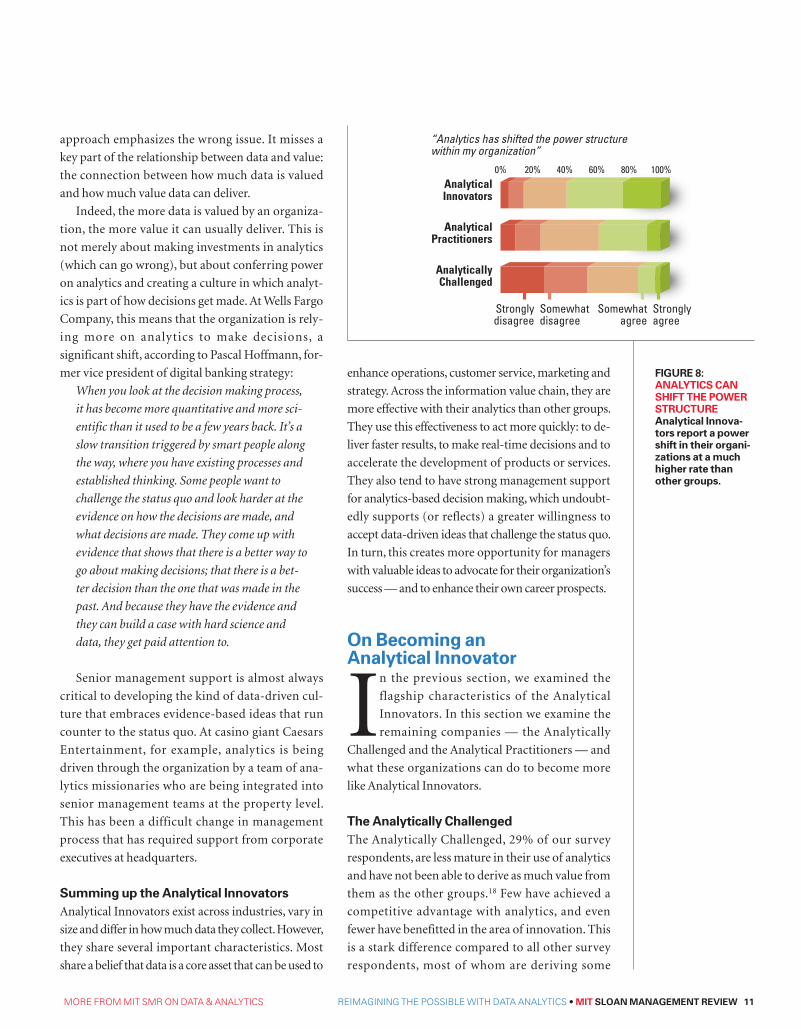
Our survey revealed that Analytical Innovators
“strongly agree” or “somewhat agree” four times
more than Analytically Challenged organizations
that analytics has shifted the power structure within
their organizations. (See Figure 8: Analytics Shifts
the Power Structure. )
That power shift can take a number of forms. A C-
suite champion may give new analytics talent the
power to innovate. Or analytics and analysis may start
to influence investment decisions, shifting power from
one group or executive to another. For example, at
Neiman Marcus, analytics was once consumed exclu-
sively by midlevel managers. Now, with consistent
project successes, analytics outcomes are regularly re-
ported to the board and senior executives. According
to Jeff Rosenfeld, vice president of customer insight
and analytics at Neiman Marcus, this has created a
shift in the all-important funding decision process:
Having a culture, which has evolved over the
last couple of years, based more on data, has
caused us to make smarter decisions. No ques-
tion. There is a long list of examples of changes
we’ve made to the website, or customer experi-
ence, or changes we’ve made to promotions
that were based on rigorous analytics and tests
to understand what’s most profitable for the
business. How we choose to allocate our mar-
keting dollars has shifted by substantial dollar
figures, based on analytics.
Those who have control over data, and the abil-
ity to analyze that data, move to the forefront in the
organization — in fact, it is suddenly very cool to be
the geek. (Researchers Tom Davenport and D. J.
Patil peg data scientists as having, “The Sexiest Job
of the 21st Century.”)16
Chief marketing officers are among those who are
benefitting from data analytics. In a 2012 survey of
100 CMOs,17 over 89% say that social data has influ-
enced their decisions. The authors of the study offered
a particularly intriguing conclusion: CMOs are using
social data to drive discussion in the C-suite and
thereby elevate themselves “as owners of the brand-
consumer relationship.” This suggests that CMOs are
using social data to enhance their influence and
improve their personal brand within the organiza-
tion. For CMOs, social data is not merely about
insight; it is a new source of legitimacy in the C-suite.
Many executives focus on the question of how to
get more value from their data. But for some com-
panies — perhaps even many companies — this
50%
40%
30%
20%
10%
0%Capturing
informationAggregating/
integrating information
Percentage indicating that their organiza-tion is "very effective" at each activity
Analyzing information
Using insights to
guide future strategies
Analytical InnovatorsAnalytical PractitionersAnalytically Challenged
FIGURE 6: EFFECTIVENESS ACROSS THE INFORMATION VALUE CHAINAnalytical Innova-tors are more effective at capturing and analyzing data, and utilizing insights from that data than their Analytically Challenged or Ana-lytical Practitioner counterparts.
FIGURE 7: ANALYTICAL INNOVATORS HAVE MORE SUPPORTS FOR ANALYTICSAnalytical Innovators are much more likely to support analytics with more resources and processes.
50%
40%
30%
20%
10%
0%Analytics
champions promote best
practices
Data insights shared with stakeholders
Percentage “strongly agreeing” their organizations have these supports
Customer-facing employees have
access to insights to help drive sales and productivity
An integrated approach to information
management
Analytical InnovatorsAnalytical PractitionersAnalytically Challenged
MOREFROMMITSMRONDATA&ANALYTICS REIMAGININGTHEPOSSIBLEWITHDATAANALYTICS•MIT SLOAN MANAGEMENT REVIEW 11
approach emphasizes the wrong issue. It misses a
key part of the relationship between data and value:
the connection between how much data is valued
and how much value data can deliver.
Indeed, the more data is valued by an organiza-
tion, the more value it can usually deliver. This is
not merely about making investments in analytics
(which can go wrong), but about conferring power
on analytics and creating a culture in which analyt-
ics is part of how decisions get made. At Wells Fargo
Company, this means that the organization is rely-
ing more on analytics to make decisions, a
significant shift, according to Pascal Hoffmann, for-
mer vice president of digital banking strategy:
When you look at the decision making process,
it has become more quantitative and more sci-
entific than it used to be a few years back. It’s a
slow transition triggered by smart people along
the way, where you have existing processes and
established thinking. Some people want to
challenge the status quo and look harder at the
evidence on how the decisions are made, and
what decisions are made. They come up with
evidence that shows that there is a better way to
go about making decisions; that there is a bet-
ter decision than the one that was made in the
past. And because they have the evidence and
they can build a case with hard science and
data, they get paid attention to.
Senior management support is almost always
critical to developing the kind of data-driven cul-
ture that embraces evidence-based ideas that run
counter to the status quo. At casino giant Caesars
Entertainment, for example, analytics is being
driven through the organization by a team of ana-
lytics missionaries who are being integrated into
senior management teams at the property level.
This has been a difficult change in management
process that has required support from corporate
executives at headquarters.
Summing up the Analytical InnovatorsAnalytical Innovators exist across industries, vary in
size and differ in how much data they collect. However,
they share several important characteristics. Most
share a belief that data is a core asset that can be used to
enhance operations, customer service, marketing and
strategy. Across the information value chain, they are
more effective with their analytics than other groups.
They use this effectiveness to act more quickly: to de-
liver faster results, to make real-time decisions and to
accelerate the development of products or services.
They also tend to have strong management support
for analytics-based decision making, which undoubt-
edly supports (or reflects) a greater willingness to
accept data-driven ideas that challenge the status quo.
In turn, this creates more opportunity for managers
with valuable ideas to advocate for their organization’s
success — and to enhance their own career prospects.
On Becoming an Analytical Innovator
In the previous section, we examined the
flagship characteristics of the Analytical
Innovators. In this section we examine the
remaining companies — the Analytically
Challenged and the Analytical Practitioners — and
what these organizations can do to become more
like Analytical Innovators.
The Analytically ChallengedThe Analytically Challenged, 29% of our survey
respondents, are less mature in their use of analytics
and have not been able to derive as much value from
them as the other groups.18 Few have achieved a
competitive advantage with analytics, and even
fewer have benefitted in the area of innovation. This
is a stark difference compared to all other survey
respondents, most of whom are deriving some
Analytical Innovators
Analytical Practitioners
Analytically Challenged
Stronglydisagree
Somewhatdisagree
Somewhatagree
Stronglyagree
“Analytics has shifted the power structure within my organization”
0% 20% 40% 60% 80% 100%
FIGURE 8: ANALYTICS CAN SHIFT THE POWER STRUCTUREAnalytical Innova-tors report a power shift in their organi-zations at a much higher rate than other groups.
12 MIT SLOAN MANAGEMENT REVIEW•SASINSTITUTEINC. MOREFROMMITSMRONDATA&ANALYTICS
S P E C I A L R E P O R T R E I M A G I N I N G T H E P O S S I B L E W I T H D A T A A N A L Y T I C S
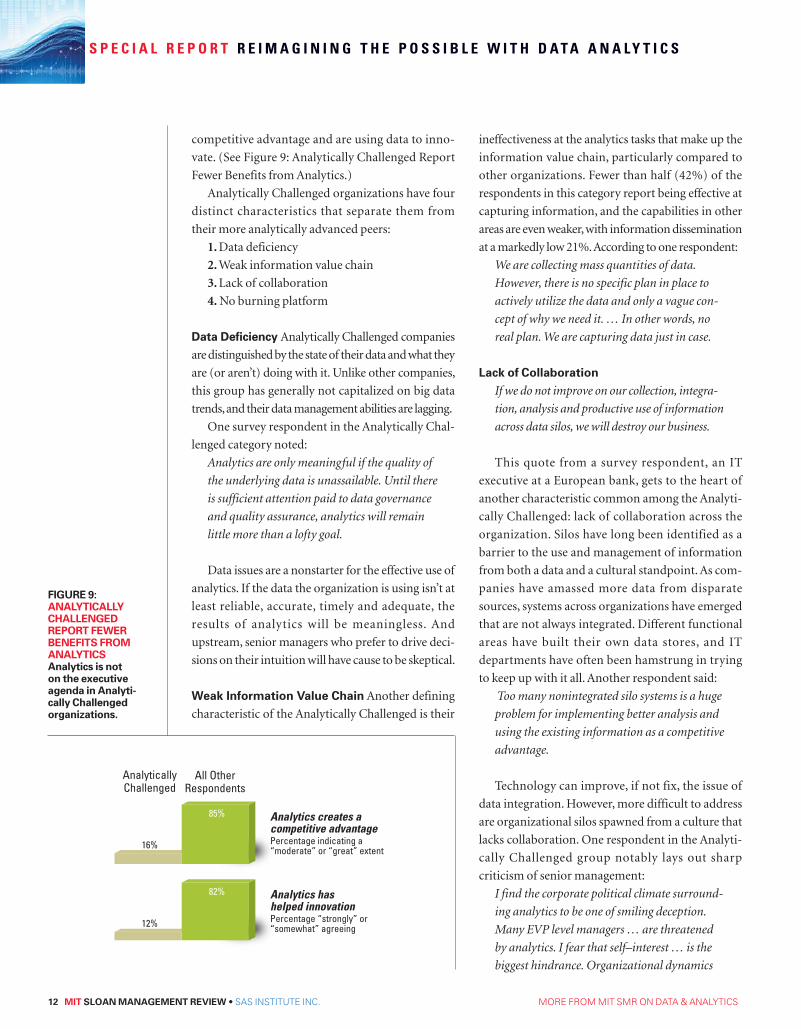
competitive advantage and are using data to inno-
vate. (See Figure 9: Analytically Challenged Report
Fewer Benefits from Analytics.)
Analytically Challenged organizations have four
distinct characteristics that separate them from
their more analytically advanced peers:
1. Data deficiency
2. Weak information value chain
3. Lack of collaboration
4. No burning platform
Data Deficiency Analytically Challenged companies
are distinguished by the state of their data and what they
are (or aren’t) doing with it. Unlike other companies,
this group has generally not capitalized on big data
trends, and their data management abilities are lagging.
One survey respondent in the Analytically Chal-
lenged category noted:
Analytics are only meaningful if the quality of
the underlying data is unassailable. Until there
is sufficient attention paid to data governance
and quality assurance, analytics will remain
little more than a lofty goal.
Data issues are a nonstarter for the effective use of
analytics. If the data the organization is using isn’t at
least reliable, accurate, timely and adequate, the
results of analytics will be meaningless. And
upstream, senior managers who prefer to drive deci-
sions on their intuition will have cause to be skeptical.
Weak Information Value Chain Another defining
characteristic of the Analytically Challenged is their
ineffectiveness at the analytics tasks that make up the
information value chain, particularly compared to
other organizations. Fewer than half (42%) of the
respondents in this category report being effective at
capturing information, and the capabilities in other
areas are even weaker, with information dissemination
at a markedly low 21%. According to one respondent:
We are collecting mass quantities of data.
However, there is no specific plan in place to
actively utilize the data and only a vague con-
cept of why we need it. … In other words, no
real plan. We are capturing data just in case.
Lack of Collaboration
If we do not improve on our collection, integra-
tion, analysis and productive use of information
across data silos, we will destroy our business.
This quote from a survey respondent, an IT
executive at a European bank, gets to the heart of
another characteristic common among the Analyti-
cally Challenged: lack of collaboration across the
organization. Silos have long been identified as a
barrier to the use and management of information
from both a data and a cultural standpoint. As com-
panies have amassed more data from disparate
sources, systems across organizations have emerged
that are not always integrated. Different functional
areas have built their own data stores, and IT
departments have often been hamstrung in trying
to keep up with it all. Another respondent said:
Too many nonintegrated silo systems is a huge
problem for implementing better analysis and
using the existing information as a competitive
advantage.
Technology can improve, if not fix, the issue of
data integration. However, more difficult to address
are organizational silos spawned from a culture that
lacks collaboration. One respondent in the Analyti-
cally Challenged group notably lays out sharp
criticism of senior management:
I find the corporate political climate surround-
ing analytics to be one of smiling deception.
Many EVP level managers … are threatened
by analytics. I fear that self–interest … is the
biggest hindrance. Organizational dynamics
Analytics creates a competitive advantagePercentage indicating a “moderate” or “great” extent
Analytics has helped innovationPercentage “strongly” or “somewhat” agreeing
AnalyticallyChallenged
16%
12%
85%
82%
All OtherRespondents
FIGURE 9: ANALYTICALLY CHALLENGED REPORT FEWER BENEFITS FROM ANALYTICSAnalytics is not on the executive agenda in Analyti-cally Challenged organizations.

MOREFROMMITSMRONDATA&ANALYTICS REIMAGININGTHEPOSSIBLEWITHDATAANALYTICS•MIT SLOAN MANAGEMENT REVIEW 13
are always at the core of enterprise solution
adoption. … I fear it probable that many
officers may be shackled and apprehensive,
caught on the sucker’s side of the Prisoner’s
Dilemma.19
No Burning Platform The fourth characteristic of
Analytically Challenged companies is that they
appear to have no key driver to use analytics — no
real burning platform compelling them to make the
foray into analytics, let alone to improve their data
management. Without something threatening to
spur them to action and leave the status quo, there
will not likely be much change. As one Analytically
Challenged survey respondent noted:
Everyone believes that if we’ve managed so far
and so well without a robust strategic approach
to data analytics, we can go on doing so in the
future as well.
These companies are clearly change-resistant. A
telling example: Only 13% of the Analytically Chal-
lenged strongly agree that their companies are open
to approaches that challenge current practices, com-
pared to 60% of Analytical Innovators who feel that
way. Evidently, many Analytically Challenged organi-
zations are feeling no pressure to do things differently.
Another respondent from this group offered:
Unfortunately, the pain of declining profits and
markets will have to take the lead before man-
agement will seriously look to analytics as a
source of competitive advantage. No pain, no
analytics seems to be the business model.
Supporting this notion is our finding that only
29% of the Analytically Challenged organizations
indicate that analytics is a top-down mandate, com-
pared to 55% of all other respondents. There is a
case to be made that not only are these organiza-
tions analytically challenged but they are also
analytically apathetic.
Moving Forward with Analytics Analytics in the organization has a huge
future. I’m very interested in where big data
goes over the next few years. My organization
doesn’t get it at this point; there are some pock-
ets of the company where teams are pushing for
increased analytics, but the C-suite doesn’t yet
see the value.
This survey response seems to capture the atti-
tude of many respondents in the Analytically
Challenged group, who expressed general frustra-
tion with their organization’s view on data and
analytics. The obstacles they face due to data defi-
ciency, a weak information value chain, lack of
collaboration and no burning platform are formidable.
Though it is unlikely that a company will prog-
ress from Analytically Challenged directly to being
an Analytical Innovator, the data advocates in these
organizations can help ignite change. The mission
for the individual who wants to be an analytics cata-
lyst: Lead analytics change by showing value.
We’ve identified three key issues stemming from
the characteristics noted above that individuals can
begin to address: technology latency, lack of collab-
oration and inertia.
Technology Latency. The Analytically Challenged
are stymied in their progress by core data issues, from
upstream at the capture, quality, integration and
access phases to downstream, where data is analyzed
and disseminated. To address these areas, companies
must invest in improved infrastructure, processes
and technology skills. Wholesale change of these
competencies across the organization is impossible
without executive commitment to data. Therefore,
improvement must start at the localized level.
Action items for the analytics catalyst: Identify a
small but important issue that will benefit from the
use of analytics. Use the resources that can be found
in the organization and highlight what needs to be
brought in from the outside. Find the internal geeks
— those who are hungry for analytical work — and
take a seat at their lunch table. Gather credible, timely
and accurate data. Make use of the available analyti-
cal technology, and focus on identifying solutions to
your issue that have a clear and measurable impact.
Lack of Collaboration. The silos in the organiza-
tion, whether built from data stores or management
protectionism, are a major impediment to the effec-
tive use of information. Talk about breaking down
14 MIT SLOAN MANAGEMENT REVIEW•SASINSTITUTEINC. MOREFROMMITSMRONDATA&ANALYTICS
S P E C I A L R E P O R T R E I M A G I N I N G T H E P O S S I B L E W I T H D A T A A N A L Y T I C S
these silos is not new. But enterprise-wide change in
this arena could require a substantial information
infrastructure investment, not to mention a dra-
matic culture shift. However, collaboration can start
to occur at the individual level.
Action items for the analytics catalyst: Reach
across the hall to those who have data that is impor-
tant to addressing your issue. Enlist their help
as partners in increasing the value of their data in de-
cision making. Build ongoing relationships by
including them in the process moving forward. Facili-
tate discussions among peers in different departments
on bringing data together to address specific chal-
lenges. Give to get — share information of value to
other departments to encourage reciprocity.
Inertia. Unfortunately, Analytically Challenged or-
ganizations are constrained in their use of analytics
by their executives’ unwillingness to change the sta-
tus quo. These executives see no need for large
investments in the infrastructure, systems and tal-
ent necessary to drive decisions with analytics
because they believe that what they have been doing
is working just fine. They are suspicious of data,
particularly if it contradicts their intuition. So far,
there has been no life-threatening event to their or-
ganization that has spurred thinking beyond the
status quo. Outside of creating a burning platform
to ignite a need for changes in decision making,
those advocating the use of analytics simply must
prove its value, one small win at a time.
Action items for the analytics catalyst: Develop
an executive communication strategy for your ana-
lytics use case. To increase the credibility of the effort,
engage your cross-sectional team to participate.
Translate the analytical results into business insights
and recommended actions. Show a clear ROI in
terms of cost reduction, improved operations or in-
creased revenue. Focus discussions on improving the
business issue rather than on the method.
The Analytics PractitionersThe second and largest segment we identified through
the survey responses is the Analytics Practitioners,
which represent 60% of respondents. These compa-
nies have made significant progress in their analytics
journey, and many are reaping strong benefits. How-
ever, the key metric that separates them from the
Analytical Innovators is outcome. Recall that the Ana-
lytical Innovator group consists of those respondents
who indicated that the use of analytics has provided a
competitive advantage to a great extent and strongly
agreed that analytics has helped them innovate. The
Analytics Practitioners have not achieved this high
level of competitive advantage and innovation from
analytics. But they have matured well beyond the
Analytically Challenged on their path to being data-
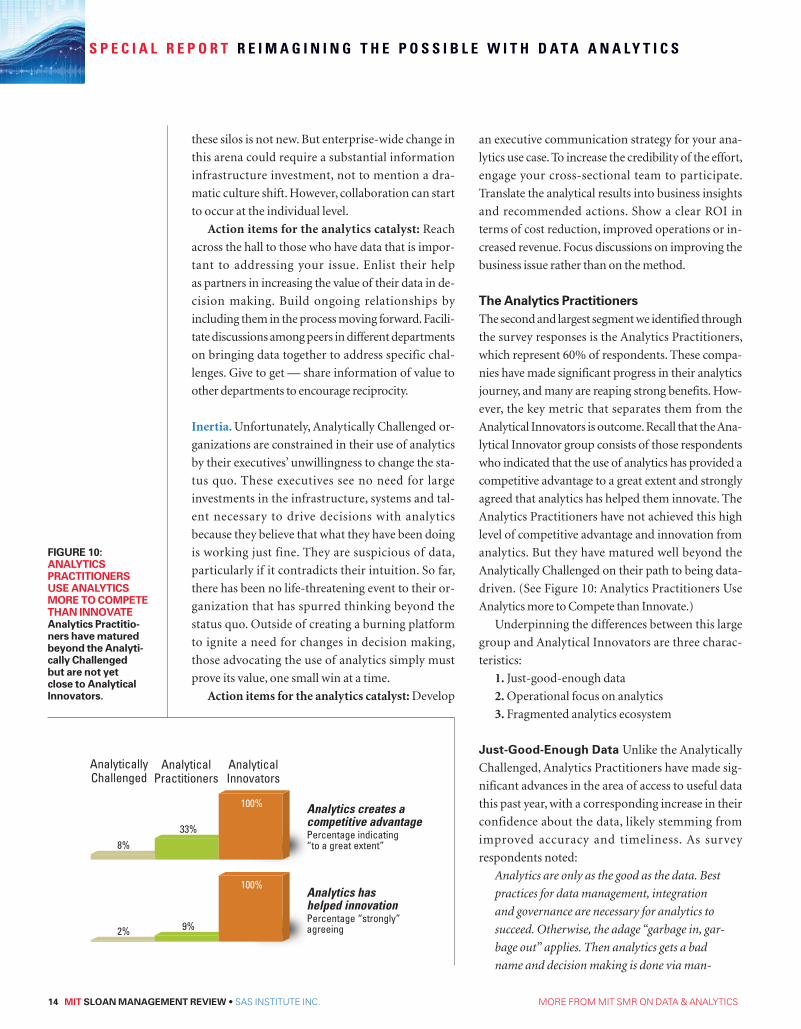
driven. (See Figure 10: Analytics Practitioners Use
Analytics more to Compete than Innovate.)
Underpinning the differences between this large
group and Analytical Innovators are three charac-
teristics:
1. Just-good-enough data
2. Operational focus on analytics
3. Fragmented analytics ecosystem
Just-Good-Enough Data Unlike the Analytically
Challenged, Analytics Practitioners have made sig-
nificant advances in the area of access to useful data
this past year, with a corresponding increase in their
confidence about the data, likely stemming from
improved accuracy and timeliness. As survey
respondents noted:
Analytics are only as the good as the data. Best
practices for data management, integration
and governance are necessary for analytics to
succeed. Otherwise, the adage “garbage in, gar-
bage out” applies. Then analytics gets a bad
name and decision making is done via man-
Analytics creates a competitive advantagePercentage indicating “to a great extent”
Analytics has helped innovationPercentage “strongly” agreeing
AnalyticallyChallenged
8%
2%
33%
9%
100%
100%
AnalyticalPractitioners
AnalyticalInnovators
FIGURE 10: ANALYTICS PRACTITIONERS USE ANALYTICS MORE TO COMPETE THAN INNOVATEAnalytics Practitio-ners have matured beyond the Analyti-cally Challenged but are not yet close to Analytical Innovators.

MOREFROMMITSMRONDATA&ANALYTICS REIMAGININGTHEPOSSIBLEWITHDATAANALYTICS•MIT SLOAN MANAGEMENT REVIEW 15
agement intuition rather than based on facts
originating in the data.
We operate in extremely complex markets that
are very difficult to model, so the reliability of
the data, analysis or insights is often challenged
by the decision makers. We still have a way to go.
Let’s be clear: This group still has room for im-
provement in terms of data proficiency. But Analytics
Practitioners have achieved a level at which they are
able to make use of their information to help run
their businesses. In their own words:
Today, accessing data is not an issue, but the
challenge lies in structuring the data, manag-
ing the data and making the data more usable,
which will enable quicker decision making.
We have the data in pockets and currently
manually piece a lot of it together, but have
been making great progress in first aligning
data so we speak the same language across the
global operations, then connecting data, and
finally creating dashboards and tools to pro-
vide the right data to the right people.
Operational Focus on AnalyticsAnalytics are mired in “automating the
existing” rather than innovating a brighter
performance future. It is a culture problem
that will not be mitigated until a real leader-
ship change occurs.
As this survey respondent points out, Analytics Prac-
titioners tend to be focused more on day-to-day
operational use of analytics, as opposed to using it to
drive innovation and change the business. This is clearly
supported by the survey results, which show that the top
two uses of analytics among this group, similar to the
Analytically Challenged, are reduction of enterprise costs
and improvement in resource allocations. Compare these
to the priority uses of the Analytical Innovators: making
real-time decisions and increasing customer understand-
ing. One Analytics Practitioner respondent noted:
We have to teach the enterprise to “behave”
differently with data and move from a
transactional to an insight mindset.
The balance of using analytics and intuition in
key decisions is another example of the operational
focus of Analytical Practitioners. In decisions in the
areas of budget allocation, financial forecasts, sup-
ply chain management and allocating employees’
time, Analytics Practitioners and Analytical Inno-
vators use a similar balance of intuition and
analytics. However, for more strategic insights such
as identifying target customers, enhancing cus-
tomer experience and establishing strategy for the
organization, Analytical Innovators are much more
reliant on analytics than the Practitioners.
Fragmented Analytics Ecosystem Analytics are HUGE in my company. … Until
recently, though, it was held in the hands of
very few people. To the point where we worried
about the proverbial “what if they get hit by a
bus” scenario. The past 12 months have been
focused on integrating and trying to give data
access to more people.
As seen in this comment, the third key differen-
tiator of the Analytics Practitioner and their more
analytics-savvy counterpart is their fragmented
approach to the execution and use of analytics in
the organization. Additional fragmentation is evi-
denced by differences in where companies are in
their integration of information management and
business analytics. While fully 85% of the Analyti-
cal Innovators indicate that an integrated approach
is a core part of their business strategy, only 59% of
the Analytics Practitioners report the same. One
respondent’s view of the future of analytics empha-
sizes this point:
In the future, analytics will transition from
simple information gatherers and maintainers
to influential thought-leaders that are inte-
grated parts of teams across the organization.
In the meantime, a pervasive issue still exists: inef-
fective dissemination of key insights to employees.
We found that companies generally seem to struggle
most with the dissemination of some components of
the information value chain. This is quite definitely
the weakest link for the Analytics Practitioners. One
survey respondent from this group said:

16 MIT SLOAN MANAGEMENT REVIEW•SASINSTITUTEINC. MOREFROMMITSMRONDATA&ANALYTICS
S P E C I A L R E P O R T R E I M A G I N I N G T H E P O S S I B L E W I T H D A T A A N A L Y T I C S
The need internally is to have access to action-
able insight with data at the right level of
granularity — when it is needed.
What’s more, only 14% of Analytics Practitio-
ners report increasing by “a great deal” their delivery
of actionable insights to frontline employees over
the past year, as compared to 35% of Analytical
Innovators. That, coupled with the 16% of Analyti-
cal Practitioner organizations that “strongly agree”
that their customer-facing employees have access to
insights, gives rise to a sort of insight fragmentation
— analytics is being conducted to drive decisions,
but the results are not being shared among those
who might be in the best positions to drive change.
In the words of one respondent:
A data-driven decision culture is at its beginning
of being developed across the organization. It
will be effective only if it is being embraced at all
levels and everyone is empowered to access it.
Moving Forward with AnalyticsThe current operational and tactical use of analytics
by Analytics Practitioners is not unexpected for com-
panies getting their feet wet in the use of analytics
technology. Many companies have only recently
made the foray into data-driven decisions and are
still experiencing growing pains. It’s clear that, unlike
some in the Analytically Challenged segment, these
organizations do see value in information, and they
are earnest in trying to use it to their advantage.
One Analytics Practitioner respondent noted:
Analytics are the essential tool in the toolbox.
The analytics are not THE answer, but the an-
alytics should inform us to reach or formulate
the answer. A growing trend for our company is
the ability to capture information from a wide
range of sources, use standard metrics and an-
alytics to glean some knowledge and then
ensure that this knowledge is appropriately
disseminated. This is a trend and a need within
our company ... it is a work in progress.
This optimism about the use of analytics was
strong among the Analytical Practitioner group.
Unlike the general feeling of “we can’t” among the
Analytically Challenged, this group showed a defi-
nite sentiment of “we’ll try.” The mission for
analytics evangelists who want to step up their orga-
nization’s use of analytics: Expand analytics reliance
by demonstrating strategic possibilities.
In order to develop the ability to “reimagine the
possible” with game-changing insights, at least
three issues must be addressed: due data diligence,
dashboard dependence and denial of access.
Due Data Diligence. A key differentiator between
these organizations and those taking analytics to the
next level is the data itself. It’s a matter of data qual-
ity, access and management. Analytical Innovators
are leading the charge in tapping new sources of
data. Analytics Practitioners should take note and
learn from them.
Action items for the analytics evangelist: Con-
duct a data audit. Do a quality check on the data you
are using to drive decisions. How long have you been
using the same data sources? Identify gaps in what
you have and what you need, and consider how data
from unconventional sources (e.g., social media)
might provide a new perspective on your business.
Dashboard Dependence. Business intelligence
technologies brought the ability to watch day-to-day
operations on bright and shiny dashboards and
monitor actual results against KPIs. But what’s hot
now is the ability to predict what’s going to happen
and to find patterns in data that lead to not-so-obvi-
ous conclusions. Analytics Practitioners who want
to step beyond the tactical and operational uses of
their data need to sharpen their analytical skills and
cast a net for analytics talent. If you are going to
make the move to Innovator, be prepared to invest.
Action items for the analytics evangelist: Take
stock of your own analytical prowess. Do you or
your staff have the right skills to employ sophisti-
cated analytical techniques? Search for talent that
combines an understanding of your business with a
passion for data exploration and technical skills.
Denial of Access. To help drive innovation, Analytics
Practitioners must do a better job at disseminating
key insights to the right people at the right time. Ana-
lytics should be approachable — easy to access,
simple and intuitive – in order to spur innovation
MOREFROMMITSMRONDATA&ANALYTICS REIMAGININGTHEPOSSIBLEWITHDATAANALYTICS•MIT SLOAN MANAGEMENT REVIEW 17
from all levels in the organization. As one respondent
said, “Analytics must be in the DNA of every empow-
ered employee.”
Action items for the analytics evangelist: Take
stock of your organization’s information access and
distribution. Are employees stifled in their jobs
because they don’t have the appropriate informa-
tion to make decisions? Connect with peers about
information dissemination, and developing strate-
gies that help empower workers with insight.
Conclusion
The analytics revolution is still at an early
point in its development. Many compa-
nies are still struggling to figure out how,
where and when to use analytics. Despite
their analytical prowess, less than half of Analytical
Innovators report that they are “very effective” at
capturing data, analyzing and integrating it, and
using analytical insights to guide strategy. Similarly,
less than half of Analytical Innovators strongly agree
that they share data with key stakeholders and have
an integrated approach to information management.
Even so, Analytical Innovators are much more
likely to be able create a competitive advantage from
analytics than their counterparts in the other two
groups. In part, this is a matter of definition. Analytical
Innovators are those respondents who say their com-
panies are using analytics (to a great extent) to compete
and innovate. However, the key lessons that we have
identified from studying this group is that:
(a) their orientation to data and analytics is much
different than other groups. How Analytical
Innovators think about analytics, how they sup-
port the development and dissemination of
analytical insights, and what they do with
analytics are very different compared to the ap-
proaches taken by the Analytically Challenged
and Analytics Practitioner groups
(b) We have boiled down these differences into
three characteristics:
i. A widely shared belief that data is a core
asset that can be used to enhance operations,
customer service, marketing and strategy
ii. More effective use of more data for faster
results
iii. Support for analytics by senior managers
who embrace new ideas and are willing to
shift power and resources to those who make
data-driven decisions
These are the main characteristics of companies
that are, today, leading the analytics revolution.
We hope that a better understanding of the Ana-
lytical Innovators will yield benefits for companies
that are looking not only to create business value
from analytics, but also for a more innovative way
to compete in their markets.
REFERENCES
1.“TheNewInitiativeontheDigitalEconomy,”press release,MITSloanSchoolofManagement,n.d., http://digital.mit.edu/ide/initiative/.
2.P.C.EvansandM.Annunziata,“IndustrialInternet:PushingtheBoundariesofMindsandMachines,”GE Reports,November26,2012.
3.Evans,“IndustrialInternet.”
4.R.BeanandD.Kiron,“OrganizationalAlignmentIsKeytoBigDataSuccess,”January28,2013,http://sloanre-view.mit.edu/article/.
5.“GovernorPatrickAnnouncesNewInitiativetoStrengthenMassachusetts’PositionasaWorldLeaderinBigData,”pressrelease,CommonwealthofMassachu-setts,May30,2012.
6.”GovernorPatrickAnnouncesNewInitiative.”
7.A.Pentland,“ReinventingSocietyintheWakeofBigData,”August30,2012,www.edge.org.
8.TweetedbyJoelCherkison10/21/12:https://twitter.com/jcherkis/status/260093078004707328.
9.J.Manyika,M.Chui,et.al,“BigData:TheNewFrontierforInnovation,CompetitionandProductivity,”May2011,www.mckinsey.com.
10.CapgeminiConsultingandMITCenterforDigitalBusi-ness,“TheDigitalAdvantage:HowDigitalLeadersOutperformTheirPeersinEveryIndustry,”November5,2012, www.capgemini.com.
12.E.BrynjolfssonandA.McAfee,“BigData,TheMan-agementRevolution,”HarvardBusinessReview90(October2012):61-67.
11.T.H.DavenportandJ.G.Harris,“CompetingonAnalytics:TheNewScienceofWinning”(Cambridge,MA:HarvardBusinessSchoolPress,2007).
13.M.Lewis,“Moneyball:TheArtofWinninganUnfairGame”(NewYork:W.W.Norton,2004).
14.L.Melnick,”MoneyballStrikesAgain:HowtoUseAn-alyticsforSustainedCompetitiveAdvantage,”October3,2012, http://lloydmelnick.com.
15.Thetwoquestionswere:(a)Towhatextentdoesinformationandbusiness
18 MIT SLOAN MANAGEMENT REVIEW•SASINSTITUTEINC. MOREFROMMITSMRONDATA&ANALYTICS
S P E C I A L R E P O R T R E I M A G I N I N G T H E P O S S I B L E W I T H D A T A A N A L Y T I C S
analytics create a competitive advantage for your organizationwithinitsindustryormarkets?
(b)Towhatextentdoyouagreewiththefollowingstatement?Analyticshashelpedimprovemyorga-nization’sabilitytoinnovate.
Managersthatchecked“greatextent”forbothquestionswere placed in the Analytical Innovators category.
16.T.H.DavenportandD.J.Patil,“DataScientist:TheSexiestJobofthe21stCentury,”HarvardBusiness Review90(October2012):70-76.
17.“ChiefConsumerAdvocate:HowSocialDataElevatesCMOs,”whitepaper,BazaarvoiceandtheCMOClub,Austin,TX,July25,2012.
18.RespondentsinAnalyticallyChallengedcompanies differ demographically in subtle but important ways from othersurveyparticipants.Theytendtobeinlessseniormanagement positions and have a slightly higher likeli-hood than other survey participants to work in operational functions.Thesedemographicdifferencesmightbeacon-tributingfactortotheirevaluationsoftheirorganizationsasless analytically mature.
19.Theprisoner’sdilemmareferstoanon-zero-sumgame that shows why two people may choose to betray each other even if cooperation is in their best interest. It’s based on the premise that two isolated prisoners involved in the same crime have the independent opportunity to either collaborate with each other by remainingsilentorselltheotherprisonerout.Eachcom-bination of possibilities results in a different outcome, withthebestforbothstemmingfromcooperation.Thesucker’s side is the prisoner who remains silent but is betrayed by the other prisoner.
i.K.T.Greenfeld,“LovemanPlays‘PurelyEmpirical’GameasHarrah’sCEO,”August6,2010,www.bloomberg.com.
To deepen our understanding of the challenges and opportunities associated with the use of business analytics, MIT Sloan Management Review, in partnership with SAS Institute Inc., has conducted its third annual survey, to which more than 2,500 business executives, managers and analysts responded from organizations located around the world. Our analysis includes individuals in 121 countries and more than 30 industries. Participating organizations also ranged widely in size, from those organizations reporting under $250 million in revenues to those with $20 billion and over in revenues. Respondents included MIT alumni and MIT Sloan Management Re-view subscribers, SAS clients and other interested parties.
In addition to these survey results, we interviewed academic experts and subject matter experts from a num-ber of industries and disciplines to understand the practical issues facing organizations today in their use of analytics. Our interviewees’ insights contributed to a richer understanding of the data and the development of recommendations that respond to strategic and tactical questions senior executives address as they implement analytics within their organizations. We also drew upon a number of case studies to further illustrate how orga-nizations are using business analytics as a competitive asset.
In this report, the term “analytics” refers to the use of data and related business insights developed through applied analytical disciplines (e.g., statistical, contextual, quantitative, predictive, cognitive and other models) to drive fact-based planning, decisions, execution, management, measurement and learning.
ANALYTICS Theuseofdataandrelatedinsightsdevelopedthroughappliedanalyticsdisciplines(forexample,statistical,contextual, quantitative, predictive, cognitive and other models) to drive fact-based planning, decisions, execution, man-agement, measurement and learning. Analytics may be descriptive, predictive or prescriptive.
DATA-ORIENTED CULTURE A pattern of behaviors and practices by a group of people who share a belief that having, understandingandusingcertainkindsofdataandinformationplaysacriticalroleinthesuccessoftheirorganization.
ABOUT THE RESEARCH
DEFINITIONS

MOREFROMMITSMRONDATA&ANALYTICS REIMAGININGTHEPOSSIBLEWITHDATAANALYTICS•MIT SLOAN MANAGEMENT REVIEW 19
Deepak Agarwal, Director, Relevance Science, LinkedIn Corporation
Bruno Aziza, Vice President, Worldwide Marketing, SiSense Inc.
Bruce Bedford, Vice President, Marketing Analytics and Consumer Insights, Oberweis Dairy Inc.
Veronika Belokhvostova, Head, Global Business Analytics, PayPal Inc.
Antonio Benjamin, Chief Technology Officer and Managing Director, Citigroup Global Transaction Services/Institutional Clients Group, Citigroup Inc.
Marco Cardinale, Head of Sports Science and Research, British Olympic Association
Louis Datko, Senior Research Psychologist, United States Air Force Survey Office
John Eliseo, Vice President, Enterprise Content, Metadata Management, Thomson Reuters
Helen Fisher, Chief Scientific Advisor, Chemistry.com
Dan Flood, Senior Director, Go-to-Market Supply Chain, PepsiCo North America Beverages
Mandy Ginsberg, CEO, Match.com
Arnab Gupta, CEO, Opera Solutions LLC
Sam Hamilton, Vice President, Data, PayPal, Inc.
Shawn Hanna, Director, Financial Analysis, Petco Animal Supplies Inc.
Pascal Hoffmann, former Vice President, Digital Banking Strategy, Wells Fargo & Company
Michael Johnson, Director, Utility for Care Data Analysis, Kaiser Permanente
Pete Johnson, Chief Technology Officer, The Bank of New York Mellon Corporation
Raymond Johnson, Principal Manager, Demand and Price Forecasting, Energy Supply and Management, Southern California Edison Company
Steven Labkoff, Head, Strategic Programs, Research and Development Information, AstraZeneca Pharmaceuticals LP
Peter Marney, Senior Vice President, Platform and Information Strategy, Thomson Reuters Corp.
Ganesh Natarajan, Vice Chairman and CEO, Zensar Technologies Ltd.
David Norris, former CEO, BlueCava Inc.
Jeff Rosenfeld, Vice President, Customer Insight and Analytics, The Neiman-Marcus Group Inc.
Jeanne Ross, Director, Center for Information Systems Research, MIT Sloan School of Management
Arijit Sengupta, CEO, BeyondCore Inc.
Neel Sundaresan, Senior Director and Head, Research Labs, eBay Inc.
Laura Teller, Chief Strategy Officer, Opera Solutions LLC
Simon Thompson, Director, Commercial Solutions Esri, Inc.
George Westerman, Research Scientist, MIT Sloan Center for Digital Business, MIT Sloan School of Management
ACKNOWLEDGMENTS
FOR MORE ON DATA AND ANALYTICS FROM MIT SLOAN MANAGEMENT REVIEW
Get the complimentary monthly newsletter on Data & Analytics
The intensifying “data deluge,” and the new analytical approaches that help organizations exploit that data, will
fundamentally change how managers make decisions and innovate. Data & Analytics explores the challenges of
the data-driven world, and defines the new organizational capabilities this environment will demand. Sign up.

PDFs ■ Reprints ■ Permission to Copy ■ Back IssuesArticles published in MIT Sloan Management Review arecopyrighted by the Massachusetts Institute of Technology unless otherwise specified at the end of an article.
MIT Sloan Management Review articles, permissions, and back issues can be purchased on our Web site: sloanreview.mit.edu or you may order through our Business Service Center (9 a.m.-5 p.m. ET) at the phone numbers listed below. Paper reprints are available in quantities of 250 or more.
To reproduce or transmit one or more MIT Sloan Management Review articles by electronic or mechanical means (including photocopying or archiving in any information storage or retrieval system) requires written permission. To request permission, use our Web site: sloanreview.mit.edu),or E-mail: [email protected] Call (US and International):617-253-7170Fax: 617-258-9739
Posting of full-text SMR articles on publicly accessibleInternet sites is prohibited. To obtain permission to postarticles on secure and/or password-protected intranet sites, e-mail your request to [email protected].
Customer ServiceMIT Sloan Management Review238 Main Street E48-570Cambridge, MA 02142
Related Documents