Finding the mean from a frequency table Finding the mean from a frequency table e following table shows the mean height of 30 students in our e mean height Height (x cm) 130 - 140 140 – 150 150 – 160 160 – 170 170 – 180 Frequency 5 7 8 6 4 We first need to make sure the calculator is CLeaR of a previous content

Finding the mean from a frequency table E.g. the following table shows the mean height of 30 students in our class. Find the mean height Height (x cm)
Dec 22, 2015
Welcome message from author
This document is posted to help you gain knowledge. Please leave a comment to let me know what you think about it! Share it to your friends and learn new things together.
Transcript
Finding the mean from a frequency table
Finding the mean from a frequency tableE.g. the following table shows the mean height of 30 students in our class.
Find the mean height
Height (x cm) 130 - 140 140 – 150 150 – 160 160 – 170 170 – 180
Frequency 5 7 8 6 4
We first need to make sure
the calculator is CLeaR of all previous content

Finding the mean from a frequency table
We first need to make sure
the calculator is CLeaR of all previous content
Height (x cm) 130 - 140 140 – 150 150 – 160 160 – 170 170 – 180
Frequency 5 7 8 6 4
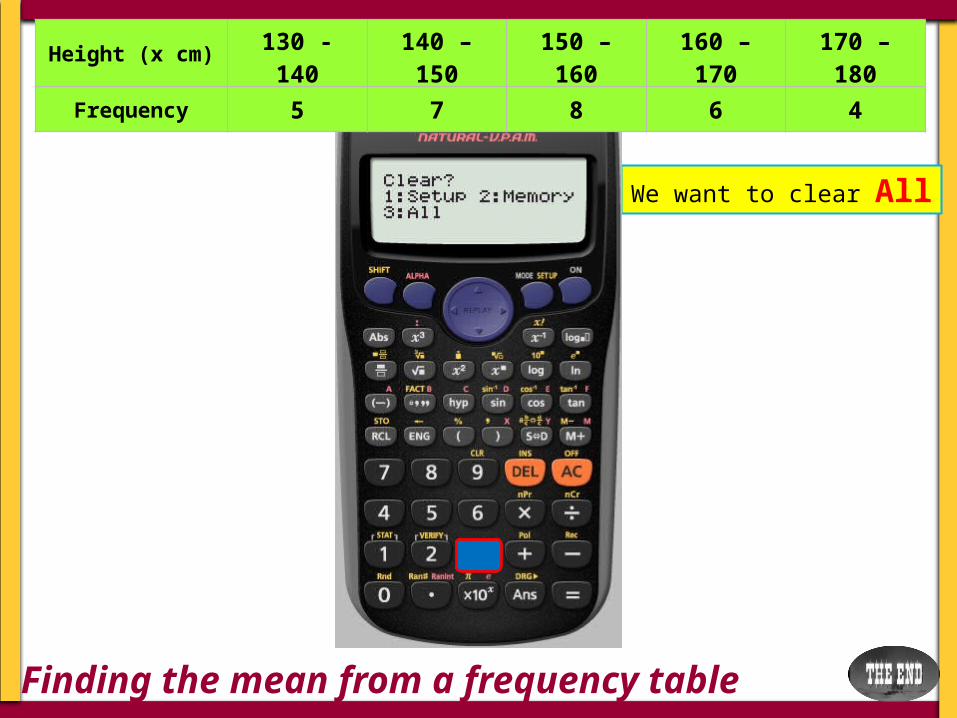
Finding the mean from a frequency table
We want to clear All
Height (x cm) 130 - 140 140 – 150 150 – 160 160 – 170 170 – 180
Frequency 5 7 8 6 4
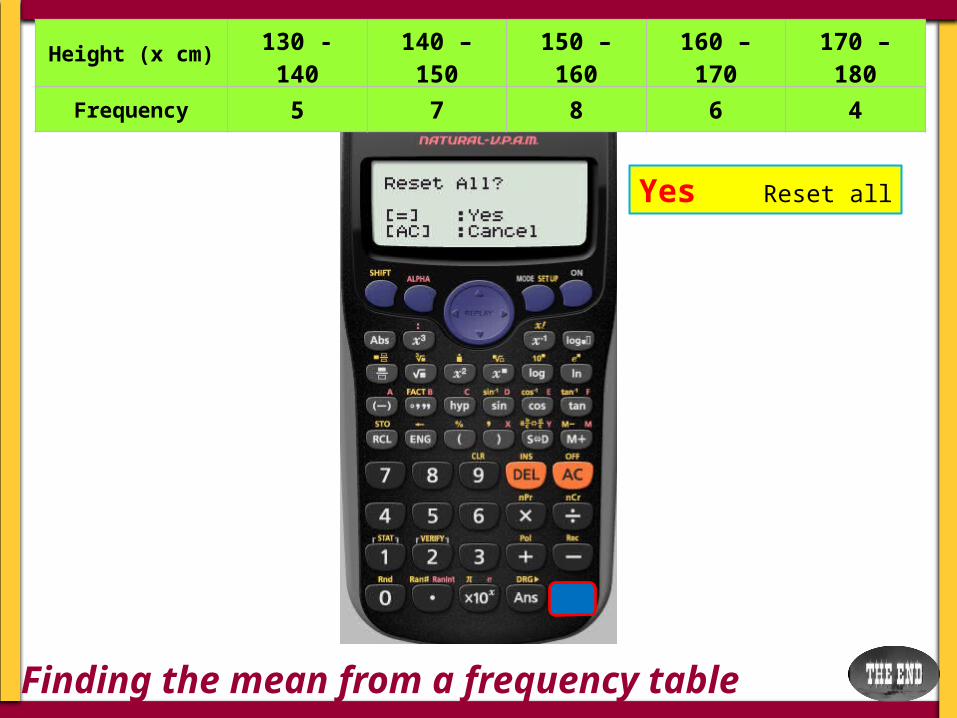
Finding the mean from a frequency table
Yes Reset all
Height (x cm) 130 - 140 140 – 150 150 – 160 160 – 170 170 – 180
Frequency 5 7 8 6 4

Finding the mean from a frequency table
We really do agree
AC
Height (x cm) 130 - 140 140 – 150 150 – 160 160 – 170 170 – 180
Frequency 5 7 8 6 4
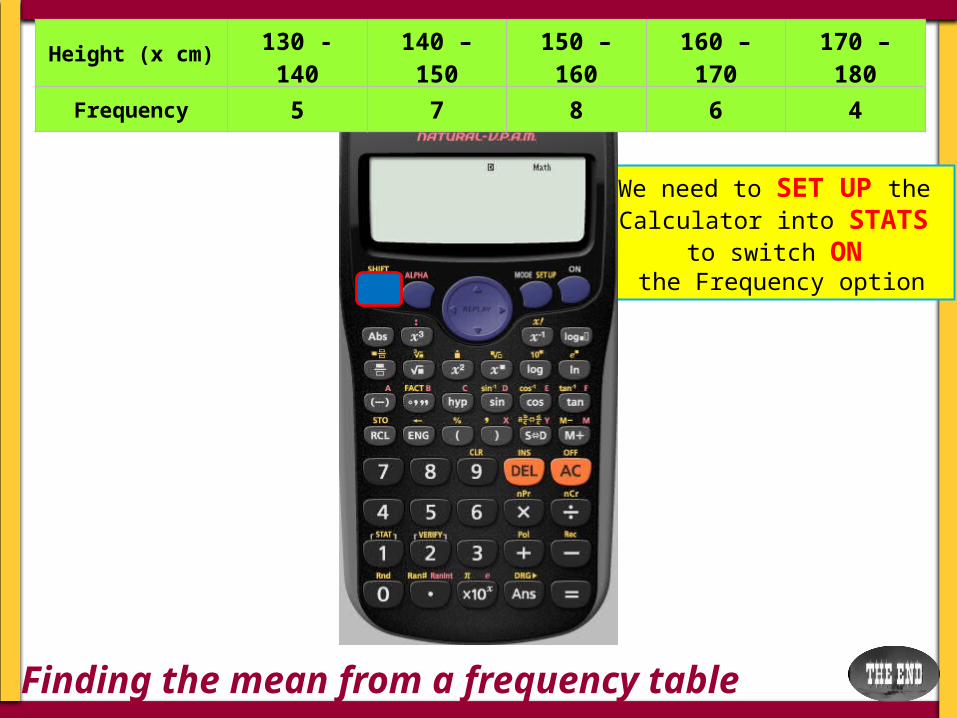
Finding the mean from a frequency table
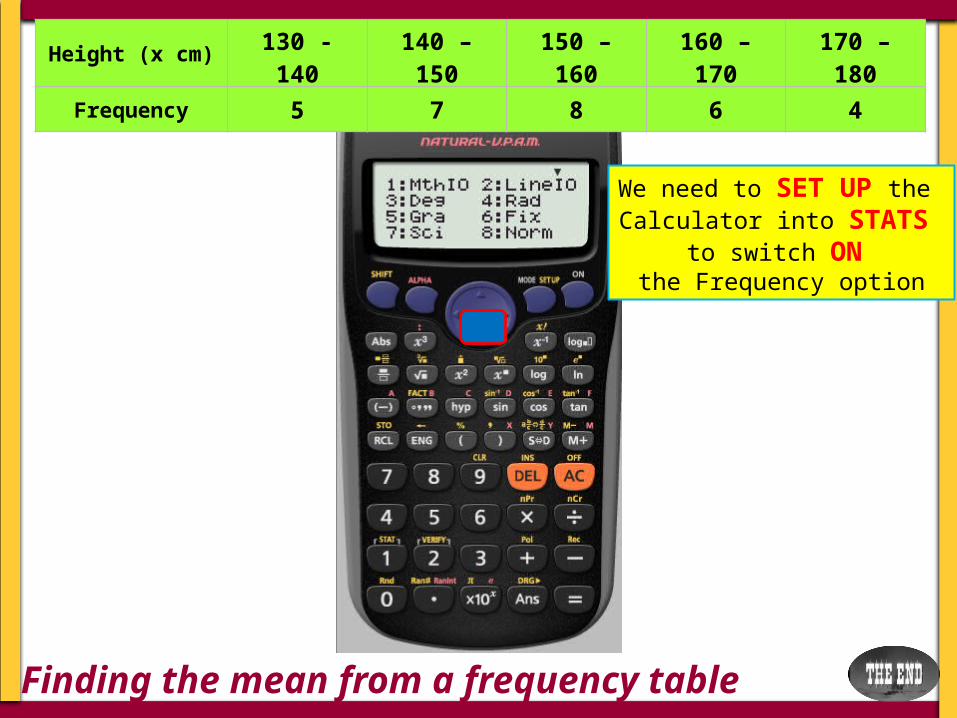
We need to SET UP the Calculator into STATS
to switch ON the Frequency option
Height (x cm) 130 - 140 140 – 150 150 – 160 160 – 170 170 – 180
Frequency 5 7 8 6 4
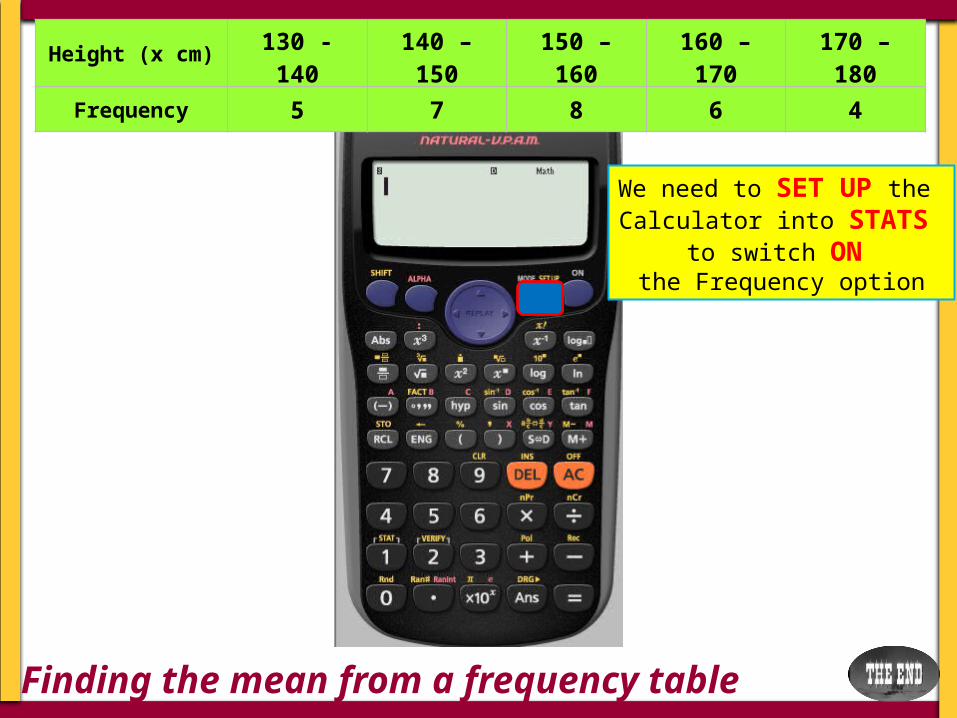
Finding the mean from a frequency table
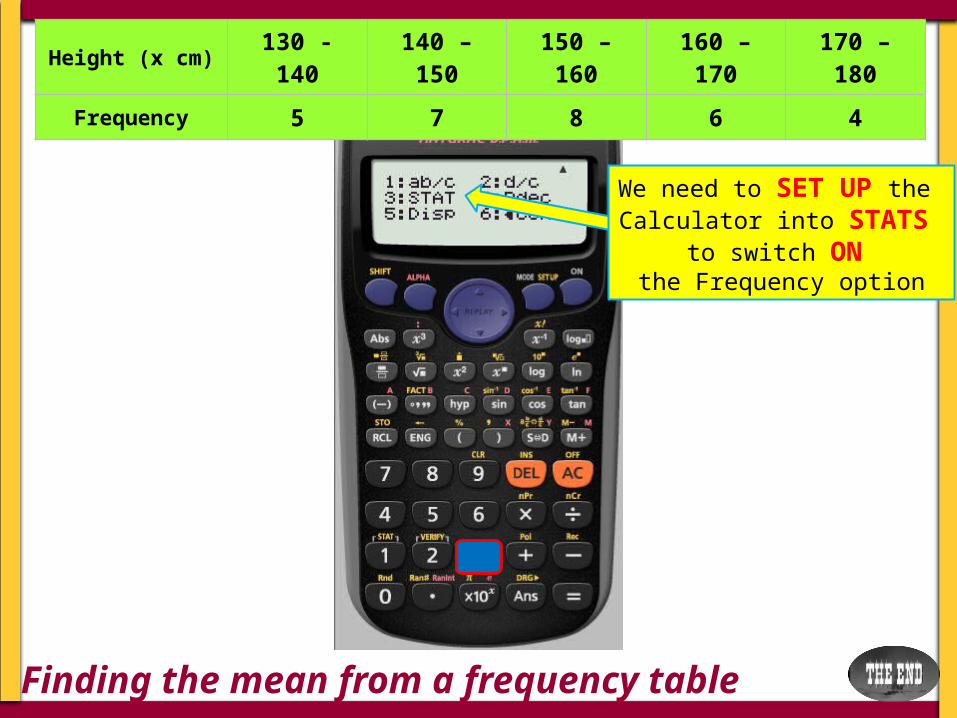
We need to SET UP the Calculator into STATS
to switch ON the Frequency option
Height (x cm) 130 - 140 140 – 150 150 – 160 160 – 170 170 – 180
Frequency 5 7 8 6 4
Finding the mean from a frequency table
We need to SET UP the Calculator into STATS
to switch ON the Frequency option
Height (x cm) 130 - 140 140 – 150 150 – 160 160 – 170 170 – 180
Frequency 5 7 8 6 4
Finding the mean from a frequency table
Height (x cm) 130 - 140 140 – 150 150 – 160 160 – 170 170 – 180
Frequency 5 7 8 6 4
We need to SET UP the Calculator into STATS
to switch ON the Frequency option

Finding the mean from a frequency table
Height (x cm) 130 - 140 140 – 150 150 – 160 160 – 170 170 – 180
Frequency 5 7 8 6 4
We need to SET UP the Calculator into STATS
to switch ON the Frequency option

Finding the mean from a frequency table
We want the calculator
in STATS mode
Height (x cm) 130 - 140 140 – 150 150 – 160 160 – 170 170 – 180
Frequency 5 7 8 6 4

Finding the mean from a frequency table
We want the calculator
in STATS mode
Height (x cm) 130 - 140 140 – 150 150 – 160 160 – 170 170 – 180
Frequency 5 7 8 6 4

Finding the mean from a frequency table
We only have 1 variable
Height (x cm) 130 - 140 140 – 150 150 – 160 160 – 170 170 – 180
Frequency 5 7 8 6 4

Finding the mean from a frequency table
Height (x cm) 130 - 140 140 – 150 150 – 160 160 – 170 170 – 180
Frequency 5 7 8 6 4
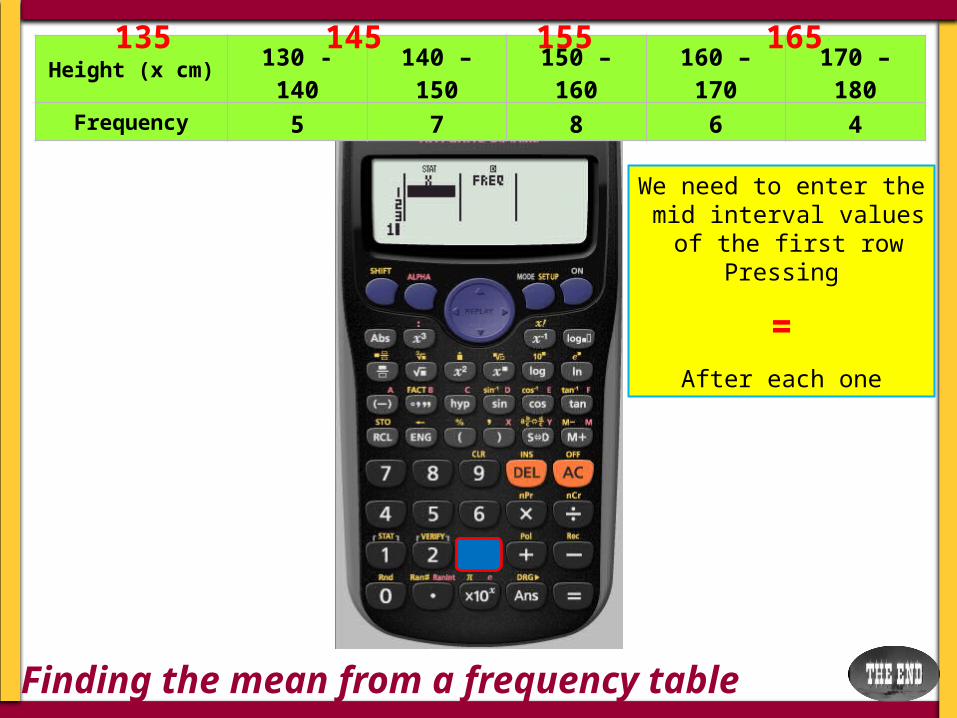
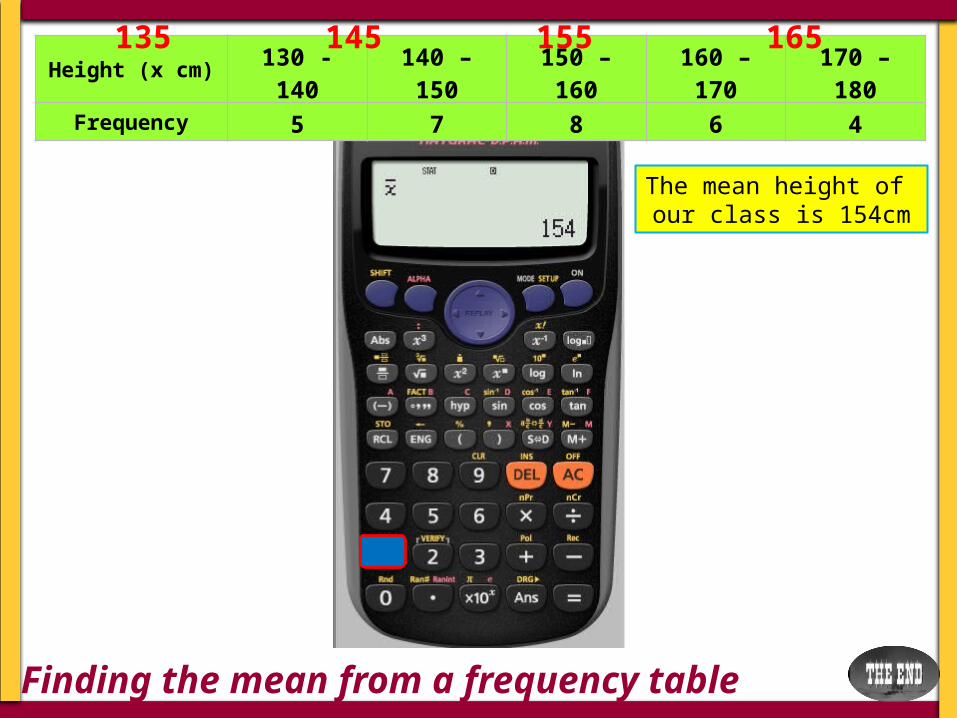
135 145 155 165 175
We need to put in the mid interval values
of the first rowPressing
=After each one
Finding the mean from a frequency table
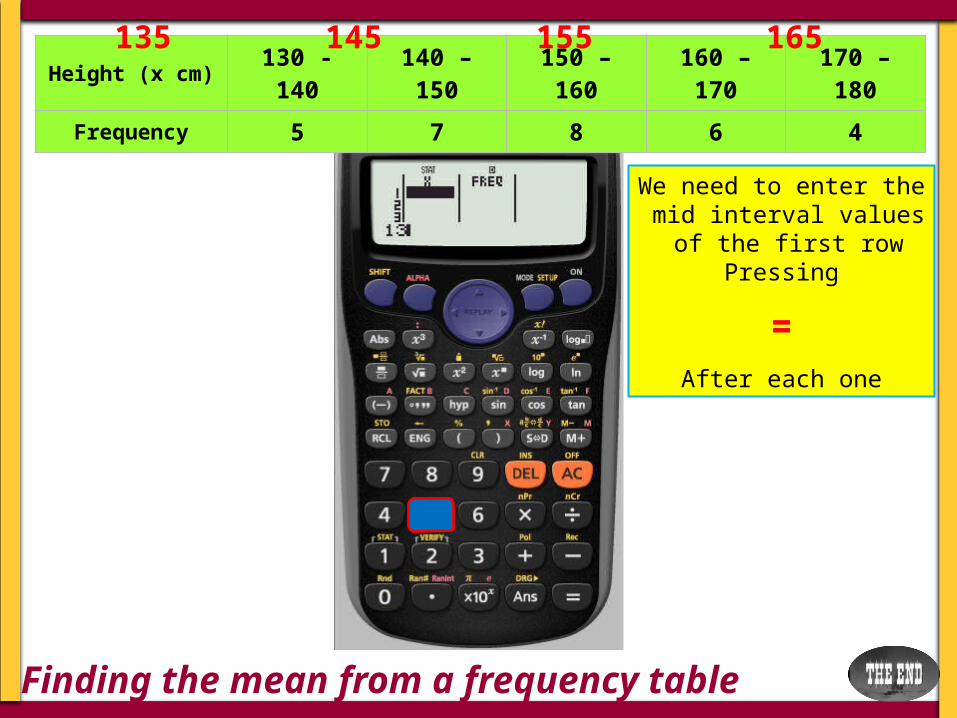
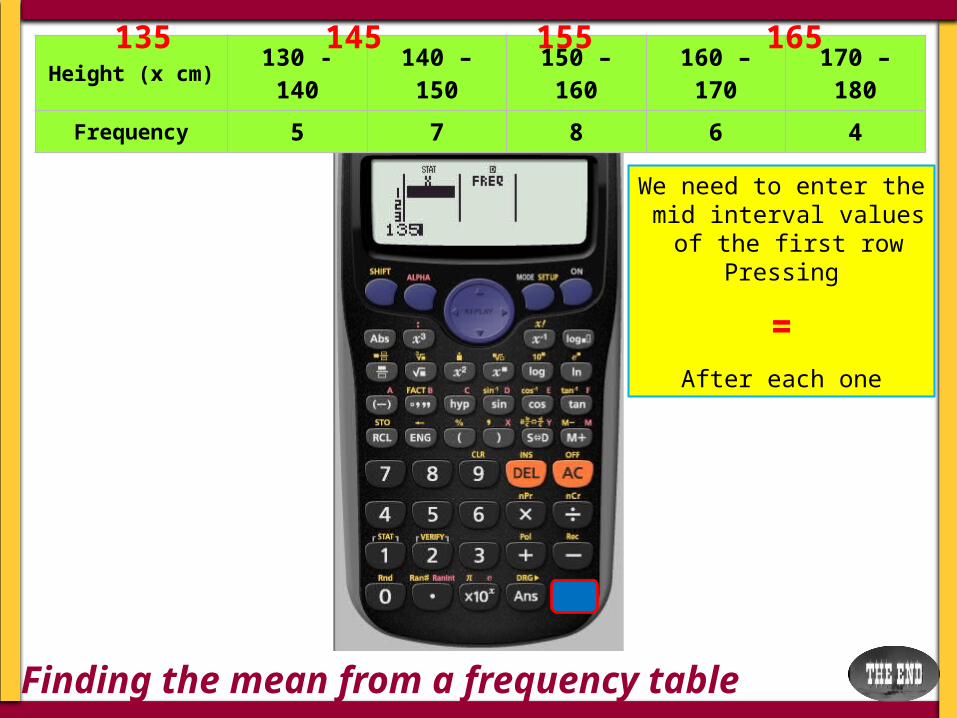
We need to enter the mid interval values
of the first rowPressing
=After each one
Height (x cm) 130 - 140 140 – 150 150 – 160 160 – 170 170 – 180
Frequency 5 7 8 6 4
135 145 155 165 175
Finding the mean from a frequency table
Height (x cm) 130 - 140 140 – 150 150 – 160 160 – 170 170 – 180
Frequency 5 7 8 6 4
We need to enter the mid interval values
of the first rowPressing
=After each one
135 145 155 165 175
Finding the mean from a frequency table
Height (x cm) 130 - 140 140 – 150 150 – 160 160 – 170 170 – 180
Frequency 5 7 8 6 4
We need to enter the mid interval values
of the first rowPressing
=After each one
135 145 155 165 175

Finding the mean from a frequency table
Height (x cm) 130 - 140 140 – 150 150 – 160 160 – 170 170 – 180
Frequency 5 7 8 6 4
We need enter the mid interval values
of the first rowPressing
=After each one
135 145 155 165 175
Finding the mean from a frequency table
Height (x cm) 130 - 140 140 – 150 150 – 160 160 – 170 170 – 180
Frequency 5 7 8 6 4
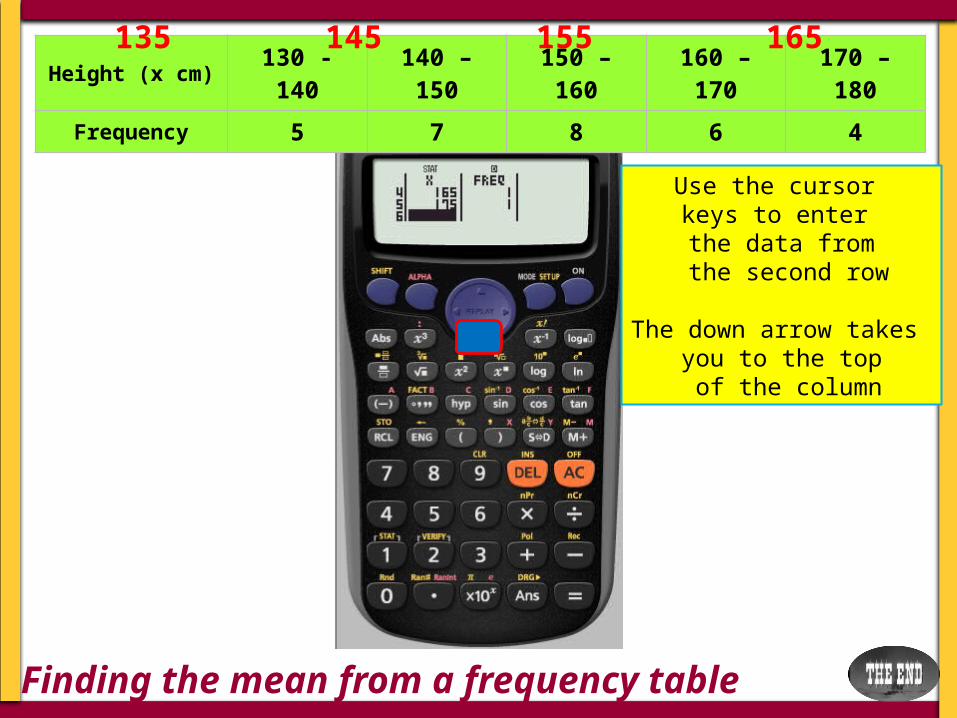
Use the cursor keys to enter the data from
the second row
The down arrow takes you to the top of the column
135 145 155 165 175
Finding the mean from a frequency table
Height (x cm) 130 - 140 140 – 150 150 – 160 160 – 170 170 – 180
Frequency 5 7 8 6 4
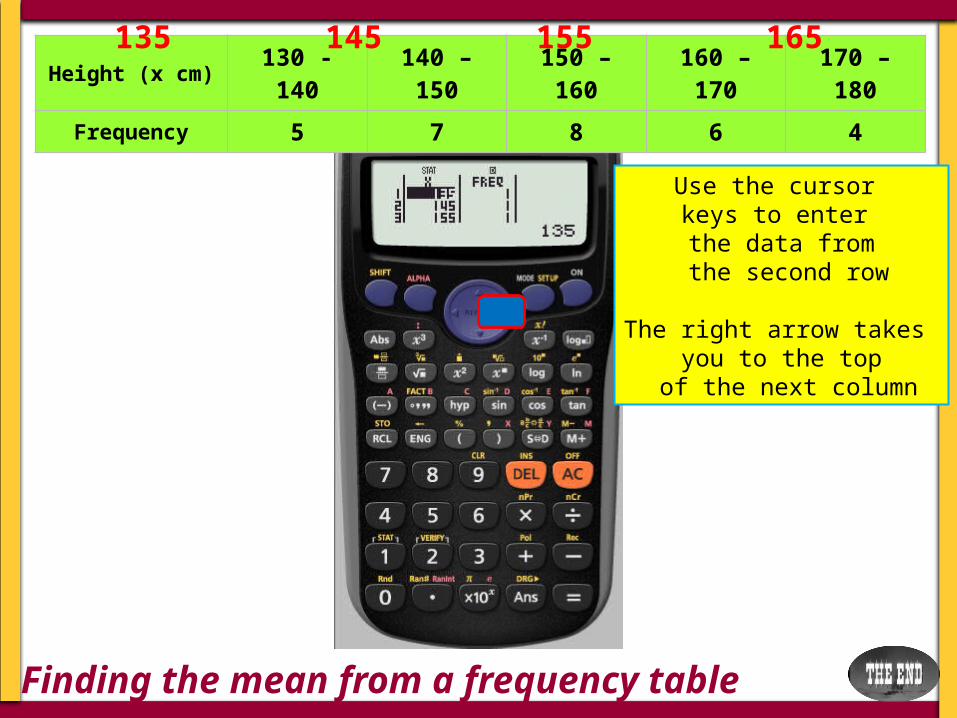
Use the cursor keys to enter the data from
the second row
The right arrow takes you to the top
of the next column
135 145 155 165 175
Finding the mean from a frequency table
Height (x cm) 130 - 140 140 – 150 150 – 160 160 – 170 170 – 180
Frequency 5 7 8 6 4
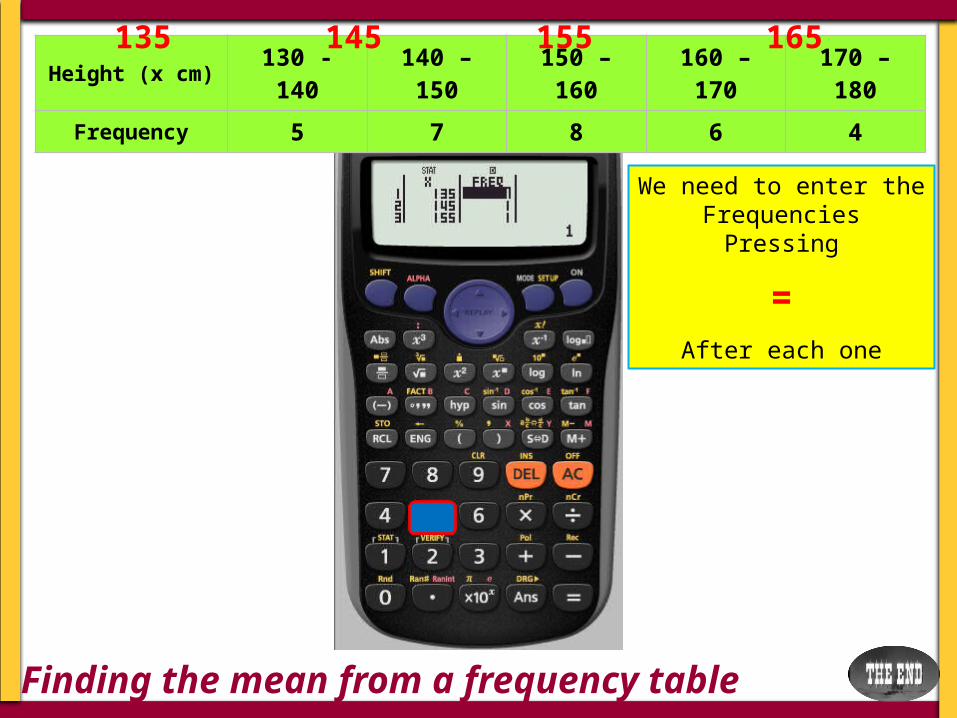
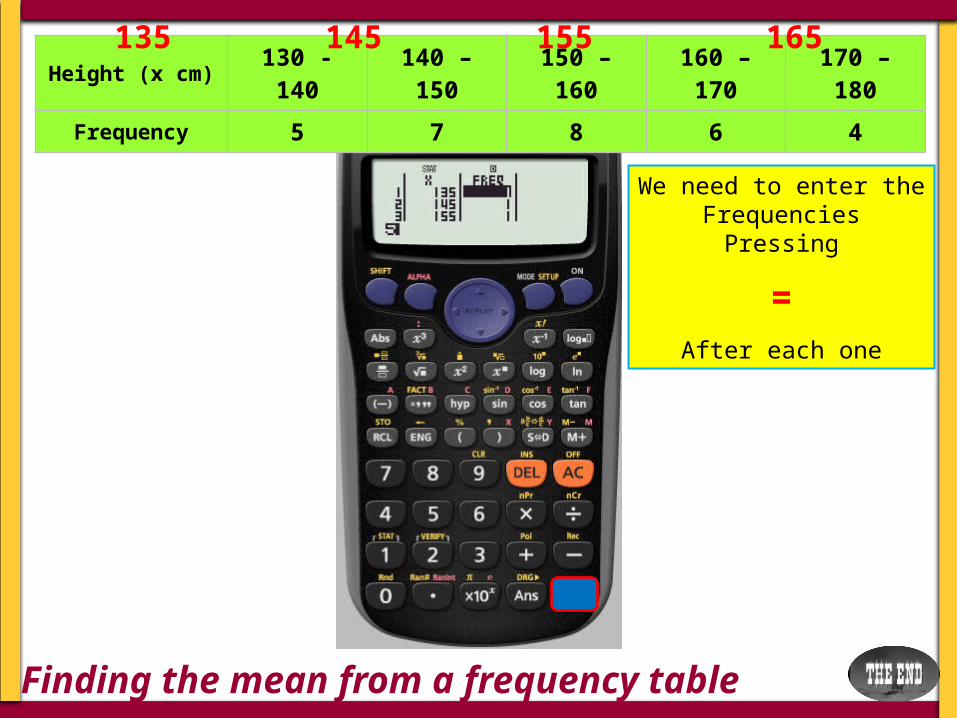
We need to enter theFrequencies
Pressing
=After each one
135 145 155 165 175
Finding the mean from a frequency table
Height (x cm) 130 - 140 140 – 150 150 – 160 160 – 170 170 – 180
Frequency 5 7 8 6 4
We need to enter theFrequencies
Pressing
=After each one
135 145 155 165 175

Finding the mean from a frequency table
Height (x cm) 130 - 140 140 – 150 150 – 160 160 – 170 170 – 180
Frequency 5 7 8 6 4
We need to enter theFrequencies
Pressing
=After each one
135 145 155 165 175
Finding the mean from a frequency table
Height (x cm) 130 - 140 140 – 150 150 – 160 160 – 170 170 – 180
Frequency 5 7 8 6 4
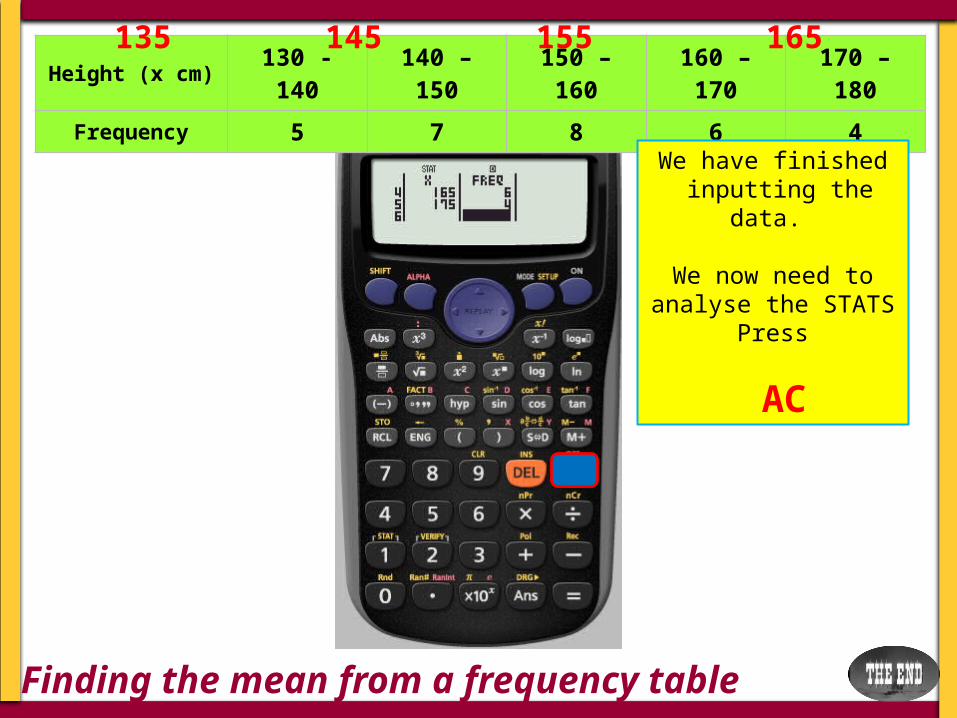
We have finished inputting the data.
We now need toanalyse the STATS
Press
AC
135 145 155 165 175

Finding the mean from a frequency table
Finding the mean from a frequency table
We need to analyse
the STATS we have input
Height (x cm) 130 - 140 140 – 150 150 – 160 160 – 170 170 – 180
Frequency 5 7 8 6 4
135 145 155 165 175

Finding the mean from a frequency table
We need to analyse
the STATS we have input
Height (x cm) 130 - 140 140 – 150 150 – 160 160 – 170 170 – 180
Frequency 5 7 8 6 4
135 145 155 165 175
Finding the mean from a frequency table
Height (x cm) 130 - 140 140 – 150 150 – 160 160 – 170 170 – 180
Frequency 5 7 8 6 4
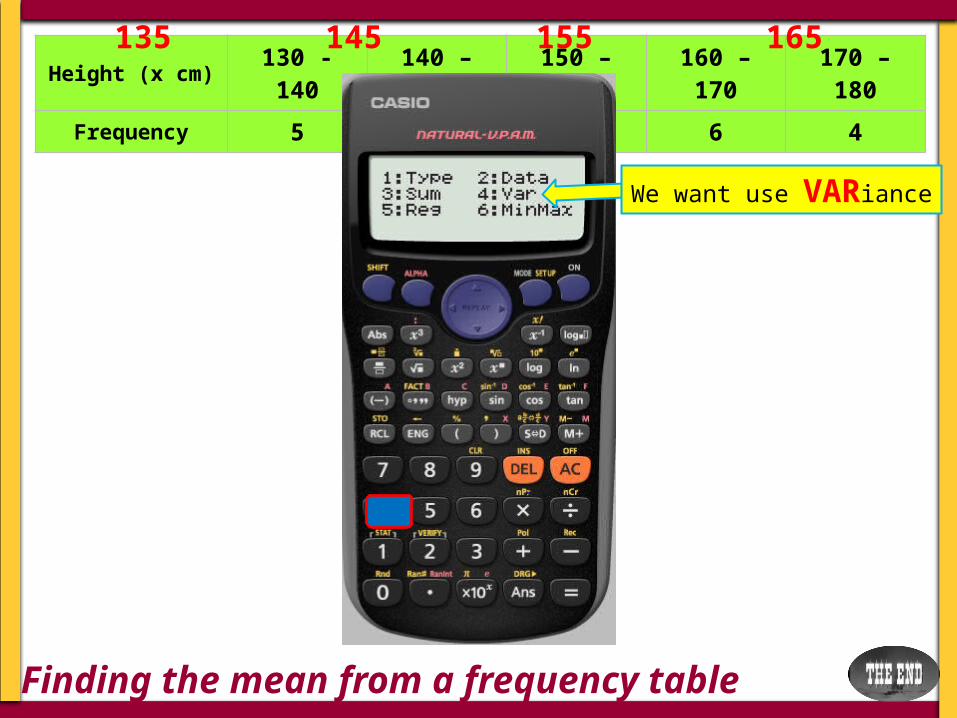
We want use VARiance
135 145 155 165 175

Finding the mean from a frequency table
Height (x cm) 130 - 140 140 – 150 150 – 160 160 – 170 170 – 180
Frequency 5 7 8 6 4
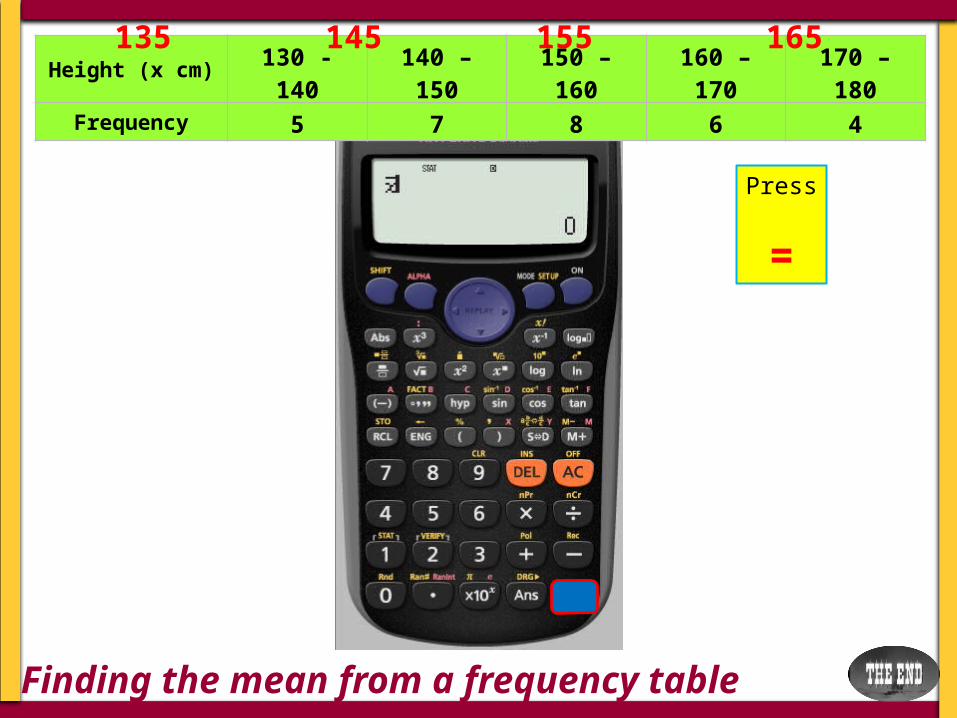
We want to find the mean
x𝑥
135 145 155 165 175
Finding the mean from a frequency table
Press
=
Height (x cm) 130 - 140 140 – 150 150 – 160 160 – 170 170 – 180
Frequency 5 7 8 6 4
135 145 155 165 175
Finding the mean from a frequency table
The mean height of our class is 154cm
Height (x cm) 130 - 140 140 – 150 150 – 160 160 – 170 170 – 180
Frequency 5 7 8 6 4
135 145 155 165 175
Related Documents