Finding Selection in All the Right Places Noor and Noor (2013) 1 Finding Selection in All the Right Places LAB 9 Notes: - Start the computer in Windows. Hold down the Option key during start up to get to the MacOS/Windows choice. - Terms in green are included in the Glossary. Objectives: 1. Use published genome data to look for evidence of selection in individual genes. 2. Understand the need for DNA sequence alignment before sequence analysis. 3. Understand the use of the McDonald-Kreitman test. 4. Form hypotheses for the inferred presence or absence of selection on individual genes. Your Mission: Your goal for this lab is to analyze 5 genes in the Drosophila pseudoobscura genome for evidence of natural selection. Each pair of students will have a different set of genes. You must bring a flash drive to lab so your TA can transfer your gene sequences to it. These analyses have not been performed before, so you will be publishing your results in a professional and publically accessible database. You will begin this process in lab this week and complete it on your own as two lab assignments due at the beginning of your next lab period. You will perform this analysis in three steps for each gene (although you’ll only complete step 3 for two genes): Step 1: Analyze the alignment of the DNA sequences. Step 2: Perform two versions of the McDonald-Kreitman test on the sequences and interpret the results. Step 3: Research two of the genes to form hypotheses to explain the results of the tests. You will complete the first two steps in lab this week (and submit your results as the first of two lab assignments) and then finish the third step on your own as a second lab assignment. Product: For each of your five genes you will need to… 1- Add the data to the class database, including attaching your FASTA file. See the Instructions for Data Entry on page 20. 2- Complete the relevant portion of lab assignment 6 on Sakai. AND For two of your five genes you need to complete Step 3 and submit it via Sakai in lab assignment 7.

Welcome message from author
This document is posted to help you gain knowledge. Please leave a comment to let me know what you think about it! Share it to your friends and learn new things together.
Transcript
Finding Selection in All the Right Places Noor and Noor (2013)
1
Finding Selection in All the Right Places
LAB 9
Notes: - Start the computer in Windows. Hold down the Option key during start up to get to the
MacOS/Windows choice. - Terms in green are included in the Glossary. Objectives: 1. Use published genome data to look for evidence of selection in individual genes. 2. Understand the need for DNA sequence alignment before sequence analysis. 3. Understand the use of the McDonald-Kreitman test. 4. Form hypotheses for the inferred presence or absence of selection on individual genes. Your Mission: Your goal for this lab is to analyze 5 genes in the Drosophila pseudoobscura genome for evidence of natural selection. Each pair of students will have a different set of genes. You must bring a flash drive to lab so your TA can transfer your gene sequences to it. These analyses have not been performed before, so you will be publishing your results in a professional and publically accessible database. You will begin this process in lab this week and complete it on your own as two lab assignments due at the beginning of your next lab period. You will perform this analysis in three steps for each gene (although you’ll only complete step 3 for two genes): Step 1: Analyze the alignment of the DNA sequences. Step 2: Perform two versions of the McDonald-Kreitman test on the sequences and interpret
the results. Step 3: Research two of the genes to form hypotheses to explain the results of the tests. You will complete the first two steps in lab this week (and submit your results as the first of two lab assignments) and then finish the third step on your own as a second lab assignment. Product: For each of your five genes you will need to… 1- Add the data to the class database, including attaching your FASTA file. See the
Instructions for Data Entry on page 20. 2- Complete the relevant portion of lab assignment 6 on Sakai.
AND
For two of your five genes you need to complete Step 3 and submit it via Sakai in lab assignment 7.
Finding Selection in All the Right Places Noor and Noor (2013)
2
Background: Before lab, you should read pp 256-263 “The Neutral Theory as a Null Hypothesis: Detecting Natural Selection on DNA Sequences” in your Freeman & Herron Evolutionary Analysis textbook. Pay particular attention to the section entitled “Comparing Silent and Replacement Changes within and between Species” on pp 258-259.
John McDonald and Martin Kreitman proposed a test of the neutral hypothesis (Kimura 1983) in 1991. Their test is based on a comparison of synonymous and nonsynonymous SNPs within and between species. Under neutrality, the ratio of synonymous fixed substitutions (differences) between species should be the same as the ratio of synonymous polymorphisms within species. Therefore, if these two ratios are significantly different, it is evidence that natural selection or some other process besides the combination of mutation and genetic drift is acting on the gene or the chromosomal region around the gene.
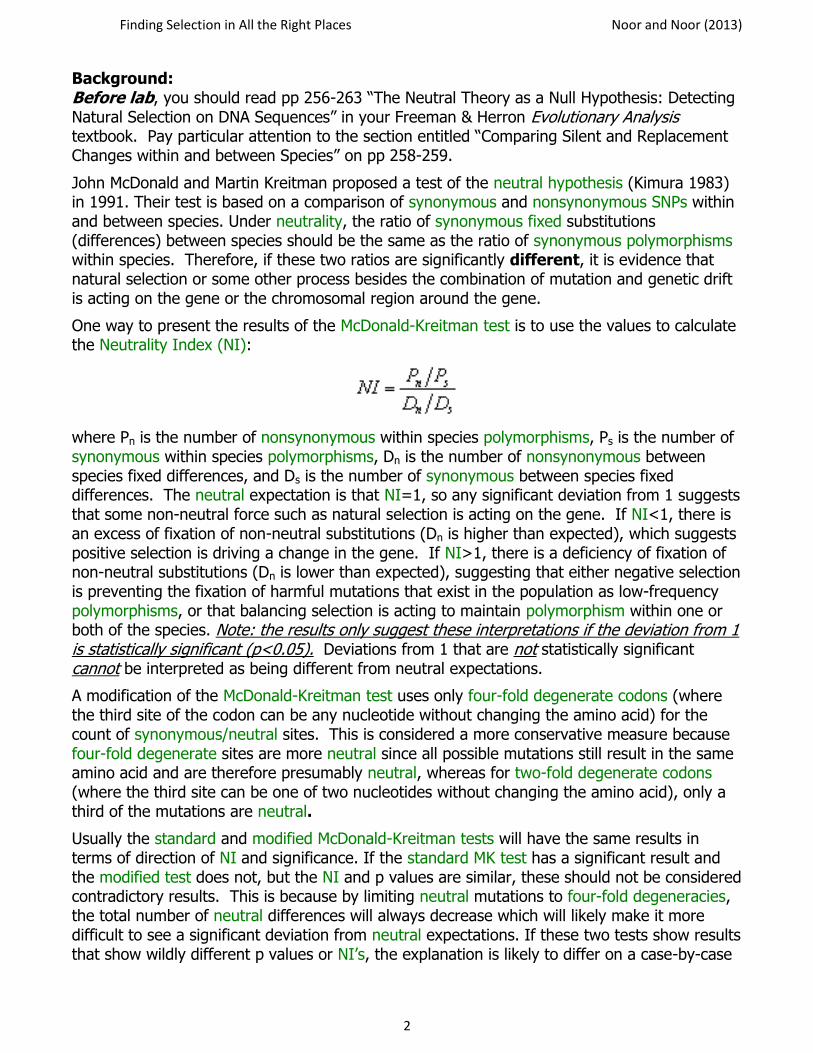
One way to present the results of the McDonald-Kreitman test is to use the values to calculate the Neutrality Index (NI):
where Pn is the number of nonsynonymous within species polymorphisms, Ps is the number of synonymous within species polymorphisms, Dn is the number of nonsynonymous between species fixed differences, and Ds is the number of synonymous between species fixed differences. The neutral expectation is that NI=1, so any significant deviation from 1 suggests that some non-neutral force such as natural selection is acting on the gene. If NI<1, there is an excess of fixation of non-neutral substitutions (Dn is higher than expected), which suggests positive selection is driving a change in the gene. If NI>1, there is a deficiency of fixation of non-neutral substitutions (Dn is lower than expected), suggesting that either negative selection is preventing the fixation of harmful mutations that exist in the population as low-frequency polymorphisms, or that balancing selection is acting to maintain polymorphism within one or both of the species. Note: the results only suggest these interpretations if the deviation from 1 is statistically significant (p<0.05). Deviations from 1 that are not statistically significant cannot be interpreted as being different from neutral expectations.
A modification of the McDonald-Kreitman test uses only four-fold degenerate codons (where the third site of the codon can be any nucleotide without changing the amino acid) for the count of synonymous/neutral sites. This is considered a more conservative measure because four-fold degenerate sites are more neutral since all possible mutations still result in the same amino acid and are therefore presumably neutral, whereas for two-fold degenerate codons (where the third site can be one of two nucleotides without changing the amino acid), only a third of the mutations are neutral.
Usually the standard and modified McDonald-Kreitman tests will have the same results in terms of direction of NI and significance. If the standard MK test has a significant result and the modified test does not, but the NI and p values are similar, these should not be considered contradictory results. This is because by limiting neutral mutations to four-fold degeneracies, the total number of neutral differences will always decrease which will likely make it more difficult to see a significant deviation from neutral expectations. If these two tests show results that show wildly different p values or NI’s, the explanation is likely to differ on a case-by-case
Finding Selection in All the Right Places Noor and Noor (2013)
3
basis. If by some chance you encounter such a result, you will only be asked to speculate as to a cause.
Pre-step: Where did these sequences come from? When researchers want to find the sequence of a particular region of DNA, whether that region is a single gene, an entire chromosome, or an entire genome, the length of the DNA strand that can be sequenced at a time (the “read” length) is limited by the method and technology used. Until a few years ago, the maximum individual read length was about 1 kilobase. That maximum is now in the tens of kilobases, but the process is still pretty cumbersome so that all of the sequences obtained for an entire genome (the D. pseudoobscura genome is 185,000 kb and the human genome is 3,300,000 kb) using these methods takes a lot of analysis to put together (as it did for the human genome). A different technology became available in the last ten years that is much faster, but produces even shorter reads – only about 100-500 bp.
With any of these methods, the problem is putting these smaller pieces together since what you really want is a much longer sequence (like a whole chromosome or entire genome). Remember that you don’t know where a particular read should go relative to the others ahead of time. They don’t come numbered 1-1000 so that all that is necessary is pasting the sequences together in order. So, how do researchers put these reads together?
The key is that some of the reads end up overlapping. Computer programs look for these overlapping stretches of sequence in a process called sequence assembly to generate the consensus sequence – the best hypothesis for the sequence for the entire long DNA region.
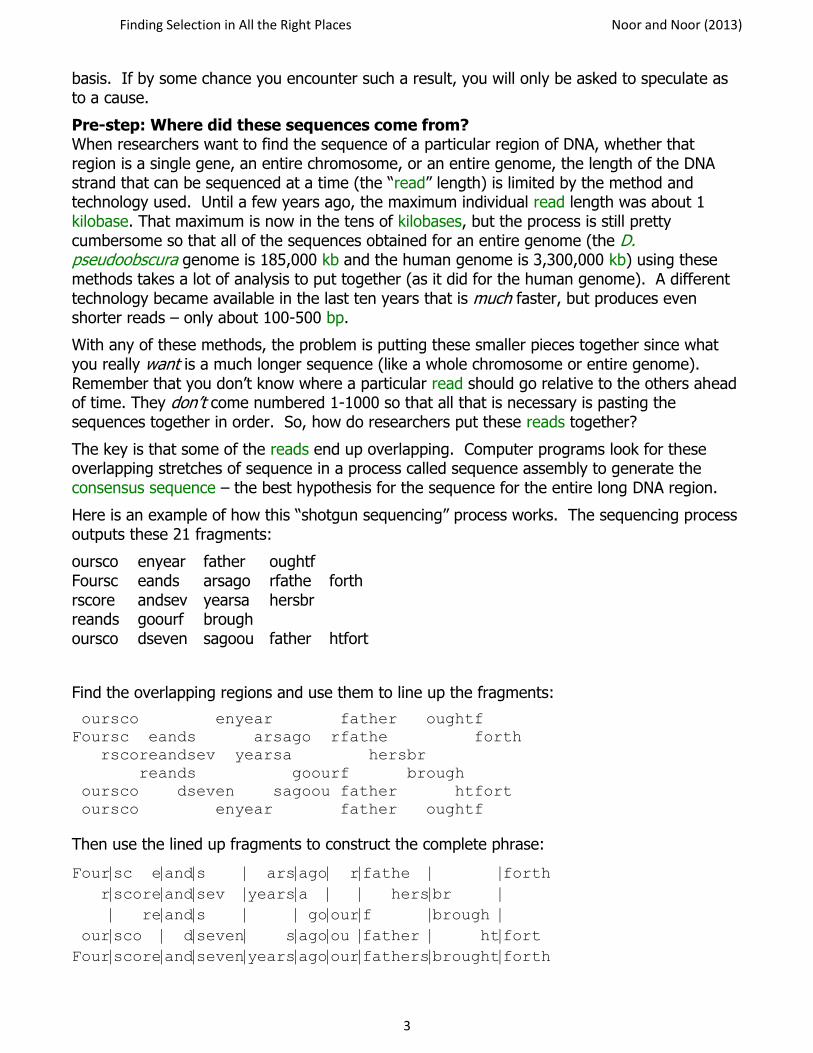
Here is an example of how this “shotgun sequencing” process works. The sequencing process outputs these 21 fragments:
oursco enyear father oughtf Foursc eands arsago rfathe forth rscore andsev yearsa hersbr reands goourf brough oursco dseven sagoou father htfort
Find the overlapping regions and use them to line up the fragments:
oursco enyear father oughtf Foursc eands arsago rfathe forth rscoreandsev yearsa hersbr reands goourf brough oursco dseven sagoou father htfort oursco enyear father oughtf
Then use the lined up fragments to construct the complete phrase:
Foursc eands arsago rfathe forth
rscoreandsev yearsa hersbr
reands goourf brough
oursco dseven sagoou father htfort
Fourscoreandsevenyearsagoourfathersbroughtforth
Finding Selection in All the Right Places Noor and Noor (2013)
4
Now try it for these sequence reads:
CTATCTCCCACGAGGATACT CTAAAGGACAAAAATATTCT ATGGCTCTAGCTATCTCCCA CAGATTTTGCTAAAGGACAA CGAGGATACTCAGATTTTGC
** What is the consensus sequence you built from these reads?
The D. pseudoobscura and D. miranda consensus sequences that we obtained from Mohamed Noor’s lab here at Duke were assembled in this manner.
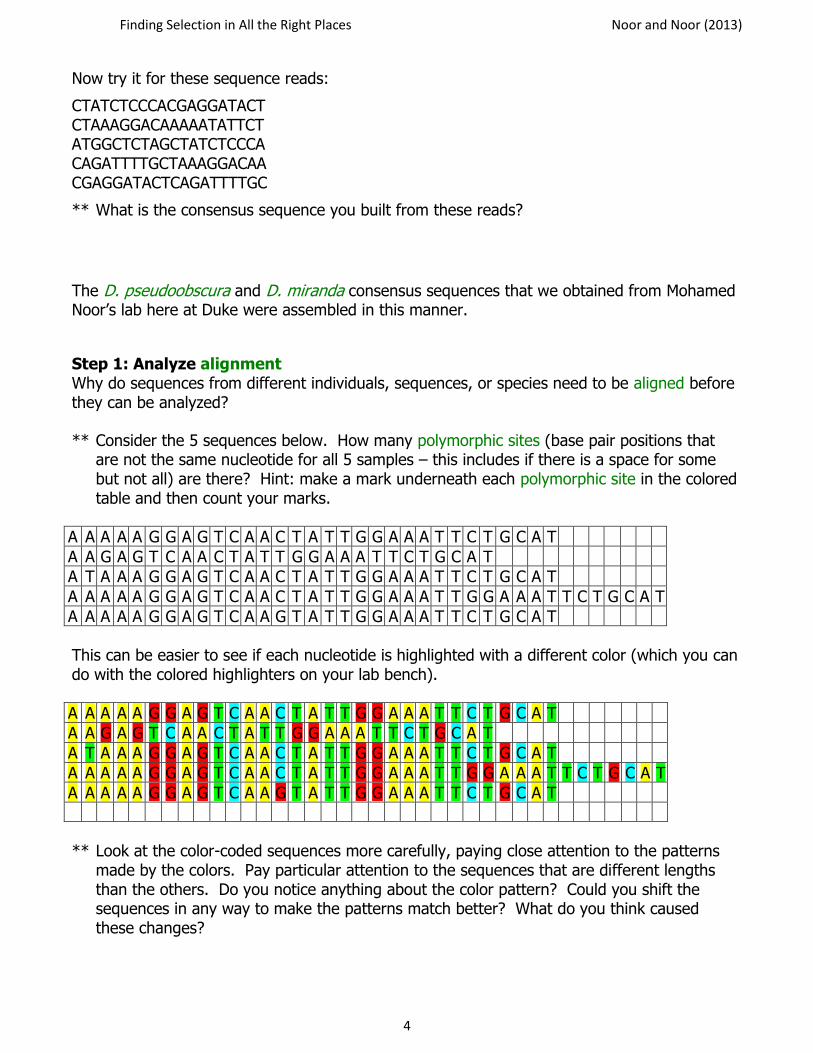
Step 1: Analyze alignment Why do sequences from different individuals, sequences, or species need to be aligned before they can be analyzed? ** Consider the 5 sequences below. How many polymorphic sites (base pair positions that
are not the same nucleotide for all 5 samples – this includes if there is a space for some but not all) are there? Hint: make a mark underneath each polymorphic site in the colored table and then count your marks.
A A A A A G G A G T C A A C T A T T G G A A A T T C T G C A T
A A G A G T C A A C T A T T G G A A A T T C T G C A T
A T A A A G G A G T C A A C T A T T G G A A A T T C T G C A T
A A A A A G G A G T C A A C T A T T G G A A A T T G G A A A T T C T G C A T A A A A A G G A G T C A A G T A T T G G A A A T T C T G C A T This can be easier to see if each nucleotide is highlighted with a different color (which you can do with the colored highlighters on your lab bench). A A A A A G G A G T C A A C T A T T G G A A A T T C T G C A T
A A G A G T C A A C T A T T G G A A A T T C T G C A T
A T A A A G G A G T C A A C T A T T G G A A A T T C T G C A T
A A A A A G G A G T C A A C T A T T G G A A A T T G G A A A T T C T G C A T A A A A A G G A G T C A A G T A T T G G A A A T T C T G C A T ** Look at the color-coded sequences more carefully, paying close attention to the patterns
made by the colors. Pay particular attention to the sequences that are different lengths than the others. Do you notice anything about the color pattern? Could you shift the sequences in any way to make the patterns match better? What do you think caused these changes?
Finding Selection in All the Right Places Noor and Noor (2013)
5
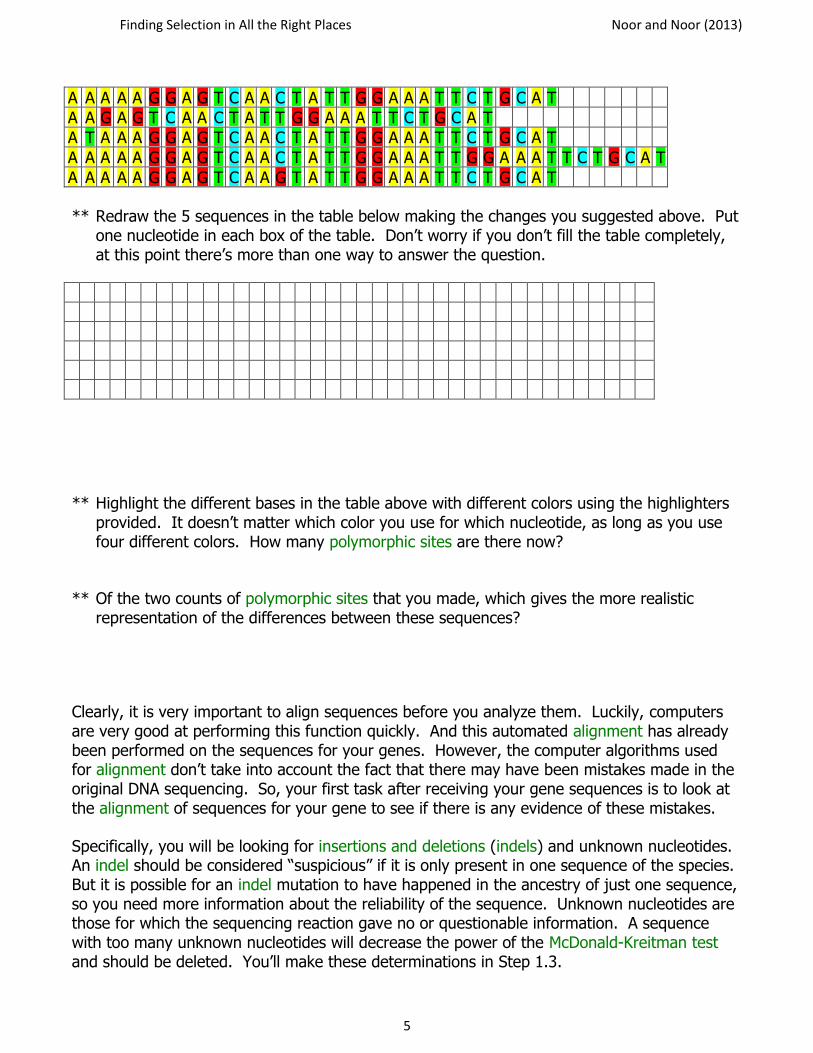
A A A A A G G A G T C A A C T A T T G G A A A T T C T G C A T
A A G A G T C A A C T A T T G G A A A T T C T G C A T
A T A A A G G A G T C A A C T A T T G G A A A T T C T G C A T
A A A A A G G A G T C A A C T A T T G G A A A T T G G A A A T T C T G C A T A A A A A G G A G T C A A G T A T T G G A A A T T C T G C A T ** Redraw the 5 sequences in the table below making the changes you suggested above. Put
one nucleotide in each box of the table. Don’t worry if you don’t fill the table completely, at this point there’s more than one way to answer the question.
** Highlight the different bases in the table above with different colors using the highlighters
provided. It doesn’t matter which color you use for which nucleotide, as long as you use four different colors. How many polymorphic sites are there now?
** Of the two counts of polymorphic sites that you made, which gives the more realistic
representation of the differences between these sequences? Clearly, it is very important to align sequences before you analyze them. Luckily, computers are very good at performing this function quickly. And this automated alignment has already been performed on the sequences for your genes. However, the computer algorithms used for alignment don’t take into account the fact that there may have been mistakes made in the original DNA sequencing. So, your first task after receiving your gene sequences is to look at the alignment of sequences for your gene to see if there is any evidence of these mistakes. Specifically, you will be looking for insertions and deletions (indels) and unknown nucleotides. An indel should be considered “suspicious” if it is only present in one sequence of the species. But it is possible for an indel mutation to have happened in the ancestry of just one sequence, so you need more information about the reliability of the sequence. Unknown nucleotides are those for which the sequencing reaction gave no or questionable information. A sequence with too many unknown nucleotides will decrease the power of the McDonald-Kreitman test and should be deleted. You’ll make these determinations in Step 1.3.
Finding Selection in All the Right Places Noor and Noor (2013)
6
Your TA will transfer your gene sequences onto your flash drive. You will receive one .fas file for each gene that contains sequences from approximately 11 sequences of D. pseudoobscura and three sequences of D. miranda. The name of each file is the name of the gene whose sequences are in that file. 1- The first thing you will need to do is look up some information about your gene. Here are
the steps to do that.
● Go to flybase.org
Click on the “Data Type” tab of the Quick Search box.
Make sure to check the box next to “include non-Dmel drosophilid species” and choose "genes" from the "Data Class" drop-down menu.
Search for “YourGeneName” by entering that in the “Enter text” box (substituting the actual name of your gene for “YourGeneName”)
Click Search.
● If multiple results are presented in a list, click on the link for “Dpse\YourGeneName”
The page that loads contains information about this gene in D. pseudoobscura. There is currently no database of D. miranda genes, but these two species have diverged so recently that we will assume that the location information from D. pseudoobscura is correct for D. miranda as well.
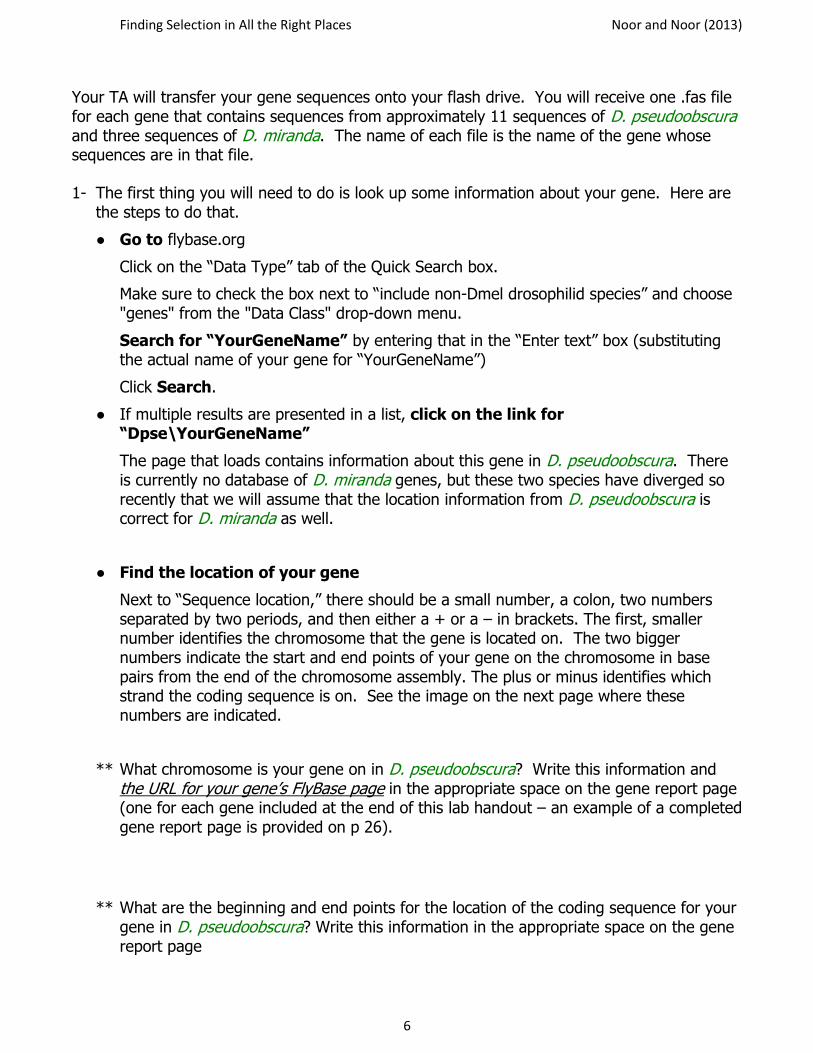
● Find the location of your gene
Next to “Sequence location,” there should be a small number, a colon, two numbers separated by two periods, and then either a + or a – in brackets. The first, smaller number identifies the chromosome that the gene is located on. The two bigger numbers indicate the start and end points of your gene on the chromosome in base pairs from the end of the chromosome assembly. The plus or minus identifies which strand the coding sequence is on. See the image on the next page where these numbers are indicated.
** What chromosome is your gene on in D. pseudoobscura? Write this information and the URL for your gene’s FlyBase page in the appropriate space on the gene report page (one for each gene included at the end of this lab handout – an example of a completed gene report page is provided on p 26).
** What are the beginning and end points for the location of the coding sequence for your gene in D. pseudoobscura? Write this information in the appropriate space on the gene report page
Finding Selection in All the Right Places Noor and Noor (2013)
7
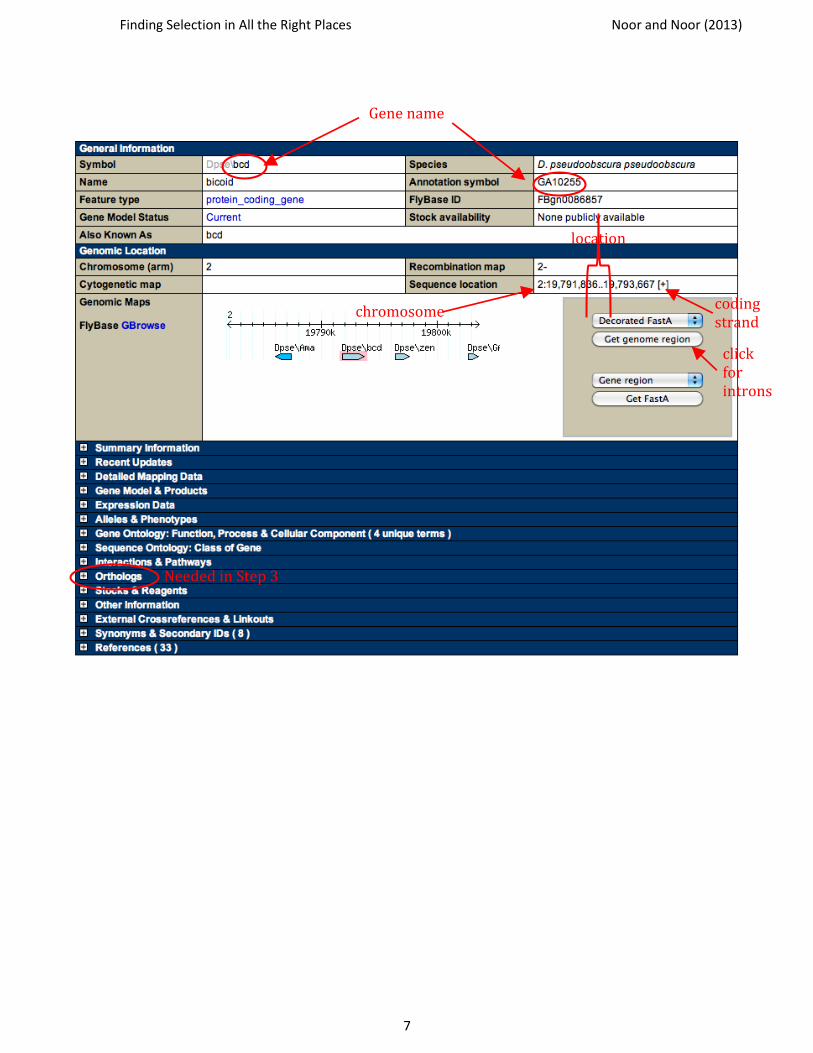
Gene name
chromosome
location
coding strand
click for introns
Needed in Step 3
Finding Selection in All the Right Places Noor and Noor (2013)
8
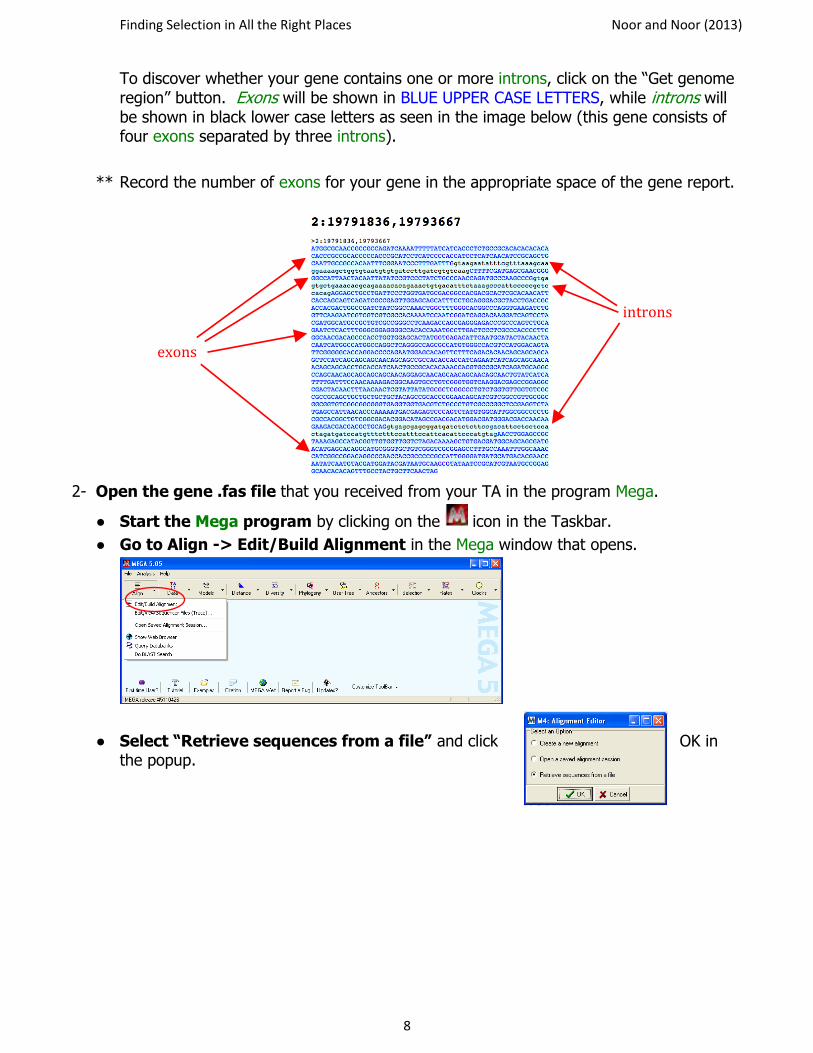
To discover whether your gene contains one or more introns, click on the “Get genome region” button. Exons will be shown in BLUE UPPER CASE LETTERS, while introns will be shown in black lower case letters as seen in the image below (this gene consists of four exons separated by three introns).
** Record the number of exons for your gene in the appropriate space of the gene report.
2- Open the gene .fas file that you received from your TA in the program Mega.
● Start the Mega program by clicking on the icon in the Taskbar.
● Go to Align -> Edit/Build Alignment in the Mega window that opens.
● Select “Retrieve sequences from a file” and click OK in the popup.
exons
introns
Finding Selection in All the Right Places Noor and Noor (2013)
9
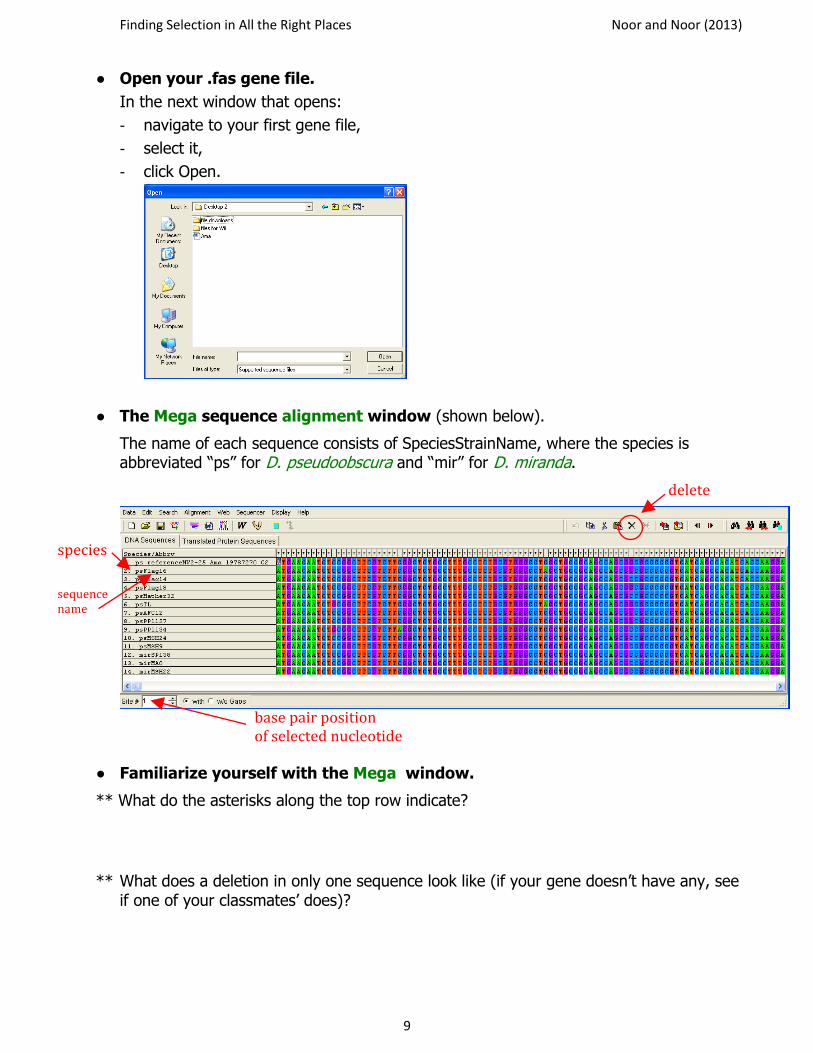
● Open your .fas gene file.
In the next window that opens:
- navigate to your first gene file,
- select it,
- click Open.
● The Mega sequence alignment window (shown below).
The name of each sequence consists of SpeciesStrainName, where the species is abbreviated “ps” for D. pseudoobscura and “mir” for D. miranda.
● Familiarize yourself with the Mega window.
** What do the asterisks along the top row indicate?
** What does a deletion in only one sequence look like (if your gene doesn’t have any, see if one of your classmates’ does)?
species
sequence name
base pair position of selected nucleotide
delete
Finding Selection in All the Right Places Noor and Noor (2013)
10
** How about an insertion in only one sequence (if your gene doesn’t have any, see if one of your classmates’ does)?
3- Check for problems in the alignment.
● Scan for problematic sequences. Any sequence that has multiple indels.
Delete any sequence that has 3 or more indels and at least one frameshift that lasts for more than 15 bp (ie is not corrected by more indels within the next 15 bps).
● Evaluate the number of unknown nucleotides (N’s). This step is necessary since the MK test will ignore any site in which even one sequence has a deletion or N. Since we need to maximize the amount of data that the MK test includes, we need to determine whether we’d have more data using a sequence’s sequence even though it has N’s and deletions, or if we’d be able to include more data if we deleted that sequence’s sequence entirely. Follow the procedure below to make this determination.
o Count the number of N’s and deletions in each sequence, paying attention to the species of each. If your gene has a lot, you may want to use the N-count.xls spreadsheet available on Sakai. Your TA will show you how to use it.
o Determine which sequence of each species has the most N’s+deletions.
o If the percentage of N’s+deletions out of the total number of nucleotides in the sequence is more than the percentage that one sequence represents of the total number of sequences, then delete that sequence. See the example below.
o Repeat for the sequence with the next most N’s+deletions, remembering that your cutoff has changed since the total number of sequences for that species has changed. See the example below.
o Keep repeating until you keep a sequence, then follow the same procedure for the other species.
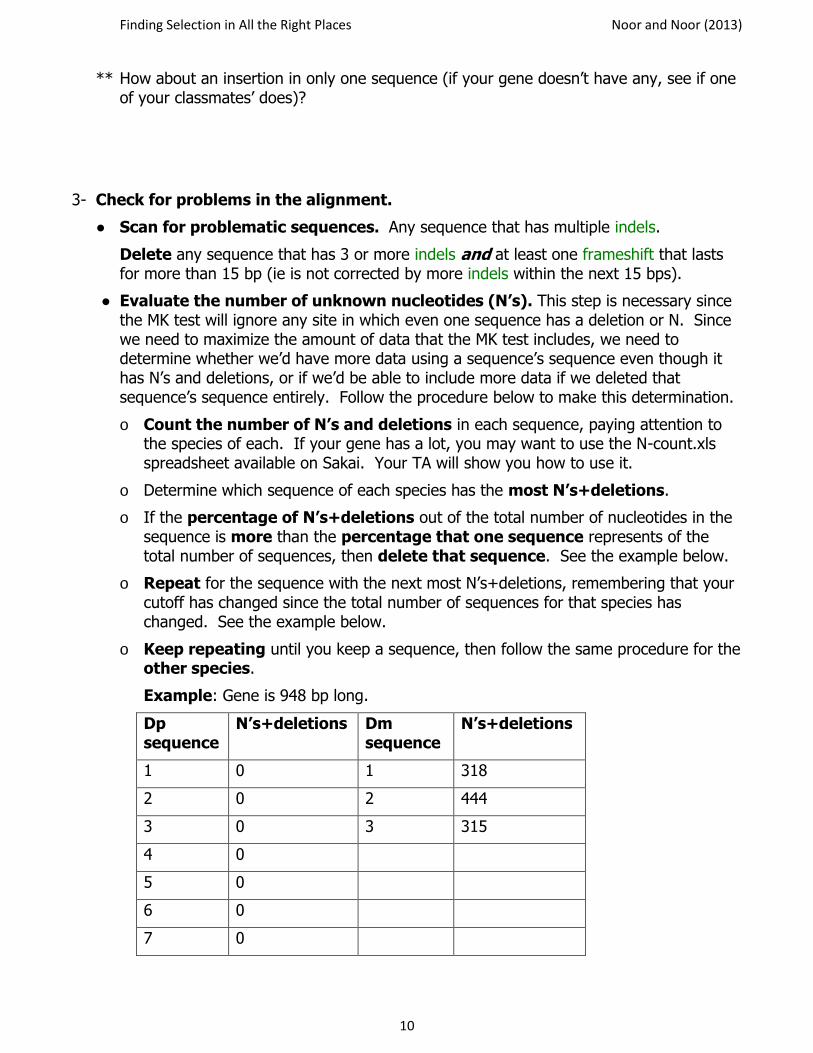
Example: Gene is 948 bp long.
Dp sequence
N’s+deletions Dm sequence
N’s+deletions
1 0 1 318
2 0 2 444
3 0 3 315
4 0
5 0
6 0
7 0
Finding Selection in All the Right Places Noor and Noor (2013)
11
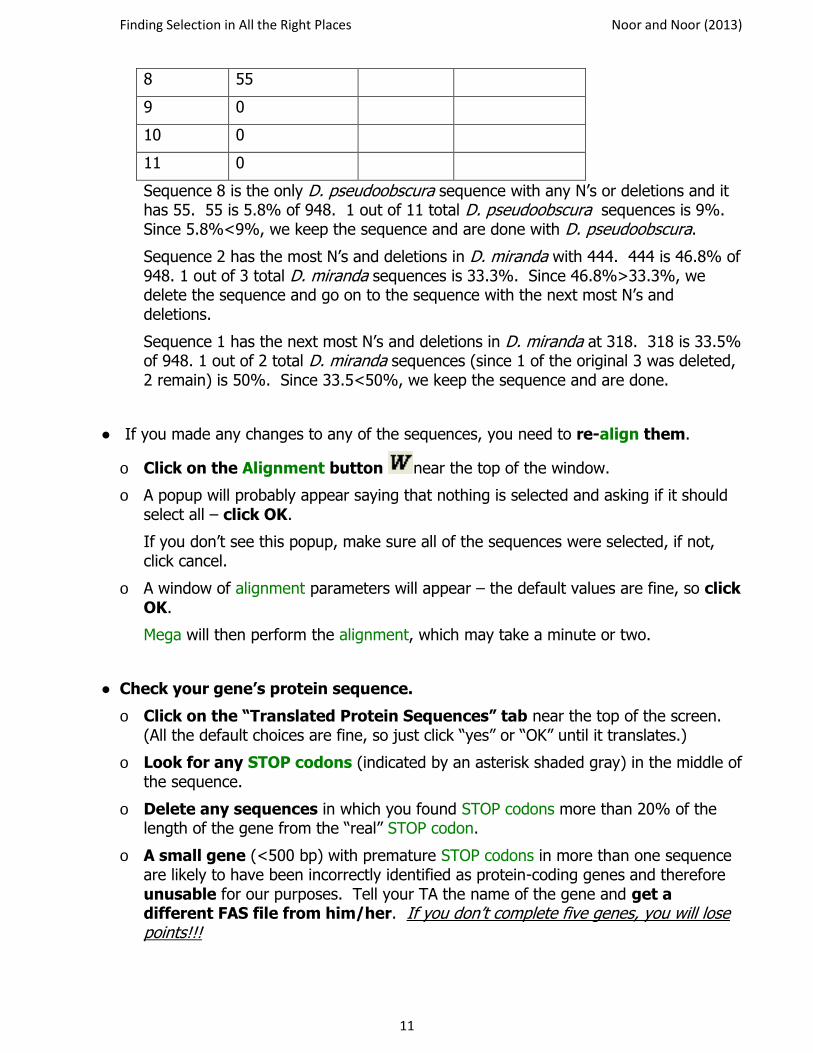
8 55
9 0
10 0
11 0
Sequence 8 is the only D. pseudoobscura sequence with any N’s or deletions and it has 55. 55 is 5.8% of 948. 1 out of 11 total D. pseudoobscura sequences is 9%. Since 5.8%<9%, we keep the sequence and are done with D. pseudoobscura.
Sequence 2 has the most N’s and deletions in D. miranda with 444. 444 is 46.8% of 948. 1 out of 3 total D. miranda sequences is 33.3%. Since 46.8%>33.3%, we delete the sequence and go on to the sequence with the next most N’s and deletions.
Sequence 1 has the next most N’s and deletions in D. miranda at 318. 318 is 33.5% of 948. 1 out of 2 total D. miranda sequences (since 1 of the original 3 was deleted, 2 remain) is 50%. Since 33.5<50%, we keep the sequence and are done.
● If you made any changes to any of the sequences, you need to re-align them.
o Click on the Alignment button near the top of the window.
o A popup will probably appear saying that nothing is selected and asking if it should select all – click OK.
If you don’t see this popup, make sure all of the sequences were selected, if not, click cancel.
o A window of alignment parameters will appear – the default values are fine, so click OK.
Mega will then perform the alignment, which may take a minute or two.
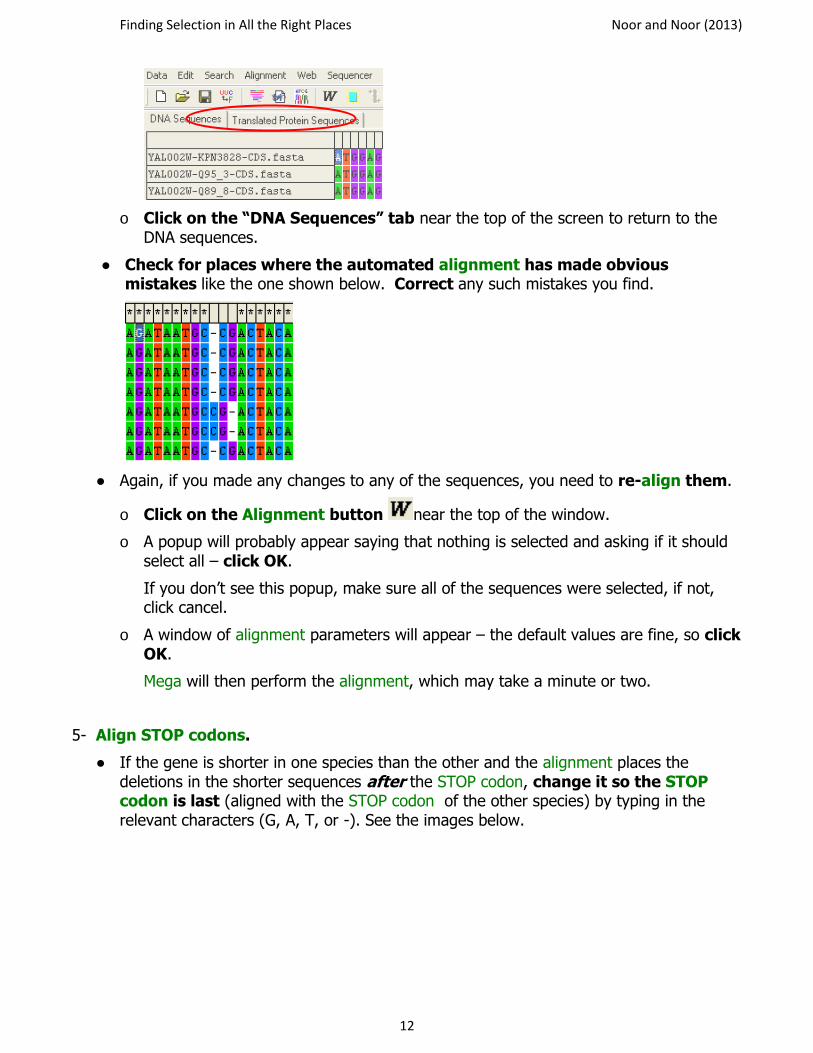
● Check your gene’s protein sequence.
o Click on the “Translated Protein Sequences” tab near the top of the screen. (All the default choices are fine, so just click “yes” or “OK” until it translates.)
o Look for any STOP codons (indicated by an asterisk shaded gray) in the middle of the sequence.
o Delete any sequences in which you found STOP codons more than 20% of the length of the gene from the “real” STOP codon.
o A small gene (<500 bp) with premature STOP codons in more than one sequence are likely to have been incorrectly identified as protein-coding genes and therefore unusable for our purposes. Tell your TA the name of the gene and get a different FAS file from him/her. If you don’t complete five genes, you will lose points!!!
Finding Selection in All the Right Places Noor and Noor (2013)
12
o Click on the “DNA Sequences” tab near the top of the screen to return to the DNA sequences.
● Check for places where the automated alignment has made obvious mistakes like the one shown below. Correct any such mistakes you find.
● Again, if you made any changes to any of the sequences, you need to re-align them.
o Click on the Alignment button near the top of the window.
o A popup will probably appear saying that nothing is selected and asking if it should select all – click OK.
If you don’t see this popup, make sure all of the sequences were selected, if not, click cancel.
o A window of alignment parameters will appear – the default values are fine, so click OK.
Mega will then perform the alignment, which may take a minute or two.
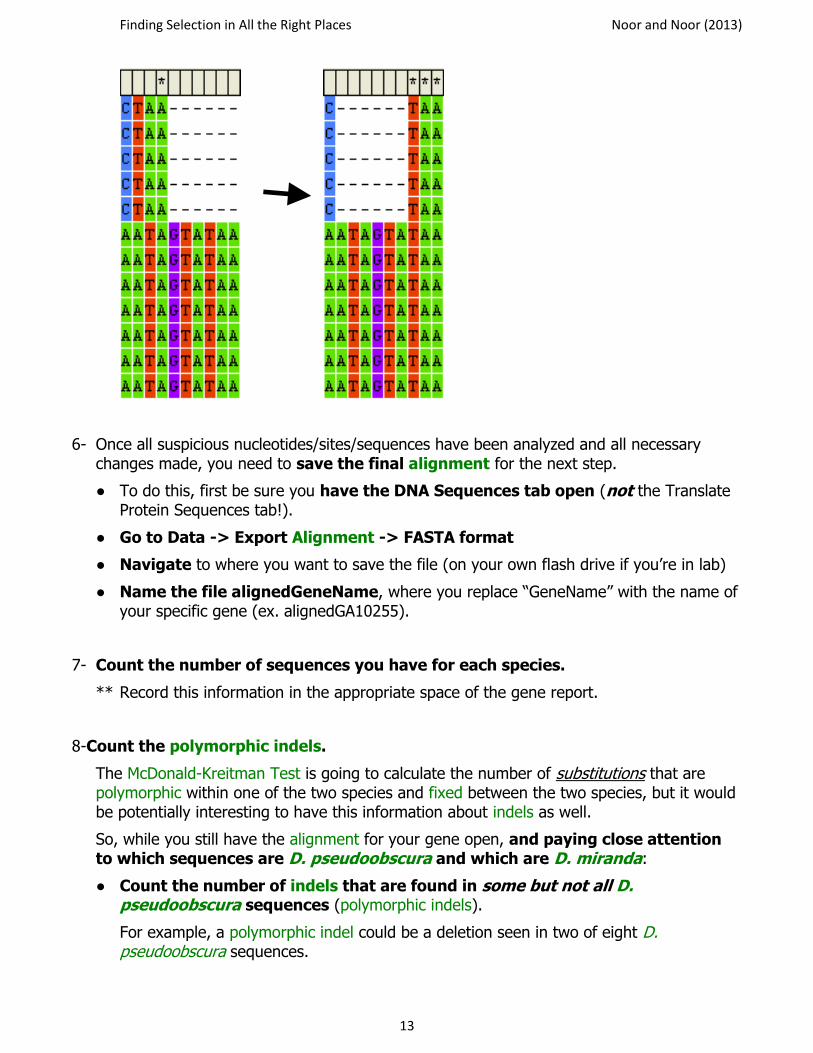
5- Align STOP codons.
● If the gene is shorter in one species than the other and the alignment places the deletions in the shorter sequences after the STOP codon, change it so the STOP codon is last (aligned with the STOP codon of the other species) by typing in the relevant characters (G, A, T, or -). See the images below.
Finding Selection in All the Right Places Noor and Noor (2013)
13
6- Once all suspicious nucleotides/sites/sequences have been analyzed and all necessary changes made, you need to save the final alignment for the next step.
● To do this, first be sure you have the DNA Sequences tab open (not the Translate Protein Sequences tab!).
● Go to Data -> Export Alignment -> FASTA format
● Navigate to where you want to save the file (on your own flash drive if you’re in lab)
● Name the file alignedGeneName, where you replace “GeneName” with the name of your specific gene (ex. alignedGA10255).
7- Count the number of sequences you have for each species.
** Record this information in the appropriate space of the gene report.
8-Count the polymorphic indels.
The McDonald-Kreitman Test is going to calculate the number of substitutions that are polymorphic within one of the two species and fixed between the two species, but it would be potentially interesting to have this information about indels as well.
So, while you still have the alignment for your gene open, and paying close attention to which sequences are D. pseudoobscura and which are D. miranda:
● Count the number of indels that are found in some but not all D. pseudoobscura sequences (polymorphic indels).
For example, a polymorphic indel could be a deletion seen in two of eight D. pseudoobscura sequences.
Finding Selection in All the Right Places Noor and Noor (2013)
14
It is possible for an indel to be polymorphic in both species, in which case include it in both counts.
● Repeat this count for indels that are found in some but not all D. miranda sequences.
● Count the indels that are found in all D. pseudoobscura sequences but no D. miranda sequences, and vice versa (indels fixed between species).
An indel fixed between species is one seen in all D. pseudoobscura sequences and none of the D. miranda sequences or all D. miranda sequences and none of the D. pseudoobscura sequences.
** Write this information in the appropriate spaces on the gene report.
Step 2: McDonald-Kreitman Test 1- Open your aligned .fas file in Notepad by right-clicking on the file, choosing “Open
With -> Choose Program,” and then scrolling down to Notepad, clicking on it, then clicking OK.
● If necessary, add carriage returns before the “>’s” identifying each sequence to make the sequences easier to see.
2- Now open a web browser (Firefox and Internet Explorer are both installed on the lab computers) and go to http://mkt.uab.es
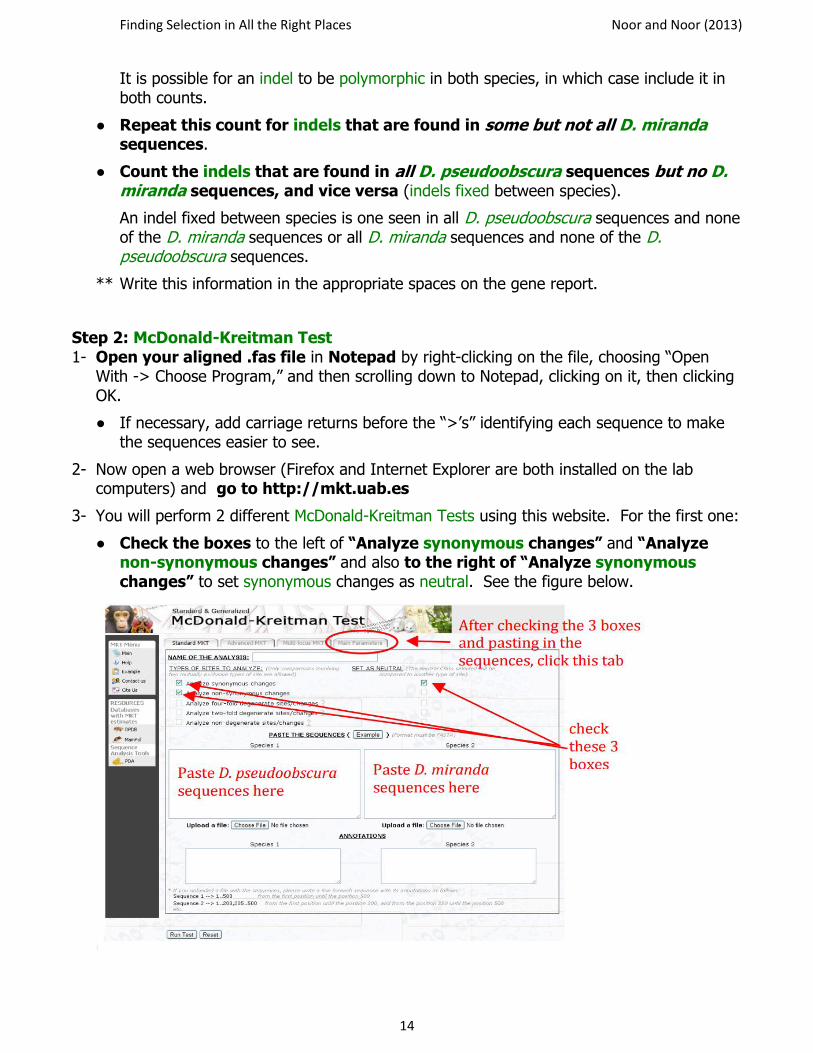
3- You will perform 2 different McDonald-Kreitman Tests using this website. For the first one:
● Check the boxes to the left of “Analyze synonymous changes” and “Analyze non-synonymous changes” and also to the right of “Analyze synonymous changes” to set synonymous changes as neutral. See the figure below.
Finding Selection in All the Right Places Noor and Noor (2013)
15
● Paste all of your D. pseudoobscura sequences from Notepad in a single block into the Species 1 box and paste all of your D. miranda sequences from Notepad in a single block into the Species 2 box.
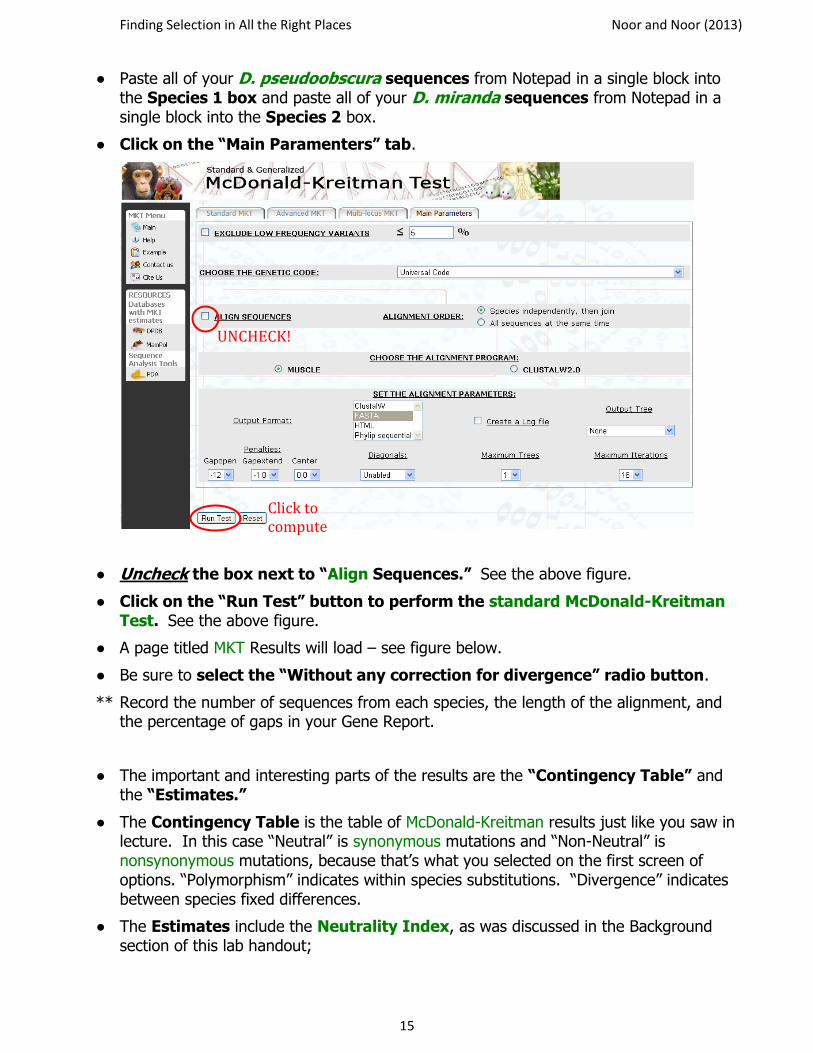
● Click on the “Main Paramenters” tab.
● Uncheck the box next to “Align Sequences.” See the above figure.
● Click on the “Run Test” button to perform the standard McDonald-Kreitman Test. See the above figure.
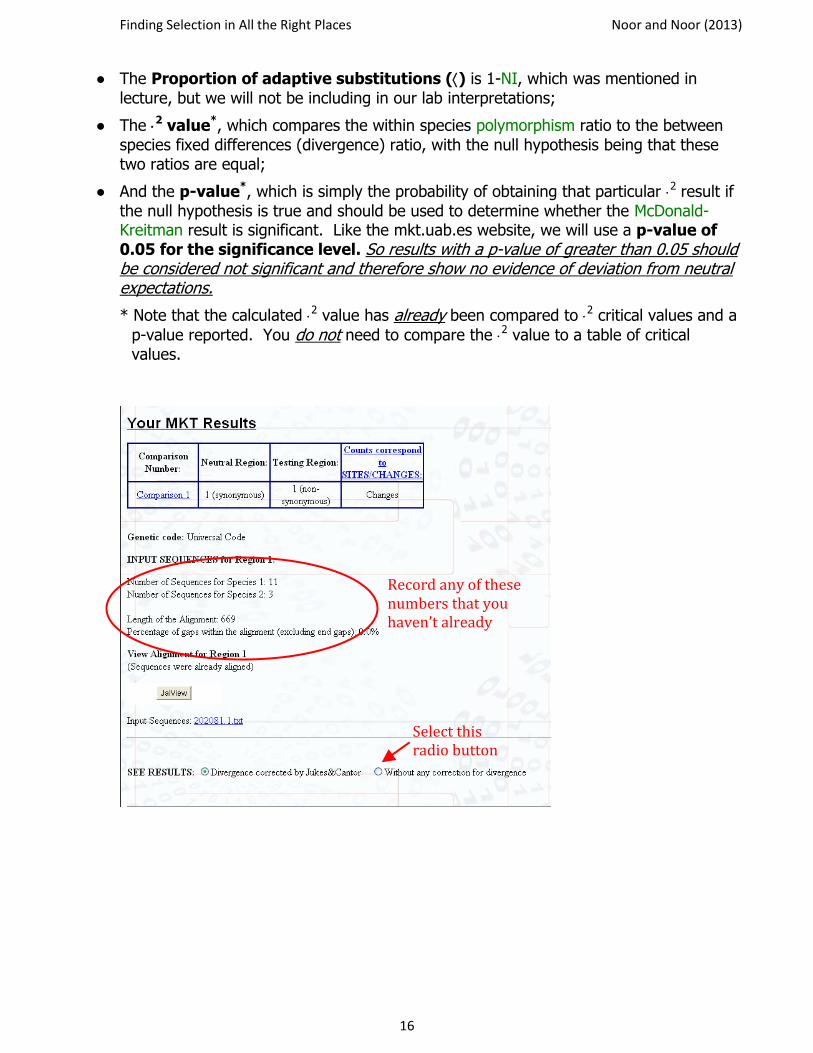
● A page titled MKT Results will load – see figure below.
● Be sure to select the “Without any correction for divergence” radio button.
** Record the number of sequences from each species, the length of the alignment, and the percentage of gaps in your Gene Report.
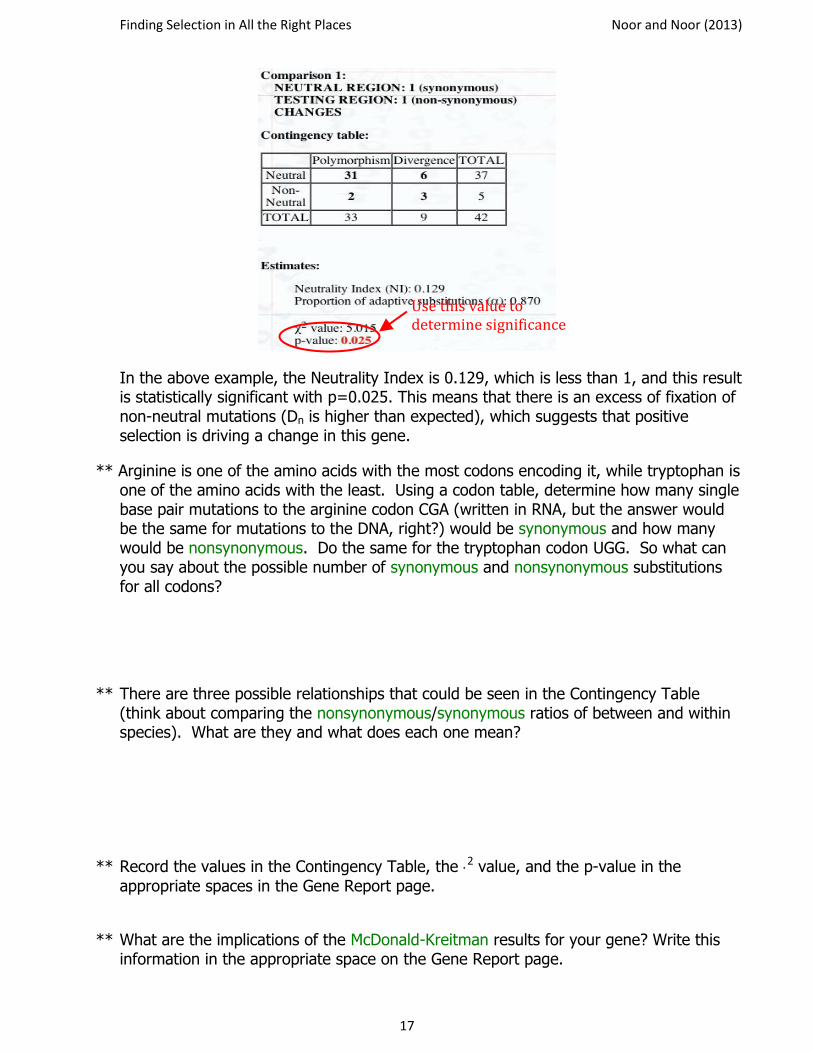
● The important and interesting parts of the results are the “Contingency Table” and the “Estimates.”
● The Contingency Table is the table of McDonald-Kreitman results just like you saw in lecture. In this case “Neutral” is synonymous mutations and “Non-Neutral” is nonsynonymous mutations, because that’s what you selected on the first screen of options. “Polymorphism” indicates within species substitutions. “Divergence” indicates between species fixed differences.
● The Estimates include the Neutrality Index, as was discussed in the Background section of this lab handout;
UNCHECK!
Click to compute
Finding Selection in All the Right Places Noor and Noor (2013)
16
● The Proportion of adaptive substitutions () is 1-NI, which was mentioned in
lecture, but we will not be including in our lab interpretations;
● The 2 value*, which compares the within species polymorphism ratio to the between
species fixed differences (divergence) ratio, with the null hypothesis being that these two ratios are equal;
● And the p-value*, which is simply the probability of obtaining that particular 2 result if
the null hypothesis is true and should be used to determine whether the McDonald-Kreitman result is significant. Like the mkt.uab.es website, we will use a p-value of 0.05 for the significance level. So results with a p-value of greater than 0.05 should be considered not significant and therefore show no evidence of deviation from neutral expectations.
* Note that the calculated 2 value has already been compared to 2 critical values and a
p-value reported. You do not need to compare the 2 value to a table of critical values.
Record any of these numbers that you haven’t already
Select this radio button
Finding Selection in All the Right Places Noor and Noor (2013)
17
In the above example, the Neutrality Index is 0.129, which is less than 1, and this result is statistically significant with p=0.025. This means that there is an excess of fixation of non-neutral mutations (Dn is higher than expected), which suggests that positive selection is driving a change in this gene.
** Arginine is one of the amino acids with the most codons encoding it, while tryptophan is one of the amino acids with the least. Using a codon table, determine how many single base pair mutations to the arginine codon CGA (written in RNA, but the answer would be the same for mutations to the DNA, right?) would be synonymous and how many would be nonsynonymous. Do the same for the tryptophan codon UGG. So what can you say about the possible number of synonymous and nonsynonymous substitutions for all codons?
** There are three possible relationships that could be seen in the Contingency Table (think about comparing the nonsynonymous/synonymous ratios of between and within species). What are they and what does each one mean?
** Record the values in the Contingency Table, the 2 value, and the p-value in the
appropriate spaces in the Gene Report page.
** What are the implications of the McDonald-Kreitman results for your gene? Write this information in the appropriate space on the Gene Report page.
Use this value to determine significance
Finding Selection in All the Right Places Noor and Noor (2013)
18
4- For the second, modified McDonald-Kreitman Test:
● Go back to the first page of the site by clicking “Main” in the lefthand menu.
● This time, check the boxes to the left of “Non-synonymous changes” and “Four-fold degenerate sites/changes” and check the box to the right of “Four-fold degenerate sites/changes” to set that as neutral.
● As before, paste all of your D. pseudoobscura sequences from Notepad in a single block into the Species 1 box and paste all of your D. miranda sequences from Notepad in a single block into the Species 2 box.
● Click on the “Main Paramenters” tab.
● Uncheck the box next to “Align Sequences.” See the above figure.
● Click on the “Run Test” button to perform the modified McDonald-Kreitman Test. See the above figure.
● Be sure to select the “Without any correction for divergence” radial button.
● The results are in the same format, except that now the “Neutral” values are the numbers of four-fold degenerate mutations.
** Record the values in this Contingency Table, the 2 value, and the p-value in the
appropriate spaces in the gene report page.
** What are the implications of these modified McDonald-Kreitman results for your gene?
Write this information in the appropriate space on the gene report page.
Step 3: Research Your Gene You need to complete step 3 for two of your five genes. Choose ones with significant McDonald-Kreitman results, if possible, or ones where the standard and modified McDonald-Kreitman results differ. This part is to be completed by each student independently (not with your lab partner, although you can choose the same genes) and is due at the beginning of the next lab period (turned in via Sakai and the database). You now need to do some online research to find out the function of your gene’s product. Start from the FlyBase page for your gene that you used to find the gene’s location. Click on the “Orthologs” option towards the bottom of the page (indicated in the figure in Step 1). Click on “AAA Orthologs…” and then “Dmel\YourGeneName” next to “Drosophila melanogaster,” which will take you to the entry for this gene in D. melanogaster. Then click on the “Summary Information” option right under the location map which should contain information about the gene’s function. If you can’t find the function on FlyBase, you can try other searches (be sure any information you find is for D. pseudoobscura
Finding Selection in All the Right Places Noor and Noor (2013)
19
or D. melanogaster), but be sure you list any and all sites in your answer on the gene report page (found on Blackboard).
If you see something like “predicted ORF” or “predicted gene” in the information for your gene, there will not be any information available about its product because no information is known. These tags indicate that the DNA sequence contains all the features of a gene (an open reading frame or ORF), however no gene product has been identified at this time. If you find significant MK results for one of these regions, it’s an extremely interesting finding! Your results provide very strong support that this region is actually protein forming and that it is under some sort of selection. Further investigation of these regions (or any genes with significant results) could be a fantastic independent project!
When reporting your findings, be sure you put the function in your own words, do not copy directly from your source, as this is plagiarism. See the example gene function page posted on the Sakai syllabus page for this week’s lab for a model of how to report this information.
Once you know the function of your gene’s product, form a hypothesis relating your MK results to this function. Submit the functions of your two genes and the two hypotheses in lab assignment 7 on Sakai.
FAY, J., WYKCOFF, G. J. and WU, C. I. (2001). Positive and negative selection on the human genome. Genetics 158: 1227-1234.
KIMURA, M. (1983). The neutral theory of Molecular Evolution. Cambridge University Press, Cambridge, Massachusetts.
McDONALD, J. H. and M. KREITMAN. (1991). Adaptive protein evolution at the Adh locus in Drosophila. Nature
351: 652-654.
RAND, D. M. and L. M. KANN. (1996). Excess amino acid polymorphism in mitochondrial DNA: contrasts among
genes from Drosophila, mice, and humans. Mol. Biol. Evol. 13: 735-748.
Finding Selection in All the Right Places Noor and Noor (2013)
20
Instructions for Data Entry
You will enter the data from the genes you analyzed into the class database. The data set consists of the information from the Gene Report page you completed for each gene. You need to submit an entry for each of your genes. However, the data for each gene should be entered only once, so you and your lab partner should submit only once, together.
Follow these instructions to enter your data:
1- Go to https://geneticsevolution.biology.duke.edu/
2- If you aren’t already signed in (because your signed into Sakai, ACES, etc already), do so by clicking on the “Login” link at the top right of the table.
3- Click on the “Add Gene” link at the top right of the table.
4- Enter the data from your Gene Report page. Where to enter each should be clear. Pay close attention to the specific notes below:
- for the start and end locations of your gene, do not include commas
- for % gaps, do not include the percent sign (%)
- for NI, Chi-sq Result, and P value, if your result is “null,” then leave the entry box blank (the database will automatically convert these to “null” for you)
- only check the box next to “Significant?” if your P value is less than 0.05 (your result is significant)
- be sure to enter your section number or your TA won’t be able to find your entry to grade!!!!
- You only need to add the Gene Function URL and Gene Function for the two genes you research for Step 3.
- Attach your aligned FASTA file (the one you named “alignedGeneName”) by clicking on the “Choose File” button next to “Upload FASTA File.”
- Be sure to add your lab partner from the list of available students by searching for their name, clicking on them, and then clicking on the blue right arrow to move them to the “Chosen Students” box!!!
If by some chance your partner’s name is not on the list, you’ll need to save (see below) and add them as described below.
o After you’ve saved, logout of the database using the “logout” link at the top right.
o Your partner should login and then logout again – sorry, this is just how the NetID system works!
o You login to the database again.
o Click the “My Genes” link next to the “Add Gene” link at the top right of the table.
o Click on the “Edit” link on the far right of the entry for the gene you just saved.
o Now follow the instructions above for adding your partner’s name and save again.
Finding Selection in All the Right Places Noor and Noor (2013)
21
5- Save your entry by clicking the “Save” button on the upper right.
6- Check the information you entered is correct:
- Click the “My Genes” link next to the “Add Gene” link at the top right of the table.
- Click on the entry for the gene you just saved.
- If you find any mistakes, click on the “Edit” link under your section, make any changes necessary in the form that loads (same as originally data entry screen), and save again. Note that the system won’t allow you to save unless you’ve made a change – if you don’t need to edit just click Back on your browser to get out of this screen.
7- You can edit your gene entries any time before the due date.
You will lose points if your data is not in the database!
Finding Selection in All the Right Places Noor and Noor (2013)
22
Glossary
alignment a way of arranging sequences of DNA, RNA, or protein to identify equivalent regions that may be a consequence of relationships between the sequences. Sequence alignments are usually represented as tables where each sequence is a row and matching bases are aligned in columns. Mismatches can be interpreted as point mutations and gaps can be interpreted as indels introduced into one or both lineages in the time since they diverged.
balancing selection
a number of processes, including heterozygote advantage and negative frequency-dependent selection, by which multiple alleles are actively maintained in a population
base pair
a metric used to describe the length of a DNA or RNA sequence by counting the number of nucleotide bases
bp. See base pair complement
a sequence whose bases will hydrogen bond to the bases of a previously mentioned reference sequence
complementary. See complement consensus sequence
the DNA (or amino acid) sequence made up of the most common nucleotides (or amino acids) after multiple sequence reads are aligned
coverage
the number of reads the consensus sequence for a particular region of DNA is based on Drosophila miranda
a species of black fruit fly, very closely related to Drosophila pseudoobscura, native to western North America
Drosophila pseudoobscura
a species of black fruit fly native to North America D. miranda See Drosophila miranda D. pseudoobscura See Drosophila pseudoobscura exons
the DNA segments of a gene that contain the sequences that, through transcription and translation, are eventually represented in the final polypeptide product
Finding Selection in All the Right Places Noor and Noor (2013)
23
fixed substitutions/differences
a base substitution or difference between species or populations where one group has only one allele and the other group has only the other allele
four-fold degenerate codon
a codon whose third site can be any nucleotide without changing the amino acid frameshift
a mutation in a DNA sequence that occurs when the number of nucleotides inserted or deleted is not a multiple of three, so that every codon beyond the point of insertion or deletion is read incorrectly during translation
indel
a type of mutation caused by the insertion or deletion of one or more bases
intron any segment of DNA that lies between coding regions (exons) of a gene. Introns are transcribed but are spliced out of the RNA product and are not represented in the polypeptide encoded by the gene
kb. See kilobase kilobase
a measurement of DNA or RNA sequence length, equal to one thousand bases McDonald-Kreitman test (standard)
a test for natural selection based on the prediction that, according to the Neutral Theory, the ratio of nonsynonymous to synonymous substitutions in between-species comparisons should equal the ratio of nonsynonymous to synonymous polymorphisms in within-species comparisons
Mega
the software program we use to align sequences MK test See McDonald-Kreitman test (standard) modified McDonald-Kreitman test
considers only four-fold degenerate sites to be neutral. Compare to McDonald-Kreitman test (standard)
neutral hypothesis
the hypothesis that observed base substitutions are neither good or bad with respect to fitness, and therefore fluctuate randomly in the population because of genetic drift
Finding Selection in All the Right Places Noor and Noor (2013)
24
neutral theory a theory that models the rate of fixation of alleles with no effect on fitness; also associated with the claim that the vast majority of observed base substitutions are neither good or bad with respect to fitness.
neutrality
evolution occurring due to mutation and genetic drift alone
Neutrality Index (NI) one way to present the results of the McDonald-Kreitman test:
where Pn is nonsynonymous within-species polymorphism, Ps is synonymous within-species polymorphism, Dn is nonsynonymous between-species fixed differences, and Ds is synonymous between-species fixed differences
NI See Neutrality Index nonsynonymous variation
differences in DNA sequence that result in changes in the amino acid sequence of the encoded protein
polymorphic sites
DNA base positions for which there are more than one nucleotide seen when comparing different aligned sequences
polymorphism
existence in multiple forms
positive selection selection that causes a new or rare variant to increase in frequency and eventually be fixed
purifying selection
negative selection, selection acting to remove new deleterious mutations read
a stretch of DNA that was the product of a sequencing reaction single nucleotide polymorphism (SNP)
a single base position in the DNA sequence at which different individuals have different nucleotides
standard McDonald-Kreitman test See McDonald-Kreitman test (standard) STOP codon
Finding Selection in All the Right Places Noor and Noor (2013)
25
a three base RNA sequence that signals the end of translation (polypeptide formation), may also refer to the equivalent sequence in the gene’s DNA. In RNA, the STOP codons are UAA, UAG, and UGA.
synonymous variation
differences in DNA sequence that do not result in changes in the amino acid sequence of the encoded protein
two-fold degenerate codon
a codon whose third site can be one of two nucleotides without changing the amino acid
Finding Selection in All the Right Places Noor and Noor (2013)
26
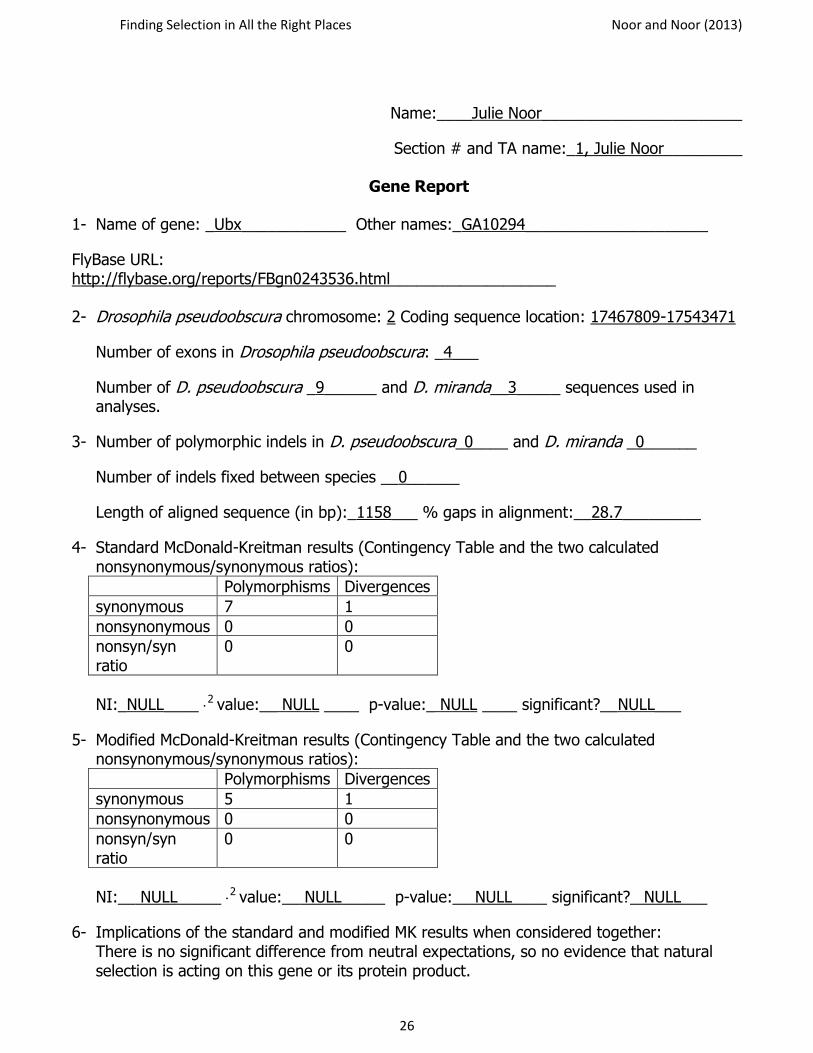
Name:____Julie Noor_______________________
Section # and TA name:_1, Julie Noor_________
Gene Report
1- Name of gene: _Ubx____________ Other names:_GA10294_____________________
FlyBase URL: http://flybase.org/reports/FBgn0243536.html___________________ 2- Drosophila pseudoobscura chromosome: 2 Coding sequence location: 17467809-17543471
Number of exons in Drosophila pseudoobscura: _4___
Number of D. pseudoobscura _9______ and D. miranda__3_____ sequences used in analyses.
3- Number of polymorphic indels in D. pseudoobscura_0____ and D. miranda _0______
Number of indels fixed between species __0______
Length of aligned sequence (in bp):_1158___ % gaps in alignment:__28.7_________
4- Standard McDonald-Kreitman results (Contingency Table and the two calculated nonsynonymous/synonymous ratios): Polymorphisms Divergences
synonymous 7 1 nonsynonymous 0 0 nonsyn/syn ratio
0 0
NI:_NULL____ 2 value:__ NULL ____ p-value:_ NULL ____ significant?__NULL___
5- Modified McDonald-Kreitman results (Contingency Table and the two calculated nonsynonymous/synonymous ratios): Polymorphisms Divergences synonymous 5 1 nonsynonymous 0 0
nonsyn/syn ratio
0 0
NI:__ NULL_____ 2 value:__ NULL_____ p-value:__ NULL____ significant?_ NULL___
6- Implications of the standard and modified MK results when considered together: There is no significant difference from neutral expectations, so no evidence that natural selection is acting on this gene or its protein product.
Finding Selection in All the Right Places Noor and Noor (2013)
27
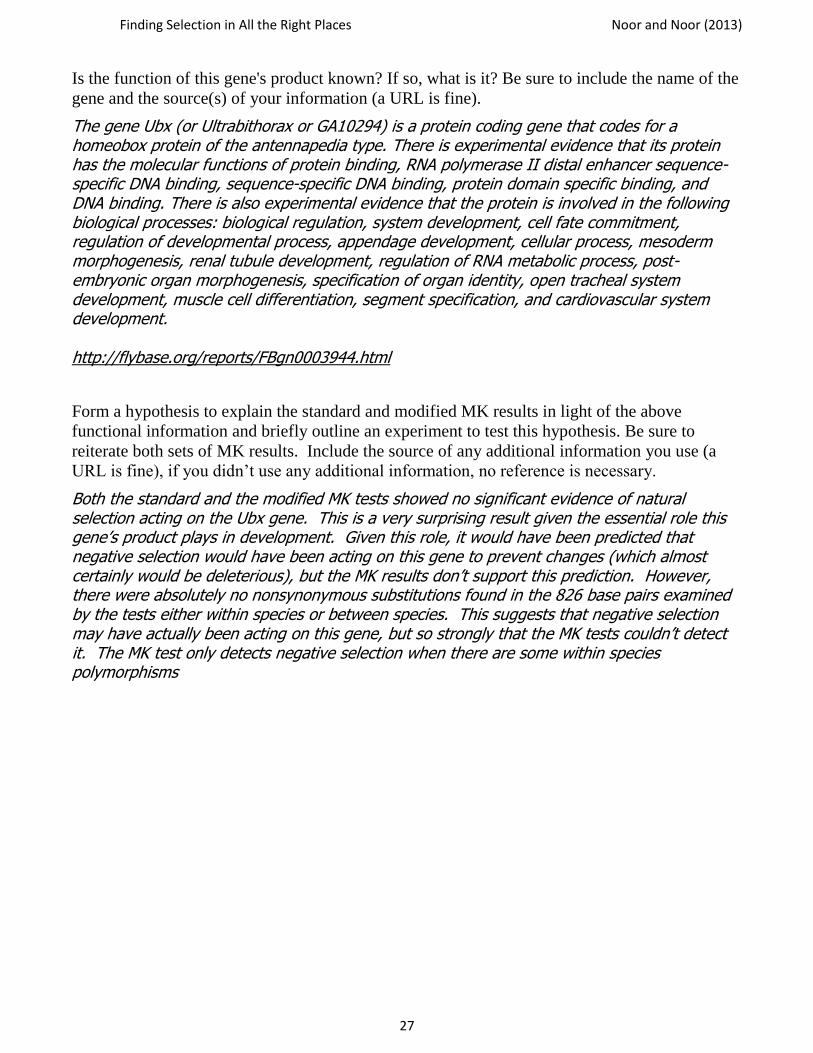
Is the function of this gene's product known? If so, what is it? Be sure to include the name of the
gene and the source(s) of your information (a URL is fine).
The gene Ubx (or Ultrabithorax or GA10294) is a protein coding gene that codes for a homeobox protein of the antennapedia type. There is experimental evidence that its protein has the molecular functions of protein binding, RNA polymerase II distal enhancer sequence-specific DNA binding, sequence-specific DNA binding, protein domain specific binding, and DNA binding. There is also experimental evidence that the protein is involved in the following biological processes: biological regulation, system development, cell fate commitment, regulation of developmental process, appendage development, cellular process, mesoderm morphogenesis, renal tubule development, regulation of RNA metabolic process, post-embryonic organ morphogenesis, specification of organ identity, open tracheal system development, muscle cell differentiation, segment specification, and cardiovascular system development. http://flybase.org/reports/FBgn0003944.html
Form a hypothesis to explain the standard and modified MK results in light of the above
functional information and briefly outline an experiment to test this hypothesis. Be sure to
reiterate both sets of MK results. Include the source of any additional information you use (a
URL is fine), if you didn’t use any additional information, no reference is necessary.
Both the standard and the modified MK tests showed no significant evidence of natural selection acting on the Ubx gene. This is a very surprising result given the essential role this gene’s product plays in development. Given this role, it would have been predicted that negative selection would have been acting on this gene to prevent changes (which almost certainly would be deleterious), but the MK results don’t support this prediction. However, there were absolutely no nonsynonymous substitutions found in the 826 base pairs examined by the tests either within species or between species. This suggests that negative selection may have actually been acting on this gene, but so strongly that the MK tests couldn’t detect it. The MK test only detects negative selection when there are some within species polymorphisms
Finding Selection in All the Right Places Noor and Noor (2013)
28
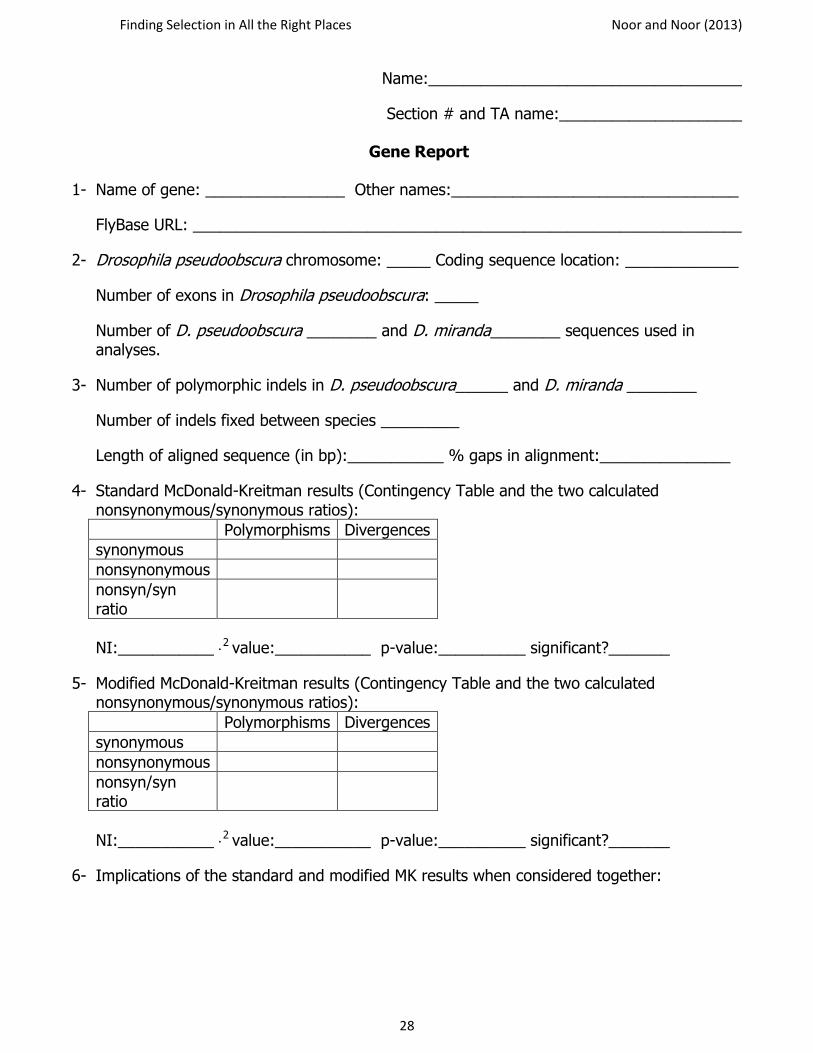
Name:____________________________________
Section # and TA name:_____________________
Gene Report
1- Name of gene: ________________ Other names:_________________________________
FlyBase URL: _______________________________________________________________
2- Drosophila pseudoobscura chromosome: _____ Coding sequence location: _____________
Number of exons in Drosophila pseudoobscura: _____
Number of D. pseudoobscura ________ and D. miranda________ sequences used in analyses.
3- Number of polymorphic indels in D. pseudoobscura______ and D. miranda ________
Number of indels fixed between species _________
Length of aligned sequence (in bp):___________ % gaps in alignment:_______________
4- Standard McDonald-Kreitman results (Contingency Table and the two calculated nonsynonymous/synonymous ratios): Polymorphisms Divergences synonymous
nonsynonymous
nonsyn/syn ratio
NI:___________ 2 value:___________ p-value:__________ significant?_______
5- Modified McDonald-Kreitman results (Contingency Table and the two calculated nonsynonymous/synonymous ratios): Polymorphisms Divergences synonymous
nonsynonymous
nonsyn/syn ratio
NI:___________ 2 value:___________ p-value:__________ significant?_______
6- Implications of the standard and modified MK results when considered together:

Finding Selection in All the Right Places Noor and Noor (2013)
29
Name:____________________________________
Section # and TA name:_____________________
Gene Report
1- Name of gene: ________________ Other names:_________________________________
FlyBase URL: _______________________________________________________________
2- Drosophila pseudoobscura chromosome: _____ Coding sequence location: _____________
Number of exons in Drosophila pseudoobscura: _____
Number of D. pseudoobscura ________ and D. miranda________ sequences used in analyses.
3- Number of polymorphic indels in D. pseudoobscura______ and D. miranda ________
Number of indels fixed between species _________
Length of aligned sequence (in bp):___________ % gaps in alignment:_______________
4- Standard McDonald-Kreitman results (Contingency Table and the two calculated nonsynonymous/synonymous ratios): Polymorphisms Divergences synonymous
nonsynonymous
nonsyn/syn ratio
NI:___________ 2 value:___________ p-value:__________ significant?_______
5- Modified McDonald-Kreitman results (Contingency Table and the two calculated nonsynonymous/synonymous ratios): Polymorphisms Divergences synonymous
nonsynonymous
nonsyn/syn ratio
NI:___________ 2 value:___________ p-value:__________ significant?_______
6- Implications of the standard and modified MK results when considered together:

Finding Selection in All the Right Places Noor and Noor (2013)
30
Name:____________________________________
Section # and TA name:_____________________
Gene Report
1- Name of gene: ________________ Other names:_________________________________
FlyBase URL: _______________________________________________________________
2- Drosophila pseudoobscura chromosome: _____ Coding sequence location: _____________
Number of exons in Drosophila pseudoobscura: _____
Number of D. pseudoobscura ________ and D. miranda________ sequences used in analyses.
3- Number of polymorphic indels in D. pseudoobscura______ and D. miranda ________
Number of indels fixed between species _________
Length of aligned sequence (in bp):___________ % gaps in alignment:_______________
4- Standard McDonald-Kreitman results (Contingency Table and the two calculated nonsynonymous/synonymous ratios): Polymorphisms Divergences synonymous
nonsynonymous
nonsyn/syn ratio
NI:___________ 2 value:___________ p-value:__________ significant?_______
5- Modified McDonald-Kreitman results (Contingency Table and the two calculated nonsynonymous/synonymous ratios): Polymorphisms Divergences synonymous
nonsynonymous
nonsyn/syn ratio
NI:___________ 2 value:___________ p-value:__________ significant?_______
6- Implications of the standard and modified MK results when considered together:

Finding Selection in All the Right Places Noor and Noor (2013)
31
Name:____________________________________
Section # and TA name:_____________________
Gene Report
1- Name of gene: ________________ Other names:_________________________________
FlyBase URL: _______________________________________________________________
2- Drosophila pseudoobscura chromosome: _____ Coding sequence location: _____________
Number of exons in Drosophila pseudoobscura: _____
Number of D. pseudoobscura ________ and D. miranda________ sequences used in analyses.
3- Number of polymorphic indels in D. pseudoobscura______ and D. miranda ________
Number of indels fixed between species _________
Length of aligned sequence (in bp):___________ % gaps in alignment:_______________
4- Standard McDonald-Kreitman results (Contingency Table and the two calculated nonsynonymous/synonymous ratios): Polymorphisms Divergences synonymous
nonsynonymous
nonsyn/syn ratio
NI:___________ 2 value:___________ p-value:__________ significant?_______
5- Modified McDonald-Kreitman results (Contingency Table and the two calculated nonsynonymous/synonymous ratios): Polymorphisms Divergences synonymous
nonsynonymous
nonsyn/syn ratio
NI:___________ 2 value:___________ p-value:__________ significant?_______
6- Implications of the standard and modified MK results when considered together:

Finding Selection in All the Right Places Noor and Noor (2013)
32
Name:____________________________________
Section # and TA name:_____________________
Gene Report
7- Name of gene: ________________ Other names:_________________________________
FlyBase URL: _______________________________________________________________
8- Drosophila pseudoobscura chromosome: _____ Coding sequence location: _____________
Number of exons in Drosophila pseudoobscura: _____
Number of D. pseudoobscura ________ and D. miranda________ sequences used in analyses.
9- Number of polymorphic indels in D. pseudoobscura______ and D. miranda ________
Number of indels fixed between species _________
Length of aligned sequence (in bp):___________ % gaps in alignment:_______________
10- Standard McDonald-Kreitman results (Contingency Table and the two calculated nonsynonymous/synonymous ratios): Polymorphisms Divergences synonymous
nonsynonymous
nonsyn/syn ratio
NI:___________ 2 value:___________ p-value:__________ significant?_______
11- Modified McDonald-Kreitman results (Contingency Table and the two calculated nonsynonymous/synonymous ratios): Polymorphisms Divergences synonymous
nonsynonymous
nonsyn/syn ratio
NI:___________ 2 value:___________ p-value:__________ significant?_______
12- Implications of the standard and modified MK results when considered together:
Related Documents


![Model Selection versus Model Averaging in Dose …1508.00281v1 [stat.AP] 2 Aug 2015 Model Selection versus Model Averaging in Dose Finding Studies Schorning, Kirsten Ruhr-Universität](https://static.cupdf.com/doc/110x72/5ab1229d7f8b9a7e1d8c05e4/model-selection-versus-model-averaging-in-dose-150800281v1-statap-2-aug.jpg)