Finding Probability Using Tree Diagrams and Outcome Tables Chapter 4.5 – Introduction to Probability PDF created with pdfFactory Pro trial version www.pdffactory.com

Welcome message from author
This document is posted to help you gain knowledge. Please leave a comment to let me know what you think about it! Share it to your friends and learn new things together.
Transcript
Finding Probability Using Tree Diagrams and Outcome Tables
Chapter 4.5 – Introduction to Probability
PDF created with pdfFactory Pro trial version www.pdffactory.com

Tree Diagramsn if you flip a coin twice, you can model the
possible outcomes using a tree diagram or an outcome table resulting in 4 possible outcomes
T
H
T
H
H
T
TTTT
THHT
HTTH
HHHH
SimpleEvent
Flip 2Flip 1
PDF created with pdfFactory Pro trial version www.pdffactory.com

Tree Diagrams Continuedn if you rolled 1 die and then flipped a coin you
have 12 possible outcomes
HT
HTHT
HT
HT
HT
1
2
3
4
5
6
(2,H)
(1,H)
(3,H)
(4,H)
(5,H)
(6,H)
(2,T)
(1,T)
(3,T)
(4,T)
(5,T)
(6,T)
PDF created with pdfFactory Pro trial version www.pdffactory.com
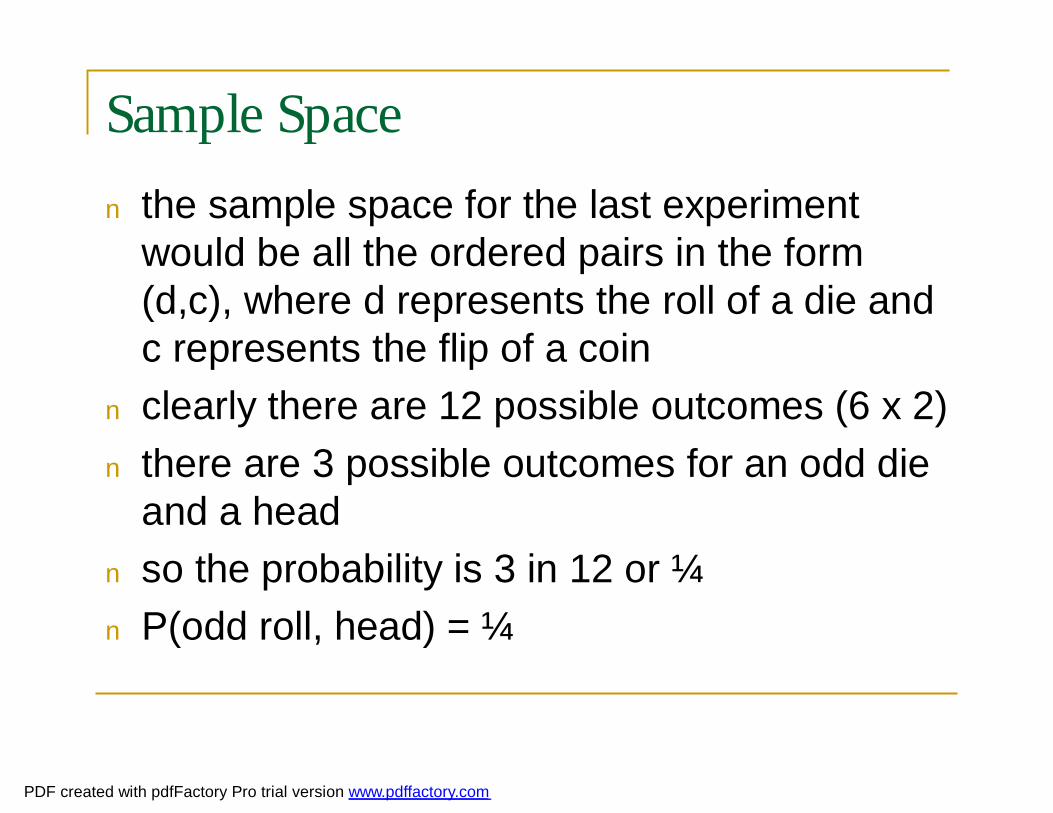
Sample Spacen the sample space for the last experiment
would be all the ordered pairs in the form (d,c), where d represents the roll of a die and c represents the flip of a coin
n clearly there are 12 possible outcomes (6 x 2)n there are 3 possible outcomes for an odd die
and a head n so the probability is 3 in 12 or ¼n P(odd roll, head) = ¼
PDF created with pdfFactory Pro trial version www.pdffactory.com

Multiplicative Principle for Countingn The total number of outcomes is the product of the
possible outcomes at each step in the sequencen if a is selected from A, and b selected from B…n n (a,b) = n(A) x n(B)
q (this assumes that each outcome has no influence on the next outcome)
n How many possible three letter words are there? q you can choose 26 letters for each of the three positions, so
there are 26 x 26 x 26 = 17576n how many possible license plates are there in Ontario?
q 26 x 26 x 26 x 26 x 10 x 10 x 10
PDF created with pdfFactory Pro trial version www.pdffactory.com

Independent and Dependent Eventsn two events are independent of each other if an
occurence in one event does not change the probability of an occurrence in the other
n what is the probability of getting heads when you know in advance that you will throw an even die?q these are independent events, so knowing the outcome of
the second does not change the probability of the first
)()|(,21)(
21
63
123
)()()|(
headsPevenheadsPsaycanweheadsPas
evenPevenheadsPevenheadsP
==
=
=∩
=
PDF created with pdfFactory Pro trial version www.pdffactory.com
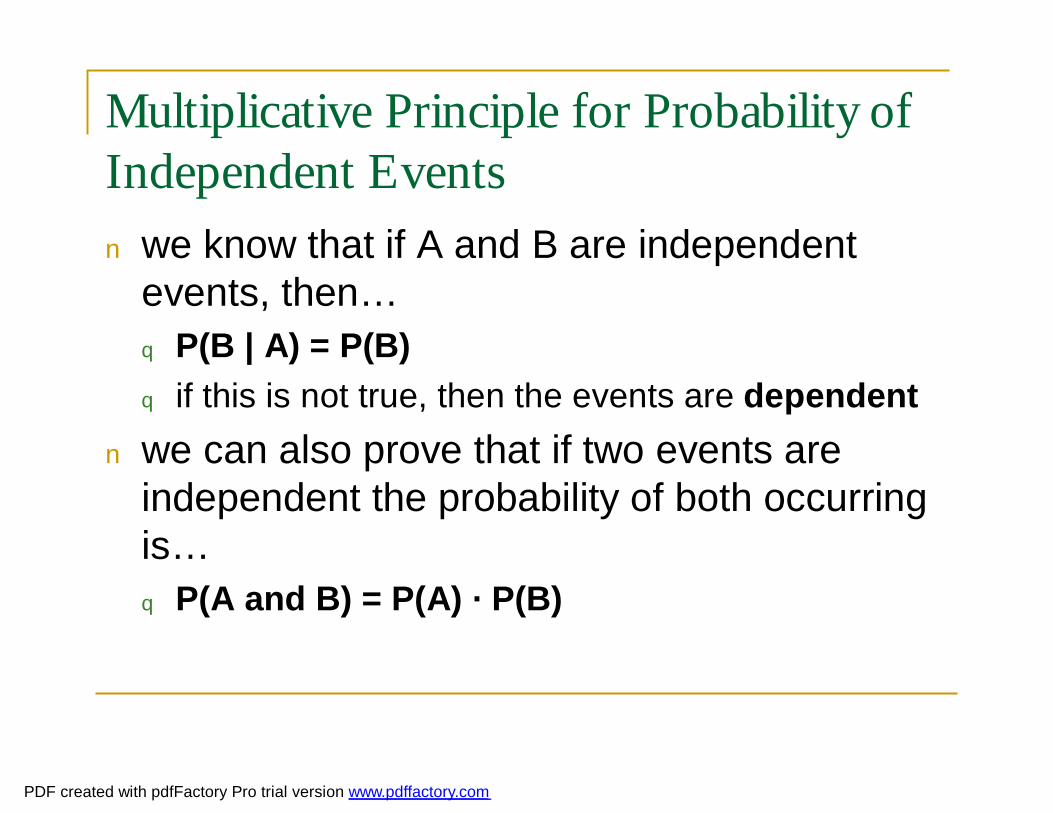
Multiplicative Principle for Probability of Independent Eventsn we know that if A and B are independent
events, then…q P(B | A) = P(B)q if this is not true, then the events are dependent
n we can also prove that if two events are independent the probability of both occurring is…q P(A and B) = P(A) · P(B)
PDF created with pdfFactory Pro trial version www.pdffactory.com

Examplen a sock drawer has a red, a green and a blue sockn you pull out one sock, replace it and pull another outn draw a tree diagram representing the possible outcomesn what is the probability of drawing 2 red socks?n these are independent events
R
R
R
R
B
B
B
BG
G
G
G
91
31
31
)()()(
=×=
×= redPredPredandredP
PDF created with pdfFactory Pro trial version www.pdffactory.com

Examplen if you draw a card, replace it and draw
another, what is the probability of two aces?q 4/52 x 4/52 q independent events
n if you draw a card and then draw a second card (no replacement), what is the probability of two aces?q 4/52 x 3/51q second event depends on first eventq the sample space is reduced by the first event
PDF created with pdfFactory Pro trial version www.pdffactory.com

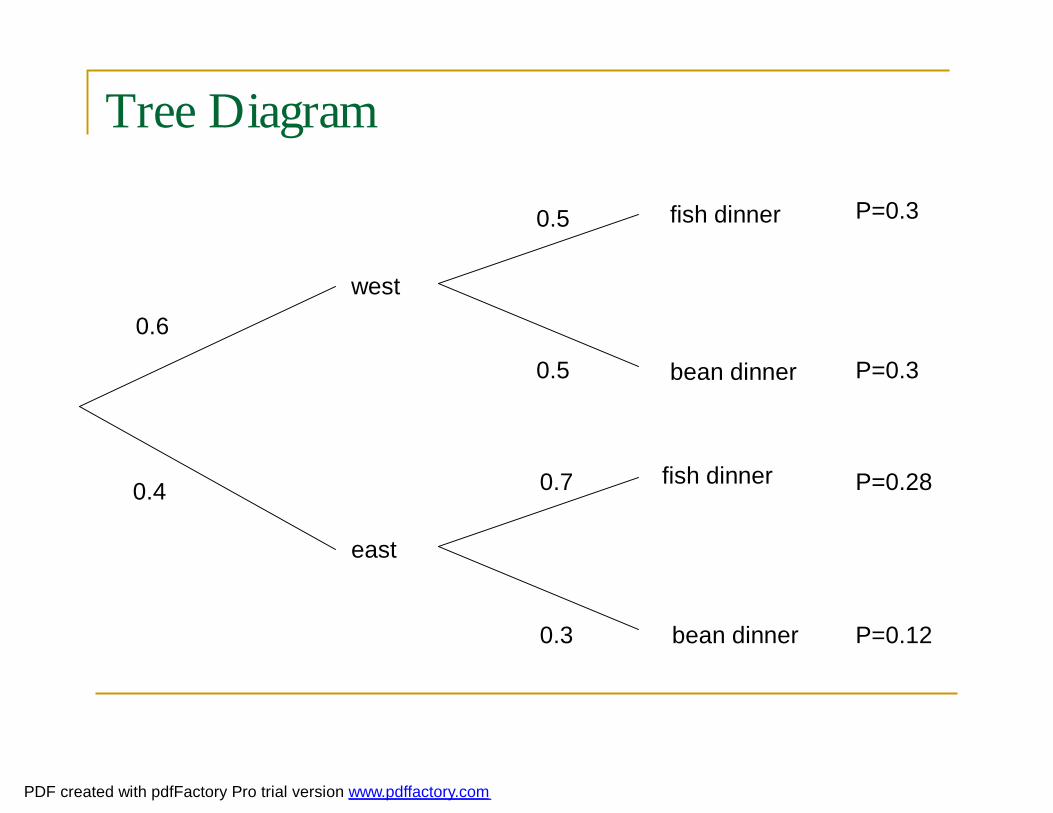
Predicting Outcomesn a math teacher is going fishingn he finds that he catches fish 70% of the time
when the wind is out of the eastn he also finds that he catches fish 50% of the
time when the wind is out of the westn if there is a 60% chance of a west wind
today, what are his chances of having fish for dinner?
n we will start by creating a tree diagram
PDF created with pdfFactory Pro trial version www.pdffactory.com
Tree Diagram
west
east
fish dinner
fish dinner
bean dinner
bean dinner
0.6
0.4 0.7
0.3
0.5
0.5
P=0.3
P=0.3
P=0.28
P=0.12
PDF created with pdfFactory Pro trial version www.pdffactory.com

Continued…n P(east, catch) = P(east) x P(catch | east)n = 0.4 x 0.7 = 0.28n P(west, catch) = P(west) x P(catch | west)n = 0.6 x 0.5 = 0.30n Probability of a fish dinner: 0.28 + 0.3 = 0.58n So a math teacher has a 58% chance of
catching a fish for dinner
PDF created with pdfFactory Pro trial version www.pdffactory.com

Exercises
n read the examples on pages 239-244n try page 245# 1,2,4,7,8,10q check each answer with the back of the book to
make sure that you are understanding these concepts
PDF created with pdfFactory Pro trial version www.pdffactory.com

Counting Techniques and Probability Strategies -Permutations
Chapter 4.6 – Introduction to Probability
PDF created with pdfFactory Pro trial version www.pdffactory.com

Arrangements of objects
n suppose you have three people in a lineq how many different arrangements are there?
n it turns out that there are 6q how many arrangements are there for blocks of
different colorsq how many for 4 blocksq how many for 5 blocksq how many for 6 blocksq what is the pattern?
PDF created with pdfFactory Pro trial version www.pdffactory.com

Selecting When Order Mattersn when order matters, we have fewer choices
for later places in the arrangementsn for the problem of 3 people:q for person 1 we have 3 choicesq for person 2 we have 2 choices leftq for person 3 we have one choice left
n the number of possible arrangements for 3 people is 3 x 2 x 1 = 6
n there is a mathematical notation for this (and your calculator has it)
PDF created with pdfFactory Pro trial version www.pdffactory.com

Factorial Notation
n the notation is called factorialn n!= n x (n – 1) x (n – 2) x … x 2 x 1n for example:q 3! = 3 x 2 x 1 = 6q 5! = 5 x 4 x 3 x 2 x 1 = 120
n If we have 10 books to place on a shelf, how many possible ways are there to arrange them?
n 10! = 3628800 ways
PDF created with pdfFactory Pro trial version www.pdffactory.com
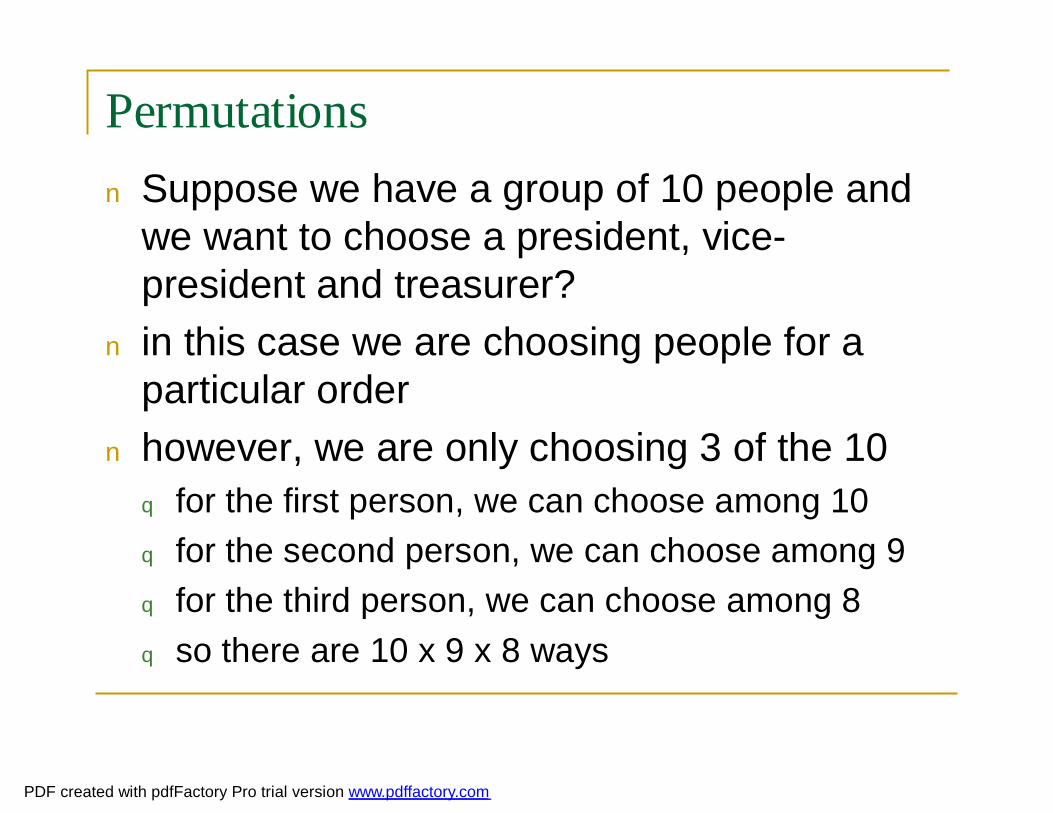
Permutationsn Suppose we have a group of 10 people and
we want to choose a president, vice-president and treasurer?
n in this case we are choosing people for a particular order
n however, we are only choosing 3 of the 10q for the first person, we can choose among 10q for the second person, we can choose among 9q for the third person, we can choose among 8q so there are 10 x 9 x 8 ways
PDF created with pdfFactory Pro trial version www.pdffactory.com

Permutation Notationn a permutation is an ordered arrangement of
objects selected from a setn written P(n,r) or sometimes nPr
n it is the number of possible permutations of r objects from a set of n objects
( )!!),(rn
nrnP−
=
PDF created with pdfFactory Pro trial version www.pdffactory.com

Choosing 3 people from 10…
n we get 720 possible arrangements
72089101234567
12345678910!7!10
)!310(!10)3,10(
=××=××××××
×××××××××
==−
=P
PDF created with pdfFactory Pro trial version www.pdffactory.com

Permutations When Some Objects Are Aliken suppose you are creating arrangements and
some objects are alike?n for example, the word ear has 6 or 3!
arrangements (aer, are, ear, era, rea, rae)n but the word eel has repeating letters and
only 3 arrangements (eel, ele, lee)n how do we calculate arrangements in these
cases?
PDF created with pdfFactory Pro trial version www.pdffactory.com

Permutations With Some Objects Alike
n to perform this calculation we divide the number of possible combinations by the combinations of objects that are similar
n n is the number of objects
n a, b, c are objects that occur more than once
!...!!!cba
nnsPermutatio
=
PDF created with pdfFactory Pro trial version www.pdffactory.com

So back to our problem
n combinations of the letters in the word eel
n what would be the possible arrangements of 8 socks if 3 were red, 2 were blue, 1 black, one white and one green?
312
123!2!3
=×
××=
336012123
12345678!2!3
!8
=××××
×××××××=
PDF created with pdfFactory Pro trial version www.pdffactory.com
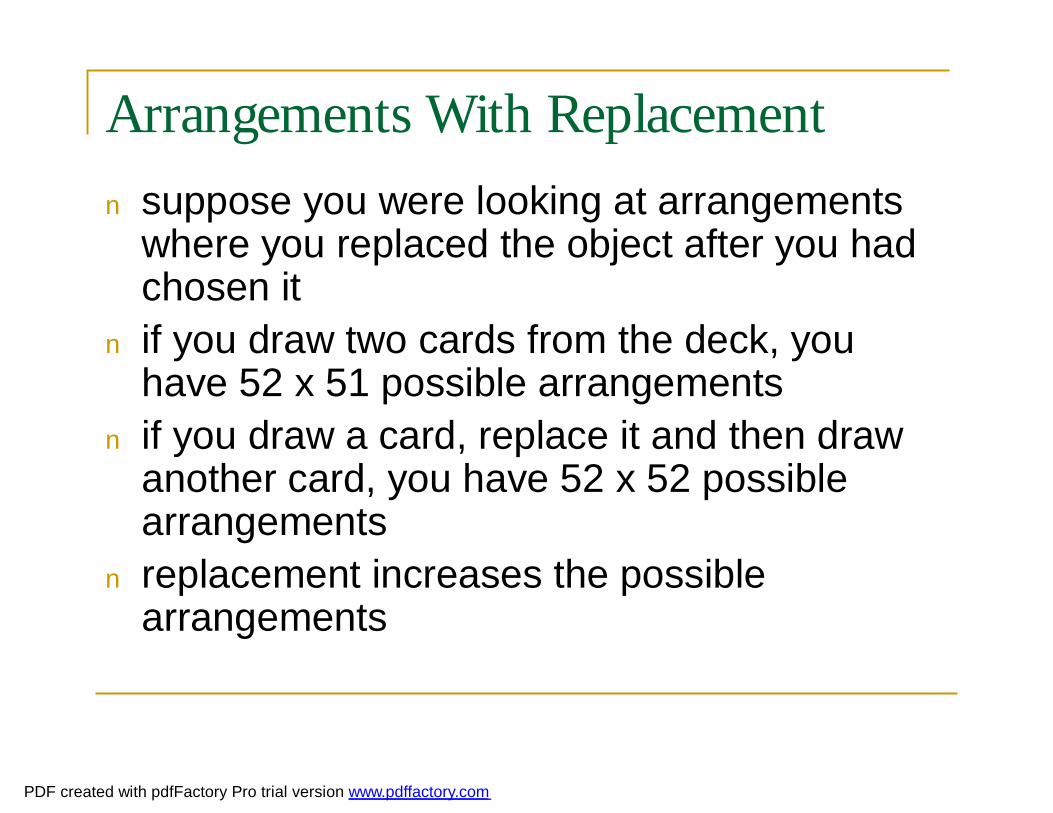
Arrangements With Replacementn suppose you were looking at arrangements
where you replaced the object after you had chosen it
n if you draw two cards from the deck, you have 52 x 51 possible arrangements
n if you draw a card, replace it and then draw another card, you have 52 x 52 possible arrangements
n replacement increases the possible arrangements
PDF created with pdfFactory Pro trial version www.pdffactory.com

Permutations and Probabilityn if you have 10 different colored socks in a
drawer, what is the probability of choosing a red, green and blue sock?
n probability is the number of possible outcomes you want divided by the total number of possible outcomes
n you need to divide the number of possible arrangements of red, green and blue socks by the total number of ways that 3 socks can be pulled from the drawer
PDF created with pdfFactory Pro trial version www.pdffactory.com
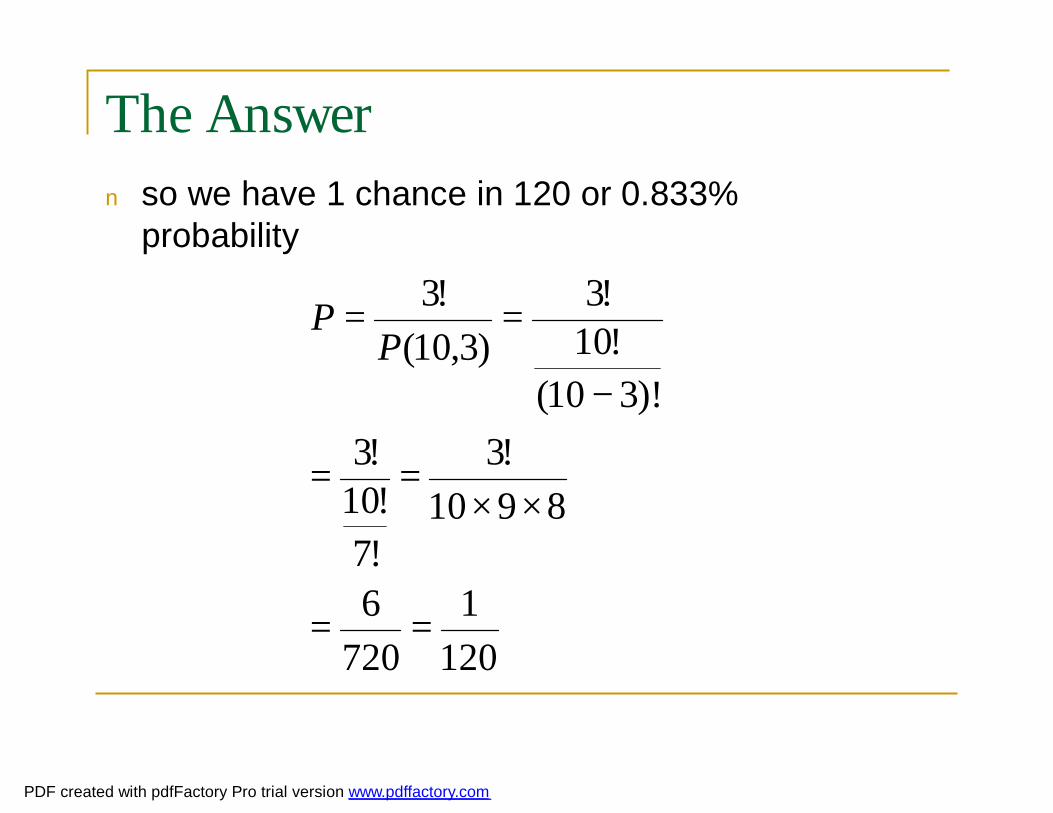
The Answern so we have 1 chance in 120 or 0.833%
probability
1201
7206
8910!3
!7!10!3
)!310(!10!3
)3,10(!3
==
××==
−
==P
P
PDF created with pdfFactory Pro trial version www.pdffactory.com

Exercises
n Page 255 #1, 4, 5, 7, 11, 12
PDF created with pdfFactory Pro trial version www.pdffactory.com

Counting Techniques and Probability Strategies -Combinations
Chapter 4.7 – Introduction to Probability
PDF created with pdfFactory Pro trial version www.pdffactory.com
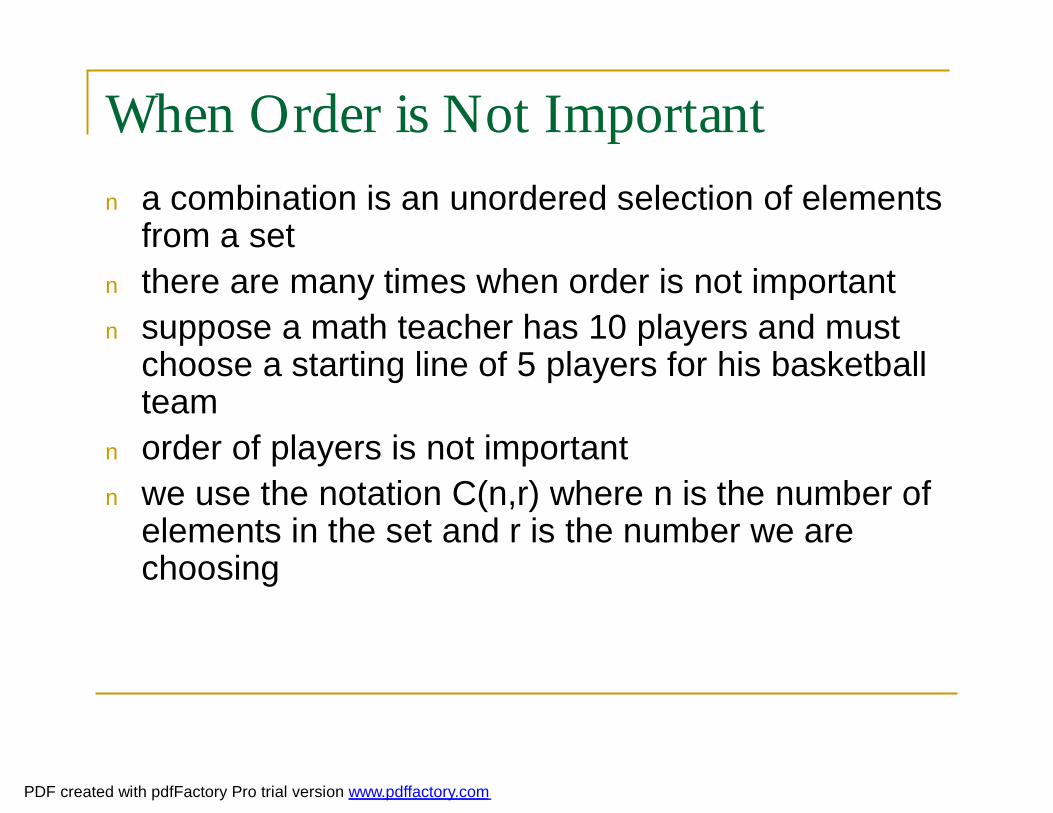
When Order is Not Importantn a combination is an unordered selection of elements
from a setn there are many times when order is not importantn suppose a math teacher has 10 players and must
choose a starting line of 5 players for his basketball team
n order of players is not importantn we use the notation C(n,r) where n is the number of
elements in the set and r is the number we are choosing
PDF created with pdfFactory Pro trial version www.pdffactory.com

Combinationsn a combination of 5 players from 10 is calculated
the following way, giving 252 ways for a math teacher to choose his starting lineup
252!5!5!10
!5)!510(!10
510
)5,10(
!)!(!),(
==
−=
=
−=
=
C
rrnn
rn
rnC
PDF created with pdfFactory Pro trial version www.pdffactory.com

An Example of a Restriction on a Combinationn suppose that one of basketball players is the
superintendent’s son, and so must be one of the 5 starting players
n here there are really only 4 choices from 9 players
n so the calculation is C(9,4) = 126n so now there are 126 possible combinations
for the starting lineup
PDF created with pdfFactory Pro trial version www.pdffactory.com
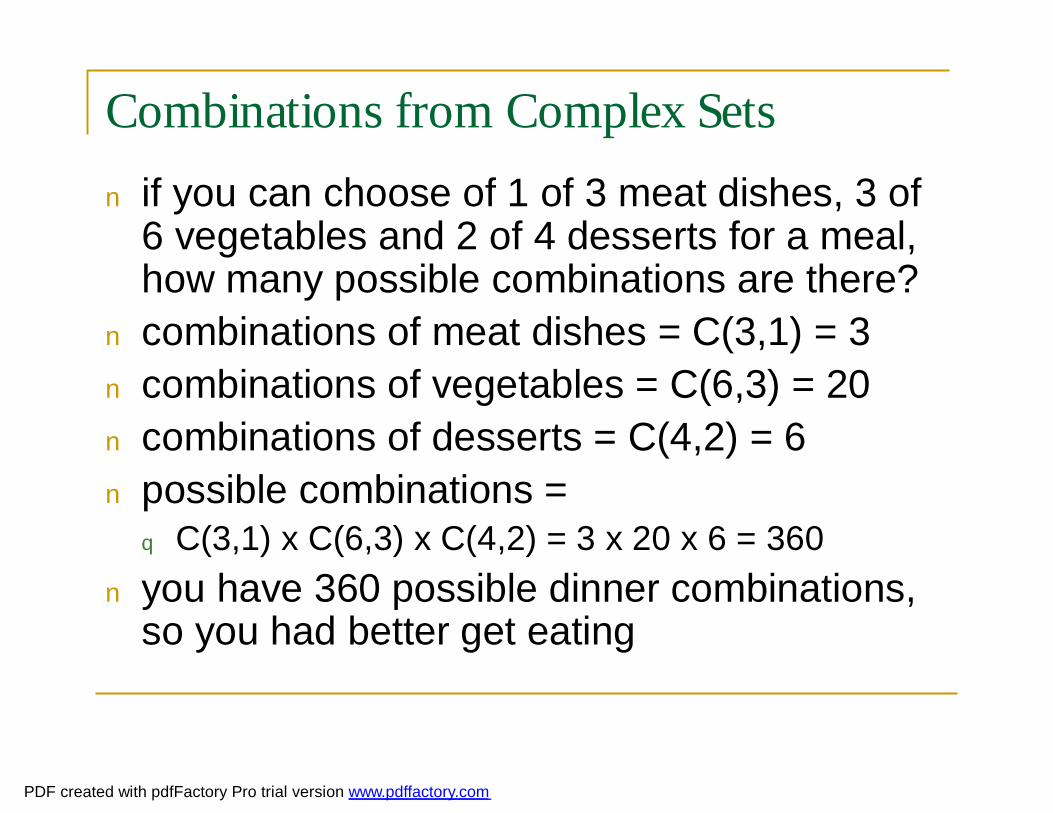
Combinations from Complex Setsn if you can choose of 1 of 3 meat dishes, 3 of
6 vegetables and 2 of 4 desserts for a meal, how many possible combinations are there?
n combinations of meat dishes = C(3,1) = 3n combinations of vegetables = C(6,3) = 20n combinations of desserts = C(4,2) = 6n possible combinations = q C(3,1) x C(6,3) x C(4,2) = 3 x 20 x 6 = 360
n you have 360 possible dinner combinations, so you had better get eating
PDF created with pdfFactory Pro trial version www.pdffactory.com

Calculating the Number of Combinationsn suppose you are playing coed volleyball, with
a team of 4 men and 5 womenn the rules state that you must have at least 3
women on the floor at all timesn how many combinations of team lineups are
there?n you need to take into account team
combinations with 3, 4, or 5 women
PDF created with pdfFactory Pro trial version www.pdffactory.com

Solution 1: Direct Reasoningn in direct reasoning, you determine the number of
possible combinations of suitable outcomes and add them
n find the combinations that have 3, 4 and 5 women and add them
74430401456104
55
14
45
24
35
34
=++=×+×+×=
+
+
=
PDF created with pdfFactory Pro trial version www.pdffactory.com

Solution 2: Indirect Reasoningn in indirect reasoning,
you determine the total possible combinations of outcomes and subtract unsuitable combinations
n find the total combinations and subtract those with 0, 1, or 2 women 741084
1018425
44
69
=−=×−=
−
=
PDF created with pdfFactory Pro trial version www.pdffactory.com

Finding Probabilities Using Combinations
n what is the probability of drawing 10-J-Q-K-A from the same suit in a deck of cards?
n there are C(52,5) ways to draw 5 cardsn there are 4 ways to draw this type of straightn P = 4 / C(52,5) = 1/649740n you will likely need to play a lot of poker to
get one of these hands
PDF created with pdfFactory Pro trial version www.pdffactory.com
Finding Probability Using Combinations
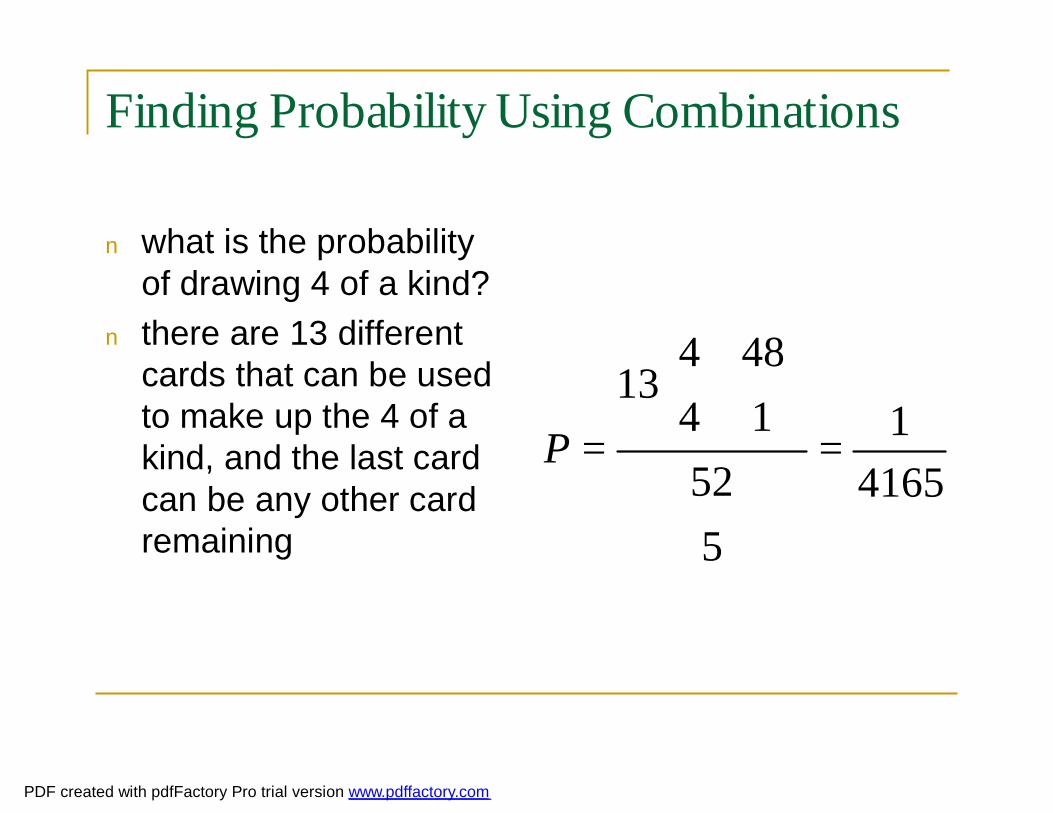
n what is the probability of drawing 4 of a kind?
n there are 13 different cards that can be used to make up the 4 of a kind, and the last card can be any other card remaining
41651
552
148
44
13=
=P
PDF created with pdfFactory Pro trial version www.pdffactory.com
Probability and Oddsn these two terms have different uses in mathn probability involves comparing the number of
favorable outcomes with the total number of possible outcomes
n if you have 5 green socks and 8 blue socks in a drawer the probability of drawing a green sock is 5/13
n odds compare the number of favorable outcomes with the number of unfavorable
n with 5 green and 8 blue socks, the odds of drawing a green sock is 5 to 8 (or 5:8)
PDF created with pdfFactory Pro trial version www.pdffactory.com

Exercises
n Page 262 # 3, 5, 7, 9, 13, 14
PDF created with pdfFactory Pro trial version www.pdffactory.com
References
n Wikipedia (2004). Online Encyclopedia. Retrieved September 1, 2004 from http://en.wikipedia.org/wiki/Main_Page
PDF created with pdfFactory Pro trial version www.pdffactory.com
Related Documents