Financing Green Urban Infrastructure OECD Regional Development Working Papers 2012/10 Merk, O., Saussier, S., Staropoli, C., Slack, E., Kim, J-H (2012), ―Financing Green Urban Infrastructure‖, OECD Regional Development Working Papers 2012/10, OECD Publishing; http://dc.doi.org/10.1787/5k92p0c6j6r0-en

Welcome message from author
This document is posted to help you gain knowledge. Please leave a comment to let me know what you think about it! Share it to your friends and learn new things together.
Transcript

Financing Green Urban Infrastructure
OECD Regional Development
Working Papers 2012/10
Merk, O., Saussier, S., Staropoli, C., Slack, E., Kim, J-H
(2012), ―Financing Green Urban Infrastructure‖, OECD
Regional Development Working Papers 2012/10, OECD
Publishing; http://dc.doi.org/10.1787/5k92p0c6j6r0-en

2
ABSTRACT
This paper presents an overview of practices and challenges related to financing green sustainable
cities. Cities are essential actors in stimulating green infrastructure; and urban finance is one of the
promising ways in which this can be achieved. Cities are key investors in infrastructure with green
potential, such as buildings, transport, water and waste. Their main revenue sources, such as property
taxes, transport fees and other charges, are based on these same sectors; cities thus have great potential
to ―green‖ their financial instruments. At the same time, increased public constraints call for a
mobilisation of new sources of finance and partnerships with the private sector. This working paper
analyses several of these sources: public-private partnerships, tax-increment financing, development
charges, value-capture taxes, loans, bonds and carbon finance. The challenge in mobilising these
instruments is to design them in a green way, while building capacity to engage in real co-operative
and flexible arrangements with the private sector.
Keywords: infrastructure finance, urban infrastructure, urban development, urban finance,
private finance, public-private partnerships, green growth
3
FOREWORD
This paper was produced in co-operation with la Fabrique de la Cité/ The City Factory (VINCI)
and was approved by the 14th session of the OECD Working Party on Urban Areas, 6 December
2011.
The report has been produced and co-ordinated by Olaf Merk, under responsibility of Lamia
Kamal-Chaoui (Head of OECD Urban Unit) and Joaquim Oliveira Martins (Head of OECD Regional
Development Policy Division). The report has benefitted from contributions from Remi Dorval (La
Fabrique de la Cité), Stéphane Saussier (IAE – Sorbonne Business School), Carine Staropoli
(University Paris I Sorbonne), Enid Slack (Munk School of Global Affairs, University of Toronto),
Jay-Hyung Kim (Public and Private Infrastructure Investment Management Center, Korea
Development Institute), and Adeline Pelletier (Consultant, OECD). Valuable comments during the
drafting of the report were provided by Chris Kennedy, Jan Corfee-Morlot, Heidi Smith and Tadashi
Matsumoto (OECD). Caitlin Connelly edited the report.
The authors are grateful to Mr. Remi Dorval, President of La Fabrique de la Cité for his support
and interest in OECD activities on Green Cities.
Please address further enquiries about this work to Olaf Merk ([email protected])

4
TABLE OF CONTENTS
FOREWORD ................................................................................................................................ 3
EXECUTIVE SUMMARY ........................................................................................................... 7
POLICY RECOMMENDATIONS ............................................................................................... 8
INTRODUCTION ....................................................................................................................... 10
1. URBAN FINANCE AND GREEN INFRASTRUCTURE .................................................... 12
1.1. Green investments by cities .............................................................................................. 12 1.2. Revenues and green cities; getting the incentives right .................................................... 20 1.3. Revenue and green cities: the case of the property tax ..................................................... 25
2. PRIVATE FINANCE AND GREEN URBAN INFRASTRUCTURE ................................... 28
2.1 Conditions for private finance ........................................................................................... 28 2.2 Involving the private sector through Public-Private Partnerships (PPPs).......................... 29 2.3 Stimulating private investment: the case of Tax Increment Financing (TIF) .................... 36 2.4 Making the developer pay: development charges and value capture................................. 38 2.5 Loans, bonds and carbon finance ....................................................................................... 42
ANNEX 1: THE PROMISES AND PITFALLS OF PUBLIC-PRIVATE PARTNERSHIPS .. 45
BIBLIOGRAPHY ....................................................................................................................... 55
NOTES ........................................................................................................................................ 64

5
LIST OF ABBREVIATIONS
ADB Asian Development Bank
BAB Build America Bonds
BC British Columbia
BRIICS Brazil, Russia, India, Indonesia, China and South Africa
CEPAC Special Additional Potential Construction Certificates (Certificados de Potencial
Adicional de Construção)
CDM Clean Development Mechanism
CREB Clean Energy Renewable Bonds
BID business improvement district
EIB European Investment Bank
EUR euro
FAR floor area ratio
FSI floor space index
GDP gross domestic product
GHG greenhouse gas
GTA Greater Toronto Area
IEA International Energy Agency
JI Joint Implementation
ICGF infrastructure credit guarantee fund
LCOE levelised cost of energy
MSA Metropolitan Statistical Areas
MWh megawatt
NAO UK National Audit Office
OECD Organisation for Economic Co-operation and Development
PACE Property Assessed Clean Energy Bonds
PPP public-private partnership

6
QUECB Qualified Energy Conservation Bonds
TIF tax increment financing
TMAP Transport Management and Accessibility Plan
UK United Kingdom
UNFCCC United Nations Framework Convention on Climate Change
US United States
USD United States dollars
WEF World Economic Forum

7
EXECUTIVE SUMMARY
Cities play a critical role in planning and investing in urban infrastructure. In many cases, local
governments have authority over the selection of infrastructure projects made at the municipal level.
Therefore, they exercise influence over the nature of infrastructure renewal and expansion, and have
the ability to promote greener and more sustainable urban centres. Their leadership role extends to the
kinds of investment mechanism selected to finance, for example, improvements in the transportation,
building, waste and water and, to a lesser extent, energy sector. Because cities have revenue sources
that are tied to many aspects of these sectors, their design can stimulate or dissuade the development
of greener and more sustainable cities.
The greening of municipal financial instruments, such as congestion charges, variable parking
fees, toll lanes and split-rate property taxes, is an important first step toward achieving greener urban
infrastructure. Public sector financing, however, may not be sufficient to stimulate a paradigm shift.
Therefore, the second critical step is to mobilise private sector investments to fill funding gaps for
many urban green infrastructure projects. There are certain conditions that need to be put in place in
order to attract and capture private sector investments. The three main conditions are (1) markets for
green urban investment projects, (2) good return on investment and (3) limited risk. Cities and
countries differ with respect to these conditions; as such, some of these instruments could be more
appropriate for cities in industrialised and medium income countries than lower income developing
countries, for which grants, loans and other development finance instruments could be more relevant.
There are several existing financial instruments that cities have applied in order to attract private
finance for urban green infrastructure:
Private sector involvement in urban green infrastructure can take the form of public-private
partnerships (PPPs), in which the long-term risk is transferred to the private sector.
Through an alternative instrument, tax increment financing, future tax revenues are used to
attract private finance.
Real estate developers may also pay for the infrastructure that is needed to connect their new
development to existing infrastructure in the form of development charges (impact fees)
and value capture (taxes that capture the value increases of real estate due to new
infrastructure development nearby).
Finally, loans, bonds and carbon finance are instruments used to attract private finance in
well-functioning capital markets.

8
POLICY RECOMMENDATIONS1
Policy alignment across levels of government
1. National policies are key. The greener the national framework, the easier it will be to address
city-specific challenges and to ensure coherence and consistency between national and local
policies. The national framework is particularly important with respect to pricing signals for
non-localised environmental externalities, such as GHG emissions. Moreover, in many
countries, reform of urban revenue sources requires central government action.
2. Remove barriers to local government action. While national governments may face
challenges to immediately implementing holistic reforms, they can start by eliminating
current regulations that impair the potential for local governments to act.
3. A holistic approach is necessary. Efforts to green urban revenue sources may have
undesirable distributional consequences. These concerns should be addressed in the context
of the entire tax and benefit system, rather than trying to ensure that each individual policy
measure serves both environmental and equity objectives.
4. Keep the policy package simple. While the design of specific instruments will in many cases
need to be quite sophisticated, it is important to keep the overall policy package as simple as
possible. An overly complex system of environmental taxes, charges and fees makes impact
assessment harder and raises the risk of unintended interaction effects or perverse incentives.
Making existing revenue sources greener
5. The overriding aim is to internalise externalities. To the extent possible, taxes, charges and
fees should be designed to confront agents with the full marginal social cost of actions
affecting the environment. At a minimum, this means eliminating the anti-green bias of some
existing local tax provisions and the perverse incentives created by many environmentally
harmful subsidies.
6. Road-pricing policies can help reduce traffic and pollution. Road-pricing policies like
congestion charges are likely to be most effective at reducing traffic and emissions when
differentiated according to the level of congestion, peak hours or both. Linking pricing
structures to vehicle type as well may strengthen incentives to switch to greener forms of
transport.
7. Transport-related revenue sources require coherent planning. The use of congestion charges
to achieve green objectives will be more effective and less costly to users when alternative
mobility solutions are available; governments might consider earmarking such revenues to
finance public transportation.
8. Fees for water and waste services should be more responsive to actual resource use. Fees
and prices should be used to signal the scarcity of the resources being consumed, as well as
covering the costs of infrastructure investment and service provision.
9. Where appropriate, intergovernmental grants should take into account environmental
objectives. This will help compensate cities for the opportunity costs of green behaviour

9
(e.g., the loss of development charges if an area is designated as a public park). Specific or
matching grants can compensate local governments for the spillovers generated by green
policies that incur localised costs but generate broad benefits.
Tapping new sources of finance
10. Carbon finance should be more accessible to cities. Cities and central governments can work
together to make better use of carbon-offsetting programmes (e.g., the Clean Development
Mechanism and Joint Implementation) and to ensure that these (and other) resources may
come directly to cities. One of the conditions of carbon finance should be use of a
harmonised emission inventory for cities.
11. Infrastructure needs related to new development should be internalised in the financing of
development projects. The costs of sprawl, for example, may be recovered from developers
through development charges or other financial contributions. In a similar fashion, new
developments should also, where appropriate, incorporate the cost of investment in
alternative water sources.
12. National-local co-operation is essential to developing access to new forms of green finance.
There are a number of potential instruments for tapping private finance in support of urban
greening and aligning private investment with policy priorities. These include private-public
partnerships, green bonds and green infrastructure banks. However, they each raise potential
problems of insufficient size, moral hazard and opportunism. Cities thus need to co-operate
with one another and with central governments to build capacity and ensure that they possess
the requisite financial, technical and legal expertise, as well as sufficient bargaining power
when negotiating private-sector financing.

10
INTRODUCTION
Cities are central to greening urban infrastructure. They occupy 2% of the world’s landmass but
are responsible for more than two-thirds of global energy use and greenhouse gas emissions
(IEA, 2008). A majority of the world’s population lives in cities; this majority is expected to reach
two-thirds by 2050. Within the next decade, there will be nearly 500 cities of more than a million
people, including several ―megacities‖ with population exceeding 20 million (OECD, 2011).
Furthermore, the decentralisation of government in many countries has put most of the operational
decision making in the hands of the cities rather than at the national level. Thus, cities are key engines
for economic growth but also a major contributor to global warming and environmental problems.
The transition to green cities is an essential process that will require overcoming many
challenges, particularly with regard to technology, governance and financing. The deployment of
technology and capacity compatible with the goals calls for investments that are, in certain respects,
unusual in terms of three key properties:
Size: Whether the aim is to improve the energy performance of the built environment, organise
carbon-free urban mobility, adapt existing networks or ensure waste collection and treatment, the
entire existing infrastructure stock will have to be renovated, modified and modernised. Greening
cities therefore concerns not only new infrastructure relating to the development of cities, but also the
transformation of existing infrastructure. In addition, efforts will need to be made to finance the
necessary technological innovations. Cities will require high levels of investment in the years to come
in order to finance these changes — investment levels that will exceed business-as-usual infrastructure
maintenance.
Concentration over time: The benefits of greening urban infrastructure extend beyond local and
national borders to issues, such as climate change, being fought at the international level. Greening
cities helps to mitigate and adapt to the pressing challenges presented by climate change. The
additional investments required will therefore be concentrated over a relatively short period of time,
making it harder to resolve the issue of financing these investments.
Nature: An important outcome (or result) of green initiatives is their positive long-term
environmental impact on cities. The corresponding conditions for investment require the development
of innovative financing mechanisms that are resilient to the three main characteristics of green
projects.
They generate positive externalities and are often justified through a collective social benefit
that cannot be readily quantified in economic terms. Infrastructure aimed at reducing
greenhouse gases exemplifies this characteristic.
They produce effects over the very long term, which makes it hard to advance conventional
economic arguments regarding the financing of investments.

11
They carry a high degree of risk, especially related to uncertainty of the regulatory and
economic environment (energy prices, cost of carbon dioxide, etc.).
Securing financing for green initiatives requires innovative solutions that combine both public
and private funds because public funds alone are inadequate in the current fiscal environment.
Leveraging global investment through the use of private financing makes sense and is possible,
provided that reasonable conditions of profitability, risk and timeframes can be ensured. Numerous
studies, conducted to identify strategies to secure sufficient financing, led to the following findings:
There could be an array of investments for green cities; each type of investment must
generate its own business model that can provide a basis for a financing method.
The identification and valuation of externalities through public policy informs the
investment mobilisation and selection process resulting in better matches between
financing choice and project.
Joint public-private approaches work when they are based on a precise analysis of the
value created by the investment, its positioning (public or private sphere), its long-term
nature and the capacity of different players to understand it. Risk analysis and effective
sharing of this risk must also be taken into consideration.
The decision-making environment is rapidly evolving; this creates uncertainty, but also
opportunity for new sources of investment related to behavioural change (i.e. socially
responsible investments).

12
1. URBAN FINANCE AND GREEN INFRASTRUCTURE
Urban finance has a potentially large role to play in greening infrastructure. Cities invest in both
green infrastructure (i.e. infrastructure developed to serve an environmentally beneficial function, such
as environmental protection) and ―greenable‖ infrastructure (i.e. existing infrastructure, like
transportation, that can be improved to reduce its environmental impact). Moreover, cities have
revenue sources that are tied to many of these infrastructure-related sectors, such as building and
transport. The design of these revenue sources, especially property taxation, can stimulate or
discourage green cities. The following sections – addressing cities’ ―greenable‖ infrastructure
investments, green urban revenue sources and financial incentives for greening the urban property tax
– will elaborate on this concept.
1.1. “Greenable” infrastructure investments by cities
Cities are key investors in infrastructure. Urban areas in 20 European OECD countries invested
approximately USD 59 billion in 2010 in the transport, housing and environmental protection sectors.
In most cities, transportation infrastructure accounts for the greatest share of urban capital spending; in
others, such as France, housing infrastructure dominates this pool (Figure 1). However, maintenance
and operational spending is not taken into account in these calculations; in reality, cities will thus
spend more on green infrastructure than indicated here.
Figure 1. Gross capital formation (bn USD) in urban areas in European OECD-countries, 2010
Source: Author’s own calculation based on OECD National Account Statistics Database and OECD Regional Database. Note: The columns refer to the functional classification of spending in national accounts: economic affairs, housing and community amenities and environmental protection. Transportation spending is included in the economic affairs category; the gross capital formation for this is considered to be transportation-related, as the other economic affairs spending (salaries, subsidies, etc.) do not relate to capital. Gross capital formation by local governments is corrected for the share of local government population that is living in predominantly urban areas in that country, in order to derive gross capital formation by cities. For Ireland, Poland and Sweden data for 2009 are used.

13
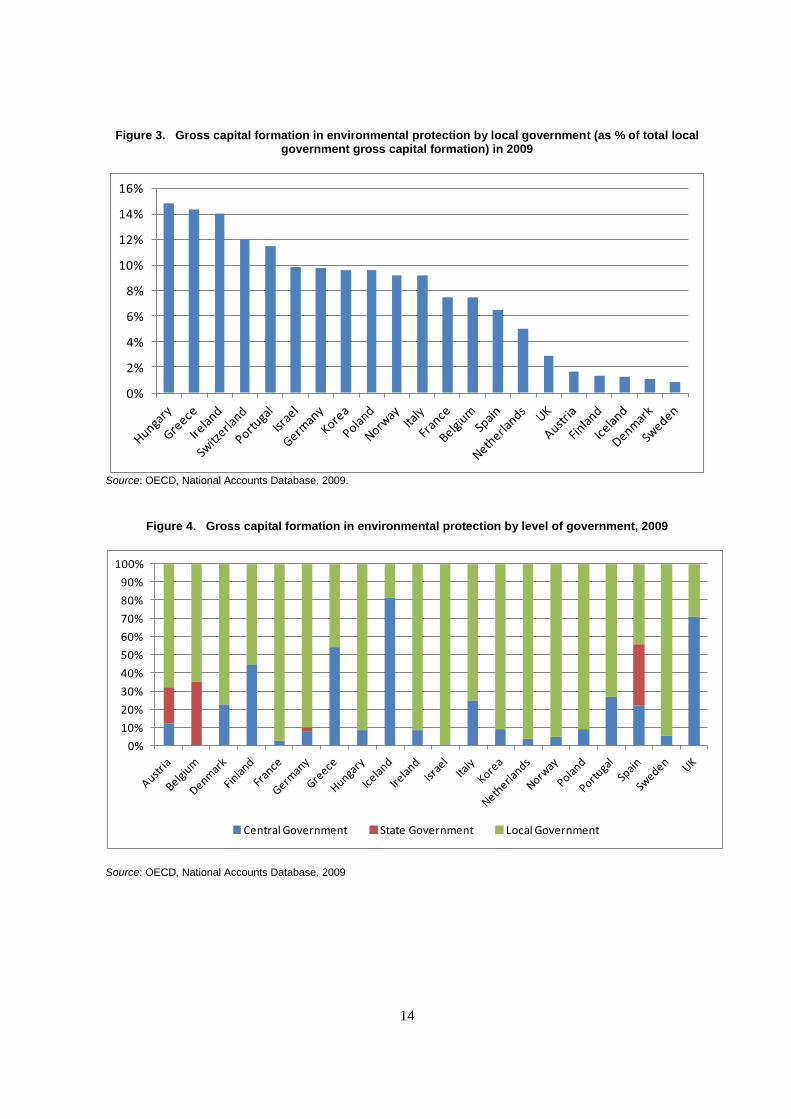
Local governments spend an average of about 8% of their capital budget on environmental
protection. However, this is generally not the main source of local governments’ spending; gross
capital formation by local government in OECD countries is mainly channelled to economic affairs,
education, housing and general public services (Figure 2). In 2009, capital expenditure in
environmental protection represented, on average, 7.6% of total local government gross capital
formation, with large disparities among countries ranging from below 2% (e.g. Iceland, Denmark and
Sweden) to almost 15% (e.g. Hungary and Greece) (Figure 3). While in some European countries (e.g.
France, Netherlands, Norway and Sweden), capital expenditure in environmental protection is incurred
almost entirely by the local government, in other countries (e.g. United Kingdom and Iceland), local
government represents less than a third of total government expenditures in this sector (Figure 4). In
decentralised countries, such as Spain or Belgium, regional government expenditures in environmental
protection accounts for nearly a third of total environmental expenditure. On average, capital
expenditure in environmental protection by local government represents 75% of total government
expenditure in environment. Among main OECD member countries, France, Italy, Spain and Germany
top the ranking of total gross capital formation in environmental protection by either local or general
government (Figures 5 and 6).
Figure 2. Local government gross capital formation by function
0%
10%
20%
30%
40%
50%
60%
70%
80%
90%
100%
Au
stri
a
Be
lgiu
m
De
nm
ark
Fin
lan
d
Fran
ce
Ge
rman
y
Gre
ece
Hu
nga
ry
Ice
lan
d
Ire
lan
d
Isra
el
Ital
y
Ko
rea
Ne
the
rlan
ds
No
rway
Po
lan
d
Po
rtu
gal
Spai
n
Swe
de
n
Swit
zerl
and
UK
Economic affairs General public services
Education Housing and community amenities
Defence Public order and safety
Environment protection Health
Recreation; culture and religion Social protection
Source: OECD, National Accounts Database, 2009, http://www.oecd-ilibrary.org/economics/data/oecd-national-accounts-statistics_na-data-en
14
Figure 3. Gross capital formation in environmental protection by local government (as % of total local government gross capital formation) in 2009
0%
2%
4%
6%
8%
10%
12%
14%
16%
Source: OECD, National Accounts Database, 2009.
Figure 4. Gross capital formation in environmental protection by level of government, 2009
0%
10%
20%
30%
40%
50%
60%
70%
80%
90%
100%
Central Government State Government Local Government
Source: OECD, National Accounts Database, 2009

15
Figure 5. General government gross capital formation in environmental protection in USD (current prices, millions in 2009)
0
1000
2000
3000
4000
5000
6000
Source: OECD, National Accounts Database, 2009.
Figure 6. Local gross capital formation in environmental protection in USD (current prices, million in 2009)
0
500
1000
1500
2000
2500
3000
3500
4000
4500
5000
Source: OECD, National Accounts Database, 2009.
Urban spending in sectors with green potential represent between 10% and 45% of total urban
expenditures (Figure 7). This means that cities have a relatively large margin of manoeuvring for
greening these sectors (transport, building, water, waste and other environmental services). The
margin is particularly high in Canadian cities like Montreal and Toronto, where they represent 44% of

16
total city current and capital expenditures, mainly due to large shares in transport spending. These
expenditures can stimulate green growth through employment opportunities: in the short term, during
the construction phase of the infrastructure, and in the medium/long term, in maintenance or transport.
The building sector can also represent important opportunities for green growth through employment
in construction, development of markets for green building products, etc. Green growth projects in the
building sector could also promote equity by improving housing conditions for low-income
households. Box 1 presents concrete examples of budget items connected to transportation and
building. Green spaces, parks management, environmental services, streets and sanitation, power and
environmental protection – grouped together as ―other environment‖ (Figures 7 and 8) – can also
present green growth opportunities generally related to regular maintenance of green spaces or streets.
Figure 7. Expenditure shares of major cities by function, 2010
0%
10%
20%
30%
40%
50%
60%
70%
80%
90%
100%
Building Transport Water Waste Other environment Other
Source: Based on financial statements of cities on their respective websites, in 2010, except (*), 2009.

17
Figure 8. Expenditure shares in green growth sectors, 2010
0%
10%
20%
30%
40%
50%
60%
70%
80%
90%
100%
Building Transport Water Waste Other environment
Source: City Council Financial Statements, in 2010, except (*), 2009.
Box 1. Transport- and building-related green activities in cities' budgets
Transport accounts for a large part of expenditures in sectors with green potential, and is generally related to transport planning and investment in transport infrastructure. For example:
San Francisco is planning to build a multi-modal hub in the city’s core; this Transbay Transit Center will provide expanded bus service to and from surrounding counties. The city also plans to expand the subway system to help reduce car use and ultimately greenhouse gas emissions.
In Sydney, transport projects include a 200km bicycle network designed to reduce overall congestion and increase the number of people choosing cycling as a safe, sustainable and healthier transport option. The city has allocated more than USD 70 million over four years to build this bicycle network. Sydney has also initiated plans to enhance access by public transport through regional and city programmes, such as the Green Square Transport Management and Accessibility Plan (TMAP) to reduce car ownership and reliance and improve accessibility by non-car travel mode in Green Square.
Similarly, in Paris, expenditures in transport, amounting to EUR 257 million in 2010, were used to expand the subway system to the periphery and to improve the bicycle track network.
Building-related green activities include the following examples in the different city budgets:
Sydney’s major programme, “Retrofit of City of Sydney Portfolio” (to be completed in December 2012), aims to install metering and energy savings devices in all city of Sydney properties, to replace inefficient plant and equipment and to incorporate new technologies to improve environmental performance.
Toronto’s Tower Renewal Project is designed to drive broad environmental, social, economic and cultural change by improving the city’s concrete apartment towers and the neighbourhoods that surround them.
The City of London spent GBP 1.26 million in 2010 for its housing programme, created to improve homes and transform neighbourhoods by improving design quality, greening homes, promoting mixed communities and tackling empty homes.

18
Significant global funding needs
Investing in green urban infrastructure is challenged by current global fiscal constraints.
Resources are scarce, and public authorities in all levels of government must do more with less. This
decrease in public investment flows hits sub-national governments – historically responsible for two-
thirds of public investment across the OECD – especially hard. Some fiscal stimulus packages (e.g. in
the US and South Korea) incorporated urban green growth initiatives, providing more room for public
investment in the short term. Since 2010, however, most OECD countries have attempted to curb
public debt by reducing public expenditure. As a result, many cities around the world have been faced
with local budget cuts due to reduced intergovernmental transfers and lower tax bases.
At the same time, global infrastructure needs are huge. According to OECD (2007), improving
the world’s infrastructure will require an estimated USD 35-40 trillion – i.e. USD 2 trillion dollars per
year, or 2.5% of global GDP. Major sectors that need increased investment include road, rails,
telecoms, electricity and water (water requires the largest investment of USD 16 trillion). Consistent
with these projections, the International Energy Agency (IEA) estimates that meeting global
population growth, especially for the BRIICS countries (Brazil, Russia, China, India, Indonesia and
South Africa), requires an average investment of USD 48 billion per year until 2030 into the energy
sector alone (IEA, 2011). IEA (2010) also estimates that a USD 46 trillion increase in global energy
investment between 2010 and 2050 is needed to deliver low-carbon energy systems that yield
cumulative fuel savings equal to USD 112 trillion. A considerable share of this investment is required
in cities.
The urban infrastructure deficit in developing countries is particularly acute. A high proportion of
the urban population in Africa and Asia, and a significant proportion in Latin America and the
Caribbean, live in homes and settlements with little or no infrastructure (i.e. no all-weather roads, no
drains, no piped water supplies and no provision for electricity). Most urban centres in developing
countries, including many with several million inhabitants, also lack sewers. Removing the housing
and infrastructure deficit in developing countries by 2030 would cost an estimated USD 6.3 trillion,
including USD 700 billion for expanding housing and infrastructure for growing urban populations
(Parry et al., 2009).
Greening urban systems is expensive and requires shifting of investments. Preliminary estimates
of C40 (Cities Climate Leadership Group) city greenhouse gas emissions suggest (Hoornweg et al.,
2011) that the total capital costs of infrastructure investments required to mitigate the group’s
emissions, status quo (i.e. without population growth), would be approximately USD 3 trillion. These
investments, which include private sector government contributions, may take several years to realise.
Individual calculations per city confirm the extent of these costs: London has estimated that meeting
the Mayor’s target to reduce carbon dioxide emissions by 60% by 2025 will cost about
GBP 40 billion; and the Mayor’s existing climate change mitigation programme is projected to cost
about GBP 14 billion by 2025 (KPMG,, 2011). In addition, overviews of realised capital costs of
urban green projects provide a more detailed presentation of costs associated with green cities (Table
1).

19
Table 1. Capital costs of selected green projects in OECD cities
Project City Capital costs (USD million)
Annual GHG savings
(ktCO2e)
Transportation
Bus rapid transit Vancouver 39.2 1.8
Congestion charging London 244 120
Bike sharing Paris 132 18
Buildings
Solar air heating Montreal 1.96 1.34 Energy
Solar centre receiver station Seville 41 110
Urban wind power Toronto 1.21 0.38
Solid Waste
Source-separation and methane production
Sydney 75 0.36
Incineration-based CHP Gothenburg 453 205 Water/Wastewater
Biogass from sewage Stockholm 15 14 Source: Kennedy, C. et al. (2010), “Getting to Carbon Neutral: A Review of Best Practices in Infrastructure Strategy”, in Bose, B. K. (ed.), Energy Efficient Cities: Assessment Tools and Benchmarking Practices, World Bank, Washington DC, pp. 171-172.
Funding climate change adaptation in cities will require significant investment as well. Damages,
especially to infrastructure, caused by climate change-related disasters are likely to pose increased
costs for cities. Global climate change adaptation costs vary, but alone are estimated to be between
USD 49 billion and 171 billion per year until 2030 (UNFCC, 2007), i.e. one or several hundred billion
dollars a year (International Strategy for Disaster Response, 2009); cities will need to bear a large
share of this cost.
Investment of this scale calls for a new focus on green funding and innovative solutions. Green
infrastructure for cities requires upfront investments that may show benefits only in the long run and
incur risks related to uncertainty over regulatory, economic and technological developments (e.g.
energy prices and the cost of carbon dioxide emissions). Furthermore, these investments are
constrained by limited size of urban projects and capacity at the urban level, as well as transaction
costs of mobilising private finance. The inclination of cities and investors to focus on short-term
priorities and concerns presents the key challenge: to develop viable business cases for investment in
green urban infrastructure. A range of instruments can help to achieve this goal through green urban
finance and innovative finance solutions (Table 2). A green focus on urban finance could mean
property taxes that stimulate density, transportation fees that reduce car traffic, and fees that stimulate
responsible water consumption. Public finance can also be used to leverage finance from private actors
through loans, bonds and carbon markets; to create incentives for them to invest in sustainable
infrastructure related to new development; and to get them involved in partnerships so government can
benefit from private sector knowledge and experience in greening infrastructure.

20
Table 2. Main financial instruments in the main green urban sectors
Transportation Buildings Water /Waste Energy
Taxes Property tax
Fees and charges
Congestion charges Parking fees High Occupancy Toll lanes
Building permits Tariffs and fees Electricity user fees
Grants General grants with environmental indicators, specific grants for environmental goods and services, matching grants
PPPs Concessions and Private Finance Initiatives (PFIs), energy performance contracts
Land-based income
Development charges/impact fees Value capture tax Higher density building rights Tax increment financing
Loans and bonds
Loans and green bonds
Carbon finance Clean Development Mechanism/Joint Implementation, voluntary carbon offsets Source: Authors’ own elaboration
1.2. Revenues and green cities: Getting the incentives right
City and local government revenue sources are usually classified according to revenue types: tax
revenues, fees and charges and intergovernmental grants. To assess the potential green impacts of
these sources they further classified according to where their revenue base originates (i.e.
transportation, building sector or other sectors).
Revenues from building and transport – the main source of urban revenues (Figure 9) – are
mostly derived from transportation fees and charges (e.g. parking fees) and property taxes (see Section
1.3), or in the case of Montreal and Melbourne, from state grants. In Sydney, user charges and fees
represent 17% of total revenues, of which 40% comes from parking meter income and 11% from
parking station income. Other sources of revenues include taxes for waste management, representing
12% of total revenues from taxes for the City of Paris, and charges for water services, representing
between 4% and 7% of total revenues in US cities such as Los Angeles, San Francisco and Chicago.

21
Figure 9. Revenues of cities by function, in %, 2010
0%
10%
20%
30%
40%
50%
60%
70%
80%
90%
100%
Building Transport Water Waste Other environment Other
Source: City Council Financial Statements, 2010; except (*): City Council Financial Statements, 2009 as found on the different cities’ websites.
Urban revenue sources can either help or hinder green policy priorities. Fiscal policies –
operating within and across levels of government – should be reconsidered to identify unintended
consequences to green growth and sustainable development (see Corfee-Morlot, et al., 2012). At a
minimum, this means eliminating the anti-green bias of some existing local tax provisions and the
perverse incentives created by many environmentally harmful subsidies. Three broad principles are
key to identifying an appropriate mix of green revenue reforms:
Policy coherence across levels of government is critical. Reforms to urban revenue sources
need to be designed considering the broader policy framework. The greener the national
framework, the easier it will be to address city-specific challenges and to ensure coherence
and consistency between national and local policies. At times, national-level initiatives may
obviate the need for local action; in other cases, they may create new opportunities for cities to
act. Furthermore, if co-ordination is poor, national and local initiatives can hinder each other’s
effectiveness. The national framework is particularly important for establishing price signals
for non-localised environmental externalities, such as greenhouse gas emissions.
A holistic approach is necessary. Efforts to green urban revenue sources may have
undesirable distributional consequences. These concerns should be addressed in the context of
the entire tax and benefit system, rather than trying to ensure that each individual policy
measure serves both environmental and equity objectives. Thus, changes to transfers or non-
environmental taxes and charges may be needed to offset the distributional impact of reforms
seeking to green some revenue sources.

22
The instruments should be sophisticated but the package should be simple. The design of
specific instruments will in many cases need to be quite sophisticated in order to avoid
creating perverse incentives. Congestion charges, for example, will likely be more effective if
they vary according to vehicle type, peak hours, etc. Nevertheless, it is important to keep the
overall policy package as simple as possible. An overly complex system of environmental
taxes, charges and fees makes impact assessment more difficult and raises the risk of
unintended interaction effects or perverse incentives.
Property taxes and development fees
Property taxes should be designed to limit urban sprawl. Throughout the OECD, local
governments earn the most revenue from property taxes. The impact of these taxes on land use,
density and urban sprawl depends on policy choices: what is included and excluded from the tax base,
how property value is defined for different classes of property (e.g. residential, multi-residential, farm,
commercial and industrial properties), what percentage of the value is taxable, and how effective tax
rates vary within and among property classes.2 By altering the relative price of property, these taxes
can influence a number of decisions regarding property improvement, size and location – and
ultimately increase or decrease urban sprawl (Deskins and Fox, 2010). Decreasing sprawl through
property taxes requires the following priority actions (see Section 1.3 for a more in-depth analysis):
Eliminate policies that favour single-family homes over apartments. Policies that favour
single-family homes over multi-family properties result in less dense development. Perverse
incentives are created when single-family residential properties are offered lower taxes than
higher-density properties of the same value (Haveman and Sexton, 2008).
Tax the land value, not the property. When property taxes are based on land value, rather
than buildings or other improvements to the property, owners have an incentive to develop the
land to its most profitable use. Replacing a traditional property tax with a land-value tax, or a
split-value tax that includes higher rates for land value and lower rates for structures or other
improvements (as implemented by some municipalities in the US state of Pennsylvania),
could encourage development in the urban core.
Development fees can discourage sprawl and fund infrastructure. In several countries,
municipalities have the discretion to negotiate infrastructure improvements with developers when the
municipalities make new land available for urban development. Such contributions from developers
could be designed to discourage sprawl if they cover the real costs of infrastructure provision to the
new site. This could be achieved through the following approaches (a more in-depth analysis in
section 2.3):
Impose area-specific development charges – a one-time levy on developers to finance the
growth-related infrastructure investments needed to serve the new development or, in some
cases, redevelopment. This type of pricing policy can be an effective planning tool that
renders developers fully responsible for their project costs, promotes the need to correct for
the external costs of development by increasing land cost, and generates funds for
infrastructure development and compensation programmes. For example, the extension of the
metro-line in Copenhagen was financed through fees from development of the Ørestad area of
Copenhagen (OECD, 2009).
Sell additional building rights. In São Paolo, for example, the building rights for additional
floor space on the top of existing buildings that exceeded normal maximum density were sold
in areas authorised for higher-density development. Similar mechanisms can be found in the

23
state of Maharashtra, India, where the maximum floor space index was increased, and the
extra floor space sold to developers. Both initiatives have generated additional infrastructure
funding while increasing urban density. The sale of additional building rights is particularly
relevant for growing cities with scarce land, as long as construction and safety standards are
taken into account (a more in-depth analysis is provided in Section 2.4).
Tax low-density development. France introduced a scheme in 2010 that taxes development
that does not meet minimum density requirements. The City of Austin, Texas in the US has
introduced a special transportation levy on all municipal utility bills, based on the estimated
average number of daily motor vehicle trips per household, in effect penalizing less-dense
development.
Transportation fees and charges
Transport fees should discourage car use and encourage public transit and non-motorised travel.
While national or state/provincial governments control most transportation-related taxes, local
governments often control transportation fees and charges. The following instruments have been used
successfully to reduce the share of car traffic, reduce emissions, and raise funding to finance local
transportation infrastructure:
Congestion charges are fees for road use that are applied exclusively or more intensely
during peak traffic periods. Congestion charges have reduced air pollutions, including a
decrease in carbon dioxide emissions of up to 19.5% in the cities where they have been
(Beevers and Carslaw, 2005) (Table 3). Higher polluting vehicles may be charged higher
rates (e.g. as in Singapore and Milan), which more closely ties the congestion charges to
greenhouse gas reduction goals. Some cities (e.g. London) use the revenue from congestion
charges to finance urban public transport.
Table 3. Impacts selected urban congestion charges
London Stockholm Singapore Milan
Introduced 2003 2006 1975-98 (2nd
generation)
2008
Reduction CO2 emissions (in %)
19.5% 13% n.a. 9%
Period of effect 2002-03 January-July 2006 n.a. January-December 2008
Other effects Reductions of emissions (NOx, PM10), car traffic
Reductions of emissions (NOx, CO, PM10), vehicle passages
Reductions of car traffic and car share modal split.
Reductions of emissions (PM10, NOx) and traffic volumes.
Source: OECD (2010b), Cities and Climate Change, OECD, Paris.
Variable parking fees and taxes can reduce car trips and encourage public transportation use
(OECD, 2010b). Parking fees can even more effectively discourage car use by charging
higher rates in congested areas or during peak hours (e.g. as in Los Angeles and New York
City), especially if the parking tax revenue is used to finance public transit.
High Occupancy Toll (HOT) lanes encourage carpooling by charging a toll on vehicles with
less than a minimum number of occupants (usually two or three). The effectiveness of HOT
lanes is mixed, considering the relatively high costs for collecting tolls: for example, a major

24
HOT lane in Los Angeles has operating expenses totalling 27% of gross revenues (Dachis,
2011).
Utility fees
Utility fees should encourage resource conservation. Water, waste and energy fees should be used
to signal the scarcity of the resource being consumed. This will discourage resource consumption and
waste generation, which can in turn increase efficiency and revenues. Many local governments
already do link fees to actual consumption of water and energy and actual generation of waste, but
many others could strengthen this link to promote conservation and less waste. Fees tied to resource
consumption or waste generation can fund service delivery and infrastructure improvements, although
they are best considered as part of a funding package that also includes taxes and transfers.
The impact of national policy
National policies’ impacts on local incentives should also be reviewed. As noted above, national
government policies can support or undermine local green development. It is important to identify and
remove perverse incentives in order to encourage infrastructure investment in line with sustainable
development and green goals.
Remove national obstacles to local incentives. National regulations may in some cases
constrain local governments’ ability to act. For example, several countries (e.g. Denmark)
require national government approval for cities to use revenue from congestion charges, as
they are considered new taxes.
Strengthen local authority to act. National governments could also introduce requirements
and standards for infrastructure cost recovery (e.g. Netherlands).
Design general grants to cities to compensate for environmental service provision and
opportunity costs of environmental preservation. A large share of many cities’ revenues comes
from development rights, building permits and the income related to new development. Some
national governments have begun to compensate local governments for these opportunity costs
by revising their grant allocation formulas to account for environmentally protected municipal
land.
Provide specific-purpose and matching grants to align local action with national green
growth and sustainable development goals. Green urban infrastructure investments are often
public goods with effects beyond local governments; intergovernmental grants would
therefore have to internalise these externalities, which can be done through specific purpose
grants. A way to align national and urban objectives consists of matching grants, which
depend on co-funding by the local government that receives the grant. This reduces the
marginal cost of investment for local governments and therefore increases the level of goods
they are willing to provide. For example, Portuguese national grants reward municipalities for
designating Natura 2000 sites and other protected areas within their boundaries, representing
5% of total money allocated through this grant. Several Brazilian states allocate state tax
revenues to municipalities based in part on the amount of land municipalities set aside for
environmental protection (OECD, 2010b).

25
1.3. Revenue and green cities: The case of the property tax
Property taxes represent the largest tax revenue source of local governments throughout the
OECD and can have an impact on land use. Property taxes are determined by multiplying a tax rate
(or series of tax rates) times the tax base. A number of policy choices regarding the structure of the
property tax can have an impact on land use: what is included and excluded from the tax base, how
property value is defined for different classes of property (e.g. residential, multi-residential, farm,
commercial and industrial properties), what percentage of the value is taxable, and how effective tax
rates vary within and between classes of property. Property taxes can influence a number of decisions
by altering the relative price of property. Specifically, it can influence choices about where to locate,
whether to improve one’s property, and what size dwelling to live in. These decisions, in turn, can
influence urban sprawl (Deskins and Fox, 2010).
Research on the impact of the property tax on urban sprawl is mixed. Theoretically, the property
tax can have two different effects on sprawl (Brueckner and Kim, 2003). The improvement effect
suggests that, all else being equal, a property tax based on market value is expected to result in a
reduction in density. Where the tax is levied on the assessed value of property (land and
improvements), any investment (such as a building) that increases the value of the property increases
its assessed value and thereby its tax.3
Higher property taxes are thus expected to provide an incentive
for less densely developed projects – scattered single-family houses rather than apartment buildings.
Lower densities mean that the city is likely to expand in a way that is socially inefficient
(Brueckner, 2001).4 In contrast, the dwelling-size effect would lead to a reduction in urban sprawl. If
the tax is partially shifted onto consumers it would lead to a reduction in the size of homes and result
in a more densely populated city (Brueckner and Kim, 2003).
Few empirical studies of the impact of the property tax on urban sprawl have been undertaken.
Deskins and Fox (2010) report on two US studies, which indicate that the dwelling effect exceeds the
improvement effect. One study, using data from 448 urbanised areas with a population of at least
50 000, shows that higher effective property tax rates reduce sprawl (Song and Zenou, 2006).
According to their estimates, a 1% increase in the effective property tax rate leads to a reduction of
about 0.4% in the spatial extent of an urban area. A second study, using data from 306 Metropolitan
Statistical Areas (MSAs) in 1990 and 2000, confirms that higher average property tax rates result in
less sprawl (Marshall, 2008). A more recent study by Song and Zenou (2009), however, uses a
database for central cities and suburbs in 445 urban areas in the US and finds that a lower property tax
rate in the suburbs compared to the central city is associated with more expansive urban growth and a
higher level of population and employment decentralisation.
To the extent that property tax differentials are matched by differentials in expenditures on public
services, they should not result in a distortionary impact on location or land use. The property tax
cannot be regarded as a direct user fee that individuals pay directly for the services they receive, with
both tax rates and service levels determined locally; yet, the property tax may loosely be considered a
benefits tax to the extent that the public services provided to the property owner enhance the value of
the property and result in higher property taxes. Where such ―matching‖ does not occur, however,
there will be a pattern of positive and negative subsidies that will influence urban development
patterns, usually in a way that worsens it.
Getting rid of incentives that favour single-family homes over apartments
Eliminating policies that favour single-family homes could help to stimulate urban density. In
most countries around the world, the property tax favours residential single-family homes over multi-
residential properties (Bird and Slack, 2004), as is the case in Toronto and New York City (Box 2).
26
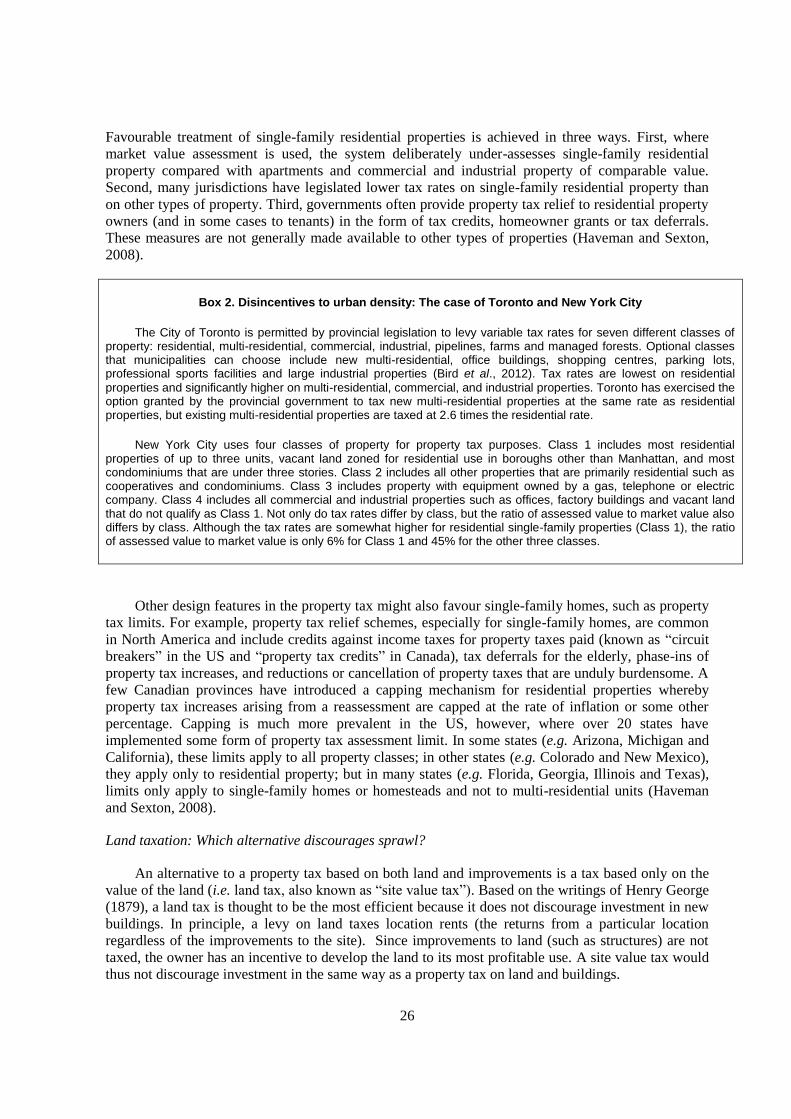
Favourable treatment of single-family residential properties is achieved in three ways. First, where
market value assessment is used, the system deliberately under-assesses single-family residential
property compared with apartments and commercial and industrial property of comparable value.
Second, many jurisdictions have legislated lower tax rates on single-family residential property than
on other types of property. Third, governments often provide property tax relief to residential property
owners (and in some cases to tenants) in the form of tax credits, homeowner grants or tax deferrals.
These measures are not generally made available to other types of properties (Haveman and Sexton,
2008).
Box 2. Disincentives to urban density: The case of Toronto and New York City
The City of Toronto is permitted by provincial legislation to levy variable tax rates for seven different classes of property: residential, multi-residential, commercial, industrial, pipelines, farms and managed forests. Optional classes that municipalities can choose include new multi-residential, office buildings, shopping centres, parking lots, professional sports facilities and large industrial properties (Bird et al., 2012). Tax rates are lowest on residential
properties and significantly higher on multi-residential, commercial, and industrial properties. Toronto has exercised the option granted by the provincial government to tax new multi-residential properties at the same rate as residential properties, but existing multi-residential properties are taxed at 2.6 times the residential rate.
New York City uses four classes of property for property tax purposes. Class 1 includes most residential properties of up to three units, vacant land zoned for residential use in boroughs other than Manhattan, and most condominiums that are under three stories. Class 2 includes all other properties that are primarily residential such as cooperatives and condominiums. Class 3 includes property with equipment owned by a gas, telephone or electric company. Class 4 includes all commercial and industrial properties such as offices, factory buildings and vacant land that do not qualify as Class 1. Not only do tax rates differ by class, but the ratio of assessed value to market value also differs by class. Although the tax rates are somewhat higher for residential single-family properties (Class 1), the ratio of assessed value to market value is only 6% for Class 1 and 45% for the other three classes.
Other design features in the property tax might also favour single-family homes, such as property
tax limits. For example, property tax relief schemes, especially for single-family homes, are common
in North America and include credits against income taxes for property taxes paid (known as ―circuit
breakers‖ in the US and ―property tax credits‖ in Canada), tax deferrals for the elderly, phase-ins of
property tax increases, and reductions or cancellation of property taxes that are unduly burdensome. A
few Canadian provinces have introduced a capping mechanism for residential properties whereby
property tax increases arising from a reassessment are capped at the rate of inflation or some other
percentage. Capping is much more prevalent in the US, however, where over 20 states have
implemented some form of property tax assessment limit. In some states (e.g. Arizona, Michigan and
California), these limits apply to all property classes; in other states (e.g. Colorado and New Mexico),
they apply only to residential property; but in many states (e.g. Florida, Georgia, Illinois and Texas),
limits only apply to single-family homes or homesteads and not to multi-residential units (Haveman
and Sexton, 2008).
Land taxation: Which alternative discourages sprawl?
An alternative to a property tax based on both land and improvements is a tax based only on the
value of the land (i.e. land tax, also known as ―site value tax‖). Based on the writings of Henry George
(1879), a land tax is thought to be the most efficient because it does not discourage investment in new
buildings. In principle, a levy on land taxes location rents (the returns from a particular location
regardless of the improvements to the site). Since improvements to land (such as structures) are not
taxed, the owner has an incentive to develop the land to its most profitable use. A site value tax would
thus not discourage investment in the same way as a property tax on land and buildings.

27
A land tax is considered neutral with respect to timing, location and density of development
(assuming the tax base reflects the highest and best use of the property). Although it is neutral with
respect to the above factors, a move from a property tax to a site value tax would likely increase
density and curb urban sprawl: lowering the tax on structures will encourage more structures on a
given land area and lead to greater density.
Although exclusive local land taxes are very rare, some local governments tax land separately via
their property tax system. For example, some municipalities in Pennsylvania use a split rate system
that taxes land more heavily than improvements. The ratio of tax on land values to tax on
improvements ranges from 1.66:1 to 30:1 among the 16 communities that levy a split rate. Empirical
evidence on the impact of land value taxation on development in the US is mixed, however. Mathis
and Zech (1982) identified no relationship between the split-rate tax and the level of building activity
across Pennsylvania communities. Bourassa (1990) found that the split-rate tax had a significant
impact on residential building activity in Pittsburgh but not the two other cities studied. According to
Oates and Schwab (1997), the split-rate tax increased building permit activity when the City of
Pittsburgh reformed its property tax in 1979-80 by raising the tax rate on land to more than five times
the rate on structures. Although the authors conclude that the subsequent increase in building activity
was largely attributable to a shortage of commercial space, the move to greater taxation of land is
thought to have played a role. By increasing land taxes, which are neutral in terms of development
decisions, the city was able to increase its revenues without increasing other taxes that could have had
a distortionary impact on development decisions. Plassmann and Tideman (2000) also found that a
split-rate tax in Pennsylvania resulted in a 3 to 4% increase in residential construction.
Land value taxation scores well in terms of efficiency. However, problems arise in its
implementation: administration of the land tax can be difficult. Accurate land valuation presents a
challenge to assessors because most urban real estate sales combine the value of land and
improvements. Site value taxation requires the subtraction of the value of the improvements from the
value of the property as a whole in order to derive an assessed value for the land. For this reason, some
consider such taxation to be unacceptably arbitrary. On the other hand, some authors have argued that
valuation of land alone is probably easier than valuation of property (Netzer, 1998): instead of
assessing the value of land and improvements and then subtracting the value of improvements, site
values per square metre could be estimated directly from sales and demolition records.
28
2. PRIVATE FINANCE AND GREEN URBAN INFRASTRUCTURE
Private financing could fill the funding gap for many urban green infrastructure projects. For
private finance to be a solution, three conditions would have to be met: a market for green urban
investment projects, good return on investment and limited risk. Several instruments have been
applied to attract private finance for urban green infrastructure. Private sector involvement in urban
green infrastructure can take the form of public-private partnerships (PPPs), whereby the long-term
risk is transferred to the private sector. Another instrument, tax increment financing, uses tax revenues
to attract private finance. Alternatively, real estate developers can pay for the infrastructure needed to
connect new development to existing infrastructure; this has taken the form of development charges
and impact fees in North America, but similar instruments can also be found elsewhere in somewhat
different forms. Asia makes extensive use of value capture taxes, aimed to seize part of the value
increases of real estate due to new nearby infrastructure development. Finally, loans, bonds and carbon
finance are instruments used (and that could be used more) to attract private finance.
2.1 Conditions for private finance
It is not possible to engage the private sector if there is no market for urban green projects; and if
there is a lack of appropriate projects, the size of the market might be too small. In deciding on their
investment portfolio, each private investor considers the trade-off between projected return on
investment and risk. To gain the interest of private investors, urban green infrastructure projects need
to be marketable and promising with regard to returns and risk: high potential yields or limited risk, or
both.
Relatively limited market size might pose a challenge for private financing of urban projects. The
potential market for urban green investment projects is small and fragmented. Attracting private
investment, such as large loans or issuing of bonds, often requires the assistance of intermediaries or
banks, which are subject to economies of scale. Small investment projects could mean prohibitively
large transaction costs. With less frequency of investment projects at the city level than at the country
level, capacity building for attracting private finance and contract negotiation for small urban
development is also more challenging. This will be less problematic for large metropolitan areas, but
smaller cities might benefit from pooling projects and capacity when mobilising private finance.
The relatively high cost of clean technologies can make it appear less attractive as an urban
investment. Returns on green urban investment are often lower than alternative investment options. In
many sectors, clean technologies are still in development, and the negative externalities of dirty
industries are not always taken into account; this means that dirty technologies and sectors are
favoured. In the energy sector, for example, only a limited number of countries have introduced
carbon taxes to internalise negative externalities of fossil fuels, while many countries still have fuel
subsidies that stimulate fossil fuel consumption. As a result, the costs of generating energy from coal
or natural gas are still considerably lower (up to five times depending on the technology) than from
renewable energy sources, even if the price of clean energy seems to drop quickly (WEF, 2010).5 Even
if the returns of investment could be high, the benefits might spill over to other actors leading to
under-investment from a societal point of view. Policy must take this spillover into account.
High risk associated with newer technologies can discourage financing options for urban green
projects. In some sectors, technological uncertainty can translate to risk of investment in urban green
projects. Risk profiles vary for different technologies and their stages of development; the technology
development stage determines which type of financing is most appropriate. For example, venture

29
capital financing is generally suited for unproven and untested technologies, while project finance is
used for mature technologies, such as wind and solar power. Government-supported policies thus need
to be tailored to the stages of a technology’s development. Financing methods also depend on the
project phase. Maturity of technologies and types of financing available are reflected in risk-return
profiles of urban green investment opportunities. Thus, urban green projects with high capital intensity
and high technology risk will be most difficult to finance.
2.2 Involving the private sector through public-private partnerships
The notion of public-private partnerships is multifaceted and covers a wide diversity of
contractual agreements characterised by different risk-sharing and financing schemes, as well as
different organisational forms – from management contracts to the Private Finance Initiative (OECD,
2008). PPPs are broadly defined as long-term contractual agreements between a private
operator/company (or a consortium) and a public entity, under which a service is provided, generally
with related investments (Saussier et al., 2009). Fundamental to this funding approach is the private
partner’s both long-term relationship with the public partner and assumption of some investment risk.
The type of PPP arrangement determines the private operator’s level of participation, exact role and
involvement in the project’s different stages (design, completion, implementation and/or funding).
Unlike traditional public sector procurement, where the private contractor simply designs and/or
builds what the public sector orders, PPPs involve a process in which private operators bid for a
contract to design, finance and manage the risks involved in delivering public services or assets. In
return, the private contractor receives fees from the public body and/or user tolls for the long-term
operation and maintenance of the asset.
Two families of PPPs – concessions and private finance initiatives (PFIs) – differ regarding the
private operator’s remuneration schemes. For concessions, payments are usually made by users or are
substantially connected to the number of users (e.g. shadow tolls). As a consequence, the private
operator bears the demand risks because revenues are directly and substantially connected to the
consumption level. In contrast, payment for PFIs is based on making the infrastructure available and is
usually affected by the capabilities of the operator to meet performance targets. Consequently, the
demand risk is more extensively transferred in concessions than in PFIs (see Annex I for a more
detailed analysis of promises and pitfalls of PPPs).
Public-private partnerships can be either solicited or unsolicited, depending on who initiates the
project. For a solicited project, the competent authority (central or local government) identifies a
potential PPP project and solicits proposals from the private sector. For an unsolicited project, the
private sector identifies a potential PPP project and requests designation of the project as a PPP from
the competent authority. In this case, the concessionaire is selected under a competitive bidding
process, although the initial proponent (the private actor who proposed the project) may obtain extra
points in the bid evaluation. Not all countries accept unsolicited project initiation, but the following
countries have participated in this type of PPP: Chile, India (sub-national), Pakistan, Philippines,
Russian Federation (sub-national), United States (sub-national), and South Africa. Solicited projects
cost governments considerable time and money to initiate, whereas unsolicited projects benefit from
the efficiency of the private sector and their assumption of associated costs and risks. As a result, in
countries where both solicited and unsolicited projects exist (e.g. South Korea), unsolicited projects
may be favoured. Unlike unsolicited PPPs, however, solicited projects can be implemented in line
with a government’s overall infrastructure investment plan and priorities. For this reason, the
government of South Korea has recently made efforts to promote more solicited projects.
Cities often use PPPs to achieve their green infrastructure objectives. Several projects identified
as ―best practice‖ projects by the C40 are governed by PPPs (Table 4). The different types of contracts

30
indicated for the PPP projects show the diversity of contractual practices among these various cases.
Alternative modes of governance (e.g. in-house, procurement, public) are also represented within this
sample of projects. Considering this diversity, it is difficult to provide generic conclusions about the
efficiency of PPPs: much depends on institutional, technological and economical circumstances. This
is also illustrated by the case of the Eco-Stadium of the City of Nice (Box 3).
Table 4. C40 "best practice" projects
Activity City Country Governance Type of contract
Transport
Bicycle sharing
Paris France PPP Concession
London UK PPP
Barcelona Spain PPP
Oslo Norway PPP
Lyon France PPP
Stockholm Sweden PPP
Brussels Belgium PPP
Seville Spain PPP
Dublin Ireland PPP
Copenhagen Denmark NGO
Bicycles paths Bogota Columbia In-house
Congestion charge Stockholm Sweden Procurement
Energy
Renewable energy supply
Austin USA In-house
Melbourne Australia Procurement
Supply and install
Rizhao China Public Regulation, subsidy
Barcelona Spain Public Regulation
Energy savings
Chicago USA In-house
Copenhagen Denmark In-house
Tokyo Japan Public Regulation
Street lighting Los Angeles USA In-house
Building Energy savings
Berlin Germany PPP ESP
London UK PPP EPC
Stuttgart Germany In-house
Paris France PPP PFI3
Urban development
Dongguan China PPP
Waste Waste management
Gothenburg Sweden PPP Management contract
Sydney Australia PPP BOO
Dhaka India NGO
Water Water distribution
Tokyo Japan In-house
Emefuloni South Africa
PPP BOT
Austin USA Public Regulation, subsidy

31
Box 3. The Eco-Stadium of the City of Nice
The City of Nice Eco-Stadium project illustrates the potential of a global contract and the necessary conditions for PPPs to reach this potential. The project – including design, financing, construction, operation, and maintenance – aimed to build a stadium with a positive energetic balance sheet. Designed as part of a proactive sustainable development program, the stadium includes an exceptionally large-scale wood structure and a unique arrangement of natural air-conditioning (a fan wall system cools the stadium using prevailing winds).
This type of innovative project would have been difficult, if not impossible to develop under traditional procurement. As the leader of the entire project from design to maintenance over a 30-year contract, the private operator has a high incentive to innovate – even at the cost of higher up-front investments – in order to reduce the cost of the project overall. Furthermore, the operator must be accountable for objective targets and measures. For example, in this project, an assessment of the energy production and cost of the stadium and its parking lots, shops and museum determines the operator’s commitments.
There are two types of green PPP projects: greenfield projects and brownfield projects. In
brownfield projects, the private sector participates (as investors and operators) in existing
infrastructure facilities; greenfield projects develop new infrastructure, such as a new wastewater
treatment facility. While both greenfield and brownfield PPPs can have environmentally friendly
characteristics, it is easier to make greenfield PPPs truly green. In the building sector, for example, the
recast of the 2002 Energy Performance of Buildings Directive (EPBD) – adopted by the European
Parliament and the Council of the European Union on 19 May 2010 – strengthens the energy
performance requirements of both new and existing buildings across the European Union (EU). For
new buildings, the recast fixes 2020 as the deadline for all new buildings to be ―nearly zero-energy
buildings‖6 (and even sooner – by the end of 2018 – for public buildings). For existing buildings,
member states must draw up national plans to increase the number of nearly zero-energy buildings
(though no specific targets have been set).
One of the most innovative urban green PPPs is Energy Performance Contracting (EPC). The EU
Directive 2006/32/EC, which lays the legal foundation for such contracts in the EU, defines EPC as ―a
contractual arrangement between the beneficiary and the provider (usually an Energy Service
Company - ESCO) of an energy efficiency improvement measure, where investments in that measure
are paid for in relation to a contractually agreed level of energy efficiency improvement‖. The
objective of EPC is not the execution of works (supply of goods or services), but the improvement of
energy efficiency (i.e. reduction of energy consumption) (Box 4). This is an innovative approach to
contract design and thus raises specific issues related to performance measures and verifiability under
the context of legal and technological uncertainty. The use of a performance-oriented contract is only
possible when energy efficiency is perfectly measurable, with observable and verifiable indicators.
Depending on the sector and the objectives of a given project, such measure may be difficult to
establish and contest. The more difficult the control, the more likely ex post conflicts concerning
efficiency targets, observed performances and responsibilities will occur. These conflicts are costly
and affect the efficiency of PFI.
32
Box 4. Energy performance contracting
Despite the definition given by the EU Directive 2006/32/EC, the definition and implementation conditions of energy performance contracting (EPC) vary in different countries. This affects how EPC is marketed (i.e. high or low market visibility) as well as the cost and quality of services provided by suppliers. Still, there are common features of EPC:
EPC is objective-oriented, in that a private contractor's revenue under EPC depends at least partly on energy savings that have been achieved. The cost of investment (in air conditioning systems, energy management control systems, efficient lighting, peak load management, thermal insulation as well as campaigns to make users sensitive to energy savings) is paid back from the energy savings. If the Energy Services Company (ESCO) fails to achieve the estimated energy savings, they must cover the difference between the invested cost and the realised savings. In addition, to ensure that the building is used in the most efficient way, building occupants receive training on energy efficiency practices. Since EPC is a performance contract, rigorous procedures for assessment and verification performance have to be implemented by ESCOs. EPC is thus an incentive contract that should improve energy efficiency.
EPC is a global contract, for which the ESCO designs, realises, exploits, and maintains energy-saving equipment, supporting most of the performance risks.
EPC is a long-term contractual agreement, through which the customers should benefit from new or upgraded energy equipment along the life of the contract.
Urban green PPPs might face challenges if their objectives result in decreased consumption. Such
objectives appear incompatible with concession contracts, in which the gains of the private operator is
positively linked to the level of consumption. The greening of public services through concession-type
contracts is thus problematic. The frequent use of concession-type contracts for water utility contracts
in France illustrates this problem: when private operators’ payment is based on the amount of water
consumed, conserving natural resources (i.e. reducing the quantity of distributed water) conflicts with
increasing earnings (Box 5).
Box 5. Are concession contracts adapted for water services?
The private sector provides water services to 75% of the population in France. France is one of the three countries worldwide (other two being Chile and the United Kingdom) with the highest share of private sector provision in this sector. The French debate about water concession contracts; the re-municipalisation of water services (e.g. in Paris) is largely connected to the misalignment of contractual tools. Some municipalities would like to focus on reaching environmental targets, like reduced water losses, improved resource protection and reduced consumption. However, the contracts that allow municipalities to partner with private operators through a global contract are concession or lease contracts, both of which base payment to operators on the volume of water consumed. This clearly contradicts the willingness to achieve water consumption reductions. A new paradigm is therefore necessary, and there are many options. Concession and lease contracts could be replaced with PFIs, in which operators are paid through their capacity to reach quality targets (e.g. volume reduction of water consumption). Mixed payments provide
another alternative: consumers pay for water services, while citizens’ taxes cover costs of other services that benefit the whole society (e.g. resource protection, leakage reduction). Thus, a continuum of PPPs is possible, with a mix of features of concessions and PFIs.
Green projects face high uncertainty regarding technological and legal developments. In most
standardised PPPs, project technologies are built-in or traditional, and market-tested throughout the
long-term and repeated government procurement processes. However, some green technologies,
including resource recirculation or renewable energy technology, are new and less verified in the field.
Sometimes, they need to be modified to meet new criteria of the environment or energy saving index.

33
New technologies are less likely to be accepted to project developers or financial investors, since they
are more vulnerable to various risks of technology failures. Limited experience with and evidence on
green PPPs to properly guide optimal concession designs increases the level of uncertainty in the
processes of project design, implementation, financing, and operation and maintenance. For this
reason, cities like Amsterdam (Box 6) have introduced forms of co-operation that aim to promote
knowledge exchange between the different actors involved in green finance.
Box 6. Green Finance Lab in Amsterdam
The Green Finance Lab is an initiative of the City of Amsterdam and the Dutch bank ABN AMRO, as part of the Amsterdam Sustainability Programme and a Green Deal between the City of Amsterdam and the Dutch national government. The Green Finance Lab aims to find new financing mechanisms for realising the transition towards a sustainable metropole (including ecosystem services, energy, water, raw materials and transportation). The Lab serves as a forum for stakeholders from different sectors (public, private, NGO and research) to develop new financial solutions for sustainability challenges. In 2011, the first Lab focused on the financing of green areas around Amsterdam, followed in 2012 by the organisation of “chambers” for sponsorship, donations, private investment zones and value capture finance. Each chamber brings together entrepreneurs (from the private, social or public sector) and investors. These entrepreneurs frame their proposals in parameters that give maximum information to investors (e.g. cash flow, risk management), while investors comment, coach and help search for innovative solutions where conventional mechanisms fall short.
This uncertainty makes for a complex trade-off between flexibility and rigidity of the contract.
The more a contract is complete, the more likely costly renegotiations can be avoided. However,
completeness also means rigidness; and in a complex and uncertain environment, contracts need
flexibility rather than rigidity: the more the contract is incomplete, the more it is flexible and adaptable
to unanticipated contingencies and open to incorporating new incentives for cooperative behaviour.
Still, it does not protect against opportunistic behaviours from the public body or the private partner.
The often-high uncertainty of green projects thus increases the need for flexibility and, as a
consequence, the insecurity and instability of PPP relationships under permanent threat of
opportunism.
PPPs may sometimes be too rigid in the context of technological evolution: if PPPs cannot easily
incorporate technological innovation during the life of the contract, they lose their comparative
advantage to internal public solutions and traditional procurement. Thus, PPPs may not always be a
good candidate for green projects with strong technological components. Some national governments
(e.g. South Korea) put packages in place to stimulate urban green infrastructure PPPs by taking away
some of the risks connected to this uncertainty (Box 7).
Box 7. National incentives to stimulate green infrastructure PPPs: The case of South Korea
The national government of South Korea promulgates various kinds of financial and tax incentive policies that can facilitate green infrastructure PPP financing, in line with its First Five-Year Action Plan for Green Growth, initiated in 2009. More specifically, the government provides (i) construction subsidies, (ii) compensation for base cost, (iii) infrastructure credit guarantees via the Infrastructure Credit Guarantee Fund, and (iv) tax incentives.
i. Construction subsidies: According to the PPP Act, the government may grant a construction subsidy to
the concessionaire, if it is required to maintain the user fee at an affordable level. The timing of the
subsidy is determined in the course of the concession agreement and depends on the equity investment
plan of the concessionaire. The timing of the distribution reflects the completion level of the project and
the schedule and scope of equity investment. The amount of subsidy is determined in each individual

34
concession agreement. When notifying about a project, the government first discloses an approximate
ratio of the construction cost that it is willing to subsidise. The exact ratio of subsidy to construction cost
is determined through consultation and is stipulated in the concession agreement. As a result, each
project ends up with a different amount of subsidy. The government has set a subsidy guideline for road
projects of 20% - 30% of the total project cost. It has set a subsidy guideline for railway projects of up to
50% of total project cost. The ratio of subsidy to construction cost for environmental projects is
stipulated by law (50% to 80%) and included in the government’s public notification. Generally speaking,
more green-oriented projects are eligible for larger subsidies than the other projects.
ii. Compensation for base cost: the government assumes a portion of investment risk. This risk is limited to
what the government’s costs would have been in the case of a public-financed project. The government
payment is made for the amount of shortfall in the actual operational revenue compared to the share of
investment risks by the government.7 When the actual operational revenue exceeds the share of
investment risks, government subsidies are redeemed on the basis of and within the limit of the amount
previously paid. On the part of the private participant, subsidies are provided only when the actual
operational revenue surpasses 50% of investment risk.
iii. Infrastructure credit guarantee fund (ICGF): Since 1994, the ICGF has provided credit guarantees to
concessionaires who want to obtain loans from financial institutions for PPP projects. According to the
PPP Act, the ICGF is managed by the Korea Credit Guarantee Fund. The ICGF consists of annual
government subsidies, guarantee fees and investment returns. When the project guaranteed by the
ICGF defaults, the ICGF subrogates on behalf of the project company. Additional government
contribution can be granted if the funds are insufficient. The limit of the credit guarantee per
concessionaire is KRW 100 billion, but in cases where the director of the management institution
considers it necessary, the limit may be raised to KRW 200 billion. The guarantee fee will have a
maximum annual fee rate of 1.5%.
iv. Tax incentives: To facilitate infrastructure financing, the government provides tax incentives that are
stipulated in the PPP Act. Details of the tax incentives are also included in the PPP Basic Plan in four
categories: special taxation, corporate tax, local tax and exceptions from charges. The PPP Act directs
the government to enact special taxation for infrastructure bond, value-added tax, foreign investment
zone, and infrastructure fund. A separate taxation rate of 14% is applied to the interest revenue from
infrastructure bonds. A 0% tax rate is applied for the value-added tax for infrastructure facilities or
construction services. Reduction of and exemption from taxes, including corporate tax, income tax,
acquisition tax, registration tax, and property tax, are applied to foreign investment in the foreign
investment zone. With respect to the dividend income distributed for the infrastructure fund, a 5% tax
rate is applied to the dividend income from the equity investment portion up to KRW 300 million and a
14% tax rate is applied to the dividend income from the equity investment portion exceeding KRW 300
million. Local tax exemptions for PPP projects, which include an exception for three times the
registration tax within the capital region and an exemption from acquisition and registration tax are
included as well.8

35
Conditions for success
PPPs may help increase public awareness and expand the diversity of stakeholders in green city
development. Creating a favourable environment for private sector participation by strengthening cash
flow from concessional loans and grants may contribute directly to the establishment of new green
projects, resulting in the realisation of projects that could not be pursued with traditional government
procurement alone. Private firms not only can foster corporate social responsibility by participating in
green projects, but also can create markets for green products by facilitating a better investment
environment. Although most green projects are highly uncertain, PPP diversifies business risks and
stakeholders by promoting joint public-private activities. It enables the implementation of large
infrastructure projects too costly for either the public or private sector to pursue on its own. Because
all participating agencies make joint contributions to increasing resources by collaborating with the
private sector, more green projects can take advantage of government subsidies and public funds, with
risks distributed more evenly among the participants.
Competition and expertise within the private sector can enhance efficiency and effectiveness of
green public investment under PPP. Since PPP enables the efficient undertaking and operation of large
projects related to the green economy throughout competitive bidding and concession contracting
processes, it has been adopted to support projects more amenable to private sector participation. The
public and private sectors have been cooperating in a wide range of areas based on the accumulation of
experience by the private sector in green investment. The PPP is expected to improve the conditions
for businesses’ entry into the market and facilitate capacity building. Enhancement of efficiency and
effectiveness, however, requires well-designed, well-implemented concessions and related government
regulations, and depends on several conditions.
Effective partnerships are crucial to the success of green urban PPPs. Unlike traditional
procurements for assets or services, which use shorter-term contracts to acquire or renovate
public assets, a green PPP is a global contract, which may last for 15 to sometimes more than
90 years. Establishing a real partnership based on co-operation, expertise and credible
commitment is essential and requires a different approach than shorter contracts. Especially
for complex green PPPs, the public body must also acquire internal knowledge and expertise
necessary to define the terms of the agreement.
Interaction and negotiation with one or several operators during the call for bidders phase
could clarify the objectives of the partnership and provide innovative technological solutions
not yet envisioned by the public body. This interaction in the bidding phase is especially
helpful for green PPPs negotiated in an uncertain environment with complex technologies that
vary in speed of obsolescence. In order for this phase to be efficient, the public body must
invest in gaining enough expertise and generating sufficient competition to challenge private
partner candidates.
Clear environmental objectives and their weight in the procedure to award PPP-projects
must drive effective green PPPs. The addition of green requirements to the project
specification after PPP design will be costly and likely problematic (i.e. incompatible with
technological choices put in place). In addition, environmental targets must be measurable and
clearly defined, with agreed upon approaches for ex post monitoring explicitly described in the
contract. Since most of these methods and protocols evolve over time (due to both innovation
and demand evolution), they should also be adaptable.

36
Flexibility is a key element of green PPPs. Discussion with private operators for a green PPP
should focus on efficient and flexible solutions that allow for speedy response to changing
requirements and new technologies. This is an option-value trade-off that might increase costs.
In addition, the contract should describe and anticipate how the relationships evolve over time
as soon as unanticipated events occur (e.g. what renegotiation procedures, what termination
procedure).
Instead of introducing green aspects in PPPs, PPPs could be designed so that operators are paid
solely on their ability to reach environmental targets. In many cases, this will not be possible because
it would lead to risk transfers that would be considered too high by the operator. When feasible, this
arrangement would send a clear signal about the willingness of the city to favour green aspects in bid
selection. The private operator would also be more incentivised to take green commitment seriously.
In this case, the selection of the best candidate should be based not on one single criterion (e.g. price),
but on the economically most advantageous criteria such as whole life costs, quality, deliverability,
flexibility, innovation and level of risk transfer. However, given higher costs, the real willingness and
capacity of cities to enter this game remains in question.
2.3 Stimulating private investment: The case of tax increment financing (TIF)
Tax increment financing (TIF) is an economic development tool used to encourage the
redevelopment of areas in need of revitalisation and brownfield remediation.9 Cities designate a TIF
area for capital improvements and then earmark any future growth in property taxes to pay for
investments in infrastructure and other economic development initiatives. TIF districts are often the
beneficiaries of federal and state grants and tax incentives, and these additional funds help to achieve
the revitalisation objective (Box 8). TIFs were first introduced in California in 1952 and since then
have spread to almost all US states.10
In Chicago, by 2005, 10% of all property taxes were earmarked
for TIF purposes, and TIF districts covered more than 25% of the city’s geographic area (Quigley,
2007). In Canada, TIFs are a much newer instrument and not nearly as widespread as in the US. TIF
legislation was passed in Manitoba in 2008, but the instruments are not yet being used in that
province. In Alberta, TIFs are known as community revitalisation levies (CRL) and are being used in
Calgary and Edmonton. In Ontario, TIFs are being considered for two pilot projects in Toronto,
pending the passage of enabling regulations.11
In recent years, however, the underlying purpose of TIFs and their impact on green infrastructure
have come into question.12
TIFs were originally designed as a tool to stimulate private investment in
urban cores and to assist these areas to compete with outlying suburban and exurban areas. The
rationale behind TIF districts is that revitalisation can have a positive impact on urban quality of life
and future tax revenue. However, as one author notes, TIFs are ―a complicated device for subsidising
development that has morphed from a tool for inner-city revitalisation into a widely used suburban
program frequently associated with disputes about sprawl‖ (LeRoy, 2008, 3).

37
Box 8. How does tax increment financing work?
Cities designate a tax increment financing (TIF) district for capital improvements and then earmark any future growth in property taxes to pay for investments in infrastructure and other economic development initiatives. TIFs are governed by state/provincial legislation and are thus applied differently in different states and provinces. They do, however, follow a similar approach:
Initially, a TIF district is proposed based on planning criteria and what is permitted in the enabling legislation. The geographic boundaries of the TIF district should reflect the area in need of redevelopment. Public consultation is held and a redevelopment plan is developed for the district.
Once the area has been given official status, the annual property tax revenue accruing to all taxing authorities within the district (the municipality, the county, school boards, etc.) is frozen at pre-revitalisation levels.
13 These property taxes are known as “base level” taxes. For a period between 15 and 35 years, all or
some portion of the incremental tax generated (above the base level) accrues to the redevelopment agency (or the municipality) to be used for the redevelopment.
To kick-start the redevelopment, the municipality or redevelopment agency invests in infrastructure and/or acquires land. TIFs are generally used to cover the cost of studies, surveys and plans; professional service costs such as architectural, legal and engineering; property assembly costs, including land acquisition, demolitio, and land clearing; costs of rehabilitation, reconstruction, repair or remodelling existing buildings and fixtures; costs of construction of public works or improvements; financing costs; capital costs resulting from the redevelopment project; and relocation costs. Generally, TIFs cannot be used to pay for general government operations including police and fire protection, road maintenance or similar operating costs, or for the construction or financing of government buildings. In some US states, TIFs are even used to offset private development expenses such as site preparation and construction.
Capital investments are usually funded through borrowing or issuing bonds against the expected incremental tax increases (TIF bonds). TIF funds are used to pay back these bonds.
After the TIF period expires, tax revenues from the expanded assessment base again flow through to the taxing authorities.
TIFs are not the same as tax abatements. Under a TIF, the development is financed from increases in tax revenue generated by the development and not from a municipal subsidy. There is no transfer of funds from the municipality to businesses, nor is there a transfer from one business to another. Taxes from the increase in the assessment base are used to finance public improvements in the district. The widespread use of TIFs in the US is, in part, because they offer a way for municipalities to get around borrowing limits; tax increment bonds are not subject to municipal debt limits or public referendum requirements in most states. This financing method results in more capital for infrastructure than would otherwise be available with traditional general obligation bonds.
The designation of a TIF district usually requires that an area be ―blighted‖ and that the
development would not take place ―but for‖ the incentive. Over time, however, both of these
requirements have been relaxed in many US states, calling into question the extent to which they
promote green infrastructure. In terms of blight, TIF legislation in some states sets out specific
conditions such as overcrowding, dilapidated or deteriorating buildings. Other states, however, lack
any legal definition of ―blight‖.14
The requirement that the area be blighted has been essentially
ignored (Youngman, 2011), as TIF districts can be created in any neighbourhood. A 1999 study
suggested that 45% of Wisconsin’s 661 TIFs were used to develop open space, mainly farmland,
including a superstore on what had previously been an apple orchard. Other applications of TIFs
include a golf course project on Greenfield in Des Moines, Iowa to pay for sewer lines and a shopping
mall in St. Louis, Missouri (LeRoy, 2008).
In an era of fiscal restraint and declining federal and state grants, municipalities are looking for
new ways to raise revenues. As a consequence, instead of using TIFs in blighted neighbourhoods
where they are most needed, they are often used where they can bring in the most revenue.

38
Municipalities are anxious to extend TIFs to more affluent neighbourhoods because blighted areas
have the least chance of increasing property values sufficiently to pay back TIF bonds. Furthermore,
TIFs are more likely to be successful on undeveloped land, such as agricultural land that is eligible for
preferential farmland programs (Youngman, 2011). Farm properties offer the greatest potential for
property value increases not only because they are undeveloped, but also because they would be
reclassified from farmland (levied at a low tax rate) to commercial or industrial properties (levied at a
high tax rate). However, as one author notes, ―the use of TIF for large-scale greenfield projects – of
whatever quality – seems far afield from both the original mission of TIFs and the intent of smart
growth‖ (LeRoy, 2008, 10).
TIFs can only be used for expenditures that meet the ―but for‖ test. This test ensures that the
development would not have taken place ―but for‖ (without) these expenditures. Typically, the
expenditures that meet this test are those that put infrastructure in place for the development or reduce
the risk to developers so that they are willing to undertake the development. The ―but for‖ test, like the
determination of what is a blighted neighbourhood, has been compromised and, as LeRoy (2008) and
Youngman (2011) argue, has become merely a gesture of formality to justify that TIFs are not simply
giveaways to developments that would have occurred anyway.
2.4 Making the developer pay: Development charges and value capture
Several cities earn much of their revenues through land sales to developers. This can create
incentives for urban sprawl, as shown by the metropolitan cities in China’s Guangdong province. The
contribution of land sales to local revenue was estimated to be 55% in the City of Guangzhou in 2006
and about 80% in the City of Shenzhen throughout the 1990s (Tian and Ma, 2009; Peterson, 2006;
OECD, 2010c). Although these could be valuable instruments to capture land value increases and to
finance infrastructure, in practice local governments in China have been so motivated to generate
revenues from land sale and leasing that they have generated an oversupply of land for construction.
This has stimulated sprawled development and loss of cultivated land in the whole of China. Similar
dynamics, though less extreme, are evident in other metropolitan regions in the OECD. Municipalities
in the peri-urban fringe of many German agglomerations compete with each other by developing new
land to attract inhabitants and companies, thereby producing revenue used to finance public services.
This dynamic is made possible by municipal autonomy in land-use planning and large demand for
undeveloped land; the result is an undermining of sustainable planning principles.
Charging project developers
Cities throughout the OECD try to make developers pay for the infrastructure costs of new
development and related sprawl. Municipalities across North America levy development charges or
impact fees to pay for infrastructure in new developments.15
A development charge is a one-time levy
on developers to finance the growth-related capital costs associated with new development or, in some
cases, redevelopment. These charges are levied for works constructed by the municipality, and the
funds collected must finance the infrastructure needed for the development. Development charges are
appropriate for financing infrastructure in areas experiencing new growth but not applicable to
maintenance and replacement of old services.
Historically, municipalities have required developers to provide or pay for on-site services, such
as streets, street lighting, sidewalks and other public facilities within the subdivision. Subdivision
agreements between the municipality and developer require the developer to take responsibility for
providing (or funding) these services to meet municipal specifications as a condition of subdivision

39
approval. Over the last 30 years, municipalities have extended the responsibility to developers to pay
for the off-site costs associated with new development. These growth-related costs have traditionally
included ―hard‖ costs for roads, water and sewage systems and, in some jurisdictions, also ―soft‖ costs
for services like libraries, recreation centres and schools. The rationale for charging developers for off-
site growth-related costs is that ―growth should pay for itself‖ and not be a burden on existing
taxpayers (Slack, 2002).16
Several studies investigating who ultimately pays the development charge conclude that bearer of
the burden – the new homebuyer, developers or pre-development landowners – depends to a large
extent on the demand and supply conditions in the market for new housing (Slack and Bird, 1991).
Most studies conclude that, over the long-term, development charges are borne by the new
homebuyer. In some cases, the predevelopment landowner, or some combination of the homebuyer,
predevelopment landowner and the developer, may bear the cost. To the extent that the new
homebuyer bears the cost, the beneficiaries of the infrastructure pay for it.
If properly implemented, development charges can take into account the externalities of new
urban development and discourage urban sprawl. In order to have this effect, the charges have to be
differentiated by location to reflect the different infrastructure costs. For example, costs tend to be
higher for developments located further away from major facilities and for low-density developments.
To be efficient, development charges would be higher in these locations. Area-specific charges allow
municipalities to vary the charge according to the different infrastructure costs imposed by each area
on the city.
The costs of services may vary by location for at least three reasons (Tomalty and Skaburskis,
1997). First, the distance of each development from major facilities makes a difference. A
development far away from an existing water treatment plant, for example, may require an additional
pumping station. Second, there will be infrastructure cost savings for nodal or infill development
because the infrastructure is already there. Third, service standards may vary in different developments
(e.g. household water use versus waste generation). Whatever the reason for the differential costs,
efficient land use requires that developments imposing higher infrastructure costs on the city pay
higher development charges than developments imposing lower costs. Pamela Blais (2010) notes that,
in addition to varying by location, charges should also differ according to the density and type of
development to avoid low-cost areas subsidising high-cost areas, small lots subsidising large lots, and
smaller residential units subsidising larger units.
Development charges that reflect the true cost of providing services can buttress planning tools
by guiding development away from high-cost areas to more efficient locations (Tomalty and
Skaburskis, 2003). As Skaburskis (2003, 197) notes, pricing policies can be an effective planning tool
because ―they directly engage developers, they make them accept the full project costs, they recognise
and publicise the need to correct for the external costs of development by increasing the cost of land,
and they raise funds for infrastructure development and compensation programmes.‖ When urban
form and density are not fully factored into the development charge, a market distortion occurs and
inefficient allocation of resources often results (GTA Task Force, 1996, 128). A uniform charge
subsidises inefficient uses of land; developments that impose higher costs are subsidised by
developments that incur lower costs. In practice, several applications do not foster green development:
Canadian municipalities are not using development charges as a financial instrument to
discourage inefficient and costly land uses (Tomalty and Skaburskis, 2003). Most
municipalities impose the same charge on all properties of a particular type regardless of
location. In Ontario, for example, few municipalities differentiate development charges by
location with the exception of municipalities in the York Region. Presumably, the practice of

40
uniform charges has been adopted for administrative simplicity and perhaps also for reduced
conflict with developers (OECD, 2010a, 172), but it is clearly inefficient. One result is likely
to be over-development of low-density housing and under-development of high-density
housing relative to what is economically efficient (Slack, 2002). In British Columbia,
however, area-specific development charges are more common.17
The provincial
government’s Development Cost Charge Best Practices Guide suggests that development
charges be varied according to density to encourage more compact development and reduce
the amount of roads needed, increase the viability of transit and leave a smaller ecological
footprint (British Columbia Ministry of Community Services, 2005).
In US jurisdictions, impact fees are widely used but their design is generally not consistent
with efficient pricing of infrastructure (McGuire and Sjoquist, 2003). The reason is that fees
are generally based on average costs rather than marginal costs. This means that fees are the
same for an infill development close to existing services and a greenfield development on the
outskirts of a city. Communities generally use one of two methods for calculating impact
fees on single-family homes: a uniform charge regardless of size or a sliding scale that
responds to either interior square footage or the number of bedrooms (Burge, 2010).
Other problems can arise from the way in which the charge is determined. In Ontario, for
example, municipalities are only permitted to charge the infrastructure costs for services that are
already delivered in the municipality and only for standards of service that do not exceed the average
level of service over the previous ten years. If a municipality chooses to encourage compact
development by increasing transit service, for example, the development charge cannot be used to
cover costs that exceed the existing standard. Although these provisions were instituted to ensure that
developers are not responsible to pay for gold-plated services (services that exceed what existing
residents currently enjoy), they make it difficult for municipalities to recover transit costs (OECD,
2010a).
Capturing value connected to infrastructure investment
Smart land-based instruments can simultaneously increase both urban revenues (brought in by
developers) and urban density. In São Paolo, for example, building rights for additional floor space on
top of existing buildings, exceeding normal maximal density, were sold in locations authorised for
higher-density development (Box 9). Through a similar mechanism in the state of Maharashtra, India,
the maximum floor space index (FSI) was increased, with the extra FSI sold to developers. Both
schemes, particularly relevant for growing cities with a scarcity of land, have generated additional
infrastructure funding while increasing urban density. Developers can also pay for sustainable
transport infrastructure by capturing the value increases resulting from new public infrastructure
investment. Countries have had mixed success with this method: Singapore, for example, has made
ample use of such instruments to finance infrastructure, but Poland has experienced difficulties
implementing similar instruments (Box 10).
Urban green infrastructure could also be financed by local businesses, for example via business
improvement districts (BIDs). Originally invented in Ontario, Canada, BIDs are widely used in the US
and Europe since the 1960s. This mechanism facilitates financing and managing improvements to
commercial and industrial environments based on the agreement by a majority of businesses (either
land owners or tenants) who accept an additional levy. Once a district is established, revenue is
available through long-term debt for capital investment. Initially, BID resources often support
additional safety and sanitation services, but they can develop into much more sophisticated
investments and initiatives such as joint promotional initiatives. The district governing board, usually
consisting of city government representatives and private business representatives, avails itself to a

41
host of financing methods for district improvement. The boundaries of such districts are usually a
contiguous commercial or industrial area within a central city location, though they can also be
effectively used in suburban and ex-urban industrial locations. In cases of multiplicity of fragmented
jurisdictions at the local level, coupled with multiple tax rates and fiscal system, BIDs have become an
attractive new addition to local fiscal and management instruments. BIDs are only workable with a
critical mass of businesses willing to pay for particular services. They are also good tools for tightly
bound, reasonably healthy commercial and industrial centres that are densely populated by the
owners/users. However, BIDs are less effective in areas that are more spread out or have a high degree
of mixed land use, where it is harder for the payer to capture the benefits of targeted improvements in
services.
Box 9. Selling building rights in São Paulo, Brazil
The São Paulo Municipality in Brazil has successfully used new financial instruments to generate resources for urban regeneration and infrastructure investment in various parts of the city. The municipality has sold building rights exceeding USD 1.2 billion in the last six years in two “Urban Operations” projects based on the sale of additional floor space. The municipality changed land-use occupation regulations concerning floor area ratio (FAR) in relation to these projects. The total available stock of new building rights made available through this programme may be used for the transfer of individual lots or virtually, through property certificates of built area called Special Additional Potential Construction Certificates (Certificados de Potencial Adicional de Construção, or CEPACs). CEPACs are issued by the city and purchased by individuals who link them to their plot of land, thus increasing the total FAR permitted. These securities are issued by the municipality, and the funds are transferred to the Treasury, where they remain in a fiduciary account. CEPACs are issued and traded in the São Paulo Stock Exchange, which requires intermediation from a financial institution such as Banco do Brasil. However, the financial institutions give no guarantees. The CEPACs are intended to create reserves for carrying out public works, such as subway extensions, which aim to increase mobility and improve infrastructure under the city’s master plan. Though property values around the area typically increase, the Urban Operations are intended to encourage mixed use and increase the space available for residential and commercial development, thus creating value for the real estate market.
Different conversion rates of CEPACs into building areas allow city planners further discretion over incentives for specific sub-areas in the same Urban Operation. For example, if a conversion rate in a sub-area is set for two, it will cost half as much to buy an additional square metre than in a sub-area where the conversion rate is one. City planners can then incorporate relative market prices for different sub-areas in order to set conversion rates that will encourage development in that sub-area. Different conversion rates for commercial or residential use can also encourage development in the desired use and in mixed-use development.
The municipal law that creates each Urban Operation designates SP-Urbanismo (a public company linked to the Urban Development Secretary developing the Urban Operation Master Plan) as responsible for managing the process, controlling the finances and supervising contractors for the construction. The law also encourages community participation by stipulating that members of civil society be represented on managerial committees.
Source: Fróes, M. and J. Rebelo (2006), “Urban Operations and the São Paulo Metro Line 4”, Working paper, The World Bank.

42
Box 10. Betterment levies in Poland
Poland is one of the few OECD countries with a betterment-capture mechanism intended to capture windfalls due to planning decisions. The levy is assessed through a parcel-by-parcel appraisal, in order to determine the real value increase attributable to a new or revised plan. The municipalities administer the levy and keep its revenues. Another financial instrument using land values in Poland has been the “adjacency levy”, based on the market value increase of land resulting from the installation of local public infrastructure (e.g. roads, sewers, water supply and other utilities) adjacent to newly installed municipal infrastructure. The law permits local authorities to set levy rates up to 50% of project costs. A majority of local governments have adopted the levy.
In practice, assessing the incremental land value created by local plans or public improvements, such as new infrastructure provision, proved to be very difficult. Special appraisers were hired to estimate before-and-after land values, parcel by parcel, within improvement districts designated by the local government. However, the Supreme Administrative Court set aside many of the appraisers’ decisions, finding wrongful determination of land-value gains. Administrative costs were high, running as much as 30% of revenue collections. A case study of Szczecin, a city in the north-west of Poland with approximately 400 000 inhabitants, found that only 26 land parcels were assessed for land-value gains and that the total amount of revenue collected was equal to 0.6% of public infrastructure investment in the areas designated as improvement districts. The betterment statute was annulled after less than a year, primarily because the controversy over land-value determination outweighed the revenue generated (Gdesz, 2005).
The disappointment over the betterment levies in Poland reflects a tendency worldwide to abandon parcel-by-parcel betterment levies. Countries that continue to use some sort of betterment levy, such as Colombia, have transformed it from parcel-by-parcel estimates of land value gains into a citywide bundle of public works projects, financed in part through a citywide fee, broadly differentiated by benefit zone and other factors (Peterson, 2009).
2.5 Loans, bonds and carbon finance
Larger access to loans and bonds could help to mobilise finance for green urban investment.
Bonds provide institutional investors, such as pension funds, stable yields and limited risks. Urban
green infrastructure investments currently use both to a limited extent, but they could be leveraged
more often for infrastructure investments (Della Croce et al., 2011). There is a relationship between
access to borrowing and cities’ own revenue sources: the more revenue sources a city has, the higher
its perceived repayment capacity, and thus the greater its access to debt markets, including loans.
Local government access to private loans could increase as long as sound local financial
management practices are in place. Some OECD member states’ fiscal rules may ban local
governments from borrowing or issuing bonds; while others constrain the size of municipal budget
deficits or debt levels. In most OECD countries, local governments are only allowed to borrow to
finance investment (the golden rule for debt financing). In some countries, only long-term borrowing
is limited to investment, while short-term loans may be used to finance operating expenditures. Local
borrowing is also subject to prudential regulations, based on debt service and repayment capacity. In
most countries, collateral restrictions exist for debt issuance. As a result of all these constraints, local
governments generally have a low debt to GDP ratio; only in a few OECD countries (e.g. Denmark,
Iceland, Italy and the Netherlands) does the stock of local government liabilities reach 10% of GDP or
more. However, sound local financial management practices could limit the risk of perceived sub-
national fiscal irresponsibility that underlies many of the constraints on sub-national access to
borrowing.

43
Elaborating green bonds
Green bonds are promising vehicles for cities to attract private finance. Green bonds provide a
channel for directing institutional investor capital towards green projects (Della Croce et al. 2011).
Institutional investors, such as pension funds, invest in infrastructure. For example, the Ontario
Teachers’ Pension Plan owns a subsidiary that runs container port terminals in Vancouver and New
York/New Jersey; and other Canadian pension funds are not only funding but actually also running
toll roads in major cities in Australia and the US. Institutional investors in OECD member countries
seek long-term investments with steady yields and limited risks; their portfolios are thus dominated by
bonds, accounting for half of total assets under management in OECD pension funds. The share of
bond investment in green infrastructure is currently small, and even smaller for green urban
infrastructure, but three promising models exist:
1. Multinational development banks: Multilateral development banks have started to fund
green bonds. To ensure returns, the World Bank’s green bonds were structured with standard
financial features, such as an AAA credit rating. Urban green investment projects are
estimated to make up 20% to 25% of the green bond portfolio.18
Other development banks
have created similar instruments: the European Investment Bank has developed Climate
Awareness Bonds financing green projects in several cities, such as district heating in Paris.
2. US Green Bonds: Unlike many other countries, the US has a well-developed market of tax-
exempt local bonds that can substantially help finance cities. These include Clean Energy
Renewable Bonds (CREBs), Qualified Energy Conservation Bonds (QECBs), Property
Assessed Clean Energy Bonds (PACE) and Build America Bonds (BABs) (see Della Croce et
al., 2011). Some cities, including Chicago, have developed their own green bond programme
for energy efficiency and renewable energy goals. Such programmes, however, are only viable
for cities that have credit ratings similar to the national credit ratings; if not, a national
programme would make more sense.
3. Climate-specific institutional investors groups: Several institutional investors have grouped
together to form climate change groups (e.g. Institutional Investors Group on Climate Change
[IIGCC] and the Investor Network on Climate Risk). They are creating their own financing
packages, such as climate bonds, and could potentially be interested in urban sustainability
projects.
Box 11. What are green bonds?
Green bonds are fixed-income securities issued to raise the necessary capital for a project that contributes to a low-carbon, climate-resilient economy. While green bonds can be issued by governments, multinational banks or corporations, most to date have been issued as AAA-rated securities by the World Bank and other multilateral development banks, such as the European Investment Bank (EIB) and the Asian Development Bank (ADB). Green bonds have been designed to attract capital from institutional investors, or as a means for governments to direct funding to climate change mitigation. The current market size for all green bond issuance – approximately USD 15.6 billion – is still marginal (0.017%) compared to the capital held in global bonds markets.
Green bonds are most promising when cities and national governments co-operate. Cities
generally have lower credit ratings than their respective national governments, as their default risk is
considered to be higher (Canuto and Liu, 2010). When cities and local governments issue green bonds,
investors look for risk compensation. For this reason, the US federal government financially supports
municipal bonds (through tax exemptions and subsidies). Some form of urban-national co-operation is
thus required in order for green bonds to be a viable option for cities. For cities in low and middle-

44
income countries, the World Bank offers green bonds as part of project financing within a country’s
assistance portfolio; co-operation with national governments is therefore necessary.
Green infrastructure banks could help solve market failures and the challenge of limited market
size. Development banks serve to unify finances and distribute it across countries through projects like
waste infrastructure or water treatment. Development banks like the Green Investment Bank (GIB), set
up by the UK, may offer financial benefits such as technical assistance or a lengthened loan repayment
period. For this purpose, the UK Government unified local government spending into a lump sum of
GBP 100 million to invest in smaller waste infrastructure projects (typically in the range of GBP 15-
25 million), on a fully commercial basis. The waste infrastructure projects will be transacted initially
through specialised fund managers experienced in this sector, in order to ensure that government funds
are deployed on equal terms with private capital. The bank manages the full procurement process of
these types of loans and investments (e.g. Chicago Infrastructure Trust, set up in 2012 at the city
level).
Wider application of carbon finance
Obstacles to cities’ access to carbon finance need to be addressed. Cities could take better
advantage of opportunities provided by carbon finance (Clapp et al., 2010). The two greenhouse gas
offset mechanisms put in place by the Kyoto Protocol under the United Nations Framework
Convention on Climate Change (UNFCCC) – the Clean Development Mechanism (CDM) and Joint
Implementation (JI) – can serve as sources of revenue for metropolitan areas. CDM allows developed
countries to purchase certified carbon credits from approved emission reduction projects in developing
countries, and JI from emission reduction projects in other developed countries. In addition, voluntary
carbon markets can and have been used to put a price on carbon, independent of any national
emissions cap. Another option is to use domestic offsets as an incentive mechanism, by agreement
between local and national governments; in this case national governments could agree to pay local
governments for emission reductions achieved by local policies, thus assisting with the achievement of
national mitigation targets. To date, the participation of cities and urban mitigation projects in the
global carbon markets remains extremely limited for the following reasons (Clapp et al. 2010; World
Bank, 2010):
Limited autonomy of urban authorities to directly regulate greenhouse gas emissions;
Limited budgets and access to start-up capital;
Limited institutional and technical capacity;
Difficulties in measuring the effects of urban mitigation projects with existing methodologies
and lack of standardised methodologies (e.g. for greenhouse gas inventories at the urban
level);
Small scale of municipal-level greenhouse gas reduction initiatives (e.g. improving the
efficiency of street lights) that do not warrant the transaction costs of pursuing carbon
finance;
Lack of support from national governments.
Overcoming these barriers could facilitate cities’ engagement in carbon finance. Cities’ future use
of these instruments must be integrated into urban planning and financial frameworks so that carbon
financing, if and when available to support urban mitigation projects, also contributes to the broader
urban sustainability agenda.

45
ANNEX 1: THE PROMISES AND PITFALLS OF PUBLIC-PRIVATE PARTNERSHIPS
While there are many definitions of PPPs, there are four commonly agreed features, which were
clearly defined when the European Commission published the Green Paper on PPP in 2004 (OECD,
2008; FNEP and IGD, 2010):
a) A way to mobilise vast amounts of private investment while overcoming public authorities’
inability to close massive and long-standing infrastructure deficits through public financing
alone: PPPs are a ―method of funding‖/ funding tool for the project based partially or totally
on private participation. The level of participation of private sector depends on the type of PPP
arrangement;
b) The long duration of the relationship, involving co-operation between the public and private
partners on different aspects of a project (to be implemented) or a service (to be managed):
This co-operation is one key element since it leads to the ―Partnership‖ nature in the public-
private relationship;
c) The important role of the private operator, who participates at different stages in the project
(design, completion, implementation and/or funding) depending on the PPP arrangement:
Unlike traditional public sector procurement, where the private contractor simply designs
and/or builds what the public sector orders, PPPs involve a competitive tendering process in
which private operators bid for a contract to design, finance and manage the risks involved in
delivering public services or assets. In return, the private contractor is paid fees by the public
body and/or tolls from users for the long-term operation and maintenance of the asset;
d) The distribution of risks between the public partner and the private partner, according to the
ability of concerned parties to assess, control and cope with this risk and the resulting
economic optimum.
Since their development in the UK during the early 1990s, PFIs have been widely developed in
many public services leading to important future obligation of payment from the government (Figure
10). Their development in other European countries is also significant.

46
Figure 10. Estimated payments in real terms under signed PFI contracts in UK
Source: HM Treasury (2011), “UK Private Finance Initiative Projects: Summary Data”, March, HM Treasury, London.
.. PPPs potential advantages
The PPP model has been widely adopted for public infrastructure projects in both developed and
developing countries around the world (Estache, 2006). PPPs present numerous advantages on paper,
but their effectiveness can only be assessed in comparison with other management methods. If public
authorities do not want to go through PPPs, alternative options involve either in-house or traditional
public procurement solutions to implement the necessary infrastructures to provide the service; the
public service can then be operated through either direct public management (in-house) or a private
contractor (supply contract). These are management methods that represent alternatives to PPPs and
can be used as reference points to discuss their efficiency.
Direct public management vs. PPPs
The main consequence of direct public management is exclusion of the private operator.
Comparing the effectiveness of direct public management to a private contractor is thus the same as
comparing the advantages of the private sector or ―the market solution‖ to the public solution (i.e. the
externalisation vs. the in-house provision of a public service). There are two main arguments for
justifying the use of private operators: the differential in skill and scale of operations, and market
incentives.
a) Skills and economy of scale: Private companies that run PPP projects have experience. The
skills they acquire over time permit them to offer better prices compared to a public entity
with less experience.19
Moreover, the multiplicity of contracts awarded to private operators
enables economies of scale: lower unit prices with increased production. Finally, some large
companies are able to provide several services (roads and airports, water distribution and
water treatment, water and transport, etc.), enabling economies of scope: substantial savings
(reduced cost) when several products or services are provided together.

47
b) Market incentives: Employee incentives for effectiveness are greater in PPPs than in an
employment relationship that binds the government and a civil servant. Penalties for failing to
respect the terms of the contract are higher in the market. The probability that the contract will
not be renewed also generates incentives for the private operators to provide better services.20
Finding greater incentives is central to the decision to outsource a public service or any other
activity (Williamson, 1985).
Box 12. Arbitration between rents and incentives
Suppose a company has an intrinsic productivity parameter β, which is characterised by operation costs C, such as: C = β − e. The level of cost C is supposedly influenced not only by the intrinsic efficiency of the company, or β, its parameter of productivity (unobservable), but also by its level of effort e, which is costly for the company. This level of effort is chosen by the company and cannot be contractually imposed (e is a hidden unobservable action). To simplify, let’s consider two types of companies operating on the market: efficient ones with a low productivity parameter βL and inefficient ones with a high productivity parameter βH. Let ψ(e), an increasing and convex function in e (i.e. ψ (e) > 0 and ψ (e) > 0), which represents the cost of the productivity effort for the company. In this simple example, in order to obtain an adequate and efficient productivity level, we need ψ (e) = 1 (i.e. the optimal level of effort chosen by the company must be such that the marginal cost of the effort equalises its marginal gain).
Such a result can be reached simply with a fixed price contract, for which the company is the residual claimant of his efforts (i.e. he retains the savings/ efficiency gains that are made). The problem is to set the price that remunerates
the company at an adequate level. A price that is too high allows an effective company, with a low β, to maintain an
informational income β = βE − βF. A price that is too low excludes inefficient companies and may even exclude efficient ones.
PPP contracts are typically price-capped, fixed-price contracts with strong incentives for administrators that incite them to reduce their costs and produce efficiently. By contracting on service obligations instead of obligations of means, these contracts provide strong incentives. However, it should be noted that these contracts are effective only to the extent that it is possible to contract on all the characteristics of the expected service. If not, private operators may be tempted to reduce their costs at the expense of the quality of service. Therefore, implementing a global contract (PPP) may incite them to use technology that will reduce operating costs; this will result in a mediocre quality of service if all the details regarding the quality expected for the public service in questions are not completely contractible. Hart et al.(1997) show that this type of strategy is being used in American prisons. The services delegated to the private sector are carried out by under-qualified prison guards, resulting in decreased operating costs as, well as reduced quality of service (i.e. prison violence, prison breaks, etc.) According to the authors, this is why the private sector runs prisons for minors, and not maximum security prisons housing dangerous offenders.
The traditional solution (i.e. traditional procurement) is similar to an “obligation of means” contract, which corresponds more to a cost-plus contract. In this case, costs are reimbursed: without incentives because productivity gains generated by the administrators are shared, but with the advantage of not inciting the reduction of operating costs and the expense of quality.
Traditional public procurement vs. PPP
Though the previous arguments can justify the use of the private sector, they cannot justify using
PPPs over traditional public procurement. Authorities rely on private operators to build, maintain and
provide public service for both PPPs and more traditional solutions, such as public procurement. Thus,
the efficiency, or ineffectiveness, of PPPs cannot be based solely on the private firms’ participation
and their effectiveness compared to public bodies. Other arguments for the advantage of PPPs over
traditional solutions focus on the advantages of a global contract and the governance mechanisms
included in these contracts.
Setting up a global contract

48
The main potential advantage of PPPs as stated in the economic literature is the ability to propose
a global contract, linking several related phases of a project (e.g. design, investment, operation,
infrastructure maintenance and the management of the corresponding public service). By proposing a
global package to one private operator, the authorities give incentives to internalise reductions in
operating costs, made possible through investment and proper design of infrastructure support (Hart,
2003; Bennett and Iossa, 2006; Martimort and Pouyet, 2008; Iossa and Martimort, 2008). This has
serious implications for the level of incentives for private operators, as well as for the nature of the
service provided.
This type of contract motivates the operator to take into account the complementarities between
the various stages of the project. Signing a global contract changes the nature and intensity of the
incentives received by the private operator, which results in changes to the amount of investments in
place, to the revenues and/or general wellbeing generated by the service, and to the completion of the
infrastructures. These benefits are rooted in the partnership created between the public and the private
sectors, thus re-equilibrating the incentive abilities of the public and private parties and allowing
private operators to consolidate various phases of a public project.
Deadlines for implementing a new infrastructure are met more readily with a PPP than with a
traditional procedure. Several reports by the NAO show a positive effect on the completion of the
project by the deadline for implementing infrastructure with PFI contracts that have been signed to
date. A recent NAO study shows that ―most private finance projects are built close to the agreed time,
price and specifications: in our sample, 69% of PFI construction projects between 2003 and 2008 were
delivered on time, and 65% were delivered at the contracted price. Of those delivered late, 42% were
delivered within six months of the agreed time, and under half experienced price increases‖ (NAO,
2009). However, the favourable performance of PFIs in comparison with classic procurement, noted
previously in English studies (HM Treasury, 2003), is reduced (see Table 5). In addition, the first
empirical feedback also suggests that infrastructures are delivered within the allocated time, without
delays that would reduce the social utility generated by the projects carried out as partnership
contracts. Specifically, more than 95% of signed French PFIs in total or partial operation were
completed on time (Nardi, 2010).
Table 5. The efficiency of English PFI vs. public sector
This timeliness is explained in part by the strong incentives for the private operator. For example,
payment does not begin before the operation phase of the service, and late penalties exist. Timeliness
is also due to the private partner’s increased participation and the unity of actions of this operator’s
actions (without involvement of a third party) at each phase of the project. Finally, when permitted by
the type of contract and calls for tender, grouping the activities needed to carry out the project into one
contract motivates the private operator to innovate to generate more revenue.
Private operators’ signing on a global contract also affects investment levels for PPPs. In a recent
study financed by the European Investment Bank, Blanc-Brude et al. (2009) investigated the

49
construction costs of European motorway projects (227 projects, including 65 PPP projects) 21
between
1990 and 2005. Construction costs were 25% higher in PPP projects than the others. According to the
authors, this excess might be explained by the will of the private operators to overinvest during the
construction phase in order to reduce the operation costs that would follow and, ultimately, the overall
project costs. The transfer of certain risks from the public sector to the private sector may also
contribute to the cost differential. These potential advantages can only be obtained with the signing of
a long-term contract, enabling a return on investments for the private operators.
In conclusion, economic literature states that the global nature of the PPP contract is essential to
its efficiency. When all the phases are combined and carried out by one private operator, costs are
minimised and the resulting value is maximised for the entire project. This results in investment
strategies that differ from traditional procurement as long as it decreases operating costs and increases
future revenue.
The primacy of the economic objectives
The economic literature also notes that PPPs are characterised by less political interference, thus
allowing greater focus on economic objectives. PPPs are generally more supervised, with explicit or
implicit preliminary evaluation procedures often lacking in public services under state control, or are
limited to one phase of a project (as is the case for traditional procurement). Public bodies sometimes
follow political rather than economic goals, which can affect the effectiveness of state-controlled
services (Shleifer and Vishny, 1994). In contrast, when a private company is in charge of building an
infrastructure or providing a service, it is faced with strong financial pressure, which limits the risk of
political interference. In addition, PPPs require the government to clarify project objectives with a
long-term vision. This clarification is beneficial because it obliges the public authorities to specify
what is needed. This results in an analysis of the value of the program’s elements, and often a decrease
in demands. However, this work is not always clearly carried out through direct public management,
resulting in the spiralling costs and delays often be seen in traditional projects or services.
Better expenditure planning and commitment
With a traditional solution, the government does not generally initiate long-term expenditure for
infrastructure maintenance. With PPPs, however, the private operator must plan all the expenditures
pertaining to the project. Thus, if traditionally managed work is hit by unexpected budget cuts, PPPs
generally maintain a better residual value at the end of the project (Bennett and Iossa, 2006; Auriol
and Picard, 2011).
Potential pitfalls associated with PPPs
While promises and positive feedbacks associated with PPPs exist, negative feedbacks also warn
us that these promises are not automatic. PPPs might be suitable for some kind of transactions, and not
for other. Therefore, a (theoretical) framework to highlight trade-offs is necessary.
Transaction costs
PPPs require the implementation of a long-term partnership that results in transaction costs – ex
ante and ex post contracting costs (i.e. costs arising before and after the signature of the
contract). These include costs for feasibility studies and diagnostics, choosing partners,
writing the contract, enforcing the contract, and dealing with maladaptation and renegotiation
(or amendments) to the contracts (Williamson, 1985). These costs need to be included in the
calculus when assessing the costs and benefits to use PPPs compared to other solution. Some

50
transaction costs also exist within the framework of in-house or traditional procurement solutions.
However, due to the characteristics of PPPs (i.e. investments, long term contracts, incomplete
contracts, uncertainty and risks), transaction costs are higher and harder to limit than with in-house
and traditional procurement solutions. Because the contract relationship is generally shorter in
traditional procurement, transaction costs for traditional solutions should take the form not of
contracting costs, but of incentive decreases – a less visible drawback than the contracting problems
generated by PPPs.
Contract length and transaction costs
Contract length is a crucial feature for PPP efficiency. A long-term contract can recoup the
investment supported by a private operator that cannot be redeployed without costs. In theory, the
contract length should be used not only to recoup the cost of an investment, but also to stagger all
non-recurring expenses and to smooth out yearly hazards.
Pitfalls to long-term contracts do exist, however, and can suggest the benefits of a shorter-term
contract – one that is shorter than amortisation period of the investments required by the private
operator in charge of the service. Long-term contracts limit the frequency of calls for bids, thus
reducing the competition level (i.e. with a long-term contract the private operator benefits from a
monopoly for a longer period of time). If competition in the sector is already low, this should have a
low impact. However, if the competitive intensity is high, missed opportunity to benefit from
competition could be detrimental to the quality of the project.
Incomplete contracting and transaction costs
In addition, high level of uncertainty regarding important parameters of the contractual
relationship, such as the obsolescence of the technologies used and the evolution of future demand,
can be particularly problematic for long-term contracts. Uncertainty prevents contract completeness,
induces mistakes and oversights, and thus necessitates frequent renegotiation of the original contract.
Because these renegotiations can lead to high transaction costs, short-term contracting may sometimes
be more effective for public authorities, even if the responses to calls for tenders are less advantageous
or if service subsidies are necessary (Saussier, 2008).
Transaction costs emerge at different phases of the PPP’s life cycle: the pre-contractual
phase (feasibility study, selection and awarding process), the execution phase, and the post-
contractual phase (renewal of the contract). In addition to the transaction costs that also exist
in traditional procurement, there are transaction costs linked to the partnership aspects of
public-private relationships. The informal features of these partnership relationships
involving trust, reciprocity or reputation increase transaction costs. In order to generate
mutual confidence, the involved stakeholders will have to make serious efforts towards co-
operation and information sharing during the PPP’s life cycle in order to facilitate the
achievement of benefits associated with PPPs.
Life cycle
A complex PPP contract often requires a long and costly feasibility study and award-process
phase. This pre-contractual phase (notably the selection and awarding process) is regulated but does
leave some room in the process depending on the type of PPP. Difficulties related to the pre-
contractual phase are generally due to the complex nature of the projects and the strategic behaviour of
the actors who can impede the selection of the most efficient private operator with the most
advantageous offer. These difficulties also have an impact on the execution phase of PPP contracts.

51
Project specification and competition
The effectiveness of the call for bids depends primarily on the public authorities’ ability to
characterise the desired service. If the buyer cannot precisely outline the object of the call for tender,
potential bidders may be discouraged from participating – due to costs of obtaining information
needed to make an offer and fear of contract renegotiation, especially the risk of public authorities’
attempt to make unilateral changes to the contract (Zupan, 1989a, 1989b; Spiller and Tommasi, 2003;
Guasch and Straub, 2006). Fewer bidders hinder the anticipated benefits from competitive bidding.
Project specification and aggressive offers
If the service obligations are not properly specified, the tendering process may lead to the
selection of the most opportunistic bidders (i.e. those most aware of holes in the contract that could be
exploited ex post (Williamson, 1976; Bajari et al., 2009). An opportunistic candidate who hopes to
take advantage of unforeseen situations in the contract because of its incompleteness will bid very low
and, even as an inferior candidate, will thus be awarded the contract. The analysis proposed here by
Guasch (2004) suggests that this is a frequent occurrence, especially in developing countries. In his
analysis of over 1 000 contracts in Latin American countries, Guasch shows that many contracts are
renegotiated shortly after they have been signed (over 50% of the road concessions and over 70% of
the water contracts are renegotiated within two years of their tendering), very often during the
infrastructure building phase and to the advantage of the private administrators (i.e. with an increase in
price and/or length of concession). The author concludes that offers by administrators do not constitute
actual commitments.
Other studies from developed countries also show a high level of renegotiations for PPPs (Athias
and Saussier, 2007). Nevertheless, observing a high level of renegotiations does not automatically
mean the administrator or government representative is opportunistic. Any long-term contract must
adapt to new conditions that cannot be anticipated when the contract is signed (Brux, 2010). In this
sense, renegotiations are analysed as natural reformulations during the contract period.
Uncertainty related to the project and optimistic offers
Even if the government’s expectations are clearly defined, each potential bidder may evaluate
uncertainty associated with the project differently. This is more likely to occur when the private
operator is paid from the revenue generated by the infrastructure being implemented, and there is real
uncertainty regarding the future use of the work. The invitation to bid may results in the selection of
candidates who are most optimistic regarding the future operating conditions and the future level of
demand. This can lead to the so-called ―winner’s curse‖.22
This phenomenon, documented in a study
by Athias and Nunez (2008), is more likely to occur when the institutional environment allows
contracts to be easily renegotiated. Athias and Nunez’s study examined 49 concession projects around
the world and showed that private operators bid less aggressively when they expect strong competition
(i.e. they include a risk premium based on the number of bidders in order to avoid the winner’s
curse).23
This behaviour is less evident in countries where the institutional framework is conducive to
contract renegotiation.
Enforcement costs
Problems that arise during the execution phase of PPP contracts are linked to contract
incompleteness, generating risks of opportunism by the partners (both government and private partner
opportunism). Once the bid has been won and the contract begun, the partners may break their
promises and attempt to renegotiate the initial contract.

52
Unless there are serious and repeated counter-performances, the winner of a bid knows that there
is little risk of being replaced before the end of the contract. Respect of the contract length is the return
for the sustainable investments made; by guaranteeing length of commitments, the government can
both incentivise actors to invest in long-term assets and prove its credibility to future partners. Rather
than becoming involved in a lengthy and expensive process of conflict resolution, taking on the
transition costs and facing a break in service, the unsatisfied buyer would prefer to continue the
relationship and renegotiate a compromise (Williamson, 1976). Consequently, breaking the contract is
very rare.
Moreover, because of their inherent incompleteness, contracts are not perfect ways to coordinate
exchanges. They cannot foresee all of the future situations and must be adapted in case of disruption.
Beneficially, this includes renegotiations to ―realign‖ the contract with its economic environment
(Brux, 2010). However, contract incompleteness also leaves room for strategic actions that result in
costly renegotiations, unjustified from a social point of view; these renegotiations are generally
bilateral and exclude important stakeholders – the consumers and citizens (Estache, 2006).
Box 13. Frequency of renegotiations in concessions
A study by Guasch (2004) is based on the analysis of over 1 300 infrastructure concessions signed between 1980 and 2003 in Latin American and Caribbean countries. To our knowledge, this is the most exhaustive study (based on the largest number of concessions) that exists.
Sector % of renegotiated contracts Average time before renegotiation (in years)
All sectors combined
42% 2.1
Electricity 10% 2.3
Transport 57% 3.1
Water 75% 1.7
In addition to frequency, contract size was also analysed.
% of contracts negotiated resulting in:
Relaxation of the time frame 69%
Reduction of the time frame 18%
Increase of charges 62%
Reduction of charges 19%
Increase in number of components with automatic “pass-through” by increasing charges
59%
Extension of the concession period 38%
Other less exhaustive studies show that renegotiations are just as common in industrialised countries. In a recent
report, Engel et al. (2011) note that, in the case of transport concessions signed since 1991 in the United States, “six
out of twenty projects have undergone a major change in the initial contractual agreement, favouring the concessionaire, and two additional projects have pending renegotiations” (Engel et al., 2011, 11). Regarding France, Athias and Saussier (2007) estimate that approximately 50% of the French motorway concession contracts underwent substantial renegotiations. A more recent study on parking concessions in France concludes that contracts are renegotiated about once every two and a half years (Brux et al., 2011). This study indicates that frequency of
renegotiations does not seem to reflect disagreements between the parties since it does not affect the probability of the parties renewing the contracts once they have ended.
In conclusion, the economic analysis and empirical feedback suggests that grouping several steps
of the same project into one long-term contract can lead to a more efficient production and better

53
quality of service – i.e. signing a PPP is more advantageous than going through traditional
procurement. The few examples that we have mentioned are promising. However, there are some
examples of unsuccessful PPP with empirical feedback that is less positive. These examples suggest
that the gains in effectiveness of PPP are only potential, and certain conditions must be fulfilled for
this potential to be reached (Engel et al., 2010). Costs at each step of a PPP’s implementation could
reduce, and even nullify a PPP’s advantages. Therefore, costs must be minimised to maintain the
anticipated profits from the PPP. The characteristics of PPPs are at the sources of their potential
benefits and drawbacks compared to traditional procurement and internal solutions (Table 6).

54
Table 6. Strengths and pitfalls of PPPs
Main Features of
PPP
Potential Strengths of PPP Potential Pitfalls of PPP
Global contracts
Minimisation of the global cost
of the project (Hart, 2003)
Incentive to invest and
innovate
Economies of scale and
scope
Management of the whole
project
The selected operator is not always the
best one for each step of the project
Scale and scope economies reduced
Contractualisation issues
Lower intensity of competition
Contractual rigidities
Need to contractualise on verifiable
objectives
LT agreement
Allow to recoup for the cost of investment
Incentive to invest
Incentive to offer a good bid
Incentive to offer a bid that minimise
costs over the whole duration of the
contract
Smooth out yearly hazards
Reduction of competition (lower number
of call for tenders)
Higher uncertainty on technology, level
of demand
Need for flexibility and adaptation
Complex project
Competitive dialogue when used
Helps innovation to emerge
Fosters the use of private expertise and
competencies
Contractual incompleteness
Room for opportunistic behaviours
Winner’s curse
Future renegotiations
Risk transfer to
private operator
Transferring risks to the party best placed to
manage them ensures best value for money.
Risk premium increases the cost of PPP
Spread payment
Payment of the up-front investments is
spread through time with payment schemes
based on
The demand (i.e. tolls or shadow tolls)
The availability (i.e. performance
indicators)
LT agreement

55
BIBLIOGRAPHY
Allen & Overy LLP (2010), Global Guide to Public-Private Partnerships, Allen & Overy, London.
Anderson, J. (1990), ―Tax Increment Financing: Municipal Adoption and Growth‖, National Tax
Journal, Vol. 43, No. 2, pp. 155-64.
Athias, L. and A. Nunez (2008), ―Winner’s Curse in Toll Road Concessions‖, Economics Letters, Vol.
101, No. 3, pp. 172–174.
Athias, L. and S. Saussier (2007), « Un Partenariat Public-Privé Rigide ou Flexible ? Théorie et
Applications aux Concessions Routieres », Revue Economique, Vol. 58, No. 3, pp. 565–576.
Auriol, E. and P. Picard (2011), ―A Theory of BOT Concession Contracts‖, Centre for Economic
Policy Research (CEPR) Discussion Papers, No. 8323, CEPR, London.
Bajari, P., R. S. MacMillan and S. Tadelis (2009), ―Auctions versus Negotiations in Procurement: An
Empirical Analysis‖, The Journal of Law, Economics and Organization, Vol. 25, No. 2, pp. 372-
399.
Bajari, P. and S. Tadelis, (2001), ―Incentives versus Transaction Costs: A Theory of Procurement
Contracts‖, RAND Journal of Economics, Vol, 32, No. 3, pp. 387-407.
Baker, G., R. Gibbons and K. J. Murphy (2002), ―Relational Contracts and the Theory of the Firm‖,
The Quarterly Journal of Economics, Vol. 117, No. 1, pp. 39-84.
British Columbia Ministry of Community Services (2005), Development Cost Charge Best Practices
Guide. British Columbia (BC) Ministry of Community Services, Victoria, BC.
Beevers, S. D. and D. C. Carslaw (2005), ―The Impact of Congestion Charging on Vehicle Emissions
in London‖, Atmospheric Environment, Vol. 39, No. 1, January, pp. 1-5.
Bennett, J. and E. Iossa, (2006), ―Building and Managing Facilities for Public Services‖, Journal of
Public Economics, Vol. 90, No. 10-11, pp. 2143-2160.
Bird, R. M. and E. Slack (2004), International Handbook on Land and Property Taxation, Edward
Elgar, Cheltenham, UK.
Bird, R. M. and E. Slack (2007), ―Taxing Land and Property in Emerging Economies: Raising
Revenue ... and More‖, in G. Ingram and Y-H Hong (eds.), Land Policies and Their Outcomes,
Lincoln Institute of Land Policy, Cambridge, MA.
Bird, R. M., E. Slack and A. Tassonyi (2012), A Tale of Two Taxes: Property Tax Reform in Ontario,
Lincoln Institute of Land Policy, Cambridge, MA.
Blais, P. (2010), Perverse Cities: Hidden Subsidies, Wonky Policy, and Urban Sprawl. UBC Press,
Vancouver, BC.

56
Blanc-Brude, F., H. Goldsmith and T. Valila (2009), ―A Comparison of Construction Contract Prices
for Traditionally Procured Roads and Public Private Partnerships‖, Review of Industrial
Organization, Vol. 35, No. 1-2, pp. 19-40.
Bourassa, S. (1990), ―Land Value Taxation and Housing Development: Effects of the Property Tax
Reform in Three Types of Cities‖, American Journal of Economics and Sociology, Vol. 49, No. 1,
pp. 101-111.
Briffault, R. (2010), ―The Most Popular Tool: Tax Increment Financing and the Political Economy of
Local Government‖, University of Chicago Law Review, Vol. 65.
Brueckner, J. K. (2001), ―Property Taxation and Urban Sprawl‖, in W. E. Oates (ed.), Property
Taxation and Local Government Finance. Lincoln Institute of Land Policy, Cambridge, MA.
Brueckner, J. and H. A. Kim (2003), ―Urban Sprawl and the Property Tax‖, International Tax and
Public Finance, Vol. 10, No. 1, pp. 5-23.
Brux, J. de (2010), ―The Dark and Bright Sides of Renegotiation: An Application to Transport
Concession Contracts‖, Utilities Policy, Vol. 18, No. 2, pp. 77–85.
Brux, J. de, J. Beuve and S. Saussie (2011a), ―Renegotiations and Contract Renewals in PPPs: An
Empirical Analysis‖, Paper presented at Conference on Contracts, Procurement, and Public-Private
Agreements, Paris, 30 May.
Brux, J. de, C. Desrieux and V. Piron (2011b), « Risques, Choix des Projets à Réaliser et Choix
Contractuels », Transport, Vol. 465, pp. 1–11.
Buildings Performance Institute Europe (BPIE) (2010), Cost Optimality: Discussing Methodology and
Challenges within the Recast Energy Performance of Buildings Directive, BPIE,
www.buildup.eu/system/files/content/BPIE_costoptimality_publication2010.pdf.
Burge, G. S. (2010), ―The Effects of Development Impact Fees on Local Fiscal Conditions‖, in G. K.
Ingram and Y-H Hong (eds.), Municipal Revenues and Land Policies, Lincoln Institute of Land
Policy, Cambridge, MA, pp. 182-212.
Canuto, O. and L. Liu (2010), ―Sub-National Debt Finance: Make it Sustainable‖, World Bank
Working Paper, World Bank, Washington DC.
Chernick, H., A. Langley and A. Reschovsky (2010), Revenue Diversification and the Financing of
Large American Central Cities, Working Paper, Lincoln Insitute of Land Policy, Cambridge,
MA.
Chong, E., F. Huet S. and Saussier (2006), ―Auctions, Ex Post Competition and Prices: The Efficiency
of Public-Private Partnership‖, Annals of Public and Cooperative Economics, Vol. 77, No. 4, pp.
517-549.
Clapp, C, A. Leseur, O. Sartor, G. Briner, J. Corfee-Morlot (2010), ―Cities and Carbon Market
Finance: Taking Stock of Cities’ Experience with Clean Development Mechanism (CDM) and
Joint Implementation (JI)‖, OECD Environmental Working Paper No. 29, OECD, Paris.

57
Corfee-Morlot, J., V. Marchal, C. Kauffmann, C. Kennedy, F. Stewart. C. Kaminker and G. Ang
(2012), ―Towards a Green Investment Policy Framework: The Case of Low-Carbon, Climate-
Resilient Infrastructure‖, OECD Environment Working Papers, OECD, Paris.
Dachis, D. (2011), ―Congestive Traffic Failure: The Case for High-Occupancy and Express Toll Lanes
in Canadian Cities‖, Essential Policy Intelligence E-brief, August, C. D. Howe Institute,
www.cdhowe.org/pdf/ebrief_122.pdf.
Davies, P. and K. Eustice (2005). Delivering the PPP promises in Europe. PriceWaterhouseCoopers
(PwC), www.pwc.com/en_GX/gx/government-infrastructure/pdf/promisereport.pdf.
Della Croce, R., C. Kaminker, F. Stewart (2011), The Role of Pension Funds in Financing Green
Growth Initiatives, OECD Working Papers on Finance, Insurance and Private Pensions, No.10,
OECD, Paris
Deskins, J. and W. Fox (2010), ―Measuring the Behavioral Responses of the Property Tax‖, in R.
Bahl, J. Martinez-Vazquez, and J. Youngman, Challenging the Conventional Wisdom of the
Property Tax, Lincoln Instittue of Land Policy, Cambridge, MA, pp. 47-66.
Desrieux, C., E. Chong and S. Saussier (2008), ―Horizontal Integration and Relational Contracting: An
Application to the French Water Sector‖, Working Paper, http://pdfcast.org/pdf/horizontal-
integration-and-relational-contracting-an-application-to-local-public-services.
Dye, R. and D. Merriman (2006), ―Tax Increment Financing: A Tool for Economic Development‖,
Land Lines, Vol.18, No. 1.
Engel, E., R. Fischer and A. Galetovic (1997), ―Highway Franchising: Pitfalls and Opportunities‖, The
American Economic Review, Vol. 87, No. 2, pp. 68-72.
Engel, E., R. Fischer and A. Galetovic (2006), ―Privatizing Highways in the United States‖, Review of
Industrial Organization, Vol. 29, No. 1, pp. 27-53.
Engel, E., R. Fischer, and A. Galetovic (2010), ―The Economics of Infrastructure Finance: Public-
Private Partnerships versus Public Provision‖, EIB Papers, No. 2/2010, European Investment Bank,
Economics Department, Luxembourg.
Engel, E., R. Fisher and A. Galetovic (2011), ―Public-Private Partnerships to Revamp U.S.
Infrastructure‖, Discussion Paper 2011-02, The Hamilton Project, Brookings.
Estache, A. (2006), ―PPI Partnerships vs. PPI Divorces in LDCs‖, Review of Industrial Organization,
Vol. 29, No. 1, pp. 3-26.
European Commission (2009), ―Regulation (Ec) No. 714/2009 of the European Parliament and of the
Council of 13 July 2009 on Conditions for Access to the Network for Cross-Border Exchanges in
Electricity and Repealing Regulation (EC) No. 1228/2003‖, Off. J. Eur. Union L 211, 15-35.
Fox, W. F. and E. Slack (2010), ―North America‖, The State of Local Government Finance: Are We
Ready to Face the Demand, United Cities and Local Governments, Barcelona, pp. 289-314.

58
FNEP (Foundation Nationale Enterprise et Performance) and IGD (l’Institut de la Gestion Deleguee)
(2010), ―Partenariats Public-Privé et Performance des Investissements Publics‖, Public presentation
of the work of Mission 2009, Science Po, Paris, 21 October.
Fróes, M. and J. Rebelo (2006), ―Urban Operations and the São Paulo Metro Line 4‖, Working paper,
World Bank,
http://web.worldbank.org/WBSITE/EXTERNAL/TOPICS/EXTTRANSPORT/EXTURBANTRA
NSPORT/0,,contentMDK:20249518~menuPK:610867~pagePK:148956~piPK:216618~theSitePK:
341449,00.html.
Gdesz, M. (2005), ―Adjacency Levies in Poland – Main Problems‖, paper for FIG Working Week
2005, 16-21 April 2005, Cairo.
George, H. (1879), Progress and Poverty: An Inquiry into the Cause of Industrial Depressions and of
Increase of Want with Increase of Wealth: The Remedy, Doubleday, Page & Co., Garden City,
NY.
Gillingham, K., R. G. Newell and K. Palmer (2009), ―Energy Efficiency Economics and Policy‖,
Annual Review of Resource Economics, Annual Reviews, Vol. 1, No. 1, pp. 597-620.
Greater Toronto Area (GTA) Task Force (1996), Greater Toronto. GTA Task Force, Toronto.
Guasch, J. L. (2004), Granting and Renegotiating Infrastructure Concession: Doing It Right. World
Bank, Washington DC.
Guasch, J. L. and S. Straub (2006), ―Renegotiation of Infrastructure Concessions: An Overview‖,
Annals of Public and Cooperative Economics, Vol. 77, No. 4, pp. 479-493.
Hart, O. (2003), ―Incomplete Contracts and Public Ownership: Remarks, and an Application to Public-
Private Partnerships‖, The Economic Journal, Vol. 113, No. 485, Conference Papers (March),
Blackwell Publishing for the Royal Economic Society, pp. C69-C76.
Hart, O., A. Shleifer and R. W. Vishny (1997), ―The Proper Scope of Government: Theory and an
Application to Prisons, Quarterly Journal of Economics, Vol. 112, No. 4, pp. 1127-1161.
Haveman, M. and Sexton, T. A. (2008), Property Tax Assessment Limits: Lessons from Thirty Years of
Experience, Lincoln Institute of Land Policy, Cambridge, MA.
House of Commons Committee of Public Accounts (2003), ―Delivering Better Value for Money from
the Private Finance Initiative‖, Twenty-eighth Report of Session 2002-03 (HC 764), House of
Commons, London.
House of Commons Treasury Committee (2011), ―Private Finance Initiative‖, Seventeenth report of
Session 2010-2012 (HC1146), House of Commons, London.
Houser, T. (2009), The Economics of Energy Efficiency in Buildings, Peterson Institute for
International Economics, http://www.piie.com/publications/pb/pb09-17.pdf.
HM Treasury (2003), PFI: Meeting the Investment Challenge, HM Treasury, London.

59
HM Treasury (2011), ―UK Private Finance Initiative Projects: Summary Data‖, March, HM Treasury,
London, www.hm-treasury.gov.uk/d/pfi_data_summary_november_2011.pdf.
Hong, H. and M. Shum (2002), ―Increasing Competition and the Winner’s Curse: Evidence from
Procurement‖, Review of Economic Studies, Vol. 69, No. 4, pp. 871-898.
Hoornweg, D. et al. (eds.) (2011), Cities and Climate Change: Responding to an Urgent Agenda,
World Bank, Washington DC.
IEA (2011), Energy for All: Financing Access for the Poor, World Energy Outlook 2011, International
Energy Agency, Paris.
Iossa, E. and D. Martimort (2008), ―The Simple Micro-Economics of Public-Private Partnerships‖,
CEIS Working paper No. 139, CEIS, http://dx.doi.org/10.2139/ssrn.1271082.
Kamal-Chaoui, L. and A. Robert (2009), Competitive Cities and Climate Change, OECD, Paris.
Kaminker, C., F. Stewart (2012), ―The Role of Institutional Investors in Financing Clean Energy‖,
OECD Working Papers on Finance, Insurance and Private Pensions, No. 23, OECD Publishing
Katherine F. et al. (2009), ―Saving Energy Cost Effectively: A National Review of the Cost of Energy
Saved Through Utility-Sector Energy Efficiency Programs‖, Research Report U029, American
Council for an Energy Efficient Economy (ACEEE), http://www.aceee.org/research-
report/u092.
Kennedy, C. et al. (2010), ―Getting to Carbon Neutral: A Review of Best Practices in Infrastructure
Strategy‖, in Bose, B. K. (ed), Energy Efficient Cities: Assessment Tools and Benchmarking
Practices, World Bank, Washington DC, pp. 165-184.
KPMG (2011), CDP Cities 2011 Global Report on C40 Cities, Carbon Disclosure Project,
c40citieslive.squarespace.com/storage/CDP%20Cities%202011%20Global%20Report.pdf.
Lambert-Mogiliansky, A. and G. Kosenok (2009), ―Fine-Tailored for the Cartel-Favoritism in
Procurement‖, Review of Industrial Organization, Vol. 35, No. 1-2, pp. 95-121.
LeRoy, G. (2008), ―Greenfields, and Sprawl: How an Incentive Created to Alleviate Slums Has Come
to Subsidize Upscale Mall and New Urbanist Developments‖, Planning and Environmental
Law, Vol. 60, No. 2, pp. 3-11.
Managan, K. and P. Sweatman (2010), Financing Energy Efficiency Building Retrofits. Climate
Strategy and Partners, www.climatestrategy.es/index.php?id=19&accion=download&item=7.
Marron, D. B. (1997), ―Buying Green: Government Procurement as Instrument of Environmental
Policy‖, Public Finance Review, Vol. 25, pp. 285-305.
Marshall, J. (2008), Fiscal Variables and Urban Sprawl, Ph.D. Thesis, University of Tennessee,
Knoxville.
Martimort, D. and J. Pouyet (2008), ―To Build or Not to Build: Normative and Positive Theories of
Public-Private Partnerships‖, International Journal of Industrial Organization, Vol. 26, No. 2, pp.

60
393-411.
Maskin, E. and J. Tirole (2008), ―Public-Private Partnerships and Government Spending Limits‖,
International Journal of Industrial Organization, Vol. 26, No. 2, pp. 412-420.
Mathis, E. and C. Zech (1982), ―An Empirical Test: The Economic Effects of Land Value Taxation‖,
Growth and Change, Vol. 13, No. 4, pp. 2-5.
Maurer, R. and A. Paugam (2000), Reform toward Ad Valorem Property Tax in Transition Economies:
Fiscal and Land Use Benefits, World Bank, Washington, DC.
McAfee, R. P. and J. MacMillan (1987), ―Auctions and Bidding‖, Journal of Economic Literature,
Vol. 25, No. 2, pp. 699-738.
McGuire, T. J., and D. L. Sjoquist (2003), ―Urban Sprawl and the Finances of State and Local
Governments‖, in D. Sjoquist (ed.), State and Local Finances Under Pressure, Elgar
Publishing, Cheltenham, UK and Northampton, MA, pp. 29-326.
Morris, A. C. (1998), ―Property Tax Treatment of Farmland: Does Tax Relief Delay Development?‖,
in H. Ladd, Local Government and Land Use Policies in the United States, Edward Elgar,
Cheltenham, pp. 144-67.
NAO (UK National Audit Office) (2004), London Underground PPP: Were they good deals?, NAO,
London.
NAO (2009), ―Private Finance Projects‖, A Paper for the Lords Economic Affairs Committee,
October, NAO, London.
Nardi, T. (2010), « La Gestion du Temps en Contrat de Partenariat », Rapport Technique Rapport
Mappp, Mission d’Appui aux Partenariats Public‐Privé, Paris
Nelson, A. and M. Moody (2003), Paying for Prosperity: Impact Fees and Job Growth. Brookings
Institution Center on Urban and Metropolitan Policy, Washington, DC.
Netzer, D. (1998), ―The Relevance and Feasibility of Land Value Taxation in the Rich Countries‖,,in
D. Netzer, Land Value Taxation: Can It and Will It Work Today?, Lincoln Institute of Land
Policy, Cambridge, MA, pp. 109-136.
Oates, W. E. and R. M. Schwab (1997), ―The Impact of Urban Land Taxation: The Pittsburgh
Experience‖, National Tax Journal, Vol. 50, No. 1, pp. 1-21.
OECD (2007), Infrastructure to 2030 (Vol.2), Mapping Policy for Electricity, Water and Transport,
OECD, Paris.
OECD (2008), Les Partenariats Public-Privé : Partager les Risques et Optimiser les Ressources,
OECD, Paris.
OECD (2009), OECD Territorial Reviews: Copenhagen, Denmark, OECD, Paris.
OECD (2010a), OECD Territorial Reviews: Toronto, Canada, OECD, Paris.

61
OECD (2010b), Cities and Climate Change, OECD, Paris.
OECD (2010c), OECD Territorial Reviews: Guangdong, China, OECD, Paris.
OECD (2011), ―Cities and Green Growth: A Conceptual Paper‖, Issues paper for the 13th Session of
the Working Party on Territorial Development Policies in Urban Areas, OECD, May.
Parry, M. et al. (2009), Assessing the Costs of Adaptation to Climate Change: A Review of the
UNFCCC and Other Recent Estimates, International Institute for Environment and Development
(IIED) and Grantham Institute for Climate Change, London.
Peterson, G. (2006), ―Land Leasing and Land Sale as an Infrastructure-Financing Option‖, World
Bank Policy Research Working Paper, No. 4043, Washington DC.
Peterson, G. (2009), Unlocking Land Values for Urban Infrastructure Finance, World Bank
Publications, Washington DC.
Plassmann, F. and T. Tideman (2000), « A Markov Chain Monte Carlo Analysis of the Effect of Two-
Rate Property Taxes on Construction‖, Journal of Urban Economics, Vol. 47, No. 2, pp. 216-
247.
Quigley, M. (2007), A Tale of Two Cities: Reinventing Tax Increment Financing, The Heartfelt
Institute, Chicago.
Saussier, S. (1998), « Théorie des Coûts de Transaction et Durée des Contrats : Une Analyse
Empirique », Economie et Prévision, Vol. 135, No. 4-5, pp. 137-147.
Saussier, S., C. Staropoli and A. Yvrande-Billon (2009), ―Public Private Agreements, Institutions and
Competition: When Economic Theory Meets Facts‖, Review of Industrial Organization, Vol. 35,
No. 1, pp. 1-18.
Shleifer, A. and R. W. Vishny (1994), ―Politicians and Firms‖, The Quarterly Journal of Economics,
Vol. 109, No. 4, pp. 995-1025.
Skaburskis, A. (2003), ―Planning City Form: Development Cost Charges and Simulated Markets‖,
Planning Practice and Research, Vol. 18, No. 2, pp. 197-211.
Slack, E. (2002), Municipal Finance and the Pattern of Urban Growth, C. D. Howe Institute, Toronto.
Slack, E. and R. M. Bird (1991), ―Financing Urban Growth Through Development Charges‖,
Canadian Tax Journal, Vol. 39, No. 5.
Song, Y. and Y. Zenou (2009), ―How Do Differences in Property Taxes Within Cities Affect Urban
Sprawl?‖, Journal of Regional Studies, Vol. 49, No. 5, pp. 801-831.
Song, Y. and Y. Zenou (2006), ―Property Tax and Urban Sprawl: Theory and Implications of US
Cities‖, Journal of Urban Economics, Vol. 60, No. 3, pp. 519-34.
Spiller, P. T. (2008), ―An Institutional Theory of Public Contracts: Regulatory Implications‖, Working
paper, National Bureau of Economic Research, Inc.

62
Spiller, P. T. and M. Tommasi (2003), ―The Institutional Foundations of Public Policy: A Transactions
Approach with Application to Argentina‖, Journal of Law, Economics and Organization, Vol. 19,
No. 2, pp. 281–306.
Stern, N. (2007), The Economics of Climate Change - The Stern Review, Cambridge University
Press, January.
Talanker, A., K. Davis and G. LeRoy (2003), ―How States are Weakening Enterprise Zone and Tax
Increment Financing Programs‖, State Tax Notes, Vol. 3, No. 1, October.
Thompson, W. (1968), ―The City as a Distorted Price System‖, Psychology Today, Vol. 2, pp. 30-33.
Thomson, J. and T. Jackson (2007), ―Sustainable Procurement in Practice: Lessons from Local
Government‖, Journal of Environmental Planning and Management, Vol. 50, No. 3, pp. 421-444.
Tian, L. and W. Ma (2009), ―Government Intervention in City Development in China: A Tool of Land
Supply‖, Land Use Policy, Vol. 26 (2009), pp. 599-609
Tomalty, R. and A. Skaburskis (1997), ―Negotiating Development Charges in Ontario: Average Cost
versus Marginal Cost Pricing of Services‖, Urban Studies, Vol. 34, No. 12, pp. 1987-2003.
Tomalty, R. and A. Skaburskis (2003), ―The Politics of Average versus Marginal Cost Pricing of
Development Charges: A Canadian Case Study‖, in F. Ennis, Infrastructure Provision and the
Negotiating Process, Ashgate, Hamshire, UK.
Torres, L. and V. Pina (2001), ―Public Private Partnership and Private Finance Initiatives in the EU
and Spanish Local Governments‖, The European Accounting Review, Vol. 10, No. 3, pp. 601-
619.
Wassmer, R. (1994), ―Can Local Incentives Alter a Metro City’s Economic Development?‖, Urban
Studies, Vol. 31, No. 8, pp. 1251-78.
WEF (2010), Green Investing 2010: Policy Mechanisms to Bridge the Financing Gap, World
Economic Forum, Geneva.
Williamson, O. E. (1976), ―Franchise Bidding for Natural Monopolies: In General and with Respect to
CATV‖, Bell Journal of Economics, Vol. 7, No.1, pp.73-104.
Williamson, O. E. (1985), The Economic Institutions of Capitalism, The Free Press, New York.
Williamson, O. E. (1999), ―Public and Private Bureaucracies: A Transaction Cost Economics
Perspective‖, Journal of Law, Economics and Organization, Vol. 15, No. 1, pp. 306–342.
World Bank (2010), A City-Wide Approach to Carbon Finance, World Bank, Washington DC.
Youngman, J. (2011), TIF at a Turning Point: Defining Debt Down, Lincoln Institute of Land Policy,
Cambridge, MA.
Zupan, M. A. (1989a), ―Cable Franchise Renewals: Do Incumbent Firms Behave Opportunistically?‖,
RAND Journal of Economics, Vol. 20, No. 4, pp. 473-482.

63
Zupan, M. A. (1989b), ―The Efficacy of Franchise Bidding Schemes in the Case of Cable Television:
Some Systematic Evidence‖, Journal of Law and Economics, Vol. 32, No. 2, pp. 401-456.

64
NOTES
1 These recommendations are the result of discussion and adoption at the OECD Roundtable of Mayors
and Ministers, 8th
March 2012 in Chicago, Illinois, United States.
2 Effective property tax rates are calculated as total property tax revenues divided by the market value
of properties.
3 This finding assumes that a change in the value of the property will be assessed for tax purposes on a
regular basis. However, assessed values lag market values in many jurisdictions.
4 The choice of highest and best use (rather than current use) as the tax base is also likely to result in
higher densities.
5 Levelised cost of energy (LCOE) is the USD/MWh (megawatt) price for an inflation-adjusted fixed-price off-take agreement that offers the project developer the minimum equity return necessary to undertake the project.
6 Article 2(1a) gives a purely qualitative definition: A ―nearly zero-energy building‖ is a building that
has a very high-energy performance. The nearly zero or very low amount of energy must come from
renewable sources (to a very significant extent). The timescales are further amplified in Article 9 of
the directive, which states that member states shall ensure that: (a) by 31 December 2020, all new
buildings are nearly zero-energy buildings; and (b) after 31 December 2018, new buildings occupied
and owned by public authorities are nearly zero-energy buildings.
7 Share of investment risks is the amount of operational revenue that guarantees the internal rate of
return comparable to the government bond’s rate of return on the private sector’s capital.
8 The capital region includes the city of Seoul and Kyonggi province.
9 Brownfields are urban sites that are underutilised, often vacant, and sometimes contaminated.
Because of their proximity to downtown areas where infrastructure is generally in place, brownfields
hold a great deal of potential for redevelopment. The realisation of this potential is hindered, however,
by cleanup costs of contaminated lands, the costs of upgrading or replacing existing but older
infrastructure, and the liability. In many cases, traditional sources of private financing are hesitant to
invest in brownfield sites because of the risks associated with their redevelopment. Although there is
the potential for future rewards, these lands often remain unused because of a lack of upfront
redevelopment financing.

65
10
TIFs are not used in Arizona.
11 TIF legislation was passed by the provincial government in 2006, but the regulations have yet to be
promulgated.
12 Earlier studies of TIFs that expand on their benefits include, for example, Wassmer (1994) and
Anderson (1990). More recent studies question the use of TIFs. See, for example, Youngman (2011)
and Briffault (2010).
13 In some US states, the TIF can also apply to the local portion of the sales tax.
14 A recent study suggests that legislative changes in 16 states have weakened TIFs by permitting them
to be used in non-blighted areas; seven states strengthened their TIF programs (Talanker, Davis and
LeRoy, 2003).
15 In Canada, development charges are also referred to as development cost charges and lot levies. In the
US, impact fees are also called development fees, capacity fees, facility fees, capital recovery fees,
system development charges, expansion fees, and mitigation fees (Burge, 2010).
16 Other exactions (formal or informal) on the developer are part of the subdivision approval process but
are not strictly development charges. These include, for example, land dedications that require the
developer to set aside land for roadways, other public works or school sites, or for environmental
needs; parkland dedications that require a portion of the land used for development to be set aside for
parkland (or a cash payment in lieu of parkland); density bonuses granted to developers (i.e. higher
densities than permitted in the Official Plan, in return for meeting conditions such as providing day
care or preserving a historic building); connection fees to permit developers to buy into existing
capacity of water and sewer facilities; and over-sizing provisions (sometimes called front-end
financing) that require developers to provide more infrastructure than is required for their
development. The municipality, in some cases, agrees to recover part of the costs on behalf of the
developer from future benefitting owners.
17 Municipalities in BC can only levy development cost charges for roads, drainage, sewers, water and
parkland. The City of Vancouver, under its own legislation, can also levy for affordable housing and
day care facilities.
18 According to a spokesperson of the World Bank Capital Markets Department.
19 For example, it is rare for a municipality to have several different management experiences for water
services during one mandate, and therefore to be able to learn from the successes and failures of these
experiences.
20 Even if contract renewal is not in the near future, the reputation of the contractor will have a
significant effect on other potential contracts (Chong et al., 2006).
21 The 65 projects are concession contracts and PFIs.
22 The most optimistic respondents, if selected, are also those with the highest risk of going bankrupt
during the contract – thus the winner’s curse, which falls on the one who is chosen in this type of risky
project.
23 This result is also found in the study by Hong and Shum (2002).
Related Documents


