Financing Global Health 2020 The impact of COVID-19 healthdata.org

Welcome message from author
This document is posted to help you gain knowledge. Please leave a comment to let me know what you think about it! Share it to your friends and learn new things together.
Transcript

Financing Global Health 2020The impact of COVID-19
healthdata.org

Financing Global Health 2020The impact of COVID-19

2 | FINANCING GLOBAL HEALTH 2020
This report was prepared by the Institute for Health Metrics and Evaluation (IHME) through core funding from the Bill & Melinda Gates Foundation. The views expressed are those of the authors.
The contents of this publication may be reproduced and redistributed in whole or in part, provided the intended use is for noncommercial purposes, the contents are not altered, and full acknowledgment is given to IHME.
This work is licensed under the Creative Commons Attribution-NonCommercial-NoDerivs 4.0 Unported License. To view a copy of this license, please visit https://creativecommons.org/licenses/by-nc-nd/4.0/. For any usage that falls outside of these license restrictions, please contact IHME Global Engagement at [email protected].
Citation: Institute for Health Metrics and Evaluation (IHME). Financing Global Health 2020: The impact of COVID-19. Seattle, WA: IHME, 2021.
Institute for Health Metrics and Evaluation3980 15th Ave. NE Seattle, WA 98195USA www.healthdata.org
To request copies of this report, please contact IHME:Telephone: +1-206-897-2800Fax: +1-206-897-2899Email: [email protected]
Printed in the United States of America
ISBN 978-0-9976462-9-0
© 2021 Institute for Health Metrics and Evaluation

3
Contents
Acronyms .................................................................................................................... 7
Acknowledgments .................................................................................................... 8
About IHME .........................................................................................................9
Call for collaborators ................................................................................................ 9
Executive summary.................................................................................................11
Introduction and COVID-19 spending .................................................................41
What’s new in Financing Global Health 2020 ..............................................................43
Global health spending priorities and the impact of COVID-19 .............................45
Part One: Tracking development assistance for health for COVID-19 ..........51
Part Two: Development assistance for health beyond COVID-19 ..................61
Part Three: Total health spending prior to COVID-19 ......................................75
Conclusion: Addressing COVID-19 and preparing for future pandemics ....87
Projections of future spending ........................................................................................87
Meeting the challenges ahead .........................................................................................90
Global health financing profiles ...........................................................................93
References ...............................................................................................................111
Annex 1: Methods .................................................................................................115
Overview .......................................................................................................................... 115
Development assistance for health ............................................................................. 115
Domestic health spending and total health spending ............................................. 116
Future health spending .................................................................................................. 117
Annex 2: Tabulated data ......................................................................................119
4 | FINANCING GLOBAL HEALTH 2020
Figures
Figure 1 Type of health assistance provided toward the COVID-19 pandemic, 2020 ...................................................... 46
Figure 2 Type of health assistance for COVID-19 by channel of assistance, 2020............................................................. 47
Figure 3 Development assistance for health targeting COVID-19 and deaths from COVID-19, 2020 ........................... 48
Figure 4 Development assistance for health and COVID-19 by source of funding, 1990–2020 ................................... 52
Figure 5 Development assistance for health by health focus area, 1990–2020 ................................................................ 53
Figure 6 Development assistance for health by channel of assistance, 1990–2020 ......................................................... 54
Figure 7 Flows of development assistance for COVID-19 from source to channel to program area, 2020 .................. 56
Figure 8 Development assistance for health sources, channels of assistance, implementing institutions ................. 61
Figure 9 Annualized rate of change in development assistance for health disbursed by source, 2000–2015, 2015–2019, and 2019–2020 .................................................................................................................................... 62
Figure 10 Annualized rate of change in development assistance for health disbursed by channel, 2000–2015, 2015–2019, and 2019–2020 .................................................................................................................................... 63
Figure 11 Development assistance for health systems strengthening and sector-wide approaches by channel of assistance, 1990–2020 ......................................................................................................................................... 64
Figure 12 Development assistance for health systems strengthening by health focus area, 1990–2020 ..................... 65
Figure 13 Development assistance for health by health focus area, 1990–2020 ................................................................ 66
Figure 14 Development assistance for health by health focus area and program area, 2000–2020* .................................................. 67
Figure 15 Annualized rate of change in development assistance for health disbursed, by health focus area, 2000–2015, 2015–2019, and 2019–2020 ................................................................................................................................................ 68
Figure 16 The share of development assistance for health allocated by health focus area, 1990–2020 ........................ 69
Figure 17 Development assistance for health by recipient Global Burden of Disease super-region, 1990–2020 ....... 70
Figure 18 Total health spending by source of financing, 1995–2018 .................................................................................... 78
FIGurEs | 5
Figure 19 Annualized rate of change in health spending per person by World Bank income group, 2000–2018 ..... 79
Figure 20 Annualized rate of change in health spending per person by Global Burden of Disease super-region, 2000–2018 .............................................................................................................................................................. 80
Figure 21 Health spending, population, and disability-adjusted life years by World Bank income group, 2018 ........ 81
Figure 22 The share of health spending by source and GDP per person, 2018 .................................................................... 82
Figure 23 Changes in health spending per person and universal health service coverage, 2000–2018 ....................... 83
Figure 24 Government health spending as a fraction of total health spending, 2018 ...................................................... 84
Figure 25 Flows of health spending from financing source to World Bank income groups and Global Burden of Disease super-regions, 2015–2018 .............................................................................................................................................. 85
Figure 26 Annualized rate of change in health spending per person by Global Burden of Disease super-region, 2018–2030 ........................................................................................................................................................................................ 88
Figure 27 Forecasted total health spending, 2050 .................................................................................................................... 89
Source for all figures unless otherwise indicated: Financing Global Health Database 2020

6 | FINANCING GLOBAL HEALTH 2020
Boxes
Box 1 Peer-reviewed foundation ...................................................................................................................................................43
Box 2 Health financing terms defined ........................................................................................................................................ 44
Box 3 Development assistance for health terms defined ......................................................................................................... 51
Tables
TaBle 1 Estimates of COVID-related disbursements and commitments of health and non-health funds, 2020 .......... 46
TaBle 2 Development assistance for health targeting COVID-19 in 2020, by channel and type of assistance ............... 55
TaBle 3 Total health spending and health spending by source, 2018 .......................................................................................76

ACrONyms | 7
Acronyms
CoVax COVID-19 Vaccines Global Access Facility
DaC Development Assistance Committee
DaH Development assistance for health
DalY Disability-adjusted life year
gBD Global Burden of Diseases, Injuries, and Risk Factors Study
gDP Gross domestic product
gNi Gross national income
HSS Health systems strengthening
iaTi International Aid Transparency Initiative
iHMe Institute for Health Metrics and Evaluation
iMF International Monetary Fund
MDgs Millennium Development Goals
NCDs Non-communicable diseases
SDgs Sustainable Development Goals
SWaps Sector-wide approaches
uHC Universal health coverage
uNiCeF United Nations Children’s Fund
uNoCHa United Nations Office of Humanitarian Assistance
8 | FINANCING GLOBAL HEALTH 2020
AcknowledgmentsWe extend our appreciation to past authors of this report for developing and refining the analytical foundation upon which this work is based. We would also like to acknowledge the staff members of the numerous develop-ment agencies, public-private partnerships, international organizations, non-governmental organizations, and foundations who responded to our data requests and questions. We greatly appreciate their time and assistance.
Our interpretation of this year’s findings benefitted greatly from the contributions of the Council on Foreign Relations’ Thomas Bollyky, Rachel Nugent of RTI International, and Erika Larson of the University of California San Francisco. We would like to also acknowledge Dr. Shuhei Nomura and Dr. Satoshi Ezoe for providing data and insight on Japan as a bilateral and funding source in this analysis.
The analysis of development assistance for health, COVID-19, and other sources of health spending presented in Financing Global Health 2020 draw in part on data and analysis presented in “Tracking development assistance for health and for the COVID-19 pandemic: a review of development assis-tance, government, out-of-pocket, and other private spending on health for 204 countries, 1990–2050,” published this year in The Lancet. We also thank the 2020 Global Burden of Disease Health Financing Collaborator Network for feedback on data, methods, and preliminary results.
We would also like to acknowledge the broader efforts of the IHME community, which contributed greatly to the production of this year’s report. In particular, we thank IHME’s Board for their continued leadership, Adrienne Chew and Rebecca Sirull for editing, Joan Williams for produc-tion oversight and publication management, and Michaela Loeffler and Annika Newell for design. Finally, we would like to extend our gratitude to the Bill & Melinda Gates Foundation for generously funding IHME and for its consistent support of this research and report.
research team:
aNgela e. MiCaH, PHD
JoSePH l. DieleMaN, PHD
KeViN F. o’rourKe, MFa
iaN e. CogSWell, BS
BraNDoN CuNNiNgHaM, Ma
aNToN C. Harle, Ba
eMilie r. MaDDiSoN, BS
CHriSToPHer J.l. MurraY, MD, DPHil
KYle e. SiMPSoN, BS
HaYleY N. STuTZMaN, Ba
golSuM TSaKaloS, MS
liNDSeY WallaCe, MPa
raHul ZeNDe, MS
YiNgxi ZHao, MPH
ABOuT IHmE | 9
About IHMEThe Institute for Health Metrics and Evaluation (IHME) is an independent global health research organization at the University of Washington that provides rigorous and comparable measurement of the world’s most important health problems and evaluates the strategies used to address them. IHME makes this information widely available so that policymakers have the evidence they need to make informed decisions about how to allocate resources to improve population health. For more information about IHME and its work, please visit www.healthdata.org.
Call for collaboratorsIn addition to conducting the Financing Global Health (FGH) study, IHME coordinates the Global Burden of Diseases, Injuries, and Risk Factors (GBD) Study, a comprehensive effort to measure epidemiological levels and trends worldwide. (More information on GBD is available at http://www.healthdata. org/gbd.) The GBD study relies on a worldwide network of more than 7,000 collaborators in over 150 countries. Current collaborator areas of expertise include epidemiology, public health, demography, statistics, and other related fields. IHME has expanded the scope of GBD to encompass quantifi-cation of health resource flows, health system attributes, and the performance of health systems. To that end, IHME is seeking GBD collabora-tors who are experts in health financing and health systems. GBD collaborators – many of whom have co-authored GBD or FGH publications – provide timely feedback related to the interpretation of GBD and FGH results, data sources, and methodological approaches pertaining to their areas of expertise. We invite researchers and analysts with expertise in health financing to join the GBD collaborator network. Potential collabora-tors may apply at http://www.healthdata.org/gbd/call-for-collaborators.

10 | FINANCING GLOBAL HEALTH 2020
ExECuTIvE summAry | 11
Executive summary
Much has changed since the Institute for Health Metrics and Evaluation began publishing the annual Financing Global Health series of reports in 2009. The report, which initially focused on development assistance for health, has grown to cover an expanded list of sources and health focus areas, and has reported estimates related to a number of global health developments, from the fallout of the 2008 global recession to the conclu-sion of the Millennium Development Goals in 2015.
This year’s report tracks spending on global health, but specifically highlights development assistance for health support during a pandemic, and that fact – that COVID-19 continues to challenge the world, infecting and killing thousands every day – underscores the importance of tracking resources available for health. In addition to providing readers a picture of how the world’s major health donors have responded to COVID-19, the work presented in Financing Global Health 2020 can help decision-makers craft responses to the health challenges of both today and tomorrow.
As in previous years, Financing Global Health 2020 (the 12th in the series) provides updated estimates of spending on health, development assistance for health, and projections of future health spending. Our health spending tracking and estimates show patterns between income groups and regions over time, and highlight variations between countries, which can identify where more resources are needed most. Financing Global Health 2020 particularly focuses on how donors have responded to the COVID-19 pandemic and the associated changes in global spending and global spending priorities. We also highlight other areas of concern – and oppor-tunity – facing the world.
The enormity of the crisis COVID-19 has posed, and continues to pose, cannot be overstated. Since the beginning of the pandemic, COVID-19’s toll on the world’s health has been staggering. As of August 15, 2021, approxi-mately 2.5 billion people have been infected with COVID-19,1 and the pandemic has led to 4.4 million reported COVID-19 deaths globally. An additional 1.1 million reported deaths – for a total of 5.5 million – are projected by December 1, 2021, while evolving challenges associated with new variants of the virus are making the pandemic’s future anything but certain. Moreover, according to the International Monetary Fund, the pandemic’s economic impact has been severe, with global GDP contracting an estimated 3.5% in 2020, including a decline of approximately 7.0% in Latin America and the Caribbean, and more than 6% in sub-Saharan Africa.
Among its many other effects, COVID-19 has also led to a substantial increase in development assistance for health (DAH). All told, we estimate that $13.7 billion in DAH was allocated to the health response for COVID-19 activity, such as spending on treatment and logistics. This support led to an unprecedented increase of 35.7% in overall DAH between 2019 and 2020. Our analysis also shows that by region, development assistance for health for COVID-19 has to date not necessarily matched where the virus has had

12 | FINANCING GLOBAL HEALTH 2020
the most impact. For example, the Latin America and Caribbean Global Burden of Disease super-region has received only 5.2% of DAH for COVID-19, but as a region has experienced 28.7% of reported global COVID-19 deaths as of August 15, 2021.1 We explore this and other findings in depth in Financing Global Health 2020’s COVID-19 sections.
This year’s report also updates our estimates of pandemic preparedness spending. In 2020, development assistance for health for pandemic pre-paredness was an estimated $811.1 million, or about 1.5% of total 2020 DAH (which was an estimated 0.58% [95% uncertainty interval 0.57–0.58]† of overall 2020 global spending on health). As we saw last year and will continue to see in stark terms for as long as COVID-19 lasts, inadequately preparing for pandemics can have disastrous, long-lasting consequences.
More broadly, Financing Global Health 2020 includes health spending estimates that cover 204 countries from 1995 to 2018. For DAH, we present estimates from 1990 to 2020 for 135 low- and middle-income countries. And our future health spending scenarios cover 204 countries for the period from 2019 to 2050. The COVID-19 pandemic has shown the world how important having robust health systems is (of which pandemic prepared-ness is just one element), and Financing Global Health’s government spending data and DAH estimates help policymakers identify areas for health system improvement.
Our work shows that total global health spending has continued to increase, reaching $8.5 trillion (8.4–8.5) in 2018, the most recent year for which observed total health spending data are available. This constitutes a 3.0% (1.7–4.3) increase over the 2017 total. By type, 2018 spending breaks down as follows:
• $5.0 trillion (5.0–5.1), or 59.4%, government health spending • $1.9 trillion (1.8–1.9), or 22.1%, prepaid private spending • $1.5 trillion (1.5–1.6), or 18.0%, out-of-pocket spending • $39.2 billion, or 0.5%, donor financing
In 2018, the global population was an estimated 7.7 billion people, 46.7% of whom (3.6 billion) lived in one of the 79 low-income or lower-middle- income countries. Even though, in 2018, DAH constituted only 0.46% (0.46–0.47) of global spending on health, it is important to those countries that depend on it. In addition to acting as a lifeline for some countries, DAH can be a catalyst, by focusing investments on activities or populations that might not otherwise receive attention or resources.
As noted, total DAH in 2020 was up more than 35.7% from our 2019 estimate of $40.4 billion. Though it has grown over the past 30 years – in 1990, DAH was $8.1 billion, marking a rise of 574.0% over the time period of our tracking – DAH has never grown the way it did between 2019 and 2020. Indeed, between 2010 and 2019, development assistance for health was largely flat, hovering between $35.3 billion and $40.6 billion per year. As positive as the 2019–2020 growth is, additional spending is needed to ensure that lower-income countries do not fall behind. Without taking spending on COVID-19 into account, 2020 DAH was $41.2 billion, about 1.8% higher than 2019 DAH.
By World Bank income group, DAH remains most relied upon in low-in-come countries (25.0% [24.4–25.5] of 2018 health spending), while
† Our modeled estimates for total health spending are presented with uncertainty intervals. Our estimates of DAH are generally not modeled and do not include uncertainty intervals. Unless otherwise indicated, all estimates are reported in 2020 inflation-adjusted US dollars, and the source for all figures unless otherwise indicated is the Financing Global Health Database 2020.
ExECuTIvE summAry | 13
out-of-pocket spending is most relied upon for financing health care in lower-middle-income countries (55.9% [53.7–58.2] of 2018 health spending). Government and prepaid private spending are most prevalent in high- income countries (86.5% [86.0–87.0] of 2018 health spending). In terms of health focus areas other than COVID-19, DAH for HIV/AIDS, malaria, and tuberculosis decreased between 2019 and 2020, going down 3.4%, 2.2%, and 5.5%, respectively. DAH for non-communicable diseases (NCDs) increased by roughly 4.7%, going from $846.9 million in 2019 to $887.0 million in 2020, while our estimates of DAH for newborn and child health as well as repro-ductive and maternal health show that both decreased between 2019 and 2020: funding for newborn and child health went down 2.6%, while repro-ductive and maternal health DAH declined 6.8% between 2019 and 2020. Though spending on COVID-19 did not lead to major declines in health focus areas’ development assistance for health between 2019 and 2020, DAH for many health focus areas did not grow, and the pandemic has certainly complicated the development spending landscape, not to mention the critical work of getting care to those who most need it. Reducing the burden caused by conditions like malaria and tuberculosis remains as pressing as ever.
Financing Global Health 2020 also includes estimates of future health spending from 2019 to 2050 to help funders and policymakers plan. We estimate global health spending will grow to $9.9 trillion (95% UI 9.7–10.1) by 2030 and $14.4 trillion (13.7–15.1) by 2050. Global disparities will almost certainly remain: high-income spending is projected to grow to $6,023 per person (5,904–6,150) by 2030 and $8,539 per person (8,058–9,065) by 2050. In contrast, low-income spending is projected to grow from $35 per person (34–36) in 2018 (0.6% of 2018 high-income spending) to $46 per person (44–48) in 2050 (0.5% of high-income spending in 2050).
overall, Financing Global Health 2020’s highlights include:
• A focus on tracking spending related to COVID-19. These estimates draw on novel work performed by the research team. Our COVID-19 work includes estimates of donor support for COVID-19, including spending commitments and disbursements by disbursing agency, as well as whether funding was redirected to fight COVID-19 or whether it is new.
• Updated estimates of overall global domestic spending, now through 2018, and updated estimates of contributions to DAH, now through 2020.
• Updated estimates of future health spending, to 2050.• Updated Global Health Financing Profiles for seven health focus areas,
including a new profile for COVID-19.


摘要健康计量与评估研究所在2009年首次发表全球卫生筹资报告,自此以来
情况已经发生很大的变化。该报告最初侧重于卫生发展援助,现在逐渐包括了更广泛的资金来源和卫生重点领域估算;此外也提供了从2008年的全球经济衰退到2015年千年发展目标完成等在内的许多全球卫生发展相关估算。
今年的报告追踪了全球卫生方面的支出,但特别强调了在大流行期间的卫生发展援助情况。2019冠状病毒病(COVID-19)正在持续给世界带来挑战、每天感染和死亡人数上千的这一事实,强调了追踪卫生相关可用资源的重要性。除了向读者提供了全球主要卫生援助方如何应对COVID-19的现状以外,全球卫生筹资2020报告的分析还可以帮助决策者制定解决方案,来应对当今和未来的健康挑战。
与往年一样,全球卫生筹资2020(该系列报告的第12版)更新了卫生支出和卫生发展援助的估算,以及未来卫生支出的预测。我们的卫生支出追踪和估算总结了不同收入水平国家和不同区域变化的趋势,突出了国家间的差异,从而可以突出资源最紧缺的地方。全球卫生筹资2020特别地关注了援助方如何应对COVID-19疫情以及全球支出和优先事项的相关变化。我们也介绍了世界面临其他值得关注的领域和机遇。
COVID-19危机已经并持续带来严重影响,这种影响怎样强调都不为过。自疫情开始以来,COVID-19对于全球健康的影响一直是惊人的。截止到2021年八月15日,大约有25亿人感染了COVID-19,疫情也造成了全球超过440万人死亡。预估到2021年12月1日还会有110万人死亡,总计死亡达到550万,与此同时病毒变异株带来的持续挑战使得疫情的未来扑朔迷离。此外,根据国际货币基金组织的报告,疫情带来的经济影响十分严重,预计2020年全球GDP萎缩3.5%,其中拉丁美洲和加勒比地区下降约7.0%,撒哈拉以南非洲下降超过6%。
在其许多其他的影响中,COVID-19也导致了卫生发展援助的显著增加。我们估算有137亿美元的卫生发展援助用于COVID-19的卫生应对,例如治疗和后勤支出。这导致了卫生发展援助在2019年-2020年空前地增加了35.7%。按照地区划分的分析还显示,COVID-19的卫生发展援助数额并不与疫情影响严重程度相匹配。例如,按照全球疾病负担研究划分的拉丁美洲和加勒比地区仅接受了全球COVID-19卫生发展援助总额的5.2%,但是截止到2021年八月15日,这一地区的COVID-19死亡人数占全球的28.7%。1我们在全球卫生筹资2020的COVID-19章节深入探讨了这一结果和其他分析。
今年的报告还更新了我们对大流行防范支出的估算。 2020年,用于大流行防范的卫生发展援助估计为8.111亿美元,约占2020年卫生发展援助总额的1.5%(占2020年全球卫生总支出的0.58%【95%不确定性区间0.57-0.58】)†。 正如我们去年所看到的那样,未对大流行充分准备可能会造成灾难性的长期后果,而只要COVID-19继续,这一情况就会持续显著。
更广泛地,全球卫生筹资2020包括了1995年至2018年204个国家的卫生支出估算。对于卫生发展援助,我们汇报了1990年至2020年135个中低收入国家的估算。而我们卫生支出未来期望涵盖了204个国家从2020年至2050年的预测。COVID-19疫情向世界证明了拥有强健卫生体系的重要性(大流行防范只是其中一个要素),全球卫生筹资的政府卫生支出数据和
† 我们对于总卫生支出的模型估算结果包括了不确定性区间。我们对于卫生发展援助的估算未经模型估算,因此不含不确定性空间。除非另有说明,所有估算结果单位均为去通胀调整后的2020年美元,所有图表信息来源均为全球卫生筹资2020年数据库。
摘要 | 15

16 | FINANCING GLOBAL HEALTH 2020
卫生发展援助估算可以帮助政策制定者确定卫生系统需要改善的领域。我们的分析表明,全球卫生总支出持续增长,在卫生总支出现有数据的
最新年份2018年达到了8.5万亿美元(8.4-8.5)。与2017年相比增加了3.0%(1.7-4.3)。按照来源,2018年的卫生支出为:
• 政府卫生支出,5.0万亿美元(5.0–5.1),占比59.4%• 预付私人保险支出,1.9万亿美元(1.8-1.9),占比22.1%• 个人或家庭现金支出,1.5万亿美元(1.5-1.6),占比18.0%• 援助方支出,392亿美元,占比0.5%2018年,全球人口约为77亿,其中有46.7%(36亿人)生活在79个低收入
或中低收入国家之一。 尽管卫生发展援助在2018年仅占全球卫生总支出的0.46%(0.46-0.47),但对于那些依赖这一来源的国家来说是十分重要的。除了充当国家的生命线以外,卫生发展援助可以作为催化剂,投资于那些原本可能无法受到关注或者获得资源的活动或者人群。
如前所述,2020年的卫生发展援助总额比我们估算的2019年总额404亿美元增长了35.7%。尽管过去的三十年中卫生发展援助一直在增长──1990年的卫生发展援助总额为81亿美元,在我们追踪的年份中增长了574%──但是从来没有像2019年至2020年间这样增长过。事实上,2010年至2019年卫生发展援助数额基本持平,每年徘徊在353亿至406亿美元之间。尽管2019-2020年的增长是积极的,但是依然需要额外的资金来保证低收入国家不会落后。如果不考虑COVID-19,2020年的卫生发展援助为412亿美元,比2019年高约1.8%。
按照世界银行按收入水平划分的组别,低收入国家最依赖卫生发展援助(占2018年卫生总支出的25.0%【24.4-25.5】),而中低收入国家最依赖个人或家庭现金支出(占2018年卫生总支出的55.9%【53.7-58.2】)。政府卫生支出和预付私人保险支出在高收入国家中占比最高(占2018年卫生总支出的86.5%【86.0-87.0】)。在除COVID-19之外的卫生重点领域中,在2020年用于艾滋病、疟疾和结核病的卫生发展援助相比于2019年分别降低了3.4%,2.2%和5.5%。用于非传染性疾病的卫生发展援助增加了约4.7%,从2019年的8.469亿美元增长到2020年的8.870亿美元。而我们对于新生儿和儿童健康、生殖和孕产妇健康2020年卫生发展援助的估算显示两者相比2019年都减少了:新生儿和儿童健康减少了2.6%,而生殖和孕产妇健康减少了6.8%。尽管在COVID-19上的支出并未导致2019年至2020年卫生重点领域援助的显著降低,大多数领域的卫生发展援助并未增长,大流行无疑使发展支出前景更复杂,更何况还需保证服务可以真正覆盖需要的人群。降低由疟疾和结核病等疾病导致的负担一如既往地紧迫。
全球卫生筹资2020还预测了2019年至2050年的未来卫生支出,以帮助援助方和政治制定者提前规划。我们估算到2030年全球卫生总支出将会增长到9.9万亿美元(95%不确定性区间9.7-10.1),到2050年会增长到14.4万亿美元(13.7-15.1)。全球差异依然会存在:高收入国家支出会在2030年增长到每人6,032美元(5,904–6,150),在2050年会增长到每人8,539美元(8,058–9,065)。而低收入国家会从2018年的每人35美元(34-36),是高收入国家水平的0.6%;增长到2050年的每人46美元(44-48),是高收入国家水平的0.5%。
综上,全球卫生筹资2020的亮点包括:• 重点追踪了COVID-19相关的支出,该估算是研究小组的新颖成果。我
们估算了援助方对于COVID-19支持的数额,包括按照拨付机构估算的承诺额和拨付额,以及是改变原有用途的资金还是新的资金

• 更新了截至2018年的全球国内支出估算,截至2020年的卫生发展援助估算
• 更新了截至2050年的未来卫生支出估算• 更新了七个卫生重点领域的全球卫生筹资概况,包括一个新的针对
COVID-19的筹资概况
摘要 | 17

18 | FINANCING GLOBAL HEALTH 2020
ИТОГОВЫЙ ОТЧЕТ | 19
Итоговый отчет
Многое изменилось с тех пор, как Институт измерения показателей и оценки здоровья (Institute for Health Metrics and Evaluation) начал публиковать серию ежегодных отчетов Финансирование сферы всемирного здравоохранения (Financing Global Health) в 2009 году. Отчет, который первоначально был ориентирован на помощь в целях содействия развитию здравоохранения, начал включать в себя расширенный список источников и приоритетных областей здравоохранения, а также содержать оценки, относящиеся к ряду глобальных событий в области здравоохранения, начиная с последствий мирового экономического кризиса 2008 года и заканчивая достижением Целей развития тысячелетия в 2015 году.
В отчете, составленном в этому году, отслеживаются расходы на всемирное здравоохранение, однако особо выделяется помощь в целях содействия развитию здравоохранения во время пандемии. При этом уже тот факт, что COVID-19 продолжает оставаться серьезной проблемой для всего мира, ежедневно приводя к тысячам заражений и смертей, подчеркивает важность отслеживания ресурсов, доступных для здравоохранения. Помимо предоставления читателям картины того, как основные мировые источники финансирования здравоохранения отреагировали на COVID-19, информация, представленная в отчете Финансирование сферы всемирного здравоохранения за 2020 год, может помочь ответственным лицам выработать ответы на вызовы в области здравоохранения как сегодня, так и в будущем.
Как и в предыдущие годы, в отчете Финансирование сферы всемирного здравоохранения за 2020 год (12-м в серии) представлены обновленная оценка расходов на здравоохранение и содействие в его развитии, а также прогнозы будущих расходов на здравоохранение. Наши механизмы наблюдения и оценки расходов на здравоохранение позволяют в динамике отследить закономерности по категориям доходов и регионам, а также выделить различия между странами и, соответственно, определить районы, наиболее нуждающиеся в ресурсах. В отчете Финансирование сферы всемирного здравоохранения за 2020 год уделено особое внимание тому, как источники финансирования отреагировали на пандемию COVID-19, а также связанным с ней изменениям в глобальных расходах и глобальных приоритетах расходов. Мы также выделили другие проблемные, но перспективные вопросы, стоящие перед миром.
Невозможно переоценить масштабы кризиса, который был вызван вирусом COVID-19 и не прекращается до сих пор. С самого начала пандемии последствия COVID-19 для сферы мирового здравоохранения были ошеломляющими. По состоянию на середину августа2021 года COVID-191 заразилось примерно 2,5 млрд человек, что привело к более чем 4,4 млн смертей по всему миру. К 1 декабря2021 года прогнозируется еще 1,1 млн смертей, что в общей сложности

20 | FINANCING GLOBAL HEALTH 2020
доведет количество жертв до 5,5 млн человек, в то время как вновь возникающие проблемы, связанные с новыми штаммами вируса, делают перспективы пандемии неопределенными. Более того, по данным Международного валютного фонда, экономические последствия пандемии также являются серьезными: в 2020 году мировой уровень ВВП сократился примерно на 3,5 %, в том числе примерно на 7,0 % в Латинской Америке и странах Карибского бассейна и более чем на 6 % в странах Африки к югу от Сахары.
Помимо множества других последствий, COVID-19 также привел к значительному увеличению помощи на содействие развитию здравоохранения (СРЗ). В целом, по нашим оценкам, на медико-санитарные меры по борьбе с COVID-19, такие как расходы на лечение и логистику, в рамках СРЗ было выделено 13,7 млрд долларов. В период с 2019 по 2020 год такая помощь привела к беспрецедентному увеличению общего уровня СРЗ на 35,7 %. Наш анализ также показывает, что уровень помощи на содействие развитию здравоохранения в связи с COVID-19 по регионам на сегодняшний день не обязательно совпадает с уровнем наибольшего воздействия вируса. Например, согласно исследованию глобального бремени болезней, уровень СРЗ в результате COVID-19 в странах Латинской Америки и Карибского бассейна находится на отметке 5,2 %, хотя на этот регион приходится 28,7 % от общего количества смертей в результате пандемии.1 Этот и другие вопросы более детально рассматриваются в разделах отчета Финансирование сферы всемирного здравоохранения за 2020 год, посвященных COVID-19.
В отчете за этот год также обновлены наши оценки расходов на обеспечение готовности к пандемии. В 2020 году уровень помощи на содействие развитию здравоохранения для обеспечения готовности к пандемии составил, по оценкам, 811,1 млн долларов, или около 1,5 % от общего уровня СРЗ за 2020 год (что составило примерно 0,58 % [0,57–0,58 с интервалом неопределенности 95 %]† от общих расходов на всемирное здравоохранение в 2020 году). Как мы наблюдали в прошлом году и будем наблюдать до тех пор, пока будет длиться COVID-19, недостаточная подготовка к пандемии может иметь катастрофические и долгосрочные последствия.
В более широком смысле отчет Финансирование сферы всемирного здравоохранения за 2020 год включает оценки расходов на здравоохранение для 204 стран с 1995 по 2018 год. Для СРЗ приведены оценки с 1990 по 2020 год для 135 стран с низким и средним уровнем дохода. Также приведены варианты прогноза расходов на здравоохранение для 204 стран на период с 2019 по 2050 год. Пандемия COVID-19 показала миру, насколько важно наличие надежных систем здравоохранения (в которых готовность к пандемии является лишь одним из элементов), а данные о государственных расходах и оценки СРЗ, содержащиеся в отчете Финансирование сферы всемирного здравоохранения, помогают ответственным лицам обнаруживать области, позволяющие улучшить систему здравоохранения.
Наши исследования показывают, что общий уровень глобальных расходов на здравоохранение продолжает расти, достигнув 8,5 трлн
† Наши смоделированные оценки общих расходов на здравоохранение представлены с интервалами неопределенности. Наши оценки СРЗ обычно не моделируются и не включают интервалы неопределенности. Если не указано иное, все оценки приводятся в долларах США с поправкой на инфляцию по состоянию на 2020 год.

долларов (8,4–8,5) в 2018 году, самом последнем году, за который доступны статистические данные об общих расходах на здравоохранение. Это на 3,0 % (1,7–4,3) больше, чем в 2017 году. По видам расходы за 2018 год можно разделить следующим образом:
• 5,0 трлн долларов (5,0–5,1), или 59,4 % — государственные расходы на здравоохранение
• 1,9 трлн долларов (1,8–1,9), или 22,1 % — предварительно оплаченные расходы частного сектора
• 1,5 трлн долларов (1,5–1,6), или 18,0 % — личные расходы • 39,2 млрд долларов, или 0,5 % — донорское финансирование
В 2018 году население планеты составляло 7,7 млрд человек, 46,7 % (3,6 млрд) из которых проживали в одной из 79 стран с низким уровнем дохода или уровнем дохода ниже среднего. Несмотря на то, что в 2018 году уровень СРЗ составлял лишь 0,46 % (0,46–0,47) от глобальных расходов на здравоохранение, этот показатель важен для тех стран, которые от него зависят. Помимо того, что финансирование СРЗ является жизненно важным аспектом для некоторых стран, оно также может стать своего рода катализатором, сосредотачивая инвестиции на видах деятельности или группах населения, которые иначе не получили бы внимания или ресурсов.
Как уже отмечалось, общий объем финансирования СРЗ в 2020 году вырос более чем на 35,7 % по сравнению с нашей оценкой за 2019 год в 40,4 млрд долларов. Хотя уровень СРЗ за последние 30 лет вырос — в 1990 году он составлял 8,1 млрд долларов, что означает, что за период нашего наблюдения он вырос на 574,0 %, — финансирование СРЗ никогда не росло так, как в период с 2019 по 2020 год. Действительно, в период с 2010 по 2019 год уровень помощи на содействие развитию здравоохранения был в основном неизменным, колеблясь от 35,3 до 40,6 млрд долларов в год. Каким бы положительным ни был рост в 2019–2020 годах, необходимо обеспечить дополнительное финансирование, чтобы страны с низкими доходами продолжали получать необходимую помощь. Без учета расходов на COVID-19, уровень финансирования СРЗ в 2020 году составил 41,2 млрд долларов, что примерно на 1,8 % выше, чем в 2019 году.
Согласно классификации стран по уровню доходов, используемой Всемирным банком, на СРЗ больше всего полагаются страны с низким уровнем дохода (25,0 % [24,4–25,5] от расходов на здравоохранение за 2018 год), в то время как на финансирование здравоохранения из личных средств больше всего полагаются в странах с уровнем дохода ниже среднего (55,9 % [53,7–58,2] от расходов на здравоохранение за 2018 год). Государственные и предварительно оплаченные расходы частного сектора наиболее распространены в странах с высоким уровнем дохода (86,5 % [86,0–87,0] от расходов на здравоохранение за 2018 год). Что касается других областей здравоохранения, помимо COVID-19, СРЗ в отношении ВИЧ/СПИДа, малярии и туберкулеза в период с 2019 по 2020 год снизилось на 3,4 %, 2,2 % и 5,5 % соответственно. СРЗ в отношении неинфекционных заболеваний (НИЗ) увеличилось примерно на 4,7 %, с 846,9 млн долларов в 2019 году до 887,0 млн долларов в 2020 году, в то время как наши оценки СРЗ в
ИТОГОВЫЙ ОТЧЕТ | 21

22 | FINANCING GLOBAL HEALTH 2020
отношении здоровья новорожденных и детей, а также репродуктивного и материнского здоровья показывают, что оба этих показателя снизились в период с 2019 по 2020 год: финансирование сферы охраны здоровья новорожденных и детей сократилось на 2,6 %, в то время как СРЗ в области репродуктивного и материнского здоровья в период с 2019 по 2020 год сократилось на 6,8 %. Хотя в период с 2019 по 2020 год расходы на COVID-19 не привели к значительному сокращению помощи на содействие развитию приоритетных областей здравоохранения, СРЗ во многих областях здравоохранения не увеличилось, и пандемия, безусловно, усложнила картину расходов на развитие, не говоря уже о критически важной работе по оказанию помощи тем, кто больше всего в ней нуждается. Снижение бремени, вызванного такими заболеваниями, как малярия и туберкулез, по-прежнему актуально.
Отчет Финансирование сферы всемирного здравоохранения за 2020 год также включает в себя оценки предстоящих расходов на здравоохранение с 2019 по 2050 год, что позволяет облегчить инвесторам и лицам, определяющим политику здравоохранения, процесс планирования расходов. По нашим оценкам, к 2030 году глобальные расходы на здравоохранение вырастут до 9,9 трлн долларов (9,7–10,1 с интервалом неопределенности 95 %), а к 2050 году — до 14,4 трлн долларов (13,7–15,1). Глобальные диспропорции почти наверняка сохранятся: по прогнозам, к 2030 году расходы в странах с высоким уровнем дохода вырастут до 6023 долларов на человека (5904–6150), а к 2050 году — до 8539 долларов на человека (8058–9065). С другой стороны, расходы в странах с низким уровнем дохода, по прогнозам, вырастут с 35 долларов на человека (34–36) в 2018 году (0,6 % от расходов стран с высоким уровнем дохода на 2018 год) до 46 долларов на человека (44–48) в 2050 году (0,5 % от расходов стран с высоким уровнем дохода в 2050 году).
Ключевые аспекты отчета Финансирование сферы всемирного здравоохранения за 2020 год:
• Акцент на отслеживании расходов, связанных с COVID-19. Эти оценки основаны на недавней работе, выполненной исследовательской группой. Наша работа по COVID-19 включает:
• Оценки донорской поддержки финансирования, связанного с COVID19, включая обязательства по расходам и выплаты со стороны финансирующих учреждений, а также то, было ли финансирование перенаправлено на борьбу с COVID-19 или является новой статьей расходов.
• Обновленные оценки глобальных внутренних расходов на здравоохранение вплоть до 2018 года и обновленные оценки отчислений на СРЗ вплоть до 2020 года.
• Обновленные оценки будущих расходов на здравоохранение до 2050 года.
• Обновленные профили финансирования сферы всемирного здравоохранения для семи основных областей здравоохранения, включая новый профиль для COVID-19.


24 | FINANCING GLOBAL HEALTH 2020
résumé ANALyTIquE | 25
Résumé analytique
Beaucoup de choses ont changé depuis que l’Institute for Health Metrics and Evaluation a commencé à publier la série de rapports annuels Financing Global Health en 2009. Le rapport, qui était initialement axé sur l’aide au développement en matière de santé, s’est étoffé pour couvrir une liste élargie de sources et de domaines stratégiques relatifs à la santé. Il a également fourni des estimations liées à un certain nombre d’avancées en matière de santé mondiale, des retombées de la récession mondiale de 2008 à la conclusion des objectifs du Millénaire pour le développement en 2015.
Le rapport de cette année suit les dépenses en matière de santé mondiale, mais met spécifiquement l’accent sur l’aide au développement pour le soutien sanitaire pendant une pandémie, et ce fait – que la COVID-19 continue de défier le monde, infectant et tuant des milliers de personnes chaque jour – souligne l’importance du suivi des ressources disponibles pour la santé. En plus de fournir aux lecteurs un aperçu de la façon dont les principaux donateurs de santé à travers le monde ont répondu à la pandémie de COVID-19, le travail présenté dans le rapport Financing Global Health 2020 peut aider les décideurs à élaborer des réponses aux défis actuels et à venir, en matière de santé.
Comme les années précédentes, le rapport Financing Global Health 2020 (le 12e de la série) présente des estimations actualisées des dépenses de santé, de l’aide au développement en matière de santé et des projections quant aux dépenses de santé futures. Notre suivi des dépenses de santé et nos estimations indiquent les tendances au fil du temps entre les groupes et les régions en termes de revenus et font ressortir des variations entre les pays, ce qui permet d’identifier là où le besoin en ressources est le plus important. Le rapport Financing Global Health 2020 s’intéresse plus particulièrement à la façon dont les donateurs ont réagi à la pandémie de COVID-19 et aux changements correspondants en termes de dépenses mondiales et de hiérarchisation de ces dépenses. Il met également en lumière d’autres sujets de préoccupation, ainsi que les opportunités, auxquels le monde est confronté.
L’énormité de la crise que la COVID-19 a provoquée, et continue de provoquer, ne peut être surestimée. Depuis le début de la pandémie, le bilan de la COVID-19 sur la santé dans le monde est accablant. Au 15 août 2021, environ 2,5 milliards de personnes ont été infectées par la COVID-191, et la pandémie est responsable de 4,4 millions de décès signalés à travers le monde. On prévoit 1,1 million de décès signalés supplémentaires, soit un total de 5,5 millions, d’ici le 1er décembre 2021, tandis que les défis posés par les nouveaux variants du virus rendent l’avenir incertain. De plus, selon le Fonds monétaire international, l’impact économique de la pandémie a été sévère, avec une contraction du PIB mondial estimée à 3,5 % en 2020, dont un recul d’environ 7,0 % en Amérique latine et dans les Caraïbes, et de plus de 6 % en Afrique subsaharienne.

26 | FINANCING GLOBAL HEALTH 2020
Parmi ses nombreux autres effets, la COVID-19 a également entraîné une augmentation substantielle de l’aide au développement pour la santé (ADS). Au total, nous estimons que 13,7 milliards de dollars d’ADS ont été alloués à la réponse sanitaire pour l’activité COVID-19, telle que les dépenses consacrées au traitement et à la logistique. Cette aide a entraîné une augmentation historique de 35,7 % de l’ADS totale entre 2019 et 2020. Notre analyse montre également que, par région, l’aide au développement pour la santé dans le cadre de la COVID-19 ne correspond pas nécessairement aux endroits où le virus a eu le plus d’impact. Par exemple, la super-région Amérique latine et Caraïbes selon le Global Burden of Disease n’a reçu que 5,2 % de l’ADS pour la COVID-19, alors qu’elle a enregistré 28,7 % du total des décès mondiaux signalés au 15 août 20211. Nous examinons ce point et d’autres constatations dans les sections sur la COVID-19 du rapport Financing Global Health 2020.
Le rapport de cette année actualise également nos estimations des dépenses en matière de préparation aux pandémies. En 2020, l’aide au développement pour la santé consacrée à la préparation aux pandémies était estimée à 811,1 millions de dollars, soit environ 1,5 % de l’ADS totale pour 2020 (qui est estimée à 0,58 % [intervalle d’incertitude à 95 % : 0,57 – 0,58]† du montant total des dépenses de santé mondiales pour 2020). Comme nous avons pu le constater l’année dernière et comme nous continuerons à le constater tant que durera la COVID-19, une préparation inadéquate aux pandémies peut avoir des conséquences désastreuses et durables.
De manière plus générale, le rapport Financing Global Health 2020 comprend des estimations des dépenses de santé dans 204 pays entre 1995 et 2018. En ce qui concerne l’ADS, les estimations couvrent la période de 1990 à 2020 dans 135 pays à faible revenu et à revenu intermédiaire. Nos scénarios de dépenses de santé futures couvrent 204 pays pour la période allant de 2019 à 2050. La pandémie de COVID-19 a montré au monde l’importance de disposer de systèmes de santé robustes (dont la préparation aux pandémies n’est qu’un aspect), et les données sur les dépenses publiques et les estimations de l’ADS du rapport Financing Global Health’s aident les décideurs à identifier les domaines d’amélioration.
Nos travaux montrent que le montant total des dépenses de santé mondiales a continué d’augmenter, atteignant 8,5 billions de dollars (8,4 – 8,5) en 2018, l’année la plus récente pour laquelle des données sur les dépenses totales de santé observées sont disponibles. Cela représente une augmentation de 3,0 % (1,7 - 4,3) par rapport au total de 2017. Par type de dépenses, la ventilation pour 2018 est la suivante :
• 5 billions de dollars (5,0 – 5,1), soit 59,4 %, dépenses publiques de santé • 1,9 billion de dollars (1,8 – 1,9), soit 22,1 %, dépenses privées prépayées • 1,5 billion de dollars (1,5 – 1,6), soit 18,0 %, financement direct par
les patients • 39,2 milliards, soit 0,5 %, prise en charge des donateurs
En 2018, la population mondiale était estimée à 7,7 milliards de personnes, dont 46,7 % (3,6 milliards) vivaient dans l’un des 79 pays à faible
† Nos estimations modélisées pour les dépenses totales de santé sont présentées avec des fourchettes d’incertitude. Nos estimations relatives à l’ADS ne sont en général pas modélisées et ne comprennent aucune fourchette d’incertitude. Sauf indications contraires, toutes les estimations sont exprimées en dollars É.-U. ajustés en fonction du taux d’inflation de 2020. Tous ces chiffres proviennent, sauf indications contraires, de la base de données Financing Global Health 2020.

résumé ANALyTIquE | 27
revenu ou à revenu intermédiaire. Même si, en 2018, l’ADS ne représentait que 0,46 % (0,46 – 0,47) des dépenses de santé mondiales, elle est essentielle pour les pays qui en dépendent. En plus de représenter une planche de salut pour certains pays, l’ADS peut être un catalyseur, en concentrant les investissements sur des activités ou des populations qui, sinon, ne recevraient peut-être pas l’attention ou les ressources nécessaires.
Comme nous l’avons souligné, l’ADS totale en 2020 a augmenté de plus de 35,7 % par rapport à notre estimation de 2019, qui était de 40,4 milliards de dollars. Bien qu’elle ait augmenté au cours des 30 dernières années – en 1990, l’ADS s’élevait à 8,1 milliards de dollars, marquant une hausse de 574,0 % sur notre période de suivi – la croissance de l’ADS n’a jamais été aussi forte qu’entre 2019 et 2020. En effet, entre 2010 et 2019, l’aide au développement pour la santé est restée largement stable, oscillant entre 35,3 et 40,6 milliards de dollars par an. Aussi positive que soit la croissance en 2019–2020, des dépenses supplémentaires sont nécessaires pour que les pays à faible revenu ne se retrouvent pas à la traîne. Sans tenir compte des dépenses liées à la COVID-19, l’ADS pour 2020 s’élevait à 41,2 milliards de dollars, soit environ 1,8 % de plus que l’ADS pour 2019.
Par groupe de revenu de la Banque mondiale, l’ADS reste la source de financement des dépenses de santé à laquelle les pays à faible revenu ont eu le plus recours (25,0 % [24,4 – 25,5] des dépenses de santé en 2018), tandis que le financement direct par les patients est la forme de financement des soins de santé privilégiée dans les pays à revenu intermédiaire de la tranche inférieure (55,9 % [53,7 – 58,2] des dépenses de santé en 2018). Les dépenses publiques et les dépenses privées prépayées sont plus répandues dans les pays à revenu élevé (86,5 % [86,0 – 87,0] des dépenses de santé en 2018). En ce qui concerne les domaines stratégiques relatifs à la santé autres que la pandémie de COVID-19, l’ADS pour le VIH/SIDA, le paludisme et la tuberculose a diminué entre 2019 et 2020, de 3,4 %, 2,2 % et 5,5 % respectivement. L’ADS pour les maladies non transmissibles (MNT) a augmenté d’environ 4,7 %, passant de 846,9 millions de dollars en 2019 à 887,0 millions de dollars en 2020, tandis que nos estimations de l’ADS pour la santé des nouveau-nés et des enfants, ainsi que pour la santé reproductive et maternelle, montrent que les deux ont diminué entre 2019 et 2020 : le financement de la santé des nouveau-nés et des enfants a baissé de 2,6 %, tandis que l’ADS pour la santé reproductive et maternelle a diminué de 6,8 % entre 2019 et 2020. Bien que les dépenses liées à la COVID-19 n’aient pas entraîné de baisse majeure de l’aide au développement pour la santé dans les domaines stratégiques entre 2019 et 2020, l’ADS de nombreux autres domaines stratégiques relatifs à la santé n’a pas augmenté, et la pandémie a certainement compliqué la répartition des dépenses de développement, sans parler du travail essentiel consistant à fournir des soins à ceux qui en ont le plus besoin. La réduction de la charge de certaines maladies comme le paludisme et la tuberculose reste plus urgente que jamais.
Le rapport Financing Global Health 2020 présente également des estimations des futures dépenses de santé sur la période comprise entre 2019 et 2050, afin d’aider les organismes de financement et les responsables

28 | FINANCING GLOBAL HEALTH 2020
de la santé à élaborer des plans. Nous estimons que les dépenses de santé mondiales atteindront 9,9 billions de dollars (II à 95 % 9,7 – 10,1) en 2030 et 14,4 billions de dollars (13,7 – 15,1) en 2050. Il est presque certain que des disparités subsisteront au niveau mondial : les dépenses dans les pays à hauts revenus devraient atteindre 6 023 dollars par personne (5 904 – 6 150) d’ici 2030 et 8 539 dollars par personne (8 058 – 9 065) d’ici 2050. En revanche, les dépenses dans les pays à faible revenu devraient passer de 35 dollars par personne (34 – 36) en 2018 (0,6 % des dépenses des pays à hauts revenus en 2018) à 46 dollars par personne (44 – 48) en 2050 (0,5 % des dépenses des pays à hauts revenus en 2050).
Dans l’ensemble, les principaux aspects du rapport Financing Global Health 2020 sont les suivants :
• Un accent mis sur le suivi des dépenses liées à la COVID-19. Ces estimations s’appuient sur des travaux inédits menés par l’équipe de recherche. Notre travail sur la pandémie de COVID-19 comprend des estimations du soutien des donateurs pour la COVID-19, y compris les promesses de dépenses et les décaissements par organisme payeur, ainsi que la question de savoir si les fonds ont été réorientés dans le but de lutter contre la COVID-19 ou s’il s’agit de nouveaux fonds débloqués.
• Des estimations récentes des dépenses de santé mondiales totales par pays, désormais jusqu’en 2018, et des estimations récentes des contributions à l’ADS, désormais jusqu’en 2020.
• Des estimations actualisées des dépenses de santé futures, jusqu’en 2050.
• Des profils actualisés de financement de la santé mondiale pour sept domaines stratégiques, y compris un nouveau profil pour la COVID-19.


30 | FINANCING GLOBAL HEALTH 2020

rEsumEN EjECuTIvO | 31
Resumen ejecutivoHan cambiado muchas cosas desde que en 2009 el Institute for Health Metrics and Evaluation (Instituto de Métricas y Evaluación de la Salud) comenzó a publicar la serie anual de informes Financiación de la salud en el mundo. El informe, que originalmente se centraba en la asistencia para el desarrollo de la salud, ha evolucionado hasta incluir una lista ampliada de fuentes y áreas prioritarias de salud, y ha informado sobre estimaciones relacionadas con una serie de acontecimientos sanitarios a nivel mundial, desde las repercusiones de la recesión mundial de 2008 hasta la conclusión de los Objetivos de desarrollo del milenio de 2015.
El informe de este año hace un seguimiento del gasto sanitario mundial, pero en concreto destaca la ayuda al desarrollo para la asistencia sanitaria durante una pandemia, y ese hecho en concreto —que la COVID-19 sigue causando dificultades en todo el mundo, infectando y causando la muerte de miles de personas cada día— subraya la importancia de hacer un seguimiento de los recursos sanitarios disponibles. Además de proporcionar a los lectores una visión general de cómo han respondido a la COVID-19 los principales donantes de fondos y recursos para uso sanitario, el trabajo presentado en Financiación de la salud en el mundo 2020 puede ayudar a los responsables en materia de gestión a diseñar su respuesta a los problemas sanitarios tanto actuales como futuros.
Al igual que en años anteriores, Financiación de la salud en el mundo 2020 (la 12.ª edición de la serie) presenta estimaciones actualizadas del gasto sanitario, asistencia al desarrollo en materia de salud y proyecciones de gasto futuro. Nuestras estimaciones y seguimiento del gasto sanitario muestran patrones entre grupos de ingresos y regiones a lo largo del tiempo y destacan variaciones entre países que permiten identificar las áreas donde más recursos se necesitan. Financiación de la salud en el mundo 2020 se centra específicamente en la forma en que los donantes de fondos y recursos han respondido a la pandemia de la COVID-19 y en los cambios asociados al gasto mundial y las prioridades en cuanto al gasto en todo el mundo. Asimismo, se destacan otras áreas preocupantes —y oportunidades de mejora— que existen en el mundo.
No podemos dejar de subrayar la enormidad de la crisis que la COVID-19 ha provocado y que aún continúa a día de hoy. Desde el principio de la pandemia, los estragos causados por la COVID-19 en la salud mundial han sido sobrecogedores. A fecha del 15 de agosto de 2021, se han infectado por COVID-19 aproximadamente 2500 millones de personas1 y se han contabilizado 4,4 millones de muertes a causa de la pandemia de COVID-19 en todo el mundo. Se prevé que para el 1 de diciembre de 2021 se hayan registrado 1,1 millones más de muertes —hasta una cifra total de 5,5 millones— mientras que las mutaciones asociadas a las nuevas variantes del virus dejan un futuro incierto en torno a la pandemia. Por otro lado, según el Fondo Monetario Internacional, el impacto económico de la pandemia ha sido grave, con un retroceso estimado del PIB del 3,5 % en 2020, incluido un descenso aproximado del 7,0 % en Latinoamérica y el

32 | FINANCING GLOBAL HEALTH 2020
Caribe, y de más del 6 % en el África subsahariana.Entre muchos otros efectos, la COVID-19 ha originado un incremento
considerable de la asistencia al desarrollo en el ámbito de la salud (ADS). Teniendo todo en cuenta, se estima que se asignaron 13 700 millones de dólares en ADS para las actividades de respuesta a la COVID-19 como, por ejemplo, gastos de tratamiento y logística. Esta asistencia generó un aumento sin precedentes del 35,7 % de la ADS global entre 2019 y 2020. Nuestro análisis también muestra que, hasta la fecha, la distribución de ADS para la COVID-19 por región no coincide con las zonas en las que el virus ha tenido los efectos más devastadores. Por ejemplo, la extensa región de carga mundial de morbimortalidad formada por Latinoamérica y el Caribe solo ha recibido el 5,2 % de ADS para la COVID-19, mientras que ha sufrido el 28,7 % de las muertes por COVID-19 registradas en todo el mundo hasta el 15 de agosto de 2021.1 Estudiamos este hecho, así como otros hallazgos, en los apartados sobre COVID-19 del informe Financiación de la salud en el mundo 2020.
El informe de este año también actualiza nuestras estimaciones sobre el gasto destinado a la preparación para situaciones de pandemia. En 2020, se estimó que la ADS destinada a la preparación para situaciones de pandemia ascendió a 811,1 millones de dólares o aproximadamente el 1,5 % de la ADS total de 2020 (que era aproximadamente el 0,58 % [intervalo de incertidumbre del 95 %, 0,57-0,58]† del gasto sanitario total a nivel mundial en 2020). Como vimos el año pasado y seguiremos observando en términos absolutos mientras dure la pandemia de la COVID-19, la preparación inadecuada para afrontar situaciones de pandemia puede tener consecuencias desastrosas de larga duración.
En términos más generales, el informe de Financiación de la salud en el mundo 2020 incluye estimaciones del gasto sanitario en 204 países que cubre el período de 1995 a 2018. En el caso de la ADS, presentamos estimaciones de 1990 a 2020 para 135 países en el rango de ingresos bajos y medios. Y para el panorama futuro de gasto sanitario, nuestras estimaciones cubren un total de 204 países durante el período de 2019 a 2050. La pandemia de la COVID-19 ha enseñado al mundo lo importante que es contar con sistemas sanitarios sólidos (dentro de los cuales, la preparación ante una posible pandemia no es sino un elemento) y los datos de gasto público y las estimaciones de ADS que figuran en Financiación de la salud en el mundo ayudan a los gobiernos a identificar áreas en las que se puede mejorar el sistema sanitario.
Nuestro trabajo indica que el gasto sanitario total en todo el mundo ha seguido aumentando hasta alcanzar la cifra de 8,5 billones de dólares (8,4-8,5) en 2018, que es el año más reciente para el que se dispone de datos sobre gasto sanitario total. Esto representa un aumento del 3,0 % (1,7-4,3) con respecto al total en 2017. Según el tipo de gasto, el gasto en 2018 queda desglosado de la siguiente manera:
• 5 billones de dólares (5,0-5,1), o un 59,4 %, gasto público en salud • 1,9 billones (1,8-1,9), o un 22,1 %, gasto privado de prepago • 1,5 billones (1,5-1,6), o un 18,0 %, gasto directo • 39 200 millones de dólares, o un 0,5 %, financiación a través de
donaciones
En 2018, se estimaba una población mundial de 7700 millones de
† Nuestros modelos de estimaciones de gasto sanitario total se presentan con intervalos de incertidumbre. Nuestras estimaciones de ADS por lo general no se basan en modelos y no incluyen intervalos de incertidumbre. A menos que se indique lo contrario, todas las estimaciones se presentan en dólares estadounidenses con ajuste a la inflación de 2020 y la fuente de todas las cifras (a menos que se indique lo contrario) es la base de datos de Financiación de la salud en el mundo 2020.

rEsumEN EjECuTIvO | 33
personas, de las que un 46,7 % (3600 millones) vivía en uno de los 79 países con ingresos bajos o medios-bajos. Si bien es cierto que en 2018 la ADS tan solo supuso un 0,46 % (0,46-0,47) del gasto sanitario mundial, esa cifra es importante para aquellos países que dependen de ella. Además de ser una ayuda vital para algunos países, la ADS puede ser un catalizador, al centrar las inversiones en actividades o en poblaciones que quizá nunca recibirían esa atención o recursos de otro modo.
Como ya se observó, la ADS total en 2020 se incrementó más de un 35,7 % con respecto a nuestras estimaciones para 2019 de 40 400 millones de dólares. Aunque la cifra ha aumentado en los últimos 30 años —en 1990, la ADS fue de 8100 millones, lo que marcó un incremento del 574,0 % en el período que comprende nuestro seguimiento—, la ADS nunca ha crecido tanto como lo hizo entre 2019 y 2020. De hecho, entre 2010 y 2019, la ADS se mantuvo estable, oscilando entre 35 300 millones y 40 600 millones de dólares al año. Aunque el crecimiento entre 2019 y 2020 es positivo, es necesario aumentar el gasto para garantizar que los países de renta baja no se queden rezagados. Sin tener en cuenta el gasto destinado a la COVID-19, en 2020 la ADS fue de 41 200 millones de dólares, aproximadamente un 1,8 % más que la ADS en 2019.
Por grupos de ingresos según el Banco Mundial, se mantiene la mayor dependencia de la ADS entre los países con ingresos bajos (25,0 % [24,4-25,5] del gasto sanitario en 2018), mientras que la dependencia del gasto directo para la financiación de la atención sanitaria es mayor entre los países con ingresos medios-bajos (55,9 % [53,7-58,2] del gasto sanitario en 2018). El gasto público y el privado de prepago están más extendidos en los países con ingresos altos (86,5 % [86,0-87,0] del gasto sanitario en 2018). En cuanto a otras áreas prioritarias de salud diferentes de la COVID-19, la ADS para VIH/SIDA, malaria y tuberculosis se redujo entre 2019 y 2020, pasando a un 3,4 %, 2,2 % y 5,5 %, respectivamente. La ADS para enfermedades no transmisibles (ENT) aumentó alrededor de un 4,7 %, de 846,9 millones en 2019 a 887 millones en 2020, mientras que nuestras estimaciones de ADS para la salud infantil y de neonatos, así como para la salud reproductiva y materna, indican que ambas cifras disminuyeron entre 2019 y 2020: la financiación para la salud infantil y de neonatos se redujo un 2,6 %, mientras que la ADS para salud reproductiva y materna descendió un 6,8 % entre 2019 y 2020. Aunque el gasto en COVID-19 no dio lugar a una reducción importante de la ADS en áreas prioritarias de salud entre 2019 y 2020, tampoco se incrementó la ADS en muchas áreas prioritarias de salud, y la pandemia ciertamente ha complicado el panorama del gasto en desarrollo, por no mencionar la labor vital de proporcionar atención a quienes más lo necesitan. La reducción de la carga asistencial que provocan enfermedades como la malaria y la tuberculosos sigue siendo una necesidad tan urgente como antes.
El informe Financiación de la salud en el mundo 2020 también incluye estimaciones del gasto sanitario futuro de 2019 a 2050 con el objetivo de ayudar a las entidades financiadoras y a los gobiernos en su planificación. Se calcula que el gasto sanitario mundial aumentará hasta los 9,9 billones de dólares (Intervalo de incertidumbre del 95 %, 9,7-10,1) en 2030 y hasta los 14,4 billones de dólares (13,7-15,1) para 2050. Las disparidades entre los países se mantendrán casi con toda seguridad: se prevé que el gasto en los

34 | FINANCING GLOBAL HEALTH 2020
países de ingresos altos aumente hasta 6023 dólares por persona (5904-6150) en 2030 y hasta los 8539 dólares por persona (8058-9065) para 2050. En contraste, el gasto en los países de bajos ingresos está previsto que aumente de 35 dólares por persona (34-36) en 2018 (0,6 % del gasto en los países de ingresos altos en 2018) hasta 46 dólares por persona (44-48) en 2050 (0,5 % del gasto en los países de ingresos altos en 2050).
en general, otros puntos destacados del informe Financiación de la salud en el mundo 2020 son los siguientes:
• Énfasis en el seguimiento del gasto relacionado con la COVID-19. Estas estimaciones se basan en nuevos estudios realizados por el equipo de investigación. Nuestro trabajo sobre la COVID-19 incluye estimaciones sobre asistencia prestada por donantes para la COVID-19, incluido el compromiso de gasto y los desembolsos por entidad pagadora, así como si se redestinó financiación para luchar contra la COVID-19 o si se trata de nueva financiación.
• Estimaciones actualizadas del gasto interno total a nivel mundial hasta 2018 y estimaciones actualizadas de contribuciones a la ADS hasta 2020.
• Estimaciones actualizadas sobre gasto sanitario futuro hasta 2050.• Actualización de perfiles de financiación de la salud en el mundo en
siete áreas prioritarias de salud, incluido un perfil nuevo para la COVID-19.


36 | FINANCING GLOBAL HEALTH 2020

37 | يذيفنتلا صخلملا
التنفيذي الملخص لقد تغير الكثير منذ أن بدأ معهد القياسات الصحية والتقييم في نشر سلسلة تقارير تمويل
قطاع الصحة العالمي السنوية عام 2009. فقد توسع التقرير، الذي كان يركز بادئ الأمر على المساعدة الإنمائية الصحية، ليشمل قائمة موسّعة من المصادر ومجالات التركيز الصحي، وذكر تقديرات متعلقة بعدد من التطورات في قطاع الصحة العالمي، بدءًا من
التداعيات التي عقبت الركود العالمي عام 2008، وحتى استخلاص الأهداف الإنمائية للألفية عام 2015.
يرصد تقرير العام الحالي حجم الإنفاق الصحي العالمي، إلا أنه يسلط الضوء بالأخص على المساعدة الإنمائية لدعم القطاع الصحي أثناء جائحة، وهذه الحقيقة – التي تتمثل
ا أمام العالم بإصابة وقتل الآلاف كل يوم في مواصلة جائحة COVID-19 في أن تشكل تحديً– تؤكد على مدى أهمية رصد الموارد المتاحة للقطاع الصحي. وبالإضافة إلى منح القراء COVID-19 صورة حول كيفية استجابة كبرى الجهات المانحة في قطاع الصحة لجائحة
على مستوى العالم، يمكن للعمل المقدم في تقرير تمويل قطاع الصحة العالمي لعام 2020 أن يساعد متخذي القرارات على ابتكار سبل استجابة للتصدي للتحديات الصحية
الحالية والمستقبلية على السواء. كحال الأعوام السابقة، يقدم تقرير تمويل قطاع الصحة العالمي لعام 2020 )الثاني
عشر في السلسلة( تقديرات محدثة لحجم الإنفاق الصحي، والمساعدة الإنمائية الصحية، وتوقعات لحجم الإنفاق الصحي في المستقبل. وعمليات الرصد والتقديرات التي نوفرها
لحجم الإنفاق الصحي توضح الأنماط التي توجد بين فئات الدخل والمناطق بمرور الزمن، وتلقي الضوء على التفاوتات الموجودة بين البلدان، وهو ما يمكنه تحديد الجوانب ذات
الحاجة الأمَس إلى مزيد من الموارد. يركز تقرير تمويل قطاع الصحة العالمي لعام 2020 على وجه التحديد على كيفية استجابة الجهات المانحة لجائحة COVID-19 والتغيرات ذات الصلة التي طرأت على حجم الإنفاق العالمي وأولوياته. ونبرز أيضًا مواطن القلق الأخرى
– والفرص المتاحة – التي يواجهها العالم.لا يمكن التعبير بالقدر الكافي عن مدى فداحة الأزمة التي أثارتها، ولا تزال تثيرها،
جائحة COVID-19. ومنذ بدء الجائحة، كانت الخسائر التي ألحقها COVID-19 بالصحة العالمية مهولة. فاعتباراً من 15 أغسطس 2021، كان قد أصيب نحو 2.5 مليار شخص
بعدوى COVID-19، 1 وتوفي على إثر الجائحة 4.4 مليون شخص على مستوى العالم، وفق ما ورد في التقارير المعنية. ومن المتوقع ازدياد معدل الوفيات المُبلغ عنها بمقدار 1.1
مليون حالة وفاة إضافية – بإجمالي عدد وفيات يصل إلى 5.5 مليون شخص – بحلول 1 ديسمبر 2021، وعلى الجانب المقابل، فإن التحديات المتغيرة المرتبطة بالسلالات الجديدة ا لصندوق النقد من الفيروس لا تنبئ إلا بمصير مجهول للجائحة. بالإضافة إلى ذلك، ووفقً
الدولي، فإن تبعات الجائحة على القطاع الاقتصادي كانت جسيمة، حيث تراجع إجمالي ا انخفاض بنحو %7.0 الناتج المحلي (GDP) العالمي بنحو 3.5% في عام 2020، متضمنًفي أمريكا اللاتينية ومنطقة البحر الكاريبي وانخفاض يتجاوز 6% في الدول الإفريقية
التي تقع جنوب الصحراء الكبرى.من بين الآثار العديدة الأخرى لجائحة COVID-19، فقد أدت أيضًا إلى حدوث ارتفاع
هائل في معدلات المساعدة الإنمائية الصحية (DAH). وإجمالًا، فإننا نُقدّر أنه قد تم تخصيص 13.7 مليار دولار من المساعدة الإنمائية الصحية لأوجه الاستجابة الصحية
اللازمة للتصدي لنشاط COVID-19، مثل الإنفاق على العلاجات والمتطلبات اللوجستية. وقد نتج عن ذلك الدعم زيادة غير مسبوقة تبلغ 35.7% في إجمالي المساعدة الإنمائية
الصحية بين عامي 2019 و2020. يظهر تحليلنا أيضًا أنه حسب المنطقة، لم تكن المساعدة الإنمائية الصحية المقدمة حتى يومنا هذا لمواجهة COVID-19 تتناسب
بالضرورة مع المناطق التي وقعت بها أشد التبعات نتيجة الفيروس. فعلى سبيل المثال، حصلت أمريكا اللاتينية ومنطقة البحر الكاريبي، التي تمثل منطقة عظمى فيما يتعلق
بعبء المرض العالمي، على 5.2% فقط من المساعدة الإنمائية الصحية المُخصصة

38 | FINANCING GLOBAL HEALTH 2020
بل البنك الدولي، فإن البلدان منخفضة الدخل تظل هي حسب فئة الدخل المُصنفة من قِالأكثر اعتمادًا على المساعدة الإنمائية الصحية (25.0% [24.4–25.5] من حجم الإنفاق
الصحي في عام 2018)، بينما يتم الاعتماد على الإنفاق الشخصي بالصورة الأكبر لتمويل الرعاية الصحية في البلدان ذات الدخل الأقل من المتوسط (55.9% [53.7-58.2] من حجم
الإنفاق الصحي في عام 2018). في حين يكون الإنفاق الحكومي والإنفاق الخاص المدفوع ا هما الأكثر انتشاراً في البلدان مرتفعة الدخل (86.5% [86.0-87.0] من حجم الإنفاق مسبقً
الصحي في عام 2018). وبالنسبة لمجالات التركيز الصحي بخلاف COVID-19، فقد انخفضت المساعدة الإنمائية الصحية المُخصصة لمكافحة فيروس نقص المناعة البشرية/الإيدز
والملاريا والسُل بين عامي 2019 و2020، حيث تراجعت بمقدار 3.4% و2.2% و5.5% على التوالي. بالإضافة إلى ذلك، ارتفعت المساعدة الإنمائية الصحية المُخصصة لمكافحة الأمراض
ا، حيث زادت من 846.9 مليون دولار عام 2019 إلى غير السارية (NCDs) بنسبة 4.7% تقريبً887.0 مليون دولار عام 2020، وفي المقابل، تُظهر تقديراتنا للمساعدة الإنمائية الصحية
المُخصصة لمجال صحة الأطفال وحديثي الولادة ومجال الصحة الإنجابية وصحة الأمومة أنها انخفضت في كليهما بين عامي 2019 و2020: انخفض التمويل المقدم لصحة الأطفال وحديثي الولادة بنسبة 2.6%، بينما انخفضت المساعدة الإنمائية الصحية المقدمة للصحة الإنجابية وصحة الأمومة بنسبة 6.8% بين عامي 2019 و2020. بالرغم من أن الإنفاق على
مكافحة COVID-19 لم يسفر عن انخفاضات كبرى في المساعدة الإنمائية الصحية المُخصصة لمجالات التركيز الصحي في الفترة بين عامي 2019 و2020، فإن المساعدة الإنمائية الصحية
لم ترتفع في العديد من مجالات التركيز الصحي، ومما لا شك فيه أن الجائحة قد عقدت مخطط الإنفاق الإنمائي، فضلًا عن تعقيد الجهود الحيوية لتوفير الرعاية لمن هم في أمس الحاجة
إليها. ويظل تخفيف العبء الناجم عن حالات مثل الملاريا والسُل ملحًا كأي وقت مضى. يتضمن تقرير تمويل قطاع الصحة العالمي لعام 2020 أيضًا تقديرات لحجم الإنفاق الصحي
في المستقبل بدءًا من عام 2019 وحتى عام 2050، وذلك لمساعدة الممولين وصانعي السياسات على التخطيط. ونتوقع أن ينمو حجم الإنفاق الصحي العالمي ليصل إلى 9.9
تريليون دولار )فاصل عدم التأكد 95%: 9.7-10.1) بحلول عام 2030 وإلى 14.4 تريليون دولار (13.7– 15.1) بحلول 2050. على الأرجح، ستظل هناك فوارق على الصعيد العالمي: من المتوقع أن ينمو
حجم إنفاق البلدان ذات الدخل المرتفع ليصل إلى 6023 دولاراً للفرد (5904–6150) بحلول عام 2030 وإلى 8539 دولاراً للفرد (8058–9065) بحلول 2050. وعلى النقيض،
من المتوقع أن ينمو حجم إنفاق البلدان ذات الدخل المنخفض من 35 دولاراً للفرد (34–36) في عام 2018 (0.6% من حجم إنفاق البلدان ذات الدخل المرتفع لعام 2018) إلى 46 دولاراً للفرد
(44–48) في عام 2050 (0.5% من حجم إنفاق البلدان ذات الدخل المرتفع في عام 2050).
إجمالًا، تتضمن أبرز النقاط الواردة في تقرير تمويل قطاع الصحة العالمي لعام 2020 ما يلي:
تركيز على رصد حجم الإنفاق المتعلق بجائحة COVID-19. تستند هذه التقديرات على ـCOVID-19 تقديرات العمل الجديد الذي اضطلع به فريق البحث. ويشمل عملنا المتعلق ب
الدعم الذي تقدمه الجهات المانحة للتصدي لجائحة COVID-19، بما في ذلك التزامات COVID-19 بل وكالة التوزيع، وما إذا أعيد توجيه التمويل لمكافحة الإنفاق وتوزيعاته من قِ
أو ما إذا كان جديدًا أم لا.
التقديرات المحدثة لإجمالي الإنفاق المحلي على الصعيد العالمي، من الآن وحتى عام 2018، والتقديرات المحدثة للمساهمات في المساعدة الإنمائية الصحية، من الآن
وحتى عام 2020.
التقديرات المحدثة لحجم لإنفاق الصحي المستقبلي حتى عام 2050.
ملفات تعريف تمويل قطاع الصحة العالمي المحدثة لسبعة مجالات تركيز صحي، .COVID-19 بما في ذلك ملف تعريف جديد لجائحة

لت 28.7% من للتصدي لجائحة COVID-19، في حين أن نسبة الوفيات بها كمنطقة شكَّا للتقارير الواردة حتى 15 أغسطس نسبة الوفيات العالمية التي أسفر عنها COVID-19 وفقً
2021. 1 نتطرق لهذا الأمر وغيره من النتائج باستفاضة في الأقسام ذات الصلة بجائحة COVID-19 من تقرير تمويل قطاع الصحة العالمي لعام 2020.
يحتوى تقرير هذا العام أيضًا على تحديثات لتقديراتنا الخاصة بحجم الإنفاق رت المساعدة الإنمائية الصحية المُخصص للتأهب للجوائح. ففي عام 2020، قُدِّ
المُخصصة للتأهب للجوائح بـ811.1 مليون دولار، أو نحو 1.5% من المساعدة الإنمائية رت بنسبة 0.58% ]فاصل عدم التأكد %95: 0.57– الصحية الكلية لعام 2020 )التي قُدِّ
0.58 ]† من إجمالي الإنفاق العالمي على القطاع الصحي في عام 2020(. ومثلما شهدنا العام الماضي وسنظل نشهد كما تدل الحقيقة المجردة طالما استمر وباء COVID-19، فإن
التأهب غير الكافي للجوائح قد يكون له عواقب كارثية طويلة الأمد. على نطاق أوسع، يتضمن تقرير تمويل قطاع الصحة العالمي لعام 2020 تقديرات
الإنفاق الصحي التي تغطي 204 بلدان من عام 1995 وحتى عام 2018. وفيما يتعلق بالمساعدة الإنمائية الصحية، فإننا نوفر تقديرات من عام 1990 حتى 2020 لعدد 135 من
البلدان منخفضة الدخل ومتوسطة الدخل.أما السيناريوهات التي نتوقعها لحجم الإنفاق الصحي في المستقبل، فتغطي 204 دولة للفترة من 2019 إلى 2050. لقد بيّنت جائحة
COVID-19 للعالم مدى أهمية وجود منظومات صحية راسخة )بحيث يمثل التأهب ا واحدًا فقط منها(، وتعمل بيانات الإنفاق الحكومي الواردة في تقرير تمويل للجوائح ركنً
قطاع الصحة العالمي إلى جانب تقديرات المساعدة الإنمائية الصحية على مساعدة صانعي السياسات في تحديد الجوانب اللازم تحسينها في المنظومات الصحية.
يوضح عملنا أن إجمالي الإنفاق الصحي العالمي استمر في الازدياد ليصل إلى 8.5 تريليون دولار (8.4-8.5) في عام 2018، وهو أحدث عام تتوفر له بيانات بشأن إجمالي
الإنفاق الصحي. يشكل هذا زيادة بنسبة 3.0% (4.3-1.7) عن إجمالي الإنفاق لعام 2017. ا لنوع الإنفاق، يمكن تقسيم أوجه الإنفاق خلال عام 2018 على النحو التالي: ووفقً
5.0 تريليون دولار (5.0-5.1)، أو 59.4%، إنفاق حكومي على الصحة • ا • 1.9 تريليون دولار (1.8-1.9)، أو 22.1%، إنفاق خاص مدفوع مسبقً1.5 تريليون دولار (1.5-1.6)، أو 18.0%، إنفاق شخصي على الصحة • 39.2 مليار دولار، أو 0.5%، تمويل من جهات مانحة•
ر عدد سكان العالم بنحو 7.7 مليار نسمة، من بينهم %46.7 (3.6 في عام 2018، قُدِّـ 79 بلدًا منخفضة الدخل أو ذات الدخل الأقل من مليار) كانوا يعيشون في واحد من ال
المتوسط. وعلى الرغم من أنه، في عام 2018، شكلت المساعدة الإنمائية الصحية نسبة 0.46% فقط
(0.46–0.47) من الإنفاق العالمي على القطاع الصحي، إلا أنها تمثل أهمية بالنسبة للبلدان التي تعتمد على هذه المساعدة. وبالإضافة إلى كون المساعدة الإنمائية الصحية بمثابة طوق نجاة لبعض الدول، فبإمكانها أن تمثل حافزاً عن طريق تركيز الاستثمارات
على الأنشطة أو الفئات التي قد لا تحظى بالاهتمام أو الموارد بصورة أخرى. كما تم التنويه إليه، فقد ارتفع إجمالي المساعدة الإنمائية الصحية في عام 2020
بمعدل يتجاوز نسبة 35.7% الواردة في تقديراتنا لعام 2019 البالغة 40.4 مليار دولار. ـ30 عامًا وعلى الرغم من أن المساعدة الإنمائية الصحية قد ازدادت على مدار فترة ال
الماضية – حيث بلغت 8.1 مليار دولار في عام 1990، مُحرزة بذلك ارتفاعًا بنسبة 574.0% على مدى الفترة الزمنية لرصدنا – إلا أن معدلات المساعدة الإنمائية الصحية لم يسبق لها الازدياد على النحو الذي ازدادت عليه في الفترة بين عامي 2019 و2020.
والواقع أن المساعدة الإنمائية الصحية كانت ثابتة إلى حد كبير بين عامي 2010 و2019، إذ تراوحت بين 35.3 و40.6 مليار دولار في العام الواحد. على الرغم من أن
معدل الزيادة في الفترة بين عاميا لضمان عدم إهمال ا إضافيً ا، فإن الأمر يتطلب إنفاقً 2019-2020 كان أمراً إيجابيً
الدول منخفضة الدخل. فدون أخذ معدل الإنفاق على COVID-19 بعين الاعتبار، بلغ حجم المساعدة الإنمائية الصحية في عام 2020 قيمة 41.2 مليار دولار، وهو أعلى من
المساعدة الإنمائية الصحية المُخصصة في عام 2019 بنحو %1.8.
39 | يذيفنتلا صخلملا
† تقديراتنا المُنمذجة لإجمالي الإنفاق الصحي مُقدمة بفواصل عدم تأكد. أما تقديراتنا للمساعدة الإنمائية
الصحية، فهي ليست مُنمذجة بصورة عامة ولا تتضمن فواصل عدم تأكد. ما لم تتم الإشارة إلى خلاف
ذلك، فإن جميع التقديرات مُقدمة بالدولار الأمريكي المُعدَّل حسب التضخم في عام 2020 والمصدر
المُستمد منه جميع الأرقام هو قاعدة بيانات تمويل قطاع الصحة العالمي لعام 2020، ما لم تتم الإشارة
إلى خلاف ذلك.

40 | FINANCING GLOBAL HEALTH 2020

INTrOduCTION ANd COvId-19 spENdING | 41
Introduction and COVID-19 spending
The Institute for Health Metrics and Evaluation is pleased to present Financing Global Health 2020, the 12th in the report series that tracks global health spending. The 2019 report was written and edited in the early days of the COVID-19 pandemic, and we posed a series of questions pertinent to the evolving pandemic situation: will there be enough hospital beds? Will there be enough ventilators? What about personal protective equipment and hand sanitizer – will there be enough to go around? In the year that ensued, COVID-19 has continued to exact a terrible toll. The pandemic has taken millions of lives, infected tens of millions more, and done trillions of dollars of economic damage around the world. In the United States, COVID-19’s death toll is now higher than the number of US deaths in World War II, the Korean War, the Vietnam War, the Gulf War, the War in Afghanistan, and the Iraq War combined. And it has cost countries trillions of dollars to treat both the disease itself and the financial pain the pandemic has caused around the world.2
But now, a year later, answers to some of the questions we asked in Financing Global Health 2019 are known, and it is clear that robust and well-financed health systems are integral, although perhaps not sufficient, to protecting individual countries and the global system we all live in. Because of the importance of this, in addition to reporting on total health spending, we include in this year’s report a more in-depth analysis of development assistance for health for COVID-19. We also estimate health spending to 2050, to help policymakers plan for coming transitions and challenges.
Much of Financing Global Health 2020 is focused on estimating the amount of resources disbursed to the health-related global response to COVID-19. Specifically, we present estimates of development assistance for health for COVID-19, by source, channel, and program area. Our work on COVID-19 not only gives policymakers a view of spending on the health- related response to COVID-19 to date, but it can also help identify areas of concerns and targets of future spending. After all, while human ingenuity has very much been on display over the last year – that so many COVID-19 vaccines3 have been developed within a year of the pandemic’s appearance remains amazing – a new set of COVID-19 challenges now confront the world.
Issues such as vaccine nationalism will mean that some countries see improved infection and death rates while other countries (generally low-income without sufficient access to vaccines) fare worse. Additionally, if global vaccine distribution is not equitable, then COVID-19 could continue to thrive in some parts of the world while others recover from the pan-demic.4 That in turn could lead to the development of variants that elude current vaccines’ protection or that can lead to reinfection, introducing the

42 | FINANCING GLOBAL HEALTH 2020
possibility that places which may have seemed “safe” are safe no longer.5 There is evidence that some SARS-CoV-2 variants may be more transmis-sible and deadlier than the original SARS-CoV-2 virus (D614G).6,7 More worrisome is the evidence that some variants could be resistant to COVID-19 treatments or could evade vaccine protection.8
This is all the more reason for the global health world to work together to wholly tackle – and re-tackle as necessary – the ongoing COVID-19 crisis. Because COVID-19 is a global issue it requires a global response: anything less could very well prolong the pandemic’s course. By emphasizing the interconnected and interdependent nature of global health and global health financing, Financing Global Health 2020 can help decision-makers address complicated, multifaceted, multi-stakeholder health issues, from novel infectious diseases to chronic conditions. In a globally connected world, robustly financed public health systems are essential to combating pandemics.
In Financing Global Health 2020’s introduction, we explore data related to the focus of this year’s report: the contagious respiratory disease caused by the SARS-CoV-2 virus, Coronavirus disease 2019, or COVID-19. The pan-demic has been one of the most destabilizing events of the past century (if not the most), and has led to a radical reorientation of life around COVID-19. Financing Global Health 2020 is no different: our resource tracking efforts have been centered around COVID-19.
The report’s introduction also provides an overview of total health spending for 204 countries, from 1995 to 2018. It can be argued that because of COVID-19, tracking total health spending and projecting future spending on health is more important than ever. The pandemic has shown us how important it is for health systems to be robust and responsive: health systems require prepaid resources to ensure that key public health initia-tives and responses are possible. Without such resources, health systems may not be ready for the shock of a pandemic or similar widespread health event. And in the case of a communicable disease, a lack of preparation (and a speedy response) can turn something that could be quite mild into a crisis.
Following the introduction, our work on development assistance for health is split in two: Part One of the report is focused on DAH for COVID-19, while Part Two details other important trends in development assistance for health. This includes DAH for non-COVID-19 health focus areas (i.e., HIV/AIDS, malaria, and tuberculosis) as well as DAH by source and channel, region, and program areas. Our COVID-19 estimates show DAH for COVID-19 by source and channel, plus comparisons to DAH for other health focus areas, and explorations of the impact the sudden influx of COVID-19 spending had on overall infectious disease program and health systems strengthening (HSS) spending.
Financing Global Health’s third section covers domestic spending, both historically and in the future, from 2018 to 2030 and to 2050. Our estimates of domestic spending in this year’s report cover health spending by financing source, health spending by person and income group, changes over time in health spending per person and universal health coverage, and regional patterns of health spending. Given Financing Global Health 2020’s

INTrOduCTION ANd COvId-19 spENdING | 43
Box 1 Peer-reviewed foundation
The work presented in Financing Global Health 2020 draws in part on a peer-reviewed research article published on September 22, 2021.
• Tracking development assistance for health and for COVID-19: a review of development assistance, government, out-of-pocket, and other private spending on health for 204 countries and territories, 1990–2050
focus on COVID-19, we do not estimate domestic spending by health focus area, though estimates for condition-related development assistance for health are available.
Finally, Financing Global Health 2020 includes an updated feature introduced in last year’s report, the global health financing profiles. This year we chose to concentrate on key health focus areas, including a new profile for COVID-19 spending. In addition to being available as a section of Financing Global Health 2020, stakeholders can access the profiles individually on healthdata.org.
What’s new in Financing Global Health 2020The 2020 edition of Financing Global Health introduces a number of additional data sources, analyses, and sections. The report has been published annually since 2009, and with every iteration we seek to improve upon the previous year’s work. Here’s what’s new in Financing Global Health 2020:
• A focus on COVID-19Financing Global Health 2020 includes a number of sections that explore the development assistance committed toward the health- related COVID-19 response. In addition to presenting new estimates of development assistance for health for COVID-19, the theme of the pandemic runs throughout this year’s report.
• Streamlined domestic spending estimates As noted, given this year’s focus on DAH for COVID-19 (and the new research required to produce those estimates), we’ve focused our estimates of domestic spending. While estimates of spending by country, region, and income group through 2018 are available and included, Financing Global Health 2020 does not include updated estimates of domestic spending by health focus area.
• Revised future health spending projections to 2030 and 2050This year’s report includes updated spending projections to 2030 and 2050. Our work explores trends in future health spending for 204 countries, assuming historical spending patterns and relation-ships persist.
• Updated Global Health Financing ProfilesIntroduced in Financing Global Health 2019, the Global Health Financing Profiles allow stakeholders to easily access information on a range of health focus areas and related funding streams; we also include a separate Global Health Financing Profile of COVID-19 in this year’s report. In addition to being available as a section of Financing Global Health 2020, the profiles can be viewed individually on healthdata.org.

44 | FINANCING GLOBAL HEALTH 2020
Box 2 Health financing terms defined
Annualized rate of change: This is the growth rate needed each year (i.e., annualized) to go from the observed amount in one year to an observed amount in a different year. Also known as compound growth rate (with annual compounding).
Development assistance for health: Financial and in-kind resources that are trans-ferred through international development agencies (such as United Nations Children’s Fund [UNICEF], the United Kingdom’s Department for International Development, or the Bill & Melinda Gates Foundation) to low- and middle-income countries with the primary purpose of maintaining or improving health.
Disability-adjusted life year (DALY): One DALY is equivalent to one lost year of “healthy” life. The sum of these DALYs across the population, or the health loss, is a measurement of the gap between current health status and an ideal health situation where the entire population lives to an advanced age, free of disease and disability.
Global Burden of Disease super-regions: Seven regions which group sub-regions based on cause of death patterns. Super-regions are as follows: GBD high-income; Latin America and the Caribbean; sub-Saharan Africa; Southeast Asia, East Asia, and Oceania; Central Europe, Eastern Europe, and Central Asia; South Asia; and North Africa and the Middle East.
Government health spending: Spending for health care that is derived from domestic sources and is mutually exclusive from out-of-pocket, prepaid private, and DAH spending. Government spending includes spending on public health system infrastruc-ture and government-provided social health insurance.
Health financing transition: The shift that countries experience from an early period in which health spending is low and primarily out-of-pocket to a later period in which health spending is high and primarily pooled.
Out-of-pocket health spending: Payments made by individuals for health mainte-nance, restoration, or enhancement at or after the time of health care delivery, including health insurance copayments or payments devoted to deductibles. Health insurance premiums are not considered out-of-pocket.
Prepaid private health spending: Health spending sources from non-public programs that are funded prior to obtaining health care, such as private health insurance and services provided for free by non-governmental agencies.
Total health spending: The sum of government health spending, prepaid private health spending, out-of-pocket health spending, and DAH. Total health spending does not include indirect health spending, such as lost wages due to illness or transportation costs; informal care (spending on care provided by a family member or by traditional healers); or illegal transactions.
Universal health coverage: The goal of universal health coverage is to ensure that all people have access to effective health services and may partake of these services without financial hardship.
World Bank income group: The World Bank classifies countries using gross national income (GNI) per person. This report uses the Fiscal Year 2019 World Bank income groups, which are high-income (GNI per person greater than $12,055), upper-middle- income ($3,896 to $12,055), lower-middle-income ($996 to $3,895), and low-income ($995 or less).9
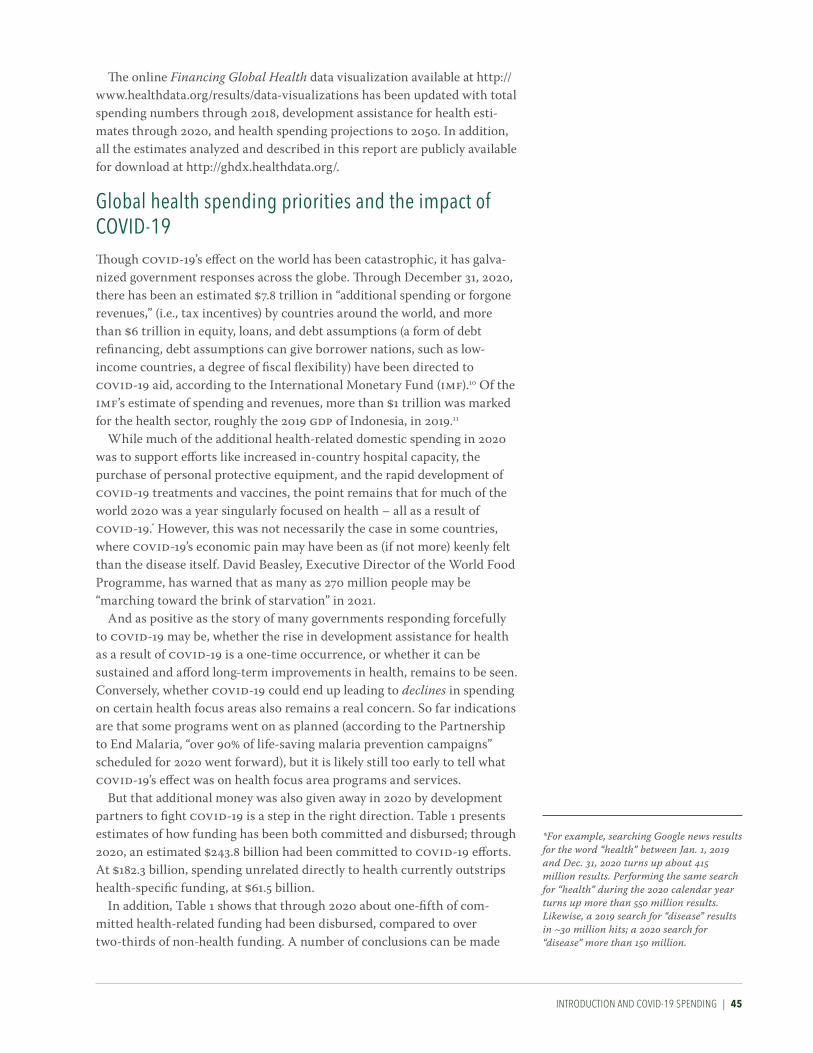
INTrOduCTION ANd COvId-19 spENdING | 45
The online Financing Global Health data visualization available at http://www.healthdata.org/results/data-visualizations has been updated with total spending numbers through 2018, development assistance for health esti-mates through 2020, and health spending projections to 2050. In addition, all the estimates analyzed and described in this report are publicly available for download at http://ghdx.healthdata.org/.
Global health spending priorities and the impact of COVID-19Though COVID-19’s effect on the world has been catastrophic, it has galva-nized government responses across the globe. Through December 31, 2020, there has been an estimated $7.8 trillion in “additional spending or forgone revenues,” (i.e., tax incentives) by countries around the world, and more than $6 trillion in equity, loans, and debt assumptions (a form of debt refinancing, debt assumptions can give borrower nations, such as low- income countries, a degree of fiscal flexibility) have been directed to COVID-19 aid, according to the International Monetary Fund (IMF).10 Of the IMF’s estimate of spending and revenues, more than $1 trillion was marked for the health sector, roughly the 2019 GDP of Indonesia, in 2019.11
While much of the additional health-related domestic spending in 2020 was to support efforts like increased in-country hospital capacity, the purchase of personal protective equipment, and the rapid development of COVID-19 treatments and vaccines, the point remains that for much of the world 2020 was a year singularly focused on health – all as a result of COVID-19.* However, this was not necessarily the case in some countries, where COVID-19’s economic pain may have been as (if not more) keenly felt than the disease itself. David Beasley, Executive Director of the World Food Programme, has warned that as many as 270 million people may be “marching toward the brink of starvation” in 2021.
And as positive as the story of many governments responding forcefully to COVID-19 may be, whether the rise in development assistance for health as a result of COVID-19 is a one-time occurrence, or whether it can be sustained and afford long-term improvements in health, remains to be seen. Conversely, whether COVID-19 could end up leading to declines in spending on certain health focus areas also remains a real concern. So far indications are that some programs went on as planned (according to the Partnership to End Malaria, “over 90% of life-saving malaria prevention campaigns” scheduled for 2020 went forward), but it is likely still too early to tell what COVID-19’s effect was on health focus area programs and services.
But that additional money was also given away in 2020 by development partners to fight COVID-19 is a step in the right direction. Table 1 presents estimates of how funding has been both committed and disbursed; through 2020, an estimated $243.8 billion had been committed to COVID-19 efforts. At $182.3 billion, spending unrelated directly to health currently outstrips health-specific funding, at $61.5 billion.
In addition, Table 1 shows that through 2020 about one-fifth of com-mitted health-related funding had been disbursed, compared to over two-thirds of non-health funding. A number of conclusions can be made
*For example, searching Google news results for the word “health” between Jan. 1, 2019 and Dec. 31, 2020 turns up about 415 million results. Performing the same search for “health” during the 2020 calendar year turns up more than 550 million results. Likewise, a 2019 search for “disease” results in ~30 million hits; a 2020 search for “disease” more than 150 million.
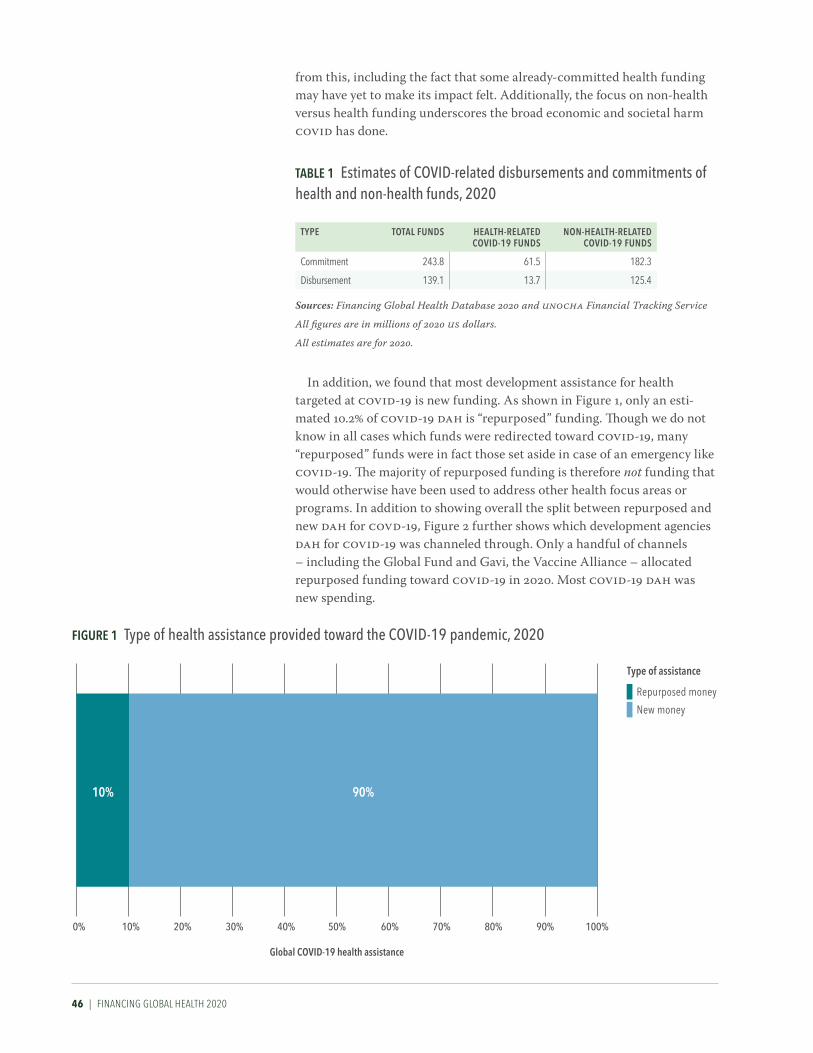
46 | FINANCING GLOBAL HEALTH 2020
from this, including the fact that some already-committed health funding may have yet to make its impact felt. Additionally, the focus on non-health versus health funding underscores the broad economic and societal harm COVID has done.
In addition, we found that most development assistance for health targeted at COVID-19 is new funding. As shown in Figure 1, only an esti-mated 10.2% of COVID-19 DAH is “repurposed” funding. Though we do not know in all cases which funds were redirected toward COVID-19, many “repurposed” funds were in fact those set aside in case of an emergency like COVID-19. The majority of repurposed funding is therefore not funding that would otherwise have been used to address other health focus areas or programs. In addition to showing overall the split between repurposed and new DAH for COVD-19, Figure 2 further shows which development agencies DAH for COVID-19 was channeled through. Only a handful of channels – including the Global Fund and Gavi, the Vaccine Alliance – allocated repurposed funding toward COVID-19 in 2020. Most COVID-19 DAH was new spending.
0% 10% 20% 30% 40% 50% 60% 70% 80% 90% 100%
Global COVID-19 health assistance
10% 90%
Type of assistance
Repurposed money
New money
Figure 1 Type of health assistance provided toward the CoViD-19 pandemic, 2020
TaBle 1 estimates of CoViD-related disbursements and commitments of health and non-health funds, 2020
TYPe ToTal FuNDS HealTH-relaTeD CoViD-19 FuNDS
NoN-HealTH-relaTeD CoViD-19 FuNDS
Commitment 243.8 61.5 182.3
Disbursement 139.1 13.7 125.4
Sources: Financing Global Health Database 2020 and UNOCHA Financial Tracking Service
All figures are in millions of 2020 US dollars.
All estimates are for 2020.
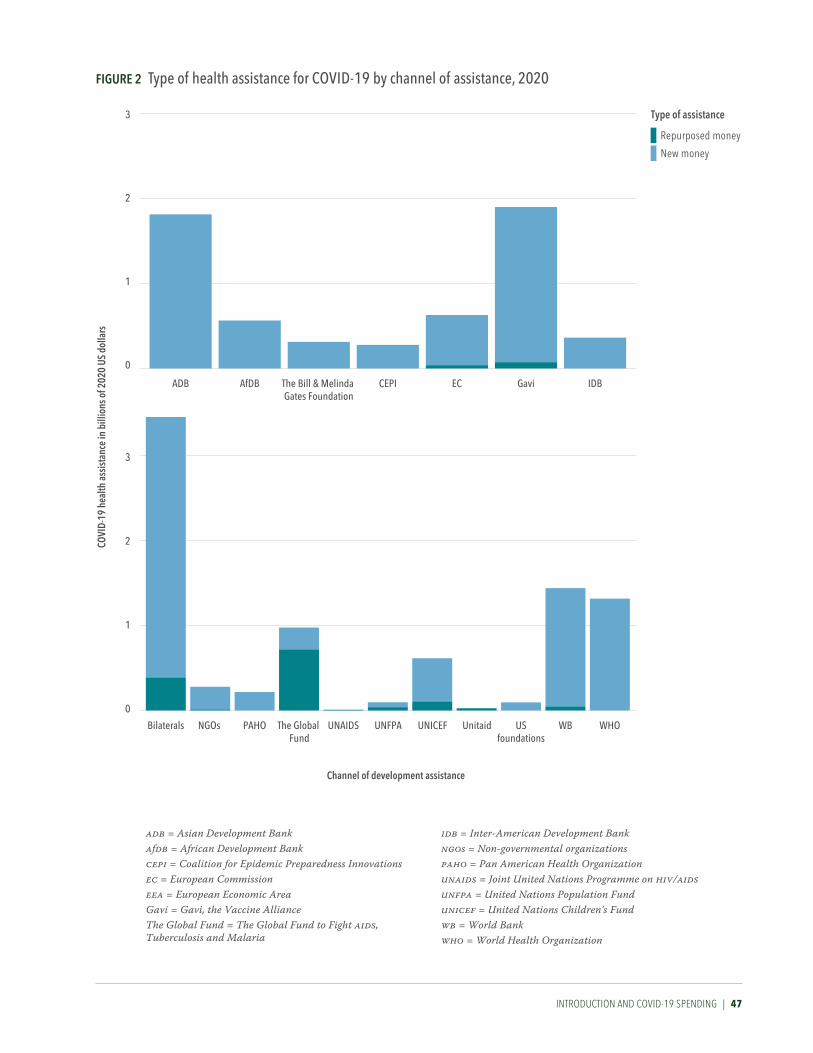
INTrOduCTION ANd COvId-19 spENdING | 47
Figure 2 Type of health assistance for CoViD-19 by channel of assistance, 2020CO
VID-
19 h
ealth
ass
istan
ce in
bill
ions
of 2
020
US d
olla
rs
Channel of development assistance
0
1
2
3
0
1
2
3
Bilaterals NGOs PAHO The Global Fund
UNAIDS UNFPA UNICEF Unitaid USfoundations
WB WHO
ADB AfDB The Bill & Melinda Gates Foundation
CEPI EC Gavi IDB
adb = Asian Development Bankafdb = African Development Bankcepi = Coalition for Epidemic Preparedness Innovationsec = European Commissioneea = European Economic AreaGavi = Gavi, the Vaccine AllianceThe Global Fund = The Global Fund to Fight aids, Tuberculosis and Malaria
Type of assistance
Repurposed money
New money
idb = Inter-American Development Bankngos = Non-governmental organizationspaho = Pan American Health Organizationunaids = Joint United Nations Programme on hiv/aidsunfpa = United Nations Population Fundunicef = United Nations Children's Fundwb = World Bankwho = World Health Organization
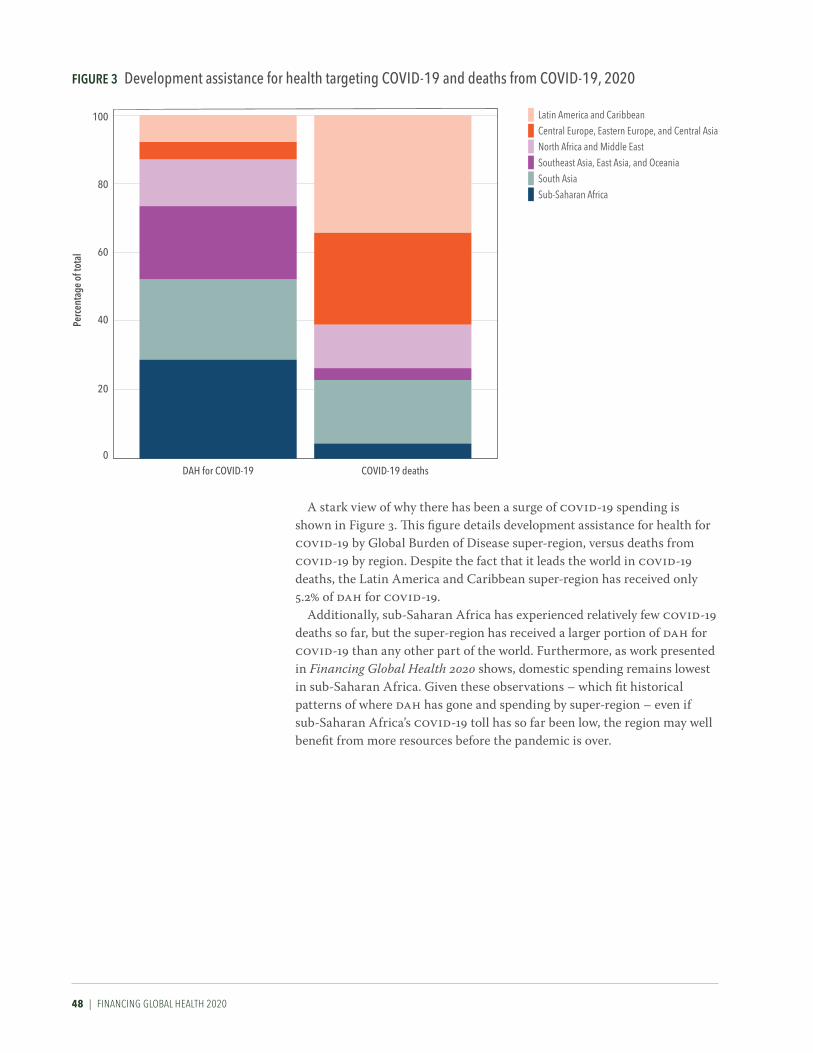
48 | FINANCING GLOBAL HEALTH 2020
A stark view of why there has been a surge of COVID-19 spending is shown in Figure 3. This figure details development assistance for health for COVID-19 by Global Burden of Disease super-region, versus deaths from COVID-19 by region. Despite the fact that it leads the world in COVID-19 deaths, the Latin America and Caribbean super-region has received only 5.2% of DAH for COVID-19.
Additionally, sub-Saharan Africa has experienced relatively few COVID-19 deaths so far, but the super-region has received a larger portion of DAH for COVID-19 than any other part of the world. Furthermore, as work presented in Financing Global Health 2020 shows, domestic spending remains lowest in sub-Saharan Africa. Given these observations – which fit historical patterns of where DAH has gone and spending by super-region – even if sub-Saharan Africa’s COVID-19 toll has so far been low, the region may well benefit from more resources before the pandemic is over.
Figure 3 Development assistance for health targeting CoViD-19 and deaths from CoViD-19, 2020Pe
rcen
tage
of t
otal
0
20
40
60
80
100
DAH for COVID-19 COVID-19 deaths
Latin America and CaribbeanCentral Europe, Eastern Europe, and Central AsiaNorth Africa and Middle EastSoutheast Asia, East Asia, and OceaniaSouth AsiaSub-Saharan Africa

INTrOduCTION ANd COvId-19 spENdING | 49

50 | FINANCING GLOBAL HEALTH 2020

TrACkING dEvELOpmENT AssIsTANCE FOr HEALTH FOr COvId-19 | 51
PART ONE
Tracking development assistance for health for COVID-19
New to Financing Global Health 2020, our estimates of COVID-19 develop-ment assistance for health were generated by combining project disbursement data from international development agency databases and data from assorted financial tracking databases like the International Aid Transparency Initiative and United Nations Office of Humanitarian Assistance (UNOCHA) Financial Tracking Service. Our aim was to generate as comprehensive a picture as possible of the health-related COVID-19 support to low- and middle-income countries, which can help decision-makers assess progress to date as well as what is still needed in the response to COVID-19, particularly in lower-income countries. According to work published by Tan-Torres Edejer et al. in The Lancet Global Health, between $33 and $62 billion may be needed to address COVID-19 in low- and middle-income countries.12
Box 3 Development assistance for health terms defined
Sources: The origins of funding, such as government treasuries, private philanthropic foundations, or any private-party contributions.
Channels: The intermediaries in the flow of funds, channels include bilateral aid agencies, multilateral organizations, non-governmental organizations (NGOs), UN agencies, public-private partnerships, and private foundations.
Implementing institutions: DAH is ultimately directed to implementing institutions to provide health services and prevent and treat diseases in low- and middle-income countries. These institutions include governmental bodies, NGOs, and international organizations.
Health focus areas: The health focus areas assessed in this report are malaria; HIV/AIDS; tuberculosis; reproductive, maternal, newborn, and child health; non-communicable diseases; other infectious diseases; and health systems strengthening (HSS) and sector-wide approaches (SWAps). “Other DAH” refers to resources that target issues outside these focus areas, and “unallocable” captures the resources that we do not have information to assign.
Program areas: Within health focus areas, program areas describe the nature of the activity for which funds are being used. For example, program areas related to tuberculosis include diagnosis, drug resistance, human resources, and treatment.
Development assistance for health for COVID-19: Resources intended to improve COVID-19 health outcomes in low- and middle-income countries by development organizations through health interventions focused on country-level coordination, supply chain and logistics support, and treatment; COVID-19 DAH also covers spending for infection prevention and personal protective equipment, as well as vaccine research and development. Note that our estimates of DAH for COVID-19 exclude investments in humanitarian responses and economic stabilization programs.

52 | FINANCING GLOBAL HEALTH 2020
We estimate that in 2020, $13.7 billion in development assistance for health was targeted at COVID-19. This is in addition to the $41.2 billion in DAH spread across other health focus areas, for a total of $54.8 billion. This constitutes a 35.7% increase over the 2019 total of $40.4 billion. For compar-ison, the largest year-over-year increase in overall DAH was between 2002 and 2003, when DAH grew 24.9%, an increase of $3.5 billion. There has never been an increase in DAH like the one observed between 2019 and 2020, which points both to the enormity of the challenge posed by COVID-19, as well as the global effort to fight it.
Notably, while COVID-19 drove a dramatic increase in 2020 DAH overall, spending on other health focus areas (HIV/AIDS, malaria, and tuberculosis) stayed largely flat or declined slightly. According to our estimates, the attention focused on COVID-19 has so far not led to a new emphasis on development assistance for health overall.*
Figure 4 illustrates the dramatic jump in DAH driven by COVID-19 in 2020. Although there has been broad, steady growth in DAH spending since 1990 (albeit with several dips, such as in 1991, 1996–1997, and between 2014 and 2016), DAH has never grown like it did between 2019 and 2020. What’s
Figure 4 Development assistance for health and CoViD-19 by source of funding, 1990–2020
Billi
ons o
f 202
0 US
dol
lars
0
5
10
15
20
25
30
35
40
45
50
55
1991
1992
1993
1994
1995
1996
1997
1998
1999
2000
2001
2002
2003
2004
2005
2006
2007
2008
2009
2010
2011
2012
2013
2014
2016
2015
1990
2017
2018
2019
*
2020
*
Australia
Unidentified
Other sources
Debt repayments, IBRD
Other private philanthropy
Corporate donations
The Bill & Melinda Gates Foundation
Other governments
ChinaCanada
JapanNetherlands
NorwaySpain
FranceGermany
United Kingdom
United States
*2019 and 2020 estimates are preliminary.
ibrd = International Bank for Reconstruction and Development.
“Other governments” include Afghanistan, Angola, Argentina, Austria, Azerbaijan, Bangladesh, Belgium, Bhutan, Brazil, Brunei, Bulgaria, Côte d'Ivoire, Cameroon, Central African Republic, Chad, Colombia, Croatia, Czechia, Democratic Republic of the Congo, Denmark, Egypt, Estonia, Ethiopia, Finland, Gabon, Greece, Guinea, Hungary, Iceland, India, Indonesia, Iran, Iraq, Ireland, Italy, Jamaica, Jordan, Kenya, Kuwait, Latvia, Lebanon, Libya, Lithuania, Luxembourg, Madagascar, Malaysia, Malta, Monaco, Myanmar, New Zealand, Nigeria, Oman, Pakistan, Palestine, Peru, Poland, Portugal, Qatar, Romania, Russia, São Tomé and Príncipe, Saudi Arabia, Serbia, Singapore, Slovakia, Slovenia, South Africa, South Korea, South Sudan, Sudan, Sweden, Switzerland, Syria, Taiwan (province of China), Thailand, Togo, Turkey, Uganda, Ukraine, United Arab Emirates, Yemen, and Zimbabwe. “Other sources” captures development assistance for health for which we have source information but which is not identified as originating within any of the sources listed. Health assistance for which we have no source information is designated as “Unidentified.”
*See additional DAH estimates in Part Two of the report, which digs into DAH unrelated to COVID-19.
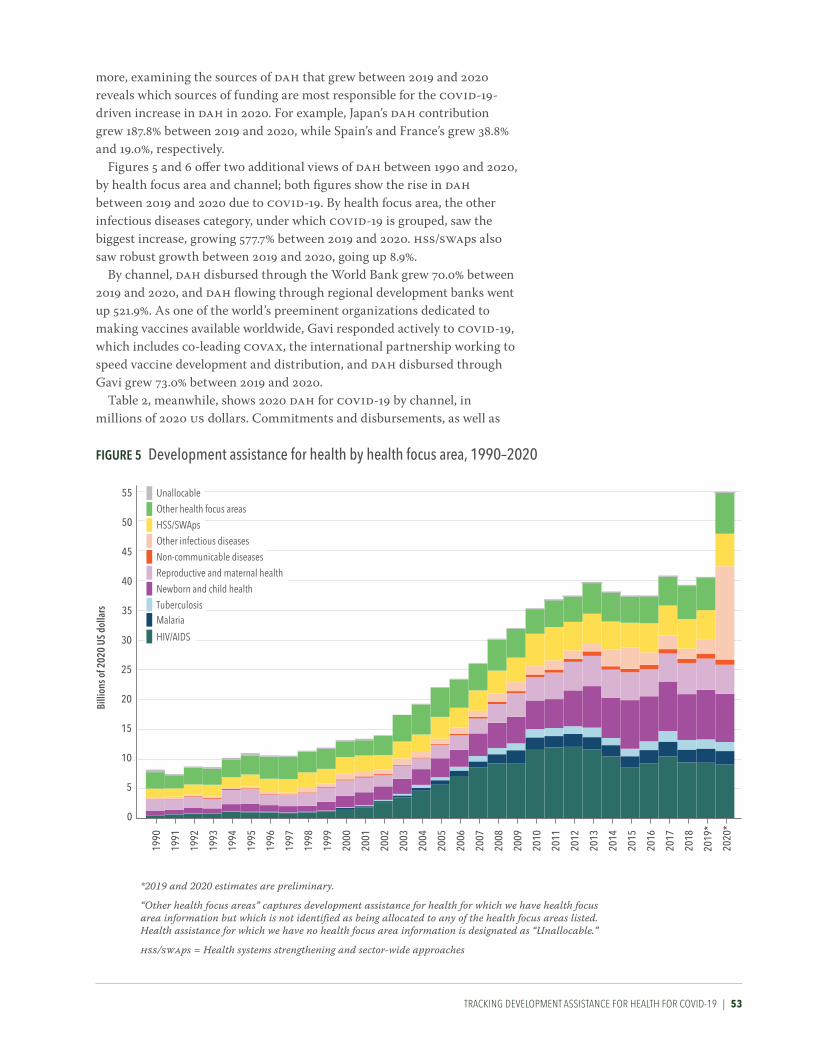
TrACkING dEvELOpmENT AssIsTANCE FOr HEALTH FOr COvId-19 | 53
more, examining the sources of DAH that grew between 2019 and 2020 reveals which sources of funding are most responsible for the COVID-19-driven increase in DAH in 2020. For example, Japan’s DAH contribution grew 187.8% between 2019 and 2020, while Spain’s and France’s grew 38.8% and 19.0%, respectively.
Figures 5 and 6 offer two additional views of DAH between 1990 and 2020, by health focus area and channel; both figures show the rise in DAH between 2019 and 2020 due to COVID-19. By health focus area, the other infectious diseases category, under which COVID-19 is grouped, saw the biggest increase, growing 577.7% between 2019 and 2020. HSS/SWAps also saw robust growth between 2019 and 2020, going up 8.9%.
By channel, DAH disbursed through the World Bank grew 70.0% between 2019 and 2020, and DAH flowing through regional development banks went up 521.9%. As one of the world’s preeminent organizations dedicated to making vaccines available worldwide, Gavi responded actively to COVID-19, which includes co-leading COVAX, the international partnership working to speed vaccine development and distribution, and DAH disbursed through Gavi grew 73.0% between 2019 and 2020.
Table 2, meanwhile, shows 2020 DAH for COVID-19 by channel, in millions of 2020 US dollars. Commitments and disbursements, as well as
Figure 5 Development assistance for health by health focus area, 1990–2020
Billi
ons o
f 202
0 US
dol
lars
0
25
20
15
10
5
30
35
40
45
50
55
1991
1992
1993
1994
1995
1996
1997
1998
1999
2000
2001
2002
2003
2004
2005
2006
2007
2008
2009
2010
2011
2012
2013
2014
2016
2015
1990
2017
2018
2019
*
2020
*
Tuberculosis
Unallocable
Other health focus areas
HSS/SWAps
Other infectious diseases
Non-communicable diseasesReproductive and maternal health
Newborn and child health
Malaria
HIV/AIDS
*2019 and 2020 estimates are preliminary.
“Other health focus areas” captures development assistance for health for which we have health focus area information but which is not identified as being allocated to any of the health focus areas listed. Health assistance for which we have no health focus area information is designated as “Unallocable.”
hss/swaps = Health systems strengthening and sector-wide approaches
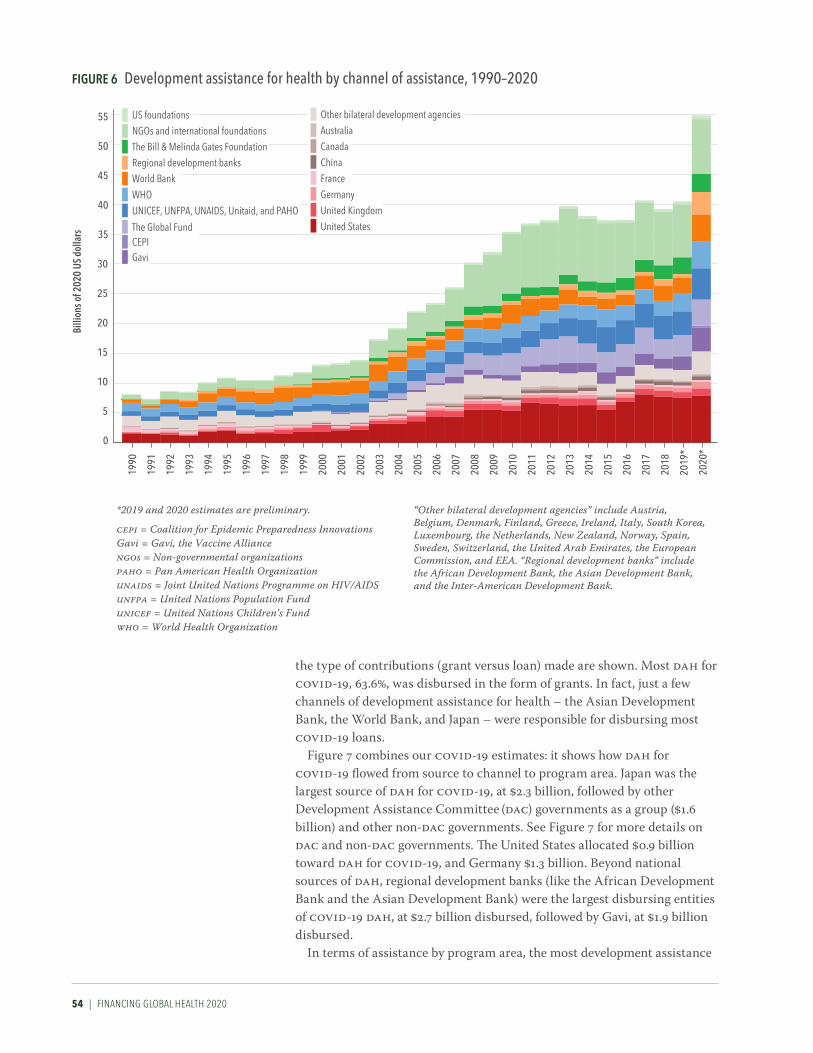
54 | FINANCING GLOBAL HEALTH 2020
the type of contributions (grant versus loan) made are shown. Most DAH for COVID-19, 63.6%, was disbursed in the form of grants. In fact, just a few channels of development assistance for health – the Asian Development Bank, the World Bank, and Japan – were responsible for disbursing most COVID-19 loans.
Figure 7 combines our COVID-19 estimates: it shows how DAH for COVID-19 flowed from source to channel to program area. Japan was the largest source of DAH for COVID-19, at $2.3 billion, followed by other Development Assistance Committee (DAC) governments as a group ($1.6 billion) and other non-DAC governments. See Figure 7 for more details on DAC and non-DAC governments. The United States allocated $0.9 billion toward DAH for COVID-19, and Germany $1.3 billion. Beyond national sources of DAH, regional development banks (like the African Development Bank and the Asian Development Bank) were the largest disbursing entities of COVID-19 DAH, at $2.7 billion disbursed, followed by Gavi, at $1.9 billion disbursed.
In terms of assistance by program area, the most development assistance
Figure 6 Development assistance for health by channel of assistance, 1990–2020Bi
llion
s of 2
020
US d
olla
rs
0
25
20
15
10
5
30
35
40
45
50
55
1991
1992
1993
1994
1995
1996
1997
1998
1999
2000
2001
2002
2003
2004
2005
2006
2007
2008
2009
2010
2011
2012
2013
2014
2016
2015
1990
2017
2018
2019
*
2020
*
*2019 and 2020 estimates are preliminary.
cepi = Coalition for Epidemic Preparedness InnovationsGavi = Gavi, the Vaccine Alliancengos = Non-governmental organizationspaho = Pan American Health Organizationunaids = Joint United Nations Programme on HIV/AIDSunfpa = United Nations Population Fundunicef = United Nations Children’s Fundwho = World Health Organization
UNICEF, UNFPA, UNAIDS, Unitaid, and PAHO
US foundations
NGOs and international foundations
World Bank
The Bill & Melinda Gates FoundationRegional development banks
WHO
CEPIGavi
The Global Fund
Other bilateral development agenciesAustralia
Canada
ChinaFrance
Germany
United Kingdom
United States
“Other bilateral development agencies” include Austria, Belgium, Denmark, Finland, Greece, Ireland, Italy, South Korea, Luxembourg, the Netherlands, New Zealand, Norway, Spain, Sweden, Switzerland, the United Arab Emirates, the European Commission, and EEA. “Regional development banks” include the African Development Bank, the Asian Development Bank, and the Inter-American Development Bank.
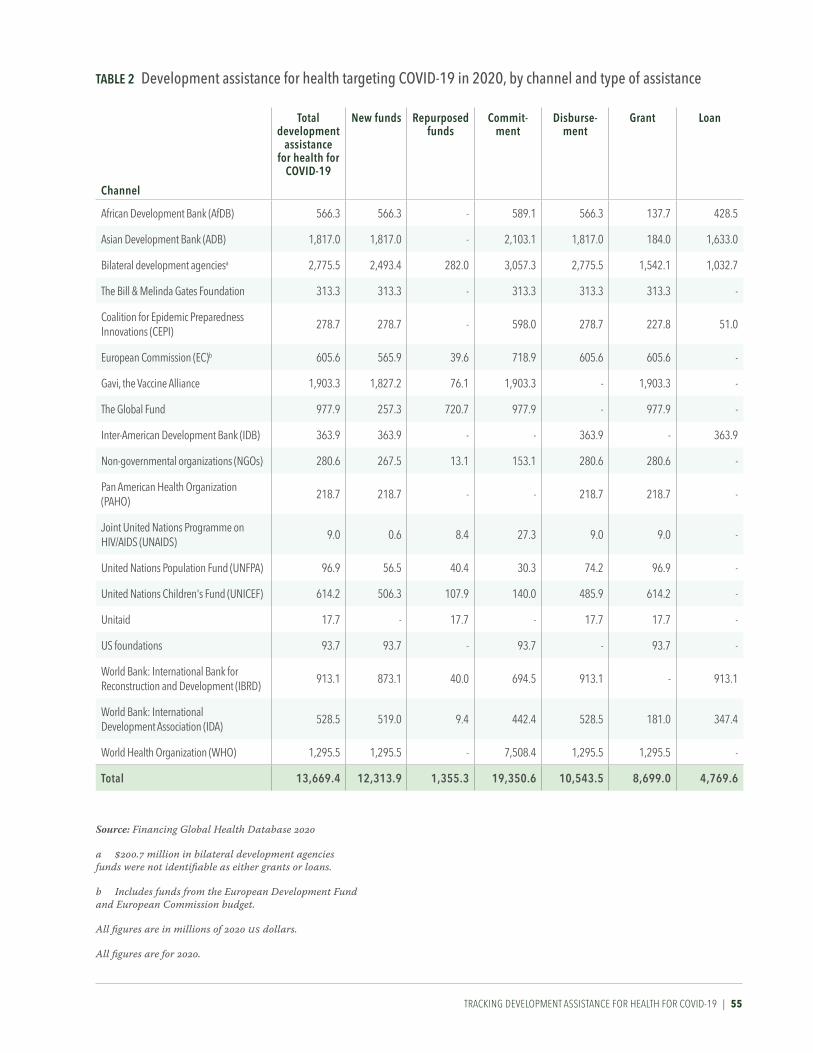
TrACkING dEvELOpmENT AssIsTANCE FOr HEALTH FOr COvId-19 | 55
Channel
Total development
assistance for health for
CoViD-19
New funds repurposed funds
Commit-ment
Disburse-ment
grant loan
African Development Bank (AfDB) 566.3 566.3 - 589.1 566.3 137.7 428.5
Asian Development Bank (ADB) 1,817.0 1,817.0 - 2,103.1 1,817.0 184.0 1,633.0
Bilateral development agenciesa 2,775.5 2,493.4 282.0 3,057.3 2,775.5 1,542.1 1,032.7
The Bill & Melinda Gates Foundation 313.3 313.3 - 313.3 313.3 313.3 -
Coalition for Epidemic Preparedness Innovations (CEPI)
278.7 278.7 - 598.0 278.7 227.8 51.0
European Commission (EC)b 605.6 565.9 39.6 718.9 605.6 605.6 -
Gavi, the Vaccine Alliance 1,903.3 1,827.2 76.1 1,903.3 - 1,903.3 -
The Global Fund 977.9 257.3 720.7 977.9 - 977.9 -
Inter-American Development Bank (IDB) 363.9 363.9 - - 363.9 - 363.9
Non-governmental organizations (NGOs) 280.6 267.5 13.1 153.1 280.6 280.6 -
Pan American Health Organization (PAHO)
218.7 218.7 - - 218.7 218.7 -
Joint United Nations Programme on HIV/AIDS (UNAIDS)
9.0 0.6 8.4 27.3 9.0 9.0 -
United Nations Population Fund (UNFPA) 96.9 56.5 40.4 30.3 74.2 96.9 -
United Nations Children's Fund (UNICEF) 614.2 506.3 107.9 140.0 485.9 614.2 -
Unitaid 17.7 - 17.7 - 17.7 17.7 -
US foundations 93.7 93.7 - 93.7 - 93.7 -
World Bank: International Bank for Reconstruction and Development (IBRD)
913.1 873.1 40.0 694.5 913.1 - 913.1
World Bank: International Development Association (IDA)
528.5 519.0 9.4 442.4 528.5 181.0 347.4
World Health Organization (WHO) 1,295.5 1,295.5 - 7,508.4 1,295.5 1,295.5 -
Total 13,669.4 12,313.9 1,355.3 19,350.6 10,543.5 8,699.0 4,769.6
Source: Financing Global Health Database 2020
a $200.7 million in bilateral development agencies funds were not identifiable as either grants or loans.
b Includes funds from the European Development Fund and European Commission budget.
All figures are in millions of 2020 US dollars.
All figures are for 2020.
TaBle 2 Development assistance for health targeting CoViD-19 in 2020, by channel and type of assistance

56 | FINANCING GLOBAL HEALTH 2020
Figure 7 Flows of development assistance for CoViD-19 from source to channel to program area, 2020
*Includes planning, monitoring and evaluation, risk communication and community engagement, and travel restrictions
**“Other non-DAC governments” include Afghanistan, Angola, Argentina, Azerbaijan, Bangladesh, Bhutan, Brazil, Brunei, Bulgaria, Côte d'Ivoire, Cameroon, Central African Republic, Chad, China, Colombia, Croatia, Democratic Republic of the Congo, Egypt, Estonia, Ethiopia, Gabon, Guinea, India, Indonesia, Iran, Iraq, Jamaica, Jordan, Kenya, Kuwait, Latvia, Lebanon, Libya, Lithuania, Madagascar, Malaysia, Malta, Monaco, Myanmar, Nigeria, Oman, Pakistan, Palestine, Peru, Qatar, Romania, Russia, São Tomé and Príncipe, Saudi Arabia, Serbia, Singapore, South Africa, South Sudan, Sudan, Syria, Taiwan (province of China), Thailand, Togo, Turkey, Uganda, Ukraine, United Arab Emirates, Yemen, and Zimbabwe. “Other DAC governments” include Australia, Austria, Belgium, Czechia, Denmark, Finland, Greece, Hungary, Iceland, Ireland, Italy, South Korea, Luxembourg, the Netherlands, New Zealand, Norway, Poland, Portugal, Slovakia, Slovenia, Spain, Sweden, and Switzerland. “Other sources” captures development assistance for health for which we have source information but which is not identified as originating within any of the sources listed. Health assistance for which we have no source information is designated as “Unidentified.” “Other bilateral development agencies” include Austria, Belgium, Denmark, Finland, Greece, Ireland, Italy, South Korea, Luxembourg, the Netherlands, New Zealand, Norway, Spain, Sweden, Switzerland, the United Arab Emirates, the European Commission, and EEA. “Regional development banks” include the African Development Bank, the Asian Development Bank, and the Inter-American Development Bank. “Other” captures development assistance for health for which we have program area information but which is not identified as being allocated to any of the program areas listed.
cepi = Coalition for Epidemic Preparedness Innovationsdac = Development assistance committeeGavi = Gavi, the Vaccine Allianceibrd = International Bank for Reconstruction and Developmentngos = Non-governmental organizationspaho = Pan American Health Organizationr&d = Research and developmentunaids = Joint United Nations Programme on hiv/aidsunfpa = United Nations Population Fundunicef = United Nations Children’s Fundwho = World Health Organization
United States $927.9M
United Kingdom $802.9M
Germany $1.3B
France $423.8M
Japan $2.3B
Canada $382.9M
Other non-DAC** governments $1.6B
Other DAC***
governments $1.6B
Debt repayments, IBRD $1.2B
The Bill & Melinda Gates Foundation $550.0M
Corporate donations $30.4MOther private
philanthropy $330.3M
Other sources $1.9B
Unidentified $223.2M
Country-level coordination* $3.1B
Surveillance, rapid-response teams, and case investigation$538.6M
National labs and testing $1.1B
Infection prevention and personal protective equipment $870.9M
Treatment $1.5B
Supply chain and logistics $2.4B
Maintaining other essential health servicesand systems $550.6M
R&D for vaccine and other therapeutics $551.8M
Other $3.0B
United States $177.1MUnited Kingdom $106.5M
Germany $359.7MFrance $22.5M
Japan $1.4B
Canada $11.5MEuropean Commission $605.6M
Other bilateral development agencies $656.0M
Gavi $1.9B
CEPI $278.7M
The Global Fund $977.9M
UNICEF, UNFPA, UNAIDS, Unitaid, and PAHO $956.6M
WHO $1.3B
World Bank $1.4B
Regional development banks $2.7B
The Bill & Melinda Gates Foundation $313.3MNGOs and international foundations$280.6M
US foundations $93.7M
Source Channel Program area
*** For a list of DAC countries, see https://www.oecd.org/dac/development-assistance-committee/
For an interactive version of this figure and others, please visit: https://vizhub.healthdata.org/fgh

TrACkING dEvELOpmENT AssIsTANCE FOr HEALTH FOr COvId-19 | 57
for COVID-19 was directed at country-level coordination programs ($3.1 billion), followed by spending to support supply chains and logistics ($2.4 billion) and COVID-19 treatment ($1.5 billion). A closer look at Figure 7 shows how certain types of DAH for COVID-19 were directed through specific channels. For example, 62.0% of spending on supply chain and logistics efforts was channeled through Gavi, while 48.1% of spending on treatment was channeled through regional development banks. This overall view of where spending originated, how it was disbursed, and the program areas targeted, as shown in Figure 7, illustrates the different ways sources and channels have approached combating the pandemic.
As noted above, estimates of the additional costs of an effective response to COVID-19 in low- and middle-income countries range between $33 and $62 billion.12 Assuming that’s the case, the 2020 total of $13.7 billion in DAH for COVID-19 falls short of the mark – tens of billions of dollars in addi-tional spending may well be needed to fully address the pandemic in low- and middle-income countries.
And though a number of vaccines are now being administered around the world, only a handful of countries have so far vaccinated significant portions of their populations. For example, vaccine deployment in Africa remained far behind other parts of the world. As of mid-August 2021, Senegal had fully vaccinated approximately 2.0% of its population and Zimbabwe 9.0%.1 In comparison, 51.0% of the total US population was fully vaccinated by mid-August, and in Israel, 58.0% (note, however, that vaccina-tion deployment efforts in both countries began in late 2020). Nonetheless, progress is being made: COVAX announced in early March that Côte d’Ivoire and Ghana had begun to vaccinate their populations through the program, the start of “at least 2 billion doses of COVID-19 vaccines by the end of 2021” COVAX aims to deliver. But in order to get to that point, additional resources will need to be marshaled.
Vaccines aside, there are a number of health areas where lower-income countries could use development assistance. For example, intensive care unit beds and ventilators are in short supply in many low-income and lower-middle-income countries. Benin, which had a 2019 GDP of $16.2 billion (15.9–16.7) (by contrast, the US’s was $21.7 trillion [21.6–21.7]), has approximately 40 ICU beds in the entire nation1 and a population of roughly 13 million.13 Likewise, Bulgaria has fewer than 2,000 ICU beds, an estimated population of 7 million,14 and 573.2 COVID-19 deaths per 100,000 through mid-May 2021, one of the highest rates in Central Europe. And Nigeria, with the highest population in Africa at roughly 215 million,15 has only approximately 1,000 ICU beds. For comparison, the US population is an estimated 328 million,16 and there are about 70,000 ICU beds in the US. Until vaccines are distributed widely and vaccine protection begins to take effect, countries like Benin, Bulgaria, and Nigeria face fundamental chal-lenges in the fight against COVID-19.
Therefore, future levels of development assistance for COVID-19, and whether the world will remain focused on combating the pandemic once the worst has passed in higher-income countries, is of utmost importance. Now that a number of high-income countries, and the donor organizations that call those countries home, have vaccinated significant portions of their
58 | FINANCING GLOBAL HEALTH 2020
populations, the hope is that they can sustain sufficient levels of develop-ment assistance for health for COVID-19 to not only prevent a resurgence of the pandemic within their own borders, but to ensure the populations of low-income and lower-middle-income countries can not only avoid the worst of COVID-19, but also thrive once the pandemic is finally declared over.

TrACkING dEvELOpmENT AssIsTANCE FOr HEALTH FOr COvId-19 | 59

60 | FINANCING GLOBAL HEALTH 2020

dEvELOpmENT AssIsTANCE FOr HEALTH BEyONd COvId-19 | 61
PART TWO
Development assistance for health beyond COVID-19
As detailed in Part One, development assistance for health saw an unprece-dented increase between 2019 and 2020, driven by additional health spending in response to COVID-19. Overall DAH was an estimated $54.8 billion in 2020, an increase of 35.7% over the 2019 total of $40.4 billion. Such a large year-over-year increase in total DAH has never been observed before. However, excluding DAH for COVID-19, 2020 DAH was $41.2 billion, a 1.8% increase over the 2019 total.
Despite being a fraction of global spending on health – approximately 0.5% – DAH is important for a number of reasons. For one, many low- income and lower-middle-income countries use development assistance for health to support their health systems and to fight specific diseases. In low-income countries, 25.0% of spending in 2018 was DAH, versus 3.3% in lower-middle-income countries.
Figure 8 gives a high-level overview of how development assistance for health moves from funding sources (originating in national treasuries, private philanthropic sources, and debt repayments) to channels of assis-tance (such as bilateral development assistance agencies, foundations, and non-governmental organizations, to name a few) to implementing institu-tions (via national ministries of health and non-governmental programs like private-sector contractors).
Figure 8 Development assistance for health sources, channels of assistance, implementing institutions
governmental programs
National ministries of healthNational disease control programs
Non-governmental programs
NGOsPrivate sector contractors
Universities and research institutions
iMPleMeNTiNg iNSTiTuTioNS
Bilateral development assistance agenciesThe European Commission
UN agencies: UNFPA, UNAIDS, UNICEF, Unitaid, PAHO, WHOThe World Bank and regional development banks
The Global Fund
Gavi, the Vaccine AllianceFoundations
NGOsCoalition for Epidemic Preparedness Innovations
European Economic Area
CHaNNelS oF aSSiSTaNCe
National treasuriesPrivate philanthropies
Debt repayments to international financial institutionsFuNDiNg SourCeS
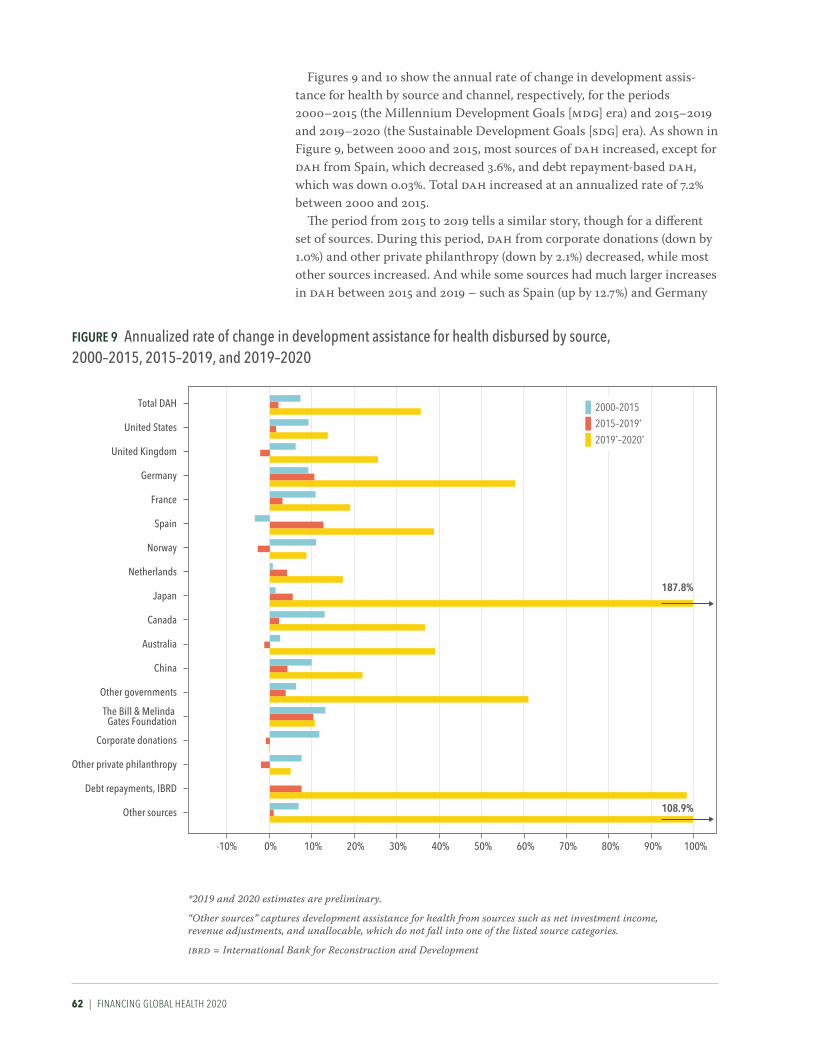
62 | FINANCING GLOBAL HEALTH 2020
Figures 9 and 10 show the annual rate of change in development assis-tance for health by source and channel, respectively, for the periods 2000–2015 (the Millennium Development Goals [MDG] era) and 2015–2019 and 2019–2020 (the Sustainable Development Goals [SDG] era). As shown in Figure 9, between 2000 and 2015, most sources of DAH increased, except for DAH from Spain, which decreased 3.6%, and debt repayment-based DAH, which was down 0.03%. Total DAH increased at an annualized rate of 7.2% between 2000 and 2015.
The period from 2015 to 2019 tells a similar story, though for a different set of sources. During this period, DAH from corporate donations (down by 1.0%) and other private philanthropy (down by 2.1%) decreased, while most other sources increased. And while some sources had much larger increases in DAH between 2015 and 2019 – such as Spain (up by 12.7%) and Germany
Figure 9 annualized rate of change in development assistance for health disbursed by source, 2000–2015, 2015–2019, and 2019–2020
Other sources
Debt repayments, IBRD
Other private philanthropy
Corporate donations
The Bill & Melinda Gates Foundation
Other governments
China
Australia
Canada
Japan
Netherlands
Norway
Spain
France
Germany
United Kingdom
United States
Total DAH
-10% 20% 70%0% 100%60% 90%80%10% 50%30% 40%
187.8%
108.9%
2000–2015
2015–2019*
2019*–2020*
*2019 and 2020 estimates are preliminary.
“Other sources” captures development assistance for health from sources such as net investment income, revenue adjustments, and unallocable, which do not fall into one of the listed source categories.
ibrd = International Bank for Reconstruction and Development
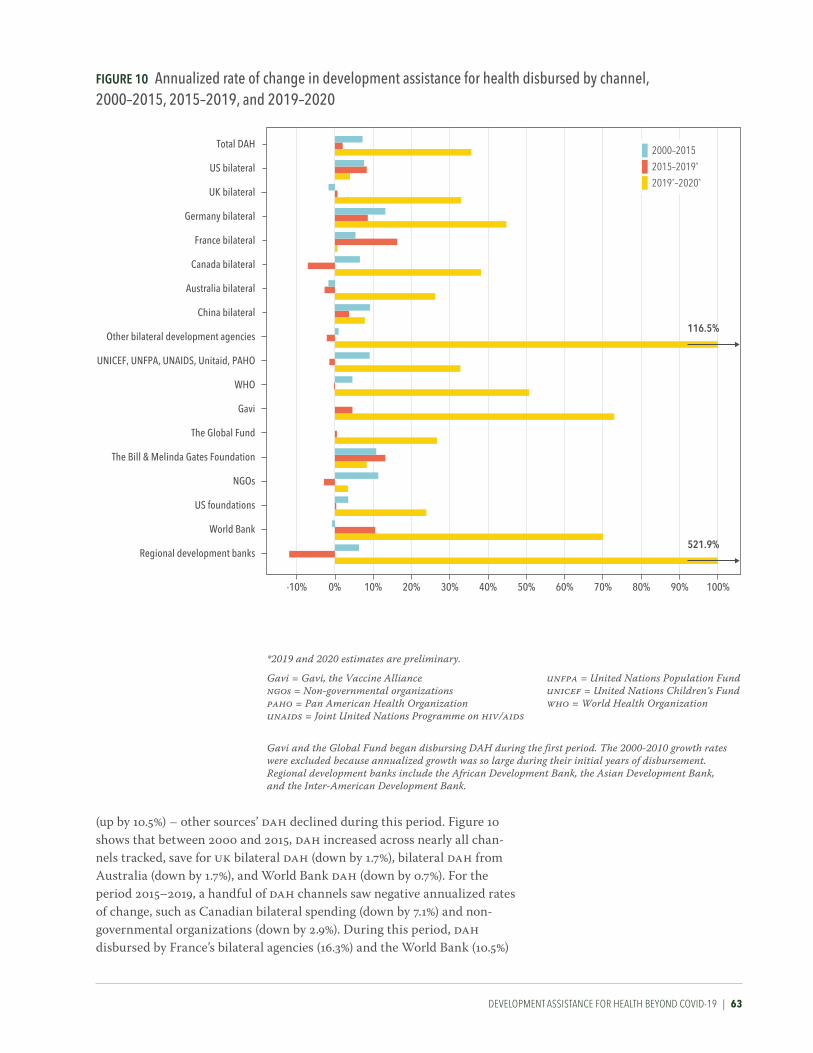
dEvELOpmENT AssIsTANCE FOr HEALTH BEyONd COvId-19 | 63
(up by 10.5%) – other sources’ DAH declined during this period. Figure 10 shows that between 2000 and 2015, DAH increased across nearly all chan-nels tracked, save for UK bilateral DAH (down by 1.7%), bilateral DAH from Australia (down by 1.7%), and World Bank DAH (down by 0.7%). For the period 2015–2019, a handful of DAH channels saw negative annualized rates of change, such as Canadian bilateral spending (down by 7.1%) and non- governmental organizations (down by 2.9%). During this period, DAH disbursed by France’s bilateral agencies (16.3%) and the World Bank (10.5%)
Figure 10 annualized rate of change in development assistance for health disbursed by channel, 2000–2015, 2015–2019, and 2019–2020
-10% 20% 70%0% 100%
Regional development banks
World Bank
US foundations
NGOs
The Bill & Melinda Gates Foundation
The Global Fund
Gavi
WHO
UNICEF, UNFPA, UNAIDS, Unitaid, PAHO
Other bilateral development agencies
China bilateral
Australia bilateral
Canada bilateral
France bilateral
Germany bilateral
UK bilateral
US bilateral
Total DAH
60% 90%80%10% 50%30% 40%
116.5%
521.9%
2000–2015
2015–2019*
2019*–2020*
*2019 and 2020 estimates are preliminary.
Gavi = Gavi, the Vaccine Alliancengos = Non-governmental organizationspaho = Pan American Health Organizationunaids = Joint United Nations Programme on hiv/aids
Gavi and the Global Fund began disbursing DAH during the first period. The 2000-2010 growth rates were excluded because annualized growth was so large during their initial years of disbursement.Regional development banks include the African Development Bank, the Asian Development Bank, and the Inter-American Development Bank.
unfpa = United Nations Population Fundunicef = United Nations Children’s Fundwho = World Health Organization

64 | FINANCING GLOBAL HEALTH 2020
saw the largest increases in annualized rate of change. In both figures, the enormous increase in development assistance for
health between 2019 and 2020, which as noted was driven by the pandemic, is obvious. During this period, DAH coming from Japan as a source increased at a rate of 187.8%, while Germany’s DAH grew 57.9%. And by channel, development assistance for health disbursed by regional develop-ment banks increased 521.9%, and DAH flowing through Gavi went up 73.0%.
“Development assistance for health systems strengthening (HSS)” refers to funding intended to improve access, quality, or efficiency of health care, and can emphasize specific health focus areas or programs. An example of DAH for HSS is US Agency for International Development programs that support the development of health workforces, supporting worker training and health service delivery. Meanwhile, SWAps are funds that are pooled for broad, national goals, and are intended to be allocated as health ministries determine. SWAps arose in the 1990s in response to targeted projects that, at times, were not focused on the issues that were of the highest priority to
Figure 11 Development assistance for health systems strengthening and sector-wide approaches by channel of assistance, 1990–2020
6
0
2
4
Billi
ons o
f 202
0 US
dol
lars
1991
1992
1993
1994
1995
1996
1997
1998
1999
2000
2001
2002
2003
2004
2005
2006
2007
2008
2009
2010
2011
2012
2013
2014
2016
2015
1990
2017
2018
2019
*
2020
*
*2019 and 2020 estimates are preliminary.
cepi = Coalition for Epidemic Preparedness Innovationsngos = Non-governmental organizationspaho = Pan American Health Organizationunaids = Joint United Nations Programme on hiv/aids
Regional development banks include the African Development Bank, the Asian Development Bank, and the Inter-American Development Bank.
unfpa = United Nations Population Fundunicef = United Nations Children’s Fundwho = World Health Organization
Regional development banks
World Bank
US foundations
NGOs and international foundationsThe Bill & Melinda Gates Foundation
CEPI
The Global FundGavi
WHO
UNICEF, UNFPA, UNAIDS, Unitaid, PAHOOther bilateral development agencies
China bilateral
Australia bilateralCanada bilateral
France bilateral
Germany bilateral
UK bilateral
US bilateral

dEvELOpmENT AssIsTANCE FOr HEALTH BEyONd COvId-19 | 65
local governments. Spending directed at SWAps and HSS is intended to strengthen health systems overall.
Funding for SWAps and HSS totaled $5.5 billion in 2020. This represents 9.9% of total development assistance for health in 2020, and an increase of 8.9% over 2019 (in part driven by COVID-19). This number comprises $811.1 million for pandemic preparedness, $1.1 billion for human resources, and $3.5 billion in other spending.
Figure 11 shows DAH for HSS/SWAps by channel of assistance from 1990 to 2020. The World Health Organization was the largest channel of HSS/SWAps spending, disbursing 28.6% of 2020 DAH for HSS/SWAps. For its part, the World Bank channeled $1.2 billion, or 21.2% of DAH for HSS/SWAps.
While development assistance for HSS is intended to be broadly applied, many development assistance projects are aimed at building health systems for specific health focus areas. Between 1990 and 2020, as shown in Figure 12, a significant portion of HSS resources were allocated to build systems focused on the prevention and treatment of HIV/AIDS, (19.8% of overall DAH for HSS), newborn and child health (9.1% of DAH for HSS), and reproductive and maternal health (7.4% of DAH for HSS). Figure 12 also shows the increase in funding for HSS/SWAps between 2019 and 2020, which was driven in part by COVID-19 related activities.
0
5
15
10
Billi
ons o
f 202
0 US
dol
lars
1991
1992
1993
1994
1995
1996
1997
1998
1999
2000
2001
2002
2003
2004
2005
2006
2007
2008
2009
2010
2011
2012
2013
2014
2016
2015
1990
2017
2018
2019
*
2020
*
*2019 and 2020 estimates are preliminary.
HSS/SWAps
Other infectious diseases HSS
Non-communicable diseases HSSReproductive and maternal health HSS
Newborn and child health HSS
Malaria HSSTuberculosis HSS
HIV/AIDS HSS
hss = Health systems strengtheningswaps = Sector-wide approaches
Figure 12 Development assistance for health systems strengthening by health focus area, 1990–2020

66 | FINANCING GLOBAL HEALTH 2020
In 2020, development assistance for HSS by health focus areas included $5.5 billion (49.5%) for HSS/SWAps, $2.8 billion (25.4%) associated with reproductive, maternal, newborn, and child health, $1.4 billion (12.6%) associated with HIV/AIDS, $567.1 million (5.2%) associated with malaria, and $355.3 million (3.2%) associated with tuberculosis.
Figures 13 and 14 show DAH trends by broad health focus area, as well as trends by health focus area and related program areas, for 1990–2020 and 2000–2020, respectively.
The most striking increase shown in Figure 13 is that of other infectious diseases funding – which includes DAH for COVID-19 – between 2019 and 2020. Indeed, prior to 2020, other infectious disease DAH made up a small fraction of overall DAH: 5.7% in 2019 and just 2.5% in 1990. The figure also shows the increase in spending on HIV/AIDS beginning in 2004, which led to a leveling trend starting in 2010. The more gradual rise of development assistance for reproductive, maternal, newborn, and child health (23.7% of 2020 development assistance for health) is also shown.
Since 2015, many of the health focus areas shown in Figure 13 have experienced increases and decreases in development assistance for health. For example, in 2015, tuberculosis DAH was $1.3 billion; in 2016, it was $1.5 billion; in 2017, $1.8 billion; 2018, $1.7 billion, and in 2019, $1.6 billion. Broadly, there has been a flattening trend across health focus areas since the beginning of the SDG era in 2015.
Meanwhile, the program area estimates in Figure 14 highlight specific activities related to each health focus area (such as HIV/AIDS treatment, and
Billi
ons o
f 202
0 US
dol
lars
0
5
10
15
20
25
30
35
40
45
50
55
1991
1992
1993
1994
1995
1996
1997
1998
1999
2000
2001
2002
2003
2004
2005
2006
2007
2008
2009
2010
2011
2012
2013
2014
2016
2015
1990
2017
2018
2019
*
2020
*
UnallocableOther health focus areas
HSS/SWAps
Other infectious diseases
Non-communicable diseasesReproductive and maternal health
Newborn and child health
MalariaTuberculosis
HIV/AIDS
*2019 and 2020 estimates are preliminary.
“Other health focus areas” captures development assistance for health for which we have health focus area information but which is not identified as being allocated to any of the health focus areas listed. Health assistance for which we have no health focus area information is designated as “Unallocable.”
hss/swaps = Health systems strengthening and sector-wide approaches
Figure 13 Development assistance for health by health focus area, 1990–2020

dEvELOpmENT AssIsTANCE FOr HEALTH BEyONd COvId-19 | 67
*2019 and 2020 estimates are preliminary. Values are reported in 2020 US dollars.
“Other health focus areas” captures development assistance for health for which we have health focus area information but which is not identified as being allocated to any of the health focus areas listed. Health assistance for which we have no health focus area information is designated as “Unallocable.”hss/swaps = Health systems strengthening and sector-wide approachespmtct = Prevention of mother-to-child transmission
Newborn and child healthMalaria
Unallocable
Other health focus areas
Health focus area
HSS/SWAps
Other infectious diseases
Non-communicable diseases
Tuberculosis
HIV/AIDS
Reproductive and maternal health Program area
Other
Other
Care and support
Counseling and testing
Other health systems strengthening
Orphans and vulnerable children
PMTCT
Treatment
Prevention
Other
TreatmentOther health systems strengthening
Bed nets
Other control
Community outreach
DiagnosisVector control including indoor residual spraying
Unallocable
Human resources
Human resources
Child/newborn nutrition
Child/newborn other
Vaccines
Other health systems strengthening
Human resources
Maternal health
Family planning
Other health systemsstrengthening
Human resources
Other maternal and reproductive health
Other
Human resources
Other healthsystems
strengtheningTobacco
Mental health
Other
Ebola
COVID-19
Other healthsystems
strengthening
Humanresources
Other infectious diseases:Zika (0.185 billion)Other infectious diseases:Antimicrobial resistance (0.076 billion)HSS/SWAps:Pandemic preparedness (4.664 billion)
Malaria:Antimicrobial resistance (0.056 billion)
HIV/AIDS:Antimicrobial resistance (0.105 billion)
Program areas not depicted in figure
HSS/SWAps
Human resources
Other health systems strengtheningTreatment
Diagnosis
Antimicrobial resistance
Human resources
Figure 14 Development assistance for health by health focus area and program area, 2000–2020*

68 | FINANCING GLOBAL HEALTH 2020
tobacco-specific NCD funding), and the fraction of DAH attributed to each health-specific program between 2000 and 2020.
Figure 15 shows the annualized rate of change in DAH disbursed by health focus area for the periods 2000–2015 (the MDG era) and 2015–2019 (the SDG era), as well as between 2019 and 2020 (the SDG era). During both the MDG and SDG eras, DAH increased almost universally across health focus areas tracked in this report – the exception being other infectious diseases between 2015 and 2019, which saw a -10.2% annualized rate of change.
The MDG era saw positive annualized rates of change across most of the health focus areas we track. For example, between 2000 and 2015, DAH for HIV/AIDS, tuberculosis, and malaria went up annually by 12.3%, 16.1%, and 17.5%, respectively. Total DAH saw an annualized rate of change of 7.2% between 2000 and 2015.
Figure 15 annualized rate of change in development assistance for health disbursed, by health focus area, 2000–2015, 2015–2019, and 2019–2020
-10% 0% 10% 20% 40%
Other health focus areas
Total DAH
30%
HSS/SWAps
Other infectious diseases
Non-communicable diseases
Newborn and child health
Reproductive and maternal health
Malaria
Tuberculosis
HIV/AIDS
577.7%
2000–2015
2015–2019*
2019–2020*
*2019 and 2020 estimates are preliminary.
"Other health focus areas" captures development assistance for health for which we have health focus area information but which is not identified as being allocated to any of the health focus areas listed.
hss/swaps = Health systems strengthening and sector-wide approaches

dEvELOpmENT AssIsTANCE FOr HEALTH BEyONd COvId-19 | 69
The period from 2015 to 2019 tells a different story. While many areas saw positive annualized rates of change – such as tuberculosis (6.0%) and non-communicable diseases (9.5%) – in many cases the increases observed were less robust than those seen between 2000 and 2015. Indeed, several areas saw negligible annualized rates of change: reproductive and maternal health DAH grew 2.8% between 2015 and 2019, while newborn and child health saw an increase of 0.5% during the SDG period.
Particularly notable in Figure 15 is the growth of other infectious diseases DAH between 2019 and 2020: the category – which includes COVID-19 – grew 577.7% between 2019 and 2020; without factoring in DAH for COVID-19, development assistance for health grew 2.0% between 2015 and 2020. A question going forward is whether the rise in DAH driven by COVID-19 will be sustained going forward, or whether development assistance for health – COVID-19’s impact on spending notwithstanding – will continue to plateau.
Shifts in how development assistance for health has been allocated to specific health focus areas between 1990 and 2020 are shown in Figure 16. The rise in DAH for HIV/AIDS between 2002 and 2007 and the leveling off since then can be seen. Additionally, a relative reduction in HSS/SWAps DAH has taken place over the past three decades in favor of more targeted funding. And though it remains a minor segment of total DAH (1.6% in 2020), non-communicable disease funding has increased 1,560.6%
Figure 16 The share of development assistance for health allocated by health focus area, 1990–2020
0%
199119921993199419951996199719981999200020012002200320042005200620072008200920102011201220132014
20162015
1990
201720182019*2020*
10% 20% 30% 40% 50% 60% 70% 80% 90% 100%
Reproductive and maternal health
Newborn and child health
Tuberculosis
Non-communicable diseases
Other infectious diseases
HIV/AIDS
Malaria
Unallocable
Other health focus areas
HSS/SWAps
*2019 and 2020 estimates are preliminary.
“Other health focus areas” captures development assistance for health for which we have health focus area information but which is not identified as being allocated to any of the health focus areas listed. Health assistance for which we have no health focus area information is designated as “Unallocable.”
hss/swaps = Health systems strengthening and sector-wide approaches

70 | FINANCING GLOBAL HEALTH 2020
since 1990. Clear in Figure 16 is the same story reiterated throughout Financing
Global Health 2020: the growth in development assistance for health due to COVID-19, and specifically the 577.7% growth of other infectious diseases DAH between 2019 and 2020. In 2019, for example, other infectious diseases funding constituted 5.7% of overall DAH, whereas in 2020 it was 28.6%.
Figure 17 shows DAH disaggregated by super-region, from 1990 to 2018 (the most recent year for which regional data are available); it shows how funding levels have changed, across countries and health focus areas, for broad regions.
Figure 17 Development assistance for health by recipient global Burden of Disease super-region, 1990–2020
Billi
ons o
f 202
0 US
dol
lars
20
0
40
60
1991
1992
1993
1994
1995
1996
1997
1998
1999
2000
2001
2002
2003
2004
2005
2006
2007
2008
2009
2010
2011
2012
2013
2014
2016
2015
1990
2017
2018
2019
*
2020
*
UnallocableAdministrative expenses
Central Europe, Eastern Europe, and Central AsiaLatin America and Caribbean
North Africa and Middle East
South AsiaSoutheast Asia, East Asia, and Oceania
Sub-Saharan Africa
Global initiatives
*2019 and 2020 estimates are preliminary.
Argentina, Chile, South Korea, Malta, and Uruguay are generally included in the Global Burden of Disease high-income classification, but have been included in these geographic regions because they were considered low- or middle-income countries by the World Bank at least at one point between 1990 and 2020.
Health assistance for which no recipient country or regional information is available is designated as “Unallocable.” Due to data limitations, development assistance for health estimates are not available by recipient region for 2019 or 2020.

dEvELOpmENT AssIsTANCE FOr HEALTH BEyONd COvId-19 | 71
Since 1990, a large proportion (23.1%) of development assistance for health has gone to countries in sub-Saharan Africa. According to the World Bank’s income groupings, 47.8% of the countries in sub-Saharan Africa are classified as low-income, and about 41.3% are classified as lower-middle-income.
By Global Burden of Disease super-region, sub-Saharan Africa received the most DAH between 1990 and 2018. Sub-Saharan Africa’s DAH per-centage has also grown since 1990: it was 19.8% of total DAH in 1990, and in 2018 stood at 26.5%. Further details by region are available in the footnotes to Figure 17.
Sub-Saharan AfricaSub-Saharan Africa received $10.4 billion, or 26.5%, of global DAH in 2018, a 5.6% decrease from 2017. The US provided $5.0 billion or 47.7% of 2018 funding, and the uk provided $893.7 million or 8.6%. Across health areas, $3.9 billion or 37.4% went to HIV/AIDS and $2.8 billion or 26.9% went to reproductive, maternal, newborn, and child health. Nigeria, Ethiopia, and Kenya were the countries receiving the most DAH for the region in 2018.
South AsiaSouth Asia received $1.7 billion or 4.5% of total DAH in 2018, down 10.7% from 2017. Of this, $620.4 million or 35.5% went to India, and $585.9 million or 33.5% was directed to Pakistan. Collectively, Bangladesh, Bhutan, and Nepal were the recipients of $543.7 million or 31.1% of DAH in South Asia. The US and the UK were major sources of DAH to this region, providing $330.0 million and $208.8 million, respectively, in 2018. Across health areas, $1.0 billion (56.5%) of DAH to South Asia went to reproductive, maternal, newborn, and child health; $249.9 million (14.3%) went to HSS/SWAps; and $98.2 million (5.6%) went to HIV/AIDS.
Southeast Asia, East Asia, and OceaniaThis region, comprising China, small-island developing states, and the members of the Association of Southeast Asian Nations, received $1.6 billion or 4.1% of DAH in 2018, down 6.0% from 2017. The US provided $252.9 million or 15.6% of DAH to this region in 2018; Germany provided $193.6 million or 11.9%; and Japan provided $144.8 million or 8.9%. The Global Fund was a major channel of assistance to this region, providing $221.7 million or 13.7% of DAH in 2018; NGOs provided $77.6 million or 4.8%. Funding was directed primarily to HSS/SWAps ($564.8 million or 34.8%) and reproductive, maternal, newborn, and child health ($340.5 million or 21.0%). Of total DAH to this region, China (the world’s largest economy) received 16.0% or $259.9 million in 2018.
72 | FINANCING GLOBAL HEALTH 2020
Latin America and the CaribbeanThe region of Latin America and the Caribbean received $1.3 billion or 3.2% of 2018 DAH, up 36.5% from 2017. The US and Canada were major sources, contributing $225.2 million and $48.0 million in DAH to the region, respec-tively. Across health areas, $258.0 million, or 20.5% of 2018 DAH, went to HSS/SWAps; $210.1 million or 16.7% went to reproductive, maternal, new-born, and child health; and $171.6 million or 13.6% went to HIV/AIDS.
North Africa and the Middle EastNorth Africa and the Middle East received $1.1 billion or 2.7% of DAH in 2018, down 26.1% from 2017. The US, the UK, and Germany were major sources of funding to the region, providing $129.5 million, $114.0 million, and $100.5 million, respectively. Across health areas, $336.4 million or 32.0% went to reproductive, maternal, newborn, and child health, and $214.0 million or 20.4% of DAH to the region was directed to HSS/SWAps.
Central Europe, Eastern Europe, and Central AsiaThis region received $694.9 million or 1.8% of DAH in 2018, up 7.0% from 2017. Major sources of funding were the US, Germany, and Japan, contrib-uting $99.4 million, $62.9 million, and $57.3 million in 2018, respectively. Across health areas, $235.7 million or 33.9% of funding was allocated to HSS/SWAps; $91.2 million or 13.1% to tuberculosis; and $90.7 million or 13.1% to HIV/AIDS.
Global initiativesActivities that are not confined to a specific region but address research, development, preparedness, and/or systems strengthening across bound-aries are classified as “global initiatives.” DAH to this category totaled $4.9 billion in 2018, up 0.02% from 2017, and represented 12.5% of total DAH for the year. The US was the main source of funding, contributing $2.4 billion; other major sources included the Bill & Melinda Gates Foundation, contrib-uting $1.2 billion, and the UK, contributing $534.7 million.


74 | FINANCING GLOBAL HEALTH 2020
TOTAL HEALTH spENdING prIOr TO COvId-19 | 75
PART THREE
Total health spending prior to COVID-19
Part Three offers a view of total spending prior to the pandemic. While COVID-19 has impacted domestic spending, data lags prevent us from assessing that impact currently, and instead we provide these global spending estimates as contextual information regarding health spending before COVID-19.
In 2018, total health spending reached $8.5 trillion (8.4–8.5),* a 3.0% (1.7–4.3) increase over our 2017 estimate. Despite its growth over the past 20 years, health spending still makes up only 9.9% (9.8–10.0) of the global economy; this is an increase of 18.4% from 1995, when health spending was an estimated 8.3% (8.2–8.5) of the global economy. When COVID-19 health spending is taken into account, this percentage will surely increase.
With $3.6 trillion (3.5–3.7) in 2018 total health spending, the United States was the leading global spender, with well over a third of all resources spent on health. Table 3 shows spending split by income group and region. Most health spending occurred in high-income countries, with health spending per person reaching $5,553 (5,496–5,612) in 2018, far more than spending per person in low-income countries ($35 [35–36]). Indeed, there is an almost 200% difference between the two. Moreover, there is also a 168.3% difference between high-income and upper-middle-income country health spending per person, highlighting the disparity in per-person spending between high-income countries and the rest of the world. Per-person health spending in 2018 ranged from $6 (5–7) in Somalia to $10,515 (10,348–10,680) in the United States.
Additionally, Table 3 shows that health spending per GDP was second highest in upper-middle-income countries, after high-income, at 5.6% (5.4–5.8), versus 12.4% (12.3–12.6). Notably, in low-income countries, where health spending per person was lowest globally, health spending per GDP was 5.0% (4.7–5.3) in 2018, only an estimated 0.6 percentage points less than spending per GDP in upper-middle-income countries. While low-income countries’ health per-person spending reflects those countries’ lower GDPs, the percentage spent per GDP also reflects the importance of key health services regardless of income level and provision of DAH.
Other important patterns illustrated in Table 3 include that the per-centage of total health spending that is out-of-pocket spending is highest in lower-middle-income countries, at 55.9% (53.6–58.2); high-income countries spent the highest percentage of total health spending on prepaid private spending, at 25.0% (24.5–25.5); and development assistance for health as a percentage of total health spending was highest in low-income countries, at 29.2% (28.4–29.8).
* The modeled estimates for total health spending are presented with uncertainty intervals. Our estimates of DAH are generally not modeled and do not include uncertainty intervals. Unless otherwise indicated, all estimates are reported in 2020 inflation-adjusted US dollars. Estimates in 2020 purchasing-power parity-adjusted dollars are available at http://ghdx.healthdata.org/.

76 | FINANCING GLOBAL HEALTH 2020
Health spending per person
(2020 uS dollars)
Health spending per person (2020 purchasing power
parity-adjusted dollars)
Health spending per gross domestic
product
government health spending per total
health spending
out-of-pocket spending per total
health spending
Prepaid private spending per total
health spending
Development assistance for
health per total health spending
annualized rate of change in health spending, 1995–
2018
annualized rate of change in health
spending per per-son, 1995–2018
annualized rate of change in health
spending per gross domestic product,
1995–2018
gloBal
Total 1,106 (1,094 to 1,116)* 725 (718 to 732) 9.9% (9.8 to 10.0) 59.4% (58.9 to 59.9) 18.0% (17.5 to 18.5) 22.1% (21.6 to 22.5) 0.5% (0.5 to 0.5) 3.87% (3.78 to 3.95) 2.59% (2.50 to 2.67) 0.74% (0.65 to 0.82)
WorlD BaNK iNCoMe grouP
High-income 5,553 (5,496 to 5,612) 6,124 (6,066 to 6,184) 12.4% (12.3 to 12.6) 61.5% (60.9 to 62.0) 13.5% (13.0 to 14.0) 25.0% (24.5 to 25.5) 0.0% (0.0 to 0.0) 3.47% (3.38 to 3.56) 2.84% (2.75 to 2.93) 1.29% (1.20 to 1.38)
Upper-middle-income 478 (464 to 493) 947 (924 to 972) 5.6% (5.4 to 5.8) 55.6% (54.0 to 57.1) 33.4% (31.9 to 35.0) 10.8% (9.9 to 11.8) 0.2% (0.2 to 0.2) 6.17% (5.95 to 6.40) 5.35% (5.13 to 5.57) 0.55% (0.34 to 0.76)
Lower-middle-income 87 (83 to 92) 272 (259 to 288) 4.1% (3.9 to 4.3) 33.0% (31.0 to 35.0) 55.9% (53.6 to 58.2) 7.8% (6.6 to 9.4) 3.8% (3.6 to 4.0) 5.49% (5.12 to 5.86) 3.63% (3.27 to 3.99) -0.08% (-0.45 to 0.28)
Low-income 35 (35 to 36) 123 (120 to 127) 5.0% (4.7 to 5.3) 24.4% (23.4 to 25.6) 44.9% (43.7 to 46.0) 5.6% (5.1 to 6.2) 29.2% (28.4 to 29.8) 3.64% (3.42 to 3.85) 1.01% (0.79 to 1.21) -0.03% (-0.30 to 0.24)
gBD SuPer-regioN
Central Europe, Eastern Europe, and Central Asia 546 (536 to 554) 1,365 (1,340 to 1,388) 5.9% (5.8 to 6.0) 64.0% (63.3 to 64.8) 32.0% (31.4 to 32.7) 3.6% (3.4 to 3.9) 0.3% (0.3 to 0.3) 3.52% (3.34 to 3.70) 3.54% (3.36 to 3.72) 0.23% (0.06 to 0.40)
Global Burden of Disease high-income 6,123 (6,058 to 6,190) 6,606 (6,539 to 6,673) 12.9% (12.8 to 13.1) 61.2% (60.6 to 61.7) 13.4% (12.9 to 14.0) 25.4% (24.9 to 25.9) 0.0% (0.0 to 0.0) 3.43% (3.33 to 3.52) 2.80% (2.70 to 2.89) 1.33% (1.24 to 1.42)
Latin America and Caribbean 516 (500 to 532) 1,169 (1,132 to 1,204) 7.4% (7.1 to 7.6) 51.1% (49.5 to 52.8) 30.1% (28.8 to 31.6) 18.5% (17.2 to 20.0) 0.4% (0.4 to 0.4) 3.47% (3.22 to 3.72) 2.12% (1.87 to 2.36) 0.83% (0.58 to 1.08)
North Africa and Middle East 381 (374 to 389) 949 (930 to 969) 5.8% (5.6 to 6.0) 55.8% (54.8 to 56.8) 29.7% (28.8 to 30.5) 14.0% (13.3 to 14.9) 0.5% (0.5 to 0.5) 5.74% (5.57 to 5.93) 3.77% (3.61 to 3.96) 2.04% (1.82 to 2.25)
South Asia 66 (60 to 74) 220 (198 to 245) 3.4% (3.1 to 3.8) 26.7% (23.1 to 30.7) 62.6% (58.0 to 66.8) 9.1% (6.6 to 12.3) 1.5% (1.3 to 1.6) 6.02% (5.22 to 6.80) 4.24% (3.45 to 5.01) -0.43% (-1.27 to 0.36)
Southeast Asia, East Asia, and Oceania 408 (390 to 427) 714 (686 to 745) 4.9% (4.7 to 5.2) 56.7% (54.5 to 59.0) 35.1% (32.9 to 37.5) 8.0% (6.7 to 9.4) 0.2% (0.2 to 0.2) 9.08% (8.58 to 9.57) 8.27% (7.78 to 8.76) 1.37% (0.92 to 1.83)
Sub-Saharan Africa 75 (73 to 78) 191 (185 to 197) 4.9% (4.7 to 5.1) 35.3% (33.9 to 36.7) 34.3% (32.8 to 36.1) 17.2% (15.9 to 18.6) 13.1% (12.7 to 13.6) 4.24% (4.01 to 4.49) 1.45% (1.23 to 1.69) -0.23% (-0.46 to 0.03)
Source: Financing Global Health Database 2020
*Estimates in parantheses are 95% uncertainty intervals.
Development assistance for health includes both financial and in-kind contributions for activities aimed at improving health in low- and middle-income countries.
TaBle 3 Total health spending and health spending by source, 2018

TOTAL HEALTH spENdING prIOr TO COvId-19 | 77
Health spending per person
(2020 uS dollars)
Health spending per person (2020 purchasing power
parity-adjusted dollars)
Health spending per gross domestic
product
government health spending per total
health spending
out-of-pocket spending per total
health spending
Prepaid private spending per total
health spending
Development assistance for
health per total health spending
annualized rate of change in health spending, 1995–
2018
annualized rate of change in health
spending per per-son, 1995–2018
annualized rate of change in health
spending per gross domestic product,
1995–2018
gloBal
Total 1,106 (1,094 to 1,116)* 725 (718 to 732) 9.9% (9.8 to 10.0) 59.4% (58.9 to 59.9) 18.0% (17.5 to 18.5) 22.1% (21.6 to 22.5) 0.5% (0.5 to 0.5) 3.87% (3.78 to 3.95) 2.59% (2.50 to 2.67) 0.74% (0.65 to 0.82)
WorlD BaNK iNCoMe grouP
High-income 5,553 (5,496 to 5,612) 6,124 (6,066 to 6,184) 12.4% (12.3 to 12.6) 61.5% (60.9 to 62.0) 13.5% (13.0 to 14.0) 25.0% (24.5 to 25.5) 0.0% (0.0 to 0.0) 3.47% (3.38 to 3.56) 2.84% (2.75 to 2.93) 1.29% (1.20 to 1.38)
Upper-middle-income 478 (464 to 493) 947 (924 to 972) 5.6% (5.4 to 5.8) 55.6% (54.0 to 57.1) 33.4% (31.9 to 35.0) 10.8% (9.9 to 11.8) 0.2% (0.2 to 0.2) 6.17% (5.95 to 6.40) 5.35% (5.13 to 5.57) 0.55% (0.34 to 0.76)
Lower-middle-income 87 (83 to 92) 272 (259 to 288) 4.1% (3.9 to 4.3) 33.0% (31.0 to 35.0) 55.9% (53.6 to 58.2) 7.8% (6.6 to 9.4) 3.8% (3.6 to 4.0) 5.49% (5.12 to 5.86) 3.63% (3.27 to 3.99) -0.08% (-0.45 to 0.28)
Low-income 35 (35 to 36) 123 (120 to 127) 5.0% (4.7 to 5.3) 24.4% (23.4 to 25.6) 44.9% (43.7 to 46.0) 5.6% (5.1 to 6.2) 29.2% (28.4 to 29.8) 3.64% (3.42 to 3.85) 1.01% (0.79 to 1.21) -0.03% (-0.30 to 0.24)
gBD SuPer-regioN
Central Europe, Eastern Europe, and Central Asia 546 (536 to 554) 1,365 (1,340 to 1,388) 5.9% (5.8 to 6.0) 64.0% (63.3 to 64.8) 32.0% (31.4 to 32.7) 3.6% (3.4 to 3.9) 0.3% (0.3 to 0.3) 3.52% (3.34 to 3.70) 3.54% (3.36 to 3.72) 0.23% (0.06 to 0.40)
Global Burden of Disease high-income 6,123 (6,058 to 6,190) 6,606 (6,539 to 6,673) 12.9% (12.8 to 13.1) 61.2% (60.6 to 61.7) 13.4% (12.9 to 14.0) 25.4% (24.9 to 25.9) 0.0% (0.0 to 0.0) 3.43% (3.33 to 3.52) 2.80% (2.70 to 2.89) 1.33% (1.24 to 1.42)
Latin America and Caribbean 516 (500 to 532) 1,169 (1,132 to 1,204) 7.4% (7.1 to 7.6) 51.1% (49.5 to 52.8) 30.1% (28.8 to 31.6) 18.5% (17.2 to 20.0) 0.4% (0.4 to 0.4) 3.47% (3.22 to 3.72) 2.12% (1.87 to 2.36) 0.83% (0.58 to 1.08)
North Africa and Middle East 381 (374 to 389) 949 (930 to 969) 5.8% (5.6 to 6.0) 55.8% (54.8 to 56.8) 29.7% (28.8 to 30.5) 14.0% (13.3 to 14.9) 0.5% (0.5 to 0.5) 5.74% (5.57 to 5.93) 3.77% (3.61 to 3.96) 2.04% (1.82 to 2.25)
South Asia 66 (60 to 74) 220 (198 to 245) 3.4% (3.1 to 3.8) 26.7% (23.1 to 30.7) 62.6% (58.0 to 66.8) 9.1% (6.6 to 12.3) 1.5% (1.3 to 1.6) 6.02% (5.22 to 6.80) 4.24% (3.45 to 5.01) -0.43% (-1.27 to 0.36)
Southeast Asia, East Asia, and Oceania 408 (390 to 427) 714 (686 to 745) 4.9% (4.7 to 5.2) 56.7% (54.5 to 59.0) 35.1% (32.9 to 37.5) 8.0% (6.7 to 9.4) 0.2% (0.2 to 0.2) 9.08% (8.58 to 9.57) 8.27% (7.78 to 8.76) 1.37% (0.92 to 1.83)
Sub-Saharan Africa 75 (73 to 78) 191 (185 to 197) 4.9% (4.7 to 5.1) 35.3% (33.9 to 36.7) 34.3% (32.8 to 36.1) 17.2% (15.9 to 18.6) 13.1% (12.7 to 13.6) 4.24% (4.01 to 4.49) 1.45% (1.23 to 1.69) -0.23% (-0.46 to 0.03)

78 | FINANCING GLOBAL HEALTH 2020
Figure 18 shows how total global health spending grew between 1995 and 2018, with spending disaggregated into four sources: development assis-tance for health, prepaid private health spending, out-of-pocket spending, and government health spending. DAH is support provided through major development agencies to improve and maintain health in low- and middle-income countries. Prepaid private spending covers health spending on private insurance premiums and through domestic non-governmental organizations. Out-of-pocket spending includes all health spending not paid in advance. Finally, government health spending is defined as spending on health from all levels of government, in public and private facilities.
Tracking each source of spending is important for a number of reasons. Understanding how government spending is allocated helps to reveal what funding is needed to build robust public health systems, while prepaid spending (government or private) is essential for reducing the possibility of catastrophic health spending on the part of individuals. Robust prepaid spending is also essential for reaching universal health coverage. Understanding out-of-pocket spending, meanwhile, tells us the opposite: how much health spending falls on individuals. And last but certainly not least, tracking development assistance for health shows which external sources of funding are supporting which health focus areas, and how that money is disbursed. Just as importantly, tracking DAH can show the degree to which lower-income countries rely on external funding, key things to
2018
2017
Trill
ions
of 2
020
US d
olla
rs
0
2
4
6
8
1998
1995
2012
1996
1997
1999
2000
2001
2002
2003
2004
2005
2006
2007
2008
2009
2010
2011
2013
2014
2015
2016
Development assistance for healthPrepaid private health spendingOut-of-pocket health spendingGovernment health spending
Figure 18 Total health spending by source of financing, 1995–2018
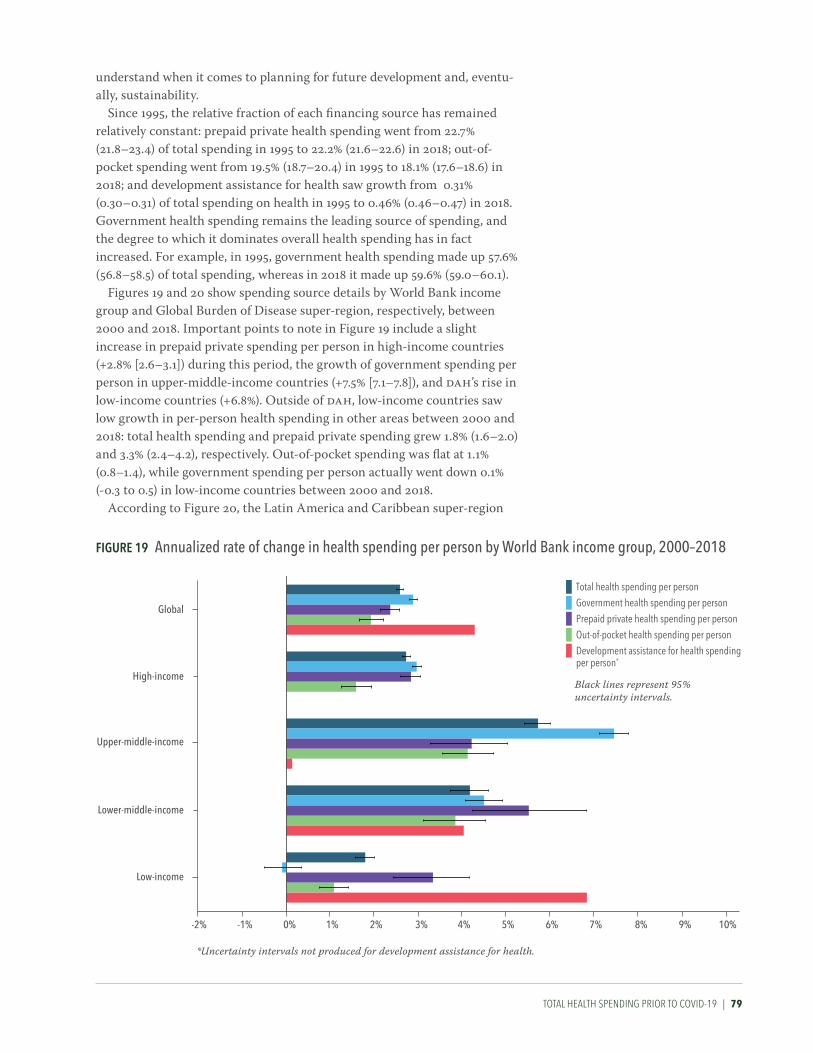
TOTAL HEALTH spENdING prIOr TO COvId-19 | 79
understand when it comes to planning for future development and, eventu-ally, sustainability.
Since 1995, the relative fraction of each financing source has remained relatively constant: prepaid private health spending went from 22.7% (21.8–23.4) of total spending in 1995 to 22.2% (21.6–22.6) in 2018; out-of-pocket spending went from 19.5% (18.7–20.4) in 1995 to 18.1% (17.6–18.6) in 2018; and development assistance for health saw growth from 0.31% (0.30–0.31) of total spending on health in 1995 to 0.46% (0.46–0.47) in 2018. Government health spending remains the leading source of spending, and the degree to which it dominates overall health spending has in fact increased. For example, in 1995, government health spending made up 57.6% (56.8–58.5) of total spending, whereas in 2018 it made up 59.6% (59.0–60.1).
Figures 19 and 20 show spending source details by World Bank income group and Global Burden of Disease super-region, respectively, between 2000 and 2018. Important points to note in Figure 19 include a slight increase in prepaid private spending per person in high-income countries (+2.8% [2.6–3.1]) during this period, the growth of government spending per person in upper-middle-income countries (+7.5% [7.1–7.8]), and DAH’s rise in low-income countries (+6.8%). Outside of DAH, low-income countries saw low growth in per-person health spending in other areas between 2000 and 2018: total health spending and prepaid private spending grew 1.8% (1.6–2.0) and 3.3% (2.4–4.2), respectively. Out-of-pocket spending was flat at 1.1% (0.8–1.4), while government spending per person actually went down 0.1% (-0.3 to 0.5) in low-income countries between 2000 and 2018.
According to Figure 20, the Latin America and Caribbean super-region
Figure 19 annualized rate of change in health spending per person by World Bank income group, 2000–2018
Low-income
Lower-middle-income
Upper-middle-income
High-income
Global
-2% -1% 0% 1% 2% 3% 4% 5% 6% 7% 8% 9% 10%
Total health spending per person
Government health spending per person
Prepaid private health spending per personOut-of-pocket health spending per personDevelopment assistance for health spending per person*
Black lines represent 95% uncertainty intervals.
*Uncertainty intervals not produced for development assistance for health.
rT: we aren't sure whether this is 2000 (which would jive with the text in the parag above) or 1995 (which would fit with the other figures and this figure's x axis label).

80 | FINANCING GLOBAL HEALTH 2020
saw a decrease of 3.5% in DAH during this period, while sub-Saharan Africa saw the largest increase in DAH between 2000 and 2018 (6.5%). Both government spending and prepaid private spending per person grew the most – 11.8% (11.1–12.4) and 5.0% (3.1–6.9), respectively – in the Southeast Asia, East Asia, and Oceania Global Burden of Disease super-region, and prepaid private spending increased 8.1% (7.3–8.9) in North Africa and the Middle East.
Figure 21 compares spending, population, and DALYs across World Bank income groups in 2018. As the figure shows, the majority of health spending (80.5% [80.0–81.0]) takes place in high-income countries, while the least (0.03% [0.03–0.03]) occurs in low-income countries. Figure 21 shows 16.0% of the global population lives in a high-income country while 37.3%, 38.1%, and 8.6% live in upper-middle, lower-middle, and low-income countries, respectively. Also shown in Figure 21, the proportion of
Figure 20 annualized rate of change in health spending per person by global Burden of Disease super-region, 2000–2018
Sub-Saharan Africa
Southeast Asia, East Asia, and Oceania
South Asia
North Africa and Middle East
Latin America and Caribbean
GBD high-income
Central Europe, Eastern Europe, and Central Asia
-5% -1% 0% 1% 2% 3% 4% 5% 6% 7% 8% 9% 10%-4% -3% -2% 11% 12%
Total health spending per person
Government health spending per person
Prepaid private health spending per personOut-of-pocket health spending per personDevelopment assistance for health spending per person*
Black lines represent 95% uncertainty intervals.
*Uncertainty intervals not produced for development assistance for health.

TOTAL HEALTH spENdING prIOr TO COvId-19 | 81
disability-adjusted life years, or years of healthy life lost due to more than 350 diseases and injuries per the Global Burden of Disease Study 2019, generally corresponds with population and was highest in lower-middle-in-come countries (41.5% [40.4–42.7]), with upper-middle-income countries accounting for 32.1% (30.8–33.5) of DALYs, low-income countries 12.0% (11.1–13.1), and high-income countries 14.3% (13.6–15.1) of total DALYs.
This figure shows the degree to which inequality shapes health spending globally. Even though high-income countries make up the smallest per-centage of the global population, they are responsible for most of the world’s health spending.
Following this, Figure 22 illustrates how spending on health generally transitions as GDP goes up: as countries grow richer (moving from left to right in the figure), their overall health spending pictures becomes less reliant on development assistance for health and out-of-pocket spending. Meanwhile, prepaid private and government spending grow. However, during this transition from DAH to government spending, countries can get stuck in the “middle.” In other words, they have either increased domestic spending to the point that DAH plays a smaller role, or donors have transi-tioned their resources elsewhere, but the countries have not yet established robust prepaid health financing systems, and so individuals are forced to pay out of pocket for care. Because the “missing middle” can lead to social inequality and inequitable health outcomes, tracking how countries are progressing toward sustainable health financing systems is important.
Figure 23 tracks progress using the universal health service coverage
Figure 21 Health spending, population, and disability-adjusted life years by World Bank income group, 2018Pe
rcen
tage
of t
otal
0
20
40
60
80
100
Health spending Population Disability-adjusted life years
High-income countriesUpper-middle-income countriesLower-middle-income countriesLow-income countries
Sources: Financing Global Health Database 2020 and gbd 2019 study

82 | FINANCING GLOBAL HEALTH 2020
index, a composite measure of related indicators used to track health coverage using a single number, on a scale of 0-100.17 Higher “scores” on the 100-point scale are associated with improved health outcomes and more effective coverage of key global health initiatives. The figure shows how countries in regions move toward, or away from, full universal health coverage as health spending per person increases or decreases. Broadly, the higher per-person health spending is in a country, the higher the country’s universal health service coverage index score.
And per Figure 24, tracking government health spending as a percentage of overall health spending can provide insights as to which countries are on the path to financial risk protection. This is important because the less dependent on donor funding and out-of-pocket spending (the latter of which can be catastrophic for individuals) countries are, the more robust their health systems are and therefore closer to UHC.
But while ensuring broad access to health services is a key part of achieving UHC, it is not the only part. Patient access to high-quality care at the expense of household welfare, or at the risk of being pushed into poverty, is at odds with the concept of UHC. Financial risk protection, through government and private health financing, may increase universal health care service coverage and reduce the chances of medical impoverish-ment. The less likely people are to be impoverished by care, the more likely they are to take advantage of care.17, 18
Figure 25 gives an overview of how health spending moved from financing source to World Bank income group and Global Burden of Disease super-region between 2015 and 2018 (from middle to left and right,
Figure 22 The share of health spending by source and gDP per person, 2018M
odel
ed p
ropo
rtion
of t
otal
hea
lth sp
endi
ng
GDP per person (2020 US dollars)
130 500 2,500 10,000 50,000 194,0000%
20%
40%
60%
80%
100%
Development assistance for health
Out-of-pocket health spending
Prepaid private health spending
Government health spending
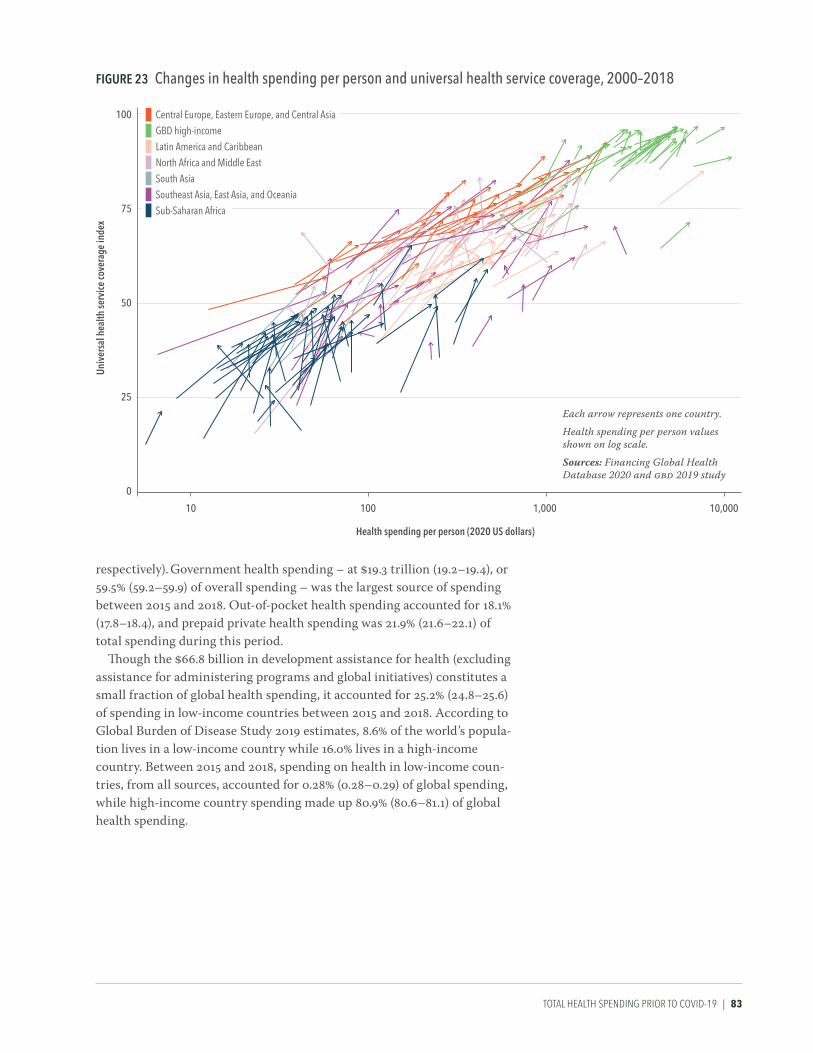
TOTAL HEALTH spENdING prIOr TO COvId-19 | 83
respectively). Government health spending – at $19.3 trillion (19.2–19.4), or 59.5% (59.2–59.9) of overall spending – was the largest source of spending between 2015 and 2018. Out-of-pocket health spending accounted for 18.1% (17.8–18.4), and prepaid private health spending was 21.9% (21.6–22.1) of total spending during this period.
Though the $66.8 billion in development assistance for health (excluding assistance for administering programs and global initiatives) constitutes a small fraction of global health spending, it accounted for 25.2% (24.8–25.6) of spending in low-income countries between 2015 and 2018. According to Global Burden of Disease Study 2019 estimates, 8.6% of the world’s popula-tion lives in a low-income country while 16.0% lives in a high-income country. Between 2015 and 2018, spending on health in low-income coun-tries, from all sources, accounted for 0.28% (0.28–0.29) of global spending, while high-income country spending made up 80.9% (80.6–81.1) of global health spending.
25
0
50
100
75
10 10,0001,000100
Univ
ersa
l hea
lth se
rvice
cove
rage
inde
xCentral Europe, Eastern Europe, and Central Asia GBD high-incomeLatin America and Caribbean
North Africa and Middle EastSouth Asia
Southeast Asia, East Asia, and Oceania
Sub-Saharan Africa
Health spending per person (2020 US dollars)
Each arrow represents one country.
Health spending per person values shown on log scale.
Sources: Financing Global Health Database 2020 and gbd 2019 study
Figure 23 Changes in health spending per person and universal health service coverage, 2000–2018
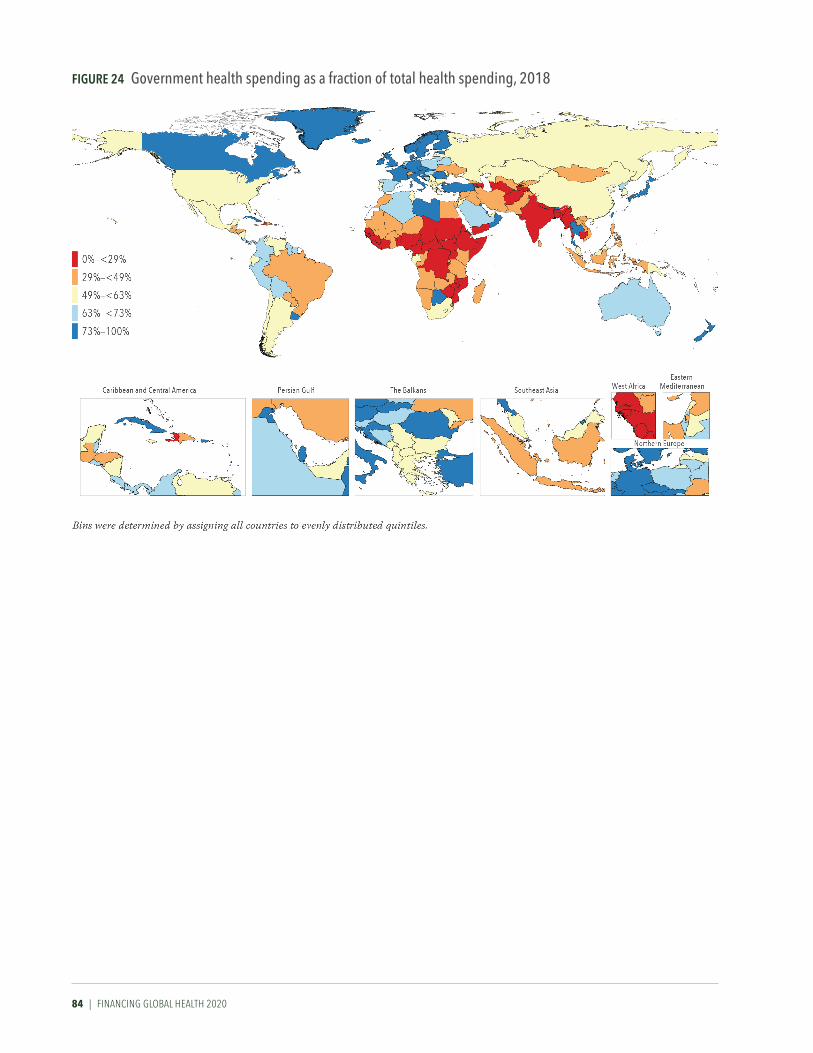
84 | FINANCING GLOBAL HEALTH 2020
Figure 24 government health spending as a fraction of total health spending, 2018
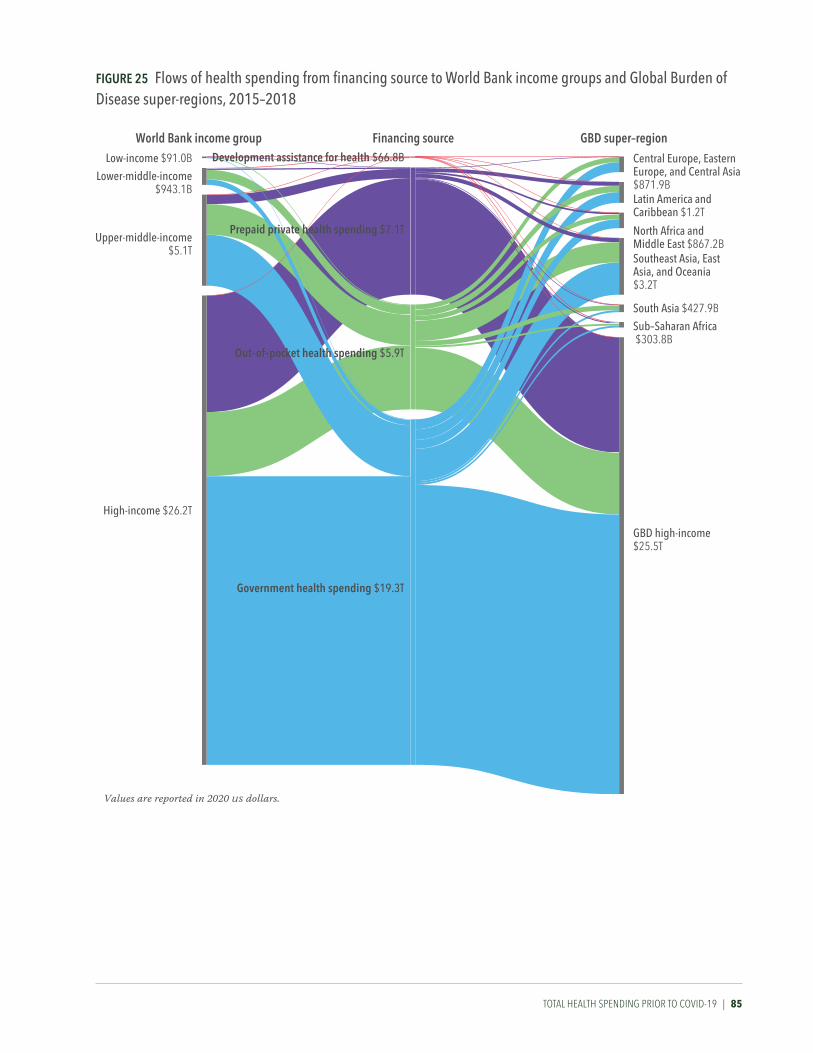
TOTAL HEALTH spENdING prIOr TO COvId-19 | 85
Figure 25 Flows of health spending from financing source to World Bank income groups and Global Burden of Disease super-regions, 2015–2018
World Bank income group Financing source GBD super–regionDevelopment assistance for health $66.8B
Prepaid private health spending $7.1T
Out–of–pocket health spending $5.9T
Government health spending $19.3T
Central Europe, Eastern Europe, and Central Asia $871.9B
North Africa andMiddle East $867.2BSoutheast Asia, East Asia, and Oceania$3.2T
South Asia $427.9B
Sub–Saharan Africa $303.8B
GBD high-income$25.5T
Latin America and Caribbean $1.2T
Low-income $91.0B
Upper-middle-income $5.1T
High-income $26.2T
Lower-middle-income$943.1B
Values are reported in 2020 us dollars.

86 | FINANCING GLOBAL HEALTH 2020
AddrEssING COvId-19 ANd prEpArING FOr FuTurE pANdEmICs | 87
CONCLUSION
Addressing COVID-19 and preparing for future pandemics
The COVID-19 pandemic has shown the urgent value of resource tracking efforts to improve our interconnected and interdependent world’s health, and in so doing to prepare the world for shocks like COVID-19. By including updated estimates of global health spending through 2018, and donor spending through 2020, Financing Global Health 2020 illustrates large disparities in health spending across countries, and which countries may remain dependent on external financing. Furthermore, this year’s future health spending projections – which again are underscored by the ongoing COVID-19 crisis – show that these disparities are not expected to dissipate.
Projections of future spendingThe pandemic has also shown us that the future is anything but certain. Despite this, planning for the future and estimating future resources available for health can help policymakers identify gaps and construct a truly global health system that is more robust to future pandemics and resilient to other expected shocks. Because of this, we estimated future health spending for 204 countries, assuming spending patterns and rela-tionships with other key determinants of health spending persist, while also doing our best to model analytically the impact of COVID-19, which we know has substantially reduced global economic activity.
Between 2018 and 2030, global spending on health is projected to grow 17.1% (15.5–18.7), from an estimated $8.5 trillion (8.4–8.5) to $9.9 trillion (9.7–10.1). By type of health spending, global government spending is projected to grow 17.2% (14.5–19.7) between 2018 and 2030, out-of-pocket spending 4.3% (3.8–4.8), prepaid private spending 27.3% (25.6–28.9), and development assistance for health 25.6% (21.1–30.6). Many of those increases, however, will be driven by spending in high-income countries. By World Bank income group, spending on health in high-income countries makes up 57.5% (53.1–61.8) of the total health spending increase from 2018 to 2030, while upper-middle-income spending is projected to contribute to 35.7% (31.7–39.8) of the increase, lower-middle-income 6.2% (5.6–7.0), and low-income just 0.6% (0.5–0.7).
Though many regions are projected to experience substantial (18.9%–103.4%) growth in government spending on health per person between 2018 and 2030, the North Africa and Middle East and Central Europe, Eastern Europe, and Central Asia super-regions are projected to experience 103.4% (84.2–128.4) and 88.0% (85.6–90.1) growth in government spending on health per person, respectively. According to Figure 26 – which shows

88 | FINANCING GLOBAL HEALTH 2020
projected increases by source of spending (government, prepaid private, out-of-pocket, and development assistance for health) per person, by region between 2018 and 2030 – the growth in government health spending in North Africa and the Middle East is accompanied by a large decline of 50.0% (21.6–117.4) in out-of-pocket spending.
Other estimates in Figure 26 suggest widespread changes (and possible challenges) for several super-regions. For example, we project that in the South Asia super-region, out-of-pocket spending will grow by 1.4% (1.3–1.5) by 2030. Currently, out-of-pocket spending already constitutes 62.6% (58.3–67.3) of total spending on health in South Asia, and the projected increase in out-of-pocket spending will put more burden on individuals. Likewise, we project that prepaid private spending will grow 2.2% (2.0–2.4) in the Latin America and Caribbean super-region. Though an improvement over the current situation – prepaid private spending is 18.5% (17.2–19.9),
Sub-Saharan Africa
Southeast Asia, East Asia, and Oceania
South Asia
North Africa and Middle East
Latin America and Caribbean
GBD high-income
Central Europe, Eastern Europe, and Central Asia
0%-4% -3% -2% -1% 1% 2% 3% 4% 5% 6% 7%
Out-of-pocket health spending per person
Total health spending per personGovernment health spending per person
Prepaid private health spendingper person
Development assistance for health spending per person
Black lines represent 95% uncertainty intervals.
Sources: Financing Global Health Database 2020 and gbd 2019 study
Figure 26 annualized rate of change in health spending per person by global Burden of Disease super-region, 2018–2030

AddrEssING COvId-19 ANd prEpArING FOr FuTurE pANdEmICs | 89
out-of-pocket spending 30.1% (28.7–31.5), and government spending 51.1% (49.5–52.7) – that prepaid private spending is projected to outstrip govern-ment spending could mean an overreliance on the market and its inherent volatility.
Meanwhile, the map of spending by country in 2050 shows our projec-tions of how countries’ annual spending on health will grow, or decline as the case may be, over the next 30 years. Spending is shown by 2020 US dollars per person, and the map is divided into five groups: from $9 to <$96 per person by 2020; $96 to <$337; $337 to <$808; $808 to <$2,177; and $2,177 to $17,324 per person.
We project that the top three countries by per-person spending in 2050 will be the United States ($17,324 [15,655–19,089]), Switzerland ($14,256 [12,862–15,739]), and Bermuda ($10,720 [8,189–13,814]). The lowest three countries by per-person spending in 2050 are Somalia ($9 [8–11]), Eritrea ($20 [17–23]), and the Democratic Republic of the Congo ($25 [22–29]), all of which are in sub-Saharan Africa. Indeed, the 12 countries with the lowest projected per-person spending across the globe – Mozambique, Benin, Burundi, Mali, Ethiopia, Niger, South Sudan, Chad, Madagascar, the Democratic Republic of the Congo, Eritrea, and Somalia – are in sub- Saharan Africa. These 12 countries are estimated to have a population of almost 800 million by 2050.* In contrast, populations in high-income countries like the US and Germany are projected to begin plateauing and
Figure 27 Forecasted total health spending, 2050
*For an additional view of total health spending in 2019 and projected spending in 2050, by World Bank income group and Global Burden of Disease super-region, see Table B4 in Annex 2.

90 | FINANCING GLOBAL HEALTH 2020
declining around the same time.19 Many of the poorest countries in the world will be growing while the richest countries are shrinking. Yet spending on health is not projected to keep pace with this coming popula-tion transition: we estimate that without the sharp increase in health spending due to COVID-19, development assistance for health will increase just 19.4% (15.2–24.3) between 2020 and 2030. Indeed, there are already signs that some donors may be responding to the ongoing economic crisis caused by COVID-19 by cutting aid and support for development assistance for health. In particular, the United Kingdom announced that it would be cutting its aid budget from 0.7% to 0.5% of GNI, a reduction of roughly $5.5 billion; this is especially notable given the UK’s importance to development assistance for health over the years.20 Meanwhile, the population of sub- Saharan Africa is expected to grow from roughly 1.1 billion in 2020 to 1.4 billion, and the health focus areas that DAH has in the past helped reduce the burden of – such as malaria, HIV/AIDS, and maternal and child health issues like neonatal sepsis and preterm birth – continue to cause death and disability in the region.
Meeting the challenges aheadOur estimates of future spending on health underscore the challenge facing the world: countries that are rich now are likely to stay rich, and the countries that require health spending assistance now will likely require it in the future. Domestic health financing systems and support from donors will need to both stay robust and continue to grow, lest any country fall behind.
What’s more, the related health and economic crises caused by COVID-19 have and will likely continue to exacerbate these inequalities. That the economic damage caused by the pandemic has been immense has been well-reported, but what has perhaps been less scrutinized is where that damage has been, and where it could get worse. For example, according to the World Bank’s January 2021 Global Economic Prospects report, “[f]ragile and conflict-affected” lower-income countries “have been particularly hard hit by the pandemic, with activity contracting by an estimated 3.9 percent. The resultant fall in per capita GDP is expected to set average living stan-dards back by a decade or more” in roughly a quarter of low-income countries around the world.21 In particular, COVID-19 “is projected to cause per capita incomes to decline by 0.2%” in 2021 in much of sub-Saharan Africa, which “is expected to push tens of millions more people into extreme poverty.”22 Even though its health loss has so far been less intensely felt in sub-Saharan Africa, the pandemic has certainly added stress to an already stressed region.
COVID-19 therefore presents the world with both a challenge and an opportunity: will it serve to catalyze attention on health and additional resources for health so that the world will be able to not only overcome COVID-19 but be better prepared for the next global health challenge? Or will COVID-19 further divide the haves from the have-nots, leading to greater disparities in health spending and in population health around the world? Will COVID-19 lead to more robust, more responsive and resilient health systems that can respond to the next health threat? Or will it lead to

AddrEssING COvId-19 ANd prEpArING FOr FuTurE pANdEmICs | 91
the opposite, a more fractured state of affairs? As Feachem and colleagues noted in The Lancet,23 the pandemic has “brought attention to the impor-tance of resilient and equitable health systems that can respond to routine health needs and health emergencies while contributing to global health security,” adding that “evidence exists showing that health emergencies can disrupt and undermine progress” made in other health focus areas.
But the early days of the pandemic are behind us now, and the world has collectively realized that it cannot defeat a resilient, deadly enemy like the novel SARS-CoV-2 virus and its variants without cooperation; even rich countries must cooperate and coordinate with other nations. So work like COVAX, and the rapid development of so many effective vaccines in such a short time, is evidence of progress in the global fight against COVID-19. The question is whether decision-makers will be able to sustain the focus on global health that COVID-19 has brought.
In an address before the UN General Assembly in December 2020, Japan’s Prime Minister Yoshihide Suga noted that “this crisis is threatening people’s lives, livelihoods and dignity across the globe,” adding that it is important for the world, “guided by the principle of human security,” to leave “no one’s health behind.” The world, argued Prime Minister Yoshihide, should therefore first work “to overcome the current crisis of the pandemic; second, to strengthen health and medical systems for future crises; and, third, to generate an environment that is resilient to infectious diseases.”24
The good news so far is that we are on the path to accomplishing the Prime Minister’s first goal, as vaccines have helped slow the pandemic in many parts of the world and are being rolled out elsewhere. But the second and third goals outlined by Prime Minister Yoshihide remain unfinished. However, the tremendous increase in development assistance for health in 2020 – as our tracking has shown – is certainly a step in the right direction. COVID-19 has shown the world that where there is the will to improve health globally, there is a way.

92 | FINANCING GLOBAL HEALTH 2020
GLOBAL HEALTH FINANCING prOFILEs | 93
Global health financing profiles
Financing Global Health 2020’s global health financing profiles expand upon the main report by offering detailed development assistance for health data and information on seven health focus areas: COVID-19; HIV/AIDS; tuberculosis; malaria; other infectious diseases; reproductive, maternal, newborn, and child health; and non-communicable diseases.
Figure a
*2019 and 2020 estimates are preliminary.
CEPI = Coalition for Epidemic Preparedness InnovationsGavi = Gavi, the Vaccine AllianceNGOs = Non-governmental organizationsPAHO = Pan American Health OrganizationUNAIDS = Joint United Nations Programme on HIV/AIDSUNFPA = United Nations Population FundUNICEF = United Nations Children’s FundWHO = World Health Organization
"Regional development banks" include the African Development Bank, the Asian Development Bank, and the Inter-American Development Bank. "Other bilateral development agencies" include Austria, Belgium, Denmark, Finland, Greece, Ireland, Italy, South Korea, Luxembourg, the Netherlands, New Zealand, Norway, Spain, Sweden, Switzerland, the United Arab Emirates, the European Commission, and EEA.
Figure B
*2019 and 2020 estimates are preliminary.
“Other” captures development assistance for health for which we have program area information but which is not identified as being allocated to any of the program areas listed.
Figure C
*2019 and 2020 estimates are preliminary.
IBRD = International Bank for Reconstruction and Development.
“Other governments” include Afghanistan, Angola, Argentina, Austria, Azerbaijan, Bangladesh, Belgium, Bhutan, Brazil, Brunei, Bulgaria, Côte d'Ivoire, Cameroon, Central African Republic, Chad, Colombia, Croatia, Czechia, Democratic Republic of the Congo, Denmark, Egypt, Estonia, Ethiopia, Finland, Gabon, Greece, Guinea, Hungary, Iceland, India, Indonesia, Iran, Iraq, Ireland, Italy, Jamaica, Jordan, Kenya, Kuwait, Latvia, Lebanon, Libya, Lithuania, Luxembourg, Madagascar, Malaysia, Malta, Monaco, Myanmar, New Zealand, Nigeria, Oman, Pakistan, Palestine, Peru, Poland, Portugal, Qatar, Romania, Russia, São Tomé and Príncipe, Saudi Arabia, Serbia, Singapore, Slovakia, Slovenia, South Africa, South Korea, South Sudan, Sudan, Sweden, Switzerland, Syria, Taiwan (province of China), Thailand, Togo, Turkey, Uganda, Ukraine, United Arab Emirates, Yemen, and Zimbabwe. “Other sources” captures development assistance for health for which we have source information but which is not identified as originating within any of the sources listed. Health assistance for which we have no source information is designated as “Unidentified.”
Footnotes for HiV/aiDS; tuberculosis; malaria; other infectious diseases; reproductive, maternal, newborn, and child health; and non-communicable diseases profiles:

94 | FINANCING GLOBAL HEALTH 2020
COVID-19COVID-19 is a respiratory disease caused the by SARS-CoV-2 virus, which was first detected in Wuhan, China, in late 2019. Since its origin, COVID-19 (as named by WHO in February 2020) has spread across the globe, infecting more than 2.5 billion people worldwide and causing an estimated 4.4 million deaths through August 15, 2021.1 WHO declared COVID-19 a pandemic in March 2020.
Generally spread by close contact between individuals, COVID-19 can also be spread via airborne transmission and, less frequently, through contact with contaminated surfaces. While most people who get COVID-19 recover (some of whom without ever exhibiting symptoms), roughly 5%–10% of those who do get COVID-19 can become seriously ill, requiring hospitalization and/or intensive care. Older individuals with comorbidities like cardiac issues, diabetes, and cancer are at the most risk for severe COVID-19.
In addition to the toll it has taken on global health, the lockdowns and other restrictions imposed to slow the spread of COVID-19 have had a severe economic impact. Between 2019 and 2020, the world economy shrank an estimated 4.3%, with some countries seeing declines as high as 9.6% (India) and 10.6% (Argentina).25 However, COVID-19 also led to a surge in govern-ment spending, including a huge increase in development assistance for health; an estimated $13.7 billion was directed toward COVID-19 in 2020.
Overall, development assistance for health for COVID-19 led to
a 35.7% increase in total development assistance for health between 2019 and 2020: in 2019, total development assistance for health was $40.4 billion, while in 2020 it was $54.8 billion.
The focus on COVID-19 development assistance for health did not, however, lead to a corresponding decline in development assistance for health for other health focus areas (such as HIV/AIDS and spending on reproductive, maternal, newborn, and child health). Indeed, our analyses found that the majority of COVID-19 development assistance for health was new rather than repur-posed spending: 90.1% of COVID-19 development assistance for health was new, and 9.9% “repurposed” funds, the majority of which was spending previously set aside for emergencies.
The COVID-19 profiles illustrate the sources, disbursement channels, and program areas COVID-19 development assistance for health was allocated to in 2020. As shown in Figure A, the leading channels for COVID-19 DAH were Gavi, the Vaccine Alliance ($1.9 billion) and regional development banks as a group ($2.7 billion).
Meanwhile, Figure B shows COVID-19 DAH received by program area in 2020. Country-level coordination ($3.1 billion), spending on supply chain and logistics ($2.4 billion), and treatment ($1.5 billion) were leading COVID-19 program areas by DAH received in 2020. And Figure C shows sources of COVID-19 DAH in 2020; the single largest sources were Japan (16.8% of COVID-19 DAH, or $2.3 billion) and Germany (9.8%, or $1.3 billion).
FIgURE A Development assistance for CoViD-19 by channel of assistance, 2020*
3%
11%
7% 2%2%
20%4%
14%7%
3%
7%
11%
9%
Regional development banks include the African Development Bank, the Asian Development Bank, and the Inter-American Development Bank.
Other bilateral agencies includes Australia, Austria, Belgium, Canada, Denmark, Finland, France Italy, South Korea, Netherlands, New Zealand, Norway, Spain, Sweden, Switzerland, United Arab Emirates, the United Kingdom, and the United States.
cepi = Coalition for Epidemic Preparedness Innovationsngos = Non-governmental organizationspaho = Pan American Health Organizationunaids = Joint United Nations Programme on hiv/aidsunfpa = United Nations Population Fundunicef = United Nations Children's Fundwho = World Health Organization
European ComissionOther bilateral agencies
GaviRegional development banks
GermanyJapanNGOs & foundations
UNAIDS, UNFPA, PAHO, UNICEF, and Unitaid
World BankWHO
The Bill & Melinda Gates Foundation
CEPI
The Global Fund
*2020 estimates are preliminary

COvId-19 prOFILE | 95
22%4%
8%
6%
11%
18%
4%4%
22%
*2020 estimates are preliminary.
Country-level coordination includes planning, monitoring and evaluation, risk communication and community engagement, and travel restrictions
Research and development for vaccine and other therapeuticsInfection prevention and personal protective equipmentNational labs and testingTreatmentSupply chain and logistics
Country-level coordination
Surveillance, rapid-response teams, and case investigationMaintaining other essential health services and systems
Other
14%
11%
3%
9%
4%
12%
3%
10%
3%
6%
17%
6%2%2%
*2020 estimates are preliminary.
Other sources include source information such as “revenue adjustments,” “UN agency,” and “miscellaneous” that does not fall into one of the listed source categories.
Other dac governments include Austria, Belgium, Czechia, Denmark, Finland, Greece, Hungary, Iceland, Ireland, Italy, Netherlands, Norway, Poland, Portugal, Spain, Slovakia, Slovenia, South Korea, Sweden, and Switzerland.
ibrd = International Bank for Reconstruction and Development
Private
The Bill & Melinda Gates Foundation
Other sourcesJapan
United StatesUnited Kingdom
GermanyFranceCanada
Australia
Other DAC governmentsOther non-DAC governments
Debt repayments, IBRDUnidentified
FIgURE B Development assistance for CoViD-19 by program area, 2020*
FIgURE C Development assistance for CoViD-19 by source of funding, 2020*

96 | FINANCING GLOBAL HEALTH 2020
FIgURE A Development assistance for HiV/aiDS by channel of assistance, 1990–2020
HIV/AIDSTransmitted during sexual intercourse, via syringes, or during pregnancy, breastfeeding, or childbirth, HIV/AIDS, if left untreated, can lead to life-threatening infections and health conditions. The virus attacks white blood cells integral to fighting off infection, without which patients are open to infection. Though there are now effective anti-retroviral treatments for HIV/AIDS, when the disease first appeared in the 1980s it led to a widespread public health crisis. Since the start of the epidemic, an estimated 32 million people have died from AIDS-related illnesses.26
2020 DAH for HIV/AIDS totaled $9.0 billion, a 3.4% decrease from the 2019 DAH total. For context, in 2017 in low- and middle-income countries, a total of $20.2 billion (comprising government spending, prepaid private spending, out-of-pocket spending, and development assistance for health) was spent on HIV/AIDS, of which 51.1% was DAH. Figure A shows HIV/AIDS DAH by channel of assistance between 1990 and 2020. In 2020, the United States (14.3% of overall DAH) remained the largest channel of HIV/AIDS DAH, followed by NGOs (16.7%). And by HIV/AIDS program area, as shown in Figure B, while HIV/AIDS treatment ($2.8 billion, 5.1% of overall 2020 DAH) remains the leading program area by DAH
received, spending on counseling and testing has grown as a share of HIV/AIDS DAH, going from 0.02% ($2.1 million) in 1990 to 6.2% ($552.7 million) in 2020. Per Figure C, the United States remains the largest source of HIV/AIDS DAH, despite reductions in 2015 and 2018.
Billi
ons o
f 202
0 US
dol
lars
4
2
6
8
12
10
0
1991
1992
1993
1994
1995
1996
1997
1998
1999
2000
2001
2002
2003
2004
2005
2006
2007
2008
2009
2010
2011
2012
2013
2014
2016
2015
1990
2017
2018
2019
*
2020
*UNICEF, UNFPA, UNAIDS, Unitaid, and PAHO
US foundations
NGOs and international foundations
World Bank
The Bill & Melinda Gates FoundationRegional development banks
WHO
CEPIGavi
The Global Fund
Other bilateral development agenciesAustralia
Canada
ChinaFrance
Germany
United Kingdom
United States
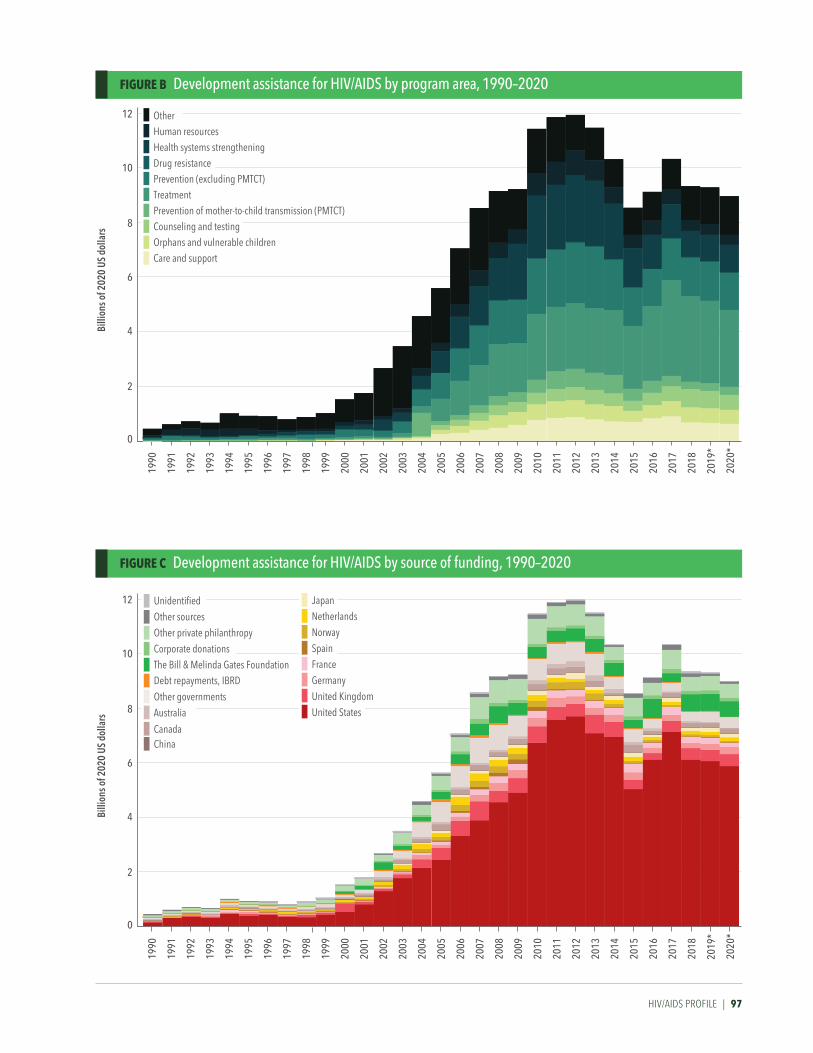
HIV/AIDS PROFILE | 97
Billi
ons o
f 202
0 US
dol
lars
4
2
6
8
12
10
0
1991
1992
1993
1994
1995
1996
1997
1998
1999
2000
2001
2002
2003
2004
2005
2006
2007
2008
2009
2010
2011
2012
2013
2014
2016
2015
1990
2017
2018
2019
*
2020
*
Other Human resources Health systems strengthening Drug resistance Prevention (excluding PMTCT) Treatment Prevention of mother-to-child transmission (PMTCT) Counseling and testing Orphans and vulnerable children Care and support
Billi
ons o
f 202
0 US
dol
lars
4
2
6
8
12
10
0
1991
1992
1993
1994
1995
1996
1997
1998
1999
2000
2001
2002
2003
2004
2005
2006
2007
2008
2009
2010
2011
2012
2013
2014
2016
2015
1990
2017
2018
2019
*
2020
*
Australia
Unidentified
Other sources
Debt repayments, IBRD
Other private philanthropy
Corporate donationsThe Bill & Melinda Gates Foundation
Other governments
ChinaCanada
JapanNetherlands
Norway
SpainFrance
Germany
United Kingdom
United States
FIgURE B Development assistance for HiV/aiDS by program area, 1990–2020
FIgURE C Development assistance for HiV/aiDS by source of funding, 1990–2020
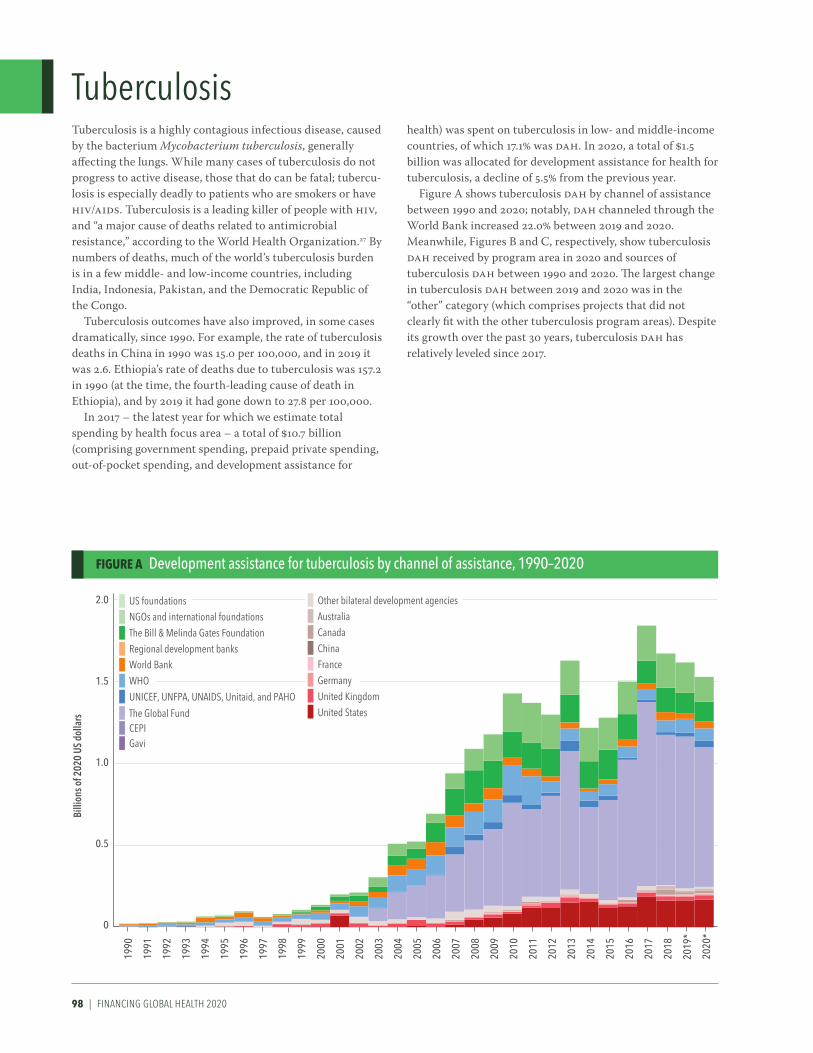
98 | FINANCING GLOBAL HEALTH 2020
FIgURE A Development assistance for tuberculosis by channel of assistance, 1990–2020
TuberculosisTuberculosis is a highly contagious infectious disease, caused by the bacterium Mycobacterium tuberculosis, generally affecting the lungs. While many cases of tuberculosis do not progress to active disease, those that do can be fatal; tubercu-losis is especially deadly to patients who are smokers or have HIV/AIDS. Tuberculosis is a leading killer of people with HIV, and “a major cause of deaths related to antimicrobial resistance,” according to the World Health Organization.27 By numbers of deaths, much of the world’s tuberculosis burden is in a few middle- and low-income countries, including India, Indonesia, Pakistan, and the Democratic Republic of the Congo.
Tuberculosis outcomes have also improved, in some cases dramatically, since 1990. For example, the rate of tuberculosis deaths in China in 1990 was 15.0 per 100,000, and in 2019 it was 2.6. Ethiopia’s rate of deaths due to tuberculosis was 157.2 in 1990 (at the time, the fourth-leading cause of death in Ethiopia), and by 2019 it had gone down to 27.8 per 100,000.
In 2017 – the latest year for which we estimate total spending by health focus area – a total of $10.7 billion (comprising government spending, prepaid private spending, out-of-pocket spending, and development assistance for
health) was spent on tuberculosis in low- and middle-income countries, of which 17.1% was DAH. In 2020, a total of $1.5 billion was allocated for development assistance for health for tuberculosis, a decline of 5.5% from the previous year.
Figure A shows tuberculosis DAH by channel of assistance between 1990 and 2020; notably, DAH channeled through the World Bank increased 22.0% between 2019 and 2020. Meanwhile, Figures B and C, respectively, show tuberculosis DAH received by program area in 2020 and sources of tuberculosis DAH between 1990 and 2020. The largest change in tuberculosis DAH between 2019 and 2020 was in the “other” category (which comprises projects that did not clearly fit with the other tuberculosis program areas). Despite its growth over the past 30 years, tuberculosis DAH has relatively leveled since 2017.
Billi
ons o
f 202
0 US
dol
lars
1.0
0.5
1.5
2.0
0
1991
1992
1993
1994
1995
1996
1997
1998
1999
2000
2001
2002
2003
2004
2005
2006
2007
2008
2009
2010
2011
2012
2013
2014
2016
2015
1990
2017
2018
2019
*
2020
*UNICEF, UNFPA, UNAIDS, Unitaid, and PAHO
US foundations
NGOs and international foundations
World Bank
The Bill & Melinda Gates FoundationRegional development banks
WHO
CEPIGavi
The Global Fund
Other bilateral development agenciesAustralia
Canada
ChinaFrance
Germany
United Kingdom
United States

TuBErCuLOsIs prOFILE | 99
Billi
ons o
f 202
0 US
dol
lars
1.0
0.5
1.5
2.0
0
1991
1992
1993
1994
1995
1996
1997
1998
1999
2000
2001
2002
2003
2004
2005
2006
2007
2008
2009
2010
2011
2012
2013
2014
2016
2015
1990
2017
2018
2019
*
2020
*
OtherHuman resourcesHealth systems strengtheningAntimicrobial resistanceTreatmentDiagnosis
Billi
ons o
f 202
0 US
dol
lars
1.0
0.5
1.5
2.0
0
1991
1992
1993
1994
1995
1996
1997
1998
1999
2000
2001
2002
2003
2004
2005
2006
2007
2008
2009
2010
2011
2012
2013
2014
2016
2015
1990
2017
2018
2019
*
2020
*
Australia
Unidentified
Other sources
Debt repayments, IBRD
Other private philanthropy
Corporate donationsThe Bill & Melinda Gates Foundation
Other governments
ChinaCanada
JapanNetherlands
Norway
SpainFrance
Germany
United Kingdom
United States
FIgURE B Development assistance for tuberculosis by program area, 1990–2020
FIgURE C Development assistance for tuberculosis by source of funding, 1990–2020
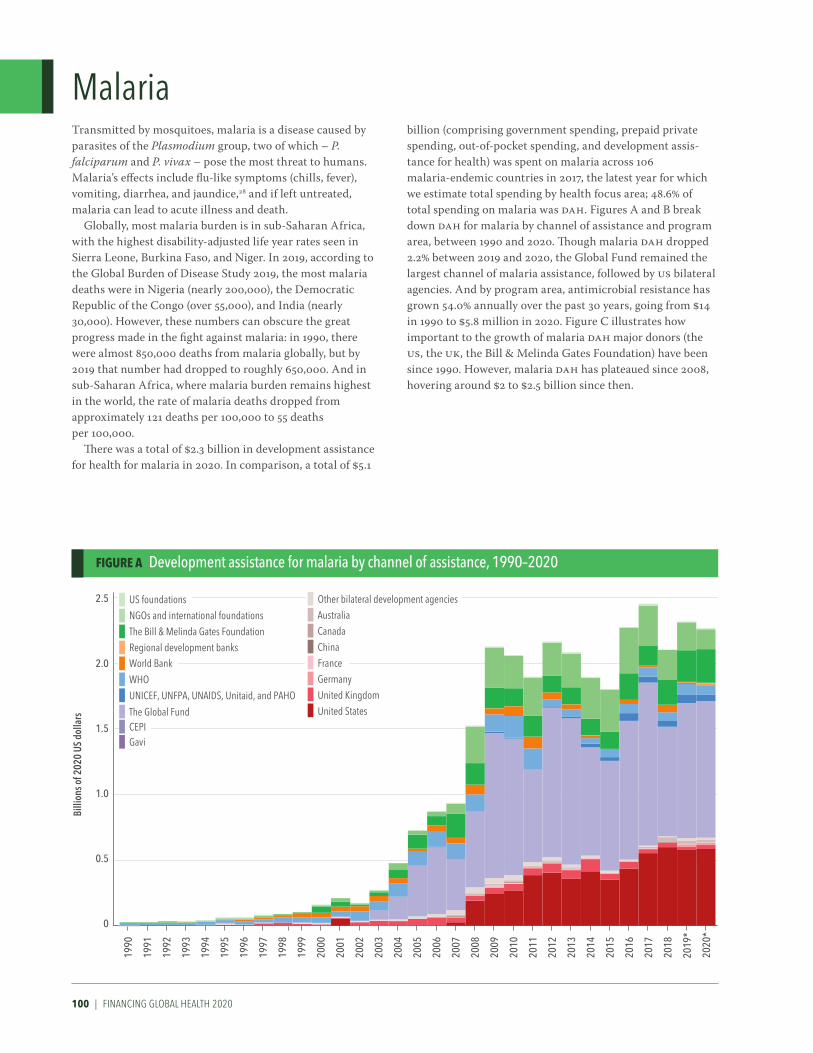
100 | FINANCING GLOBAL HEALTH 2020
FIgURE A Development assistance for malaria by channel of assistance, 1990–2020
MalariaTransmitted by mosquitoes, malaria is a disease caused by parasites of the Plasmodium group, two of which – P. falciparum and P. vivax – pose the most threat to humans. Malaria’s effects include flu-like symptoms (chills, fever), vomiting, diarrhea, and jaundice,28 and if left untreated, malaria can lead to acute illness and death.
Globally, most malaria burden is in sub-Saharan Africa, with the highest disability-adjusted life year rates seen in Sierra Leone, Burkina Faso, and Niger. In 2019, according to the Global Burden of Disease Study 2019, the most malaria deaths were in Nigeria (nearly 200,000), the Democratic Republic of the Congo (over 55,000), and India (nearly 30,000). However, these numbers can obscure the great progress made in the fight against malaria: in 1990, there were almost 850,000 deaths from malaria globally, but by 2019 that number had dropped to roughly 650,000. And in sub-Saharan Africa, where malaria burden remains highest in the world, the rate of malaria deaths dropped from approximately 121 deaths per 100,000 to 55 deaths per 100,000.
There was a total of $2.3 billion in development assistance for health for malaria in 2020. In comparison, a total of $5.1
billion (comprising government spending, prepaid private spending, out-of-pocket spending, and development assis-tance for health) was spent on malaria across 106 malaria-endemic countries in 2017, the latest year for which we estimate total spending by health focus area; 48.6% of total spending on malaria was DAH. Figures A and B break down DAH for malaria by channel of assistance and program area, between 1990 and 2020. Though malaria DAH dropped 2.2% between 2019 and 2020, the Global Fund remained the largest channel of malaria assistance, followed by US bilateral agencies. And by program area, antimicrobial resistance has grown 54.0% annually over the past 30 years, going from $14 in 1990 to $5.8 million in 2020. Figure C illustrates how important to the growth of malaria DAH major donors (the US, the UK, the Bill & Melinda Gates Foundation) have been since 1990. However, malaria DAH has plateaued since 2008, hovering around $2 to $2.5 billion since then.
Billi
ons o
f 202
0 US
dol
lars
0.5
1.0
1.5
2.5
2.0
0
1991
1992
1993
1994
1995
1996
1997
1998
1999
2000
2001
2002
2003
2004
2005
2006
2007
2008
2009
2010
2011
2012
2013
2014
2016
2015
1990
2017
2018
2019
*
2020
*UNICEF, UNFPA, UNAIDS, Unitaid, and PAHO
US foundations
NGOs and international foundations
World Bank
The Bill & Melinda Gates FoundationRegional development banks
WHO
CEPIGavi
The Global Fund
Other bilateral development agenciesAustralia
Canada
ChinaFrance
Germany
United Kingdom
United States

mALArIA prOFILE | 101
Billi
ons o
f 202
0 US
dol
lars
0.5
1.0
1.5
2.5
2.0
0
1991
1992
1993
1994
1995
1996
1997
1998
1999
2000
2001
2002
2003
2004
2005
2006
2007
2008
2009
2010
2011
2012
2013
2014
2016
2015
1990
2017
2018
2019
*
2020
*
OtherHuman resourcesHealth systems strengtheningAntimicrobial resistanceTreatmentDiagnosisCommunity outreachOther controlVector control including indoor residual sprayingBed nets
Billi
ons o
f 202
0 US
dol
lars
0.5
1.0
1.5
2.5
2.0
0
1991
1992
1993
1994
1995
1996
1997
1998
1999
2000
2001
2002
2003
2004
2005
2006
2007
2008
2009
2010
2011
2012
2013
2014
2016
2015
1990
2017
2018
2019
*
2020
*
Australia
Unidentified
Other sources
Debt repayments, IBRD
Other private philanthropy
Corporate donationsThe Bill & Melinda Gates Foundation
Other governments
ChinaCanada
JapanNetherlands
Norway
SpainFrance
Germany
United Kingdom
United States
FIgURE B Development assistance for malaria by program area, 1990–2020
FIgURE C Development assistance for malaria by source of funding, 1990–2020

102 | FINANCING GLOBAL HEALTH 2020
FIgURE A Development assistance for other infectious diseases by channel of assistance, 1990–2020
Other infectious diseasesFinancing Global Health’s other infectious diseases group refers to all infectious diseases other than HIV/AIDS, tuberculosis, malaria, and childhood diseases covered under our reproductive, maternal, and child health spending category. Note that the other infectious diseases group does include COVID-19, hence the substantial (+577.7%) rise in other infectious disease development assistance for health between 2019 and 2020.
Without taking COVID-19 into account, the burden this broad group of diseases causes has gone down over the past two decades – per the Global Burden of Disease study, in 2019, lower respiratory infections caused roughly 2.5 million deaths, down from 3.3 million in 1990. But where that burden is felt has not changed. In 1990, South Asia had the most other infectious disease burden, and sub-Saharan Africa the second-most; in 2020, the regions’ order was reversed, with sub-Saharan Africa experiencing the greatest other infec-tious disease burden.
Figure A shows other infectious diseases DAH by channel of assistance between 1990 and 2020, and Figure B shows other infectious diseases DAH received by program area for the same period. The enormous rise in other infectious
disease spending – the group went from a total of $2.3 billion in 2019 to $15.7 billion in 2020 – due to COVID-19 is immedi-ately apparent in Figure A. And Figure B illustrates the rise in DAH for Ebola in 2014 and its subsequent decline. The huge increase in other infectious disease spending driven by COVID-19 is again depicted in Figure C, which shows DAH by source of funding.
The overall jump in spending between 2019 and 2020 includes increases in the percentage of other infectious disease DAH by some sources. For example, in 2019, Japan was responsible for 3.9% of other infectious diseases DAH, while in 2020 it accounted for 15.1%. For additional context, 12.9% ($2.0 billion) of 2020 other infectious disease spending was unrelated to COVID-19, a decrease of 12.3% from the 2019 total.
Billi
ons o
f 202
0 US
dol
lars
4
2
6
8
16
10
14
12
0
1991
1992
1993
1994
1995
1996
1997
1998
1999
2000
2001
2002
2003
2004
2005
2006
2007
2008
2009
2010
2011
2012
2013
2014
2016
2015
1990
2017
2018
2019
*
2020
*UNICEF, UNFPA, UNAIDS, Unitaid, and PAHO
US foundations
NGOs and international foundations
World Bank
The Bill & Melinda Gates FoundationRegional development banks
WHO
CEPIGavi
The Global Fund
Other bilateral development agenciesAustralia
Canada
ChinaFrance
Germany
United Kingdom
United States

OTHEr INFECTIOus dIsEAsEs prOFILE | 103
Billi
ons o
f 202
0 US
dol
lars
4
2
6
8
16
10
14
12
0
1991
1992
1993
1994
1995
1996
1997
1998
1999
2000
2001
2002
2003
2004
2005
2006
2007
2008
2009
2010
2011
2012
2013
2014
2016
2015
1990
2017
2018
2019
*
2020
*
OtherHuman resourcesHealth systems strengtheningAntimicrobial resistanceZikaEbolaCOVID-19
Billi
ons o
f 202
0 US
dol
lars
4
2
6
8
16
10
14
12
0
1991
1992
1993
1994
1995
1996
1997
1998
1999
2000
2001
2002
2003
2004
2005
2006
2007
2008
2009
2010
2011
2012
2013
2014
2016
2015
1990
2017
2018
2019
*
2020
*
Australia
Unidentified
Other sources
Debt repayments, IBRD
Other private philanthropy
Corporate donationsThe Bill & Melinda Gates Foundation
Other governments
ChinaCanada
JapanNetherlands
Norway
SpainFrance
Germany
United Kingdom
United States
FIgURE B Development assistance for other infectious diseases by program area, 1990–2020
FIgURE C Development assistance for other infectious diseases by source of funding, 1990–2020
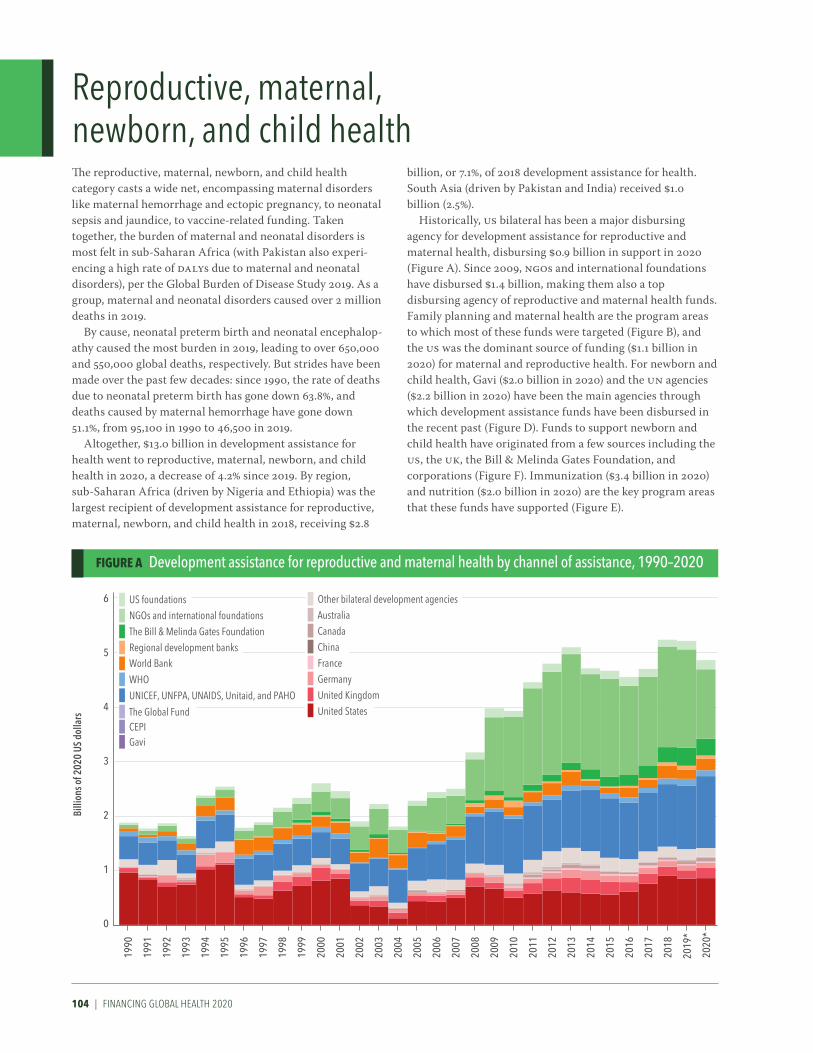
104 | FINANCING GLOBAL HEALTH 2020
FIgURE A Development assistance for reproductive and maternal health by channel of assistance, 1990–2020
Reproductive, maternal, newborn, and child healthThe reproductive, maternal, newborn, and child health category casts a wide net, encompassing maternal disorders like maternal hemorrhage and ectopic pregnancy, to neonatal sepsis and jaundice, to vaccine-related funding. Taken together, the burden of maternal and neonatal disorders is most felt in sub-Saharan Africa (with Pakistan also experi-encing a high rate of DALYs due to maternal and neonatal disorders), per the Global Burden of Disease Study 2019. As a group, maternal and neonatal disorders caused over 2 million deaths in 2019.
By cause, neonatal preterm birth and neonatal encephalop-athy caused the most burden in 2019, leading to over 650,000 and 550,000 global deaths, respectively. But strides have been made over the past few decades: since 1990, the rate of deaths due to neonatal preterm birth has gone down 63.8%, and deaths caused by maternal hemorrhage have gone down 51.1%, from 95,100 in 1990 to 46,500 in 2019.
Altogether, $13.0 billion in development assistance for health went to reproductive, maternal, newborn, and child health in 2020, a decrease of 4.2% since 2019. By region, sub-Saharan Africa (driven by Nigeria and Ethiopia) was the largest recipient of development assistance for reproductive, maternal, newborn, and child health in 2018, receiving $2.8
billion, or 7.1%, of 2018 development assistance for health. South Asia (driven by Pakistan and India) received $1.0 billion (2.5%).
Historically, US bilateral has been a major disbursing agency for development assistance for reproductive and maternal health, disbursing $0.9 billion in support in 2020 (Figure A). Since 2009, NGOs and international foundations have disbursed $1.4 billion, making them also a top disbursing agency of reproductive and maternal health funds. Family planning and maternal health are the program areas to which most of these funds were targeted (Figure B), and the US was the dominant source of funding ($1.1 billion in 2020) for maternal and reproductive health. For newborn and child health, Gavi ($2.0 billion in 2020) and the UN agencies ($2.2 billion in 2020) have been the main agencies through which development assistance funds have been disbursed in the recent past (Figure D). Funds to support newborn and child health have originated from a few sources including the US, the UK, the Bill & Melinda Gates Foundation, and corporations (Figure F). Immunization ($3.4 billion in 2020) and nutrition ($2.0 billion in 2020) are the key program areas that these funds have supported (Figure E).
Billi
ons o
f 202
0 US
dol
lars
1
6
2
5
4
3
0
1991
1992
1993
1994
1995
1996
1997
1998
1999
2000
2001
2002
2003
2004
2005
2006
2007
2008
2009
2010
2011
2012
2013
2014
2016
2015
1990
2017
2018
2019
*
2020
*UNICEF, UNFPA, UNAIDS, Unitaid, and PAHO
US foundations
NGOs and international foundations
World Bank
The Bill & Melinda Gates FoundationRegional development banks
WHO
CEPIGavi
The Global Fund
Other bilateral development agenciesAustralia
Canada
ChinaFrance
Germany
United Kingdom
United States
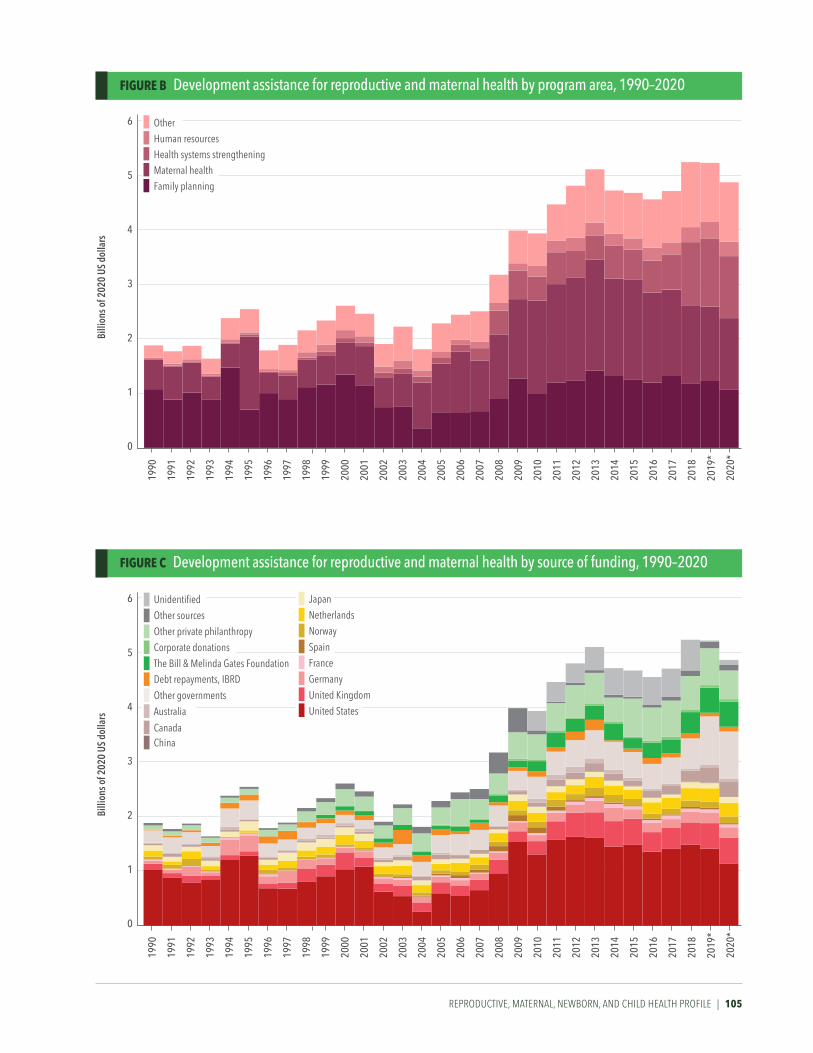
REPRODUCTIVE, MATERNAL, NEWBORN, AND CHILD HEALTH PROFILE | 105
FIgURE B Development assistance for reproductive and maternal health by program area, 1990–2020
FIgURE C Development assistance for reproductive and maternal health by source of funding, 1990–2020
Billi
ons o
f 202
0 US
dol
lars
1
6
2
5
4
3
0
1991
1992
1993
1994
1995
1996
1997
1998
1999
2000
2001
2002
2003
2004
2005
2006
2007
2008
2009
2010
2011
2012
2013
2014
2016
2015
1990
2017
2018
2019
*
2020
*
OtherHuman resourcesHealth systems strengtheningMaternal healthFamily planning
Billi
ons o
f 202
0 US
dol
lars
1
6
2
5
4
3
0
1991
1992
1993
1994
1995
1996
1997
1998
1999
2000
2001
2002
2003
2004
2005
2006
2007
2008
2009
2010
2011
2012
2013
2014
2016
2015
1990
2017
2018
2019
*
2020
*
Australia
Unidentified
Other sources
Debt repayments, IBRD
Other private philanthropy
Corporate donationsThe Bill & Melinda Gates Foundation
Other governments
ChinaCanada
JapanNetherlands
Norway
SpainFrance
Germany
United Kingdom
United States

106 | FINANCING GLOBAL HEALTH 2020
Billi
ons o
f 202
0 US
dol
lars
1
9
2
8
7
6
5
4
3
0
1991
1992
1993
1994
1995
1996
1997
1998
1999
2000
2001
2002
2003
2004
2005
2006
2007
2008
2009
2010
2011
2012
2013
2014
2016
2015
1990
2017
2018
2019
*
2020
*
OtherHuman resourcesHealth systems strengtheningImmunizationNutrition
Billi
ons o
f 202
0 US
dol
lars
1
9
2
8
7
6
5
4
3
0
1991
1992
1993
1994
1995
1996
1997
1998
1999
2000
2001
2002
2003
2004
2005
2006
2007
2008
2009
2010
2011
2012
2013
2014
2016
2015
1990
2017
2018
2019
*
2020
*
UNICEF, UNFPA, UNAIDS, Unitaid, and PAHO
US foundations
NGOs and international foundations
World Bank
The Bill & Melinda Gates FoundationRegional development banks
WHO
CEPIGavi
The Global Fund
Other bilateral development agenciesAustralia
Canada
ChinaFrance
Germany
United Kingdom
United States
FIgURE D Development assistance for newborn and child health by channel of assistance, 1990–2020
FIgURE E Development assistance for newborn and child health by program area, 1990–2020

REPRODUCTIVE, MATERNAL, NEWBORN, AND CHILD HEALTH PROFILE | 107
Billi
ons o
f 202
0 US
dol
lars
1
9
2
8
7
6
5
4
3
0
1991
1992
1993
1994
1995
1996
1997
1998
1999
2000
2001
2002
2003
2004
2005
2006
2007
2008
2009
2010
2011
2012
2013
2014
2016
2015
1990
2017
2018
2019
*
2020
*
Australia
Unidentified
Other sources
Debt repayments, IBRD
Other private philanthropy
Corporate donationsThe Bill & Melinda Gates Foundation
Other governments
ChinaCanada
JapanNetherlands
Norway
SpainFrance
Germany
United Kingdom
United States
FIgURE F Development assistance for newborn and child health by source of funding, 1990–2020

108 | FINANCING GLOBAL HEALTH 2020
FIgURE A Development assistance for non-communicable diseases by channel of assistance, 1990–2020
Non-communicable diseasesNon-communicable diseases are defined as conditions that are not transmissible from person to person; NCDs are chronic diseases, and behaviors like smoking and overuse of alcohol can increase the chance of developing one. NCDs include cardiovascular diseases, chronic respiratory diseases, and cancers.
As a group, NCDs were the leading cause of health loss globally in 2019, causing nearly three times as many deaths (more than 42 million) as communicable, maternal, neonatal, and nutritional diseases, plus injuries, combined. The leading types of NCDs include ischemic heart disease, stroke, and chronic obstructive pulmonary disease; NCD risk can be mitigated by modifying certain risk factors, like smoking.29 Globally, NCD burden is highest in many middle-income countries. For example, 31.5% of 2019 deaths in the Russian Federation were attributable to ischemic heart disease, and 18.3% to stroke. Moreover, the past 30 years have been marked by a shift away from communicable diseases (COVID-19 notwithstanding) and toward non-communicable dis-ease burden.
Meanwhile, while NCD-related development assistance for health has grown over the past 30 years, spending on NCDs
has not necessarily kept pace with the burden the group of conditions cause. A total of $887.0 million was directed toward NCD DAH in 2020, an increase of 4.7% from 2019. Between 1990 and 2020, total NCD DAH grew 1,560.6%, while overall DAH grew 574.0%. Meanwhile, as a portion of total DALYs, NCDs grew 20.7%. In 2019, NCDs caused 74.4% of global deaths (compared to communicable diseases and injuries), while in 1990 they caused 31.0% of global DALYs.
Figure A shows non-communicable disease DAH by channel of assistance between 1990 and 2020; WHO and NGOs remain the largest channels of non-communicable disease DAH. And Figure B shows non-communicable disease DAH received by program area in 2020. Excepting the “other” category, mental health and HSS were the top two NCD program areas by DAH received in 2020. By source, as shown in Figure C, private philanthropy (such as the Bloomberg Philanthropies) has grown as a source of non-communicable disease DAH.
Billi
ons o
f 202
0 US
dol
lars
0.2
0.4
1.0
0.6
0.8
0
1991
1992
1993
1994
1995
1996
1997
1998
1999
2000
2001
2002
2003
2004
2005
2006
2007
2008
2009
2010
2011
2012
2013
2014
2016
2015
1990
2017
2018
2019
*
2020
*UNICEF, UNFPA, UNAIDS, Unitaid, and PAHO
US foundations
NGOs and international foundations
World Bank
The Bill & Melinda Gates FoundationRegional development banks
WHO
CEPIGavi
The Global Fund
Other bilateral development agenciesAustralia
Canada
ChinaFrance
Germany
United Kingdom
United States

NON-COmmuNICABLE dIsEAsEs prOFILE | 109
Billi
ons o
f 202
0 US
dol
lars
0.2
0.4
1.0
0.6
0.8
0
1991
1992
1993
1994
1995
1996
1997
1998
1999
2000
2001
2002
2003
2004
2005
2006
2007
2008
2009
2010
2011
2012
2013
2014
2016
2015
1990
2017
2018
2019
*
2020
*
OtherHuman resourcesHealth systems strengtheningMental healthTobacco
Billi
ons o
f 202
0 US
dol
lars
0.2
0.4
1.0
0.6
0.8
0
1991
1992
1993
1994
1995
1996
1997
1998
1999
2000
2001
2002
2003
2004
2005
2006
2007
2008
2009
2010
2011
2012
2013
2014
2016
2015
1990
2017
2018
2019
*
2020
*
Australia
Unidentified
Other sources
Debt repayments, IBRD
Other private philanthropy
Corporate donationsThe Bill & Melinda Gates Foundation
Other governments
ChinaCanada
JapanNetherlands
Norway
SpainFrance
Germany
United Kingdom
United States
FIgURE B Development assistance for non-communicable diseases by program area, 1990–2020
FIgURE C Development assistance for non-communicable diseases by source of funding, 1990–2020

110 | FINANCING GLOBAL HEALTH 2020
rEFErENCEs | 111
References1. IHME | COVID-19 Projections.
Institute for Health Metrics and Evaluation. https://covid19.healthdata.org (accessed August 20, 2021).
2. World Economic Outlook, October 2020: A Long and Difficult Ascent. https://www.imf.org/en/Publications/WEO/Issues/2020/09/30/world-economic-outlook-octo-ber-2020.
3. Covid-19 Vaccine Tracker: Latest Updates - The New York Times. https://www.nytimes.com/interac-tive/2020/science/coronavirus-vaccine-tracker.html (accessed May 20 2021).
4. Equitable vaccine delivery plan needs more support to succeed: COVAX partners. UN News. 2021; published online March 2. https://news.un.org/en/story/2021/03/1086142.
5. Wu KJ. Coronavirus Reinfection Will Soon Become Our Reality. The Atlantic. 2021; published online Feb 24. https://www.theatlantic.com/science/archive/2021/02/coronavirus-reinfection/618128/.
6. Horby P, Bell I, Breuer J, et al. Update note on B.1.1.7 severity. Available from https://assets.publishing.service.gov.uk/government/uploads/system/uploads/attachment_data/file/982640/Feb_NERVTAG_update_note_on_B.1.1.7_severity.pdf.
7. Kirby T. New variant of SARS-CoV-2 in UK causes surge of COVID-19. Lancet Respir Med 2021; 9: e20–1.
8. COVID-19 variant in India may be evading vaccine protection, top WHO scientist says | The Japan Times. https://www.japantimes.co.jp/news/2021/05/09/asia-pacific/who-india-covid-variant/.
9. New Country Classifications by Income Level: 2019-2020. https://blogs.worldbank.org/opendata/new-country-classifications-in-come-level-2019-2020.
10. Fiscal Policies Database. IMF. https://www.imf.org/en/Topics/imf-and-covid19/Fiscal-Policies-Database- in-Response-to-COVID-19.
11. Indonesia | Data. https://data.worldbank.org/country/ID (accessed May 20, 2021).
12. Tan-Torres Edejer T, Hanssen O, Mirelman A, et al. Projected health-care resource needs for an effective response to COVID-19 in 73 low-in-come and middle-income countries: a modelling study. The Lancet Global Health 2020; 8: e1372–9.
13. Benin. Institute for Health Metrics and Evaluation. 2015; published online Sept 9. http://www.healthdata.org/benin (accessed May 20, 2021).
14. Bulgaria. Institute for Health Metrics and Evaluation. 2015; published online Sept 9. http://www.healthdata.org/bulgaria (accessed May 20, 2021).
15. Nigeria. Institute for Health Metrics and Evaluation. 2015; published online Sept 9. http://www.healthdata.org/nigeria (accessed May 20, 2021).
16. United States. Institute for Health Metrics and Evaluation. 2015; published online Sept 9. http://www.healthdata.org/united-states (accessed May 20, 2021).
17. Hogan, Daniel R., Gretchen A. Stevens, Ahmad Reza Hosseinpoor, and Ties Boerma. “Monitoring Universal Health Coverage within the Sustainable Development Goals: Development and Baseline Data for an Index of Essential Health Services.” The Lancet Global Health 6, no. 2 (February 1, 2018): e152–68. https://doi.org/10.1016/S2214-109X(17)30472-2.
18. Zeng W, Lannes L, Mutasa R. Utilization of Health Care and Burden of Out-of-Pocket Health Expenditure in Zimbabwe: Results from a National Household Survey. Health Syst Reform 2018; 4: 300–12.
19. Population Forecasting | IHME Viz Hub. http://vizhub.healthdata.org/population-forecast (accessed May 20 2021).
20. Britain’s aid cuts: what’s been announced so far. the Guardian. 2021; published online April 30. http://www.theguardian.com/global-develop-ment/2021/apr/30/britains-aid-cuts-whats-been-an-nounced-so-far.
21. Global Economic Prospects. World Bank. https://openknowledge.worldbank.org/handle/10986/34710.
22. Global Economic Prospects: Sub-Saharan Africa. World Bank. January 2021. Available from https://thedocs.worldbank.org/en/doc/641161599838775249-0050022020/original/GlobalEconomicProspectsJanuary2021 RegionalOverviewSSA.pdf.
23. Newby G, Mpanju-Shumbusho W, Feachem RGA. Global health security requires endemic disease eradication. The Lancet 2021; 397: 1163–5.
24. Address by Prime Minister SUGA at the Special Session of the United Nations General Assembly in response to the COVID-19 Pandemic. Ministry of Foreign Affairs of Japan. https://www.mofa.go.jp/ic/ghp/page1e_000292.html.
https://thedocs.worldbank.org/en/doc/641161599838775249-0050022020/original/GlobalEconomicProspectsJ
https://thedocs.worldbank.org/en/doc/641161599838775249-0050022020/original/GlobalEconomicProspectsJ
https://thedocs.worldbank.org/en/doc/641161599838775249-0050022020/original/GlobalEconomicProspectsJ
https://thedocs.worldbank.org/en/doc/641161599838775249-0050022020/original/GlobalEconomicProspectsJ
https://thedocs.worldbank.org/en/doc/641161599838775249-0050022020/original/GlobalEconomicProspectsJ
112 | FINANCING GLOBAL HEALTH 2020
25. Global Economic Prospects: Highlights from Chapter 1 the Global Outlook. World Bank. January 2021. Available from https://thedocs.worldbank.org/en/doc/930531599838746942-0050022020/original/GlobalEconomicProspectsJanuary2021 HighlightsChapter1.pdf.
26. Global HIV & AIDS statistics — Fact sheet. https://www.unaids.org/en/resources/fact-sheet (accessed May 20, 2021).
27. Global Tuberculosis Report 2019. World Health Organization. Available from https://www.who.int/tb/publications/factsheet_global.pdf?ua=1.
28. Malaria | MedlinePlus. https://medlineplus.gov/malaria.html.
29. Noncommunicable diseases. https://www.who.int/news-room/fact-sheets/detail/noncommunicable-diseases.
https://thedocs.worldbank.org/en/doc/930531599838746942-0050022020/original/GlobalEconomicProspectsJ
https://thedocs.worldbank.org/en/doc/930531599838746942-0050022020/original/GlobalEconomicProspectsJ
https://thedocs.worldbank.org/en/doc/930531599838746942-0050022020/original/GlobalEconomicProspectsJ
https://thedocs.worldbank.org/en/doc/930531599838746942-0050022020/original/GlobalEconomicProspectsJ


114 | FINANCING GLOBAL HEALTH 2020
mETHOds | 115
ANNEX 1
Methods
OverviewFinancing Global Health 2020 presents estimates based on the most reliable and up-to-date data available as of February 2021. Gathering data from spending accounts, budgets, and other estimates from a broad set of sources, we employed statistical models and accounting methods to produce our estimates. This section briefly outlines our processes. For more detailed information on the input data and methodology, please refer to our online Methods Annex, available at http://bit.ly/fgh2020report.
Additional information on methods can also be found in a paper pub-lished by the Global Burden of Disease Health Financing Collaborator Network in September 2021, “Tracking development assistance for health and for COVID-19: a review of development assistance, government, out-of-pocket, and other private spending on health for 204 countries and territories, 1990–2050” in The Lancet.
Development assistance for healthIHME collated and compiled financing data from the sources and chan-
nels discussed in this report. Our goal was to track disbursements through international development agencies that aimed to improve health in low- and middle-income countries from 1990 through 2020. Besides data from international databases such as the Organisation for Economic Co-operation and Development’s Credit Reporting System, we extracted and harmonized commitment and disbursement data from development project records, annual budgets, annual financial statements, and revenue statements from a broad set of development agencies, including multilateral and bilateral aid agencies, public-private partnerships, NGOs, and private foundations.
Furthermore, for several channels, correspondence directly with agencies led to improved understanding of the data or to the acquisition of more granular, more reliable, or more timely data. Some organizations were not able to report on disbursements for the previous year because agencies’ accounting processes can be lengthy. We therefore relied on budgets, revenues, commitments, and appropriations, as well as macroeconomic data to estimate disbursements for organizations without up-to-date spending information, and these were used to model the most recent year’s disbursements. This method led to the development of “preliminary estimates” of DAH by source, channel, and health focus area for 2019 and 2020. We do not report DAH estimates by recipient for 2019 and 2020 because preliminary estimates were not made by recipient.
Global health agencies frequently transfer funds among themselves. Since these funding flows are often reported by both the entity from which funds

116 | FINANCING GLOBAL HEALTH 2020
originate and the recipient agency, double-counting is common in the data. Including disbursements from both agencies would lead to an overestima-tion of disbursements. To prevent double-counting, we used revenue data to assess the source of all funds and remove resources that were passed between development agencies before being disbursed. For our accounting, the source of the funds is where the funds originated, while the channel is the last channel that we track to disburse the resources. Because each data source provides different categories and different information about what focus areas were targeted by their disbursements, project-specific sector and theme codes and keyword searches of project titles and descriptions were used to classify funding. DAH channeled through the Joint United Nations Programme on HIV/AIDS (UNAIDS) was considered funding for COVID, HIV/AIDS, and tuberculosis. DAH channeled through UNICEF was considered funding for reproductive, maternal, newborn, and child health, HIV/AIDS, and Ebola. For projects that span two or more health focus areas, funding was divided according to weights based on the number of keywords associated with each health focus area. DAH estimates were converted into 2020 US dollars.
We developed a separate methodology for estimating development assistance for health for COVID-19 because much of the project-level data used as input for the historical development assistance for health estimates (described above) do not extend through 2020 and therefore do not include resources disbursed in response to COVID-19. We extracted project data on commitments and disbursements from a diverse set of databases, including the UNOCHA Financial Tracking Service and the International Aid Transparency Initiative. For other development channels, we obtained information about COVID-19 commitments and disbursements through correspondence or from their respective online databases. We determined whether projects were new grants or previous grants repurposed to COVID-19 projects based on the information available from the data source and used keywords search and manual review to determine COVID-19 program areas.
Domestic health spending and total health spendingTo estimate total health spending and health spending by source, we
extracted and adjusted health spending data from the World Health Organization Global Health Expenditure Database. Extracted data included transfers from government domestic revenue (allocated to health purposes), social insurance contributions, compulsory prepayment, voluntary prepay-ment, other domestic revenue from households, corporations, and nonprofit institutions serving the household, and GDP. We extracted spending estimates in current local currency and converted them into 2020 US dollars. We used a spatiotemporal Gaussian process regression model (ST-GPR) to estimate health spending across time, country, and spending category.
Additionally, we developed a method to prioritize data from the Global Health Expenditure Database that had the most credible sources and with the best documentation for our ST-GPR modeling in order to prevent data with unclear sources or imputation methods from influencing our ST-GPR

mETHOds | 117
estimation. Our method evaluated and assigned a weight based on the information describing the source and methods used to estimate data points in the Global Health Expenditure Database. Weights were based upon metadata completeness, documented source information, and documented methods for estimation. While we included all available data in the ST-GPR model, data with the most reputable sources and most complete documentation influenced the model the most. We aggregated DAH measured in 2020 US dollars, government health spending, prepaid private health spending, and out-of-pocket health spending to estimate total health spending.
Future health spendingOur forecasted estimates include GDP, general government spending
(across all sectors); government, out-of-pocket, and prepaid private health spending; and total DAH provided and received from 2019 to 2030 and 2050. We used ensemble models to estimate per-person GDP, government spending, DAH, and government, out-of-pocket, and prepaid private health spending through 205o.

118 | FINANCING GLOBAL HEALTH 2020
TABuLATEd dATA | 119
ANNEX 2
Tabulated data
TaBle B1 Total health spending by World Bank income group and Global Burden of Disease super-region, 2018 ....................................................................................................................................................... 120
TaBle B2 Development assistance for health by source of funding, 1990–2020 .............................................................. 121
TaBle B3 Development assistance for health by health focus area and program area, 1990–2020 .............................122
TaBle B4 Total health spending by World Bank income group, Global Burden of Disease super-region, and country, 2019 and 2050, and development assistance for health specific to COVID-19 and health systems strengthening, 2020 .................................................................................................................124

120 | FINANCING GLOBAL HEALTH 2020
TaBle B1 Development assistance for health by World Bank income group and global Burden of Disease super-region, 1990–2018
Source: Financing Global Health Database 2020
All figures in millions of 2020 US dollars.
1990 1995 2000 2005 2010 2015 2018
WorlD BaNK iNCoMe grouP
High-income 119.28 156.17 54.36 160.82 118.00 41.98 68.22
Upper-middle-income 1,049.54 1,863.96 2,342.71 3,103.02 5,117.36 2,862.99 2,869.54
Lower-middle-income 2,481.06 2,480.12 3,364.28 5,702.93 8,715.82 9,161.59 9,693.77
Low-income 991.15 948.14 1,247.62 2,740.47 5,426.07 6,853.12 6,708.67
Unallocable by income group 3,493.30 5,459.43 6,082.99 10,315.83 15,910.05 18,366.35 19,785.52
ToTal 8,134.32 10,907.83 13,091.96 22,023.08 35,287.30 37,286.04 39,125.71
gBD SuPer-regioN
Central Europe, Eastern Europe, and Central Asia 12.30 187.80 316.00 526.77 726.93 440.28 694.87
Latin America and Caribbean 619.08 1,272.48 1,465.40 1,454.83 2,504.70 1,893.49 1,258.84
North Africa and Middle East 202.94 406.38 373.85 1,258.58 1,176.27 806.73 1,050.73
South Asia 779.84 774.22 1,091.72 1,333.77 1,844.27 1,857.81 1,749.99
Southeast Asia, East Asia, and Oceania 846.10 908.44 1,034.91 1,346.12 1,816.09 1,527.80 1,623.07
Sub-Saharan Africa 1,612.00 1,369.64 2,054.62 4,588.72 8,643.45 10,046.56 10,371.95
Administrative expenses 1,155.52 1,223.68 1,299.89 2,624.39 4,911.05 4,879.43 5,312.71
Unallocable by region 2,526.16 3,343.94 4,368.66 7,025.31 10,724.93 12,286.26 12,190.39
Global 380.40 1,421.25 1,086.92 1,864.60 2,939.61 3,547.68 4,873.16
ToTal 8,134.32 10,907.83 13,091.96 22,023.08 35,287.30 37,286.04 39,125.71

TaBle B2 Development assistance for health by source of funding, 1990–2020
Source: Financing Global Health Database 2020
*2020 estimates are preliminary.
This table disaggregates development assistance for health by primary funding source.
All figures are in millions of 2020 US dollars.
Funding source 1990 1995 2000 2005 2010 2015 2020*
NaTioNal TreaSurieS
Australia 66.13 172.97 320.89 326.74 650.12 460.11 606.49
Austria 52.33 38.46 61.82 127.09 118.52 70.70 116.54
Belgium 155.94 141.92 144.61 414.14 360.09 291.62 275.74
Canada 175.50 239.80 170.81 737.37 913.12 1,060.48 1,580.21
China 82.75 101.13 145.04 221.97 449.57 594.93 853.20
Denmark 131.23 159.95 199.44 291.93 466.62 236.75 375.02
Finland 179.31 47.83 62.85 128.90 195.39 135.38 127.43
France 854.63 623.65 207.23 786.81 1,009.67 965.13 1,291.32
Germany 292.64 805.74 388.40 729.57 1,217.28 1,430.51 3,371.34
Greece 2.20 10.39 12.83 55.37 21.77 13.56 14.45
Ireland 4.74 31.77 53.44 203.50 196.41 138.92 171.20
Italy 299.72 196.58 192.76 485.30 331.39 370.23 542.56
Japan 652.15 1,006.94 844.71 876.79 1,103.08 1,034.23 3,673.96
Luxembourg 2.83 20.31 44.91 57.76 95.54 72.77 120.49
Netherlands 274.25 327.04 596.83 662.24 791.52 662.68 910.87
New Zealand 2.24 62.45 9.47 35.00 49.97 34.44 72.25
Norway 143.64 140.04 158.41 615.89 840.55 749.16 724.32
Portugal 2.46 15.54 18.45 31.00 37.10 39.46 26.27
South Korea 1.41 36.37 103.24 133.35 213.10 278.60 378.87
Spain 21.93 215.64 221.31 326.06 685.32 128.31 287.04
Sweden 545.21 263.04 166.61 727.36 856.51 590.39 718.78
Switzerland 126.03 82.72 81.21 112.83 159.56 264.56 376.34
United Kingdom 304.39 472.69 1,539.58 1,544.81 2,432.65 3,740.79 4,278.79
United States 2,194.74 2,969.20 3,032.09 5,788.59 11,427.62 11,252.77 13,560.82
Other governments 148.72 271.59 169.70 160.99 303.81 727.91 2,749.83
PriVaTe PHilaNTHroPY
The Bill & Melinda Gates Foundation 0 0 441.31 886.16 2,049.52 2,802.16 4,584.06
Corporate donations 62.55 127.51 169.06 579.48 674.57 886.97 850.97
Other private philanthropy excluding the Bill & Melinda Gates Foundation
573.41 847.56 1,535.98 2,436.55 3,822.01 4,543.47 4,375.98
oTHer
Debt repayments 168.12 843.33 1,192.20 1,204.44 2,404.72 1,186.28 3,143.63
Other 532.40 545.97 751.25 1,334.96 1,054.37 2,015.04 4,361.91
Unallocable 80.72 89.72 55.51 0.13 355.81 507.73 307.64
ToTal 8,134.32 10,907.83 13,091.96 22,023.08 35,287.30 37,286.04 54,828.32
TABuLATEd dATA | 121
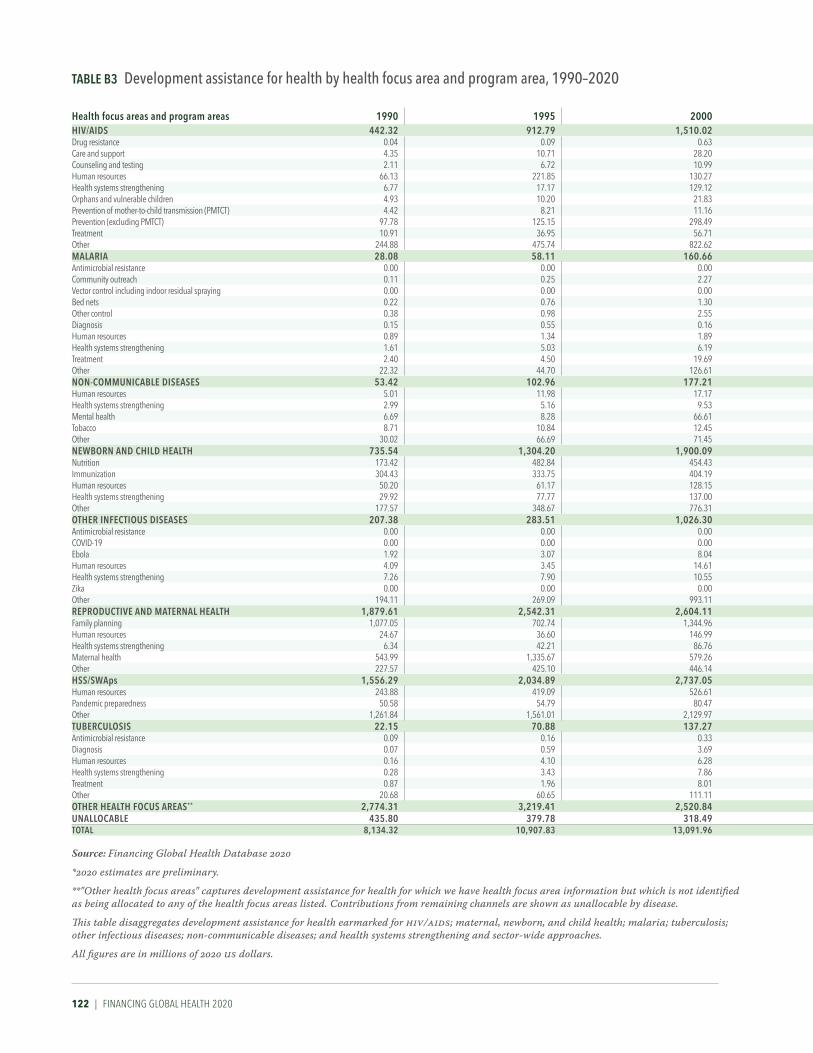
122 | FINANCING GLOBAL HEALTH 2020
TaBle B3 Development assistance for health by health focus area and program area, 1990–2020
Source: Financing Global Health Database 2020
*2020 estimates are preliminary.
**"Other health focus areas" captures development assistance for health for which we have health focus area information but which is not identified as being allocated to any of the health focus areas listed. Contributions from remaining channels are shown as unallocable by disease.
This table disaggregates development assistance for health earmarked for HIV/AIDS; maternal, newborn, and child health; malaria; tuberculosis; other infectious diseases; non-communicable diseases; and health systems strengthening and sector-wide approaches.
All figures are in millions of 2020 US dollars.
Health focus areas and program areas 1990 1995 2000 2005 2010 2015 2020*
HiV/aiDS 442.32 912.79 1,510.02 5,595.79 11,445.99 8,551.95 8,974.48Drug resistance 0.04 0.09 0.63 0.33 20.39 5.06 3.57Care and support 4.35 10.71 28.20 253.34 769.77 691.64 630.84Counseling and testing 2.11 6.72 10.99 174.81 429.81 362.06 552.71Human resources 66.13 221.85 130.27 319.21 809.75 498.66 379.36Health systems strengthening 6.77 17.17 129.12 776.73 2,296.81 1,421.24 1,010.04Orphans and vulnerable children 4.93 10.20 21.83 145.63 564.80 417.41 512.48Prevention of mother-to-child transmission (PMTCT) 4.42 8.21 11.16 148.10 474.55 442.91 288.10Prevention (excluding PMTCT) 97.78 125.15 298.49 966.74 2,003.16 1,429.72 1,380.96Treatment 10.91 36.95 56.71 815.54 2,427.66 2,294.87 2,806.52Other 244.88 475.74 822.62 1,995.37 1,649.29 988.38 1,409.89Malaria 28.08 58.11 160.66 728.55 2,066.27 1,805.84 2,270.11Antimicrobial resistance 0.00 0.00 0.00 0.31 7.31 0.94 5.83Community outreach 0.11 0.25 2.27 14.88 96.77 72.29 92.54Vector control including indoor residual spraying 0.00 0.00 0.00 11.38 73.17 133.52 136.65Bed nets 0.22 0.76 1.30 35.84 140.35 103.91 156.64Other control 0.38 0.98 2.55 37.36 215.55 89.42 165.40Diagnosis 0.15 0.55 0.16 9.10 53.43 77.89 87.25Human resources 0.89 1.34 1.89 29.22 120.62 117.17 146.58Health systems strengthening 1.61 5.03 6.19 67.36 345.32 264.51 420.55Treatment 2.40 4.50 19.69 165.22 391.42 336.50 398.07Other 22.32 44.70 126.61 357.87 622.33 609.70 660.59NoN-CoMMuNiCaBle DiSeaSeS 53.42 102.96 177.21 167.98 441.99 588.62 887.04Human resources 5.01 11.98 17.17 51.41 107.39 66.09 76.43Health systems strengthening 2.99 5.16 9.53 27.09 17.26 50.02 83.86Mental health 6.69 8.28 66.61 27.58 41.32 95.54 157.20Tobacco 8.71 10.84 12.45 14.69 62.22 88.02 75.98Other 30.02 66.69 71.45 47.22 213.81 288.95 493.57NeWBorN aND CHilD HealTH 735.54 1,304.20 1,900.09 3,194.54 4,822.04 8,196.72 8,133.72Nutrition 173.42 482.84 454.43 713.06 1,312.84 2,000.73 2,022.20Immunization 304.43 333.75 404.19 1,356.09 1,552.14 2,916.08 3,431.95Human resources 50.20 61.17 128.15 172.80 388.05 430.10 333.32Health systems strengthening 29.92 77.77 137.00 187.58 342.74 655.44 1,062.84Other 177.57 348.67 776.31 765.01 1,226.27 2,194.37 1,283.40oTHer iNFeCTiouS DiSeaSeS 207.38 283.51 1,026.30 828.46 1,421.69 3,563.11 15,702.13Antimicrobial resistance 0.00 0.00 0.00 0.02 1.31 1.81 19.86COVID-19 0.00 0.00 0.00 0.00 0.00 0.00 13,669.32Ebola 1.92 3.07 8.04 6.50 2.21 1,528.42 50.07Human resources 4.09 3.45 14.61 38.99 63.45 157.80 103.22Health systems strengthening 7.26 7.90 10.55 19.26 80.83 128.60 182.55Zika 0.00 0.00 0.00 0.00 0.00 0.00 32.12Other 194.11 269.09 993.11 763.69 1,273.89 1,746.48 1,644.99reProDuCTiVe aND MaTerNal HealTH 1,879.61 2,542.31 2,604.11 2,282.73 3,930.86 4,672.82 4,867.41Family planning 1,077.05 702.74 1,344.96 652.92 987.55 1,246.06 1,064.16Human resources 24.67 36.60 146.99 97.75 205.64 205.91 266.21Health systems strengthening 6.34 42.21 86.76 114.91 439.25 555.14 1,135.73Maternal health 543.99 1,335.67 579.26 892.40 1,711.57 1,832.26 1,313.39Other 227.57 425.10 446.14 524.75 586.85 833.45 1,087.92HSS/SWaps 1,556.29 2,034.89 2,737.05 3,694.09 5,441.08 4,176.09 5,451.71Human resources 243.88 419.09 526.61 647.58 1,105.17 1,440.75 1,109.71Pandemic preparedness 50.58 54.79 80.47 79.73 221.03 344.37 811.11Other 1,261.84 1,561.01 2,129.97 2,966.78 4,114.87 2,390.97 3,530.89TuBerCuloSiS 22.15 70.88 137.27 522.89 1,425.32 1,280.19 1,526.17Antimicrobial resistance 0.09 0.16 0.33 9.45 43.94 63.77 52.25Diagnosis 0.07 0.59 3.69 7.32 53.56 42.61 34.53Human resources 0.16 4.10 6.28 44.16 195.12 147.18 172.54Health systems strengthening 0.28 3.43 7.86 51.63 161.93 186.86 182.75Treatment 0.87 1.96 8.01 45.01 179.79 192.19 226.15Other 20.68 60.65 111.11 365.32 790.98 647.57 857.96oTHer HealTH FoCuS areaS** 2,774.31 3,219.41 2,520.84 4,882.39 4,134.31 4,450.68 7,015.56uNalloCaBle 435.80 379.78 318.49 126.47 161.00 0.00 0.00ToTal 8,134.32 10,907.83 13,091.96 22,023.08 35,287.30 37,286.04 54,828.32
TABuLATEd dATA | 123

124 | FINANCING GLOBAL HEALTH 2020
Health spending per person, 2019 and 2050 (2020 uS dollars)
Health spending per person, 2019 and 2050 (2020 purchasing power parity-adjusted dollars)
Total health spending per gross domestic product, 2019 and 2050
CoViD-19 development assistance received for health per person
(2020 uS dollars)
Development assistance for health systems strengthening per person
(2020 uS dollars)
2019 2050 2019 2050 2019 2050 2020 2020
gloBal
ToTal 1,129 (1,116 to 1,140) 1,515 (1,444 to 1,587) 1,482 (1,467 to 1,498) 2,050 (1,969 to 2,131) 9.9% (9.8 to 10.0) 12.9% (11.4 to 14.2) 1.75 0.70
WorlD BaNK iNCoMe grouP
High-income 5,702 (5,638 to 5,769) 8,536 (8,074 to 9,032) 6,288 (6,226 to 6,356) 9,322 (8,871 to 9,812) 12.6% (12.5 to 12.8) 17.6% (15.5 to 19.9) 0.00 0.00
Upper-middle-income 500 (484 to 517) 1,001 (922 to 1,083) 984 (959 to 1,011) 1,915 (1,783 to 2,051) 5.7% (5.5 to 5.9) 8.3% (6.4 to 10.3) 0.80 0.03
Lower-middle-income 90 (86 to 95) 150 (141 to 159) 281 (267 to 297) 461 (433 to 493) 4.1% (3.9 to 4.3) 4.6% (3.8 to 5.4) 1.62 0.08
Low-income 36 (35 to 37) 46 (44 to 47) 124 (121 to 129) 151 (145 to 158) 5.0% (4.7 to 5.3) 4.6% (4.1 to 5.2) 2.80 0.05
gBD SuPer-regioN
Central Europe, Eastern Europe, and Central Asia 571 (560 to 580) 656 (628 to 684) 1,426 (1,398 to 1,453) 1,635 (1,564 to 1,708) 6.0% (5.9 to 6.1) 7.0% (6.0 to 7.9) 1.15 0.16
GBD high-income 6,282 (6,211 to 6,356) 9,302 (8,791 to 9,852) 6,773 (6,701 to 6,848) 9,949 (9,436 to 10,500) 13.1% (12.9 to 13.3) 18.1% (15.8 to 20.5) 0.22 0.00
Latin America and Caribbean 514 (497 to 530) 762 (710 to 824) 1,163 (1,125 to 1,200) 1,734 (1,615 to 1,873) 7.4% (7.2 to 7.6) 10.3% (8.7 to 12.0) 0.80 0.11
North Africa and Middle East 378 (370 to 386) 469 (444 to 498) 945 (926 to 967) 1,225 (1,154 to 1,296) 5.8% (5.6 to 6.0) 8.6% (7.5 to 9.7) 2.02 0.00
South Asia 69 (62 to 77) 134 (119 to 150) 229 (207 to 255) 447 (397 to 502) 3.4% (3.1 to 3.8) 4.1% (2.9 to 5.6) 1.18 0.05
Southeast Asia, East Asia, and Oceania 439 (419 to 459) 1,025 (915 to 1,138) 766 (735 to 800) 1,784 (1,606 to 1,966) 5.1% (4.8 to 5.3) 7.7% (5.6 to 10.3) 0.91 0.05
Sub-Saharan Africa 76 (74 to 79) 99 (94 to 106) 193 (187 to 199) 253 (240 to 268) 5.0% (4.8 to 5.2) 5.0% (4.4 to 5.7) 2.40 0.06
CouNTrY
Albania (UM)* 293 (270 to 317) 355 (319 to 396) 816 (753 to 884) 990 (888 to 1,103) 5.5% (5.1 to 6.0) 6.0% (4.1 to 8.3) 1.99 0.00
Armenia (UM) 436 (409 to 462) 531 (495 to 568) 1,387 (1,301 to 1,472) 1,689 (1,576 to 1,807) 9.6% (8.6 to 10.6) 10.0% (6.7 to 13.9) 4.16 3.31
Azerbaijan (UM) 157 (140 to 174) 185 (161 to 211) 550 (492 to 612) 648 (567 to 741) 3.6% (3.2 to 4.0) 4.1% (2.8 to 6.0) 0.88 0.00
Belarus (UM) 361 (334 to 387) 459 (364 to 576) 1,163 (1,075 to 1,248) 1,480 (1,174 to 1,858) 5.7% (5.3 to 6.1) 6.6% (4.3 to 10.0) 1.37 0.00
Bosnia and Herzegovina (UM) 548 (517 to 582) 951 (872 to 1,038) 1,416 (1,336 to 1,503) 2,457 (2,253 to 2,682) 9.0% (8.4 to 9.5) 12.2% (8.3 to 17.4) 7.75 0.00
Bulgaria (UM) 785 (745 to 826) 991 (847 to 1,162) 1,896 (1,799 to 1,997) 2,396 (2,047 to 2,808) 7.7% (7.3 to 8.2) 8.9% (6.0 to 12.7) 0.05 0.00
Croatia (H) 1,024 (964 to 1,082) 1,299 (1,040 to 1,619) 2,020 (1,901 to 2,134) 2,563 (2,052 to 3,193) 6.7% (6.3 to 7.1) 8.4% (5.5 to 12.3) 0 0
Czech Republic (H) 1,851 (1,789 to 1,911) 2,547 (2,244 to 2,869) 3,296 (3,186 to 3,402) 4,536 (3,996 to 5,109) 7.6% (7.1 to 8.3) 9.9% (6.8 to 13.6) 0 0
Estonia (H) 1,628 (1,586 to 1,669) 2,211 (1,973 to 2,456) 2,623 (2,555 to 2,689) 3,561 (3,179 to 3,956) 6.8% (6.6 to 7.0) 8.2% (5.7 to 11.4) 0 0
Georgia (UM) 330 (311 to 350) 516 (456 to 585) 1,133 (1,067 to 1,201) 1,773 (1,568 to 2,009) 7.4% (6.8 to 8.1) 10.5% (7.4 to 14.4) 8.37 0.00
Hungary (H) 1,100 (1,068 to 1,133) 1,296 (1,197 to 1,405) 2,321 (2,253 to 2,390) 2,734 (2,526 to 2,964) 6.7% (6.5 to 6.9) 7.2% (5.3 to 9.5) 0 0
Kazakhstan (UM) 282 (258 to 308) 403 (331 to 484) 855 (782 to 934) 1,219 (1,002 to 1,465) 3.1% (2.8 to 3.4) 3.8% (2.6 to 5.4) 6.15 0.00
Kyrgyzstan (LM) 83 (79 to 88) 108 (98 to 121) 350 (333 to 369) 455 (412 to 510) 6.3% (6.0 to 6.7) 7.7% (5.7 to 10.2) 2.21 0.00
Latvia (H) 1,132 (1,094 to 1,170) 1,384 (1,259 to 1,517) 2,008 (1,941 to 2,075) 2,456 (2,233 to 2,693) 6.2% (6.0 to 6.4) 7.1% (4.9 to 9.7) 0 0
Lithuania (H) 1,321 (1,277 to 1,364) 1,649 (1,519 to 1,786) 2,562 (2,477 to 2,646) 3,198 (2,947 to 3,465) 6.6% (6.3 to 6.9) 7.3% (4.9 to 10.3) 0 0
Moldova (LM) 215 (198 to 232) 252 (225 to 285) 667 (616 to 720) 783 (698 to 884) 5.8% (4.3 to 8.3) 7.1% (4.4 to 11.5) 3.59 0.00
Mongolia (LM) 203 (187 to 222) 293 (254 to 345) 623 (575 to 683) 900 (781 to 1,059) 4.8% (4.4 to 5.3) 5.9% (4.0 to 8.3) 24.65 9.45
Montenegro (UM) 732 (689 to 780) 814 (745 to 892) 1,840 (1,733 to 1,960) 2,047 (1,873 to 2,242) 8.1% (7.7 to 8.7) 9.0% (6.4 to 12.0) 10.05 0.00
North Macedonia (UM) 412 (396 to 429) 412 (378 to 449) 1,137 (1,092 to 1,183) 1,136 (1,042 to 1,239) 6.5% (6.0 to 7.0) 6.7% (5.1 to 8.7) 5.27 0.00
Poland (H) 1,023 (999 to 1,048) 1,461 (1,338 to 1,599) 2,256 (2,202 to 2,310) 3,221 (2,949 to 3,525) 6.4% (6.3 to 6.6) 8.7% (6.0 to 12.3) 0 0
Romania (H) 773 (733 to 815) 1,038 (861 to 1,228) 1,819 (1,723 to 1,917) 2,440 (2,025 to 2,888) 5.8% (5.4 to 6.1) 6.7% (4.4 to 9.6) 0 0
Russia (UM) 563 (537 to 586) 611 (554 to 676) 1,546 (1,475 to 1,610) 1,679 (1,522 to 1,858) 5.4% (5.1 to 5.6) 6.2% (4.4 to 8.5) 0.00 0.00
Serbia (UM) 518 (505 to 533) 637 (598 to 677) 1,302 (1,268 to 1,339) 1,600 (1,504 to 1,700) 6.8% (6.6 to 7.0) 7.4% (5.4 to 9.7) 2.58 0.00
Slovakia (H) 1,375 (1,317 to 1,435) 1,813 (1,637 to 2,046) 2,373 (2,272 to 2,475) 3,128 (2,824 to 3,530) 6.9% (6.6 to 7.2) 8.6% (5.9 to 11.6) 0 0
Slovenia (H) 2,248 (2,186 to 2,314) 2,691 (2,511 to 2,883) 3,456 (3,360 to 3,558) 4,137 (3,860 to 4,432) 8.4% (8.1 to 8.6) 10.5% (7.4 to 14.5) 0 0
Tajikistan (L) 59 (56 to 61) 68 (62 to 77) 251 (240 to 262) 292 (264 to 329) 7.0% (6.4 to 7.6) 7.7% (5.4 to 10.8) 3.50 0.00
TaBle B4 Total health spending by World Bank income group, global Burden of Disease super-region, and country, 2019 and 2050, and development assistance for health specific to COVID-19 and health systems strengthening, 2020

Health spending per person, 2019 and 2050 (2020 uS dollars)
Health spending per person, 2019 and 2050 (2020 purchasing power parity-adjusted dollars)
Total health spending per gross domestic product, 2019 and 2050
CoViD-19 development assistance received for health per person
(2020 uS dollars)
Development assistance for health systems strengthening per person
(2020 uS dollars)
2019 2050 2019 2050 2019 2050 2020 2020
gloBal
ToTal 1,129 (1,116 to 1,140) 1,515 (1,444 to 1,587) 1,482 (1,467 to 1,498) 2,050 (1,969 to 2,131) 9.9% (9.8 to 10.0) 12.9% (11.4 to 14.2) 1.75 0.70
WorlD BaNK iNCoMe grouP
High-income 5,702 (5,638 to 5,769) 8,536 (8,074 to 9,032) 6,288 (6,226 to 6,356) 9,322 (8,871 to 9,812) 12.6% (12.5 to 12.8) 17.6% (15.5 to 19.9) 0.00 0.00
Upper-middle-income 500 (484 to 517) 1,001 (922 to 1,083) 984 (959 to 1,011) 1,915 (1,783 to 2,051) 5.7% (5.5 to 5.9) 8.3% (6.4 to 10.3) 0.80 0.03
Lower-middle-income 90 (86 to 95) 150 (141 to 159) 281 (267 to 297) 461 (433 to 493) 4.1% (3.9 to 4.3) 4.6% (3.8 to 5.4) 1.62 0.08
Low-income 36 (35 to 37) 46 (44 to 47) 124 (121 to 129) 151 (145 to 158) 5.0% (4.7 to 5.3) 4.6% (4.1 to 5.2) 2.80 0.05
gBD SuPer-regioN
Central Europe, Eastern Europe, and Central Asia 571 (560 to 580) 656 (628 to 684) 1,426 (1,398 to 1,453) 1,635 (1,564 to 1,708) 6.0% (5.9 to 6.1) 7.0% (6.0 to 7.9) 1.15 0.16
GBD high-income 6,282 (6,211 to 6,356) 9,302 (8,791 to 9,852) 6,773 (6,701 to 6,848) 9,949 (9,436 to 10,500) 13.1% (12.9 to 13.3) 18.1% (15.8 to 20.5) 0.22 0.00
Latin America and Caribbean 514 (497 to 530) 762 (710 to 824) 1,163 (1,125 to 1,200) 1,734 (1,615 to 1,873) 7.4% (7.2 to 7.6) 10.3% (8.7 to 12.0) 0.80 0.11
North Africa and Middle East 378 (370 to 386) 469 (444 to 498) 945 (926 to 967) 1,225 (1,154 to 1,296) 5.8% (5.6 to 6.0) 8.6% (7.5 to 9.7) 2.02 0.00
South Asia 69 (62 to 77) 134 (119 to 150) 229 (207 to 255) 447 (397 to 502) 3.4% (3.1 to 3.8) 4.1% (2.9 to 5.6) 1.18 0.05
Southeast Asia, East Asia, and Oceania 439 (419 to 459) 1,025 (915 to 1,138) 766 (735 to 800) 1,784 (1,606 to 1,966) 5.1% (4.8 to 5.3) 7.7% (5.6 to 10.3) 0.91 0.05
Sub-Saharan Africa 76 (74 to 79) 99 (94 to 106) 193 (187 to 199) 253 (240 to 268) 5.0% (4.8 to 5.2) 5.0% (4.4 to 5.7) 2.40 0.06
CouNTrY
Albania (UM)* 293 (270 to 317) 355 (319 to 396) 816 (753 to 884) 990 (888 to 1,103) 5.5% (5.1 to 6.0) 6.0% (4.1 to 8.3) 1.99 0.00
Armenia (UM) 436 (409 to 462) 531 (495 to 568) 1,387 (1,301 to 1,472) 1,689 (1,576 to 1,807) 9.6% (8.6 to 10.6) 10.0% (6.7 to 13.9) 4.16 3.31
Azerbaijan (UM) 157 (140 to 174) 185 (161 to 211) 550 (492 to 612) 648 (567 to 741) 3.6% (3.2 to 4.0) 4.1% (2.8 to 6.0) 0.88 0.00
Belarus (UM) 361 (334 to 387) 459 (364 to 576) 1,163 (1,075 to 1,248) 1,480 (1,174 to 1,858) 5.7% (5.3 to 6.1) 6.6% (4.3 to 10.0) 1.37 0.00
Bosnia and Herzegovina (UM) 548 (517 to 582) 951 (872 to 1,038) 1,416 (1,336 to 1,503) 2,457 (2,253 to 2,682) 9.0% (8.4 to 9.5) 12.2% (8.3 to 17.4) 7.75 0.00
Bulgaria (UM) 785 (745 to 826) 991 (847 to 1,162) 1,896 (1,799 to 1,997) 2,396 (2,047 to 2,808) 7.7% (7.3 to 8.2) 8.9% (6.0 to 12.7) 0.05 0.00
Croatia (H) 1,024 (964 to 1,082) 1,299 (1,040 to 1,619) 2,020 (1,901 to 2,134) 2,563 (2,052 to 3,193) 6.7% (6.3 to 7.1) 8.4% (5.5 to 12.3) 0 0
Czech Republic (H) 1,851 (1,789 to 1,911) 2,547 (2,244 to 2,869) 3,296 (3,186 to 3,402) 4,536 (3,996 to 5,109) 7.6% (7.1 to 8.3) 9.9% (6.8 to 13.6) 0 0
Estonia (H) 1,628 (1,586 to 1,669) 2,211 (1,973 to 2,456) 2,623 (2,555 to 2,689) 3,561 (3,179 to 3,956) 6.8% (6.6 to 7.0) 8.2% (5.7 to 11.4) 0 0
Georgia (UM) 330 (311 to 350) 516 (456 to 585) 1,133 (1,067 to 1,201) 1,773 (1,568 to 2,009) 7.4% (6.8 to 8.1) 10.5% (7.4 to 14.4) 8.37 0.00
Hungary (H) 1,100 (1,068 to 1,133) 1,296 (1,197 to 1,405) 2,321 (2,253 to 2,390) 2,734 (2,526 to 2,964) 6.7% (6.5 to 6.9) 7.2% (5.3 to 9.5) 0 0
Kazakhstan (UM) 282 (258 to 308) 403 (331 to 484) 855 (782 to 934) 1,219 (1,002 to 1,465) 3.1% (2.8 to 3.4) 3.8% (2.6 to 5.4) 6.15 0.00
Kyrgyzstan (LM) 83 (79 to 88) 108 (98 to 121) 350 (333 to 369) 455 (412 to 510) 6.3% (6.0 to 6.7) 7.7% (5.7 to 10.2) 2.21 0.00
Latvia (H) 1,132 (1,094 to 1,170) 1,384 (1,259 to 1,517) 2,008 (1,941 to 2,075) 2,456 (2,233 to 2,693) 6.2% (6.0 to 6.4) 7.1% (4.9 to 9.7) 0 0
Lithuania (H) 1,321 (1,277 to 1,364) 1,649 (1,519 to 1,786) 2,562 (2,477 to 2,646) 3,198 (2,947 to 3,465) 6.6% (6.3 to 6.9) 7.3% (4.9 to 10.3) 0 0
Moldova (LM) 215 (198 to 232) 252 (225 to 285) 667 (616 to 720) 783 (698 to 884) 5.8% (4.3 to 8.3) 7.1% (4.4 to 11.5) 3.59 0.00
Mongolia (LM) 203 (187 to 222) 293 (254 to 345) 623 (575 to 683) 900 (781 to 1,059) 4.8% (4.4 to 5.3) 5.9% (4.0 to 8.3) 24.65 9.45
Montenegro (UM) 732 (689 to 780) 814 (745 to 892) 1,840 (1,733 to 1,960) 2,047 (1,873 to 2,242) 8.1% (7.7 to 8.7) 9.0% (6.4 to 12.0) 10.05 0.00
North Macedonia (UM) 412 (396 to 429) 412 (378 to 449) 1,137 (1,092 to 1,183) 1,136 (1,042 to 1,239) 6.5% (6.0 to 7.0) 6.7% (5.1 to 8.7) 5.27 0.00
Poland (H) 1,023 (999 to 1,048) 1,461 (1,338 to 1,599) 2,256 (2,202 to 2,310) 3,221 (2,949 to 3,525) 6.4% (6.3 to 6.6) 8.7% (6.0 to 12.3) 0 0
Romania (H) 773 (733 to 815) 1,038 (861 to 1,228) 1,819 (1,723 to 1,917) 2,440 (2,025 to 2,888) 5.8% (5.4 to 6.1) 6.7% (4.4 to 9.6) 0 0
Russia (UM) 563 (537 to 586) 611 (554 to 676) 1,546 (1,475 to 1,610) 1,679 (1,522 to 1,858) 5.4% (5.1 to 5.6) 6.2% (4.4 to 8.5) 0.00 0.00
Serbia (UM) 518 (505 to 533) 637 (598 to 677) 1,302 (1,268 to 1,339) 1,600 (1,504 to 1,700) 6.8% (6.6 to 7.0) 7.4% (5.4 to 9.7) 2.58 0.00
Slovakia (H) 1,375 (1,317 to 1,435) 1,813 (1,637 to 2,046) 2,373 (2,272 to 2,475) 3,128 (2,824 to 3,530) 6.9% (6.6 to 7.2) 8.6% (5.9 to 11.6) 0 0
Slovenia (H) 2,248 (2,186 to 2,314) 2,691 (2,511 to 2,883) 3,456 (3,360 to 3,558) 4,137 (3,860 to 4,432) 8.4% (8.1 to 8.6) 10.5% (7.4 to 14.5) 0 0
Tajikistan (L) 59 (56 to 61) 68 (62 to 77) 251 (240 to 262) 292 (264 to 329) 7.0% (6.4 to 7.6) 7.7% (5.4 to 10.8) 3.50 0.00
TABuLATEd dATA | 125

126 | FINANCING GLOBAL HEALTH 2020
Health spending per person, 2019 and 2050 (2020 uS dollars)
Health spending per person, 2019 and 2050 (2020 purchasing power parity-adjusted dollars)
Total health spending per gross domestic product, 2019 and 2050
CoViD-19 development assistance received for health per person
(2020 uS dollars)
Development assistance for health systems strengthening per person
(2020 uS dollars)
2019 2050 2019 2050 2019 2050 2020 2020
Turkmenistan (UM) 603 (559 to 648) 745 (680 to 814) 1,247 (1,157 to 1,340) 1,543 (1,406 to 1,685) 7.7% (7.1 to 8.4) 8.6% (6.0 to 12.0) 1.46 0.00
Ukraine (LM) 258 (242 to 274) 259 (233 to 288) 957 (899 to 1,015) 962 (865 to 1,067) 7.4% (6.7 to 8.1) 8.4% (6.1 to 11.2) 1.05 0.00
Uzbekistan (LM) 93 (85 to 102) 128 (112 to 145) 391 (356 to 427) 537 (469 to 606) 5.3% (4.8 to 5.8) 5.9% (4.1 to 8.4) 0.87 0.73
gBD HigH-iNCoMe
Andorra (H) 2,948 (2,827 to 3,079) 2,957 (2,538 to 3,587) 3,141 (3,012 to 3,280) 3,150 (2,704 to 3,822) 6.7% (5.9 to 7.8) 9.7% (6.6 to 13.9) 0 0
Argentina (UM) 946 (905 to 988) 1,239 (1,086 to 1,428) 2,285 (2,186 to 2,387) 2,993 (2,624 to 3,449) 9.7% (9.3 to 10.2) 13.0% (8.8 to 18.1) 5.32 0.00
Australia (H) 5,507 (5,409 to 5,608) 7,818 (7,303 to 8,402) 5,398 (5,302 to 5,498) 7,663 (7,159 to 8,236) 10.3% (9.8 to 11.1) 13.6% (9.4 to 18.6) 0 0
Austria (H) 5,383 (5,302 to 5,463) 6,766 (6,253 to 7,294) 6,132 (6,039 to 6,222) 7,707 (7,123 to 8,308) 10.3% (10.1 to 10.5) 12.8% (8.8 to 17.3) 0 0
Belgium (H) 4,983 (4,887 to 5,083) 6,490 (6,019 to 6,960) 5,698 (5,588 to 5,813) 7,421 (6,882 to 7,958) 10.4% (10.2 to 10.7) 12.7% (9.5 to 16.6) 0 0
Brunei (H) 544 (501 to 592) 490 (374 to 620) 1,454 (1,339 to 1,583) 1,310 (1,001 to 1,659) 2.3% (2.1 to 2.5) 2.5% (1.6 to 3.6) 0 0
Canada (H) 5,163 (5,104 to 5,218) 7,077 (6,531 to 7,661) 5,837 (5,770 to 5,899) 8,000 (7,383 to 8,661) 11.2% (11.0 to 11.4) 15.1% (10.8 to 20.4) 0 0
Chile (H) 1,329 (1,304 to 1,353) 2,025 (1,885 to 2,184) 2,472 (2,426 to 2,516) 3,765 (3,505 to 4,062) 9.7% (9.5 to 9.9) 14.0% (10.1 to 19.5) 0 0
Cyprus (H) 1,262 (1,212 to 1,313) 1,582 (1,443 to 1,743) 1,881 (1,806 to 1,957) 2,358 (2,150 to 2,598) 5.0% (4.0 to 6.6) 6.2% (4.3 to 9.3) 0 0
Denmark (H) 6,182 (6,035 to 6,340) 8,095 (7,433 to 8,849) 6,112 (5,967 to 6,269) 8,004 (7,350 to 8,750) 10.0% (9.7 to 10.3) 12.2% (9.2 to 15.8) 0 0
Finland (H) 4,595 (4,504 to 4,690) 5,642 (5,261 to 6,023) 4,680 (4,587 to 4,776) 5,745 (5,358 to 6,134) 9.1% (8.9 to 9.3) 9.9% (7.3 to 13.1) 0 0
France (H) 4,844 (4,792 to 4,891) 6,245 (5,714 to 6,811) 5,605 (5,545 to 5,659) 7,226 (6,612 to 7,881) 11.4% (11.0 to 11.7) 14.1% (10.8 to 18.0) 0 0
Germany (H) 5,498 (5,428 to 5,570) 7,518 (6,986 to 7,987) 6,482 (6,399 to 6,567) 8,863 (8,236 to 9,416) 11.4% (11.2 to 11.5) 14.6% (10.4 to 19.5) 0 0
Greece (H) 1,595 (1,515 to 1,677) 1,620 (1,470 to 1,785) 2,551 (2,422 to 2,682) 2,591 (2,351 to 2,854) 8.0% (7.6 to 8.4) 9.2% (7.1 to 11.7) 0 0
Greenland (H) 6,579 (5,966 to 7,194) 7,651 (6,719 to 8,606) 5,381 (4,879 to 5,884) 6,258 (5,495 to 7,038) 11.5% (10.1 to 13.0) 12.9% (8.8 to 18.2) 0 0
Iceland (H) 5,486 (5,256 to 5,722) 6,931 (6,189 to 7,676) 5,226 (5,007 to 5,451) 6,603 (5,896 to 7,313) 8.6% (8.0 to 9.2) 10.3% (7.4 to 13.8) 0 0
Ireland (H) 5,673 (5,413 to 5,932) 8,456 (7,758 to 9,225) 6,362 (6,071 to 6,653) 9,484 (8,700 to 10,345) 6.8% (6.5 to 7.1) 9.1% (6.6 to 11.8) 0 0
Israel (H) 3,246 (3,184 to 3,307) 4,174 (3,854 to 4,522) 3,056 (2,997 to 3,114) 3,930 (3,629 to 4,257) 7.1% (6.6 to 7.4) 8.1% (5.7 to 11.1) 0 0
Italy (H) 2,995 (2,931 to 3,061) 3,160 (2,924 to 3,424) 3,916 (3,833 to 4,003) 4,132 (3,823 to 4,478) 8.7% (8.6 to 8.9) 10.6% (8.1 to 13.6) 0 0
Japan (H) 4,489 (4,372 to 4,622) 6,150 (5,583 to 6,734) 4,787 (4,662 to 4,929) 6,558 (5,953 to 7,180) 10.9% (10.6 to 11.3) 14.4% (10.0 to 20.0) 0 0
Luxembourg (H) 6,246 (5,877 to 6,655) 6,893 (6,019 to 7,849) 6,436 (6,055 to 6,856) 7,102 (6,202 to 8,087) 5.3% (5.0 to 5.6) 6.7% (4.9 to 8.9) 0 0
Malta (H) 3,174 (3,081 to 3,268) 4,837 (4,486 to 5,211) 4,803 (4,663 to 4,946) 7,320 (6,788 to 7,886) 9.7% (8.6 to 10.6) 10.9% (7.4 to 15.5) 0 0
Monaco (H) 3,560 (3,346 to 3,779) 4,719 (4,118 to 5,446) 3,479 (3,270 to 3,693) 4,612 (4,025 to 5,322) 1.7% (1.5 to 2.1) 2.0% (1.4 to 2.9) 0 0
Netherlands (H) 5,586 (5,449 to 5,735) 7,722 (6,885 to 8,669) 6,217 (6,065 to 6,382) 8,594 (7,662 to 9,648) 10.3% (10.0 to 10.6) 13.6% (9.5 to 18.7) 0 0
New Zealand (H) 4,175 (4,081 to 4,269) 6,012 (5,553 to 6,508) 4,434 (4,334 to 4,534) 6,386 (5,898 to 6,912) 9.9% (9.4 to 10.2) 13.2% (9.4 to 17.6) 0 0
Norway (H) 7,352 (7,176 to 7,537) 8,329 (7,576 to 9,223) 7,013 (6,845 to 7,189) 7,945 (7,227 to 8,798) 10.4% (10.2 to 10.7) 12.6% (10.1 to 15.6) 0 0
Portugal (H) 2,187 (2,117 to 2,260) 2,389 (2,141 to 2,685) 3,350 (3,243 to 3,462) 3,659 (3,281 to 4,113) 9.1% (8.8 to 9.4) 10.6% (8.2 to 13.6) 0 0
San Marino (H) 3,393 (3,249 to 3,540) 3,944 (3,644 to 4,282) 4,612 (4,417 to 4,812) 5,361 (4,953 to 5,821) 7.2% (6.9 to 7.5) 8.5% (6.6 to 11.1) 0 0
Singapore (H) 2,843 (2,719 to 2,966) 5,002 (4,033 to 6,083) 4,645 (4,443 to 4,847) 8,173 (6,590 to 9,940) 4.5% (4.3 to 4.8) 7.2% (4.6 to 10.6) 0 0
South Korea (H) 2,442 (2,395 to 2,487) 4,957 (4,470 to 5,478) 3,529 (3,461 to 3,594) 7,165 (6,461 to 7,917) 7.8% (7.6 to 7.9) 14.1% (9.7 to 20.2) 0 0
Spain (H) 2,801 (2,731 to 2,868) 3,313 (3,063 to 3,708) 3,985 (3,884 to 4,079) 4,712 (4,357 to 5,274) 9.1% (8.9 to 9.4) 12.3% (9.5 to 15.8) 0 0
Sweden (H) 5,898 (5,692 to 6,117) 8,016 (7,268 to 8,874) 6,149 (5,933 to 6,376) 8,356 (7,577 to 9,250) 10.8% (10.4 to 11.3) 12.9% (9.1 to 17.6) 0 0
Switzerland (H) 10,203 (10,057 to 10,351) 14,239 (12,827 to 15,690) 8,521 (8,398 to 8,644) 11,891 (10,712 to 13,103) 11.6% (11.1 to 11.9) 17.0% (11.9 to 23.5) 0 0
UK (H) 4,392 (4,329 to 4,457) 5,279 (4,863 to 5,702) 4,960 (4,888 to 5,033) 5,962 (5,492 to 6,439) 10.1% (9.9 to 10.3) 12.3% (9.9 to 14.9) 0 0
US (H) 11,345 (11,114 to 11,578) 17,300 (15,680 to 18,976) 11,345 (11,114 to 11,578) 17,300 (15,680 to 18,976) 17.2% (16.8 to 17.5) 24.8% (19.0 to 32.5) 0 0
Uruguay (H) 1,549 (1,516 to 1,585) 2,268 (2,009 to 2,572) 2,156 (2,110 to 2,205) 3,157 (2,796 to 3,580) 9.5% (9.2 to 9.8) 11.9% (8.2 to 16.8) 0 0
TaBle B4, CoNT. Total health spending by World Bank income group, global Burden of Disease super-region, and country, 2019 and 2050, and development assistance for health specific to COVID-19 and health systems strengthening, 2020
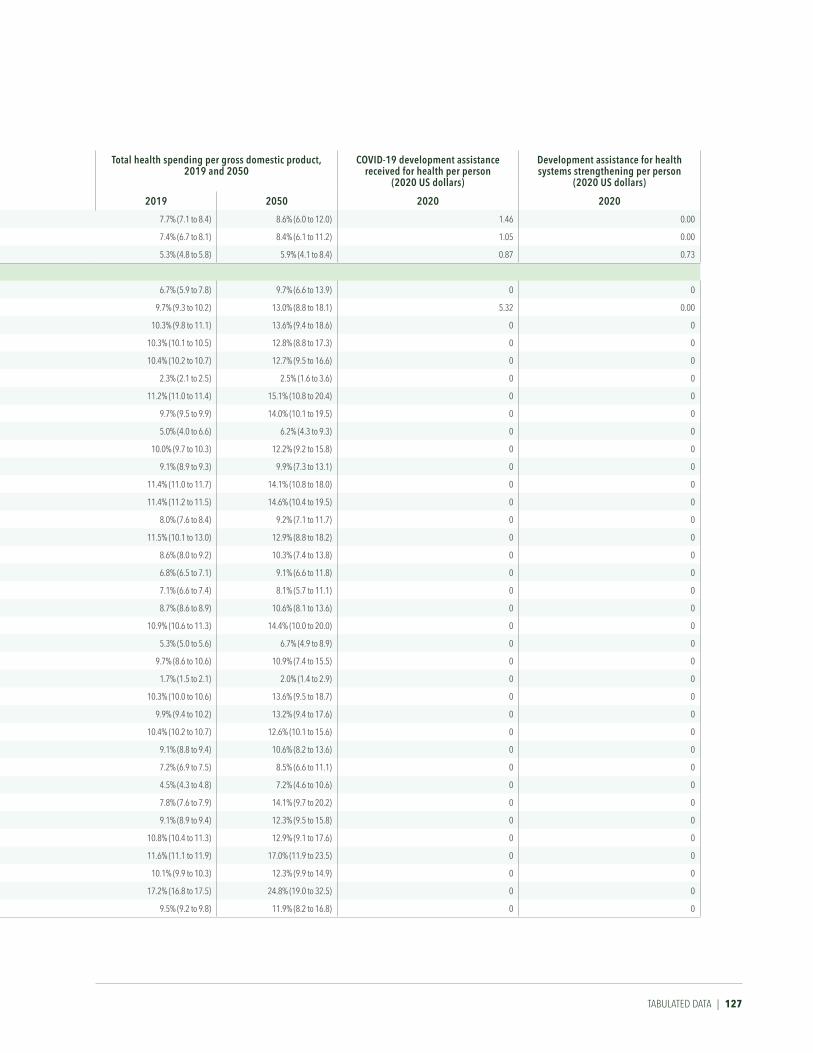
Health spending per person, 2019 and 2050 (2020 uS dollars)
Health spending per person, 2019 and 2050 (2020 purchasing power parity-adjusted dollars)
Total health spending per gross domestic product, 2019 and 2050
CoViD-19 development assistance received for health per person
(2020 uS dollars)
Development assistance for health systems strengthening per person
(2020 uS dollars)
2019 2050 2019 2050 2019 2050 2020 2020
Turkmenistan (UM) 603 (559 to 648) 745 (680 to 814) 1,247 (1,157 to 1,340) 1,543 (1,406 to 1,685) 7.7% (7.1 to 8.4) 8.6% (6.0 to 12.0) 1.46 0.00
Ukraine (LM) 258 (242 to 274) 259 (233 to 288) 957 (899 to 1,015) 962 (865 to 1,067) 7.4% (6.7 to 8.1) 8.4% (6.1 to 11.2) 1.05 0.00
Uzbekistan (LM) 93 (85 to 102) 128 (112 to 145) 391 (356 to 427) 537 (469 to 606) 5.3% (4.8 to 5.8) 5.9% (4.1 to 8.4) 0.87 0.73
gBD HigH-iNCoMe
Andorra (H) 2,948 (2,827 to 3,079) 2,957 (2,538 to 3,587) 3,141 (3,012 to 3,280) 3,150 (2,704 to 3,822) 6.7% (5.9 to 7.8) 9.7% (6.6 to 13.9) 0 0
Argentina (UM) 946 (905 to 988) 1,239 (1,086 to 1,428) 2,285 (2,186 to 2,387) 2,993 (2,624 to 3,449) 9.7% (9.3 to 10.2) 13.0% (8.8 to 18.1) 5.32 0.00
Australia (H) 5,507 (5,409 to 5,608) 7,818 (7,303 to 8,402) 5,398 (5,302 to 5,498) 7,663 (7,159 to 8,236) 10.3% (9.8 to 11.1) 13.6% (9.4 to 18.6) 0 0
Austria (H) 5,383 (5,302 to 5,463) 6,766 (6,253 to 7,294) 6,132 (6,039 to 6,222) 7,707 (7,123 to 8,308) 10.3% (10.1 to 10.5) 12.8% (8.8 to 17.3) 0 0
Belgium (H) 4,983 (4,887 to 5,083) 6,490 (6,019 to 6,960) 5,698 (5,588 to 5,813) 7,421 (6,882 to 7,958) 10.4% (10.2 to 10.7) 12.7% (9.5 to 16.6) 0 0
Brunei (H) 544 (501 to 592) 490 (374 to 620) 1,454 (1,339 to 1,583) 1,310 (1,001 to 1,659) 2.3% (2.1 to 2.5) 2.5% (1.6 to 3.6) 0 0
Canada (H) 5,163 (5,104 to 5,218) 7,077 (6,531 to 7,661) 5,837 (5,770 to 5,899) 8,000 (7,383 to 8,661) 11.2% (11.0 to 11.4) 15.1% (10.8 to 20.4) 0 0
Chile (H) 1,329 (1,304 to 1,353) 2,025 (1,885 to 2,184) 2,472 (2,426 to 2,516) 3,765 (3,505 to 4,062) 9.7% (9.5 to 9.9) 14.0% (10.1 to 19.5) 0 0
Cyprus (H) 1,262 (1,212 to 1,313) 1,582 (1,443 to 1,743) 1,881 (1,806 to 1,957) 2,358 (2,150 to 2,598) 5.0% (4.0 to 6.6) 6.2% (4.3 to 9.3) 0 0
Denmark (H) 6,182 (6,035 to 6,340) 8,095 (7,433 to 8,849) 6,112 (5,967 to 6,269) 8,004 (7,350 to 8,750) 10.0% (9.7 to 10.3) 12.2% (9.2 to 15.8) 0 0
Finland (H) 4,595 (4,504 to 4,690) 5,642 (5,261 to 6,023) 4,680 (4,587 to 4,776) 5,745 (5,358 to 6,134) 9.1% (8.9 to 9.3) 9.9% (7.3 to 13.1) 0 0
France (H) 4,844 (4,792 to 4,891) 6,245 (5,714 to 6,811) 5,605 (5,545 to 5,659) 7,226 (6,612 to 7,881) 11.4% (11.0 to 11.7) 14.1% (10.8 to 18.0) 0 0
Germany (H) 5,498 (5,428 to 5,570) 7,518 (6,986 to 7,987) 6,482 (6,399 to 6,567) 8,863 (8,236 to 9,416) 11.4% (11.2 to 11.5) 14.6% (10.4 to 19.5) 0 0
Greece (H) 1,595 (1,515 to 1,677) 1,620 (1,470 to 1,785) 2,551 (2,422 to 2,682) 2,591 (2,351 to 2,854) 8.0% (7.6 to 8.4) 9.2% (7.1 to 11.7) 0 0
Greenland (H) 6,579 (5,966 to 7,194) 7,651 (6,719 to 8,606) 5,381 (4,879 to 5,884) 6,258 (5,495 to 7,038) 11.5% (10.1 to 13.0) 12.9% (8.8 to 18.2) 0 0
Iceland (H) 5,486 (5,256 to 5,722) 6,931 (6,189 to 7,676) 5,226 (5,007 to 5,451) 6,603 (5,896 to 7,313) 8.6% (8.0 to 9.2) 10.3% (7.4 to 13.8) 0 0
Ireland (H) 5,673 (5,413 to 5,932) 8,456 (7,758 to 9,225) 6,362 (6,071 to 6,653) 9,484 (8,700 to 10,345) 6.8% (6.5 to 7.1) 9.1% (6.6 to 11.8) 0 0
Israel (H) 3,246 (3,184 to 3,307) 4,174 (3,854 to 4,522) 3,056 (2,997 to 3,114) 3,930 (3,629 to 4,257) 7.1% (6.6 to 7.4) 8.1% (5.7 to 11.1) 0 0
Italy (H) 2,995 (2,931 to 3,061) 3,160 (2,924 to 3,424) 3,916 (3,833 to 4,003) 4,132 (3,823 to 4,478) 8.7% (8.6 to 8.9) 10.6% (8.1 to 13.6) 0 0
Japan (H) 4,489 (4,372 to 4,622) 6,150 (5,583 to 6,734) 4,787 (4,662 to 4,929) 6,558 (5,953 to 7,180) 10.9% (10.6 to 11.3) 14.4% (10.0 to 20.0) 0 0
Luxembourg (H) 6,246 (5,877 to 6,655) 6,893 (6,019 to 7,849) 6,436 (6,055 to 6,856) 7,102 (6,202 to 8,087) 5.3% (5.0 to 5.6) 6.7% (4.9 to 8.9) 0 0
Malta (H) 3,174 (3,081 to 3,268) 4,837 (4,486 to 5,211) 4,803 (4,663 to 4,946) 7,320 (6,788 to 7,886) 9.7% (8.6 to 10.6) 10.9% (7.4 to 15.5) 0 0
Monaco (H) 3,560 (3,346 to 3,779) 4,719 (4,118 to 5,446) 3,479 (3,270 to 3,693) 4,612 (4,025 to 5,322) 1.7% (1.5 to 2.1) 2.0% (1.4 to 2.9) 0 0
Netherlands (H) 5,586 (5,449 to 5,735) 7,722 (6,885 to 8,669) 6,217 (6,065 to 6,382) 8,594 (7,662 to 9,648) 10.3% (10.0 to 10.6) 13.6% (9.5 to 18.7) 0 0
New Zealand (H) 4,175 (4,081 to 4,269) 6,012 (5,553 to 6,508) 4,434 (4,334 to 4,534) 6,386 (5,898 to 6,912) 9.9% (9.4 to 10.2) 13.2% (9.4 to 17.6) 0 0
Norway (H) 7,352 (7,176 to 7,537) 8,329 (7,576 to 9,223) 7,013 (6,845 to 7,189) 7,945 (7,227 to 8,798) 10.4% (10.2 to 10.7) 12.6% (10.1 to 15.6) 0 0
Portugal (H) 2,187 (2,117 to 2,260) 2,389 (2,141 to 2,685) 3,350 (3,243 to 3,462) 3,659 (3,281 to 4,113) 9.1% (8.8 to 9.4) 10.6% (8.2 to 13.6) 0 0
San Marino (H) 3,393 (3,249 to 3,540) 3,944 (3,644 to 4,282) 4,612 (4,417 to 4,812) 5,361 (4,953 to 5,821) 7.2% (6.9 to 7.5) 8.5% (6.6 to 11.1) 0 0
Singapore (H) 2,843 (2,719 to 2,966) 5,002 (4,033 to 6,083) 4,645 (4,443 to 4,847) 8,173 (6,590 to 9,940) 4.5% (4.3 to 4.8) 7.2% (4.6 to 10.6) 0 0
South Korea (H) 2,442 (2,395 to 2,487) 4,957 (4,470 to 5,478) 3,529 (3,461 to 3,594) 7,165 (6,461 to 7,917) 7.8% (7.6 to 7.9) 14.1% (9.7 to 20.2) 0 0
Spain (H) 2,801 (2,731 to 2,868) 3,313 (3,063 to 3,708) 3,985 (3,884 to 4,079) 4,712 (4,357 to 5,274) 9.1% (8.9 to 9.4) 12.3% (9.5 to 15.8) 0 0
Sweden (H) 5,898 (5,692 to 6,117) 8,016 (7,268 to 8,874) 6,149 (5,933 to 6,376) 8,356 (7,577 to 9,250) 10.8% (10.4 to 11.3) 12.9% (9.1 to 17.6) 0 0
Switzerland (H) 10,203 (10,057 to 10,351) 14,239 (12,827 to 15,690) 8,521 (8,398 to 8,644) 11,891 (10,712 to 13,103) 11.6% (11.1 to 11.9) 17.0% (11.9 to 23.5) 0 0
UK (H) 4,392 (4,329 to 4,457) 5,279 (4,863 to 5,702) 4,960 (4,888 to 5,033) 5,962 (5,492 to 6,439) 10.1% (9.9 to 10.3) 12.3% (9.9 to 14.9) 0 0
US (H) 11,345 (11,114 to 11,578) 17,300 (15,680 to 18,976) 11,345 (11,114 to 11,578) 17,300 (15,680 to 18,976) 17.2% (16.8 to 17.5) 24.8% (19.0 to 32.5) 0 0
Uruguay (H) 1,549 (1,516 to 1,585) 2,268 (2,009 to 2,572) 2,156 (2,110 to 2,205) 3,157 (2,796 to 3,580) 9.5% (9.2 to 9.8) 11.9% (8.2 to 16.8) 0 0
TABuLATEd dATA | 127

128 | FINANCING GLOBAL HEALTH 2020
Health spending per person, 2019 and 2050 (2020 uS dollars)
Health spending per person, 2019 and 2050 (2020 purchasing power parity-adjusted dollars)
Total health spending per gross domestic product, 2019 and 2050
CoViD-19 development assistance received for health per person
(2020 uS dollars)
Development assistance for health systems strengthening per person
(2020 uS dollars)
2019 2050 2019 2050 2019 2050 2020 2020
laTiN aMeriCa aND CariBBeaN
Antigua and Barbuda (H) 972 (925 to 1,024) 1,381 (1,160 to 1,608) 1,281 (1,219 to 1,349) 1,820 (1,528 to 2,119) 5.6% (5.3 to 5.9) 7.9% (5.8 to 10.7) 0 0
Barbados (H) 1,126 (1,074 to 1,182) 1,104 (1,023 to 1,205) 1,020 (973 to 1,071) 1,000 (927 to 1,091) 6.2% (5.9 to 6.5) 6.4% (5.0 to 8.4) 0 0
Belize (UM) 283 (258 to 309) 450 (346 to 551) 431 (394 to 471) 686 (527 to 841) 6.0% (5.4 to 6.6) 8.1% (5.6 to 11.7) 1.72 0.00
Bermuda (H) 8,049 (7,007 to 9,277) 10,721 (8,170 to 13,824) 5,686 (4,950 to 6,553) 7,574 (5,771 to 9,765) 6.7% (5.0 to 9.2) 12.1% (7.6 to 18.3) 0 0
Bolivia (LM) 233 (213 to 254) 336 (299 to 378) 585 (536 to 639) 845 (752 to 949) 6.4% (5.8 to 7.0) 8.5% (5.9 to 12.1) 0.69 0.00
Brazil (UM) 639 (598 to 682) 1,099 (950 to 1,266) 1,443 (1,350 to 1,540) 2,480 (2,144 to 2,858) 9.3% (8.7 to 9.9) 14.8% (10.1 to 21.0) 0.08 0.25
Colombia (UM) 447 (429 to 468) 810 (714 to 917) 1,214 (1,165 to 1,270) 2,198 (1,939 to 2,490) 7.8% (7.5 to 8.2) 12.7% (8.8 to 17.9) 1.42 0.00
Costa Rica (UM) 1,083 (1,061 to 1,105) 1,682 (1,530 to 1,869) 1,798 (1,762 to 1,835) 2,792 (2,541 to 3,104) 8.7% (8.6 to 8.9) 13.0% (9.3 to 17.7) 1.02 0.00
Cuba (UM) 1,170 (1,090 to 1,255) 1,745 (1,549 to 1,936) 2,863 (2,667 to 3,071) 4,268 (3,790 to 4,735) 13.1% (11.7 to 14.7) 20.3% (14.1 to 28.4) 0.76 0.00
Dominica (UM) 431 (403 to 460) 466 (391 to 550) 676 (632 to 722) 731 (613 to 863) 5.1% (4.8 to 5.5) 5.1% (3.8 to 6.6) 0.06 0.00
Dominican Republic (UM) 446 (416 to 476) 715 (600 to 847) 1,124 (1,048 to 1,200) 1,804 (1,514 to 2,137) 5.7% (5.3 to 6.2) 7.6% (5.1 to 10.9) 0.75 0.00
Ecuador (UM) 483 (455 to 512) 684 (600 to 771) 963 (907 to 1,022) 1,366 (1,198 to 1,540) 8.0% (7.5 to 8.5) 11.0% (7.6 to 15.4) 9.41 0.00
El Salvador (LM) 322 (299 to 347) 508 (452 to 572) 707 (657 to 764) 1,116 (994 to 1,258) 7.7% (7.1 to 8.3) 10.9% (8.2 to 14.1) 1.20 0.00
Grenada (UM) 515 (483 to 551) 650 (560 to 766) 863 (808 to 923) 1,088 (937 to 1,283) 4.7% (4.4 to 5.1) 5.1% (3.6 to 6.9) 2.82 0.00
Guatemala (UM) 308 (291 to 326) 461 (420 to 501) 601 (567 to 636) 899 (820 to 977) 6.9% (6.3 to 7.4) 8.4% (6.5 to 10.7) 0.88 0.00
Guyana (UM) 323 (301 to 346) 542 (422 to 692) 648 (604 to 694) 1,087 (847 to 1,390) 4.4% (3.9 to 5.0) 5.1% (3.6 to 7.5) 1.14 0.00
Haiti (L) 47 (43 to 53) 73 (64 to 84) 111 (100 to 124) 171 (151 to 199) 5.3% (3.0 to 7.5) 7.6% (3.8 to 12.6) 3.06 0.01
Honduras (LM) 187 (173 to 203) 283 (245 to 331) 429 (396 to 465) 650 (562 to 759) 7.1% (6.5 to 7.7) 8.3% (5.6 to 11.5) 1.43 0.00
Jamaica (UM) 365 (337 to 393) 598 (509 to 698) 715 (660 to 769) 1,170 (996 to 1,366) 6.7% (6.0 to 7.3) 12.0% (8.3 to 16.8) 1.41 0.00
Mexico (UM) 502 (482 to 525) 619 (572 to 671) 1,171 (1,124 to 1,223) 1,441 (1,332 to 1,564) 5.6% (5.4 to 5.8) 6.6% (5.0 to 8.2) 0.13 0.00
Nicaragua (LM) 169 (153 to 186) 262 (228 to 297) 501 (454 to 551) 777 (678 to 881) 8.7% (7.9 to 9.6) 12.5% (8.9 to 17.2) 3.13 1.29
Panama (H) 1,103 (1,075 to 1,128) 1,631 (1,464 to 1,813) 2,353 (2,293 to 2,406) 3,479 (3,121 to 3,866) 7.1% (6.9 to 7.2) 8.8% (6.1 to 12.3) 0 0
Paraguay (UM) 380 (357 to 404) 750 (678 to 830) 968 (908 to 1,029) 1,909 (1,727 to 2,114) 7.2% (6.8 to 7.7) 11.1% (7.7 to 15.0) 3.49 0.00
Peru (UM) 346 (324 to 369) 401 (352 to 455) 683 (639 to 728) 790 (694 to 897) 5.0% (4.6 to 5.3) 6.3% (4.5 to 8.6) 0.60 0.00
Puerto Rico (H) 1,286 (1,138 to 1,459) 1,626 (1,385 to 1,890) 1,496 (1,323 to 1,697) 1,890 (1,611 to 2,198) 3.9% (3.4 to 4.5) 5.3% (3.8 to 7.2) 0 0
Saint Kitts and Nevis (H) 1,026 (967 to 1,086) 1,457 (1,293 to 1,651) 1,415 (1,332 to 1,497) 2,008 (1,782 to 2,276) 5.2% (4.8 to 5.7) 5.7% (4.3 to 7.3) 0 0
Saint Lucia (UM) 531 (496 to 568) 708 (610 to 809) 744 (695 to 797) 992 (855 to 1,134) 4.5% (4.2 to 4.9) 6.2% (4.3 to 8.3) 1.66 0.00
Saint Vincent and the Grenadines (UM) 359 (334 to 387) 510 (451 to 576) 626 (583 to 675) 890 (788 to 1,005) 4.7% (4.4 to 5.1) 6.5% (4.7 to 8.7) 2.57 0.00
Suriname (UM) 408 (381 to 438) 610 (501 to 746) 1,420 (1,324 to 1,524) 2,121 (1,742 to 2,595) 8.2% (7.6 to 8.8) 12.0% (8.1 to 17.1) 1.67 0.00
The Bahamas (H) 2,191 (2,111 to 2,270) 3,238 (2,932 to 3,572) 2,468 (2,377 to 2,557) 3,646 (3,302 to 4,022) 6.2% (6.0 to 6.5) 10.1% (7.4 to 13.5) 0 0
Trinidad and Tobago (H) 1,145 (1,093 to 1,203) 1,392 (1,262 to 1,530) 1,836 (1,752 to 1,929) 2,232 (2,022 to 2,452) 6.6% (6.3 to 7.0) 8.1% (6.1 to 10.6) 0 0
Venezuela (UM)† 94 (84 to 104) 80 (68 to 93) 230 (206 to 255) 196 (166 to 228) 3.7% (3.0 to 4.5) 3.9% (2.5 to 5.6) 0.73 0.00
Virgin Islands (H) 969 (825 to 1,133) 1,132 (931 to 1,375) 969 (825 to 1,133) 1,132 (931 to 1,375) 2.4% (2.0 to 2.9) 2.7% (1.9 to 3.8) 0 0
NorTH aFriCa aND MiDDle eaST
Afghanistan (L) 54 (49 to 58) 58 (53 to 64) 223 (205 to 243) 243 (221 to 265) 10.5% (9.3 to 11.8) 9.9% (6.6 to 14.2) 4.47 0.00
Algeria (LM) 231 (210 to 253) 308 (260 to 363) 765 (696 to 838) 1,021 (862 to 1,202) 6.4% (5.8 to 7.0) 9.0% (6.4 to 12.3) 0.14 0.00
Bahrain (H) 1,052 (1,001 to 1,103) 938 (793 to 1,108) 2,260 (2,151 to 2,369) 2,015 (1,705 to 2,380) 4.6% (4.1 to 4.9) 6.2% (4.2 to 8.6) 0 0
Egypt (LM) 173 (162 to 183) 276 (248 to 306) 617 (580 to 655) 984 (884 to 1,093) 5.2% (4.6 to 5.7) 5.9% (4.0 to 8.2) 0.20 0.00
Iran (UM) 675 (642 to 706) 890 (770 to 1,014) 1,112 (1,059 to 1,164) 1,467 (1,270 to 1,671) 8.4% (7.7 to 9.1) 14.2% (10.0 to 19.1) 0.95 0.00
Iraq (UM) 185 (168 to 203) 322 (246 to 409) 415 (378 to 455) 723 (552 to 917) 3.6% (3.3 to 4.0) 5.0% (3.1 to 7.9) 1.50 0.00
Jordan (UM) 306 (284 to 331) 475 (403 to 560) 734 (679 to 792) 1,137 (966 to 1,341) 6.9% (6.4 to 7.4) 10.3% (7.3 to 14.2) 4.43 0.00
TaBle B4, CoNT. Total health spending by World Bank income group, global Burden of Disease super-region, and country, 2019 and 2050, and development assistance for health specific to COVID-19 and health systems strengthening, 2020

Health spending per person, 2019 and 2050 (2020 uS dollars)
Health spending per person, 2019 and 2050 (2020 purchasing power parity-adjusted dollars)
Total health spending per gross domestic product, 2019 and 2050
CoViD-19 development assistance received for health per person
(2020 uS dollars)
Development assistance for health systems strengthening per person
(2020 uS dollars)
2019 2050 2019 2050 2019 2050 2020 2020
laTiN aMeriCa aND CariBBeaN
Antigua and Barbuda (H) 972 (925 to 1,024) 1,381 (1,160 to 1,608) 1,281 (1,219 to 1,349) 1,820 (1,528 to 2,119) 5.6% (5.3 to 5.9) 7.9% (5.8 to 10.7) 0 0
Barbados (H) 1,126 (1,074 to 1,182) 1,104 (1,023 to 1,205) 1,020 (973 to 1,071) 1,000 (927 to 1,091) 6.2% (5.9 to 6.5) 6.4% (5.0 to 8.4) 0 0
Belize (UM) 283 (258 to 309) 450 (346 to 551) 431 (394 to 471) 686 (527 to 841) 6.0% (5.4 to 6.6) 8.1% (5.6 to 11.7) 1.72 0.00
Bermuda (H) 8,049 (7,007 to 9,277) 10,721 (8,170 to 13,824) 5,686 (4,950 to 6,553) 7,574 (5,771 to 9,765) 6.7% (5.0 to 9.2) 12.1% (7.6 to 18.3) 0 0
Bolivia (LM) 233 (213 to 254) 336 (299 to 378) 585 (536 to 639) 845 (752 to 949) 6.4% (5.8 to 7.0) 8.5% (5.9 to 12.1) 0.69 0.00
Brazil (UM) 639 (598 to 682) 1,099 (950 to 1,266) 1,443 (1,350 to 1,540) 2,480 (2,144 to 2,858) 9.3% (8.7 to 9.9) 14.8% (10.1 to 21.0) 0.08 0.25
Colombia (UM) 447 (429 to 468) 810 (714 to 917) 1,214 (1,165 to 1,270) 2,198 (1,939 to 2,490) 7.8% (7.5 to 8.2) 12.7% (8.8 to 17.9) 1.42 0.00
Costa Rica (UM) 1,083 (1,061 to 1,105) 1,682 (1,530 to 1,869) 1,798 (1,762 to 1,835) 2,792 (2,541 to 3,104) 8.7% (8.6 to 8.9) 13.0% (9.3 to 17.7) 1.02 0.00
Cuba (UM) 1,170 (1,090 to 1,255) 1,745 (1,549 to 1,936) 2,863 (2,667 to 3,071) 4,268 (3,790 to 4,735) 13.1% (11.7 to 14.7) 20.3% (14.1 to 28.4) 0.76 0.00
Dominica (UM) 431 (403 to 460) 466 (391 to 550) 676 (632 to 722) 731 (613 to 863) 5.1% (4.8 to 5.5) 5.1% (3.8 to 6.6) 0.06 0.00
Dominican Republic (UM) 446 (416 to 476) 715 (600 to 847) 1,124 (1,048 to 1,200) 1,804 (1,514 to 2,137) 5.7% (5.3 to 6.2) 7.6% (5.1 to 10.9) 0.75 0.00
Ecuador (UM) 483 (455 to 512) 684 (600 to 771) 963 (907 to 1,022) 1,366 (1,198 to 1,540) 8.0% (7.5 to 8.5) 11.0% (7.6 to 15.4) 9.41 0.00
El Salvador (LM) 322 (299 to 347) 508 (452 to 572) 707 (657 to 764) 1,116 (994 to 1,258) 7.7% (7.1 to 8.3) 10.9% (8.2 to 14.1) 1.20 0.00
Grenada (UM) 515 (483 to 551) 650 (560 to 766) 863 (808 to 923) 1,088 (937 to 1,283) 4.7% (4.4 to 5.1) 5.1% (3.6 to 6.9) 2.82 0.00
Guatemala (UM) 308 (291 to 326) 461 (420 to 501) 601 (567 to 636) 899 (820 to 977) 6.9% (6.3 to 7.4) 8.4% (6.5 to 10.7) 0.88 0.00
Guyana (UM) 323 (301 to 346) 542 (422 to 692) 648 (604 to 694) 1,087 (847 to 1,390) 4.4% (3.9 to 5.0) 5.1% (3.6 to 7.5) 1.14 0.00
Haiti (L) 47 (43 to 53) 73 (64 to 84) 111 (100 to 124) 171 (151 to 199) 5.3% (3.0 to 7.5) 7.6% (3.8 to 12.6) 3.06 0.01
Honduras (LM) 187 (173 to 203) 283 (245 to 331) 429 (396 to 465) 650 (562 to 759) 7.1% (6.5 to 7.7) 8.3% (5.6 to 11.5) 1.43 0.00
Jamaica (UM) 365 (337 to 393) 598 (509 to 698) 715 (660 to 769) 1,170 (996 to 1,366) 6.7% (6.0 to 7.3) 12.0% (8.3 to 16.8) 1.41 0.00
Mexico (UM) 502 (482 to 525) 619 (572 to 671) 1,171 (1,124 to 1,223) 1,441 (1,332 to 1,564) 5.6% (5.4 to 5.8) 6.6% (5.0 to 8.2) 0.13 0.00
Nicaragua (LM) 169 (153 to 186) 262 (228 to 297) 501 (454 to 551) 777 (678 to 881) 8.7% (7.9 to 9.6) 12.5% (8.9 to 17.2) 3.13 1.29
Panama (H) 1,103 (1,075 to 1,128) 1,631 (1,464 to 1,813) 2,353 (2,293 to 2,406) 3,479 (3,121 to 3,866) 7.1% (6.9 to 7.2) 8.8% (6.1 to 12.3) 0 0
Paraguay (UM) 380 (357 to 404) 750 (678 to 830) 968 (908 to 1,029) 1,909 (1,727 to 2,114) 7.2% (6.8 to 7.7) 11.1% (7.7 to 15.0) 3.49 0.00
Peru (UM) 346 (324 to 369) 401 (352 to 455) 683 (639 to 728) 790 (694 to 897) 5.0% (4.6 to 5.3) 6.3% (4.5 to 8.6) 0.60 0.00
Puerto Rico (H) 1,286 (1,138 to 1,459) 1,626 (1,385 to 1,890) 1,496 (1,323 to 1,697) 1,890 (1,611 to 2,198) 3.9% (3.4 to 4.5) 5.3% (3.8 to 7.2) 0 0
Saint Kitts and Nevis (H) 1,026 (967 to 1,086) 1,457 (1,293 to 1,651) 1,415 (1,332 to 1,497) 2,008 (1,782 to 2,276) 5.2% (4.8 to 5.7) 5.7% (4.3 to 7.3) 0 0
Saint Lucia (UM) 531 (496 to 568) 708 (610 to 809) 744 (695 to 797) 992 (855 to 1,134) 4.5% (4.2 to 4.9) 6.2% (4.3 to 8.3) 1.66 0.00
Saint Vincent and the Grenadines (UM) 359 (334 to 387) 510 (451 to 576) 626 (583 to 675) 890 (788 to 1,005) 4.7% (4.4 to 5.1) 6.5% (4.7 to 8.7) 2.57 0.00
Suriname (UM) 408 (381 to 438) 610 (501 to 746) 1,420 (1,324 to 1,524) 2,121 (1,742 to 2,595) 8.2% (7.6 to 8.8) 12.0% (8.1 to 17.1) 1.67 0.00
The Bahamas (H) 2,191 (2,111 to 2,270) 3,238 (2,932 to 3,572) 2,468 (2,377 to 2,557) 3,646 (3,302 to 4,022) 6.2% (6.0 to 6.5) 10.1% (7.4 to 13.5) 0 0
Trinidad and Tobago (H) 1,145 (1,093 to 1,203) 1,392 (1,262 to 1,530) 1,836 (1,752 to 1,929) 2,232 (2,022 to 2,452) 6.6% (6.3 to 7.0) 8.1% (6.1 to 10.6) 0 0
Venezuela (UM)† 94 (84 to 104) 80 (68 to 93) 230 (206 to 255) 196 (166 to 228) 3.7% (3.0 to 4.5) 3.9% (2.5 to 5.6) 0.73 0.00
Virgin Islands (H) 969 (825 to 1,133) 1,132 (931 to 1,375) 969 (825 to 1,133) 1,132 (931 to 1,375) 2.4% (2.0 to 2.9) 2.7% (1.9 to 3.8) 0 0
NorTH aFriCa aND MiDDle eaST
Afghanistan (L) 54 (49 to 58) 58 (53 to 64) 223 (205 to 243) 243 (221 to 265) 10.5% (9.3 to 11.8) 9.9% (6.6 to 14.2) 4.47 0.00
Algeria (LM) 231 (210 to 253) 308 (260 to 363) 765 (696 to 838) 1,021 (862 to 1,202) 6.4% (5.8 to 7.0) 9.0% (6.4 to 12.3) 0.14 0.00
Bahrain (H) 1,052 (1,001 to 1,103) 938 (793 to 1,108) 2,260 (2,151 to 2,369) 2,015 (1,705 to 2,380) 4.6% (4.1 to 4.9) 6.2% (4.2 to 8.6) 0 0
Egypt (LM) 173 (162 to 183) 276 (248 to 306) 617 (580 to 655) 984 (884 to 1,093) 5.2% (4.6 to 5.7) 5.9% (4.0 to 8.2) 0.20 0.00
Iran (UM) 675 (642 to 706) 890 (770 to 1,014) 1,112 (1,059 to 1,164) 1,467 (1,270 to 1,671) 8.4% (7.7 to 9.1) 14.2% (10.0 to 19.1) 0.95 0.00
Iraq (UM) 185 (168 to 203) 322 (246 to 409) 415 (378 to 455) 723 (552 to 917) 3.6% (3.3 to 4.0) 5.0% (3.1 to 7.9) 1.50 0.00
Jordan (UM) 306 (284 to 331) 475 (403 to 560) 734 (679 to 792) 1,137 (966 to 1,341) 6.9% (6.4 to 7.4) 10.3% (7.3 to 14.2) 4.43 0.00
TABuLATEd dATA | 129
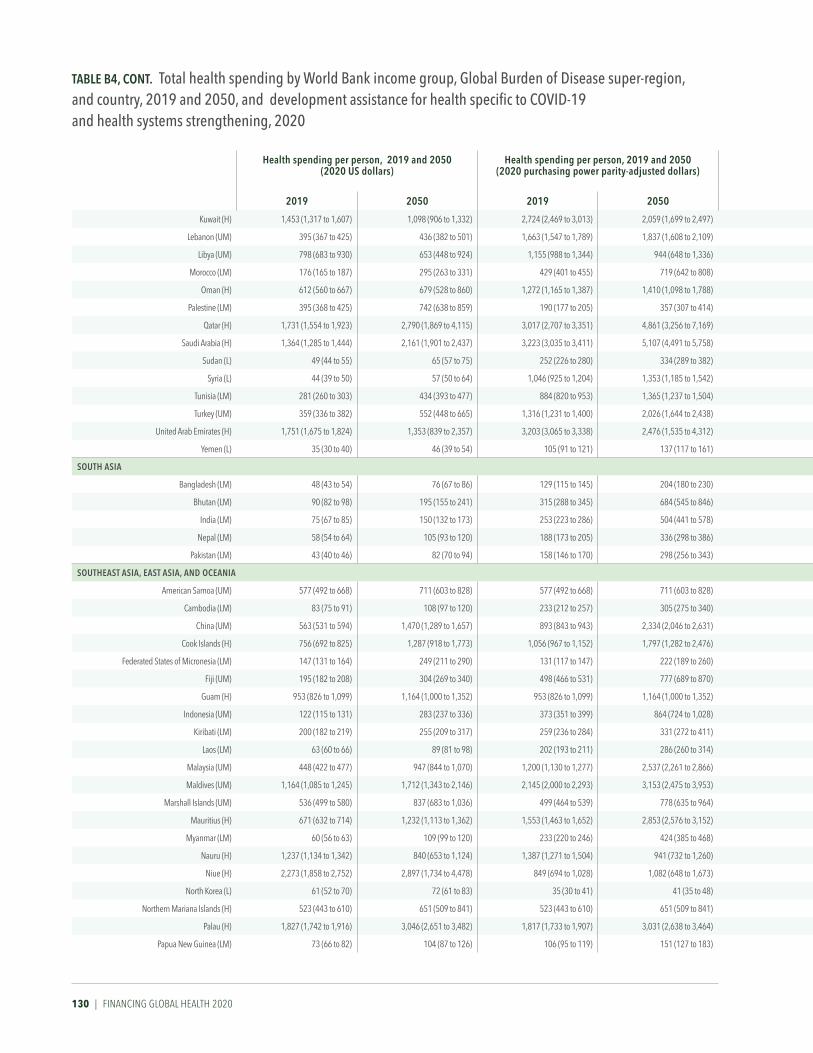
130 | FINANCING GLOBAL HEALTH 2020
Health spending per person, 2019 and 2050 (2020 uS dollars)
Health spending per person, 2019 and 2050 (2020 purchasing power parity-adjusted dollars)
Total health spending per gross domestic product, 2019 and 2050
CoViD-19 development assistance received for health per person
(2020 uS dollars)
Development assistance for health systems strengthening per person
(2020 uS dollars)
2019 2050 2019 2050 2019 2050 2020 2020
Kuwait (H) 1,453 (1,317 to 1,607) 1,098 (906 to 1,332) 2,724 (2,469 to 3,013) 2,059 (1,699 to 2,497) 5.4% (4.7 to 6.3) 7.6% (5.0 to 11.3) 0 0
Lebanon (UM) 395 (367 to 425) 436 (382 to 501) 1,663 (1,547 to 1,789) 1,837 (1,608 to 2,109) 10.7% (10.0 to 11.5) 12.7% (9.0 to 17.3) 9.06 0.00
Libya (UM) 798 (683 to 930) 653 (448 to 924) 1,155 (988 to 1,344) 944 (648 to 1,336) 9.0% (3.5 to 18.1) 10.3% (3.2 to 24.4) 3.81 0.00
Morocco (LM) 176 (165 to 187) 295 (263 to 331) 429 (401 to 455) 719 (642 to 808) 5.1% (4.7 to 5.6) 7.1% (4.9 to 9.9) 5.94 0.00
Oman (H) 612 (560 to 667) 679 (528 to 860) 1,272 (1,165 to 1,387) 1,410 (1,098 to 1,788) 4.1% (3.5 to 4.7) 5.4% (3.4 to 7.9) 0 0
Palestine (LM) 395 (368 to 425) 742 (638 to 859) 190 (177 to 205) 357 (307 to 414) 10.6% (9.7 to 11.5) 14.3% (9.8 to 19.7) 11.43 0.00
Qatar (H) 1,731 (1,554 to 1,923) 2,790 (1,869 to 4,115) 3,017 (2,707 to 3,351) 4,861 (3,256 to 7,169) 3.2% (2.8 to 3.5) 9.4% (5.5 to 15.6) 0 0
Saudi Arabia (H) 1,364 (1,285 to 1,444) 2,161 (1,901 to 2,437) 3,223 (3,035 to 3,411) 5,107 (4,491 to 5,758) 6.5% (6.1 to 6.9) 15.4% (10.4 to 22.1) 0 0
Sudan (L) 49 (44 to 55) 65 (57 to 75) 252 (226 to 280) 334 (289 to 382) 5.1% (3.3 to 6.7) 4.6% (2.6 to 6.7) 2.04 0.00
Syria (L) 44 (39 to 50) 57 (50 to 64) 1,046 (925 to 1,204) 1,353 (1,185 to 1,542) 3.6% (3.1 to 4.2) 4.4% (3.0 to 6.5) 7.41 0.00
Tunisia (LM) 281 (260 to 303) 434 (393 to 477) 884 (820 to 953) 1,365 (1,237 to 1,504) 7.8% (7.2 to 8.4) 10.9% (7.6 to 15.2) 7.89 0.00
Turkey (UM) 359 (336 to 382) 552 (448 to 665) 1,316 (1,231 to 1,400) 2,026 (1,644 to 2,438) 4.4% (4.1 to 4.6) 6.3% (4.1 to 9.0) 0.74 0.00
United Arab Emirates (H) 1,751 (1,675 to 1,824) 1,353 (839 to 2,357) 3,203 (3,065 to 3,338) 2,476 (1,535 to 4,312) 4.7% (4.3 to 5.2) 9.4% (4.9 to 18.6) 0 0
Yemen (L) 35 (30 to 40) 46 (39 to 54) 105 (91 to 121) 137 (117 to 161) 5.4% (4.0 to 7.4) 5.5% (3.6 to 8.3) 4.79 0.00
SouTH aSia
Bangladesh (LM) 48 (43 to 54) 76 (67 to 86) 129 (115 to 145) 204 (180 to 230) 26% (23 to 30) 27% (18 to 38) 162 031
Bhutan (LM) 90 (82 to 98) 195 (155 to 241) 315 (288 to 345) 684 (545 to 846) 26% (24 to 28) 34% (22 to 51) 1,648 1,225
India (LM) 75 (67 to 85) 150 (132 to 173) 253 (223 to 286) 504 (441 to 578) 35% (31 to 40) 43% (29 to 62) 100 001
Nepal (LM) 58 (54 to 64) 105 (93 to 120) 188 (173 to 205) 336 (298 to 386) 53% (48 to 58) 59% (41 to 83) 515 000
Pakistan (LM) 43 (40 to 46) 82 (70 to 94) 158 (146 to 170) 298 (256 to 343) 30% (28 to 33) 37% (25 to 52) 141 003
SouTHeaST aSia, eaST aSia, aND oCeaNia
American Samoa (UM) 577 (492 to 668) 711 (603 to 828) 577 (492 to 668) 711 (603 to 828) 49% (40 to 58) 59% (39 to 84) 0 0
Cambodia (LM) 83 (75 to 91) 108 (97 to 120) 233 (212 to 257) 305 (275 to 340) 50% (46 to 56) 45% (32 to 61) 965 003
China (UM) 563 (531 to 594) 1,470 (1,289 to 1,657) 893 (843 to 943) 2,334 (2,046 to 2,631) 53% (50 to 56) 83% (56 to 117) 004 001
Cook Islands (H) 756 (692 to 825) 1,287 (918 to 1,773) 1,056 (967 to 1,152) 1,797 (1,282 to 2,476) 34% (31 to 38) 41% (26 to 64) 0 0
Federated States of Micronesia (LM) 147 (131 to 164) 249 (211 to 290) 131 (117 to 147) 222 (189 to 260) 39% (33 to 46) 54% (37 to 75) 4,016 000
Fiji (UM) 195 (182 to 208) 304 (269 to 340) 498 (466 to 531) 777 (689 to 870) 34% (29 to 40) 45% (32 to 61) 1,584 000
Guam (H) 953 (826 to 1,099) 1,164 (1,000 to 1,352) 953 (826 to 1,099) 1,164 (1,000 to 1,352) 26% (21 to 31) 31% (23 to 42) 0 0
Indonesia (UM) 122 (115 to 131) 283 (237 to 336) 373 (351 to 399) 864 (724 to 1,028) 30% (28 to 32) 48% (33 to 70) 265 000
Kiribati (LM) 200 (182 to 219) 255 (209 to 317) 259 (236 to 284) 331 (272 to 411) 120% (109 to 131) 140% (99 to 195) 6,152 000
Laos (LM) 63 (60 to 66) 89 (81 to 98) 202 (193 to 211) 286 (260 to 314) 25% (21 to 29) 21% (14 to 30) 425 021
Malaysia (UM) 448 (422 to 477) 947 (844 to 1,070) 1,200 (1,130 to 1,277) 2,537 (2,261 to 2,866) 41% (38 to 43) 65% (45 to 92) 055 000
Maldives (UM) 1,164 (1,085 to 1,245) 1,712 (1,343 to 2,146) 2,145 (2,000 to 2,293) 3,153 (2,475 to 3,953) 91% (69 to 109) 122% (72 to 189) 4,929 000
Marshall Islands (UM) 536 (499 to 580) 837 (683 to 1,036) 499 (464 to 539) 778 (635 to 964) 124% (104 to 142) 154% (111 to 213) 8,935 000
Mauritius (H) 671 (632 to 714) 1,232 (1,113 to 1,362) 1,553 (1,463 to 1,652) 2,853 (2,576 to 3,152) 64% (60 to 68) 93% (65 to 127) 0 0
Myanmar (LM) 60 (56 to 63) 109 (99 to 120) 233 (220 to 246) 424 (385 to 468) 44% (40 to 48) 48% (32 to 68) 161 003
Nauru (H) 1,237 (1,134 to 1,342) 840 (653 to 1,124) 1,387 (1,271 to 1,504) 941 (732 to 1,260) 119% (69 to 171) 78% (37 to 141) 0 0
Niue (H) 2,273 (1,858 to 2,752) 2,897 (1,734 to 4,478) 849 (694 to 1,028) 1,082 (648 to 1,673) 119% (94 to 151) 119% (66 to 203) 000 000
North Korea (L) 61 (52 to 70) 72 (61 to 83) 35 (30 to 41) 41 (35 to 48) 52% (45 to 61) 72% (49 to 101) 010 000
Northern Mariana Islands (H) 523 (443 to 610) 651 (509 to 841) 523 (443 to 610) 651 (509 to 841) 22% (18 to 27) 35% (23 to 52) 0 0
Palau (H) 1,827 (1,742 to 1,916) 3,046 (2,651 to 3,482) 1,817 (1,733 to 1,907) 3,031 (2,638 to 3,464) 113% (107 to 118) 162% (120 to 214) 0 0
Papua New Guinea (LM) 73 (66 to 82) 104 (87 to 126) 106 (95 to 119) 151 (127 to 183) 26% (24 to 30) 30% (21 to 42) 1,254 215
TaBle B4, CoNT. Total health spending by World Bank income group, global Burden of Disease super-region, and country, 2019 and 2050, and development assistance for health specific to COVID-19 and health systems strengthening, 2020
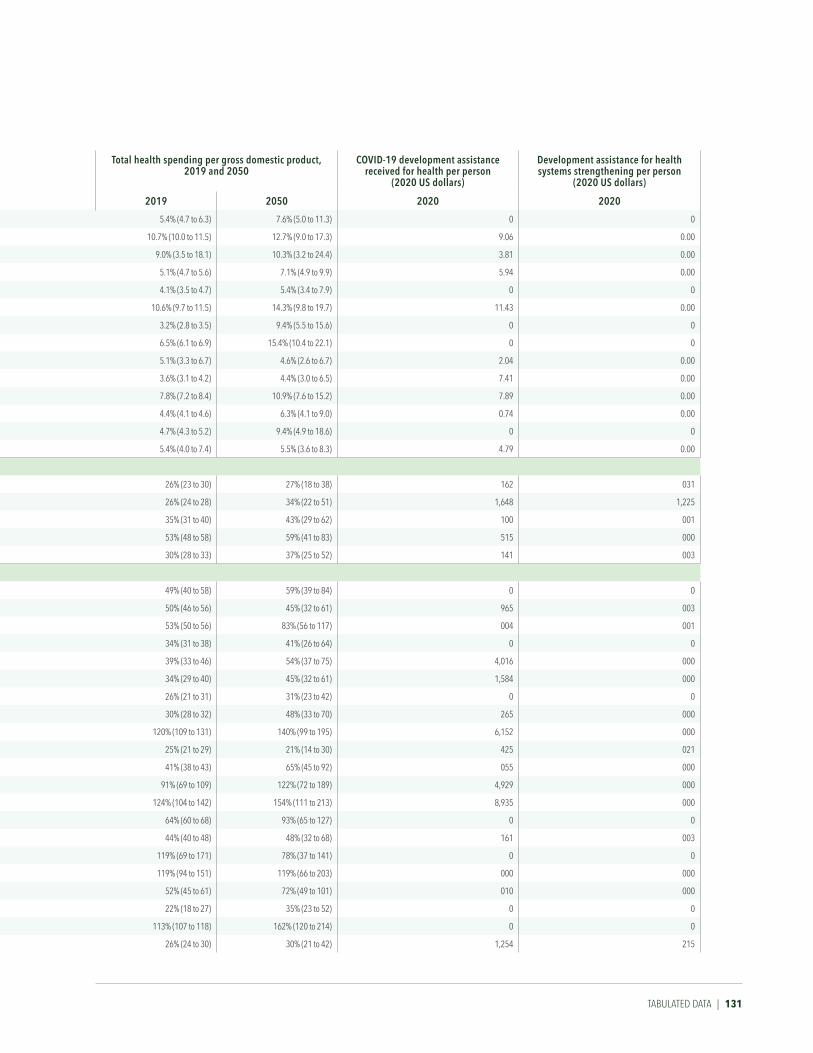
Health spending per person, 2019 and 2050 (2020 uS dollars)
Health spending per person, 2019 and 2050 (2020 purchasing power parity-adjusted dollars)
Total health spending per gross domestic product, 2019 and 2050
CoViD-19 development assistance received for health per person
(2020 uS dollars)
Development assistance for health systems strengthening per person
(2020 uS dollars)
2019 2050 2019 2050 2019 2050 2020 2020
Kuwait (H) 1,453 (1,317 to 1,607) 1,098 (906 to 1,332) 2,724 (2,469 to 3,013) 2,059 (1,699 to 2,497) 5.4% (4.7 to 6.3) 7.6% (5.0 to 11.3) 0 0
Lebanon (UM) 395 (367 to 425) 436 (382 to 501) 1,663 (1,547 to 1,789) 1,837 (1,608 to 2,109) 10.7% (10.0 to 11.5) 12.7% (9.0 to 17.3) 9.06 0.00
Libya (UM) 798 (683 to 930) 653 (448 to 924) 1,155 (988 to 1,344) 944 (648 to 1,336) 9.0% (3.5 to 18.1) 10.3% (3.2 to 24.4) 3.81 0.00
Morocco (LM) 176 (165 to 187) 295 (263 to 331) 429 (401 to 455) 719 (642 to 808) 5.1% (4.7 to 5.6) 7.1% (4.9 to 9.9) 5.94 0.00
Oman (H) 612 (560 to 667) 679 (528 to 860) 1,272 (1,165 to 1,387) 1,410 (1,098 to 1,788) 4.1% (3.5 to 4.7) 5.4% (3.4 to 7.9) 0 0
Palestine (LM) 395 (368 to 425) 742 (638 to 859) 190 (177 to 205) 357 (307 to 414) 10.6% (9.7 to 11.5) 14.3% (9.8 to 19.7) 11.43 0.00
Qatar (H) 1,731 (1,554 to 1,923) 2,790 (1,869 to 4,115) 3,017 (2,707 to 3,351) 4,861 (3,256 to 7,169) 3.2% (2.8 to 3.5) 9.4% (5.5 to 15.6) 0 0
Saudi Arabia (H) 1,364 (1,285 to 1,444) 2,161 (1,901 to 2,437) 3,223 (3,035 to 3,411) 5,107 (4,491 to 5,758) 6.5% (6.1 to 6.9) 15.4% (10.4 to 22.1) 0 0
Sudan (L) 49 (44 to 55) 65 (57 to 75) 252 (226 to 280) 334 (289 to 382) 5.1% (3.3 to 6.7) 4.6% (2.6 to 6.7) 2.04 0.00
Syria (L) 44 (39 to 50) 57 (50 to 64) 1,046 (925 to 1,204) 1,353 (1,185 to 1,542) 3.6% (3.1 to 4.2) 4.4% (3.0 to 6.5) 7.41 0.00
Tunisia (LM) 281 (260 to 303) 434 (393 to 477) 884 (820 to 953) 1,365 (1,237 to 1,504) 7.8% (7.2 to 8.4) 10.9% (7.6 to 15.2) 7.89 0.00
Turkey (UM) 359 (336 to 382) 552 (448 to 665) 1,316 (1,231 to 1,400) 2,026 (1,644 to 2,438) 4.4% (4.1 to 4.6) 6.3% (4.1 to 9.0) 0.74 0.00
United Arab Emirates (H) 1,751 (1,675 to 1,824) 1,353 (839 to 2,357) 3,203 (3,065 to 3,338) 2,476 (1,535 to 4,312) 4.7% (4.3 to 5.2) 9.4% (4.9 to 18.6) 0 0
Yemen (L) 35 (30 to 40) 46 (39 to 54) 105 (91 to 121) 137 (117 to 161) 5.4% (4.0 to 7.4) 5.5% (3.6 to 8.3) 4.79 0.00
SouTH aSia
Bangladesh (LM) 48 (43 to 54) 76 (67 to 86) 129 (115 to 145) 204 (180 to 230) 26% (23 to 30) 27% (18 to 38) 162 031
Bhutan (LM) 90 (82 to 98) 195 (155 to 241) 315 (288 to 345) 684 (545 to 846) 26% (24 to 28) 34% (22 to 51) 1,648 1,225
India (LM) 75 (67 to 85) 150 (132 to 173) 253 (223 to 286) 504 (441 to 578) 35% (31 to 40) 43% (29 to 62) 100 001
Nepal (LM) 58 (54 to 64) 105 (93 to 120) 188 (173 to 205) 336 (298 to 386) 53% (48 to 58) 59% (41 to 83) 515 000
Pakistan (LM) 43 (40 to 46) 82 (70 to 94) 158 (146 to 170) 298 (256 to 343) 30% (28 to 33) 37% (25 to 52) 141 003
SouTHeaST aSia, eaST aSia, aND oCeaNia
American Samoa (UM) 577 (492 to 668) 711 (603 to 828) 577 (492 to 668) 711 (603 to 828) 49% (40 to 58) 59% (39 to 84) 0 0
Cambodia (LM) 83 (75 to 91) 108 (97 to 120) 233 (212 to 257) 305 (275 to 340) 50% (46 to 56) 45% (32 to 61) 965 003
China (UM) 563 (531 to 594) 1,470 (1,289 to 1,657) 893 (843 to 943) 2,334 (2,046 to 2,631) 53% (50 to 56) 83% (56 to 117) 004 001
Cook Islands (H) 756 (692 to 825) 1,287 (918 to 1,773) 1,056 (967 to 1,152) 1,797 (1,282 to 2,476) 34% (31 to 38) 41% (26 to 64) 0 0
Federated States of Micronesia (LM) 147 (131 to 164) 249 (211 to 290) 131 (117 to 147) 222 (189 to 260) 39% (33 to 46) 54% (37 to 75) 4,016 000
Fiji (UM) 195 (182 to 208) 304 (269 to 340) 498 (466 to 531) 777 (689 to 870) 34% (29 to 40) 45% (32 to 61) 1,584 000
Guam (H) 953 (826 to 1,099) 1,164 (1,000 to 1,352) 953 (826 to 1,099) 1,164 (1,000 to 1,352) 26% (21 to 31) 31% (23 to 42) 0 0
Indonesia (UM) 122 (115 to 131) 283 (237 to 336) 373 (351 to 399) 864 (724 to 1,028) 30% (28 to 32) 48% (33 to 70) 265 000
Kiribati (LM) 200 (182 to 219) 255 (209 to 317) 259 (236 to 284) 331 (272 to 411) 120% (109 to 131) 140% (99 to 195) 6,152 000
Laos (LM) 63 (60 to 66) 89 (81 to 98) 202 (193 to 211) 286 (260 to 314) 25% (21 to 29) 21% (14 to 30) 425 021
Malaysia (UM) 448 (422 to 477) 947 (844 to 1,070) 1,200 (1,130 to 1,277) 2,537 (2,261 to 2,866) 41% (38 to 43) 65% (45 to 92) 055 000
Maldives (UM) 1,164 (1,085 to 1,245) 1,712 (1,343 to 2,146) 2,145 (2,000 to 2,293) 3,153 (2,475 to 3,953) 91% (69 to 109) 122% (72 to 189) 4,929 000
Marshall Islands (UM) 536 (499 to 580) 837 (683 to 1,036) 499 (464 to 539) 778 (635 to 964) 124% (104 to 142) 154% (111 to 213) 8,935 000
Mauritius (H) 671 (632 to 714) 1,232 (1,113 to 1,362) 1,553 (1,463 to 1,652) 2,853 (2,576 to 3,152) 64% (60 to 68) 93% (65 to 127) 0 0
Myanmar (LM) 60 (56 to 63) 109 (99 to 120) 233 (220 to 246) 424 (385 to 468) 44% (40 to 48) 48% (32 to 68) 161 003
Nauru (H) 1,237 (1,134 to 1,342) 840 (653 to 1,124) 1,387 (1,271 to 1,504) 941 (732 to 1,260) 119% (69 to 171) 78% (37 to 141) 0 0
Niue (H) 2,273 (1,858 to 2,752) 2,897 (1,734 to 4,478) 849 (694 to 1,028) 1,082 (648 to 1,673) 119% (94 to 151) 119% (66 to 203) 000 000
North Korea (L) 61 (52 to 70) 72 (61 to 83) 35 (30 to 41) 41 (35 to 48) 52% (45 to 61) 72% (49 to 101) 010 000
Northern Mariana Islands (H) 523 (443 to 610) 651 (509 to 841) 523 (443 to 610) 651 (509 to 841) 22% (18 to 27) 35% (23 to 52) 0 0
Palau (H) 1,827 (1,742 to 1,916) 3,046 (2,651 to 3,482) 1,817 (1,733 to 1,907) 3,031 (2,638 to 3,464) 113% (107 to 118) 162% (120 to 214) 0 0
Papua New Guinea (LM) 73 (66 to 82) 104 (87 to 126) 106 (95 to 119) 151 (127 to 183) 26% (24 to 30) 30% (21 to 42) 1,254 215
TABuLATEd dATA | 131

132 | FINANCING GLOBAL HEALTH 2020
Health spending per person, 2019 and 2050 (2020 uS dollars)
Health spending per person, 2019 and 2050 (2020 purchasing power parity-adjusted dollars)
Total health spending per gross domestic product, 2019 and 2050
CoViD-19 development assistance received for health per person
(2020 uS dollars)
Development assistance for health systems strengthening per person
(2020 uS dollars)
2019 2050 2019 2050 2019 2050 2020 2020
Philippines (LM) 156 (142 to 172) 259 (228 to 295) 396 (362 to 437) 659 (580 to 751) 43% (38 to 48) 56% (38 to 76) 378 000
Samoa (UM) 235 (217 to 253) 331 (291 to 378) 319 (294 to 344) 450 (396 to 514) 53% (47 to 58) 73% (52 to 102) 5,897 000
Seychelles (H) 673 (642 to 701) 935 (791 to 1,103) 1,440 (1,376 to 1,502) 2,003 (1,694 to 2,362) 47% (44 to 49) 61% (41 to 90) 0 0
Solomon Islands (LM) 112 (99 to 128) 176 (102 to 300) 116 (102 to 132) 182 (105 to 310) 48% (39 to 61) 58% (29 to 111) 1,840 000
Sri Lanka (LM) 156 (146 to 167) 234 (211 to 261) 555 (519 to 593) 830 (749 to 926) 40% (37 to 43) 44% (31 to 60) 424 179
Taiwan (province of China) (H) 1,377 (1,307 to 1,464) 2,368 (2,218 to 2,561) 2,765 (2,624 to 2,939) 4,754 (4,453 to 5,142) 51% (48 to 55) 77% (55 to 106) 0 0
Thailand (UM) 307 (286 to 330) 595 (517 to 680) 759 (708 to 818) 1,475 (1,282 to 1,686) 39% (36 to 42) 68% (47 to 96) 026 000
Timor-Leste (LM) 82 (74 to 90) 97 (73 to 132) 226 (205 to 249) 269 (202 to 365) 65% (56 to 74) 51% (32 to 77) 894 000
Tokelau (UM) 1,492 (1,274 to 1,751) 2,679 (2,229 to 3,236) 3,074 (2,625 to 3,608) 5,520 (4,592 to 6,666) 231% (196 to 272) 263% (178 to 385) 33,752 000
Tonga (UM) 240 (224 to 256) 330 (297 to 367) 290 (272 to 310) 399 (360 to 444) 47% (43 to 51) 48% (38 to 60) 6,517 8,826
Tuvalu (UM) 757 (693 to 833) 1,010 (799 to 1,307) 835 (763 to 918) 1,114 (881 to 1,441) 190% (169 to 213) 198% (132 to 282) 45,969 000
Vanuatu (LM) 100 (88 to 114) 148 (104 to 212) 92 (81 to 105) 136 (95 to 195) 31% (27 to 35) 33% (20 to 52) 4,312 000
Vietnam (LM) 167 (157 to 177) 288 (241 to 344) 512 (483 to 545) 884 (741 to 1,056) 57% (44 to 69) 71% (43 to 107) 044 010
SuB-SaHaraN aFriCa
Angola (LM) 57 (50 to 64) 94 (75 to 117) 195 (172 to 222) 326 (260 to 405) 2.7% (2.4 to 3.1) 3.2% (2.1 to 4.7) 0.53 0.00
Benin (LM) 29 (26 to 32) 42 (37 to 49) 79 (72 to 86) 116 (101 to 133) 2.2% (2.1 to 2.5) 2.2% (1.6 to 3.0) 1.98 0.21
Botswana (UM) 464 (436 to 494) 1,257 (1,124 to 1,392) 1,144 (1,073 to 1,218) 3,097 (2,768 to 3,429) 6.2% (5.7 to 6.6) 11.7% (8.0 to 16.4) 3.14 0.00
Burkina Faso (L) 41 (39 to 44) 70 (64 to 78) 119 (113 to 125) 202 (183 to 224) 5.1% (4.9 to 5.4) 5.8% (4.1 to 8.2) 3.38 0.05
Burundi (L) 29 (27 to 31) 40 (35 to 47) 86 (80 to 93) 120 (103 to 141) 10.0% (8.8 to 11.2) 12.3% (8.7 to 16.8) 1.29 0.00
Cameroon (LM) 49 (42 to 56) 77 (65 to 90) 121 (104 to 139) 192 (161 to 223) 3.1% (2.7 to 3.6) 3.2% (2.4 to 4.2) 2.14 0.00
Cape Verde (LM) 183 (170 to 196) 325 (261 to 386) 380 (354 to 407) 676 (542 to 802) 5.0% (4.7 to 5.4) 7.1% (5.0 to 9.6) 26.93 0.00
Central African Republic (L) 30 (28 to 33) 47 (41 to 56) 61 (56 to 66) 95 (83 to 113) 6.1% (5.6 to 6.6) 7.7% (5.6 to 10.4) 10.31 0.00
Chad (L) 28 (25 to 33) 33 (28 to 40) 71 (62 to 83) 85 (71 to 101) 4.3% (3.7 to 4.9) 3.8% (2.8 to 5.3) 2.43 0.00
Comoros (LM) 83 (74 to 94) 112 (96 to 133) 187 (166 to 213) 252 (216 to 299) 5.6% (4.7 to 6.6) 6.2% (4.2 to 8.7) 4.91 0.00
Congo (Brazzaville) (LM) 47 (43 to 51) 70 (58 to 86) 93 (86 to 102) 139 (115 to 172) 2.2% (1.9 to 2.6) 2.5% (1.7 to 3.6) 4.47 0.16
Côte d'Ivoire (LM) 72 (66 to 79) 110 (94 to 129) 170 (155 to 186) 259 (221 to 302) 5.3% (2.6 to 10.6) 6.8% (3.0 to 14.0) 2.92 0.00
DR Congo (L) 20 (19 to 22) 25 (22 to 29) 43 (41 to 46) 54 (46 to 62) 4.0% (3.5 to 4.5) 4.3% (2.8 to 6.3) 1.85 0.00
Djibouti (LM) 54 (47 to 61) 72 (58 to 87) 88 (78 to 100) 119 (96 to 144) 1.6% (1.4 to 1.9) 1.9% (1.2 to 2.8) 21.79 0.00
Equatorial Guinea (UM) 222 (196 to 252) 507 (431 to 603) 554 (488 to 627) 1,265 (1,074 to 1,504) 2.8% (2.5 to 3.2) 3.5% (2.1 to 5.5) 1.80 0.00
Eritrea (L) 15 (13 to 17) 20 (17 to 23) 46 (42 to 52) 62 (54 to 72) 2.5% (2.2 to 2.8) 2.4% (1.7 to 3.3) 0.40 0.00
Ethiopia (L) 26 (24 to 28) 38 (33 to 43) 75 (69 to 80) 107 (94 to 122) 3.0% (2.5 to 3.4) 2.6% (1.7 to 3.7) 1.77 0.24
Gabon (UM) 245 (228 to 261) 452 (395 to 521) 541 (504 to 576) 997 (872 to 1,151) 3.4% (3.1 to 3.6) 5.3% (3.8 to 7.3) 7.36 0.00
Ghana (LM) 72 (66 to 81) 121 (104 to 142) 189 (171 to 210) 316 (271 to 371) 3.7% (2.9 to 5.1) 4.6% (3.0 to 7.3) 2.66 0.04
Guinea (L) 50 (45 to 55) 81 (71 to 93) 124 (112 to 136) 201 (174 to 230) 4.3% (3.6 to 5.3) 4.4% (3.1 to 6.2) 2.35 0.01
Guinea-Bissau (L) 58 (55 to 62) 78 (71 to 85) 178 (167 to 190) 238 (215 to 259) 7.8% (6.9 to 8.6) 7.4% (5.3 to 10.0) 5.11 0.00
Kenya (LM) 103 (95 to 112) 176 (152 to 204) 248 (229 to 270) 423 (367 to 492) 5.2% (4.6 to 5.9) 6.4% (4.4 to 8.8) 3.92 0.06
Lesotho (LM) 125 (115 to 136) 220 (188 to 255) 390 (358 to 425) 686 (586 to 795) 13.0% (11.9 to 14.2) 14.7% (10.1 to 20.9) 7.40 0.00
Liberia (L) 66 (62 to 70) 94 (81 to 114) 154 (145 to 164) 222 (191 to 267) 11.3% (8.5 to 15.7) 13.7% (8.2 to 23.1) 4.22 0.06
Madagascar (L) 22 (19 to 25) 31 (26 to 35) 70 (61 to 79) 98 (85 to 113) 4.0% (3.6 to 4.5) 5.4% (3.9 to 7.3) 0.77 0.00
Malawi (L) 43 (40 to 45) 51 (43 to 60) 107 (101 to 113) 126 (108 to 149) 9.8% (8.9 to 11.0) 7.9% (5.4 to 10.9) 3.71 0.01
Mali (L) 30 (27 to 32) 39 (34 to 44) 80 (74 to 87) 105 (92 to 118) 3.0% (2.3 to 3.6) 2.5% (1.6 to 3.8) 2.58 0.00
Mauritania (LM) 65 (59 to 71) 93 (81 to 106) 210 (192 to 231) 301 (263 to 342) 3.7% (3.2 to 4.2) 3.7% (2.7 to 5.2) 5.17 0.00
TaBle B4, CoNT. Total health spending by World Bank income group, global Burden of Disease super-region, and country, 2019 and 2050, and development assistance for health specific to COVID-19 and health systems strengthening, 2020
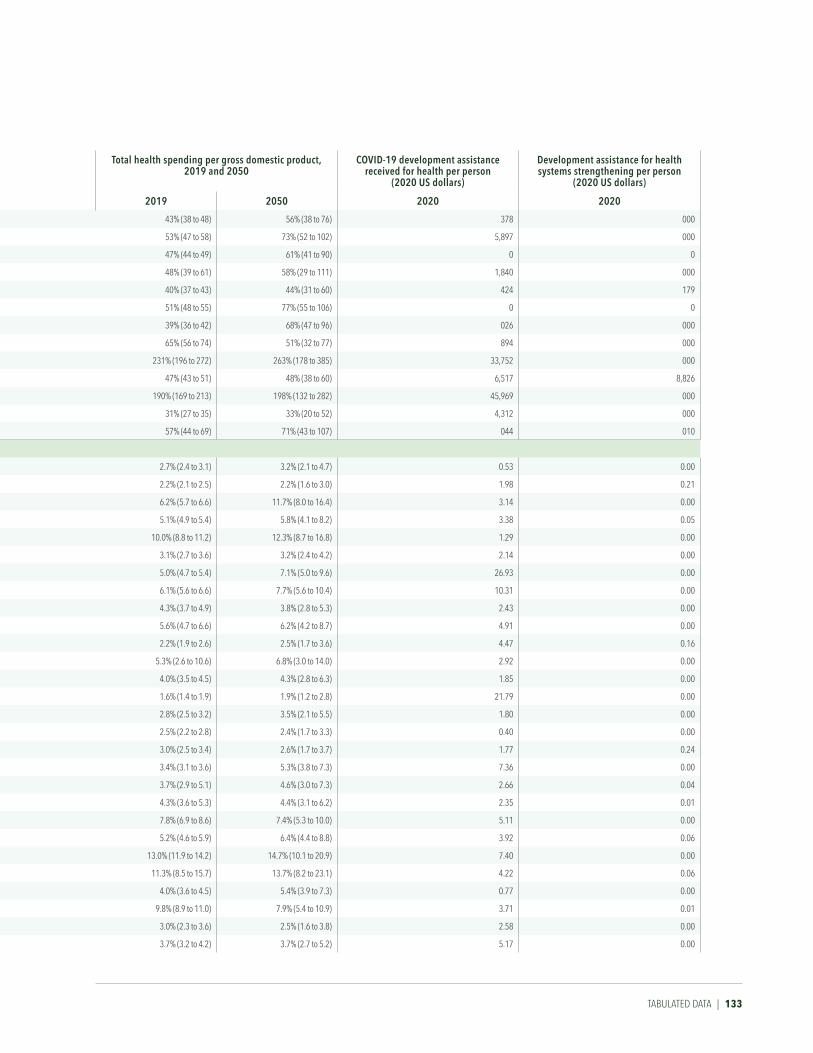
Health spending per person, 2019 and 2050 (2020 uS dollars)
Health spending per person, 2019 and 2050 (2020 purchasing power parity-adjusted dollars)
Total health spending per gross domestic product, 2019 and 2050
CoViD-19 development assistance received for health per person
(2020 uS dollars)
Development assistance for health systems strengthening per person
(2020 uS dollars)
2019 2050 2019 2050 2019 2050 2020 2020
Philippines (LM) 156 (142 to 172) 259 (228 to 295) 396 (362 to 437) 659 (580 to 751) 43% (38 to 48) 56% (38 to 76) 378 000
Samoa (UM) 235 (217 to 253) 331 (291 to 378) 319 (294 to 344) 450 (396 to 514) 53% (47 to 58) 73% (52 to 102) 5,897 000
Seychelles (H) 673 (642 to 701) 935 (791 to 1,103) 1,440 (1,376 to 1,502) 2,003 (1,694 to 2,362) 47% (44 to 49) 61% (41 to 90) 0 0
Solomon Islands (LM) 112 (99 to 128) 176 (102 to 300) 116 (102 to 132) 182 (105 to 310) 48% (39 to 61) 58% (29 to 111) 1,840 000
Sri Lanka (LM) 156 (146 to 167) 234 (211 to 261) 555 (519 to 593) 830 (749 to 926) 40% (37 to 43) 44% (31 to 60) 424 179
Taiwan (province of China) (H) 1,377 (1,307 to 1,464) 2,368 (2,218 to 2,561) 2,765 (2,624 to 2,939) 4,754 (4,453 to 5,142) 51% (48 to 55) 77% (55 to 106) 0 0
Thailand (UM) 307 (286 to 330) 595 (517 to 680) 759 (708 to 818) 1,475 (1,282 to 1,686) 39% (36 to 42) 68% (47 to 96) 026 000
Timor-Leste (LM) 82 (74 to 90) 97 (73 to 132) 226 (205 to 249) 269 (202 to 365) 65% (56 to 74) 51% (32 to 77) 894 000
Tokelau (UM) 1,492 (1,274 to 1,751) 2,679 (2,229 to 3,236) 3,074 (2,625 to 3,608) 5,520 (4,592 to 6,666) 231% (196 to 272) 263% (178 to 385) 33,752 000
Tonga (UM) 240 (224 to 256) 330 (297 to 367) 290 (272 to 310) 399 (360 to 444) 47% (43 to 51) 48% (38 to 60) 6,517 8,826
Tuvalu (UM) 757 (693 to 833) 1,010 (799 to 1,307) 835 (763 to 918) 1,114 (881 to 1,441) 190% (169 to 213) 198% (132 to 282) 45,969 000
Vanuatu (LM) 100 (88 to 114) 148 (104 to 212) 92 (81 to 105) 136 (95 to 195) 31% (27 to 35) 33% (20 to 52) 4,312 000
Vietnam (LM) 167 (157 to 177) 288 (241 to 344) 512 (483 to 545) 884 (741 to 1,056) 57% (44 to 69) 71% (43 to 107) 044 010
SuB-SaHaraN aFriCa
Angola (LM) 57 (50 to 64) 94 (75 to 117) 195 (172 to 222) 326 (260 to 405) 2.7% (2.4 to 3.1) 3.2% (2.1 to 4.7) 0.53 0.00
Benin (LM) 29 (26 to 32) 42 (37 to 49) 79 (72 to 86) 116 (101 to 133) 2.2% (2.1 to 2.5) 2.2% (1.6 to 3.0) 1.98 0.21
Botswana (UM) 464 (436 to 494) 1,257 (1,124 to 1,392) 1,144 (1,073 to 1,218) 3,097 (2,768 to 3,429) 6.2% (5.7 to 6.6) 11.7% (8.0 to 16.4) 3.14 0.00
Burkina Faso (L) 41 (39 to 44) 70 (64 to 78) 119 (113 to 125) 202 (183 to 224) 5.1% (4.9 to 5.4) 5.8% (4.1 to 8.2) 3.38 0.05
Burundi (L) 29 (27 to 31) 40 (35 to 47) 86 (80 to 93) 120 (103 to 141) 10.0% (8.8 to 11.2) 12.3% (8.7 to 16.8) 1.29 0.00
Cameroon (LM) 49 (42 to 56) 77 (65 to 90) 121 (104 to 139) 192 (161 to 223) 3.1% (2.7 to 3.6) 3.2% (2.4 to 4.2) 2.14 0.00
Cape Verde (LM) 183 (170 to 196) 325 (261 to 386) 380 (354 to 407) 676 (542 to 802) 5.0% (4.7 to 5.4) 7.1% (5.0 to 9.6) 26.93 0.00
Central African Republic (L) 30 (28 to 33) 47 (41 to 56) 61 (56 to 66) 95 (83 to 113) 6.1% (5.6 to 6.6) 7.7% (5.6 to 10.4) 10.31 0.00
Chad (L) 28 (25 to 33) 33 (28 to 40) 71 (62 to 83) 85 (71 to 101) 4.3% (3.7 to 4.9) 3.8% (2.8 to 5.3) 2.43 0.00
Comoros (LM) 83 (74 to 94) 112 (96 to 133) 187 (166 to 213) 252 (216 to 299) 5.6% (4.7 to 6.6) 6.2% (4.2 to 8.7) 4.91 0.00
Congo (Brazzaville) (LM) 47 (43 to 51) 70 (58 to 86) 93 (86 to 102) 139 (115 to 172) 2.2% (1.9 to 2.6) 2.5% (1.7 to 3.6) 4.47 0.16
Côte d'Ivoire (LM) 72 (66 to 79) 110 (94 to 129) 170 (155 to 186) 259 (221 to 302) 5.3% (2.6 to 10.6) 6.8% (3.0 to 14.0) 2.92 0.00
DR Congo (L) 20 (19 to 22) 25 (22 to 29) 43 (41 to 46) 54 (46 to 62) 4.0% (3.5 to 4.5) 4.3% (2.8 to 6.3) 1.85 0.00
Djibouti (LM) 54 (47 to 61) 72 (58 to 87) 88 (78 to 100) 119 (96 to 144) 1.6% (1.4 to 1.9) 1.9% (1.2 to 2.8) 21.79 0.00
Equatorial Guinea (UM) 222 (196 to 252) 507 (431 to 603) 554 (488 to 627) 1,265 (1,074 to 1,504) 2.8% (2.5 to 3.2) 3.5% (2.1 to 5.5) 1.80 0.00
Eritrea (L) 15 (13 to 17) 20 (17 to 23) 46 (42 to 52) 62 (54 to 72) 2.5% (2.2 to 2.8) 2.4% (1.7 to 3.3) 0.40 0.00
Ethiopia (L) 26 (24 to 28) 38 (33 to 43) 75 (69 to 80) 107 (94 to 122) 3.0% (2.5 to 3.4) 2.6% (1.7 to 3.7) 1.77 0.24
Gabon (UM) 245 (228 to 261) 452 (395 to 521) 541 (504 to 576) 997 (872 to 1,151) 3.4% (3.1 to 3.6) 5.3% (3.8 to 7.3) 7.36 0.00
Ghana (LM) 72 (66 to 81) 121 (104 to 142) 189 (171 to 210) 316 (271 to 371) 3.7% (2.9 to 5.1) 4.6% (3.0 to 7.3) 2.66 0.04
Guinea (L) 50 (45 to 55) 81 (71 to 93) 124 (112 to 136) 201 (174 to 230) 4.3% (3.6 to 5.3) 4.4% (3.1 to 6.2) 2.35 0.01
Guinea-Bissau (L) 58 (55 to 62) 78 (71 to 85) 178 (167 to 190) 238 (215 to 259) 7.8% (6.9 to 8.6) 7.4% (5.3 to 10.0) 5.11 0.00
Kenya (LM) 103 (95 to 112) 176 (152 to 204) 248 (229 to 270) 423 (367 to 492) 5.2% (4.6 to 5.9) 6.4% (4.4 to 8.8) 3.92 0.06
Lesotho (LM) 125 (115 to 136) 220 (188 to 255) 390 (358 to 425) 686 (586 to 795) 13.0% (11.9 to 14.2) 14.7% (10.1 to 20.9) 7.40 0.00
Liberia (L) 66 (62 to 70) 94 (81 to 114) 154 (145 to 164) 222 (191 to 267) 11.3% (8.5 to 15.7) 13.7% (8.2 to 23.1) 4.22 0.06
Madagascar (L) 22 (19 to 25) 31 (26 to 35) 70 (61 to 79) 98 (85 to 113) 4.0% (3.6 to 4.5) 5.4% (3.9 to 7.3) 0.77 0.00
Malawi (L) 43 (40 to 45) 51 (43 to 60) 107 (101 to 113) 126 (108 to 149) 9.8% (8.9 to 11.0) 7.9% (5.4 to 10.9) 3.71 0.01
Mali (L) 30 (27 to 32) 39 (34 to 44) 80 (74 to 87) 105 (92 to 118) 3.0% (2.3 to 3.6) 2.5% (1.6 to 3.8) 2.58 0.00
Mauritania (LM) 65 (59 to 71) 93 (81 to 106) 210 (192 to 231) 301 (263 to 342) 3.7% (3.2 to 4.2) 3.7% (2.7 to 5.2) 5.17 0.00
TABuLATEd dATA | 133

134 | FINANCING GLOBAL HEALTH 2020
Health spending per person, 2019 and 2050 (2020 uS dollars)
Health spending per person, 2019 and 2050 (2020 purchasing power parity-adjusted dollars)
Total health spending per gross domestic product, 2019 and 2050
CoViD-19 development assistance received for health per person
(2020 uS dollars)
Development assistance for health systems strengthening per person
(2020 uS dollars)
2019 2050 2019 2050 2019 2050 2020 2020
Mozambique (L) 36 (34 to 38) 43 (35 to 54) 100 (95 to 106) 121 (97 to 151) 7.4% (7.0 to 7.9) 4.9% (3.3 to 7.3) 3.35 0.04
Namibia (UM) 410 (382 to 441) 806 (702 to 930) 964 (899 to 1,039) 1,897 (1,652 to 2,190) 9.4% (8.7 to 10.1) 15.0% (10.6 to 20.4) 4.27 0.00
Niger (L) 30 (29 to 32) 37 (34 to 42) 71 (67 to 75) 87 (78 to 97) 5.5% (5.2 to 5.8) 5.5% (3.9 to 7.4) 4.36 0.02
Nigeria (LM) 81 (73 to 90) 106 (91 to 123) 192 (173 to 213) 249 (215 to 290) 3.5% (3.2 to 3.9) 3.4% (2.5 to 4.8) 1.06 0.07
Rwanda (L) 53 (47 to 59) 96 (76 to 119) 153 (137 to 172) 278 (221 to 344) 6.6% (5.8 to 7.5) 8.6% (5.7 to 12.5) 3.10 0.01
Senegal (LM) 66 (60 to 74) 90 (80 to 102) 158 (142 to 176) 215 (191 to 243) 4.4% (4.0 to 4.9) 4.4% (3.2 to 5.9) 4.39 0.05
Sierra Leone (L) 73 (66 to 81) 110 (95 to 128) 241 (217 to 269) 363 (312 to 422) 13.4% (12.0 to 14.9) 14.9% (10.5 to 20.5) 3.76 0.39
Somalia (L) 7 (6 to 8) 9 (8 to 11) 21 (19 to 23) 28 (24 to 33) 5.4% (4.7 to 6.2) 6.4% (4.9 to 8.5) 3.56 0.00
South Africa (UM) 478 (448 to 513) 766 (666 to 890) 1,202 (1,128 to 1,290) 1,927 (1,675 to 2,238) 9.1% (8.5 to 9.8) 14.2% (10.8 to 18.2) 3.76 0.02
South Sudan (L) 29 (27 to 30) 34 (30 to 41) 83 (79 to 88) 100 (88 to 119) 9.3% (4.3 to 15.8) 11.1% (4.3 to 20.5) 7.92 0.00
São Tomé and PrÍncipe (LM) 117 (109 to 125) 183 (134 to 258) 234 (219 to 252) 367 (268 to 518) 5.6% (5.3 to 6.0) 6.3% (4.0 to 9.9) 32.36 0.00
Tanzania (LM) 40 (37 to 43) 54 (42 to 71) 103 (95 to 111) 140 (108 to 183) 3.7% (3.1 to 4.3) 3.6% (2.3 to 5.4) 0.66 0.03
The Gambia (L) 39 (38 to 41) 49 (44 to 55) 118 (113 to 124) 147 (132 to 166) 5.0% (4.8 to 5.3) 4.6% (3.4 to 6.2) 7.21 0.00
Togo (L) 40 (37 to 44) 62 (54 to 71) 96 (88 to 105) 146 (128 to 169) 5.2% (3.9 to 6.4) 5.9% (3.7 to 8.4) 3.13 0.00
Uganda (L) 46 (43 to 50) 55 (48 to 62) 131 (121 to 142) 154 (135 to 176) 5.7% (4.5 to 7.6) 4.3% (2.6 to 6.8) 2.22 0.04
Zambia (LM) 62 (58 to 67) 76 (59 to 102) 205 (191 to 222) 252 (193 to 336) 5.6% (5.1 to 6.1) 5.1% (3.4 to 7.4) 1.96 0.06
Zimbabwe (LM) 75 (69 to 83) 108 (90 to 130) 211 (194 to 231) 303 (253 to 364) 7.1% (6.5 to 7.8) 8.3% (5.8 to 11.5) 5.18 0.00
eSwatini (LM) 226 (215 to 238) 340 (296 to 389) 593 (563 to 625) 893 (775 to 1,021) 6.4% (6.0 to 6.8) 6.6% (4.4 to 9.0) 11.00 0.00
Source: Financing Global Health Database 2020
*World Bank income groups are indicated in parentheses following country name. H = high-income; UM = upper-middle-income; LM = lower-middle-income; L = low-income.
Estimates for Venezuela are presented as 2014 USD.
TaBle B4, CoNT. Total health spending by World Bank income group, global Burden of Disease super-region, and country, 2019 and 2050, and development assistance for health specific to COVID-19 and health systems strengthening, 2020
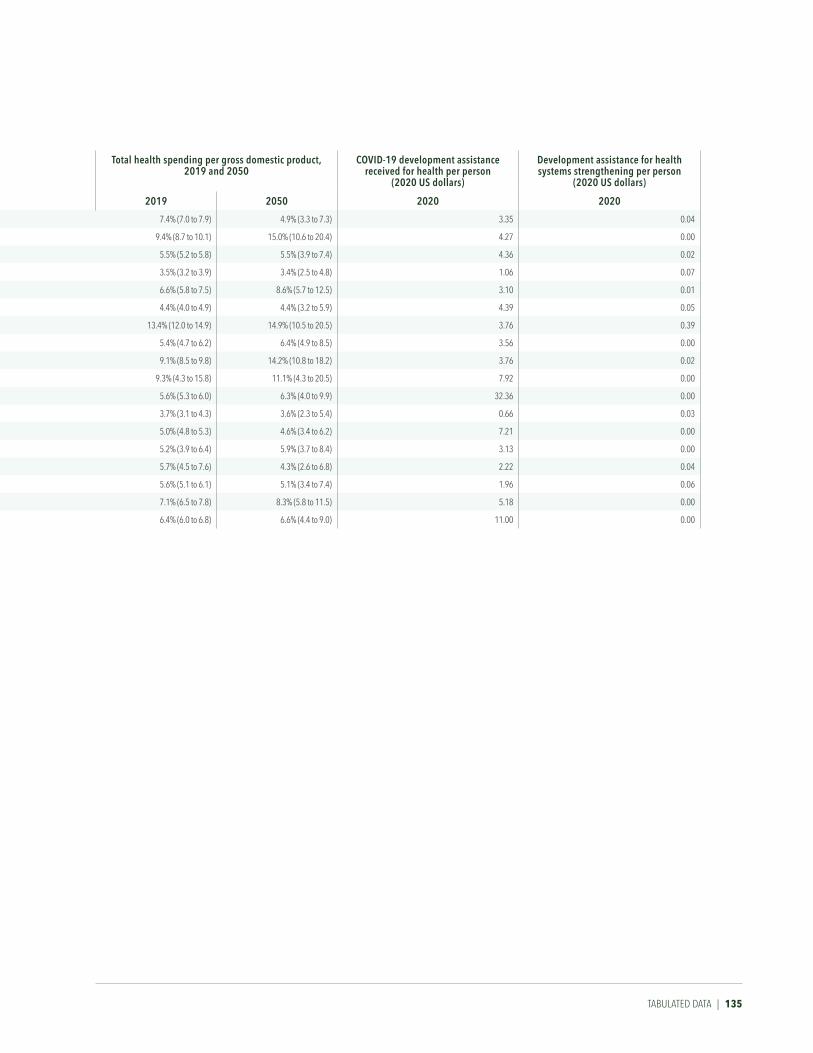
Health spending per person, 2019 and 2050 (2020 uS dollars)
Health spending per person, 2019 and 2050 (2020 purchasing power parity-adjusted dollars)
Total health spending per gross domestic product, 2019 and 2050
CoViD-19 development assistance received for health per person
(2020 uS dollars)
Development assistance for health systems strengthening per person
(2020 uS dollars)
2019 2050 2019 2050 2019 2050 2020 2020
Mozambique (L) 36 (34 to 38) 43 (35 to 54) 100 (95 to 106) 121 (97 to 151) 7.4% (7.0 to 7.9) 4.9% (3.3 to 7.3) 3.35 0.04
Namibia (UM) 410 (382 to 441) 806 (702 to 930) 964 (899 to 1,039) 1,897 (1,652 to 2,190) 9.4% (8.7 to 10.1) 15.0% (10.6 to 20.4) 4.27 0.00
Niger (L) 30 (29 to 32) 37 (34 to 42) 71 (67 to 75) 87 (78 to 97) 5.5% (5.2 to 5.8) 5.5% (3.9 to 7.4) 4.36 0.02
Nigeria (LM) 81 (73 to 90) 106 (91 to 123) 192 (173 to 213) 249 (215 to 290) 3.5% (3.2 to 3.9) 3.4% (2.5 to 4.8) 1.06 0.07
Rwanda (L) 53 (47 to 59) 96 (76 to 119) 153 (137 to 172) 278 (221 to 344) 6.6% (5.8 to 7.5) 8.6% (5.7 to 12.5) 3.10 0.01
Senegal (LM) 66 (60 to 74) 90 (80 to 102) 158 (142 to 176) 215 (191 to 243) 4.4% (4.0 to 4.9) 4.4% (3.2 to 5.9) 4.39 0.05
Sierra Leone (L) 73 (66 to 81) 110 (95 to 128) 241 (217 to 269) 363 (312 to 422) 13.4% (12.0 to 14.9) 14.9% (10.5 to 20.5) 3.76 0.39
Somalia (L) 7 (6 to 8) 9 (8 to 11) 21 (19 to 23) 28 (24 to 33) 5.4% (4.7 to 6.2) 6.4% (4.9 to 8.5) 3.56 0.00
South Africa (UM) 478 (448 to 513) 766 (666 to 890) 1,202 (1,128 to 1,290) 1,927 (1,675 to 2,238) 9.1% (8.5 to 9.8) 14.2% (10.8 to 18.2) 3.76 0.02
South Sudan (L) 29 (27 to 30) 34 (30 to 41) 83 (79 to 88) 100 (88 to 119) 9.3% (4.3 to 15.8) 11.1% (4.3 to 20.5) 7.92 0.00
São Tomé and PrÍncipe (LM) 117 (109 to 125) 183 (134 to 258) 234 (219 to 252) 367 (268 to 518) 5.6% (5.3 to 6.0) 6.3% (4.0 to 9.9) 32.36 0.00
Tanzania (LM) 40 (37 to 43) 54 (42 to 71) 103 (95 to 111) 140 (108 to 183) 3.7% (3.1 to 4.3) 3.6% (2.3 to 5.4) 0.66 0.03
The Gambia (L) 39 (38 to 41) 49 (44 to 55) 118 (113 to 124) 147 (132 to 166) 5.0% (4.8 to 5.3) 4.6% (3.4 to 6.2) 7.21 0.00
Togo (L) 40 (37 to 44) 62 (54 to 71) 96 (88 to 105) 146 (128 to 169) 5.2% (3.9 to 6.4) 5.9% (3.7 to 8.4) 3.13 0.00
Uganda (L) 46 (43 to 50) 55 (48 to 62) 131 (121 to 142) 154 (135 to 176) 5.7% (4.5 to 7.6) 4.3% (2.6 to 6.8) 2.22 0.04
Zambia (LM) 62 (58 to 67) 76 (59 to 102) 205 (191 to 222) 252 (193 to 336) 5.6% (5.1 to 6.1) 5.1% (3.4 to 7.4) 1.96 0.06
Zimbabwe (LM) 75 (69 to 83) 108 (90 to 130) 211 (194 to 231) 303 (253 to 364) 7.1% (6.5 to 7.8) 8.3% (5.8 to 11.5) 5.18 0.00
eSwatini (LM) 226 (215 to 238) 340 (296 to 389) 593 (563 to 625) 893 (775 to 1,021) 6.4% (6.0 to 6.8) 6.6% (4.4 to 9.0) 11.00 0.00
TABuLATEd dATA | 135

Hans Rosling Center for Population HealthINSTITUTE FOR HEALTH METRICS AND EVALUATION
3980 15th Avenue NE
Box 351616
Seattle, WA 98195-1616USA
Telephone: +1-206-897-2800 Fax: +1-206-897-2899
Email: [email protected]
Related Documents