Financing Frictions and the Substitution Between Internal and External Funds* Heitor Almeida Murillo Campello University of Illinois & NBER University of Illinois & NBER [email protected] [email protected] This Draft: September 9, 2008 Abstract Ample evidence points to a negative relation between internal funds (profitability) and the demand for external funds (debt issuance). This relation has been interpreted as evidence supporting the pecking order theory. We show, however, that the negative effect of internal funds on the demand for external financing is concentrated among firms that are least likely to face high external financing costs (firms that distribute large amounts of dividends, that are large, and whose debt is rated). For firms in the other end of the spectrum (low payout, small, and unrated), external financing is insensitive to internal funds. These cross- firm differences hold separately for debt and equity, and are magnified in the aftermath of macroeconomic movements that tighten financing constraints. We argue that the greater complementarity between internal funds and external finance for constrained firms is a consequence of the interdependence of their financing and investment decisions. Key words: Capital structure, external financing, pecking order, financial constraints, transaction costs, investment, business cycles. JEL classification: G31. *We thank Mike Faulkender, Murray Frank, João Gomes, Kathy Kahle, Dave Ikenberry, Bob McDonald, Mike Weisbach, Paulo Terra, Jing Yang, Jeff Wurgler, participants at the 2008 AFA meetings, the 2007 EFMA conference, the 2008 Brazilian Finance Association Meeting, and in particular an anonymous referee, Long Chen, and Dirk Hackbarth for their helpful comments and suggestions. Joongho Han and Marco Rocha provided excellent research assistance. The usual disclaimer applies.

Welcome message from author
This document is posted to help you gain knowledge. Please leave a comment to let me know what you think about it! Share it to your friends and learn new things together.
Transcript
Financing Frictions and the Substitution BetweenInternal and External Funds*
Heitor Almeida Murillo CampelloUniversity of Illinois & NBER University of Illinois & NBER
[email protected] [email protected]
This Draft: September 9, 2008
Abstract
Ample evidence points to a negative relation between internal funds (profitability) and the demand forexternal funds (debt issuance). This relation has been interpreted as evidence supporting the pecking ordertheory. We show, however, that the negative effect of internal funds on the demand for external financingis concentrated among firms that are least likely to face high external financing costs (firms that distributelarge amounts of dividends, that are large, and whose debt is rated). For firms in the other end of thespectrum (low payout, small, and unrated), external financing is insensitive to internal funds. These cross-firm differences hold separately for debt and equity, and are magnified in the aftermath of macroeconomicmovements that tighten financing constraints. We argue that the greater complementarity between internalfunds and external finance for constrained firms is a consequence of the interdependence of their financingand investment decisions.
Key words: Capital structure, external financing, pecking order, financial constraints, transaction costs,investment, business cycles.
JEL classification: G31.
*We thank Mike Faulkender, Murray Frank, João Gomes, Kathy Kahle, Dave Ikenberry, Bob McDonald,Mike Weisbach, Paulo Terra, Jing Yang, Jeff Wurgler, participants at the 2008 AFA meetings, the 2007EFMA conference, the 2008 Brazilian Finance Association Meeting, and in particular an anonymous referee,Long Chen, and Dirk Hackbarth for their helpful comments and suggestions. Joongho Han and Marco Rochaprovided excellent research assistance. The usual disclaimer applies.
I. Introduction
Corporate managers in the US and Europe claim that maintaining “financial flexibility” is the
primary objective of their firms’ financial policies (see Graham and Harvey (2001) and Bancel and
Mittoo (2002)). Their stated policies are consistent with the goal of ensuring funding for present and
future investment undertakings in a world where financing frictions force firms to pass up profitable
opportunities. In spite of this observation, empirical work on capital structure tends to overlook the
interplay between corporate investment and financing decisions. Most recent papers take invest-
ment as exogenous to financial policy, and focus on issues such as the relative costs of issuing debt
versus equity (e.g., Shyam-Sunder and Myers (1999) and Fama and French (2002, 2005)), market
timing (Baker and Wurgler (2002)), security return dynamics (Welch (2004)), and the relevance of
elements of the tradeoff theory; taxes and financial distress costs (Hovakimian et al. (2001)). While
these issues are undoubtedly important for our understanding of corporate financial policies, the
literature often abstracts from crucial aspects influencing the supply and demand for external funds
across firms: capital market imperfections and real investment demand.
In this paper we study the implications of investment—financing interactions for external financ-
ing decisions. To understand those interactions, we focus on one of the key stylized facts of the
empirical capital structure literature, namely the finding that more profitable firms demand less ex-
ternal finance. In contrast to the extant literature (e.g., Myers (1993) and Fama and French (2002)),
we argue that this finding should not be interpreted as evidence for external financing costs arising
from asymmetric information (à la pecking order theory). Our main argument is simple. If the
negative relation between internal funds and the demand for external financing is due to external
financing costs, then this relation should be more strongly negative in situations in which external
financing costs are high. Remarkably, we show new, robust evidence that this negative relation
is concentrated among firms that are least likely to face strong financing frictions. The negative
relation between profits and external financing that we observe for financially unconstrained firms is
consistent with the relevance of adjustment costs in issuance decisions. Our evidence suggests that
the greater complementarity between internal and external funds among constrained firms arises
from the effect of endogenous investment on external financing decisions.
To illustrate our basic argument, consider first a situation in which firms face little or no frictions
when raising funds for positive NPV projects (i.e., firms are “financially unconstrained”). Notably,
these firms are less likely to suffer from asymmetric information. For an unconstrained firm, invest-
ment spending is exogenous to financing – investment it is only determined by the availability of
profitable opportunities. In the absence of other considerations, theory does not pin down the rela-
tion between profitability and external financing demand among such firms (cf. M&M irrelevance
1

argument). Recent theories, however, suggest that internal funds might be negatively related to ex-
ternal financing demand even if firms are financially unconstrained. For example, Strebulaev (2007)
shows that a dynamic tradeoff model with small adjustment costs can generate a negative cross-
sectional relation between profitability and leverage, due to the presence of inactive firms (those
that optimally choose not to adjust their capital structure) in the cross-section.1 In particular, small
adjustment costs can also generate a negative relation between profitability and issuance activity:
profitable firms may choose, on the margin, to finance investments with internal funds so as to save
on flotation costs. If external financing costs that stem from market imperfections are negligible,
the relation between internal funds and external financing is either undetermined or (more likely)
negative because of adjustment costs.
Consider, in contrast, the case of firms that face higher costs of external financing either be-
cause of asymmetric information, incomplete contractibility, or agency-related issues (“financially
constrained” firms). The standard pecking order argument would suggest that financially con-
strained firms should display an even more negative relation between the availability of internal
funds and the demand for external finance, relative to comparable unconstrained firms. Presum-
ably, constrained firms should be even less likely to tap the external capital markets: for a given
level of investment, profitable constrained firms require less external financing, and should show
lower security issuance activity. Crucially, this argument implicitly assumes that investment is de-
termined before the firm decides the optimal amount of debt and equity to issue. In other words,
the standard pecking order argument ignores the possibility that the firm’s investment choice might
become endogenous to external financing decisions precisely when external financing costs are high.
We argue that the relation between internal funds and external financing is fundamentally af-
fected by the endogeneity of investment when firms are financially constrained. Three different, yet
related effects shape that relation.
First, a financially constrained firm faces a particularly high opportunity cost of investment,
and may therefore use internal funds for additional capital spending rather than reducing its use of
external financing. Secondly, notice that a firm that is financially constrained worries not only about
the funding of current investments, but also future ones. The need to fund future investments under
credit constraints increases the firm’s demand for liquid assets such as cash and working capital.
This effect also decreases the firm’s propensity to use internal funds to reduce external financing.
Lastly, high costs of external finance create a direct complementarity between the generation of
internal funds and the firm’s capacity to raise external finance. To wit, a constrained firm with
high internal funds can direct some of those funds to investments in pledgeable assets, which in turn1Hennessy and Whited (2005) and Lewellen and Lewellen (2006) argue that tax considerations can also generate
a negative relation between profitability and external financing. See also Chen and Zhao (2005).
2

increase the firm’s collateral and its ability to raise additional external funds. Those new external
funds allow for further investment in pledgeable assets, amplifying the positive effect of internal
funds on the demand for external financing (“credit multiplier”).2
All of these effects point to the same direction. Following increases in profitability, a financially
constrained firm may not reduce its demand for external funds. These arguments suggest that, in
contrast to the standard pecking order argument, constrained firms should display a less negative
relation between the availability of internal funds and the demand for external funds, relative to
similar firms that do not face strong financing frictions. This complementarity between internal
funds and external financing arises from the interdependence of financing and investment decisions.
To test these arguments, we empirically examine the relation between financial constraints and
the sensitivity of external financing to internal cash flows. We do so by looking at firms’ propen-
sity to resort to external funding sources (debt and equity issuance) in response to innovations
in profitability (cash flows). Using a large sample of firms over thirty years, we estimate that
propensity for various subsamples partitioned on the basis of the likelihood that firms have con-
strained/unconstrained access to external finance. Following standard literature, we consider four
alternative firm characteristics in identifying constrained and unconstrained subsamples: payout
policy, asset size, bond ratings, and commercial paper ratings.
Under each one of our constraint criteria, we find that the cash flow sensitivity of external
financing is negative and statistically significant for the subsample of financially unconstrained
firms, but indistinguishable from zero for the subsample of constrained firms. Importantly, all
cross-constraint-type differences in internal—external funding sensitivities are statistically and eco-
nomically significant. The patterns that we observe in our base tests remain after various robustness
checks involving changes in empirical specifications, variable construction methods, sampling restric-
tions, and econometric techniques.
Our findings do not support those interpretations of the data that are usually associated with
standard pecking order tests. Because the negative relation between profits and external financing
is concentrated among financially unconstrained firms, it is unlikely that asymmetric information
is the driver of this negative relation. In contrast, since even financially unconstrained firms face
capital structure adjustment costs, our findings are consistent with the presence of those costs.
Crucially, our findings suggest that the endogeneity of investment is a key factor behind external fi-
nancing activities under financing constraints, as evidenced by the greater complementarity between
internal and external financing that we document for constrained firms. Our constrained sample
results are surprising as they cannot be explained away by standard capital structure theories.2Bernanke and Gertler (1989) and Kiyotaki and Moore (1997) provide a full-blown characterization of the credit
multiplier. Firm-level evidence of the credit multiplier can be found in the recent work of Almeida and Campello (2007).
3

Besides performing robustness checks on the reliability of our empirical estimates, we report a
number of additional tests supporting the underlying logic that links endogenous investment to ex-
ternal financing decisions. First, we show evidence that the complementarity between internal and
external funds is particularly pronounced for constrained firms with highly liquid (or “tangible”) as-
sets. As we argue below, the credit multiplier mechanism that links the generation of internal funds
and the firm’s capacity to raise external finance should be particularly pronounced for those firms
whose assets are highly tangible. These findings provide additional evidence that a credit multiplier
mechanism is behind the cross-sectional differences that we uncover in the paper. Second, using a
system-regression framework, we show that the same firms that avoid using cash flows to reduce
external financing demand systematically allocate a large portion of their profits into assets that
can be used to smooth out the investment process (such as cash and other working capital items).
Results from these system-regressions support the conjecture that internal and external financing
policies are determined jointly with investment spending under financing frictions. Finally, we show
evidence that differences in external financing—cash flow sensitivities across constrained and uncon-
strained firm samples are magnified during macroeconomic recessions; that is, precisely at times
when financing constraints are likely to be tightened. These differences-in-differences estimations
further address potential concerns with spurious biases affecting our panel estimations.
We follow the recent capital structure literature in that we focus on firms’ marginal financing
decisions – the issuance of new external financial claims – to learn about financial policy-making
(e.g., Shyam-Sunder and Myers (1999) and Frank and Goyal (2003)). Note, however, that papers in
that literature are generally concerned with firms’ choice between debt versus equity. In contrast,
we focus on the total financing that firms raise in the capital markets; i.e., new debt and equity
issues, and examine the substitution between internal and external funds. Nevertheless, we also
look at how debt and equity financing (separately) respond to variations in cash flows. We find that
the differences across constrained and unconstrained firms that we have identified hold irrespective
of firms’ preferred source of marginal outside financing: the cash flow sensitivities of both debt and
equity financing are significantly more negative for financially unconstrained firms.
One study that is directly related to ours is Lemmon and Zender (2004), who look at the ex-
ternal financing patterns of firms sorted according to whether or not they have easy access to the
capital markets; i.e., have rated bonds. Differently from our study, however, those authors focus
on the determinants of the debt versus equity decision, running “financing-deficit”-type regressions
across samples of constrained and unconstrained firms. Based on cross-sectional differences in the
estimates returned from these regressions, Lemmon and Zender conclude that some of the patterns
observed in the data can be reconciled by the pecking order theory. Consistent with our analysis,
4
Faulkender and Petersen (2006) show that financing constraints – proxied by the absence of a
bond rating – are a key determinant of firms’ capital structure. Faulkender and Petersen argue
that observed leverage ratios endogenize issues related to the supply of funds by outside creditors.
Finally, our study has connections with the literature on real investment under financial con-
straints (see Hubbard (1998) for a review). We add to the financial constraints literature by pro-
viding prima facie evidence that firms often presumed to be financially constrained – those that
pay little or no dividends to investors, those that are small, and those whose debt instruments are
not rated – indeed access the capital markets (and save funds) in ways that are consistent with
the presence of frictions in the availability of funding for their investments.
The remainder of the paper is organized as follows. In the next section we develop the argument
that relates endogenous investment to the sensitivity of external financing to internal funds. Section
III describes our sampling and empirical methods. Sections IV and V present our main empirical
findings. Section VI concludes the paper.
II. Endogenous Investment and the Substitution between Internaland External Financing
The empirical capital structure literature documents a negative association between firm profitabil-
ity and external financing. While most of the literature focuses on the relation between profitability
and leverage levels (e.g., Rajan and Zingales (1995)), the negative association between the avail-
ability of internal funds and the use of external finance also holds for flow measures of external
financing. Leary and Roberts (2005), for example, find that firms that have high cash flows or high
cash balances are less likely to issue (and are more likely to retire) both debt and equity.
Leary and Roberts (2005), like much of the literature, interpret the existing findings as evi-
dence supporting the pecking order theory (see, e.g., Myers (1993) and Fama and French (2002)).
According to the pecking order argument, firms prefer to finance investments with internal funds,
because asymmetric information increases external financing costs (Myers and Majluf (1984) and
Myers (1984)). A preference for internal over external funds would then generate a negative rela-
tion between internal cash flows and external financing: more profitable firms require less external
financing, and should thus show lower security issuance activity. This observed negative relation
would seem inconsistent with standard arguments based on the tradeoff theory of capital structure,
which predicts that because of tax shields more profitable firms should use external funds (i.e., debt)
to finance investments (see, e.g., Graham (2000)).
Recent literature, however, suggests that the negative relation between profitability and external
financing could be due to the presence of (possibly small) adjustment costs (see Strebulaev (2007)).
5

Arguably, all firms face some direct flotation costs when accessing external markets, which lead to
relatively infrequent refinancing decisions. Strebulaev presents evidence that the presence of firms
that do not readjust their capital structure (inactive firms) in random samples generates the well
known negative cross-sectional relation between profits and leverage ratios. In his paper, lever-
age ratios decrease mechanically with profitability for inactive firms, given that equity values are
positively related to profitability. Transaction costs can also generate a negative relation between
profitability and issuance activity. In particular, profitable firms may choose, on the margin, to
finance investments with internal funds so as to save on transaction costs.3
In addition to standard adjustment costs, some firms are also subject to potentially more sub-
stantial costs of external financing. These distinct, additional costs arise from issues such as agency
problems, informational asymmetries, contracting imperfections, and lack of collateral. We call
these costs financing constraint costs. Financing constraint costs, when considered on top of small
adjustment costs, can lead to pronounced distortions in the firm’s investment policy. As a result, for
firms subject to financial constraint costs (financially constrained firms), investment and financing
decisions become interconnected. For example, a constrained firm’s ability to access debt financing
at a fair cost might depend on the amount of collateral that the firm can provide to lenders, which
in turn depends on the amount of investment that the firm can make.
Interactions between investment and financing have been largely ignored in the standard tests of
the pecking order argument. Consistent with the assumption of exogenous (unconstrained) invest-
ment, various previous papers use capital expenditures as an explanatory variable in the right-hand
side of regressions that explain capital structure (as part of the firm’s “financing deficit”). This
testing approach, which follows from Shyam-Sunder and Myers (1999), implicitly assumes that ob-
served investment is equal to desired investment even when the firm faces capital market frictions.
In contrast to this, we argue that the endogeneity of financing and investment decisions influence the
substitution between internal and external funds. To develop these implications in greater detail,
we draw on the literature that examines the impact of capital markets imperfections on investment.
First, if firms’ investments are lower than desired levels because of capital markets imperfections
(i.e., if firms are financially constrained), then their spending should be related to the availability of
internal funds. Essentially, firms with high internal funds will find it advantageous to direct some
of those funds towards incremental investment – which have high marginal product – as opposed
to cutting down on external financing. Conversely, if internal funds decrease, a constrained firm3Hennessy and Whited (2005) and Lewellen and Lewellen (2006) also offer an explanation for the negative relation
between profits and external financing that is not based upon asymmetric information. In their work, debt-related taxbenefits are less attractive when the firm can finance investments with internal funds, because internal financing allowsthe firm to defer taxes on payments to equity holders. As a consequence, more profitable firms may optimally issue lessexternal finance (i.e., debt) than firms that are less profitable (which must choose between debt and outside equity).
6
might be forced to cut down investment because the alternative – i.e., leaving investment constant
and raising additional external funds – might not be feasible. This investment—financing tradeoff
works to mitigate any potential substitution effect between external and internal funds.
This first mechanism underlies the tests of financing constraints first proposed by Fazzari et al.
(1988), and motivates a large empirical literature in economics and finance (see Hubbard (1998)
and Stein (2003) for comprehensive reviews of early literature, and Rauh (2006) for recent empirical
evidence). It is important to note that recent research has pointed to difficulties with the strategy
of looking at the empirical correlation between real and financial variables, stemming from measure-
ment problems in the control for investment opportunities (see, e.g., Erickson and Whited (2000),
Gomes (2001), and Cummins et al. (2006)). Our test design avoids the explicit modeling of real
variables, and our estimations recognize the possibility that well-known biases could underlie infer-
ences with the sorts of empirical models we estimate. Among other expedients, we adopt empirical
strategies that directly address the measurement error problem (e.g., Cummins et al. (2006)).
The second mechanism is related to the effect of future investment on current financing choices.
A firm that faces costly external financing should worry not only about current investment needs, but
also about future ones. One way that the firm can secure future investment spending is by increasing
its holdings of cash, securities, and other liquid assets that can be used to smooth out the investment
process (e.g., working capital). For constrained firms, holdings of liquid assets are an additional
competing use of internal funds. In other words, firms that face high costs of external financing may
find it optimal to direct cash flows towards liquid assets when they observe high profitability (see
Fazzari and Petersen (1993) and Almeida et al. (2004) for evidence). Conversely, if profitability is
low, constrained firms may draw down their stocks of liquid assets to avoid raising costly external
financing. The optimal management of liquid assets is another reason why constrained firms should
display a lower propensity to use cash flows towards the reduction of external financing.
In order to test whether external financing and liquid asset holdings are simultaneously deter-
mined, we estimate a system of regressions in which both these variables are endogenous. This
approach allows us to test the hypothesis that those firms that avoid using external financing to
absorb changes in internal funds also direct internal funds towards holdings of liquid assets.4
The third mechanism affecting the substitution between internal and external financing is related
to the firm’s capacity to raise external finance. Constrained firms’ ability to raise external financing
is likely to covary positively with variations in internal cash flows, either because external financing
costs decrease when cash flows are high (Bernanke and Gertler (1989)), or because the value of col-4Our tests on liquid asset holdings draw on Almeida et al. (2004). However, while Almeida et al. use only cash
on the left-hand side of their empirical models, the tests of this paper use a broader measure of liquid asset holdingsthat also include working capital items (such as inventory and accounts receivables). This modification is importantto consider because cash and working capital can be close substitutes (see, for example, Bates et al. (2006)).
7

lateral increases with internal cash flows (Kiyotaki and Moore (1997)). Following a positive income
shock, firms invest more, therefore increasing their holdings of tangible assets. These assets create
new collateral, which in turn allow the firm to raise more external finance (“credit multiplier”). The
credit multiplier mechanism suggests that internal funds and external finance should become more
complementary for firms that are financially constrained. This mechanism provides yet another rea-
son why the relation between internal funds and external finance should be less negative than what
one would expect in the absence of an endogenous link between investment and financing decisions.
Our empirical analysis also explores the rationale behind the credit multiplier by identifying
situations in which this mechanism is more likely to become important. First, the credit multiplier
mechanism should be stronger for firms that have more tangible assets, because an increase in cash
flow will have a greater impact on collateral value for this group of firms (see Almeida and Campello
(2007)). Accordingly, internal funds and external finance should be even more complementary for
constrained firms that have highly tangible assets. Second, prior research also suggests that the
credit multiplier matters more during recessions and monetary contractions, when financing con-
straints are more likely to bind (see, e.g., Kashyap et al. (1994), Gertler and Gilchrist (1994), and
Calomiris et al. (1995)). Accordingly, we examine the extent to which the sensitivity of external
financing to internal funds varies with the business cycle for different types of firms. Presumably,
it is more likely that internal funds and external finance become complementary under economic
conditions that are associated with tighter financing constraints.
The theories of interest for our analysis (pecking order, adjustment costs, and endogenous in-
vestment driven by financing constraints) have distinct predictions for the substitutability between
internal and external funds across constrained and unconstrained firm samples. Let’s summarize
these predictions.
Unconstrained Firms. The adjustment costs argument suggests that even in the absence of high
costs of external financing there should be a negative relation between profitability and the use
of external finance (cf. Strebulaev (2007)). The presence of adjustment costs – which are rele-
vant for all firms – implies that the relation between profitability and external financing might
be negative for financially unconstrained firms: on the margin, these firms finance their profitable
investment projects with internal (as apposed to external) funds, thereby economizing on transac-
tions costs. Neither the pecking order nor financial constraints arguments make clear predictions
about financially unconstrained firms, since these firms should be characterized by low asymmetry
of information and exogenous investment. Greater substitutability between internal and external
funds for unconstrained firms would be more consistent with the adjustment costs arguments.
Constrained Firms. The standard pecking order story with exogenous investment would suggest
8

that the relation between profits and external financing should become more strongly negative
when firms are financially constrained, since these firms are more likely to suffer from information
asymmetry. In contrast, as discussed above, if investment and external financing are endogenously
determined, then internal funds and external finance should become more complementary, relative
to a situation in which firms are financially unconstrained. The predictions of the adjustment cost
argument for the constrained samples depend on whether adjustment costs are higher or lower for
constrained firms. We are unaware of any evidence suggesting that constrained firms have lower
adjustment costs. On the contrary, the existing empirical literature suggests that adjustment costs
are higher for the types of firms that are typically classified as financially constrained.5 Greater
complementarity between internal and external funds for constrained firms would be more consistent
with evidence of an endogenous link between investment and financing decisions.
To provide evidence for these arguments we perform the following sets of tests:
(1) Single-Equation Tests: We relate the sensitivity of external financing (debt and equity is-
suance) to innovations in profitability (cash flows), both for constrained and unconstrained
firms. If investment and external financing are jointly determined, then we expect this sensi-
tivity to be less negative for constrained firms than for unconstrained firms.
(2) System-Equation Tests: We relate both external financing and liquid asset holdings to in-
novations in cash flows in a system of seemingly unrelated regressions (SUR), separately for
constrained and unconstrained firms. If investment and external financing are jointly deter-
mined, then the same set of constrained firms that display a less negative sensitivity of external
financing to cash flow innovations should also display a more positive sensitivity of liquid asset
holdings (cash, inventory, etc.) to cash flows, relative to unconstrained firms.
(3) Credit Multiplier Tests: We examine whether asset tangibility affects the sensitivity of ex-
ternal financing to innovations in profitability both for constrained and unconstrained firms.
If investment and external financing are jointly determined, then we expect tangibility to in-
crease the complementarity between internal and external funds for constrained firms, but not
for unconstrained ones.
(4) Differences-in-Differences Tests: We examine the time-series properties of the cash flow sensi-
tivity of external financing of constrained and unconstrained firms. If investment and external5For example, Altinkilic and Hansen (2000) find that smaller and riskier firms face higher adjustment costs for
both debt and outside equity (see also Kim et al. (2003)). Fischer et al. (1989) argue that because small issuesincur larger proportional adjustment costs, and because issue size is correlated with firm size, small firms should havehigher adjustment costs. They report evidence that the range of observed debt ratios is higher for small firms, whichis consistent with higher adjustment costs. On the other hand, Corwin (2003) does not find a clear link between SEOunderpricing and firm size.
9
financing are jointly determined, then the sensitivity should become more positive for con-
strained firms (greater complementarity) during periods in which financial constraints are more
likely to bind (e.g., economic recessions). We expect no such pattern for unconstrained firms.
III. Sample and Methodology
A. Sample
To test our predictions we use a sample of firms taken from COMPUSTAT’s P/S/T, Full Coverage,
and Research annual tapes over a three-decade window from 1971 to 2001.6 Our sampling disregards
observations from financial institutions (SICs 6000—6999), utilities (SICs 4900—4999), and not-for-
profit organizations and governmental enterprises (SICs greater than 8000). We require firms to
provide valid information on their total assets, sales, debt, market capitalization, and operating
income (cash flows). We deflate all series to 1971 dollars.
Our data selection criteria and variable construction approach follows that of Almeida et al.
(2004), who study the impact of financing constraints on the management of internal funds, and
that of Frank and Goyal (2003), who look at external financing decisions. Following Almeida et al.,
we discard from the raw data those firm-years for which the value of assets is less than $5 million,
and those displaying asset growth exceeding 100%.7 We further request that firm annual sales
exceed $1 million in order to minimize the sampling of distressed firms. We use the flow of funds
account series detailed in Frank and Goyal to construct our empirical proxies. Differently from those
authors, however, we do not trim any of the variables at their extreme percentiles. Instead we place
limits on variables’ distributions based on economic intuition. For instance, we eliminate firm-years
for which debt exceeds total assets (near-bankruptcy firms), and those whose market-to-book asset
ratio (or Q, our basic proxy for investment opportunities) is either negative or greater than 10 (see
Gilchrist and Himmelberg (1995)).
Our final sample consists of observations from 10,031 individual firms (72,851 firm-years). Table
1 reports summary statistics for the main variables used in our tests. Since our sampling approach
and variable construction criteria follow the literature, it is not surprising that the numbers we
report in Panel A (statistics for the whole sample) resemble those found in related studies (see, e.g.,6We start collecting our sample from 1971 because the flow of funds data is not available prior to that year. The
tests of this paper only consider security issuance activities that generate actual flows of funds from the financialmarkets into the firm (and vice-versa). Our results are immune to Fama and French’s (2005) criticism that existingstudies in the literature fail to account for events that change a firm’s observed capital structure – such as mergersand granting of stocks to managers – but produce no cash flows to the firm.
7The first screen eliminates from the sample those firms with severely limited access to the public markets; theinternal—external funding interplay that we examine requires the firm to have active (albeit potentially constrained)access to funds from the financial markets. The second screen eliminates those firm-years registering large jumps intheir business fundamentals; these are typically indicative of major corporate events.
10

Frank and Goyal (2003) and Lemmon and Zender (2004)). In the interest of brevity, we omit the
discussion of the descriptive statistics of our (standard) sample.
− insert Table 1 here −
B. Methodology
Our goal is to provide evidence on the relation between internal funds and external finance for
constrained and unconstrained firms. In order to do this, we need to specify an empirical model
relating firms’ issuance of external financing instruments and cash flows, and also to empirically
identify financially constrained and unconstrained firms. We tackle these two issues in this section.
1. Empirical Models of External Financing
We use two alternative specifications to empirically model the cash flow sensitivity of external fi-
nancing. The first specification is a parsimonious one, in addition to firm size, it only includes
proxies for variables that we believe will capture information related to the primitives of our story:
cash flows and investment opportunities. Define ExternalFinancing as the ratio of the total net
equity issuances (COMPUSTAT’s item #108 — item #115) plus net debt issuances (item #111 —
item #114) to total book value of assets (item #6). CashFlow is defined as the ratio of earnings
before extraordinary items plus depreciation and amortization (item #123 + item #125) to total
book assets. Our proxy for investment opportunities, Q, is computed as the market value of assets
divided by the book value of assets, or (item #6 + (item #199 × item #25) − item #60 − item#74) / (item #6). Our baseline empirical model can be written as:
(1) ExternalF inancingi,t = α1CashF lowi,t + α2Qi,t + α3Sizei,t +Xi
firmi +Xt
yeart + εi,t,
where Size is the natural log of sales (item #12), and firm and year absorb firm- and time-specific
effects, respectively.
We focus on the effect of cash flows on the issuance of financing instruments, as captured by α1
in Eq. (1). In addition, financing decisions should also be influenced by the attractiveness of future
investment opportunities. Noting the difficulty in empirically measuring those opportunities, our
baseline model uses Q to capture information about the value of long-term growth options that are
available to the firm. We, however, acknowledge the limitations of empirical Q and later propose
alternative specifications that sidestep those limitations. We include firm size in our baseline spec-
ification because accessing external funds may entail fixed costs; on the margin, the larger firms
within a given subset of firms could be more favorably predisposed to substitute between internal
and external funds due to economies of scale. Finally, we explicitly control for biases stemming from
11

unobserved individual heterogeneity and time idiosyncrasies by expunging firm- and time-fixed ef-
fects from our sample. In fitting the data, we allow residuals to be correlated within years using
the “sandwich” (or Huber-White) variance/covariance matrix estimator.
An alternative estimate of the cash flow sensitivity of external financing is obtained from a spec-
ification in which a firm’s decision to issue public securities in face of cash flow innovations takes
into account the firm’s pre-existing stock of internal funding/wealth and its ex-ante financial struc-
ture. Here, we borrow insights from the literature on investment demand (e.g., Fazzari and Petersen
(1993) and Schiantarelli and Sembenelli (2000)), on liquidity demand (Almeida et al. (2004)), and
on capital structure (e.g., Rajan and Zingales (1995)), and model the annual net issuances also
as a function of the beginning-of-the-year stock of cash and liquid securities (CashHoldings), ac-
counts receivables and inventory items (Inventory), gross plant, property and equipment (PPE),
and debt/equity ratios (Debt/Equity):
ExternalF inancingi,t = α1CashFlowi,t + α2Qi,t + α3S izei,t(2)
+α4CashHoldingsi,t−1 + α5Inventoryi,t−1
+α6PPEi,t−1 + α7Debt/Equityi,t−1
+Xi
firmi +Xt
yeart + εi,t.
We control for pre-existing stocks of cash holdings and other working capital items because a firm
can use these alternative components of internal wealth to accommodate shocks to cash flows. As in
previous research, a firm’s stock of fixed assets and its lagged capital structure enter as additional
determinants of the amount of new external financing that it obtains.8
In estimating equation (2), we explicitly recognize the endogeneity of corporate policies such as
the accumulation of assets (e.g., cash) that can be quickly liquidated in order to absorb cash flow
shocks as well as pre-existing capital structure. We do so in a GMM framework. Identifying instru-
ments for endogenous regressors is never an obvious task, but the combination of some economic
introspection and thorough testing of the validity and relevance of the selected set of instruments
will help ensure the reliability of our GMM estimates. In particular, we conjecture that past lags of
the included variables will convey only negligible (if any) additional information to what is already
contained in the right-hand side of (2); yet those same lags should be reasonably correlated with
the included regressors. Accordingly, we use lags two and three of the included endogenous re-
gressors (CashHoldings, Inventory, PPE, and Debt/Equity) in addition to the exogenous regressors
(CashFlow, Q, and Size) as instruments in (2). Instrument validity is checked via Hansen’s (1982)8All variables are scaled by total assets, with the exception of Debt/Equity. Accordingly, CashHoldings is
computed as the COMPUSTAT’s item #1 divided by item #6. Inventory is equal to item #2 plus item #3, dividedby item #6. PPE is item #8 divided by item #6. Debt/Equity is item #9 plus item #34, divided by item #216.
12

J -statistic, which in light of our instrument set, reduces to a χ2 (4) statistic. Instrument relevance
can be determined from the excluded instruments’ squared partial correlations, which are essentially
the partial F -statistics from the first stage regressions of the endogenous regressors on the excluded
instruments in the system (see Bound et al. (1995)).9
2. Financial Constraints Criteria
Testing the implications of our model requires separating firms according to a priori measures of the
financing frictions that they face. There are a number of plausible approaches to sorting firms into
“financially constrained” and “financially unconstrained” categories. We do not have strong priors
about which approach is best and use a of variety alternative schemes to partition our sample:
• Scheme #1: In every year over the 1971 to 2001 period, we rank firms based on their payoutratio and assign to the financially constrained (unconstrained) group those firms in the bottom
(top) three deciles of the annual payout distribution. We compute the payout ratio as the ra-
tio of total distributions (dividends and repurchases) to operating income. The intuition that
financially constrained firms have significantly lower payout ratios follows from Fazzari et al.
(1988), among many others, in the financial constraints literature.10 In the capital structure
literature, Fama and French (2002) use payout ratios as a measure of difficulties firms may
face in assessing the financial markets.
• Scheme #2: We rank firms based on their asset size over the 1971 to 2001 period, and assign tothe financially constrained (unconstrained) group those firms in the bottom (top) three deciles
of the size distribution. The rankings are again performed on an annual basis. This approach
resembles that of Gilchrist and Himmelberg (1995), who also distinguish between groups of
financially constrained and unconstrained firms on the basis of size. Fama and French (2002)
and Frank and Goyal (2003) also associate firm size with the degree of external financing fric-
tions. The argument for size as a good observable measure of financial constraints is that small
firms are typically young, less well known, and thus more vulnerable to credit imperfections.
• Scheme #3: We retrieve data on firms’ bond ratings and categorize those firms that never hadtheir public debt rated during our sample period as financially constrained. Given that uncon-
9Equation (2) has four variables that we take to be endogenous. In establishing instrument relevance in theregressions below, we only report the lowest of the four first-stage F -statistics – i.e., in order to ensure robustness,we gauge the quality of our instruments based on the weakest of their associated test statistics.10The deciles are set according to the distribution of the payout ratio reported by the firms (rather than according
to the distribution of the reporting firms), which yields an unequal number of observations being assigned to eachof our constraint groups. For example, since many firms have a zero payout ratio, we have more payout-constrainedfirms than unconstrained ones. Our approach ensures that we do not assign firms with low payouts to the financiallyunconstrained group, and that firms with similar payouts are assigned to the same group.
13
strained firms may choose not to use debt financing and hence not obtain a debt rating, we only
assign to the constrained subsample those firm-years that both lack a rating and report positive
debt (see Faulkender and Petersen (2006)).11 Financially unconstrained firms are those whose
bonds have been rated during the sample period. Related approaches for characterizing finan-
cial constraints are used by Gilchrist and Himmelberg (1995) and Lemmon and Zender (2004).
• Scheme #4: We retrieve data on firms’ commercial paper ratings and categorize as financiallyconstrained those firms that never display any ratings during our sample period. Observations
from those firms are only assigned to the constrained subsample in years in which positive
debt is reported. Firms that issued commercial papers receiving ratings at some point dur-
ing the sample period are considered unconstrained. This approach follows from the work of
Calomiris et al. (1995) on the characteristics of commercial paper issuers.
Panel B of Table 1 reports summary statistics separately for constrained and unconstrained sub-
samples. The cross-sample differences between constrained and unconstrained firms are consistent
with expectations and with other papers in the literature. For example, constrained firms have
lower cash flows, higher Qs, are smaller, hold higher amounts of cash, and have less tangible assets.
Table 2 reports the number of firm-years under each of the eight financial constraint categories
used in our analysis. According to the payout scheme, for example, there are 30,947 financially
constrained firm-years and 22,530 financially unconstrained firm-years. The table also shows the
extent to which those classification schemes are correlated. For example, out of the 30,947 firm-years
considered constrained according to payout, 13,637 are also constrained according to size, while a
much lower number, or 5,027 firm-years, are considered unconstrained. The remaining firm-years
represent payout-constrained firms that are neither constrained nor unconstrained according to size.
In general, there is a positive correlation among the four measures of financial constraints. However,
the table also makes it clear that these cross-group correlations are far from perfect. It should be
difficult to find consistent results across all of these partition schemes unless they capture some
dimension of a common financing constraint phenomenon.
− insert Table 2 here −11Firms with no bond rating and no debt are considered unconstrained, but our results are not affected if we treat
these firms as neither constrained nor unconstrained. We use the same criterion for firms with no commercial paperrating and no debt in scheme #4 below. In the robustness checks, we restrict the sample to the period where firms’bond ratings are observed every year (from 1986 to 2001), allowing firms to migrate across constraint categories.
14

IV. Baseline Empirical Findings
We start our analysis by estimating equation (1) over our entire sample (pooling together financially
constrained and unconstrained firms). We do so with the goal of verifying that well-documented
patterns in the relation between firm profitability and external financing are present in our data.
This first test returns the following estimates (t-statistics in parenthesis):
(3) ExternalF inancingi,t = −0.0269(−4.79)
×CashFlowi,t+0.0038(4.36)
×Qi,t+0.0081(7.32)
×Sizei,t, R2 = 0.35.
The coefficient associated with CashFlow displays the usual, negative association between external
financing and profitability. That coefficient is very similar, for example, to the profitability coeffi-
cients reported by Leary and Roberts (2005) in their issuance/retirement regressions for debt and
equity securities (see Table V in their paper). In other words, despite differences in specification,
our testing framework reproduces the standard negative relation between profitability and external
financing. We now turn to the cross-sectional and time-series properties of the internal—external
funding relation.
A. Substitution between Internal and External Funds: Constrained versus Un-constrained Firms
Table 3 presents the results from the estimation of our baseline regression model (equation (1))
within each of the constrained/unconstrained partition schemes described in the last section. A total
of eight estimated equations are reported in the table (4 constraint criteria× 2 constraint categories).Under each one of the constraint criteria considered, the set of financially unconstrained firms dis-
play significantly negative sensitivities of external financing to cash flow – these sensitivities are all
significant at better than 1% test level. In economic terms, the estimates in the table suggest that for
each dollar of internal cash flow shortfall (normalized by assets), an unconstrained firm will seek for
up to 27 cents in new external financing. In sharp contrast, the estimated external financing—cash
flow sensitivities in the constrained samples are much less negative (around 1 or 2 cents), and always
statistically insignificant. Wald tests for difference in sensitivities between constrained and uncon-
strained firms are significant at better than the 1% level for the payout and commercial paper ratings
criteria, and at 3% for the size and bond ratings measures. The coefficients on the control variables
also conform to our expectations. An increase in investment opportunities makes it more likely that
both sets of firms will seek external funding, while bigger firms generally issue more securities.
− insert Table 3 here −
Table 4 reports the results we obtain by fitting equation (2) to the data. The model is estimated
via GMM. The external financing—cash flow sensitivity estimates show the same patterns reported
15
in Table 3 as we include controls for alternative internal funding sources and add proxies for capital
stock and pre-existing financial structure. The cash flow sensitivity estimates are all negative and
highly significant for constrained firms and small, statistically insignificant for the set of constrained
firms. Differences in external financing—cash flow sensitivities across constrained and unconstrained
samples are significant at better than the 1% level for all criteria. The coefficients for the other
regressors attract either statistically insignificant estimates (e.g., PPE) or significant estimates of
the expected sign (e.g., Q).
− insert Table 4 here −
In the last two columns of Table 4 we report the diagnostic test statistics associated with our in-
strumental set. As it turns out, those instruments are well-suited for the equations we estimate. For
instance, note that the lowest p-value associated with Hansen’s (1982) test of overidentifying restric-
tions is as high as 20%. Moreover, the lowest partial F -statistic from the (first-stage) regression of
the endogenous regressors on the set of excluded instruments is highly significant in each of the mod-
els estimated. These diagnostic test statistics suggest that our instruments are valid and relevant.
Our results suggest that a negative relation between internal funds and external financing holds
for the subsample of firms that are least likely to face high financing costs. These findings are
consistent to what one would expect if unconstrained firms’ financing decisions were influenced by
the adjustment costs argument. In the subsample of financially constrained firms, however, the
negative relation between internal and external financing is significantly mitigated. This pattern is
inconsistent with the standard pecking order explanation for the substitutability between internal
funds and external finance, which is based precisely on costly external financing. As discuss above,
the endogeneity of investment that is induced by financing constraints is likely to explain the greater
complementarity between internal and external finance among constrained firms.
Given that we find an insignificant relation between internal funds and external finance for
constrained firms, one might wonder whether our findings could be explained by an M&M-type ar-
gument. In particular, if M&M holds only for constrained but not for unconstrained firms, we could
observe a non-systematic relation (statistically equal to zero) between profits and external financing
for constrained firms. While it is difficult to test for this null-M&M hypothesis directly, we believe
it is unlikely to explain our findings given the body of evidence that such firms do not behave in
the M&M fashion. For example, the firms that we classify as constrained seem to engage in optimal
liquidity and inventory management (Almeida et al. (2004) and Fazzari and Petersen (1993)), and
their investment is particularly sensitive to the availability of internal funds (e.g., Rauh (2006));
behaviors that are consistent with credit market imperfections. We provide additional evidence that
supports our preferred interpretation of the empirical evidence. Before we do so, we present some
16

results to verify the robustness of the cross-sectional patterns reported in Tables 3 and 4.
B. Robustness
In this section we perform our basic tests using alternative model specifications, proxy construction
methods, sampling procedures, and econometric techniques. This battery of checks should provide
evidence that our empirical estimates are robust.
1. Base Checks
One issue we have to consider is whether including Q as a proxy for investment opportunities in our
regressions will bias the inferences that we can make about cash flow sensitivities. Such concerns
have become a topic of debate in the literature, as evidence of higher cash flow sensitivities of con-
strained firms has been ascribed to measurement problems with Q (see, e.g., Erickson and Whited
(2000)). Similar issues could arguably plague our results. For example, if profitability captures infor-
mation about investment opportunities that are not well captured by Q, then the complementarity
between profitability and external financing could be simply due to a positive correlation between
profitability and investment opportunities. To wit, when investment opportunities are high firms
need to invest more and raise more external funds. In turn, we propose alternative ways of checking
whether our inferences are robust to measurement issues in our proxy for investment opportunities.
The first row of Table 5 displays the results we obtain from using the approach suggested by
Cummins et al. (2006): we use financial analysts’ forecasts of earnings as an instrument for Q in an
IV estimation of our baseline model. As in Polk and Sapienza (2003), we employ the median fore-
cast of the two-year ahead earnings scaled by lagged total assets to construct the earnings forecast
measure. The earnings data are taken from IBES, where extensive coverage only starts in 1986.
The results from these IV regressions show that our main results are actually strengthened when
explicitly address the potential for attenuation biases associated with poorly-measured Qs.
Another way of tackling the empirical limitations of Q is to use alternative proxies for invest-
ment opportunities. One simple approach is to include investment in the regression. However, since
investment is a decision variable, we would like to include in the regression only the component of
investment that is explained by factors that are outside of the firm’s control. To do this, we look
for industry drivers of investment spending, in particular, aggregate industry demand. Accordingly,
we introduce in our baseline model the projection of investment on two lags of the observed growth
sales in the firm’s main three-digit SIC activity. In unreported tables, we check that this proposed
instrumentation passes standard tests of instrument relevance and validity. Row 2 of Table 5 reports
the coefficients associated with the variables in our baseline model once we use IV methods and add
investment to our estimations. As one can see from that table, our results continue to hold steadily
17

across the subsamples of constrained and unconstrained firms.
An alternative approach which is common in the financial constraints literature is to use R&D
expenditures as a proxy for investment opportunities (see, among others, Graham (2000) and Fama
and French (2002)). In row 3 of Table 5 we report results from the estimation of our baseline model
after we replace Q with the ratio of R&D expenditures (COMPUSTAT’s item #46) to total assets.
This seems to produce very few changes in our baseline estimates. Taken together, the results in the
first three rows of Table 5 suggest that our results are unlikely to be driven by unobserved variation
in investment opportunities.
In the fourth row of Table 5 we report the estimates for external financing—cash flow sensitivities
that are returned when we eliminate IPO-years from the sample. As discussed in Frank and Goyal
(2003) and Lemmon and Zender (2004), the year in which a firm becomes public is characterized
by unusual equity issuance activity. It has also been noted that many of the IPOs of the 1990s were
particularly unprofitable. These observed regularities could “hard-wire” an empirical association
between cash flows and issuance activity. As in Lemmon and Zender, we identify IPO-years by
determining the first year in which a firm appears in our sample (other than the first year of the
sampling period). Results in row 4 of Table 5 make it clear that our conclusions are unaffected by
concerns with IPO observations.
Recent work by Strebulaev and Yang (2007) shows that zero (and near-zero) leverage firms have
markedly different behaviors from proxy firms when it comes down to equity issuance (Table XI in
their paper) and debt taking (Table XII). As those authors propose, there are a host of explana-
tions that could potentially motivate those behaviors. Thus, it is interesting to see if our results
hold once we control for the presence of these firms in the data. Similar to Strebulaev and Yang,
we find a sizable number of zero-leverage firms in our sample; a total of 7,929 (or 9% of our raw
sample). We examine whether our results hold steadily in two different ways. The first is to add
an explicit control for the zero-leverage firms by way of a dummy variable. The second, is by way
of re-estimating our baseline regressions eliminating zero-leverage firms from the sample. Row 5 of
Table 5 reports this last set of estimations (we find similar results when we use the first approach).
As can be seen from row 5, our results hold after we control for zero-leverage firms in our sample.
Finally, we revisit the constraint characterizations that are based on the existence of ratings
(bond and commercial paper). Following Faulkender and Petersen (2006) and Lemmon and Zender
(2004), we focus on data that start from 1986 – when COMPUSTAT provides extensive coverage
on ratings – and define as financially unconstrained firm-years those firms for which COMPUSTAT
reports the existence of a rating during the very year under examination (i.e., we do not input ratings
information from the later part of the sample into the early sample years). Differently from our previ-
18
ous strategy, this approach allows firms to migrate across constraint categories over the years. Study-
ing only the second half of our sample period also serves the purpose of verifying whether our results
are stable through time. The sixth row of Table 5 reports the results we obtain when we fit equation
(1) over the 43,350 data points contained in the 1986—2001 period, under the newly proposed con-
strained/unconstrained partitions. The estimates from this experiment show that the patterns we
have uncovered are nearly insensitive to qualitative changes to our constraint characterizations and
that our previous results seem to emerge consistently across different windows of our sample period.
− insert Table 5 here −
2. Additional Testing Strategies and Robustness Checks
Besides the base robustness checks reported in Table 5, we have experimented with two other tests
which we describe here. The associated tables are available upon request.
Firstly, it is plausible that financially constrained firms find it difficult to issue long-term debt,
and optimally choose to rely on short-term debt. Because constrained firms need to refinance their
debt more frequently, they might behave similarly to firms that face lower adjustment costs. In this
way, an adjustment cost story could confound the results in Tables 3, 4, and 5.
To verify this possibility, for each one of our eight financial constraints categories, we compute
the ratio of short-to-total debt (the sum of short- plus long-term debt). We find that the median and
mean short-to-total ratios are somewhat larger for constrained firms, in particular for the constraint
criteria that are based on size and the existence of bond ratings. To examine whether reliance on
short-term debt can explain our results, we do the following. Conditional on the existence of posi-
tive debt in the firms’ balance sheets, we split each of our constraint categories into two subgroups:
those firms with no short-term debt, and those whose ratio of short-to-total debt is ranked above the
median cut-off of their particular constraint category. This essentially introduces a “double-sorting”
approach to our categorizations. We find very little variation in the relation between internal cash
flows and external financing activities across the new subcategories we consider.
Secondly, it is well known that in many firm-years do not observe economically meaningful
changes in capital structure, a pattern that can be partly due to adjustment costs. Since our tests
are based on issuance activity, it is interesting to examine whether our results hold if we restrict
the sample to times when firms experience large refinancing activities.
To do this, we have considered a variety of cut-offs to define years in which firms initiate “large”
issuance/repurchase activities (proxied by ExternalF inancing): (1) 0.5%; (2) 1%; (3) 2%; (4) 5%;
(5) 10%; and (6) 20%. We then discard firm-years in which ExternalF inancing is below these
cutoffs and perform our tests in the trimmed sample. The samples associated with these different
19

cut-offs vary in size in considerable ways; for example, as we restrict the data to those observations
pertaining to very large net issuance cut-offs (such as 20%), the number of observations become a
concern for constraint-subsample regressions. Despite the arbitrary nature of any of these choices,
we find that our results hold still when we subject our data to this additional set of tests irrespective
of the cutoff used.
C. Is it Debt or Equity?
The analysis thus far focuses on the total amount of funds that firms raise in the capital markets,
both debt and equity. Yet, one may wonder whether the data patterns that we have uncovered
hold for both debt and equity issues separately, or if they are driven primarily by one of those
two securities. One might conjecture, for example, that the firms that we deem as financially con-
strained are primarily constrained in their ability to contract debt when cash flows fall short of
investment needs.12 This argument would suggest that the cross-sectional patterns that we have
uncovered could be largely driven by debt financing alone. Conversely, most optimal contracting
models suggest that debt – not equity – should be the preferred form of external financing when
firms face the types of frictions (e.g., agency- and imperfect information-type problems) that make
them financially constrained (see Tirole (2006)). This would suggest that the differences in financ-
ing patterns between constrained and unconstrained firms that we have uncovered could be largely
driven by cross-sectional differences in the dynamics of outside equity financing alone.
In order to evaluate these different possibilities, we re-estimate our baseline empirical model sepa-
rately for debt and equity issues (as opposed to total issues) across samples of constrained and uncon-
strained firms. The first row of Table 6 displays the results we obtain for constrained firms when we
replace ExternalFinancing in equation (1) with either DebtFinancing (the ratio of net debt issuances
(COMPUSTAT’s item #111 — item #114) to total book value of assets (item #6)) or EquityFinanc-
ing (the ratio of total net equity issuances (item #108 — item #115) to total book value of assets).
Row 2 presents the results from similar models estimated over samples of financially unconstrained
firms. Row 3 reports p-values for a Wald test of cross-group differences in cash flow sensitivities.
The cash flow sensitivity estimates in Table 6 suggest that our previous results cannot be at-
tributed to either debt or equity financing alone. The cash flow sensitivities of constrained firms
are uniformly less negative than in the unconstrained sample, for both debt and equity financing.
In addition, for every possible constrained—unconstrained comparison pair, the cash flow sensitivity
of external finance (again, debt and equity) is significantly more negative for unconstrained firms
at the 5% test level or better. The results suggest that, comparatively to the unconstrained firms,12Lemmon and Zender (2004) suggest that this consideration might help reconcile the findings that small firms
“too often” issue equity with the pecking order theory.
20

constrained firms use less of both debt and equity financing to absorb variations in internal cash flows.
− insert Table 6 here −
V. Extensions
The results above show strong evidence of a greater degree of complementarity between internal
and external financing among financially constrained firms, relative to unconstrained ones. The
discussion in Section II suggests that this greater complementarity could arise from the optimal
management of liquid asset holdings by constrained firms, and from a credit multiplier argument
that directly links profitability to the firm’s ability to raise external finance. In this section, we
attempt to provide additional evidence that suggests that such investment—financing interactions
are indeed behind our baseline findings.
A. Credit Multiplier Tests
One channel through which the endogenous association between investment and financing works
relates to the level of collateral a firm may be able to offer to external creditors. To wit, the
positive relation between cash flow and external financing could be particularly strong for financially
constrained firms with tangible assets, in that new investment in more collateralizable assets – e.g.,
hard assets such as plants and machines – may enhance their credit capacity more than what is
observed for constrained firms with less tangible assets. This proposed mechanism relates to the
“credit multiplier” effect found in the macroeconomics literature (e.g., Bernanke et al. (1996) and
Kiyotaki and Moore (1997)), where more collateral helps relax external financing constraints, which
allows for more external credit, which in turn allows for more investment (in collateralizable assets),
which allow for more external credit, and so on.
To test the endogenous internal—external financing story via the collateral channel, we design an
empirical test in the spirit of the multiplier effect just described. Recall, our benchmark empirical
specification models external financing as a function of internal funds (i.e., cash flows) plus controls.
To better characterize the differential effect of cash flows on external financing activity along the
lines of the credit multiplier idea, we introduce a measure of asset collateral (which we dub “asset
tangibility”) and an interaction term between cash flow and asset tangibility. We expect our en-
dogenous internal—external financing mechanism to be stronger at higher levels of asset tangibility,
conditional on a sample of financially constrained firms. More precisely, in our external financing
regressions, we expect the cash flow coefficients to be more positive for constrained firms whose
assets are easier to liquidate (are more tangible). At the same time, within a sample of financially
unconstrained firms, we do not expect to see a differential impact of cash flow on external financing
21

activities for firms with more tangible assets. This is akin to a “differences-in-differences” test –
high/low constraints × high/low tangibility – that plays off of a wrinkle that is consistent with
our endogenous financing constraint story, but that is unlikely to confound other stories.
Our new test revolves around the estimation of the following credit multiplier-type regression:
ExternalF inancingi,t = α1CashFlowi,t + α2Qi,t + α3Sizei,t + α4Tangibilityi,t(4)
+ α5 (CashFlow × Tangibility)i,t +Xi
Firmi +Xt
Y eart + εi,t.
The model is a direct extension of our baseline model (equation (1)) and the estimation meth-
ods used are similar (e.g., fixed-effects and error clustering). A unique feature of this model is the
introduction of a proxy for asset tangibility (Tangibility). Following Kessides (1990), Worthington
(1995), and Almeida and Campello (2007), we use a time-variant proxy that gauges the ease with
which lenders can liquidate a firm’s productive capital. This measure of asset redeployability is com-
puted as the ratio of used to total (i.e., used plus new) fixed depreciable capital expenditures in an
industry times the firm’s ratio of (beginning of the year) fixed depreciable assets to total assets. To
construct this proxy, starting from 1981, we first hand-collect data for used and new capital acqui-
sitions at the four-digit SIC level from the Bureau of Census’ Annual Survey of the Manufacturers.
Data on plant and equipment acquisitions are compiled by the Bureau every year, with the last sur-
vey identifying both used and new capital acquisitions being published in 1996. Besides the shorter
time coverage, we note that estimations based on this measure of asset tangibility use smaller sample
sizes because not all of COMPUSTAT’s SIC codes are present in the Census data. Since different
firms in the same industry may differ in the degree of hard, salable assets in their balance sheets,
we then multiply the aforementioned industry-level Census data by the firm-level ratio of plant,
property and equipment to total book assets (or COMPUSTAT’s item #8 divided by item #6).13
− insert Table 7 here −
Table 7 reports the coefficients associated with our proposed credit multiplier regression. Each
of the regression pairs in the table reveals the same key result: constrained firms’ external—internal
financing sensitivities are increasing in asset tangibility, while unconstrained firms’ sensitivities show
no or little response to tangibility. In particular, the interaction between cash flow and tangibil-
ity attracts positive, statistically significant coefficients in all of the constrained firm estimations.
Further, these coefficients are uniformly higher than those of the unconstrained samples, and sta-
tistically different at the 1% test level in virtually all of the comparison pairs. These contrasts13We also run tests where our Tangibility proxy does not include the firm specific PPE/total asset scaling (i.e., is
based only on the Census data). Our results are unaffected.
22

are consistent with the presence of a multiplier effect for constrained firm’s financing patterns, one
that is explained by the endogeneity of investment and the substitutability of external and internal
financing under credit constraints.
Before concluding our discussion of the multiplier model results, it is worth noting that compared
to our benchmark, non-interactive model (Table 3), the coefficients returned for CashFlow are
now less weakly negative for constrained firms. This is due to the impact of the (tangibility-)
“interaction” effect on the “main” regression effect of cash flows: the coefficient returned for α1
(alone) reflects the elasticity of ExternalFinancing to CashFlow when Tangibility would equal zero.
Notice, however, that this is a point that lies outside the empirical distribution of Tangibility.14
B. External and Internal Financing
The arguments in Section II suggest that, if investment and external financing are jointly deter-
mined, then the same set of constrained firms that display a less negative sensitivity of external
financing to cash flow innovations should also display a more positive sensitivity of liquid asset hold-
ings (cash, inventory, etc.) to cash flows, relative to unconstrained firms. To test this prediction, we
estimate the following SUR system separately across sets of constrained and unconstrained firms:
(5) ExternalF inancingi,t = α1CashFlowi,t + α2Qi,t + α3Sizei,t +Xi
firmi +Xt
yeart + εEFi,t,
(6) InternalF inancingi,t = β1CashFlowi,t + β2Qi,t + β3Sizei,t +Xi
firmi +Xt
yeart + εIFi,t .
ExternalFinancing is defined as above, i.e., net security issuance over total assets. In contrast,
InternalFinancing captures changes in a set of proxies for internal funding sources (“savings”) that,
according to previous research, can be used to smooth the investment process: changes in cash
stocks (COMPUSTAT’s item #274), changes in inventories (item #303), and changes in accounts
receivables (item #302) (see, e.g., Fazzari and Petersen (1993) and Almeida et al. (2004)).
We expect the estimates from equation (5) to be close to those of equation (1) in that we are
estimating a similar model, but now conditioning on the sample of firms for which we have full in-
formation on the components of internal savings policy (from Table 1 one can see that only 63% of
the sample firms provide complete information on InternalFinancing). Regarding equation (6), we
expect to find that the greater complementarity between external and internal financing among con-
strained firms translates into a greater propensity to use cash flow surpluses to build internal stocks
of liquid wealth. That is, the coefficient β1 should be larger (more positive) among constrained firms.14The linear estimator for interactive models will produce vector coefficients for the “main” effects of the interacted
variables even when those effects accrue to data points that lie outside of the underlying sample distribution.
23

Table 8 reports the results from the above SUR system separately for constrained and uncon-
strained firm samples. For ease of exposition, we only present the results for the estimates associated
with the cash flow innovations in the system (i.e., α1 and β1in equations (5) and (6)). As in previous
estimations, unconstrained firms display a strong, negative cash flow sensitivity of external financ-
ing, while constrained firms show estimates that are neither economically nor statistically significant
(see results in row 1). In accordance with our prior that external financing constraints must also in-
fluence the internal financing choices of constrained firms, we find that these firms display a strong,
positive cash flow sensitivity of internal financing. Unconstrained firms, on the other hand, do not
accumulate internal resources out of their cash flows (see row 2). Altogether, the results from Table
8 are consistent with the notion that constrained firms manage their liquid asset holdings in a way
that makes internal and external financing more complementary, relative to unconstrained firms.
− insert Table 8 here −
C. Macroeconomic Dynamics
Research on the impact of financing constrains on corporate behavior commonly draws inferences
from macroeconomic dynamics. This follows naturally from the idea that financing constraints
are linked with the real economy in that it is generally believed that those constraints bind more
during recessions and monetary contractions – when corporate net worth falls, collateral values
collapse, and higher interests increase the cost of servicing debt (see, e.g., Gertler and Gilchrist
(1994), Calomiris et al. (1995), Korajczyk and Levy (2003), Kashyap et al. (1994), and Fazzari et
al. (1994)).
Showing that cross-sectional differences in firm behavior, on average, conform with expecta-
tions regarding the impact of financing constraints on corporate behavior is an important step in
testing any argument, but empirical limitations may still permeate those findings. For example,
it is impossible to completely rule out the importance of concerns with simultaneity biases in our
cross-sectional estimates.15 Exploring the dynamics of macroeconomic movements, on the other
hand, can provide for evidence that the impact of constraints on firm behavior covaries with ex-
ogenous tightenings and relaxations of those constraints. In this testing set up, when comparing
differential external financing behavior across groups of firms categorized as either constrained or
unconstrained, one does not need to focus on differences in the levels of external financing—cash
flow sensitivities across those two groups of firms (as we have done thus far), but instead on the
responses of those sensitivities to macroeconomic innovations.15 In particular, one could raise an involved argument suggesting that estimation biases might affect one set of
subsample regressions more severely than another, possibly yielding misleading inferences.
24

Our basic proposition is that differences in the external financing behavior of constrained and
unconstrained firms – specifically, cross-sectional differences in the sensitivity of external financing
to cash flow – will become more pronounced following negative innovations to macroeconomic
conditions; that is, in periods when financial constraints are more likely to bind.
To implement a test of this proposition, we use a two-step approach similar to that used by
Campello (2002). The idea is to relate external financing—cash flow sensitivities and aggregate
demand conditions by combining cross-sectional and times series regressions.
The first step of this procedure consists of estimating our baseline regression model (equation
(1)) every year separately for groups of financially constrained and unconstrained firms. From each
yearly sequence of cross-sectional regressions, we collect the coefficients returned for cash flow (i.e.,
α1) and “stack” them into the vector Ψt, which is then used as the dependent variable in the
following (second-stage) time series regression:
(7) Ψt = η + φ∆Activityt + ρTrendt + ut,
where the term ∆Activity represents shocks to aggregate activity. These shocks are computed from
the residual of an autoregression of log real GDP on four lags of itself, with the error structure fol-
lowing a moving average process.16 The impact of unforecasted shocks to aggregate activity on the
sensitivity of external financing to cash flow can be gauged from φ. A time trend (Trend) is included
to capture secular changes in external financing activities. Finally, because movements in aggregate
demand and other macroeconomic variables often coincide, in “multivariate” versions of equation
(7) we also include changes in inflation (log CPI) and changes in basic interest rates (Fed funds
rate) to ensure that our findings are indeed driven by shocks to demand. These macroeconomic
series are gathered from the Bureau of Labor Statistics and the Federal Reserve websites.
The results from the two-stage estimator are summarized in Table 8. The table reports the coeffi-
cients returned for φ from equation (7), along with the associated p-values (calculated via Newey and
West’s (1987) covariance estimator). Row 1 collects the results for financially constrained firms while
row 2 reports results for unconstrained firms. Additional tests for cross-group coefficient differences
are reported at the bottom of the table (row 3). Standard errors for the “difference” coefficients are
estimated via a SUR system that combines the two constraint categories (p-values reported).
− insert Table 8 here −
The GDP-response coefficients for the constrained firms in row 1 are all negative and highly
statistically significant, indicating that the cash flow sensitivity of external financing of these firms16Even though the macro innovation proxy is a generated regressor the coefficient estimates of equation (7) are
consistent (see Pagan (1984)).
25

increases (i.e., becomes even less negative) during recessions. This finding suggests that the de-
gree of complementarity between internal funds and external finance increases during recessions for
constrained firms. In contrast, the response coefficients for the unconstrained firms (row 2) are typ-
ically indistinguishable from zero. The differences between those sets of coefficients (row 3) suggest
that the external financing—cash flow sensitivities of financially constrained and unconstrained firms
follow markedly different paths in the aftermath of negative shocks to the macroeconomy.
VI. Final Remarks
In this paper we study the implications of investment—financing interactions for the understanding
of one of the key stylized facts of the empirical capital structure literature, namely the finding that
more profitable firms demand less external finance. The literature has argued that this finding is
consistent with a preference for internal funds to finance investments, in world in which external
financing is costly. However, we show new, robust evidence that this negative relation is concen-
trated among firms that are least likely to face high costs of external finance. We argue that this
negative relation is more consistent with the existence of small but pervasive capital structure ad-
justment costs (see Strebulaev (2007)). We also argue that the endogeneity of investment that is
engendered by financing constraints can explain the apparently puzzling finding that firms that face
the highest costs of external financing do not seem to show a preference for internal funds. While
it is still the case that such firms place a high value on internal funds, reducing external finance is
not necessarily the best use of funds for them. These firms can also use additional internal funds to
increase investment, holdings of liquid assets, or to create collateral that allows further borrowing.
As a result, internal funds and external finance can become complements rather than substitutes
when external financing costs are high.
It is important to stress that our results do not imply that asymmetric information is unim-
portant for external financing decisions. Instead, they suggest that the negative relation between
profitability and external financing should not be interpreted as evidence for the role of asymmetric
information in firm financing. Our results also suggest that endogenous investment is a key factor
behind observed external financing decisions. We believe that the sorts of financing constraints that
firms face in the real world should be more carefully considered in future attempts at characterizing
corporate financial policies in the empirical literature.
26
References
Almeida, H., and M. Campello, “Financing Constraints, Asset Tangibility, and Corporate Invest-ment,” Review of Financial Studies 20 (2007), 1429-1460.
Almeida, H., M. Campello, and M. Weisbach, “The Cash Flow Sensitivity of Cash,” Journal ofFinance 59 (2004), 1777-1804.
Altinkilic, O., and R. Hansen, “Are There Economies of Scale in Underwriting Fees? Evidence ofRising External Financing Costs,” Review of Financial Studies 13 (2000), 191-218.
Baker, M., and J. Wurgler, “Market Timing and Capital Structure,” Journal of Finance 57 (2002),1-32.
Bates, T., K. Kahle, and R. Stulz, “Why Do U.S. Firms Hold so Much More Cash Than TheyUsed To?” NBER Working paper 12534 (2006).
Bancel, F., and U. Mittoo, “Cross-Country Determinants of Capital Structure Choice: A Surveyof European Firms,” Financial Management 33 (2004), 103-132.
Bernanke, B. and M. Gertler, “Agency costs, net worth, and business fluctuations,” AmericanEconomic Review 79 (1989), 14-31.
Bernanke, B., M. Gertler, and S. Gilchrist, “The Financial Accelerator and the Flight to Quality,”Review of Economics and Statistics 78 (1996), 1-15.
Bound, J., D. Jaeger, and R. Baker, “Problems with Instrumental Variables Estimation When theCorrelation between the Instruments and the Endogenous Explanatory Variable is Weak,”Journal of the American Statistical Association 90 (1995), 443-450.
Calomiris, C., C. Himmelberg, and P. Wachtel, “Commercial Paper and Corporate Finance: A Mi-croeconomic Perspective,” Carnegie Rochester Conference Series on Public Policy 45 (1995),203-250.
Campello, M., “Internal Capital Markets in Financial Conglomerates: Evidence from Small BankResponses to Monetary Policy,” Journal of Finance 57 (2002), 2773-2805.
Chen, L., and X. Zhao, “Why Do More Profitable Firms Have Lower Leverage Ratios?” Workingpaper, Michigan State University and Kent State University (2006).
Corwin, S., “The Determinants of Underpricing for Seasoned Equity Offers,” Journal of Finance58 (2003), 2249-2279.
Cummins, J., K. Hasset, and S. Oliner, “Investment Behavior, Observable Expectations, andInternal Funds,” American Economic Review 96 (2006), 796-810.
Erickson, T., and T. Whited, “Measurement Error and the Relationship between Investment andQ,” Journal of Political Economy 108 (2000), 1027-1057.
27

Faulkender, M., and M. Petersen, “Does the Source of Capital Affect Capital Structure?” Reviewof Financial Studies 19 (2006), 45-79.
Fama, E., and K. R. French, “Testing Tradeoff and Pecking Order Predictions about Dividendsand Debt,” Review of Financial Studies 15 (2002), 1-33.
Fama, E., and K. French, “Financing Decisions: Who Issues Stock?” Journal of Financial Eco-nomics 76 (2005), 549-582.
Fazzari S., R. G. Hubbard, and B. Petersen, “Financing Constraints and Corporate Investment,”Brooking Papers on Economic Activity 1 (1988), 141-195.
Fazzari S., R. G. Hubbard, and B. Petersen, “Inventory Investment, Internal-Finance Fluctuations,and the Business Cycle,” Brooking Papers on Economic Activity 2 (1994), 75-138.
Fischer, E., R. Heinkel, and J. Zechner, “Dynamic Capital Structure Choice: Theory and Tests,”Journal of Finance 44 (1989), 19-40.
Fazzari, S., and B. Petersen, “Working Capital and Fixed Investment: New Evidence on FinancingConstrains,” RAND Journal of Economics 24 (1993), 328-342.
Frank, M., and V. Goyal, “Testing the Pecking Order Theory of Capital Structure,” Journal ofFinancial Economics 67 (2003), 217-248.
Gertler, M., and S. Gilchrist, “Monetary Policy, Business Cycles, and the Behavior of Small Man-ufacturing Firms,” Quarterly Journal of Economics 109 (1994), 309-340.
Gilchrist, S., and C. Himmelberg, “Evidence on the Role of Cash Flow for Investment,” Journalof Monetary Economics 36 (1995), 541-572.
Gomes, J., “Financing Investment,” American Economic Review 91 (2001), 1263-1285.
Graham, J., “How Big Are the Tax Benefits of Debt?” Journal of Finance 55 (2000), 1901-1941.
Graham, J., and C. Harvey, “The Theory and Practice of Corporate Finance: Evidence from theField,” Journal of Financial Economics 60 (2001), 187-243.
Hansen, L., “Large Sample Properties of Generalized Methods of Moments Estimators,” Econo-metrica 50 (1982), 1029-1054.
Hennessy, C., and T. Whited, “Debt Dynamics,” Journal of Finance 60 (2005), 1129-1165.
Hovakimian, A., T. Opler, and S. Titman, “The Debt-Equity Choice,” Journal of Financial andQuantitative Analysis 36 (2001), 1-24.
Hubbard, R. G., “Capital Market Imperfections and Investment,” Journal of Economic Literature36 (1998), 193-227.
Kashyap, A., O. Lamont, and J. Stein, “Credit Conditions and the Cyclical Behavior of Invento-ries,” Quarterly Journal of Economics 109 (1994), 565-592.
28

Kessides, I., “Market Concentration, Contestability, and Sunk Costs,” Review of Economics andStatistics 72 (1990), 614-622.
Kim, D., D. Palia, and T. Saunders, “The Long-Run Behavior of Debt and Equity UnderwritingSpreads,” Working paper, NYU and Rutgers University (2003).
Kiyotaki, N., and J. Moore, “Credit Cycles,” Journal of Political Economy 105 (1997), 211-248.
Korajczyk, R., and A. Levy, “Capital Structure Choice: Macroeconomic Conditions and FinancialConstraints,” Journal of Financial Economics 68 (2003), 75-109.
Leary, M., and M. Roberts, “Do Firms Rebalance their Capital Structures?” Journal of Finance60 (2005), 2575-2619.
Lemmon, M., and J. Zender, “Debt Capacity and Tests of Capital Structure Theories,” Workingpaper, University of Utah and University of Colorado at Boulder (2007).
Lewellen J., and K. Lewellen, “Internal Equity, Taxes, and Capital Structure,” Working paper,Dartmouth College (2006).
Myers, S., “The Capital Structure Puzzle,” Journal of Finance 39 (1984), 575-592.
Myers, S., “Still Searching for Optimal Capital Structure,” Journal of Applied Corporate Finance6 (1993), 4-44.
Myers, S., and N. Majluf, “Corporate Financing and Investment Decisions when Firms have In-formation that Investors do not have.” Journal of Financial Economics 13 (1984), 187-221.
Newey, W., and K. West, “A Simple Positive Semi-definite, Heteroskedasticity and AutocorrelationConsistent Covariance Matrix,” Econometrica 55 (1987), 703-708.
Pagan, A., “Econometric Issues in the Analysis of Regressions with Generated Regressors,” Inter-national Economic Review 25 (1984), 221-247.
Polk, C., and P. Sapienza, “The Stock Market and Corporate Investment: a Test of CateringTheory,” forthcoming, Review of Financial Studies (2006).
Rajan, R., and L. Zingales, “What Do We Know about Capital Structure? Some Evidence fromInternational Data,” Journal of Finance 50 (1995), 1421-1460.
Rauh, J., “ Investment and Financing Constraints: Evidence from the Funding of CorporatePension Plans,” Journal of Finance 61 (2006), 33-75.
Schiantarelli, F., and A. Sembenelli, “Form of Ownership and Financial Constraints: Panel DataEvidence from Flow of Funds and Investment Equations,” Empirica 27 (2000), 175-192.
Shyam-Sunder, L., and S. Myers, “Testing Static Tradeoff against Pecking Order Models of CapitalStructure,” Journal of Financial Economics 51 (1999), 219-244.
29
Stein, J., “Agency Information and Corporate Investment,” in G. Constantinides, M. Harris, andR. Stulz (eds.), Handbook of the Economics of Finance (2003), Elsevier/North-Holland, Am-sterdam.
Strebulaev, I., “Do Tests of Capital Structure Theory Mean What They Say?” Journal of Finance62 (2007), 1747-1787.
Strebulaev, I. and Yang, B., “The Mystery of Zero-Leverage Firms,” Working paper, StanfordUniversity (2007).
Tirole, J., The Theory of Corporate Finance, Princeton University Press (2006).
Welch, I., “Capital Structure and Stock Returns,” Journal of Political Economy 112 (2004), 106-131.
Worthington P., “Investment, Cash Flow, and Sunk Costs,” Journal of Industrial Economics 43(1995), 49-61.
30

Table 1. Sample Descriptive StatisticsThis table displays summary statistics for the main variables used in the paper’s empirical estimations. Panel Ashows detailed statistics for the entire sample. Panel B shows only variable means and standard deviations foreach of the constraint partitions used in estimations. All firm data are collected from COMPUSTAT’s annualindustrial tapes over the 1971—2001 period. The sampled firms exclude financial institutions (SICs 6000—6999),utilities (SICs 4900—4999), and not-for-profit organizations and governmental agencies (SICs greater than 8000).ExternalF inancing is the ratio of the total net equity issuances (COMPUSTAT’s item #108 — item #115) plusnet debt issuances (item #111 — item #114) to the total book value of assets (item #6). CashF low is the ratioof earnings before extraordinary items and depreciation (item #123 + item #125) to total assets. Q is computedas the market value of assets divided by the book value of assets, or (item #6 + (item #199 × item #25) —item #60 — item #74) / (item #6). Size is the natural log of sales (item #12). Cash is item #1 divided byitem #6. Inventory is equal to item #2 plus item #3, divided by item #6. PPE is item #8 divided by item #6. Debt/Equity is item #9 plus item #34, divided by item #216. InternalF inancing is item #274, plus item#303, plus item #302, all divided by item #6. Tangibility is a measure of asset redeployment. This measure iscomputed as the product of the ratio of new-to-total depreciable asset acquisition (industry-level data availablefrom 1981 through 1996 from the Bureau of Census’ Annual Survey of Manufacturers) and the firm-level ratio offixed-to-total assets (COMPUSTAT’s item #8 over item #6).Panel A: Entire Sample
Variables Sample Statistics
Mean Median Std. Dev. 25th Pct. 75th Pct. Obs.
ExternalF inancing (Total) 0.0325 0.0022 0.1153 —0.0129 0.0589 72,851
DebtF inancing 0.0132 0.0000 0.1032 —0.0138 0.0272 72,851
EquityF inancing 0.0194 0.0003 0.0632 —0.0000 0.0057 72,851
CashFlow 0.0628 0.0948 0.2145 0.0519 0.1359 72,851
Q 1.9098 1.3013 2.6311 0.9814 2.0154 72,851
Size 2.1837 1.9277 1.5084 1.0188 3.0601 72,851
CashHoldings 0.1764 0.0979 0.1973 0.0401 0.2374 72,851
Inventory 0.1682 0.1431 0.1503 0.0341 0.2604 72,483
PPE 0.3238 0.2795 0.2167 0.1547 0.4567 72,738
Debt/Equity 0.7482 0.3620 12.7943 0.0636 0.8206 72,830
Tangibility 0.0162 0.0106 0.0192 0.0049 0.0303 16,473
InternalF inancing —0.0033 —0.0085 0.1761 —0.0658 0.0489 46,264

Table 1. Sample Descriptive Statistics – Continued
Panel B: Constraint Partitions
Variables Statistics by Constraint Partition
Div. Payout Firm Size Bond Ratings CP RatingsConstrained Unconstrained Constrained Unconstrained Constrained Unconstrained Constrained UnconstrainedMean/Std.Dev. Mean/Std.Dev. Mean / Std.Dev. Mean/Std.Dev. Mean/Std.Dev. Mean/Std.Dev. Mean/Std.Dev. Mean/Std.Dev.
ExternalF inancing (Total) 0.0335/0.1442 0.0125/0.0812 0.0487/0.1413 0.0225/0.0892 0.0344/0.1167 0.0295/0.1129 0.0361/0.1219 0.0149/0.0722
DebtF inancing 0.0144/0.1263 0.0131/0.0791 0.0023/0.1133 0.0200/0.0870 0.0071/0.0981 0.0232/0.1104 0.0130/0.1087 0.0141/0.0701
EquityF inancing 0.0401/0.0835 0.0006/0.0354 0.0464/0.0967 0.0026/0.0220 0.0273/0.0748 0.0063/0.0330 0.0231/0.0680 0.0008/0.0224
CashFlow 0.0111/0.3859 0.1120/0.1589 0.0081/0.3379 0.0934/0.0883 0.0475/0.2586 0.0882/0.1027 0.0533/0.2326 0.1099/0.0583
Q 2.3529/3.6575 1.5476/1.1932 2.5314/3.2045 1.5224/1.1389 2.1268/3.1757 1.5509/1.2200 1.9744/2.8421 1.5896/1.0391
Size 1.8382/1.2788 2.6435/1.6749 1.1535/0.7432 3.5575/1.5541 1.7508/1.2265 2.8995/1.6515 1.8843/1.2817 3.6667/1.6626
CashHoldings 0.2464/0.2402 0.1125/0.1312 0.3127/0.2382 0.0814/0.0947 0.2261/0.2195 0.0942/0.1131 0.1970/0.2073 0.0740/0.0794
Inventory 0.1427/0.1523 0.1739/0.1376 0.1520/0.1502 0.1577/0.1333 0.1666/0.1511 0.1708/0.1490 0.1670/0.1542 0.1739/0.1293
PPE 0.2826/0.2221 0.3693/0.2125 0.2384/0.1900 0.4118/0.2168 0.2842/0.2077 0.3894/0.2154 0.3073/0.2165 0.4057/0.1981
Debt/Equity 0.8774/11.4923 0.6601/4.5208 0.3391/4.6073 0.9812/11.9519 0.5232/5.8846 1.1202/14.5835 0.7006/14.9839 0.9839/9.3108
Tangibility 0.0127/0.0264 0.0192/0.0217 0.0123/0.0153 0.0192/0.0230 0.0148/0.0180 0.0184/0.0208 0.0156/0.0191 0.0185/0.0197
InternalF inancing —0.0028/0.2190 —0.0095/0.0977 —0.0108/0.2643 —0.0103/0.0741 0.0008/0.2065 —0.0106/0.1004 —0.0019/0.1880 —0.0118/0.0613

Table 2. Cross-Classification of Financial Constraint TypesThis table displays firm-year cross-classifications for the various criteria used to categorize firm-years as eitherfinancially constrained or unconstrained (see text for definitions). To ease visualization, we assign the letter(C) for constrained firms and (U) for unconstrained firms in each row/column. All firm data are collected fromCOMPUSTAT’s annual industrial tapes. The sampled firms exclude financial institutions (SICs 6000—6999),utilities (SICs 4900—4999), and not-for-profit organizations and governmental agencies (SICs greater than 8000).
Financial Constraints Criteria Div. Payout Firm Size Bond Ratings CP Ratings
(C) (U) (C) (U) (C) (U) (C) (U)
1. Payout Policy
Constrained Firms (C) 30,947
Unconstrained Firms (U) 22,530
2. Firm Size
Constrained Firms (C) 13,637 3,380 21,873
Unconstrained Firms (U) 5,027 11,453 22,569
3. Bond Ratings
Constrained Firms (C) 22,290 11,362 20,245 5,547 45,392
Unconstrained Firms (U) 8,657 11,168 1,628 17,022 27,459
4. Comm. Paper Ratings
Constrained Firms (C) 29,319 15,378 21,746 11,925 44,891 15,720 60,611
Unconstrained Firms (U) 1,628 7,152 127 10,644 501 11,739 12,240

Table 3. The Cash Flow Sensitivity of External Financing: The Baseline Model
This table displays results for OLS (with year- and firm-fixed effects) estimations of the baseline regression model(Eq. (1) in the text). All firm data are collected from COMPUSTAT’s annual industrial tapes. See Table1 for detailed variable definitions. The sampled firms exclude financial institutions (SICs 6000—6999), utilities(SICs 4900—4999), and not-for-profit organizations and governmental agencies (SICs greater than 8000). Theestimations correct the error structure for heteroskedasticity and within-period error correlation using the White-Huber estimator. t-statistics (in parentheses).
Dependent Variable Independent Variables R2 Obs.
ExternalF inancing CashF low Q Size
Financial Constraints Criteria
1. Payout Policy
Constrained Firms (C) —0.0134 0.0039** 0.0204** 0.42 30,947(—1.09) (4.22) (9.05)
Unconstrained Firms (U) —0.2725** 0.0051** 0.0112 0.39 22,530(—11.23) (5.91) (0.99)
P -Value of Difference (C) — (U) [0.00] [0.34] [0.43]
2. Firm Size
Constrained Firms (C) —0.0208 0.0045** 0.0234** 0.50 21,873(—1.21) (4.52) (6.88)
Unconstrained Firms (U) —0.0727** 0.0046** 0.0116 0.29 22,569(—4.24) (5.45) (1.56)
P -Value of Difference (C) — (U) [0.03] [0.94] [0.15]
3. Bond Ratings
Constrained Firms (C) —0.0202 0.0035** 0.0106** 0.39 45,392(—1.57) (4.14) (8.34)
Unconstrained Firms (U) —0.0701** 0.0052** 0.0093** 0.21 27,459(—3.63) (4.52) (4.91)
P -Value of Difference (C) — (U) [0.03] [0.23] [0.57]
4. Comm. Paper Ratings
Constrained Firms (C) —0.0262 0.0037** 0.0116** 0.33 60,611(—1.74) (4.30) (8.26)
Unconstrained Firms (U) —0.1866** 0.0032* —0.0014 0.22 12,240(—4.64) (2.05) (—1.41)
P -Value of Difference (C) — (U) [0.00] [0.78] [0.00]
Note: ** and * indicate statistical significance at the 1-percent and 5-percent (two-tail) test levels, respectively.
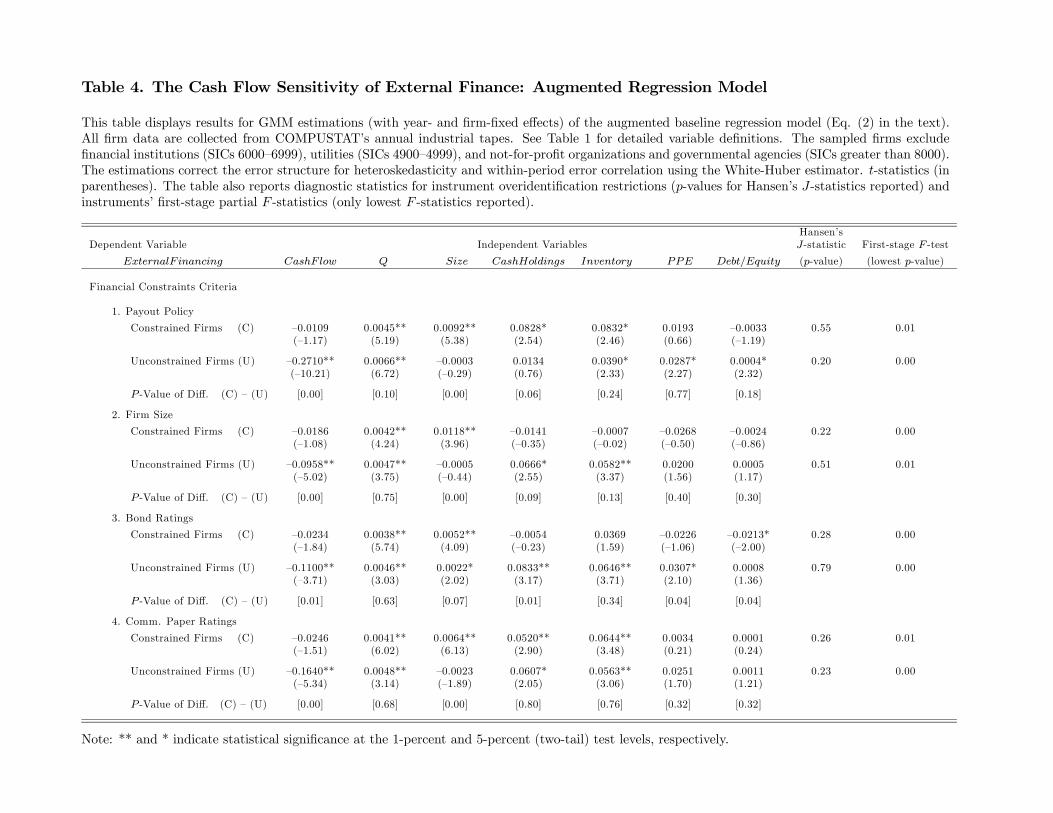
Table 4. The Cash Flow Sensitivity of External Finance: Augmented Regression Model
This table displays results for GMM estimations (with year- and firm-fixed effects) of the augmented baseline regression model (Eq. (2) in the text).All firm data are collected from COMPUSTAT’s annual industrial tapes. See Table 1 for detailed variable definitions. The sampled firms excludefinancial institutions (SICs 6000—6999), utilities (SICs 4900—4999), and not-for-profit organizations and governmental agencies (SICs greater than 8000).The estimations correct the error structure for heteroskedasticity and within-period error correlation using the White-Huber estimator. t-statistics (inparentheses). The table also reports diagnostic statistics for instrument overidentification restrictions (p-values for Hansen’s J-statistics reported) andinstruments’ first-stage partial F -statistics (only lowest F -statistics reported).
Hansen’sDependent Variable Independent Variables J-statistic First-stage F -test
ExternalF inancing CashF low Q Size CashHoldings Inventory PPE Debt/Equity (p-value) (lowest p-value)
Financial Constraints Criteria
1. Payout Policy
Constrained Firms (C) —0.0109 0.0045** 0.0092** 0.0828* 0.0832* 0.0193 —0.0033 0.55 0.01(—1.17) (5.19) (5.38) (2.54) (2.46) (0.66) (—1.19)
Unconstrained Firms (U) —0.2710** 0.0066** —0.0003 0.0134 0.0390* 0.0287* 0.0004* 0.20 0.00(—10.21) (6.72) (—0.29) (0.76) (2.33) (2.27) (2.32)
P -Value of Diff. (C) — (U) [0.00] [0.10] [0.00] [0.06] [0.24] [0.77] [0.18]
2. Firm Size
Constrained Firms (C) —0.0186 0.0042** 0.0118** —0.0141 —0.0007 —0.0268 —0.0024 0.22 0.00(—1.08) (4.24) (3.96) (—0.35) (—0.02) (—0.50) (—0.86)
Unconstrained Firms (U) —0.0958** 0.0047** —0.0005 0.0666* 0.0582** 0.0200 0.0005 0.51 0.01(—5.02) (3.75) (—0.44) (2.55) (3.37) (1.56) (1.17)
P -Value of Diff. (C) — (U) [0.00] [0.75] [0.00] [0.09] [0.13] [0.40] [0.30]
3. Bond Ratings
Constrained Firms (C) —0.0234 0.0038** 0.0052** —0.0054 0.0369 —0.0226 —0.0213* 0.28 0.00(—1.84) (5.74) (4.09) (—0.23) (1.59) (—1.06) (—2.00)
Unconstrained Firms (U) —0.1100** 0.0046** 0.0022* 0.0833** 0.0646** 0.0307* 0.0008 0.79 0.00(—3.71) (3.03) (2.02) (3.17) (3.71) (2.10) (1.36)
P -Value of Diff. (C) — (U) [0.01] [0.63] [0.07] [0.01] [0.34] [0.04] [0.04]
4. Comm. Paper Ratings
Constrained Firms (C) —0.0246 0.0041** 0.0064** 0.0520** 0.0644** 0.0034 0.0001 0.26 0.01(—1.51) (6.02) (6.13) (2.90) (3.48) (0.21) (0.24)
Unconstrained Firms (U) —0.1640** 0.0048** —0.0023 0.0607* 0.0563** 0.0251 0.0011 0.23 0.00(—5.34) (3.14) (—1.89) (2.05) (3.06) (1.70) (1.21)
P -Value of Diff. (C) — (U) [0.00] [0.68] [0.00] [0.80] [0.76] [0.32] [0.32]
Note: ** and * indicate statistical significance at the 1-percent and 5-percent (two-tail) test levels, respectively.
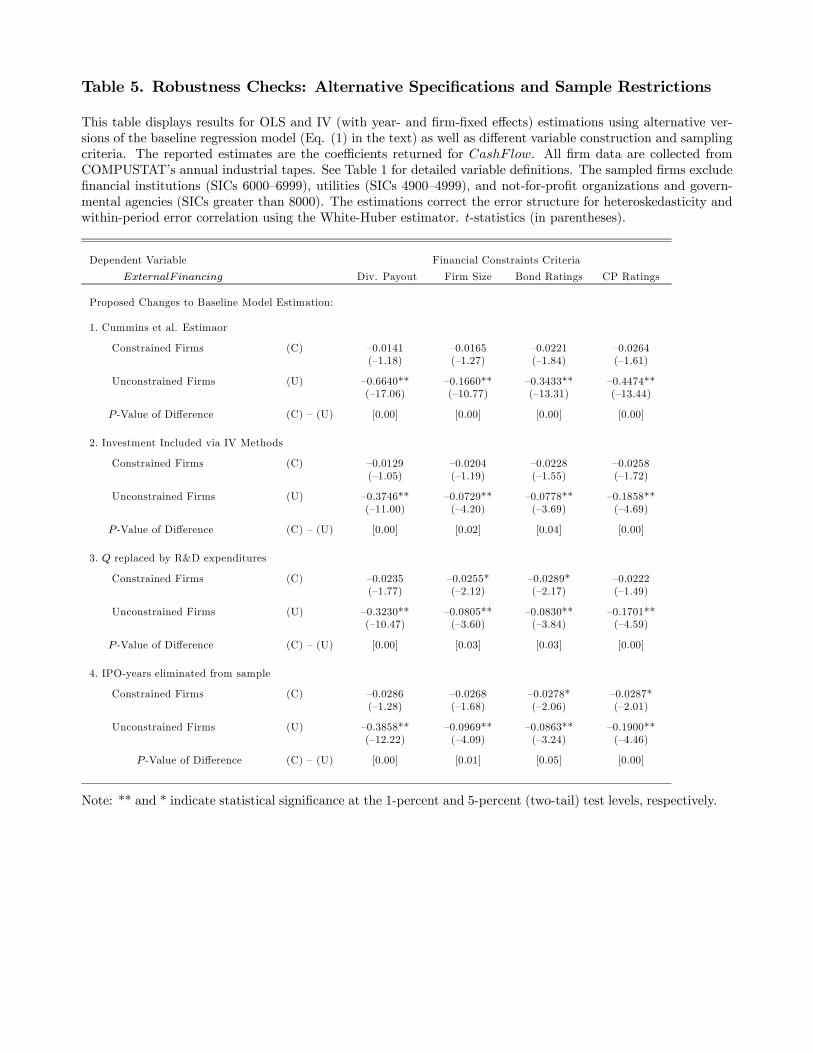
Table 5. Robustness Checks: Alternative Specifications and Sample Restrictions
This table displays results for OLS and IV (with year- and firm-fixed effects) estimations using alternative ver-sions of the baseline regression model (Eq. (1) in the text) as well as different variable construction and samplingcriteria. The reported estimates are the coefficients returned for CashF low. All firm data are collected fromCOMPUSTAT’s annual industrial tapes. See Table 1 for detailed variable definitions. The sampled firms excludefinancial institutions (SICs 6000—6999), utilities (SICs 4900—4999), and not-for-profit organizations and govern-mental agencies (SICs greater than 8000). The estimations correct the error structure for heteroskedasticity andwithin-period error correlation using the White-Huber estimator. t-statistics (in parentheses).
Dependent Variable Financial Constraints Criteria
ExternalF inancing Div. Payout Firm Size Bond Ratings CP Ratings
Proposed Changes to Baseline Model Estimation:
1. Cummins et al. Estimaor
Constrained Firms (C) —0.0141 —0.0165 —0.0221 —0.0264(—1.18) (—1.27) (—1.84) (—1.61)
Unconstrained Firms (U) —0.6640** —0.1660** —0.3433** —0.4474**(—17.06) (—10.77) (—13.31) (—13.44)
P -Value of Difference (C) — (U) [0.00] [0.00] [0.00] [0.00]
2. Investment Included via IV Methods
Constrained Firms (C) —0.0129 —0.0204 —0.0228 —0.0258(—1.05) (—1.19) (—1.55) (—1.72)
Unconstrained Firms (U) —0.3746** —0.0729** —0.0778** —0.1858**(—11.00) (—4.20) (—3.69) (—4.69)
P -Value of Difference (C) — (U) [0.00] [0.02] [0.04] [0.00]
3. Q replaced by R&D expenditures
Constrained Firms (C) —0.0235 —0.0255* —0.0289* —0.0222(—1.77) (—2.12) (—2.17) (—1.49)
Unconstrained Firms (U) —0.3230** —0.0805** —0.0830** —0.1701**(—10.47) (—3.60) (—3.84) (—4.59)
P -Value of Difference (C) — (U) [0.00] [0.03] [0.03] [0.00]
4. IPO-years eliminated from sample
Constrained Firms (C) —0.0286 —0.0268 —0.0278* —0.0287*(—1.28) (—1.68) (—2.06) (—2.01)
Unconstrained Firms (U) —0.3858** —0.0969** —0.0863** —0.1900**(—12.22) (—4.09) (—3.24) (—4.46)
P -Value of Difference (C) — (U) [0.00] [0.01] [0.05] [0.00]
Note: ** and * indicate statistical significance at the 1-percent and 5-percent (two-tail) test levels, respectively.
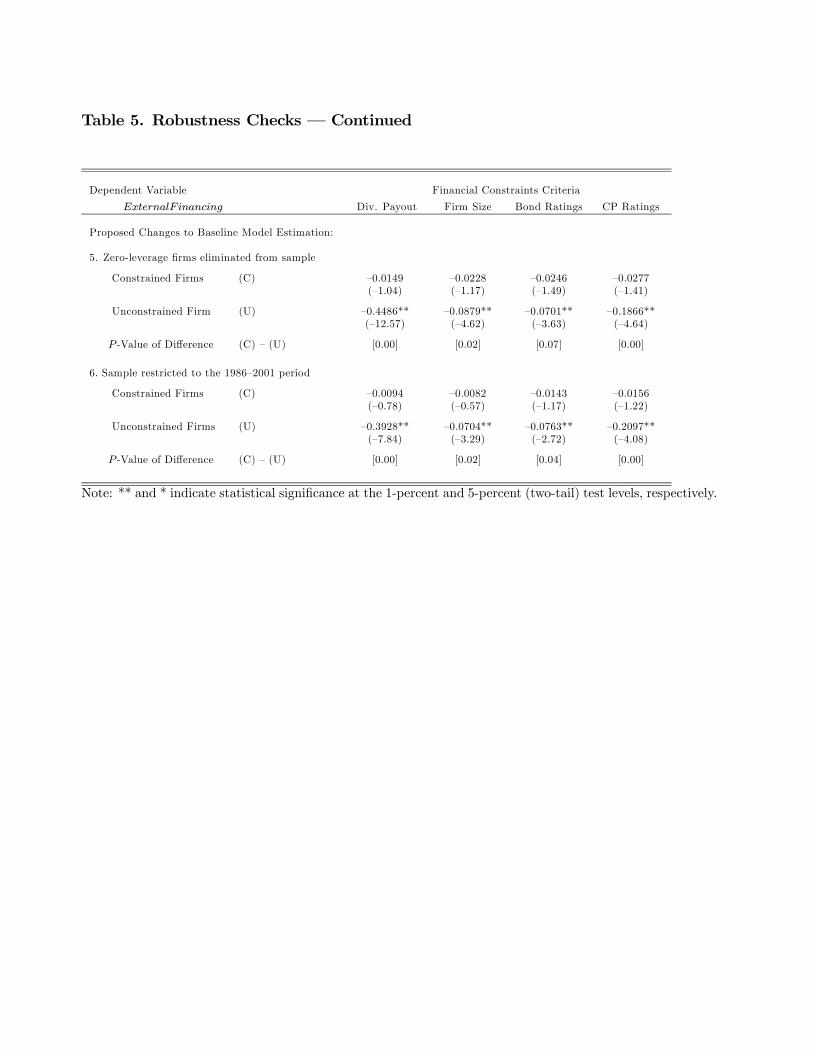
Table 5. Robustness Checks – Continued
Dependent Variable Financial Constraints Criteria
ExternalF inancing Div. Payout Firm Size Bond Ratings CP Ratings
Proposed Changes to Baseline Model Estimation:
5. Zero-leverage firms eliminated from sample
Constrained Firms (C) —0.0149 —0.0228 —0.0246 —0.0277(—1.04) (—1.17) (—1.49) (—1.41)
Unconstrained Firm (U) —0.4486** —0.0879** —0.0701** —0.1866**(—12.57) (—4.62) (—3.63) (—4.64)
P -Value of Difference (C) — (U) [0.00] [0.02] [0.07] [0.00]
6. Sample restricted to the 1986—2001 period
Constrained Firms (C) —0.0094 —0.0082 —0.0143 —0.0156(—0.78) (—0.57) (—1.17) (—1.22)
Unconstrained Firms (U) —0.3928** —0.0704** —0.0763** —0.2097**(—7.84) (—3.29) (—2.72) (—4.08)
P -Value of Difference (C) — (U) [0.00] [0.02] [0.04] [0.00]
Note: ** and * indicate statistical significance at the 1-percent and 5-percent (two-tail) test levels, respectively.

Table 6. Debt or Equity?
This table displays results for OLS (with year- and firm-fixed effects) estimations of the baseline regressionmodel (Eq. (1) in the text), but estimated separately for net issues of debt (DebtF inancing) and equity(EquityF inancing) on the left-hand side of the specification. The reported estimates are the coefficients re-turned for CashF low. All firm data are collected from COMPUSTAT’s annual industrial tapes. The sampledfirms exclude financial institutions (SICs 6000—6999), utilities (SICs 4900—4999), and not-for-profit organizationsand governmental agencies (SICs greater than 8000). The estimations correct the error structure for heteroskedas-ticity and within-period error correlation using the White-Huber estimator. t-statistics (in parentheses).
Financial Constraints Criteria
Div. Payout Firm Size Bond Ratings CP Ratings
1. Constrained Firms (C)
DebtF inancing —0.0081 —0.0166 —0.0115 —0.0193(—0.79) (—1.52) (—1.24) (—1.55)
EquityF inancing —0.0053 —0.0142* —0.0127* —0.0069(—1.63) (—2.11) (—2.15) (—1.65)
2. Unconstrained Firms (U)
DebtF inancing —0.2504** —0.0592** —0.0485** —0.0975*(—7.61) (—4.31) (—2.90) (—2.55)
EquityF inancing —0.1821** —0.0435** —0.0416** —0.0891**(—10.08) (—3.52) (—3.58) (—5.58)
3. P -Value of Difference (C) — (U)
DebtF inancing [0.00] [0.02] [0.05] [0.05]
EquityF inancing [0.00] [0.04] [0.03] [0.00]
Note: ** and * indicate statistical significance at the 1-percent and 5-percent (two-tail) testlevels, respectively.

Table 7. The Cash Flow Sensitivity of External Finance: Credit Multiplier Model
This table displays results for OLS (with year- and firm-fixed effects) estimations of the credit multiplier regressionmodel (Eq. (4) in the text). All firm data are collected from COMPUSTAT’s annual industrial tapes. SeeTable 1 for detailed variable definitions. The sampled firms exclude financial institutions (SICs 6000—6999),utilities (SICs 4900—4999), and not-for-profit organizations and governmental agencies (SICs greater than 8000).The estimations correct the error structure for heteroskedasticity and within-period error correlation using theWhite-Huber estimator. t-statistics (in parentheses). The table also reports diagnostic statistics for instrumentoveridentification restrictions (p-values for Hansen’s J-statistics reported) and instruments’ first-stage partialF -statistics (only lowest F -statistics reported).
Dependent Variable Independent Variables R2 Obs.
ExternalF inancing CashF low Q Size Tangibility CashF low×Tangibility
Financial Constraints Criteria
1. Payout Policy
Constrained Firms (C) —0.0335 0.0039** 0.0154** —0.0068 0.0643** 0.419 30,947(—1.37) (4.23) (5.11) (—1.72) (2.58)
Unconstrained Firms (U) —0.3224** 0.0061** 0.0072 —0.0095 —0.0165 0.389 22,530(—8.54) (5.86) (1.01) (—1.64) (—1.09)
P -Value of Diff. (C) — (U) [0.00] [0.12] [0.32] [0.71] [0.00]
2. Firm Size
Constrained Firms (C) —0.0259 0.0046** 0.0236** —0.0057 0.0616** 0.501 21,873(—1.00) (4.61) (7.11) (—1.40) (3.20)
Unconstrained Firms (U) —0.1090** 0.0045** 0.0016 —0.0020 —0.0117 0.290 22,569(—2.95) (5.23) (1.57) (—0.47) (—1.12)
P -Value of Diff. (C) — (U) [0.07] [0.94] [0.00] [0.53] [0.00]
3. Bond Ratings
Constrained Firms (C) —0.0480* 0.0036** 0.0107** —0.0077 0.0615** 0.392 45,392(—2.05) (4.14) (4.66) (—1.93) (3.66)
Unconstrained Firms (U) —0.1482** 0.0057** 0.0063** —0.0095 0.0093 0.210 27,459(—2.99) (4.38) (2.60) (1.24) (1.02)
P -Value of Diff. (C) — (U) [0.06] [0.18] [0.21] [0.83] [0.00]
4. Comm. Paper Ratings
Constrained Firms (C) —0.0400* 0.0037** 0.0117** —0.0078 0.0647** 0.335 60,611(—2.02) (4.31) (8.32) (—1.13) (3.02)
Unconstrained Firms (U) —0.2346** 0.0030* —0.0014 —0.0066 —0.0098 0.119 12,240(—2.72) (1.97) (—1.42) (—1.42) (—0.45)
P -Value of Diff. (C) — (U) [0.03] [0.69] [0.01] [0.89] [0.01]
Note: ** and * indicate statistical significance at the 1-percent and 5-percent (two-tail) test levels, respectively.
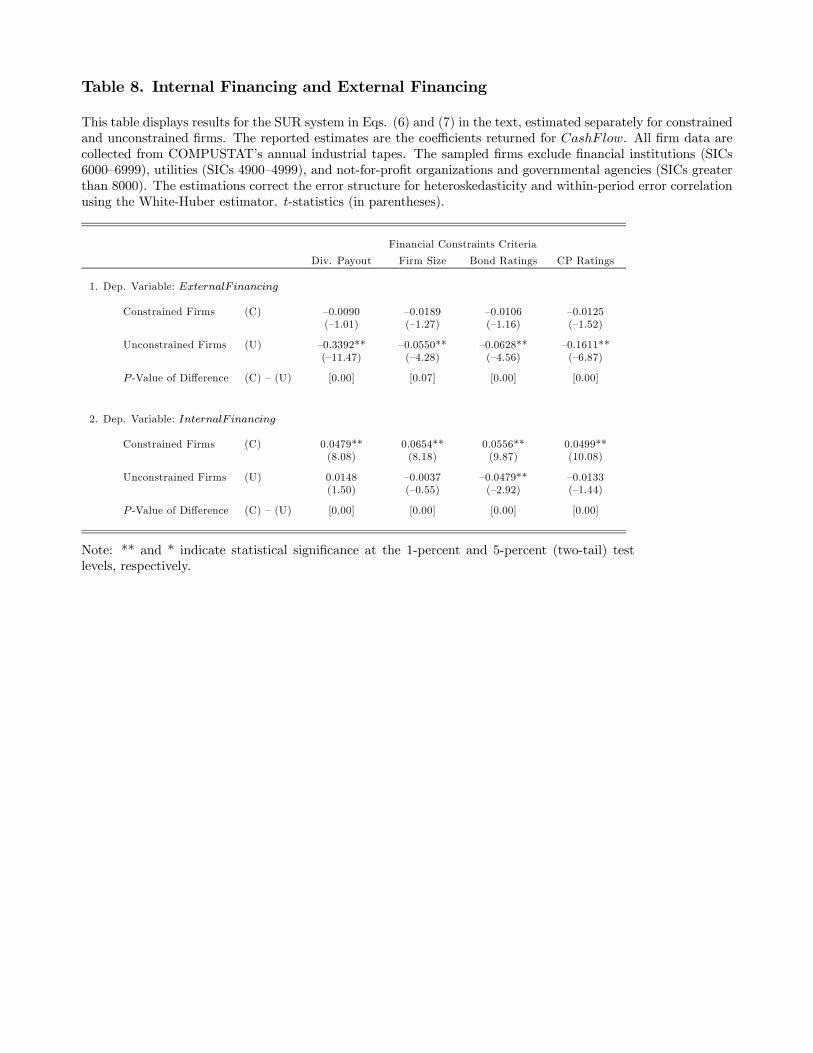
Table 8. Internal Financing and External Financing
This table displays results for the SUR system in Eqs. (6) and (7) in the text, estimated separately for constrainedand unconstrained firms. The reported estimates are the coefficients returned for CashF low. All firm data arecollected from COMPUSTAT’s annual industrial tapes. The sampled firms exclude financial institutions (SICs6000—6999), utilities (SICs 4900—4999), and not-for-profit organizations and governmental agencies (SICs greaterthan 8000). The estimations correct the error structure for heteroskedasticity and within-period error correlationusing the White-Huber estimator. t-statistics (in parentheses).
Financial Constraints Criteria
Div. Payout Firm Size Bond Ratings CP Ratings
1. Dep. Variable: ExternalF inancing
Constrained Firms (C) —0.0090 —0.0189 —0.0106 —0.0125(—1.01) (—1.27) (—1.16) (—1.52)
Unconstrained Firms (U) —0.3392** —0.0550** —0.0628** —0.1611**(—11.47) (—4.28) (—4.56) (—6.87)
P -Value of Difference (C) — (U) [0.00] [0.07] [0.00] [0.00]
2. Dep. Variable: InternalF inancing
Constrained Firms (C) 0.0479** 0.0654** 0.0556** 0.0499**(8.08) (8.18) (9.87) (10.08)
Unconstrained Firms (U) 0.0148 —0.0037 —0.0479** —0.0133(1.50) (—0.55) (—2.92) (—1.44)
P -Value of Difference (C) — (U) [0.00] [0.00] [0.00] [0.00]
Note: ** and * indicate statistical significance at the 1-percent and 5-percent (two-tail) testlevels, respectively.
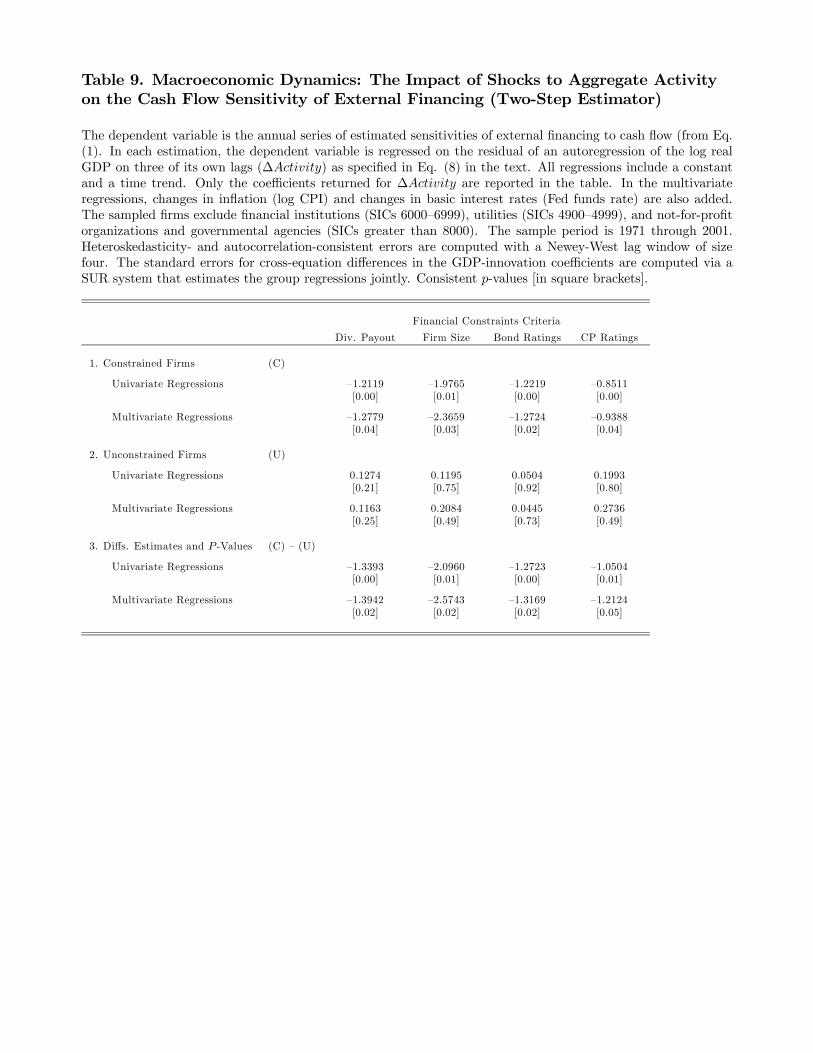
Table 9. Macroeconomic Dynamics: The Impact of Shocks to Aggregate Activityon the Cash Flow Sensitivity of External Financing (Two-Step Estimator)
The dependent variable is the annual series of estimated sensitivities of external financing to cash flow (from Eq.(1). In each estimation, the dependent variable is regressed on the residual of an autoregression of the log realGDP on three of its own lags (∆Activity) as specified in Eq. (8) in the text. All regressions include a constantand a time trend. Only the coefficients returned for ∆Activity are reported in the table. In the multivariateregressions, changes in inflation (log CPI) and changes in basic interest rates (Fed funds rate) are also added.The sampled firms exclude financial institutions (SICs 6000—6999), utilities (SICs 4900—4999), and not-for-profitorganizations and governmental agencies (SICs greater than 8000). The sample period is 1971 through 2001.Heteroskedasticity- and autocorrelation-consistent errors are computed with a Newey-West lag window of sizefour. The standard errors for cross-equation differences in the GDP-innovation coefficients are computed via aSUR system that estimates the group regressions jointly. Consistent p-values [in square brackets].
Financial Constraints Criteria
Div. Payout Firm Size Bond Ratings CP Ratings
1. Constrained Firms (C)
Univariate Regressions —1.2119 —1.9765 —1.2219 —0.8511[0.00] [0.01] [0.00] [0.00]
Multivariate Regressions —1.2779 —2.3659 —1.2724 —0.9388[0.04] [0.03] [0.02] [0.04]
2. Unconstrained Firms (U)
Univariate Regressions 0.1274 0.1195 0.0504 0.1993[0.21] [0.75] [0.92] [0.80]
Multivariate Regressions 0.1163 0.2084 0.0445 0.2736[0.25] [0.49] [0.73] [0.49]
3. Diffs. Estimates and P -Values (C) — (U)
Univariate Regressions —1.3393 —2.0960 —1.2723 —1.0504[0.00] [0.01] [0.00] [0.01]
Multivariate Regressions —1.3942 —2.5743 —1.3169 —1.2124[0.02] [0.02] [0.02] [0.05]
Related Documents


![Macroeconomics and financing frictions, [lectures 2 and 3]. Part 1: crisis narrative and the thieving banker model Lecture to MSc Advanced Macro Students,](https://static.cupdf.com/doc/110x72/56649e855503460f94b87ec3/macroeconomics-and-financing-frictions-lectures-2-and-3-part-1-crisis.jpg)