The Initiative on Financing for Resilient and Green Urban Global Solutions (FRUGS) Financing for Resilient and Green Urban Solutions in Cebu, Philippines

Welcome message from author
This document is posted to help you gain knowledge. Please leave a comment to let me know what you think about it! Share it to your friends and learn new things together.
Transcript
The Initiative on Financing for Resilient and Green Urban Global Solutions (FRUGS)
Financing for Resilient and Green Urban Solutions in
Cebu, Philippines

First published by United Nations Human Settlements Programme (UN-Habitat) 2020
All rights reserved
HS Number: HS/061/19E
ISBN Number(Series): 978-92-1-133389-3
ISBN Number:(Volume) 978-92-1-132853-0
Chief Editors and Managers: Xing Quan Zhang, Irina Eichenauer and Wolfgang Ryll
Principal Author: Cristina Gregorio
Expert Team: Cristina Gregorio, Godfred Alufar Bokpin, Luxien Ariyan, Steven Segerlin, Nicholas Ngece, Michael Bookstaber, David Rosen, Hongwei Wang, Guodong Chen, Simon Gusah, Frank Gyamfi Yeboah, Joseph Kofi Teye, Nicolo Cannizzaro, Daniel Duman, Tekalign Tsige and Mercy Gichora
Disclaimer: The designations employed and the presentation of material in this publication do not imply the
expression of any opinion whatsoever on the part of the secretariat of the United Nations concerning the legal
status of any county, territory, city or area or its authorities, or concerning the delimitation of its frontiers or
boundaries regarding its economic system or degree of development. Excerpts may be reproduced without
authorization, on condition that the source is indicated. Views expressed in this publication do not necessarily
reflect those of the United Nations Human Settlements Programme, the United Nations and its member states.
The Financing for Resilient and Green Urban Global Solutions (FRUGS) Initiative is a partnership among
UN-HABITAT, KfW on behalf of and with financial support of the German Federal Ministry for Economic
Cooperation and Development (BMZ), African Development Bank, Inter-American Development Bank and
Shelter Afrique.
Executive Director: Maimunah Mohd Sharif
Deputy Executive Director: Victor Kisob
Directors: Raf Tuts, Christine Knudsen
Head of Knowledge and Innovation: Eduardo Moreno
Financing for Resilient and Green Urban Solutions in Cebu, Philippines
The Initiative on Financing for Resilient and Green Urban Global Solutions (FRUGS)

iv | Financing for Resilient and Green Urban Solutions in Cebu, Philippines
The Initiative on Financing for Resilient and Green Urban Global Solutions (FRUGS)
Cebu, Philippines © SHUTTERSTOCK / Tirachard Kumtanom

Financing for Resilient and Green Urban Solutions in Cebu, Philippines | v
The Initiative on Financing for Resilient and Green Urban Global Solutions (FRUGS)
vi | Financing for Resilient and Green Urban Solutions in Cebu, Philippines
The Initiative on Financing for Resilient and Green Urban Global Solutions (FRUGS)
Table of Contents
EXECUTIVE SUMMARY .....................................................................................................................................................................1
Cebu City Profile ..................................................................................................................................................................................... 1
Housing Needs ...................................................................................................................................................................................... 3
Housing Finance Instruments ............................................................................................................................................................ 3
Housing Finance Challenges ............................................................................................................................................................ 3
Addressing Housing Finance Challenges ...................................................................................................................................... 3
Estimated financing for 2015 to 2040 for the water sector alone has a total project value of PhP 34,370 million. .. 4
Local Government Finance ................................................................................................................................................................. 4
Resilient Housing and Green Urban Development ...................................................................................................................... 4
Opportunities in Resilient Urban Development ........................................................................................................................... 4
Financing Housing and Urban Development ................................................................................................................................ 5
Next Steps for FRUGS ......................................................................................................................................................................... 5
CHAPTER 1 STATUS OF CEBU CITY’S URBANIZATION, ECONOMIC AND FINANCIAL SYSTEMS ....................................7
1.1 Brief History of Cebu City .............................................................................................................................................................. 8
1.2 Geographic Characteristics of Cebu City ................................................................................................................................ 8
1.3 Population Growth and Urbanization Patterns of Cebu City ..............................................................................................12
1.3.1 Current Status of Urbanization and Household Structure ................................................................................................12
1.3.2 Future Projection of Urbanization by 2030 ........................................................................................................................19
1.4 Economic System, Structure, and Development in Cebu City .........................................................................................22
1.5 Local Governance System, Housing and Urban Development Institutional Arrangements .....................................27
1.6 Municipal Financial System .....................................................................................................................................................34
1.7 Municipal Revenue and Expenditure by Categories ...........................................................................................................36
1.8 Financing Sources and Flows for Housing, Infrastructure, and Urban Services ..........................................................38
CHAPTER 2 FINANCING NEEDS AND STATUS FOR HOUSING, INFRASTRUCTURE, AND URBAN SERVICES .......... 43
2.1 Financing Needs for Low and Medium Income Housing ...................................................................................................44
2.1.1 Financing Needs for Low Income Housing .........................................................................................................................45
2.1.2 Financing Needs for Lower and Lower-Middle Income Housing .................................................................................49
2.2 Financing Needs for Infrastructure and Urban Services ..................................................................................................50
2.2.1 Financing Needs for Transport ...............................................................................................................................................51
2.2.2 Financing Needs for Energy and Power ............................................................................................................................52
2.2.3 Financing Needs for Water and Waste Management ....................................................................................................54
2.3 Sources and Status of Finance for Housing, Infrastructure, and Urban Services .......................................................61
2.3.1 Sources and Status of Finance for Lower and Lower-Middle Income Housing .........................................................61
2.3.2 Sources and Status of Finance for Transport, Energy, Water and Waste ..................................................................63
Financing for Resilient and Green Urban Solutions in Cebu, Philippines | vii
The Initiative on Financing for Resilient and Green Urban Global Solutions (FRUGS)
CHAPTER 3 FINANCE NEEDS AND STATUS FOR RESILIENT AND GREEN URBAN SOLUTIONS .................................. 64
3.1 Financing Needs for Resilient and Green Urban Solutions ...............................................................................................66
3.1.1 Financing Needs for Resilient and Green Housing Development ................................................................................66
3.1.2 Financing Needs for Resilient and Green Infrastructure Development ......................................................................68
3.1.3 Financing Needs for Resilient and Green Urban Services .............................................................................................72
3.2 Sources and Status of Finance for Resilient and Green Urban Solutions .................................................................... 73
3.2.1 Current Financing Sources and Flows in Resilient and Green Urban Solutions ...................................................... 73
CHAPTER 4 FINANCING INSTRUMENTS FOR HOUSING, INFRASTRUCTURE AND URBAN SERVICES ......................76
4.1 Key Challenges and Constraints in Financing the Housing Sector ................................................................................. 77
4.2 Financial Instruments for Housing ..........................................................................................................................................83
4.2.1 Assessment of Financing Instruments for Formal Housing ...........................................................................................84
4.2.2 Financing Sources and Flows for Formal Housing .........................................................................................................85
4.2.3 Assessment of Financing Instruments for Lower and Lower-Middle Income Population ......................................85
4.2.4 Financing Sources and Flows for Lower and Lower-Middle Income Population ....................................................87
4.3 Financing Instruments for Infrastructure and Urban Services .........................................................................................88
4.4 Scale and Volume of Finance ..................................................................................................................................................90
4.4.1 Assessing the scale and volume of financing involved in each financial instrument in Cebu City .....................90
4.5 Patterns of Financing Instruments to Cebu City Characteristics ....................................................................................90
4.5.1 Assessing the potential connection and patterns of financing instruments in relation to the types of economic systems, economic development stage, household income, urban policies, national policies and regulation, national financial systems, and financial markets. ............................................................................................................90
4.6 International Finance ..................................................................................................................................................................92
4.6.1 Assessing the financial flows and trends of international finance and international aid in and to Cebu City ...92
4.7 Assessing City Financing Challenges ...................................................................................................................................93
4.7.1 Macro level challenges (e.g. national regulatory, policy constraints, financial market volatility, transparency and accountability issues) ................................................................................................................................................................93
4.7.2 Sectoral challenges (e.g. market, demand, volume, technology, financial management) ......................................94
4.7.3 Project level challenges ..........................................................................................................................................................95
4.7.4 Municipal government capacity constraints ......................................................................................................................95
CHAPTER 5 IMPACTS OF FINANCING INSTRUMENTS AT THE FINANCIAL SYSTEM ...................................................... 97
5.1 Impacts on the Financial System ..............................................................................................................................................98
5.1.1 Assessing the impacts of financial instruments at the financial system level, particularly on the sustainability and resilience of the national financial system .................................................................................................................98
5.2 Impacts on Sectors ................................................................................................................................................................... 105
viii | Financing for Resilient and Green Urban Solutions in Cebu, Philippines
The Initiative on Financing for Resilient and Green Urban Global Solutions (FRUGS)
5.2.1 Identifying issues faced by different actors and stakeholders in financing housing, infrastructure and urban services ....................................................................................................................................................................................... 105
5.3 Challenges faced by different actors ................................................................................................................................... 107
5.3.1 Identify issues faced by different actors and stakeholders in financing housing and infrastructure to meet the resilient and green requirements ........................................................................................................................................ 108
CHAPTER 6 ALTERNATIVE FINANCIAL INSTRUMENTS ......................................................................................................... 110
6.1 New Challenges, Approaches, Instruments .......................................................................................................................... 111
6.1.1 Analyzing new housing and infrastructure development challenges, issues, priorities and financing opportunities and solutions in the city ................................................................................................................................. 111
6.1.2 Analyzing approaches which could reduce the costs of affordable housing and narrow the affordable housing gap in the city, including market-oriented solutions (e.g. lowering the cost of land, construction, operations and maintenance, and financing) ................................................................................................................... 112
6.1.2 Assessing opportunities for launching and developing new instruments which support low carbon and climate resilient housing and urban development ........................................................................................................... 113
6.2 Improving Financial and Technical Support at the City Level ......................................................................................... 115
6.2.1 Present recommendations on how to improve efficiency and effectiveness of financial and technical support in the city .................................................................................................................................................................................... 115
6.3 Opportunities for International Financial Institutions and Agencies ............................................................................. 115
6.3.1 Support to Financial Sector Development ......................................................................................................................... 116
6.3.2 Financing Opportunities in Cebu City .................................................................................................................................117
6.3.3 Capacity building opportunities for financing Cebu City ............................................................................................ 118
6.3.4 Partnership opportunities as well as knowledge development and sharing in Financing FRUGS .................. 120
6.3.5 Opportunities for launching and developing new instruments ................................................................................. 120
CHAPTER 7 PROJECT IDENTIFICATION ...................................................................................................................................122
7.1 National Priorities for Housing, Infrastructure and Urban Services ............................................................................... 123
7.2 City Priorities for Housing, Infrastructure, and Urban Services ..................................................................................... 125
7.3 Financing Opportunities for Project Pipelines .................................................................................................................... 126
7.4 Project Identification and Pipelines for Low Income, lower and Lower-Middle Income Housing ......................... 128
7.5 Project Identification and Pipelines for Infrastructure and Urban Services in the Philippines .............................. 128
7.6 Project Identification and Pipelines for Resilient and Green Urban Development Projects in the Philippines .. 131
CHAPTER 8 CONCLUDING REMARKS AND RECOMMENDATIONS ...................................................................................133
REFERENCES .................................................................................................................................................................................. 137
ANNEXES ........................................................................................................................................................................................145
Annex 1: NHFMC’s Secondary Market and Programs.............................................................................................................. 145
Annex 2: Defining Urbanization and an Urban Area in the Philippines ...............................................................................147
Annex 3: Key legislations for the Philippine Urban Sector ..................................................................................................... 148
Financing for Resilient and Green Urban Solutions in Cebu, Philippines | ix
The Initiative on Financing for Resilient and Green Urban Global Solutions (FRUGS)
Annex 4: List of Housing Related Ordinances in Cebu City ................................................................................................... 149
Annex 5: Summary of Specific Fees and Charges for LGUs .................................................................................................. 150
Annex 6: Statement of Receipts and Expenditures of Cebu City .......................................................................................... 151
Annex 7: HUDCC’s Proposed Housing Sector Roadmap from 2017 to 2022 ................................................................... 154
Annex 8: Official Development Assistance Pipeline of Programs and Projects in the Philippines .............................. 156
Annex 9: Dutertenomics’ Build, Build, Build Flagship Projects and Overall List .............................................................. 236
Annex 10: Pipeline of Disaster Risk Reduction and Management Projects in Cebu City .............................................. 239
Annex 11: Priority Projects of Cebu City on Housing, Urban Infrastructure and Services from 2005 to 2020 ........ 242
Annex 12: KfW Financing Instruments ........................................................................................................................................250
Annex 13: List of Interviewees ....................................................................................................................................................... 252
Annex 14: List of Further Suggested and/or Requested Interviews .................................................................................... 253
x | Financing for Resilient and Green Urban Solutions in Cebu, Philippines
The Initiative on Financing for Resilient and Green Urban Global Solutions (FRUGS)
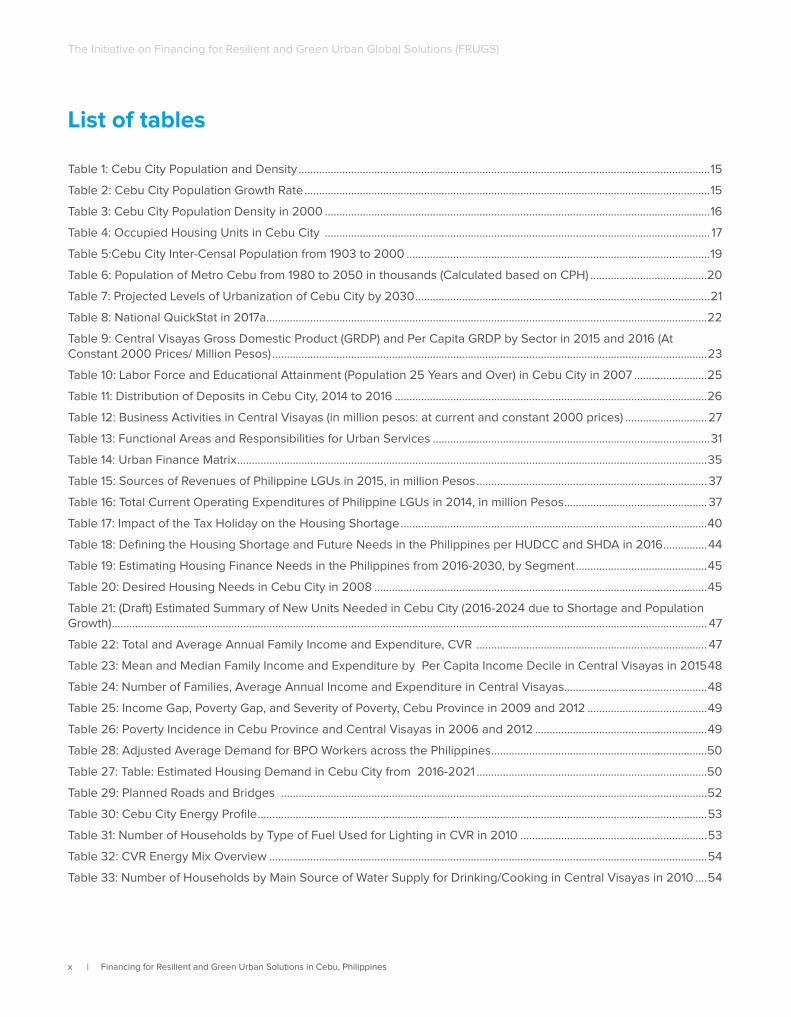
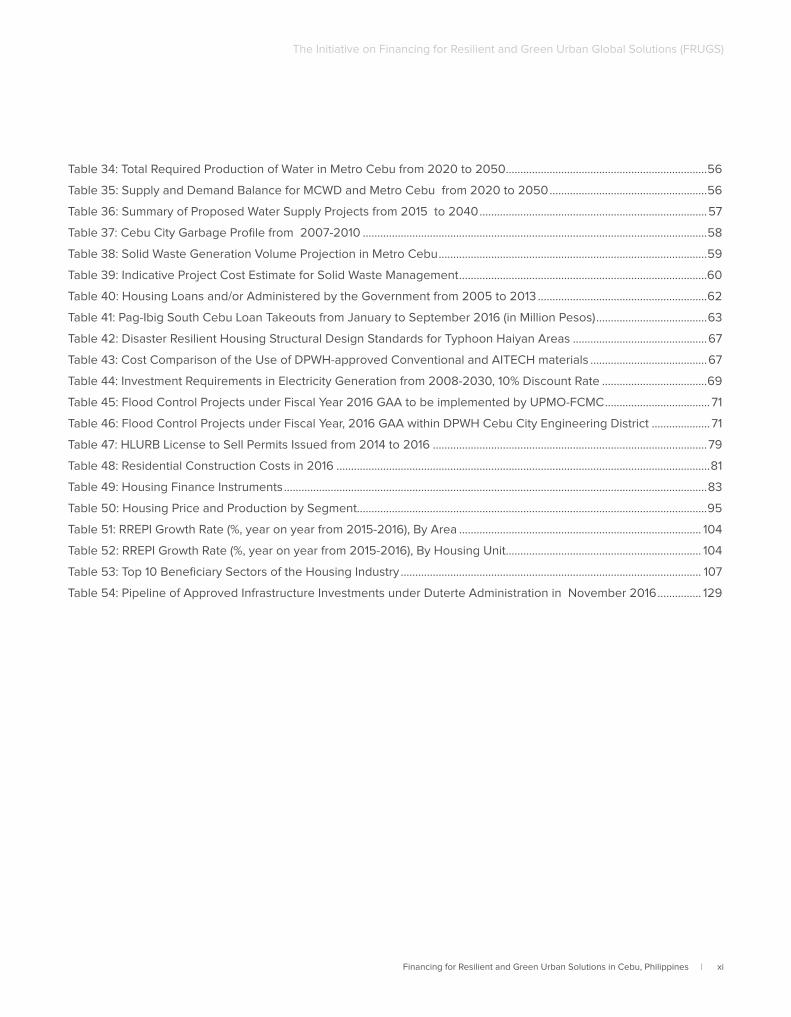
List of tables
Table 1: Cebu City Population and Density .............................................................................................................................................15
Table 2: Cebu City Population Growth Rate ...........................................................................................................................................15
Table 3: Cebu City Population Density in 2000 ....................................................................................................................................16
Table 4: Occupied Housing Units in Cebu City .................................................................................................................................... 17
Table 5:Cebu City Inter-Censal Population from 1903 to 2000 ........................................................................................................19
Table 6: Population of Metro Cebu from 1980 to 2050 in thousands (Calculated based on CPH) ........................................20
Table 7: Projected Levels of Urbanization of Cebu City by 2030 .....................................................................................................21
Table 8: National QuickStat in 2017a .......................................................................................................................................................22
Table 9: Central Visayas Gross Domestic Product (GRDP) and Per Capita GRDP by Sector in 2015 and 2016 (At Constant 2000 Prices/ Million Pesos) .....................................................................................................................................................23
Table 10: Labor Force and Educational Attainment (Population 25 Years and Over) in Cebu City in 2007 .........................25
Table 11: Distribution of Deposits in Cebu City, 2014 to 2016 ...........................................................................................................26
Table 12: Business Activities in Central Visayas (in million pesos: at current and constant 2000 prices) ............................27
Table 13: Functional Areas and Responsibilities for Urban Services ...............................................................................................31
Table 14: Urban Finance Matrix .................................................................................................................................................................35
Table 15: Sources of Revenues of Philippine LGUs in 2015, in million Pesos ............................................................................... 37
Table 16: Total Current Operating Expenditures of Philippine LGUs in 2014, in million Pesos ................................................. 37
Table 17: Impact of the Tax Holiday on the Housing Shortage .........................................................................................................40
Table 18: Defining the Housing Shortage and Future Needs in the Philippines per HUDCC and SHDA in 2016 ...............44
Table 19: Estimating Housing Finance Needs in the Philippines from 2016-2030, by Segment .............................................45
Table 20: Desired Housing Needs in Cebu City in 2008 ..................................................................................................................45
Table 21: (Draft) Estimated Summary of New Units Needed in Cebu City (2016-2024 due to Shortage and Population Growth) ............................................................................................................................................................................................................ 47
Table 22: Total and Average Annual Family Income and Expenditure, CVR ............................................................................... 47
Table 23: Mean and Median Family Income and Expenditure by Per Capita Income Decile in Central Visayas in 2015 48
Table 24: Number of Families, Average Annual Income and Expenditure in Central Visayas.................................................48
Table 25: Income Gap, Poverty Gap, and Severity of Poverty, Cebu Province in 2009 and 2012 .........................................49
Table 26: Poverty Incidence in Cebu Province and Central Visayas in 2006 and 2012 ...........................................................49
Table 28: Adjusted Average Demand for BPO Workers across the Philippines ..........................................................................50
Table 27: Table: Estimated Housing Demand in Cebu City from 2016-2021 ...............................................................................50
Table 29: Planned Roads and Bridges ..................................................................................................................................................52
Table 30: Cebu City Energy Profile ..........................................................................................................................................................53
Table 31: Number of Households by Type of Fuel Used for Lighting in CVR in 2010 ................................................................53
Table 32: CVR Energy Mix Overview ......................................................................................................................................................54
Table 33: Number of Households by Main Source of Water Supply for Drinking/Cooking in Central Visayas in 2010 ....54
Financing for Resilient and Green Urban Solutions in Cebu, Philippines | xi
The Initiative on Financing for Resilient and Green Urban Global Solutions (FRUGS)
Table 34: Total Required Production of Water in Metro Cebu from 2020 to 2050 .....................................................................56
Table 35: Supply and Demand Balance for MCWD and Metro Cebu from 2020 to 2050 ......................................................56
Table 36: Summary of Proposed Water Supply Projects from 2015 to 2040 ..............................................................................57
Table 37: Cebu City Garbage Profile from 2007-2010 ......................................................................................................................58
Table 38: Solid Waste Generation Volume Projection in Metro Cebu ............................................................................................59
Table 39: Indicative Project Cost Estimate for Solid Waste Management .....................................................................................60
Table 40: Housing Loans and/or Administered by the Government from 2005 to 2013 ..........................................................62
Table 41: Pag-Ibig South Cebu Loan Takeouts from January to September 2016 (in Million Pesos) ......................................63
Table 42: Disaster Resilient Housing Structural Design Standards for Typhoon Haiyan Areas ..............................................67
Table 43: Cost Comparison of the Use of DPWH-approved Conventional and AITECH materials ........................................67
Table 44: Investment Requirements in Electricity Generation from 2008-2030, 10% Discount Rate ....................................69
Table 45: Flood Control Projects under Fiscal Year 2016 GAA to be implemented by UPMO-FCMC .................................... 71
Table 46: Flood Control Projects under Fiscal Year, 2016 GAA within DPWH Cebu City Engineering District .................... 71
Table 47: HLURB License to Sell Permits Issued from 2014 to 2016 ..............................................................................................79
Table 48: Residential Construction Costs in 2016 ................................................................................................................................81
Table 49: Housing Finance Instruments .................................................................................................................................................83
Table 50: Housing Price and Production by Segment........................................................................................................................95
Table 51: RREPI Growth Rate (%, year on year from 2015-2016), By Area ................................................................................... 104
Table 52: RREPI Growth Rate (%, year on year from 2015-2016), By Housing Unit ................................................................... 104
Table 53: Top 10 Beneficiary Sectors of the Housing Industry ....................................................................................................... 107
Table 54: Pipeline of Approved Infrastructure Investments under Duterte Administration in November 2016 ............... 129
xii | Financing for Resilient and Green Urban Solutions in Cebu, Philippines
The Initiative on Financing for Resilient and Green Urban Global Solutions (FRUGS)
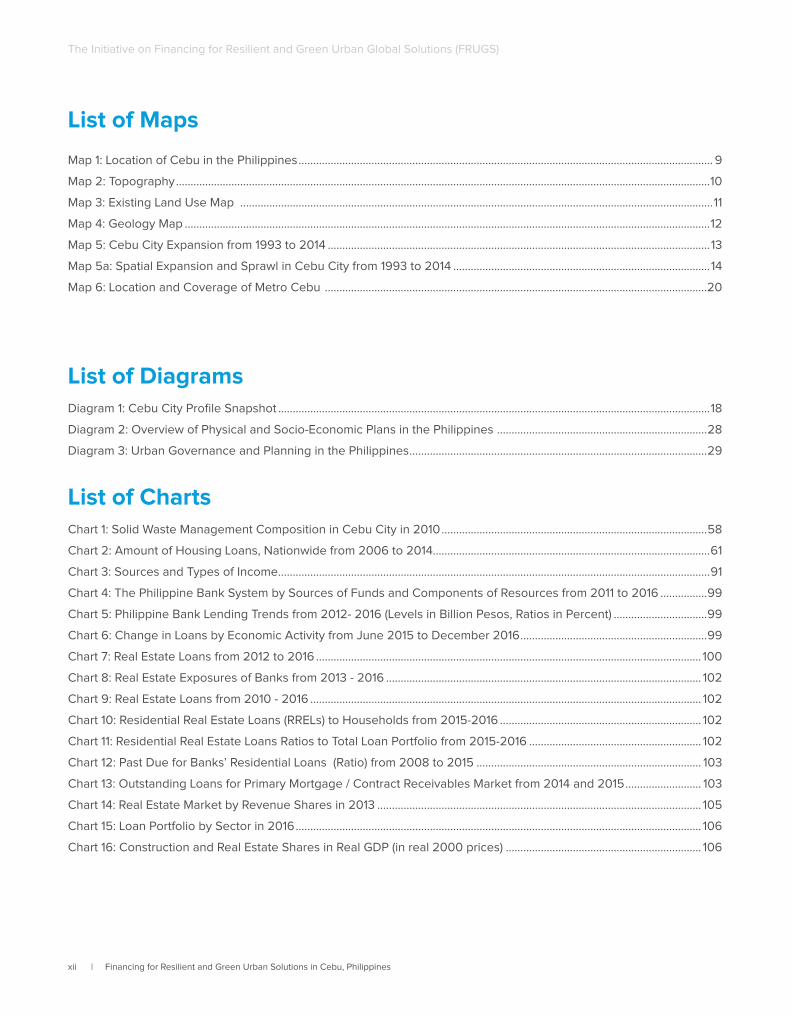
List of Maps
Map 1: Location of Cebu in the Philippines .............................................................................................................................................. 9
Map 2: Topography .......................................................................................................................................................................................10
Map 3: Existing Land Use Map ..................................................................................................................................................................11
Map 4: Geology Map ....................................................................................................................................................................................12
Map 5: Cebu City Expansion from 1993 to 2014 ...................................................................................................................................13
Map 5a: Spatial Expansion and Sprawl in Cebu City from 1993 to 2014 ........................................................................................14
Map 6: Location and Coverage of Metro Cebu ...................................................................................................................................20
List of Diagrams Diagram 1: Cebu City Profile Snapshot ....................................................................................................................................................18
Diagram 2: Overview of Physical and Socio-Economic Plans in the Philippines ........................................................................28
Diagram 3: Urban Governance and Planning in the Philippines ......................................................................................................29
List of Charts Chart 1: Solid Waste Management Composition in Cebu City in 2010 ...........................................................................................58
Chart 2: Amount of Housing Loans, Nationwide from 2006 to 2014...............................................................................................61
Chart 3: Sources and Types of Income ....................................................................................................................................................91
Chart 4: The Philippine Bank System by Sources of Funds and Components of Resources from 2011 to 2016 ................99
Chart 5: Philippine Bank Lending Trends from 2012- 2016 (Levels in Billion Pesos, Ratios in Percent) ................................99
Chart 6: Change in Loans by Economic Activity from June 2015 to December 2016 ................................................................99
Chart 7: Real Estate Loans from 2012 to 2016 .................................................................................................................................... 100
Chart 8: Real Estate Exposures of Banks from 2013 - 2016 ............................................................................................................ 102
Chart 9: Real Estate Loans from 2010 - 2016 ...................................................................................................................................... 102
Chart 10: Residential Real Estate Loans (RRELs) to Households from 2015-2016 ..................................................................... 102
Chart 11: Residential Real Estate Loans Ratios to Total Loan Portfolio from 2015-2016 ........................................................... 102
Chart 12: Past Due for Banks’ Residential Loans (Ratio) from 2008 to 2015 ............................................................................. 103
Chart 13: Outstanding Loans for Primary Mortgage / Contract Receivables Market from 2014 and 2015 .......................... 103
Chart 14: Real Estate Market by Revenue Shares in 2013 ............................................................................................................... 105
Chart 15: Loan Portfolio by Sector in 2016 ........................................................................................................................................... 106
Chart 16: Construction and Real Estate Shares in Real GDP (in real 2000 prices) ................................................................... 106
Financing for Resilient and Green Urban Solutions in Cebu, Philippines | xiii
The Initiative on Financing for Resilient and Green Urban Global Solutions (FRUGS)
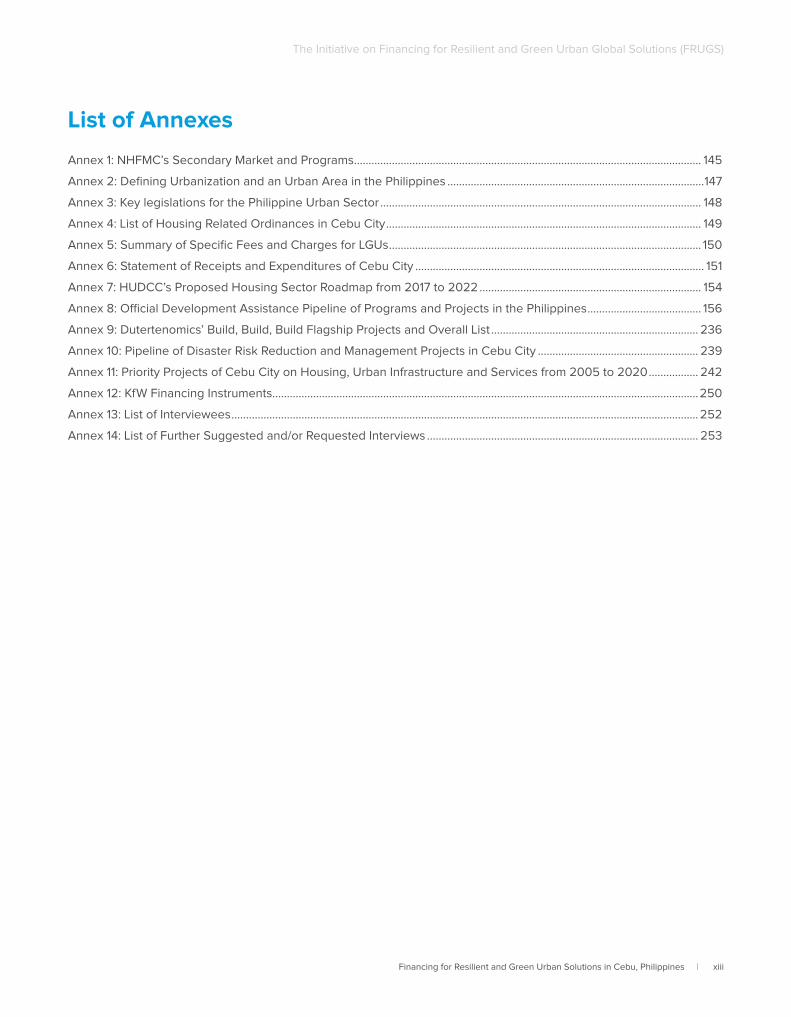
List of Annexes
Annex 1: NHFMC’s Secondary Market and Programs ....................................................................................................................... 145
Annex 2: Defining Urbanization and an Urban Area in the Philippines ........................................................................................147
Annex 3: Key legislations for the Philippine Urban Sector .............................................................................................................. 148
Annex 4: List of Housing Related Ordinances in Cebu City ............................................................................................................ 149
Annex 5: Summary of Specific Fees and Charges for LGUs ........................................................................................................... 150
Annex 6: Statement of Receipts and Expenditures of Cebu City ................................................................................................... 151
Annex 7: HUDCC’s Proposed Housing Sector Roadmap from 2017 to 2022 ............................................................................ 154
Annex 8: Official Development Assistance Pipeline of Programs and Projects in the Philippines ....................................... 156
Annex 9: Dutertenomics’ Build, Build, Build Flagship Projects and Overall List ....................................................................... 236
Annex 10: Pipeline of Disaster Risk Reduction and Management Projects in Cebu City ....................................................... 239
Annex 11: Priority Projects of Cebu City on Housing, Urban Infrastructure and Services from 2005 to 2020 ................. 242
Annex 12: KfW Financing Instruments..................................................................................................................................................250
Annex 13: List of Interviewees ................................................................................................................................................................ 252
Annex 14: List of Further Suggested and/or Requested Interviews ............................................................................................. 253
xiv | Financing for Resilient and Green Urban Solutions in Cebu, Philippines
The Initiative on Financing for Resilient and Green Urban Global Solutions (FRUGS)
ADB Asian Development Bank
AIP Annual Investment Plan
AITECH Accreditation of Innovative Technologies for Housing
APEC Asia Pacific Economic Cooperation
ARI Annual Regular Income
BAU Business as Usual
BLGF Bureau of Local Government Finance
BOI Board of Investments
BPO Business Process Outsourcing
BSP Bangko Sentral ng Pilipinas
CCA Climate Change Adaptation
CCC Climate Change Commission
CCET Climate Change Expenditure Tagging
CCG Cebu City Government
CDM Clean Development Mechanism
CDP Comprehensive Development Plan
CER Certified Emission Reduction
CIP Core Investment Program
CIIP Comprehensive and Integrated Infrastructure Program
CISFA Comprehensive and Integrated Shelter and Finance Act
CITOM Cebu City Traffic Operations Management
CLUP Comprehensive Land Use Plan
CMP Community Mortgage Program
CPH Census of Population and Housing
CVR Central Visayas Region
DBM Department of Budget and Management
DBP Development Bank of the Philippines
DOE Department of Energy
DOF Department of Finance
DRRM Disaster Risk Reduction and Management
DENR Department of Environment and Natural Resources
DPWH Department of Public Works and Highways
DRR Disaster Risk Reduction
EO Executive Order
FCDU Foreign Currency Deposit Units
Abbreviations
Financing for Resilient and Green Urban Solutions in Cebu, Philippines | xv
The Initiative on Financing for Resilient and Green Urban Global Solutions (FRUGS)
FRUGS Financing Resilient and Green Urban Global Solutions
FSSC Financial Stability Coordinating Council
GBC Green Building Code
GCF Green Climate Fund
GFIs Government Financial Institutions
GHG Greenhouse Gas
GRP Gross Regional Product
GSIS Government Service Insurance System
HDMF Home Development Mutual Fund
HGC Home Guarantee Corporation
HLURB Housing and Land Use Regulatory Board
HOA Homeowners’ Association
HUDCC Housing and Urban Development Coordinating Council
IC Insurance Commission
ICC Investment Coordination Committee
IMF International Monetary Fund
INDCs Intended Nationally Determined Contributions
IPP Investment Priorities Plan
IRA Internal Revenue Allotment
ITH Income Tax Holiday
KfW KfW Development Bank
KSA Key Shelter Agencies
LBP Land Bank of the Philippines
LCCAP Local Climate Change Adaptation Plan
LEED Leadership in Energy and Environmental Design
LGC Local Government Code
LGU Local Government Unit
LGUGC Local Government Unit Guarantee Corporation
LSP Local Shelter Plan
LTV Loan to Value Ratio
MCDA Metro Cebu Development Authority
MCDCB Metro Cebu Development and Coordinating Board
MCWD Metropolitan Cebu Water District
MDFO Municipal Development Fund Office
MTPDP Medium-term Philippine Development Plan
MRF Material Recovery Facility
MRV Monitoring, Reporting and Verification
NCC National Competitiveness Council
NCCAP National Climate Change Adaptation Plan
xvi | Financing for Resilient and Green Urban Solutions in Cebu, Philippines
The Initiative on Financing for Resilient and Green Urban Global Solutions (FRUGS)
NDRRMC National Disaster Risk Reduction and Management Council
NEDA National Economic Development Authority
NEEDS National Environmental, Economic, and Developmental Study
NFPP National Framework for Physical Planning
NHA National Housing Authority
NISUS National Informal Settlements Upgrading Strategy
NPL Non-performing loans
NSCB National Statistical Coordination Board
NSS National Spatial Strategy
NUDHF National Urban Development and Housing Framework
ODA Official Development Assistance
PAP Programs, activities and projects
PEP Philippine Energy Plan
PDIC Philippine Deposit and Insurance Corporation
PDRF Philippine Disaster Resilience Foundation
PDP Philippine Development Plan
PFI Private Financial Institutions
PGBC Philippine Green Building Code
PIP Philippine Investment Plan
PPP Public-Private Partnership
PSF People Survival Fund
PSA Philippine Statistics Authority
QRF Quick Response Fund
RA Republic Act
RRFP Residential Real Estate Financing Program
SEC Securities and Exchange Commission
SHDA Subdivision and Housing Developer’s Association
SHFC Social Housing Finance Corporation
SWM Solid Waste Management
SSS Social Service Security System
TLP Total Loan Portfolio
UDHA Urban Development and Housing Act
UNFCCC United Nations Framework Convention on Climate Change
UN-HABITAT United Nations Human Settlements Program
UPMO-FCMC Flood Control Management Cluster
VECO Visayan Electric Company
WtE Waste to Energy
Financing for Resilient and Green Urban Solutions in Cebu, Philippines | 1
The Initiative on Financing for Resilient and Green Urban Global Solutions (FRUGS)
Executive Summary
The KfW and UN-Habitat study on Financing for Resilient and Green Urban Solutions (FRUGS) includes Cebu City in the Philippines. This report examined the status of housing and urban infrastructure and how much investment is needed. The assessment particularly considered the status of housing finance instruments and costs, as well as the roles of
local and national governments in facilitating investments. The report was also anchored on determining whether the identified investment needs address resilient housing and infrastructure and assessed challenges to financing such green urban solutions in Cebu City and in the Philippines in general.
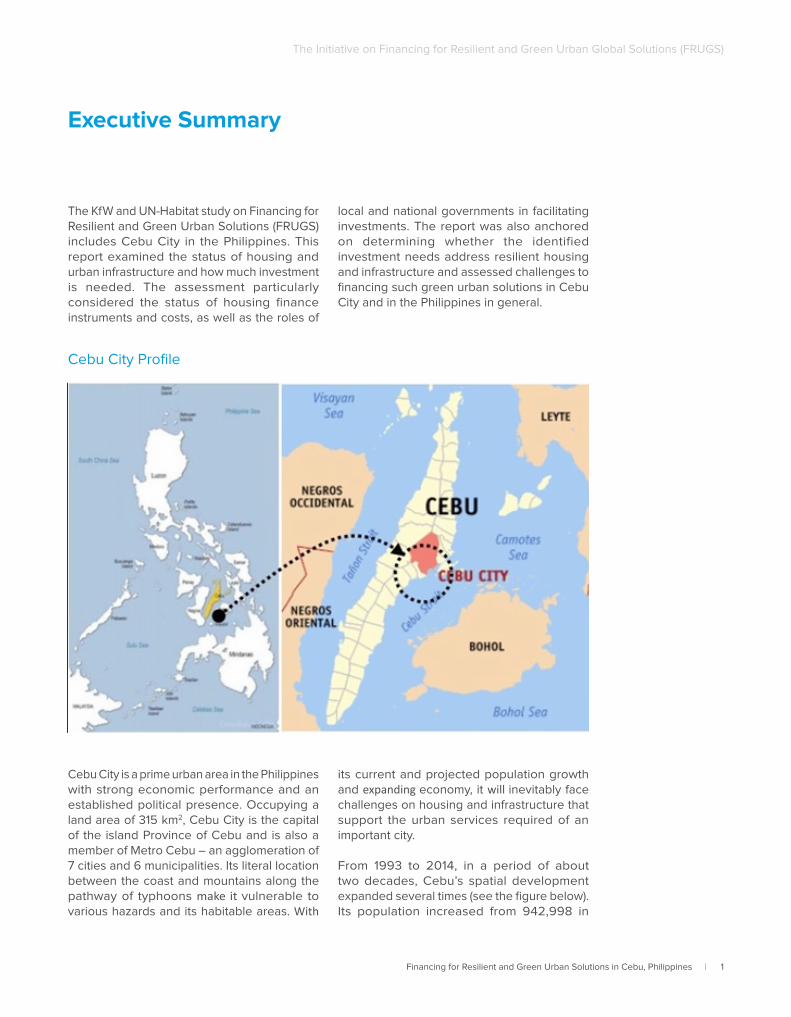
Cebu City Profile
Cebu City is a prime urban area in the Philippines with strong economic performance and an established political presence. Occupying a land area of 315 km2, Cebu City is the capital of the island Province of Cebu and is also a member of Metro Cebu – an agglomeration of 7 cities and 6 municipalities. Its literal location between the coast and mountains along the pathway of typhoons make it vulnerable to various hazards and its habitable areas. With
its current and projected population growth and expanding economy, it will inevitably face challenges on housing and infrastructure that support the urban services required of an important city.
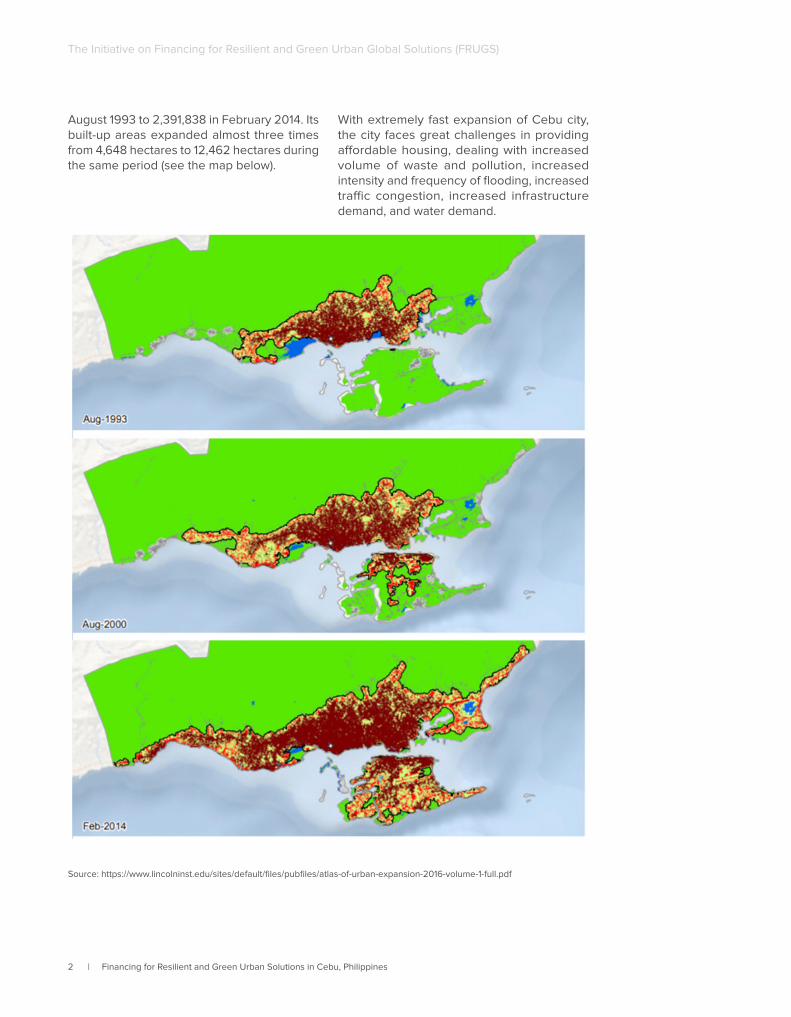
From 1993 to 2014, in a period of about two decades, Cebu’s spatial development expanded several times (see the figure below). Its population increased from 942,998 in
2 | Financing for Resilient and Green Urban Solutions in Cebu, Philippines
The Initiative on Financing for Resilient and Green Urban Global Solutions (FRUGS)
August 1993 to 2,391,838 in February 2014. Its built-up areas expanded almost three times from 4,648 hectares to 12,462 hectares during the same period (see the map below).
With extremely fast expansion of Cebu city, the city faces great challenges in providing affordable housing, dealing with increased volume of waste and pollution, increased intensity and frequency of flooding, increased traffic congestion, increased infrastructure demand, and water demand.
Source: https://www.lincolninst.edu/sites/default/files/pubfiles/atlas-of-urban-expansion-2016-volume-1-full.pdf
Financing for Resilient and Green Urban Solutions in Cebu, Philippines | 3
The Initiative on Financing for Resilient and Green Urban Global Solutions (FRUGS)
Housing Needs
In 2016, the Philippines was estimated to have a nationwide housing shortage of 5.56 million units. In the government’s 2017-2022 Housing Roadmap, an estimated additional 1,675,560 units will be needed. Similarly, according to a developers’ association, the national financing need for economic, low, and middle income segments from 2017 to 2030 will be a total of over PhP 3.4 trillion. Meanwhile, Cebu City’s overall housing need from 2016 to 2024 is tentatively estimated to be 46,903 units. This includes all types of segments including the homeless and displaced. Another study estimates that from 2016 to 2021, there would be an annual housing demand increase in Metro Cebu from 6,568 units to 10,164 units for employees of the business process outsourcing industry alone.
Housing Finance Instruments
Aside from self-funding, housing units can be acquired by direct housing provision or subsidy to the marginalized through social housing projects and mortgages with public (HDMF / Pag-Ibid Fund) and private financial institutions undertaken by aspiring homeowners for the higher segments. These loans and savings schemes cater to both the formally and informally employed. Property developers may also get direct support from government through tax holidays and the option to enter the secondary mortgage market through securitization. Meanwhile, different financing instruments accessible to cities vary from local sources, national transfers, development partners, and from capital markets.
Housing Finance Challenges
Aside from these estimated housing needs, a number of housing finance issues affect the affordability of available housing units. These include having an underdeveloped mortgage market and sub-optimal access to formal finance. Due to land use, registration, and management issues, the Philippines also suffers from an inefficient land market, with
Cebu City bearing no exception. All these factors together with inconsistent housing and land policies and complex governance arrangements among agencies contribute to making housing production to address the shortage complicated and acquisition difficult.
Addressing Housing Finance Challenges
With government aware of these challenges and an imperative need to address the housing shortage, a number of ways are suggested to make housing more affordable, namely:
• Focused and targeted subsidized housing to vulnerable populations and further encourage private sector participation in social housing to return to market prices, especially for economic, low and medium segments;
• Approach housing as part of broader urban development planning especially regarding connective infrastructure and urban services. This requires that all stakeholders are towards a common direction;
• Ensure land use plans reflect the best use of resources and consider climate change adaptation and mitigation as well as disaster risk reduction;
• Stakeholders, particularly those from national and local governments must facilitate an enabling environment for PPP and for blended financing to flourish in the housing sector;
• Mainstream green building standards and provide more financial incentives towards resilient housing and urban development;
• Encourage independent cooperation between the financial sector and real estate developers on increase financial literacy among households to improve buyer’s capacity for home ownership
4 | Financing for Resilient and Green Urban Solutions in Cebu, Philippines
The Initiative on Financing for Resilient and Green Urban Global Solutions (FRUGS)
Local Government Finance
The Urban Development and Housing Act mandates that LGUs provide basic services together with related government agencies and incentivize the private sector to support the development of viable infrastructure and services. The Local Government Code and the current legal framework allows private sector participation in a number of ways including but not limited to: a) Public-Private Partnership (PPP) arrangements, b) The LGU bond market through the LGU Guarantee Corporation, and c) government and private financial institutions. Countless policies reiterate private sector financing, including Cebu City’s Draft Shelter Framework Plan that supports mobilization of resources via joint venture projects with developers. However, historically, local governments rely on transfers from the national government combined with loans or grants from international development partners and government development banks due to their poor ability to mobilize resources for basic infrastructure and services. Local capacity is often weak in public sector management, financial management, taxation, debt financing and especially structuring PPP projects.
Resilient Housing and Green Urban Development
Cebu City and Metro Cebu in general have been quite ahead in accessing blended finance and availing innovative green financing for their urban infrastructure and services though there is still room for increased use (e.g. GCF, green bonds etc). Their latest draft Comprehensive Land Use Plan and Local Climate Change Adaptation Plan already include green dimensions, and together with Metro Cebu’s plans, provide a comprehensive foundation for accessing climate finance instruments. However, ensuring consistent planning, investment programming, budgeting, and implementation within a chief executive’s term will always be a challenge. One solution is for the national governments to undertake such key infrastructure that benefit several LGUs at a time to ensure these are implemented beyond a mayor’s term.
Also, although Cebu City and Metro Cebu in general can be considered experienced in public financial management through its countless development cooperation projects, it will need to improve its understanding of the already complex and evolving housing and urban infrastructure financing policies with a climate-resilient lens. To abide by national government policies on climate change adaptation while benefitting from continuous environmentally sustainable growth and providing adequate urban services, the city government can avail of a deeper understanding of financing mechanisms and revenue – generating activities related to pursuing a climate-resilient growth path.
Opportunities in Resilient Urban Development
Nationwide, renewable energy investment from 2008 to 2030 requires PhP 30.51 billion. As regards urban infrastructure, Metro Cebu’s estimated prospective road and transport needs due to be undertaken from 2021 to 2030 will cost a total of PhP 57,894 billion. Estimated financing for 2015 to 2040 for the water sector alone has a total project value of PhP 34,370 million. From 2016 to 2030, an estimated PhP 2,747 billion would be needed to manage waste in Metro Cebu as well. These are infrastructure investments that will benefit Cebu City that can be undertaken by Metro Cebu for its component cities. The CIF-funded BRT project in Metro Cebu also demonstrates that estimating financing needs for green and/or resilient urban infrastructure for Cebu City can be made possible through Metro Cebu’s pipeline of projects.
Estimated financing for 2015 to 2040 for the water sector alone has a total project value of PhP 34,370 million.
Financing for Resilient and Green Urban Solutions in Cebu, Philippines | 5
The Initiative on Financing for Resilient and Green Urban Global Solutions (FRUGS)
The Philippine government also introduced resilient housing standards through the use of accredited technologies. Although conventional belief dictates that resilient buildings are more expensive, a cost comparison revealed that it can actually be cheaper by 8-12%. Unfortunately, this has only been adopted in social housing projects. Similarly, optimal implementation of the Green Building Code can save Philippine businesses and consumers up to USD 800 million (PhP 35.2 billion) by 2030. Although stakeholders are aware of the need for climate-resilient housing, a gap in determining actual needs and lack of understanding of various construction standards, incentives and processes both at the national and local levels prevail. Regardless, stakeholders are aware of the necessity and look forward to further dialogue and knowledge-sharing on resilient housing. In the case of Cebu City though, as its local shelter plan has yet to be formulated, there is still an opportunity to integrate the green and resilient housing dimensions into its affordability assessment and financing needs estimation.
Financing Housing and Urban Development
The Philippine financial system is stable marked by continuous asset expansion, adequate liquidity, and strong core earnings. Despite being a bank-centric financial system, its strong performance has been anchored on overall improvement in the country’s macroeconomic fundamentals, showing profitability and strong capitalization. As regards outstanding loans, real estate, construction and household consumption accounted almost a third of the total in 2016. The total loan portfolio also grew by 15.4% from 2012 to June 2016, of which, real estate accounted for 17.6% share amounting to PhP 1,195.3 billion. The value of the loan portfolio has also increased from 2014-2015, although private banks have higher outstanding loans than government housing finance institutions. Due to strong interconnectedness, any uncertainty in the real estate sector can negatively affect the banking system. Despite financial stability, the Bangko Sentral ng Pilipinas employs the following safeguard measures: a) expanded reporting
of bank real estate exposures, b) generation of the RREPI index, c) guidelines on sound credit risk management practices, d) real estate stress tests, e) concentration limits and f) loan-to-value ratios.
Next Steps for FRUGS
Despite published project roadmaps and pipelines, financing for some projects have not been finalized. As such, there are still opportunities for international development agencies and the private sector to finance Cebu City’s efforts in developing resilient and sustainable housing and infrastructure. German financial institutions have traditionally supported projects on economic, ecological and social development related to coastal management, biodiversity, environment, and peace and livelihood. While it is practical to intensify established partnerships and expertise on themes that Germany has strongly supported such as climate change adaptation, defining financing opportunities for German financial cooperation would require mapping BMZ priorities for the Philippines, how it matches national and local development priorities, and time cycles. It is also necessary to map available financing instruments that cities are also allowed to access.
Moving forward, it is essential for Cebu City to understand the linkage of cities and climate change as well as plan urban development investments with a climate finance lens. Improving cities and climate change understanding among stakeholders across the board will also increase awareness of the need to think in terms of the people, planet and profit, particularly on low carbon and climate resilient solutions. As such, continuously providing opportunities for LGUs to share and understand the local situation in the context of scientific developments to inform investment planning will also be useful. Similarly, countries like the Philippines need to be supported in regularly measuring, reporting and verifying data on emissions, mitigation actions and compiling reports and inventories to link technical and financial support from climate change initiatives.
6 | Financing for Resilient and Green Urban Solutions in Cebu, Philippines
The Initiative on Financing for Resilient and Green Urban Global Solutions (FRUGS)
Assessing partnership opportunities for FRUGS particularly on knowledge development and financing must naturally begin with the existing engagement of UN-Habitat and the German development cooperation agencies in the Philippines. Both have been actively engaging the national government and select LGUs on a range of projects at the nexus of climate change and cities. They are in a position to extend this fundamental support to ensure that approved investment projects are designed with climate components. Aside from partnering with the academe and private sector consortia, piloting the FRUGS concept on Cebu City would be the most
practical partnership given city government interest and timing. Similarly, their expertise in government-led low-income and middle-income housing would be a potent whole-of-government approach for resilient housing and urban development. This includes a multi-sector approach to operationalize Philippine commitments to the Habitat III. The ultimate goal is to demonstrate and mainstream the role of city governments as urban managers and for stakeholders, especially for the private sector, to see cities as clients aside from the national government in the effort of greening cities.
Financing for Resilient and Green Urban Solutions in Cebu, Philippines | 7
The Initiative on Financing for Resilient and Green Urban Global Solutions (FRUGS)
Chapter 1
Status of Cebu City’s Urbanization, Economic and Financial Systems
8 | Financing for Resilient and Green Urban Solutions in Cebu, Philippines
The Initiative on Financing for Resilient and Green Urban Global Solutions (FRUGS)
1.1 Brief History of Cebu City
Often called the Queen City of the South, the name Cebu came from the word “sebu,” which means animal fat. Prior to the arrival of the Spaniards in 1521, today’s settlement was a fishing and trading village under the Rajahnate of Cebu. Rajahs and Datus ruled the Hindu and Islamic groups that occupied the area from the 13th and 16th centuries. It was also along the ancient Southeast Asian trade route receiving goods from as far as Japan and Burma. Found by Sri Lumay or “Rajamuda Lumaya” the settlement was also named “Sugbo,” a shorter version of “Kang Sri Lumaying Sugbo,” literally “that of Sri Lumay’s great fire.” Sri Lumay would burn the settlement every time marauders from Mindanao called Magolos would attack, developing the term “Sugbo” or scorching the earth.
By the time the Portuguese explorer Ferdinand Magellan arrived Cebu on 7 April 1521, Sri Humabon, Sri Lumaya’s grandson, ruled Cebu. Despite having heard of conquests around the Malay Peninsula, Rajah Humabon welcomed Magellan’s expedition. Their bond was sealed with a blood compact and the conversion of Humabon and the natives to Christianity. However, Lapu-Lapu, local chieftain of nearby Mactan Island refused this arrangement. The Battle of Mactan ensued with Lapu-Lapu killing Magellan in the process. The Spaniards left Cebu temporarily and intensified their settlement in Manila.
Rajah Tupas was the last ruler of pre-colonial Cebu until the Spaniards returned on 15 April 1565. He presented himself on 8 May 1565 and the Spanish King’s possession of Cebu was formalized with the Treaty of Cebu on 3 July 1565. The city was renamed “Villa de San Miguel de Cebu” (later named Villa del Santisimo Nombre de Jesus). In 1567, around 2,100 soldiers arrived from New Spain (Mexico). Despite the occupation, Cebu was
1 First class cities need to have a minimum of 200,000 inhabitants and at least PhP 50 million annual income. See more at http://nap.psa.gov.ph/activestats/psgc/articles/con_cityclass.asp
2 The published administrative land area of Cebu City varies from 326 km2 in the Cebu City Brief Profile, Draft Final Report, Cebu City Strategic Master Plan Study; 291 km2 per the City Government’s Cebu City Profile from 2008 and 315 km2 in the Philippine Statistical Yearbook
still intermittently attacked by islanders who opposed colonization. To protect and defend the growing colony, the Spaniards erected Fort San Pedro. It is still the smallest fort in the Philippines to date.
By 1569, the settlement became a strategic safe port for ships from Mexico and a hub for further exploration of the Philippine archipelago. In 1570, Lopez de Legazpi left Cebu for Manila and forged an agreement between the Spaniards and Rajahs forming a city council. This resulted in the construction of the Christian walled city of Intramuros in Manila, which slowly eased out the established Islamic community. In the ensuing years, the Spaniards established Christian settlements all over the country. By 14 August 1595, Pope Clement created the diocese of Cebu as a suffragan to the Archdiocese of Manila.
At the signing of the Treaty of Paris and the end of the Spanish-American War in 1898, Cebu and the rest of the Philippines was seceded to the United States. Despite being just a town since its founding in 1565, Cebu became a chartered city on 24 February 1937. It kept this status throughout the Japanese Occupation, independence from the United States, and under the Republic of the Philippines. Under current Philippine laws, Cebu is a first class highly urbanized city1.
1.2 Geographic Characteristics of Cebu City
Occupying a land area of 315 square kilometers Cebu City is the capital of Cebu Province and is also the center of Metro Cebu – an agglomeration of 7 cities and 6 municipalities. It is also part of the Central Visayas Region (CVR) of the Philippines2. To the northeast are Mandaue City and Consolacion town, to the west are Toledo City and towns of Balamban and Asturias, while in the south are Talisay City
Financing for Resilient and Green Urban Solutions in Cebu, Philippines | 9
The Initiative on Financing for Resilient and Green Urban Global Solutions (FRUGS)
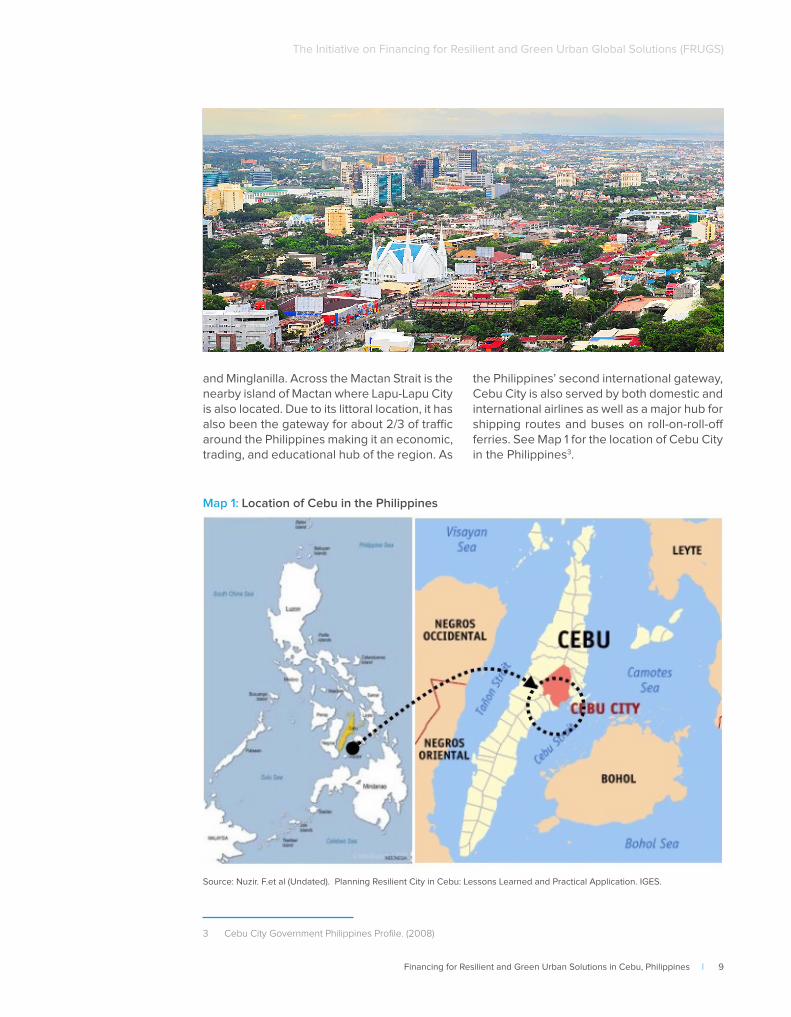
and Minglanilla. Across the Mactan Strait is the nearby island of Mactan where Lapu-Lapu City is also located. Due to its littoral location, it has also been the gateway for about 2/3 of traffic around the Philippines making it an economic, trading, and educational hub of the region. As
3 Cebu City Government Philippines Profile. (2008)
the Philippines’ second international gateway, Cebu City is also served by both domestic and international airlines as well as a major hub for shipping routes and buses on roll-on-roll-off ferries. See Map 1 for the location of Cebu City in the Philippines3.
Map 1: Location of Cebu in the Philippines
Source: Nuzir. F.et al (Undated). Planning Resilient City in Cebu: Lessons Learned and Practical Application. IGES.
10 | Financing for Resilient and Green Urban Solutions in Cebu, Philippines
The Initiative on Financing for Resilient and Green Urban Global Solutions (FRUGS)
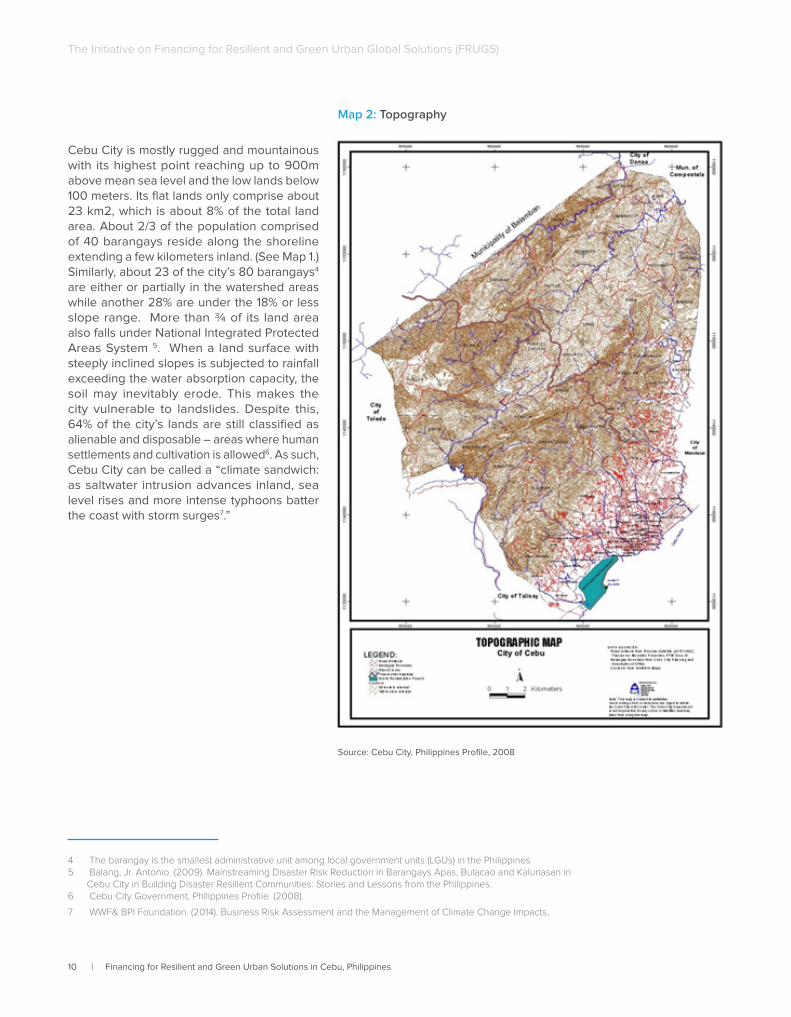
Cebu City is mostly rugged and mountainous with its highest point reaching up to 900m above mean sea level and the low lands below 100 meters. Its flat lands only comprise about 23 km2, which is about 8% of the total land area. About 2/3 of the population comprised of 40 barangays reside along the shoreline extending a few kilometers inland. (See Map 1.) Similarly, about 23 of the city’s 80 barangays4 are either or partially in the watershed areas while another 28% are under the 18% or less slope range. More than ¾ of its land area also falls under National Integrated Protected Areas System 5. When a land surface with steeply inclined slopes is subjected to rainfall exceeding the water absorption capacity, the soil may inevitably erode. This makes the city vulnerable to landslides. Despite this, 64% of the city’s lands are still classified as alienable and disposable – areas where human settlements and cultivation is allowed6. As such, Cebu City can be called a “climate sandwich: as saltwater intrusion advances inland, sea level rises and more intense typhoons batter the coast with storm surges7.”
4 The barangay is the smallest administrative unit among local government units (LGUs) in the Philippines 5 Balang, Jr. Antonio. (2009). Mainstreaming Disaster Risk Reduction in Barangays Apas, Bulacao and Kalunasan in
Cebu City in Building Disaster Resilient Communities: Stories and Lessons from the Philippines.6 Cebu City Government, Philippines Profile. (2008).
7 WWF& BPI Foundation. (2014). Business Risk Assessment and the Management of Climate Change Impacts.
Map 2: Topography
Source: Cebu City, Philippines Profile, 2008
Financing for Resilient and Green Urban Solutions in Cebu, Philippines | 11
The Initiative on Financing for Resilient and Green Urban Global Solutions (FRUGS)
Map 3: Existing Land Use Map
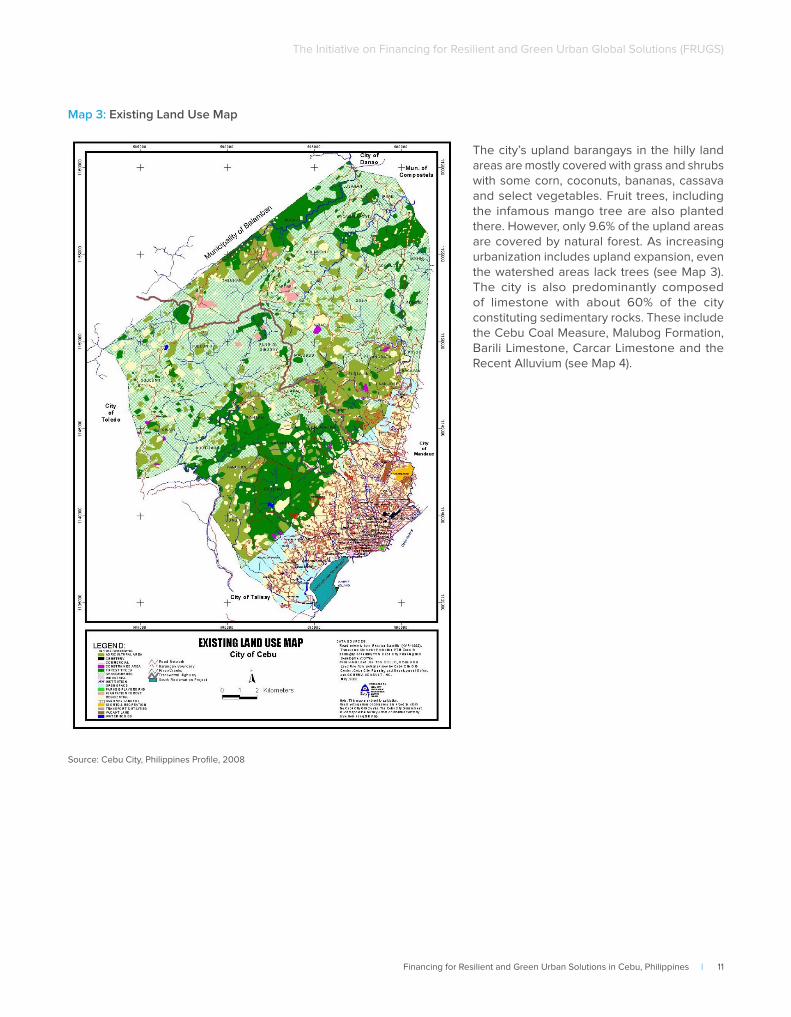
The city’s upland barangays in the hilly land areas are mostly covered with grass and shrubs with some corn, coconuts, bananas, cassava and select vegetables. Fruit trees, including the infamous mango tree are also planted there. However, only 9.6% of the upland areas are covered by natural forest. As increasing urbanization includes upland expansion, even the watershed areas lack trees (see Map 3). The city is also predominantly composed of limestone with about 60% of the city constituting sedimentary rocks. These include the Cebu Coal Measure, Malubog Formation, Barili Limestone, Carcar Limestone and the Recent Alluvium (see Map 4).
Source: Cebu City, Philippines Profile, 2008
12 | Financing for Resilient and Green Urban Solutions in Cebu, Philippines
The Initiative on Financing for Resilient and Green Urban Global Solutions (FRUGS)
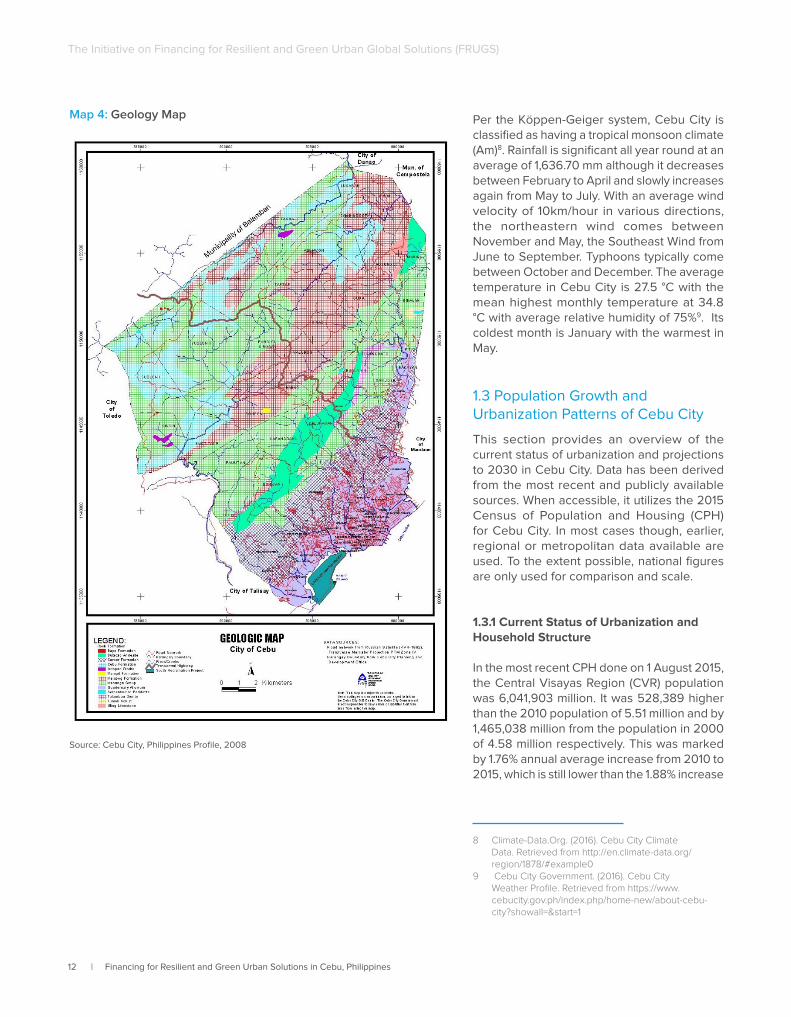
Map 4: Geology Map Per the Köppen-Geiger system, Cebu City is classified as having a tropical monsoon climate (Am)8. Rainfall is significant all year round at an average of 1,636.70 mm although it decreases between February to April and slowly increases again from May to July. With an average wind velocity of 10km/hour in various directions, the northeastern wind comes between November and May, the Southeast Wind from June to September. Typhoons typically come between October and December. The average temperature in Cebu City is 27.5 °C with the mean highest monthly temperature at 34.8 °C with average relative humidity of 75%9. Its coldest month is January with the warmest in May.
1.3 Population Growth and Urbanization Patterns of Cebu City
This section provides an overview of the current status of urbanization and projections to 2030 in Cebu City. Data has been derived from the most recent and publicly available sources. When accessible, it utilizes the 2015 Census of Population and Housing (CPH) for Cebu City. In most cases though, earlier, regional or metropolitan data available are used. To the extent possible, national figures are only used for comparison and scale.
1.3.1 Current Status of Urbanization and Household Structure
In the most recent CPH done on 1 August 2015, the Central Visayas Region (CVR) population was 6,041,903 million. It was 528,389 higher than the 2010 population of 5.51 million and by 1,465,038 million from the population in 2000 of 4.58 million respectively. This was marked by 1.76% annual average increase from 2010 to 2015, which is still lower than the 1.88% increase
8 Climate-Data.Org. (2016). Cebu City Climate Data. Retrieved from http://en.climate-data.org/region/1878/#example0
9 Cebu City Government. (2016). Cebu City Weather Profile. Retrieved from https://www.cebucity.gov.ph/index.php/home-new/about-cebu-city?showall=&start=1
Source: Cebu City, Philippines Profile, 2008
Financing for Resilient and Green Urban Solutions in Cebu, Philippines | 13
The Initiative on Financing for Resilient and Green Urban Global Solutions (FRUGS)
from 2000 to 201010. CVR accounts for about 6% of the Philippine population which stood at a total of 100.98 million in 2015 – an increase of 8.64 million since 2010 with an average annual growth rate of 1.72%. Comprised of the three provinces of Cebu, Bohol and Siquijor, Cebu had the highest population increase in CVR in the last census with 2.94 million inhabitants. The region also has three highly
10 PSA. (2016). Population of Region VII - Central Visayas (Based on the 2015 Census of Population)
Retrieved from https://psa.gov.ph/content/population-region-vii-central-visayas-based-2015-census-population
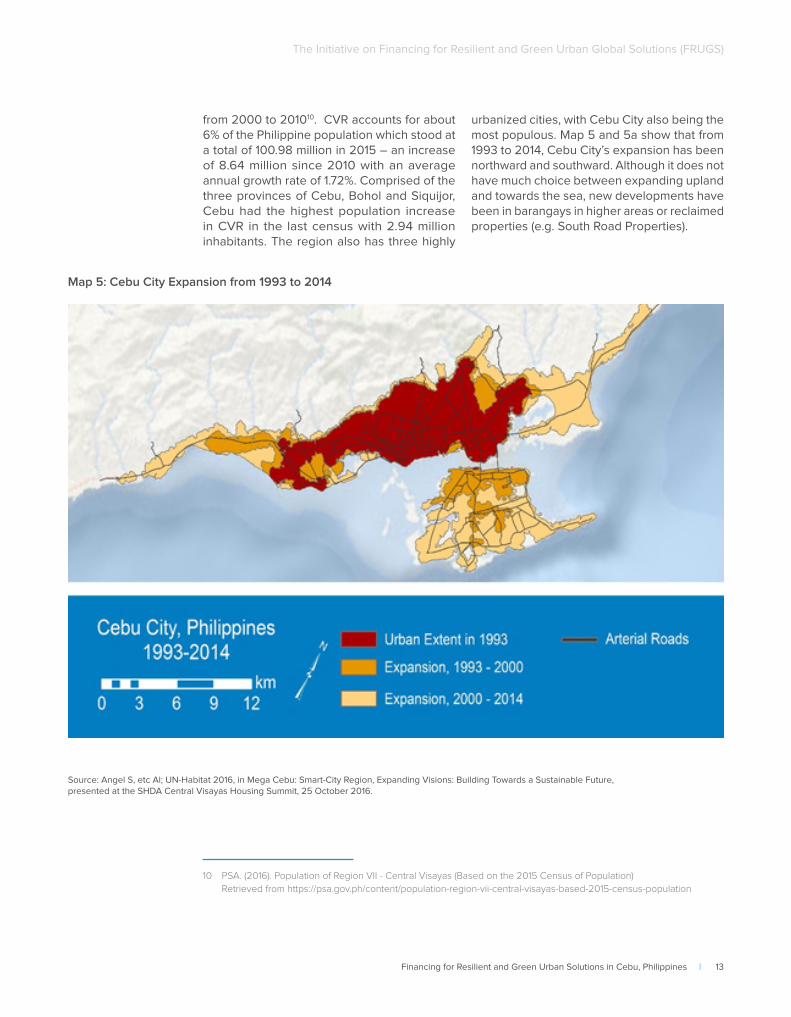
urbanized cities, with Cebu City also being the most populous. Map 5 and 5a show that from 1993 to 2014, Cebu City’s expansion has been northward and southward. Although it does not have much choice between expanding upland and towards the sea, new developments have been in barangays in higher areas or reclaimed properties (e.g. South Road Properties).
Map 5: Cebu City Expansion from 1993 to 2014
Source: Angel S, etc Al; UN-Habitat 2016, in Mega Cebu: Smart-City Region, Expanding Visions: Building Towards a Sustainable Future, presented at the SHDA Central Visayas Housing Summit, 25 October 2016.
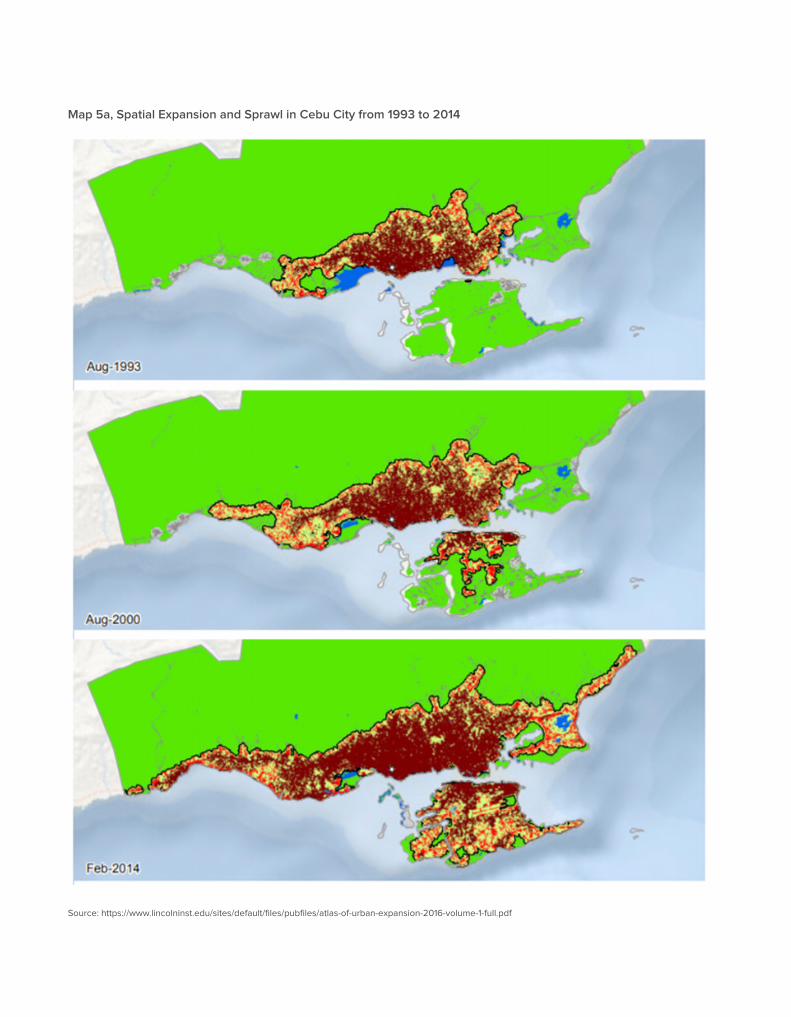
Map 5a, Spatial Expansion and Sprawl in Cebu City from 1993 to 2014
Source: https://www.lincolninst.edu/sites/default/files/pubfiles/atlas-of-urban-expansion-2016-volume-1-full.pdf
Financing for Resilient and Green Urban Solutions in Cebu, Philippines | 15
The Initiative on Financing for Resilient and Green Urban Global Solutions (FRUGS)
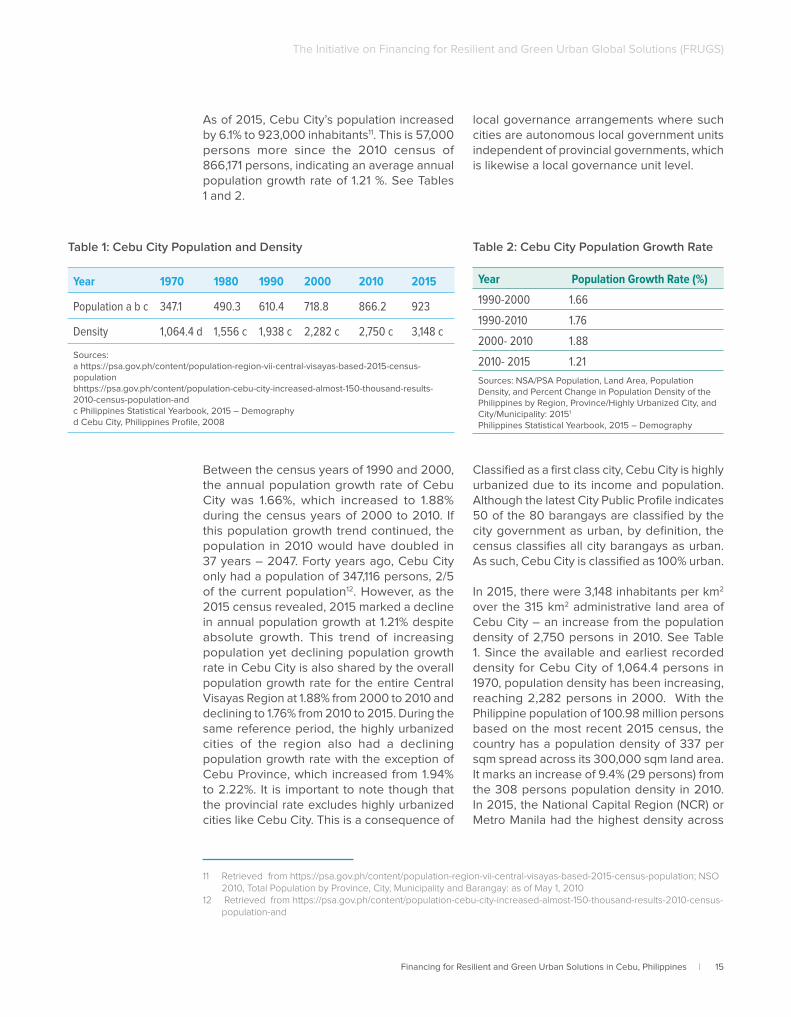
As of 2015, Cebu City’s population increased by 6.1% to 923,000 inhabitants11. This is 57,000 persons more since the 2010 census of 866,171 persons, indicating an average annual population growth rate of 1.21 %. See Tables 1 and 2.
Between the census years of 1990 and 2000, the annual population growth rate of Cebu City was 1.66%, which increased to 1.88% during the census years of 2000 to 2010. If this population growth trend continued, the population in 2010 would have doubled in 37 years – 2047. Forty years ago, Cebu City only had a population of 347,116 persons, 2/5 of the current population12. However, as the 2015 census revealed, 2015 marked a decline in annual population growth at 1.21% despite absolute growth. This trend of increasing population yet declining population growth rate in Cebu City is also shared by the overall population growth rate for the entire Central Visayas Region at 1.88% from 2000 to 2010 and declining to 1.76% from 2010 to 2015. During the same reference period, the highly urbanized cities of the region also had a declining population growth rate with the exception of Cebu Province, which increased from 1.94% to 2.22%. It is important to note though that the provincial rate excludes highly urbanized cities like Cebu City. This is a consequence of
11 Retrieved from https://psa.gov.ph/content/population-region-vii-central-visayas-based-2015-census-population; NSO 2010, Total Population by Province, City, Municipality and Barangay: as of May 1, 2010
12 Retrieved from https://psa.gov.ph/content/population-cebu-city-increased-almost-150-thousand-results-2010-census-population-and
local governance arrangements where such cities are autonomous local government units independent of provincial governments, which is likewise a local governance unit level.
Classified as a first class city, Cebu City is highly urbanized due to its income and population. Although the latest City Public Profile indicates 50 of the 80 barangays are classified by the city government as urban, by definition, the census classifies all city barangays as urban. As such, Cebu City is classified as 100% urban.
In 2015, there were 3,148 inhabitants per km2 over the 315 km2 administrative land area of Cebu City – an increase from the population density of 2,750 persons in 2010. See Table 1. Since the available and earliest recorded density for Cebu City of 1,064.4 persons in 1970, population density has been increasing, reaching 2,282 persons in 2000. With the Philippine population of 100.98 million persons based on the most recent 2015 census, the country has a population density of 337 per sqm spread across its 300,000 sqm land area. It marks an increase of 9.4% (29 persons) from the 308 persons population density in 2010. In 2015, the National Capital Region (NCR) or Metro Manila had the highest density across
Table 1: Cebu City Population and Density
Year 1970 1980 1990 2000 2010 2015
Population a b c 347.1 490.3 610.4 718.8 866.2 923
Density 1,064.4 d 1,556 c 1,938 c 2,282 c 2,750 c 3,148 c
Sources: a https://psa.gov.ph/content/population-region-vii-central-visayas-based-2015-census-populationbhttps://psa.gov.ph/content/population-cebu-city-increased-almost-150-thousand-results-2010-census-population-andc Philippines Statistical Yearbook, 2015 – Demographyd Cebu City, Philippines Profile, 2008
Table 2: Cebu City Population Growth Rate
Year Population Growth Rate (%)
1990-2000 1.66
1990-2010 1.76
2000- 2010 1.88
2010- 2015 1.21
Sources: NSA/PSA Population, Land Area, Population Density, and Percent Change in Population Density of the Philippines by Region, Province/Highly Urbanized City, and City/Municipality: 20151
Philippines Statistical Yearbook, 2015 – Demography
16 | Financing for Resilient and Green Urban Solutions in Cebu, Philippines
The Initiative on Financing for Resilient and Green Urban Global Solutions (FRUGS)
the country with 20,785 persons per sqm, about 67 times higher than the national level at 337 persons, and about nine times higher than that of Cebu City in the same period. NCR’s population density in 2015 was an 8.6% increase from 19,137 persons in 201013. Overall, the country’s increasing population and density is consistent with Cebu City figures.
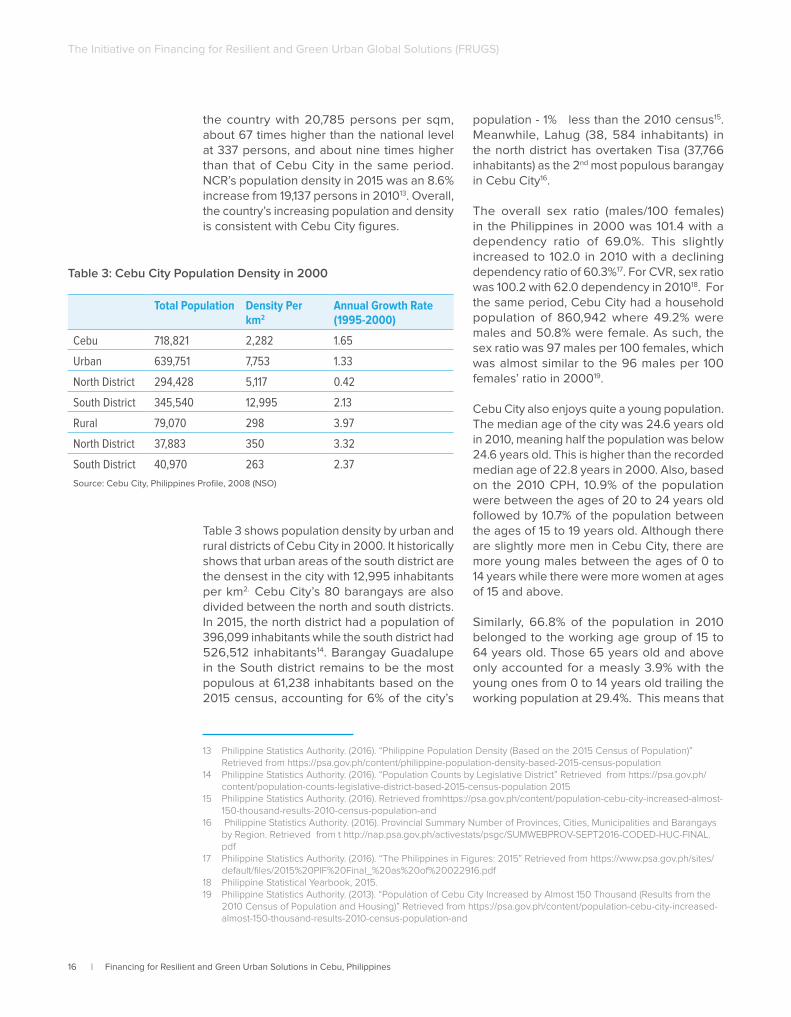
Table 3 shows population density by urban and rural districts of Cebu City in 2000. It historically shows that urban areas of the south district are the densest in the city with 12,995 inhabitants per km2. Cebu City’s 80 barangays are also divided between the north and south districts. In 2015, the north district had a population of 396,099 inhabitants while the south district had 526,512 inhabitants14. Barangay Guadalupe in the South district remains to be the most populous at 61,238 inhabitants based on the 2015 census, accounting for 6% of the city’s
13 Philippine Statistics Authority. (2016). “Philippine Population Density (Based on the 2015 Census of Population)” Retrieved from https://psa.gov.ph/content/philippine-population-density-based-2015-census-population
14 Philippine Statistics Authority. (2016). “Population Counts by Legislative District” Retrieved from https://psa.gov.ph/content/population-counts-legislative-district-based-2015-census-population 2015
15 Philippine Statistics Authority. (2016). Retrieved fromhttps://psa.gov.ph/content/population-cebu-city-increased-almost-150-thousand-results-2010-census-population-and
16 Philippine Statistics Authority. (2016). Provincial Summary Number of Provinces, Cities, Municipalities and Barangays by Region. Retrieved from t http://nap.psa.gov.ph/activestats/psgc/SUMWEBPROV-SEPT2016-CODED-HUC-FINAL.pdf
17 Philippine Statistics Authority. (2016). “The Philippines in Figures: 2015” Retrieved from https://www.psa.gov.ph/sites/default/files/2015%20PIF%20Final_%20as%20of%20022916.pdf
18 Philippine Statistical Yearbook, 2015. 19 Philippine Statistics Authority. (2013). “Population of Cebu City Increased by Almost 150 Thousand (Results from the
2010 Census of Population and Housing)” Retrieved from https://psa.gov.ph/content/population-cebu-city-increased-almost-150-thousand-results-2010-census-population-and
population - 1% less than the 2010 census15. Meanwhile, Lahug (38, 584 inhabitants) in the north district has overtaken Tisa (37,766 inhabitants) as the 2nd most populous barangay in Cebu City16.
The overall sex ratio (males/100 females) in the Philippines in 2000 was 101.4 with a dependency ratio of 69.0%. This slightly increased to 102.0 in 2010 with a declining dependency ratio of 60.3%17. For CVR, sex ratio was 100.2 with 62.0 dependency in 201018. For the same period, Cebu City had a household population of 860,942 where 49.2% were males and 50.8% were female. As such, the sex ratio was 97 males per 100 females, which was almost similar to the 96 males per 100 females’ ratio in 200019.
Cebu City also enjoys quite a young population. The median age of the city was 24.6 years old in 2010, meaning half the population was below 24.6 years old. This is higher than the recorded median age of 22.8 years in 2000. Also, based on the 2010 CPH, 10.9% of the population were between the ages of 20 to 24 years old followed by 10.7% of the population between the ages of 15 to 19 years old. Although there are slightly more men in Cebu City, there are more young males between the ages of 0 to 14 years while there were more women at ages of 15 and above.
Similarly, 66.8% of the population in 2010 belonged to the working age group of 15 to 64 years old. Those 65 years old and above only accounted for a measly 3.9% with the young ones from 0 to 14 years old trailing the working population at 29.4%. This means that
Table 3: Cebu City Population Density in 2000
Total Population Density Per km2
Annual Growth Rate (1995-2000)
Cebu 718,821 2,282 1.65
Urban 639,751 7,753 1.33
North District 294,428 5,117 0.42
South District 345,540 12,995 2.13
Rural 79,070 298 3.97
North District 37,883 350 3.32
South District 40,970 263 2.37
Source: Cebu City, Philippines Profile, 2008 (NSO)
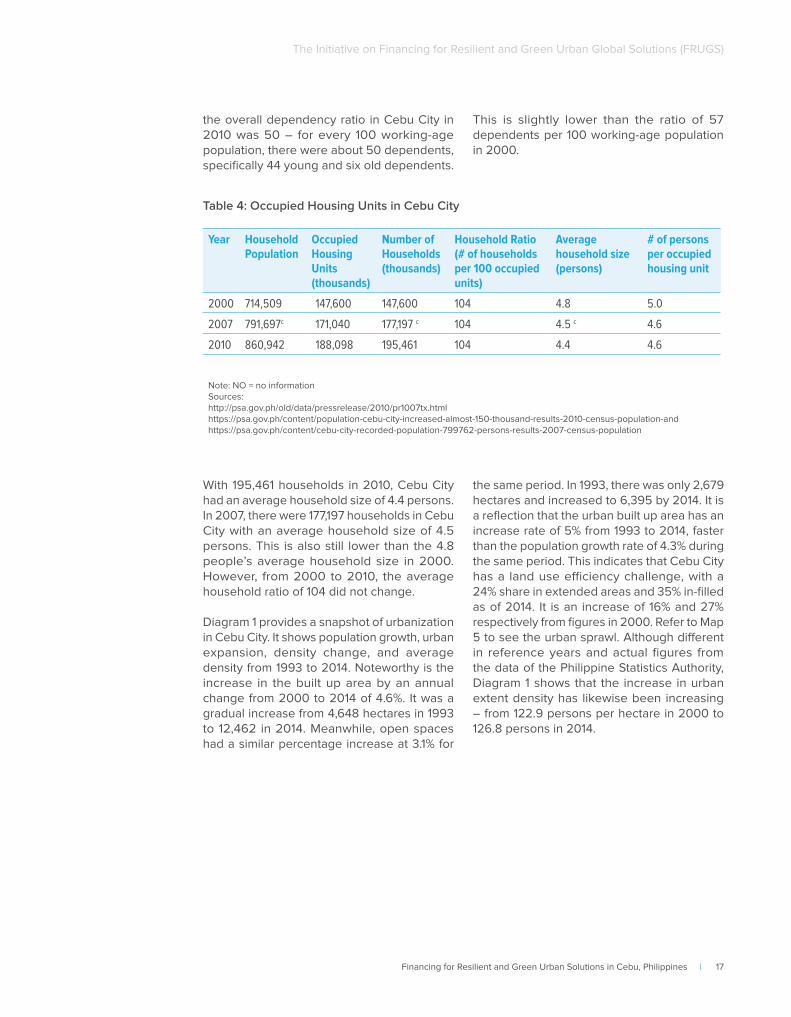
Financing for Resilient and Green Urban Solutions in Cebu, Philippines | 17
The Initiative on Financing for Resilient and Green Urban Global Solutions (FRUGS)
the overall dependency ratio in Cebu City in 2010 was 50 – for every 100 working-age population, there were about 50 dependents, specifically 44 young and six old dependents.
This is slightly lower than the ratio of 57 dependents per 100 working-age population in 2000.
Table 4: Occupied Housing Units in Cebu City
Year Household Population
Occupied Housing Units (thousands)
Number of Households (thousands)
Household Ratio(# of households per 100 occupied units)
Average household size (persons)
# of persons per occupied housing unit
2000 714,509 147,600 147,600 104 4.8 5.0
2007 791,697c 171,040 177,197 c 104 4.5 c 4.6
2010 860,942 188,098 195,461 104 4.4 4.6
Note: NO = no information Sources: http://psa.gov.ph/old/data/pressrelease/2010/pr1007tx.htmlhttps://psa.gov.ph/content/population-cebu-city-increased-almost-150-thousand-results-2010-census-population-andhttps://psa.gov.ph/content/cebu-city-recorded-population-799762-persons-results-2007-census-population
With 195,461 households in 2010, Cebu City had an average household size of 4.4 persons. In 2007, there were 177,197 households in Cebu City with an average household size of 4.5 persons. This is also still lower than the 4.8 people’s average household size in 2000. However, from 2000 to 2010, the average household ratio of 104 did not change.
Diagram 1 provides a snapshot of urbanization in Cebu City. It shows population growth, urban expansion, density change, and average density from 1993 to 2014. Noteworthy is the increase in the built up area by an annual change from 2000 to 2014 of 4.6%. It was a gradual increase from 4,648 hectares in 1993 to 12,462 in 2014. Meanwhile, open spaces had a similar percentage increase at 3.1% for
the same period. In 1993, there was only 2,679 hectares and increased to 6,395 by 2014. It is a reflection that the urban built up area has an increase rate of 5% from 1993 to 2014, faster than the population growth rate of 4.3% during the same period. This indicates that Cebu City has a land use efficiency challenge, with a 24% share in extended areas and 35% in-filled as of 2014. It is an increase of 16% and 27% respectively from figures in 2000. Refer to Map 5 to see the urban sprawl. Although different in reference years and actual figures from the data of the Philippine Statistics Authority, Diagram 1 shows that the increase in urban extent density has likewise been increasing – from 122.9 persons per hectare in 2000 to 126.8 persons in 2014.
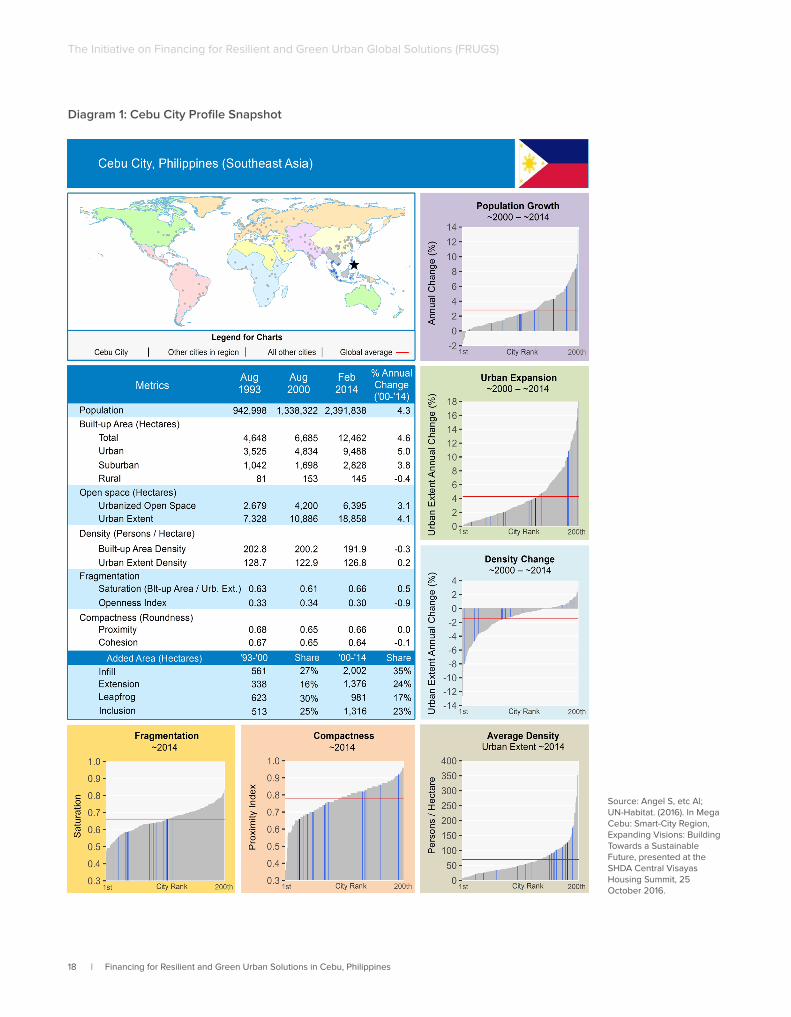
18 | Financing for Resilient and Green Urban Solutions in Cebu, Philippines
The Initiative on Financing for Resilient and Green Urban Global Solutions (FRUGS)
Diagram 1: Cebu City Profile Snapshot
Source: Angel S, etc Al; UN-Habitat. (2016). In Mega Cebu: Smart-City Region, Expanding Visions: Building Towards a Sustainable Future, presented at the SHDA Central Visayas Housing Summit, 25 October 2016.
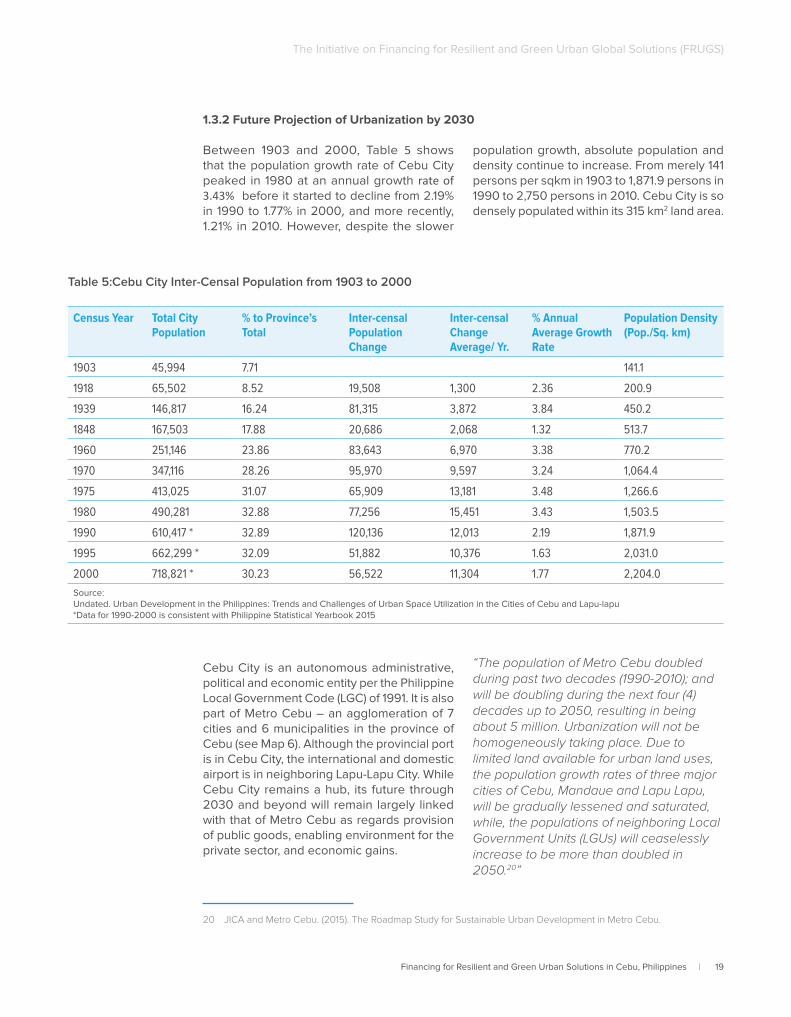
Financing for Resilient and Green Urban Solutions in Cebu, Philippines | 19
The Initiative on Financing for Resilient and Green Urban Global Solutions (FRUGS)
Between 1903 and 2000, Table 5 shows that the population growth rate of Cebu City peaked in 1980 at an annual growth rate of 3.43% before it started to decline from 2.19% in 1990 to 1.77% in 2000, and more recently, 1.21% in 2010. However, despite the slower
population growth, absolute population and density continue to increase. From merely 141 persons per sqkm in 1903 to 1,871.9 persons in 1990 to 2,750 persons in 2010. Cebu City is so densely populated within its 315 km2 land area.
1.3.2 Future Projection of Urbanization by 2030
Census Year Total City Population
% to Province’s Total
Inter-censal Population Change
Inter-censal Change Average/ Yr.
% Annual Average Growth Rate
Population Density (Pop./Sq. km)
1903 45,994 7.71 141.1
1918 65,502 8.52 19,508 1,300 2.36 200.9
1939 146,817 16.24 81,315 3,872 3.84 450.2
1848 167,503 17.88 20,686 2,068 1.32 513.7
1960 251,146 23.86 83,643 6,970 3.38 770.2
1970 347,116 28.26 95,970 9,597 3.24 1,064.4
1975 413,025 31.07 65,909 13,181 3.48 1,266.6
1980 490,281 32.88 77,256 15,451 3.43 1,503.5
1990 610,417 * 32.89 120,136 12,013 2.19 1,871.9
1995 662,299 * 32.09 51,882 10,376 1.63 2,031.0
2000 718,821 * 30.23 56,522 11,304 1.77 2,204.0
Source: Undated. Urban Development in the Philippines: Trends and Challenges of Urban Space Utilization in the Cities of Cebu and Lapu-lapu*Data for 1990-2000 is consistent with Philippine Statistical Yearbook 2015
Table 5:Cebu City Inter-Censal Population from 1903 to 2000
Cebu City is an autonomous administrative, political and economic entity per the Philippine Local Government Code (LGC) of 1991. It is also part of Metro Cebu – an agglomeration of 7 cities and 6 municipalities in the province of Cebu (see Map 6). Although the provincial port is in Cebu City, the international and domestic airport is in neighboring Lapu-Lapu City. While Cebu City remains a hub, its future through 2030 and beyond will remain largely linked with that of Metro Cebu as regards provision of public goods, enabling environment for the private sector, and economic gains.
20 JICA and Metro Cebu. (2015). The Roadmap Study for Sustainable Urban Development in Metro Cebu.
“The population of Metro Cebu doubled during past two decades (1990-2010); and will be doubling during the next four (4) decades up to 2050, resulting in being about 5 million. Urbanization will not be homogeneously taking place. Due to limited land available for urban land uses, the population growth rates of three major cities of Cebu, Mandaue and Lapu Lapu, will be gradually lessened and saturated, while, the populations of neighboring Local Government Units (LGUs) will ceaselessly increase to be more than doubled in 2050.20”
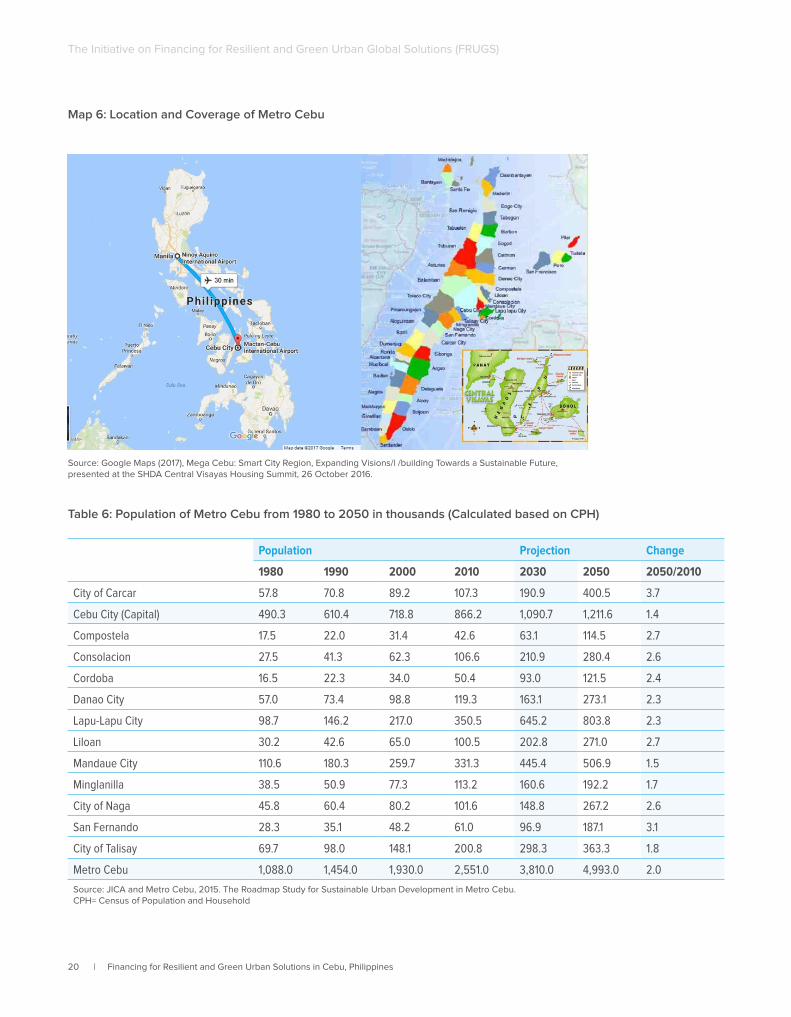
20 | Financing for Resilient and Green Urban Solutions in Cebu, Philippines
The Initiative on Financing for Resilient and Green Urban Global Solutions (FRUGS)
Population Projection Change
1980 1990 2000 2010 2030 2050 2050/2010
City of Carcar 57.8 70.8 89.2 107.3 190.9 400.5 3.7
Cebu City (Capital) 490.3 610.4 718.8 866.2 1,090.7 1,211.6 1.4
Compostela 17.5 22.0 31.4 42.6 63.1 114.5 2.7
Consolacion 27.5 41.3 62.3 106.6 210.9 280.4 2.6
Cordoba 16.5 22.3 34.0 50.4 93.0 121.5 2.4
Danao City 57.0 73.4 98.8 119.3 163.1 273.1 2.3
Lapu-Lapu City 98.7 146.2 217.0 350.5 645.2 803.8 2.3
Liloan 30.2 42.6 65.0 100.5 202.8 271.0 2.7
Mandaue City 110.6 180.3 259.7 331.3 445.4 506.9 1.5
Minglanilla 38.5 50.9 77.3 113.2 160.6 192.2 1.7
City of Naga 45.8 60.4 80.2 101.6 148.8 267.2 2.6
San Fernando 28.3 35.1 48.2 61.0 96.9 187.1 3.1
City of Talisay 69.7 98.0 148.1 200.8 298.3 363.3 1.8
Metro Cebu 1,088.0 1,454.0 1,930.0 2,551.0 3,810.0 4,993.0 2.0
Source: JICA and Metro Cebu, 2015. The Roadmap Study for Sustainable Urban Development in Metro Cebu. CPH= Census of Population and Household
Map 6: Location and Coverage of Metro Cebu
Source: Google Maps (2017), Mega Cebu: Smart City Region, Expanding Visions/l /building Towards a Sustainable Future, presented at the SHDA Central Visayas Housing Summit, 26 October 2016.
Table 6: Population of Metro Cebu from 1980 to 2050 in thousands (Calculated based on CPH)
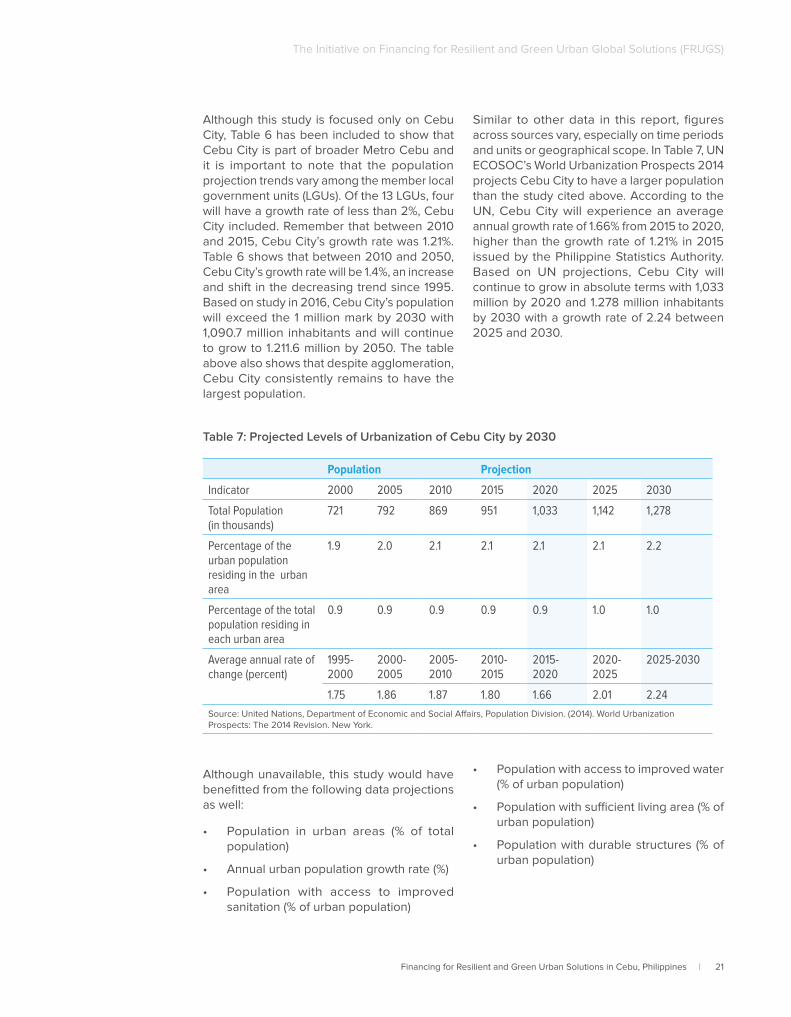
Financing for Resilient and Green Urban Solutions in Cebu, Philippines | 21
The Initiative on Financing for Resilient and Green Urban Global Solutions (FRUGS)
Although this study is focused only on Cebu City, Table 6 has been included to show that Cebu City is part of broader Metro Cebu and it is important to note that the population projection trends vary among the member local government units (LGUs). Of the 13 LGUs, four will have a growth rate of less than 2%, Cebu City included. Remember that between 2010 and 2015, Cebu City’s growth rate was 1.21%. Table 6 shows that between 2010 and 2050, Cebu City’s growth rate will be 1.4%, an increase and shift in the decreasing trend since 1995. Based on study in 2016, Cebu City’s population will exceed the 1 million mark by 2030 with 1,090.7 million inhabitants and will continue to grow to 1.211.6 million by 2050. The table above also shows that despite agglomeration, Cebu City consistently remains to have the largest population.
Similar to other data in this report, figures across sources vary, especially on time periods and units or geographical scope. In Table 7, UN ECOSOC’s World Urbanization Prospects 2014 projects Cebu City to have a larger population than the study cited above. According to the UN, Cebu City will experience an average annual growth rate of 1.66% from 2015 to 2020, higher than the growth rate of 1.21% in 2015 issued by the Philippine Statistics Authority. Based on UN projections, Cebu City will continue to grow in absolute terms with 1,033 million by 2020 and 1.278 million inhabitants by 2030 with a growth rate of 2.24 between 2025 and 2030.
Population Projection
Indicator 2000 2005 2010 2015 2020 2025 2030
Total Population (in thousands)
721 792 869 951 1,033 1,142 1,278
Percentage of the urban population residing in the urban area
1.9 2.0 2.1 2.1 2.1 2.1 2.2
Percentage of the total population residing in each urban area
0.9 0.9 0.9 0.9 0.9 1.0 1.0
Average annual rate of change (percent)
1995-2000
2000-2005
2005-2010
2010-2015
2015-2020
2020-2025
2025-2030
1.75 1.86 1.87 1.80 1.66 2.01 2.24
Source: United Nations, Department of Economic and Social Affairs, Population Division. (2014). World Urbanization Prospects: The 2014 Revision. New York.
Table 7: Projected Levels of Urbanization of Cebu City by 2030
Although unavailable, this study would have benefitted from the following data projections as well:
• Population in urban areas (% of total population)
• Annual urban population growth rate (%)
• Population with access to improved sanitation (% of urban population)
• Population with access to improved water (% of urban population)
• Population with sufficient living area (% of urban population)
• Population with durable structures (% of urban population)
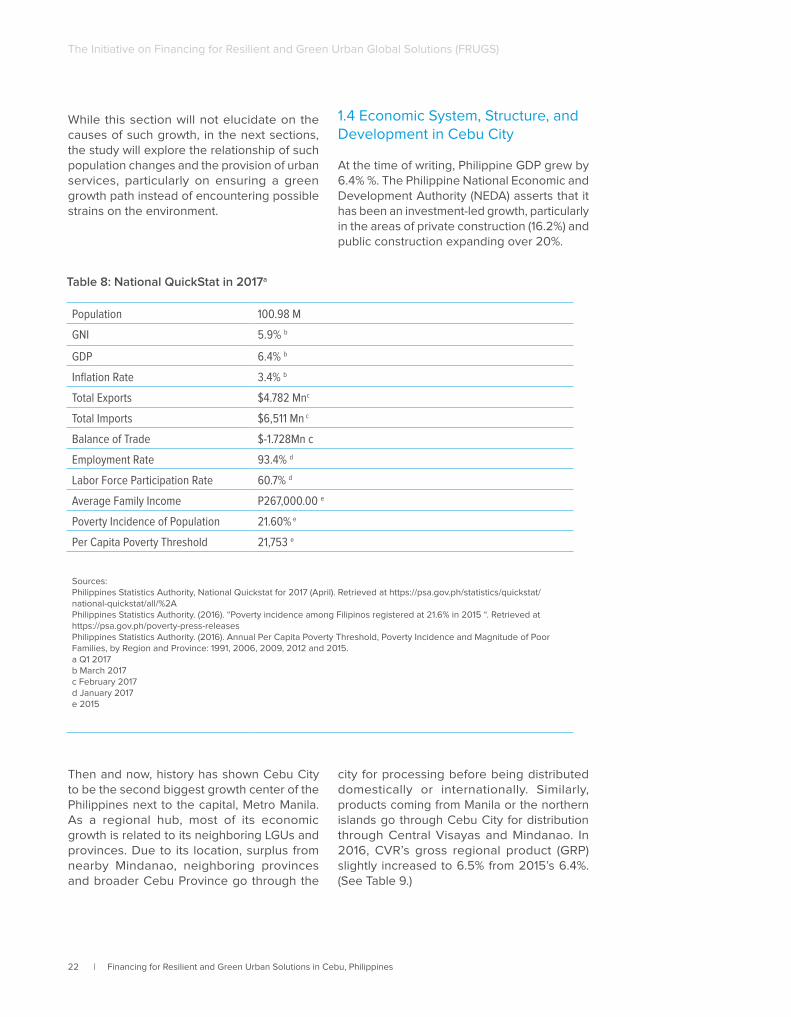
22 | Financing for Resilient and Green Urban Solutions in Cebu, Philippines
The Initiative on Financing for Resilient and Green Urban Global Solutions (FRUGS)
While this section will not elucidate on the causes of such growth, in the next sections, the study will explore the relationship of such population changes and the provision of urban services, particularly on ensuring a green growth path instead of encountering possible strains on the environment.
1.4 Economic System, Structure, and Development in Cebu City
At the time of writing, Philippine GDP grew by 6.4% %. The Philippine National Economic and Development Authority (NEDA) asserts that it has been an investment-led growth, particularly in the areas of private construction (16.2%) and public construction expanding over 20%.
Table 8: National QuickStat in 2017a
Population 100.98 M
GNI 5.9% b
GDP 6.4% b
Inflation Rate 3.4% b
Total Exports $4.782 Mnc
Total Imports $6,511 Mn c
Balance of Trade $-1.728Mn c
Employment Rate 93.4% d
Labor Force Participation Rate 60.7% d
Average Family Income P267,000.00 e
Poverty Incidence of Population 21.60% e
Per Capita Poverty Threshold 21,753 e
Sources: Philippines Statistics Authority, National Quickstat for 2017 (April). Retrieved at https://psa.gov.ph/statistics/quickstat/national-quickstat/all/%2APhilippines Statistics Authority. (2016). “Poverty incidence among Filipinos registered at 21.6% in 2015 “. Retrieved at https://psa.gov.ph/poverty-press-releasesPhilippines Statistics Authority. (2016). Annual Per Capita Poverty Threshold, Poverty Incidence and Magnitude of Poor Families, by Region and Province: 1991, 2006, 2009, 2012 and 2015. a Q1 2017b March 2017c February 2017d January 2017e 2015
Then and now, history has shown Cebu City to be the second biggest growth center of the Philippines next to the capital, Metro Manila. As a regional hub, most of its economic growth is related to its neighboring LGUs and provinces. Due to its location, surplus from nearby Mindanao, neighboring provinces and broader Cebu Province go through the
city for processing before being distributed domestically or internationally. Similarly, products coming from Manila or the northern islands go through Cebu City for distribution through Central Visayas and Mindanao. In 2016, CVR’s gross regional product (GRP) slightly increased to 6.5% from 2015’s 6.4%. (See Table 9.)
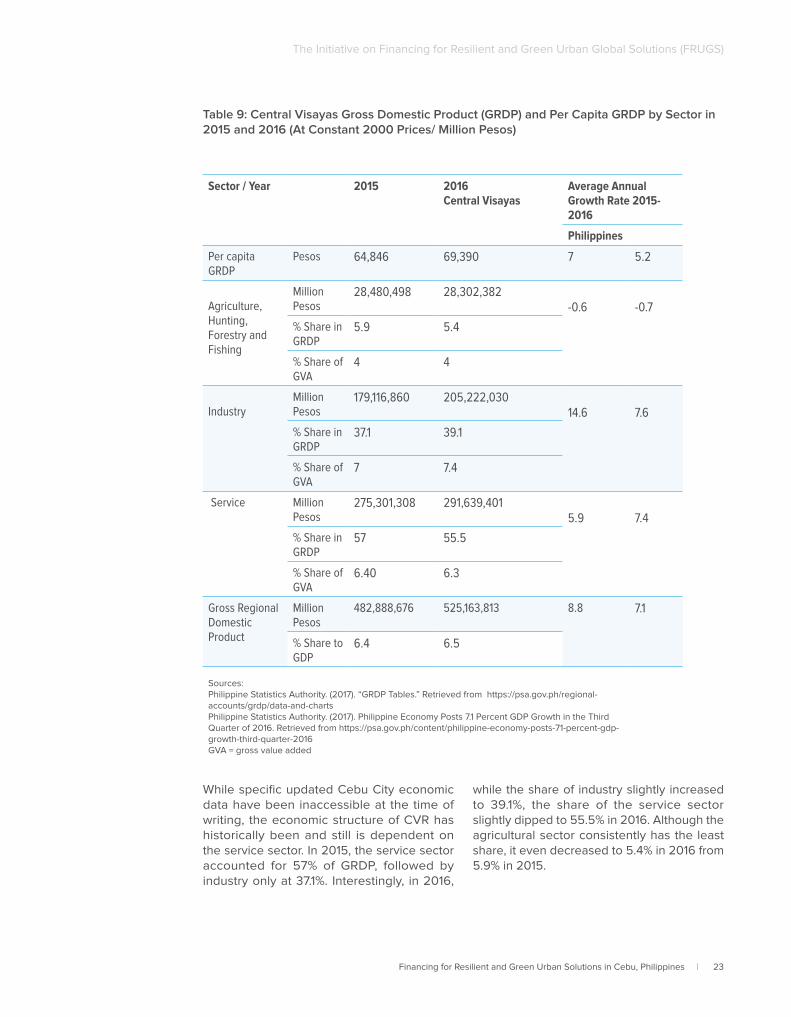
Financing for Resilient and Green Urban Solutions in Cebu, Philippines | 23
The Initiative on Financing for Resilient and Green Urban Global Solutions (FRUGS)
Sector / Year 2015 2016Central Visayas
Average Annual Growth Rate 2015-2016
Philippines
Per capita GRDP
Pesos 64,846 69,390 7 5.2
Agriculture, Hunting,Forestry and Fishing
Million Pesos
28,480,498 28,302,382-0.6 -0.7
% Share in GRDP
5.9 5.4
% Share of GVA
4 4
IndustryMillion Pesos
179,116,860 205,222,03014.6 7.6
% Share in GRDP
37.1 39.1
% Share of GVA
7 7.4
Service Million Pesos
275,301,308 291,639,4015.9 7.4
% Share in GRDP
57 55.5
% Share of GVA
6.40 6.3
Gross Regional DomesticProduct
Million Pesos
482,888,676 525,163,813 8.8 7.1
% Share to GDP
6.4 6.5
Sources: Philippine Statistics Authority. (2017). “GRDP Tables.” Retrieved from https://psa.gov.ph/regional-accounts/grdp/data-and-chartsPhilippine Statistics Authority. (2017). Philippine Economy Posts 7.1 Percent GDP Growth in the Third Quarter of 2016. Retrieved from https://psa.gov.ph/content/philippine-economy-posts-71-percent-gdp-growth-third-quarter-2016GVA = gross value added
Table 9: Central Visayas Gross Domestic Product (GRDP) and Per Capita GRDP by Sector in 2015 and 2016 (At Constant 2000 Prices/ Million Pesos)
While specific updated Cebu City economic data have been inaccessible at the time of writing, the economic structure of CVR has historically been and still is dependent on the service sector. In 2015, the service sector accounted for 57% of GRDP, followed by industry only at 37.1%. Interestingly, in 2016,
while the share of industry slightly increased to 39.1%, the share of the service sector slightly dipped to 55.5% in 2016. Although the agricultural sector consistently has the least share, it even decreased to 5.4% in 2016 from 5.9% in 2015.
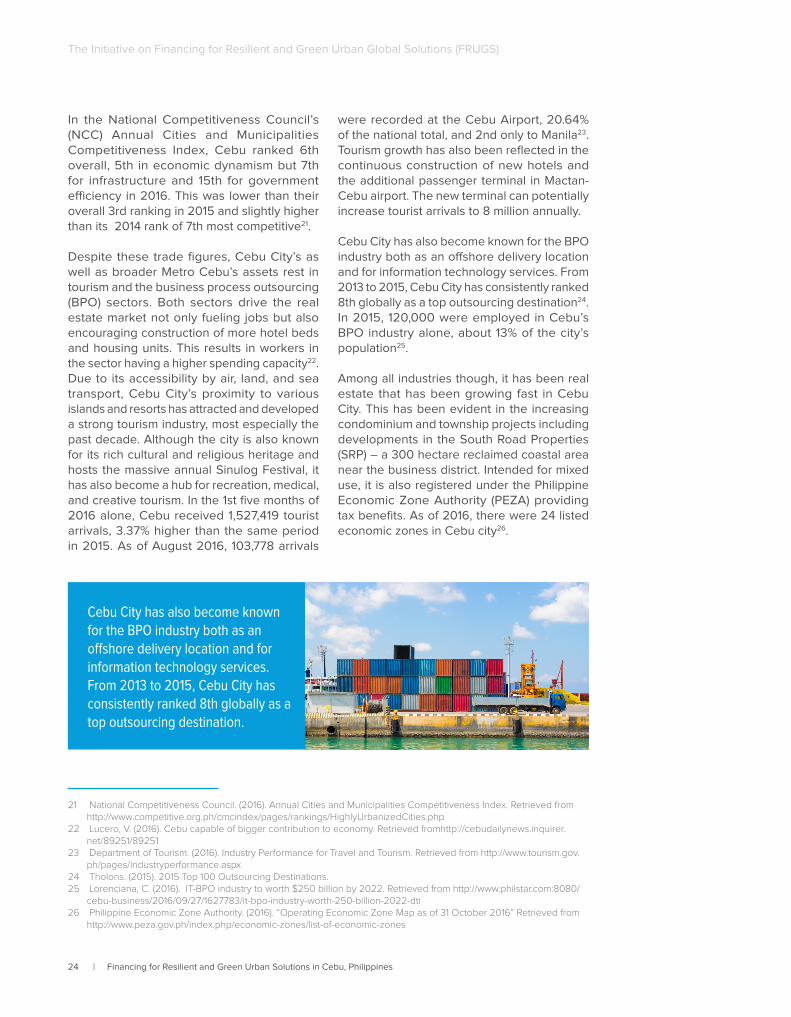
24 | Financing for Resilient and Green Urban Solutions in Cebu, Philippines
The Initiative on Financing for Resilient and Green Urban Global Solutions (FRUGS)
In the National Competitiveness Council’s (NCC) Annual Cities and Municipalities Competitiveness Index, Cebu ranked 6th overall, 5th in economic dynamism but 7th for infrastructure and 15th for government efficiency in 2016. This was lower than their overall 3rd ranking in 2015 and slightly higher than its 2014 rank of 7th most competitive21.
Despite these trade figures, Cebu City’s as well as broader Metro Cebu’s assets rest in tourism and the business process outsourcing (BPO) sectors. Both sectors drive the real estate market not only fueling jobs but also encouraging construction of more hotel beds and housing units. This results in workers in the sector having a higher spending capacity22. Due to its accessibility by air, land, and sea transport, Cebu City’s proximity to various islands and resorts has attracted and developed a strong tourism industry, most especially the past decade. Although the city is also known for its rich cultural and religious heritage and hosts the massive annual Sinulog Festival, it has also become a hub for recreation, medical, and creative tourism. In the 1st five months of 2016 alone, Cebu received 1,527,419 tourist arrivals, 3.37% higher than the same period in 2015. As of August 2016, 103,778 arrivals
21 National Competitiveness Council. (2016). Annual Cities and Municipalities Competitiveness Index. Retrieved from http://www.competitive.org.ph/cmcindex/pages/rankings/HighlyUrbanizedCities.php
22 Lucero, V. (2016). Cebu capable of bigger contribution to economy. Retrieved fromhttp://cebudailynews.inquirer.net/89251/89251
23 Department of Tourism. (2016). Industry Performance for Travel and Tourism. Retrieved from http://www.tourism.gov.ph/pages/industryperformance.aspx
24 Tholons. (2015). 2015 Top 100 Outsourcing Destinations.25 Lorenciana, C. (2016). IT-BPO industry to worth $250 billion by 2022. Retrieved from http://www.philstar.com:8080/
cebu-business/2016/09/27/1627783/it-bpo-industry-worth-250-billion-2022-dti26 Philippine Economic Zone Authority. (2016). “Operating Economic Zone Map as of 31 October 2016” Retrieved from
http://www.peza.gov.ph/index.php/economic-zones/list-of-economic-zones
were recorded at the Cebu Airport, 20.64% of the national total, and 2nd only to Manila23. Tourism growth has also been reflected in the continuous construction of new hotels and the additional passenger terminal in Mactan-Cebu airport. The new terminal can potentially increase tourist arrivals to 8 million annually.
Cebu City has also become known for the BPO industry both as an offshore delivery location and for information technology services. From 2013 to 2015, Cebu City has consistently ranked 8th globally as a top outsourcing destination24. In 2015, 120,000 were employed in Cebu’s BPO industry alone, about 13% of the city’s population25.
Among all industries though, it has been real estate that has been growing fast in Cebu City. This has been evident in the increasing condominium and township projects including developments in the South Road Properties (SRP) – a 300 hectare reclaimed coastal area near the business district. Intended for mixed use, it is also registered under the Philippine Economic Zone Authority (PEZA) providing tax benefits. As of 2016, there were 24 listed economic zones in Cebu city26.
Cebu City has also become known for the BPO industry both as an offshore delivery location and for information technology services. From 2013 to 2015, Cebu City has consistently ranked 8th globally as a top outsourcing destination.
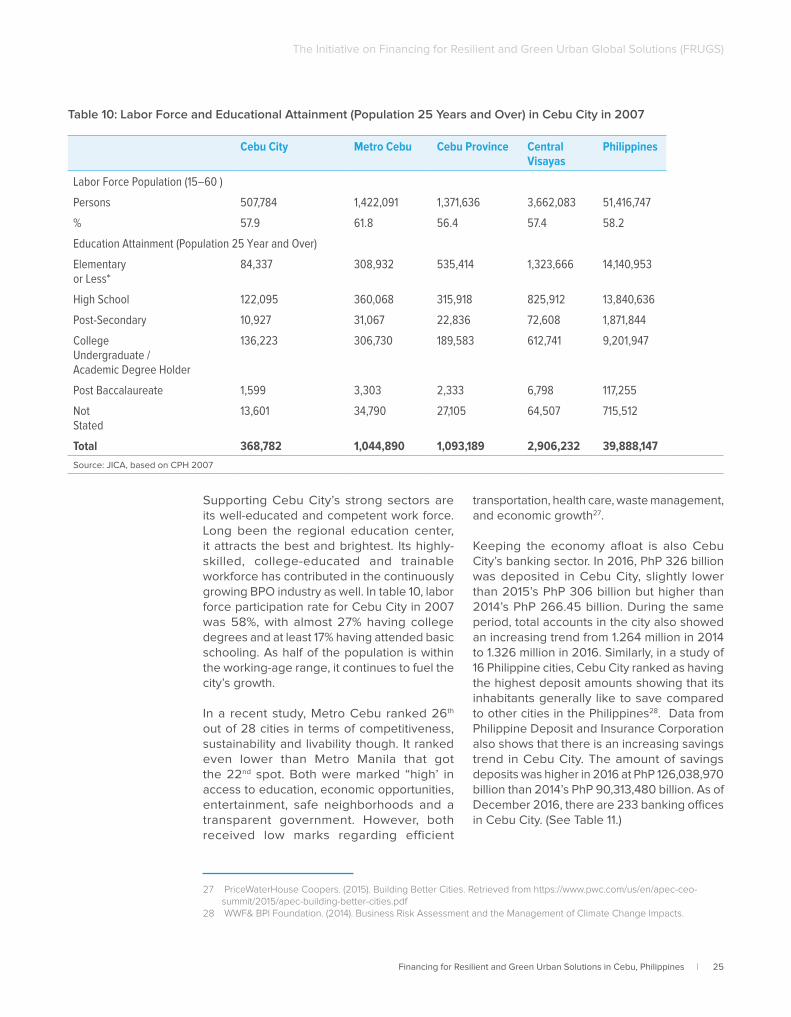
Financing for Resilient and Green Urban Solutions in Cebu, Philippines | 25
The Initiative on Financing for Resilient and Green Urban Global Solutions (FRUGS)
Table 10: Labor Force and Educational Attainment (Population 25 Years and Over) in Cebu City in 2007
Cebu City Metro Cebu Cebu Province Central Visayas
Philippines
Labor Force Population (15–60 )
Persons 507,784 1,422,091 1,371,636 3,662,083 51,416,747
% 57.9 61.8 56.4 57.4 58.2
Education Attainment (Population 25 Year and Over)
Elementaryor Less*
84,337 308,932 535,414 1,323,666 14,140,953
High School 122,095 360,068 315,918 825,912 13,840,636
Post-Secondary 10,927 31,067 22,836 72,608 1,871,844
CollegeUndergraduate /Academic Degree Holder
136,223 306,730 189,583 612,741 9,201,947
Post Baccalaureate 1,599 3,303 2,333 6,798 117,255
NotStated
13,601 34,790 27,105 64,507 715,512
Total 368,782 1,044,890 1,093,189 2,906,232 39,888,147Source: JICA, based on CPH 2007
Supporting Cebu City’s strong sectors are its well-educated and competent work force. Long been the regional education center, it attracts the best and brightest. Its highly-skilled, college-educated and trainable workforce has contributed in the continuously growing BPO industry as well. In table 10, labor force participation rate for Cebu City in 2007 was 58%, with almost 27% having college degrees and at least 17% having attended basic schooling. As half of the population is within the working-age range, it continues to fuel the city’s growth.
In a recent study, Metro Cebu ranked 26th out of 28 cities in terms of competitiveness, sustainability and livability though. It ranked even lower than Metro Manila that got the 22nd spot. Both were marked “high’ in access to education, economic opportunities, entertainment, safe neighborhoods and a transparent government. However, both received low marks regarding efficient
27 PriceWaterHouse Coopers. (2015). Building Better Cities. Retrieved from https://www.pwc.com/us/en/apec-ceo-summit/2015/apec-building-better-cities.pdf
28 WWF& BPI Foundation. (2014). Business Risk Assessment and the Management of Climate Change Impacts.
transportation, health care, waste management, and economic growth27.
Keeping the economy afloat is also Cebu City’s banking sector. In 2016, PhP 326 billion was deposited in Cebu City, slightly lower than 2015’s PhP 306 billion but higher than 2014’s PhP 266.45 billion. During the same period, total accounts in the city also showed an increasing trend from 1.264 million in 2014 to 1.326 million in 2016. Similarly, in a study of 16 Philippine cities, Cebu City ranked as having the highest deposit amounts showing that its inhabitants generally like to save compared to other cities in the Philippines28. Data from Philippine Deposit and Insurance Corporation also shows that there is an increasing savings trend in Cebu City. The amount of savings deposits was higher in 2016 at PhP 126,038,970 billion than 2014’s PhP 90,313,480 billion. As of December 2016, there are 233 banking offices in Cebu City. (See Table 11.)
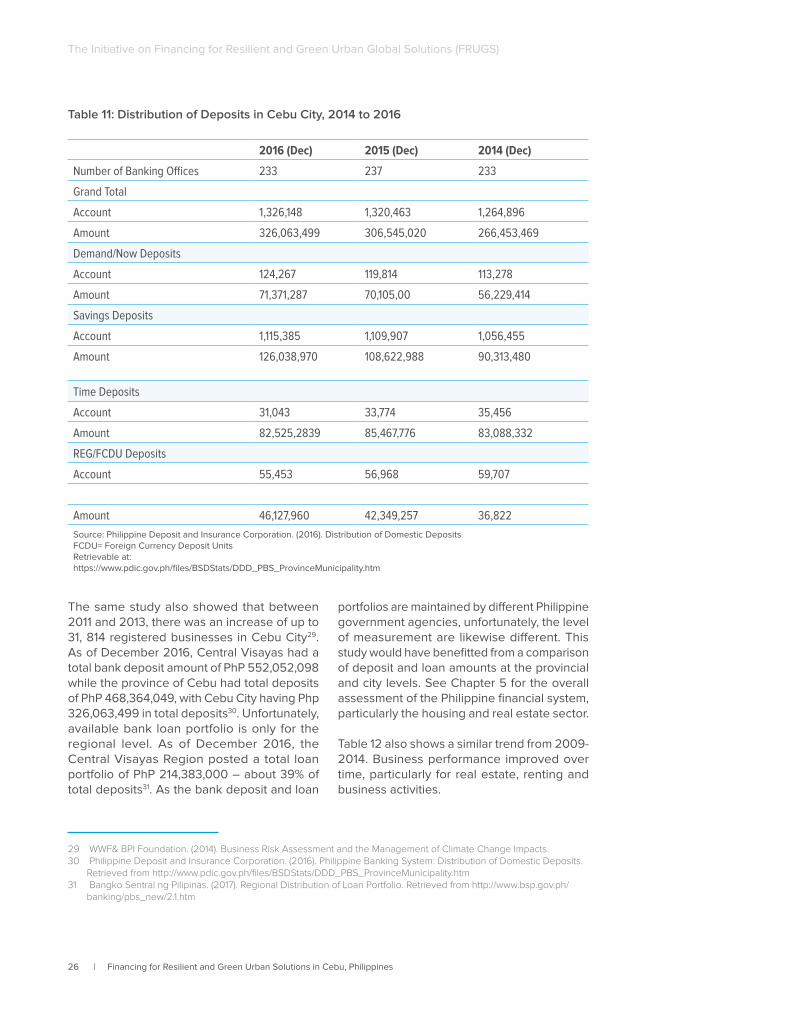
26 | Financing for Resilient and Green Urban Solutions in Cebu, Philippines
The Initiative on Financing for Resilient and Green Urban Global Solutions (FRUGS)
2016 (Dec) 2015 (Dec) 2014 (Dec)
Number of Banking Offices 233 237 233
Grand Total
Account 1,326,148 1,320,463 1,264,896
Amount 326,063,499 306,545,020 266,453,469
Demand/Now Deposits
Account 124,267 119,814 113,278
Amount 71,371,287 70,105,00 56,229,414
Savings Deposits
Account 1,115,385 1,109,907 1,056,455
Amount 126,038,970 108,622,988 90,313,480
Time Deposits
Account 31,043 33,774 35,456
Amount 82,525,2839 85,467,776 83,088,332
REG/FCDU Deposits
Account 55,453 56,968 59,707
Amount 46,127,960 42,349,257 36,822
Source: Philippine Deposit and Insurance Corporation. (2016). Distribution of Domestic Deposits FCDU= Foreign Currency Deposit Units Retrievable at: https://www.pdic.gov.ph/files/BSDStats/DDD_PBS_ProvinceMunicipality.htm
Table 11: Distribution of Deposits in Cebu City, 2014 to 2016
The same study also showed that between 2011 and 2013, there was an increase of up to 31, 814 registered businesses in Cebu City29. As of December 2016, Central Visayas had a total bank deposit amount of PhP 552,052,098 while the province of Cebu had total deposits of PhP 468,364,049, with Cebu City having Php 326,063,499 in total deposits30. Unfortunately, available bank loan portfolio is only for the regional level. As of December 2016, the Central Visayas Region posted a total loan portfolio of PhP 214,383,000 – about 39% of total deposits31. As the bank deposit and loan
29 WWF& BPI Foundation. (2014). Business Risk Assessment and the Management of Climate Change Impacts.30 Philippine Deposit and Insurance Corporation. (2016). Philippine Banking System: Distribution of Domestic Deposits.
Retrieved from http://www.pdic.gov.ph/files/BSDStats/DDD_PBS_ProvinceMunicipality.htm31 Bangko Sentral ng Pilipinas. (2017). Regional Distribution of Loan Portfolio. Retrieved from http://www.bsp.gov.ph/
banking/pbs_new/2.1.htm
portfolios are maintained by different Philippine government agencies, unfortunately, the level of measurement are likewise different. This study would have benefitted from a comparison of deposit and loan amounts at the provincial and city levels. See Chapter 5 for the overall assessment of the Philippine financial system, particularly the housing and real estate sector.
Table 12 also shows a similar trend from 2009-2014. Business performance improved over time, particularly for real estate, renting and business activities.
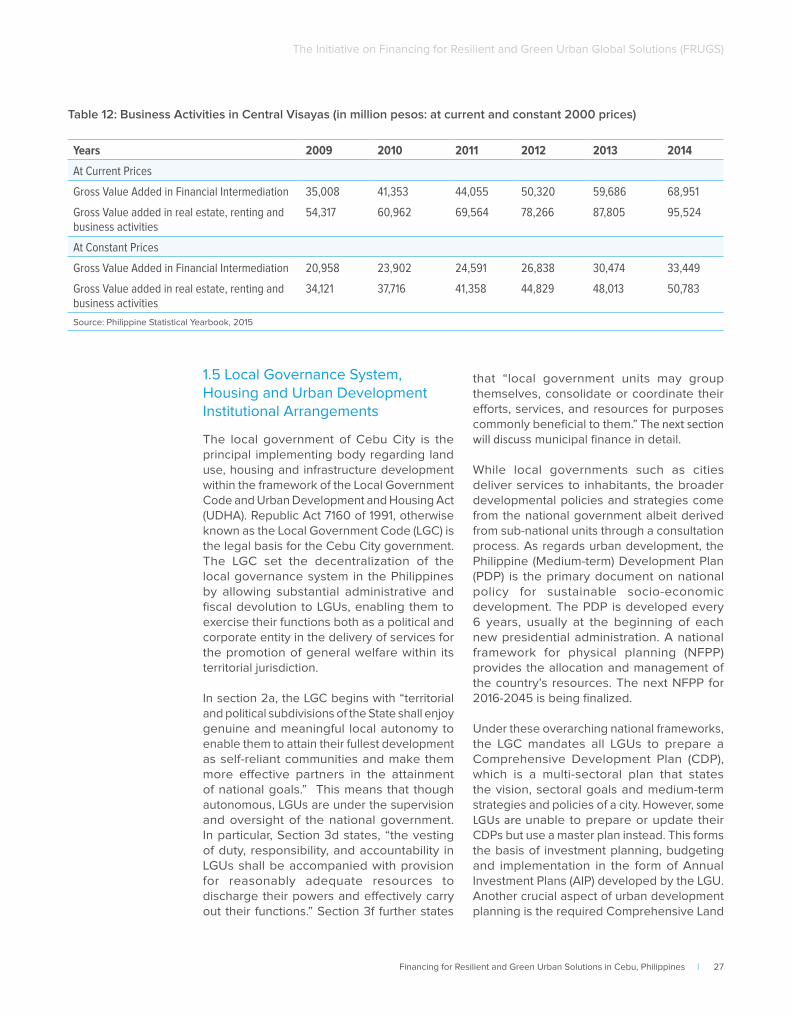
Financing for Resilient and Green Urban Solutions in Cebu, Philippines | 27
The Initiative on Financing for Resilient and Green Urban Global Solutions (FRUGS)
Years 2009 2010 2011 2012 2013 2014
At Current Prices
Gross Value Added in Financial Intermediation 35,008 41,353 44,055 50,320 59,686 68,951
Gross Value added in real estate, renting and business activities
54,317 60,962 69,564 78,266 87,805 95,524
At Constant Prices
Gross Value Added in Financial Intermediation 20,958 23,902 24,591 26,838 30,474 33,449
Gross Value added in real estate, renting and business activities
34,121 37,716 41,358 44,829 48,013 50,783
Source: Philippine Statistical Yearbook, 2015
Table 12: Business Activities in Central Visayas (in million pesos: at current and constant 2000 prices)
1.5 Local Governance System, Housing and Urban Development Institutional Arrangements
The local government of Cebu City is the principal implementing body regarding land use, housing and infrastructure development within the framework of the Local Government Code and Urban Development and Housing Act (UDHA). Republic Act 7160 of 1991, otherwise known as the Local Government Code (LGC) is the legal basis for the Cebu City government. The LGC set the decentralization of the local governance system in the Philippines by allowing substantial administrative and fiscal devolution to LGUs, enabling them to exercise their functions both as a political and corporate entity in the delivery of services for the promotion of general welfare within its territorial jurisdiction.
In section 2a, the LGC begins with “territorial and political subdivisions of the State shall enjoy genuine and meaningful local autonomy to enable them to attain their fullest development as self-reliant communities and make them more effective partners in the attainment of national goals.” This means that though autonomous, LGUs are under the supervision and oversight of the national government. In particular, Section 3d states, “the vesting of duty, responsibility, and accountability in LGUs shall be accompanied with provision for reasonably adequate resources to discharge their powers and effectively carry out their functions.” Section 3f further states
that “local government units may group themselves, consolidate or coordinate their efforts, services, and resources for purposes commonly beneficial to them.” The next section will discuss municipal finance in detail.
While local governments such as cities deliver services to inhabitants, the broader developmental policies and strategies come from the national government albeit derived from sub-national units through a consultation process. As regards urban development, the Philippine (Medium-term) Development Plan (PDP) is the primary document on national policy for sustainable socio-economic development. The PDP is developed every 6 years, usually at the beginning of each new presidential administration. A national framework for physical planning (NFPP) provides the allocation and management of the country’s resources. The next NFPP for 2016-2045 is being finalized.
Under these overarching national frameworks, the LGC mandates all LGUs to prepare a Comprehensive Development Plan (CDP), which is a multi-sectoral plan that states the vision, sectoral goals and medium-term strategies and policies of a city. However, some LGUs are unable to prepare or update their CDPs but use a master plan instead. This forms the basis of investment planning, budgeting and implementation in the form of Annual Investment Plans (AIP) developed by the LGU. Another crucial aspect of urban development planning is the required Comprehensive Land
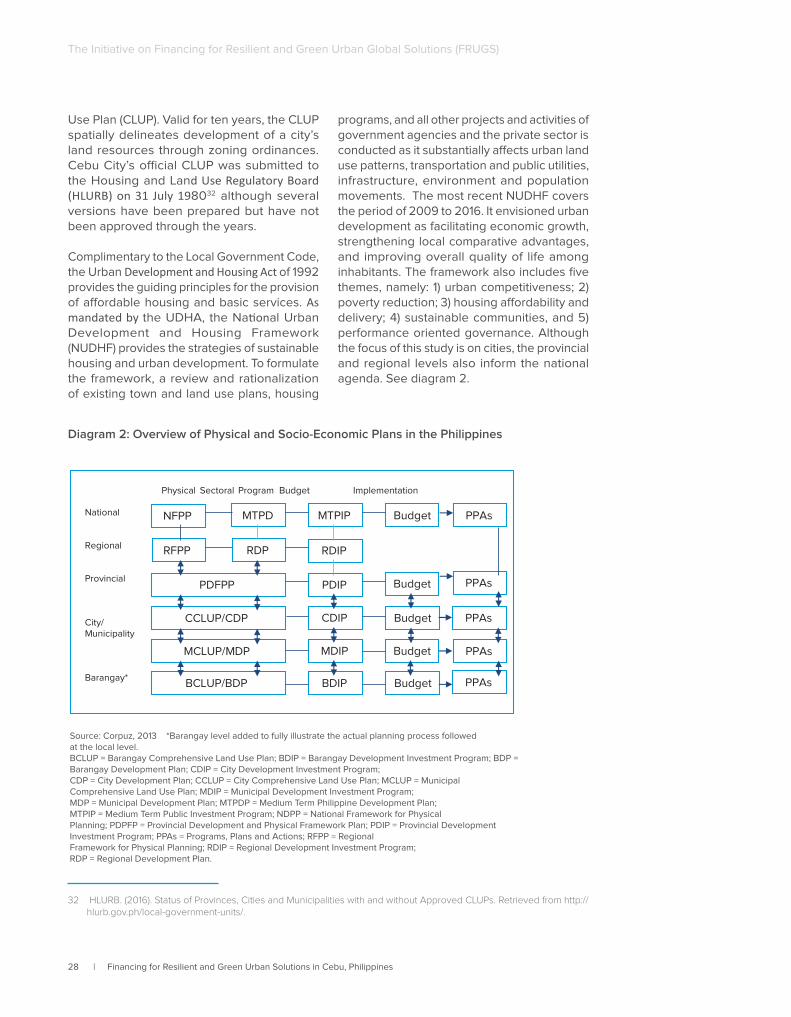
28 | Financing for Resilient and Green Urban Solutions in Cebu, Philippines
The Initiative on Financing for Resilient and Green Urban Global Solutions (FRUGS)
Use Plan (CLUP). Valid for ten years, the CLUP spatially delineates development of a city’s land resources through zoning ordinances. Cebu City’s official CLUP was submitted to the Housing and Land Use Regulatory Board (HLURB) on 31 July 198032 although several versions have been prepared but have not been approved through the years.
Complimentary to the Local Government Code, the Urban Development and Housing Act of 1992 provides the guiding principles for the provision of affordable housing and basic services. As mandated by the UDHA, the National Urban Development and Housing Framework (NUDHF) provides the strategies of sustainable housing and urban development. To formulate the framework, a review and rationalization of existing town and land use plans, housing
32 HLURB. (2016). Status of Provinces, Cities and Municipalities with and without Approved CLUPs. Retrieved from http://hlurb.gov.ph/local-government-units/.
programs, and all other projects and activities of government agencies and the private sector is conducted as it substantially affects urban land use patterns, transportation and public utilities, infrastructure, environment and population movements. The most recent NUDHF covers the period of 2009 to 2016. It envisioned urban development as facilitating economic growth, strengthening local comparative advantages, and improving overall quality of life among inhabitants. The framework also includes five themes, namely: 1) urban competitiveness; 2) poverty reduction; 3) housing affordability and delivery; 4) sustainable communities, and 5) performance oriented governance. Although the focus of this study is on cities, the provincial and regional levels also inform the national agenda. See diagram 2.
Diagram 2: Overview of Physical and Socio-Economic Plans in the Philippines
Physical Sectoral Program Budget Implementation
National
Regional
Provincial
City/ Municipality
Barangay*
RFPP
PDFPP
NFPP MTPDP
RDP
CCLUP/CDP
MCLUP/MDP
BCLUP/BDP
MTPIP Budget PPAs
RDIP
PDIP
CDIP
MDIP
BDIP
Budget PPAs
Budget
PPAs Budget
PPAs Budget
PPAs
Source: Corpuz, 2013 *Barangay level added to fully illustrate the actual planning process followedat the local level.BCLUP = Barangay Comprehensive Land Use Plan; BDIP = Barangay Development Investment Program; BDP = Barangay Development Plan; CDIP = City Development Investment Program; CDP = City Development Plan; CCLUP = City Comprehensive Land Use Plan; MCLUP = Municipal Comprehensive Land Use Plan; MDIP = Municipal Development Investment Program; MDP = Municipal Development Plan; MTPDP = Medium Term Philippine Development Plan; MTPIP = Medium Term Public Investment Program; NDPP = National Framework for PhysicalPlanning; PDPFP = Provincial Development and Physical Framework Plan; PDIP = Provincial Development Investment Program; PPAs = Programs, Plans and Actions; RFPP = Regional Framework for Physical Planning; RDIP = Regional Development Investment Program; RDP = Regional Development Plan.
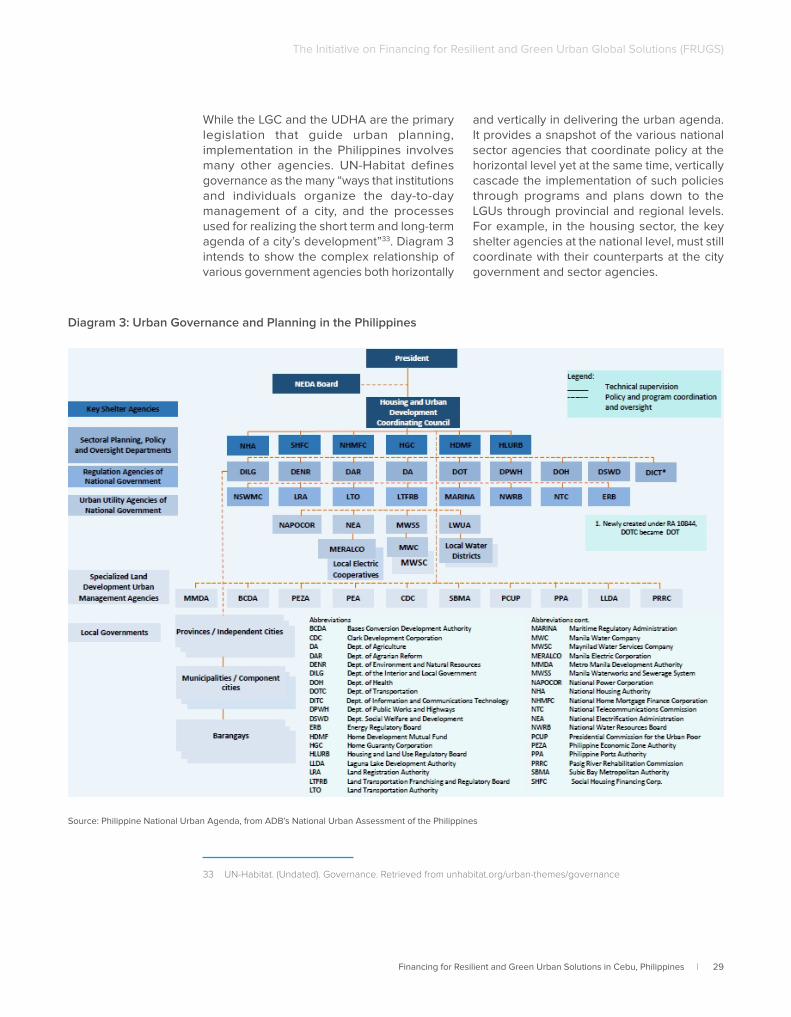
Financing for Resilient and Green Urban Solutions in Cebu, Philippines | 29
The Initiative on Financing for Resilient and Green Urban Global Solutions (FRUGS)
While the LGC and the UDHA are the primary legislation that guide urban planning, implementation in the Philippines involves many other agencies. UN-Habitat defines governance as the many “ways that institutions and individuals organize the day-to-day management of a city, and the processes used for realizing the short term and long-term agenda of a city’s development”33. Diagram 3 intends to show the complex relationship of various government agencies both horizontally
33 UN-Habitat. (Undated). Governance. Retrieved from unhabitat.org/urban-themes/governance
and vertically in delivering the urban agenda. It provides a snapshot of the various national sector agencies that coordinate policy at the horizontal level yet at the same time, vertically cascade the implementation of such policies through programs and plans down to the LGUs through provincial and regional levels. For example, in the housing sector, the key shelter agencies at the national level, must still coordinate with their counterparts at the city government and sector agencies.
Source: Philippine National Urban Agenda, from ADB’s National Urban Assessment of the Philippines
Diagram 3: Urban Governance and Planning in the Philippines
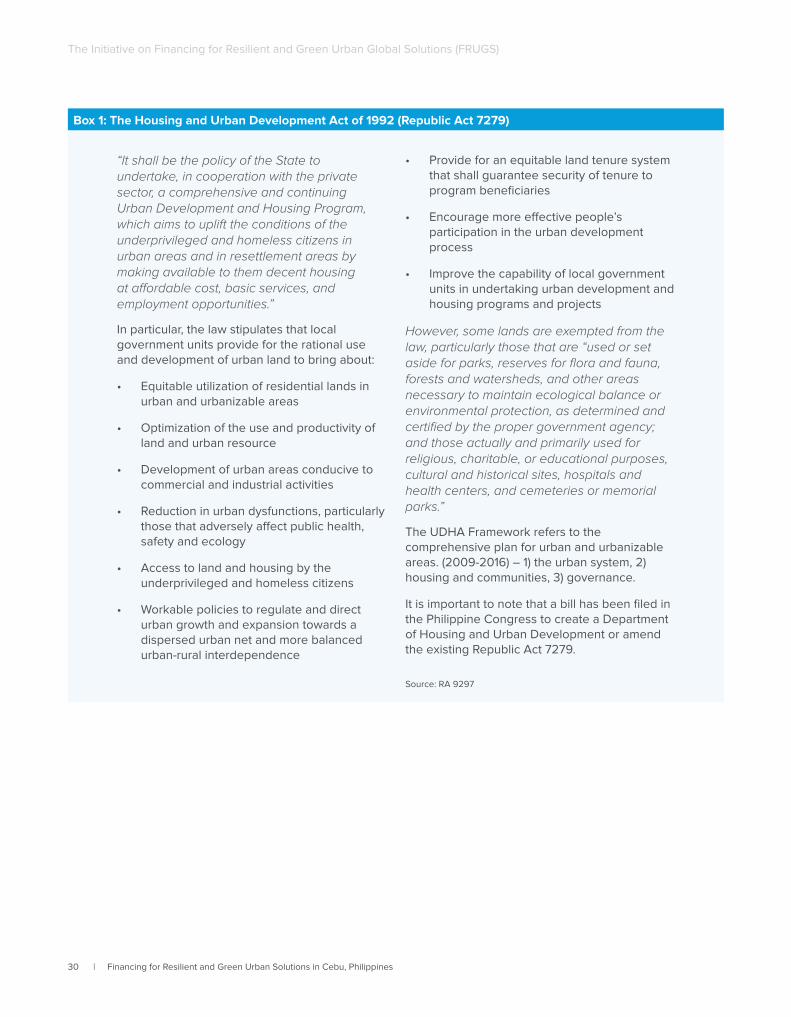
30 | Financing for Resilient and Green Urban Solutions in Cebu, Philippines
The Initiative on Financing for Resilient and Green Urban Global Solutions (FRUGS)
“It shall be the policy of the State to undertake, in cooperation with the private sector, a comprehensive and continuing Urban Development and Housing Program, which aims to uplift the conditions of the underprivileged and homeless citizens in urban areas and in resettlement areas by making available to them decent housing at affordable cost, basic services, and employment opportunities.”
In particular, the law stipulates that local government units provide for the rational use and development of urban land to bring about:
• Equitable utilization of residential lands in urban and urbanizable areas
• Optimization of the use and productivity of land and urban resource
• Development of urban areas conducive to commercial and industrial activities
• Reduction in urban dysfunctions, particularly those that adversely affect public health, safety and ecology
• Access to land and housing by the underprivileged and homeless citizens
• Workable policies to regulate and direct urban growth and expansion towards a dispersed urban net and more balanced urban-rural interdependence
• Provide for an equitable land tenure system that shall guarantee security of tenure to program beneficiaries
• Encourage more effective people’s participation in the urban development process
• Improve the capability of local government units in undertaking urban development and housing programs and projects
However, some lands are exempted from the law, particularly those that are “used or set aside for parks, reserves for flora and fauna, forests and watersheds, and other areas necessary to maintain ecological balance or environmental protection, as determined and certified by the proper government agency; and those actually and primarily used for religious, charitable, or educational purposes, cultural and historical sites, hospitals and health centers, and cemeteries or memorial parks.”
The UDHA Framework refers to the comprehensive plan for urban and urbanizable areas. (2009-2016) – 1) the urban system, 2) housing and communities, 3) governance.
It is important to note that a bill has been filed in the Philippine Congress to create a Department of Housing and Urban Development or amend the existing Republic Act 7279.
Source: RA 9297
Box 1: The Housing and Urban Development Act of 1992 (Republic Act 7279)
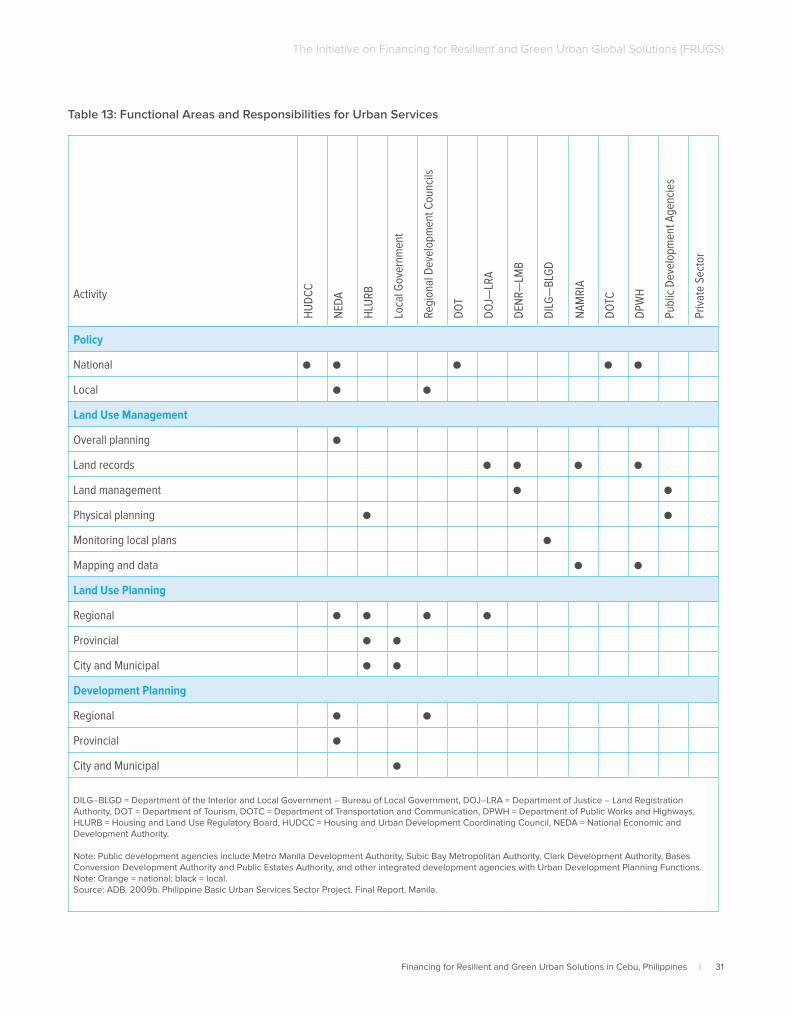
Financing for Resilient and Green Urban Solutions in Cebu, Philippines | 31
The Initiative on Financing for Resilient and Green Urban Global Solutions (FRUGS)
Table 13: Functional Areas and Responsibilities for Urban Services
ActivityH
UD
CC
NED
A
HLU
RB
Loca
l Gov
ernm
ent
Regi
onal
Dev
elop
men
t Cou
ncils
DO
T
DO
J—LR
A
DEN
R—
LMB
DIL
G—
BLG
D
NA
MR
IA
DO
TC
DPW
H
Publ
ic D
evel
opm
ent A
genc
ies
Priv
ate
Sect
or
Policy
National
Local
Land Use Management
Overall planning
Land records
Land management
Physical planning
Monitoring local plans
Mapping and data
Land Use Planning
Regional
Provincial
City and Municipal
Development Planning
Regional
Provincial
City and Municipal
DILG–BLGD = Department of the Interior and Local Government – Bureau of Local Government, DOJ–LRA = Department of Justice – Land Registration Authority, DOT = Department of Tourism, DOTC = Department of Transportation and Communication, DPWH = Department of Public Works and Highways, HLURB = Housing and Land Use Regulatory Board, HUDCC = Housing and Urban Development Coordinating Council, NEDA = National Economic and Development Authority.
Note: Public development agencies include Metro Manila Development Authority, Subic Bay Metropolitan Authority, Clark Development Authority, Bases Conversion Development Authority and Public Estates Authority, and other integrated development agencies with Urban Development Planning Functions.Note: Orange = national; black = local.Source: ADB. 2009b. Philippine Basic Urban Services Sector Project. Final Report. Manila.
32 | Financing for Resilient and Green Urban Solutions in Cebu, Philippines
The Initiative on Financing for Resilient and Green Urban Global Solutions (FRUGS)
Similarly, the strategic policy and oversight for the provision of urban services rest on various national agencies. Table 13 presents the functions of policy-making, land use management, land use planning, and development planning. Although these are operationalized at the city level, the agencies have supervisory function, if not even provision of technical assistance over LGUs. It further shows the necessity of coordination among various agencies to formulate required urban plans horizontally and vertically.
The governance arrangements discussed so far cover the standard framework between national and local governments as regards urban development and to the extent the
oversight and functions of sector agencies relate to housing. Challenges that such governance arrangements result in are discussed in Chapter 4.
Cebu City has demonstrated and as the LGC allows, LGUs may group themselves for purposes commonly beneficial to them. It is for this primary reason that Metro Cebu came into being. This provides an alternate, if not a supra-local framework though not beyond the provincial and regional scope of urban governance. As noted in Chapter 1, Cebu City is part of a metropolitan arrangement called Metro Cebu. It is one among the 13 local government units that are members.
On 1 April 2011, a Memorandum of Agreement was signed among the provincial government of Cebu, 7 cities, 6 municipalities, regional counterparts of national sector agencies, and leaders of the private sector to create the Metro Cebu Development and Coordinating Board (MCDCB). It was created as a response to the desire of the public and private sectors for a collective and effective governance and efficient service delivery to address rapid urbanization among the initial participating LGUs. It aimed to ease the formulation, coordination, and monitoring of integrated development strategies and policies.
On 27 January 2015, the Philippine Congress approved House Bill 6227 “An Act Creating the Mega Cebu Development Authority (MCDA), Prescribing Its Powers, Functions, and Duties, Providing Funds Therefor, and for other purposes.” Although it still needs to get approved by the Philippine Senate, the envisioned MCDA will formulate investment plans for multi-LGU benefit on services such as land use, spatial and physical development, and integrated systems for sustainable urban development. These metropolitan public goods will go beyond the prescribed administrative boundaries of the member LGUS.
The MCDA will materialize the Mega Cebu 2050 Vision of a Wholesome,
Advanced, Vibrant, Equitable, and Sustainable (W.A.V.E.S.) Cebu towards a competitive, livable, mobile metropolis through the implementation of the Metropolitan Cebu Roadmap 2050.
In July 2016, Cebu City Mayor Tomas Osmena announced that Cebu City will no longer be involved in any discussions involving the Metro Cebu Development Coordinating Board due to its lack of legal persona. Changes on this position remains to be seen.
Source: Felicitas, P. (2016). Cebu City Backs Out of Mega Cebu. Retrievable from: http://www.sunstar.com.ph/cebu/local-news/2016/07/16/cebu-city-backs-out-mega-cebu-485614
Box 2: Collaborative Governance in Metro Cebu
Financing for Resilient and Green Urban Solutions in Cebu, Philippines | 33
The Initiative on Financing for Resilient and Green Urban Global Solutions (FRUGS)
Also, while the local government unit is the primary actor under the LGC, the implementation of UDHA’s National Shelter Program was through 5 key shelter agencies (KSA) in the Philippines. Initially mandated by Executive Order (EO) 90 of 1987, the Housing and Urban Development Coordinating Council (HUDCC) is the lead housing agency to undertake planning and coordination, and provides technical assistance on housing projects (e.g. in the preparation and development of the Local Shelter Plan). The other 4 KSAs are:
• National Housing Authority (NHA): It is the sole agency tasked to engage in direct shelter production and provision of housing benefits focusing on the lowest 30% of urban income earners through slum upgrading, squatter relocation, development of sites and services and construction of core-housing units. The NHA can also undertake programs for the improvement of blighted urban areas and provide technical assistance for private developers. Tracing its origins to the People’s Homesite Corporation established in 1938 and the National Housing Corporation created in 1945, another 6 agencies were created for the housing mandate until the NHA was officially established in 1975.
• Housing and Land Use Regulatory Board (HLURB): It is tasked to develop a comprehensive plan for urban and urbanizable areas and to regulate land use plans and housing development. It is also responsible for preparing the NUDHF and guides LGUs in the preparation of the CLUP. It traces its origins from the Task Force on Human Settlements created in 1973. In 1978, it was designated as the regulatory arm of the Ministry of Settlements, and was renamed as HLURB and designated regulatory body for housing and land development in 1986.
• Home Guaranty Corporation (HGC): It is responsible for providing guarantee schemes and other incentives to encourage financial institutions to go into direct lending for housing. It was originally created in 1950 as the Home Financing Commission.
• National Home Mortgage Finance Corporation (NHMFC). It was created under Presidential Decree 1267 in 1977 as the government’s secondary mortgage institution. Its initial main function is to operate a viable home mortgage market and attract private and public institutional funds into long-term housing mortgages. Annex 1 provides the mortgage products, terms and conditions, and the secondary market that NHMFC facilitates.
• Social Housing Finance Corporation (SHFC): Established in a wholly-owned subsidiary of NHMFC is tasked to develop and administer social housing finance programs for low-income formal and informal households. It is also tasked to implement the Community Mortgage Program (CMP) and the Abot-Kaya Pabahay Fund (AKPF) – the former quite successful for the urban poor and the latter currently non-operational. A discussion of market and housing finance will be in Chapter Four.
Also mandated by EO 90, the Philippines has three contractual savings institutions to ensure the availability of long-term loans that have regional offices across the country, including Cebu City. The three institutions that provide non-bank direct lending to aspiring homeowners that are discussed in detail in Section 1.8 are:
• Home Development Mutual Fund (HDMF), also known as the Pag-IBIG Fund
• Social Security System (SSS)
• Government Service Insurance System (GSIS)
Although the five KSAs are the core actors in housing and urban development together with the LGU, it is important to note the non-government actors as well, namely: members of the private sector (e.g. developers, banks), civil society, and homeowners.
At the local government level, HUDCC encourages the creation of shelter boards. Active since 19 May 1999, Cebu City’s Housing Board has 19 members. It has been responsible for leading the formulation and
34 | Financing for Resilient and Green Urban Solutions in Cebu, Philippines
The Initiative on Financing for Resilient and Green Urban Global Solutions (FRUGS)
implementation of Cebu City’s Shelter Plan, setting the housing policy direction, shelter planning, and assessments of beneficiaries. It also has a sub-committee composed of five members that screens and approves qualified socialized housing beneficiaries. Cebu City’s Local Housing Board meets every Monday and has representatives from the city government, key shelter agencies, the private sector, and civil society. (See Annex 4 for a list of housing-related ordinances.)
1.6 Municipal Financial System
According to the UN-Habitat, “municipal finance refers to the revenue and expenditure decisions of governments. It includes sources of revenues such as taxes (property, income, sales), user fees, and inter-governmental transfers. It also covers the means of financing infrastructure through the use of operating revenues, borrowing, charges, and public-private partnerships. It also concerns accountability for expenditure and revenue decisions, including the budgetary process and financial management”34.
In the case of the Philippines, municipal financial arrangements emanate from the 1991 Local Government Code. As LGUs are mandated to provide services to its inhabitants, decentralization included the receipt of proceeds from local revenues, share of cities from internal revenue allotment, other funding support form national government and its instrumentalities, government-owned and controlled corporations. With autonomy came the LGU’s authority:
to create own sources of revenue and to levy taxes, fees, and public utility charges
• to an equitable share in the proceeds from the utilization and development of the national wealth and resources within their respective territorial jurisdictions;
• to acquire, develop, lease, encumber, alienate, or otherwise dispose of real or
34 UN-Habitat. (2009). Guide to Municipal Finance. Nairobi.
personal property in a city’s proprietary capacity and to apply resources and assets for welfare purposes
• to negotiate and secure financial grants from local and foreign assistance agencies, provided projects without national security implications are approved by the national agency concerned;
• to engage in cooperative undertakings among other LGUs and contribute funds and other resources as mutually agreed by participating LGUs
• to assess and collect real property taxes
• to create indebtedness, avail of credit facilities to finance local infrastructure and other socio-economic development projects, and avail of credit lines from government or private banks and lending institutions for the purpose of stabilizing local finances
• defer payment and other financial schemes
• to issue bonds, debentures, securities, collaterals, notes and other obligations to finance self-liquidating, income-producing development or livelihood projects pursuant to the priorities established in the approved local development plan or the public investment program per the rules of the Central Bank and Securities and Exchange Commission
• to extend loans, grants, or subsidies to other local government units under such terms and conditions as may be agreed upon by the contracting parties
• undertake loans from funds secured by the national government from foreign sources;
• to engage in the financing, construction, maintenance, operation, and management of infrastructure projects by the private sector
• to create a local finance committee
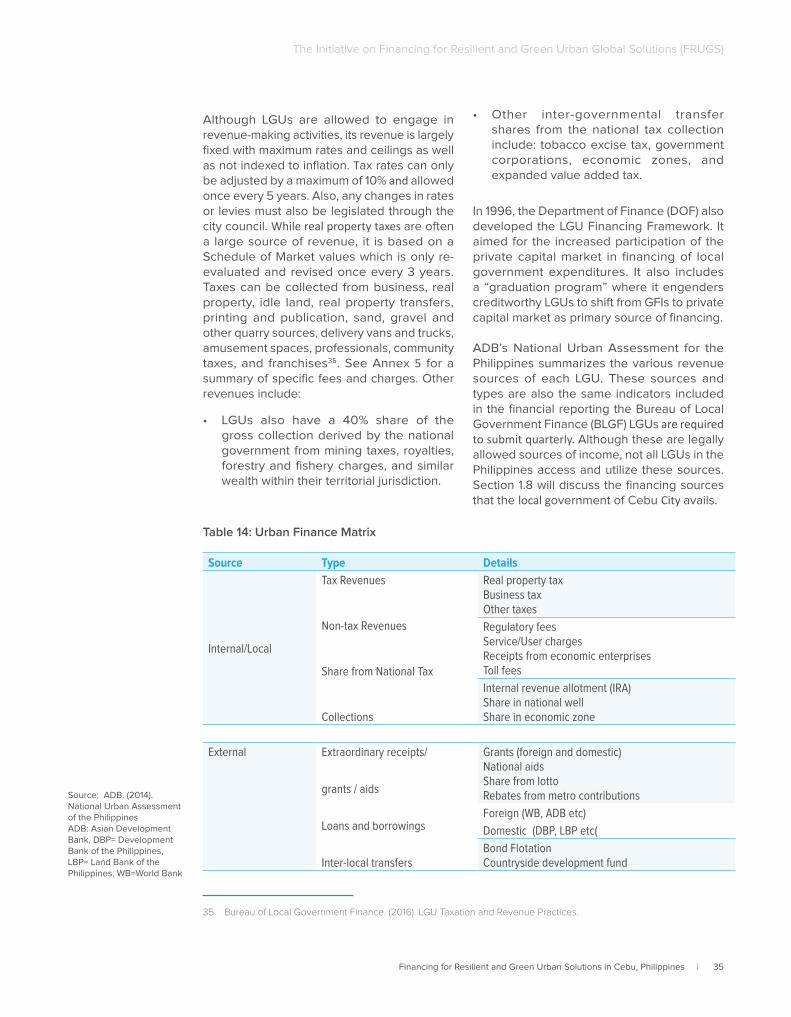
Financing for Resilient and Green Urban Solutions in Cebu, Philippines | 35
The Initiative on Financing for Resilient and Green Urban Global Solutions (FRUGS)
Although LGUs are allowed to engage in revenue-making activities, its revenue is largely fixed with maximum rates and ceilings as well as not indexed to inflation. Tax rates can only be adjusted by a maximum of 10% and allowed once every 5 years. Also, any changes in rates or levies must also be legislated through the city council. While real property taxes are often a large source of revenue, it is based on a Schedule of Market values which is only re-evaluated and revised once every 3 years. Taxes can be collected from business, real property, idle land, real property transfers, printing and publication, sand, gravel and other quarry sources, delivery vans and trucks, amusement spaces, professionals, community taxes, and franchises35. See Annex 5 for a summary of specific fees and charges. Other revenues include:
• LGUs also have a 40% share of the gross collection derived by the national government from mining taxes, royalties, forestry and fishery charges, and similar wealth within their territorial jurisdiction.
35 Bureau of Local Government Finance. (2016). LGU Taxation and Revenue Practices.
• Other inter-governmental transfer shares from the national tax collection include: tobacco excise tax, government corporations, economic zones, and expanded value added tax.
In 1996, the Department of Finance (DOF) also developed the LGU Financing Framework. It aimed for the increased participation of the private capital market in financing of local government expenditures. It also includes a “graduation program” where it engenders creditworthy LGUs to shift from GFIs to private capital market as primary source of financing.
ADB’s National Urban Assessment for the Philippines summarizes the various revenue sources of each LGU. These sources and types are also the same indicators included in the financial reporting the Bureau of Local Government Finance (BLGF) LGUs are required to submit quarterly. Although these are legally allowed sources of income, not all LGUs in the Philippines access and utilize these sources. Section 1.8 will discuss the financing sources that the local government of Cebu City avails.
Table 14: Urban Finance Matrix
Source Type Details
Internal/Local
Tax Revenues
Non-tax Revenues
Share from National Tax
Collections
Real property taxBusiness taxOther taxes
Regulatory feesService/User chargesReceipts from economic enterprisesToll fees
Internal revenue allotment (IRA)Share in national wellShare in economic zone
External Extraordinary receipts/
grants / aids
Loans and borrowings
Inter-local transfers
Grants (foreign and domestic)National aidsShare from lottoRebates from metro contributions
Foreign (WB, ADB etc)
Domestic (DBP, LBP etc(
Bond Flotation Countryside development fund
Source: ADB. (2014). National Urban Assessment of the PhilippinesADB: Asian Development Bank, DBP= Development Bank of the Philippines, LBP= Land Bank of the Philippines, WB=World Bank
36 | Financing for Resilient and Green Urban Solutions in Cebu, Philippines
The Initiative on Financing for Resilient and Green Urban Global Solutions (FRUGS)
Meanwhile, to provide the mandated basic services, LGUs are responsible for spending on the following: health and social services, agriculture, environmental protection and management, infrastructure, tourism and regulatory functions. However, expenditures are reported based on the following categories: general public services, social services, economic services, and debt services.
It is important to note though that debt servicing shall not exceed 20% of the regular income of the borrowing LGU. Under ex-ante rules, the DOF/BLGF certifies debt service ceilings and net borrowing capacity of LGUs while the Monetary Board issues an opinion on the monetary and balance of payments implications of every proposed borrowing. The certification on an LGU’s borrowing capacity is only valid for one year.
1.7 Municipal Revenue and Expenditure by Categories
Following the discussion on the municipal financial system in the Philippines, this section attempts to discuss actual municipal revenue and expenditures. While LGUs have mandated revenues and expenditures, these vary based on the results of city planning, investment programming, and overall revenue administration. Nationally, these are under the oversight of the National Economic Development Authority (NEDA), the Department of Budget and Management (DBM), and DOF, where the latter covers BLGF. Through the Joint Memorandum Circular on Harmonization of Local Planning, there have been efforts to synchronize local planning with the budget calendar. Following development and investment plans, it aims to ensure there are corresponding budgetary requirements to implement such projects.
36 Liu, L., Llanto, G. and Petersen, J. (2013). “The Philippines: Recent Developments in the Subnational Government
Debt Markets.” In “Until Debt Do Us Part.” World Bank: Washington, D.C. USA. 37 Bureau of Local Government Finance. (2016). “Statement of Receipts and Expenditures CY 2015.” Retrieved from
http://blgf.gov.ph/lgu-fiscal-data/
Although technically the LGC does not set a limit to outstanding debt amounts, the LGC sets a limit to the debt service ratio vis-à-vis an LGU’s income. DOF’s BLGF defines an LGU’s regular income as the “debt service and debt capacity calculations as the combined total of the three-year average of Locally Own Sources Income, the IRA payments estimated by the DBM and the three-year average of national wealth payments. The total gives the “ARI” or “average regular income.” The (ARI) × (.20) equals the maximum allowable debt service ceiling36. This refers to an example of ex-ante fiscal rule enforced in the Philippines.
Revenue sources for local governments nationwide are comprised of local and external. Per LGC mandate, LGUs have both tax and non-tax revenues. In 2015, both accounted for 24.9 % of LGU’s total operating income. However, for Cebu City, its local revenues accounted for 23% of its income in 2015. Meanwhile, nationwide, 66% of LGU revenue came from external sources such as the internal revenue allotment from the national government, shares from national tax collection, other transfers and grants and donations. Kindy note that nationwide, only 2.1% of total LGU revenue in 2015 came from aid. This refers to accounts from domestic and foreign grants and donations, other subsidy income such as those from government-owned corporations, foreign exchange, asset sale, and investment sale gains, and premium bonds payable. As for Cebu City, its external revenue accounted for 77% of total revenues in 2015, with 65% coming from extraordinary receipts, grants, donations and aid. See table 15 for a general breakdown37. As such, municipal revenue is still mostly generated through external sources and that there is room to further enhance the LGUs revenue-making functions.
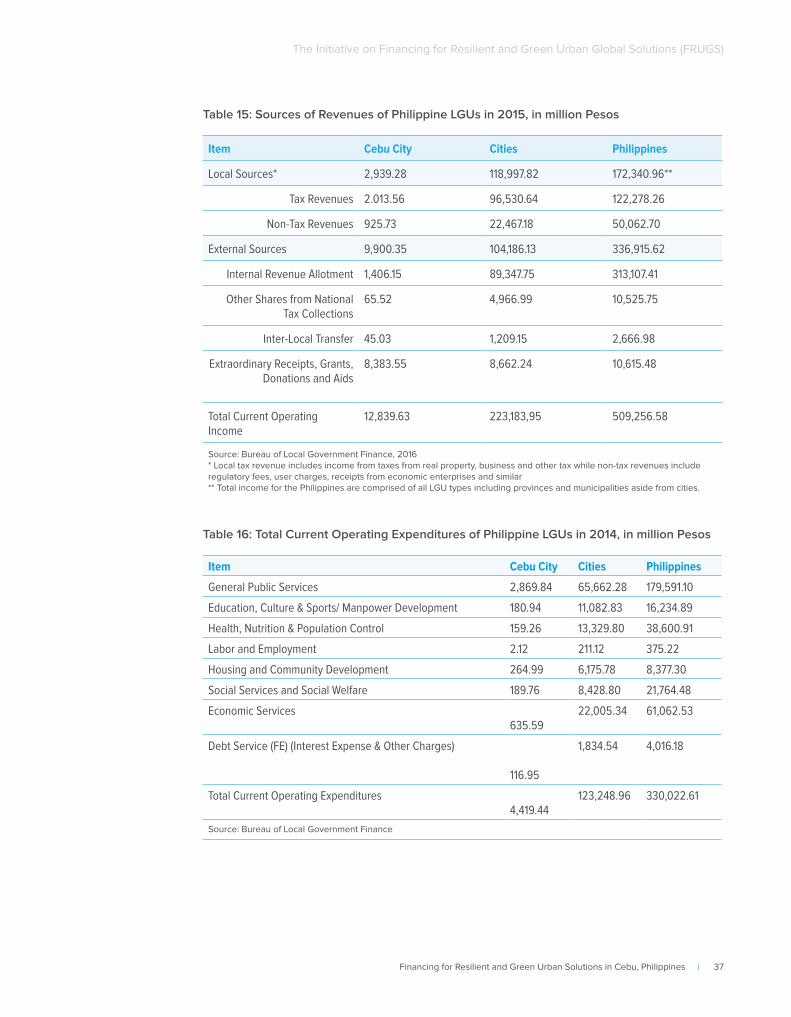
Financing for Resilient and Green Urban Solutions in Cebu, Philippines | 37
The Initiative on Financing for Resilient and Green Urban Global Solutions (FRUGS)
Table 15: Sources of Revenues of Philippine LGUs in 2015, in million Pesos
Item Cebu City Cities Philippines
Local Sources* 2,939.28 118,997.82 172,340.96**
Tax Revenues 2.013.56 96,530.64 122,278.26
Non-Tax Revenues 925.73 22,467.18 50,062.70
External Sources 9,900.35 104,186.13 336,915.62
Internal Revenue Allotment 1,406.15 89,347.75 313,107.41
Other Shares from National Tax Collections
65.52 4,966.99 10,525.75
Inter-Local Transfer 45.03 1,209.15 2,666.98
Extraordinary Receipts, Grants, Donations and Aids
8,383.55 8,662.24 10,615.48
Total Current Operating Income
12,839.63 223,183,95 509,256.58
Source: Bureau of Local Government Finance, 2016* Local tax revenue includes income from taxes from real property, business and other tax while non-tax revenues include regulatory fees, user charges, receipts from economic enterprises and similar ** Total income for the Philippines are comprised of all LGU types including provinces and municipalities aside from cities.
Table 16: Total Current Operating Expenditures of Philippine LGUs in 2014, in million Pesos
Item Cebu City Cities Philippines
General Public Services 2,869.84 65,662.28 179,591.10
Education, Culture & Sports/ Manpower Development 180.94 11,082.83 16,234.89
Health, Nutrition & Population Control 159.26 13,329.80 38,600.91
Labor and Employment 2.12 211.12 375.22
Housing and Community Development 264.99 6,175.78 8,377.30
Social Services and Social Welfare 189.76 8,428.80 21,764.48
Economic Services 635.59
22,005.34 61,062.53
Debt Service (FE) (Interest Expense & Other Charges)
116.95
1,834.54 4,016.18
Total Current Operating Expenditures4,419.44
123,248.96 330,022.61
Source: Bureau of Local Government Finance
38 | Financing for Resilient and Green Urban Solutions in Cebu, Philippines
The Initiative on Financing for Resilient and Green Urban Global Solutions (FRUGS)
Although only gathered through news reports instead of official government data, Cebu City is supposed to have surpassed its target revenue collection for 2016. From January to September 2016, the City Treasurer’s Office already collected PhP 7.16 billion with only a target of PhP 6.45 billion for the year. Total tax revenue in 2016 so far has been PhP 2.2 billion of which, PhP 745 million was from real property taxes, PhP 236 million from special education funds and PhP 1.2 billion from business and other taxes. Another PhP 3.2 billion was earned through the sale of South Road Property (SRP) lots. As such, Cebu City has a high rate of local revenue compared to other local governments.
For 2017, city tax revenues form part of the envisioned fund sources. This will be enhanced through a planned tax mapping exercise to collect more revenues. The city government also hopes to raise PhP 5.8 billion through other sources such as business and real property taxes as well as another PhP 1 billion from non-tax revenues. As regards external sources, the city government expects to receive PhP 1.8 billion, with about PhP 1.6 billion from IRA and another PhP 115 million from its Ecozone shares38.
1.8 Financing Sources and Flows for Housing, Infrastructure, and Urban Services
While the local government code provided financing sources to LGUs for the provision of basic services, Philippine laws also provide specific sources for housing, as well as more specific mechanisms to finance infrastructure and urban services. Succeeding discussions would focus only on the study’s scope of low-income (less than 50% of national median income), lower and middle income housing, excluding slum-upgrading and similar initiatives.
38 Cuizon, R. (2016). Treasurer’s office ‘surpasses’ target collection. Retrieved from http://www.sunstar.com.ph/cebu/local-news/2016/10/26/treasurers-office-surpasses-target-collection-505746
As regards housing financing, it is important to remember the actors involved in the industry. There are government institutions, private developers, and the homeowner – the end user. The succeeding paragraphs will discuss housing finance sources based on the three actors.
For end-users or homeowners, EO 90 also prescribed support agencies to ensure long-term housing loans are available on a self-sustaining basis. Although their operations have changed through the decades, there are three support agencies with the following mandates:
• Government Service Insurance System – GSIS is the primary provider of funds for long-term housing mortgages for low and middle-income government employees.
• Social Security System – The SSS is the primary provider of funds for long-term housing mortgages and pension for low and middle-income private sector employees.
• Home Development Mutual Fund also known as the Pag-Ibig Fund – The HDMF administers provident fund contributions collected from member employees and employers, utilizing funds not required for provident benefits for housing loans for members that are lower-than-market interest rates and longer term, and, charges the development of saving schemes for home acquisition by private and government employees. It has quite a menu of instruments both for business as usual built code and has recently released green finance incentives. These instruments will be discussed in Chapter 4 of this study.
While GSIS membership is mandatory for government employees, at different points in history, Pag-Ibig membership was not compulsory for private sector employees. In 1995 however, RA 7742 made contributions to
Financing for Resilient and Green Urban Solutions in Cebu, Philippines | 39
The Initiative on Financing for Resilient and Green Urban Global Solutions (FRUGS)
both SSS and Pag-Ibig mandatory for private sector employees. In recent years, both Pag-Ibig and SSS have become more flexible allowing voluntary and self-employed members to contribute and take out loans. This change has been most beneficial to those with informal income streams, retirees, and overseas Filipino workers (OFWs). Pag-Ibig loans have maturity duration of 5 to 30 years with interest rates varying based on the amounts borrowed and capacity to pay.
Directly beneficial to government institutions, another key legislation related to housing finance is the Comprehensive and Integrated Shelter and Finance Act (CISFA) enacted in 1994. CISFA envisioned to regularize the yearly increase of appropriation of the major components of the national shelter program, augmented the authorized capital stock and paid-up capital of NHMFC and H (I) GC, and identify other means of mobilizing funds for housing.
UDHA of 1992 also featured financing schemes such as leasehold right and usufruct contracts. While UDHA affirmed HUDCC’s role as policy coordinator for the housing sector, it also included some provisions for housing finance for low and middle income housing:
• The Home Guaranty Corporation (HGC) currently provides the following:
• Extension of government development loans and retail loan guarantees to parties like government financial institutions, social security and housing loan agencies, and their accredited institutions;
• Exemption of accredited institutions from gross receipt tax and even income taxes for interest incomes net of guarantee payments;
• Exemption of banks from single borrower limits imposed on net worth and exemption of developers from the 70% collateral cover for its loans.
The HGC Act of 2000 provided recapitalization of PhP 12 million and provided capacity for guarantee cover that is equivalent to 20 times its equity. As of 2012, it had only capitalized PhP13.57 billion. Its guarantee fee ranges from 1.5% to 2.5% premium payment depending on the guarantee coverage and the type of loan package but not adjusted to the risk profile of the borrower and the kind of loan being guaranteed unlike Pag-Ibig loans. This recapitalization allowed the HGC to assure lenders and investors through issuance of loan and securitization guarantees to banks and other financial institutions. The banks can then lend to individuals and housing developers.
• The National Home Mortgage Finance Corporation’s main function is to operate a viable home mortgage market and attract private and public institutional funds into long-term housing mortgages.
For the private sector, primarily real estate developers:
• The Board of Investments (BOI), as mandated by EO 226, annually issues a list of industries included in the investment priorities plan (IPP) entitled to income tax holidays (ITH). The mass housing industry included covering vertical or horizontal developments with more than 20 units. This is intended to lower the unit production cost of housing benefitting end-users.
In a study commissioned by SHDA in 2012, estimates were made on the impact of the tax holiday on the housing shortage (see Table 17.)
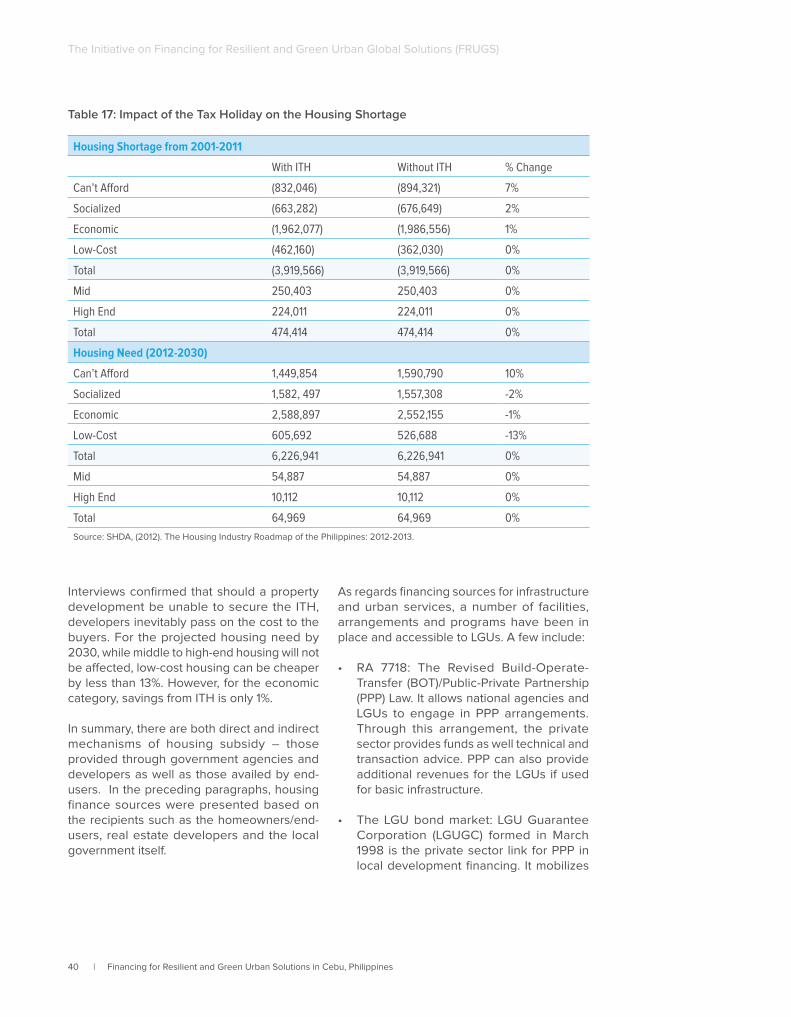
40 | Financing for Resilient and Green Urban Solutions in Cebu, Philippines
The Initiative on Financing for Resilient and Green Urban Global Solutions (FRUGS)
Table 17: Impact of the Tax Holiday on the Housing Shortage
Housing Shortage from 2001-2011
With ITH Without ITH % Change
Can’t Afford (832,046) (894,321) 7%
Socialized (663,282) (676,649) 2%
Economic (1,962,077) (1,986,556) 1%
Low-Cost (462,160) (362,030) 0%
Total (3,919,566) (3,919,566) 0%
Mid 250,403 250,403 0%
High End 224,011 224,011 0%
Total 474,414 474,414 0%
Housing Need (2012-2030)
Can’t Afford 1,449,854 1,590,790 10%
Socialized 1,582, 497 1,557,308 -2%
Economic 2,588,897 2,552,155 -1%
Low-Cost 605,692 526,688 -13%
Total 6,226,941 6,226,941 0%
Mid 54,887 54,887 0%
High End 10,112 10,112 0%
Total 64,969 64,969 0%
Source: SHDA, (2012). The Housing Industry Roadmap of the Philippines: 2012-2013.
Interviews confirmed that should a property development be unable to secure the ITH, developers inevitably pass on the cost to the buyers. For the projected housing need by 2030, while middle to high-end housing will not be affected, low-cost housing can be cheaper by less than 13%. However, for the economic category, savings from ITH is only 1%.
In summary, there are both direct and indirect mechanisms of housing subsidy – those provided through government agencies and developers as well as those availed by end-users. In the preceding paragraphs, housing finance sources were presented based on the recipients such as the homeowners/end-users, real estate developers and the local government itself.
As regards financing sources for infrastructure and urban services, a number of facilities, arrangements and programs have been in place and accessible to LGUs. A few include:
• RA 7718: The Revised Build-Operate-Transfer (BOT)/Public-Private Partnership (PPP) Law. It allows national agencies and LGUs to engage in PPP arrangements. Through this arrangement, the private sector provides funds as well technical and transaction advice. PPP can also provide additional revenues for the LGUs if used for basic infrastructure.
• The LGU bond market: LGU Guarantee Corporation (LGUGC) formed in March 1998 is the private sector link for PPP in local development financing. It mobilizes
Financing for Resilient and Green Urban Solutions in Cebu, Philippines | 41
The Initiative on Financing for Resilient and Green Urban Global Solutions (FRUGS)
the resources of private sector financial institutions through credit enhancement to fund local development projects in the capital market.39 It also extends its guarantees to water districts, cooperatives, educational institutions and renewable energy projects.
• Private Financial Institutions (PFIs). Although it can provide investment services, LGUs cannot use PFIs as their depository bank. LGUs may undertake loans with PFIs with LGUGC guarantee. However, through co-financing with the private sector units of development banks, LGUs may have a role in facilitating PFI loans for LGUs. Another option would be through the Department of Finance’ Municipal Development Fund Office (MDFO). Its products also reflect specific funds such as conduit for private sector financing
• Government Financial Institutions (GFIs) – GFIs can lend to credit-worthy LGUs, develop co-financing arrangements or referrals with private banks and provide technical advice for credit worthiness enhancement. It also has an advantage of being the LGUs’ depositor bank. For example, Land Bank’s Official Development Assistance (ODA) Facilities, DBP’s ODA Facilities – Green Financing Program and the Residential Real Estate Financing Program (RRFP) aim to provide accessible financing for shelter production and secure tenure delivery. Majority of the LGUs loans are with GFIs, even those from ODA.
• Official Development Assistance for technical assistance (TA) and financing – PPP structuring and transaction advisory; credit enhancements for PFI lending for urban services; capacity development for fiscal management
• Central to local fiscal transfers – Aside from those mandated by the LGC, there are other financing sources that could be used
39 LGUGC. (2016). About LGUGC. Retrieved from http://www.lgugc.com/about.html
40 Bureau of Local Government Finance. (2016). Locally Sourced Revenue Dependency, FY 2011-2015. 41 Bureau of Local Government Finance. (2016). Other Shares from National Tax Dependency, FY 2011-2015
for infrastructure and urban services. One example is DILG’s Performance Challenge Fund where cash incentives are provided to LGUs who qualify based on set criteria.
To summarize, LGUs can access financing for housing and basic infrastructure projects from the following, including special funds:
1. National Government
• Sector ministries
• Financing from key-housing agencies (NHA, HGC, HDMF, NHMFC)
• Lending program from government banks
• Presidential Funds
• DOF-BLGF Municipal Development Fund
2. Local Government
• Local appropriations for housing
• Savings
• Special sources of revenue
• Bond flotation
• Calamity funds and other special funds
3. Other Sources
• Official Development Assistance
• Non-government organizations such as Habitat for Humanity or Gawad Kalinga
• Private financial institutions
Cebu City’s dependency on locally sourced revenue from 2011 to 2015 has increased year on year. From 56.88% in 2011, dependence on locally sourced revenue has increased to 60.93% in 201540. Meanwhile, for the same period, dependency on shares of national tax was also increasing from 2011 to 2014, at 1.30% and 3.10% respectively, only to decline in 2015 at 1.71%41. In 2014, Cebu City’s total current operating income from all sources amounted to PhP 4,689.83 billion, increasing
42 | Financing for Resilient and Green Urban Solutions in Cebu, Philippines
The Initiative on Financing for Resilient and Green Urban Global Solutions (FRUGS)
to Php 12,839.63 in 2015. The spike came from extra-ordinary receipts and grants. The total current operating expenditures in 2014 amounted to PhP 3, 483.88 and increased to PhP 4,419.44 in 2015. These included
expenses related to general public services, housing and community development, labor and employment as well as debt servicing. For a complete breakdown, see Annex 6 on Statement of Receipts and Expenditures.
Financing for Resilient and Green Urban Solutions in Cebu, Philippines | 43
The Initiative on Financing for Resilient and Green Urban Global Solutions (FRUGS)
Chapter 2
Financing Needs and Status for Housing, Infrastructure, and Urban Services
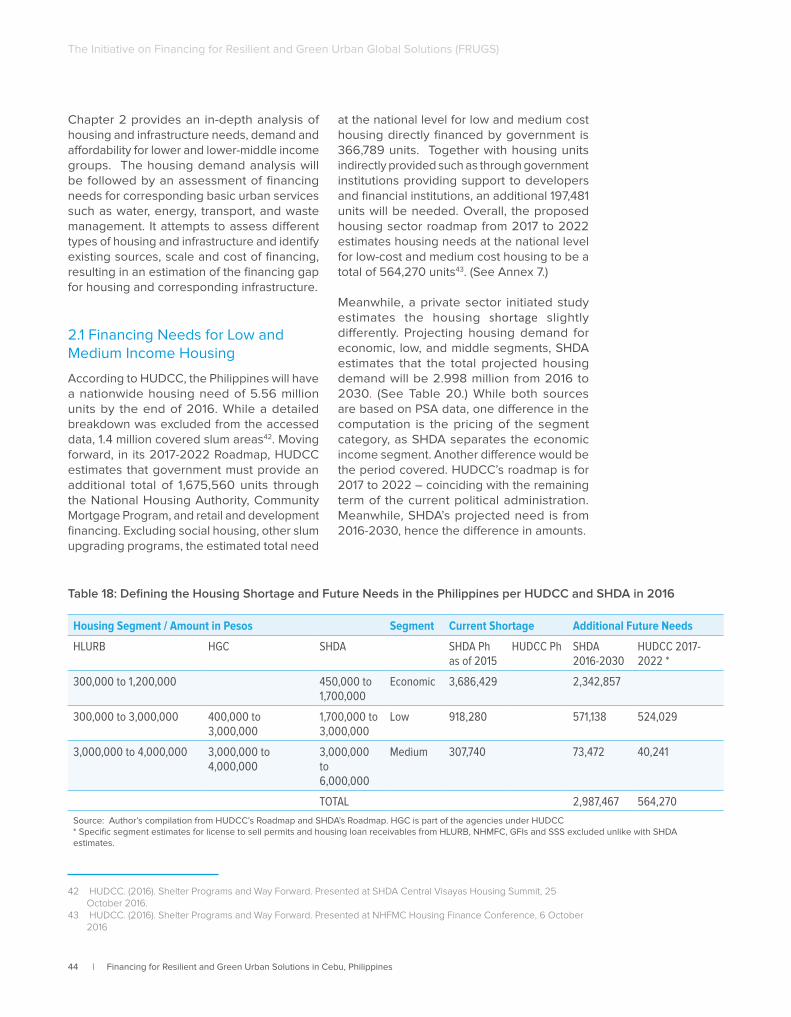
44 | Financing for Resilient and Green Urban Solutions in Cebu, Philippines
The Initiative on Financing for Resilient and Green Urban Global Solutions (FRUGS)
Chapter 2 provides an in-depth analysis of housing and infrastructure needs, demand and affordability for lower and lower-middle income groups. The housing demand analysis will be followed by an assessment of financing needs for corresponding basic urban services such as water, energy, transport, and waste management. It attempts to assess different types of housing and infrastructure and identify existing sources, scale and cost of financing, resulting in an estimation of the financing gap for housing and corresponding infrastructure.
2.1 Financing Needs for Low and Medium Income Housing
According to HUDCC, the Philippines will have a nationwide housing need of 5.56 million units by the end of 2016. While a detailed breakdown was excluded from the accessed data, 1.4 million covered slum areas42. Moving forward, in its 2017-2022 Roadmap, HUDCC estimates that government must provide an additional total of 1,675,560 units through the National Housing Authority, Community Mortgage Program, and retail and development financing. Excluding social housing, other slum upgrading programs, the estimated total need
42 HUDCC. (2016). Shelter Programs and Way Forward. Presented at SHDA Central Visayas Housing Summit, 25 October 2016.
43 HUDCC. (2016). Shelter Programs and Way Forward. Presented at NHFMC Housing Finance Conference, 6 October 2016
at the national level for low and medium cost housing directly financed by government is 366,789 units. Together with housing units indirectly provided such as through government institutions providing support to developers and financial institutions, an additional 197,481 units will be needed. Overall, the proposed housing sector roadmap from 2017 to 2022 estimates housing needs at the national level for low-cost and medium cost housing to be a total of 564,270 units43. (See Annex 7.)
Meanwhile, a private sector initiated study estimates the housing shortage slightly differently. Projecting housing demand for economic, low, and middle segments, SHDA estimates that the total projected housing demand will be 2.998 million from 2016 to 2030. (See Table 20.) While both sources are based on PSA data, one difference in the computation is the pricing of the segment category, as SHDA separates the economic income segment. Another difference would be the period covered. HUDCC’s roadmap is for 2017 to 2022 – coinciding with the remaining term of the current political administration. Meanwhile, SHDA’s projected need is from 2016-2030, hence the difference in amounts.
Table 18: Defining the Housing Shortage and Future Needs in the Philippines per HUDCC and SHDA in 2016
Housing Segment / Amount in Pesos Segment Current Shortage Additional Future Needs
HLURB HGC SHDA SHDA Ph as of 2015
HUDCC Ph SHDA2016-2030
HUDCC 2017-2022 *
300,000 to 1,200,000 450,000 to 1,700,000
Economic 3,686,429 2,342,857
300,000 to 3,000,000 400,000 to 3,000,000
1,700,000 to 3,000,000
Low 918,280 571,138 524,029
3,000,000 to 4,000,000 3,000,000 to 4,000,000
3,000,000 to 6,000,000
Medium 307,740 73,472 40,241
TOTAL 2,987,467 564,270
Source: Author’s compilation from HUDCC’s Roadmap and SHDA’s Roadmap. HGC is part of the agencies under HUDCC* Specific segment estimates for license to sell permits and housing loan receivables from HLURB, NHMFC, GFIs and SSS excluded unlike with SHDA estimates.
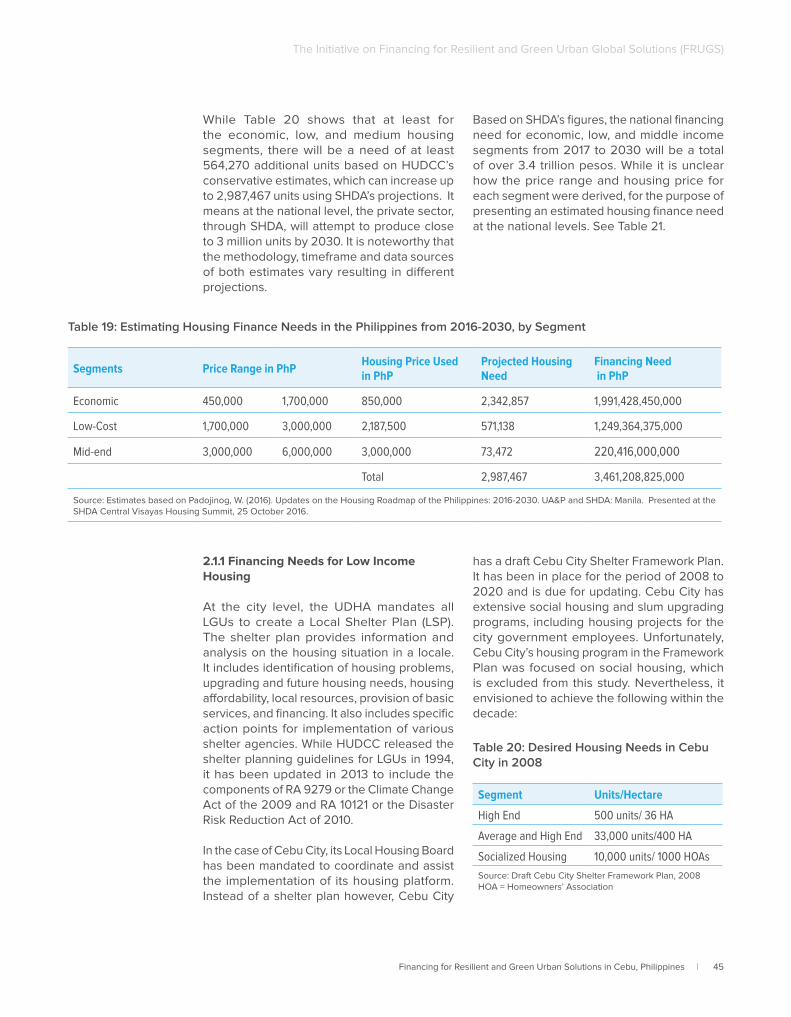
Financing for Resilient and Green Urban Solutions in Cebu, Philippines | 45
The Initiative on Financing for Resilient and Green Urban Global Solutions (FRUGS)
While Table 20 shows that at least for the economic, low, and medium housing segments, there will be a need of at least 564,270 additional units based on HUDCC’s conservative estimates, which can increase up to 2,987,467 units using SHDA’s projections. It means at the national level, the private sector, through SHDA, will attempt to produce close to 3 million units by 2030. It is noteworthy that the methodology, timeframe and data sources of both estimates vary resulting in different projections.
Based on SHDA’s figures, the national financing need for economic, low, and middle income segments from 2017 to 2030 will be a total of over 3.4 trillion pesos. While it is unclear how the price range and housing price for each segment were derived, for the purpose of presenting an estimated housing finance need at the national levels. See Table 21.
Table 19: Estimating Housing Finance Needs in the Philippines from 2016-2030, by Segment
Segments Price Range in PhP Housing Price Used in PhP
Projected Housing Need
Financing Need in PhP
Economic 450,000 1,700,000 850,000 2,342,857 1,991,428,450,000
Low-Cost 1,700,000 3,000,000 2,187,500 571,138 1,249,364,375,000
Mid-end 3,000,000 6,000,000 3,000,000 73,472 220,416,000,000
Total 2,987,467 3,461,208,825,000
Source: Estimates based on Padojinog, W. (2016). Updates on the Housing Roadmap of the Philippines: 2016-2030. UA&P and SHDA: Manila. Presented at the SHDA Central Visayas Housing Summit, 25 October 2016.
2.1.1 Financing Needs for Low Income Housing
At the city level, the UDHA mandates all LGUs to create a Local Shelter Plan (LSP). The shelter plan provides information and analysis on the housing situation in a locale. It includes identification of housing problems, upgrading and future housing needs, housing affordability, local resources, provision of basic services, and financing. It also includes specific action points for implementation of various shelter agencies. While HUDCC released the shelter planning guidelines for LGUs in 1994, it has been updated in 2013 to include the components of RA 9279 or the Climate Change Act of the 2009 and RA 10121 or the Disaster Risk Reduction Act of 2010.
In the case of Cebu City, its Local Housing Board has been mandated to coordinate and assist the implementation of its housing platform. Instead of a shelter plan however, Cebu City
has a draft Cebu City Shelter Framework Plan. It has been in place for the period of 2008 to 2020 and is due for updating. Cebu City has extensive social housing and slum upgrading programs, including housing projects for the city government employees. Unfortunately, Cebu City’s housing program in the Framework Plan was focused on social housing, which is excluded from this study. Nevertheless, it envisioned to achieve the following within the decade:
Table 20: Desired Housing Needs in Cebu City in 2008
Segment Units/Hectare
High End 500 units/ 36 HA
Average and High End 33,000 units/400 HA
Socialized Housing 10,000 units/ 1000 HOAs
Source: Draft Cebu City Shelter Framework Plan, 2008HOA = Homeowners’ Association
46 | Financing for Resilient and Green Urban Solutions in Cebu, Philippines
The Initiative on Financing for Resilient and Green Urban Global Solutions (FRUGS)
Despite not having housing needs and projections for low and middle income segments in the draft shelter framework plan, it included noteworthy strategies and projects useful for this study. These include the following:
• Enhanced capacity of the Local Housing Board on Land and Housing Development Management for sustainable policies and housing initiatives.
• Localization of the UDHA
• Identification of future potential sites for land and housing development
• Established monitoring and evaluation for land and housing development
• Established well-coordinated efforts in monitoring and implementation of the Cebu City +10 Development Strategy on Housing Sector commitment action plan implementation.
• Ensured sustainable fund allocation for land and housing development from various sources
• Strengthened partnership and linkages among government and other partners
To achieve these, Cebu City’s Local Housing Board was created to assist and monitor its delivery. As regards governance, the board had various sub-committees which included one on land valuation and balanced housing.
The Draft Shelter Framework Plan also ensured that the board would explore mobilization of resources via joint venture projects with developers and co-financing projects with civil society and foreign funders. Although there was no accessible assessment of the framework’s implementation, Annex 4 lists housing-related ordinances passed by the Cebu City Council since 2010. Unfortunately, apart from the creation of the local housing board and adoption of the shelter framework, the ordinances were primarily for social housing.
Table 9 shows Cebu City’s household population in 2010 to be 860,942, accounting for 195,461 households. At the time of research, updating the Local Shelter Plan was already included in Cebu City’s Housing Board’s agenda under the current administration. Tentative estimates shared by HUDCC Central Visayas Region reveal that the overall housing need from 2016 to 2024 in Cebu City will be 46,903 units. However, this figure includes all types of segments including homeless and displaced units. Computed based on the Local Shelter Plan Formulation Manual developed by HUDCC and UN-Habitat Philippines, housing needs are estimated based on population growth projections, household size and number of households on the base year. Kindly note that in Table 23, HUDCC has different population figures than those projected by JICA and the UN’s World Urbanization Prospects presented in Chapter 1.
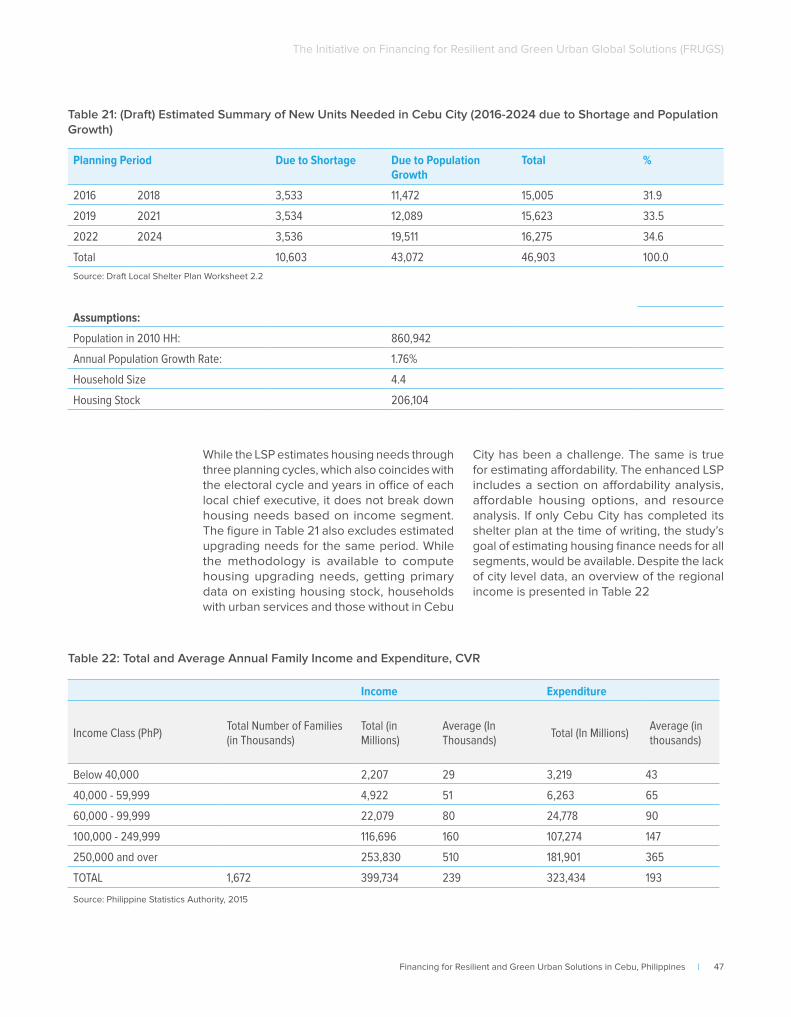
Financing for Resilient and Green Urban Solutions in Cebu, Philippines | 47
The Initiative on Financing for Resilient and Green Urban Global Solutions (FRUGS)
Planning Period Due to Shortage Due to Population Growth
Total %
2016 2018 3,533 11,472 15,005 31.9
2019 2021 3,534 12,089 15,623 33.5
2022 2024 3,536 19,511 16,275 34.6
Total 10,603 43,072 46,903 100.0
Source: Draft Local Shelter Plan Worksheet 2.2
Assumptions:
Population in 2010 HH: 860,942
Annual Population Growth Rate: 1.76%
Household Size 4.4
Housing Stock 206,104
Table 21: (Draft) Estimated Summary of New Units Needed in Cebu City (2016-2024 due to Shortage and Population Growth)
While the LSP estimates housing needs through three planning cycles, which also coincides with the electoral cycle and years in office of each local chief executive, it does not break down housing needs based on income segment. The figure in Table 21 also excludes estimated upgrading needs for the same period. While the methodology is available to compute housing upgrading needs, getting primary data on existing housing stock, households with urban services and those without in Cebu
City has been a challenge. The same is true for estimating affordability. The enhanced LSP includes a section on affordability analysis, affordable housing options, and resource analysis. If only Cebu City has completed its shelter plan at the time of writing, the study’s goal of estimating housing finance needs for all segments, would be available. Despite the lack of city level data, an overview of the regional income is presented in Table 22
Table 22: Total and Average Annual Family Income and Expenditure, CVR
Income Expenditure
Income Class (PhP) Total Number of Families (in Thousands)
Total (in Millions)
Average (In Thousands)
Total (In Millions)Average (in thousands)
Below 40,000 2,207 29 3,219 43
40,000 - 59,999 4,922 51 6,263 65
60,000 - 99,999 22,079 80 24,778 90
100,000 - 249,999 116,696 160 107,274 147
250,000 and over 253,830 510 181,901 365
TOTAL 1,672 399,734 239 323,434 193
Source: Philippine Statistics Authority, 2015
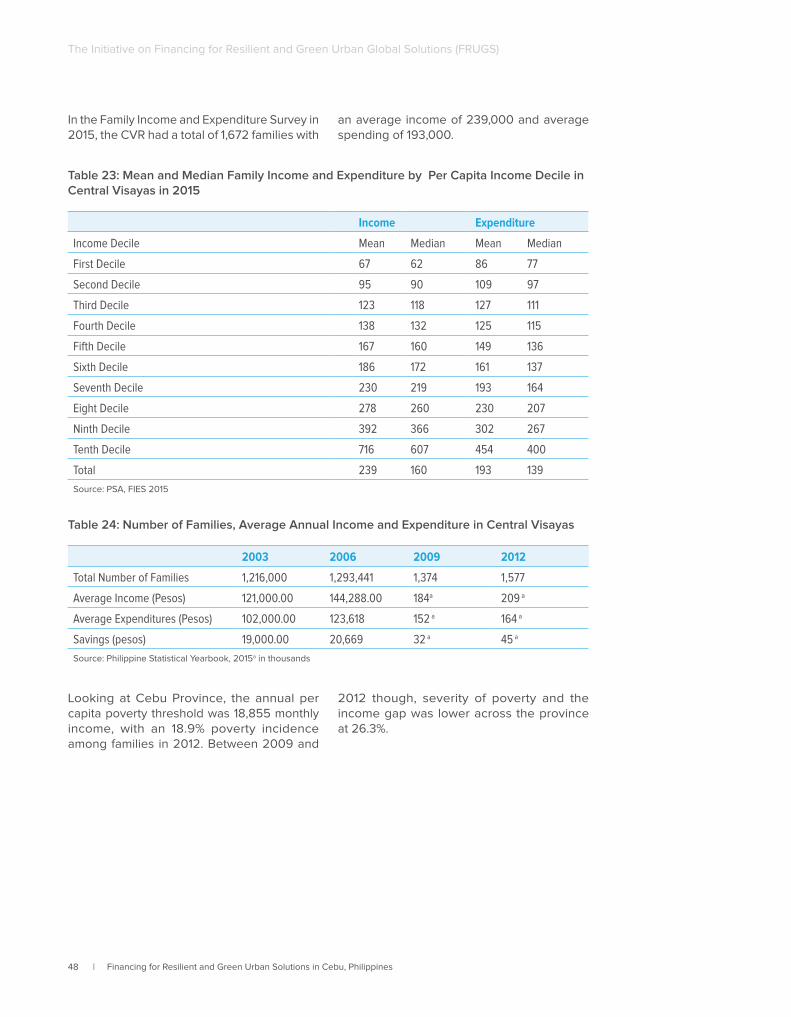
48 | Financing for Resilient and Green Urban Solutions in Cebu, Philippines
The Initiative on Financing for Resilient and Green Urban Global Solutions (FRUGS)
In the Family Income and Expenditure Survey in 2015, the CVR had a total of 1,672 families with
an average income of 239,000 and average spending of 193,000.
Table 23: Mean and Median Family Income and Expenditure by Per Capita Income Decile in Central Visayas in 2015
Income Expenditure
Income Decile Mean Median Mean Median
First Decile 67 62 86 77
Second Decile 95 90 109 97
Third Decile 123 118 127 111
Fourth Decile 138 132 125 115
Fifth Decile 167 160 149 136
Sixth Decile 186 172 161 137
Seventh Decile 230 219 193 164
Eight Decile 278 260 230 207
Ninth Decile 392 366 302 267
Tenth Decile 716 607 454 400
Total 239 160 193 139
Source: PSA, FIES 2015
Table 24: Number of Families, Average Annual Income and Expenditure in Central Visayas
2003 2006 2009 2012
Total Number of Families 1,216,000 1,293,441 1,374 1,577
Average Income (Pesos) 121,000.00 144,288.00 184a 209 a
Average Expenditures (Pesos) 102,000.00 123,618 152 a 164 a
Savings (pesos) 19,000.00 20,669 32 a 45 a
Source: Philippine Statistical Yearbook, 2015a in thousands
Looking at Cebu Province, the annual per capita poverty threshold was 18,855 monthly income, with an 18.9% poverty incidence among families in 2012. Between 2009 and
2012 though, severity of poverty and the income gap was lower across the province at 26.3%.
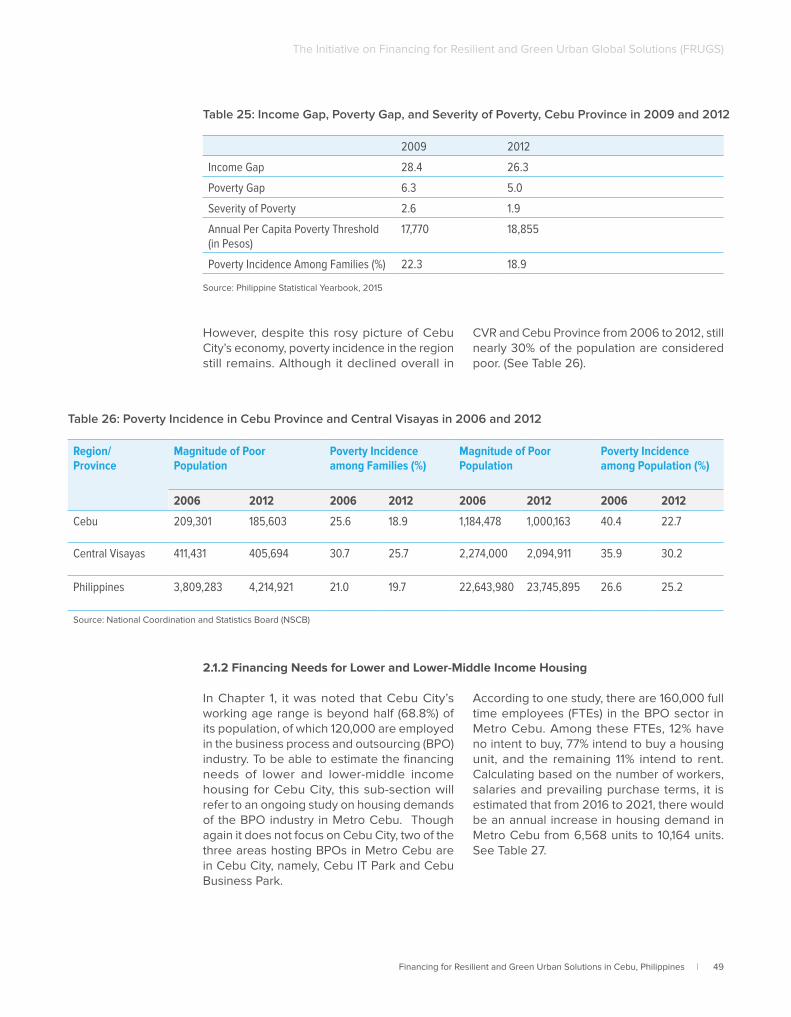
Financing for Resilient and Green Urban Solutions in Cebu, Philippines | 49
The Initiative on Financing for Resilient and Green Urban Global Solutions (FRUGS)
Table 25: Income Gap, Poverty Gap, and Severity of Poverty, Cebu Province in 2009 and 2012
2009 2012
Income Gap 28.4 26.3
Poverty Gap 6.3 5.0
Severity of Poverty 2.6 1.9
Annual Per Capita Poverty Threshold (in Pesos)
17,770 18,855
Poverty Incidence Among Families (%) 22.3 18.9
Source: Philippine Statistical Yearbook, 2015
However, despite this rosy picture of Cebu City’s economy, poverty incidence in the region still remains. Although it declined overall in
CVR and Cebu Province from 2006 to 2012, still nearly 30% of the population are considered poor. (See Table 26).
Table 26: Poverty Incidence in Cebu Province and Central Visayas in 2006 and 2012
Region/Province
Magnitude of Poor Population
Poverty Incidence among Families (%)
Magnitude of Poor Population
Poverty Incidence among Population (%)
2006 2012 2006 2012 2006 2012 2006 2012
Cebu 209,301 185,603 25.6 18.9 1,184,478 1,000,163 40.4 22.7
Central Visayas 411,431 405,694 30.7 25.7 2,274,000 2,094,911 35.9 30.2
Philippines 3,809,283 4,214,921 21.0 19.7 22,643,980 23,745,895 26.6 25.2
Source: National Coordination and Statistics Board (NSCB)
2.1.2 Financing Needs for Lower and Lower-Middle Income Housing
In Chapter 1, it was noted that Cebu City’s working age range is beyond half (68.8%) of its population, of which 120,000 are employed in the business process and outsourcing (BPO) industry. To be able to estimate the financing needs of lower and lower-middle income housing for Cebu City, this sub-section will refer to an ongoing study on housing demands of the BPO industry in Metro Cebu. Though again it does not focus on Cebu City, two of the three areas hosting BPOs in Metro Cebu are in Cebu City, namely, Cebu IT Park and Cebu Business Park.
According to one study, there are 160,000 full time employees (FTEs) in the BPO sector in Metro Cebu. Among these FTEs, 12% have no intent to buy, 77% intend to buy a housing unit, and the remaining 11% intend to rent. Calculating based on the number of workers, salaries and prevailing purchase terms, it is estimated that from 2016 to 2021, there would be an annual increase in housing demand in Metro Cebu from 6,568 units to 10,164 units. See Table 27.
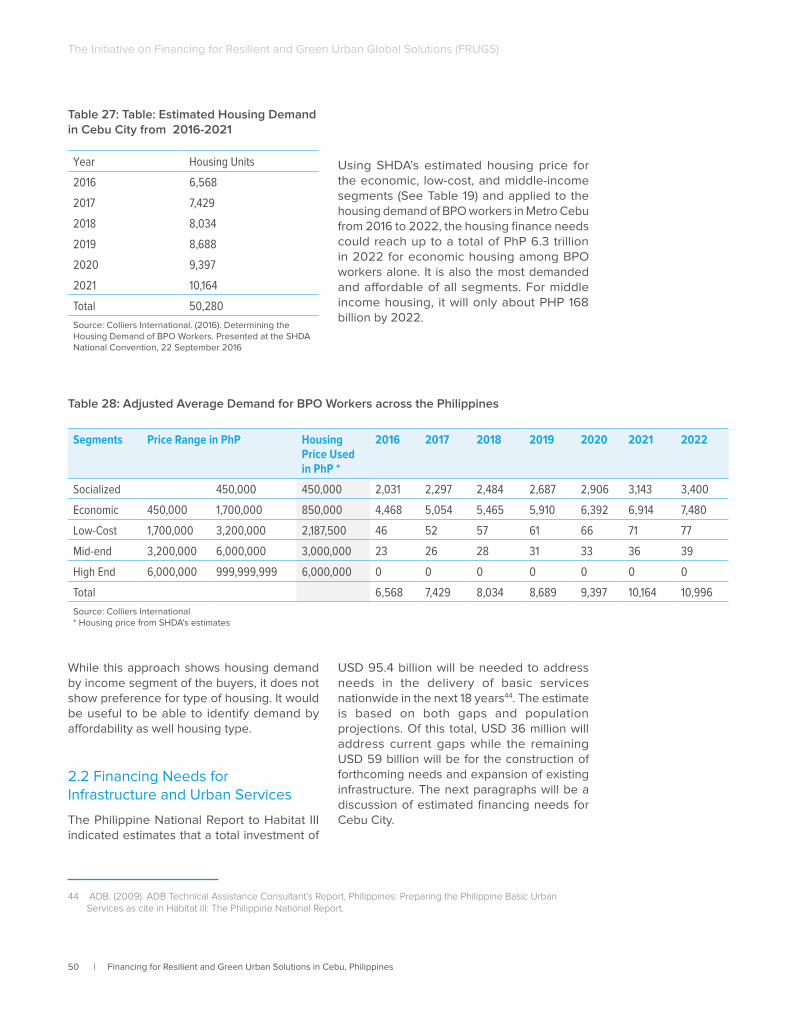
50 | Financing for Resilient and Green Urban Solutions in Cebu, Philippines
The Initiative on Financing for Resilient and Green Urban Global Solutions (FRUGS)
Table 27: Table: Estimated Housing Demand in Cebu City from 2016-2021
Year Housing Units
2016 6,568
2017 7,429
2018 8,034
2019 8,688
2020 9,397
2021 10,164
Total 50,280
Source: Colliers International. (2016). Determining the Housing Demand of BPO Workers. Presented at the SHDA National Convention, 22 September 2016
Using SHDA’s estimated housing price for the economic, low-cost, and middle-income segments (See Table 19) and applied to the housing demand of BPO workers in Metro Cebu from 2016 to 2022, the housing finance needs could reach up to a total of PhP 6.3 trillion in 2022 for economic housing among BPO workers alone. It is also the most demanded and affordable of all segments. For middle income housing, it will only about PHP 168 billion by 2022.
Table 28: Adjusted Average Demand for BPO Workers across the Philippines
Segments Price Range in PhP Housing Price Used in PhP *
2016 2017 2018 2019 2020 2021 2022
Socialized 450,000 450,000 2,031 2,297 2,484 2,687 2,906 3,143 3,400
Economic 450,000 1,700,000 850,000 4,468 5,054 5,465 5,910 6,392 6,914 7,480
Low-Cost 1,700,000 3,200,000 2,187,500 46 52 57 61 66 71 77
Mid-end 3,200,000 6,000,000 3,000,000 23 26 28 31 33 36 39
High End 6,000,000 999,999,999 6,000,000 0 0 0 0 0 0 0
Total 6,568 7,429 8,034 8,689 9,397 10,164 10,996
Source: Colliers International * Housing price from SHDA’s estimates
While this approach shows housing demand by income segment of the buyers, it does not show preference for type of housing. It would be useful to be able to identify demand by affordability as well housing type.
2.2 Financing Needs for Infrastructure and Urban Services
The Philippine National Report to Habitat III indicated estimates that a total investment of
44 ADB. (2009). ADB Technical Assistance Consultant’s Report, Philippines: Preparing the Philippine Basic Urban Services as cite in Habitat III: The Philippine National Report.
USD 95.4 billion will be needed to address needs in the delivery of basic services nationwide in the next 18 years44. The estimate is based on both gaps and population projections. Of this total, USD 36 million will address current gaps while the remaining USD 59 billion will be for the construction of forthcoming needs and expansion of existing infrastructure. The next paragraphs will be a discussion of estimated financing needs for Cebu City.
Financing for Resilient and Green Urban Solutions in Cebu, Philippines | 51
The Initiative on Financing for Resilient and Green Urban Global Solutions (FRUGS)
2.2.1 Financing Needs for Transport
The Cebu City Planning and Development Office and the City Traffic Operations Management (CITOM) are responsible for city transport planning. However, as a component city of Metro Cebu, Cebu City’s transport system is linked to the broader network of the other LGUs. Public transport comprises about 80% share in Cebu City’s traffic. Modes of transport include public utility vehicles such as jeepneys and mini-buses, taxis, vehicles for hire and motorized tricycles. These are the modes that take visitors, residents, employees and students through, to and from Cebu City. It is noteworthy to account for the effect of in-flows to Cebu City’s transportation capacity as well. Interviews noted that the vertical expansion of residential areas and the mandatory parking/occupant ratio significantly increases in-city traffic. Similarly, the lack of housing in Cebu City or the availability of jobs in the city makes the in-flow of traffic from other neighboring LGUs also a cause for concern.
Although under the administrative area of the city government, some land and infrastructure are either owned or managed by the provincial or even national government. Cebu City has 28 national bridges within its boundaries. At the development of the city’s master plan in the 1990s, the roads and bridges in the city still satisfactorily served its fundamental functions for public and private commuters. However, this is contrary to the results of an undated study no later than 2006 entitled “Metro Cebu: Integrating Land Use and Transport Development.” It noted challenges such as poor road network, increasing motorization, traffic congestion, low service levels of public transport, and decrease in public transport patronage prevail in Cebu City45. Since 1995, the Metro Cebu Development Plan has had three phases with phase 1 amounting to 2.027B yen loan, phase 2 amounting to 3.652 B yen
45 NCTS. (Undated.) Metro Cebu: Integrating Land Use and Transport Development. University of the Philippines: Manila.
46 Tan, L. (2016). Waze: Cebu is worst in the world for drivers. Retrieved from http://cnnphilippines.com/news/2016/09/15/Cebu-Metro-Manila-Philippines-traffic-Waze.html
47 Cuizon, R. (2016). Cebu City Mayor Says Presidential Assistant Might Push to Shelve BRT Project. Retrieved from http://www.sunstar.com.ph/cebu/local-news/2016/10/11/cebu-city-mayor-says-presidential-assistant-might-push-shelve-brt-project
loan, and phase 3 with two components, 24.521 B loan for the Cebu-South Coastal Road and 6,420 B yen for the South Road Properties, which are ongoing until now. Providing a historical account of traffic management in Cebu City and the consequent initiatives of Metro Cebu and the Cebu CITOM Board, it noted the shift from previous close-to-market rates from multilateral bank loans to more reasonable JBIC loans.
Interviewees, who were likewise residents, expressed dismay with the worsening traffic and travel time within Cebu City and to and coming from the other LGUs. Cab drivers even lamented that as long as the location is a residential area, traffic from private vehicles is expected. Navigation app Waze has even rated Cebu City as the worst urban area to be a driver at in 201546. These have been echoed in countless news articles, more recently calling for Presidential emergency powers. Although a Php 10.6 billion Bus-Rapid-Transport System in Cebu City is envisioned to be operational in 2017 as committed and undertaken by the previously elected city officials and continued in the present, the politically appointed Presidential Assistant covering Cebu City prefers rail transport. He has a proposed a 170 million Php transport study for Cebu. This echoes the President’s statements on bringing rail to Cebu. 47
As regards transport infrastructure in residential areas, the UDHA mandates that LGUs should provide basic services, including transport for socialized housing and resettlement areas. As regards higher income housing, the UDHA also mandates that the LGU, together with related government agencies, should incentivize the private sector to support the development of a viable transport system.
Under the clustered and regional development growth approach, “The Roadmap Study for
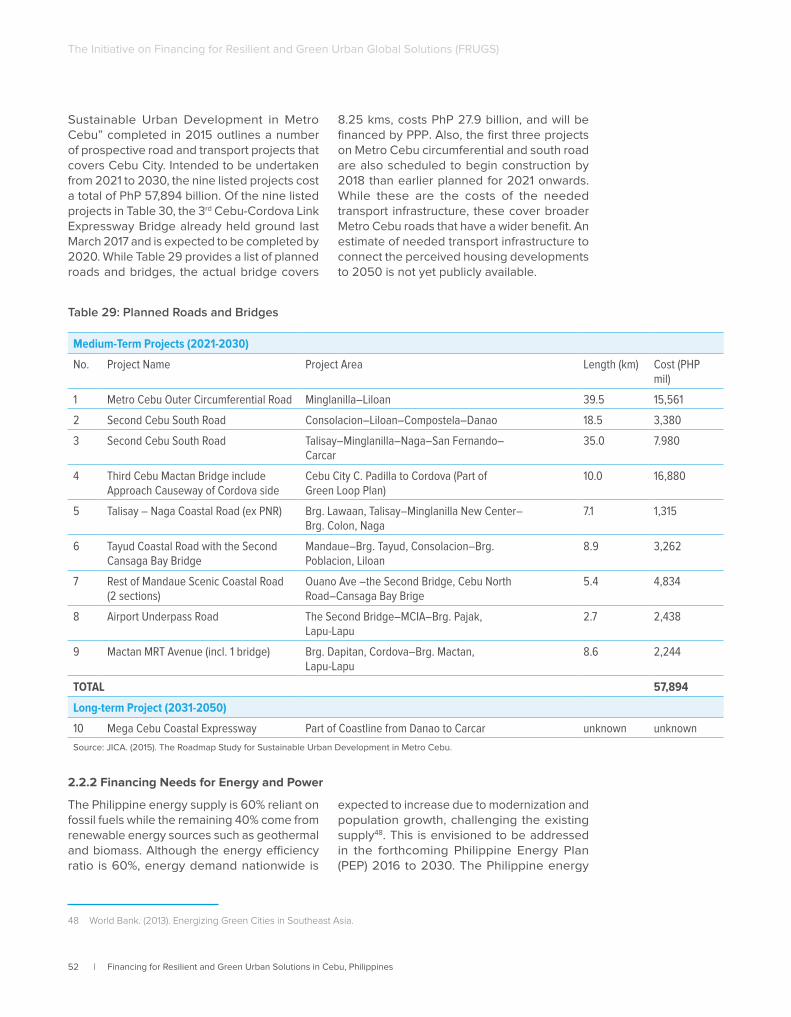
52 | Financing for Resilient and Green Urban Solutions in Cebu, Philippines
The Initiative on Financing for Resilient and Green Urban Global Solutions (FRUGS)
Sustainable Urban Development in Metro Cebu” completed in 2015 outlines a number of prospective road and transport projects that covers Cebu City. Intended to be undertaken from 2021 to 2030, the nine listed projects cost a total of PhP 57,894 billion. Of the nine listed projects in Table 30, the 3rd Cebu-Cordova Link Expressway Bridge already held ground last March 2017 and is expected to be completed by 2020. While Table 29 provides a list of planned roads and bridges, the actual bridge covers
8.25 kms, costs PhP 27.9 billion, and will be financed by PPP. Also, the first three projects on Metro Cebu circumferential and south road are also scheduled to begin construction by 2018 than earlier planned for 2021 onwards. While these are the costs of the needed transport infrastructure, these cover broader Metro Cebu roads that have a wider benefit. An estimate of needed transport infrastructure to connect the perceived housing developments to 2050 is not yet publicly available.
Table 29: Planned Roads and Bridges
Medium-Term Projects (2021-2030)
No. Project Name Project Area Length (km) Cost (PHP mil)
1 Metro Cebu Outer Circumferential Road Minglanilla–Liloan 39.5 15,561
2 Second Cebu South Road Consolacion–Liloan–Compostela–Danao 18.5 3,380
3 Second Cebu South Road Talisay–Minglanilla–Naga–San Fernando–Carcar
35.0 7.980
4 Third Cebu Mactan Bridge includeApproach Causeway of Cordova side
Cebu City C. Padilla to Cordova (Part ofGreen Loop Plan)
10.0 16,880
5 Talisay – Naga Coastal Road (ex PNR) Brg. Lawaan, Talisay–Minglanilla New Center–Brg. Colon, Naga
7.1 1,315
6 Tayud Coastal Road with the SecondCansaga Bay Bridge
Mandaue–Brg. Tayud, Consolacion–Brg.Poblacion, Liloan
8.9 3,262
7 Rest of Mandaue Scenic Coastal Road (2 sections)
Ouano Ave –the Second Bridge, Cebu NorthRoad–Cansaga Bay Brige
5.4 4,834
8 Airport Underpass Road The Second Bridge–MCIA–Brg. Pajak,Lapu-Lapu
2.7 2,438
9 Mactan MRT Avenue (incl. 1 bridge) Brg. Dapitan, Cordova–Brg. Mactan,Lapu-Lapu
8.6 2,244
TOTAL 57,894
Long-term Project (2031-2050)
10 Mega Cebu Coastal Expressway Part of Coastline from Danao to Carcar unknown unknown
Source: JICA. (2015). The Roadmap Study for Sustainable Urban Development in Metro Cebu.
2.2.2 Financing Needs for Energy and Power
The Philippine energy supply is 60% reliant on fossil fuels while the remaining 40% come from renewable energy sources such as geothermal and biomass. Although the energy efficiency ratio is 60%, energy demand nationwide is
48 World Bank. (2013). Energizing Green Cities in Southeast Asia.
expected to increase due to modernization and population growth, challenging the existing supply48. This is envisioned to be addressed in the forthcoming Philippine Energy Plan (PEP) 2016 to 2030. The Philippine energy
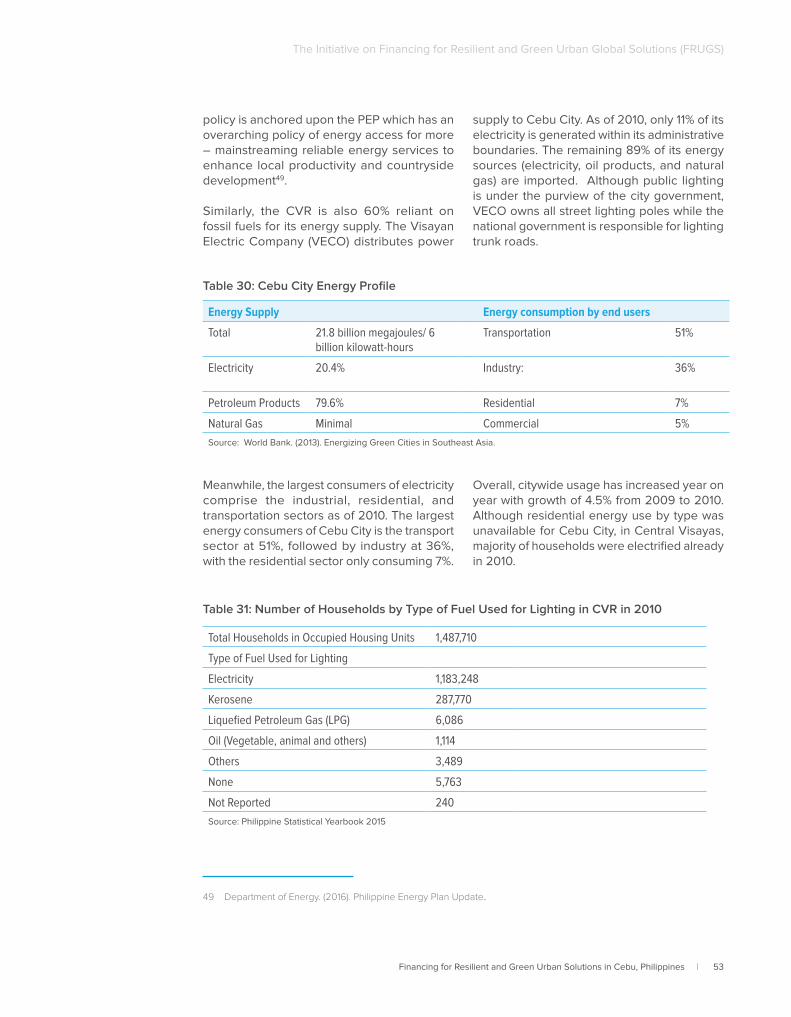
Financing for Resilient and Green Urban Solutions in Cebu, Philippines | 53
The Initiative on Financing for Resilient and Green Urban Global Solutions (FRUGS)
policy is anchored upon the PEP which has an overarching policy of energy access for more – mainstreaming reliable energy services to enhance local productivity and countryside development49.
Similarly, the CVR is also 60% reliant on fossil fuels for its energy supply. The Visayan Electric Company (VECO) distributes power
49 Department of Energy. (2016). Philippine Energy Plan Update.
supply to Cebu City. As of 2010, only 11% of its electricity is generated within its administrative boundaries. The remaining 89% of its energy sources (electricity, oil products, and natural gas) are imported. Although public lighting is under the purview of the city government, VECO owns all street lighting poles while the national government is responsible for lighting trunk roads.
Table 30: Cebu City Energy Profile
Table 31: Number of Households by Type of Fuel Used for Lighting in CVR in 2010
Energy Supply Energy consumption by end users
Total 21.8 billion megajoules/ 6 billion kilowatt-hours
Transportation 51%
Electricity 20.4% Industry: 36%
Petroleum Products 79.6% Residential 7%
Natural Gas Minimal Commercial 5%
Source: World Bank. (2013). Energizing Green Cities in Southeast Asia.
Meanwhile, the largest consumers of electricity comprise the industrial, residential, and transportation sectors as of 2010. The largest energy consumers of Cebu City is the transport sector at 51%, followed by industry at 36%, with the residential sector only consuming 7%.
Overall, citywide usage has increased year on year with growth of 4.5% from 2009 to 2010. Although residential energy use by type was unavailable for Cebu City, in Central Visayas, majority of households were electrified already in 2010.
Total Households in Occupied Housing Units 1,487,710
Type of Fuel Used for Lighting
Electricity 1,183,248
Kerosene 287,770
Liquefied Petroleum Gas (LPG) 6,086
Oil (Vegetable, animal and others) 1,114
Others 3,489
None 5,763
Not Reported 240
Source: Philippine Statistical Yearbook 2015
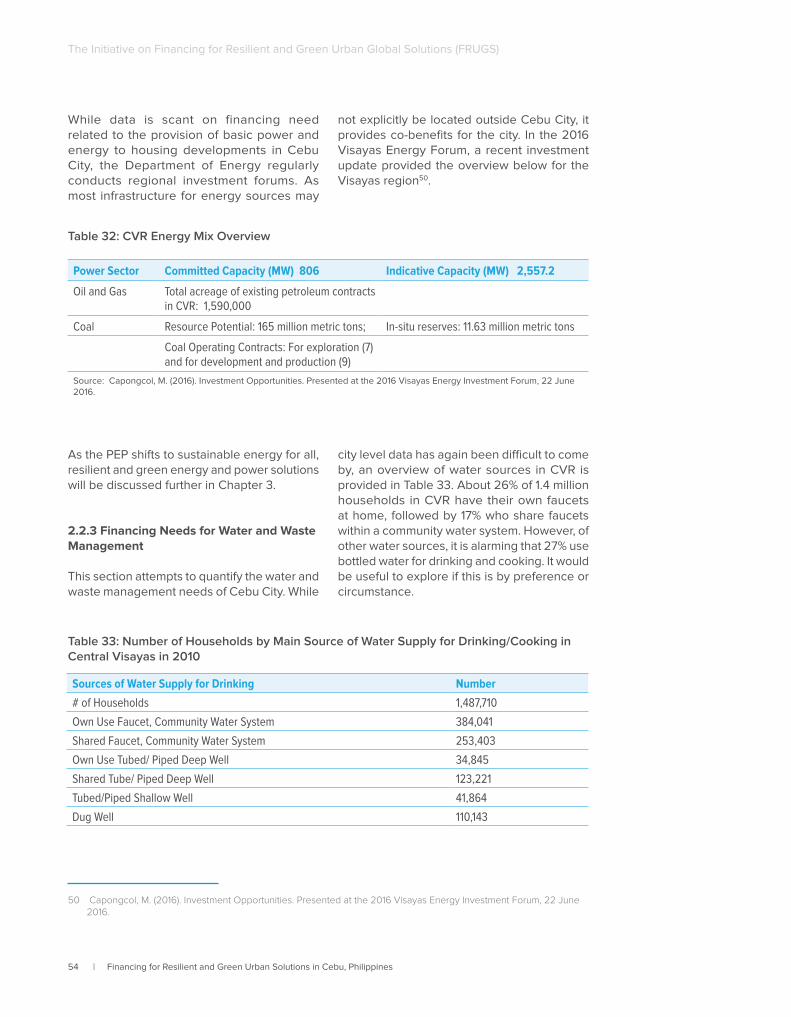
54 | Financing for Resilient and Green Urban Solutions in Cebu, Philippines
The Initiative on Financing for Resilient and Green Urban Global Solutions (FRUGS)
While data is scant on financing need related to the provision of basic power and energy to housing developments in Cebu City, the Department of Energy regularly conducts regional investment forums. As most infrastructure for energy sources may
50 Capongcol, M. (2016). Investment Opportunities. Presented at the 2016 Visayas Energy Investment Forum, 22 June 2016.
not explicitly be located outside Cebu City, it provides co-benefits for the city. In the 2016 Visayas Energy Forum, a recent investment update provided the overview below for the Visayas region50.
Table 32: CVR Energy Mix Overview
Power Sector Committed Capacity (MW) 806 Indicative Capacity (MW) 2,557.2
Oil and Gas Total acreage of existing petroleum contracts in CVR: 1,590,000
Coal Resource Potential: 165 million metric tons; In-situ reserves: 11.63 million metric tons
Coal Operating Contracts: For exploration (7) and for development and production (9)
Source: Capongcol, M. (2016). Investment Opportunities. Presented at the 2016 Visayas Energy Investment Forum, 22 June 2016.
As the PEP shifts to sustainable energy for all, resilient and green energy and power solutions will be discussed further in Chapter 3.
2.2.3 Financing Needs for Water and Waste Management
This section attempts to quantify the water and waste management needs of Cebu City. While
city level data has again been difficult to come by, an overview of water sources in CVR is provided in Table 33. About 26% of 1.4 million households in CVR have their own faucets at home, followed by 17% who share faucets within a community water system. However, of other water sources, it is alarming that 27% use bottled water for drinking and cooking. It would be useful to explore if this is by preference or circumstance.
Table 33: Number of Households by Main Source of Water Supply for Drinking/Cooking in Central Visayas in 2010
Sources of Water Supply for Drinking Number
# of Households 1,487,710
Own Use Faucet, Community Water System 384,041
Shared Faucet, Community Water System 253,403
Own Use Tubed/ Piped Deep Well 34,845
Shared Tube/ Piped Deep Well 123,221
Tubed/Piped Shallow Well 41,864
Dug Well 110,143
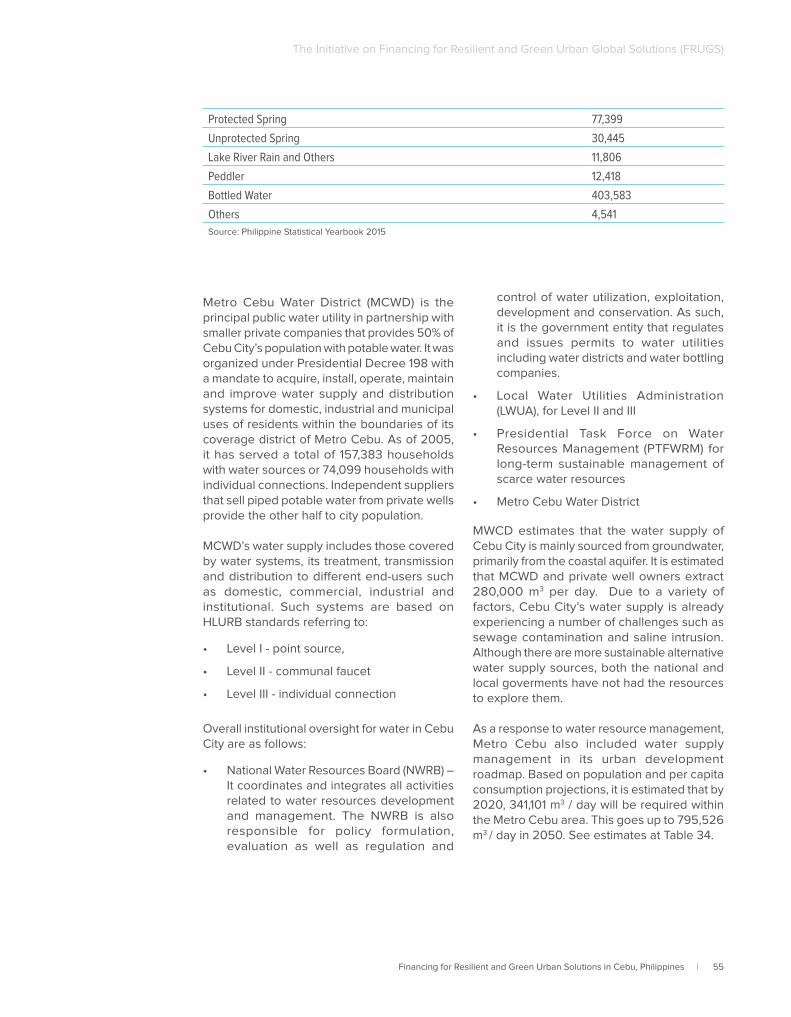
Financing for Resilient and Green Urban Solutions in Cebu, Philippines | 55
The Initiative on Financing for Resilient and Green Urban Global Solutions (FRUGS)
Protected Spring 77,399
Unprotected Spring 30,445
Lake River Rain and Others 11,806
Peddler 12,418
Bottled Water 403,583
Others 4,541
Source: Philippine Statistical Yearbook 2015
Metro Cebu Water District (MCWD) is the principal public water utility in partnership with smaller private companies that provides 50% of Cebu City’s population with potable water. It was organized under Presidential Decree 198 with a mandate to acquire, install, operate, maintain and improve water supply and distribution systems for domestic, industrial and municipal uses of residents within the boundaries of its coverage district of Metro Cebu. As of 2005, it has served a total of 157,383 households with water sources or 74,099 households with individual connections. Independent suppliers that sell piped potable water from private wells provide the other half to city population.
MCWD’s water supply includes those covered by water systems, its treatment, transmission and distribution to different end-users such as domestic, commercial, industrial and institutional. Such systems are based on HLURB standards referring to:
• Level I - point source,
• Level II - communal faucet
• Level III - individual connection
Overall institutional oversight for water in Cebu City are as follows:
• National Water Resources Board (NWRB) – It coordinates and integrates all activities related to water resources development and management. The NWRB is also responsible for policy formulation, evaluation as well as regulation and
control of water utilization, exploitation, development and conservation. As such, it is the government entity that regulates and issues permits to water utilities including water districts and water bottling companies.
• Local Water Utilities Administration (LWUA), for Level II and III
• Presidential Task Force on Water Resources Management (PTFWRM) for long-term sustainable management of scarce water resources
• Metro Cebu Water District
MWCD estimates that the water supply of Cebu City is mainly sourced from groundwater, primarily from the coastal aquifer. It is estimated that MCWD and private well owners extract 280,000 m3 per day. Due to a variety of factors, Cebu City’s water supply is already experiencing a number of challenges such as sewage contamination and saline intrusion. Although there are more sustainable alternative water supply sources, both the national and local goverments have not had the resources to explore them.
As a response to water resource management, Metro Cebu also included water supply management in its urban development roadmap. Based on population and per capita consumption projections, it is estimated that by 2020, 341,101 m3 / day will be required within the Metro Cebu area. This goes up to 795,526 m3 / day in 2050. See estimates at Table 34.
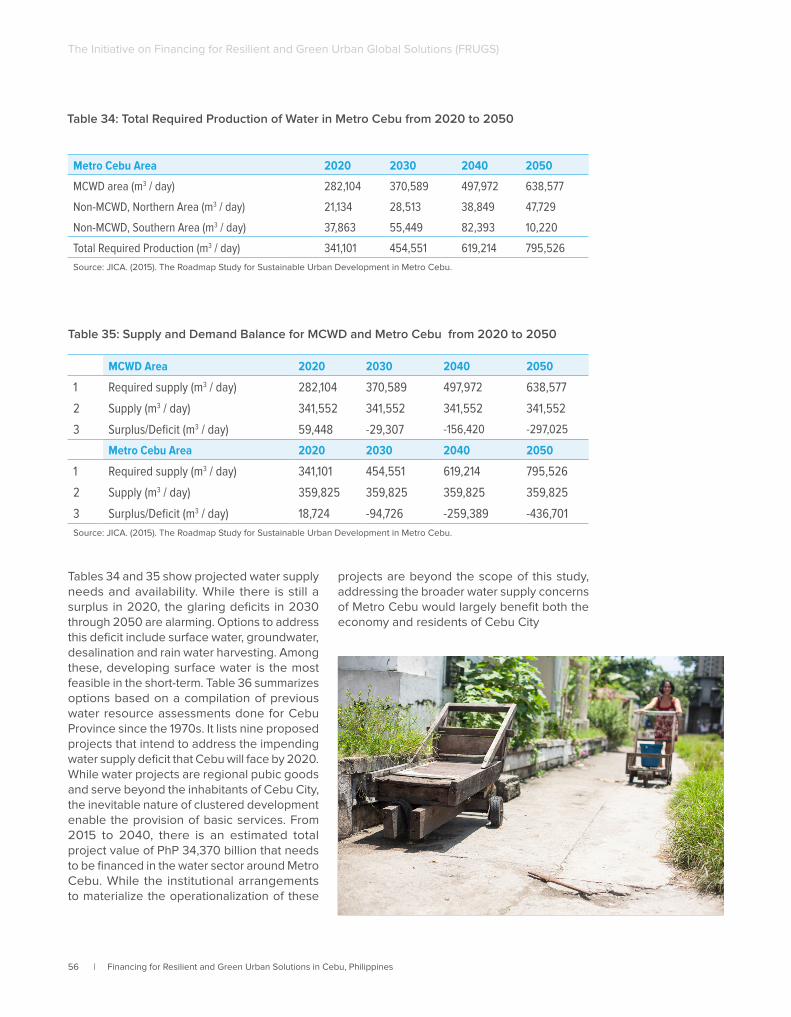
56 | Financing for Resilient and Green Urban Solutions in Cebu, Philippines
The Initiative on Financing for Resilient and Green Urban Global Solutions (FRUGS)
Table 34: Total Required Production of Water in Metro Cebu from 2020 to 2050
Metro Cebu Area 2020 2030 2040 2050
MCWD area (m3 / day) 282,104 370,589 497,972 638,577
Non-MCWD, Northern Area (m3 / day) 21,134 28,513 38,849 47,729
Non-MCWD, Southern Area (m3 / day) 37,863 55,449 82,393 10,220
Total Required Production (m3 / day) 341,101 454,551 619,214 795,526
Source: JICA. (2015). The Roadmap Study for Sustainable Urban Development in Metro Cebu.
Table 35: Supply and Demand Balance for MCWD and Metro Cebu from 2020 to 2050
MCWD Area 2020 2030 2040 2050
1 Required supply (m3 / day) 282,104 370,589 497,972 638,577
2 Supply (m3 / day) 341,552 341,552 341,552 341,552
3 Surplus/Deficit (m3 / day) 59,448 -29,307 -156,420 -297,025
Metro Cebu Area 2020 2030 2040 2050
1 Required supply (m3 / day) 341,101 454,551 619,214 795,526
2 Supply (m3 / day) 359,825 359,825 359,825 359,825
3 Surplus/Deficit (m3 / day) 18,724 -94,726 -259,389 -436,701
Source: JICA. (2015). The Roadmap Study for Sustainable Urban Development in Metro Cebu.
Tables 34 and 35 show projected water supply needs and availability. While there is still a surplus in 2020, the glaring deficits in 2030 through 2050 are alarming. Options to address this deficit include surface water, groundwater, desalination and rain water harvesting. Among these, developing surface water is the most feasible in the short-term. Table 36 summarizes options based on a compilation of previous water resource assessments done for Cebu Province since the 1970s. It lists nine proposed projects that intend to address the impending water supply deficit that Cebu will face by 2020. While water projects are regional pubic goods and serve beyond the inhabitants of Cebu City, the inevitable nature of clustered development enable the provision of basic services. From 2015 to 2040, there is an estimated total project value of PhP 34,370 billion that needs to be financed in the water sector around Metro Cebu. While the institutional arrangements to materialize the operationalization of these
projects are beyond the scope of this study, addressing the broader water supply concerns of Metro Cebu would largely benefit both the economy and residents of Cebu City
Financing for Resilient and Green Urban Solutions in Cebu, Philippines | 57
The Initiative on Financing for Resilient and Green Urban Global Solutions (FRUGS)
Term Project Period Project Cost * Million Peso
Shor
t
Project for Construction of New WaterSupply Facilities (Reservoirs, PumpStations, Well Development)
2015-2020 2.326
Construction of Mananga II Dam 2015-2020 4,778
Sub-total 7,104
Med
ium
Construction of Kotkot and Lusaran Dam 2018-2030 7,500
Groundwater Exploitation Study 2018-2030 620
Reduction of NRW 1,100
Sub-total 9,220
Long
Development of Surface Water and Groundwater at the Northern and Southern areas of Metro Cebu
2028-2040 11,220
Construction of Desalination Plant 2028-2040 3,100
Reduction of NRW 2028-2040 1,100
Recharge to the Ground Water 2028-2040 440
Use of Recycled Water 2028-2040 1,100
Sub-total 16,960
Total 34,370Source: Source: JICA. (2015). The Roadmap Study for Sustainable Urban Development in Metro Cebu. * Exchange Rate: 1PHP=2.442 JPY (JICA, November 2014).
Table 36: Summary of Proposed Water Supply Projects from 2015 to 2040
At the time of writing, Cebu City has been reprimanded to close the Inayawan landfill again not only because it has exceeded its intended life of seven years since 1998 but also because it has become a public hazard. Disposed hazardous and medical waste used to be dumped at the landfill, aggravating untreated landfill leachate. In a report released in 2013, PhP 11 million was noted to be earmarked to fund the landfill’s leachate51. As of March 2017, the Cebu City government appealed the delay of the landfill’s closure to January 2017 to provide ample time to afford and make arrangements for an
51 World Bank. (2013). Energizing Green Cities in Southeast Asia.52 Dalipe, G. and Cuizon, R. (2015). Cebu City to Close Inayawan Landfill Again. Retrieved from http://www.sunstar.com.
ph/cebu/local-news/2016/10/25/cebu-city-close-inayawan-landfill-again-505559. 53 Business World. (2017). “2 firms present proposals for waste-to-energy facility in Cebu’s Inayawan landfill.” Retrieved
from http://www.bworldonline.com/content.php?section=Nation&title=2-firms-present-proposals-for-waste-to-energy-facility-in-cebu&8217s-inayawan-landfill&id=142138
alternate landfill. It cost the city government almost PhP 1 million daily to dump an estimated 600 tons of collected garbage to a private land fill in Consolacion town, 27 kms from the Cebu City Hall. It has been estimated that each ton dumped at Consolacion town costs PhP 1,500, which include tipping and hauler’s fees52. As a complimentary effort, the Cebu City Government has received proposals to rehabilitate the landfill and likewise develop a waste-to-energy facility aside from encouraging proper waste segregation at the household and barangay levels53.
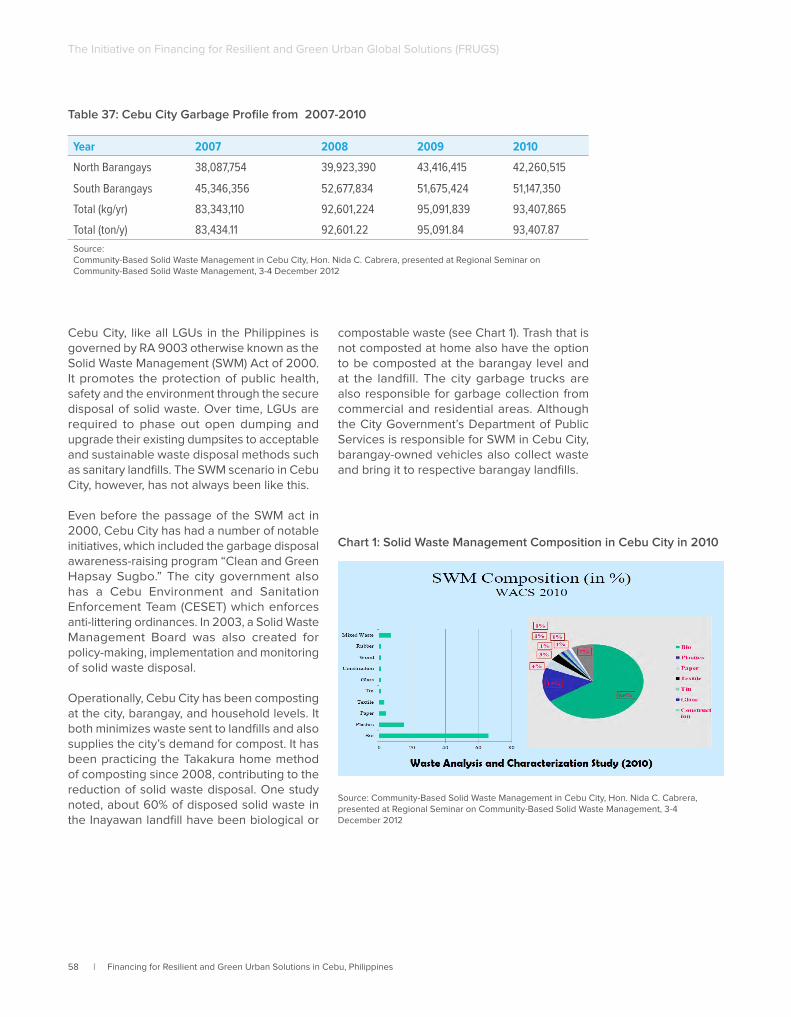
58 | Financing for Resilient and Green Urban Solutions in Cebu, Philippines
The Initiative on Financing for Resilient and Green Urban Global Solutions (FRUGS)
Table 37: Cebu City Garbage Profile from 2007-2010
Year 2007 2008 2009 2010
North Barangays 38,087,754 39,923,390 43,416,415 42,260,515
South Barangays 45,346,356 52,677,834 51,675,424 51,147,350
Total (kg/yr) 83,343,110 92,601,224 95,091,839 93,407,865
Total (ton/y) 83,434.11 92,601.22 95,091.84 93,407.87
Source: Community-Based Solid Waste Management in Cebu City, Hon. Nida C. Cabrera, presented at Regional Seminar on Community-Based Solid Waste Management, 3-4 December 2012
Cebu City, like all LGUs in the Philippines is governed by RA 9003 otherwise known as the Solid Waste Management (SWM) Act of 2000. It promotes the protection of public health, safety and the environment through the secure disposal of solid waste. Over time, LGUs are required to phase out open dumping and upgrade their existing dumpsites to acceptable and sustainable waste disposal methods such as sanitary landfills. The SWM scenario in Cebu City, however, has not always been like this.
Even before the passage of the SWM act in 2000, Cebu City has had a number of notable initiatives, which included the garbage disposal awareness-raising program “Clean and Green Hapsay Sugbo.” The city government also has a Cebu Environment and Sanitation Enforcement Team (CESET) which enforces anti-littering ordinances. In 2003, a Solid Waste Management Board was also created for policy-making, implementation and monitoring of solid waste disposal.
Operationally, Cebu City has been composting at the city, barangay, and household levels. It both minimizes waste sent to landfills and also supplies the city’s demand for compost. It has been practicing the Takakura home method of composting since 2008, contributing to the reduction of solid waste disposal. One study noted, about 60% of disposed solid waste in the Inayawan landfill have been biological or
compostable waste (see Chart 1). Trash that is not composted at home also have the option to be composted at the barangay level and at the landfill. The city garbage trucks are also responsible for garbage collection from commercial and residential areas. Although the City Government’s Department of Public Services is responsible for SWM in Cebu City, barangay-owned vehicles also collect waste and bring it to respective barangay landfills.
Source: Community-Based Solid Waste Management in Cebu City, Hon. Nida C. Cabrera, presented at Regional Seminar on Community-Based Solid Waste Management, 3-4 December 2012
Chart 1: Solid Waste Management Composition in Cebu City in 2010
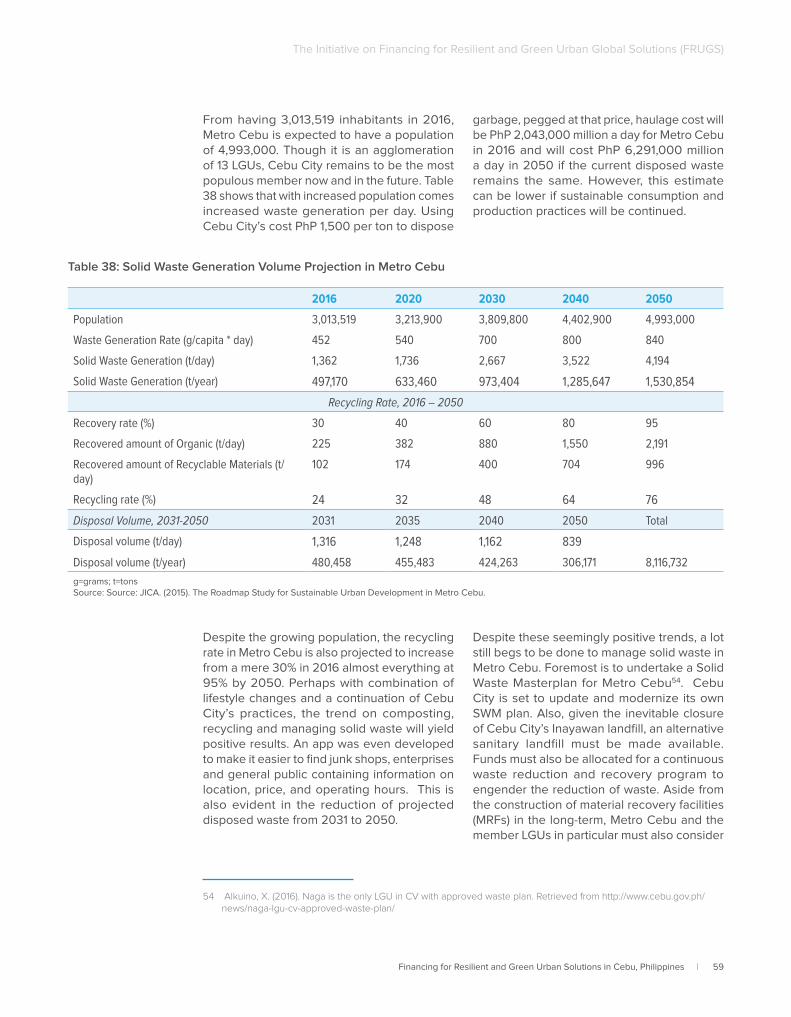
Financing for Resilient and Green Urban Solutions in Cebu, Philippines | 59
The Initiative on Financing for Resilient and Green Urban Global Solutions (FRUGS)
From having 3,013,519 inhabitants in 2016, Metro Cebu is expected to have a population of 4,993,000. Though it is an agglomeration of 13 LGUs, Cebu City remains to be the most populous member now and in the future. Table 38 shows that with increased population comes increased waste generation per day. Using Cebu City’s cost PhP 1,500 per ton to dispose
garbage, pegged at that price, haulage cost will be PhP 2,043,000 million a day for Metro Cebu in 2016 and will cost PhP 6,291,000 million a day in 2050 if the current disposed waste remains the same. However, this estimate can be lower if sustainable consumption and production practices will be continued.
Table 38: Solid Waste Generation Volume Projection in Metro Cebu
2016 2020 2030 2040 2050
Population 3,013,519 3,213,900 3,809,800 4,402,900 4,993,000
Waste Generation Rate (g/capita * day) 452 540 700 800 840
Solid Waste Generation (t/day) 1,362 1,736 2,667 3,522 4,194
Solid Waste Generation (t/year) 497,170 633,460 973,404 1,285,647 1,530,854
Recycling Rate, 2016 – 2050
Recovery rate (%) 30 40 60 80 95
Recovered amount of Organic (t/day) 225 382 880 1,550 2,191
Recovered amount of Recyclable Materials (t/day)
102 174 400 704 996
Recycling rate (%) 24 32 48 64 76
Disposal Volume, 2031-2050 2031 2035 2040 2050 Total
Disposal volume (t/day) 1,316 1,248 1,162 839
Disposal volume (t/year) 480,458 455,483 424,263 306,171 8,116,732
g=grams; t=tonsSource: Source: JICA. (2015). The Roadmap Study for Sustainable Urban Development in Metro Cebu.
Despite the growing population, the recycling rate in Metro Cebu is also projected to increase from a mere 30% in 2016 almost everything at 95% by 2050. Perhaps with combination of lifestyle changes and a continuation of Cebu City’s practices, the trend on composting, recycling and managing solid waste will yield positive results. An app was even developed to make it easier to find junk shops, enterprises and general public containing information on location, price, and operating hours. This is also evident in the reduction of projected disposed waste from 2031 to 2050.
54 Alkuino, X. (2016). Naga is the only LGU in CV with approved waste plan. Retrieved from http://www.cebu.gov.ph/news/naga-lgu-cv-approved-waste-plan/
Despite these seemingly positive trends, a lot still begs to be done to manage solid waste in Metro Cebu. Foremost is to undertake a Solid Waste Masterplan for Metro Cebu54. Cebu City is set to update and modernize its own SWM plan. Also, given the inevitable closure of Cebu City’s Inayawan landfill, an alternative sanitary landfill must be made available. Funds must also be allocated for a continuous waste reduction and recovery program to engender the reduction of waste. Aside from the construction of material recovery facilities (MRFs) in the long-term, Metro Cebu and the member LGUs in particular must also consider
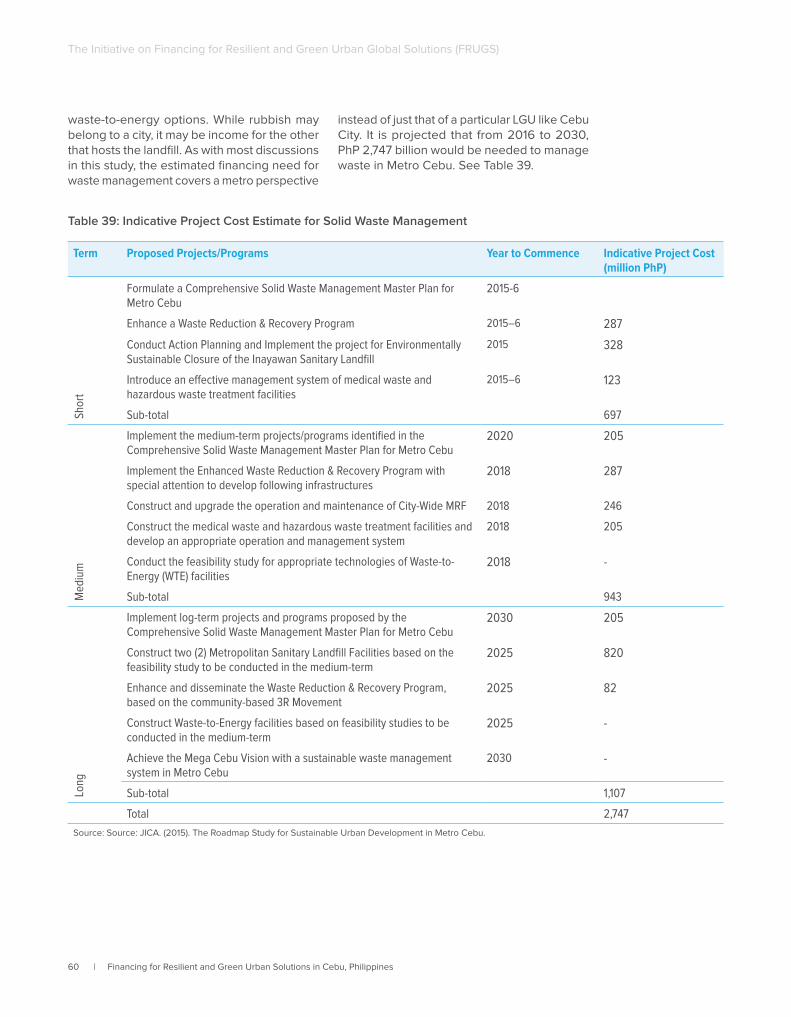
60 | Financing for Resilient and Green Urban Solutions in Cebu, Philippines
The Initiative on Financing for Resilient and Green Urban Global Solutions (FRUGS)
waste-to-energy options. While rubbish may belong to a city, it may be income for the other that hosts the landfill. As with most discussions in this study, the estimated financing need for waste management covers a metro perspective
instead of just that of a particular LGU like Cebu City. It is projected that from 2016 to 2030, PhP 2,747 billion would be needed to manage waste in Metro Cebu. See Table 39.
Table 39: Indicative Project Cost Estimate for Solid Waste Management
Term Proposed Projects/Programs Year to Commence Indicative Project Cost (million PhP)
Shor
t
Formulate a Comprehensive Solid Waste Management Master Plan for Metro Cebu
2015-6
Enhance a Waste Reduction & Recovery Program 2015–6 287
Conduct Action Planning and Implement the project for Environmentally Sustainable Closure of the Inayawan Sanitary Landfill
2015 328
Introduce an effective management system of medical waste and hazardous waste treatment facilities
2015–6 123
Sub-total 697
Med
ium
Implement the medium-term projects/programs identified in the Comprehensive Solid Waste Management Master Plan for Metro Cebu
2020 205
Implement the Enhanced Waste Reduction & Recovery Program with special attention to develop following infrastructures
2018 287
Construct and upgrade the operation and maintenance of City-Wide MRF 2018 246
Construct the medical waste and hazardous waste treatment facilities and develop an appropriate operation and management system
2018 205
Conduct the feasibility study for appropriate technologies of Waste-to-Energy (WTE) facilities
2018 -
Sub-total 943
Long
Implement log-term projects and programs proposed by the Comprehensive Solid Waste Management Master Plan for Metro Cebu
2030 205
Construct two (2) Metropolitan Sanitary Landfill Facilities based on the feasibility study to be conducted in the medium-term
2025 820
Enhance and disseminate the Waste Reduction & Recovery Program, based on the community-based 3R Movement
2025 82
Construct Waste-to-Energy facilities based on feasibility studies to be conducted in the medium-term
2025 -
Achieve the Mega Cebu Vision with a sustainable waste management system in Metro Cebu
2030 -
Sub-total 1,107
Total 2,747
Source: Source: JICA. (2015). The Roadmap Study for Sustainable Urban Development in Metro Cebu.
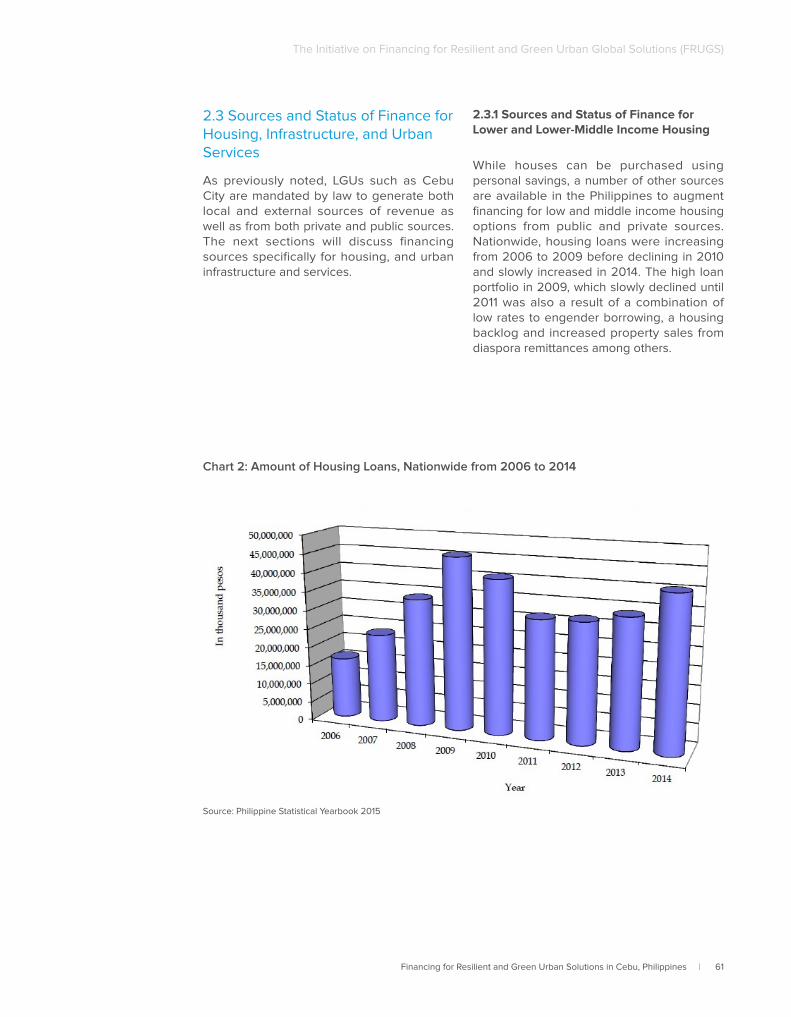
Financing for Resilient and Green Urban Solutions in Cebu, Philippines | 61
The Initiative on Financing for Resilient and Green Urban Global Solutions (FRUGS)
2.3 Sources and Status of Finance for Housing, Infrastructure, and Urban Services
As previously noted, LGUs such as Cebu City are mandated by law to generate both local and external sources of revenue as well as from both private and public sources. The next sections will discuss financing sources specifically for housing, and urban infrastructure and services.
2.3.1 Sources and Status of Finance for Lower and Lower-Middle Income Housing
While houses can be purchased using personal savings, a number of other sources are available in the Philippines to augment financing for low and middle income housing options from public and private sources. Nationwide, housing loans were increasing from 2006 to 2009 before declining in 2010 and slowly increased in 2014. The high loan portfolio in 2009, which slowly declined until 2011 was also a result of a combination of low rates to engender borrowing, a housing backlog and increased property sales from diaspora remittances among others.
Chart 2: Amount of Housing Loans, Nationwide from 2006 to 2014
Source: Philippine Statistical Yearbook 2015
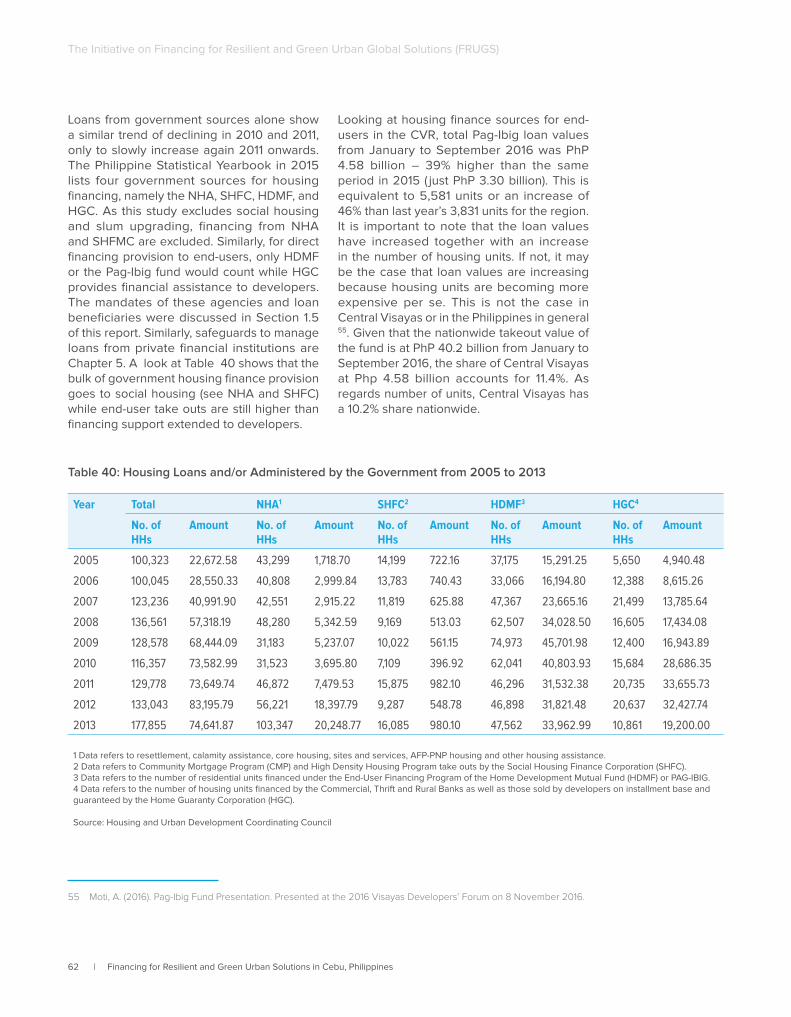
62 | Financing for Resilient and Green Urban Solutions in Cebu, Philippines
The Initiative on Financing for Resilient and Green Urban Global Solutions (FRUGS)
Loans from government sources alone show a similar trend of declining in 2010 and 2011, only to slowly increase again 2011 onwards. The Philippine Statistical Yearbook in 2015 lists four government sources for housing financing, namely the NHA, SHFC, HDMF, and HGC. As this study excludes social housing and slum upgrading, financing from NHA and SHFMC are excluded. Similarly, for direct financing provision to end-users, only HDMF or the Pag-Ibig fund would count while HGC provides financial assistance to developers. The mandates of these agencies and loan beneficiaries were discussed in Section 1.5 of this report. Similarly, safeguards to manage loans from private financial institutions are Chapter 5. A look at Table 40 shows that the bulk of government housing finance provision goes to social housing (see NHA and SHFC) while end-user take outs are still higher than financing support extended to developers.
55 Moti, A. (2016). Pag-Ibig Fund Presentation. Presented at the 2016 Visayas Developers’ Forum on 8 November 2016.
Looking at housing finance sources for end-users in the CVR, total Pag-Ibig loan values from January to September 2016 was PhP 4.58 billion – 39% higher than the same period in 2015 ( just PhP 3.30 billion). This is equivalent to 5,581 units or an increase of 46% than last year’s 3,831 units for the region. It is important to note that the loan values have increased together with an increase in the number of housing units. If not, it may be the case that loan values are increasing because housing units are becoming more expensive per se. This is not the case in Central Visayas or in the Philippines in general 55. Given that the nationwide takeout value of the fund is at PhP 40.2 billion from January to September 2016, the share of Central Visayas at Php 4.58 billion accounts for 11.4%. As regards number of units, Central Visayas has a 10.2% share nationwide.
Table 40: Housing Loans and/or Administered by the Government from 2005 to 2013
Year Total NHA1 SHFC2 HDMF3 HGC4
No. of HHs
Amount No. of HHs
Amount No. of HHs
Amount No. of HHs
Amount No. of HHs
Amount
2005 100,323 22,672.58 43,299 1,718.70 14,199 722.16 37,175 15,291.25 5,650 4,940.48
2006 100,045 28,550.33 40,808 2,999.84 13,783 740.43 33,066 16,194.80 12,388 8,615.26
2007 123,236 40,991.90 42,551 2,915.22 11,819 625.88 47,367 23,665.16 21,499 13,785.64
2008 136,561 57,318.19 48,280 5,342.59 9,169 513.03 62,507 34,028.50 16,605 17,434.08
2009 128,578 68,444.09 31,183 5,237.07 10,022 561.15 74,973 45,701.98 12,400 16,943.89
2010 116,357 73,582.99 31,523 3,695.80 7,109 396.92 62,041 40,803.93 15,684 28,686.35
2011 129,778 73,649.74 46,872 7,479.53 15,875 982.10 46,296 31,532.38 20,735 33,655.73
2012 133,043 83,195.79 56,221 18,397.79 9,287 548.78 46,898 31,821.48 20,637 32,427.74
2013 177,855 74,641.87 103,347 20,248.77 16,085 980.10 47,562 33,962.99 10,861 19,200.00
1 Data refers to resettlement, calamity assistance, core housing, sites and services, AFP-PNP housing and other housing assistance. 2 Data refers to Community Mortgage Program (CMP) and High Density Housing Program take outs by the Social Housing Finance Corporation (SHFC).3 Data refers to the number of residential units financed under the End-User Financing Program of the Home Development Mutual Fund (HDMF) or PAG-IBIG.4 Data refers to the number of housing units financed by the Commercial, Thrift and Rural Banks as well as those sold by developers on installment base and guaranteed by the Home Guaranty Corporation (HGC).
Source: Housing and Urban Development Coordinating Council
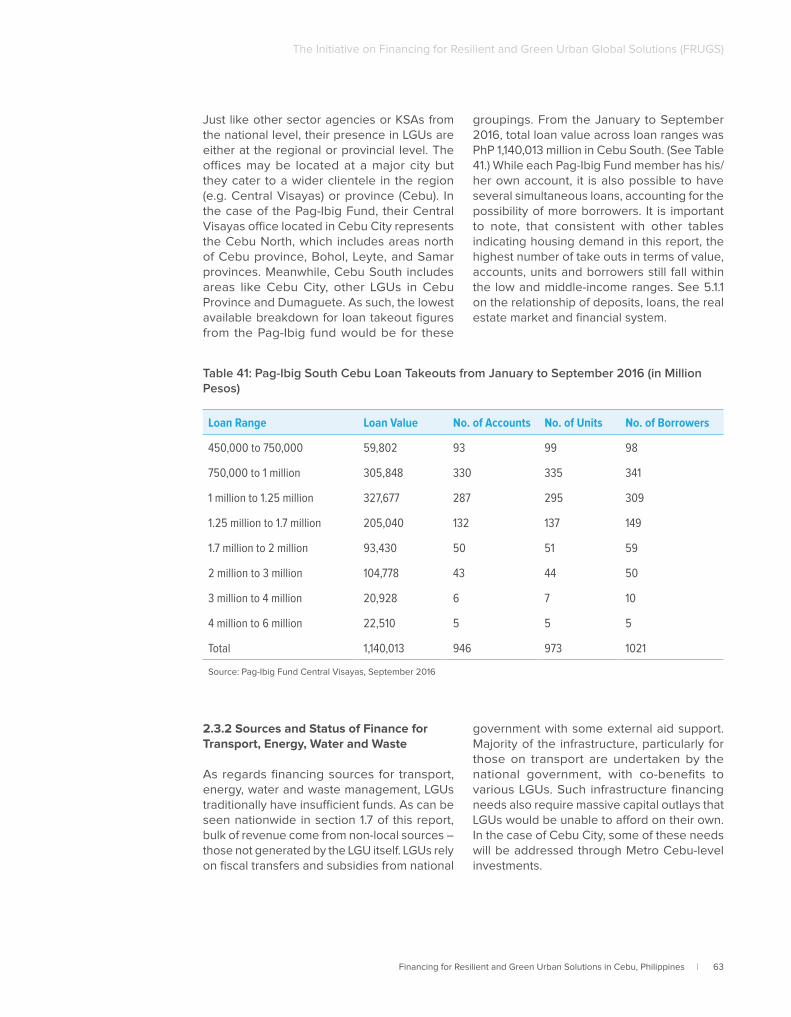
Financing for Resilient and Green Urban Solutions in Cebu, Philippines | 63
The Initiative on Financing for Resilient and Green Urban Global Solutions (FRUGS)
Just like other sector agencies or KSAs from the national level, their presence in LGUs are either at the regional or provincial level. The offices may be located at a major city but they cater to a wider clientele in the region (e.g. Central Visayas) or province (Cebu). In the case of the Pag-Ibig Fund, their Central Visayas office located in Cebu City represents the Cebu North, which includes areas north of Cebu province, Bohol, Leyte, and Samar provinces. Meanwhile, Cebu South includes areas like Cebu City, other LGUs in Cebu Province and Dumaguete. As such, the lowest available breakdown for loan takeout figures from the Pag-Ibig fund would be for these
groupings. From the January to September 2016, total loan value across loan ranges was PhP 1,140,013 million in Cebu South. (See Table 41.) While each Pag-Ibig Fund member has his/her own account, it is also possible to have several simultaneous loans, accounting for the possibility of more borrowers. It is important to note, that consistent with other tables indicating housing demand in this report, the highest number of take outs in terms of value, accounts, units and borrowers still fall within the low and middle-income ranges. See 5.1.1 on the relationship of deposits, loans, the real estate market and financial system.
Table 41: Pag-Ibig South Cebu Loan Takeouts from January to September 2016 (in Million Pesos)
Loan Range Loan Value No. of Accounts No. of Units No. of Borrowers
450,000 to 750,000 59,802 93 99 98
750,000 to 1 million 305,848 330 335 341
1 million to 1.25 million 327,677 287 295 309
1.25 million to 1.7 million 205,040 132 137 149
1.7 million to 2 million 93,430 50 51 59
2 million to 3 million 104,778 43 44 50
3 million to 4 million 20,928 6 7 10
4 million to 6 million 22,510 5 5 5
Total 1,140,013 946 973 1021
Source: Pag-Ibig Fund Central Visayas, September 2016
2.3.2 Sources and Status of Finance for Transport, Energy, Water and Waste
As regards financing sources for transport, energy, water and waste management, LGUs traditionally have insufficient funds. As can be seen nationwide in section 1.7 of this report, bulk of revenue come from non-local sources – those not generated by the LGU itself. LGUs rely on fiscal transfers and subsidies from national
government with some external aid support. Majority of the infrastructure, particularly for those on transport are undertaken by the national government, with co-benefits to various LGUs. Such infrastructure financing needs also require massive capital outlays that LGUs would be unable to afford on their own. In the case of Cebu City, some of these needs will be addressed through Metro Cebu-level investments.
64 | Financing for Resilient and Green Urban Solutions in Cebu, Philippines
The Initiative on Financing for Resilient and Green Urban Global Solutions (FRUGS)
Chapter 3
Finance Needs and Status for Resilient and Green Urban Solutions
Financing for Resilient and Green Urban Solutions in Cebu, Philippines | 65
The Initiative on Financing for Resilient and Green Urban Global Solutions (FRUGS)
“Disaster risk reduction is an investment, not a cost. It increases business returns. [The province of] Albay has seen a surge in investments, even after typhoons and volcanic eruptions. Climate change adaptation and risk reduction allow development to proceed amid disasters, since they don’t disrupt people’s lives when the local government takes charge of the disaster.” - Joey Salceda, Congressman, Province of Albay, Philippines, First Champion, Making Cities Resilient Campaign, former Board Member, Green Climate Fund
As the fourth most vulnerable country in the world to the effects of climate change and the most disaster-prone in the world56, the need for resilient and green urban solutions has never been more imperative for the Philippines. As the cliché goes, the battle for climate change will be won or lost in cities, and certainly, many cities across the Philippine archipelago will be affected. The Philippine National Report to Habitat III estimates that 70% of Philippine cities are coastal and vulnerable to hazards, which includes Cebu City. While the LGC mandates and authorizes LGUs to pursue revenue-generating activities to deliver basic services to its constituents as indicated in their development plans, the Philippine government has other overarching frameworks that govern resilient and green solutions, particularly climate finance at the national and local levels.
As a response to massive flooding that inundated Metro Manila after Typhoon Ondoy in 2009, RA 9729 otherwise known as the Climate Change Act was passed. It mandated the creation of the Climate Change Commission (CCC) which has the responsibility of formulating, implementing, and monitoring plans related to addressing climate impacts. As a result of the law, the National Framework Strategy on Climate Change 2010-2022 was prepared and approved followed by the formulation of the National Climate Change Adaptation Plan (NCCAP). It aims to address synergies between adaptation and mitigation through the core principles of sustainable development which are economic, environmental and social aspects.
As a consequence, all LGUs are required to prepare their own Local Climate Change Adaptation Plans (LCCAPs). As of December
56 UNISDR. (2016). The Human Cost of Weather Related Disaster Report 1995-2015
57 Local Government Academy. (2016). List of LGUs Provided with LCCAP Training. As of July 2016.
2015, only 167 out of 789 LGUs that had received training to prepare one had formulated LCCAPs57. As of November 2016, Cebu City had already undergone the multi-stakeholder workshops to formulate their LCCAP.
As the Philippines is still a low-emitter, the country priority is climate adaptation than mitigation. In 2010, RA 10121 or the Disaster Risk Reduction and Management Act was passed. As result of this law, the National Disaster Risk Reduction and Management (DRRM) Framework and Plan was formulated to likewise guide the preparation of local DRRM plans. In 2012, NEDA also issued the “Guidelines on Mainstreaming DRRM in Sub-National Planning.” Specific to housing, the HLURB also issued “The Supplemental Guidelines on Mainstreaming Climate Change and Disaster Risk in the Comprehensive Land Use Plans” in 2014. Meanwhile, the DILG also issued Memorandum Circular 2015-77, Mainstreaming DRR/CCA in the Comprehensive Development Plans (CDP). As discussed in Section 1.5, stemming from the CLUP, CDPs and investment plans are formulated to inform budget appropriations. In 2014, DBM, together with the CCC, issued another Joint Memorandum Circular instructing LGUs to tag expenditures related to climate change in their annual investment plans. As of 2015, there have been 42 LGUs who have started to tag, under the Climate Change Expenditure Tagging (CCET), excluding Cebu City. Given all these national and local frameworks, if followed, cities have fundamental plans to incorporate resilient and green solutions to their urban development and access climate finance.
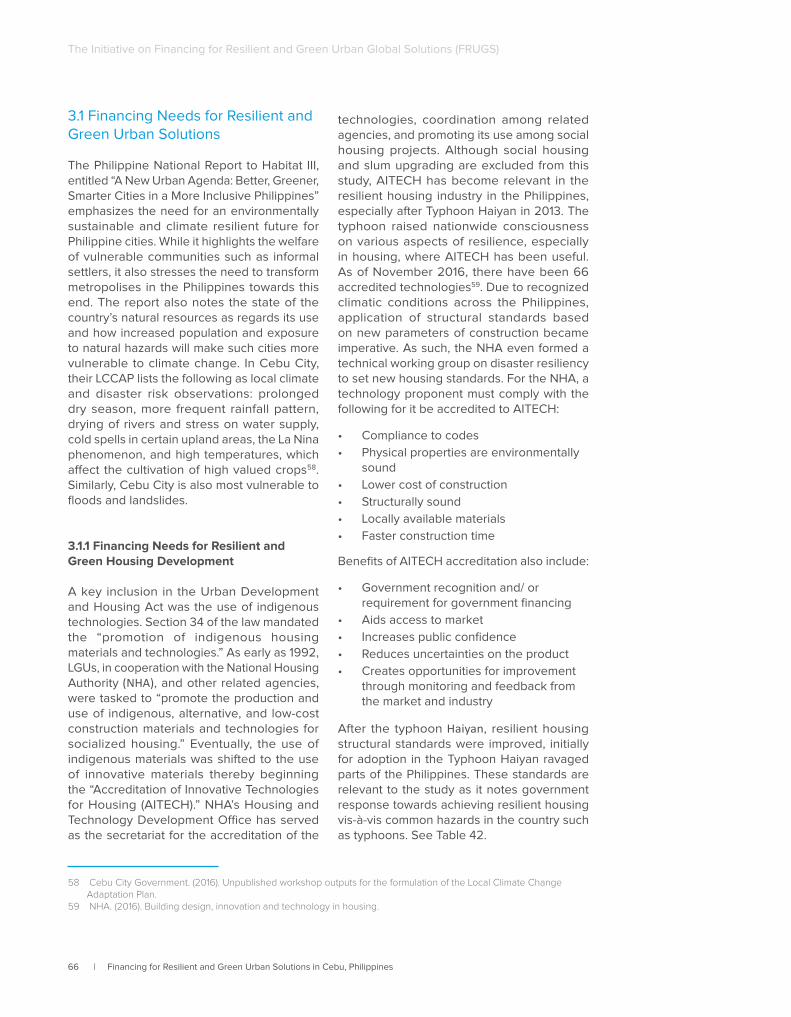
66 | Financing for Resilient and Green Urban Solutions in Cebu, Philippines
The Initiative on Financing for Resilient and Green Urban Global Solutions (FRUGS)
3.1 Financing Needs for Resilient and Green Urban Solutions
The Philippine National Report to Habitat III, entitled “A New Urban Agenda: Better, Greener, Smarter Cities in a More Inclusive Philippines” emphasizes the need for an environmentally sustainable and climate resilient future for Philippine cities. While it highlights the welfare of vulnerable communities such as informal settlers, it also stresses the need to transform metropolises in the Philippines towards this end. The report also notes the state of the country’s natural resources as regards its use and how increased population and exposure to natural hazards will make such cities more vulnerable to climate change. In Cebu City, their LCCAP lists the following as local climate and disaster risk observations: prolonged dry season, more frequent rainfall pattern, drying of rivers and stress on water supply, cold spells in certain upland areas, the La Nina phenomenon, and high temperatures, which affect the cultivation of high valued crops58. Similarly, Cebu City is also most vulnerable to floods and landslides.
3.1.1 Financing Needs for Resilient and Green Housing Development
A key inclusion in the Urban Development and Housing Act was the use of indigenous technologies. Section 34 of the law mandated the “promotion of indigenous housing materials and technologies.” As early as 1992, LGUs, in cooperation with the National Housing Authority (NHA), and other related agencies, were tasked to “promote the production and use of indigenous, alternative, and low-cost construction materials and technologies for socialized housing.” Eventually, the use of indigenous materials was shifted to the use of innovative materials thereby beginning the “Accreditation of Innovative Technologies for Housing (AITECH).” NHA’s Housing and Technology Development Office has served as the secretariat for the accreditation of the
58 Cebu City Government. (2016). Unpublished workshop outputs for the formulation of the Local Climate Change Adaptation Plan.
59 NHA. (2016). Building design, innovation and technology in housing.
technologies, coordination among related agencies, and promoting its use among social housing projects. Although social housing and slum upgrading are excluded from this study, AITECH has become relevant in the resilient housing industry in the Philippines, especially after Typhoon Haiyan in 2013. The typhoon raised nationwide consciousness on various aspects of resilience, especially in housing, where AITECH has been useful. As of November 2016, there have been 66 accredited technologies59. Due to recognized climatic conditions across the Philippines, application of structural standards based on new parameters of construction became imperative. As such, the NHA even formed a technical working group on disaster resiliency to set new housing standards. For the NHA, a technology proponent must comply with the following for it be accredited to AITECH:
• Compliance to codes
• Physical properties are environmentally sound
• Lower cost of construction
• Structurally sound
• Locally available materials
• Faster construction time
Benefits of AITECH accreditation also include:
• Government recognition and/ or requirement for government financing
• Aids access to market
• Increases public confidence
• Reduces uncertainties on the product
• Creates opportunities for improvement through monitoring and feedback from the market and industry
After the typhoon Haiyan, resilient housing structural standards were improved, initially for adoption in the Typhoon Haiyan ravaged parts of the Philippines. These standards are relevant to the study as it notes government response towards achieving resilient housing vis-à-vis common hazards in the country such as typhoons. See Table 42.
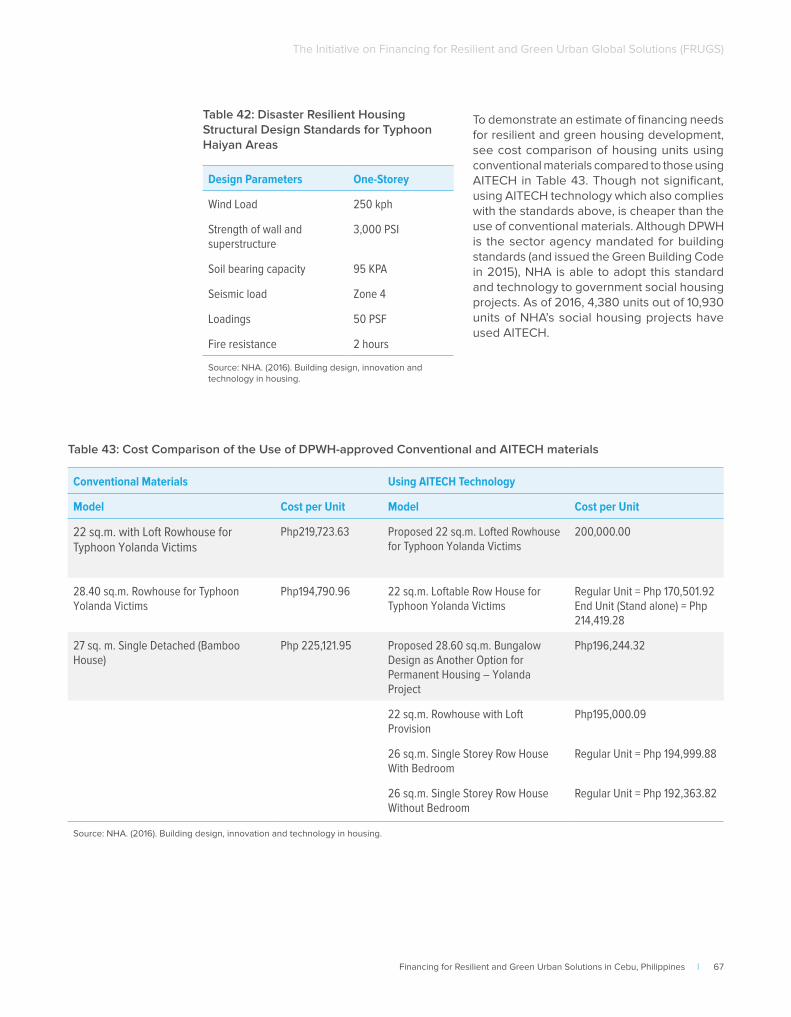
Financing for Resilient and Green Urban Solutions in Cebu, Philippines | 67
The Initiative on Financing for Resilient and Green Urban Global Solutions (FRUGS)
Table 42: Disaster Resilient Housing Structural Design Standards for Typhoon Haiyan Areas
Design Parameters One-Storey
Wind Load 250 kph
Strength of wall and superstructure
3,000 PSI
Soil bearing capacity 95 KPA
Seismic load Zone 4
Loadings 50 PSF
Fire resistance 2 hours
Source: NHA. (2016). Building design, innovation and technology in housing.
To demonstrate an estimate of financing needs for resilient and green housing development, see cost comparison of housing units using conventional materials compared to those using AITECH in Table 43. Though not significant, using AITECH technology which also complies with the standards above, is cheaper than the use of conventional materials. Although DPWH is the sector agency mandated for building standards (and issued the Green Building Code in 2015), NHA is able to adopt this standard and technology to government social housing projects. As of 2016, 4,380 units out of 10,930 units of NHA’s social housing projects have used AITECH.
Conventional Materials Using AITECH Technology
Model Cost per Unit Model Cost per Unit
22 sq.m. with Loft Rowhouse for Typhoon Yolanda Victims
Php219,723.63 Proposed 22 sq.m. Lofted Rowhouse for Typhoon Yolanda Victims
200,000.00
28.40 sq.m. Rowhouse for Typhoon Yolanda Victims
Php194,790.96 22 sq.m. Loftable Row House for Typhoon Yolanda Victims
Regular Unit = Php 170,501.92 End Unit (Stand alone) = Php 214,419.28
27 sq. m. Single Detached (Bamboo House)
Php 225,121.95 Proposed 28.60 sq.m. Bungalow Design as Another Option for Permanent Housing – Yolanda Project
Php196,244.32
22 sq.m. Rowhouse with Loft Provision
Php195,000.09
26 sq.m. Single Storey Row House With Bedroom
Regular Unit = Php 194,999.88
26 sq.m. Single Storey Row House Without Bedroom
Regular Unit = Php 192,363.82
Source: NHA. (2016). Building design, innovation and technology in housing.
Table 43: Cost Comparison of the Use of DPWH-approved Conventional and AITECH materials
68 | Financing for Resilient and Green Urban Solutions in Cebu, Philippines
The Initiative on Financing for Resilient and Green Urban Global Solutions (FRUGS)
At the aftermath of Typhoon Haiyan, 1,140,332 housing units were either totally or partially damaged60. Assuming all those units were replaced using AITECH standards above based on the cheapest unit of a 22 sqm single storey house with a bedroom at PhP 195,000.0 each, it would cost PhP 222,364,740,000.00. Majority of the typhoon victims were from the province of Leyte. Although the northern part of Cebu Province in Daan Bantayan was also severely affected by the typhoon, interviews revealed that consciousness of Cebu City stakeholders to climate resilience was brought about by compliance to national policy than experience from typhoon Haiyan.
Based on interviews with stakeholders in Cebu City both from the private and public sectors, there has been awareness on the need for climate-resilient housing but they expressed lack of awareness on how to assess that need and how to integrate it in succeeding ordinances, policies, and housing developments beyond ongoing efforts for informal settler families and the urban poor in general. Developers willingly comply with the required 40% open and green spaces in the development of their communities. When asked about their impressions on the cost difference between a standard housing unit and a climate-resilient one, developers lamented that their current estimates still exclude adoption of the new green building code and AITECH among other green options. Beyond the use of LED lights and options to use solar panels, there hasn’t been mainstreamed adoption of green initiatives. Developers and government stakeholders are aware of such new initiatives towards resilience and look forward to having further dialogue and knowledge-sharing on the matter.
As such, it has been difficult to estimate resilient and green housing finance needs, especially for the low and middle income segments, nationwide or for Cebu City. Arriving at a cost per housing unit and scaling it to the projected housing need vis-à-vis what the developers commit to produce has been
60 HUDCC. (2016). Philippine National Report to Habitat III: A New Urban Agenda: Better, Greener, Smarter Cities in a More Inclusive Philippines.
61 Republic of the Philippines. (2015). Intended Nationally Determined Contributions. Submitted to the United Nations Framework Convention on Climate Change on October 2015.
missing, especially in establishing the resilient dimension of a particular design of a housing unit. For example, Architect Joy Onozawa, a known green building and sustainable urban development practitioner, has shared that the prevalence of sink holes in Cebu City would require solid and robust engineering among developers to avoid disasters in an already acquired property. In the case of Cebu City though, as its LSP has yet to be formulated, there is an opportunity to integrate the green and resilient housing dimensions into its affordability assessment and financing needs estimation. As early as 2013, UN-Habitat Philippines supported a number of LGUs formulate enhanced shelter plans, particularly integrating the elements of climate change and disaster risk reduction in the planning process. Jointly developed by HUDCC and UN-Habitat Philippines, workshops were conducted across Philippine cities. Although Cebu City is excluded from the beneficiaries of UN-Habitat Philippines, they have worked with HUDCC CVR in other cities in the region. This allows HUDCC staff, who are also members of the Cebu City Housing Board to share knowledge and facilitate the optimal formulation of their LSP.
3.1.2 Financing Needs for Resilient and Green Infrastructure Development
The Philippine submission of its National Determined Contributions (NDCs) to the UNFFCC in October 2015 cements the climate mitigation and adaptation commitment of the country. To realize its commitments, it stresses that “public financing will prioritize adaptation to reduce vulnerability and risks to the community, at the same time providing a policy environment that will enable participation of the private sector to optimize mitigation opportunities and reduce business risks towards a climate smart development. Full implementation of the Philippines’ INDC requires support in the form of adequate, predictable and sustainable financing.61” As such, abiding by its commitment and delivering
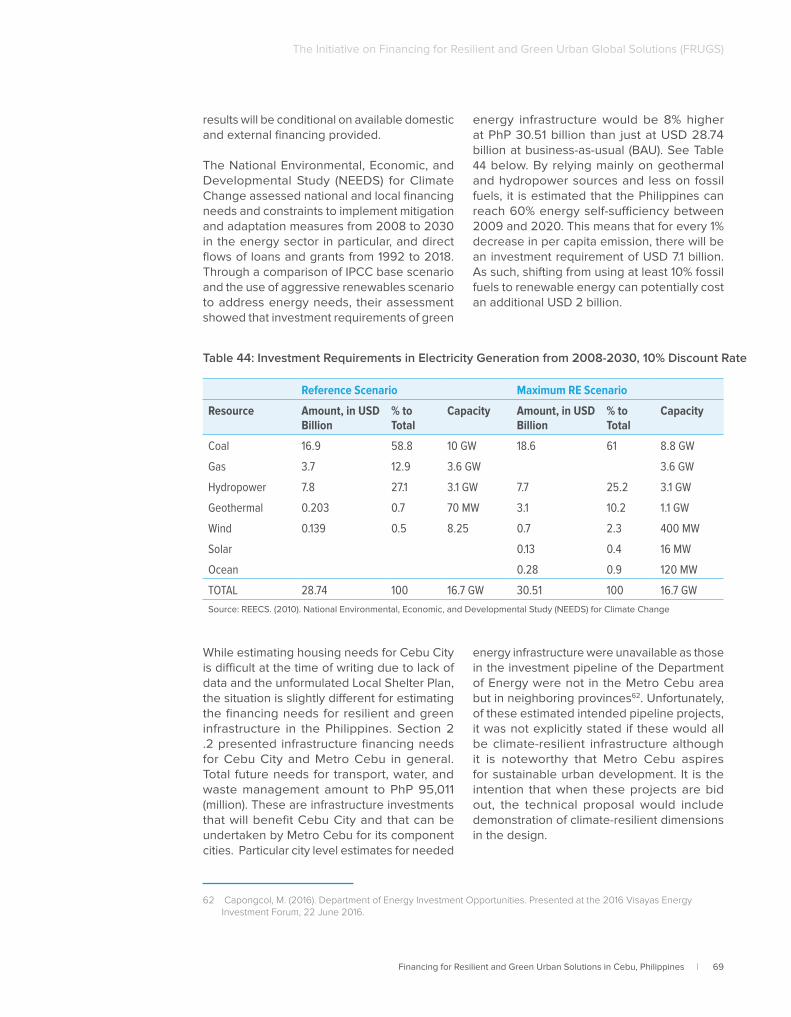
Financing for Resilient and Green Urban Solutions in Cebu, Philippines | 69
The Initiative on Financing for Resilient and Green Urban Global Solutions (FRUGS)
results will be conditional on available domestic and external financing provided.
The National Environmental, Economic, and Developmental Study (NEEDS) for Climate Change assessed national and local financing needs and constraints to implement mitigation and adaptation measures from 2008 to 2030 in the energy sector in particular, and direct flows of loans and grants from 1992 to 2018. Through a comparison of IPCC base scenario and the use of aggressive renewables scenario to address energy needs, their assessment showed that investment requirements of green
energy infrastructure would be 8% higher at PhP 30.51 billion than just at USD 28.74 billion at business-as-usual (BAU). See Table 44 below. By relying mainly on geothermal and hydropower sources and less on fossil fuels, it is estimated that the Philippines can reach 60% energy self-sufficiency between 2009 and 2020. This means that for every 1% decrease in per capita emission, there will be an investment requirement of USD 7.1 billion. As such, shifting from using at least 10% fossil fuels to renewable energy can potentially cost an additional USD 2 billion.
Table 44: Investment Requirements in Electricity Generation from 2008-2030, 10% Discount Rate
Reference Scenario Maximum RE Scenario
Resource Amount, in USD Billion
% to Total
Capacity Amount, in USD Billion
% to Total
Capacity
Coal 16.9 58.8 10 GW 18.6 61 8.8 GW
Gas 3.7 12.9 3.6 GW 3.6 GW
Hydropower 7.8 27.1 3.1 GW 7.7 25.2 3.1 GW
Geothermal 0.203 0.7 70 MW 3.1 10.2 1.1 GW
Wind 0.139 0.5 8.25 0.7 2.3 400 MW
Solar 0.13 0.4 16 MW
Ocean 0.28 0.9 120 MW
TOTAL 28.74 100 16.7 GW 30.51 100 16.7 GW
Source: REECS. (2010). National Environmental, Economic, and Developmental Study (NEEDS) for Climate Change
While estimating housing needs for Cebu City is difficult at the time of writing due to lack of data and the unformulated Local Shelter Plan, the situation is slightly different for estimating the financing needs for resilient and green infrastructure in the Philippines. Section 2 .2 presented infrastructure financing needs for Cebu City and Metro Cebu in general. Total future needs for transport, water, and waste management amount to PhP 95,011 (million). These are infrastructure investments that will benefit Cebu City and that can be undertaken by Metro Cebu for its component cities. Particular city level estimates for needed
62 Capongcol, M. (2016). Department of Energy Investment Opportunities. Presented at the 2016 Visayas Energy Investment Forum, 22 June 2016.
energy infrastructure were unavailable as those in the investment pipeline of the Department of Energy were not in the Metro Cebu area but in neighboring provinces62. Unfortunately, of these estimated intended pipeline projects, it was not explicitly stated if these would all be climate-resilient infrastructure although it is noteworthy that Metro Cebu aspires for sustainable urban development. It is the intention that when these projects are bid out, the technical proposal would include demonstration of climate-resilient dimensions in the design.
70 | Financing for Resilient and Green Urban Solutions in Cebu, Philippines
The Initiative on Financing for Resilient and Green Urban Global Solutions (FRUGS)
In the transport sector, Metro Cebu has made progress in securing funding from the Climate Investment Fund’s (CIF) Clean Technology Fund (CTF) for its bus-rapid-transport (BRT) system. The total project costs USD 228.50 million, financed through a USD 116 million loan from the World Bank and USD 25 million from CTF. Expected to be completed by 2020, the BRT will cover 23 kms through Metro Cebu and intends to contribute to decreased motorization. As such, it is expected to reduce emissions by 115,000 tons per annum in 2020 and 192,000 per annum by 202563. This CIF project demonstrates that estimating financing needs for green and/or resilient urban infrastructure can be made possible through Metro Cebu’s pipeline of projects.
The Philippine Department of Public Works and Highways (DPWH) launched a Green Building Code (GBC) in 2015. The new law is only applicable to buildings constructed or modified after its effectivity and is applicable depending on the total floor gross area of the buildings use (e.g. residential, institutional, etc. As DPWH has a mandate over construction standards, the GBC intend improve building efficiency through sustainable building regulations, highlighting energy efficiency, water and wastewater management, the use of sustainable materials, solid waste management, and air quality. Consistent with the global Leadership in Energy and Environmental Design (LEED) standards, the GBC is expected to save Philippine businesses and consumers up to USD 800 million (PhP 35.2 billion) by 203064. Optimal implementation of the GBC can save the Philippines up to 4 million MW per hour by 2030 and also lessen emissions by 1.90 tons. As this is an eco-efficient version of the old building code, there has been a clamor to incentivize practitioners such as architects, developers, and even consumers to adopt the GBC as well as ensure that there is enough capacity among LGUs to have GBC inspectors.
63 CIF. (Undated). Cebu Bus Rapid Transit Project. Retrieved from https://www-cif.climateinvestmentfunds.org/projects/cebu-bus-rapid-transit-project
64 Ranada, P. (2015). “Green buildings can save businesses, consumers P35.2 billion.” Retrieved from http://www.rappler.com/science-nature/environment/56194-green-building-code-dpwh
65 Aurellado, E. (Undated). The Greening of the Project Management Cycle in the Construction Industry.” Occasional Paper Series No. 10, Ateneo Graduate School of Business.
Similarly, prior to the GBC, the Cebu Provincial Government encouraged the adoption of a “Province of Cebu Green Building Program,” which adheres to the Philippine Green Building Council’s (PGBC) standards and practices. It is mandatory for government buildings but voluntary for the private sector. For the PGBC, an edifice is considered a green building if it meets the requirements of Building for Ecologically Responsive Design Excellence or Berde, the Filipino word for green. A partner organization of the DOE, Berde has various criteria for new construction, retrofits, renovations, and building management. Berde standards is also mandatory for all planned unit developments in Cebu City’s next door LGU neighbor, Mandaue City. As of October 2015, there have been 29 registered projects in the Philippines abiding by the Berde standard. Unfortunately, while a few developers present in Cebu City are part of these 29 Berde “builders,” during interviews, representatives from the housing industry expressed confusion and desire for harmonizing construction standards and the consequent incentives both at the national and local levels. While there was no accessible overall estimation of the costs of adopting Berde or the GBC (LEED Standard) vs conventional standards for the national construction industry or similar post-construction cost assessments, all the more there are none for Cebu City at the time of writing. Literature commonly claims that green materials are more costly than conventional materials but is cheaper over time65.
Some say that climate change is the case of either the lack of water or too much water. Cebu City faces both – challenged and diminishing water supplies and vulnerability to flood inundation. While Metro Cebu already had a pipeline of projects intended to address water resources, DWPH Central Visayas also has a pipeline of projects funded under its appropriations from the national budget in 2016. Table 45 lists five flood control projects
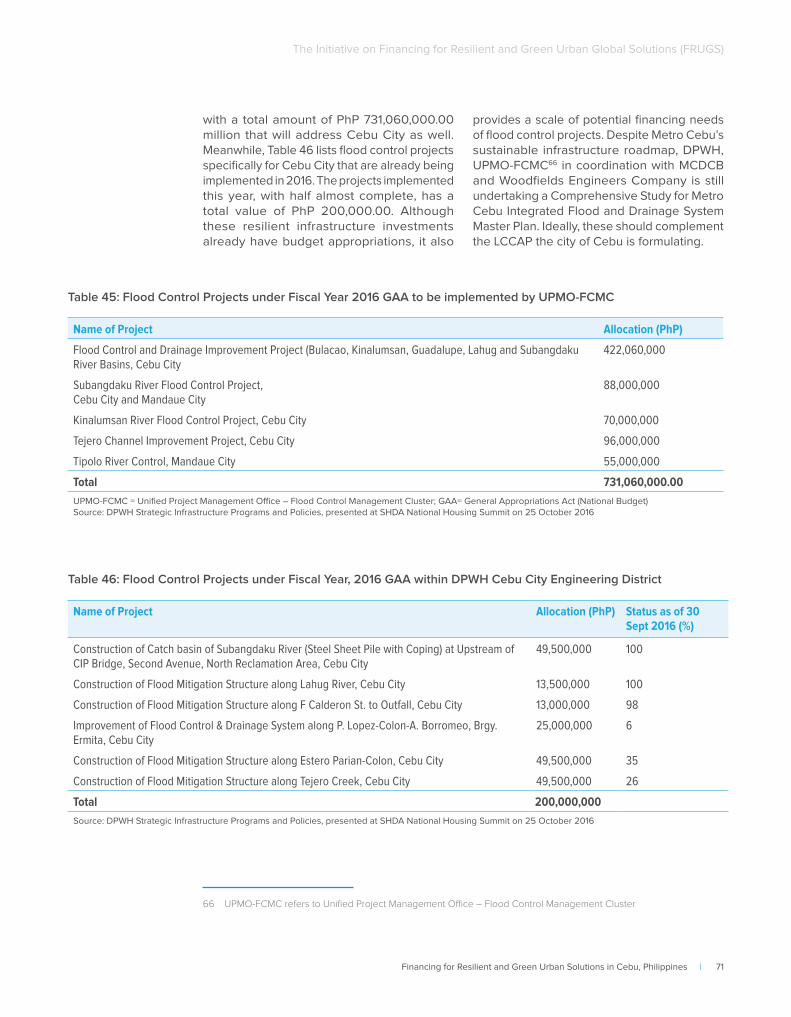
Financing for Resilient and Green Urban Solutions in Cebu, Philippines | 71
The Initiative on Financing for Resilient and Green Urban Global Solutions (FRUGS)
with a total amount of PhP 731,060,000.00 million that will address Cebu City as well. Meanwhile, Table 46 lists flood control projects specifically for Cebu City that are already being implemented in 2016. The projects implemented this year, with half almost complete, has a total value of PhP 200,000.00. Although these resilient infrastructure investments already have budget appropriations, it also
66 UPMO-FCMC refers to Unified Project Management Office – Flood Control Management Cluster
provides a scale of potential financing needs of flood control projects. Despite Metro Cebu’s sustainable infrastructure roadmap, DPWH, UPMO-FCMC66 in coordination with MCDCB and Woodfields Engineers Company is still undertaking a Comprehensive Study for Metro Cebu Integrated Flood and Drainage System Master Plan. Ideally, these should complement the LCCAP the city of Cebu is formulating.
Table 45: Flood Control Projects under Fiscal Year 2016 GAA to be implemented by UPMO-FCMC
Name of Project Allocation (PhP)
Flood Control and Drainage Improvement Project (Bulacao, Kinalumsan, Guadalupe, Lahug and Subangdaku River Basins, Cebu City
422,060,000
Subangdaku River Flood Control Project,Cebu City and Mandaue City
88,000,000
Kinalumsan River Flood Control Project, Cebu City 70,000,000
Tejero Channel Improvement Project, Cebu City 96,000,000
Tipolo River Control, Mandaue City 55,000,000
Total 731,060,000.00UPMO-FCMC = Unified Project Management Office – Flood Control Management Cluster; GAA= General Appropriations Act (National Budget) Source: DPWH Strategic Infrastructure Programs and Policies, presented at SHDA National Housing Summit on 25 October 2016
Table 46: Flood Control Projects under Fiscal Year, 2016 GAA within DPWH Cebu City Engineering District
Name of Project Allocation (PhP) Status as of 30 Sept 2016 (%)
Construction of Catch basin of Subangdaku River (Steel Sheet Pile with Coping) at Upstream of CIP Bridge, Second Avenue, North Reclamation Area, Cebu City
49,500,000 100
Construction of Flood Mitigation Structure along Lahug River, Cebu City 13,500,000 100
Construction of Flood Mitigation Structure along F Calderon St. to Outfall, Cebu City 13,000,000 98
Improvement of Flood Control & Drainage System along P. Lopez-Colon-A. Borromeo, Brgy. Ermita, Cebu City
25,000,000 6
Construction of Flood Mitigation Structure along Estero Parian-Colon, Cebu City 49,500,000 35
Construction of Flood Mitigation Structure along Tejero Creek, Cebu City 49,500,000 26
Total 200,000,000Source: DPWH Strategic Infrastructure Programs and Policies, presented at SHDA National Housing Summit on 25 October 2016
72 | Financing for Resilient and Green Urban Solutions in Cebu, Philippines
The Initiative on Financing for Resilient and Green Urban Global Solutions (FRUGS)
3.1.3 Financing Needs for Resilient and Green Urban Services
Urban services essentially refer to the “business of running cities,” operationalizing all its plans beyond construction and is the actual delivery of services67. These may include the areas of mobility, buildings, water, waste, energy among others. A coordinated effort among a number of stakeholders covering these sectors from the public and private sectors and civil society is the optimal approach in providing these services. In the previous section, estimated financing needs for urban infrastructure in Metro Cebu were presented. In simple terms, quantitatively determining the quantity and quality of urban services have been difficult due to the lack of data on local spending for such services. However, rudimentary information from news articles would suffice to demonstrate minimal budgetary requirements in a number of sectors. As regards attempts to provide resilient and green urban services in Cebu City, initiatives on waste management demonstrates a practical example.
The Inayawan sanitary landfill, which cost PhP 208.7 million to construct has been required to be closed countless times. During its operation, it ceased to serve as such and became both an open dumping site and a garbage transfer station. At least in 2013, about 40% of the waste brought to the Inayawan Landfill were transferred to a private landfill in Consolacion town 30 kms away for a fee of PhP 700 per tonne. In 2013, the Cebu City government spent PhP 39.8 million for tipping fees for the disposal of 56,884 tons to Consolacion. As the city lacks garbage trucks, leasing trucks for the transfer for five months cost an additional PhP 8.3 million68. In 2016, the cost of transferring garbage for even just four months was already PhP 15 million69.
67 Boex, J., Edwards, B. Et al (2014). Urban Service Delivery Assessment Framework. The Urban Institute: Washington, D.C.
68 Climate and Clean Air Coalition Municipal Solid Waste Initiative. (2013). Cebu City Solid Waste Management City Profile.
69 ____. (2016). Costly Garbage Disposal. Retrieved from cebudailynews.inquirer.net/95241/costly-garbage-disposal
Although the city had been separating and segregating waste at source through at least 58 barangays with their own MRF, it has not been very successful. At least three private companies have been engaged in formal recycling for about 46,000 tonnes of organic waste and another 22,000 recyclable materials annually contractually costing the city Php 700 per tonne as tipping fee. Some of the remaining waste sorted at the barangay level are recycled into souvenirs. Recycling reduced waste volume by 30%, reducing trips to the landfill from seven to four or three trips, and lessened gasoline expenses shouldered by the city government.
Based on City Ordinance No. 2018 or “An Ordinance Establishing a System of Garbage Collection and Imposing Fee,” garbage fees from at least 26,000 registered business for collection. The fees vary from PhP 6,000 to 10,000 for manufacturers and producers to just PhP 2,000 for bakeshops and pharmacies. Hospitals are charged PhP 1,500 to PhP 9,000 while fees for funeral parlors ranged from Php 1,200 to Php 5,000. In 2012, the city government was estimated to have collected PhP 72.3 million. This is still insufficient for the implementation of proper solid waste management which requires an estimated PhP 100 million annually. For 2013, an estimated PhP 169.2 million was required for waste management, which included costs of city hall workers (PhP 73.3 million), garbage collection and disposal (PhP 52 million), salaries of barangay garbage collectors (PhP 33.9 million) and Barangay Enforcement Offices (Php 11 million). As such, it demonstrates that subsidizing waste collection and disposal has been costly for the city government of Cebu.
Financing for Resilient and Green Urban Solutions in Cebu, Philippines | 73
The Initiative on Financing for Resilient and Green Urban Global Solutions (FRUGS)
3.2 Sources and Status of Finance for Resilient and Green Urban Solutions
3.2.1 Current Financing Sources and Flows in Resilient and Green Urban Solutions
Financing sources for resilient and green urban solutions in Cebu City through the years have come from a variety of sources and may evolve over time. Sources available to a local government unit like Cebu City include the following:
• City Government Funds (local sources)
• National to local fiscal transfers including tax allotments, performance and challenge funds, specific climate change adaptation and disaster risk reduction funds
• Loans from government financial institutions, development financial institutions, commercial and savings banks
• Credit guarantees
• Capital Market through financial institutions and other financing tools
• PPP arrangements
• Grants and technical assistance
Aside from utilizing city government coffers, among other sources of direct financing for households indicated in Chapter 2 is the Pag-Ibig Fund. While it has traditional products for both affordable and end-user financing programs, it has also recently introduced an “enhanced appraisal for green features” of a household unit. Premium pricing is provided as long as it covers the following:
• Landscape waste minimization in accordance with green technology
• Use of solar energy or energy efficient lighting system
• Eco-sanitation like waste water recycling or treatment system
If any of the above are articulated in the loan application, a maximum of 20% positive adjustment can be adopted. This adjustment also considers other factors such as location, area, and features.
At the national level, plenty of climate finance sources are available. The Climate Change Act defines climate finance as:
“The allocation of public resources towards the climate change adaptation and mitigation requirements of the country and vulnerable communities, through frameworks, mechanisms and processes that are equitable, accountable, transparent, and are in line with the national development goals.”
As early as 1999, the Philippines already had RA 8749 or the Clean Air Act, which aimed to control greenhouse gas (GHG) emissions and to reduce air pollution as part of Kyoto Protocol commitments. This facilitated the Clean Development Mechanism and the United Nations Framework Convention on Climate Change (UNFCCC) Adaptation fund for programs, activities, and projects (PAPs) in developing countries. Through the CDM, emission reduction projects and programs can earn Certified Emission Reduction credits. A recent project under CDM relevant to this study is the Cebu City Landfill Gas and Waste to Energy (WtE) project in Inayawan Landfill. Considered a large activity, it intended to reduce 53,712 mt CO2 equivalent annually. With a fee level of USD 9,242.40, its crediting period was from 2012 to 2018. Although this was coursed through the Department of Environment and Natural Resources (DENR) as CDM’s national designated authority in the Philippines, it is one example of a fund source for projects benefitting a city despite not being initiated by the city itself.
In 2011, RA 10174 created the People Survival Fund (PSF) to provide long-term financing streams to local governments to address climate change adaptation (CCA) initiatives. It was given an allocation of Php 1 billion from the national budget and can be augmented by other sources from the LGUs, private sector, civil society and partners. It also expanded the Climate Change Commission’s board to include the DOF. While LGUs can technically utilize
74 | Financing for Resilient and Green Urban Solutions in Cebu, Philippines
The Initiative on Financing for Resilient and Green Urban Global Solutions (FRUGS)
climate finance for their urban infrastructure if climate dimensions are demonstrated in the design, the PSF is a special and a direct purpose facility for climate change adaptation interventions. For the Philippines in general, and LGUs in particular, to access climate financing, a readiness program was in place from 2013 to 2016. These included the following:
1. Readiness to access such as monitoring and learning from the CDM, Department of Energy preparations for adaptation fund accreditation, and engagement in policy dialogues regarding the Green Climate Fund (GCF);
2. Readiness to plan and mainstream such as aligning the Philippine Development Plan and National Climate Change Adaptation Plan, harmonizing risk assessment methodologies, local climate change adaptation plan formulations, mainstreaming climate change adaptation and disaster risk management in the comprehensive land use plans and the comprehensive development plan;
3. Readiness to spend effectively and efficiently at the national level such as tagging climate change in programs, activities and projects, including in budget preparation, and monitoring national government plans and private sector/development partner contributions;
4. Readiness to spend effectively and efficiently at the sub- national level such as review LGU financing as it relates to PSF, assess enabling policies and address constraints;
5. Development of sub-national adaptation and mitigation programs, activities and projects such as vulnerability assessments, development of menu of mitigation options, cluster LGUs for implementation and invite LGUs to undertake such options.
Aside from those mentioned above, the Philippine government also has the following policies and strategies to promote the
mobilization of public and private sources of climate finance:
1. Climate Public Expenditure and Institutional Review, particularly among partner aid agencies involved in climate change
2. Program Budget Approach that constitutes overall climate change expenditure
3. Specific green financial products from various government financial institutions
While the LGC included a calamity fund, the new disaster risk reduction and management (DRRM) law provided another funding source for LGUs for resilient solutions. The local DRRM Fund could be used for disaster preparedness programs including training and purchase of supplies and equipment. It caps 5% of the LGU’s estimated revenues for the DRRM Fund, with 30% earmarked as a Quick Response Fund (QRF). The QRF is meant for emergency situations.
Development Banks such as Land Bank of the Philippines (LBP) and Development Bank of the Philippines (DBP) are also sources of financing for green and resilient urban infrastructure and services. For example, DBP has an “Environmental Development Project facility in cooperation with JICA that allow LGUs, water utilities and private companies to access long-term funds for environment-friendly projects. Metro Cebu avails of funding support from EDP. Meanwhile, DBP has green financing programs for industry covering pollution control, waste management, and energy efficiency among others.
Aside from specific climate finance sources available to the national and local governments, there have been other sources that have traditionally been used for BAU urban infrastructure and services but could be utilized for green solutions. One example is the Philippine Public-Private-Partnership program. Stemming from the initial Build-Operate-Transfer law, it enabled the participation of the private sector in major infrastructure projects that benefit cities. The Philippine PPP program is coordinated by the PPP Center under
Financing for Resilient and Green Urban Solutions in Cebu, Philippines | 75
The Initiative on Financing for Resilient and Green Urban Global Solutions (FRUGS)
National Economic Development Authority. From 1990 to 2008, the BOT program already gained USD 19 billion worth of capital investments. Some perspectives tag projects as urban only if it is literally undertaken in the city by the city. However, some are tagged as urban even if they are located elsewhere or undertaken by the national government as they certainly benefit the city. The Philippine PPP program follows the latter where even if the projects are undertaken at the national level, these benefit cities. One example would be the rehabilitation of the Cebu- Mactan Passenger Terminal. Though not in Cebu City, the airport is within Metro Cebu and serves the entire province. The project cost PhP 17.2 billion with 30% completed as of September 2016.
Apart from PPP arrangements, private financial institutions have also started to look into the relationship of climate change and overall urban resilience and how it relates to the competitiveness and economic performance of cities. One such private financial institution is the Bank of the Philippine Islands. It commissioned WWF Philippines to undertake a study on the topic. It has since developed further sector studies on the recommendations from the urban resilience study completed in 2014.
76 | Financing for Resilient and Green Urban Solutions in Cebu, Philippines
The Initiative on Financing for Resilient and Green Urban Global Solutions (FRUGS)
Chapter 4
Financing Instruments for Housing, Infrastructure and Urban Services
Financing for Resilient and Green Urban Solutions in Cebu, Philippines | 77
The Initiative on Financing for Resilient and Green Urban Global Solutions (FRUGS)
Chapter 4 attempts to analyze key challenges and constraints in the housing and infrastructure finance sector. Discussions in the next sections will include research and analysis on access to long-term financing, availability of deposits in local currency. Different concepts and approaches in the areas of housing and infrastructure development will also be presented and reviewed.
4.1 Key Challenges and Constraints in Financing the Housing Sector
In this section, it would be crucial to delineate challenges brought about by urban development per se and those that the housing finance sector faces in general. This section focuses on the challenges of the housing finance sector in the Philippines. Based on a review of literature and interviews for the study, a number of housing finance issues affect the affordability of available housing units. These include having an underdeveloped mortgage market and sub-optimal access to formal finance. Due to land use, registration, and management issues, the Philippines also suffers from an inefficient land market, with Cebu City bearing no exception. All these factors together with inconsistent housing and land policies and complex governance arrangements among agencies contribute to making housing production to address the shortage complicated and acquisition difficult.
Underdeveloped mortgage market – The National Housing Summit held in 2016 concluded that the Philippines has an underdeveloped mortgage market manifested in underpriced loans and guarantees. Loan rates in the Philippines vary among originators from government institutions (e.g. Pag-Ibig Fund, NHA, and NHMFC) to private financial institutions. Housing loan rates vary within the range of 5.3% to 7.8% for one year fixed loans and 7% to 10% thereafter for 5-year fixed mortgages from commercial banks.
70 Bangko Sentral ng Pilipinas. (2017). “Universal and Commercial Banks’ Loans Outstanding to the Real Estate Sector by Purpose.” Retrieved from http://www.bsp.gov.ph/statistics/spei_new/tab26_rel.htm
71 Monsod (2016). As cited in the National Urban Summit Report. 72 SHDA, (2012). Housing Roadmap.
Meanwhile, the government’s Pag-Ibig Fund can offer as low as 4.5% for socialized housing for 30 years. From 2008 to 2016, overall universal and commercial bank outstanding loans to the real estate sector increased by nearly 60% overall. However, loans to the social housing sector declined for the same period from 28.6% of total loans in 2008 to just 24.5% in 2016. Similarly, outstanding loans to the residential sector through commercial banks also declined from 16.2% in 2008 to 14.7% in 2016. Loans to other borrowers for residential units also a declined for the same period from 7.2% to 6.5%70. In 2015, the ratio of real estate loans to GDP accounted for 3.3%, an increase from 2.04% in 2009. To realize the typical Filipino household’s aspiration for a quality house, households still have to resort to self-financing such as savings, inheritance or gradual construction, which is a reflection of an inefficient formal housing market71.
Similarly, SHDA’s housing roadmap noted that the housing finance market remains to be inefficient especially in mobilizing private resources with the correct market incentives. This is primarily due to improper market pricing of loans and disproportionate distribution of risk and return among housing developments. Although government housing programs are more susceptible to these inefficiencies, the challenge of mobilizing private capital to supplement or even replace government subsidies both for homeowners or the developers would sustainably address housing demand72.
Insufficient or hidden information also makes the housing market insufficient. Making sense of the regulations, the requirements, and even available subsidies already pose transaction costs. Aside from the complex governance framework prevailing in the Philippine housing industry, it is necessary to assess how the key shelter agencies perceive the role of information in the formal market not only for aspiring homeowners accessing loans but
78 | Financing for Resilient and Green Urban Solutions in Cebu, Philippines
The Initiative on Financing for Resilient and Green Urban Global Solutions (FRUGS)
more especially in incentivizing the private sector to participate73. This both includes real estate developers and financial institutions. With sufficient information, those who are more qualified and most in need could avail of such subsidies. Without sufficient information, the primary mortgage market is at risk of further inefficiencies.74
Together with market information, mechanisms for dealing with risks could also be improved to expand the market to poor income segments, which are deemed to be riskier for investors. If the current situation of having a surplus of produced housing units for low and middle income housing prevails, investors will have to deal with the risk of prolonged tied funds and uncertainty of liquidation. As such, most of the approved loans are short-term. The Philippines also has an outdated cadaster system and land titling and registrations concerns are common, making selling, transferring and even foreclosure and dispute settlements take a lengthy process. As such, these factors contribute to the current underdeveloped mortgage market.
Sub-optimal access to formal finance - Not all low and middle income households are able to access formal finance. Despite their incomes, findings of the Philippine National Housing Summit revealed that there are income segments that had enough to access modest housing (owned or rented) but remain in sub-optimal housing conditions due to unavailability of financial products that cater to those at the fringes of formal credit. These may be segments with reasonable income but may not necessarily have regular or formal income streams. Initiatives to assist households at the margins could vary. Encouraging savings and improving employment safeguards among others can increase confidence to take up loans.
73 National Housing Summit (2016). Lea 2009, quoted in Monsod 201674 Monsod, T. (2011). Is Government Really Solving the Housing Problem? UP School of Economics. 75 Social Housing Finance Corporation. (2017). “The Community Mortgage Program: Fast Facts.” Retrieved from http://
www.shfcph.com/CMP_Fast_Facts.html76 Llanto, G (1998). A Study of Housing Subsidies in the Philippines; Discussion paper series no. 98-42.
Although this study excludes social housing and slum upgrading, one glaring finding of the National Housing Summit was that the “poor are displaced by middle income households.” While the National Housing Authority provides social housing, the Community Mortgage Program (CMP), under the NHMFC and SHFCPH covers slum upgrading. CMP is a mortgage program that assists organized groups of homeless and underprivileged citizens through affordable financing to secure tenure of the lots they occupy. The maximum loan package is PhP 250,000.00 (about USD 5,000) payable up to 25 years75. The CMP is popular and largely implemented in highly urbanized cities in the Philippines as it provides an opportunity to formalize settlement in depressed areas. As these financially challenged aspiring homeowners have difficulty providing proof of formal and stable income and likewise only intend to acquire tenure of small lots, they are not served by conventional mortgage instruments of both the private and public sectors. The government KSAs have also been noted to have “inefficient targeting records,” which lead to supporting non-poor dwellers76. At the moment, the housing finance market practically caters only to the low and middle income segments while the lower and homeless rely on government subsidies such as social housing programs or become informal settlers. By further enabling the access of low and middle income segments to formal financing, their possibility of sliding down into housing for the urban poor may be lessened or completely avoided.
Despite the availability for formal housing finance mechanisms, aspiring homeowners would also still benefit from reduction in loan interest rates, longer payment terms (e.g. up to 30 years), reduced loan requirements and even processing times. Although private financial institutions and government housing agencies have been lowering interest rates
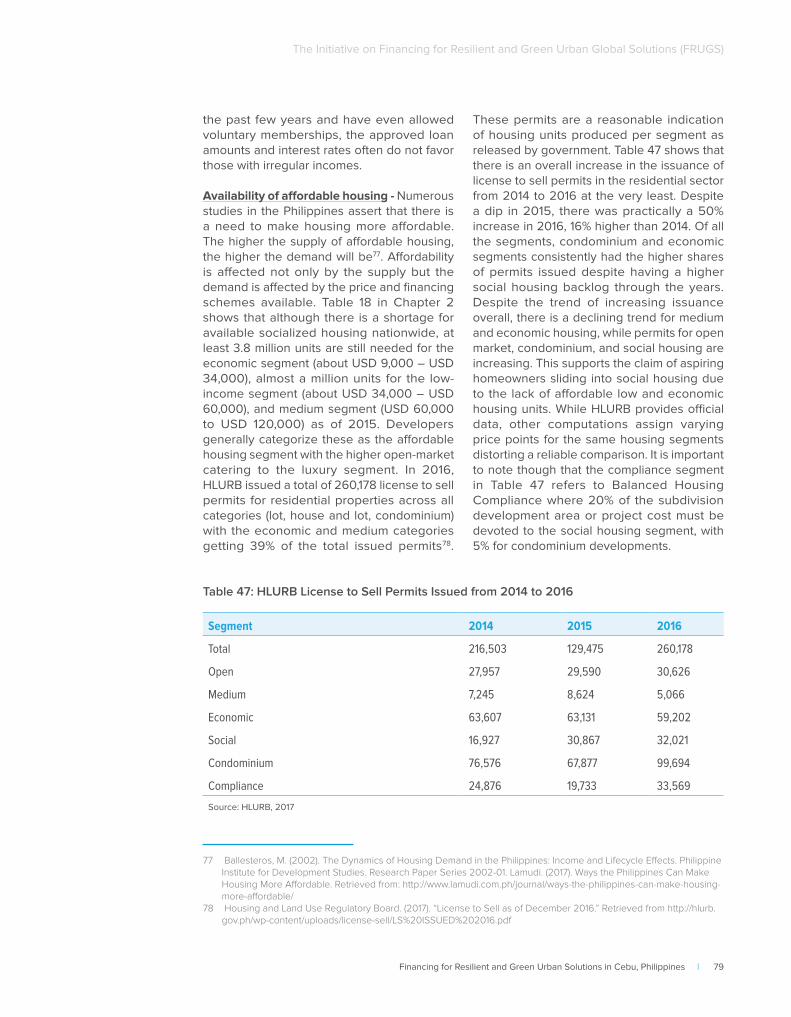
Financing for Resilient and Green Urban Solutions in Cebu, Philippines | 79
The Initiative on Financing for Resilient and Green Urban Global Solutions (FRUGS)
the past few years and have even allowed voluntary memberships, the approved loan amounts and interest rates often do not favor those with irregular incomes.
Availability of affordable housing - Numerous studies in the Philippines assert that there is a need to make housing more affordable. The higher the supply of affordable housing, the higher the demand will be77. Affordability is affected not only by the supply but the demand is affected by the price and financing schemes available. Table 18 in Chapter 2 shows that although there is a shortage for available socialized housing nationwide, at least 3.8 million units are still needed for the economic segment (about USD 9,000 – USD 34,000), almost a million units for the low-income segment (about USD 34,000 – USD 60,000), and medium segment (USD 60,000 to USD 120,000) as of 2015. Developers generally categorize these as the affordable housing segment with the higher open-market catering to the luxury segment. In 2016, HLURB issued a total of 260,178 license to sell permits for residential properties across all categories (lot, house and lot, condominium) with the economic and medium categories getting 39% of the total issued permits78.
77 Ballesteros, M. (2002). The Dynamics of Housing Demand in the Philippines: Income and Lifecycle Effects. Philippine Institute for Development Studies. Research Paper Series 2002-01. Lamudi. (2017). Ways the Philippines Can Make Housing More Affordable. Retrieved from: http://www.lamudi.com.ph/journal/ways-the-philippines-can-make-housing-more-affordable/
78 Housing and Land Use Regulatory Board. (2017). “License to Sell as of December 2016.” Retrieved from http://hlurb.gov.ph/wp-content/uploads/license-sell/LS%20ISSUED%202016.pdf
These permits are a reasonable indication of housing units produced per segment as released by government. Table 47 shows that there is an overall increase in the issuance of license to sell permits in the residential sector from 2014 to 2016 at the very least. Despite a dip in 2015, there was practically a 50% increase in 2016, 16% higher than 2014. Of all the segments, condominium and economic segments consistently had the higher shares of permits issued despite having a higher social housing backlog through the years. Despite the trend of increasing issuance overall, there is a declining trend for medium and economic housing, while permits for open market, condominium, and social housing are increasing. This supports the claim of aspiring homeowners sliding into social housing due to the lack of affordable low and economic housing units. While HLURB provides official data, other computations assign varying price points for the same housing segments distorting a reliable comparison. It is important to note though that the compliance segment in Table 47 refers to Balanced Housing Compliance where 20% of the subdivision development area or project cost must be devoted to the social housing segment, with 5% for condominium developments.
Table 47: HLURB License to Sell Permits Issued from 2014 to 2016
Segment 2014 2015 2016
Total 216,503 129,475 260,178
Open 27,957 29,590 30,626
Medium 7,245 8,624 5,066
Economic 63,607 63,131 59,202
Social 16,927 30,867 32,021
Condominium 76,576 67,877 99,694
Compliance 24,876 19,733 33,569
Source: HLURB, 2017
80 | Financing for Resilient and Green Urban Solutions in Cebu, Philippines
The Initiative on Financing for Resilient and Green Urban Global Solutions (FRUGS)
Though no exact figure is available, interviews revealed that the private sector produced housing units based on reported housing shortages but in actuality, the selling and occupancy rates are low. Estimates for condominium units in the central business districts (CBD) in Manila are expected to have a vacancy rate of 6% to 15% in 201779. In a 2016 presentation of a real estate company made to housing industry stakeholders in Central Visayas, it was stated that developers have delayed launching dates of new developments due to large unabsorbed inventories, particularly in the middle-income segments in Cebu80. To date, there are no known assessments exploring if these are due to the floor areas of available units (law was adjusted to 18 sqm to make it affordable but some developers prefer to produce 25 sqm instead), consequent effect on prices or even the preference to rent.
Although rental rates are declining across CBDs, unit prices are increasing81. The relationship of this real estate price index and the broader financial system will be discussed in Section 5. However, the demand for luxury and upmarket units are coming from expatriate, affluent families and senior employees of corporations. To access the available inventory, affordable financing schemes are still necessary. As noted in the preceding section, a factor that greatly affects housing affordability for the low and middle income segments include access to financing. According to SHDA, one way to address the affordability issue aside from pricing is to ensure that those who could actually afford be covered by existing formal economic and financing structures and those truly in need get subsidies. Despite the plethora of financing options from both private and public sectors noted in Chapter 2, the interest rates still need to be more accessible to end users. While Pag-ibig loans could go as low as 4.5%, it is under a fixed-pricing framework where the rate will be
79 Colliers International. (2017). Philippines Residential Update, May 2017. Retrieved from http://www.colliers.com/-/media/files/marketing%20reports/1q2017-residential_market_report.pdf
80 McCullough, M. (2016). “The Supply Gap: Key Expansion Areas (Philippines). Presented at the SHDA Central Visayas Housing Summit 25 October 2016.
81 JLL. (2017). “Philippine Property Digest: Property Sector Finishes on a Strong Note.” Retrieved from http://www.ap.jll.com/asia-pacific/en-gb/Research/Philippine-Property-Digest-4Q16.pdf?e5ad661c-360a-43bd-98eb-237805efe10a.
higher the later the loan maturity date is. In this case, the end user bears the full risk brought about by real estate fluctuations.
This is unlikely to change if inefficiencies prevail in the land market. Though not yet apparent, the Cebu City government is already anticipating that majority of the young BPO workers who are currently renting in various arrangements will eventually seek more affordable home ownership options. Nationally, the trend is to increase rental options, worker accommodations, and innovative lease and rent-to-own arrangements.
Inefficient urban land market - While the optimal scenario would be a well-functioning housing finance market, an efficient land market is also a necessity. As noted in Chapter 1, only about 20% of the administrative land area of Cebu City is fit for housing and other developments – the remaining are in the upland areas. Despite its growing population, its land area remains the same. Interviews with Cebu City stakeholders both from the private and public sectors acknowledge that the need for housing units is greater than the available land for future production of housing units. Land inventory also revealed that majority of the available land possibly fit for housing developments are either privately owned or provincial government owned. While the city government had made arrangements for property swaps with the provincial government to address social housing needs, its reclamation for South Road Properties also added to the city’s land inventory with some lots sold to private developers already. Another unique example though in Metro Manila is a PhP 65 billion joint venture between a private developer (72%) and the NHA (38%) to develop the latter’s idle asset into a transit-oriented-development area. The property sits at a prime location of two metro lines and has long been occupied by informal settlers. It is intended to create a modern CBD in the north,
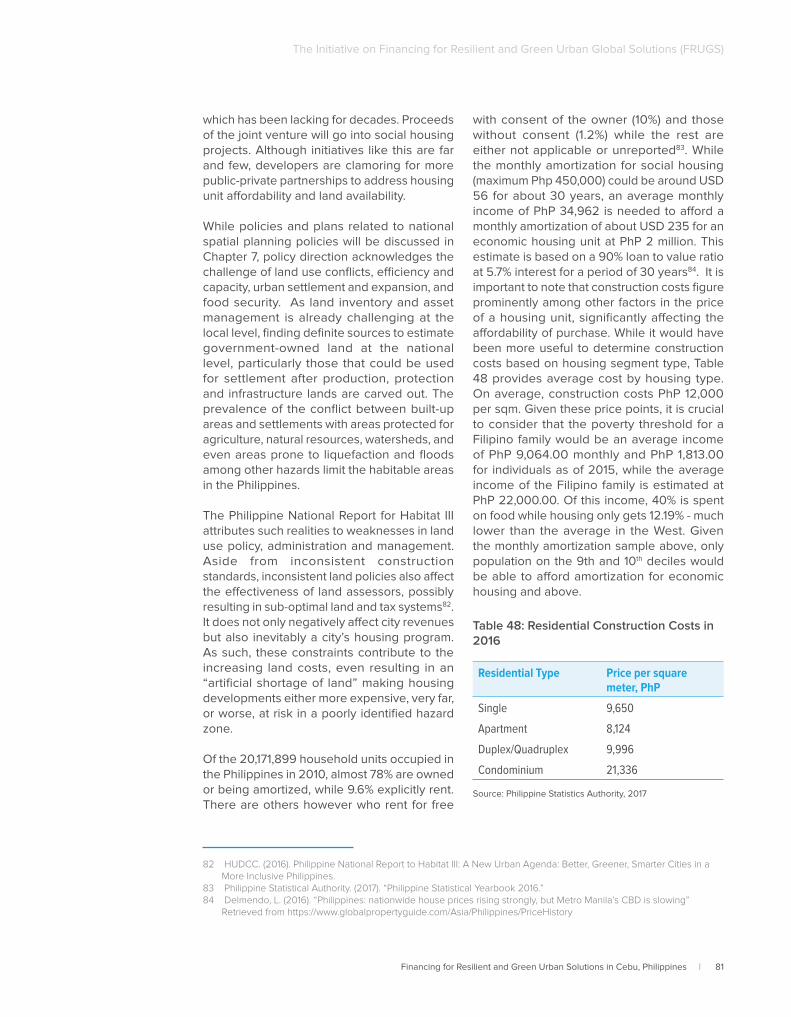
Financing for Resilient and Green Urban Solutions in Cebu, Philippines | 81
The Initiative on Financing for Resilient and Green Urban Global Solutions (FRUGS)
which has been lacking for decades. Proceeds of the joint venture will go into social housing projects. Although initiatives like this are far and few, developers are clamoring for more public-private partnerships to address housing unit affordability and land availability.
While policies and plans related to national spatial planning policies will be discussed in Chapter 7, policy direction acknowledges the challenge of land use conflicts, efficiency and capacity, urban settlement and expansion, and food security. As land inventory and asset management is already challenging at the local level, finding definite sources to estimate government-owned land at the national level, particularly those that could be used for settlement after production, protection and infrastructure lands are carved out. The prevalence of the conflict between built-up areas and settlements with areas protected for agriculture, natural resources, watersheds, and even areas prone to liquefaction and floods among other hazards limit the habitable areas in the Philippines.
The Philippine National Report for Habitat III attributes such realities to weaknesses in land use policy, administration and management. Aside from inconsistent construction standards, inconsistent land policies also affect the effectiveness of land assessors, possibly resulting in sub-optimal land and tax systems82. It does not only negatively affect city revenues but also inevitably a city’s housing program. As such, these constraints contribute to the increasing land costs, even resulting in an “artificial shortage of land” making housing developments either more expensive, very far, or worse, at risk in a poorly identified hazard zone.
Of the 20,171,899 household units occupied in the Philippines in 2010, almost 78% are owned or being amortized, while 9.6% explicitly rent. There are others however who rent for free
82 HUDCC. (2016). Philippine National Report to Habitat III: A New Urban Agenda: Better, Greener, Smarter Cities in a More Inclusive Philippines.
83 Philippine Statistical Authority. (2017). “Philippine Statistical Yearbook 2016.”84 Delmendo, L. (2016). “Philippines: nationwide house prices rising strongly, but Metro Manila’s CBD is slowing”
Retrieved from https://www.globalpropertyguide.com/Asia/Philippines/PriceHistory
with consent of the owner (10%) and those without consent (1.2%) while the rest are either not applicable or unreported83. While the monthly amortization for social housing (maximum Php 450,000) could be around USD 56 for about 30 years, an average monthly income of PhP 34,962 is needed to afford a monthly amortization of about USD 235 for an economic housing unit at PhP 2 million. This estimate is based on a 90% loan to value ratio at 5.7% interest for a period of 30 years84. It is important to note that construction costs figure prominently among other factors in the price of a housing unit, significantly affecting the affordability of purchase. While it would have been more useful to determine construction costs based on housing segment type, Table 48 provides average cost by housing type. On average, construction costs PhP 12,000 per sqm. Given these price points, it is crucial to consider that the poverty threshold for a Filipino family would be an average income of PhP 9,064.00 monthly and PhP 1,813.00 for individuals as of 2015, while the average income of the Filipino family is estimated at PhP 22,000.00. Of this income, 40% is spent on food while housing only gets 12.19% - much lower than the average in the West. Given the monthly amortization sample above, only population on the 9th and 10th deciles would be able to afford amortization for economic housing and above.
Table 48: Residential Construction Costs in 2016
Residential Type Price per square meter, PhP
Single 9,650
Apartment 8,124
Duplex/Quadruplex 9,996
Condominium 21,336
Source: Philippine Statistics Authority, 2017
82 | Financing for Resilient and Green Urban Solutions in Cebu, Philippines
The Initiative on Financing for Resilient and Green Urban Global Solutions (FRUGS)
While the inefficient land market severely affects the social housing sector, it also affects the affordability for low and middle income earners, who already face financing and tenure accessibility issues. One of the findings of the recent Philippine National Housing summit was the domination of the private sector of the production of housing units that inevitably, only those who can afford can avail. In 2015 alone, Table 47 shows that only 25.2% of units were produced for social housing. Cities that either lack or have a poorly implemented land use plan often result in an incompatible land mix, thereby affective overall livability85.
Inconsistent housing and land policies - A main challenge that besets developers and aspiring homeowners alike is the varied existing construction standards and consequent financing requirements. Literature and interviews concur that there is a need to streamline housing development processes and reduce transaction costs to protect consumers (developers and homeowners)86. The recent National Housing Summit’s concluding report articulates that housing “developers and community associations cited construction codes and subdivision restrictions as constraints to improving housing supply87.” Some suggest that it may take up to 18 months for private developers to secure all requirements. It was unanimous that making sense of these varying regulations was tedious and time-consuming. These are also aggravated by the titling and registration process that limit the acquisition of larger parcels of land for housing developments. These delays inevitably affect the unit cost of land and housing, its consequent implication on the ownership or rental of such units. As of 2011, there was no known audit of the impact of housing regulations to its cost and supply88. This becomes even more imperative
85 World Bank. (2016). Closing the Affordable Housing Gap: Policy paper for the national summit on housing and urban development.
86 Ballesteros, M. (2000). Land Use Planning in Metro Manila and the Urban Fringe:Implications on the Land and Real Estate Market. Philippine Institute of Development Studies. Discussion paper series no. 2000-20
87 National Summit Report (2016). 88 Monsod, T. (2011). Is Government Really Solving the Housing Problem? UP School of Economics.89 Ordinario, C. (2016). DBM cuts housing budget for 2017. Retrieved from http://www.businessmirror.com.ph/dbm-cuts-
housing-budget-for-2017/
in the pursuit of climate-resilient housing and communities.
As a regulatory body, HLURB is responsible for housing standards and land use. However, some of the rules conflict leaving a gray area for developers. For example, it follows both PD 958 and BP 220. Despite this constraint, interviews for this study with HLURB indicate that BP 220 is under review to even include green standards and harmonize with other building codes.
Complex governance arrangements and insufficient budget – Although shelter agencies like the Pag-Ibig fund capitalizes on its assets from member contributions and investments, other housing agencies rely on government appropriation. From 2000-2014, only 1.135% of the annual budget was allotted for housing or about PhP 23 billion annually, representing only 0.12% of Philippine GDP. HUDCC’s proposed budget for 2017 was even further cut to PhP 15.266 billion, which will be shared among the six agencies89. This does not bode well for a framework with already complex governance arrangements, which impedes its effectiveness. Although traditionally under the Office of the Vice President, the current administration issued Executive Order number 1, mandating HUDCC to be subsumed under the Office of the President’s Cabinet Secretary.
While mandates are seemingly distinct, a coherent delineation among national, provincial, regional and local functions is further needed to address housing needs and broader urbanization challenges. For example, although the LGC mandates that the function of land use planning and administration rests among LGUs, its regulation rests on HLURB, some land administration and management functions also rest with other national agencies, including
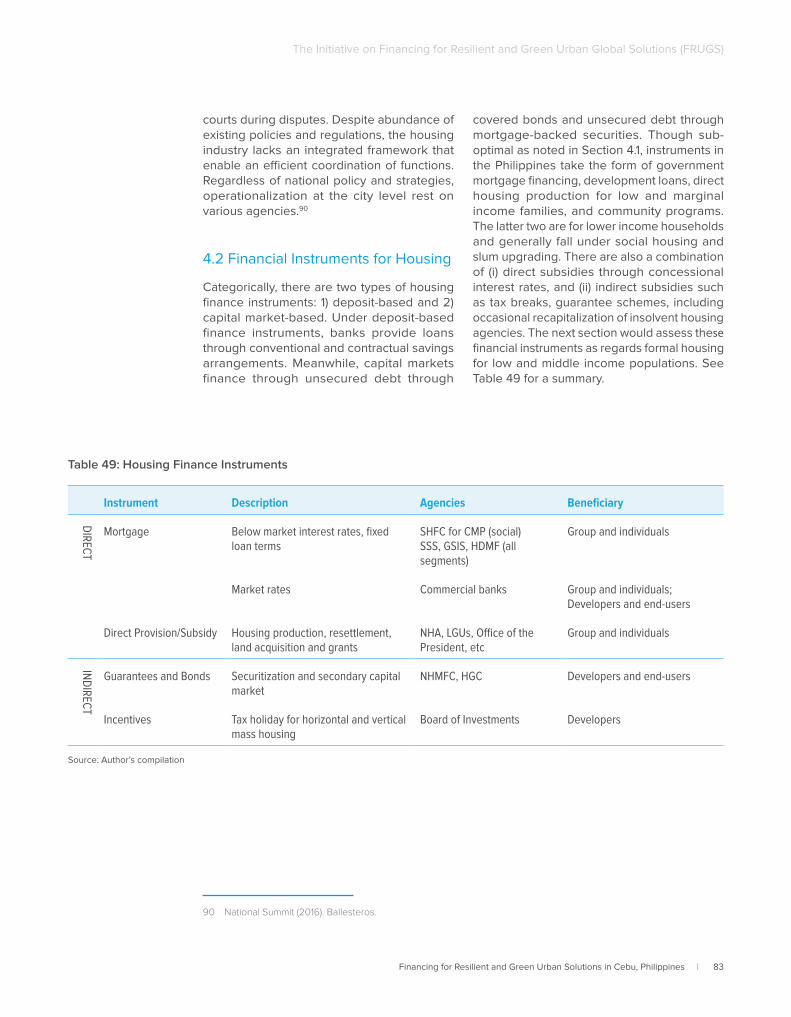
Financing for Resilient and Green Urban Solutions in Cebu, Philippines | 83
The Initiative on Financing for Resilient and Green Urban Global Solutions (FRUGS)
courts during disputes. Despite abundance of existing policies and regulations, the housing industry lacks an integrated framework that enable an efficient coordination of functions. Regardless of national policy and strategies, operationalization at the city level rest on various agencies.90
4.2 Financial Instruments for Housing
Categorically, there are two types of housing finance instruments: 1) deposit-based and 2) capital market-based. Under deposit-based finance instruments, banks provide loans through conventional and contractual savings arrangements. Meanwhile, capital markets finance through unsecured debt through
90 National Summit (2016). Ballesteros.
covered bonds and unsecured debt through mortgage-backed securities. Though sub-optimal as noted in Section 4.1, instruments in the Philippines take the form of government mortgage financing, development loans, direct housing production for low and marginal income families, and community programs. The latter two are for lower income households and generally fall under social housing and slum upgrading. There are also a combination of (i) direct subsidies through concessional interest rates, and (ii) indirect subsidies such as tax breaks, guarantee schemes, including occasional recapitalization of insolvent housing agencies. The next section would assess these financial instruments as regards formal housing for low and middle income populations. See Table 49 for a summary.
Table 49: Housing Finance Instruments
Instrument Description Agencies Beneficiary
DIR
ECT
Mortgage Below market interest rates, fixed loan terms
SHFC for CMP (social)SSS, GSIS, HDMF (all segments)
Group and individuals
Market rates Commercial banks Group and individuals; Developers and end-users
Direct Provision/Subsidy Housing production, resettlement, land acquisition and grants
NHA, LGUs, Office of the President, etc
Group and individuals
IND
IREC
T
Guarantees and Bonds Securitization and secondary capital market
NHMFC, HGC Developers and end-users
Incentives Tax holiday for horizontal and vertical mass housing
Board of Investments Developers
Source: Author’s compilation
84 | Financing for Resilient and Green Urban Solutions in Cebu, Philippines
The Initiative on Financing for Resilient and Green Urban Global Solutions (FRUGS)
4.2.1 Assessment of Financing Instruments for Formal Housing
In a study on housing demand undertaken in 2001, it was revealed that the Philippines is lacking in housing alternatives particularly for formal low-income housing91. Even then, the gap between housing demand and supply was brought about by the low capacity of households to pay for housing and land. Although there is long-term financing available from both the government and private financial institutions, these are constrained by various factors including formula lending (i.e. loan amount computed as percentage of income) or developer-lent financing that does not encourage prudence. These have been part of the underdeveloped mortgage market in the Philippines discussed in Section 4.1. As such, even if a few housing finance instruments exist, overall housing costs and alternatives to actual low-cost housing products must still be explored and be made available.
Assessing housing finance from the perspective of an aspiring homeowner, the deposit-based instruments available are through banks and the Pag-Ibig Fund. HUDCC issued a circular pegging the socialized housing ceiling at PhP 450,000.00 and is the maximum eligible amount for government concessional lending. Studies showed that this is also the most affordable amount for about 70% of the urban households living in Metro Manila, but not for the bottom 30% or those from areas outside NCR. The private sector developers though think this threshold is too low for them to be able to sell housing units resulting on a focus on housing production for low and middle income earners instead.
Given the study’s focus on the low and middle income earners, augmenting financing from either a loan from a bank or the Pag-Ibig fund seems sufficient at the surface. However, despite the menu of housing finance instruments available, it is the actual
91 Ballesteros, M. (2001). The Dynamics of Housing Demand in the Philippines: Income and Lifecycle Effects. Discussion paper series no. 2001-15.
92 Ren, S. (2016). Philippine Housing: Not Affordable; Worst Yet To Come, Warns Credit Suisse. Retrieved from http://blogs.barrons.com/asiastocks/2016/09/13/philippinehousingnotaffordableworstyettocomewarnscreditsuisse/
requirements and approved loan amount that make it questionable in the long-run. Both have lowered interest rates significantly yet loan approvals are evaluated by the applicant’s income vis-à-vis the loan value (i.e. formula-based lending). For example, with Pag-ibig Fund’s adjustment to include voluntary or self-employed workers, the basis for gross income can come from various sources. Though this adjustment allows those with sufficient income streams to access financing, it becomes questionable when irregular or non-liquid sources of incomes are included in the income assessment to increase the possible loan-to-value (LTV) ratio. Maximum loans range from 80% to 90% depending on the interest rate and period. However, including irregular income (e.g. non-salaries such as 13th month pay, bonus, interest from savings, inheritance etc) irresponsibly inflate an applicant’s income. Instead of providing opportunities, this is assessed as irresponsible for two reasons. First, the actual monthly income of the borrower can be less. Inflating the income through irregular sources that results in a higher approved loan results in a higher monthly due. This is alarming given the actual monthly percentage spent on housing may be higher than what the borrower can afford. 92 To abide by loan obligations, savings and other expenses will have to be reduced. Second, the likelihood of being unable to sustain payments from irregular income can make a loaner worse off over time. On months or years when such irregular income are unavailable, the monthly due remains the same. This can increase the already rising non-performing loans portfolio (see Chapter 5).
Despite having the Pag-Ibig fund as a loan facility to augment other housing finance options (e.g. private financial institution loans and personal savings), previous studies revealed that majority of the fund’s contributors are mostly the lower-income and self-employed members who “bear the burden of interest subsidies and default leakages thru lower
Financing for Resilient and Green Urban Solutions in Cebu, Philippines | 85
The Initiative on Financing for Resilient and Green Urban Global Solutions (FRUGS)
returns on their mandatory contributions.” Those who benefit from below-market rate mortgages are the higher-income members who are qualified to borrow. 93 This goes back to the issue of poor target beneficiaries and woes of a formula-based lending program noted in Section 4.1.
Another concern about end-user financing is the changing demographic and income sources of current and future homeowners. Such direct borrower schemes in the Philippines were designed in the 1980s when the traditional income source was through being a salaried employee and stay with the jobs until retirement. Although many families across the country acquired homes this way, the current generation are presented plenty alternative opportunities beyond permanent employment. Although it could technically be addressed by voluntary or self-employed memberships, a study on the housing preferences of the young is necessary. Among those interested to own a house, how many of them will be forced to keep a permanent job just to meet loan obligations? Although the private sector will continue to produce houses to meet the housing shortage per their computation, how many of the working age population in fact would opt to rent instead? Some private developers have rent-to-own schemes already94. Regulations covering the rental market have yet to be developed though already in the agenda of HLURB and HUDCC. Another issue is the affordability of payments over a shorter loan period. Some borrow late in life (unlike in their early 20s in the 1980s) shortening the loan period and increasing the monthly dues.
As such, for direct housing finance, the current and even innovative products of banks and shelter agencies make home ownership more accessible but need to be reviewed in terms of the borrower’s welfare and payment sustainability. While home ownership is now being approached from a rights-based perspective, such access to home ownership need not make a borrower worse off nor
93 Monsod, T. (2011). “Is Government Really Solving the Housing Problem?” UP School of Economics.94 ABS-CBN News. (2014). Robinsons Land Launches Lease-to-Own Program. Retrieved from: http://news.abs-cbn.com/
business/03/04/14/robinsons-land-launches-lease-own-program95 Llanto, G (1998). “A Study of Housing Subsidies in the Philippines”; Discussion paper series no. 98-42.
constrain other possible life choices.
4.2.2 Financing Sources and Flows for Formal Housing
Financing sources for formal housing are either directly to the housing beneficiaries or through the housing sector in general. Sources accessible to beneficiaries include a) below-market loans, b) below-market sales of public assets, c) grants and exemptions, and d) straight grants95. Beneficiaries of social housing and slum upgrading programs benefit from the last three while low to middle-income housing benefit from below-market loans through agencies such as the Pag-Ibig Fund. See section 2.3.1 for the take out amounts for the Philippines and Cebu City in particular. Meanwhile, the housing sector in general such as private developers and government shelter agencies also receive subsidies such as direct a) budgetary transfers, b) asset in-kind housing, c) institutional transfers to housing intermediaries, and d) institutional tax exemptions. As such, both end-users and agencies benefit from non-market financing such as government subsidies.
4.2.3 Assessment of Financing Instruments for Lower and Lower-Middle Income Population
The current framework of available financing instruments in the Philippines have been brought about by what the government thinks is needed and how it goes about providing this perceived need for lower and middle-income segments of the population. In the past, the framework governing financial instruments have also been pursued only in parallel with urban development arrangements inevitably affecting necessary urban infrastructure and services, largely provided outside the housing sector. This has been changing for the better policy-wise nationally and operationalized one LGU at a time.
86 | Financing for Resilient and Green Urban Solutions in Cebu, Philippines
The Initiative on Financing for Resilient and Green Urban Global Solutions (FRUGS)
Primary Mortgage Market. Philippine housing programs and plans always began with the need to address the growing housing shortage, particularly benefitting lower income households, urban poor and informal settler families. As such, the focus has been “on maximizing the output of new houses and sites for sale at below market prices via under-priced mortgages, development loans and guaranties, and other implicit and explicit government subsidies”96. It is important to note though that government subsidies to the housing sector has traditionally ranged more or less than 1 percent of annual GDP. Literature and interviews suggest that this approach merits a review of the government’s role in the housing sector especially in how it affects financing instruments for low and middle income segments of the population.
It was noted in Section 4.1 that the Philippine housing sector is marred by an underdeveloped mortgage market and inefficient land market. When the housing supply becomes responsive to effective demand at market prices, the housing market is close to functioning97. As the housing sector serves as an investment both for homeowners and developers, it requires sufficient insurance to mitigate risks such as market failures. These can be in the form of unsold inventories either due to lack of affordability (e.g. high land cost contributing to expensive units), poor access to financing primarily due to poor borrower credit information (e.g. low income) and loan defaults (e.g. increasing non-performing loans) among others. Although the Bangko Sentral ng Pilipinas (BSP) has put measures to mitigate risks for formal housing finance as will be discussed in Chapter 5, there are still income segments that fall off. Unfortunately, this often results in the low and middle income households being less served by formal housing finance instruments. Though not necessarily income poor, some households have to resort to social
96 Monsod, T. (2012). Rethinking Urban Housing Policy in the Philippines. Global Development Network97 Monsod, T. (2011). Is Government Really Solving the Housing Problem? UP School of Economics.98 Monsod, T. (2011). Is Government Really Solving the Housing Problem? UP School of Economics.99 See Llanto, G (1998). A Study of Housing Subsidies in the Philippines; Discussion paper series no. 98-42. Padojinog,
W. (2012). Housing Roadmap 2012-2030. SHDA. 100 Ignacio, A. (2015). Reaching Low-Income Households with Affordable Mortgage Finance. Kasagana-Ka Development
Center, Inc. and Microfinance Council of the Philippines.
housing programs due to sub-optimal access to housing finance. As such, there is a need to review housing finance eligibility to ensure that government resources are received by the truly destitute who cannot avail formal housing.
Secondary Mortgage Market. Also, due to below-market pricing for social and economic housing, including subsidized lending in the primary mortgage market, it has crowded out the participation of private developers and private financial institutions who have instead focused on middle-income and open market housing units.98 Although the secondary mortgage market has been gaining renewed support in recent years, its successive crises have yielded mixed support99 with lower income contributors and tax payers, bailing these government institutions out. Similarly, as the coverage of government social housing subsidies has been insufficient to cover the need, microfinance organizations have been working with civil society organizations to provide micro mortgages. In this approach, wholesale financing institutions link with financial service providers for low income households to bridge beneficiaries to the formal mechanisms of mortgage and non-mortgage financing.100 Pagtambayayong Foundation has engaged in similar activities in Cebu City. This alternative housing finance instrument also functions under the BSP’s guidelines on housing microfinance.
Despite these financing instruments, the government’s focus on housing production with below-market pricing and housing finance subsidies through the years have not resulted in overcoming the annual shortage. Although social housing beneficiaries welcome the various slum upgrading programs of the government, there is still a need to make the housing market more efficient by removing barriers to producing housing units and making housing affordable for all.

Financing for Resilient and Green Urban Solutions in Cebu, Philippines | 87
The Initiative on Financing for Resilient and Green Urban Global Solutions (FRUGS)
Direct Subsidies. One way to make the housing market more efficient is to understand the cost and incidence of such government subsidies. This includes assessing the incentive structures that govern the several actors of the housing sector from the KSAs, private banks and developers, LGUs, and the aspiring homeowners. As noted throughout this report, the role of the private sector has been focused on serving the needs of the low, middle and higher income housing segments. As the government only extends about 1% of its annual GDP to the housing sector and general scarcity of economic sources, it is crucial to review the incentive structure to engender private sector participation in housing production and financing across all segments. Instead of just pouring subsidies to poorly targeted beneficiaries and increase the budget allocation, it will be worthwhile to undertake a holistic review of the housing sector’s regulatory framework and incentive structure towards engendering behavior that provides affordable housing for all.
Alternative Instruments. Aside from reviewing the regulatory framework and incentive structure of the housing sector, there is a need to look into the underdeveloped rental market. Although the Philippine Rent Control Act of 2009 has been in place and updated, it largely serves the interests of lower income segments. As noted in Chapter 2, there is an increasing rental housing demand from low to middle income segments due to change in lifestyles especially in urban areas. A study undertaken in 2004 echoes similar findings101.
Similarly, another approach is to strengthen the housing sector’s linkage with broader urban governance and development. Although this connection has been present in the mandate of HLURB and its required formulation of land use plans of LGUs and issuance of license to sell permits, the housing sectors linkage with the infrastructure sector and the needed services, which various government agencies and private institutions provide are weakly reflected
101 Ballesteros, M. (2004). Rental Housing for Urban Low-Income Households in the Philippines. Discussion paper series no. 2004-47. Philippine Institute for Development Studies; Ballesteros, M. (2016). Rent Control in the Philippines: An Update. Discussion paper series no. 2016-40. Philippine Institute for Development Studies.
in planning and actual developments. As such, government intervention need not be limited to reviewing appropriate regulations, taxes, and subsidies but also strengthening land and property market institutions to engender urban infrastructure connectivity and broader socio-economic development. This need has been reflected in the Philippine National Report to Habitat III and articulated in specific goals to be discussed in Chapter 7. As section 5.2 will also demonstrate, the housing sector can also serve as an economic multiplier and can complement the government’s broader goals of supporting secondary cities to ensure inclusive growth across the country.
4.2.4 Financing Sources and Flows for Lower and Lower-Middle Income Population
For this study, the lower-middle income population refers to semi-professionals and craftsmen with rough average of standard of living. Most are college-educated and are white collar workers. The housing finance sources and flows for lower-middle income segment has been discussed in Section 2.3.1. Meanwhile, the lower income population refers to the working class who are mostly clerical and blue-collar workers. Most of the lower income earners have varied standards of living with just enough earnings.
Across income segments in the Philippines, housing is often financed with personal savings with a combination of either a loan (for low-middle income households) or a social housing subsidy for the lower income population. These subsidies come in grants, direct housing provisions through the NHA, below-market risk insurance, low interest mortgages (e.g. community mortgage programs), tax exemptions, shelter programs and slum upgrading programs of the LGU. As noted above, urban poor in select cities also benefit from the support of people’s organizations and CSOs for microfinance. Despite these financing sources, a series of studies through
88 | Financing for Resilient and Green Urban Solutions in Cebu, Philippines
The Initiative on Financing for Resilient and Green Urban Global Solutions (FRUGS)
the years revealed that these have not resulted in benefits for low and lower-middle income households in the scale necessary102. For reasons discussed earlier in this section, literature and interviews have consistently called for a review of regulations governing the housing finance sector, particularly towards a more favorable environment for low income segments to access financing for more affordable housing units. This can correct housing market inefficiencies103.
4.3 Financing Instruments for Infrastructure and Urban Services
Traditional: local revenue, national-local transfers, PPP. Historically, local governments rely on transfers from the national government combined with loans or grants from international development partners and government development banks due to their poor ability to mobilize resources for basic infrastructure and services. Local capacity is often weak in public sector management, financial management, taxation, debt financing and especially structuring PPP projects. More often than not, the proponent of PPP projects in the Philippines is the national government. Since the PPP program was revived, only two projects were initiated by LGUs although countless national PPP projects benefit plenty LGUs104.
In the case of Cebu City, being the 4th richest city in the Philippines, it is not about not having enough revenue but optimizing tax collections further and allocating such resources to more green and resilient solutions. For example, to address growth needs, the Cebu City government undertook a loan for the South Road Properties development area initially at PhP 2.3 billion in 1995. Although Cebu City is unique due to its Metro Cebu membership,
102 Monsod, T. (2011). Is Government Really Solving the Housing Problem? UP School of Economics.; Llanto, G. and Orbeta (2001). Ballesteros, M. (2011). Fiscal costs of subsidies for socialized housing programs: an update. Philippine Institute for Development Studies Policy Notes. No. 2011-14 (July 2011)
103 Palana, A. (2015). Improve housing finance access for poor – study. Retrieved from http://www.manilatimes.net/improve-housing-finance-access-for-poor-study/187279/
104 PPP Center. (2016). Status of PPP Projects as of 16 November 2016. Retrieved from http://ppp.gov.ph/wp-content/uploads/2016/11/MISD_20161117_TABLE_status-of-ppp-projects-as-of-nov1uti
105 JICA. (2015). The Roadmap Study for Sustainable Urban Development in Metro Cebu.
it has been able to benefit from a number of donor-financed initiatives on behalf of the entire metropolitan area. These come in the form of either loans or grants to assess city needs (e.g. solid waste management) or construct physical infrastructure. Structuring the infrastructure investment through Metro Cebu also expands the scale of the project, making it attractive to investors, increases the beneficiaries, and positively affects returns on the investment.
Climate Finance. As discussed in Chapters 1 to 3, Cebu City and Metro Cebu have been utilizing climate finance funds aside from traditional financing instruments to pay for its urban infrastructure and services. Examples include CIF funds for the BRT and UNFCCC funds for solid waste management. As such, Cebu City and Metro Cebu in general have been quite ahead in accessing blended finance and availing innovative green financing through government, private, and development financial institutions for their urban infrastructure and services (e.g. water and waste management) though there is still room for increased use (e.g. GCF, green bonds etc). As noted earlier, it would be useful to have an inventory of materialized ODA-funded urban infrastructure projects in Cebu City, whether planned (e.g. present in the CLUP) or unplanned.
Utilization of green financing instruments also demonstrates Cebu City’s and Metro Cebu’s inclination to maximize co-benefits from climate-resilient infrastructure and broader sustainability of green urban services. This is manifested in the previously discussed Mega Cebu Roadmap’s aim of having a smart city region towards a sustainable future105 and Cebu City’s local climate change adaptation plan to be discussed in Chapter 7 among others. Although the Philippine national government
Financing for Resilient and Green Urban Solutions in Cebu, Philippines | 89
The Initiative on Financing for Resilient and Green Urban Global Solutions (FRUGS)
has countless commitments and plans towards climate resilience and the various sector agencies are attempting these (e.g. green building code for DPWH or green procurement for DOE/DENR), there is still a need to ensure an enabling environment for green financing at the LGU level. As these financial instruments are fast evolving and the existing regulatory framework may not evolve as quickly, there is a constant need for improved capacity building. This would be both for planning, structuring, implementing and even for awareness-raising and appreciation from the community.
As discussed in Chapter 1, most LGUs do not rely on local revenues to finance urban infrastructure though these are also sources for overhead expenditures related to urban services. Given that there is low reliance on local financing instruments and instead high reliance on either nationally undertaken projects or external financing options, it appears that LGUs also do not maximize available financing from the capital market as well, in general. These could stem from lack of economies of scale for the project, limited understanding of available options from the capital market, especially, sector specific information.
Issues and Opportunities. As discussed in Chapter 1, the LGC devolved a number of functions to LGUs, including the delivery of basic infrastructure and services. While the city government enables the building of primary infrastructure, secondary infrastructure such as water, sewerage, and energy connections are the responsibility of private developers.106 However, there is a mismatch between the LGU’s tax base and sources of revenues and the functions it must pay for. As national to local transfers are formula-based, LGUs that have higher shares of IRA also tend to be more relaxed about their tax collection efforts. LGUs that have access to external financing for their infrastructure needs are also beset by the same behavior. This reality calls for the
106 Llanto, G. (1999). Housing Policy, Strategy and Recent Developments in Market-based Housing Finance. Philippine Institute for Development Studies. Discussion paper series no. 99-20
107 Manasan, G. (2004). Local Public Finance in the Philippines: In Search of Autonomy with Accountability. Discussion paper series no. 2004-42
108 LWUA. (2016). “What is LWUA?” Retrieved from http://www.lwua.gov.ph/about_lwua_14/what%20is%20lwua.html.
need to review and strengthen the regulatory framework that governs LGU borrowing to maximize opportunities from capital investment financing, especially through intergovernmental transfers.107 As such, it has become more convenient to rely on MCDC or donor-supported PPP arrangements for financing infrastructure.
Financing instruments for transport, energy, power, water and waste management are generally the same such as national-local transfers, loans, grants and local revenues. However, there are also sector specific financing instruments or sector-induced funding availability. For example, RA 9003 mandates solid waste management compliance among LGUs. In pursuit of having sanitary landfills and MRFs among others, LGUs could group themselves together for a bigger project scale, not only for ROI and more attractive to PPP proponents but also to have a wider reach of beneficiaries. Similarly, the Local Water Utilities Administration (LWUA) is an independent government owned and controlled corporation with a financial, technical and institutional development function and competence to enable water provision in districts outside the National Capital Region (NCR)108. It has been financing water supply projects from national government funds, official development assistance, internally-generated funds, and more recently, from private financing institutions since 1973. In Cebu, LWUA works with MCWD. Another innovation in the water sector is financing through the Philippine Water Revolving Fund (PWRF). It was established to manage the transition towards market-based lending in the water sector, particular to leverage limited public resources for private sector financing to enable more affordable water access that is at the same time acceptable to private financing institutions and create a revolving fund in the process. Without doing away with ODA and national-local transfers entirely, it will engender
90 | Financing for Resilient and Green Urban Solutions in Cebu, Philippines
The Initiative on Financing for Resilient and Green Urban Global Solutions (FRUGS)
blended finance, participation of private sector and access to capital markets109. In the energy and power sectors, countless government agencies are involved. As such, an inventory of institutions that directly facilitate financing instruments by sector to LGUs either directly or through indirect coverage (e.g. sector departments) would be very useful.
4.4 Scale and Volume of Finance
4.4.1 Assessing the scale and volume of financing involved in each financial instrument in Cebu City
As noted elsewhere in the report, Cebu City has stable local revenue sources and has even exceeded its revenue targets for 2016. However, its non-local revenues, especially external receipts, including ODA, are much higher than its locally-sourced income. These international finance flows will be further discussed in Section 4.6. Given the lack of existing studies or inventory of how past and current infrastructure has been financed, an accurate assessment of the scale and volume of financing per instrument is difficult to determine. Similarly, the lack of an official CLUP, which indicates the financing plan of each intended infrastructure makes the assessment of scale and volume less accurate. However, a review of annual investment plans could be a good start.
109 Llanto, G. (2015). Development Finance and Aid in the Philippines: Policy, Institutional Arrangements and Flows. Philippine Institute for Development Studies. Discussion paper series no. 2015-10.
4.5 Patterns of Financing Instruments to Cebu City Characteristics
4.5.1 Assessing the potential connection and patterns of financing instruments in relation to the types of economic systems, economic development stage, household income, urban policies, national policies and regulation, national financial systems, and financial markets.
To recap, Chart 3 shows the different financing instruments accessible to cities from local sources, national transfers, and from capital markets. Following discussions in Chapters 1-3, financing instruments for urban infrastructure common to Cebu City have been from local revenues and transfers from the national government, and loans from GFIs and ODA. Social housing benefits from national and local government subsidies under shelter programs have addressed its housing needs. As for low and middle income housing units, end users access long-term loans from PFIs and the Pag-Ibig fund while developers also take loans from PFIs and also avail of a series of tax exemptions, subsidies, and grants from government agencies as applicable. Though there are innovative and green housing finance options available, interviews for this report revealed that both end-users and developers have not availed of these instruments yet. Meanwhile, there is a specific capital market for LGUs. As discussed in Chapter 1, the Local Government Code authorizes Philippine LGUs, such as cities, to issue, to place, sell, redeem and retire bonds. These will be fully guaranteed by the national government through the approval of the Secretary of the Department of Finance while abiding by the Bangko Sentral ng Pilipinas guidelines. The LGU Guarantee Corporation likewise provides a credit rating and guarantee mechanism in place. However, despite this option, very few LGUs have financed their infrastructure through this instrument.
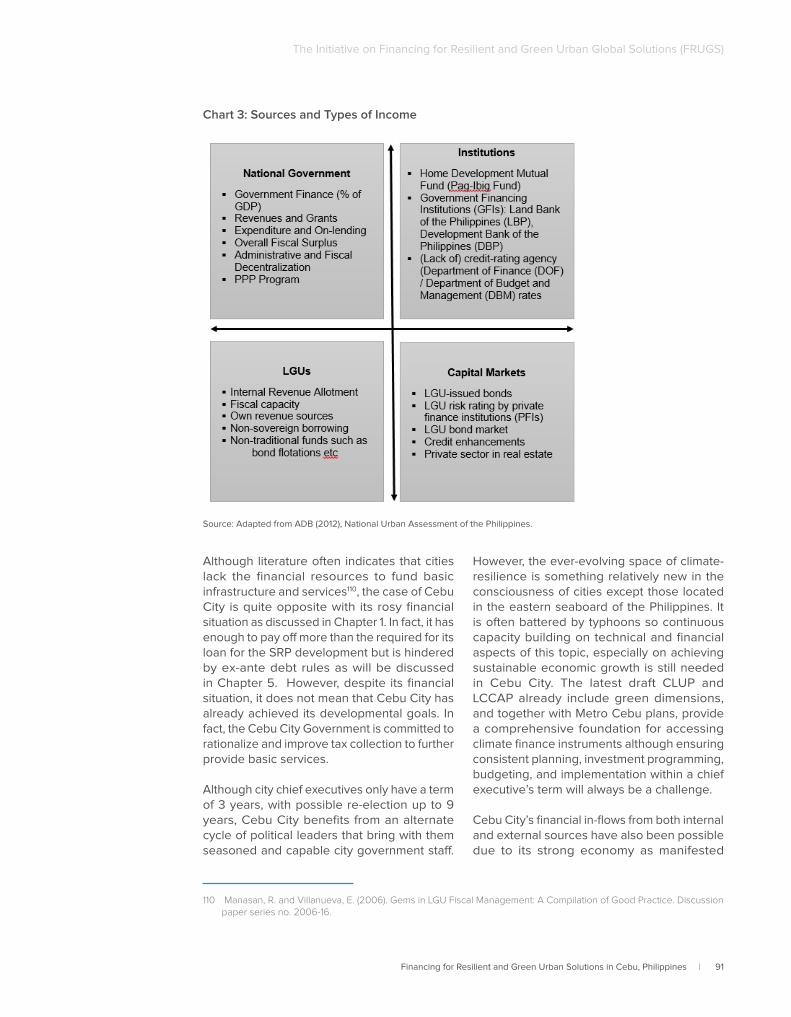
Financing for Resilient and Green Urban Solutions in Cebu, Philippines | 91
The Initiative on Financing for Resilient and Green Urban Global Solutions (FRUGS)
Chart 3: Sources and Types of Income
Although literature often indicates that cities lack the financial resources to fund basic infrastructure and services110, the case of Cebu City is quite opposite with its rosy financial situation as discussed in Chapter 1. In fact, it has enough to pay off more than the required for its loan for the SRP development but is hindered by ex-ante debt rules as will be discussed in Chapter 5. However, despite its financial situation, it does not mean that Cebu City has already achieved its developmental goals. In fact, the Cebu City Government is committed to rationalize and improve tax collection to further provide basic services.
Although city chief executives only have a term of 3 years, with possible re-election up to 9 years, Cebu City benefits from an alternate cycle of political leaders that bring with them seasoned and capable city government staff.
110 Manasan, R. and Villanueva, E. (2006). Gems in LGU Fiscal Management: A Compilation of Good Practice. Discussion paper series no. 2006-16.
However, the ever-evolving space of climate-resilience is something relatively new in the consciousness of cities except those located in the eastern seaboard of the Philippines. It is often battered by typhoons so continuous capacity building on technical and financial aspects of this topic, especially on achieving sustainable economic growth is still needed in Cebu City. The latest draft CLUP and LCCAP already include green dimensions, and together with Metro Cebu plans, provide a comprehensive foundation for accessing climate finance instruments although ensuring consistent planning, investment programming, budgeting, and implementation within a chief executive’s term will always be a challenge.
Cebu City’s financial in-flows from both internal and external sources have also been possible due to its strong economy as manifested
Source: Adapted from ADB (2012), National Urban Assessment of the Philippines.
92 | Financing for Resilient and Green Urban Solutions in Cebu, Philippines
The Initiative on Financing for Resilient and Green Urban Global Solutions (FRUGS)
in various industries (e.g. trade, transport, tourism, real estate etc) and banking sector. As discussed in Chapter 1, Cebu City benefits from a young and highly educated labor force that fuels its economy, including the blossoming BPO sector. Although there is still poverty incidence in the city as evidenced by its very active slum upgrading and settlement relocation programs, Cebu City still has one of the highest deposit levels at private banks across the country. It also has one of the lowest levels of non-performing loans.
Despite national policies and regulations, Cebu City has also demonstrated access to various forms of climate finance long before the Paris Agreement in 2015 making it quite ahead of other LGUs. Given the population and economic growth of Cebu City, infrastructure investment projects have a scale big enough to reap a sizeable ROI and at the same time combine BAU infrastructure needs with low-carbon and climate-resilient benefits.
4.6 International Finance
4.6.1 Assessing the financial flows and trends of international finance and international aid in and to Cebu City
International finance flows and trends referred to in this study is official development assistance (ODA). Through RA 8182, as amended by RA 8555 or the ODA Act of the Philippines, the government may contract foreign loans and receive grants with governments of foreign countries with whom the Philippines has diplomatic and/or trade relations and/or are members of the United Nations system. ODA refers to either loans or grants with the goal of socio-economic development in favor of Philippine needs. These are channeled and used for development programs and projects at the national and local levels. Based on a paper published in 2009, only less than 1% of ODA to the Philippines went to LGUs. The national
111 Brillantes Jr., A, Llanto, G. and Alonzo, R., (2010). Access to Official Development Assistance (ODA): Status, Issues, and Concerns. Discussion paper series no. 2010-10.
112 NEDA. (2015). CY 2014 ODA Portfolio Review: Regional Distribution of the GPH ODA (Loans and Grants) Portfolio.
government received 65%, government owned and controlled corporations received 22% and 13% respectively in 2006111. Of the 19 ODA projects at the LGU level in 2009, four were from KfW. In 2014, the Philippines received a total of Php 338,139.64 worth of ODA, with Php 297,940.41 million and Php 40,199.24 for loans and grants respectively112. (See Annex 8 for ODA flows by source and sector.) For the same period, Central Visayas Region, of which Cebu City belongs to, received 8.95% of overall ODA, receiving 9.46% of total loans and only 5.19 % of total grants.
The dismal proportion of ODA LGUs receive have been attributed to low capacity to assess, design and conceptualize proposals to access and manage ODA funds. Often times, LGUs also need technical assistance to even undertake a pre-feasibility study. ODA procedures per se are also deemed complicated with LGU staff often unfamiliar with the process. This unfamiliarity with procedures is also coupled with general lack of information on ODA application and implementation requirements.
Cebu City though, together with Metro Cebu and the Cebu Provincial Government has also received significant ODA for their infrastructure projects whether directly or indirectly. As discussed in Section 1.7, in 2015, 77% of Cebu City’s income came from external revenue, with 65% comprised of receipts, grants, donations, and aid. Cebu City together with Metro Cebu benefit from international aid in a variety of modalities such as loans and grants for infrastructure and capacity building.
Although NEDA issues an annual ODA portfolio review, it is presented by sector, donor and by region not by LGU. In the latest review issued in 2014, only Cebu City’s BRT project with the World Bank undertaken through the Department of Transportation was listed. AfD is a co-funder but its contribution is administered by the World Bank. What is lacking is a database and a further assessment of a city’s specific ODA (loan and grants) portfolio whether
Financing for Resilient and Green Urban Solutions in Cebu, Philippines | 93
The Initiative on Financing for Resilient and Green Urban Global Solutions (FRUGS)
directly engaged or indirectly benefiting as the proponent is another entity other than the Cebu City Government. However, gathering from literature on Metro Cebu and neighboring LGUs, international aid flows that benefit Cebu City should be high. For example, AfD is expected to finance an Urban Water Supply and Sanitation project for Metro Cebu and Metro Davao amounting to USD 54 million113. Japan, as the Philippines’ largest bilateral partner also has a strong presence in Cebu both for financing actual urban infrastructure and providing technical assistance. It has supported the Cebu-Mactan International Airport and the Mega Cebu Roadmap study among many others.
To assess international aid flows to Cebu City, it is not only essential to have a clear and comprehensive portfolio as noted above but also it is essential to review project completion reports at the very least. While this has been done at a national level, no similar recent study has been done for Cebu City. In an evaluation of ODA nationwide done in 2008, it was revealed that economic returns were often overestimated during appraisal stage and the actual economic returns after completion are often significantly lower114.
4.7 Assessing City Financing Challenges
This sub-section will investigate the challenges that cities face in financing the growing demand for housing and the necessary physical and social infrastructure.
4.7.1 Macro level challenges (e.g. national regulatory, policy constraints, financial market volatility, transparency and accountability issues)
Chapter 5 discusses the impact of housing and urban infrastructure finance to the
113 Brutas, K. (2016). Top development aid donors to the Philippines. Retrieved from https://www.devex.com/news/top-development-aid-donors-to-the-philippines-2015-89091
114 Landingin, R. (2008). 7 in 10 ODA projects fail to deliver touted benefits. Retrieved from http://pcij.org/stories/7-in-10-oda-projects-fail-to-deliver-touted-benefits/
Philippine financial system. While the macro-level financial system is generally stable and even considered to be growing, monitoring specific sectors, particularly those at the nexus of real estate and the banking sector is necessary. The BSP continues to ensure that improvements in the financial regulatory frameworks are present. For example, with the increase in technology-based transactions, the BSP has initiated increased digital surveillance and mechanisms to deter money-laundering and fraud.
At the national level, regular reports on the various risk management mechanisms the BSP employs are easily accessible. However, not all city-level data are available publicly unlike from the Bureau of Local Government Finance of the DOF. For example, the residential real estate pricing index is reported based on two geographical groupings: the National Capital Region and Areas outside the National Capital Region. If the portfolio at the LGU level is low, at least reporting based on metropolitan arrangements might be useful. While not yet a challenge per se, having such data would be useful for urban development planners both from the public and private sectors as well as homeowners.
Another challenge noted earlier that requires macro-level regulation is the rental market. Rental market regulation in the Philippines is virtually non-existent although the HLURB is already looking into the matter. Due to the changing demography, lifestyles income streams, and need for mobility, homelessness is not necessarily mitigated by homeownership but by renting. The burgeoning rental market in the Philippines is primarily driven by the need for affordable and convenient worker and student accommodation and as an investment for passive and recurring income. According to one study, 69% of Filipinos prefer to rent than to buy a home. This is also complimented by the rental demand of expatriates from multinational corporations and diplomatic circles in urbanized
94 | Financing for Resilient and Green Urban Solutions in Cebu, Philippines
The Initiative on Financing for Resilient and Green Urban Global Solutions (FRUGS)
areas. In the CBDs of Metro Manila, 3-bedroom rental unit rental rates ranged from PhP 640 to PhP 1,070 per sqm in 2016, declining within the range of 1.86% to 2.15% in the 1st quarter of 2017. It is expected to decline further in 2018 by at least 1.24%115. Vacancy rates in the same areas account for 6% to 14% of overall inventory. Aside from 3-bedroom units, there is also an oversupply of studio and one-bedroom units which are increasingly being leased out by either developers or homeowners to long-term and short-term tenants, which are especially convenient for overseas Filipinos. A number of upcoming properties being developed are also deliberately for the rental market or serviced apartments116. As of March 2017, gross rental yields in Manila stayed at 7.04% for 30 sqm units and 7.72% on 80 sqm condominium units117. However, these earnings are before capital gains, rental income tax, and value added tax. Although there are certain exemptions, owners opting to rent must consider these additional costs which is inevitably passed on to the renters.
The complex national regulatory framework of the housing institutions also further challenge financing instruments for housing and urban infrastructure provision in the Philippines. The conflicting standards also stem from the various legal bases for housing rules that cover both financial institutions and real estate developers. As noted earlier, the complex regulatory framework and mandates of the KSAs result in market efficiency, which inadvertently affect housing provision and affordability.
4.7.2 Sectoral challenges (e.g. market, demand, volume, technology, financial management)
Condominium sales based on License to Sell Permits issued have also been declining
115 Colliers International. (2017). “Colliers Quarterly Philippines Residential.1Q 2017.” 116 JLL. (2017). “Philippine Property Market Monitor, May 2017.”117 Delmendo, L. (2016). “Philippines: nationwide house prices rising strongly, but Metro Manila’s CBD is slowing”
Retrieved from https://www.globalpropertyguide.com/Asia/Philippines/PriceHistory118 Montealegre, K. (2016). Demand for affordable housing remains unmet: Colliers Ph. Retrieved from: http://www.
bworldonline.com/content.php?section=Corporate&title=demand-for-affordable-housing-remains-unmet-colliers-phl&id=122940
119 Ren, S. (2016). Philippine Housing: Not Affordable: Worst Yet To Come, Warns Credit Suisse. Retrieved from http://blogs.barrons.com/asiastocks/2016/09/13/philippinehousingnotaffordableworstyettocomewarnscreditsuisse/
since 2012 resulting in unutilized inventory especially for the middle income segments118. However, this is not a result of low demand but inappropriately produced units compared to what is needed. Credit Suisse even estimates a decline in condominium pre-selling until 2018119. There is a higher demand for economic or low income housing but the units for sale are unaffordable. The mismatch between housing demand and housing supplied remains a sector challenge that not only affect the current sales and pricing but the future production of low and middle income housing as well. Table 50 provides a housing price and production matrix for comparison. While actual housing unit price varies, it indicates the industry accepted maximum price range for each segment. The table also shows housing production by segment based on LTS issuances. Based on issuances in 2016, the economic and low housing segments had the highest issuances next to social housing. Despite affordability and amortization concerns, it is a positive development to have an inventory of the needed housing segments. Unfortunately, latest data to estimate housing quality through construction materials is only available for 2010. With nationwide total of 19,715,695 housing units, 45% had concrete or brick homes, while both wood and bamboo were used by 18% each and another 16% using half concrete and half natural material. The remaining percentage use glass, asbestos or have no walls at all. These figures are alarming as less than 50% are built of strong materials. It would also be useful to have a survey of residences constructed after 1992, when the building code was revised to improve structural integrity and to survive 9.0 magnitude earthquakes. This is also where data on self-built or non-engineered homes become important.
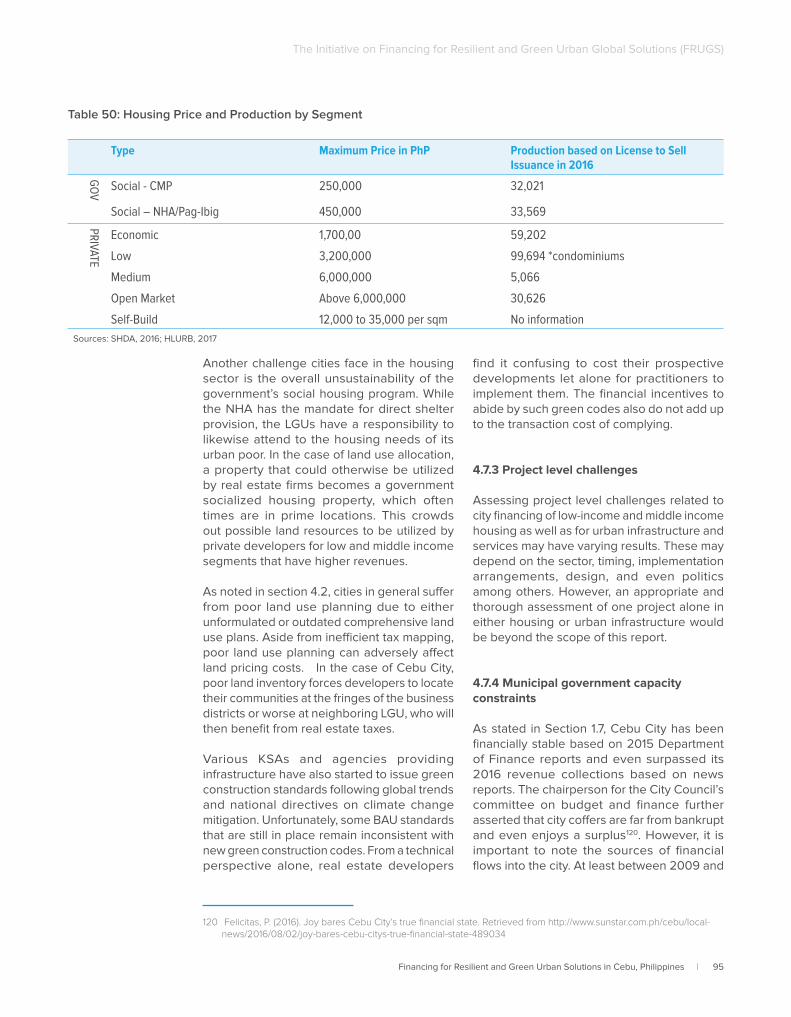
Financing for Resilient and Green Urban Solutions in Cebu, Philippines | 95
The Initiative on Financing for Resilient and Green Urban Global Solutions (FRUGS)
Table 50: Housing Price and Production by Segment
Type Maximum Price in PhP Production based on License to Sell Issuance in 2016
GO
V Social - CMP 250,000 32,021
Social – NHA/Pag-Ibig 450,000 33,569
PRIVATE
Economic 1,700,00 59,202
Low 3,200,000 99,694 *condominiums
Medium 6,000,000 5,066
Open Market Above 6,000,000 30,626
Self-Build 12,000 to 35,000 per sqm No information
Sources: SHDA, 2016; HLURB, 2017
Another challenge cities face in the housing sector is the overall unsustainability of the government’s social housing program. While the NHA has the mandate for direct shelter provision, the LGUs have a responsibility to likewise attend to the housing needs of its urban poor. In the case of land use allocation, a property that could otherwise be utilized by real estate firms becomes a government socialized housing property, which often times are in prime locations. This crowds out possible land resources to be utilized by private developers for low and middle income segments that have higher revenues.
As noted in section 4.2, cities in general suffer from poor land use planning due to either unformulated or outdated comprehensive land use plans. Aside from inefficient tax mapping, poor land use planning can adversely affect land pricing costs. In the case of Cebu City, poor land inventory forces developers to locate their communities at the fringes of the business districts or worse at neighboring LGU, who will then benefit from real estate taxes.
Various KSAs and agencies providing infrastructure have also started to issue green construction standards following global trends and national directives on climate change mitigation. Unfortunately, some BAU standards that are still in place remain inconsistent with new green construction codes. From a technical perspective alone, real estate developers
120 Felicitas, P. (2016). Joy bares Cebu City’s true financial state. Retrieved from http://www.sunstar.com.ph/cebu/local-news/2016/08/02/joy-bares-cebu-citys-true-financial-state-489034
find it confusing to cost their prospective developments let alone for practitioners to implement them. The financial incentives to abide by such green codes also do not add up to the transaction cost of complying.
4.7.3 Project level challenges
Assessing project level challenges related to city financing of low-income and middle income housing as well as for urban infrastructure and services may have varying results. These may depend on the sector, timing, implementation arrangements, design, and even politics among others. However, an appropriate and thorough assessment of one project alone in either housing or urban infrastructure would be beyond the scope of this report.
4.7.4 Municipal government capacity constraints
As stated in Section 1.7, Cebu City has been financially stable based on 2015 Department of Finance reports and even surpassed its 2016 revenue collections based on news reports. The chairperson for the City Council’s committee on budget and finance further asserted that city coffers are far from bankrupt and even enjoys a surplus120. However, it is important to note the sources of financial flows into the city. At least between 2009 and
96 | Financing for Resilient and Green Urban Solutions in Cebu, Philippines
The Initiative on Financing for Resilient and Green Urban Global Solutions (FRUGS)
2015, main sources of non-local revenues were from lot sales of the reclaimed South Road Properties. As indicated in Cebu City’s statement of income and expenditures, PhP 656.06 million were earned from real property taxes and another PhP 328.82 million from other receipts (Annex 6), which included SRP land sales. The various lots have been sold to different private developers at different prices and payment terms. Some are payable in six years while some in 18 years. It is worth looking into the effect of SRP lot sales and overall balance of revenue sources for sustainable financing of urban services. Looking into the capacity for sector-based financial planning of Cebu City would be worthwhile. For example, looking into user fees, tariffs and other income from the provision of urban services. In the meantime, the current administration has also expressed pursuing improved tax mapping and assessment initiatives to improve its financial situation.
While there is no apparent or glaring constraint regarding finance flows into Cebu City, these statements have mostly been based on business-as-usual forms of revenues. Although Cebu City and Metro Cebu in general can be considered experienced in public financial management through its countless development cooperation projects, it will need to improve its understanding of the already complex and evolving housing and urban infrastructure financing policies with a climate-resilient lens. To be able to abide by national government policies on climate change adaptation, at the same time enjoy continuous environmentally sustainable growth while providing adequate urban services, the city government can benefit from a deeper understanding of the financing mechanism and revenue – generating activities related to pursuing a climate-resilient growth path.
Financing for Resilient and Green Urban Solutions in Cebu, Philippines | 97
The Initiative on Financing for Resilient and Green Urban Global Solutions (FRUGS)
Chapter 5
Impacts of Financing Instruments at the Financial System
98 | Financing for Resilient and Green Urban Solutions in Cebu, Philippines
The Initiative on Financing for Resilient and Green Urban Global Solutions (FRUGS)
Chapter 5 examines the impacts of such financial instruments on the Philippine financial system. Discussions will particularly include an assessment of the sustainability and resilience of the financial system. The aim is to prevent overheating of the housing market because it would lead to a rise in prices and which threatens housing affordability.
5.1 Impacts on the Financial System
5.1.1 Assessing the impacts of financial instruments at the financial system level, particularly on the sustainability and resilience of the national financial system
By the end of 2016, the Philippine financial system continued to be sound and stable marked by continuous asset expansion, improved asset quality, adequate liquidity, and strong core earnings121. Total resources of the Philippine financial system stood at PhP 15.8 trillion, 9.6% higher than 2015’s PhP 14.4 trillion, and a 61.7% expansion from the recorded level at the end of 2012. Of these resources, 81.2% were from banks and is an increase from 2015’s 79.6% share of bank resources. GDP/bank credit ratio was also at 49.9% indicating the main role of banks in fueling the domestic credit economy. Meanwhile, financial services accounted for 9.5% compared to 2015’s 7.2% share. The BSP notes that since 2011, the banking system has remained to be the main credit provider to the Philippine domestic economy. The Philippine banking system assets stood at 12.2% year-on-year to Php 12.5 trillion, with PhP 8.0 trillion for Php deposits (an 11.7% year on year increase) and equity at PhP 1.5 trillion, a 6.4% expansion. As of June 2016,
121 Bangko Sentral ng Pilipinas. (2016). Status Report, June 2016), Office of Supervisory Policy Development. Manila.
the banks recorded a positive bottom line of PhP 78.1 billion and capital adequacy ratio of 16.1%. As such, the BSP has actively supported the development of the domestic capital market through surveillance databases on banks’ intraday liquidity, repo, and derivatives transaction as well.
The Philippines grew up to 6.8% in 2016 thanks to stable domestic demand, with growth in 2017 expected to be more average at 6.4% to 6.6%. There has also been an increase in fixed investments as a contributor to GDP growth with a ratio of 23.8%. Private consumption has also been increasing from 6.3% in 2015 to 6.9% in 2016, providing 70% of GDP growth in 2016. Despite benign inflation at an average of 1.9% in 2016, it is still within the range set by the BSP.
Nationwide, the deposit portfolio stood at PhP 10,504 billion, a 13.7% growth from PhP 9,232 billion in 2016. (See Chart 4.) Savings deposits though mostly in PhP currency and from resident individuals had a 49.7% share, amounting to Php 5,217.1 billion, while time deposits accounted for 27%. About Php 17.1 billion (56.2% share) of such accounts only had deposits of PhP 5,000.00 and below (roughly USD 100.00). Though seemingly significant, accounts with deposits higher than PhP 60,000 had a faster annual growth rate. Cities in NCR (66.9% share) were the biggest sources of deposits nationwide followed by Cebu at 4.4% share. In the discussion of the economic profile of Cebu City in Section 1.4, it was noted that Cebu City has had an increasing trend of deposits at least from 2014 to 2016. This is consistent with a report published in 2014 that ranked Cebu City with the 2nd most deposits out of 16 cities in the study.
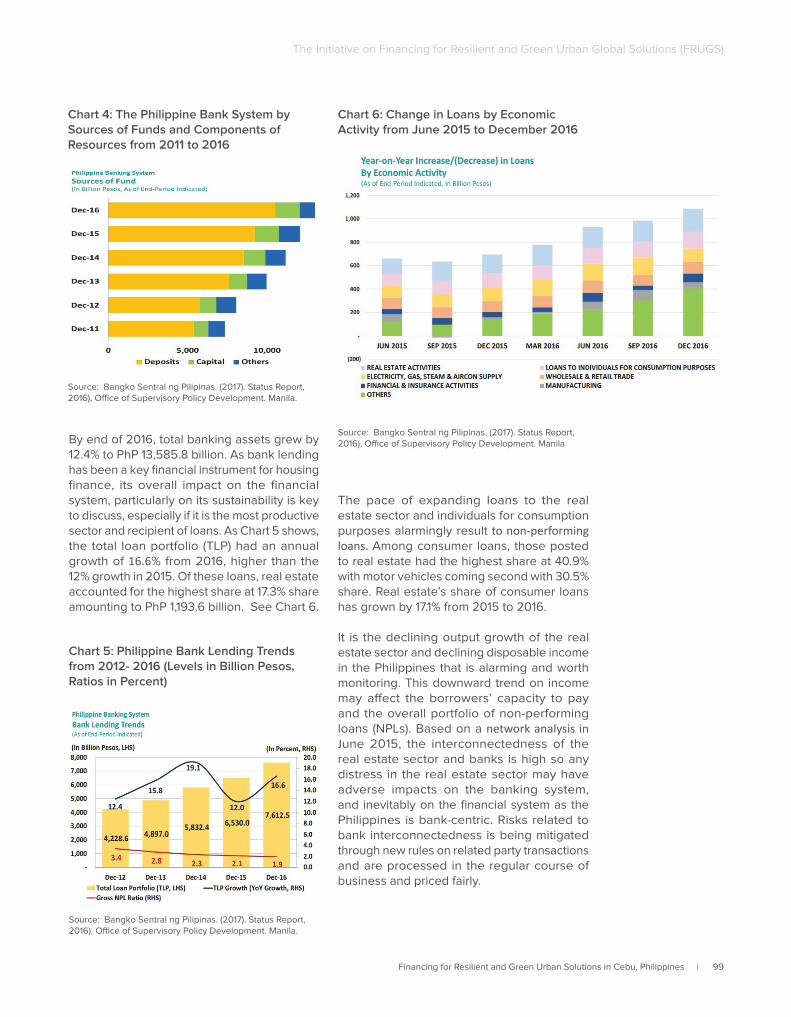
Financing for Resilient and Green Urban Solutions in Cebu, Philippines | 99
The Initiative on Financing for Resilient and Green Urban Global Solutions (FRUGS)
Chart 4: The Philippine Bank System by Sources of Funds and Components of Resources from 2011 to 2016
Source: Bangko Sentral ng Pilipinas. (2017). Status Report, 2016), Office of Supervisory Policy Development. Manila.
By end of 2016, total banking assets grew by 12.4% to PhP 13,585.8 billion. As bank lending has been a key financial instrument for housing finance, its overall impact on the financial system, particularly on its sustainability is key to discuss, especially if it is the most productive sector and recipient of loans. As Chart 5 shows, the total loan portfolio (TLP) had an annual growth of 16.6% from 2016, higher than the 12% growth in 2015. Of these loans, real estate accounted for the highest share at 17.3% share amounting to PhP 1,193.6 billion. See Chart 6.
Chart 5: Philippine Bank Lending Trends from 2012- 2016 (Levels in Billion Pesos, Ratios in Percent)
Chart 6: Change in Loans by Economic Activity from June 2015 to December 2016
Source: Bangko Sentral ng Pilipinas. (2017). Status Report, 2016), Office of Supervisory Policy Development. Manila
The pace of expanding loans to the real estate sector and individuals for consumption purposes alarmingly result to non-performing loans. Among consumer loans, those posted to real estate had the highest share at 40.9% with motor vehicles coming second with 30.5% share. Real estate’s share of consumer loans has grown by 17.1% from 2015 to 2016.
It is the declining output growth of the real estate sector and declining disposable income in the Philippines that is alarming and worth monitoring. This downward trend on income may affect the borrowers’ capacity to pay and the overall portfolio of non-performing loans (NPLs). Based on a network analysis in June 2015, the interconnectedness of the real estate sector and banks is high so any distress in the real estate sector may have adverse impacts on the banking system, and inevitably on the financial system as the Philippines is bank-centric. Risks related to bank interconnectedness is being mitigated through new rules on related party transactions and are processed in the regular course of business and priced fairly.
Source: Bangko Sentral ng Pilipinas. (2017). Status Report, 2016), Office of Supervisory Policy Development. Manila.
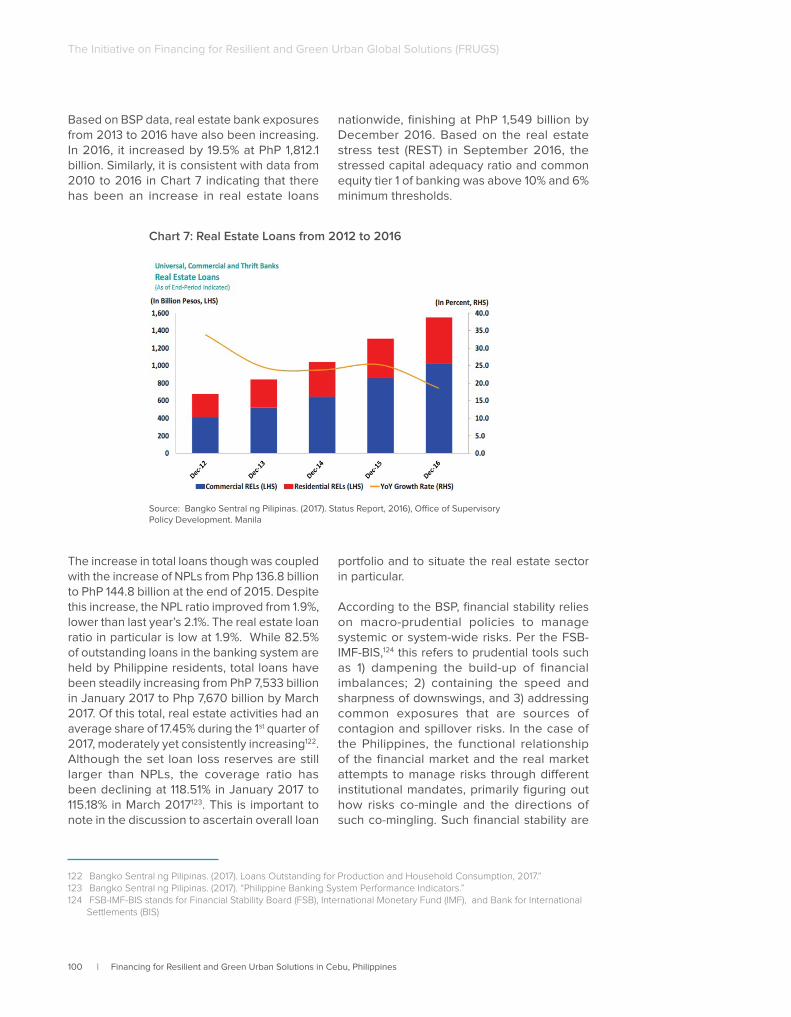
100 | Financing for Resilient and Green Urban Solutions in Cebu, Philippines
The Initiative on Financing for Resilient and Green Urban Global Solutions (FRUGS)
Based on BSP data, real estate bank exposures from 2013 to 2016 have also been increasing. In 2016, it increased by 19.5% at PhP 1,812.1 billion. Similarly, it is consistent with data from 2010 to 2016 in Chart 7 indicating that there has been an increase in real estate loans
nationwide, finishing at PhP 1,549 billion by December 2016. Based on the real estate stress test (REST) in September 2016, the stressed capital adequacy ratio and common equity tier 1 of banking was above 10% and 6% minimum thresholds.
Chart 7: Real Estate Loans from 2012 to 2016
Source: Bangko Sentral ng Pilipinas. (2017). Status Report, 2016), Office of Supervisory Policy Development. Manila
The increase in total loans though was coupled with the increase of NPLs from Php 136.8 billion to PhP 144.8 billion at the end of 2015. Despite this increase, the NPL ratio improved from 1.9%, lower than last year’s 2.1%. The real estate loan ratio in particular is low at 1.9%. While 82.5% of outstanding loans in the banking system are held by Philippine residents, total loans have been steadily increasing from PhP 7,533 billion in January 2017 to Php 7,670 billion by March 2017. Of this total, real estate activities had an average share of 17.45% during the 1st quarter of 2017, moderately yet consistently increasing122. Although the set loan loss reserves are still larger than NPLs, the coverage ratio has been declining at 118.51% in January 2017 to 115.18% in March 2017123. This is important to note in the discussion to ascertain overall loan
122 Bangko Sentral ng Pilipinas. (2017). Loans Outstanding for Production and Household Consumption, 2017.” 123 Bangko Sentral ng Pilipinas. (2017). “Philippine Banking System Performance Indicators.” 124 FSB-IMF-BIS stands for Financial Stability Board (FSB), International Monetary Fund (IMF), and Bank for International
Settlements (BIS)
portfolio and to situate the real estate sector in particular.
According to the BSP, financial stability relies on macro-prudential policies to manage systemic or system-wide risks. Per the FSB-IMF-BIS,124 this refers to prudential tools such as 1) dampening the build-up of financial imbalances; 2) containing the speed and sharpness of downswings, and 3) addressing common exposures that are sources of contagion and spillover risks. In the case of the Philippines, the functional relationship of the financial market and the real market attempts to manage risks through different institutional mandates, primarily figuring out how risks co-mingle and the directions of such co-mingling. Such financial stability are
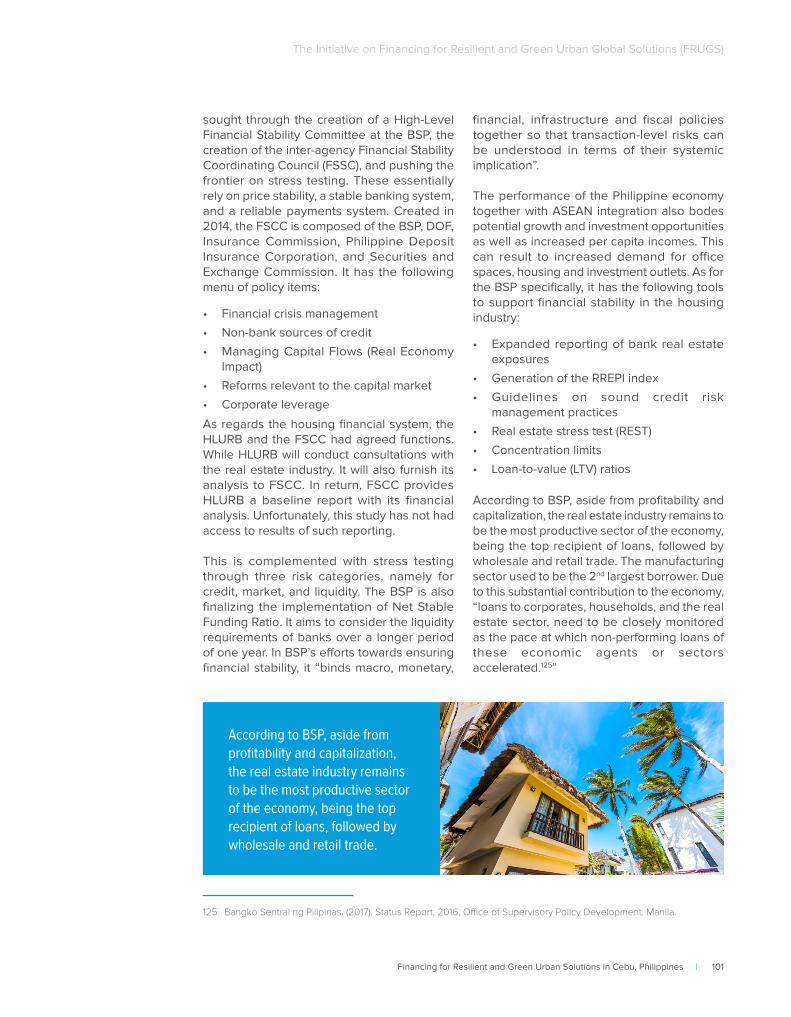
Financing for Resilient and Green Urban Solutions in Cebu, Philippines | 101
The Initiative on Financing for Resilient and Green Urban Global Solutions (FRUGS)
sought through the creation of a High-Level Financial Stability Committee at the BSP, the creation of the inter-agency Financial Stability Coordinating Council (FSSC), and pushing the frontier on stress testing. These essentially rely on price stability, a stable banking system, and a reliable payments system. Created in 2014, the FSCC is composed of the BSP, DOF, Insurance Commission, Philippine Deposit Insurance Corporation, and Securities and Exchange Commission. It has the following menu of policy items:
• Financial crisis management
• Non-bank sources of credit
• Managing Capital Flows (Real Economy Impact)
• Reforms relevant to the capital market
• Corporate leverage
As regards the housing financial system, the HLURB and the FSCC had agreed functions. While HLURB will conduct consultations with the real estate industry. It will also furnish its analysis to FSCC. In return, FSCC provides HLURB a baseline report with its financial analysis. Unfortunately, this study has not had access to results of such reporting.
This is complemented with stress testing through three risk categories, namely for credit, market, and liquidity. The BSP is also finalizing the implementation of Net Stable Funding Ratio. It aims to consider the liquidity requirements of banks over a longer period of one year. In BSP’s efforts towards ensuring financial stability, it “binds macro, monetary,
125 Bangko Sentral ng Pilipinas. (2017). Status Report, 2016, Office of Supervisory Policy Development. Manila.
financial, infrastructure and fiscal policies together so that transaction-level risks can be understood in terms of their systemic implication”.
The performance of the Philippine economy together with ASEAN integration also bodes potential growth and investment opportunities as well as increased per capita incomes. This can result to increased demand for office spaces, housing and investment outlets. As for the BSP specifically, it has the following tools to support financial stability in the housing industry:
• Expanded reporting of bank real estate exposures
• Generation of the RREPI index
• Guidelines on sound credit risk management practices
• Real estate stress test (REST)
• Concentration limits
• Loan-to-value (LTV) ratios
According to BSP, aside from profitability and capitalization, the real estate industry remains to be the most productive sector of the economy, being the top recipient of loans, followed by wholesale and retail trade. The manufacturing sector used to be the 2nd largest borrower. Due to this substantial contribution to the economy, “loans to corporates, households, and the real estate sector, need to be closely monitored as the pace at which non-performing loans of these economic agents or sectors accelerated.125”
According to BSP, aside from profitability and capitalization, the real estate industry remains to be the most productive sector of the economy, being the top recipient of loans, followed by wholesale and retail trade.
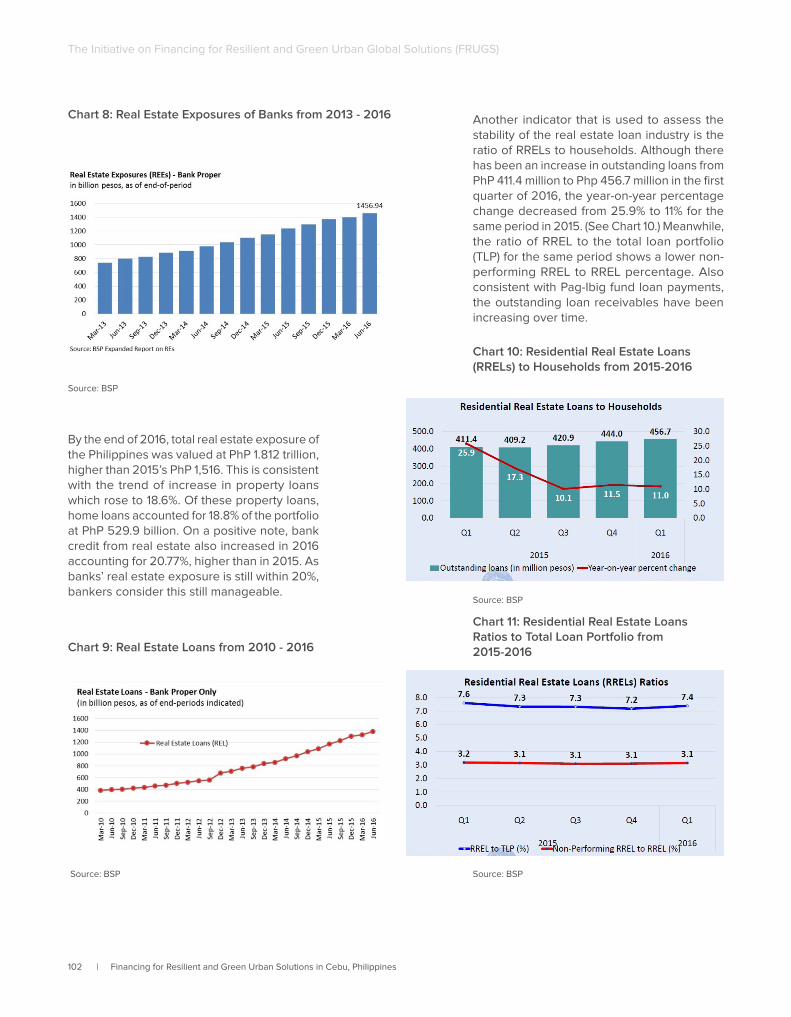
102 | Financing for Resilient and Green Urban Solutions in Cebu, Philippines
The Initiative on Financing for Resilient and Green Urban Global Solutions (FRUGS)
Chart 8: Real Estate Exposures of Banks from 2013 - 2016
Source: BSP
By the end of 2016, total real estate exposure of the Philippines was valued at PhP 1.812 trillion, higher than 2015’s PhP 1,516. This is consistent with the trend of increase in property loans which rose to 18.6%. Of these property loans, home loans accounted for 18.8% of the portfolio at PhP 529.9 billion. On a positive note, bank credit from real estate also increased in 2016 accounting for 20.77%, higher than in 2015. As banks’ real estate exposure is still within 20%, bankers consider this still manageable.
Another indicator that is used to assess the stability of the real estate loan industry is the ratio of RRELs to households. Although there has been an increase in outstanding loans from PhP 411.4 million to Php 456.7 million in the first quarter of 2016, the year-on-year percentage change decreased from 25.9% to 11% for the same period in 2015. (See Chart 10.) Meanwhile, the ratio of RREL to the total loan portfolio (TLP) for the same period shows a lower non-performing RREL to RREL percentage. Also consistent with Pag-Ibig fund loan payments, the outstanding loan receivables have been increasing over time.
Chart 10: Residential Real Estate Loans (RRELs) to Households from 2015-2016
Chart 9: Real Estate Loans from 2010 - 2016
Source: BSP
Source: BSP
Chart 11: Residential Real Estate Loans Ratios to Total Loan Portfolio from 2015-2016
Source: BSP
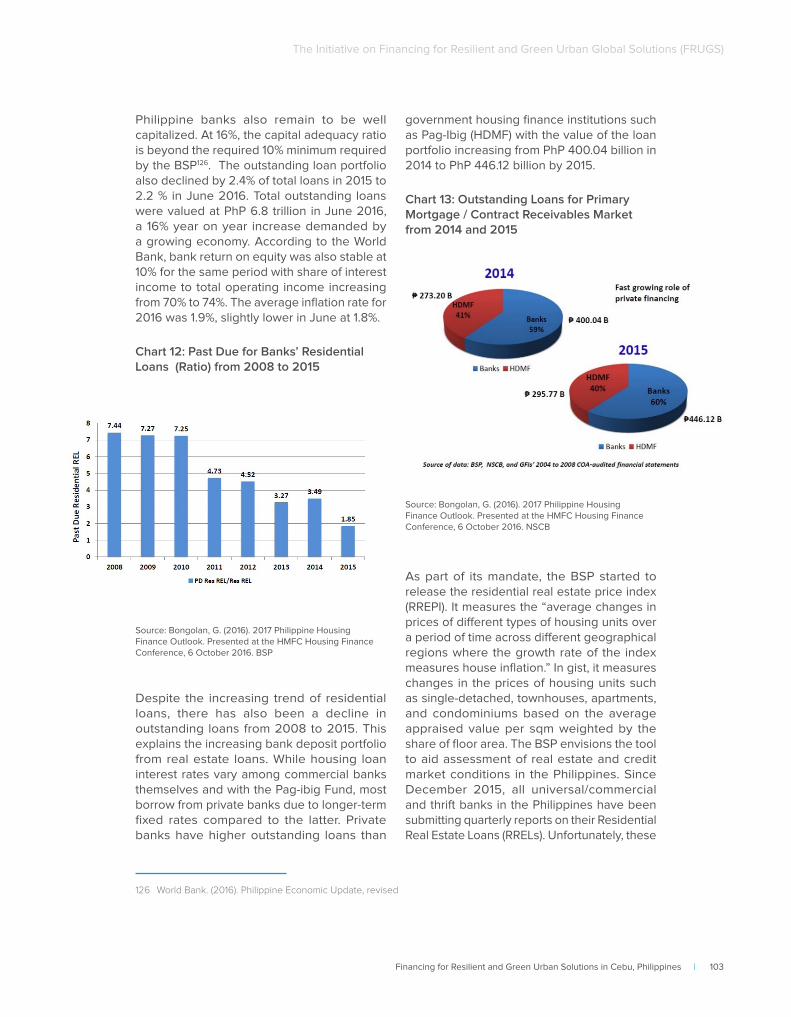
Financing for Resilient and Green Urban Solutions in Cebu, Philippines | 103
The Initiative on Financing for Resilient and Green Urban Global Solutions (FRUGS)
Philippine banks also remain to be well capitalized. At 16%, the capital adequacy ratio is beyond the required 10% minimum required by the BSP126. The outstanding loan portfolio also declined by 2.4% of total loans in 2015 to 2.2 % in June 2016. Total outstanding loans were valued at PhP 6.8 trillion in June 2016, a 16% year on year increase demanded by a growing economy. According to the World Bank, bank return on equity was also stable at 10% for the same period with share of interest income to total operating income increasing from 70% to 74%. The average inflation rate for 2016 was 1.9%, slightly lower in June at 1.8%.
Chart 12: Past Due for Banks’ Residential Loans (Ratio) from 2008 to 2015
Source: Bongolan, G. (2016). 2017 Philippine Housing Finance Outlook. Presented at the HMFC Housing Finance Conference, 6 October 2016. BSP
Despite the increasing trend of residential loans, there has also been a decline in outstanding loans from 2008 to 2015. This explains the increasing bank deposit portfolio from real estate loans. While housing loan interest rates vary among commercial banks themselves and with the Pag-ibig Fund, most borrow from private banks due to longer-term fixed rates compared to the latter. Private banks have higher outstanding loans than
126 World Bank. (2016). Philippine Economic Update, revised
government housing finance institutions such as Pag-Ibig (HDMF) with the value of the loan portfolio increasing from PhP 400.04 billion in 2014 to PhP 446.12 billion by 2015.
Chart 13: Outstanding Loans for Primary Mortgage / Contract Receivables Market from 2014 and 2015
Source: Bongolan, G. (2016). 2017 Philippine Housing Finance Outlook. Presented at the HMFC Housing Finance Conference, 6 October 2016. NSCB
As part of its mandate, the BSP started to release the residential real estate price index (RREPI). It measures the “average changes in prices of different types of housing units over a period of time across different geographical regions where the growth rate of the index measures house inflation.” In gist, it measures changes in the prices of housing units such as single-detached, townhouses, apartments, and condominiums based on the average appraised value per sqm weighted by the share of floor area. The BSP envisions the tool to aid assessment of real estate and credit market conditions in the Philippines. Since December 2015, all universal/commercial and thrift banks in the Philippines have been submitting quarterly reports on their Residential Real Estate Loans (RRELs). Unfortunately, these
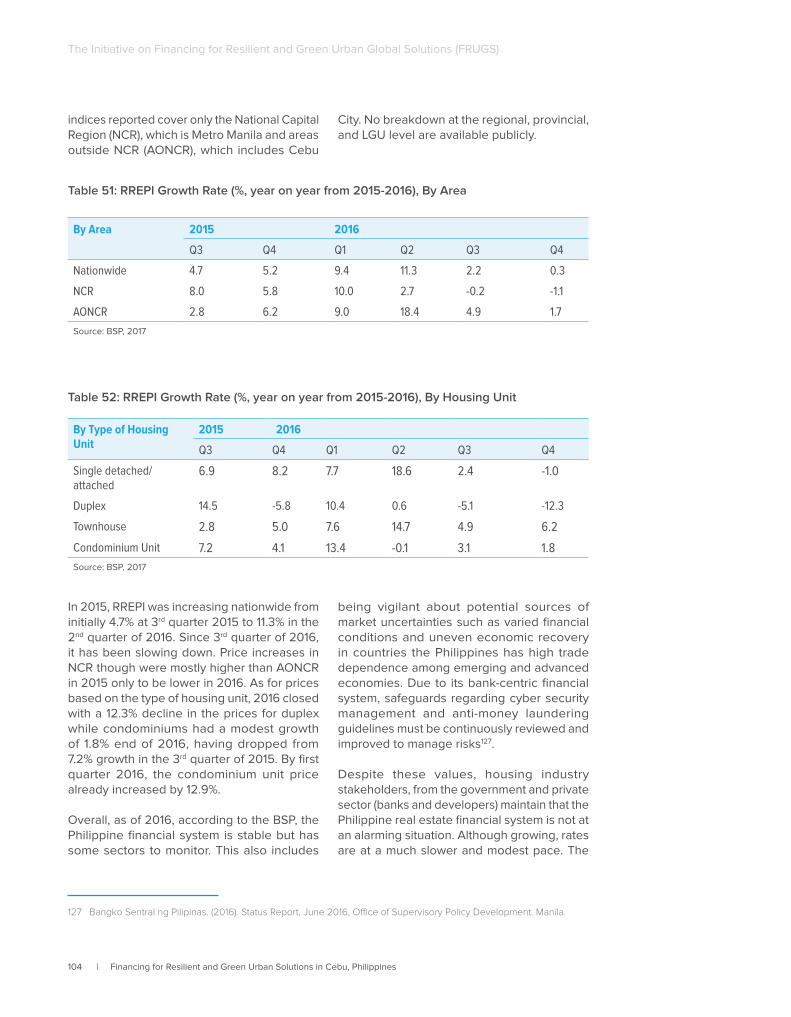
104 | Financing for Resilient and Green Urban Solutions in Cebu, Philippines
The Initiative on Financing for Resilient and Green Urban Global Solutions (FRUGS)
indices reported cover only the National Capital Region (NCR), which is Metro Manila and areas outside NCR (AONCR), which includes Cebu
City. No breakdown at the regional, provincial, and LGU level are available publicly.
Table 51: RREPI Growth Rate (%, year on year from 2015-2016), By Area
By Area 2015 2016
Q3 Q4 Q1 Q2 Q3 Q4
Nationwide 4.7 5.2 9.4 11.3 2.2 0.3
NCR 8.0 5.8 10.0 2.7 -0.2 -1.1
AONCR 2.8 6.2 9.0 18.4 4.9 1.7
Source: BSP, 2017
Table 52: RREPI Growth Rate (%, year on year from 2015-2016), By Housing Unit
By Type of Housing Unit
2015 2016
Q3 Q4 Q1 Q2 Q3 Q4
Single detached/attached
6.9 8.2 7.7 18.6 2.4 -1.0
Duplex 14.5 -5.8 10.4 0.6 -5.1 -12.3
Townhouse 2.8 5.0 7.6 14.7 4.9 6.2
Condominium Unit 7.2 4.1 13.4 -0.1 3.1 1.8
Source: BSP, 2017
In 2015, RREPI was increasing nationwide from initially 4.7% at 3rd quarter 2015 to 11.3% in the 2nd quarter of 2016. Since 3rd quarter of 2016, it has been slowing down. Price increases in NCR though were mostly higher than AONCR in 2015 only to be lower in 2016. As for prices based on the type of housing unit, 2016 closed with a 12.3% decline in the prices for duplex while condominiums had a modest growth of 1.8% end of 2016, having dropped from 7.2% growth in the 3rd quarter of 2015. By first quarter 2016, the condominium unit price already increased by 12.9%.
Overall, as of 2016, according to the BSP, the Philippine financial system is stable but has some sectors to monitor. This also includes
127 Bangko Sentral ng Pilipinas. (2016). Status Report, June 2016, Office of Supervisory Policy Development. Manila.
being vigilant about potential sources of market uncertainties such as varied financial conditions and uneven economic recovery in countries the Philippines has high trade dependence among emerging and advanced economies. Due to its bank-centric financial system, safeguards regarding cyber security management and anti-money laundering guidelines must be continuously reviewed and improved to manage risks127.
Despite these values, housing industry stakeholders, from the government and private sector (banks and developers) maintain that the Philippine real estate financial system is not at an alarming situation. Although growing, rates are at a much slower and modest pace. The
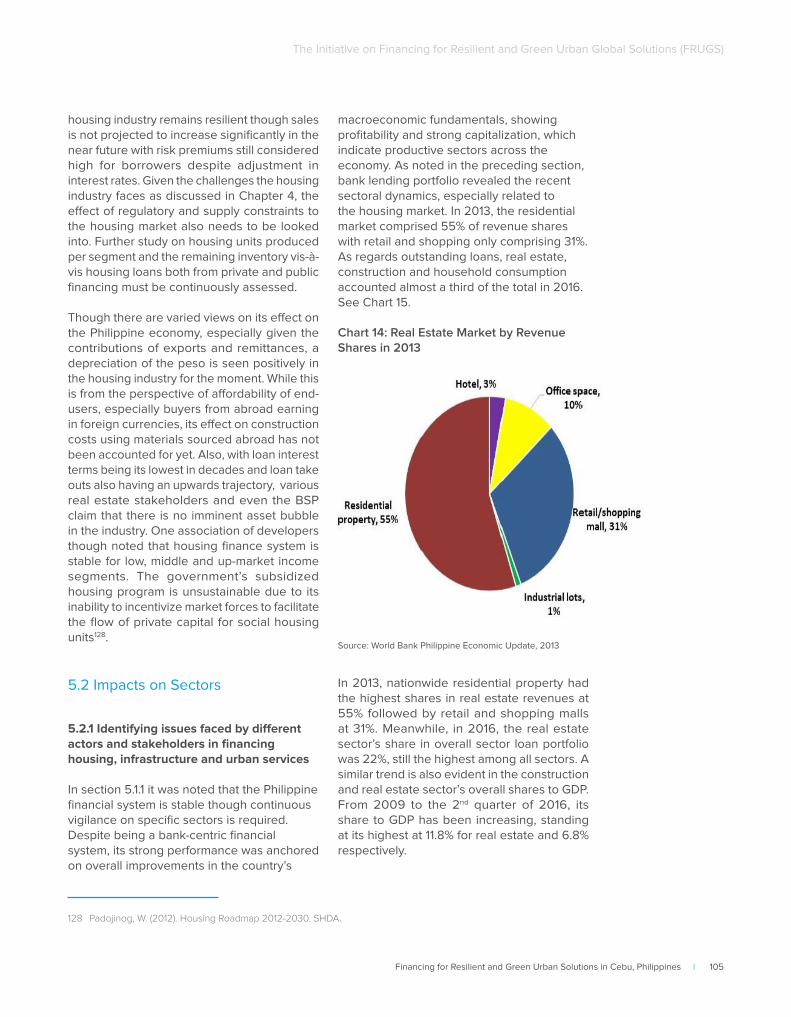
Financing for Resilient and Green Urban Solutions in Cebu, Philippines | 105
The Initiative on Financing for Resilient and Green Urban Global Solutions (FRUGS)
housing industry remains resilient though sales is not projected to increase significantly in the near future with risk premiums still considered high for borrowers despite adjustment in interest rates. Given the challenges the housing industry faces as discussed in Chapter 4, the effect of regulatory and supply constraints to the housing market also needs to be looked into. Further study on housing units produced per segment and the remaining inventory vis-à-vis housing loans both from private and public financing must be continuously assessed.
Though there are varied views on its effect on the Philippine economy, especially given the contributions of exports and remittances, a depreciation of the peso is seen positively in the housing industry for the moment. While this is from the perspective of affordability of end-users, especially buyers from abroad earning in foreign currencies, its effect on construction costs using materials sourced abroad has not been accounted for yet. Also, with loan interest terms being its lowest in decades and loan take outs also having an upwards trajectory, various real estate stakeholders and even the BSP claim that there is no imminent asset bubble in the industry. One association of developers though noted that housing finance system is stable for low, middle and up-market income segments. The government’s subsidized housing program is unsustainable due to its inability to incentivize market forces to facilitate the flow of private capital for social housing units128.
5.2 Impacts on Sectors
5.2.1 Identifying issues faced by different actors and stakeholders in financing housing, infrastructure and urban services
In section 5.1.1 it was noted that the Philippine financial system is stable though continuous vigilance on specific sectors is required. Despite being a bank-centric financial system, its strong performance was anchored on overall improvements in the country’s
128 Padojinog, W. (2012). Housing Roadmap 2012-2030. SHDA.
macroeconomic fundamentals, showing profitability and strong capitalization, which indicate productive sectors across the economy. As noted in the preceding section, bank lending portfolio revealed the recent sectoral dynamics, especially related to the housing market. In 2013, the residential market comprised 55% of revenue shares with retail and shopping only comprising 31%. As regards outstanding loans, real estate, construction and household consumption accounted almost a third of the total in 2016. See Chart 15.
Chart 14: Real Estate Market by Revenue Shares in 2013
Source: World Bank Philippine Economic Update, 2013
In 2013, nationwide residential property had the highest shares in real estate revenues at 55% followed by retail and shopping malls at 31%. Meanwhile, in 2016, the real estate sector’s share in overall sector loan portfolio was 22%, still the highest among all sectors. A similar trend is also evident in the construction and real estate sector’s overall shares to GDP. From 2009 to the 2nd quarter of 2016, its share to GDP has been increasing, standing at its highest at 11.8% for real estate and 6.8% respectively.
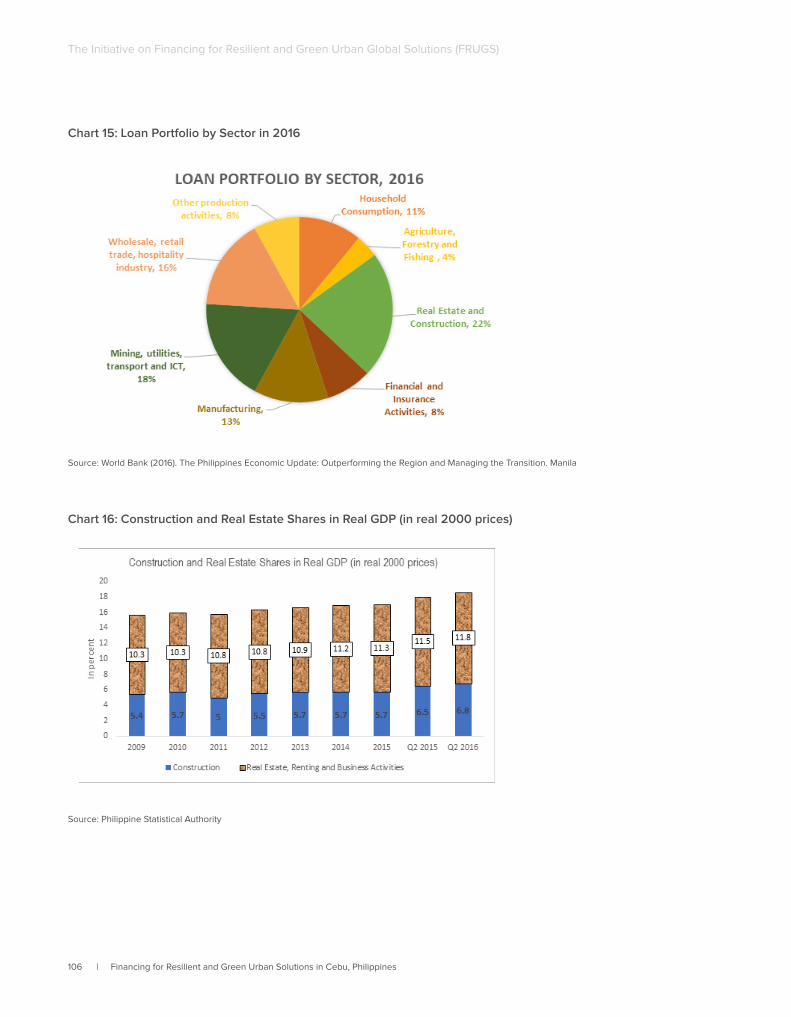
106 | Financing for Resilient and Green Urban Solutions in Cebu, Philippines
The Initiative on Financing for Resilient and Green Urban Global Solutions (FRUGS)
Chart 15: Loan Portfolio by Sector in 2016
Source: World Bank (2016). The Philippines Economic Update: Outperforming the Region and Managing the Transition. Manila
Chart 16: Construction and Real Estate Shares in Real GDP (in real 2000 prices)
Source: Philippine Statistical Authority
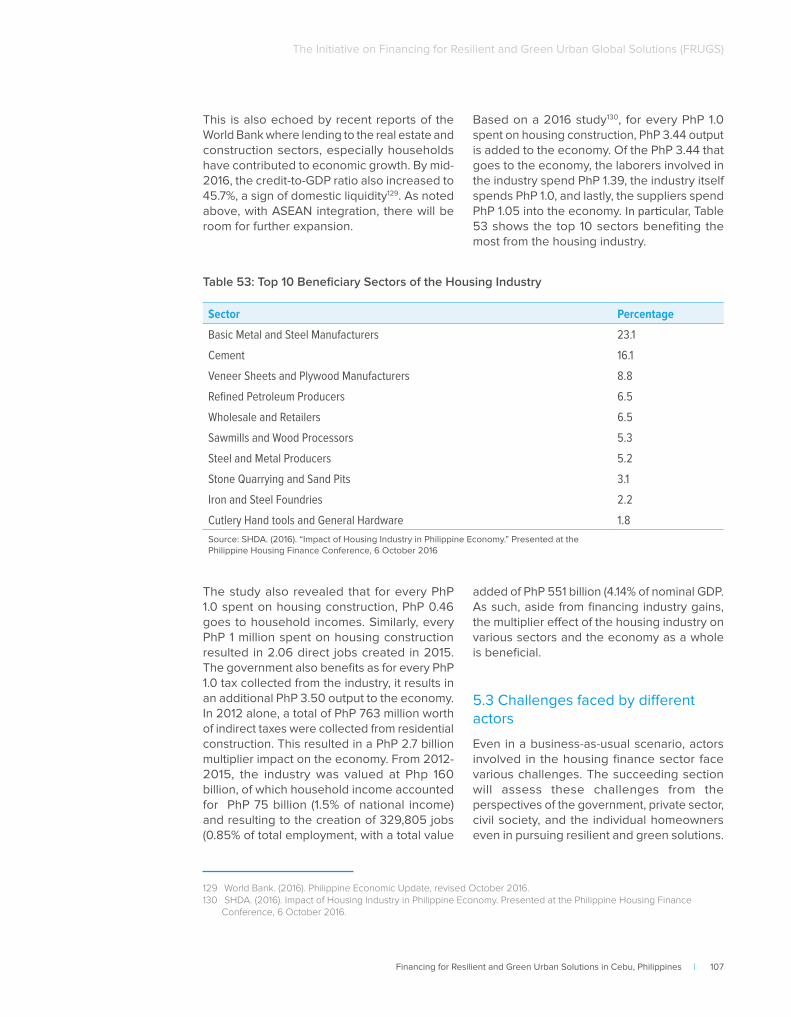
Financing for Resilient and Green Urban Solutions in Cebu, Philippines | 107
The Initiative on Financing for Resilient and Green Urban Global Solutions (FRUGS)
This is also echoed by recent reports of the World Bank where lending to the real estate and construction sectors, especially households have contributed to economic growth. By mid-2016, the credit-to-GDP ratio also increased to 45.7%, a sign of domestic liquidity129. As noted above, with ASEAN integration, there will be room for further expansion.
129 World Bank. (2016). Philippine Economic Update, revised October 2016. 130 SHDA. (2016). Impact of Housing Industry in Philippine Economy. Presented at the Philippine Housing Finance
Conference, 6 October 2016.
Based on a 2016 study130, for every PhP 1.0 spent on housing construction, PhP 3.44 output is added to the economy. Of the PhP 3.44 that goes to the economy, the laborers involved in the industry spend PhP 1.39, the industry itself spends PhP 1.0, and lastly, the suppliers spend PhP 1.05 into the economy. In particular, Table 53 shows the top 10 sectors benefiting the most from the housing industry.
Table 53: Top 10 Beneficiary Sectors of the Housing Industry
Sector Percentage
Basic Metal and Steel Manufacturers 23.1
Cement 16.1
Veneer Sheets and Plywood Manufacturers 8.8
Refined Petroleum Producers 6.5
Wholesale and Retailers 6.5
Sawmills and Wood Processors 5.3
Steel and Metal Producers 5.2
Stone Quarrying and Sand Pits 3.1
Iron and Steel Foundries 2.2
Cutlery Hand tools and General Hardware 1.8
Source: SHDA. (2016). “Impact of Housing Industry in Philippine Economy.” Presented at the Philippine Housing Finance Conference, 6 October 2016
The study also revealed that for every PhP 1.0 spent on housing construction, PhP 0.46 goes to household incomes. Similarly, every PhP 1 million spent on housing construction resulted in 2.06 direct jobs created in 2015. The government also benefits as for every PhP 1.0 tax collected from the industry, it results in an additional PhP 3.50 output to the economy. In 2012 alone, a total of PhP 763 million worth of indirect taxes were collected from residential construction. This resulted in a PhP 2.7 billion multiplier impact on the economy. From 2012-2015, the industry was valued at Php 160 billion, of which household income accounted for PhP 75 billion (1.5% of national income) and resulting to the creation of 329,805 jobs (0.85% of total employment, with a total value
added of PhP 551 billion (4.14% of nominal GDP. As such, aside from financing industry gains, the multiplier effect of the housing industry on various sectors and the economy as a whole is beneficial.
5.3 Challenges faced by different actors
Even in a business-as-usual scenario, actors involved in the housing finance sector face various challenges. The succeeding section will assess these challenges from the perspectives of the government, private sector, civil society, and the individual homeowners even in pursuing resilient and green solutions.
108 | Financing for Resilient and Green Urban Solutions in Cebu, Philippines
The Initiative on Financing for Resilient and Green Urban Global Solutions (FRUGS)
5.3.1 Identify issues faced by different actors and stakeholders in financing housing and infrastructure to meet the resilient and green requirements
Various government agencies are involved in housing finance. From the regulators of the financial system such as the BSP, to the regulators of housing standards such as HLURB and provider of construction standards such as the DPWH, or Pag-Ibig fund as the provider of direct lending to homeowners. There are also government institutions that are focused on policymaking and oversight such as HUDCC and DILG, of which, LGUs should abide by and implement. The various functions of these agencies have been discussed in Section 1.5. However, even more important are the various sector agencies that set the national policy direction and technical specifications as regards climate resilience operationalized at the city level – the nexus of implementation of all these agencies. Similarly, to comply with green and resilient requirements, investment projects can be financed using domestic funds or international climate finance.
Before accessing financing, it is a pre-requisite for all related stakeholders to be aware of climate resilient needs, innovations in green solutions, and updates on regulations and standards related to sustainable urban infrastructure and housing. For example, the DPWH has released a green building code while the Pag-Ibig Fund has also provided an innovative product that gives loan discounts for housing projects that demonstrate green features. Developers have difficulty making sense of BAU regulations, let alone new green regulations vis-à-vis the overlapping and sometimes conflicting technical regulations of some government agencies and regulations per se. It is important to note that aside from top down regulations from national agencies, LGUs also have their own specific ordinances that sometimes, can even be ahead of or conflict with national policy. It is only after overcoming this hurdle that developers could assess the cost implications and/or tax breaks brought
131 Manasan, R., Villanueva, E. (2006). Gems in LGU Fiscal Management: a Compilation of Good Practices. Philippine Institute for Development Studies. Discussion paper series no. 2006-16
about by green requirement compliance in the housing sector. These are not limited to specific housing regulations. For example, the national energy policy is in favor of clean and renewable energy. At the local and housing unit level, this could be manifested through energy efficiency measures such as the use of LED lights or solar power at the minimum.
As regards urban infrastructure and urban development in general, a key issue faced by government is overlapping mandates among sector agencies, “commissions” and “councils” coupled with either lack of appropriated budgets (resulting in reliance on donor support) or national level concentration of technical expertise with LGUs having different levels of capacity. Accessing finance for resilient housing and infrastructure even makes this technical gap worse because not only should climate dimensions in the investment project be demonstrated but also be able to identify and structure the financing modalities, whether sourced from local, national or international funds. This would require sub-national governments to understand the evolving green standards (e.g. building code), solutions, and the consequent financing mechanisms available. For example, to bridge this gap, the plurality of GCF-readiness programs in the Philippines across stakeholders at the national and local governments reflect this issue. Another example of an unutilized domestic source to aid in meeting resilient and green requirements is the People Survival Fund. Putting PSF governance issues aside, the weak technical capacity to structure projects of scale based on available financing is manifested in the dismal ratio of approved projects against the budgeted PhP 1 billion fund.
Then and now, the challenge of consistent planning, investment programming, budgeting and implementing green investment projects is imperative. While under the BAU scenario, there were earlier claims that the DILG and local government units’ did not check consistencies with NEDA plans nor did DBM check AIPs131, accessing specific finance
Financing for Resilient and Green Urban Solutions in Cebu, Philippines | 109
The Initiative on Financing for Resilient and Green Urban Global Solutions (FRUGS)
to meet resilient and green requirements compel project proponents and investors to ensure consistency. As such, it is necessary to harmonize programs, activities, and projects in national and local plans, especially consistency between the NCCAP and LCCAP.
While national financial stability and sufficient local revenues are the minimum prior to endeavoring with climate finance for housing and infrastructure, overall political leadership at
the national and local levels expressing support for resilient and green solutions are needed. Despite science, experience, existing laws and policies so far demonstrating the undeniable need for resilient and green approaches to housing and urban infrastructure, stakeholders in the Philippines also need consistent commitment of politicians that the country both at the national and sub-national levels will abide by its climate commitments especially with every new administration.
110 | Financing for Resilient and Green Urban Solutions in Cebu, Philippines
The Initiative on Financing for Resilient and Green Urban Global Solutions (FRUGS)
Chapter 6
Alternative Financial Instruments
Financing for Resilient and Green Urban Solutions in Cebu, Philippines | 111
The Initiative on Financing for Resilient and Green Urban Global Solutions (FRUGS)
Having discussed resilient housing and urban infrastructure needs, the corresponding financing instruments and its effect on the broader financial system, Chapter 6 explores alternative financial instruments to mobilize private sector capital for Cebu City and the Philippines in general. This section attempts to investigate new housing and infrastructure development challenges, issues, priorities, and financing opportunities and solutions from international development agencies. Although social housing and slum upgrading are excluded from this study, initiatives and rulings that affect the affordability of economic housing (low-income) and segments above will influence alternative financial instruments and support to the industry at national and local levels.
6.1 New Challenges, Approaches, Instruments
6.1.1 Analyzing new housing and infrastructure development challenges, issues, priorities and financing opportunities and solutions in the city
To recap, existing housing challenges as discussed in Chapter 4 include:
• underdeveloped mortgage market
• sub-optimal access to formal finance
• availability of affordable housing
• inefficient urban land market
• inconsistent housing and land policies
• complex governance arrangements and insufficient budget
While affordability, access to finance, and overall efficiency of the housing market will still plague the sector, there are also new challenges to financing housing and infrastructure provision. With increased urbanization and as a consequence of unplanned urban sprawl, the demand for residential properties remain
132 Ballesteros, M. (2004). Rental Housing for Urban Low-Income Households in the Philippines. Discussion paper series no. 2004-47. Philippine Institute for Development Studies.
higher than the available land supply. However, urban expansion has also resulted in expanding economic activities beyond traditional growth centers to other LGUs. As such, there has been a rise in agglomeration and pursuit of formal metropolitan governance arrangements.
Both a challenge and an opportunity, metropolitan arrangements such as Mega Cebu aid in the provision of public goods, in ensuring scale of investments, equity and guarantees, and in addressing common hazards regarding climate change. The main challenge there though is the governance framework to get autonomous member LGUs to agree on common initiatives as it lowers transaction costs for projects that go beyond each LGU’s administrative boundaries.
An immediate need that has been growing largely unregulated is the rental market. As noted earlier, the existing rent control law practically only covers lower income households and is silent on rental schemes covering low, middle and open market housing 132. Although it will always be appropriate to prioritize the welfare of those who cannot afford home ownership and have no choice but to rent, there is a population segment that opt to rent despite affording ownership.
Although the real estate sector responded to the changing lifestyle, needs and preferences of homebuyers by shifting their housing projects to vertical developments in centrally located areas close to livelihood opportunities, it has not fully addressed the housing affordability issue. It may also have long-term effects on livability quality.
Similarly, implicit in the global and national climate change agenda is the common pursuit of the triple bottom line of people, planet, and profit. While it may still be a challenge to shift from BAU to a low carbon and/or climate resilient approach to housing and urban infrastructure provision, the triple bottom line as the new normal in abiding by
112 | Financing for Resilient and Green Urban Solutions in Cebu, Philippines
The Initiative on Financing for Resilient and Green Urban Global Solutions (FRUGS)
sustainable development commitments also presents opportunities. It is an opportune time to develop and/or adopt green technologies, especially indigenous ones and engender the participation and support of stakeholders from the private, public and civil society sectors. As the 2016 Development Cooperation Report of the Organization for Economic Cooperation and Development states, timing is ripe to spur private support for development, from foreign direct investments, blended finance and social impact investment133 . It also conveniently provides a platform for multi-sector stakeholders to pursue co-beneficial initiatives and likewise update standards and regulations. Although these result in challenging work, the resulting gains are far higher.
6.1.2 Analyzing approaches which could reduce the costs of affordable housing and narrow the affordable housing gap in the city, including market-oriented solutions (e.g. lowering the cost of land, construction, operations and maintenance, and financing)
It has been reiterated in this report that affordable housing has been elusive for lower and low income segments of the Philippine population and that housing sector stakeholders agree measures to narrow the affordable housing gap must be pursued. These measures will vary depending on whether they are initiated by the national and/or local governments, private sector such as banks and developers, civil society including academia, and the buyers/homeowners themselves. Some measures will also have to be pursued together.
A common reason cited in literature for the lack of affordable housing has been inefficiencies in the housing market. Contributing factors include poor land mapping, lack of infrastructure, below-market pricing, poor
133 OECD. (2016). The Development Cooperation Report: The Sustainable Development Goals as Business Opportunities.
134 ___. (2015). Century moves into low-cost housing. Retrieved rom http://www.century-properties.com/century-moves-into-low-cost-housing/. ___. (2016). SMDC to venture into affordable housing. Retrieved from: www.rappler.com/business/156426-sm-development-venture-affordable-housing
targeting of beneficiaries for subsidies and bank loans among others. While land use planning and mapping and infrastructure provision are already mandates of national and local governments, a shift from subsidized housing that distort affordability is one way of returning low cost housing to market prices and engender increased private sector participation. Although high end developers are already venturing into affordable housing outside Metro Manila, the challenge is for the urban housing market to have private sector participation in lower and low income housing developments 134.
One major approach to narrowing the affordability gap is to approach housing as part of broader urban development efforts. There is still room for government to ensure that residential communities are served by essential urban services such as affordable transport, water, energy, and waste management. As such, this will require effective planning and coordination among various sector agencies at the national and local levels. It will also give LGUs an opportunity to exercise their roles as effective urban managers.
To lower land development costs, LGUs can also ensure that land use plans are updated and integrate new data on hazard prone areas and take advantage of GIS and other technologies. Efficient land mapping can contribute to reducing land cost especially in areas with sufficient connective infrastructure where there will be lower development costs. In 2016, HUDCC began using data from the European Satellite Agency on mapping land titles in NCR. Efforts to scale up the effort nationwide should be pursued to have more information to support land use planning and urban development in general.
To improve housing affordability, government can also update inclusionary housing policies. The UDHA only requires inclusion of affordable

Financing for Resilient and Green Urban Solutions in Cebu, Philippines | 113
The Initiative on Financing for Resilient and Green Urban Global Solutions (FRUGS)
market-priced housing units in subdivisions. It must also be adopted in vertical residential developments or in mixed use areas as central business districts. Aside from the maximization of available land for housing, it also ensures there will be more land stock particularly available for affordable housing.
The government, through the KSAs, must also ensure an enabling environment for public private partnerships to flourish in the housing sector. Countless opportunities abound from land development to construction, and financing. Similarly, another opportunity is disaster risk financing.
As government adapt construction standards towards green solutions, it is also imperative that they are introduced in a timely manner and mainstreamed to relevant stakeholders.135 This will aid not only in increased understanding and adoption of environmental and construction standards, it can also lower construction costs. Although there are conflicting positions on the cost of building green, early adoption in new developments will still be cheaper than retrofitting existing housing units.
Independent cooperation between the financial sector and real estate developers on increasing financial literacy among middle income households can also increase the affordability of housing units. For example, Sunlife Philippines and 8990 Holdings, the largest mass-developer in the country, has partnered to explore how insurance products can aid sustainable amortization payments and inform investment choices136. One way to narrow the affordability gap is to improve the financial literacy of buyers. Aside from having a steady income stream, further learning about financial management can boost their capacity to afford available housing units.
While cooperation between banks and developers have been largely successful in increasing access to finance, their cooperation can also extend to developing
135 ADB. (2016). Philippines: Public-Private Partnerships by Local Government Units. Manila.136 Schnabel, C. (2016). Sunlife, 8990 Holdings tie up to boost financial literacy. Retrieved from http://www.rappler.com/
business/industries/banking-and-financial-services/134990-sun-life-8990-holdings-partnership
financial instruments that serve maintenance or upgrading needs of existing housing units or communities, especially in adopting green solutions. Some housing units are decades old and occupants who could not afford its maintenance end up selling the property in favor of more modest living arrangements.
6.1.2 Assessing opportunities for launching and developing new instruments which support low carbon and climate resilient housing and urban development
Regardless of the priorities and position of the current administration, the undeniable vulnerability to climate change of the Philippines and the consecutive international agreements and consequent translation into national policies make the time ripe for launching and developing new instruments for low carbon and climate resilient housing and urban development. In fact, previously existing instruments that did not take off have the opportunity to be utilized for financing green solutions.
From a housing perspective, launching initiatives or regulations on housing suitability by integrating new hazard maps in land use planning and future developments also support efforts on disaster risk management. As cities are already mandated to formulate their LCCAPs and update it every three years, hopefully, at each start of a chief executive’s term, there is also a constant opportunity to integrate low carbon and climate resilient approaches in addressing urban development.
Similarly, select private financial institutions have went ahead in assessing the impact of climate change on competitiveness and business resilience and the consequent sector specific financial instruments needed (e.g. agriculture and energy sectors). A few business groups have also developed competitiveness and livability rankings and would benefit from integrating principles of low carbon growth and
114 | Financing for Resilient and Green Urban Solutions in Cebu, Philippines
The Initiative on Financing for Resilient and Green Urban Global Solutions (FRUGS)
climate resilience into their ratings. Similarly, the creation of the Philippine Disaster Resilience Foundation (PDRF) demonstrates private sector support for the need to address disaster preparedness, recovery and rehabilitation137. These demonstrated initiatives from the private sector pursued alongside and in support of ongoing efforts show that similar opportunities can be explored for climate resilient and low carbon urban development.
As previously noted, the crackdown on non-compliance to RA 9003 or the Solid Waste Management Act, provides another opportunity for blended financial instruments for waste to energy plants, sanitary landfills, material recovery facilities and adoption of green technology. In select sectors such as renewable energy for example, the opportunity to advance or adapt technology for sustainable development purposes has been present and needs to be mainstreamed across the LGUs.
While it is an opportune time to re-launch specific green financial instruments and at the same time develop modes of blended finance as various sources emerge, it requires harmonized low carbon and climate resilient policies and standards at the national and local levels. This includes city ordinances that may have been enacted prior to national policy. The government must ensure there are no conflicts, especially when adopted for an actual project or when applying for financial incentives for implementation. One way to overcome this hurdle is to review existing ordinances vis-à-vis national plans or support the formulation of a detailed implementing rules and regulations.
As stated in the Philippine government’s national report to Habitat III, succeeding urban development initiatives should be pursued with a multi-sector co-benefits lens. Although areas like disaster management benefit from a coordinated and participatory National Disaster Risk Reduction and Management
137 PDRF. (2016). Who we are. Retrieved from http://pdrf.org/who-we-are138 ADB. (2016). Philippines: Public-Private Partnerships by Local Government Units. Manila.
Council (NDRRMC) comprised of various sector agencies with specific mandates, other areas like climate change and infrastructure provision largely plan, program and implement in siloes. Unlike in metropolitan arrangements like in Metro Cebu where there is integrated multi-sector planning for technical details and financing, there is still room for national sector agencies to structure investment projects that demonstrate greater climate co-benefits. This can be through exploring or developing context-specific multi-sector methodology to assess and integrate climate finance dimensions and co-benefits in an infrastructure project. For example, e.g. a road that reduces traffic yet also reduces flood inundation; BRT project that reduces air pollution and motorization; rehabilitation of water piping network for anticipated demand needs yet also eco-efficient in supply sources.
The national urban agenda report to Habitat III also stated support for the metropolitan governance approach to providing public goods. While Metro Manila Development Authority demonstrated poor traffic management, Metro Cebu plans show inclination to maximize investments through economies of scale using a spatially integrated design. As noted earlier, as long as the LGUs agree, metropolitan arrangements provide terrific opportunities to support low carbon and climate resilient development.
Given urbanization prospects in the Philippines and especially in Cebu City, transport, water, power, and waste management infrastructure are much easier and economical to provide and maintain in cities than rural areas. Due to economies of scale, urbanization also provides opportunities for resilient infrastructure to be provided to more citizens. As engines of growth, cities also provide opportunities to make infrastructure construction, operation and maintenance more affordable138.
Financing for Resilient and Green Urban Solutions in Cebu, Philippines | 115
The Initiative on Financing for Resilient and Green Urban Global Solutions (FRUGS)
6.2 Improving Financial and Technical Support at the City Level
6.2.1 Present recommendations on how to improve efficiency and effectiveness of financial and technical support in the city
To achieve urban development goals especially towards a low carbon and climate resilient future, it is essential to maximize ongoing and future technical and financial support provided to the city. These can be achieved in a number of ways.
First, it is essential to utilize a multi-sector approach in capacity building, planning, and implementation. It should include the academe for technical and training know-how, the private sector not just for investments but also for their technical expertise and operational experience, understanding of the profitability and adoption of technology (e.g. eco-efficient homes), practitioners (e.g. association of urban planners, engineers), and career city government officials from relevant sectors, politicians and related civil society groups for buy in. Holistic targeting of human resource and institutional development across the participating stakeholders provides efficient use of resources as well as an effective learning process.
Second, a related measure is supporting the implementation of RA 10587 or the Environmental Planning Act of 2013. It directs professionalization of staff with planning functions among LGUs by requiring licensed environmental planners139. For effective technical support to the city, it is fundamental that staff are qualified planners so when innovative practices or knowledge sharing activities are undertaken, LGU staff also easily follow, can relate, and even adapt learning to local context reasonably quickly.
Third, it would be very useful if more LGUs could also benefit from the financial management
139 Republic of the Philippines. (2013). RA 10587 or the Environmental Planning Act of 2013.140 Manasan, R. et al. (1998). Local Efforts in Housing Provision. Discussion paper series no. 98-44. Philippine Institute for
Development Studies.
technical assistance being provided to the central office of DILG through its Bureau of Local Governance Development. With DILG’s supervisory and oversight functions over LGUs nationwide, mainstreaming financial know-how, especially those related to structuring investments and climate finance would immensely aid in the effectiveness of financial and technical support to cities. Similarly, LGUs need help in learning how to prepare the requirements of accessing the People’s Survival Fund as noted earlier.
Fourth, it is necessary to strengthen the relationship of DILG, CCC, DBM, DOF, NEDA and HUDCC to the extent that it affects sustainable urban development especially for climate resilient planning. As discussed in Chapters 1-3, the Philippines has a generous range of climate-related laws that cover both technical and financial aspects. To improve efficiency and effectiveness of financial and technical support to cities, enforcement and application of such policies, rules, circulars among LGUs would be the minimum. Doing so also requires defining the specific roles of stakeholders amongst others. For example, one study cites that local governments can serve as either provider (e.g. directly financing the project) or facilitator (e.g. providing a platform for other stakeholder contributions) for urban services140.
6.3 Opportunities for International Financial Institutions and Agencies
This sub-section looks into opportunities for international financial institutions and the private sector, especially exploring possible collaborations to support Cebu City develop sustainable housing and infrastructure. The discussion will support financial sector development, financing opportunities for Cebu City, capacity building and partnership opportunities such as knowledge sharing and development of new instruments.
116 | Financing for Resilient and Green Urban Solutions in Cebu, Philippines
The Initiative on Financing for Resilient and Green Urban Global Solutions (FRUGS)
6.3.1 Support to Financial Sector Development
Although Chapter 5 indicates that the Philippine financial system has been strong and stable thanks to firm macroeconomic fundamentals set in place, there is still so much room for developing the financial sector further. As will be discussed in Chapter 7, there is still a need to narrow the infrastructure investment gap in the Philippines. Due to scarce resources, the government can still benefit from a favorable financial sector environment that supports the increased participation of the private sector and development of innovative instruments for housing and infrastructure investment needs.
Consistent with the goal of making housing more affordable for more, the last PDP 2011-2016 envisioned an inclusive financial sector in the Philippines. First, it aimed to support the promotion of a regionally responsive and inclusive financial system through institutionalized savings generation and resource mobilization. Due to the archipelagic nature of the Philippines, not all segments of the population have access to financial services. Initiatives to increase alternative products and delivery of services in far-flung areas or those in informal economies can include micro-insurance, micro-housing, and involvement in the credit surety fund program. This also means exploring alternative ways of inclusive financing such as agent banking or use of non-bank financial delivery channels. Mainstreaming the various financial literacy programs will also engender increased savings. These can be complemented by new loan products and services for marginalized sectors such as the poor, elderly and persons with disability.
Second, there is a need to improve the enabling environment for long-term investments. Literature consistently stated that the housing finance market would benefit from further development of the capital market. Although the LGC allows issuance of municipal bonds,
141 ADB. (2016). Philippines: Public-Private Partnerships by Local Government Units. Manila.142 Ballesteros, M. and Dulay, D. (2013). Feasibility of Mortgage-Backed Securitization for the Underserved Housing
Market in the Philippines. Philippine Institute for Development Studies. Discussion paper series no. 2013-43.
support for increased LGU access to capital markets can also lessen reliance on national-local transfers among others. Development of bond markets can also lower risk premiums and facilitate access to financing141. Alternatively, there are also opportunities to develop auxiliary markets through forwards and cash markets. Similarly, support is needed towards faster and effective integration with the ASEAN financial system.
Specific to the housing sector, support to strengthen the NHMFC as the Philippine institution for secondary mortgage is required. Support needs include rationalization of the financing roles of the HGC, HDMF and NHFMC and development of standardized loan documents and quality underwriting through mortgage insurance142. Due to NHFMC’s historical performance and the American experience, studying the provision of appropriate securitization incentives, use of mortgage-back securitization bonds and its effect on current housing finance would be useful. Similarly, the LGU Financing Framework must be strengthened to allow the increased participation of the private capital market in financing of local government expenditures.
Third, governance of the Philippine financial system can still benefit from being strengthened based on best practices and standards. Support to ensure the system has enough risk management structures for the innovative blended financing modalities of climate finance must also be set in place. As such, financial regulators must continuously receive capacity development as regards the increasing sophistication of financial instruments, especially on green financial architecture. Support for harmonizing regulatory and supervisory oversight of domestic and international financial regulations will also be needed. This also includes f the risk-based capital adequacy (RBCA) framework for providers of financial services and products under SEC and IC regulation and supervision. Although already in place, further support for
Financing for Resilient and Green Urban Solutions in Cebu, Philippines | 117
The Initiative on Financing for Resilient and Green Urban Global Solutions (FRUGS)
the promotion of market discipline through effective corporate governance frameworks must be continued.
Fourth, a stronger legal framework to support financial sector development that prioritizes financial stability, supervisory oversight, inclusive finance and capital market development will require the support and active participation of the legislative process. Strengthening financial sector development can also include the following:
• Establishment of a legal framework for the acceptance of movable assets as collateral
• Establishing an adequate legal framework to encourage greater investor participation, financial taxation and effective oversight of the national payments systems
• Creating an enabling environment for the efficient operations of cooperatives in the Philippines following the enactment of RA 9520 or the Cooperative Code
• Supporting the operations of Central Credit Information Corporation to improve the ability of financial institutions to access credit history data for debtors resulting in lower transaction costs for loan underwriting
• Supporting a policy framework for the government’s social agenda of reducing poverty through mandated credit to certain sectors of the economy such as MSMEs and the agriculture sector
• Expanding investor and creditor protection mechanisms in response to modern banking, finance standards and insurance as well as risks such as cybercrime and money-laundering
6.3.2 Financing Opportunities in Cebu City
Chapters 2 and 3 discussed the financing needs of Cebu City and Mega Cebu as it
143 GIZ. (2016). GIZ in the Philippines. Retrieved from https://www.giz.de/en/worldwide/376.html144 German Embassy Manila. Economic Cooperation: The Philippines an Important Partner. Retrieved from http://www.
manila.diplo.de/Vertretung/manila/en/07/0--Economic_20cooperation.html145 IKI. (2016). International Climate Initiative Projects. Retrieved from https://www.international-climate-initiative.com/en/
nc/projects/projects/
relates to housing and infrastructure on various years leading to 2050. Meanwhile, Chapter 7 presents identified pipeline of projects at the national and sub-national levels based on past and present government priorities. Despite these published project roadmaps and pipelines, the financing components for some have not yet been finalized (e.g. BRT in Metro Manila or rail transport in Metro Cebu). As such, there are still opportunities for international development agencies and the private sector especially German institutions involved in financial cooperation to finance Cebu City’s efforts in developing resilient and sustainable housing and infrastructure planning.
While multilateral development partners (e.g. ADB and World Bank) have traditionally provided loans for big ticket infrastructure projects and provided technical assistance for capacity building initiatives across various sectors, bilateral partners like USAID and JICA also have a long history of supporting projects that facilitate infrastructure and economic governance development, especially in cities. Meanwhile, German financial institutions have traditionally supported projects on economic, ecological and social development related to coastal management, biodiversity, environment, and peace and livelihood143. German financial cooperation institutions commission projects from various German Federal Ministry agencies and likewise engage in cooperative financing and implementation arrangements with select United Nations agencies and other partners144. There are also European Union projects (e.g. SWITCH Asia project on sustainable consumption and production) administered or undertaken by German consulting firms. The Philippines is also a priority country under the Federal Government’s International Climate Initiative with 37 projects covering the country and 10 specific bilateral projects145.
German development cooperation requires the same inventory and audit as needed in the larger ODA portfolio in the Philippines noted
118 | Financing for Resilient and Green Urban Solutions in Cebu, Philippines
The Initiative on Financing for Resilient and Green Urban Global Solutions (FRUGS)
in Chapter 4 to determine its programming history. This would be helpful in mapping future financing opportunities. For example, GIZ provides the largest support to the Philippine CCC as well as supported a housing suitability project for HLURB146. While it would make sense to continue and intensify established partnerships and expertise on themes that Germany has strongly supported such as climate change adaptation, defining financing opportunities for German financial cooperation would require mapping BMZ priorities for the Philippines and how it matches national and local development priorities147. Aside from mapping mutual priorities and time cycles between international financing institutions particularly those belonging to the German development cooperation, it is also necessary to map available financing instruments that cities are also allowed to access. For example, KfW, the German Development Bank, has been supporting the Philippines for years148. For example, see Annex 12 for KfW’s financing instruments available to cities. Similarly, German-extended financing support could also be as an intermediary as in the case of the Green Climate Fund where KfW is an accredited implementing institution149. As the Philippines and Cebu City endeavor to implement the INDCs under the Paris Agreement, financing opportunities further abound. KfW’s publication on Linking Climate Targets and Investment Portfolio can serve us a guide150.
6.3.3 Capacity building opportunities for financing Cebu City
Capacity gaps in the housing and urban infrastructure provision of Cebu City have been noted in different sections of this report. This sub-section however will focus on capacity
146 HLURB. (2016). “Harnessing suitability mapping for preparedness and resiliency.” Retrieved from http://hlurb.gov.ph/harnessing-suitability-mapping-for-preparedness-and-resiliency/
147 BMZ. (2016). Philippines. Retrieved from http://www.auswaertiges-amt.de/EN/Aussenpolitik/Laender/Laenderinfos/01-Nodes/Philippinen_node.html
148 KfW. (2016). Philippines: Good growth rates but great disparity in incomes. Retrieved from https://www.kfw-entwicklungsbank.de/International-financing/KfW-Development-Bank/Local-presence/Asia/Philippines/
149 KfW. (2016). Green Climate Fund: KfW Accredited as an Implementing Institution. Retrieved from https://www.kfw-entwicklungsbank.de/International-financing/KfW-Development-Bank/News/News-Details_272320.html
150 Harnisch, J. et al. (2015). Materials on Development Financing No. 5: Linking Climate Targets and Investment Portfolio. KfW Development Bank.
building opportunities for financing of the city. Overall, the capacity of Cebu City to understand the linkage of cities and climate change as well as plan urban development investments with a climate finance lens is a start. Improving cities and climate change understanding among stakeholders across the board (e.g. government planners, sector engineers, architects and designers, real estate developers, government and private financial institutions, and most especially the academe and civil society) will also increase awareness of the need to think in terms of the people, planet and profit, particularly on low carbon and climate resilient solutions.
Know-how in formulating technical designs and proposals is a pre-requisite in any investment package before financing options are even pursued. Technical specifications inform project costs and knowledge of the regulatory framework and institutional arrangements inform possible subsidies or tax breaks that can be availed or engender lower transaction costs during implementation and lower operations and maintenance costs. While this technical know-how is widely acknowledged to be poor among LGUs and widely attributed as the cause of the low ratio of ODA projects at the LGU level, integrating green solutions is even poorer. This also includes improving spatial planning that integrates resource needs for the city’s increasing population and inevitable challenges brought about by urbanization as well as designs that demonstrate multi-sector benefits. Capacity building in understanding green solutions either through retrofitting or new construction can also lower expenses related to hiring consultants and engaging foreigners to even undertake pre-feasibility studies. For example, it would also be useful if LGUs would know how to translate INDCs into
Financing for Resilient and Green Urban Solutions in Cebu, Philippines | 119
The Initiative on Financing for Resilient and Green Urban Global Solutions (FRUGS)
actual local programs and projects. Another example is preparing proposals eligible for the Php 1 billion PSF. Similarly, cities and national government sector agencies can learn the process of accessing GCF funds together.
As some developmental partners and financing institutions operate on the basis of country partnership strategies, capacities in linking land use planning, investment programing and development planning as well as budgeting and implementation also need to be strengthened151. This would most especially be essential for green solutions where matching local priorities with national and development partners’ priorities will be a starting point.
While hiring seasoned transaction advisers through donor-funded projects has become the norm, it would also be helpful for cities to gain capacity to undertake project structuring on their own, especially having in-house knowledge on having PPP arrangements. In this manner, LGUs would be able to merge their roles as political figures, corporate entities and urban managers in delivering climate-resilient infrastructure and services. However, transaction advisers need not be done away completely as they can also serve as carriers of knowledge and best practices. Advisors engaged by other LGUs can pass on useful lessons. Similarly, LGUs could also benefit from improving their understanding of the economic and financial benefits of linking with other LGUs in financing infrastructure and services that address common needs152.
The stability of both the national financial system and Cebu City’s resource mobilization has been noted elsewhere in this report. However, the current Cebu City government has expressed plans to further maximize revenue generation through improved tax mapping. Supporting the assessor’s office in
151 Carino, B. and Corpuz, A. (2009). Toward a Strategic Urban Development and Housing Policy for the Philippines. Philippine Institute for Development Studies. Discussion paper series no. 2009-21.
152 ADB. (2016). Philippines: Public-Private Partnerships by Local Government Units. Manila.153 HUDCC. (2016). Philippine National Report to Habitat III: A New Urban Agenda: Better, Greener, Smarter Cities in a
More Inclusive Philippines154 International Partnership on Mitigation and MRV. (2016). Measuring, Reporting, and Verification (MRV). Retrieved from
https://mitigationpartnership.net/measuring-reporting-and-verification-mrv-0
updating tax maps that integrate available hazard maps using GIS technology would be one means of improving capacity. The national government has undertaken a similar effort with the European Space Agency for Metro Manila to determine social housing suitability.
The Philippine National Report to Habitat III also highlights the need to “to continually integrate local knowledge with additional scientific and technical knowledge”153. As such, continuously providing opportunities for LGUs to share and understand the local situation in the context of scientific developments to inform planning will also be useful. Similarly, as part of UNFCCC commitments, countries must regularly measure, report and verify (MRV) collected data on “emissions, mitigation actions and support compiled into reports and inventories for international review and analysis”154. Continuing and intensifying ongoing support from donors on MRVs would be most useful. Although the former Cebu City Mayor signed ICLEI’s Compact of Mayor’s in Paris 2015, both ICLEI Southeast Asia and the current city administration confirmed there has been no progress in compiling the inventory. As such, this is clearly an area that would benefit from capacity building as it aids in linking technical and financial support from climate change initiatives.
Philippine law also allows alternative mechanisms such as issuance of municipal bonds and value capture financing. While these were discussed previously in Section 6.3.1 on supporting financial sector development, the city government can immensely diversity their external financing options by increasing their understanding and use of such alternative instruments. One example would be improving the enabling framework for disaster risk insurance for housing developments.
120 | Financing for Resilient and Green Urban Solutions in Cebu, Philippines
The Initiative on Financing for Resilient and Green Urban Global Solutions (FRUGS)
6.3.4 Partnership opportunities as well as knowledge development and sharing in Financing FRUGS
Assessing partnership opportunities for FRUGS particularly on knowledge development and financing must naturally begin with the existing engagement of UN-Habitat Philippines and the German development cooperation agencies. Both have been actively engaging the national government and select LGUs on a range of programs and projects at the nexus of climate change and cities. For example, GIZ has supported HLURB to develop an updated CLUP guidebook that integrates climate change adaptation and mitigation. Similarly, UN-Habitat Philippines has been supporting HUDCC in the formulation of LSPs among LGUs that likewise integrate climate change dimensions in their population and housing needs planning. However, to gather increased buy-in for FRUGS and broader implementation, it would be beneficial to have partnerships with all the other international partners involved.
As regards the national government, if there will be a single focal point for future FRUGS engagement, it is suggested that DILG takes on this role due to its mandate of oversight and policy supervision of all LGUs. It sits on every inter-agency grouping including the CCC, the PSF board and the NDRRMC among others. Its attached agency, the Local Government Academy is also responsible for capacity building initiatives on the formulation of the LCCAP and disaster preparedness across the country.
To improve knowledge development and knowledge sharing, it would be beneficial to partner with the University of the Philippines’ School of Urban and Regional Planning, which coincidentally is also a consortium member of the German Academic Exchange Service’s Spatial Planning for Regions in Growing Economies Program. It is the training ground for the country’s environmental planners and would help ensure that courses held in the Philippines are up to par with green urban development thinking and practices. However, there is also a need to engage other organizations knowledgeable of climate
finance for cities. Professional organizations like the Philippine Institute of Environmental Planners or United Architects of the Philippines can also aid in knowledge development especially through their members who are embedded in both public and private sectors.
To mobilize financing for the FRUGS initiative beyond donor support and government-appropriated budgets, partnerships with various chambers of commerce across the country, business groups and similar would be options. Even without explicit financial support, buying into the concept of FRUGS and mainstreaming it into their businesses can have far reaching effects.
To actually materialize the FRUGS concept, it is essential to partner with an LGU, preferably Cebu City. Having been chosen as a pilot city for FRUGS, it has demonstrated to possess the combination of having both the economic and financial strength amidst a challenging climate-risk and hazard prone area as it addresses the challenges of urbanization. As this report has shown, Cebu City also has extensive experience with donor supported programs across sectors. The current city administrator is also hailed as the country’s top low-income housing expert having led the previous President’s national program as well as has decades of administering urban services in Cebu. Having attended the Habitat III meeting in Quito in October 2016, there has been expressed interest to support the operationalization of the Philippine National Urban Agenda with Cebu City as pilot.
6.3.5 Opportunities for launching and developing new instruments
As previously discussed in Section 3.1.2, the Philippines Green Business Council already has the BERDE standard adopted by select architects, designers and developers. Increased mainstreaming of such standards, together with the new Philippine Green Building Code issued by DPWH would provide the foundation for creating a green building and housing index. A similar tool to create a climate-resilient infrastructure index across the
Financing for Resilient and Green Urban Solutions in Cebu, Philippines | 121
The Initiative on Financing for Resilient and Green Urban Global Solutions (FRUGS)
Philippines would be a practical initiative. It may also start with the city AIPs or infrastructure tagged under CCET. Mapping green buildings provides a useful baseline for better urban development and investment planning.
Similarly, an inventory of adaptable or already adopted green technologies in the Philippines would help homeowners, industries, the academe and government alike. Knowledge of available technology facilitates compliance with national government guidelines on the use of clean and renewable energy. As complex challenges brought about by urbanization and climate change requires innovative solutions, there is a practical opportunity to introduce a green technology index together with suppliers and costs if available. Having information readily available could encourage adoption of eco-efficient technologies.
While some countries rely on technology transfers, some also undertake their own research and development in pursuit of sustainable development goals. The Philippine National Report to Habitat III called for the systematic study of urban demography, including internal migration patterns that can inform urban resilience and housing planning. Although the NCC already has a livability index and WWF Philippines has indexed 16 cities in terms of their urban resilience, their methodologies and databases provide the foundation for integrating local knowledge with scientific and technical ability to inform various stakeholders.
Google maps provides an efficient way to locate places all over the world that is accessible to practically anyone with internet access. Similar access to a one-stop portal to Philippine hazard maps at the national, regional, and local levels must also be made available. Although these may be a matter of national security that may have economic implications, knowing whether an actual property is at a flood prone area despite the real estate agent not disclosing the fact would be very helpful for example. The Philippine National Mapping and Resource Information Authority has a Geoportal that includes maps on tourism, DRRM, routing, Haiyan-related information, and roads. However, it is the Philippine Department of Science and Technology, through its attached agencies such as the Philippine Institute of Volcanology and Seismology and the Philippine Atmospheric, Geophysical and Astronomical Services Administration that host hazard (e.g. flood and landslides) maps and fault system atlases among others. Similarly, PDRF and WWF have mapped critical infrastructure in the Philippines that will affect overall climate and economic resilience but these are not publicly available.
These are just a few examples of new tools and instruments that could be refined and re-launched that support the overall goal of the FRUGS project. Opportunities abound in the Philippines and making sense of the available data, determining gaps, and how such information could be useful for others will be one of the main challenges.
122 | Financing for Resilient and Green Urban Solutions in Cebu, Philippines
The Initiative on Financing for Resilient and Green Urban Global Solutions (FRUGS)
Chapter 7
Project Identification
Financing for Resilient and Green Urban Solutions in Cebu, Philippines | 123
The Initiative on Financing for Resilient and Green Urban Global Solutions (FRUGS)
This last chapter focuses on identifying projects on housing, infrastructure and services both at the national and sub-national levels. It begins by presenting the national and city priorities followed by a discussion of financing opportunities. Given these priorities and opportunities, project pipelines for a BAU scenario and under a low-carbon and climate-resilient scenario will be presented.
7.1 National Priorities for Housing, Infrastructure and Urban Services
Philippine national priorities for housing, infrastructure and urban services are outlined in a number of key documents arrived at through collaborative and consultative processes155. Philippine development in the next 25 years is anchored upon AmBisyon Natin 2040 (Our Aspiration 2040). As the framework that will embody the four forthcoming PDPs under each incoming administration, it envisions that:
“By 2040, the Philippines shall be a prosperous, predominantly middle-class society where no one is poor. [Filipino] People will enjoy long and healthy lives, are smart and innovative, and will live in a high-trust society.”
Its formulation is spearheaded by NEDA as the national development planning agency of the Philippines. Ambisyon 2040 focuses on eight priority sectors such as: 1) housing and urban development; 2) manufacturing; 3) connectivity; 4) education services; 5) tourism and allied services; 6) agriculture; 7) health and wellness services; and 8) financial services. Specific policies and strategies to pursue these priorities are articulated in the current Medium-term Philippine Development Plan for 2017-2022.
155 The key documents include: the Philippine Development Plan (2010-2016), the National Urban Development and Housing Framework (2009-2016) with the 2016-2022 currently under preparation; National Report to Habitat III (2016); the National Shelter Plan.
• Even when the MTPDP for the current administration was forthcoming, the Philippine Government expressed its commitment to the principles of Habitat III as articulated in the National Urban Report lead by HUDCC completed in 2016. It’s indicated agenda focused on six areas, namely:
• Urban demography. Focuses on investing in people, capturing the youth dividend and pursuing a more spatially and regionally balanced development across regions in the Philippines. It also emphasizes the need for improved capacity for urban demography to address the need for its systemic study especially on monitoring population movements and internal migration;
• Land and Urban Planning, particularly on more effective regional planning that integrates CCA and DRRM, and improved access to urban land. It continues to emphasize the integration of CCA and DRRM towards spatial urban planning. It also highlights the need to stimulate growth in secondary cities and adopt infrastructure-guided planning to manage urban sprawl and built forms. This also includes redefining land tenure with a rights-based lens.
• The urban environment: improved capacity and governance arrangements at the national and local levels accelerate climate resilience of cities. It emphasizes the role of integrated knowledge and science with local context in innovative solutions towards developing green cities. This particularly includes greening solid waste management and facilitating more investments in water supply across the country.
• Urban governance: the need for stronger sector leadership manifested in the creation of the Department of Housing and Urban Development, more transparent
124 | Financing for Resilient and Green Urban Solutions in Cebu, Philippines
The Initiative on Financing for Resilient and Green Urban Global Solutions (FRUGS)
and accountable digital governance and improved public financial management. This includes reviewing policies related to national and local sharing of resources that is crucial in metropolitan governance. It supports metropolitan arrangements among LGUs and recommends these be established with adequate powers, tools, and incentives, particularly for bigger infrastructure projects to deliver efficient and affordable metropolitan services;
• Urban economy: more diversified local and housing finance options and sustainable local economic development mainstreamed in development planning. It highlights the role of cities in agents of diverse financing to address the urban infrastructure investment finance gap. In particular, it aims for cities to be able to have better access at both capital and debt markets as well as learn to structure and manage viable PPP projects;
• Provision of housing and basic services. Though the priority are informal settlements and urban poor, it encourages investments in spatially integrated climate resilient housing and urban infrastructure. It emphasizes the need to invest in infrastructure with co-benefits across income segments and sectors towards achieving the triple bottom line (people, planet, profit). To link these climate-resilient communities, the report also prescribes the promotion of shifting towards demand-based and low-carbon transportation in the Philippines.
While the national urban report to the Habitat III is not a regular expression of the priorities of the Philippine Government due to its timing, a key document that also indicates national priorities on urban development and infrastructure is the National Physical Framework Plan. The current NPFP is valid from 2001 to 2030 but it is already being updated for the period of 2016-2045. Also lead by NEDA, the NPFP is intended to guide the location of investments, improvement of the flow of people, goods, and services, protection and conservation of the environment, and reduction of disaster risk and vulnerability to natural hazards. Its core strategy is reflected in the National
Spatial Strategy (NSS) which considers population trends, economic services and activities, especially amidst the increasing role of cities in growth and poverty reduction. The upcoming NPFP 2016-2045 recognizes and centers its proposed solutions on four development issues and challenges, namely: 1) urban/settlement and food security; 2) land use conflicts; 3) urban efficiency and capacity; and 4) disaster risk and vulnerability. As such, the core strategy of NSS focuses on the following strategies and objectives:
• Concentration
• Optimization of benefits from agglomeration
• Increasing viability of wider variety and higher level of service in areas with bigger markets
• Reduction of encroachment into agricultural land and other environmentally-sensitive or protected areas
• Connectivity
• Improving the linkages among settlements and key production areas
• Growth in areas with economic potential through efficient transportation networks
• Increasing access to jobs and services in smaller settlements
• Vulnerability Reduction
• Protection of environmentally-constrained and/or hazard-prone areas
• Controlling settlements in hazard-prone areas
• Ensuring the safety of the population as regards vulnerability to natural hazards
• Ensuring access to areas affected by hazard events
Financing for Resilient and Green Urban Solutions in Cebu, Philippines | 125
The Initiative on Financing for Resilient and Green Urban Global Solutions (FRUGS)
The National Spatial Strategy recognizes the need for a network of settlements across the country at the level of metropolitan, regional and sub-regional centers156. This includes Cebu City as a metropolitan center that also serves as an economic and administrative center, a primary international gateway, and a distinct function of having innovative and advanced services, culture and tourism, education and research, transportation, trade, production, and technology development. In the plan, Metro Cebu is envisioned to remain as the economic, commercial, and logistics center of the Visayas region. As such, the National Physical Plan continues to integrate not only CCA and DRR into spatial urban planning but also continues to highlight the importance of economic growth across the country, particularly in cities and the increasing agglomeration among Philippine LGUs.
Although these agenda are expressed commitments of the government, the National Urban Development and Housing Framework articulates clear policy guidelines, and where possible, also includes strategy and actual suggested programs and projects. The most recent National Urban Development and Housing Framework (2010-2016) aimed for “urban development in the Philippines to be an urban system that facilitates economic growth, develops and strengthens local comparative advantages, and significantly improves the quality of life of its residents.” It is currently being updated for the 2016-2022 period consistent with the Habitat III principles and the Ambisyon 2040. It envisions to have a better, greener, smarter urban systems in a more inclusive Philippines. Focusing on the integration of CCA and DRRM in housing and urban development, the next framework is anchored on the following principles:
• Urbanization as a catalyst for inclusive development;
• Resilience as a base for spatial structuring and sectoral development;
156 NEDA. (2016). NEDA Board Committee on Land Use to Review National Spatial Strategy, Retrieved from http://www.neda.gov.ph/2016/12/12/neda-board-committee-on-land-use-to-review-national-spatial-strategy/
• Spatially and thematically integrated settlements within coherent and efficient urban systems and forms across scales;
• Urban areas as accessible platforms for social and economic opportunity, cultural expression and innovation; and
• People’s participation, empowerment and capacity as foundations of urban governance, facilitating sustainable resource use, planning, management and finance.
While these principles will be translated into strategies and projects to be enumerated in the forthcoming NUDHF 2016-2022, these are consistent with the more specific agenda of the national urban report of the Philippine government to Habitat III. These principles are likewise consistent with the development of Philippine legislation as regards CCA and DRRM discussed in Chapters 2-4. As such, Philippine priorities for housing, infrastructure and urban services have been towards providing green solutions to developmental issues.
Given these national priorities as indicated in the above-mentioned plans, materializing these priorities into actual projects will be reflected in the approvals of the NEDA’s Investment Coordination Committee (ICC) and the appropriated national budget. These will be discussed in Section 7.3 on financing opportunities for project pipelines. As regards city level versions of these priorities, see the next section.
7.2 City Priorities for Housing,
Infrastructure, and Urban Services
As noted earlier, the last approved CLUP of Cebu City was submitted to HLURB in 1981. Despite that, various versions have been prepared and submitted for the City Council’s approval through the years. Unfortunately, due
126 | Financing for Resilient and Green Urban Solutions in Cebu, Philippines
The Initiative on Financing for Resilient and Green Urban Global Solutions (FRUGS)
to some contentious segments, a new official one has not been approved yet. However, Cebu City Government (CCG) priorities for housing, infrastructure and urban services are guided by the most recent draft CLUP and the Cebu City Strategic Master Plan Study approved by the City Council in 2005 and updated in 2012. This master plan includes situational analyses and provides CCG priorities from 2005 to 2023. The projects were prioritized for the following reasons:
• To mitigate the critical constraint or resolve the critical problem that could hamper Cebu City’s economy in the near future;
• To support the on-going project/program which can substantially contribute to the formulation of basic infrastructure or social base for sustainable development;
• To recognize pre-requisite interventions to facilitate long-term investments;
• To improve the government-provided infrastructure or services;
• Implementation-ready projects due to completion of feasibility studies and/or detailed designs
The 90 priority projects are categorized according to the following:
• Economic development (3 projects)
• Rural development (4 projects)
• Urban development and land use (2 projects)
• Housing Development (2 projects)
• Social Services (4 projects)
• Education (6 projects)
• Environment (6 projects)
• Parks and recreation (2 projects)
• Transport
• Land (10 projects)
• Sea (2 projects)
157 DOF. (2016). Duterte Admin awaits financing cooperation with AIIB on big ticket projects. Retrieved from http://www.of.gov.ph/index.php/duterteadminawaitsfinancingcooperationwithaiibonbigticketprojects/
• Air (1 project)
• Administration (2 projects)
• Utilities Development
• Water (4 projects)
• Power and electrification (3 projects)
• Communication (3 projects)
These priority projects were also categorized based on its implementation timeline of short term (2005), mid-term (2010), and long-term (2020). As such, some of these projects may have been completed already or are currently ongoing. See Annex 11 for the actual list for housing, infrastructure, and urban services with corresponding project costing.
Although the City Government of Cebu will undertake the above under its mandate and autonomous nature, some of the projects above will also benefit other members of Metro Cebu and be implemented in cooperation with Metro Cebu. As such, when determining priority projects, it is essential to consider both the plans of the Cebu City Government as well Metro Cebu. Annex 11 also includes agencies involved in implementation and financing.
7.3 Financing Opportunities for Project Pipelines
Given the national and city priorities discussed both for a BAU and climate-resilient future, financing opportunities abound to materialize these into actual projects. While project pipelines will be presented in sub-sections 7.4 to 7.6, this brief sub-section will discuss potential opportunities for financing for partners from both the public and private sectors as well as funds from the Philippine Government, both at the national and sub-national levels.
According to the DOF, the public spending will be in the horizon of PhP 8-9 trillion until 2022 to close the Philippine infrastructure gap157. Accounting for 61 projects, three of these cover
Financing for Resilient and Green Urban Solutions in Cebu, Philippines | 127
The Initiative on Financing for Resilient and Green Urban Global Solutions (FRUGS)
Cebu City and will also benefit neighboring LGUs. Amounting to a total of PhP 46,153 billion, these are the Mactan-Cebu International Airport funded by PPP (PhP 17,520), the Metro Cebu Expressway to be funded using the national budget (PhP 18,016 billion), and the Cebu BRT funded by ODA (PhP 10,617). All three are part of previous plans and roadmaps, with only the expressway at project development stage158. These are included in the ‘Build, Build, Build’ Program of the President’s ‘Dutertenomics.’ See Annex 9 for the list of projects. Although only 3 explicitly cover Metro Cebu, other projects that align with the FRUGS initiative aside from the Cebu BRT project (CIF-funded) includes the Leyte Tide Embankment (PhP 7.9 billion) also in Central Visayas Region. A remnant of the post-Haiyan Build Back Better on the Rehabilitation of and Recovery from Super Typhoon Haiyan, it intends to cover 27.3 km. While the Public Works Minister stated at a recent World Economic Forum that all these projects will abide by the Paris Commitments towards low-carbon growth and addressing climate change, no definitive available review of the project designs can confirm the statement. However, a series of projects on New Clark City in Luzon, about 80 kms away and less than 2 hours from Manila explicitly complement the FRUGS initiative. Although not all projects are costed yet, those with estimates are valued at PhP 136 billion already. See annexes 8 and 9 for description, status, and funding options.
In the 2011-2016 Philippine Investment Plan (PIP), the previous administration planned 69 infrastructure investment projects amounting to PhP 551,545.75. From 2008 – 2012, the share of infrastructure spending in GDP ranged only from 1.40% to 2.09%, which is way beneath then target spending of 5% of GDP159. In 2014, three ratings agencies, namely Moody’s, Standard & Poor’s and Fitch updated the Philippines’ rating on external debt to investment grade. To build on the momentum of continuous GDP growth and improved rankings, the World Bank
158 Government of the Philippines. (2017). “Projects of the Build, Build, Build Program.” Retrieved from http://www.build.gov.ph/Home/Project?page=1
159 Llanto, G. and Navarro, A. (2014). Financing Infrastructure in the Philippines: Fiscal Landscape and Resource Mobilization. Philippine Institute for Development Studies. Discussion Paper Series No. 2014-01.
160 KPMG. (2015). Infrastructure In-depth: Philippines 2015 Investment Guide in the Philippines by KPMG.161 Komatsuzaki, T. (2016). Improving Public Infrastructure in the Philippines. IMF Working Paper.
has also encouraged to increase infrastructure spending, especially through the PPP program as a “new source of growth”160.
While sub-section 7.5 provides a pipeline of infrastructure projects as of 2016, KPMG’s study on infrastructure investments in the Philippines as of 2015 provides a comprehensive assessment of the previous administration’s gains particularly on the relationship of development plans, governance, partnerships, sector-specific resource needs and the regulatory environment that shape financing. Similarly, in early 2016, the International Monetary Fund (IMF) noted the prevailing low level of public capital, quality of infrastructure, and overall public investment efficiency in the Philippines compared to the rest of Asia. To address this gap, IMF assessments revealed that there is much room for improving public investment efficiency resulting in further sustained growth. In particular, an increase in public investment alone can result in a cumulative increase of GDP by 4.5 - 6%, while eliminating inefficiency would yield 5 - 6% increase in 15 years. To do so, IMF holds that a combination of deficit-based and tax-based financing must be pursued albeit with varied effects on the macro economy. Regardless, ensuring debt-sustainability would still require increased revenue mobilization, ensuring a complimentary governance framework is in place, especially on broadening the tax base161.
Given the value of bridging the infrastructure investment gap in the Philippines, as noted in previous sections of the report, blended financing opportunities could be through the following: private sector financing through the PPP program and PFIs, public sector financing through ODA and GFIs, and wholly funded through national and local revenues. There is an opportunity to leverage these projects with national government guarantee and combine with other resources. The suitable financing modality varies based on sector and scale.
128 | Financing for Resilient and Green Urban Solutions in Cebu, Philippines
The Initiative on Financing for Resilient and Green Urban Global Solutions (FRUGS)
Sections 7.4 to 7.6 provide a pipeline of projects for housing, infrastructure and resilient urban development projects, and where available, indicates the appropriate modality.
7.4 Project Identification and Pipelines for Low Income, lower and Lower-Middle Income Housing
As discussed in Chapter 1, HUDCC is the primary institution that coordinates the other five KSAs at the national level, which all have their independent mandates. HUDCC estimated a 5.56 million housing shortage by the end of 2016, with 1.4 million comprised of informal settler families, of which 40% reside in Metro Manila. Based on initial presentations on HUDCC’s Proposed Housing Sector Roadmap for 2017 to 2022, needed direct housing provision will be a total of 1,675,650 million households while those in need of indirect assistance will be 1,590,688 households by 2022. The offices of the World Bank and UN-Habitat in the Philippines have been assisting HUDCC in developing the Comprehensive Housing Roadmap and a Post-Disaster Shelter Framework Policy and Plan which are due to be completed by 2017162. Due to the need to have reliable information for housing planning, the roadmap being developed will be based on data from available properties and list of informal settler families (ISF) nationwide from the Department of Social Welfare and Development.
As such, while the roadmap covers all household income segments and financing sources, the current housing pipeline is based on the “Developing a National Informal Settlements Upgrading Strategy” (NISUS) Report completed in 2014, which focuses on correcting then existing programs for ISFs. The NISUS is the overarching strategy of the Philippine Government on slum upgrading and relocation of settlements away from danger
162 Ordinario, C. (2016). Comprehensive housing road map to be completed by Q1 2017–HUDCC
http://www.businessmirror.com.ph/comprehensive-housing-road-map-to-be-completed-by-q1-2017-hudcc/
163 NEDA. (2017). NEDA Board Approved Projects as of 28 February 2017. Retrieved from: http://www.neda.gov.ph/wp-content/uploads/2017/03/ICC-NB-Approved-Projects-as-of-Feb-2017-Aquino-Admin.pdf
zones. A World Bank-supported National Summit was organized from 2015 to 2016 and current HUDCC leadership is slowly adopting its recommendations.
The Philippine New Urban Agenda (2016-2036) also has a specific agenda on “scaling up low income and pro poor housing, affordable, reliable and resilient basic services, and shifting to an inclusive, low carbon urban transport system.” Putting priority on informal settler families to live in resilient, vibrant, and connected urban communities, the agenda also sets the minimum standard for low-income, lower and middle-income housing policy. It also highlights the integration of climate resilience in basic infrastructure and the importance of low-carbon transport. Unfortunately, much of national and local housing plans and resources are devoted to slum upgrading and addressing the needs of the urban poor.
7.5 Project Identification and Pipelines for Infrastructure and Urban
Services in the Philippines
The primary list of infrastructure investments in the Philippines is generated through an approval process under the NEDA’s Investment Coordination Committee (ICC), chaired by the President. From June 2010 until February 2017, the ICC has approved a total of 116 projects worth PhP 1, 645,394.64 million where only two projects that covered Cebu City were included - the Cebu-Mactan Airport and the BRT163. Eighteen of these projects amounting to a total of about PhP 392,931.51 billion were approved within the first eight months of the current President. The port project for Cebu included in the list is likewise part of Metro Cebu’s roadmap of initial projects. See Table 54.
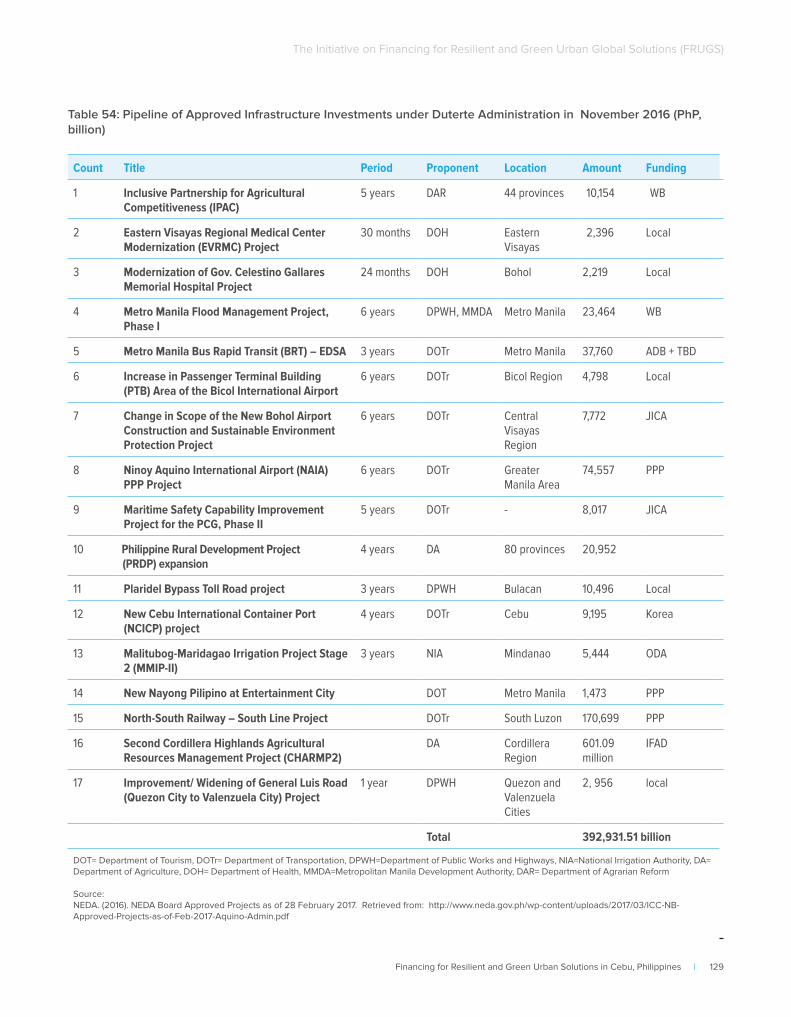
Financing for Resilient and Green Urban Solutions in Cebu, Philippines | 129
The Initiative on Financing for Resilient and Green Urban Global Solutions (FRUGS)
Count Title Period Proponent Location Amount Funding
1 Inclusive Partnership for Agricultural Competitiveness (IPAC)
5 years DAR 44 provinces 10,154 WB
2 Eastern Visayas Regional Medical Center Modernization (EVRMC) Project
30 months DOH Eastern Visayas
2,396 Local
3 Modernization of Gov. Celestino Gallares Memorial Hospital Project
24 months DOH Bohol 2,219 Local
4 Metro Manila Flood Management Project, Phase I
6 years DPWH, MMDA Metro Manila 23,464 WB
5 Metro Manila Bus Rapid Transit (BRT) – EDSA 3 years DOTr Metro Manila 37,760 ADB + TBD
6 Increase in Passenger Terminal Building (PTB) Area of the Bicol International Airport
6 years DOTr Bicol Region 4,798 Local
7 Change in Scope of the New Bohol Airport Construction and Sustainable Environment Protection Project
6 years DOTr Central Visayas Region
7,772 JICA
8 Ninoy Aquino International Airport (NAIA) PPP Project
6 years DOTr Greater Manila Area
74,557 PPP
9 Maritime Safety Capability Improvement Project for the PCG, Phase II
5 years DOTr - 8,017 JICA
10 Philippine Rural Development Project (PRDP) expansion
4 years DA 80 provinces 20,952
11 Plaridel Bypass Toll Road project 3 years DPWH Bulacan 10,496 Local
12 New Cebu International Container Port (NCICP) project
4 years DOTr Cebu 9,195 Korea
13 Malitubog-Maridagao Irrigation Project Stage 2 (MMIP-II)
3 years NIA Mindanao 5,444 ODA
14 New Nayong Pilipino at Entertainment City DOT Metro Manila 1,473 PPP
15 North-South Railway – South Line Project DOTr South Luzon 170,699 PPP
16 Second Cordillera Highlands Agricultural Resources Management Project (CHARMP2)
DA Cordillera Region
601.09 million
IFAD
17 Improvement/ Widening of General Luis Road (Quezon City to Valenzuela City) Project
1 year DPWH Quezon and Valenzuela Cities
2, 956 local
Total 392,931.51 billion
DOT= Department of Tourism, DOTr= Department of Transportation, DPWH=Department of Public Works and Highways, NIA=National Irrigation Authority, DA= Department of Agriculture, DOH= Department of Health, MMDA=Metropolitan Manila Development Authority, DAR= Department of Agrarian Reform
Source: NEDA. (2016). NEDA Board Approved Projects as of 28 February 2017. Retrieved from: http://www.neda.gov.ph/wp-content/uploads/2017/03/ICC-NB-Approved-Projects-as-of-Feb-2017-Aquino-Admin.pdf
Table 54: Pipeline of Approved Infrastructure Investments under Duterte Administration in November 2016 (PhP, billion)
130 | Financing for Resilient and Green Urban Solutions in Cebu, Philippines
The Initiative on Financing for Resilient and Green Urban Global Solutions (FRUGS)
These 17 approved infrastructure investments reflect the initial priorities of the national government under the new administration installed last July 2016. Having passed the ICC approval process, these projects have already gone rigorous assessments. The projects are at various stages of procurement and not all have secured 100% funding. While some projects will be supported by donor partners such as the ADB, JICA, the World Bank, the Philippine government is still also open to working with other partners to finance some of these projects. For example, the DOF expressed desire to discuss partial financing of the listed BRT and flood control projects in Metro Manila with the Asian Infrastructure Investment Bank although the ADB and the World Bank are already on board.164
In December 2016, NEDA also expressed the need to create a new Comprehensive and Integrated Infrastructure Program (CIIP) under the current administration. The purpose of the CIIP is to monitor infrastructure targets as the ICC-approval is only valid for 18 months. Aside from ICC approval, the Philippines also has approvals related to a Three-Year Rolling Infrastructure Program (TRIP) and the Core Investment Program (CIP). Despite the TRIP and CIP, the CIIP will still be proposed for formulation, which will include infrastructure funded via ODA, general appropriations act (GAA), corporate budgets, PPP/JVs and those under the private sector.
Under the current administration’s Public Investment Program (PIP) and TRIP, about PhP 652.9 billion will be needed for 2018, accounting for 17% of the Php 3.84 trillion proposed national budget. The initial TRIP costs PhP 3.6 trillion and includes a total of 5,215 projects, 177 costing more than PhP 2.5 billion each, accounting for 93.18%. The remaining 3.94% cover 4,889 projects that cost under PhP 1 billion amounting to PhP 311.02 altogether, and another 2.87% comprising 149 projects that cost between Php 1 billion and PhP
164 Dela Paz, C. (2016). Metro Manila food control, bus rapid transits eyed for AIIB financing. Retrieved from http://www.rappler.com/business/155261-philippines-aiib-financing-infra-projects
165 Retrieved from http://www.dbm.gov.ph/?page_id=20383166 Department of Budget and Management. (2017). Sectoral Distribution of Public Expenditure 2015-2017.” Retrieved
2.5 billion, amounting to PhP 226.83 billion. While the project lists are still being finalized, the government estimates that a trillion pesos will be spent annually on infrastructure until 2020. The government targets to implement 2,822 projects in 2018 alone valued at PhP 1.13 trillion, while budget allocation for 2019 will be PhP 1.18 trillion, and PhP 1.29 trillion in 2020 respectively. The TRIP covers flagship projects under the President’s Build, Build, Build program. See Annex 9.
The 2017 national budget allocates PhP 847.2 billion to infrastructure alone, accounting for 5.3% of GDP165. Although these investment projects will be funded using the national budget (general appropriations act or GAA), about 20% of the infrastructure costs will be augmented by ODA loans. Government economic ministers claim loans secured so far from Japan and the People’s Republic of China are almost at the same range. As the Philippine economy continues to grow with debt to GDP ratio currently at 40% and is still expected to decline to 35%, the government is confident about the returns of these investments. Also, a massive tax reform program is pending with Congress increasing collections from 15.3% in 2015 to 17.7% of GDP by 2022.
The 2017 approved national budget was PhP 3.35 trillion, 11.16% higher than the 2016 budget. Of this amount, the national government has budgeted to spend PhP 3.23 trillion in 2017 and has prioritized the social sector (37.29%) followed by economic services (25.6%), general services (19%) and a measly 4% for defense. Interest payments and financial services account for 12.55%166. Housing and land distribution fall under social services while power, water, communications and other transport are under economic activities. Overall, the education expense is the highest at 20.35%. It is important to note though that the Department of Public Works and Highways (separate from transport and energy) is devoting 1/3 of their PhP 429,692,546 budget
Financing for Resilient and Green Urban Solutions in Cebu, Philippines | 131
The Initiative on Financing for Resilient and Green Urban Global Solutions (FRUGS)
in 2017 to preparedness and resilience, particularly retrofitting existing infrastructure and repairing roads and bridges damaged by disasters.
7.6 Project Identification and Pipelines for Resilient and Green Urban Development Projects in the
Philippines
The responsibility for policy-making, planning, and project development rests on various sector agencies at the national level, which LGUs translate into their own projects. In the case of resilient and green urban development projects, the institutions involved go beyond those discussed in Chapter 1 but also include the institutions discussed in Chapter 4. As such, although the Climate Change Commission is an independent and autonomous body entrusted to lead policy-making, coordination, monitoring, and evaluation of programs and action plans related to climate change, it is not tasked to actually undertake projects though it has been a conduit for donor-assisted grant projects. However, in its function, it is able to steer the direction of project priorities through the formulation of the National Climate Change Adaptation Plan167. The programs and projects of the Philippine government must have the following objectives for the period of 2011-2028:
• Food security
• Water sufficiency
• Ecosystem and environmental stability
• Human Security
• Climate-smart Industries and services
from http://www.dbm.gov.ph/wp-content/uploads/BESF2017/A.5.pdf167 Climate Change Commission. (2010). National Climate Change Adaptation Plan. Office of the President. 168 Department of Budget and Management. (2016). Climate Change Expenditures by National Climate Change Action
Plan Strategic Priorities, FY 2015-2017. Retrieved from http://www.dbm.gov.ph/wp-content/uploads/BESF2017/B10.pdf169 Department of Budget and Management. (2016). Climate Change Expenditures by Department and Special Purpose
Fund. Retrieved from http://www.dbm.gov.ph/wp-content/uploads/BESF2017/B9.pdf170 National Economic Development Authority. (2016). ODA Pipeline of Projects as of 30 September 2016. Retrieved
from http://www.neda.gov.ph/wp-content/uploads/2016/10/Q3-2016-ODA-Pipeline-with-Status_cleared.pdf171 Public-Private Partnership Center. (2016). Status of PPP Projects as of 16 November 2016). Retrieved from http://ppp.
gov.ph/wp-content/uploads/2016/11/MISD_20161117_TABLE_status-of-ppp-projects-as-of-nov16.pdf172 Department of Environment and Natural Resources. (2016) Climate Change Programs. Climate Change Office.
Retrieved from http://climatechange.denr.gov.ph/index.php?option=com_content&view=article&id=69&Itemid=41
• Sustainable energy
• Knowledge and Capacity Development
Per the recently approved national budget for 2017, a total of PhP 210,405,967 million was allotted for the implementation of the National Climate Change Adaptation Plan with PhP 191,676,662 million and PhP 18,729,305 million for adaptation and mitigation, respectively168. The budget for 2017 is 16.8% higher than that of 2016 and 40% higher than that of 2015. Of the seven priority areas above, addressing water sufficiency consistently had the highest budget allocation since 2015. Based on publicly available documents, the Philippine Senate has requested the CCC to furnish a list of projects for budget approval. Meanwhile, based on a by agency breakdown, the Department of Public Works and Highways consistently had total allocation from 2015 to 2017169.
Unfortunately, unlike NEDA which issues a list of ICC-approved infrastructure, a regular ODA portfolio170, and a list of PPP projects171, a similar compilation of past, ongoing, and pipeline projects for climate change adaptation and mitigation is lacking in the Philippines both at the national and sub-national levels. These lists are being noted in this section due to projects on either CCA or DRRM that are included. As such, to arrive at a pipeline for resilient and green solutions in the Philippines, these lists may provide an initial guide, which should be complimented with the individual project lists of each sector agency as well as LGUs. For example, see the project list of the Department of Environment and Natural Resources172. Unfortunately, a number of technical assistance projects provided by international NGOs or coursed through think tanks and academia are lost in the mapping of projects.
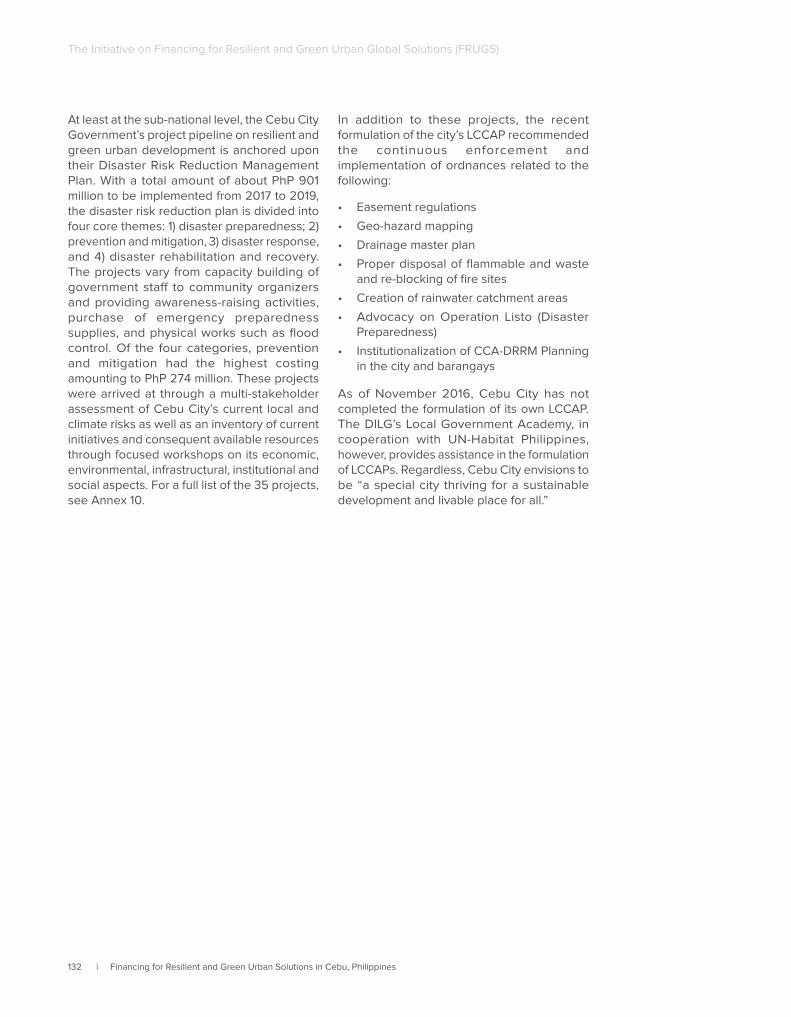
132 | Financing for Resilient and Green Urban Solutions in Cebu, Philippines
The Initiative on Financing for Resilient and Green Urban Global Solutions (FRUGS)
At least at the sub-national level, the Cebu City Government’s project pipeline on resilient and green urban development is anchored upon their Disaster Risk Reduction Management Plan. With a total amount of about PhP 901 million to be implemented from 2017 to 2019, the disaster risk reduction plan is divided into four core themes: 1) disaster preparedness; 2) prevention and mitigation, 3) disaster response, and 4) disaster rehabilitation and recovery. The projects vary from capacity building of government staff to community organizers and providing awareness-raising activities, purchase of emergency preparedness supplies, and physical works such as flood control. Of the four categories, prevention and mitigation had the highest costing amounting to PhP 274 million. These projects were arrived at through a multi-stakeholder assessment of Cebu City’s current local and climate risks as well as an inventory of current initiatives and consequent available resources through focused workshops on its economic, environmental, infrastructural, institutional and social aspects. For a full list of the 35 projects, see Annex 10.
In addition to these projects, the recent formulation of the city’s LCCAP recommended the continuous enforcement and implementation of ordnances related to the following:
• Easement regulations
• Geo-hazard mapping
• Drainage master plan
• Proper disposal of flammable and waste and re-blocking of fire sites
• Creation of rainwater catchment areas
• Advocacy on Operation Listo (Disaster Preparedness)
• Institutionalization of CCA-DRRM Planning in the city and barangays
As of November 2016, Cebu City has not completed the formulation of its own LCCAP. The DILG’s Local Government Academy, in cooperation with UN-Habitat Philippines, however, provides assistance in the formulation of LCCAPs. Regardless, Cebu City envisions to be “a special city thriving for a sustainable development and livable place for all.”
Financing for Resilient and Green Urban Solutions in Cebu, Philippines | 133
The Initiative on Financing for Resilient and Green Urban Global Solutions (FRUGS)
Chapter 8
Concluding Remarks and Recommendations
134 | Financing for Resilient and Green Urban Solutions in Cebu, Philippines
The Initiative on Financing for Resilient and Green Urban Global Solutions (FRUGS)
The KfW and UN-Habitat study on Financing for Resilient and Green Urban Solutions (FRUGS) includes Cebu City in the Philippines. This report examined the status of housing and urban infrastructure and how much investment is needed. The assessment particularly considered the status of housing finance instruments and costs, as well as the roles of local and national governments in facilitating investments. The report was also anchored on determining whether the identified investment needs address resilient housing and infrastructure and assessed challenges to financing such green urban solutions in Cebu City and in the Philippines in general.
The assessment revealed the following: First, Cebu City has a projected housing need of additional 46,900 units across all income brackets from 2016 to 2024. Unfortunately, the city government has not had a chance to completely update the Draft Shelter Framework Plan (2008-2020) into the revised Local Shelter Plan, which considers climate change adaptation and disaster risk reduction in addressing housing needs. Meanwhile, nationwide, an additional 3 million housing units (economic, low, and middle income segments) will be needed amounting to at least PhP 3.4 trillion pesos.
Second, with a strong and growing Philippine economy, the financial market has enough capital and domestic liquidity for the expansion of the housing industry. As real estate loans increase, non-performing loans decline. However, despite the slow shift of private developers from mainly up-market and middle income housing segments to low-cost and social housing, the latter is still crowded out by government funds. Aside from self-funding, housing units can by acquired through direct housing provision or subsidy to the marginalized through social housing projects and through mortgages with public (HDMF / Pag-Ibid Fund) whether formally and informally employed and private financial institutions undertaken by aspiring homeowners for the higher segments. These loans and savings schemes cater to both property developers who may also get direct support from government through tax holidays and the option to enter the secondary mortgage market through securitization.
Despite these in place, the primary mortgage market is still deemed underdeveloped. The financial instruments available are insufficient for those who needs the loans the most given the prices of housing units available in the market and relative income.
Third, 79% of Filipinos surveyed for Ambisyon 2040, the national asipiration plan that guides the Philippine Development Plan, prefer to have a medium-sized house, which is estimated to require PhP 30,000 monthly. While the social housing loan limit is PhP 450,000, the National Housing Authority accounts PhP 290,000 for the actual unit cost. By adopting government-accredited AITECH standards for green technology in design, costs could be lower by PhP 19,000 to PhP 30,000 per unit than building using conventional housing materials. Although mainstreaming green homes has been a popular idea, it has not been common among property developers and more practiced among self-built homes. Nevertheless, the Pag-Ibig fund has a particular premium price loan facility to borrowers who could show green features in their homes such as use of energy efficient lighting system, eco-sanitation and other green technologies while some cities provide real estate tax discounts. Despite these positive developments, there are still inefficiencies in the urban land market, particularly land registration and conflicting building requirements, as well as inconsistent housing and land policies, resulting in information asymmetry and higher unit cost of land and housing price.
Fourth, the current national government estimates that PhP 6-9 trillion will be needed until 2022 to bridge the Philippine infrastructure gap through the Build, Build, Build progam. Listed projects so far complement the mantra of building more bridges and roads, railways, urban mass transport, airports, and seaports, as well as new and better cities. Earlier estimates of urban infrastructure needed nationwide until 2034 is valued at USD 95 billion, of which USD 36 billion would be to address existing gaps and additional USD 56 billion to address increasing demand. Despite projected increases in demand, 40% of eneryg supply already comes from renewable energy. The forthcoming Philipine Enegy Plan through
Financing for Resilient and Green Urban Solutions in Cebu, Philippines | 135
The Initiative on Financing for Resilient and Green Urban Global Solutions (FRUGS)
2030 will continue to promote low-carbon development and climate-proofing the energy sector. Meanwhile estimated infrastructure needs in Metro Cebu, which Cebu City account for PhP 2.7 billion) on waste from 2015 to 2030, PhP 34 billion for water from 2015 to 2040, and PhP 57.9 billion for road and transport from 2021 to 2030. Some of the pipeline projects are being prioritized under the current administration.
Fifth, as a corporate entity, local governments in the Philippines are authorized to engage in public private partnership deals, issue municipal bonds, take loans and other transactions while abiding by specific safeguards to augment local income and national transfers to finance urban infrastructure. While national plans are mostly available and local versions either due for updating, spatial and policy sectoral plans exist. Both the local and national governemnts likewise provide direct and indirect housing subsidies to developers and homewners to facilitate access to housing.
Sixth, green and resilient development is underway in the Philippines. Even prior to ratifying the Paris Agreement on Climate Change, national level green and resilient develoment plans for climate change adaption and mitigation have existed. While formulation and implementation at the local levels needs further support. Aside from the National Framework Strategy on Climate Change 2010-2022, various legislation related to climate change and disaster risk reduction exist, including the recent green building code and resilient building standards that need to be mainstreamed. Aside appropriated budget streams and ODA, the national government has also presecribed PhP 1 billion for the People Survival Fund to finance climate action at the local government level.
Fifth, despite a strong economy and existence of pertinent plans and laws both on business-as-usual development and green urban development, these remain inconsistent, making enforcement and implementation difficult at the national and local levels. While national and local laws allow various modalities for financing resilient and green urban development, these are often not
utilized or maximized. Information asymmetry and low capacity remain challenges in knowing and understanding government’s authority to access green finance. Most local governments have poor understanding of the linkage between financiers and proponents as well as a low if not lacking capacity in government to demonstrate climate-resilient dimensions in urban investment projects. There is a need to improve the technical know-how on designing green public investments. This could be mitigated by strengthening the link, information-sharing and common understanding among policymakers, scientists/ practitioners and politicians on the need for unified approach to resilient housing and urban development as well as for low-carbon growth. The private sector is taking the lead both in finance and innovation, the same way real estate developers did in housing.
Sixth, certain efforts at the local level could be done to ease these challenges. An example would be improving financial management and capacity building towards understanding climate finance, maximizing local revenue collection, forecasting and credit worthiness assessment to access capital and debt markets. Cities can pursue blended financing with both development banks and private entities.
City governments could also ensure that climate adaption plans are formulated and in-sync with land use plans, particularly strengthening cooperation with the scientific community. As regards housing governance, vertical and horizontal integration of policies and improved land use management would positively affect the land market. For example, streamlining processes and responsibilities between numerous state housing agencies through one land registration portal, compendium of guidelines and standards and undertaking a regulatory audit of the housing industry. Closer coordination among the city government, housing agencies and developers can better ensure that urban expansion, housing construction and provision of services and infrastructure are in line.
To mitigate the lack of affordable homes and inadequate financial instruments, the government may also organize and expand
136 | Financing for Resilient and Green Urban Solutions in Cebu, Philippines
The Initiative on Financing for Resilient and Green Urban Global Solutions (FRUGS)
the rental market. Support for the formulation of tenure rules (e.g. subletting) and guidelines worker accommodation units would benefit the low and middle-income segments.
Lastly, to further mainstream green and resilient urban development, it would help to harmonize green building standards, climate resilient policies, and promote their mandatory use in practice. These must be complemented
by improved spatial planning and supporting regular demographic data collection at the city level for the use of planners, economists, scientists and statisticians in and out of government. Efforts must also be made to ensure financiers, scientists, policymakers, practitioners, private sector, and politicians are on the same page regarding the importance of resilient development.
Financing for Resilient and Green Urban Solutions in Cebu, Philippines | 137
The Initiative on Financing for Resilient and Green Urban Global Solutions (FRUGS)
References
___. (2015). Century moves into low-cost housing. Retrieved from http://www.century-properties.com/century-moves-into-low-cost-housing/.
___. (2016). SMDC to venture into affordable housing. Retrieved from: www.rappler.com/business/156426-sm- evelopment-venture-affordable-housing
____. (2016). Costly Garbage Disposal. Retrieved from cebudailynews.inquirer.net/95241/costly-garbage-disposal
Aurellado, E. (Undated). The Greening of the Project Management Cycle in the Construction Industry.” Occasional Paper Series No. 10, Ateneo Graduate School of Business.
ABS-CBN News. (2014). Robinsons Land Launches Lease-to-Own Program. Retrieved
from: http://news.abs-cbn.com/business/03/04/14/robinsons-land-launches-lease-own-program
Angel S, etc Al; UN-Habitat (2016). In Mega Cebu: Smart-City Region, Expanding Visions:
Building Towards a Sustainable Future, presented at the SHDA Central Visayas Housing Summit, 25 October 2016
Alkuino, X. (2016). Naga is the only LGU in CV with approved waste plan. Retrieved from
http://www.cebu.gov.ph/news/naga-lgu-cv-approved-waste-plan/
Asian Development Bank. (2009). ADB Technical Assistance Consultant’s Report,
Philippines: Preparing the Philippine Basic Urban Services as cite in Habitat III: The Philippine National Report.
Asian Development Bank. (2009). Philippines Basic Urban Services Sector Project. Final Report. Manila.
Asian Development Bank. (2014). National Urban Assessment of the Philippines. Manila
Asian Development Bank. (2016). Philippines: Public-Private Partnerships by Local Government Units. Manila.
Ballesteros, M. (2000). Land Use Planning in Metro Manila and the Urban Fringe:
Implications on the Land and Real Estate Market. Philippine Institute of Development Studies. Discussion paper series no. 2000-20
Ballesteros, M. (2001). The Dynamics of Housing Demand in the Philippines: Income and Lifecycle Effects. Discussion paper series no. 2001-15.
Ballesteros, M. (2002). The Dynamics of Housing Demand in the Philippines: Income and
Lifecycle Effects. Philippine Institute for Development Studies. Research Paper Series 2002-01.
Ballesteros, M. (2004). Rental Housing for Urban Low-Income Households in the Philippines. Discussion paper series no. 2004-47. Philippine Institute for Development Studies
Ballesteros, M. (2011). Fiscal costs of subsidies for socialized housing programs: an Update. Philippine Institute for Development Studies Policy Notes. No. 2011-14
Ballesteros, M. and Dulay, D. (2013). Feasibility of Mortgage-Backed Securitization for the
Underserved Housing Market in the Philippines. Philippine Institute for Development Studies. Discussion paper series no. 2013-43.
Ballesteros, M. (2016). Rent Control in the Philippines: An Update. Discussion paper series no. 2016-40. Philippine Institute for Development Studies.
Bangko Sentral ng Pilipinas. (2016). Status Report, June 2016, Office of Supervisory Policy
138 | Financing for Resilient and Green Urban Solutions in Cebu, Philippines
The Initiative on Financing for Resilient and Green Urban Global Solutions (FRUGS)
Development. Manila.
Bangko Sentral ng Pilipinas. (2017). Regional Distribution of Loan Portfolio. Retrieved from http://www.bsp.gov.ph/banking/pbs_new/2.1.htm
Bangko Sentral ng Pilipinas. (2017). “Universal and Commercial Banks’ Loans Outstanding to the Real Estate Sector by Purpose.” Retrieved from http://www.bsp.gov.ph/statistics/spei_new/tab26_rel.htm
Balang, Jr. Antonio. (2009). Mainstreaming Disaster Risk Reduction in Barangays Apas, Bulacao and Kalunasan in Cebu City in Building Disaster Resilient Communities: Stories and Lessons from the Philippines.
BMZ. (2016). Philippines. Retrieved from http://www.auswaertiges-amt.de/EN/Aussenpolitik/Laender/Laenderinfos/01-Nodes/Philippinen_node.html
Boex, J., Edwards, B. et al (2014). Urban Service Delivery Assessment Framework. The Urban Institute: Washington, D.C.
Brillantes Jr., A, Llanto, G. and Alonzo, R., (2010). Access to Official Development
Assistance (ODA): Status, Issues, and Concerns. Discussion paper series no. 2010-10.
Brutas, K. (2016). Top development aid donors to the Philippines. Retrieved from https://www.devex.com/news/top-development-aid-donors-to-the-philippines-2015-89091
Bureau of Local Government Finance. (2016). Locally Sourced Revenue Dependency, FY 2011-2015.
Bureau of Local Government Finance. (2016). Other Shares from National Tax Dependency, FY 2011-2015
Bureau of Local Government Finance. (2016). LGU Taxation and Revenue Practices.
Bureau of Local Government Finance. (2016). “Statement of Receipts and Expenditures CY 2015.” Retrieved from http://blgf.gov.ph/lgu-fiscal-data/
Business World. (2017). “2 firms present proposals for waste-to-energy facility in Cebu’s Inayawan landfill.” Retrieved from http://www.bworldonline.com/content.php?section=Nation&title=2-firms-present-proposals-for-waste-to-energy-facility-in-cebu&8217s-inayawan-landfill&id=142138
Bustos, F. (2016). Securitization: Developing MBS in the Philippines. Presented at the Philippine Housing Finance Conference, 6 October 2016.
Capongcol, M. (2016). Investment Opportunities. Presented at the 2016 Visayas Energy Investment Forum, 22 June 2016.
Cebu City Government. (2016). Unpublished workshop outputs for the formulation of the Local Climate Change Adaptation Plan.
Cebu City Government. (2016). Cebu City Weather Profile.
Cebu City Government. Cebu City Philippines Profile. (2008). Retrieved from http://nap.psa.gov.ph/activestats/psgc/articles/con_cityclass.asp
Cebu City Government. (Undated). Cebu city strategic master plan study: Draft Final Report
Constantino, R. and Monsod, T. (X). Climate Change Geography and Human Development. ICSC.
Climate-Data.Org. (2016). Cebu City Climate Data. Retrieved from http://en.climate- data.org/region/1878/#example0
Climate Change Commission. (2010). National Climate Change Adaptation Plan. Office of The President.
Financing for Resilient and Green Urban Solutions in Cebu, Philippines | 139
The Initiative on Financing for Resilient and Green Urban Global Solutions (FRUGS)
Climate and Clean Air Coalition Municipal Solid Waste Initiative. (2013). Cebu City Solid Waste Management City Profile
Cebu City Government. (2016). Cebu City Weather Profile. Retrieved from https://www.cebucity.gov.ph/index.php/home-new/about-cebu-city?showall=&start=1
Carino, B. and Corpuz, A. (2009). Toward a Strategic Urban Development and Housing
Policy for the Philippines. Philippine Institute for Development Studies. Discussion paper series no. 2009-21.
CIF. (Undated). Cebu Bus Rapid Transit Project. Retrieved from https://www- cif.climateinvestmentfunds.org/projects/cebu-bus-rapid-transit-project
Colliers International. (2017). Philippines Residential Update, May 2017. Retrieved from
http://www.colliers.com/-/media/files/marketing%20reports/1q2017-residential_market_report.pdf
Colliers International. (2017). “Colliers Quarterly Philippines Residential.1Q 2017.”
Cuizon, R. (2016). Treasurer’s office ‘surpasses’ target collection. Retrieved from
http://www.sunstar.com.ph/cebu/local-news/2016/10/26/treasurers-office-surpasses-target-collection-505746
Cuizon, R. (2016). Cebu City Mayor Says Presidential Assistant Might Push to Shelve BRT
Project. Retrieved from http://www.sunstar.com.ph/cebu/local-news/2016/10/11/cebu-city-mayor-says-presidential-assistant-might-push-shelve-brt-project
Department of Budget and Management. (2016). Climate Change Expenditures by National
Climate Change Action Plan Strategic Priorities, FY 2015-2017. Retrieved from http://www.dbm.gov.ph/wp-content/uploads/BESF2017/B10.pdf
Department of Budget and Management. (2016). Climate Change Expenditures by
Department and Special Purpose Fund. Retrieved from http://www.dbm.gov.ph/wp-content/uploads/BESF2017/B9.pdf
Department of Tourism. (2016). Industry Performance for Travel and Tourism. Retrieved from http://www.tourism.gov.ph/pages/industryperformance.aspx
Dela Paz, C. (2016). Metro Manila food control, bus rapid transits eyed for AIIB financing.
Retrieved from http://www.rappler.com/business/155261-philippines-aiib-financing-infra- rojects
Dalipe, G. and Cuizon, R. (2015). Cebu City to Close Inayawan Landfill Again. Retrieved
From http://www.sunstar.com.ph/cebu/local-news/2016/10/25/cebu-city-close-inayawan- and fill-again-505559.
Delmendo, L. (2016). “Philippines: nationwide house prices rising strongly, but Metro
Manila’s CBD is slowing” Retrieved from https://www.globalpropertyguide.com/Asia/Philippines/PriceHistory
Department of Environment and Natural Resources. (2016) Climate Change Programs.
Climate Change Office. Retrieved from http://climatechange.denr.gov.ph/index.php?option=com_content&view=article&id=69&Itemid=41
Department of Energy. (2016). Philippine Energy Plan Update.
Department of Finance. (2016). Duterte Admin awaits financing cooperation with AIIB on big ticket projects. Retrieved from http://www.dof.gov.ph/index.php/duterteadminawaitsfinancingcooperationwithaiibonbigticketprojects/
140 | Financing for Resilient and Green Urban Solutions in Cebu, Philippines
The Initiative on Financing for Resilient and Green Urban Global Solutions (FRUGS)
Department of Works and Highways. (2016). Strategic Infrastructure Programs and Policies, presented at SHDA National Housing Summit on 25 October 2016
Felicitas, P. (2016). Joy bares Cebu City’s true financial state. Retrieved from http://www.sunstar.com.ph/cebu/local-news/2016/08/02/joy-bares-cebu-citys-true-financial-state-489034
GIZ. (2016). GIZ in the Philippines. Retrieved from https://www.giz.de/en/worldwide/376.html
German Embassy Manila. Economic Cooperation: The Philippines an Important Partner.
Retrieved from http://www.manila.diplo.de/Vertretung/manila/en/07/0--Economic_20cooperation.html
Harnisch, J. et al. (2015). Materials on Development Financing No. 5: Linking Climate Targets and Investment Portfolio. KfW Development Bank.
HLURB. (2016). Status of Provinces, Cities and Municipalities with and without Approved CLUPs. Retrieved from http://hlurb.gov.ph/local-government-units/.
HLURB. (2016). “Harnessing suitability mapping for preparedness and resiliency.” Retrieved
From http://hlurb.gov.ph/harnessing-suitability-mapping-for-preparedness-and-resiliency/
HUDCC. (2016). Philippine National Report to Habitat III: A New Urban Agenda: Better, Greener, Smarter Cities in a More Inclusive Philippines.
HUDCC. (2016). Shelter Programs and Way Forward. Presented at SHDA Central Visayas Housing Summit, 25 October 2016.
Ignacio, A. (2015). Reaching Low-Income Households with Affordable Mortgage Finance. Kasagana-Ka Development Center, Inc. and Microfinance Council of the Philippines.
IKI. (2016). International Climate Initiative Projects. Retrieved from https://www.international- climate-initiative.com/en/nc/projects/projects/International Partnership on Mitigation and MRV. (2016). Measuring, Reporting, and
Verification (MRV). Retrieved from https://mitigationpartnership.net/measuring-reporting-and-verification-mrv-0
JICA and Metro Cebu. (2015). The Roadmap Study for Sustainable Urban Development in Metro Cebu.
JLL. (2017). “Philippine Property Digest: Property Sector Finishes on a Strong Note.”
JLL. (2017). “Philippine Property Market Monitor, May 2017.”
KfW. (2016). Philippines: Good growth rates but great disparity in incomes. Retrieved from https://www.kfw-entwicklungsbank.de/International-financing/KfW-Development-Bank/Local-presence/Asia/Philippines/
KfW. (2016). Green Climate Fund: KfW Accredited as an Implementing Institution. Retrieved
From https://www.kfw-entwicklungsbank.de/International-financing/KfW-Development-Bank/News/News-Details_272320.html
KPMG. (2015). Infrastructure In-depth: Philippines 2015 Investment Guide in the Philippines By KPMG.
Komatsuzaki, T. (2016). Improving Public Infrastructure in the Philippines. IMF Working Paper.
Landingin, R. (2008). 7 in 10 ODA projects fail to deliver touted benefits. Retrieved from http://pcij.org/stories/7-in-10-oda-projects-fail-to-deliver-touted-benefits/
Llanto, G. and Navarro, A. (2014). Financing Infrastructure in the Philippines: Fiscal
Landscape and Resource Mobilization. Philippine Institute for Development Studies. Discussion Paper Series No. 2014-01.
Llanto, G (1998). A Study of Housing Subsidies in the Philippines; Discussion paper series No. 98-42.
Financing for Resilient and Green Urban Solutions in Cebu, Philippines | 141
The Initiative on Financing for Resilient and Green Urban Global Solutions (FRUGS)
Llanto, G. (1999). Housing Policy, Strategy and Recent Developments in Market-based
Housing Finance. Philippine Institute for Development Studies. Discussion paper series no. 99-20
Llanto, G. (2015). Development Finance and Aid in the Philippines: Policy, Institutional
Arrangements and Flows. Philippine Institute for Development Studies. Discussion paper series no. 2015-10.
Liu, L., Llanto, G. and Petersen, J. (2013). “The Philippines: Recent Developments in the
Subnational Government Debt Markets.” In “Until Debt Do Us Part.?” World Bank: Washington, D.C. USA.
Local Government Academy. (2016). List of LGUs Provided with LCCAP Training. As of July 2016.
LGUGC. (2016). About LGUGC. Retrieved from http://www.lgugc.com/about.html
Lorenciana, C. (2016). IT-BPO industry to worth $250 billion by 2022. Retrieved from
http://www.philstar.com:8080/cebu-business/2016/09/27/1627783/it-bpo-industry-worth-250-billion-2022-dti
Lucero, V. (2016). Cebu capable of bigger contribution to economy. Retrieved
fromhttp://cebudailynews.inquirer.net/89251/89251
LWUA. (2016). “What is LWUA?” Retrieved from
http://www.lwua.gov.ph/about_lwua_14/what%20is%20lwua.html.
Manasan, G. (2004). Local Public Finance in the Philippines: In Search of Autonomy with
Accountability. Discussion paper series no. 2004-42
Manasan, R. and Villanueva, E. (2006). Gems in LGU Fiscal Management: A Compilation of
Good Practice. Discussion paper series no. 2006-16.
Manasan, R. et al. (1998). Local Efforts in Housing Provision. Discussion paper series no.
98-44. Philippine Institute for Development Studies.
Montealegre, K. (2016). Demand for affordable housing remains unmet: Colliers Ph.
Retrieved from: http://www.bworldonline.com/content.php?section=Corporate&title=demand-for-affordable-housing-remains-unmet-colliers-phl&id=122940
Moti, A. (2016). Pag-Ibig Fund Presentation. Presented at the 2016 Visayas Developers’
Forum on 8 November 2016.
McCullough, M. (2016). “The Supply Gap: Key Expansion Areas (Philippines). Presented at
The SHDA Central Visayas Housing Summit 25 October 2016.
Monsod, T. (2012). Rethinking Urban Housing Policy in the Philippines. Global Development
Network
Monsod, T. (2011). Is Government Really Solving the Housing Problem? UP School of
Economics.
National Economic Development Authority. (2015). CY 2014 ODA Portfolio Review:
Regional
Distribution of the GPH ODA (Loans and Grants) Portfolio.
National Economic Development Authority. (2017). NEDA Board Approved Projects as of 28
142 | Financing for Resilient and Green Urban Solutions in Cebu, Philippines
The Initiative on Financing for Resilient and Green Urban Global Solutions (FRUGS)
February 2017. Retrieved from: http://www.neda.gov.ph/wp-content/uploads/2017/03/ICC-NB-Approved-Projects-as-of-Feb-2017-Aquino-Admin.pdf
National Economic Development Authority. (2016). NEDA Board Committee on Land Use to
Review National Spatial Strategy, Retrieved from http://www.neda.gov.ph/2016/12/12/neda-board-committee-on-land-use-to-review-national-spatial-strategy/
National Economic Development Authority. (2016). NEDA Board approvals from June 2010
to 22 September 2016. Retrieved from http://www.neda.gov.ph/wp-content/uploads/2016/10/NEDA-Board-Approved-Projects-as-of-Sept-2016.pdf
National Economic Development Authority. (2016). ODA Pipeline of Projects as of 30
September 2016. Retrieved from http://www.neda.gov.ph/wp-content/uploads/2016/10/Q3-2016-ODA-Pipeline-with-Status_cleared.pdf
National Economic Development Authority. (2016). NEDA Board Approved Projects as of 22
September 2016. Retrieved from: http://www.neda.gov.ph/wp-content/uploads/2016/10/NEDA-Board-Approved-Projects-as-of-Sept-2016.pdf
National Economic Development Authority. (2016). NEDA Board approves nine projects in
first meeting. Retrieved from http://www.neda.gov.ph/2016/09/15/neda-board-
approves-nine-projects-in-first-meeting-changes-in-the-investment-coordination-
committee-icc-review-policies-also-green-lighted/
National Economic Development Authority. (2016). NEDA board approves eight projects on
agriculture, rural development, and transportation. Retrievable at http://www.neda.gov.ph/2016/11/18/neda-board-approves-eight-projects-on-agri-rural-development-transportation/
National Economic Development Authority. (2016). ICC Cab-Com endorses regional projects
to NEDA Board. Retrieved from
http://www.neda.gov.ph/2016/10/03/icc-cabcom-endorses-regional-projects-to-neda-board/
NCTS. (Undated.) Metro Cebu: Integrating Land Use and Transport Development. University
of the Philippines: Manila.
NHA. (2016). Building design, innovation and technology in housing.
National Competitiveness Council. (2016). Annual Cities and Municipalities Competitiveness
Index. Retrieved from http://www.competitive.org.ph/cmcindex/pages/rankings/HighlyUrbanizedCities.php
NSA/PSA Population, Land Area, Population Density, and Percent Change in Population
Density of the Philippines by Region, Province/Highly Urbanized City, and City/Municipality: 2015
Nuzir. F.et al (Undated). Planning Resilient City in Cebu: Lessons Learned and Practical
Application. IGES.
OECD. (2016). The Development Cooperation Report: The Sustainable Development Goals
as Business Opportunities
Ordinario, C. (2016). DBM cuts housing budget for 2017. Retrieved from
http://www.businessmirror.com.ph/dbm-cuts-housing-budget-for-2017/
Ordinario, C. (2016). NEDA bats for new infrastructure program for Duterte administration.
Financing for Resilient and Green Urban Solutions in Cebu, Philippines | 143
The Initiative on Financing for Resilient and Green Urban Global Solutions (FRUGS)
Retrieved from http://www.businessmirror.com.ph/neda-bats-for-new-infrastructure-program-for-duterte-adminitration/
Ordinario, C. (2016). Comprehensive housing road map to be completed by Q1 2017–
HUDCC. http://www.businessmirror.com.ph/comprehensive-housing-road-map-to-be-
completed-by-q1-2017-hudcc/
Palana, A. (2015). Improve housing finance access for poor – study. Retrieved from http://www.manilatimes.net/improve-housing-finance-access-for-poor-study/187279/
Padojinog, W. (2012). Housing Roadmap 2012-2030. SHDA
PDRF. (2016). Who we are. Retrieved from http://pdrf.org/who-we-are
Republic of the Philippines. (2013). RA 10587 or the Environmental Planning Act of 2013.
PPP Center. (2016). Status of PPP Projects as of 16 November 2016. Retrieved from
http://ppp.gov.ph/wp-content/uploads/2016/11/MISD_20161117_TABLE_status-of-ppp-projects-as-of-nov1uti
Philippine Deposit and Insurance Corporation. (2016). Philippine Banking System:
Distribution of Domestic Deposits. Retrieved from http://www.pdic.gov.ph/files/BSDStats/DDD_PBS_ProvinceMunicipality.htm
Philippine Economic Zone Authority. (2016). “Operating Economic Zone Map as of 31
October 2016” Retrieved from http://www.peza.gov.ph/index.php/economic-zones/list-of-economic-zones
Philippine Statistics Authority. (2016). “The Philippines in Figures: 2015” Retrieved from
https://www.psa.gov.ph/sites/default/files/2015%20PIF%20Final_%20as%20of%20022916.pdf
Philippine Statistics Authority. (2016). Population of Region VII - Central Visayas.
Philippine Statistics Authority. (2016). “Population Counts by Legislative District” Retrieved
from https://psa.gov.ph/content/population-counts-legislative-district-based-2015-census-population 2015
Philippine Statistics Authority. (2016). Retrieved fromhttps://psa.gov.ph/content/population-
cebu-city-increased-almost-150-thousand-results-2010-census-population-and
Philippine Statistics Authority. (2016). Provincial Summary Number of Provinces, Cities,
Municipalities and Barangays by Region. Retrieved from http://nap.psa.gov.ph/activestats/psgc/SUMWEBPROV-SEPT2016-CODED-HUC-FINAL.pdf
Philippine Statistical Authority. (2016). Philippine Statistical Yearbook, 2015.
Philippine Statistical Authority. (2017). “Philippine Statistical Yearbook 2016.”
PriceWaterHouse Coopers. (2015). Building Better Cities. Retrieved from
https://www.pwc.com/us/en/apec-ceo-summit/2015/apec-building-better-cities.pdf
Public-Private Partnership Center. (2016). Status of PPP Projects as of 16 November 2016).
Retrieved from http://ppp.gov.ph/wp-content/uploads/2016/11/MISD_20161117_TABLE_status-of-ppp-projects-as-of-nov16.pdf
Ranada, P. (2015). Green buildings can save businesses, consumers P35.2 billion.
Retrieved from http://www.rappler.com/science-nature/environment/56194-green-building-code-dpwh
Ren, S. (2016). Philippine Housing: Not Affordable; Worst Yet To Come, Warns Credit
144 | Financing for Resilient and Green Urban Solutions in Cebu, Philippines
The Initiative on Financing for Resilient and Green Urban Global Solutions (FRUGS)
Suisse. Retrieved from http://blogs.barrons.com/asiastocks/2016/09/13/philippinehousingnotaffordableworstyettocomewarnscreditsuisse/
Republic of the Philippines. (2015). Intended Nationally Determined Contributions. Submitted
to the UNFCCC on October 2015.
SHDA. (2016). Impact of Housing Industry in Philippine Economy. Presented at the
Philippine Housing Finance Conference, 6 October 2016
Schnabel, C. (2016). Sunlife, 8990 Holdings tie up to boost financial literacy. Retrieved from
http://www.rappler.com/business/industries/banking-and-financial-services/134990-sun-life-8990-holdings-partnership
Social Housing Finance Corporation. (2017). “The Community Mortgage Program: Fast
Facts.” Retrieved from http://www.shfcph.com/CMP_Fast_Facts.html
Tan, L. (2016). Waze: Cebu is worst in the world for drivers. Retrieved from
http://cnnphilippines.com/news/2016/09/15/Cebu-Metro-Manila-Philippines-traffic-Waze.html
Tholons. (2015). 2015 Top 100 Outsourcing Destinations
Tolentino, A. (2016). Shelter Programs and Way Forward. HUDCC, Manila. Presented at
NHFMC Housing Finance Conference, 6 October 2016.
UN ECOSOC. (2014). World Urbanization Prospects: The 2014 Revision. New York
UN-Habitat. (Undated). Governance. Retrieved from unhabitat.org/urban-themes/governance
UN-Habitat. (2009). Guide to Municipal Finance. Nairobi.
UNISDR. (2016). The Human Cost of Weather Related Disaster Report 1995-2015.
World Bank. (2013). Energizing Green Cities in Southeast Asia.
World Bank. (2016). Closing the Affordable Housing Gap: Policy paper for the national summit on housing and urban development.
World Bank. (2016). Philippine Economic Update, revised
World Bank. (2016). Philippine Economic Update, revised October 2016.
WWF& BPI Foundation. (2014). Business Risk Assessment and the Management of Climate
Change Impacts.
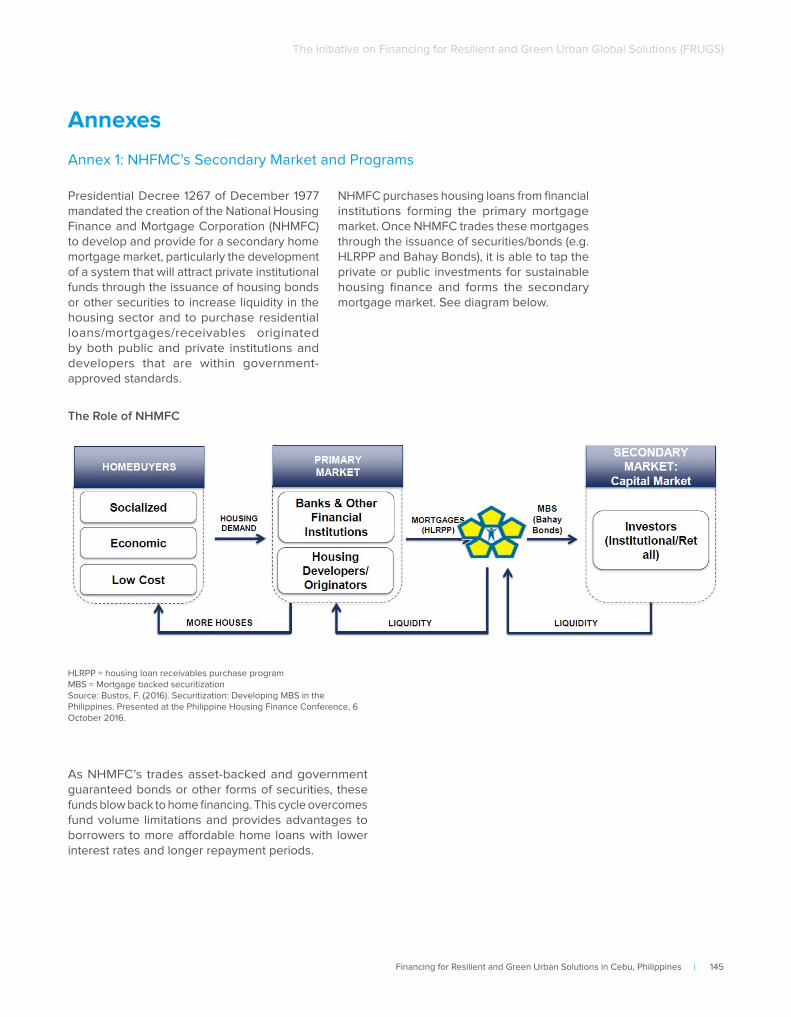
Financing for Resilient and Green Urban Solutions in Cebu, Philippines | 145
The Initiative on Financing for Resilient and Green Urban Global Solutions (FRUGS)
Presidential Decree 1267 of December 1977 mandated the creation of the National Housing Finance and Mortgage Corporation (NHMFC) to develop and provide for a secondary home mortgage market, particularly the development of a system that will attract private institutional funds through the issuance of housing bonds or other securities to increase liquidity in the housing sector and to purchase residential loans/mortgages/receivables originated by both public and private institutions and developers that are within government-approved standards.
NHMFC purchases housing loans from financial institutions forming the primary mortgage market. Once NHMFC trades these mortgages through the issuance of securities/bonds (e.g. HLRPP and Bahay Bonds), it is able to tap the private or public investments for sustainable housing finance and forms the secondary mortgage market. See diagram below.
Annexes
Annex 1: NHFMC’s Secondary Market and Programs
HLRPP = housing loan receivables purchase programMBS = Mortgage backed securitization Source: Bustos, F. (2016). Securitization: Developing MBS in the Philippines. Presented at the Philippine Housing Finance Conference, 6 October 2016.
As NHMFC’s trades asset-backed and government guaranteed bonds or other forms of securities, these funds blow back to home financing. This cycle overcomes fund volume limitations and provides advantages to borrowers to more affordable home loans with lower interest rates and longer repayment periods.
The Role of NHMFC
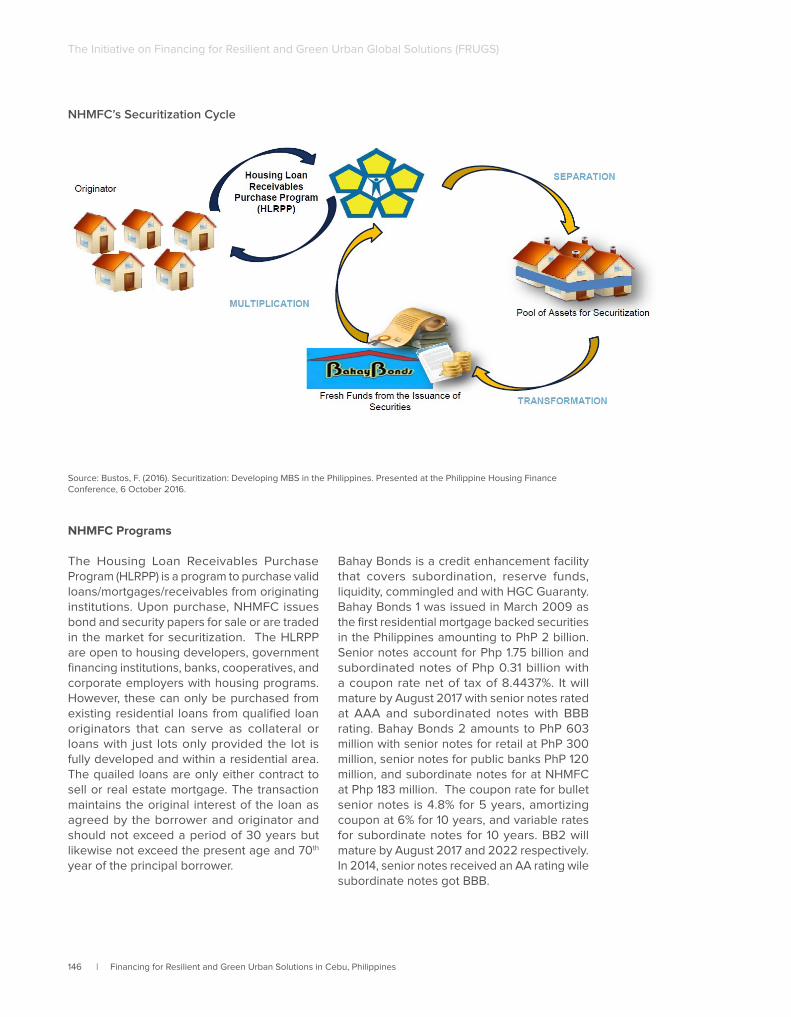
146 | Financing for Resilient and Green Urban Solutions in Cebu, Philippines
The Initiative on Financing for Resilient and Green Urban Global Solutions (FRUGS)
NHMFC’s Securitization Cycle
Source: Bustos, F. (2016). Securitization: Developing MBS in the Philippines. Presented at the Philippine Housing Finance Conference, 6 October 2016.
NHMFC Programs
The Housing Loan Receivables Purchase Program (HLRPP) is a program to purchase valid loans/mortgages/receivables from originating institutions. Upon purchase, NHMFC issues bond and security papers for sale or are traded in the market for securitization. The HLRPP are open to housing developers, government financing institutions, banks, cooperatives, and corporate employers with housing programs. However, these can only be purchased from existing residential loans from qualified loan originators that can serve as collateral or loans with just lots only provided the lot is fully developed and within a residential area. The quailed loans are only either contract to sell or real estate mortgage. The transaction maintains the original interest of the loan as agreed by the borrower and originator and should not exceed a period of 30 years but likewise not exceed the present age and 70th year of the principal borrower.
Bahay Bonds is a credit enhancement facility that covers subordination, reserve funds, liquidity, commingled and with HGC Guaranty. Bahay Bonds 1 was issued in March 2009 as the first residential mortgage backed securities in the Philippines amounting to PhP 2 billion. Senior notes account for Php 1.75 billion and subordinated notes of Php 0.31 billion with a coupon rate net of tax of 8.4437%. It will mature by August 2017 with senior notes rated at AAA and subordinated notes with BBB rating. Bahay Bonds 2 amounts to PhP 603 million with senior notes for retail at PhP 300 million, senior notes for public banks PhP 120 million, and subordinate notes for at NHMFC at Php 183 million. The coupon rate for bullet senior notes is 4.8% for 5 years, amortizing coupon at 6% for 10 years, and variable rates for subordinate notes for 10 years. BB2 will mature by August 2017 and 2022 respectively. In 2014, senior notes received an AA rating wile subordinate notes got BBB.
Financing for Resilient and Green Urban Solutions in Cebu, Philippines | 147
The Initiative on Financing for Resilient and Green Urban Global Solutions (FRUGS)
Republic Act 10625, otherwise known as “Reorganizing and Strengthening the Philippine Statistical System and for Other Purposes” mandates the Philippine Statistics Authority (PSA) to undertake the national census. In 2003, the National Statistical Coordination Board adopted the following definition of an urban area, as applicable to the lowest administrative unit in the Philippines, the barangay.
1. If a barangay has a population size of 5,000 or more, then a barangay is considered urban, or
2. If a barangay has at least one establishment with a minimum of 100 employees, a barangay is considered urban, or
3. If a barangay has 5 or more establishments with a minimum of 10 employees, and 5 or more facilities within the two-kilometer radius from the barangay hall, then a barangay is considered urban
All the cities in the National Capital Region (Metro Manila) are considered urban while those in other highly urbanized cities are subject to the criteria above. Meanwhile, Philippine cities are classified into three types:
1. Highly Urbanized Cities - Cities with a minimum population of 200,000 inhabitants, as certified by the National Statistics Office, and with the latest annual income of at least P50,000,000.00based on 1991 constant prices, as certified by the city treasurer.
2. Independent Component Cities - Cities whose charters prohibit their voters from voting for provincial elective officials. Independent component cities shall be independent of the province.
3. Component Cities - Cities which do not meet the above requirements shall be considered component cities of the province in which they are geographically located. If a component city is located within the boundaries of two (2) or more provinces, such city shall be considered a component of the province of which it used to be a municipality.
Per the World Urbanization Prospects 2014, urbanization is both a condition at a point in time and a process occurring over time. The condition of urbanization, referred to as the level of urbanization, is indicated by the percentage of a population that is living in urban areas. Meanwhile, the process of urbanization may refer to the increase in the level of urbanization, that is, an increase in the percentage urban – the growth rate change.
Sources: http://www.nscb.gov.ph/pressreleases/2004/30Jan04_urban.asp http://www.nscb.gov.ph/activestats/psgc/articles/con_cityclass.aspWorld Urbanization Prospects 2014
Annex 2: Defining Urbanization and an Urban Area in the Philippines
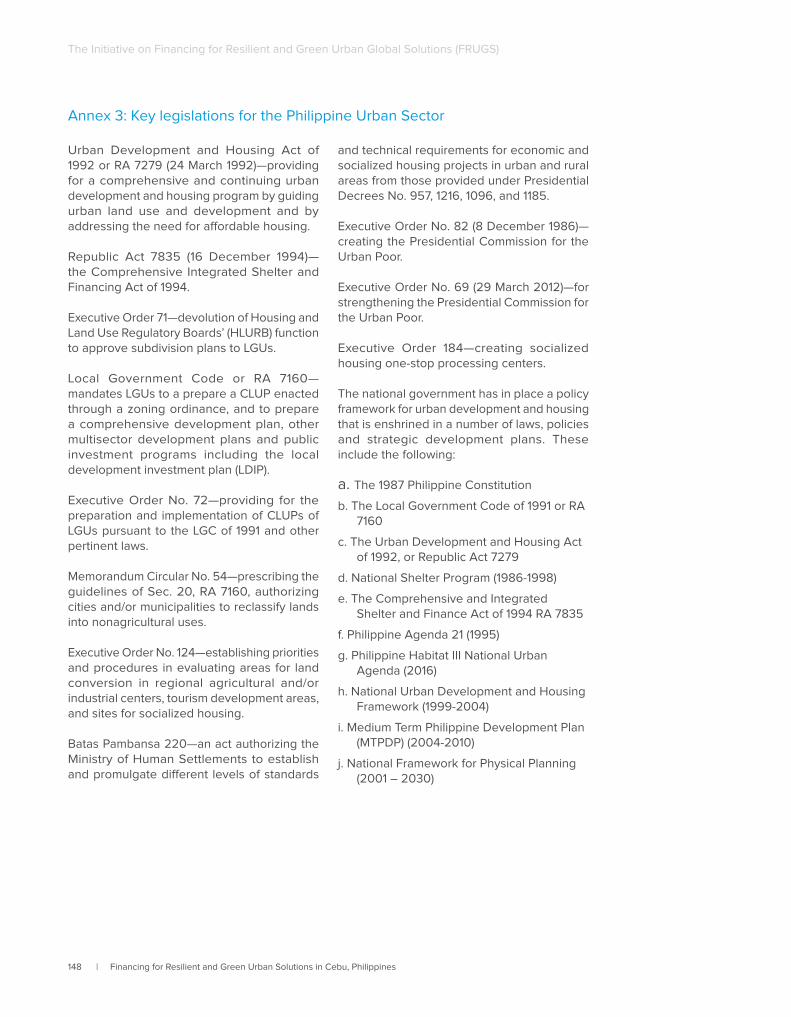
148 | Financing for Resilient and Green Urban Solutions in Cebu, Philippines
The Initiative on Financing for Resilient and Green Urban Global Solutions (FRUGS)
Annex 3: Key legislations for the Philippine Urban Sector
Urban Development and Housing Act of 1992 or RA 7279 (24 March 1992)—providing for a comprehensive and continuing urban development and housing program by guiding urban land use and development and by addressing the need for affordable housing.
Republic Act 7835 (16 December 1994)—the Comprehensive Integrated Shelter and Financing Act of 1994.
Executive Order 71—devolution of Housing and Land Use Regulatory Boards’ (HLURB) function to approve subdivision plans to LGUs.
Local Government Code or RA 7160—mandates LGUs to a prepare a CLUP enacted through a zoning ordinance, and to prepare a comprehensive development plan, other multisector development plans and public investment programs including the local development investment plan (LDIP).
Executive Order No. 72—providing for the preparation and implementation of CLUPs of LGUs pursuant to the LGC of 1991 and other pertinent laws.
Memorandum Circular No. 54—prescribing the guidelines of Sec. 20, RA 7160, authorizing cities and/or municipalities to reclassify lands into nonagricultural uses.
Executive Order No. 124—establishing priorities and procedures in evaluating areas for land conversion in regional agricultural and/or industrial centers, tourism development areas, and sites for socialized housing.
Batas Pambansa 220—an act authorizing the Ministry of Human Settlements to establish and promulgate different levels of standards
and technical requirements for economic and socialized housing projects in urban and rural areas from those provided under Presidential Decrees No. 957, 1216, 1096, and 1185.
Executive Order No. 82 (8 December 1986)—creating the Presidential Commission for the Urban Poor.
Executive Order No. 69 (29 March 2012)—for strengthening the Presidential Commission for the Urban Poor.
Executive Order 184—creating socialized housing one-stop processing centers.
The national government has in place a policy framework for urban development and housing that is enshrined in a number of laws, policies and strategic development plans. These include the following:
a. The 1987 Philippine Constitution
b. The Local Government Code of 1991 or RA 7160
c. The Urban Development and Housing Act of 1992, or Republic Act 7279
d. National Shelter Program (1986-1998)
e. The Comprehensive and Integrated Shelter and Finance Act of 1994 RA 7835
f. Philippine Agenda 21 (1995)
g. Philippine Habitat III National Urban Agenda (2016)
h. National Urban Development and Housing Framework (1999-2004)
i. Medium Term Philippine Development Plan (MTPDP) (2004-2010)
j. National Framework for Physical Planning (2001 – 2030)
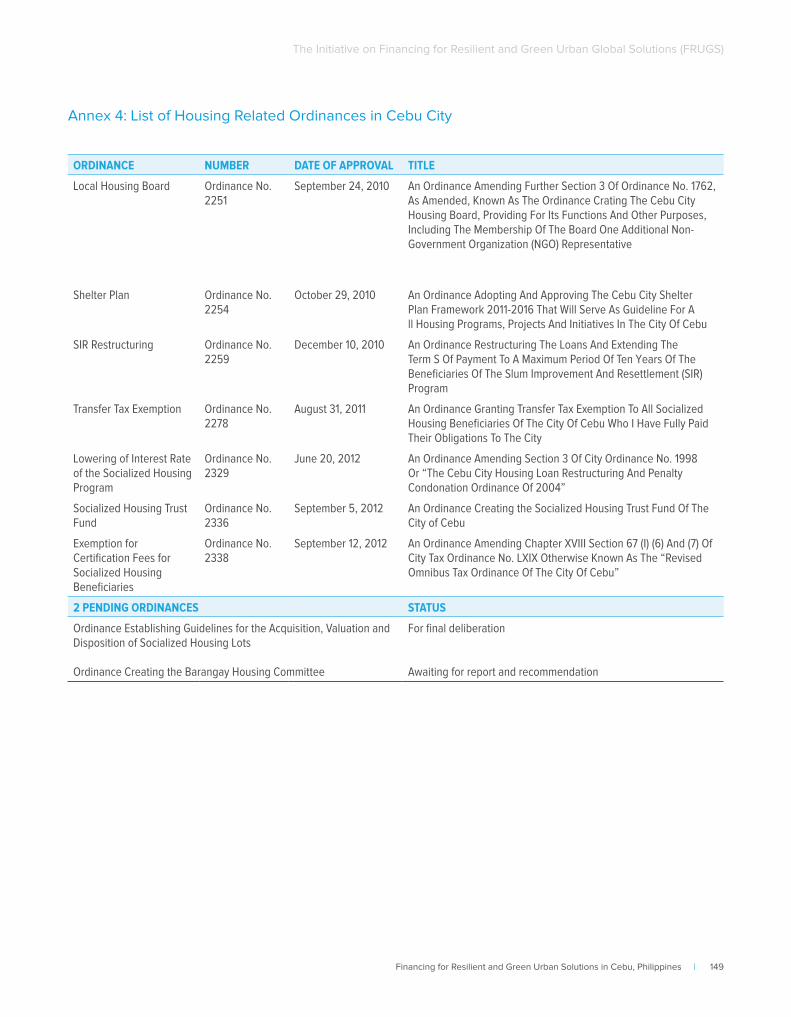
Financing for Resilient and Green Urban Solutions in Cebu, Philippines | 149
The Initiative on Financing for Resilient and Green Urban Global Solutions (FRUGS)
Annex 4: List of Housing Related Ordinances in Cebu City
ORDINANCE NUMBER DATE OF APPROVAL TITLE
Local Housing Board Ordinance No. 2251
September 24, 2010 An Ordinance Amending Further Section 3 Of Ordinance No. 1762, As Amended, Known As The Ordinance Crating The Cebu City Housing Board, Providing For Its Functions And Other Purposes, Including The Membership Of The Board One Additional Non-Government Organization (NGO) Representative
Shelter Plan Ordinance No. 2254
October 29, 2010 An Ordinance Adopting And Approving The Cebu City Shelter Plan Framework 2011-2016 That Will Serve As Guideline For A ll Housing Programs, Projects And Initiatives In The City Of Cebu
SIR Restructuring Ordinance No. 2259
December 10, 2010 An Ordinance Restructuring The Loans And Extending The Term S Of Payment To A Maximum Period Of Ten Years Of The Beneficiaries Of The Slum Improvement And Resettlement (SIR) Program
Transfer Tax Exemption Ordinance No. 2278
August 31, 2011 An Ordinance Granting Transfer Tax Exemption To All Socialized Housing Beneficiaries Of The City Of Cebu Who I Have Fully Paid Their Obligations To The City
Lowering of Interest Rate of the Socialized Housing Program
Ordinance No. 2329
June 20, 2012 An Ordinance Amending Section 3 Of City Ordinance No. 1998 Or “The Cebu City Housing Loan Restructuring And Penalty Condonation Ordinance Of 2004”
Socialized Housing Trust Fund
Ordinance No. 2336
September 5, 2012 An Ordinance Creating the Socialized Housing Trust Fund Of The City of Cebu
Exemption for Certification Fees for Socialized Housing Beneficiaries
Ordinance No. 2338
September 12, 2012 An Ordinance Amending Chapter XVIII Section 67 (I) (6) And (7) Of City Tax Ordinance No. LXIX Otherwise Known As The “Revised Omnibus Tax Ordinance Of The City Of Cebu”
2 PENDING ORDINANCES STATUS
Ordinance Establishing Guidelines for the Acquisition, Valuation and Disposition of Socialized Housing Lots
Ordinance Creating the Barangay Housing Committee
For final deliberation
Awaiting for report and recommendation
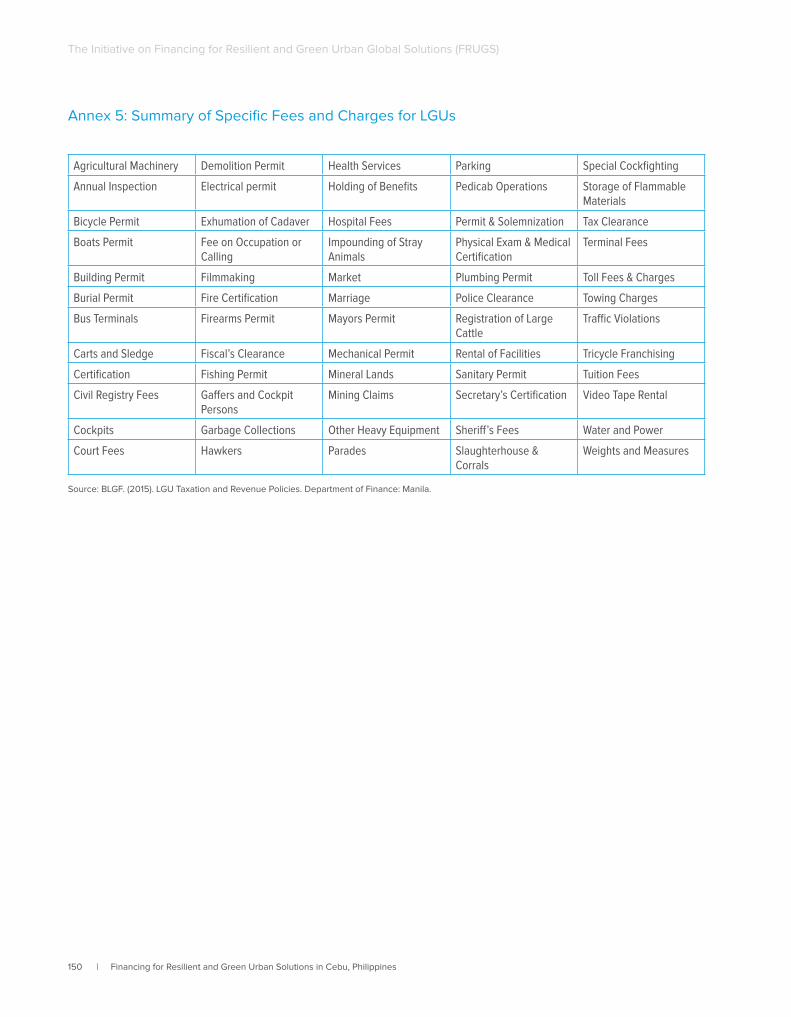
150 | Financing for Resilient and Green Urban Solutions in Cebu, Philippines
The Initiative on Financing for Resilient and Green Urban Global Solutions (FRUGS)
Annex 5: Summary of Specific Fees and Charges for LGUs
Agricultural Machinery Demolition Permit Health Services Parking Special Cockfighting
Annual Inspection Electrical permit Holding of Benefits Pedicab Operations Storage of Flammable Materials
Bicycle Permit Exhumation of Cadaver Hospital Fees Permit & Solemnization Tax Clearance
Boats Permit Fee on Occupation or Calling
Impounding of Stray Animals
Physical Exam & Medical Certification
Terminal Fees
Building Permit Filmmaking Market Plumbing Permit Toll Fees & Charges
Burial Permit Fire Certification Marriage Police Clearance Towing Charges
Bus Terminals Firearms Permit Mayors Permit Registration of Large Cattle
Traffic Violations
Carts and Sledge Fiscal’s Clearance Mechanical Permit Rental of Facilities Tricycle Franchising
Certification Fishing Permit Mineral Lands Sanitary Permit Tuition Fees
Civil Registry Fees Gaffers and Cockpit Persons
Mining Claims Secretary’s Certification Video Tape Rental
Cockpits Garbage Collections Other Heavy Equipment Sheriff’s Fees Water and Power
Court Fees Hawkers Parades Slaughterhouse & Corrals
Weights and Measures
Source: BLGF. (2015). LGU Taxation and Revenue Policies. Department of Finance: Manila.
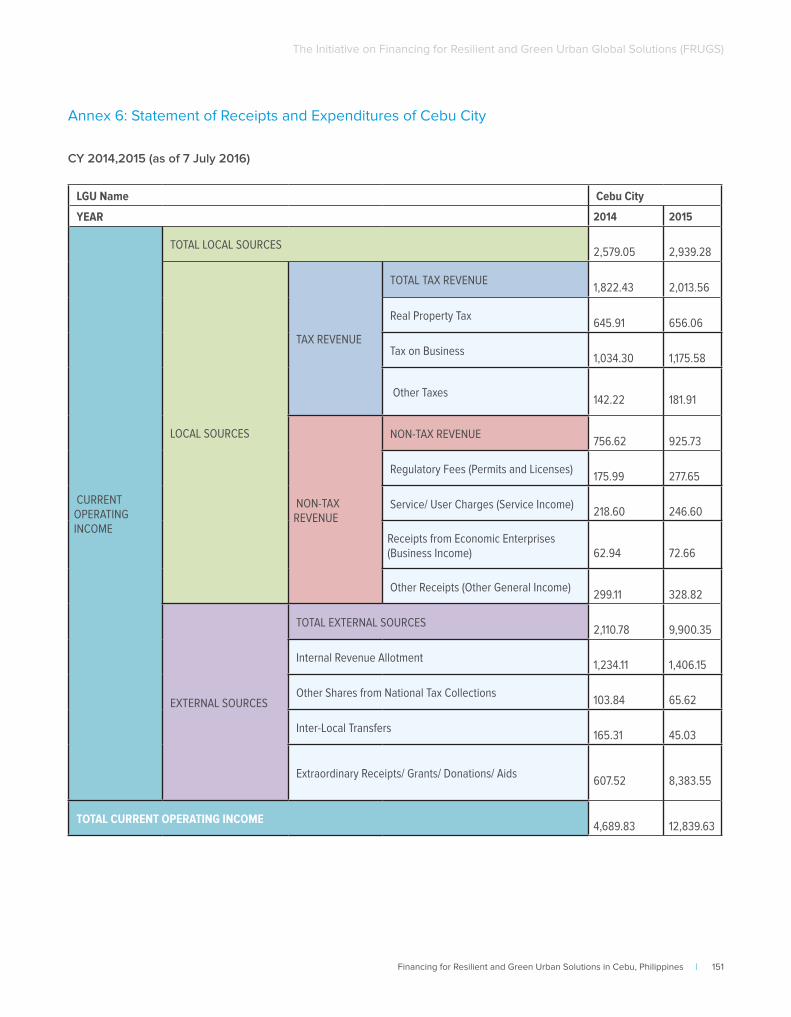
Financing for Resilient and Green Urban Solutions in Cebu, Philippines | 151
The Initiative on Financing for Resilient and Green Urban Global Solutions (FRUGS)
Annex 6: Statement of Receipts and Expenditures of Cebu City
LGU Name Cebu City
YEAR 2014 2015
CURRENT OPERATING INCOME
TOTAL LOCAL SOURCES 2,579.05
2,939.28
LOCAL SOURCES
TAX REVENUE
TOTAL TAX REVENUE 1,822.43
2,013.56
Real Property Tax 645.91
656.06
Tax on Business 1,034.30
1,175.58
Other Taxes 142.22
181.91
NON-TAX REVENUE
NON-TAX REVENUE 756.62
925.73
Regulatory Fees (Permits and Licenses) 175.99
277.65
Service/ User Charges (Service Income) 218.60
246.60
Receipts from Economic Enterprises (Business Income)
62.94
72.66
Other Receipts (Other General Income) 299.11
328.82
EXTERNAL SOURCES
TOTAL EXTERNAL SOURCES 2,110.78
9,900.35
Internal Revenue Allotment 1,234.11
1,406.15
Other Shares from National Tax Collections 103.84
65.62
Inter-Local Transfers 165.31
45.03
Extraordinary Receipts/ Grants/ Donations/ Aids 607.52
8,383.55
TOTAL CURRENT OPERATING INCOME 4,689.83
12,839.63
CY 2014,2015 (as of 7 July 2016)
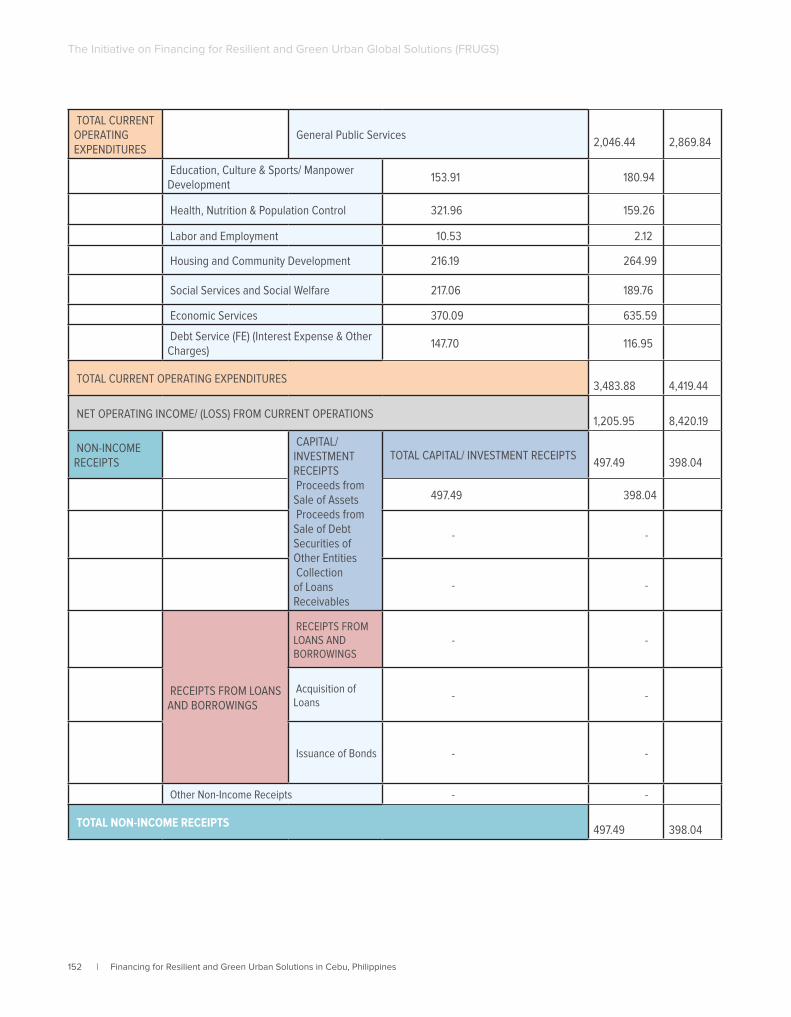
152 | Financing for Resilient and Green Urban Solutions in Cebu, Philippines
The Initiative on Financing for Resilient and Green Urban Global Solutions (FRUGS)
TOTAL CURRENT OPERATING EXPENDITURES
General Public Services 2,046.44
2,869.84
Education, Culture & Sports/ Manpower Development
153.91 180.94
Health, Nutrition & Population Control 321.96 159.26
Labor and Employment 10.53 2.12
Housing and Community Development 216.19 264.99
Social Services and Social Welfare 217.06 189.76
Economic Services 370.09 635.59
Debt Service (FE) (Interest Expense & Other Charges)
147.70 116.95
TOTAL CURRENT OPERATING EXPENDITURES 3,483.88
4,419.44
NET OPERATING INCOME/ (LOSS) FROM CURRENT OPERATIONS 1,205.95
8,420.19
NON-INCOME RECEIPTS
CAPITAL/ INVESTMENT RECEIPTS Proceeds from Sale of Assets Proceeds from Sale of Debt Securities of Other Entities Collection of Loans Receivables
TOTAL CAPITAL/ INVESTMENT RECEIPTS 497.49
398.04
497.49 398.04
- -
- -
RECEIPTS FROM LOANS AND BORROWINGS
RECEIPTS FROM LOANS AND BORROWINGS
- -
Acquisition of Loans
- -
Issuance of Bonds - -
Other Non-Income Receipts - -
TOTAL NON-INCOME RECEIPTS 497.49
398.04
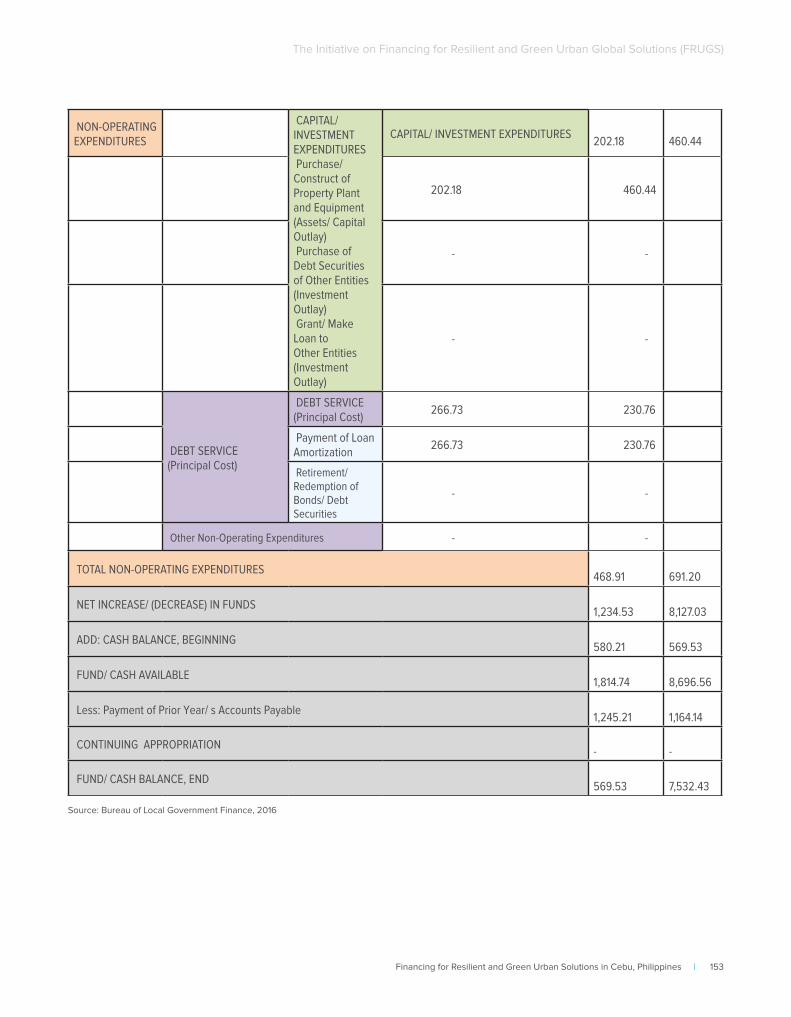
Financing for Resilient and Green Urban Solutions in Cebu, Philippines | 153
The Initiative on Financing for Resilient and Green Urban Global Solutions (FRUGS)
NON-OPERATING EXPENDITURES
CAPITAL/ INVESTMENT EXPENDITURES Purchase/ Construct of Property Plant and Equipment (Assets/ Capital Outlay) Purchase of Debt Securities of Other Entities (Investment Outlay) Grant/ Make Loan to Other Entities (Investment Outlay)
CAPITAL/ INVESTMENT EXPENDITURES 202.18
460.44
202.18 460.44
- -
- -
DEBT SERVICE (Principal Cost)
DEBT SERVICE (Principal Cost)
266.73 230.76
Payment of Loan Amortization
266.73 230.76
Retirement/ Redemption of Bonds/ Debt Securities
- -
Other Non-Operating Expenditures - -
TOTAL NON-OPERATING EXPENDITURES 468.91
691.20
NET INCREASE/ (DECREASE) IN FUNDS 1,234.53
8,127.03
ADD: CASH BALANCE, BEGINNING 580.21
569.53
FUND/ CASH AVAILABLE 1,814.74
8,696.56
Less: Payment of Prior Year/ s Accounts Payable 1,245.21
1,164.14
CONTINUING APPROPRIATION -
-
FUND/ CASH BALANCE, END 569.53
7,532.43
Source: Bureau of Local Government Finance, 2016
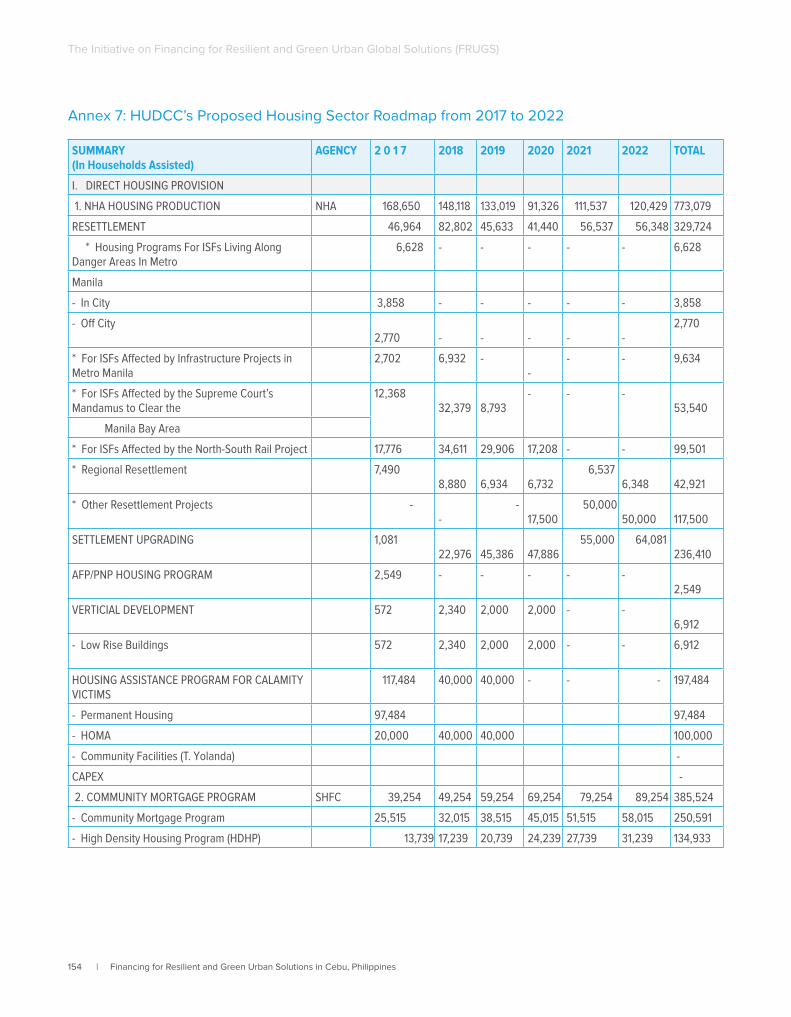
154 | Financing for Resilient and Green Urban Solutions in Cebu, Philippines
The Initiative on Financing for Resilient and Green Urban Global Solutions (FRUGS)
Annex 7: HUDCC’s Proposed Housing Sector Roadmap from 2017 to 2022
SUMMARY(In Households Assisted)
AGENCY 2 0 1 7 2018 2019 2020 2021 2022 TOTAL
I. DIRECT HOUSING PROVISION
1. NHA HOUSING PRODUCTION NHA 168,650 148,118 133,019 91,326 111,537 120,429 773,079
RESETTLEMENT 46,964 82,802 45,633 41,440 56,537 56,348 329,724
* Housing Programs For ISFs Living Along Danger Areas In Metro
6,628 - - - - - 6,628
Manila
- In City 3,858 - - - - - 3,858
- Off City 2,770
-
-
-
-
-
2,770
* For ISFs Affected by Infrastructure Projects in Metro Manila
2,702 6,932 - -
- - 9,634
* For ISFs Affected by the Supreme Court’s Mandamus to Clear the
12,368 32,379
8,793
- - - 53,540
Manila Bay Area
* For ISFs Affected by the North-South Rail Project 17,776 34,611 29,906 17,208 - - 99,501
* Regional Resettlement 7,490 8,880
6,934
6,732
6,537 6,348
42,921
* Other Resettlement Projects - -
- 17,500
50,000 50,000
117,500
SETTLEMENT UPGRADING 1,081 22,976
45,386
47,886
55,000 64,081 236,410
AFP/PNP HOUSING PROGRAM 2,549 - - - - - 2,549
VERTICIAL DEVELOPMENT 572 2,340 2,000 2,000 - - 6,912
- Low Rise Buildings 572 2,340 2,000 2,000 - - 6,912
HOUSING ASSISTANCE PROGRAM FOR CALAMITY VICTIMS
117,484 40,000 40,000 - - - 197,484
- Permanent Housing 97,484 97,484
- HOMA 20,000 40,000 40,000 100,000
- Community Facilities (T. Yolanda) -
CAPEX -
2. COMMUNITY MORTGAGE PROGRAM SHFC 39,254 49,254 59,254 69,254 79,254 89,254 385,524
- Community Mortgage Program 25,515 32,015 38,515 45,015 51,515 58,015 250,591
- High Density Housing Program (HDHP) 13,739 17,239 20,739 24,239 27,739 31,239 134,933
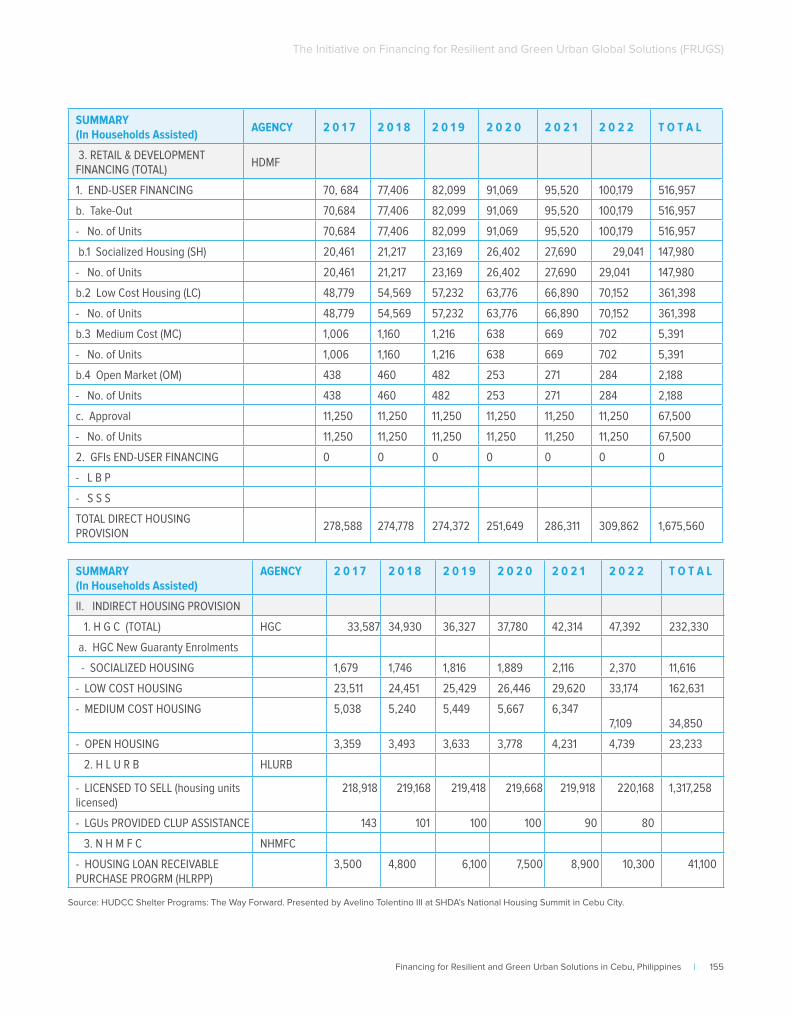
Financing for Resilient and Green Urban Solutions in Cebu, Philippines | 155
The Initiative on Financing for Resilient and Green Urban Global Solutions (FRUGS)
SUMMARY(In Households Assisted) AGENCY 2 0 1 7 2 0 1 8 2 0 1 9 2 0 2 0 2 0 2 1 2 0 2 2 T O T A L
3. RETAIL & DEVELOPMENT FINANCING (TOTAL)
HDMF
1. END-USER FINANCING 70, 684 77,406 82,099 91,069 95,520 100,179 516,957
b. Take-Out 70,684 77,406 82,099 91,069 95,520 100,179 516,957
- No. of Units 70,684 77,406 82,099 91,069 95,520 100,179 516,957
b.1 Socialized Housing (SH) 20,461 21,217 23,169 26,402 27,690 29,041 147,980
- No. of Units 20,461 21,217 23,169 26,402 27,690 29,041 147,980
b.2 Low Cost Housing (LC) 48,779 54,569 57,232 63,776 66,890 70,152 361,398
- No. of Units 48,779 54,569 57,232 63,776 66,890 70,152 361,398
b.3 Medium Cost (MC) 1,006 1,160 1,216 638 669 702 5,391
- No. of Units 1,006 1,160 1,216 638 669 702 5,391
b.4 Open Market (OM) 438 460 482 253 271 284 2,188
- No. of Units 438 460 482 253 271 284 2,188
c. Approval 11,250 11,250 11,250 11,250 11,250 11,250 67,500
- No. of Units 11,250 11,250 11,250 11,250 11,250 11,250 67,500
2. GFIs END-USER FINANCING 0 0 0 0 0 0 0
- L B P
- S S S
TOTAL DIRECT HOUSING PROVISION
278,588 274,778 274,372 251,649 286,311 309,862 1,675,560
SUMMARY(In Households Assisted)
AGENCY 2 0 1 7 2 0 1 8 2 0 1 9 2 0 2 0 2 0 2 1 2 0 2 2 T O T A L
II. INDIRECT HOUSING PROVISION
1. H G C (TOTAL) HGC 33,587 34,930 36,327 37,780 42,314 47,392 232,330
a. HGC New Guaranty Enrolments
- SOCIALIZED HOUSING 1,679 1,746 1,816 1,889 2,116 2,370 11,616
- LOW COST HOUSING 23,511 24,451 25,429 26,446 29,620 33,174 162,631
- MEDIUM COST HOUSING 5,038 5,240 5,449 5,667 6,347 7,109
34,850
- OPEN HOUSING 3,359 3,493 3,633 3,778 4,231 4,739 23,233
2. H L U R B HLURB
- LICENSED TO SELL (housing units licensed)
218,918 219,168 219,418 219,668 219,918 220,168 1,317,258
- LGUs PROVIDED CLUP ASSISTANCE 143 101 100 100 90 80
3. N H M F C NHMFC
- HOUSING LOAN RECEIVABLE PURCHASE PROGRM (HLRPP)
3,500 4,800 6,100 7,500 8,900 10,300 41,100
Source: HUDCC Shelter Programs: The Way Forward. Presented by Avelino Tolentino III at SHDA’s National Housing Summit in Cebu City.
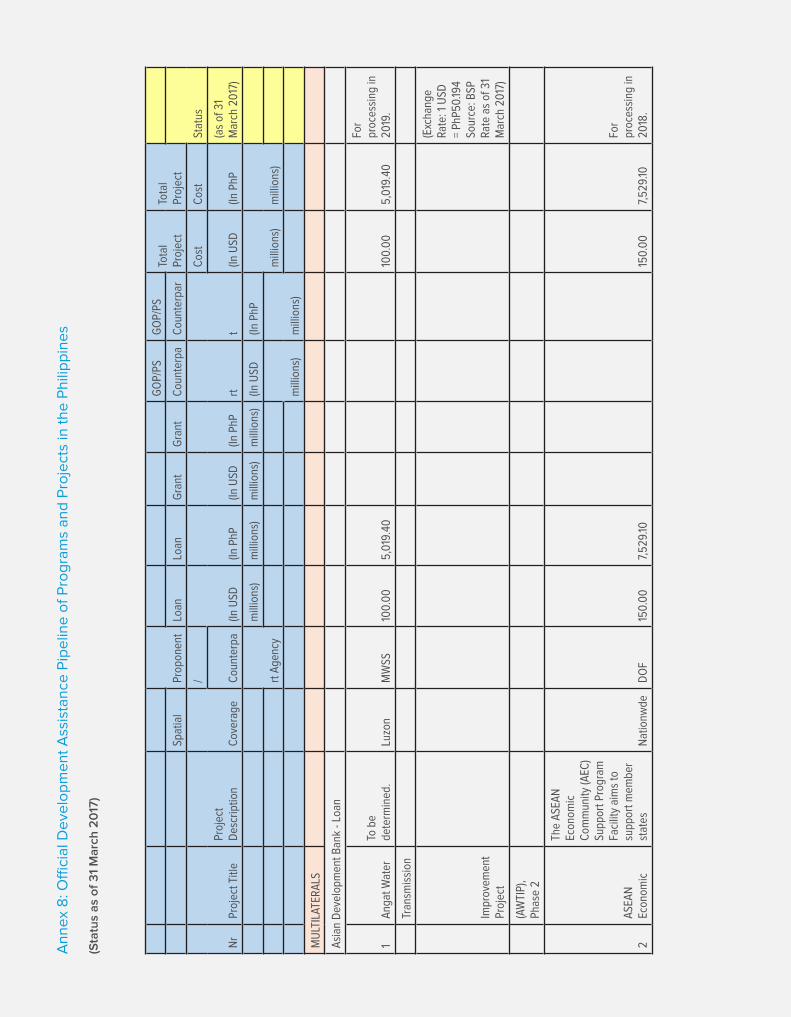
An
ne
x 8
: Offi
cia
l De
velo
pm
en
t A
ssis
tan
ce P
ipe
line
of
Pro
gra
ms
an
d P
roje
cts
in t
he
Ph
ilip
pin
es
(Sta
tus
as
of
31
Ma
rch
20
17)
Prop
onen
t
GO
P/PS
GO
P/PS
Tota
l Pr
ojec
tTo
tal
Proj
ect
Spat
ial
Loan
Loan
Gra
ntG
rant
Cou
nter
paC
ount
erpa
r
Stat
us
Nr
Proj
ect T
itle
Proj
ect
Des
crip
tion
Cov
erag
e
/
(In U
SD(In
PhP
(In U
SD(In
PhP
rtt
Cos
tC
ost
Cou
nter
pa(In
USD
(In P
hP(a
s of
31
Mar
ch 2
017
)
rt A
genc
y
mill
ions
)m
illio
ns)
mill
ions
)m
illio
ns)
(In U
SD(In
PhP
mill
ions
)m
illio
ns)
mill
ions
)m
illio
ns)
MU
LTIL
ATER
ALS
Asi
an D
evel
opm
ent B
ank
- Loa
n
1A
ngat
Wat
erTo
be
dete
rmin
ed.
Luzo
nM
WSS
100.
00
5,0
19.4
010
0.0
05,
019
.40
For
proc
essi
ng in
20
19.
Tran
smis
sion
Impr
ovem
ent
Proj
ect
(Exc
hang
e Ra
te: 1
USD
=
PhP5
0.19
4 So
urce
: BSP
Ra
te a
s of
31
Mar
ch 2
017
)
(AW
TIP)
, Ph
ase
2
2A
SEA
N
Econ
omic
The
ASE
AN
Ec
onom
ic
Com
mun
ity (A
EC)
Supp
ort P
rogr
am
Faci
lity
aim
s to
su
ppor
t mem
ber
stat
esN
atio
nwde
DO
F15
0.0
07,
529.
1015
0.0
07,
529.
10
For
proc
essi
ng in
20
18.

Com
mun
ity
(AEC
)
impr
ove
exte
rnal
co
mpe
titiv
enes
s an
d re
adin
ess
for
post
-20
15
inte
grat
ion,
and
w
here
nec
essa
ry,
put
Supp
ort
Prog
ram
Fa
cilit
y
in p
lace
ade
quat
e so
cial
pro
tect
ion
mea
sure
s so
to
incr
ease
the
pote
ntia
l gai
ns
from
ASE
AN
(Exc
hang
e Ra
te: 1
USD
=
PhP5
0.19
4 So
urce
: BSP
Ra
te a
s of
31
Mar
ch 2
017
)
inte
grat
ion
and
miti
gate
pot
entia
l ris
ks. T
he
Phili
ppin
es A
EIS
prog
ram
wou
ld
be d
esig
ned
spec
ifica
lly
to s
uppo
rt th
e Ph
ilipp
ines
im
prov
e its
re
adin
ess
for
post
AEC
20
15
and
incr
ease
its
exte
rnal
Com
petit
iven
ess.
Th
is w
ould
be
done
thro
ugh
supp
ort t
o th
e go
vern
men
t’s
natio
nal
com
petit
iven
ess
Age
nda
and
linke
d to
its
inte
grat
ion
mile
ston
es
unde
r th
e co
mpe
titiv
enes
s pi
llar
of th
e A
EC
Blu
eprin
t.
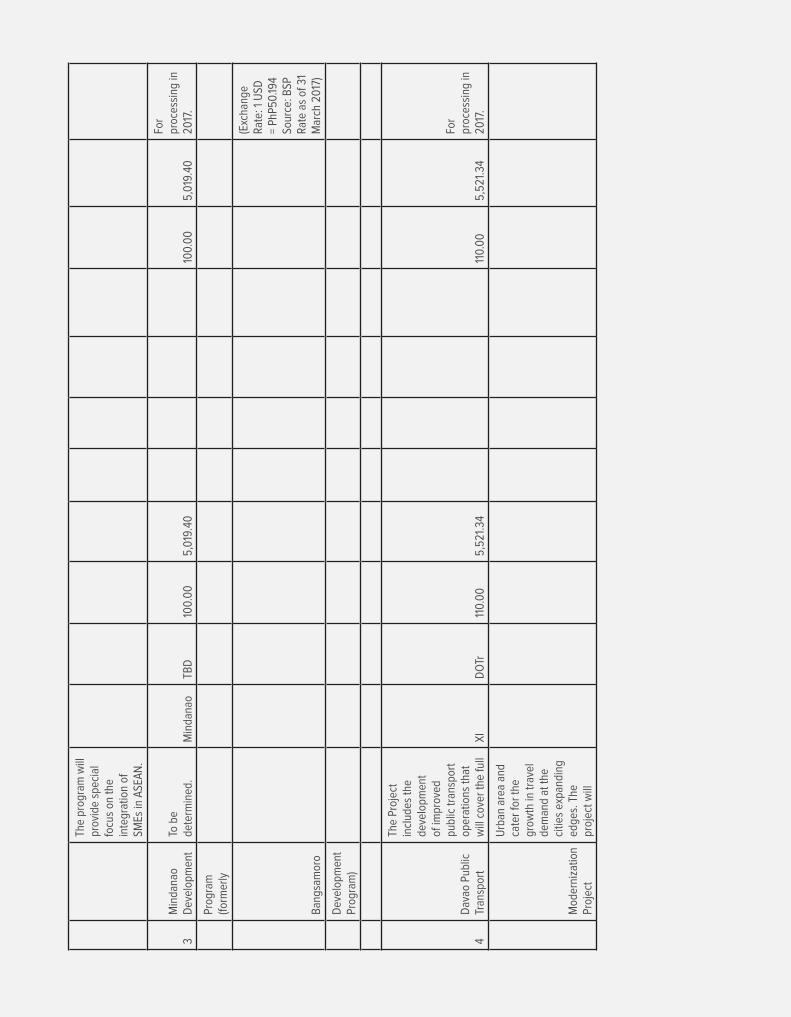
The
prog
ram
will
pr
ovid
e sp
ecia
l fo
cus
on th
e in
tegr
atio
n of
SM
Es in
ASE
AN
.
3M
inda
nao
Dev
elop
men
tTo
be
dete
rmin
ed.
Min
dana
oTB
D10
0.0
05,
019
.40
100.
00
5,0
19.4
0
For
proc
essi
ng in
20
17.
Prog
ram
(fo
rmer
ly
Ban
gsam
oro
(Exc
hang
e Ra
te: 1
USD
=
PhP5
0.19
4 So
urce
: BSP
Ra
te a
s of
31
Mar
ch 2
017
)
Dev
elop
men
t Pr
ogra
m)
4D
avao
Pub
lic
Tran
spor
t
The
Proj
ect
incl
udes
the
deve
lopm
ent
of im
prov
ed
publ
ic tr
ansp
ort
oper
atio
ns th
at
will
cov
er th
e fu
ll X
ID
OTr
110.
00
5,52
1.34
110.
00
5,52
1.34
For
proc
essi
ng in
20
17.
Mod
erni
zatio
n Pr
ojec
t
Urb
an a
rea
and
cate
r fo
r th
e gr
owth
in tr
avel
de
man
d at
the
citie
s ex
pand
ing
edge
s. T
he
proj
ect w
ill

over
haul
the
outd
ated
ser
vice
s th
at p
rovi
de a
po
or le
vel o
f se
rvic
e in
term
s of
cov
erag
e ar
ea,
hour
s of
On
17
Ferb
uary
20
17, A
DB
co
nduc
ted
an In
cept
ion
Wor
ksho
p w
ith th
e D
avao
City
G
over
nmen
t, D
OTr
and
N
RO
X
oper
atio
n, a
nd
pass
enge
r co
mfo
rt a
nd
faci
litie
s.
to fo
rmul
ate
the
tech
nica
l as
sist
ance
to
assi
st th
e ci
ty
gove
rnm
ent
and
the
AD
B
to p
repa
re a
ll ne
cess
ary
info
rmat
ion
and
stud
ies
requ
ired
to s
uppo
rt
the
loan
, w
hich
will
be
com
plet
ed o
n 31
Sep
tem
ber
2017
.
The
proj
ect w
ill
impr
ove
a ci
ty-
wid
e bu
s-ba
sed
publ
ic tr
ansp
ort
oper
atin
g sy
stem
, w
ith im
prov
ed
and
mod
ern
fran
chis
ing
mec
hani
sms
that
ens
ure
supp
ly m
eets
de
man
d. T
his
will
be
supp
orte
d th
roug
h
(Exc
hang
e Ra
te: 1
USD
=
PhP5
0.19
4 So
urce
: BSP
Ra
te a
s of
31
Mar
ch 2
017
)
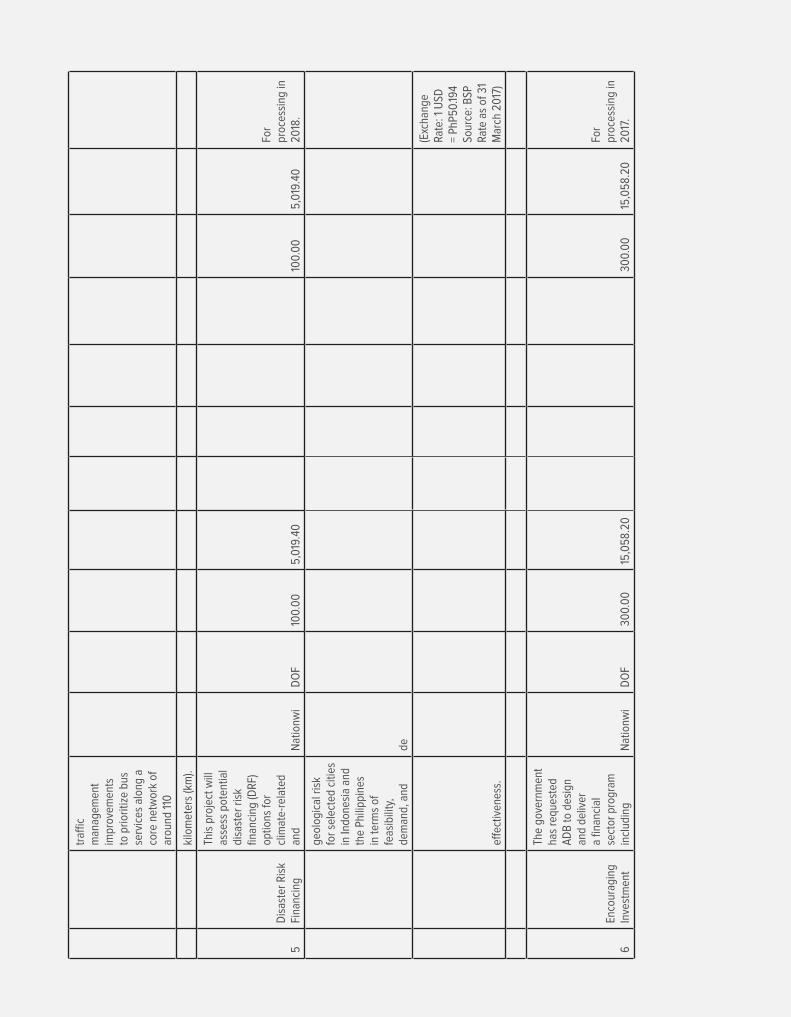
traffi
c m
anag
emen
t im
prov
emen
ts
to p
riorit
ize
bus
serv
ices
alo
ng a
co
re n
etw
ork
of
arou
nd 1
10
kilo
met
ers
(km
).
5D
isas
ter
Ris
k Fi
nanc
ing
This
pro
ject
will
as
sess
pot
entia
l di
sast
er r
isk
finan
cing
(DR
F)
optio
ns fo
r cl
imat
e-re
late
d an
dN
atio
nwi
DO
F10
0.0
05,
019
.40
100.
00
5,0
19.4
0
For
proc
essi
ng in
20
18.
geol
ogic
al r
isk
for
sele
cted
citi
es
in In
done
sia
and
the
Phili
ppin
es
in te
rms
of
feas
ibili
ty,
dem
and,
and
de
effec
tiven
ess.
(Exc
hang
e Ra
te: 1
USD
=
PhP5
0.19
4 So
urce
: BSP
Ra
te a
s of
31
Mar
ch 2
017
)
6En
cour
agin
g In
vest
men
t
The
gove
rnm
ent
has
requ
este
d A
DB
to d
esig
n an
d de
liver
a
finan
cial
se
ctor
pro
gram
in
clud
ing
Nat
ionw
iD
OF
300.
00
15,0
58.2
030
0.0
015
,058
.20
For
proc
essi
ng in
20
17.
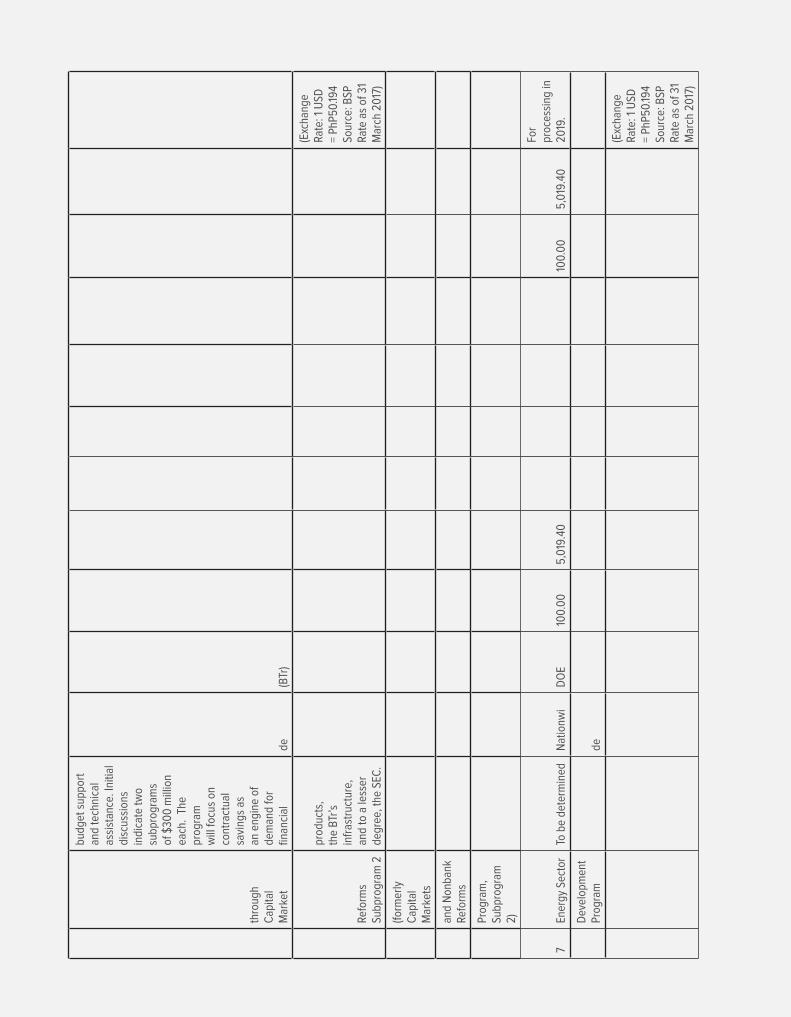
thro
ugh
Cap
ital
Mar
ket
budg
et s
uppo
rt
and
tech
nica
l as
sist
ance
. Ini
tial
disc
ussi
ons
indi
cate
two
subp
rogr
ams
of $
300
mill
ion
each
. Th
e pr
ogra
m
will
focu
s on
co
ntra
ctua
l sa
ving
s as
an
eng
ine
of
dem
and
for
finan
cial
de(B
Tr)
Refo
rms
Subp
rogr
am 2
prod
ucts
, th
e B
Tr’s
in
fras
truc
ture
, an
d to
a le
sser
de
gree
, the
SEC
.
(Exc
hang
e Ra
te: 1
USD
=
PhP5
0.19
4 So
urce
: BSP
Ra
te a
s of
31
Mar
ch 2
017
)
(form
erly
C
apita
l M
arke
ts
and
Non
bank
Re
form
s
Prog
ram
, Su
bpro
gram
2)
7En
ergy
Sec
tor
To b
e de
term
ined
Nat
ionw
iD
OE
100.
00
5,0
19.4
010
0.0
05,
019
.40
For
proc
essi
ng in
20
19.
Dev
elop
men
t Pr
ogra
mde
(Exc
hang
e Ra
te: 1
USD
=
PhP5
0.19
4 So
urce
: BSP
Ra
te a
s of
31
Mar
ch 2
017
)

8En
hanc
ing
Rur
al
The
prop
osed
pr
ogra
m w
ill
addr
ess
key
issu
es to
incr
ease
ru
ral e
mpl
oym
ent
gene
ratio
n th
roug
h (i)
Vis
ayas
DTI
200.
00
10,0
38.8
020
0.0
010
,038
.80
For
proc
essi
ng in
20
18.
Ente
rpris
e an
d R
ural
faci
litat
ing
an e
nabl
ing
envi
ronm
ent
for
job-
driv
en
prod
uctiv
e pr
ivat
e se
ctor
in
vest
men
ts in
ru
ral
and
Empl
oym
ent
Prog
ram
area
s, in
clud
ing
prov
idin
g ru
ral
infr
astr
uctu
re
whe
re n
eede
d to
red
uce
the
cost
of d
oing
bu
sine
ss in
the
rura
l are
as.;
(ii)
enco
urag
ing
the
grow
th a
nd
expa
nsio
n of
ru
ral e
nter
pris
es,
espe
cial
ly a
gro-
Min
dana
(Exc
hang
e Ra
te: 1
USD
=
PhP5
0.19
4 So
urce
: BSP
Ra
te a
s of
31
Mar
ch 2
017
)
(form
erly
C
apac
ity
proc
essi
ng
ente
rpris
es a
nd
rura
l tou
rism
(in
clud
ing
ecot
ouris
m)
ente
rpris
es; a
nd
(iii)
impr
ovin
go
Dev
elop
men
t Te
chni
cal
Skill
s of
wor
kers
an
d jo
b se
eker
s in
the
area
s of
ag
ro-p
roce
ssin
g an
d ru
ral t
ouris
m.
Ass
ista
nce
(CD
TA)

Prog
ram
and
Po
licy
Supp
ort f
or
Enha
ncin
g
Rur
al
Ente
rpris
e an
d
Rur
al
Empl
oym
ent)
9En
hanc
ing
You
th S
choo
l-
The
prog
ram
will
bu
ild o
n th
e ga
ins
of In
crea
sing
C
ompe
titiv
enes
s fo
r In
clus
ive
Gro
wth
Pro
gram
,N
atio
nwi
DO
LE30
0.0
015
,058
.20
300.
00
15,0
58.2
0
For
proc
essi
ng in
20
18.
to-W
ork
Tran
sitio
n
part
icul
arly
the
deve
lopm
ent o
f M
yFirs
tJob
s of
D
OLE
.de
Prog
ram
(fo
rmer
ly
AD
B F
act
Find
ing
Mis
sion
hel
d la
st 1
9 Fe
b 20
16 to
21
June
20
16.
Add
ress
ing
the
You
th
Empl
oym
ent
Cha
lleng
e
(Exc
hang
e Ra
te: 1
USD
=
PhP5
0.19
4 So
urce
: BSP
Ra
te a
s of
31
Mar
ch 2
017
)
Prog
ram
)
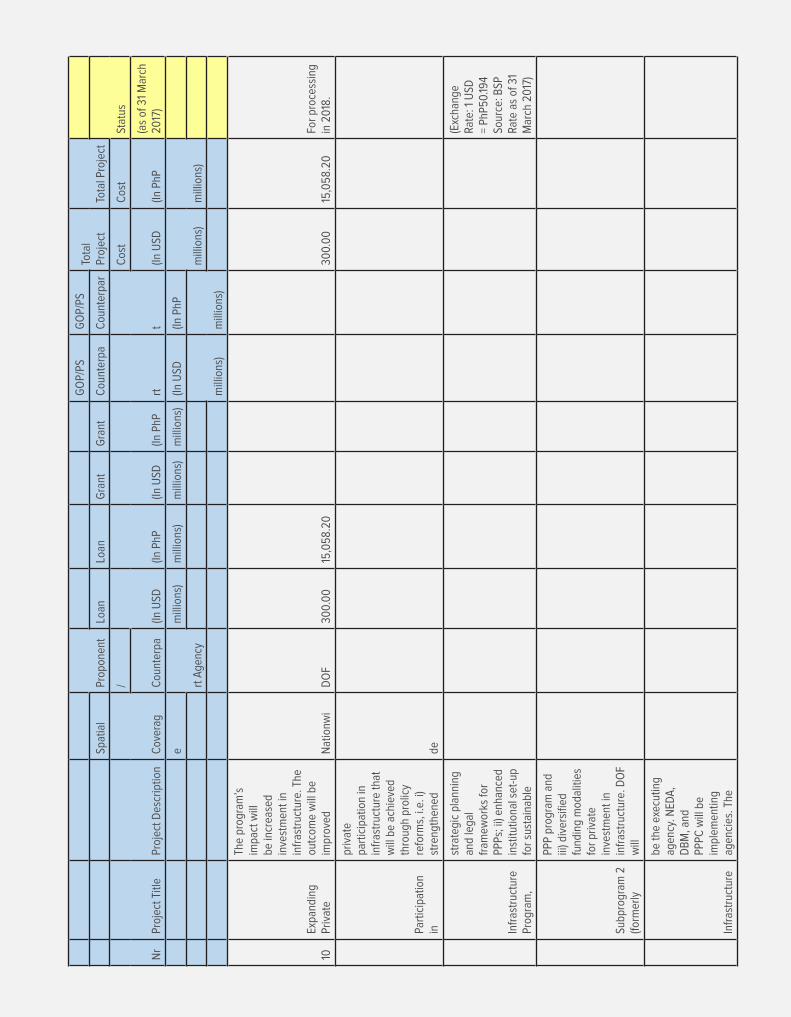
Prop
onen
t
GO
P/PS
GO
P/PS
Tota
l Pr
ojec
tTo
tal P
roje
ctSp
atia
lLo
anLo
anG
rant
Gra
ntC
ount
erpa
Cou
nter
par
Stat
us
Nr
Proj
ect T
itle
Proj
ect D
escr
iptio
nC
over
ag
/
(In U
SD(In
PhP
(In U
SD(In
PhP
rtt
Cos
tC
ost
Cou
nter
pa(In
USD
(In P
hP(a
s of
31
Mar
ch
2017
)
e
rt A
genc
y
mill
ions
)m
illio
ns)
mill
ions
)m
illio
ns)
(In U
SD(In
PhP
mill
ions
)m
illio
ns)
mill
ions
)m
illio
ns)
10Ex
pand
ing
Priv
ate
The
prog
ram
’s
impa
ct w
ill
be in
crea
sed
inve
stm
ent i
n in
fras
truc
ture
. The
ou
tcom
e w
ill b
e im
prov
edN
atio
nwi
DO
F30
0.0
015
,058
.20
300.
00
15,0
58.2
0Fo
r pr
oces
sing
in
20
18.
Part
icip
atio
n in
priv
ate
part
icip
atio
n in
in
fras
truc
ture
that
w
ill b
e ac
hiev
ed
thro
ugh
prol
icy
refo
rms,
i.e.
i)
stre
ngth
ened
de
Infr
astr
uctu
re
Prog
ram
,
stra
tegi
c pl
anni
ng
and
lega
l fr
amew
orks
for
PPPs
; ii)
enha
nced
in
stitu
tiona
l set
-up
for
sust
aina
ble
(Exc
hang
e Ra
te: 1
USD
=
PhP5
0.19
4 So
urce
: BSP
Ra
te a
s of
31
Mar
ch 2
017
)
Subp
rogr
am 2
(fo
rmer
ly
PPP
prog
ram
and
iii
) div
ersi
fied
fund
ing
mod
aliti
es
for
priv
ate
inve
stm
ent i
n in
fras
truc
ture
. DO
F w
ill
Infr
astr
uctu
re
be th
e ex
ecut
ing
agen
cy. N
EDA
, D
BM
, and
PP
PC w
ill b
e im
plem
entin
g ag
enci
es. T
he
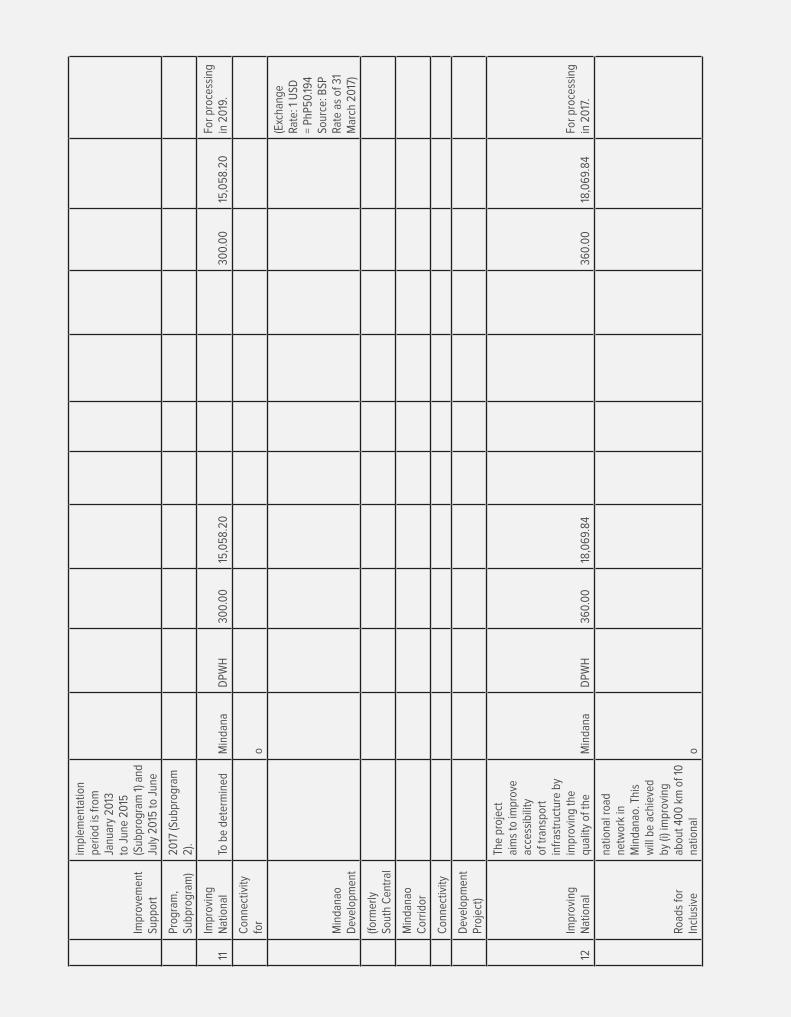
Impr
ovem
ent
Supp
ort
impl
emen
tatio
n pe
riod
is fr
om
Janu
ary
2013
to
Jun
e 20
15
(Sub
prog
ram
1) a
nd
July
20
15 to
Jun
e
Prog
ram
, Su
bpro
gram
)20
17 (S
ubpr
ogra
m
2).
11Im
prov
ing
Nat
iona
lTo
be
dete
rmin
edM
inda
naD
PWH
300.
00
15,0
58.2
030
0.0
015
,058
.20
For
proc
essi
ng
in 2
019
.
Con
nect
ivity
fo
ro
Min
dana
o D
evel
opm
ent
(Exc
hang
e Ra
te: 1
USD
=
PhP5
0.19
4 So
urce
: BSP
Ra
te a
s of
31
Mar
ch 2
017
)
(form
erly
So
uth
Cen
tral
Min
dana
o C
orrid
or
Con
nect
ivity
Dev
elop
men
t Pr
ojec
t)
12Im
prov
ing
Nat
iona
l
The
proj
ect
aim
s to
impr
ove
acce
ssib
ility
of
tran
spor
t in
fras
truc
ture
by
impr
ovin
g th
e qu
ality
of t
heM
inda
naD
PWH
360.
00
18,0
69.8
436
0.0
018
,069
.84
For
proc
essi
ng
in 2
017
.
Road
s fo
r In
clus
ive
natio
nal r
oad
netw
ork
in
Min
dana
o. T
his
will
be
achi
eved
by
(i) i
mpr
ovin
g ab
out 4
00
km
of 1
0
natio
nal
o

Gro
wth
in
Min
dana
o
road
s; (i
i) pr
epar
ing
the
deta
iled
engi
neer
ing
desi
gn
for
road
s to
be
impr
oved
und
er
futu
re p
roje
cts;
Thro
ugh
its
lett
er d
ated
10
Mar
ch
2017
, DPW
H
subm
itted
th
e pr
ojec
t pr
opos
al to
N
EDA
for
ICC
ev
alua
tion.
(form
erly
Se
cond
Roa
d
and
(iii)
stre
ngth
enin
g th
e in
stitu
tiona
l ca
paci
ty o
f DPW
H.
Impr
ovem
ent
and
(Exc
hang
e Ra
te: 1
= P
hP
50.19
4 on
31
Mar
ch 2
017
)
Inst
itutio
nal
Dev
elop
men
t
Proj
ect)
Not
e: L
oan
Com
pone
nt
Am
ount
will
in
clud
e U
SD
50 M
illio
n fr
om
AIF
, USD
40
M
illio
n fr
om
AD
FD, U
SD 5
0
Mill
ion
from
OFI
D.
13In
fras
truc
ture
Pr
epar
atio
n
The
faci
lity
will
su
ppor
t the
G
over
nmen
t of t
he
Phili
ppin
es to
mee
t its
acc
eler
ated
in
fras
truc
ture
Nat
ionw
iD
OF
100.
00
5,0
19.4
01.
00
50.19
14.16
710.
7511
5.16
5,78
0.34
For
proc
essi
ng
in 2
017
.
and
Inno
vatio
n Fa
cilit
y
deve
lopm
ent
obje
ctiv
es b
y su
ppor
ting
proj
ect
prep
arat
ion
and
man
agem
ent
capa
city
of
natio
nal
de
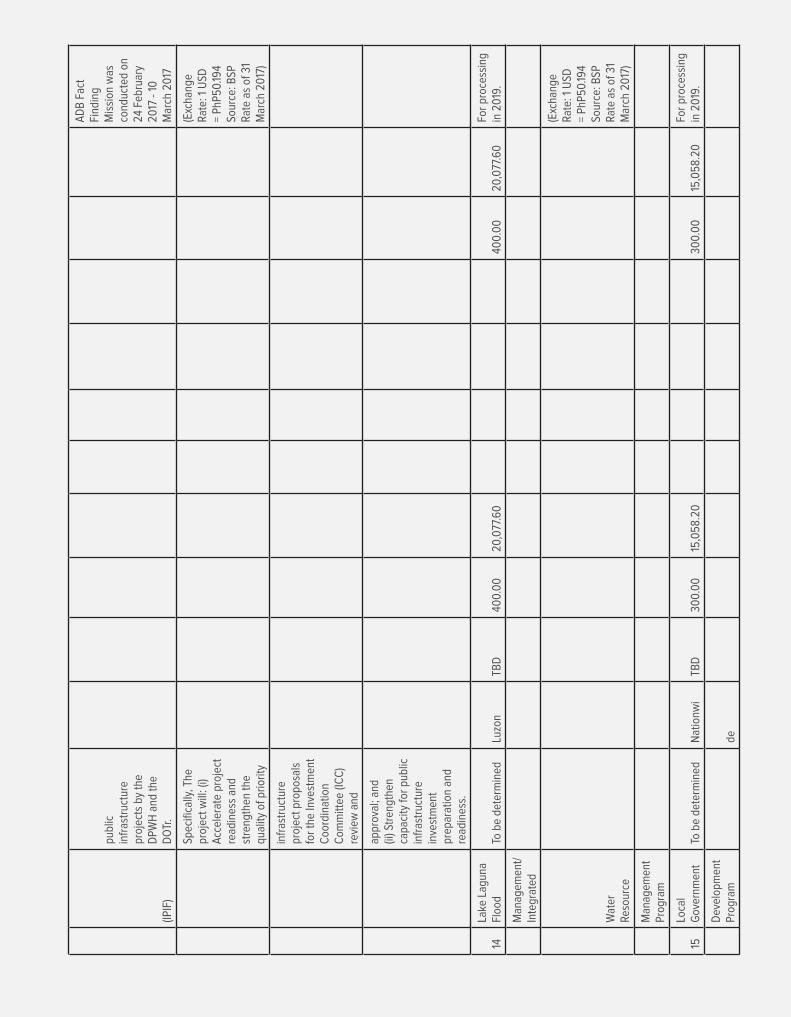
(IPIF
)
publ
ic
infr
astr
uctu
re
proj
ects
by
the
DPW
H a
nd th
e D
OTr
.
AD
B F
act
Find
ing
Mis
sion
was
co
nduc
ted
on
24 F
ebru
ary
2017
- 10
M
arch
20
17
Spec
ifica
lly, T
he
proj
ect w
ill: (
i) A
ccel
erat
e pr
ojec
t re
adin
ess
and
stre
ngth
en th
e qu
ality
of p
riorit
y
(Exc
hang
e Ra
te: 1
USD
=
PhP5
0.19
4 So
urce
: BSP
Ra
te a
s of
31
Mar
ch 2
017
)
infr
astr
uctu
re
proj
ect p
ropo
sals
fo
r th
e In
vest
men
t C
oord
inat
ion
Com
mitt
ee (I
CC
) re
view
and
appr
oval
; and
(ii
) Str
engt
hen
capa
city
for
publ
ic
infr
astr
uctu
re
inve
stm
ent
prep
arat
ion
and
read
ines
s.
14La
ke L
agun
a Fl
ood
To b
e de
term
ined
Luzo
nTB
D40
0.0
020
,077
.60
400.
00
20,0
77.6
0Fo
r pr
oces
sing
in
20
19.
Man
agem
ent/
Inte
grat
ed
Wat
er
Reso
urce
(Exc
hang
e Ra
te: 1
USD
=
PhP5
0.19
4 So
urce
: BSP
Ra
te a
s of
31
Mar
ch 2
017
)
Man
agem
ent
Prog
ram
15Lo
cal
Gov
ernm
ent
To b
e de
term
ined
Nat
ionw
iTB
D30
0.0
015
,058
.20
300.
00
15,0
58.2
0Fo
r pr
oces
sing
in
20
19.
Dev
elop
men
t Pr
ogra
mde

(Exc
hang
e Ra
te: 1
USD
=
PhP5
0.19
4 So
urce
: BSP
Ra
te a
s of
31
Mar
ch 2
017
)
16M
etro
Man
ila
Wat
er a
nd
1. T
he o
ngoi
ng
TA w
ill id
entif
y th
e pr
iorit
y in
fras
truc
ture
pr
ojec
ts to
be
finan
ced
in 2
017
. Th
e in
itial
NC
RM
WSS
100.
00
5,0
19.4
010
0.0
05,
019
.40
For
proc
essi
ng
in 2
018
.
Sani
tatio
n Pr
ogra
m
inve
stm
ent
iden
tified
by
MW
SS
for
finan
cing
is
the
reha
bilit
atio
n of
con
veya
nce
infr
astr
uctu
re o
f th
e
(form
erly
M
etro
Man
ila
Nat
iona
l Irr
igat
ion
Adm
inis
trat
ion
(NIA
), pa
rt o
f the
A
ngat
sys
tem
, w
hich
may
ena
ble
MW
SS to
use
of
(Exc
hang
e Ra
te: 1
USD
=
PhP5
0.19
4 So
urce
: BSP
Ra
te a
s of
31
Mar
ch 2
017
)
Was
te W
ater
a po
rtio
n of
NIA
’s
wat
er a
lloca
tion
for
its s
ervi
ce
area
. The
TA
will
al
so e
valu
ate
the
suita
bilit
y of
an
Impr
ovem
ent
Proj
ect)
MFF
for
MW
SS’
finan
cing
re
quire
men
ts.
2. T
he
infr
astr
uctu
re to
be
finan
ced
in 2
018
w
ill li
kely
be
a pr
iorit
y in
vest
men
t id
entifi
ed d
urin
g w
ork

on tu
nnel
4 (t
o be
fu
nded
by
AWTI
P),
whi
ch w
ill c
reat
e re
dund
anci
es in
th
e sy
stem
and
en
able
MW
SS to
se
quen
tially
clo
se,
insp
ect,
and
reha
bilit
ate
and/
or d
ecom
mis
sion
ol
der
tunn
els
and
aqua
duct
s; o
r a
sani
tatio
n in
vest
men
t as
agre
ed w
ith th
e co
nces
sion
aire
s.
17Re
duci
ng
Inco
me
The
prop
osed
Re
duci
ng In
com
e In
equa
lity
thro
ugh
Fina
ncia
l Inc
lusi
on
(RIF
I) w
ill s
uppo
rt
the
Nat
ionw
iD
OF
300.
00
15,0
58.2
030
0.0
015
,058
.20
For
proc
essi
ng
in 2
018
.
Ineq
ualit
y th
roug
h
Gov
ernm
ent o
f th
e Ph
ilipp
ines
(g
over
nmen
t) eff
orts
to b
ring
mor
e po
or fa
mili
es
into
the
finan
cial
de
Fina
ncia
l In
clus
ion
syst
em a
nd
the
prop
osed
pr
ogra
m w
ill b
e em
bedd
ed in
the
gove
rnm
ent’s
new
Fi
nanc
ial I
nclu
sion
(Exc
hang
e Ra
te: 1
USD
=
PhP5
0.19
4 So
urce
: BSP
Ra
te a
s of
31
Mar
ch 2
017
)
Stra
tegy
, whi
ch
will
be
laun
ched
in
20
15. R
IFI
will
sup
port
the
impl
emen
tatio
n of
new
and
in
nova
tive

way
s fo
r th
e de
liver
y an
d in
crea
se u
sage
of
non-
cred
it fin
anci
al
prod
ucts
and
se
rvic
es, a
cces
s to
hous
ing
finan
ce,
and
finan
cial
lit
erac
y fo
r th
e po
or.
The
RIF
I will
co
mpr
ise
of tw
o su
bpro
gram
s be
ing
part
of a
med
ium
to
long
term
re
form
age
nda
(sub
prog
ram
s in
20
18 a
nd 2
020
). W
hile
the
prog
ram
w
ill b
e ta
rget
ed
natio
nally
at t
he
bott
om 6
0%
of
hous
ehol
ds
in th
e in
com
e di
strib
utio
n, th
ere
will
be
a fo
cus
on
regi
ons
such
as
in
Vis
ayas
and
Min
dana
o w
here
fin
anci
al in
clus
ion
rate
s ar
e lo
wer
th
an th
e na
tiona
l av
erag
e, a
nd th
e in
cide
nce
of
pove
rty
and
inco
me
ineq
ualit
y ar
e hi
gher
.
18Se
cond
ary
Educ
atio
nTo
be
dete
rmin
edN
atio
nwi
Dep
Ed30
0.0
015
,058
.20
300.
00
15,0
58.2
0Fo
r pr
oces
sing
in
20
18.
Supp
ort
Prog
ram
de
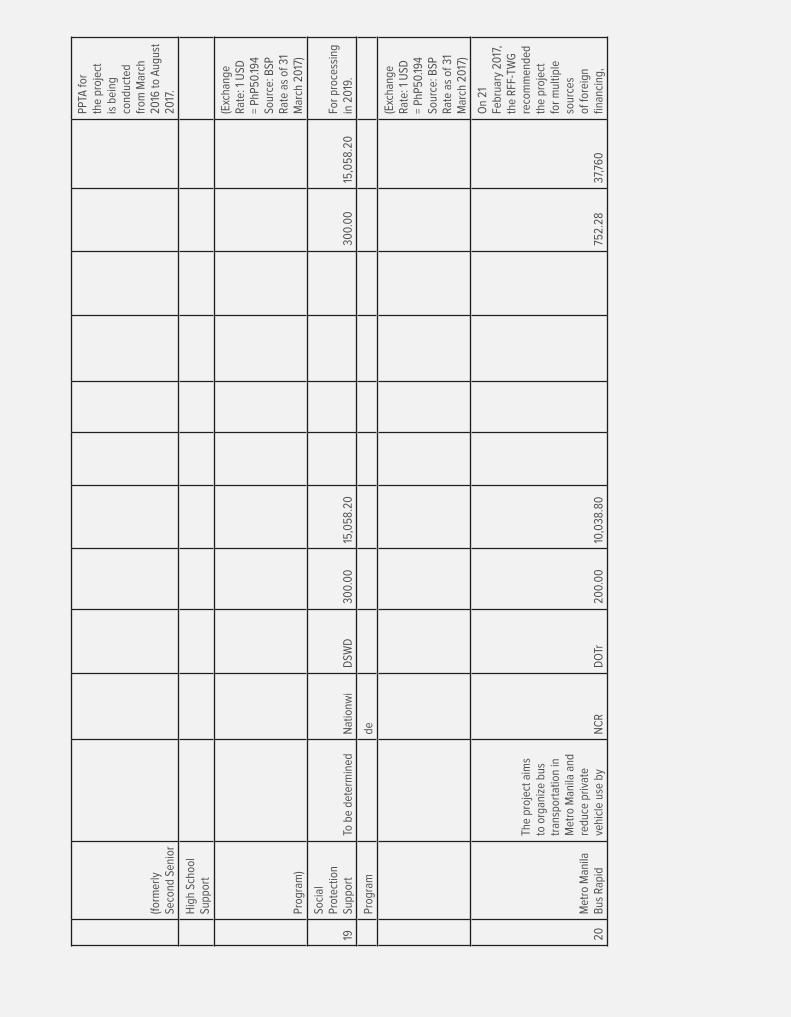
(form
erly
Se
cond
Sen
ior
PPTA
for
the
proj
ect
is b
eing
co
nduc
ted
from
Mar
ch
2016
to A
ugus
t 20
17.
Hig
h Sc
hool
Su
ppor
t
Prog
ram
)
(Exc
hang
e Ra
te: 1
USD
=
PhP5
0.19
4 So
urce
: BSP
Ra
te a
s of
31
Mar
ch 2
017
)
19
Soci
al
Prot
ectio
n Su
ppor
tTo
be
dete
rmin
edN
atio
nwi
DSW
D30
0.0
015
,058
.20
300.
00
15,0
58.2
0Fo
r pr
oces
sing
in
20
19.
Prog
ram
de
(Exc
hang
e Ra
te: 1
USD
=
PhP5
0.19
4 So
urce
: BSP
Ra
te a
s of
31
Mar
ch 2
017
)
20M
etro
Man
ila
Bus
Rap
id
The
proj
ect a
ims
to o
rgan
ize
bus
tran
spor
tatio
n in
M
etro
Man
ila a
nd
redu
ce p
rivat
e ve
hicl
e us
e by
NC
RD
OTr
200.
00
10,0
38.8
075
2.28
37,7
60
On
21
Febr
uary
20
17,
the
RFF
-TW
G
reco
mm
ende
d th
e pr
ojec
t fo
r m
ultip
le
sour
ces
of fo
reig
n fin
anci
ng,

Tran
sit (
BRT
) -
EDSA
prov
idin
g a
mor
e co
nven
ient
and
effi
cien
t opt
ion
for
priv
ate
car
user
s.
spec
ifica
lly
from
AD
B,
AFD
, AIIB
an
d K
EXIM
-ED
CF
subj
ect
to fu
rthe
r cl
arifi
catio
ns
on th
e al
loca
tion
of
Proj
ect
com
pone
nts
to b
e fu
nded
by
the
pros
pect
ive
deve
lopm
ent
part
ners
.
The
proj
ect
invo
lves
the
esta
blis
hmen
t of
a B
RT s
yste
m
whi
ch in
clud
es th
e co
nstr
uctio
n of
de
dica
ted
lane
s (1
lane
per
di
rect
ion
betw
een
stat
ions
and
2
lane
s pe
r di
rect
ion
at s
tatio
ns) w
ith
busw
ays,
The
NED
A
Boa
rd, i
n its
14
Sep
tem
ber
2016
mee
ting,
co
nfirm
ed th
e IC
C a
ppro
val
of th
e pr
ojec
t.
stat
ions
/ter
min
als
and
depo
ts;
proc
urem
ent o
f hi
gh-q
ualit
y an
d hi
gh-c
apac
ity
buse
s; in
stal
latio
n of sm
art s
igna
ling
syst
em a
t in
ters
ectio
ns
and
cent
ral
cont
rol s
yste
m;
and
prov
isio
n of
co
ntac
tless
(Exc
hang
e Ra
te: 1
USD
=
PhP5
0.19
4 So
urce
: BSP
Ra
te a
s of
31
Mar
ch 2
017
)
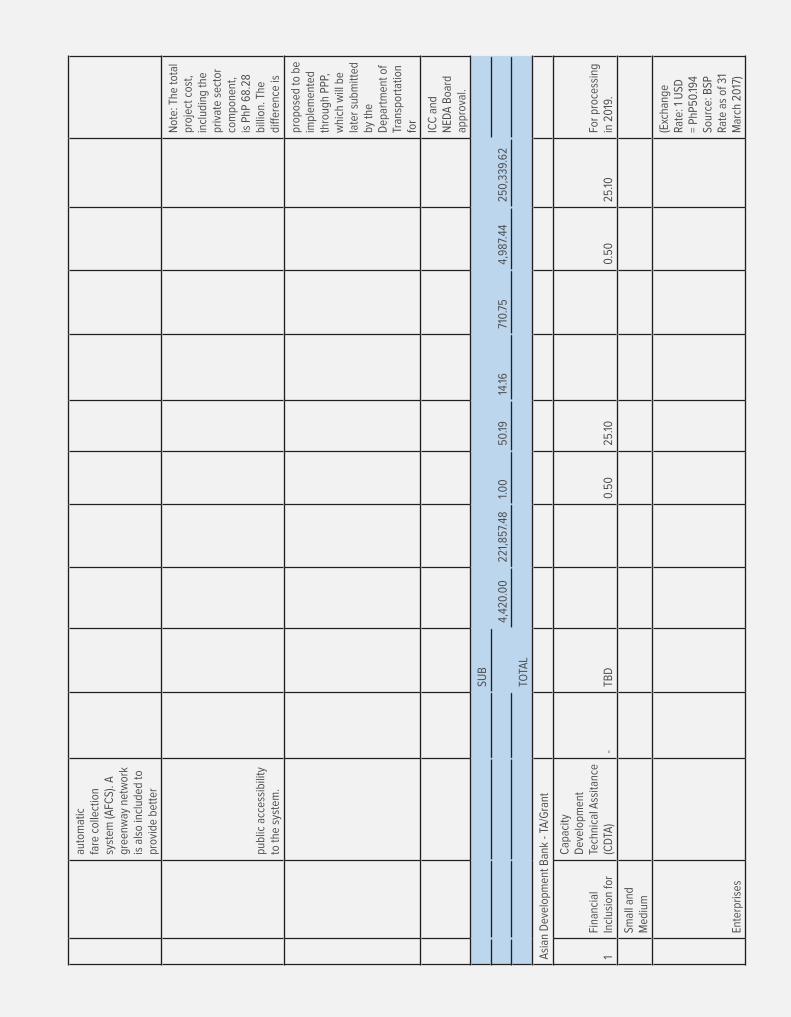
auto
mat
ic
fare
col
lect
ion
syst
em (A
FCS)
. A
gree
nway
net
wor
k is
als
o in
clud
ed to
pr
ovid
e be
tter
publ
ic a
cces
sibi
lity
to th
e sy
stem
.
Not
e: T
he to
tal
proj
ect c
ost,
incl
udin
g th
e pr
ivat
e se
ctor
co
mpo
nent
, is
PhP
68.
28
billi
on. T
he
diff
eren
ce is
prop
osed
to b
e im
plem
ente
d th
roug
h PP
P,
whi
ch w
ill b
e la
ter
subm
itted
by
the
Dep
artm
ent o
f Tr
ansp
orta
tion
for
ICC
and
N
EDA
Boa
rd
appr
oval
.
SUB
4,42
0.0
022
1,85
7.48
1.0
050
.1914
.1671
0.75
4,98
7.44
250,
339.
62
TOTA
L
Asi
an D
evel
opm
ent B
ank
- TA
/Gra
nt
1Fi
nanc
ial
Incl
usio
n fo
r
Cap
acity
D
evel
opm
ent
Tech
nica
l Ass
itanc
e (C
DTA
)-
TBD
0.50
25.10
0.50
25.10
For
proc
essi
ng
in 2
019
.
Smal
l and
M
ediu
m
Ente
rpris
es
(Exc
hang
e Ra
te: 1
USD
=
PhP5
0.19
4 So
urce
: BSP
Ra
te a
s of
31
Mar
ch 2
017
)
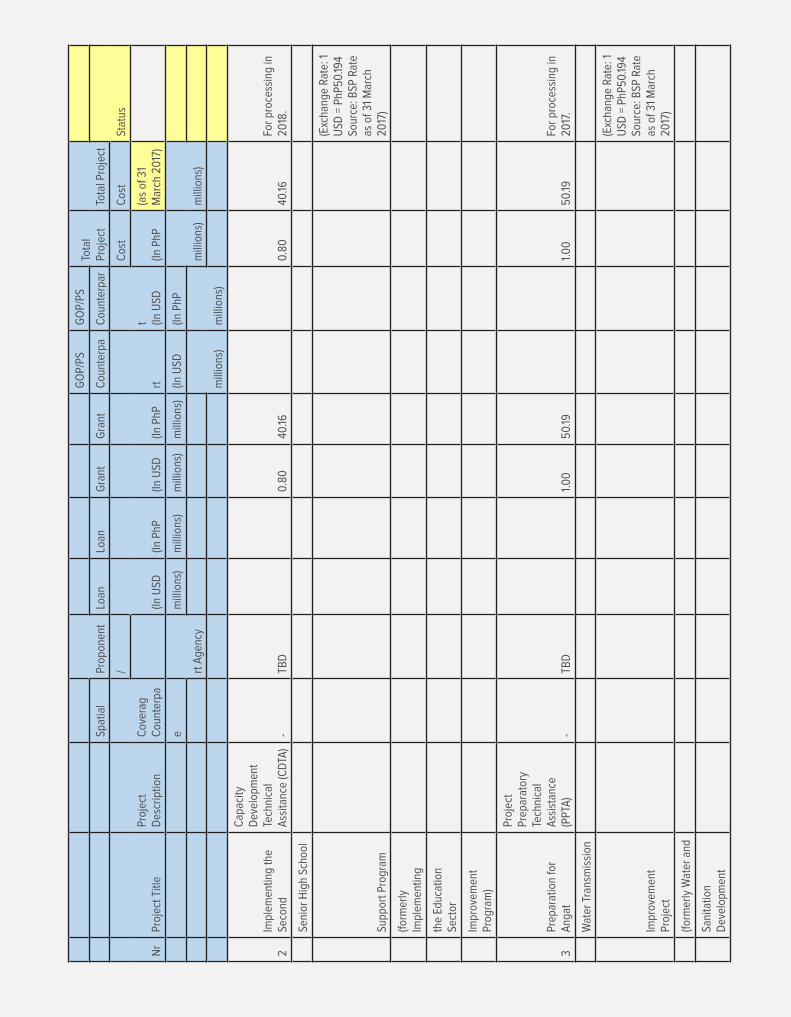
Prop
onen
t
GO
P/PS
GO
P/PS
Tota
l Pr
ojec
tTo
tal P
roje
ctSp
atia
lLo
anLo
anG
rant
Gra
ntC
ount
erpa
Cou
nter
par
Stat
us
Nr
Proj
ect T
itle
Proj
ect
Des
crip
tion
Cov
erag
Cou
nter
pa
/
(In U
SD(In
PhP
(In U
SD(In
PhP
rtt (In
USD
Cos
tC
ost
(In P
hP(a
s of
31
Mar
ch 2
017
)
e
rt A
genc
y
mill
ions
)m
illio
ns)
mill
ions
)m
illio
ns)
(In U
SD(In
PhP
mill
ions
)m
illio
ns)
mill
ions
)m
illio
ns)
2Im
plem
entin
g th
e Se
cond
Cap
acity
D
evel
opm
ent
Tech
nica
l A
ssita
nce
(CD
TA)
-TB
D0.
8040
.160.
8040
.16Fo
r pr
oces
sing
in
2018
.
Seni
or H
igh
Scho
ol
Supp
ort P
rogr
am
(Exc
hang
e Ra
te: 1
U
SD =
PhP
50.19
4 So
urce
: BSP
Rat
e as
of 3
1 M
arch
20
17)
(form
erly
Im
plem
entin
g
the
Educ
atio
n Se
ctor
Impr
ovem
ent
Prog
ram
)
3Pr
epar
atio
n fo
r A
ngat
Proj
ect
Prep
arat
ory
Tech
nica
l A
ssis
tanc
e (P
PTA
)-
TBD
1.0
050
.191.
00
50.19
For
proc
essi
ng in
20
17.
Wat
er T
rans
mis
sion
Impr
ovem
ent
Proj
ect
(Exc
hang
e Ra
te: 1
U
SD =
PhP
50.19
4 So
urce
: BSP
Rat
e as
of 3
1 M
arch
20
17)
(form
erly
Wat
er a
nd
Sani
tatio
n D
evel
opm
ent
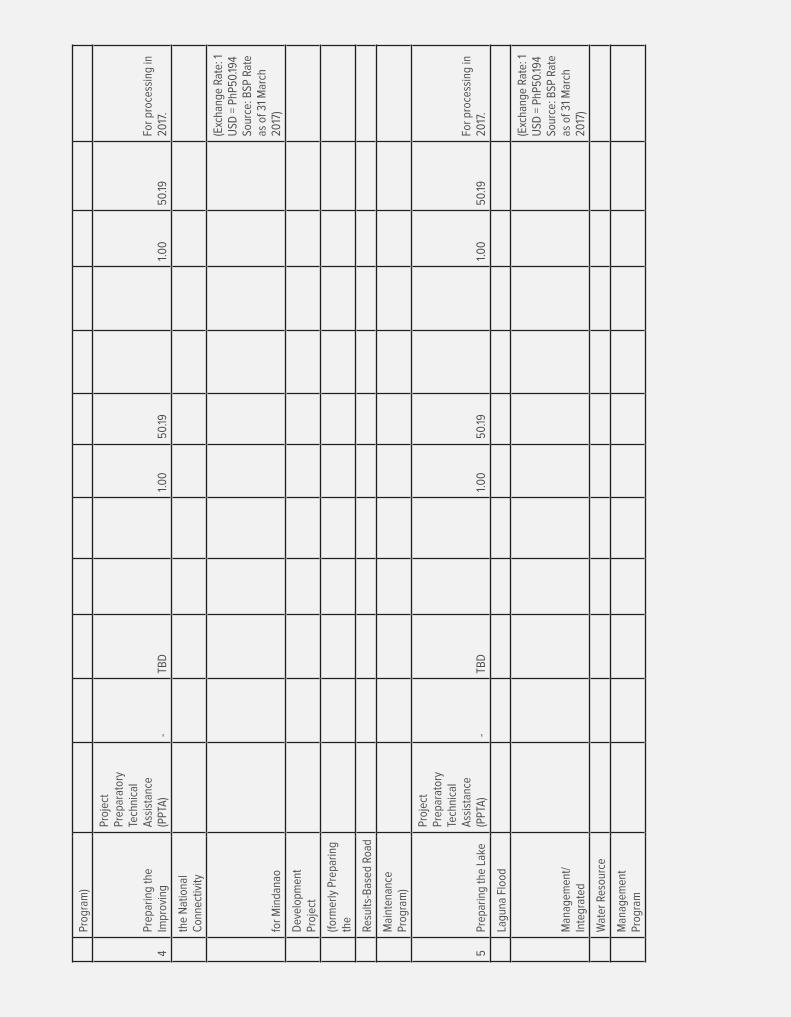
Prog
ram
)
4Pr
epar
ing
the
Impr
ovin
g
Proj
ect
Prep
arat
ory
Tech
nica
l A
ssis
tanc
e (P
PTA
)-
TBD
1.0
050
.191.
00
50.19
For
proc
essi
ng in
20
17.
the
Nat
iona
l C
onne
ctiv
ity
for
Min
dana
o
(Exc
hang
e Ra
te: 1
U
SD =
PhP
50.19
4 So
urce
: BSP
Rat
e as
of 3
1 M
arch
20
17)
Dev
elop
men
t Pr
ojec
t
(form
erly
Pre
parin
g th
e
Resu
lts-B
ased
Roa
d
Mai
nten
ance
Pr
ogra
m)
5Pr
epar
ing
the
Lake
Proj
ect
Prep
arat
ory
Tech
nica
l A
ssis
tanc
e (P
PTA
)-
TBD
1.0
050
.191.
00
50.19
For
proc
essi
ng in
20
17.
Lagu
na F
lood
Man
agem
ent/
In
tegr
ated
(Exc
hang
e Ra
te: 1
U
SD =
PhP
50.19
4 So
urce
: BSP
Rat
e as
of 3
1 M
arch
20
17)
Wat
er R
esou
rce
Man
agem
ent
Prog
ram
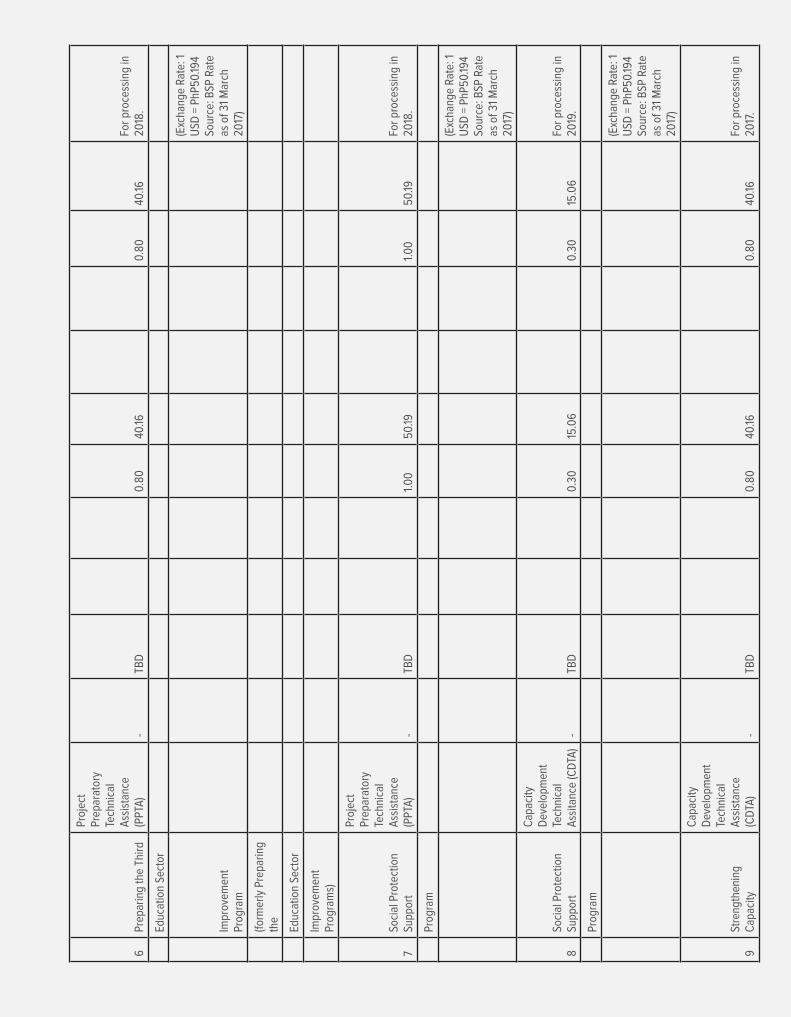
6Pr
epar
ing
the
Third
Proj
ect
Prep
arat
ory
Tech
nica
l A
ssis
tanc
e (P
PTA
)-
TBD
0.80
40.16
0.80
40.16
For
proc
essi
ng in
20
18.
Educ
atio
n Se
ctor
Impr
ovem
ent
Prog
ram
(Exc
hang
e Ra
te: 1
U
SD =
PhP
50.19
4 So
urce
: BSP
Rat
e as
of 3
1 M
arch
20
17)
(form
erly
Pre
parin
g th
e
Educ
atio
n Se
ctor
Impr
ovem
ent
Prog
ram
s)
7So
cial
Pro
tect
ion
Supp
ort
Proj
ect
Prep
arat
ory
Tech
nica
l A
ssis
tanc
e (P
PTA
)-
TBD
1.0
050
.191.
00
50.19
For
proc
essi
ng in
20
18.
Prog
ram
(Exc
hang
e Ra
te: 1
U
SD =
PhP
50.19
4 So
urce
: BSP
Rat
e as
of 3
1 M
arch
20
17)
8So
cial
Pro
tect
ion
Supp
ort
Cap
acity
D
evel
opm
ent
Tech
nica
l A
ssita
nce
(CD
TA)
-TB
D0.
3015
.06
0.30
15.0
6Fo
r pr
oces
sing
in
2019
.
Prog
ram
(Exc
hang
e Ra
te: 1
U
SD =
PhP
50.19
4 So
urce
: BSP
Rat
e as
of 3
1 M
arch
20
17)
9St
reng
then
ing
Cap
acity
Cap
acity
D
evel
opm
ent
Tech
nica
l A
ssis
tanc
e (C
DTA
)-
TBD
0.80
40.16
0.80
40.16
For
proc
essi
ng in
20
17.
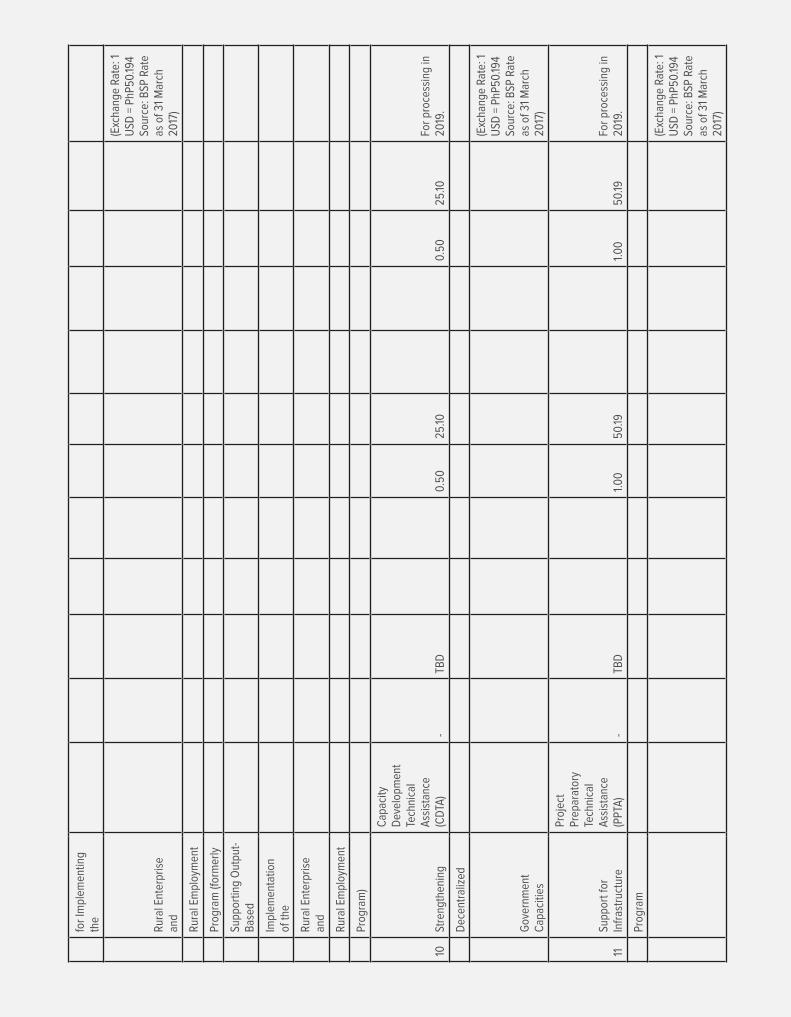
for
Impl
emen
ting
the
Rur
al E
nter
pris
e an
d
(Exc
hang
e Ra
te: 1
U
SD =
PhP
50.19
4 So
urce
: BSP
Rat
e as
of 3
1 M
arch
20
17)
Rur
al E
mpl
oym
ent
Prog
ram
(for
mer
ly
Supp
ortin
g O
utpu
t-B
ased
Impl
emen
tatio
n of
the
Rur
al E
nter
pris
e an
d
Rur
al E
mpl
oym
ent
Prog
ram
)
10St
reng
then
ing
Cap
acity
D
evel
opm
ent
Tech
nica
l A
ssis
tanc
e (C
DTA
)-
TBD
0.50
25.10
0.50
25.10
For
proc
essi
ng in
20
19.
Dec
entr
aliz
ed
Gov
ernm
ent
Cap
aciti
es
(Exc
hang
e Ra
te: 1
U
SD =
PhP
50.19
4 So
urce
: BSP
Rat
e as
of 3
1 M
arch
20
17)
11Su
ppor
t for
In
fras
truc
ture
Proj
ect
Prep
arat
ory
Tech
nica
l A
ssis
tanc
e (P
PTA
)-
TBD
1.0
050
.191.
00
50.19
For
proc
essi
ng in
20
19.
Prog
ram
(Exc
hang
e Ra
te: 1
U
SD =
PhP
50.19
4 So
urce
: BSP
Rat
e as
of 3
1 M
arch
20
17)
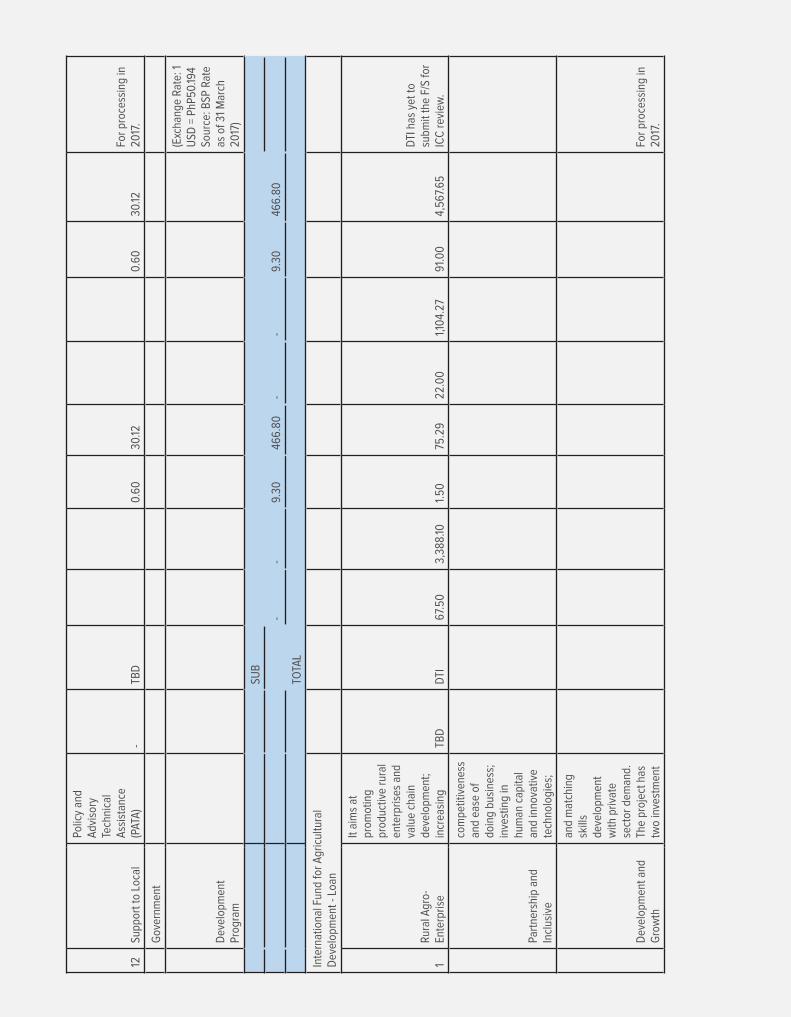
12Su
ppor
t to
Loca
l
Polic
y an
d A
dvis
ory
Tech
nica
l A
ssis
tanc
e (P
ATA
)-
TBD
0.60
30.12
0.60
30.12
For
proc
essi
ng in
20
17.
Gov
ernm
ent
Dev
elop
men
t Pr
ogra
m
(Exc
hang
e Ra
te: 1
U
SD =
PhP
50.19
4 So
urce
: BSP
Rat
e as
of 3
1 M
arch
20
17)
SUB
--
9.30
466.
80-
-9.
3046
6.80
TOTA
L
Inte
rnat
iona
l Fun
d fo
r A
gric
ultu
ral
Dev
elop
men
t - L
oan
1R
ural
Agr
o-En
terp
rise
It ai
ms
at
prom
otin
g pr
oduc
tive
rura
l en
terp
rises
and
va
lue
chai
n de
velo
pmen
t; in
crea
sing
TBD
DTI
67.5
03,
388.
101.
5075
.29
22.0
01,1
04.
2791
.00
4,56
7.65
DTI
has
yet
to
subm
it th
e F/
S fo
r IC
C r
evie
w.
Part
ners
hip
and
Incl
usiv
e
com
petit
iven
ess
and
ease
of
doin
g bu
sine
ss;
inve
stin
g in
hu
man
cap
ital
and
inno
vativ
e te
chno
logi
es;
Dev
elop
men
t and
G
row
th
and
mat
chin
g sk
ills
deve
lopm
ent
with
priv
ate
sect
or d
eman
d.
The
proj
ect h
as
two
inve
stm
ent
For
proc
essi
ng in
20
17.

Proj
ect (
RA
PID
G
row
th)
com
pone
nts
(val
ue c
hain
de
velo
pmen
t an
d pr
oduc
tive
inve
stm
ents
) an
d on
e m
anag
emen
t
new
title
com
pone
nt
(pro
ject
m
anag
emen
t).
(Exc
hang
e Ra
te: 1
U
SD =
PhP
50.19
4 So
urce
: BSP
Rat
e as
of 3
1 M
arch
20
17)
(Rur
al A
gro-
Indu
stria
l
It w
ill in
itial
ly
targ
et r
egio
ns
that
com
bine
st
rate
gic
valu
e ch
ain
cons
ider
atio
ns
(e.g
. co
mpa
rativ
e
Part
ners
hip
for
Incl
usiv
e
adva
ntag
e,
mag
nitu
de
of e
cono
mic
op
port
uniti
es,
pote
ntia
l for
pr
oduc
tion
grow
th) w
ith
farm
ing
Dev
elop
men
t and
popu
latio
n de
nsity
and
in
cide
nce
of
pove
rty.
It
is e
xpec
ted
that
targ
et
regi
ons
will
be
conc
entr
ated
in
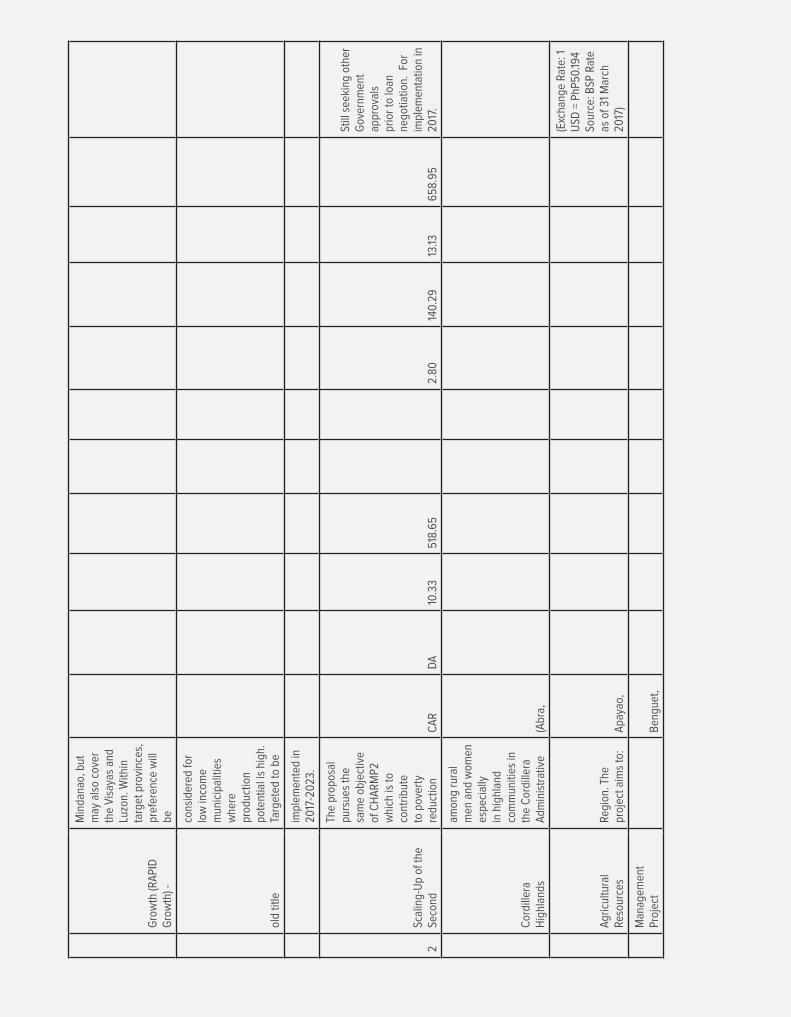
Gro
wth
(RA
PID
G
row
th) -
Min
dana
o, b
ut
may
als
o co
ver
the
Vis
ayas
and
Lu
zon.
With
in
targ
et p
rovi
nces
, pr
efer
ence
will
be
old
title
cons
ider
ed fo
r lo
w in
com
e m
unic
ipal
ities
w
here
pr
oduc
tion
pote
ntia
l is
high
. Ta
rget
ed to
be
impl
emen
ted
in
2017
-20
23.
2Sc
alin
g-U
p of
the
Seco
nd
The
prop
osal
pu
rsue
s th
e sa
me
obje
ctiv
e of
CH
AR
MP2
w
hich
is to
co
ntrib
ute
to p
over
ty
redu
ctio
nC
AR
DA
10.3
351
8.65
2.80
140.
2913
.1365
8.95
Still
see
king
oth
er
Gov
ernm
ent
appr
oval
s pr
ior
to lo
an
nego
tiatio
n. F
or
impl
emen
tatio
n in
20
17.
Cor
dille
ra
Hig
hlan
ds
amon
g ru
ral
men
and
wom
en
espe
cial
ly
in h
ighl
and
com
mun
ities
in
the
Cor
dille
ra
Adm
inis
trat
ive
(Abr
a,
Agr
icul
tura
l Re
sour
ces
Regi
on. T
he
proj
ect a
ims
to:
Apa
yao,
(Exc
hang
e Ra
te: 1
U
SD =
PhP
50.19
4 So
urce
: BSP
Rat
e as
of 3
1 M
arch
20
17)
Man
agem
ent
Proj
ect
Ben
guet
,
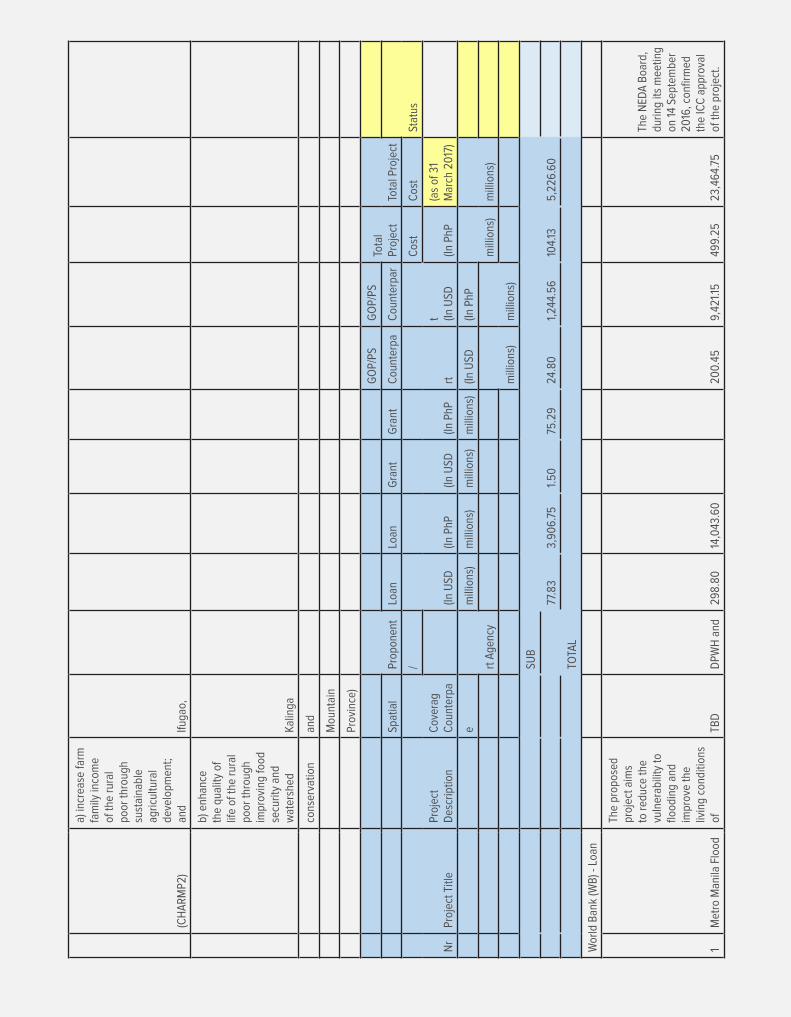
(CH
AR
MP2
)
a) in
crea
se fa
rm
fam
ily in
com
e of
the
rura
l po
or th
roug
h su
stai
nabl
e ag
ricul
tura
l de
velo
pmen
t; an
dIfu
gao,
b) e
nhan
ce
the
qual
ity o
f lif
e of
the
rura
l po
or th
roug
h im
prov
ing
food
se
curit
y an
d w
ater
shed
Kal
inga
cons
erva
tion
and
Mou
ntai
n
Prov
ince
)
Prop
onen
t
GO
P/PS
GO
P/PS
Tota
l Pr
ojec
tTo
tal P
roje
ctSp
atia
lLo
anLo
anG
rant
Gra
ntC
ount
erpa
Cou
nter
par
Stat
us
Nr
Proj
ect T
itle
Proj
ect
Des
crip
tion
Cov
erag
Cou
nter
pa
/
(In U
SD(In
PhP
(In U
SD(In
PhP
rtt (In
USD
Cos
tC
ost
(In P
hP(a
s of
31
Mar
ch 2
017
)
e
rt A
genc
y
mill
ions
)m
illio
ns)
mill
ions
)m
illio
ns)
(In U
SD(In
PhP
mill
ions
)m
illio
ns)
mill
ions
)m
illio
ns)
SUB
77.8
33,
906.
751.
5075
.29
24.8
01,
244.
5610
4.13
5,22
6.60
TOTA
L
Wor
ld B
ank
(WB
) - L
oan
1M
etro
Man
ila F
lood
The
prop
osed
pr
ojec
t aim
s to
red
uce
the
vuln
erab
ility
to
flood
ing
and
impr
ove
the
livin
g co
nditi
ons
ofTB
DD
PWH
and
298.
8014
,043
.60
200.
459,
421.1
549
9.25
23,4
64.7
5
The
NED
A B
oard
, du
ring
its m
eetin
g on
14
Sept
embe
r 20
16, c
onfir
med
th
e IC
C a
ppro
val
of th
e pr
ojec
t.
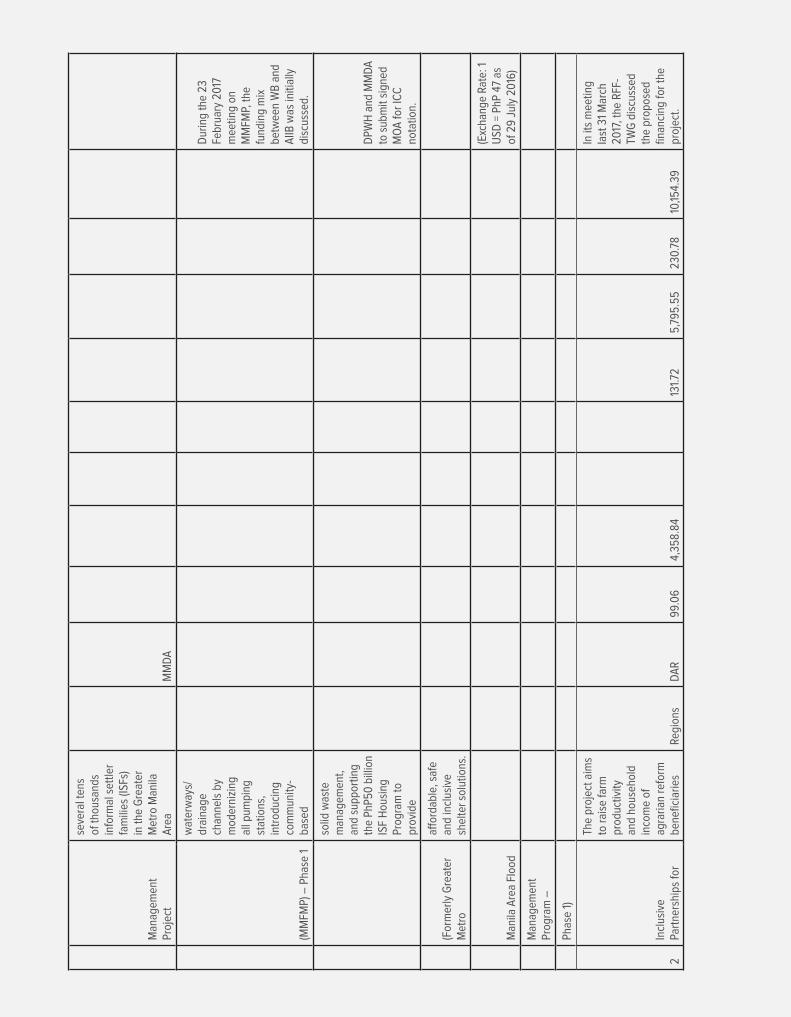
Man
agem
ent
Proj
ect
seve
ral t
ens
of th
ousa
nds
info
rmal
set
tler
fam
ilies
(ISF
s)
in th
e G
reat
er
Met
ro M
anila
A
rea
MM
DA
(MM
FMP)
– P
hase
1
wat
erw
ays/
drai
nage
ch
anne
ls b
y m
oder
nizi
ng
all p
umpi
ng
stat
ions
, in
trod
ucin
g co
mm
unity
-ba
sed
Dur
ing
the
23
Febr
uary
20
17
mee
ting
on
MM
FMP,
the
fund
ing
mix
be
twee
n W
B a
nd
AIIB
was
initi
ally
di
scus
sed.
solid
was
te
man
agem
ent,
and
supp
ortin
g th
e Ph
P50
bill
ion
ISF
Hou
sing
Pr
ogra
m to
pr
ovid
e
DPW
H a
nd M
MD
A
to s
ubm
it si
gned
M
OA
for
ICC
no
tatio
n.
(For
mer
ly G
reat
er
Met
ro
affor
dabl
e, s
afe
and
incl
usiv
e sh
elte
r sol
utio
ns.
Man
ila A
rea
Floo
d
(Exc
hang
e Ra
te: 1
U
SD =
PhP
47
as
of 2
9 Ju
ly 2
016
)
Man
agem
ent
Prog
ram
–
Phas
e 1)
2In
clus
ive
Part
ners
hips
for
The
proj
ect a
ims
to r
aise
farm
pr
oduc
tivity
an
d ho
useh
old
inco
me
of
agra
rian
refo
rm
bene
ficia
ries
Regi
ons
DA
R99
.06
4,35
8.84
131.7
25,
795.
5523
0.78
10,15
4.39
In it
s m
eetin
g la
st 3
1 M
arch
20
17, t
he R
FF-
TWG
dis
cuss
ed
the
prop
osed
fin
anci
ng fo
r th
e pr
ojec
t.
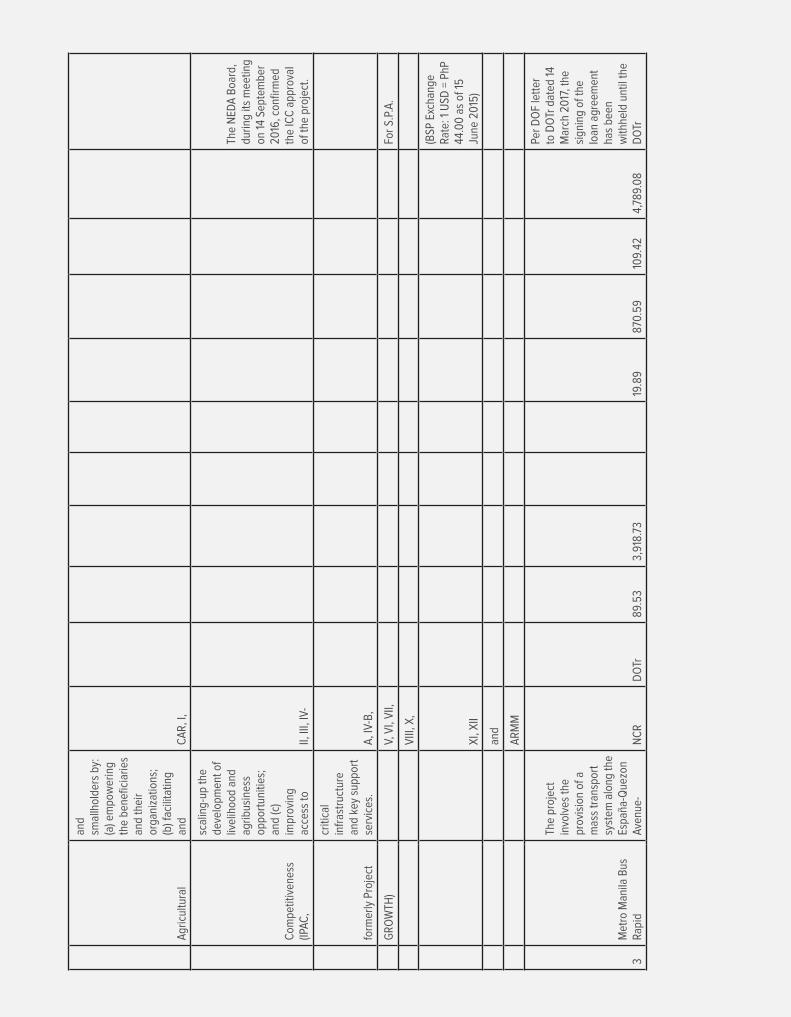
Agr
icul
tura
l
and
smal
lhol
ders
by:
(a
) em
pow
erin
g th
e be
nefic
iarie
s an
d th
eir
orga
niza
tions
; (b
) fac
ilita
ting
and
CA
R, I
,
Com
petit
iven
ess
(IPAC
,
scal
ing-
up th
e de
velo
pmen
t of
livel
ihoo
d an
d ag
ribus
ines
s op
port
uniti
es;
and
(c)
impr
ovin
g ac
cess
toII,
III,
IV-
The
NED
A B
oard
, du
ring
its m
eetin
g on
14
Sept
embe
r 20
16, c
onfir
med
th
e IC
C a
ppro
val
of th
e pr
ojec
t.
form
erly
Pro
ject
criti
cal
infr
astr
uctu
re
and
key
supp
ort
serv
ices
.A
, IV-
B,
GR
OW
TH)
V, V
I, V
II,Fo
r S.
P.A
.
VIII
, X,
XI,
XII
(BSP
Exc
hang
e Ra
te: 1
USD
= P
hP
44.0
0 a
s of
15
June
20
15)
and
AR
MM
3M
etro
Man
ila B
us
Rapi
d
The
proj
ect
invo
lves
the
prov
isio
n of
a
mas
s tr
ansp
ort
syst
em a
long
the
Espa
ña-Q
uezo
n Av
enue
-N
CR
DO
Tr89
.53
3,91
8.73
19.8
987
0.59
109.
424,
789.
08
Per
DO
F le
tter
to
DO
Tr d
ated
14
Mar
ch 2
017
, the
si
gnin
g of
the
loan
agr
eem
ent
has
been
w
ithhe
ld u
ntil
the
DO
Tr

Tran
sit (
BRT
) Lin
e 1
Com
mon
wea
lth
Aven
ue c
orrid
or
thro
ugh
high
-ca
paci
ty b
uses
ru
nnin
g on
ex
clus
ive
lane
s.
It se
eks
to
has
resp
onde
d to
cer
tain
issu
es.
Per
DO
Tr le
tter
29
Mar
ch 2
017
, th
e D
epar
tmen
t re
spon
ded
to th
e is
sues
rai
sed
(form
erly
Man
ila-
Que
zon
prov
ide
pref
eren
tial
jour
ney
times
for
publ
ic tr
ansp
ort,
as w
ell a
s im
prov
e th
e le
vel o
f ser
vice
to
the
by th
e N
EDA
-ICC
w
hen
in r
elat
ion
to c
hang
es in
pr
ojec
t sco
pe a
nd
finan
cing
; hiri
ng
of c
onsu
ltant
s fo
r th
e pr
ojec
t;
Aven
ue B
us R
apid
pass
enge
r w
hile
in v
ehic
le,
wai
ting
for
the
vehi
cle,
and
m
akin
g th
eir
way
to a
nd fr
om
the
vehi
cle.
and
plan
s an
d pr
ogra
ms
for
disp
lace
d pe
rson
s.
Tran
sit P
roje
ct)
Thro
ugh
the
conv
ersi
on o
f la
rgel
y su
b-EU
RO
veh
icle
s to
Eur
oIV,
the
proj
ect w
ill a
lso
brin
g an
un-
quan
tified
re
duct
ion
in
emis
sion
s al
ong
the
corr
idor
w
ith r
esul
tant
im
prov
emen
t in
loca
l air
qual
ity.
The
S.P.
A. w
as
issu
ed la
st 1
5 Fe
brua
ry 2
016
. Th
e m
inut
es o
f th
e ne
gotia
tion
was
sig
ned
last
21
Febr
uary
20
17.
Furt
her,
ther
e w
ill b
e a
tota
l gr
eenh
ouse
gas
em
issi
on s
avin
g of
6.2
1 m
illio
n to
nnes
ove
r th
irty
(30
)
Aw
aitin
g fo
r W
B
Boa
rd a
ppro
val b
y 17
Mar
ch 2
017
.

Tran
sit (
BRT
) Lin
e 1
Com
mon
wea
lth
Aven
ue c
orrid
or
thro
ugh
high
-ca
paci
ty b
uses
ru
nnin
g on
ex
clus
ive
lane
s.
It se
eks
to
has
resp
onde
d to
cer
tain
issu
es.
Per
DO
Tr le
tter
29
Mar
ch 2
017
, th
e D
epar
tmen
t re
spon
ded
to th
e is
sues
rai
sed
(form
erly
Man
ila-
Que
zon
prov
ide
pref
eren
tial
jour
ney
times
for
publ
ic tr
ansp
ort,
as w
ell a
s im
prov
e th
e le
vel o
f ser
vice
to
the
by th
e N
EDA
-ICC
w
hen
in r
elat
ion
to c
hang
es in
pr
ojec
t sco
pe a
nd
finan
cing
; hiri
ng
of c
onsu
ltant
s fo
r th
e pr
ojec
t;
Aven
ue B
us R
apid
pass
enge
r w
hile
in v
ehic
le,
wai
ting
for
the
vehi
cle,
and
m
akin
g th
eir
way
to a
nd fr
om
the
vehi
cle.
and
plan
s an
d pr
ogra
ms
for
disp
lace
d pe
rson
s.
Tran
sit P
roje
ct)
Thro
ugh
the
conv
ersi
on o
f la
rgel
y su
b-EU
RO
veh
icle
s to
Eur
oIV,
the
proj
ect w
ill a
lso
brin
g an
un-
quan
tified
re
duct
ion
in
emis
sion
s al
ong
the
corr
idor
w
ith r
esul
tant
im
prov
emen
t in
loca
l air
qual
ity.
The
S.P.
A. w
as
issu
ed la
st 1
5 Fe
brua
ry 2
016
. Th
e m
inut
es o
f th
e ne
gotia
tion
was
sig
ned
last
21
Febr
uary
20
17.
Furt
her,
ther
e w
ill b
e a
tota
l gr
eenh
ouse
gas
em
issi
on s
avin
g of
6.2
1 m
illio
n to
nnes
ove
r th
irty
(30
)
Aw
aitin
g fo
r W
B
Boa
rd a
ppro
val b
y 17
Mar
ch 2
017
.
year
s, o
r an
av
erag
e of
20
7,0
00
tonn
es
per
year
.
The
proj
ect w
as
appr
oved
by
the
NED
A B
oard
in
its 1
6 D
ecem
ber
2015
mee
ting.
(Exc
hang
e Ra
te:
1 U
SD =
PhP
43.7
7 as
pro
vide
d by
D
OTC
in th
eir
econ
omic
and
fin
anci
al a
ppra
isal
la
st S
ep.
2014
)
4Ph
ilipp
ines
Re
new
able
The
proj
ect
seek
s, th
roug
h a
furt
her
guar
ante
e co
ver
for
the
ongo
ing
Elec
tric
C
oope
rativ
e Pa
rtia
lN
atio
nwi
DO
E44
.00
2,20
8.54
44.0
02,
208.
54
Per
DO
E le
tter
to
WB
dat
ed
13 M
arch
20
17,
the
Dep
artm
ent
info
rmed
that
the
Pres
iden
t has
si
gned
the
SPA
for
Ener
gy
Dev
elop
men
t
Cre
dit
Gua
rant
ee
(EC
PCG
) Pr
ogra
m,
to in
crea
se
rene
wab
le
ener
gy
gene
ratio
n in
all
part
s of
the
de
DO
F an
d D
OE
to e
xecu
te w
ith
the
IBR
D th
e C
oope
ratio
n A
gree
men
t re
lativ
e to
the
PHR
ED p
roje
ct.
Proj
ect
Phili
ppin
es,
incl
udin
g in
off
-gr
id a
reas
, and
to
bol
ster
priv
ate
sect
or le
ndin
g to
ele
ctric
co
oper
ativ
es

(PH
RED
)
that
are
focu
sed
on o
pera
tiona
l an
d fin
anci
al
effici
ency
. It i
s ex
pect
ed th
at
ther
eby
ECs
will
be
abl
e to
DO
E ha
s ye
t to
sign
the
MO
A
for
guar
ante
e m
anag
er.
prov
ide
serv
ice
to m
ore
cust
omer
s an
d w
ith b
ette
r qu
ality
, whi
le a
t th
e sa
me
time
beco
min
g m
ore
cred
itwor
thy
and
ther
efor
e be
tter
ab
le to
dev
elop
an
d/or
pur
chas
e bu
lk r
enew
able
en
ergy
.
The
S.P.
A. f
or
DO
F an
d D
OE
to e
xecu
te th
e C
oope
ratio
n A
gree
men
t with
W
B a
nd o
ther
do
cum
ents
re
latin
g to
PHR
ED w
ere
issu
ed o
n 15
Se
ptem
ber
2015
.
(Exc
hang
e Ra
te: 1
U
SD =
PhP
50.19
4 So
urce
: BSP
Rat
e as
of 3
1 M
arch
20
17)
Not
e: L
oan
Com
pone
nt
amou
nt r
efer
s to
th
e gu
aran
tee
amou
nt.
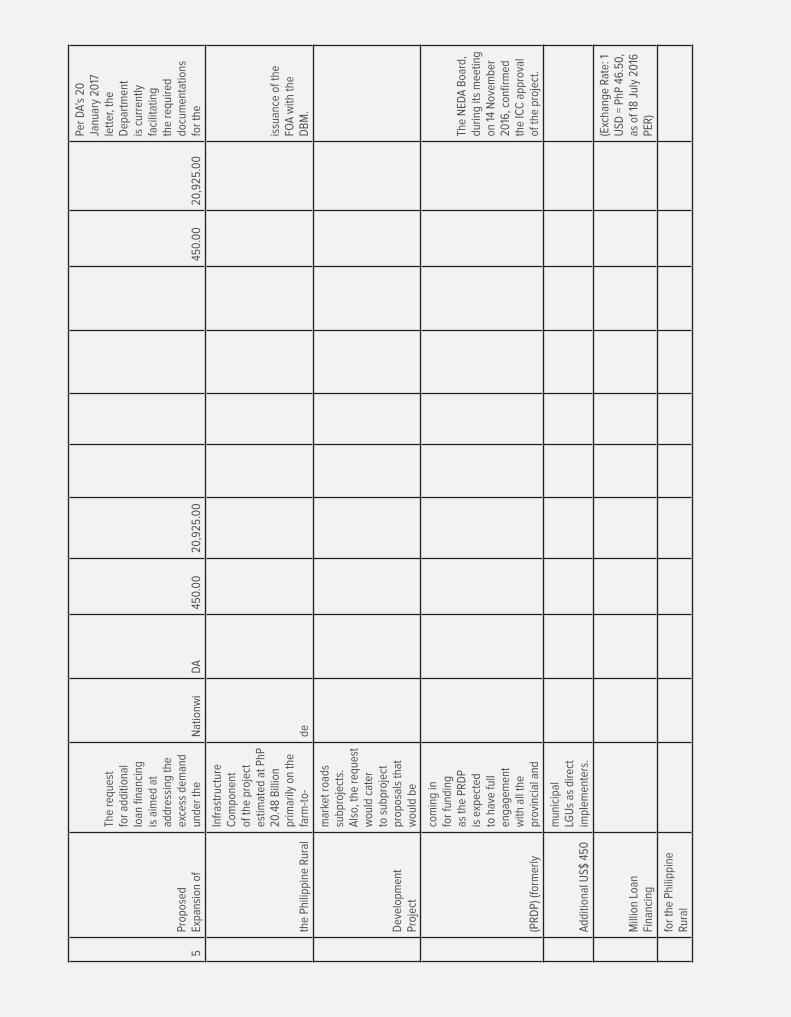
5Pr
opos
ed
Expa
nsio
n of
The
requ
est
for
addi
tiona
l lo
an fi
nanc
ing
is a
imed
at
addr
essi
ng th
e ex
cess
dem
and
unde
r th
eN
atio
nwi
DA
450.
00
20,9
25.0
045
0.0
020
,925
.00
Per
DA’
s 20
Ja
nuar
y 20
17
lett
er, t
he
Dep
artm
ent
is c
urre
ntly
fa
cilit
atin
g th
e re
quire
d do
cum
enta
tions
fo
r th
e
the
Phili
ppin
e R
ural
Infr
astr
uctu
re
Com
pone
nt
of th
e pr
ojec
t es
timat
ed a
t PhP
20
.48
Bill
ion
prim
arily
on
the
farm
-to-
de
issu
ance
of t
he
FOA
with
the
DB
M.
Dev
elop
men
t Pr
ojec
t
mar
ket r
oads
su
bpro
ject
s.
Als
o, th
e re
ques
t w
ould
cat
er
to s
ubpr
ojec
t pr
opos
als
that
w
ould
be
(PR
DP)
(for
mer
ly
com
ing
in
for
fund
ing
as th
e PR
DP
is e
xpec
ted
to h
ave
full
enga
gem
ent
with
all
the
prov
inci
al a
nd
The
NED
A B
oard
, du
ring
its m
eetin
g on
14
Nov
embe
r 20
16, c
onfir
med
th
e IC
C a
ppro
val
of th
e pr
ojec
t.
Add
ition
al U
S$ 4
50
mun
icip
al
LGU
s as
dire
ct
impl
emen
ters
.
Mill
ion
Loan
Fi
nanc
ing
(Exc
hang
e Ra
te: 1
U
SD =
PhP
46.
50,
as o
f 18
July
20
16
PER
)
for
the
Phili
ppin
e R
ural
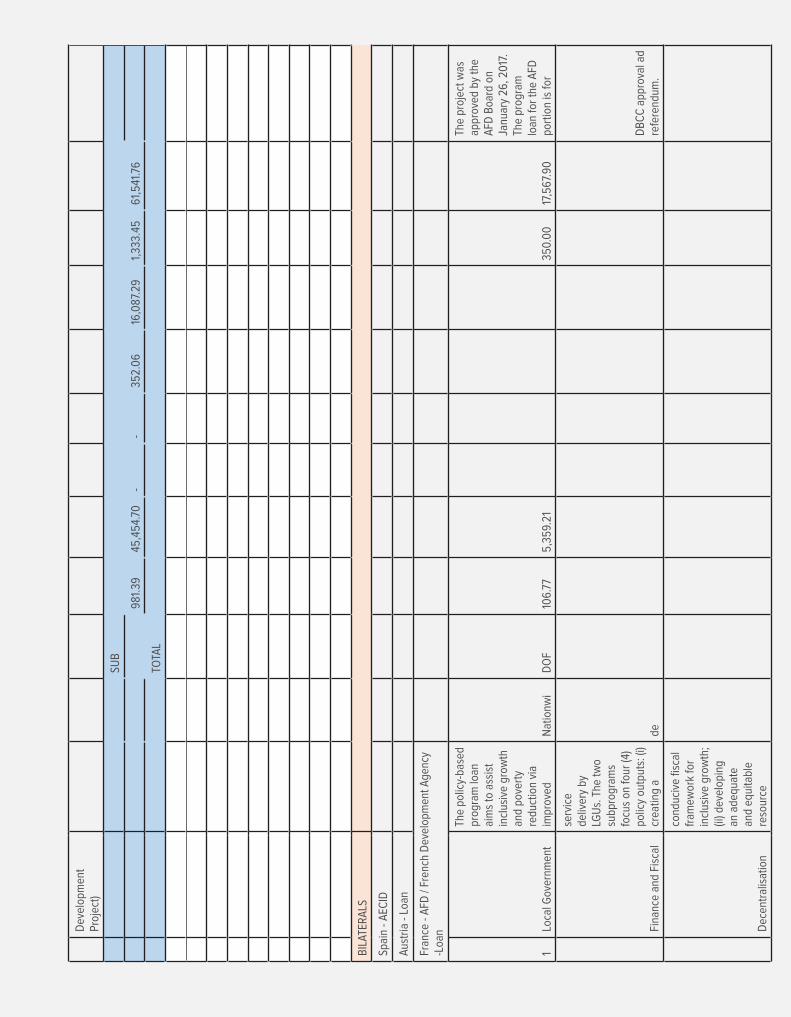
Dev
elop
men
t Pr
ojec
t)
SUB
981.
3945
,454
.70
--
352.
06
16,0
87.2
91,
333.
4561
,541
.76
TOTA
L
BIL
ATER
ALS
Spai
n - A
ECID
Aus
tria
- Lo
an
Fran
ce -
AFD
/ Fr
ench
Dev
elop
men
t Age
ncy
-Loa
n
1Lo
cal G
over
nmen
t
The
polic
y-ba
sed
prog
ram
loan
ai
ms
to a
ssis
t in
clus
ive
grow
th
and
pove
rty
redu
ctio
n vi
a im
prov
edN
atio
nwi
DO
F10
6.77
5,35
9.21
350.
00
17,5
67.9
0
The
proj
ect w
as
appr
oved
by
the
AFD
Boa
rd o
n Ja
nuar
y 26
, 20
17.
The
prog
ram
lo
an fo
r th
e A
FD
port
ion
is fo
r
Fina
nce
and
Fisc
al
serv
ice
deliv
ery
by
LGU
s. T
he tw
o su
bpro
gram
s fo
cus
on fo
ur (4
) po
licy
outp
uts:
(i)
crea
ting
ade
DB
CC
app
rova
l ad
refe
rend
um.
Dec
entr
alis
atio
n
cond
uciv
e fis
cal
fram
ewor
k fo
r in
clus
ive
grow
th;
(ii) d
evel
opin
g an
ade
quat
e an
d eq
uita
ble
reso
urce
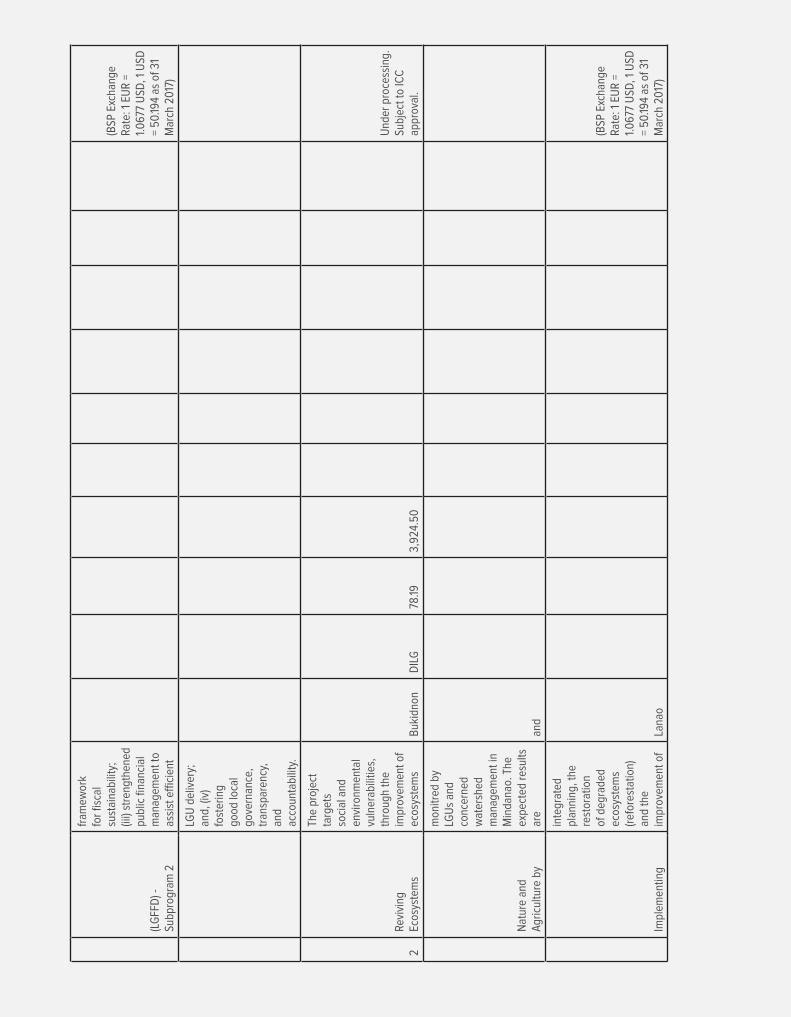
Dev
elop
men
t Pr
ojec
t)
SUB
981.
3945
,454
.70
--
352.
06
16,0
87.2
91,
333.
4561
,541
.76
TOTA
L
BIL
ATER
ALS
Spai
n - A
ECID
Aus
tria
- Lo
an
Fran
ce -
AFD
/ Fr
ench
Dev
elop
men
t Age
ncy
-Loa
n
1Lo
cal G
over
nmen
t
The
polic
y-ba
sed
prog
ram
loan
ai
ms
to a
ssis
t in
clus
ive
grow
th
and
pove
rty
redu
ctio
n vi
a im
prov
edN
atio
nwi
DO
F10
6.77
5,35
9.21
350.
00
17,5
67.9
0
The
proj
ect w
as
appr
oved
by
the
AFD
Boa
rd o
n Ja
nuar
y 26
, 20
17.
The
prog
ram
lo
an fo
r th
e A
FD
port
ion
is fo
r
Fina
nce
and
Fisc
al
serv
ice
deliv
ery
by
LGU
s. T
he tw
o su
bpro
gram
s fo
cus
on fo
ur (4
) po
licy
outp
uts:
(i)
crea
ting
ade
DB
CC
app
rova
l ad
refe
rend
um.
Dec
entr
alis
atio
n
cond
uciv
e fis
cal
fram
ewor
k fo
r in
clus
ive
grow
th;
(ii) d
evel
opin
g an
ade
quat
e an
d eq
uita
ble
reso
urce
(LG
FFD
) -
Subp
rogr
am 2
fram
ewor
k fo
r fis
cal
sust
aina
bilit
y;
(iii)
stre
ngth
ened
pu
blic
fina
ncia
l m
anag
emen
t to
assi
st e
ffici
ent
(BSP
Exc
hang
e Ra
te: 1
EU
R =
1.
067
7 U
SD, 1
USD
=
50.19
4 as
of 3
1 M
arch
20
17)
LGU
del
iver
y;
and,
(iv)
fo
ster
ing
good
loca
l go
vern
ance
, tr
ansp
aren
cy,
and
acco
unta
bilit
y.
2Re
vivi
ng
Ecos
yste
ms
The
proj
ect
targ
ets
soci
al a
nd
envi
ronm
enta
l vu
lner
abili
ties,
th
roug
h th
e im
prov
emen
t of
ecos
yste
ms
Buk
idno
nD
ILG
78.19
3,92
4.50
Und
er p
roce
ssin
g.
Subj
ect t
o IC
C
appr
oval
.
Nat
ure
and
Agr
icul
ture
by
mon
itred
by
LGU
s an
d co
ncer
ned
wat
ersh
ed
man
agem
ent i
n M
inda
nao.
The
ex
pect
ed r
esul
ts
are
and
Impl
emen
ting
inte
grat
ed
plan
ning
, the
re
stor
atio
n of
deg
rade
d ec
osys
tem
s (r
efor
esta
tion)
an
d th
e im
prov
emen
t of
Lana
o
(BSP
Exc
hang
e Ra
te: 1
EU
R =
1.
067
7 U
SD, 1
USD
=
50.19
4 as
of 3
1 M
arch
20
17)
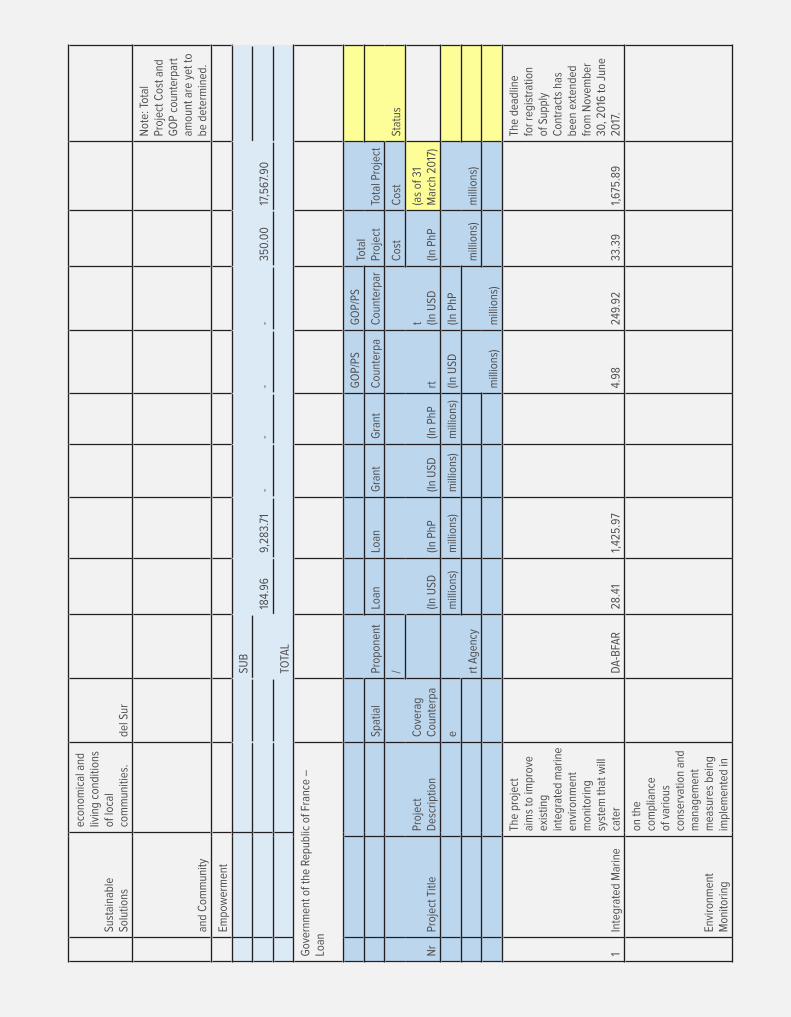
Sust
aina
ble
Solu
tions
econ
omic
al a
nd
livin
g co
nditi
ons
of lo
cal
com
mun
ities
.de
l Sur
and
Com
mun
ity
Not
e: T
otal
Pr
ojec
t Cos
t and
G
OP
coun
terp
art
amou
nt a
re y
et to
be
det
erm
ined
.
Empo
wer
men
t
SUB
184.
969,
283.
71-
--
-35
0.0
017
,567
.90
TOTA
L
Gov
ernm
ent o
f the
Rep
ublic
of F
ranc
e –
Lo
an
Prop
onen
t
GO
P/PS
GO
P/PS
Tota
l Pr
ojec
tTo
tal P
roje
ctSp
atia
lLo
anLo
anG
rant
Gra
ntC
ount
erpa
Cou
nter
par
Stat
us
Nr
Proj
ect T
itle
Proj
ect
Des
crip
tion
Cov
erag
Cou
nter
pa
/
(In U
SD(In
PhP
(In U
SD(In
PhP
rtt (In
USD
Cos
tC
ost
(In P
hP(a
s of
31
Mar
ch 2
017
)
e
rt A
genc
y
mill
ions
)m
illio
ns)
mill
ions
)m
illio
ns)
(In U
SD(In
PhP
mill
ions
)m
illio
ns)
mill
ions
)m
illio
ns)
1In
tegr
ated
Mar
ine
The
proj
ect
aim
s to
impr
ove
exis
ting
inte
grat
ed m
arin
e en
viro
nmen
t m
onito
ring
syst
em th
at w
ill
cate
rD
A-B
FAR
28.4
11,
425.
974.
9824
9.92
33.3
91,
675.
89
The
dead
line
for
regi
stra
tion
of S
uppl
y C
ontr
acts
has
be
en e
xten
ded
from
Nov
embe
r 30
, 20
16 to
Jun
e 20
17.
Envi
ronm
ent
Mon
itorin
g
on th
e co
mpl
ianc
e of
var
ious
co
nser
vatio
n an
d m
anag
emen
t m
easu
res
bein
g im
plem
ente
d in
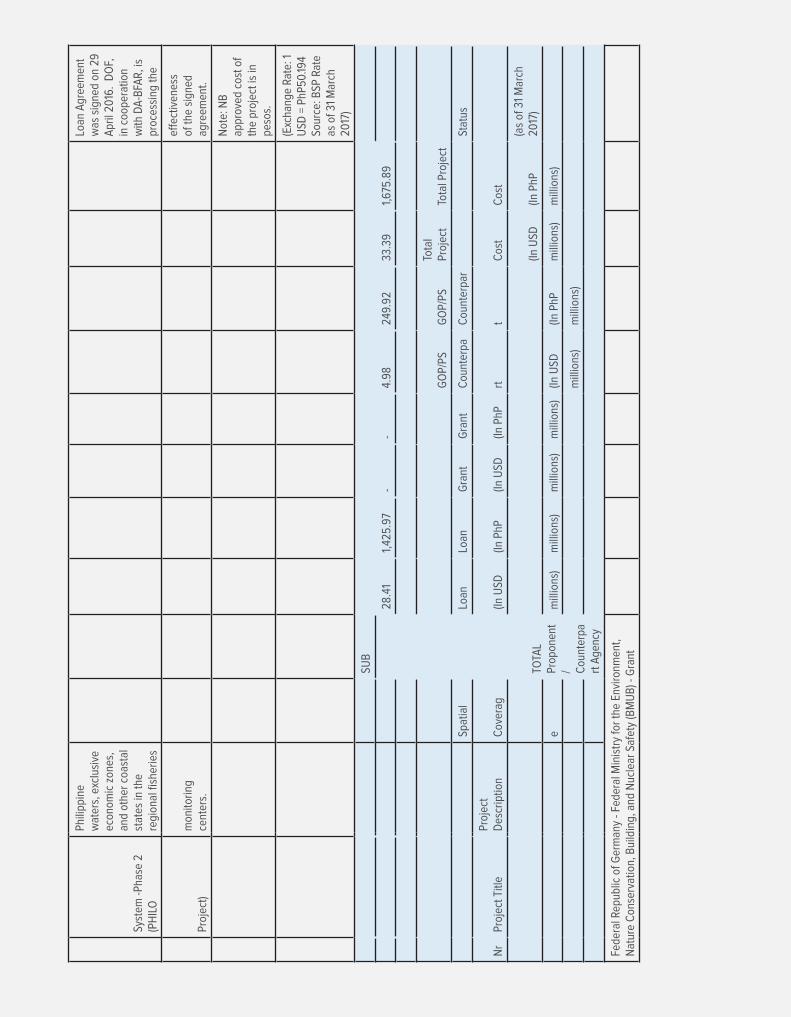
Syst
em -P
hase
2
(PH
ILO
Phili
ppin
e w
ater
s, e
xclu
sive
ec
onom
ic z
ones
, an
d ot
her
coas
tal
stat
es in
the
regi
onal
fish
erie
s
Loan
Agr
eem
ent
was
sig
ned
on 2
9 A
pril
2016
. D
OF,
in
coo
pera
tion
with
DA
-BFA
R, i
s pr
oces
sing
the
Proj
ect)
mon
itorin
g ce
nter
s.
effec
tiven
ess
of th
e si
gned
ag
reem
ent.
Not
e: N
B
appr
oved
cos
t of
the
proj
ect i
s in
pe
sos.
(Exc
hang
e Ra
te: 1
U
SD =
PhP
50.19
4 So
urce
: BSP
Rat
e as
of 3
1 M
arch
20
17)
SUB
28.4
11,
425.
97-
-4.
9824
9.92
33.3
91,
675.
89
TOTA
LPr
opon
ent
/ Cou
nter
part
Age
ncy
GO
P/PS
GO
P/PS
Tota
l Pr
ojec
tTo
tal P
roje
ct
Spat
ial
Loan
Loan
Gra
ntG
rant
Cou
nter
paC
ount
erpa
rSt
atus
Nr
Proj
ect T
itle
Proj
ect
Des
crip
tion
Cov
erag
(In U
SD(In
PhP
(In U
SD(In
PhP
rtt
Cos
tC
ost
(In U
SD(In
PhP
(as
of 3
1 M
arch
20
17)
em
illio
ns)
mill
ions
)m
illio
ns)
mill
ions
)(In
USD
(In P
hPm
illio
ns)
mill
ions
)
mill
ions
)m
illio
ns)
Fede
ral R
epub
lic o
f Ger
man
y - F
eder
al M
inis
try
for
the
Envi
ronm
ent,
Nat
ure
Con
serv
atio
n, B
uild
ing,
and
Nuc
lear
Saf
ety
(BM
UB
) - G
rant
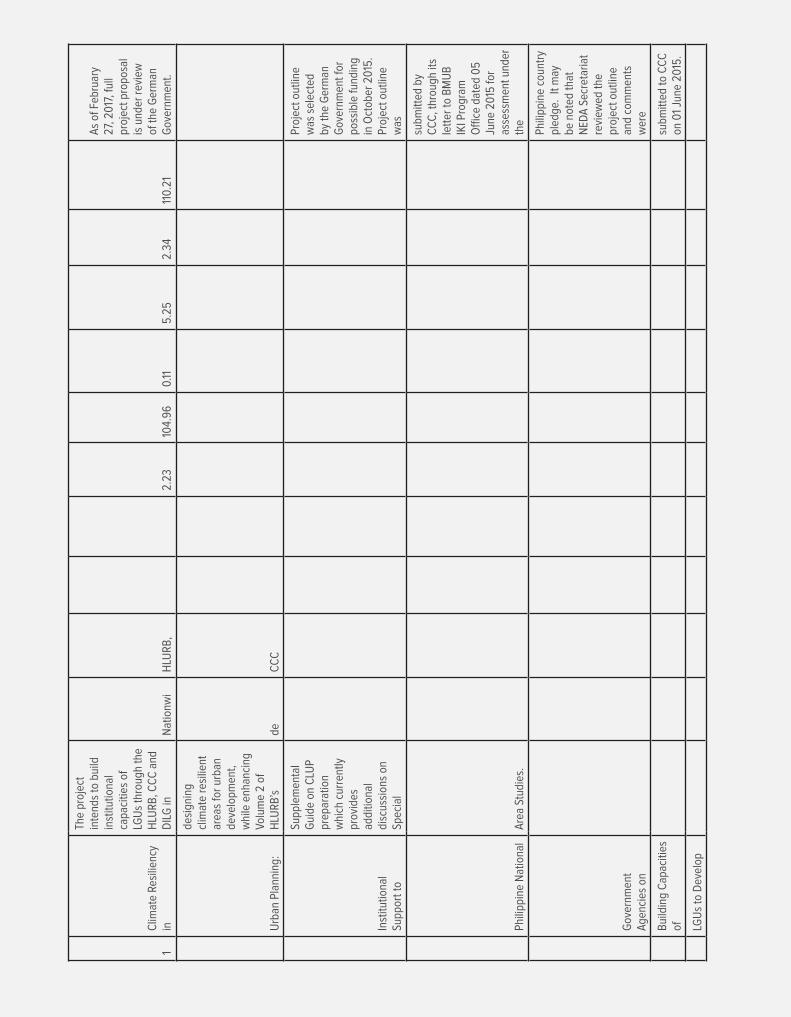
1C
limat
e Re
silie
ncy
in
The
proj
ect
inte
nds
to b
uild
in
stitu
tiona
l ca
paci
ties
of
LGU
s th
roug
h th
e H
LUR
B, C
CC
and
D
ILG
inN
atio
nwi
HLU
RB
,2.
2310
4.96
0.11
5.25
2.34
110.
21
As
of F
ebru
ary
27, 2
017
, ful
l pr
ojec
t pro
posa
l is
und
er r
evie
w
of th
e G
erm
an
Gov
ernm
ent.
Urb
an P
lann
ing:
desi
gnin
g cl
imat
e re
silie
nt
area
s fo
r ur
ban
deve
lopm
ent,
whi
le e
nhan
cing
Vo
lum
e 2
of
HLU
RB
’sde
CC
C
Inst
itutio
nal
Supp
ort t
o
Supp
lem
enta
l G
uide
on
CLU
P pr
epar
atio
n w
hich
cur
rent
ly
prov
ides
ad
ditio
nal
disc
ussi
ons
on
Spec
ial
Proj
ect o
utlin
e w
as s
elec
ted
by th
e G
erm
an
Gov
ernm
ent f
or
poss
ible
fund
ing
in O
ctob
er 2
015
. Pr
ojec
t out
line
was
Phili
ppin
e N
atio
nal
Are
a St
udie
s.
subm
itted
by
CC
C, t
hrou
gh it
s le
tter
to B
MU
B
IKI P
rogr
am
Offi
ce d
ated
05
June
20
15 fo
r as
sess
men
t und
er
the
Gov
ernm
ent
Age
ncie
s on
Phili
ppin
e co
untr
y pl
edge
. It
may
be
not
ed th
at
NED
A S
ecre
taria
t re
view
ed th
e pr
ojec
t out
line
and
com
men
ts
wer
e
Bui
ldin
g C
apac
ities
of
subm
itted
to C
CC
on
01
June
20
15.
LGU
s to
Dev
elop
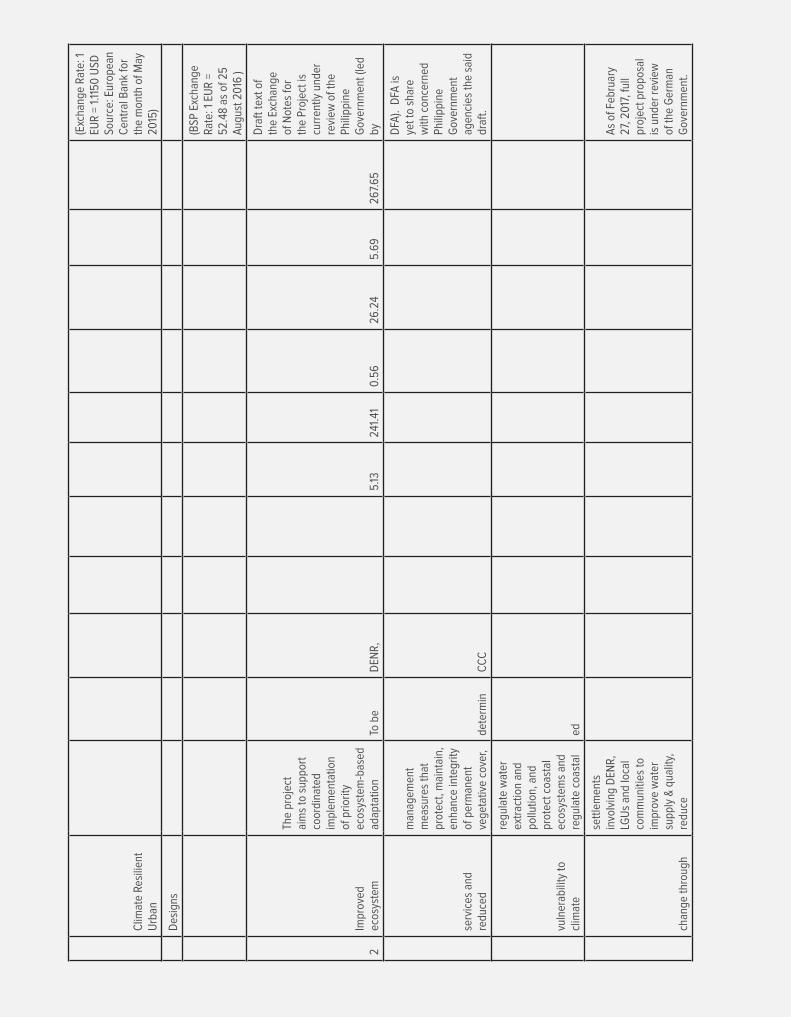
Clim
ate
Resi
lient
U
rban
(Exc
hang
e Ra
te: 1
EU
R =
1.11
50 U
SD
Sour
ce: E
urop
ean
Cen
tral
Ban
k fo
r th
e m
onth
of M
ay
2015
)
Des
igns
(BSP
Exc
hang
e Ra
te: 1
EU
R =
52
.48
as o
f 25
Aug
ust 2
016
)
2Im
prov
ed
ecos
yste
m
The
proj
ect
aim
s to
sup
port
co
ordi
nate
d im
plem
enta
tion
of p
riorit
y ec
osys
tem
-bas
ed
adap
tatio
nTo
be
DEN
R,
5.13
241.
410.
5626
.24
5.69
267.
65
Dra
ft te
xt o
f th
e Ex
chan
ge
of N
otes
for
the
Proj
ect i
s cu
rren
tly u
nder
re
view
of t
he
Phili
ppin
e G
over
nmen
t (le
d by
serv
ices
and
re
duce
d
man
agem
ent
mea
sure
s th
at
prot
ect,
mai
ntai
n,
enha
nce
inte
grity
of
per
man
ent
vege
tativ
e co
ver,
dete
rmin
CC
C
DFA
). D
FA is
ye
t to
shar
e w
ith c
once
rned
Ph
ilipp
ine
Gov
ernm
ent
agen
cies
the
said
dr
aft.
vuln
erab
ility
to
clim
ate
regu
late
wat
er
extr
actio
n an
d po
llutio
n, a
nd
prot
ect c
oast
al
ecos
yste
ms
and
regu
late
coa
stal
ed
chan
ge th
roug
h
sett
lem
ents
in
volv
ing
DEN
R,
LGU
s an
d lo
cal
com
mun
ities
to
impr
ove
wat
er
supp
ly &
qua
lity,
re
duce
As
of F
ebru
ary
27, 2
017
, ful
l pr
ojec
t pro
posa
l is
und
er r
evie
w
of th
e G
erm
an
Gov
ernm
ent.

ecos
yste
m-b
ased
disa
ster
ris
k &
pro
tect
bi
odiv
ersi
ty in
2
river
bas
ins/
wat
ersh
eds.
It
also
aim
s to
use
ec
osys
tem
man
agem
ent a
nd
serv
ices
ben
efits
as
bas
es to
se
cure
fina
ncia
l &
inst
itutio
nal
arra
ngem
ents
. C
entr
al to
this
pr
ojec
t are
The
NED
A
Secr
etar
iat,
in it
s le
tter
dat
ed 2
3 Fe
brua
ry 2
016
, pr
ovid
ed it
s co
mm
ents
on
the
expe
cted
out
puts
of
the
appl
icat
ion
of
ecos
yste
m
capa
city
de
velo
pmen
t &
kno
wle
dge
man
agem
ent f
or
sust
aina
bilit
y.
prop
osal
, as
prov
ided
by
GIZ
th
roug
h its
11
Febr
uary
20
16.
On
7 M
arch
20
16,
DEN
R e
ndor
sed
the
prop
osal
.
valu
es in
2 r
iver
ba
sins
in
the
Phili
ppin
es
Proj
ect o
utlin
e w
as s
elec
ted
by th
e G
erm
an
Gov
ernm
ent f
or
poss
ible
fund
ing
in O
ctob
er 2
015
. Pr
ojec
t out
line
was
subm
itted
by
CC
C, t
hrou
gh it
s le
tter
to B
MU
B
IKI P
rogr
am
Offi
ce d
ated
05
June
20
15 fo
r as
sess
men
t und
er
the
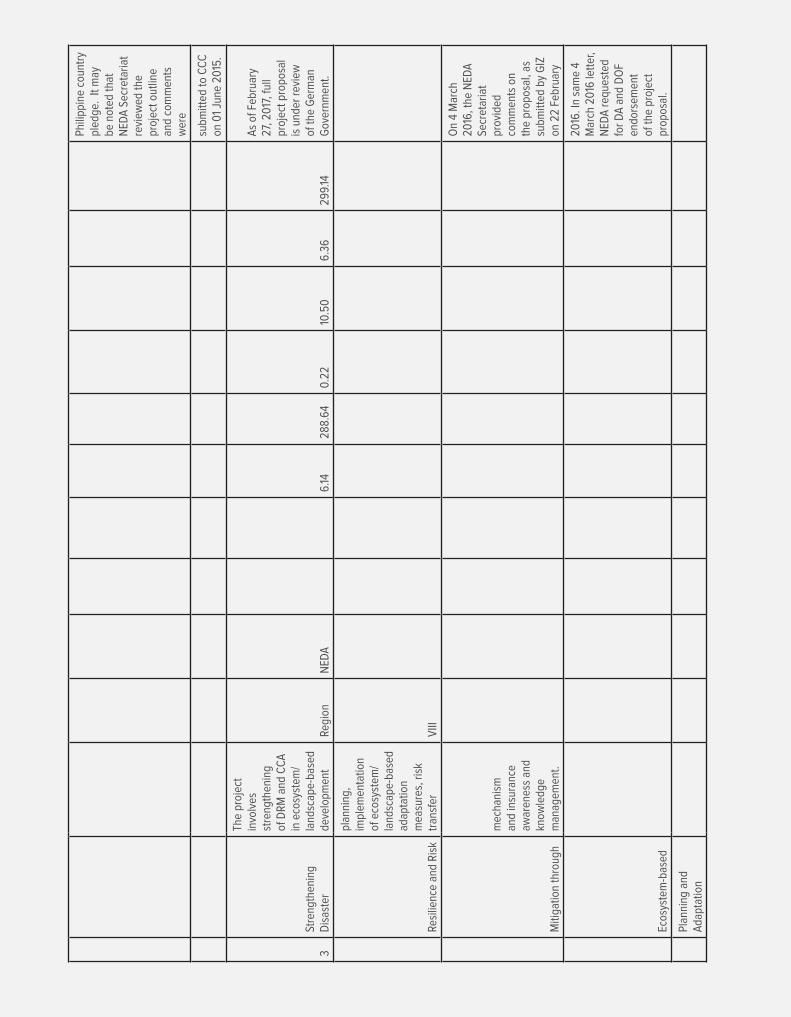
Phili
ppin
e co
untr
y pl
edge
. It
may
be
not
ed th
at
NED
A S
ecre
taria
t re
view
ed th
e pr
ojec
t out
line
and
com
men
ts
wer
e
subm
itted
to C
CC
on
01
June
20
15.
3St
reng
then
ing
Dis
aste
r
The
proj
ect
invo
lves
st
reng
then
ing
of D
RM
and
CC
A
in e
cosy
stem
/la
ndsc
ape-
base
d de
velo
pmen
tRe
gion
NED
A6.
1428
8.64
0.22
10.5
06.
3629
9.14
As
of F
ebru
ary
27, 2
017
, ful
l pr
ojec
t pro
posa
l is
und
er r
evie
w
of th
e G
erm
an
Gov
ernm
ent.
Resi
lienc
e an
d R
isk
plan
ning
, im
plem
enta
tion
of e
cosy
stem
/la
ndsc
ape-
base
d ad
apta
tion
mea
sure
s, r
isk
tran
sfer
VIII
Miti
gatio
n th
roug
h
mec
hani
sm
and
insu
ranc
e aw
aren
ess
and
know
ledg
e m
anag
emen
t.
On
4 M
arch
20
16, t
he N
EDA
Se
cret
aria
t pr
ovid
ed
com
men
ts o
n th
e pr
opos
al, a
s su
bmitt
ed b
y G
IZ
on 2
2 Fe
brua
ry
Ecos
yste
m-b
ased
2016
. In
sam
e 4
Mar
ch 2
016
lett
er,
NED
A r
eque
sted
fo
r D
A a
nd D
OF
endo
rsem
ent
of th
e pr
ojec
t pr
opos
al.
Plan
ning
and
A
dapt
atio
n

Proj
ect o
utlin
e w
as s
elec
ted
by th
e G
erm
an
Gov
ernm
ent f
or
poss
ible
fund
ing
in O
ctob
er 2
015
. Pr
ojec
t out
line
was
subm
itted
by
CC
C, t
hrou
gh it
s le
tter
to B
MU
B
IKI P
rogr
am
Offi
ce d
ated
05
June
20
15 fo
r as
sess
men
t und
er
the
Phili
ppin
e co
untr
y pl
edge
. It
may
be
not
ed th
at
NED
A S
ecre
taria
t re
view
ed th
e pr
ojec
t out
line
and
com
men
ts
wer
e
subm
itted
to C
CC
on
01
June
20
15.
(Exc
hang
e Ra
te: 1
EU
R =
1.11
50 U
SD
Sour
ce: E
urop
ean
Cen
tral
Ban
k fo
r th
e m
onth
of M
ay
2015
)
(BSP
Exc
hang
e Ra
te: 1
EU
R =
52
.48
as o
f 25
Aug
ust 2
016
)
4To
war
ds a
Sou
th-
Sout
h
The
Proj
ect
aim
s to
faci
litat
e co
llabo
ratio
n on
clim
ate
info
rmat
ion
and
serv
ices
by
key
acto
rs in
the
Nat
ionw
iC
CC
,5.
5826
2.40
1.90
89.2
27.
4735
1.62
As
of F
ebru
ary
27,
2017
, dra
ft te
xt
of th
e Ex
chan
ge
of N
otes
for
the
Proj
ect i
s cu
rren
tly u
nder
re
view
of t
he
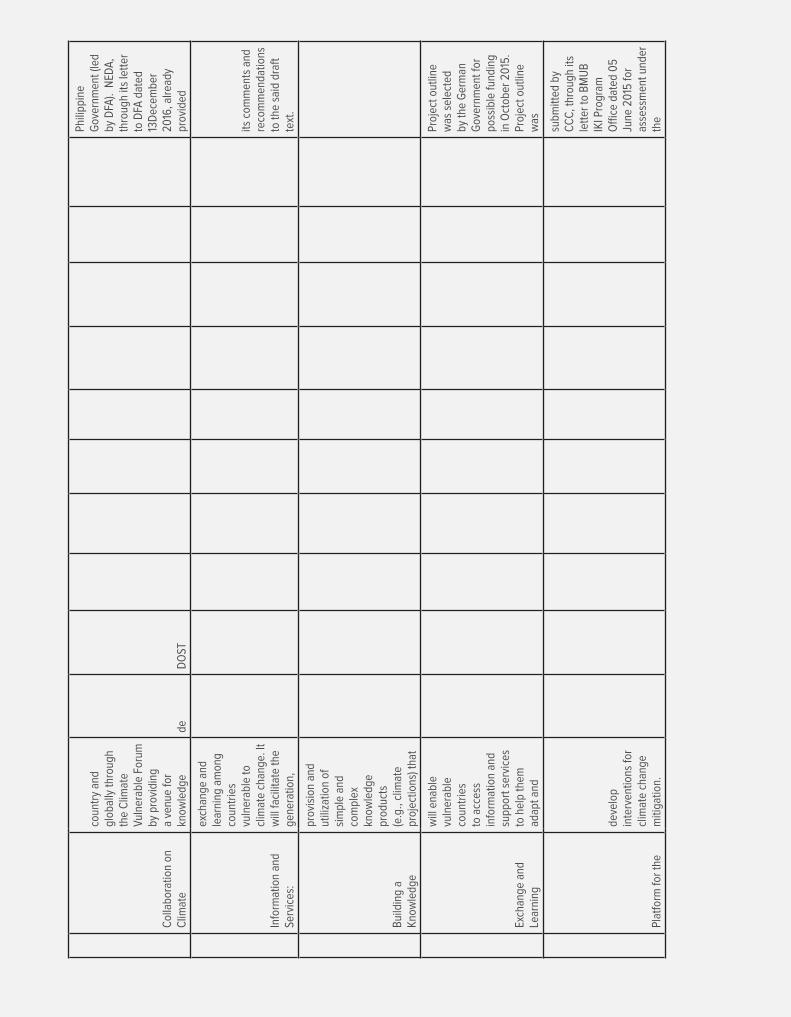
Proj
ect o
utlin
e w
as s
elec
ted
by th
e G
erm
an
Gov
ernm
ent f
or
poss
ible
fund
ing
in O
ctob
er 2
015
. Pr
ojec
t out
line
was
subm
itted
by
CC
C, t
hrou
gh it
s le
tter
to B
MU
B
IKI P
rogr
am
Offi
ce d
ated
05
June
20
15 fo
r as
sess
men
t und
er
the
Phili
ppin
e co
untr
y pl
edge
. It
may
be
not
ed th
at
NED
A S
ecre
taria
t re
view
ed th
e pr
ojec
t out
line
and
com
men
ts
wer
e
subm
itted
to C
CC
on
01
June
20
15.
(Exc
hang
e Ra
te: 1
EU
R =
1.11
50 U
SD
Sour
ce: E
urop
ean
Cen
tral
Ban
k fo
r th
e m
onth
of M
ay
2015
)
(BSP
Exc
hang
e Ra
te: 1
EU
R =
52
.48
as o
f 25
Aug
ust 2
016
)
4To
war
ds a
Sou
th-
Sout
h
The
Proj
ect
aim
s to
faci
litat
e co
llabo
ratio
n on
clim
ate
info
rmat
ion
and
serv
ices
by
key
acto
rs in
the
Nat
ionw
iC
CC
,5.
5826
2.40
1.90
89.2
27.
4735
1.62
As
of F
ebru
ary
27,
2017
, dra
ft te
xt
of th
e Ex
chan
ge
of N
otes
for
the
Proj
ect i
s cu
rren
tly u
nder
re
view
of t
he
Col
labo
ratio
n on
C
limat
e
coun
try
and
glob
ally
thro
ugh
the
Clim
ate
Vuln
erab
le F
orum
by
pro
vidi
ng
a ve
nue
for
know
ledg
ede
DO
ST
Phili
ppin
e G
over
nmen
t (le
d by
DFA
). N
EDA
, th
roug
h its
lett
er
to D
FA d
ated
13
Dec
embe
r 20
16, a
lread
y pr
ovid
ed
Info
rmat
ion
and
Serv
ices
:
exch
ange
and
le
arni
ng a
mon
g co
untr
ies
vuln
erab
le to
cl
imat
e ch
ange
. It
will
faci
litat
e th
e ge
nera
tion,
its c
omm
ents
and
re
com
men
datio
ns
to th
e sa
id d
raft
te
xt.
Bui
ldin
g a
Kno
wle
dge
prov
isio
n an
d ut
iliza
tion
of
sim
ple
and
com
plex
kn
owle
dge
prod
ucts
(e
.g.,
clim
ate
proj
ectio
ns) t
hat
Exch
ange
and
Le
arni
ng
will
ena
ble
vuln
erab
le
coun
trie
s to
acc
ess
info
rmat
ion
and
supp
ort s
ervi
ces
to h
elp
them
ad
apt a
nd
Proj
ect o
utlin
e w
as s
elec
ted
by th
e G
erm
an
Gov
ernm
ent f
or
poss
ible
fund
ing
in O
ctob
er 2
015
. Pr
ojec
t out
line
was
Plat
form
for
the
deve
lop
inte
rven
tions
for
clim
ate
chan
ge
miti
gatio
n.
subm
itted
by
CC
C, t
hrou
gh it
s le
tter
to B
MU
B
IKI P
rogr
am
Offi
ce d
ated
05
June
20
15 fo
r as
sess
men
t und
er
the
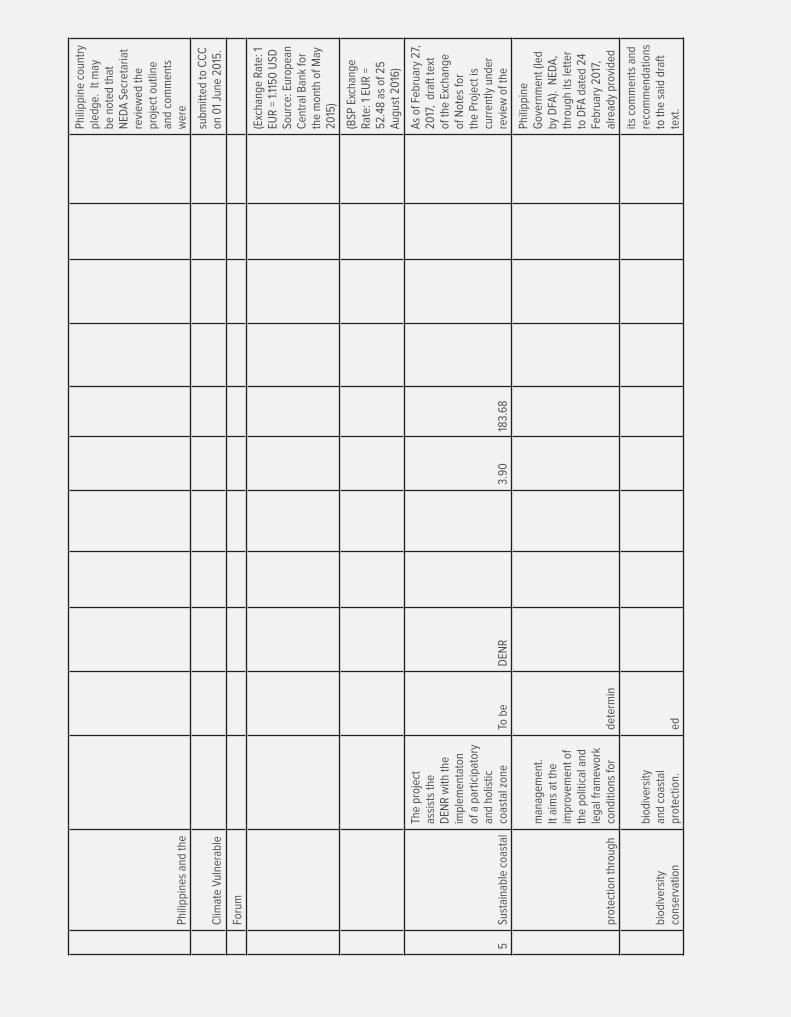
Phili
ppin
es a
nd th
e
Phili
ppin
e co
untr
y pl
edge
. It
may
be
not
ed th
at
NED
A S
ecre
taria
t re
view
ed th
e pr
ojec
t out
line
and
com
men
ts
wer
e
Clim
ate
Vuln
erab
lesu
bmitt
ed to
CC
C
on 0
1 Ju
ne 2
015
.
Foru
m
(Exc
hang
e Ra
te: 1
EU
R =
1.11
50 U
SD
Sour
ce: E
urop
ean
Cen
tral
Ban
k fo
r th
e m
onth
of M
ay
2015
)
(BSP
Exc
hang
e Ra
te: 1
EU
R =
52
.48
as o
f 25
Aug
ust 2
016
)
5Su
stai
nabl
e co
asta
l
The
proj
ect
assi
sts
the
DEN
R w
ith th
e im
plem
enta
ton
of a
par
ticip
ator
y an
d ho
listic
co
asta
l zon
eTo
be
DEN
R3.
9018
3.68
As
of F
ebru
ary
27,
2017
, dr
aft t
ext
of th
e Ex
chan
ge
of N
otes
for
the
Proj
ect i
s cu
rren
tly u
nder
re
view
of t
he
prot
ectio
n th
roug
h
man
agem
ent.
It
aim
s at
the
impr
ovem
ent o
f th
e po
litic
al a
nd
lega
l fra
mew
ork
cond
ition
s fo
rde
term
in
Phili
ppin
e G
over
nmen
t (le
d by
DFA
). N
EDA
, th
roug
h its
lett
er
to D
FA d
ated
24
Febr
uary
20
17,
alre
ady
prov
ided
biod
iver
sity
co
nser
vatio
n
biod
iver
sity
an
d co
asta
l pr
otec
tion.
ed
its c
omm
ents
and
re
com
men
datio
ns
to th
e sa
id d
raft
te
xt.

in c
oast
al
ecos
yste
ms
affec
ted
by
typh
oons
in
DFA
, thr
ough
its
Not
e N
o. 1
5-34
07
date
d 11
Aug
ust
2015
con
firm
ed
Phili
ppin
e G
over
nmen
t in
tere
st to
pa
rtic
ipat
e
the
Phili
ppin
es
in th
e pr
ojec
t.
NED
A, t
hrou
gh
its le
tter
to D
FA
date
d 28
Jul
y 20
15, p
osed
no
obje
ctio
n to
the
Phili
ppin
e
(Pro
Coa
st)
Gov
ernm
ent’s
co
nfirm
atio
n of
in
tere
st o
n th
e pr
opos
ed p
roje
ct.
(Exc
hang
e Ra
te: 1
EU
R =
1.11
50 U
SD
Sour
ce: E
urop
ean
Cen
tral
Ban
k fo
r th
e m
onth
of M
ay
2015
)
(BSP
Exc
hang
e Ra
te: 1
EU
R =
52
.48
as o
f 25
Aug
ust 2
016
)
Not
e: T
otal
Pr
ojec
t Cos
t and
G
OP
coun
terp
art
amou
nt a
re y
et to
be
det
erm
ined
.
6Fi
nanc
ing
and
Inte
grat
ing
The
proj
ect
aim
s to
impr
ove
capa
citie
s of
key
st
akeh
olde
rs
in B
utua
n C
ity
and
finan
cing
in
stitu
tions
Car
aga
WW
F0.
6129
.59
0.12
5.92
0.73
35.5
1
As
of F
ebru
ary
27, 2
017
, ful
l pr
ojec
t pro
posa
l is
und
er r
evie
w
of th
e G
erm
an
Gov
ernm
ent.
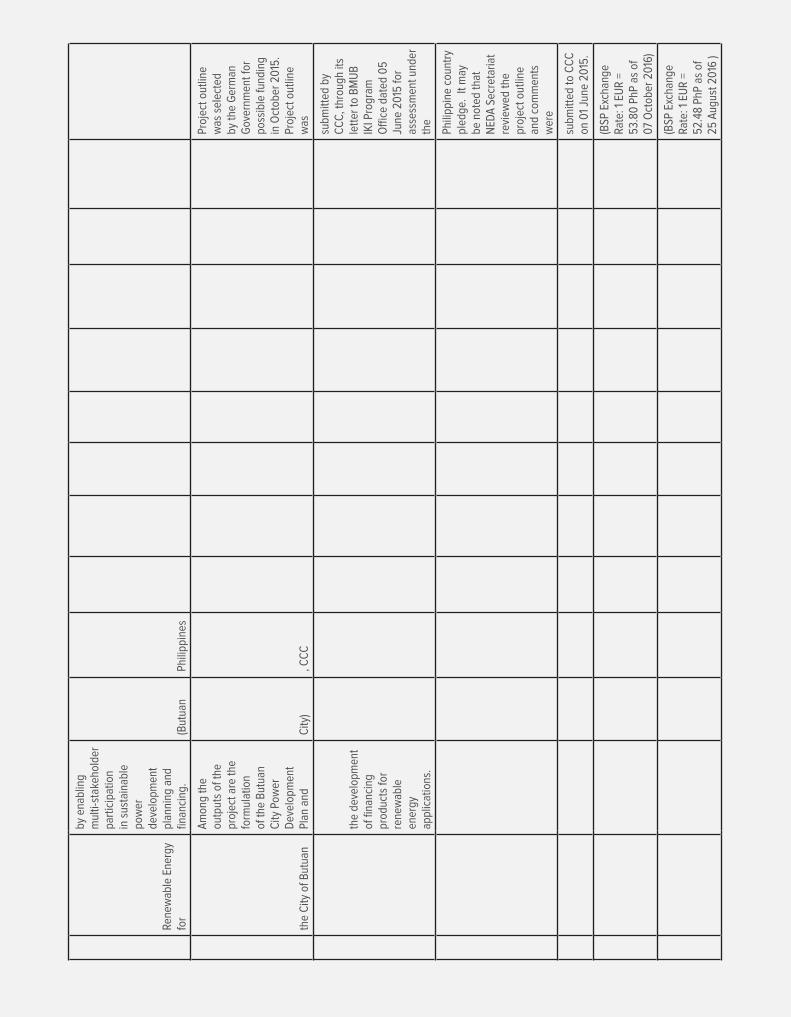
Rene
wab
le E
nerg
y fo
r
by e
nabl
ing
mul
ti-st
akeh
olde
r pa
rtic
ipat
ion
in s
usta
inab
le
pow
er
deve
lopm
ent
plan
ning
and
fin
anci
ng.
(But
uan
Phili
ppin
es
the
City
of B
utua
n
Am
ong
the
outp
uts
of th
e pr
ojec
t are
the
form
ulat
ion
of th
e B
utua
n C
ity P
ower
D
evel
opm
ent
Plan
and
City
), C
CC
Proj
ect o
utlin
e w
as s
elec
ted
by th
e G
erm
an
Gov
ernm
ent f
or
poss
ible
fund
ing
in O
ctob
er 2
015
. Pr
ojec
t out
line
was
the
deve
lopm
ent
of fi
nanc
ing
prod
ucts
for
rene
wab
le
ener
gy
appl
icat
ions
.
subm
itted
by
CC
C, t
hrou
gh it
s le
tter
to B
MU
B
IKI P
rogr
am
Offi
ce d
ated
05
June
20
15 fo
r as
sess
men
t und
er
the
Phili
ppin
e co
untr
y pl
edge
. It
may
be
not
ed th
at
NED
A S
ecre
taria
t re
view
ed th
e pr
ojec
t out
line
and
com
men
ts
wer
e
subm
itted
to C
CC
on
01
June
20
15.
(BSP
Exc
hang
e Ra
te: 1
EU
R =
53
.80
PhP
as
of
07
Oct
ober
20
16)
(BSP
Exc
hang
e Ra
te: 1
EU
R =
52
.48
PhP
as o
f 25
Aug
ust 2
016
)
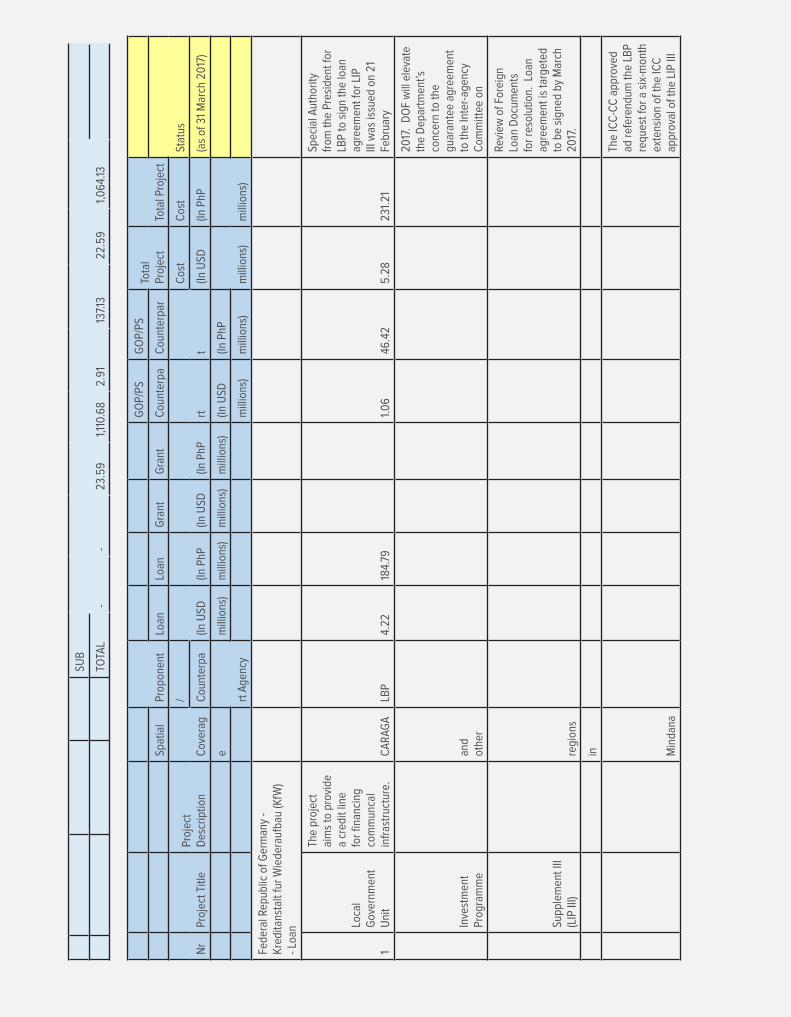
SUB
--
23.5
91,1
10.6
82.
9113
7.13
22.5
91,
064
.13TO
TAL
Prop
onen
t
GO
P/PS
GO
P/PS
Tota
l Pr
ojec
tTo
tal P
roje
ctSp
atia
lLo
anLo
anG
rant
Gra
ntC
ount
erpa
Cou
nter
par
Stat
us
Nr
Proj
ect T
itle
Proj
ect
Des
crip
tion
Cov
erag
/
(In U
SD(In
PhP
(In U
SD(In
PhP
rtt
Cos
tC
ost
Cou
nter
pa(In
USD
(In P
hP(a
s of
31
Mar
ch 2
017
)
e
rt A
genc
y
mill
ions
)m
illio
ns)
mill
ions
)m
illio
ns)
(In U
SD(In
PhP
mill
ions
)m
illio
ns)
mill
ions
)m
illio
ns)
Fede
ral R
epub
lic o
f Ger
man
y -
Kre
dita
nsta
lt fu
r W
iede
raufb
au (K
fW)
- Loa
n
1
Loca
l G
over
nmen
t U
nit
The
proj
ect
aim
s to
pro
vide
a
cred
it lin
e fo
r fin
anci
ng
com
mun
cal
infr
astr
uctu
re.
CA
RAG
ALB
P4.
2218
4.79
1.0
646
.42
5.28
231.
21
Spec
ial A
utho
rity
from
the
Pres
iden
t for
LB
P to
sig
n th
e lo
an
agre
emen
t for
LIP
III
was
issu
ed o
n 21
Fe
brua
ry
Inve
stm
ent
Prog
ram
me
and
othe
r
2017
. D
OF
will
ele
vate
th
e D
epar
tmen
t’s
conc
ern
to th
e gu
aran
tee
agre
emen
t to
the
Inte
r-ag
ency
C
omm
ittee
on
Supp
lem
ent I
II (L
IP II
I)re
gion
s
Revi
ew o
f For
eign
Lo
an D
ocum
ents
fo
r re
solu
tion.
Loa
n ag
reem
ent i
s ta
rget
ed
to b
e si
gned
by
Mar
ch
2017
.
in Min
dana
The
ICC
-CC
app
rove
d ad
ref
eren
dum
the
LBP
requ
est f
or a
six
-mon
th
exte
nsio
n of
the
ICC
ap
prov
al o
f the
LIP
III
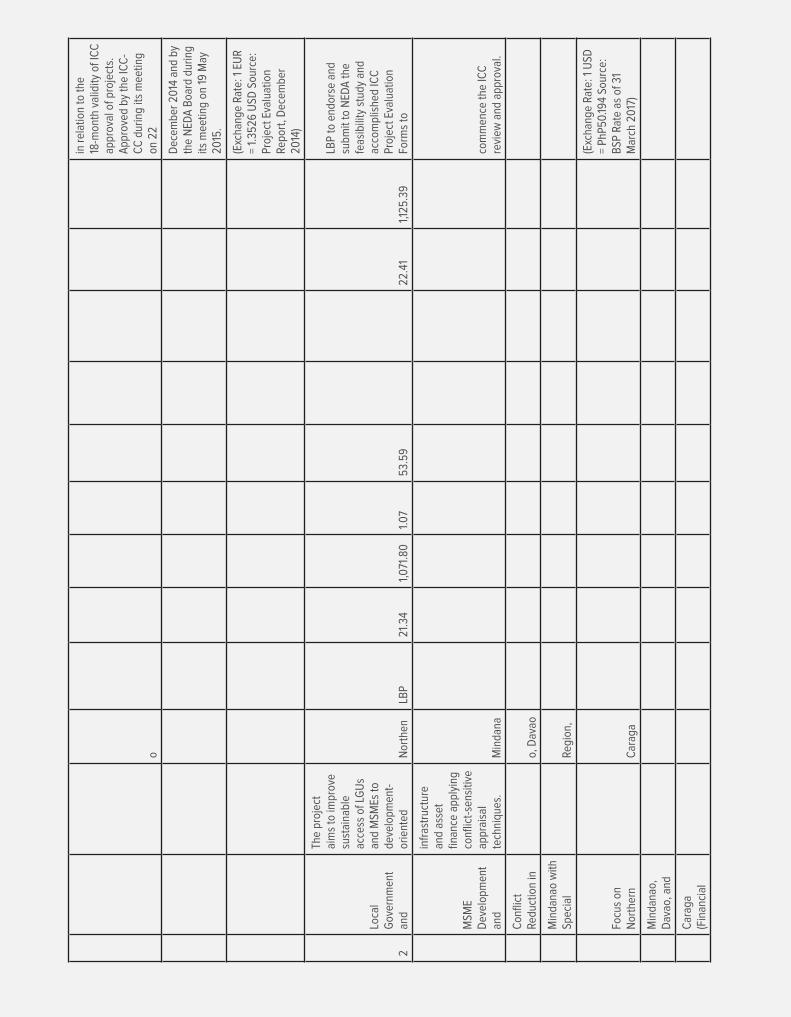
o
in r
elat
ion
to th
e 18
-mon
th v
alid
ity o
f IC
C
appr
oval
of p
roje
cts.
A
ppro
ved
by th
e IC
C-
CC
dur
ing
its m
eetin
g on
22
Dec
embe
r 20
14 a
nd b
y th
e N
EDA
Boa
rd d
urin
g its
mee
ting
on 1
9 M
ay
2015
.
(Exc
hang
e Ra
te: 1
EU
R
= 1.
3526
USD
Sou
rce:
Pr
ojec
t Eva
luat
ion
Repo
rt, D
ecem
ber
2014
)
2
Loca
l G
over
nmen
t an
d
The
proj
ect
aim
s to
impr
ove
sust
aina
ble
acce
ss o
f LG
Us
and
MSM
Es to
de
velo
pmen
t-or
ient
edN
orth
enLB
P21
.34
1,0
71.8
01.
07
53.5
922
.41
1,125
.39
LBP
to e
ndor
se a
nd
subm
it to
NED
A th
e fe
asib
ility
stu
dy a
nd
acco
mpl
ishe
d IC
C
Proj
ect E
valu
atio
n Fo
rms
to
MSM
E D
evel
opm
ent
and
infr
astr
uctu
re
and
asse
t fin
ance
app
lyin
g co
nflic
t-se
nsiti
ve
appr
aisa
l te
chni
ques
.M
inda
naco
mm
ence
the
ICC
re
view
and
app
rova
l.
Con
flict
Re
duct
ion
ino,
Dav
ao
Min
dana
o w
ith
Spec
ial
Regi
on,
Focu
s on
N
orth
ern
Car
aga
(Exc
hang
e Ra
te: 1
USD
=
PhP5
0.19
4 So
urce
: B
SP R
ate
as o
f 31
Mar
ch 2
017
)
Min
dana
o,
Dav
ao, a
nd
Car
aga
(Fin
anci
al
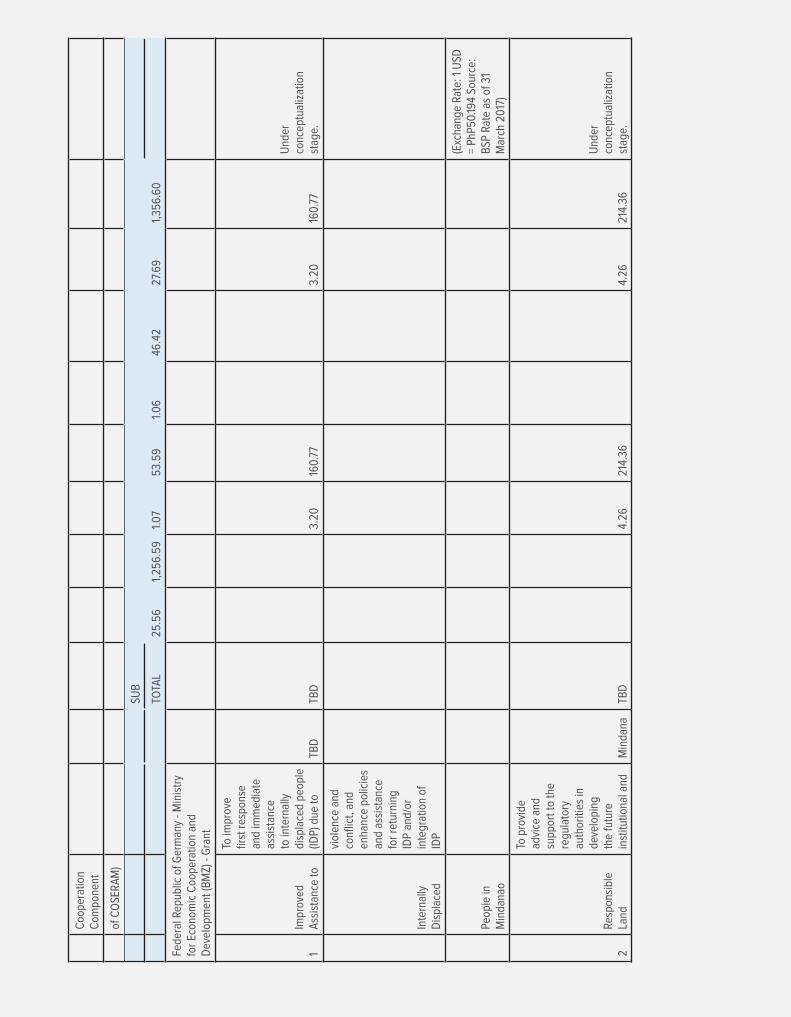
Coo
pera
tion
Com
pone
nt
of C
OSE
RA
M)
SUB
25.5
61,
256.
591.
07
53.5
91.
06
46.4
227
.69
1,35
6.60
TOTA
L
Fede
ral R
epub
lic o
f Ger
man
y - M
inis
try
for
Econ
omic
Coo
pera
tion
and
Dev
elop
men
t (B
MZ)
- G
rant
1Im
prov
ed
Ass
ista
nce
to
To im
prov
e fir
st r
espo
nse
and
imm
edia
te
assi
stan
ce
to in
tern
ally
di
spla
ced
peop
le
(IDP)
due
toTB
DTB
D3.
2016
0.77
3.20
160.
77
Und
er
conc
eptu
aliz
atio
n st
age.
Inte
rnal
ly
Dis
plac
ed
viol
ence
and
co
nflic
t, an
d en
hanc
e po
licie
s an
d as
sist
ance
fo
r re
turn
ing
IDP
and/
or
inte
grat
ion
of
IDP
Peop
le in
M
inda
nao
(Exc
hang
e Ra
te: 1
USD
=
PhP5
0.19
4 So
urce
: B
SP R
ate
as o
f 31
Mar
ch 2
017
)
2Re
spon
sibl
e La
nd
To p
rovi
de
advi
ce a
nd
supp
ort t
o th
e re
gula
tory
au
thor
ities
in
deve
lopi
ng
the
futu
re
inst
itutio
nal a
ndM
inda
naTB
D4.
2621
4.36
4.26
214.
36
Und
er
conc
eptu
aliz
atio
n st
age.
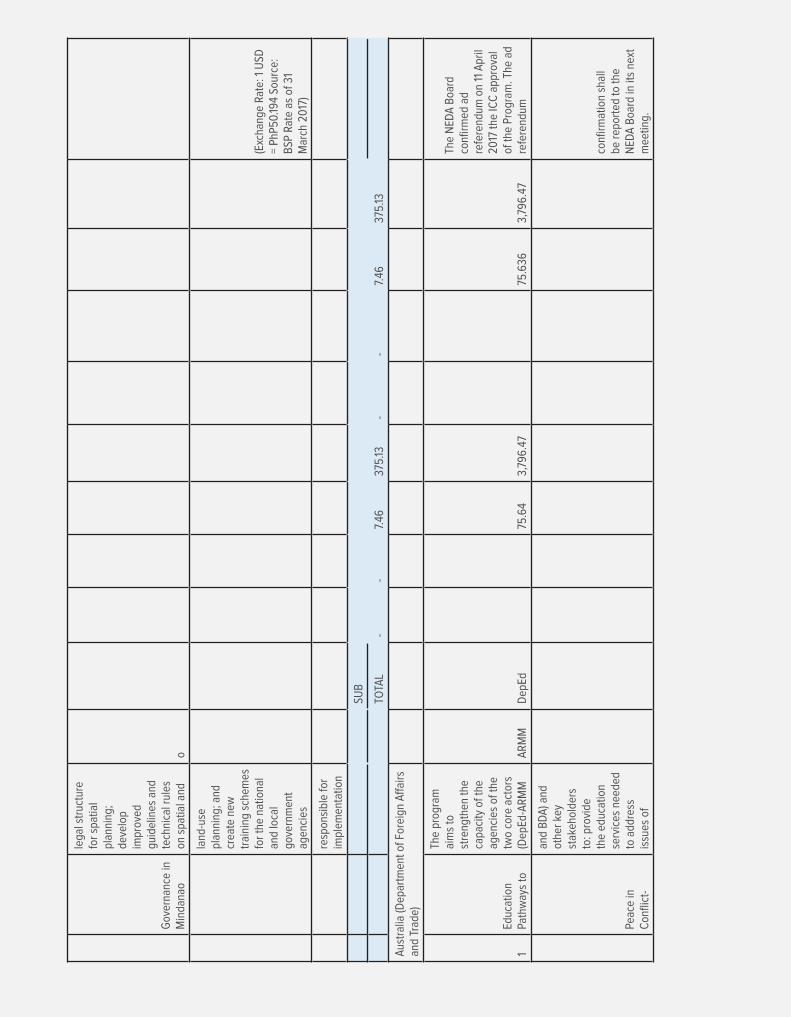
Gov
erna
nce
in
Min
dana
o
lega
l str
uctu
re
for
spat
ial
plan
ning
; de
velo
p im
prov
ed
guid
elin
es a
nd
tech
nica
l rul
es
on s
patia
l and
o
land
-use
pl
anni
ng; a
nd
crea
te n
ew
trai
ning
sch
emes
fo
r th
e na
tiona
l an
d lo
cal
gove
rnm
ent
agen
cies
(Exc
hang
e Ra
te: 1
USD
=
PhP5
0.19
4 So
urce
: B
SP R
ate
as o
f 31
Mar
ch 2
017
)
resp
onsi
ble
for
impl
emen
tatio
n
SUB
--
7.46
375.
13-
-7.
4637
5.13
TOTA
L
Aus
tral
ia (D
epar
tmen
t of F
orei
gn A
ffai
rs
and
Trad
e)
1Ed
ucat
ion
Path
way
s to
The
prog
ram
ai
ms
to
stre
ngth
en th
e ca
paci
ty o
f the
ag
enci
es o
f the
tw
o co
re a
ctor
s (D
epEd
-AR
MM
AR
MM
Dep
Ed75
.64
3,79
6.47
75.6
363,
796.
47
The
NED
A B
oard
co
nfirm
ed a
d re
fere
ndum
on
11 A
pril
2017
the
ICC
app
rova
l of
the
Prog
ram
. The
ad
refe
rend
um
Peac
e in
C
onfli
ct-
and
BD
A) a
nd
othe
r ke
y st
akeh
olde
rs
to: p
rovi
de
the
educ
atio
n se
rvic
es n
eede
d to
add
ress
is
sues
of
confi
rmat
ion
shal
l be
rep
orte
d to
the
NED
A B
oard
in it
s ne
xt
mee
ting.
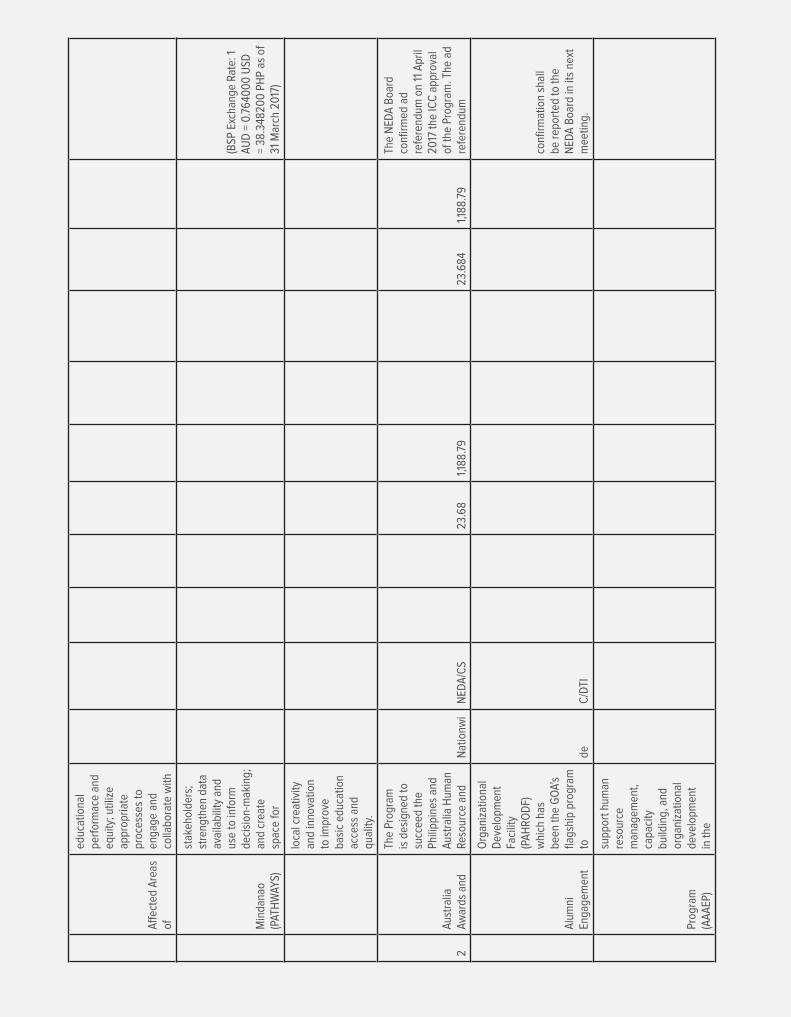
Aff
ecte
d A
reas
of
educ
atio
nal
perf
orm
ace
and
equi
ty; u
tiliz
e ap
prop
riate
pr
oces
ses
to
enga
ge a
nd
colla
bora
te w
ith
Min
dana
o (P
ATH
WAY
S)
stak
ehol
ders
; st
reng
then
dat
a av
aila
bilit
y an
d us
e to
info
rm
deci
sion
-mak
ing;
an
d cr
eate
sp
ace
for
(BSP
Exc
hang
e Ra
te: 1
AU
D =
0.7
640
00
USD
=
38.3
4820
0 P
HP
as o
f 31
Mar
ch 2
017
)
loca
l cre
ativ
ity
and
inno
vatio
n to
impr
ove
basi
c ed
ucat
ion
acce
ss a
nd
qual
ity.
2A
ustr
alia
A
war
ds a
nd
The
Prog
ram
is
des
igne
d to
su
ccee
d th
e Ph
ilipp
ines
and
A
ustr
alia
Hum
an
Reso
urce
and
Nat
ionw
iN
EDA
/CS
23.6
81,1
88.7
923
.684
1,188
.79
The
NED
A B
oard
co
nfirm
ed a
d re
fere
ndum
on
11 A
pril
2017
the
ICC
app
rova
l of
the
Prog
ram
. The
ad
refe
rend
um
Alu
mni
En
gage
men
t
Org
aniz
atio
nal
Dev
elop
men
t Fa
cilit
y (P
AH
RO
DF)
w
hich
has
be
en th
e G
OA’
s fla
gshi
p pr
ogra
m
tode
C/D
TI
confi
rmat
ion
shal
l be
rep
orte
d to
the
NED
A B
oard
in it
s ne
xt
mee
ting.
Prog
ram
(A
AA
EP)
supp
ort h
uman
re
sour
ce
man
agem
ent,
capa
city
bu
ildin
g, a
nd
orga
niza
tiona
l de
velo
pmen
t in
the

Phili
ppin
es
sinc
e 20
10.
The
PAH
RO
DF
curr
ently
pr
ovid
es a
ra
nge
of s
uppo
rt
activ
ities
to
sele
ct
(BSP
Exc
hang
e Ra
te: 1
AU
D =
0.7
640
00
USD
=
38.3
4820
0 P
HP
as o
f 31
Mar
ch 2
017
)
Phili
ppin
e or
gani
zatio
ns
incl
udin
g A
ustr
alia
Aw
ards
sc
hola
rshi
ps,
cust
omiz
ed
shor
t-te
rm
trai
ning
prog
ram
s,
busi
ness
pro
cess
im
prov
emen
t, an
d be
nchm
arki
ng
exer
cise
s.
3Tr
ade
and
Incl
usiv
e
The
Faci
lity
aim
s to
hel
p th
e Ph
ilipp
ines
ac
hiev
e su
stai
ned
and
incl
usiv
e gr
owth
th
roug
h fiv
eN
atio
nwi
DTI
61.12
3,0
67.8
661
.123,
067
.86
Und
er N
EDA
Se
cret
aria
t rev
iew
.
Econ
omic
G
row
th F
acili
ty
com
plem
enta
ry
area
s of
en
gage
men
t:de
-Con
nect
ing
the
Phili
ppin
es
with
the
glob
al
econ
omy:
aid
for
trad
e
(BSP
Exc
hang
e Ra
te: 1
AU
D =
0.7
640
00
USD
=
38.3
4820
0 P
HP
as o
f 31
Mar
ch 2
017
)
-Impr
ovin
g co
mpe
titiv
enes
s th
roug
h do
mes
tic
regu
lato
ry
refo
rm
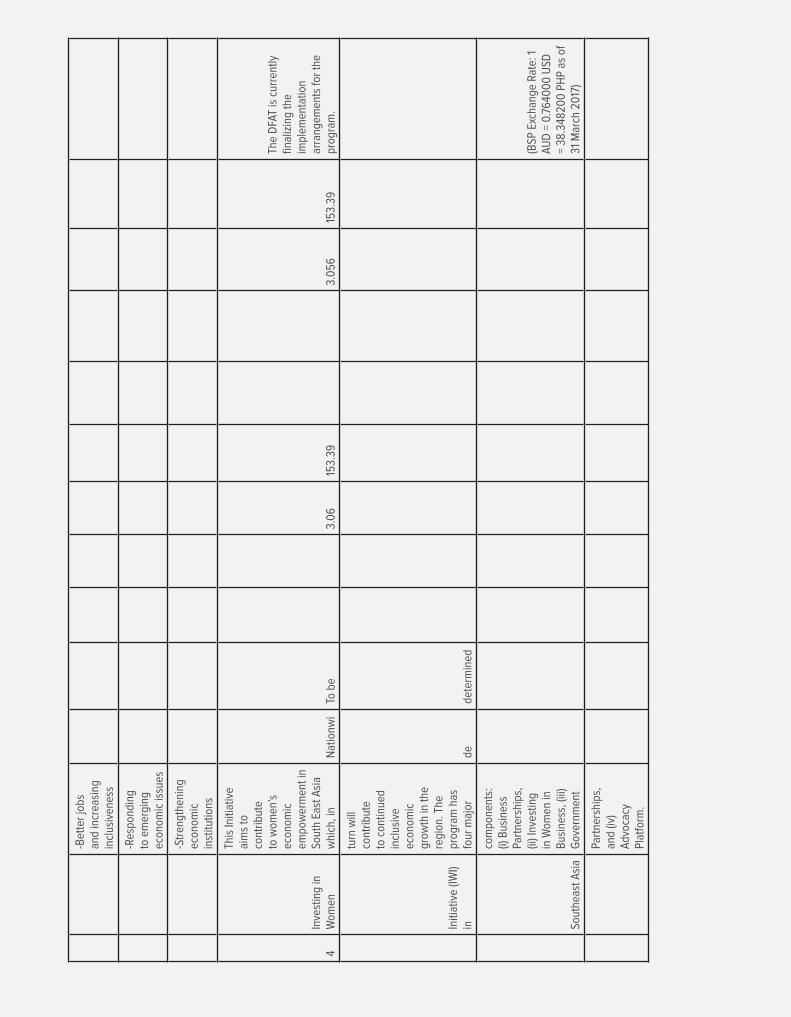
-Bet
ter
jobs
an
d in
crea
sing
in
clus
iven
ess
-Res
pond
ing
to e
mer
ging
ec
onom
ic is
sues
-Str
engt
heni
ng
econ
omic
in
stitu
tions
4In
vest
ing
in
Wom
en
This
Initi
ativ
e ai
ms
to
cont
ribut
e to
wom
en’s
ec
onom
ic
empo
wer
men
t in
Sout
h Ea
st A
sia
whi
ch, i
nN
atio
nwi
To b
e3.
06
153.
393.
056
153.
39
The
DFA
T is
cur
rent
ly
final
izin
g th
e im
plem
enta
tion
arra
ngem
ents
for
the
prog
ram
.
Initi
ativ
e (IW
I) in
turn
will
co
ntrib
ute
to c
ontin
ued
incl
usiv
e ec
onom
ic
grow
th in
the
regi
on. T
he
prog
ram
has
fo
ur m
ajor
dede
term
ined
Sout
heas
t Asi
a
com
pone
nts:
(i)
Bus
ines
s Pa
rtne
rshi
ps,
(ii) I
nves
ting
in W
omen
in
Bus
ines
s, (i
ii)
Gov
ernm
ent
(BSP
Exc
hang
e Ra
te: 1
AU
D =
0.7
640
00
USD
=
38.3
4820
0 P
HP
as o
f 31
Mar
ch 2
017
)
Part
ners
hips
, an
d (iv
) A
dvoc
acy
Plat
form
.
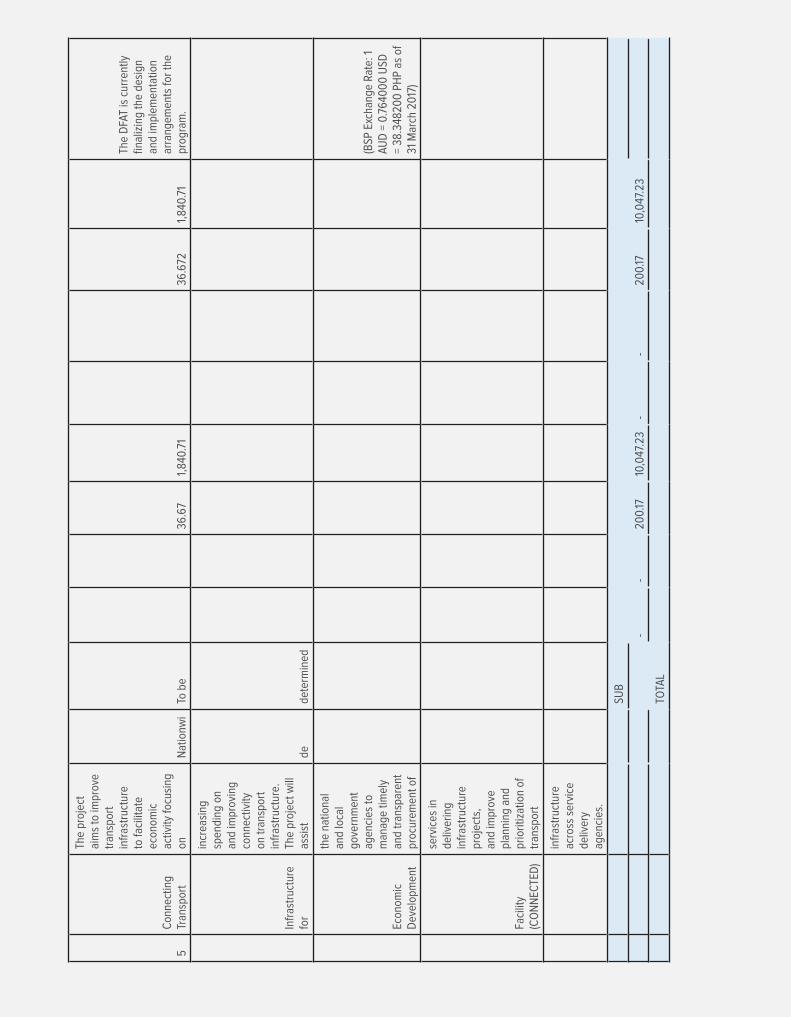
5C
onne
ctin
g Tr
ansp
ort
The
proj
ect
aim
s to
impr
ove
tran
spor
t in
fras
truc
ture
to
faci
litat
e ec
onom
ic
activ
ity fo
cusi
ng
onN
atio
nwi
To b
e36
.67
1,84
0.71
36.6
721,
840.
71
The
DFA
T is
cur
rent
ly
final
izin
g th
e de
sign
an
d im
plem
enta
tion
arra
ngem
ents
for
the
prog
ram
.
Infr
astr
uctu
re
for
incr
easi
ng
spen
ding
on
and
impr
ovin
g co
nnec
tivity
on
tran
spor
t in
fras
truc
ture
. Th
e pr
ojec
t will
as
sist
dede
term
ined
Econ
omic
D
evel
opm
ent
the
natio
nal
and
loca
l go
vern
men
t ag
enci
es to
m
anag
e tim
ely
and
tran
spar
ent
proc
urem
ent o
f
(BSP
Exc
hang
e Ra
te: 1
AU
D =
0.7
640
00
USD
=
38.3
4820
0 P
HP
as o
f 31
Mar
ch 2
017
)
Faci
lity
(CO
NN
ECTE
D)
serv
ices
in
deliv
erin
g in
fras
truc
ture
pr
ojec
ts,
and
impr
ove
plan
ning
and
pr
iorit
izat
ion
of
tran
spor
t
infr
astr
uctu
re
acro
ss s
ervi
ce
deliv
ery
agen
cies
.
SUB
--
200.
1710
,047
.23
--
200.
1710
,047
.23
TOTA
L
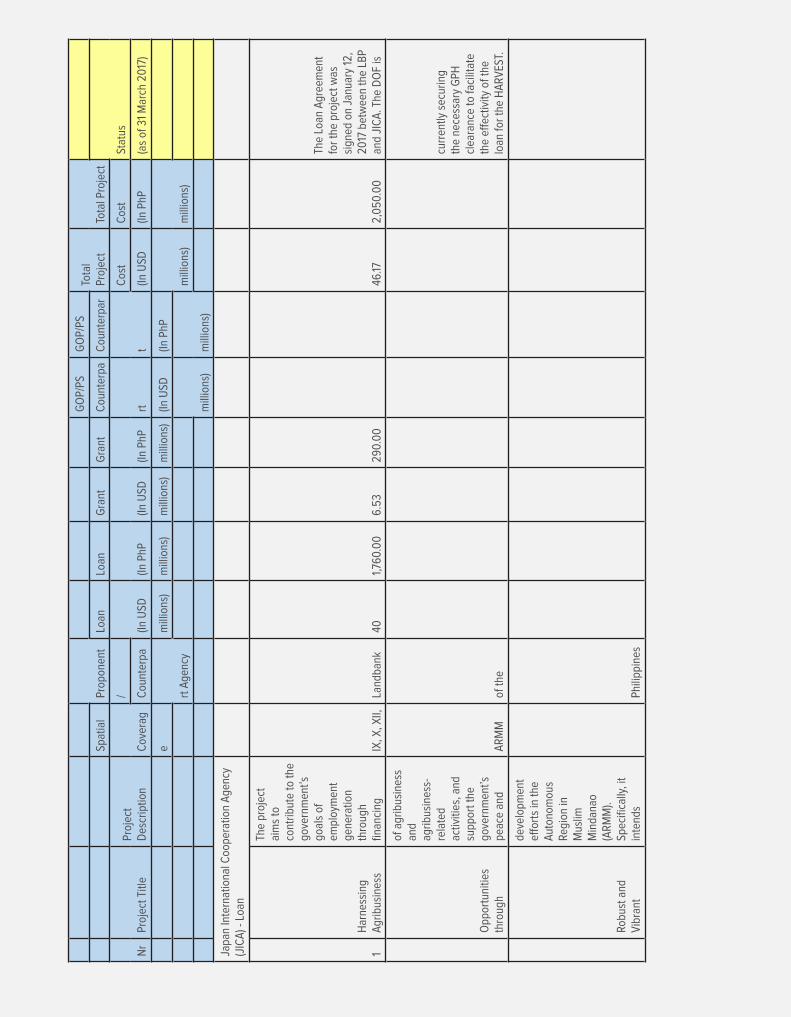
Prop
onen
t
GO
P/PS
GO
P/PS
Tota
l Pr
ojec
tTo
tal P
roje
ctSp
atia
lLo
anLo
anG
rant
Gra
ntC
ount
erpa
Cou
nter
par
Stat
us
Nr
Proj
ect T
itle
Proj
ect
Des
crip
tion
Cov
erag
/
(In U
SD(In
PhP
(In U
SD(In
PhP
rtt
Cos
tC
ost
Cou
nter
pa(In
USD
(In P
hP(a
s of
31
Mar
ch 2
017
)
e
rt A
genc
y
mill
ions
)m
illio
ns)
mill
ions
)m
illio
ns)
(In U
SD(In
PhP
mill
ions
)m
illio
ns)
mill
ions
)m
illio
ns)
Japa
n In
tern
atio
nal C
oope
ratio
n A
genc
y (J
ICA
) - L
oan
1H
arne
ssin
g A
grib
usin
ess
The
proj
ect
aim
s to
co
ntrib
ute
to th
e go
vern
men
t’s
goal
s of
em
ploy
men
t ge
nera
tion
thro
ugh
finan
cing
IX, X
, XII,
Land
bank
401,7
60.0
06.
5329
0.0
046
.172,
050
.00
The
Loan
Agr
eem
ent
for
the
proj
ect w
as
sign
ed o
n Ja
nuar
y 12
, 20
17 b
etw
een
the
LBP
and
JIC
A. T
he D
OF
is
Opp
ortu
nitie
s th
roug
h
of a
grib
usin
ess
and
agrib
usin
ess-
rela
ted
activ
ities
, and
su
ppor
t the
go
vern
men
t’s
peac
e an
dA
RM
Mof
the
curr
ently
sec
urin
g th
e ne
cess
ary
GPH
cl
eara
nce
to fa
cilit
ate
the
effec
tivity
of t
he
loan
for
the
HA
RV
EST.
Robu
st a
nd
Vib
rant
deve
lopm
ent
effor
ts in
the
Aut
onom
ous
Regi
on in
M
uslim
M
inda
nao
(AR
MM
). Sp
ecifi
cally
, it
inte
nds
Phili
ppin
es

Entr
epre
neur
ship
to p
rovi
de c
redi
t as
sist
ance
of
up to
PhP
11,13
6 m
illio
n fo
r ag
ribus
ines
s ac
tiviti
es w
ithin
th
e Re
gion
,
The
ICC
, on
Dec
embe
r 21
, 20
16, a
ppro
ved
ad r
efer
endu
m th
e fo
llow
ing
chan
ges
in
the
prop
osed
fina
ncin
g fa
cilit
y
Supp
ortiv
e of
Pe
acef
ul
and
gene
rate
21
,70
0
empl
oym
ent
durin
g its
im
plem
enta
tion.
as r
eque
sted
by
the
LBP
: (a)
dec
reas
e in
th
e lo
an a
mou
nt fr
om
PhP1
1,136
mill
ion
to
PhP1
,760
mill
ion;
(b)
Tran
sfor
mat
ion
expa
nsio
n of
targ
et
area
to in
clud
e ot
her
confl
ict-
affec
ted
area
s ou
tsid
e A
RM
M; (
c) c
hang
e in
im
plem
enta
tion
(HA
RV
EST)
sche
dule
. The
NED
A
Boa
rd, o
n Ja
nuar
y 5,
20
17, c
onfir
med
ad
refe
rend
um th
e ab
ove
cite
d IC
C a
ppro
val o
f th
e
proj
ect.
GO
J ha
s is
sued
a
pled
ge o
f sup
port
fo
r th
e pr
ojec
t on
Nov
embe
r 25
, 20
15.
The
proj
ect w
as
orig
inal
ly a
ppro
ved
by
the
ICC
on
Oct
ober
14,
20
15 w
ith a
n in
dica
tive
tota
l pro
ject
cos
t of
PhP1
1,42
6 m
illio
n. T
he
NED
A B
oard
, dur
ing
its
mee
ting
on D
ecem
ber
16, 2
015
, rec
onfir
med
th
e N
ovem
ber
18,
2015
NED
A B
oard
co
nfirm
atio
n ad
re
fere
ndum
of
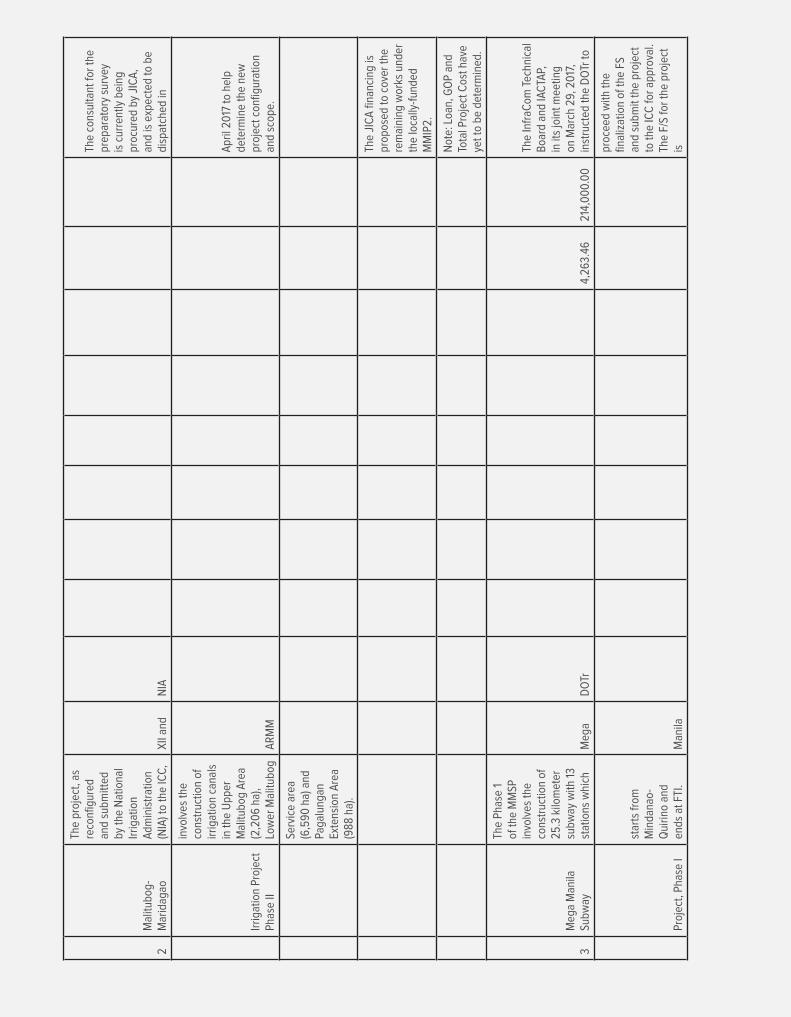
2M
alitu
bog-
Mar
idag
ao
The
proj
ect,
as
reco
nfigu
red
and
subm
itted
by
the
Nat
iona
l Ir
rigat
ion
Adm
inis
trat
ion
(NIA
) to
the
ICC
,X
II an
dN
IA
The
cons
ulta
nt fo
r th
e pr
epar
ator
y su
rvey
is
cur
rent
ly b
eing
pr
ocur
ed b
y JI
CA
, an
d is
exp
ecte
d to
be
disp
atch
ed in
Irrig
atio
n Pr
ojec
t Ph
ase
II
invo
lves
the
cons
truc
tion
of
irrig
atio
n ca
nals
in
the
Upp
er
Mal
itubo
g A
rea
(2,2
06
ha),
Low
er M
alitu
bog
AR
MM
Apr
il 20
17 to
hel
p de
term
ine
the
new
pr
ojec
t con
figur
atio
n an
d sc
ope.
Serv
ice
area
(6
,590
ha)
and
Pa
galu
ngan
Ex
tens
ion
Are
a (9
88 h
a).
The
JIC
A fi
nanc
ing
is
prop
osed
to c
over
the
rem
aini
ng w
orks
und
er
the
loca
lly-f
unde
d M
MIP
2.
Not
e: L
oan,
GO
P an
d To
tal P
roje
ct C
ost h
ave
yet t
o be
det
erm
ined
.
3M
ega
Man
ila
Subw
ay
The
Phas
e 1
of th
e M
MSP
in
volv
es th
e co
nstr
uctio
n of
25
.3 k
ilom
eter
su
bway
with
13
stat
ions
whi
chM
ega
DO
Tr4,
263.
4621
4,0
00.
00
The
Infr
aCom
Tec
hnic
al
Boa
rd a
nd IA
CTA
P,
in it
s jo
int m
eetin
g on
Mar
ch 2
9, 2
017
, in
stru
cted
the
DO
Tr to
Proj
ect,
Phas
e I
star
ts fr
om
Min
dana
o-Q
uirin
o an
d en
ds a
t FTI
.M
anila
proc
eed
with
the
final
izat
ion
of th
e FS
an
d su
bmit
the
proj
ect
to th
e IC
C fo
r ap
prov
al.
The
F/S
for
the
proj
ect
is

expe
cted
to b
e co
mpl
eted
by
Sept
embe
r 20
17.
The
DO
Tr, t
hrou
gh a
le
tter
dat
ed D
ecem
ber
16, 2
016
, end
orse
d to
JI
CA
the
Kat
ipun
an
Rout
e as
the
alig
nmen
t fo
r
the
cent
ral p
ortio
n of
th
e M
MSP
.
Not
e: In
dica
tive
Proj
ect
Cos
t for
MM
SP P
hase
1
is P
hP21
4 B
illio
n.
(Exc
hang
e Ra
te: 1
USD
=
50.19
4 Ph
P as
of
Mar
ch 3
1, 2
017
)
4N
orth
-Sou
th
Railw
ay
The
proj
ect
invo
lves
the
cons
truc
tion
of
72km
Com
mut
er
Railw
ay fr
om
Tutu
ban
to
Cal
amba
(S
ourc
e:N
CR
and
DO
Tr2,
674.
00
134,
218.
76
The
Inve
stm
ent
Coo
rdin
atio
n C
omm
ittee
-Cab
inet
C
omm
ittee
(IC
C-C
C),
durin
g its
Mar
ch 2
1,
2017
mee
ting,
Proj
ect (
NSR
P)-
Sout
h
27 M
arch
20
17 D
OTr
Pr
esen
tatio
n in
To
kyo,
Jap
an)
V
appr
oved
the
prop
osal
of
the
DO
Tr to
shi
ft
the
proc
urem
ent
mod
e of
the
capi
tal
requ
irem
ents
of t
he
proj
ect f
rom
Line
(Com
mut
er
Line
)
fPub
lic-P
rivat
e Pa
rtne
rshi
p to
O
ffici
al D
evel
opm
ent
Ass
ista
nce.
Per
DO
Tr L
ette
r to
DO
F da
ted
13 J
anua
ry 2
017
, th
e D
OTr
is p
repa
ring
to p
rocu
re a
con
sulta
nt
to u
pdat
e th
e
Det
aile
d Fe
asib
ility
St
udy
for
the
long
-hau
l se
gmen
t.
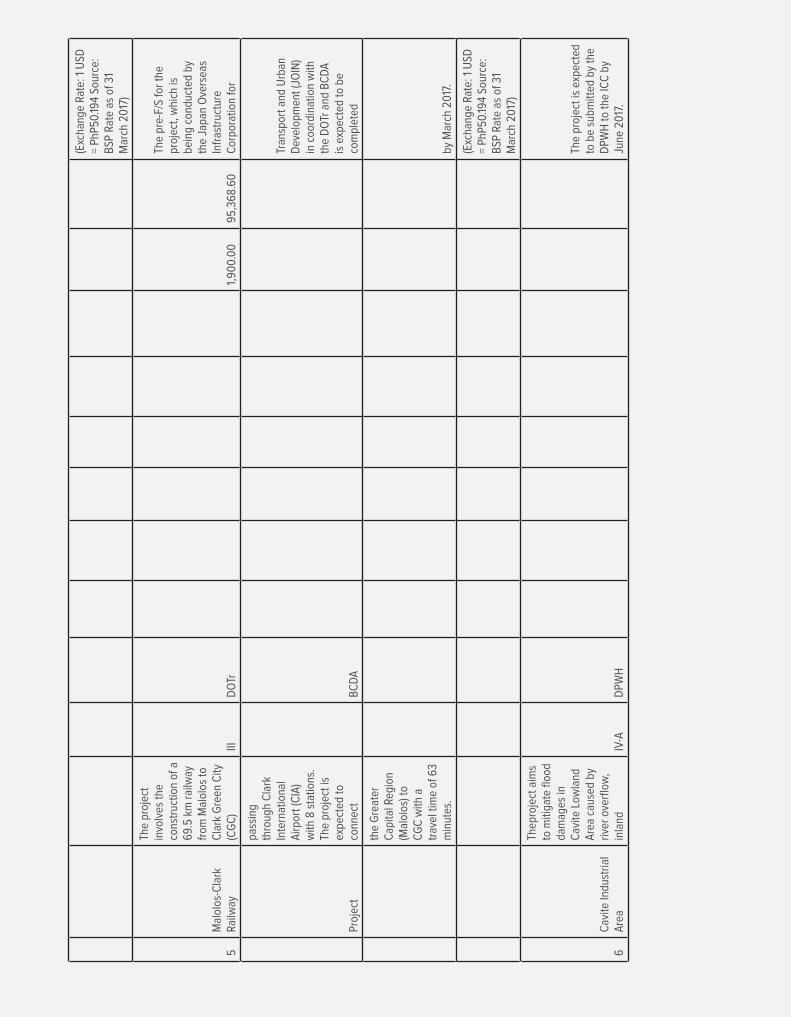
(Exc
hang
e Ra
te: 1
USD
=
PhP5
0.19
4 So
urce
: B
SP R
ate
as o
f 31
Mar
ch 2
017
)
5M
alol
os-C
lark
Ra
ilway
The
proj
ect
invo
lves
the
cons
truc
tion
of a
69
.5 k
m r
ailw
ay
from
Mal
olos
to
Cla
rk G
reen
City
(C
GC
)III
DO
Tr1,
900.
00
95,3
68.6
0
The
pre-
F/S
for
the
proj
ect,
whi
ch is
be
ing
cond
ucte
d by
th
e Ja
pan
Ove
rsea
s In
fras
truc
ture
C
orpo
ratio
n fo
r
Proj
ect
pass
ing
thro
ugh
Cla
rk
Inte
rnat
iona
l A
irpor
t (C
IA)
with
8 s
tatio
ns.
The
proj
ect i
s ex
pect
ed to
co
nnec
tB
CD
A
Tran
spor
t and
Urb
an
Dev
elop
men
t (JO
IN)
in c
oord
inat
ion
with
th
e D
OTr
and
BC
DA
is
exp
ecte
d to
be
com
plet
ed
the
Gre
ater
C
apita
l Reg
ion
(Mal
olos
) to
CG
C w
ith a
tr
avel
tim
e of
63
min
utes
.by
Mar
ch 2
017
.
(Exc
hang
e Ra
te: 1
USD
=
PhP5
0.19
4 So
urce
: B
SP R
ate
as o
f 31
Mar
ch 2
017
)
6C
avite
Indu
stria
l A
rea
Thep
roje
ct a
ims
to m
itiga
te fl
ood
dam
ages
in
Cav
ite L
owla
nd
Are
a ca
used
by
river
ove
rflow
, in
land
IV-A
DPW
H
The
proj
ect i
s ex
pect
ed
to b
e su
bmitt
ed b
y th
e D
PWH
to th
e IC
C b
y Ju
ne 2
017
.
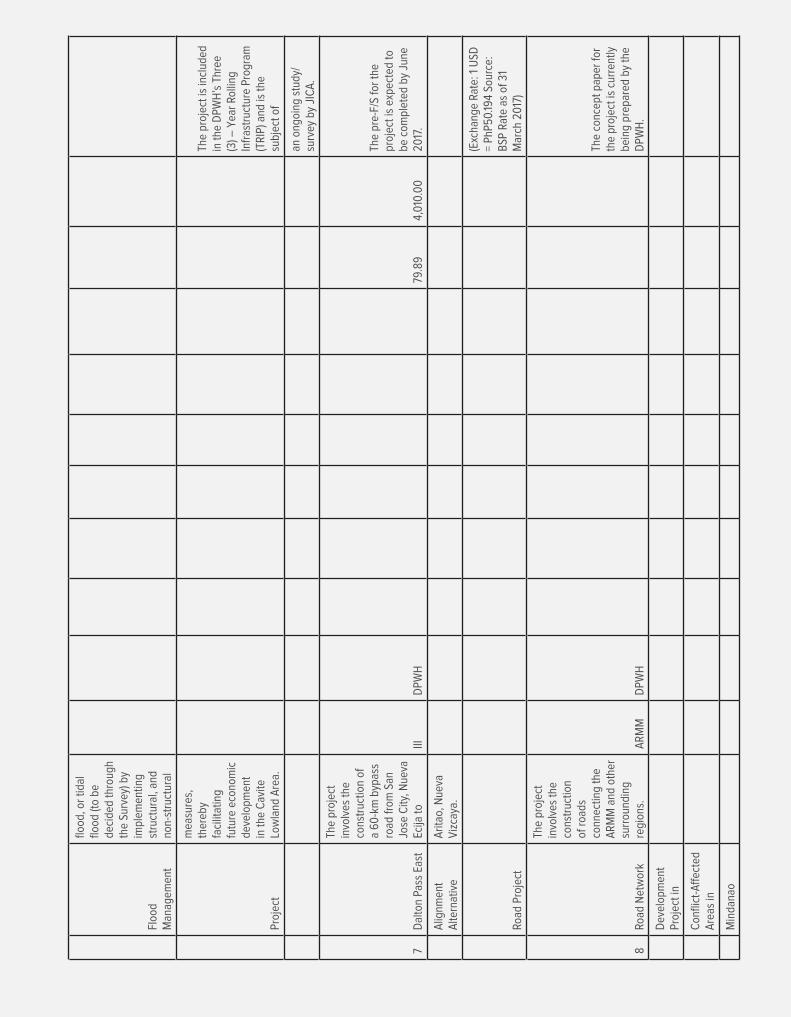
Floo
d M
anag
emen
t
flood
, or
tidal
flo
od (t
o be
de
cide
d th
roug
h th
e Su
rvey
) by
impl
emen
ting
stru
ctur
al, a
nd
non-
stru
ctur
al
Proj
ect
mea
sure
s,
ther
eby
faci
litat
ing
futu
re e
cono
mic
de
velo
pmen
t in
the
Cav
ite
Low
land
Are
a.
The
proj
ect i
s in
clud
ed
in th
e D
PWH
’s T
hree
(3
) – Y
ear
Rolli
ng
Infr
astr
uctu
re P
rogr
am
(TR
IP) a
nd is
the
subj
ect o
f
an o
ngoi
ng s
tudy
/su
rvey
by
JIC
A.
7D
alto
n Pa
ss E
ast
The
proj
ect
invo
lves
the
cons
truc
tion
of
a 60
-km
byp
ass
road
from
San
Jo
se C
ity, N
ueva
Ec
ija to
IIID
PWH
79.8
94,
010
.00
The
pre-
F/S
for
the
proj
ect i
s ex
pect
ed to
be
com
plet
ed b
y Ju
ne
2017
.
Alig
nmen
t A
ltern
ativ
eA
ritao
, Nue
va
Viz
caya
.
Road
Pro
ject
(Exc
hang
e Ra
te: 1
USD
=
PhP5
0.19
4 So
urce
: B
SP R
ate
as o
f 31
Mar
ch 2
017
)
8Ro
ad N
etw
ork
The
proj
ect
invo
lves
the
cons
truc
tion
of r
oads
co
nnec
ting
the
AR
MM
and
oth
er
surr
ound
ing
regi
ons.
AR
MM
DPW
H
The
conc
ept p
aper
for
the
proj
ect i
s cu
rren
tly
bein
g pr
epar
ed b
y th
e D
PWH
.
Dev
elop
men
t Pr
ojec
t in
Con
flict
-Aff
ecte
d A
reas
in
Min
dana
o
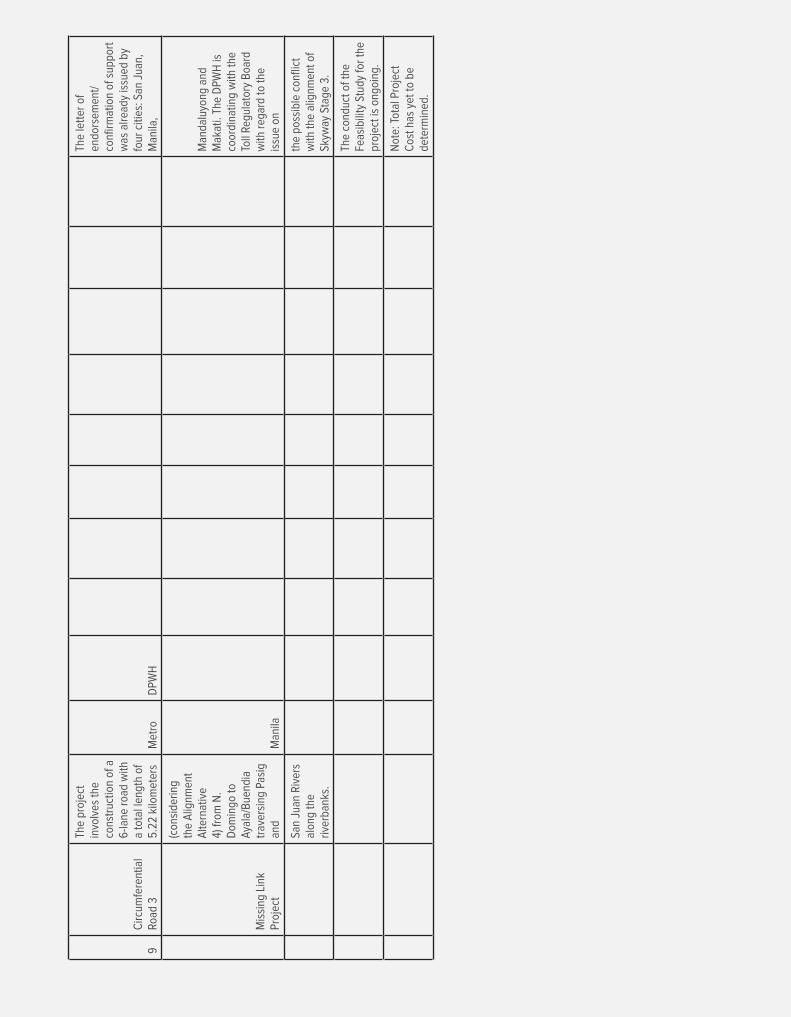
9C
ircum
fere
ntia
l Ro
ad 3
The
proj
ect
invo
lves
the
cons
truc
tion
of a
6-
lane
roa
d w
ith
a to
tal l
engt
h of
5.
22 k
ilom
eter
sM
etro
DPW
H
The
lett
er o
f en
dors
emen
t/co
nfirm
atio
n of
sup
port
w
as a
lread
y is
sued
by
four
citi
es: S
an J
uan,
M
anila
,
Mis
sing
Lin
k Pr
ojec
t
(con
side
ring
the
Alig
nmen
t A
ltern
ativ
e 4)
from
N.
Dom
ingo
to
Ayal
a/B
uend
ia
trav
ersi
ng P
asig
an
dM
anila
Man
dalu
yong
and
M
akat
i. Th
e D
PWH
is
coor
dina
ting
with
the
Toll
Regu
lato
ry B
oard
w
ith r
egar
d to
the
issu
e on
San
Juan
Riv
ers
alon
g th
e riv
erba
nks.
the
poss
ible
con
flict
w
ith th
e al
ignm
ent o
f Sk
yway
Sta
ge 3
.
The
cond
uct o
f the
Fe
asib
ility
Stu
dy fo
r th
e pr
ojec
t is
ongo
ing.
Not
e: T
otal
Pro
ject
C
ost h
as y
et to
be
dete
rmin
ed.
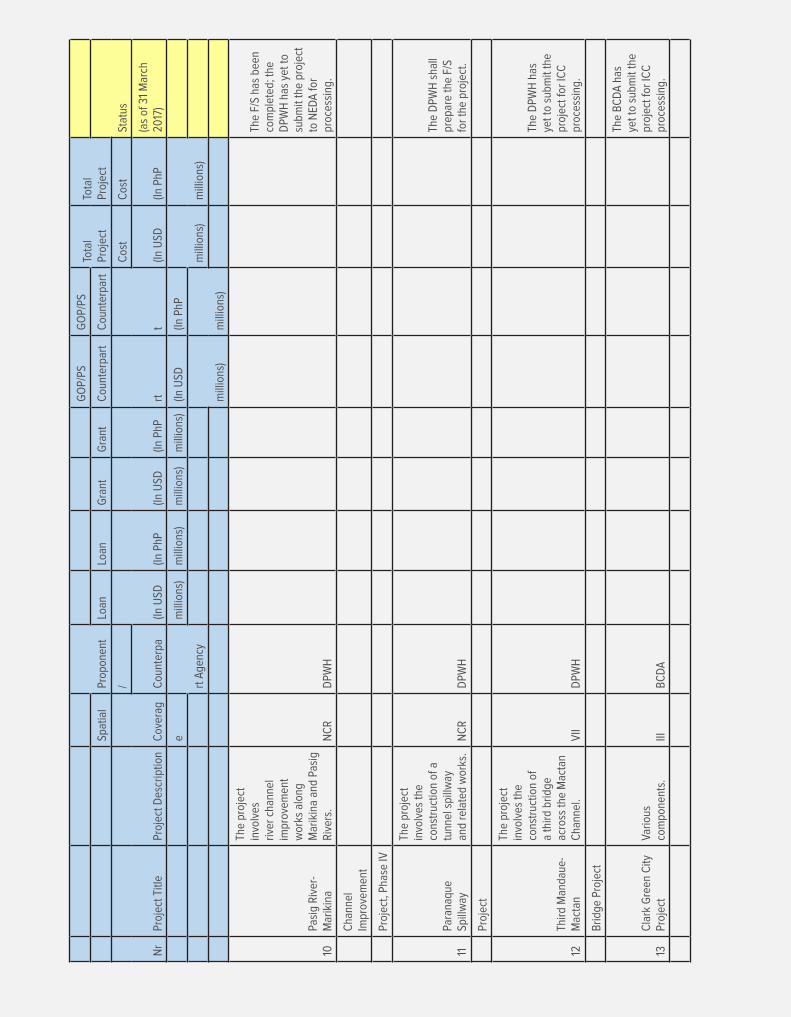
Prop
onen
t
GO
P/PS
GO
P/PS
Tota
l Pr
ojec
tTo
tal
Proj
ect
Spat
ial
Loan
Loan
Gra
ntG
rant
Cou
nter
part
Cou
nter
part
Stat
us
Nr
Proj
ect T
itle
Proj
ect D
escr
iptio
nC
over
ag
/
(In U
SD(In
PhP
(In U
SD(In
PhP
rtt
Cos
tC
ost
Cou
nter
pa(In
USD
(In P
hP(a
s of
31
Mar
ch
2017
)
e
rt A
genc
y
mill
ions
)m
illio
ns)
mill
ions
)m
illio
ns)
(In U
SD(In
PhP
mill
ions
)m
illio
ns)
mill
ions
)m
illio
ns)
10Pa
sig
Riv
er-
Mar
ikin
a
The
proj
ect
invo
lves
riv
er c
hann
el
impr
ovem
ent
wor
ks a
long
M
arik
ina
and
Pasi
g R
iver
s.N
CR
DPW
H
The
F/S
has
been
co
mpl
eted
; the
D
PWH
has
yet
to
subm
it th
e pr
ojec
t to
NED
A fo
r pr
oces
sing
.
Cha
nnel
Im
prov
emen
t
Proj
ect,
Phas
e IV
11Pa
rana
que
Spill
way
The
proj
ect
invo
lves
the
cons
truc
tion
of a
tu
nnel
spi
llway
an
d re
late
d w
orks
.N
CR
DPW
H
The
DPW
H s
hall
prep
are
the
F/S
for
the
proj
ect.
Proj
ect
12Th
ird M
anda
ue-
Mac
tan
The
proj
ect
invo
lves
the
cons
truc
tion
of
a th
ird b
ridge
ac
ross
the
Mac
tan
Cha
nnel
.V
IID
PWH
The
DPW
H h
as
yet t
o su
bmit
the
proj
ect f
or IC
C
proc
essi
ng.
Brid
ge P
roje
ct
13C
lark
Gre
en C
ity
Proj
ect
Vario
us
com
pone
nts.
IIIB
CD
A
The
BC
DA
has
ye
t to
subm
it th
e pr
ojec
t for
ICC
pr
oces
sing
.
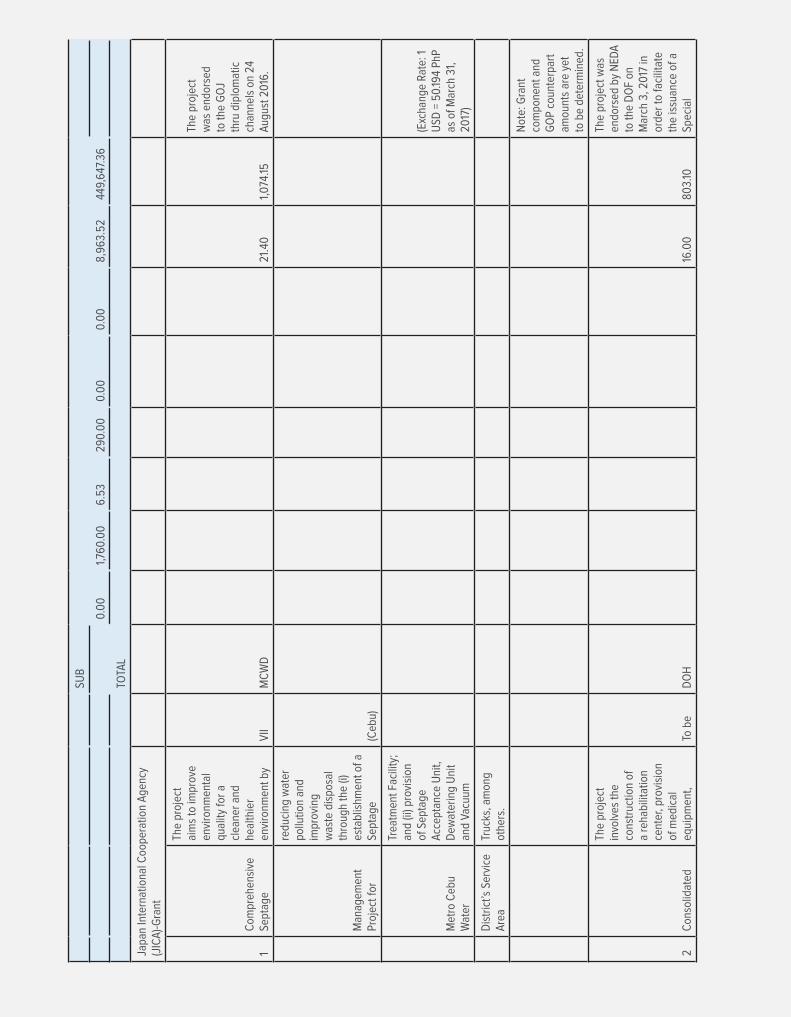
SUB
0.0
01,7
60.0
06.
5329
0.0
00.
00
0.0
08,
963.
5244
9,64
7.36
TOTA
L
Japa
n In
tern
atio
nal C
oope
ratio
n A
genc
y (J
ICA
)-Gra
nt
1C
ompr
ehen
sive
Se
ptag
e
The
proj
ect
aim
s to
impr
ove
envi
ronm
enta
l qu
ality
for
a cl
eane
r an
d he
alth
ier
envi
ronm
ent b
yV
IIM
CW
D21
.40
1,0
74.15
The
proj
ect
was
end
orse
d to
the
GO
J th
ru d
iplo
mat
ic
chan
nels
on
24
Aug
ust 2
016
.
Man
agem
ent
Proj
ect f
or
redu
cing
wat
er
pollu
tion
and
impr
ovin
g w
aste
dis
posa
l th
roug
h th
e (i)
es
tabl
ishm
ent o
f a
Sept
age
(Ceb
u)
Met
ro C
ebu
Wat
er
Trea
tmen
t Fac
ility
; an
d (ii
) pro
visi
on
of S
epta
ge
Acc
epta
nce
Uni
t, D
ewat
erin
g U
nit
and
Vacu
um
(Exc
hang
e Ra
te: 1
U
SD =
50.
194
PhP
as o
f Mar
ch 3
1,
2017
)
Dis
tric
t’s S
ervi
ce
Are
aTr
ucks
, am
ong
othe
rs.
Not
e: G
rant
co
mpo
nent
and
G
OP
coun
terp
art
amou
nts
are
yet
to b
e de
term
ined
.
2C
onso
lidat
ed
The
proj
ect
invo
lves
the
cons
truc
tion
of
a re
habi
litat
ion
cent
er, p
rovi
sion
of
med
ical
eq
uipm
ent,
To b
eD
OH
16.0
080
3.10
The
proj
ect w
as
endo
rsed
by
NED
A
to th
e D
OF
on
Mar
ch 3
, 20
17 in
or
der
to fa
cilit
ate
the
issu
ance
of a
Sp
ecia
l
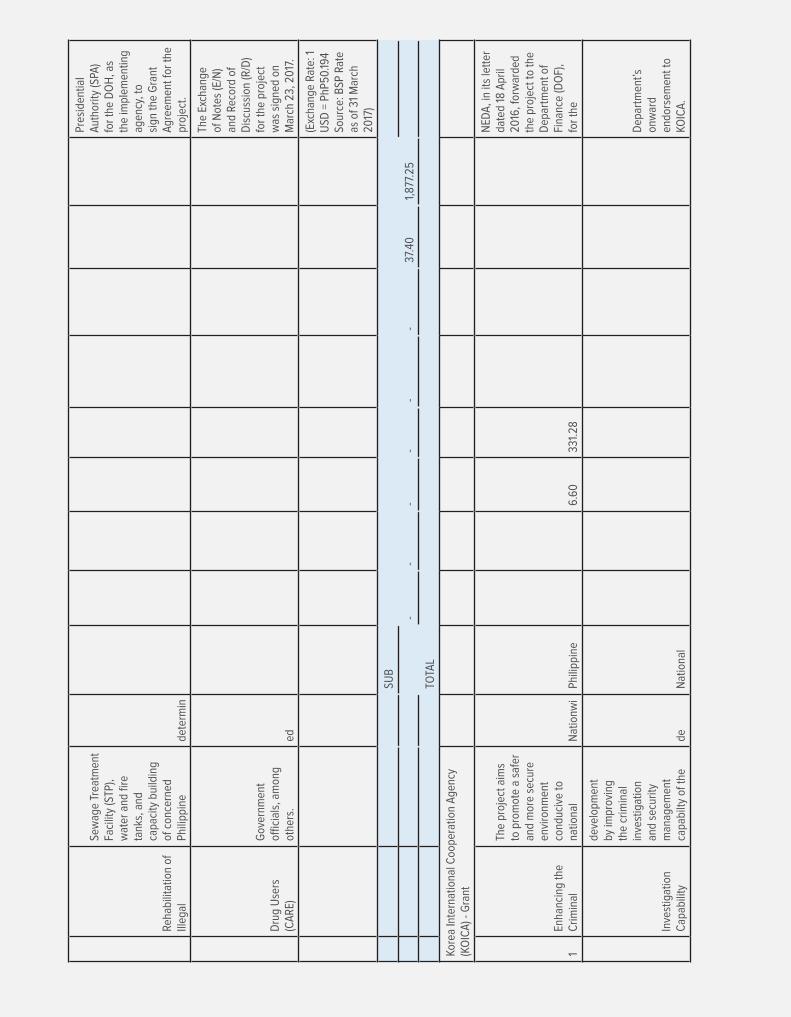
Reha
bilit
atio
n of
Ill
egal
Sew
age
Trea
tmen
t Fa
cilit
y (S
TP),
wat
er a
nd fi
re
tank
s, a
nd
capa
city
bui
ldin
g of
con
cern
ed
Phili
ppin
ede
term
in
Pres
iden
tial
Aut
horit
y (S
PA)
for
the
DO
H, a
s th
e im
plem
entin
g ag
ency
, to
sign
the
Gra
nt
Agr
eem
ent f
or th
e pr
ojec
t.
Dru
g U
sers
(C
AR
E)
Gov
ernm
ent
offici
als,
am
ong
othe
rs.
ed
The
Exch
ange
of
Not
es (E
/N)
and
Reco
rd o
f D
iscu
ssio
n (R
/D)
for
the
proj
ect
was
sig
ned
on
Mar
ch 2
3, 2
017
.
(Exc
hang
e Ra
te: 1
U
SD =
PhP
50.19
4 So
urce
: BSP
Rat
e as
of 3
1 M
arch
20
17)
SUB
--
--
--
37.4
01,
877.
25
TOTA
L
Kore
a In
tern
atio
nal C
oope
ratio
n A
genc
y (K
OIC
A) -
Gra
nt
1En
hanc
ing
the
Crim
inal
The
proj
ect a
ims
to p
rom
ote
a sa
fer
and
mor
e se
cure
en
viro
nmen
t co
nduc
ive
to
natio
nal
Nat
ionw
iPh
ilipp
ine
6.60
331.
28
NED
A, i
n its
lett
er
date
d 18
Apr
il 20
16, f
orw
arde
d th
e pr
ojec
t to
the
Dep
artm
ent o
f Fi
nanc
e (D
OF)
, fo
r th
e
Inve
stig
atio
n C
apab
ility
deve
lopm
ent
by im
prov
ing
the
crim
inal
in
vest
igat
ion
and
secu
rity
man
agem
ent
capa
bilty
of t
hede
Nat
iona
l
Dep
artm
ent’s
on
war
d en
dors
emen
t to
KOIC
A.

of th
e Ph
ilipp
ine
Nat
iona
l
polic
e. T
he
proj
ect i
nvol
ves
the
(i) p
rovi
sion
of
inve
stig
atio
n eq
uipm
ent a
nd
mat
eria
ls, (
ii)
disp
atch
of
(Met
roPo
lice
Polic
e
Kore
an e
xper
ts to
th
e Ph
ilipp
ines
to
prov
ide
cons
ultin
g se
rvic
e fo
r th
e im
plem
enta
tion
of
the
Proj
ect,
Man
ila,
The
DIL
G h
as
yet t
o su
bmit
its r
eque
st
for
Spec
ial
Pres
iden
tial
Aut
horit
y (S
PA) t
o si
gn th
e Re
cord
s of
Dis
cuss
ion
(iii)
capa
city
bu
ildin
g of
the
Phili
ppin
e offi
cial
s an
d pe
rson
nel
in K
orea
and
(iv)
co
nduc
t of l
ocal
Ceb
u,
for
the
proj
ect
on b
ehal
f of
the
Phili
ppin
e G
over
nmen
t.
The
PNP
is s
till
coor
dina
ting
with
BO
C fo
r th
e co
mpu
tatio
n
wor
ksho
ps fo
r Ph
ilipp
ine
offici
als.
Ang
eles
of ta
xes
and
dutie
s fo
r th
e eq
uipm
ent t
o be
pr
ovid
ed th
roug
h th
e Pr
ojec
t.
and
Bag
uio
(Exc
hang
e Ra
te: 1
U
SD =
50.
194
PhP
as o
f Mar
ch 3
1,
2017
)
City
)
Not
e: T
otal
pr
ojec
t cos
t and
G
OP
coun
terp
art
amou
nts
are
yet
to b
e de
term
ined
.

2Re
habi
litat
ion
of
Felip
e
The
proj
ect a
ims
to c
ontr
ibut
e to
war
ds th
e ov
er-a
ll go
al o
f re
stor
ing
the
soci
al c
ondi
tions
in
Yol
anda
-V
IIID
epar
tmen
4.80
240.
93
NED
A, i
n its
lett
er
date
d 20
Jul
y 20
16, f
orw
arde
d th
e pr
ojec
t to
the
Dep
artm
ent o
f Fi
nanc
e (D
OF)
, fo
r th
e
Abr
igo
Mem
oria
l H
ospi
tal
affec
ted
area
s an
d su
stai
ning
the
deliv
ery
of h
ealth
ca
re s
ervi
ces
thro
ugh
(i) th
e co
nstr
uctio
n of
t of H
ealth
Dep
artm
ent’s
on
war
d en
dors
emen
t to
KO
ICA
. NED
A
has
requ
este
d th
e D
OH
-BIH
C to
co
ordi
nate
with
D
OF
in
(FA
MH
) and
Felip
e A
brig
o M
emor
ial H
ospi
tal,
(ii) t
he p
rovi
sion
of
hos
pita
l fix
ture
s, m
edic
al
equi
pmen
t and
– B
urea
u
secu
ring
furt
her
gove
rnm
ent
clea
ranc
es,
incl
udin
g Sp
ecia
l Pr
esid
entia
l A
utho
rity
(SPA
), fo
r it
to s
ign
the
Reco
rds
Stre
ngth
enin
g of
the
mat
eria
ls, a
nd
(iii)
capa
city
bu
ildin
g fo
r FA
MH
pe
rson
nel o
n se
rvic
e de
liver
y ne
twor
ks, a
mon
g ot
hers
.of
of D
iscu
ssio
ns.
Gui
an In
ter-
Loca
l H
ealth
Inte
rnat
ion
Zone
(GIL
Z)al
Hea
lth
The
DO
F is
cu
rren
tly
proc
essi
ng th
e re
ques
t for
the
issu
ance
of a
SPA
fo
r th
e pr
ojec
t. So
me
of th
e in
itial
ac
tiviti
es,
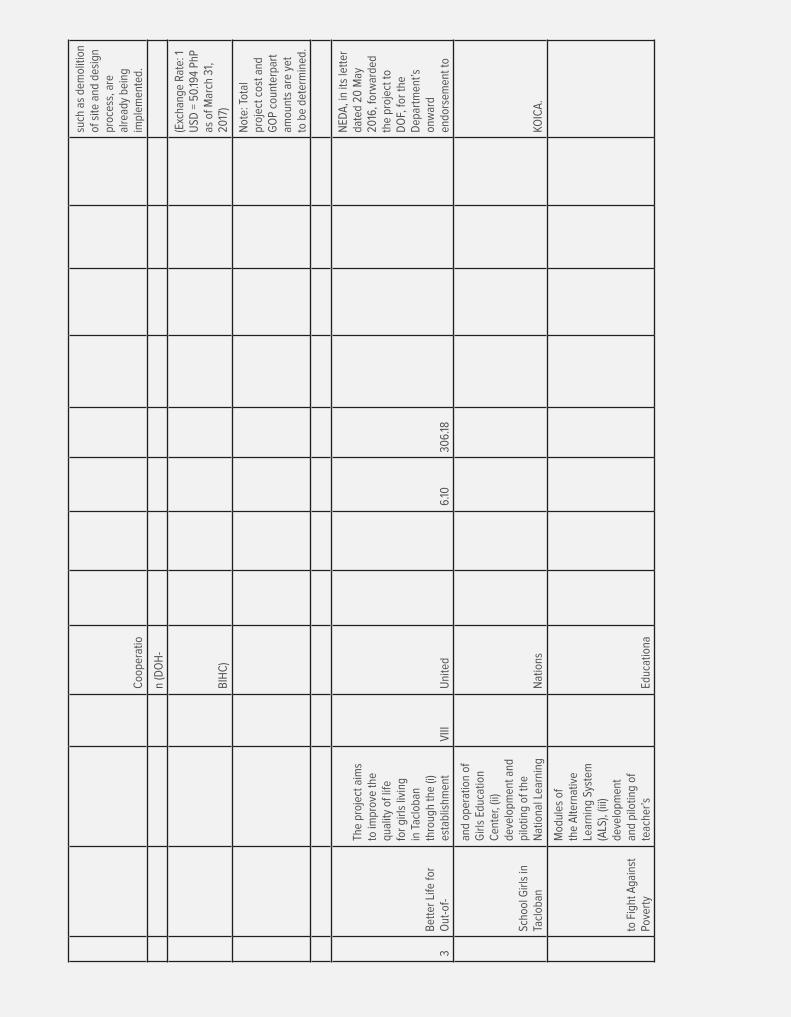
Coo
pera
tio
such
as
dem
oliti
on
of s
ite a
nd d
esig
n pr
oces
s, a
re
alre
ady
bein
g im
plem
ente
d.
n (D
OH
-
BIH
C)
(Exc
hang
e Ra
te: 1
U
SD =
50.
194
PhP
as o
f Mar
ch 3
1,
2017
)
Not
e: T
otal
pr
ojec
t cos
t and
G
OP
coun
terp
art
amou
nts
are
yet
to b
e de
term
ined
.
3B
ette
r Li
fe fo
r O
ut-o
f-
The
proj
ect a
ims
to im
prov
e th
e qu
ality
of l
ife
for
girls
livi
ng
in T
aclo
ban
thro
ugh
the
(i)
esta
blis
hmen
tV
IIIU
nite
d6.
1030
6.18
NED
A, i
n its
lett
er
date
d 20
May
20
16, f
orw
arde
d th
e pr
ojec
t to
DO
F, fo
r th
e D
epar
tmen
t’s
onw
ard
endo
rsem
ent t
o
Scho
ol G
irls
in
Tacl
oban
and
oper
atio
n of
G
irls
Educ
atio
n C
ente
r, (ii
) de
velo
pmen
t and
pi
lotin
g of
the
Nat
iona
l Lea
rnin
gN
atio
nsKO
ICA
.
to F
ight
Aga
inst
Po
vert
y
Mod
ules
of
the
Alte
rnat
ive
Lear
ning
Sys
tem
(A
LS),
(iii)
deve
lopm
ent
and
pilo
ting
of
teac
her’s
Educ
atio
na
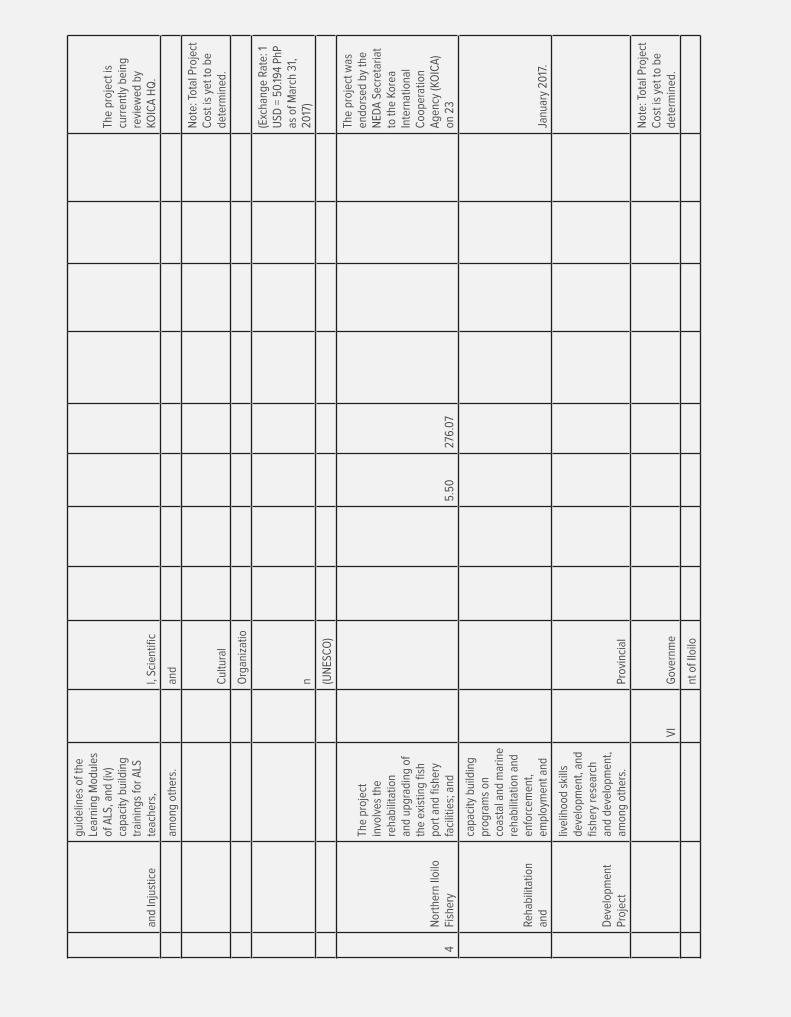
and
Inju
stic
e
guid
elin
es o
f the
Le
arni
ng M
odul
es
of A
LS, a
nd (i
v)
capa
city
bui
ldin
g tr
aini
ngs
for
ALS
te
ache
rs,
l, Sc
ient
ific
The
proj
ect i
s cu
rren
tly b
eing
re
view
ed b
y KO
ICA
HQ
.
amon
g ot
hers
.an
d
Cul
tura
l
Not
e: T
otal
Pro
ject
C
ost i
s ye
t to
be
dete
rmin
ed.
Org
aniz
atio
n
(Exc
hang
e Ra
te: 1
U
SD =
50.
194
PhP
as o
f Mar
ch 3
1,
2017
)
(UN
ESC
O)
4N
orth
ern
Iloilo
Fi
sher
y
The
proj
ect
invo
lves
the
reha
bilit
atio
n an
d up
grad
ing
of
the
exis
ting
fish
port
and
fish
ery
faci
litie
s; a
nd5.
5027
6.0
7
The
proj
ect w
as
endo
rsed
by
the
NED
A S
ecre
taria
t to
the
Kore
a In
tern
atio
nal
Coo
pera
tion
Age
ncy
(KO
ICA
) on
23
Reha
bilit
atio
n an
d
capa
city
bui
ldin
g pr
ogra
ms
on
coas
tal a
nd m
arin
e re
habi
litat
ion
and
enfo
rcem
ent,
empl
oym
ent a
ndJa
nuar
y 20
17.
Dev
elop
men
t Pr
ojec
t
livel
ihoo
d sk
ills
deve
lopm
ent,
and
fishe
ry r
esea
rch
and
deve
lopm
ent,
amon
g ot
hers
.Pr
ovin
cial
VI
Gov
ernm
e
Not
e: T
otal
Pro
ject
C
ost i
s ye
t to
be
dete
rmin
ed.
nt o
f Ilo
ilo
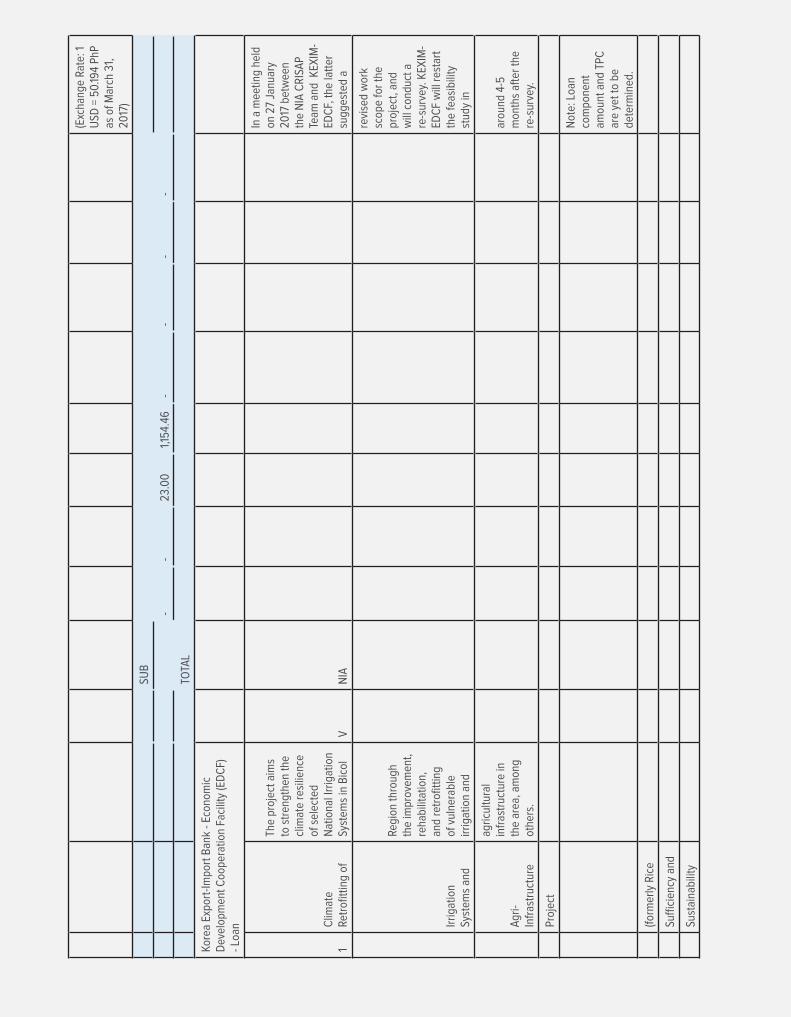
(Exc
hang
e Ra
te: 1
U
SD =
50.
194
PhP
as o
f Mar
ch 3
1,
2017
)
SUB
--
23.0
01,1
54.4
6-
--
-
TOTA
L
Kore
a Ex
port
-Impo
rt B
ank
- Eco
nom
ic
Dev
elop
men
t Coo
pera
tion
Faci
lity
(ED
CF)
- L
oan
1C
limat
e Re
trofi
ttin
g of
The
proj
ect a
ims
to s
tren
gthe
n th
e cl
imat
e re
silie
nce
of s
elec
ted
Nat
iona
l Irr
igat
ion
Syst
ems
in B
icol
VN
IA
In a
mee
ting
held
on
27
Janu
ary
2017
bet
wee
n th
e N
IA C
RIS
AP
Team
and
KEX
IM-
EDC
F, th
e la
tter
su
gges
ted
a
Irrig
atio
n Sy
stem
s an
d
Regi
on th
roug
h th
e im
prov
emen
t, re
habi
litat
ion,
an
d re
trofi
ttin
g of
vul
nera
ble
irrig
atio
n an
d
revi
sed
wor
k sc
ope
for
the
proj
ect,
and
will
con
duct
a
re-s
urve
y. K
EXIM
-ED
CF
will
res
tart
th
e fe
asib
ility
st
udy
in
Agr
i-In
fras
truc
ture
agric
ultu
ral
infr
astr
uctu
re in
th
e ar
ea, a
mon
g ot
hers
.
arou
nd 4
-5
mon
ths
afte
r th
e re
-sur
vey.
Proj
ect
Not
e: L
oan
com
pone
nt
amou
nt a
nd T
PC
are
yet t
o be
de
term
ined
.
(form
erly
Ric
e
Suffi
cien
cy a
nd
Sust
aina
bilit
y
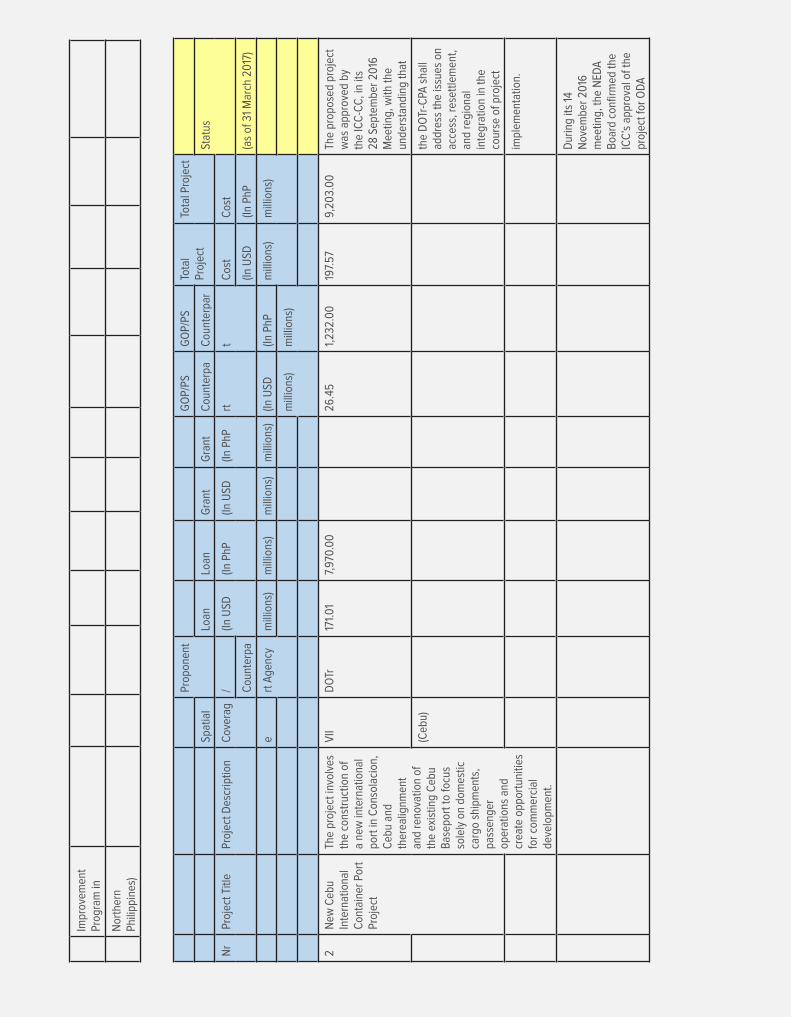
Impr
ovem
ent
Prog
ram
in
Nor
ther
n Ph
ilipp
ines
)
Prop
onen
tG
OP/
PSG
OP/
PSTo
tal
Proj
ect
Tota
l Pro
ject
Spat
ial
Loan
Loan
Gra
ntG
rant
Cou
nter
paC
ount
erpa
rSt
atus
Nr
Proj
ect T
itle
Proj
ect D
escr
iptio
nC
over
ag/
(In U
SD(In
PhP
(In U
SD(In
PhP
rtt
Cos
tC
ost
Cou
nter
pa(In
USD
(In P
hP(a
s of
31
Mar
ch 2
017
)
ert
Age
ncy
mill
ions
)m
illio
ns)
mill
ions
)m
illio
ns)
(In U
SD(In
PhP
mill
ions
)m
illio
ns)
mill
ions
)m
illio
ns)
2N
ew C
ebu
Inte
rnat
iona
lC
onta
iner
Por
t Pr
ojec
t
The
proj
ect i
nvol
ves
the
cons
truc
tion
of
a ne
w in
tern
atio
nal
port
in C
onso
laci
on,
Ceb
u an
d th
erea
lignm
ent
and
reno
vatio
n of
th
e ex
istin
g C
ebu
Bas
epor
t to
focu
s so
lely
on
dom
estic
ca
rgo
ship
men
ts,
pass
enge
r op
erat
ions
and
cr
eate
opp
ortu
nitie
s fo
r co
mm
erci
al
deve
lopm
ent.
VII
DO
Tr17
1.0
17,
970.
00
26.4
51,
232.
00
197.
579,
203.
00
The
prop
osed
pro
ject
w
as a
ppro
ved
by
the
ICC
-CC
, in
its
28 S
epte
mbe
r 20
16
Mee
ting,
with
the
unde
rsta
ndin
g th
at
(Ceb
u)th
e D
OTr
-CPA
sha
ll ad
dres
s th
e is
sues
on
acce
ss, r
eset
tlem
ent,
and
regi
onal
in
tegr
atio
n in
the
cour
se o
f pro
ject
impl
emen
tatio
n.
Dur
ing
its 1
4 N
ovem
ber
2016
m
eetin
g, th
e N
EDA
B
oard
con
firm
ed th
e IC
C’s
app
rova
l of t
he
proj
ect f
or O
DA
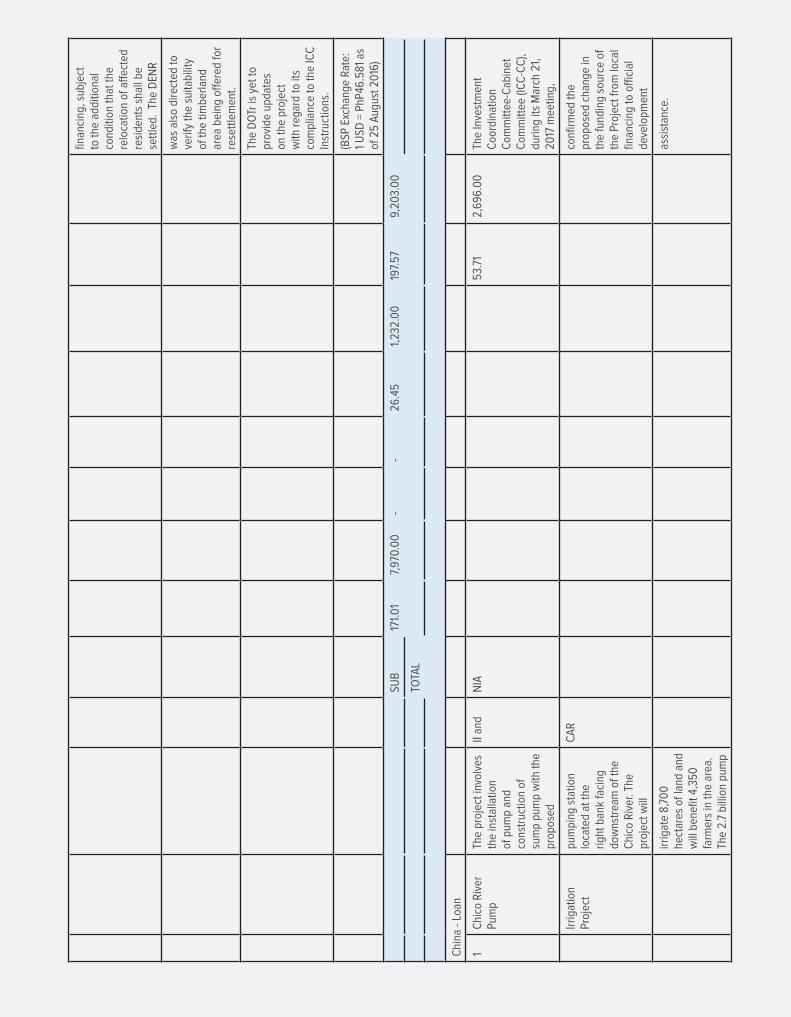
finan
cing
, sub
ject
to
the
addi
tiona
l co
nditi
on th
at th
e re
loca
tion
of a
ffec
ted
resi
dent
s sh
all b
e se
ttle
d. T
he D
ENR
was
als
o di
rect
ed to
ve
rify
the
suita
bilit
y of
the
timbe
rland
ar
ea b
eing
off
ered
for
rese
ttle
men
t.
The
DO
Tr is
yet
to
prov
ide
upda
tes
on th
e pr
ojec
t w
ith r
egar
d to
its
com
plia
nce
to th
e IC
C
Inst
ruct
ions
.
(BSP
Exc
hang
e Ra
te:
1 U
SD =
PhP
46.5
81 a
s of
25
Aug
ust 2
016
)
SUB
171.
01
7,97
0.0
0-
-26
.45
1,23
2.0
019
7.57
9,20
3.0
0
TOTA
L
Chi
na -
Loan
1C
hico
Riv
er
Pum
pTh
e pr
ojec
t inv
olve
s th
e in
stal
latio
n of
pum
p an
d co
nstr
uctio
n of
su
mp
pum
p w
ith th
e pr
opos
ed
II an
dN
IA53
.71
2,69
6.0
0Th
e In
vest
men
t C
oord
inat
ion
Com
mitt
ee-C
abin
et
Com
mitt
ee (I
CC
-CC
), du
ring
its M
arch
21,
20
17 m
eetin
g,
Irrig
atio
n Pr
ojec
tpu
mpi
ng s
tatio
n lo
cate
d at
the
right
ban
k fa
cing
do
wns
trea
m o
f the
C
hico
Riv
er. T
he
proj
ect w
ill
CA
Rco
nfirm
ed th
e pr
opos
ed c
hang
e in
th
e fu
ndin
g so
urce
of
the
Proj
ect f
rom
loca
l fin
anci
ng to
offi
cial
de
velo
pmen
t
irrig
ate
8,70
0
hect
ares
of l
and
and
will
ben
efit 4
,350
fa
rmer
s in
the
area
. Th
e 2.
7 bi
llion
pum
p
assi
stan
ce.

irrig
atio
n pr
ojec
t ta
rget
s 21
ba
rang
ays
in
Cag
ayan
and
K
alin
ga a
nd
expe
cted
to fi
nish
w
ithin
3-y
ear
perio
d.(E
xcha
nge
Rate
: 1 U
SD
= Ph
P50.
194
Sour
ce:
BSP
Rat
e as
of 3
1 M
arch
20
17)
2N
ew
Cen
tenn
ial
Wat
er
The
proj
ect i
nvol
ves
the
cons
truc
tion
of a
dam
and
co
nvey
ance
tunn
el
that
will
pro
vide
ad
ditio
nal
IV-A
MW
SS37
3.0
318
,724
.00
The
Inve
stm
ent
Coo
rdin
atio
n C
omm
ittee
-Cab
inet
C
omm
ittee
(IC
C-C
C),
durin
g its
Mar
ch 2
1,
2017
mee
ting,
Sour
ce -
K
aliw
a D
am60
0m
illio
n lit
ers
of
raw
wat
er to
ens
ure
wat
er s
ecur
ity in
th
e w
hole
of M
etro
M
anila
and
par
ts o
f
confi
rmed
the
prop
osed
cha
nge
in
the
fund
ing
sour
ce
of th
e Pr
ojec
t fro
m
Publ
ic-P
rivat
e Pa
rtne
rshi
p to
Offi
cial
Proj
ect
Cav
ite a
nd R
izal
. It
aim
s to
mee
t fu
ture
pot
able
wat
er
dem
and
and
as a
re
dund
ant w
ater
so
urce
,
Dev
elop
men
t A
ssis
tanc
e.
ther
eby
redu
cing
th
e de
pend
ence
on
the
Ang
at D
am
Rese
rvoi
r.
(Exc
hang
e Ra
te: 1
USD
=
PhP5
0.19
4 So
urce
: B
SP R
ate
as o
f 31
Mar
ch 2
017
)
3N
orth
-Sou
th
Railw
ayTh
e pr
ojec
t inv
olve
s th
e co
nstr
uctio
n an
d su
bseq
uent
op
erat
ion
and
mai
nten
ance
(O&
M)
of a
581
-
NC
R, I
V-D
OTr
2,36
8.81
118,
900.
00
The
Inve
stm
ent
Coo
rdin
atio
n C
omm
ittee
-Cab
inet
C
omm
ittee
(IC
C-C
C),
durin
g its
Mar
ch 2
1,
2017
mee
ting,

Proj
ect
(NSR
P)-S
outh
kilo
met
er s
tand
ard-
gaug
e lo
ng-h
aul
railw
ay o
pera
tions
fr
om L
os B
años
to
Mat
nog
and
a br
anch
line
A a
nd V
appr
oved
the
prop
osal
of
the
DO
Tr to
shi
ft
the
proc
urem
ent
mod
e of
the
capi
tal
requ
irem
ents
of t
he
proj
ect f
rom
Line
(Lon
g H
aul)
from
Cal
amba
to
Bat
anga
s. T
he
proj
ect a
ims
to
achi
eve
less
than
5-
hour
trav
el ti
me
from
Man
ila to
Publ
ic-P
rivat
e Pa
rtne
rshi
p to
O
ffici
al D
evel
opm
ent
Ass
ista
nce.
Lega
zpi.
Per
DO
Tr L
ette
r to
D
OF
date
d 13
Jan
uary
20
17, t
he D
OTr
is
prep
arin
g to
pro
cure
a
cons
ulta
nt to
upd
ate
the
Det
aile
d Fe
asib
ility
St
udy
for
the
long
-ha
ul s
egm
ent.
(Exc
hang
e Ra
te: 1
USD
=
PhP5
0.19
4 So
urce
: B
SP R
ate
as o
f 31
Mar
ch 2
017
)
4M
inda
nao
Railw
ayTh
e ra
ilway
pro
ject
ai
ms
to c
onne
ct
key
Min
dana
o ci
ties
incl
udin
g D
avao
, Zam
boan
ga,
But
uan,
AR
MM
,D
OTr
628.
4531
,544
.41
F/S
for
Phas
e 1
(Tag
um-D
avao
-Dig
os
segm
ent)
to b
e su
bmitt
ed to
NED
A.
Proj
ect
Surig
ao, C
agay
an
de O
ro, I
ligan
, an
d G
ener
al
Sant
os in
ord
er
to s
pur
econ
omic
de
velo
pmen
t in
the
Regi
ons
regi
on.
IX, X
, XI,
Not
e: T
otal
Pro
ject
C
ost i
s fo
r Ph
ase
1 on
ly.
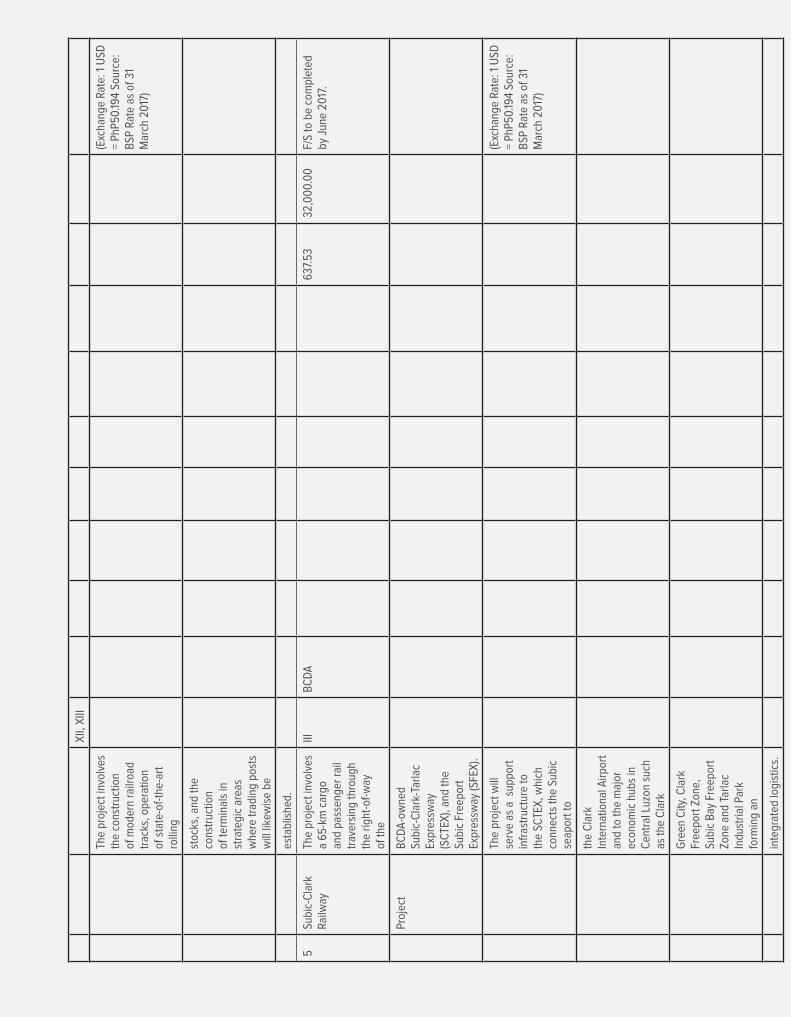
XII,
XIII
The
proj
ect i
nvol
ves
the
cons
truc
tion
of m
oder
n ra
ilroa
d tr
acks
, ope
ratio
n of
sta
te-o
f-th
e-ar
t ro
lling
(Exc
hang
e Ra
te: 1
USD
=
PhP5
0.19
4 So
urce
: B
SP R
ate
as o
f 31
Mar
ch 2
017
)
stoc
ks, a
nd th
e co
nstr
uctio
n of
term
inal
s in
st
rate
gic
area
s w
here
trad
ing
post
s w
ill li
kew
ise
be
esta
blis
hed.
5Su
bic-
Cla
rk
Railw
ayTh
e pr
ojec
t inv
olve
s a
65-k
m c
argo
an
d pa
ssen
ger
rail
trav
ersi
ng th
roug
h th
e rig
ht-o
f-w
ay
of th
e
IIIB
CD
A63
7.53
32,0
00.
00
F/S
to b
e co
mpl
eted
by
Jun
e 20
17.
Proj
ect
BC
DA
-ow
ned
Subi
c-C
lark
-Tar
lac
Expr
essw
ay
(SC
TEX
), an
d th
e Su
bic
Free
port
Ex
pres
sway
(SFE
X).
The
proj
ect w
ill
serv
e as
a s
uppo
rt
infr
astr
uctu
re to
th
e SC
TEX
, whi
ch
conn
ects
the
Subi
c se
apor
t to
(Exc
hang
e Ra
te: 1
USD
=
PhP5
0.19
4 So
urce
: B
SP R
ate
as o
f 31
Mar
ch 2
017
)
the
Cla
rk
Inte
rnat
iona
l Airp
ort
and
to th
e m
ajor
ec
onom
ic h
ubs
in
Cen
tral
Luz
on s
uch
as th
e C
lark
Gre
en C
ity, C
lark
Fr
eepo
rt Z
one,
Su
bic
Bay
Fre
epor
t Zo
ne a
nd T
arla
c In
dust
rial P
ark
form
ing
an
inte
grat
ed lo
gist
ics.
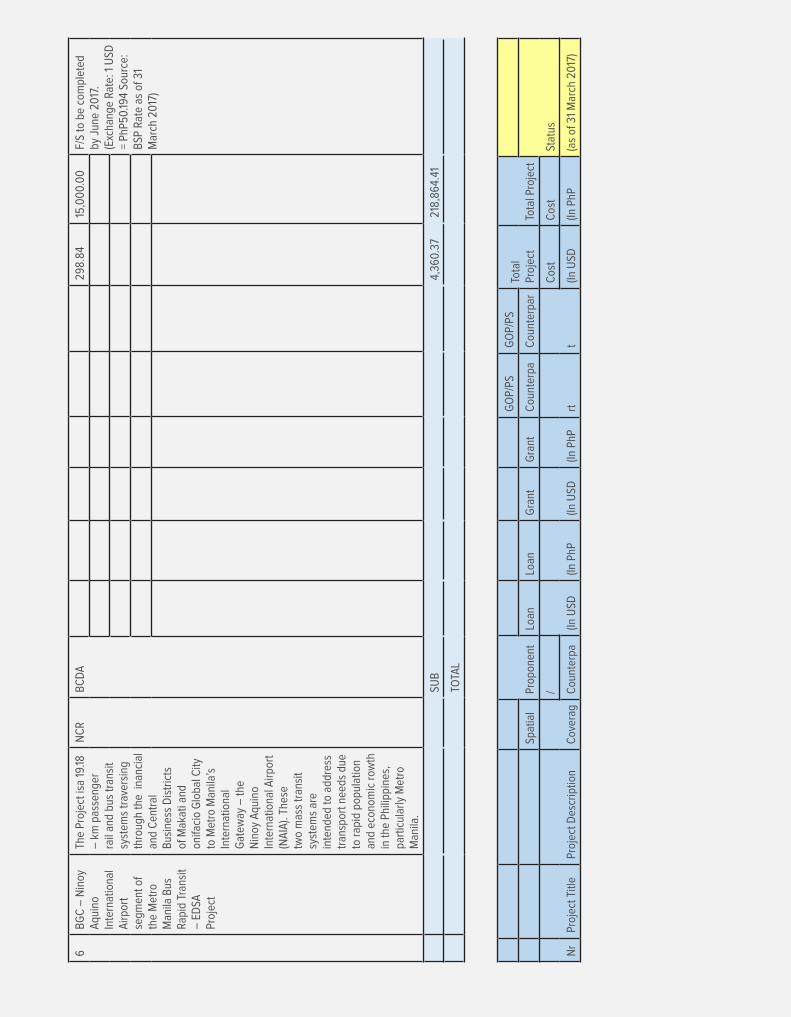
6B
GC
– N
inoy
A
quin
o In
tern
atio
nal
Airp
ort
segm
ent o
f th
e M
etro
Man
ila B
us
Rapi
d Tr
ansi
t–
ED
SA
Proj
ect
The
Proj
ect i
sa 1
9.18
–
km
pas
seng
er
rail
and
bus
tran
sit
syst
ems
trav
ersi
ng
thro
ugh
the
inan
cial
and
Cen
tral
B
usin
ess
Dis
tric
ts
of M
akat
i and
on
ifaci
o G
loba
l City
to
Met
ro M
anila
’s
Inte
rnat
iona
l G
atew
ay –
the
Nin
oy A
quin
o In
tern
atio
nal A
irpor
t (N
AIA
). Th
ese
two
mas
s tr
ansi
t sy
stem
s ar
ein
tend
ed to
add
ress
tr
ansp
ort n
eeds
due
to
rap
id p
opul
atio
n an
d ec
onom
ic r
owth
in
the
Phili
ppin
es,
part
icul
arly
Met
ro
Man
ila.
NC
RB
CD
A29
8.84
15,0
00.
00
F/S
to b
e co
mpl
eted
by
Jun
e 20
17.
(Exc
hang
e Ra
te: 1
USD
=
PhP5
0.19
4 So
urce
: B
SP R
ate
as o
f 31
Mar
ch 2
017
)
SUB
4,36
0.37
218,
864.
41
TOTA
L
Prop
onen
t
GO
P/PS
GO
P/PS
Tota
l Pr
ojec
tTo
tal P
roje
ctSp
atia
lLo
anLo
anG
rant
Gra
ntC
ount
erpa
Cou
nter
par
Stat
us
Nr
Proj
ect T
itle
Proj
ect D
escr
iptio
nC
over
ag
/
(In U
SD(In
PhP
(In U
SD(In
PhP
rtt
Cos
tC
ost
Cou
nter
pa(In
USD
(In P
hP(a
s of
31
Mar
ch 2
017
)
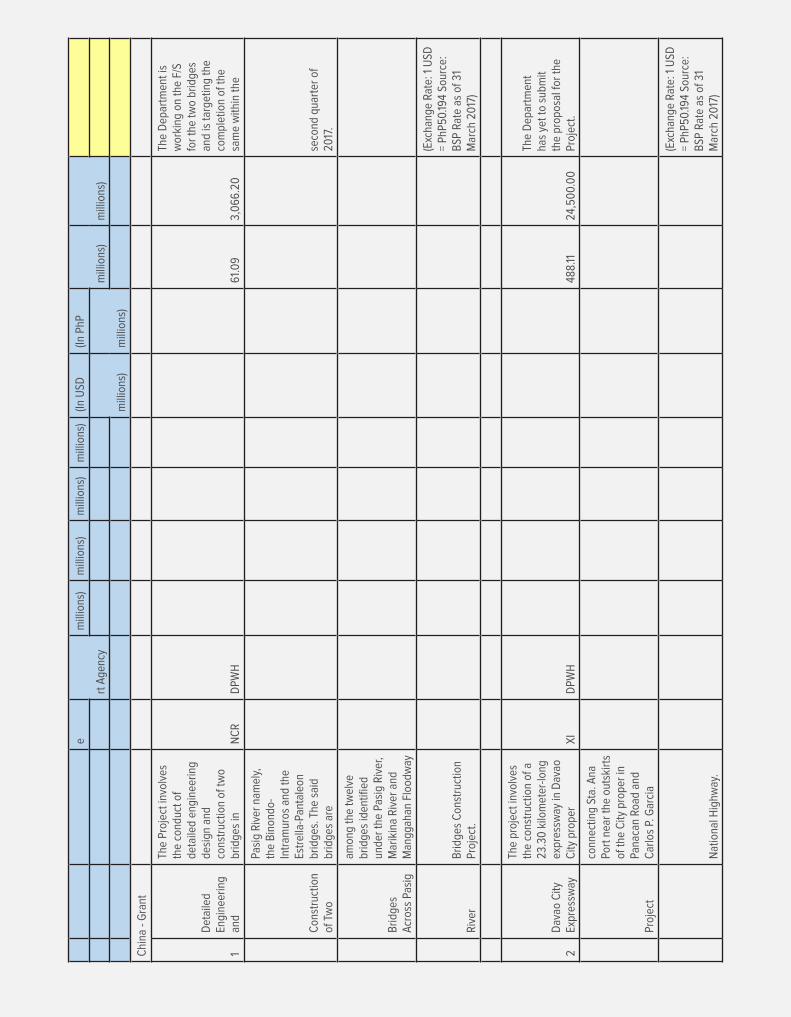
e
rt A
genc
y
mill
ions
)m
illio
ns)
mill
ions
)m
illio
ns)
(In U
SD(In
PhP
mill
ions
)m
illio
ns)
mill
ions
)m
illio
ns)
Chi
na -
Gra
nt
1
Det
aile
d En
gine
erin
g an
d
The
Proj
ect i
nvol
ves
the
cond
uct o
f de
taile
d en
gine
erin
g de
sign
and
co
nstr
uctio
n of
two
brid
ges
inN
CR
DPW
H61
.09
3,0
66.2
0
The
Dep
artm
ent i
s w
orki
ng o
n th
e F/
S fo
r th
e tw
o br
idge
s an
d is
targ
etin
g th
e co
mpl
etio
n of
the
sam
e w
ithin
the
Con
stru
ctio
n of
Tw
o
Pasi
g R
iver
nam
ely,
th
e B
inon
do-
Intr
amur
os a
nd th
e Es
trel
la-P
anta
leon
br
idge
s. T
he s
aid
brid
ges
are
seco
nd q
uart
er o
f 20
17.
Brid
ges
Acr
oss
Pasi
g
amon
g th
e tw
elve
br
idge
s id
entifi
ed
unde
r th
e Pa
sig
Riv
er,
Mar
ikin
a R
iver
and
M
angg
ahan
Flo
odw
ay
Riv
erB
ridge
s C
onst
ruct
ion
Proj
ect.
(Exc
hang
e Ra
te: 1
USD
=
PhP5
0.19
4 So
urce
: B
SP R
ate
as o
f 31
Mar
ch 2
017
)
2D
avao
City
Ex
pres
sway
The
proj
ect i
nvol
ves
the
cons
truc
tion
of a
23
.30
kilo
met
er-lo
ng
expr
essw
ay in
Dav
ao
City
pro
per
XI
DPW
H48
8.11
24,5
00.
00
The
Dep
artm
ent
has
yet t
o su
bmit
the
prop
osal
for
the
Proj
ect.
Proj
ect
conn
ectin
g St
a. A
na
Port
nea
r th
e ou
tski
rts
of th
e C
ity p
rope
r in
Pa
naca
n Ro
ad a
nd
Car
los
P. G
arci
a
Nat
iona
l Hig
hway
.
(Exc
hang
e Ra
te: 1
USD
=
PhP5
0.19
4 So
urce
: B
SP R
ate
as o
f 31
Mar
ch 2
017
)

3
Pana
y-G
uim
aras
-N
egro
s
The
proj
ect i
nvol
ves
the
cons
truc
tion
of
isla
nd b
ridge
s to
in
duce
eco
nom
ic
deve
lopm
ent a
nd
rem
ove
VI,
XV
IIID
PWH
541.
04
27,15
6.81
On
Mar
ch 2
4, 2
017
, th
e re
ques
t for
the
cond
uct o
f F/S
for
the
proj
ect w
as
forw
arde
d as
par
t of
the
Nat
ionw
ide
Isla
nd
Brid
ges
(F/S
)
exis
ting
tran
spor
tatio
n co
nstr
aint
s in
the
regi
on.
Isla
nd P
rovi
nces
Li
nk B
ridge
s fo
r Su
stai
ned
Econ
omic
G
row
th P
roje
ct to
th
e D
epar
tmen
t of
Fina
nce,
for
onw
ard
tran
smitt
al to
the
Chi
nese
Gov
ernm
ent.
(Exc
hang
e Ra
te: 1
USD
=
PhP5
0.19
4 So
urce
: B
SP R
ate
as o
f 31
Mar
ch 2
017
)
4C
ebu-
Boh
ol
Link
Brid
ge
The
proj
ect i
nvol
ves
the
cons
truc
tion
of
a 27
.5 k
m lo
ng s
pan
brid
ge to
faci
litat
e co
nnec
tivity
bet
wee
nV
IID
PWH
1,128
.01
56,6
19.5
8
On
Mar
ch 2
4, 2
017
, th
e re
ques
t for
the
cond
uct o
f F/S
for
the
proj
ect w
as
forw
arde
d as
par
t of
the
Nat
ionw
ide
(F/S
)B
ohol
and
Ceb
u.
Isla
nd P
rovi
nces
Li
nk B
ridge
s fo
r Su
stai
ned
Econ
omic
G
row
th P
roje
ct to
th
e D
epar
tmen
t of
Fina
nce,
for
onw
ard
tran
smitt
al to
the
Chi
nese
Gov
ernm
ent.
(Exc
hang
e Ra
te: 1
USD
=
PhP5
0.19
4 So
urce
: B
SP R
ate
as o
f 31
Mar
ch 2
017
)
5N
orth
Luz
on
Expr
essw
ay
It ai
ms
at p
rom
otin
g pr
oduc
tive
rura
l en
terp
rises
and
val
ue
chai
n de
velo
pmen
t; in
crea
sing
II, II
ID
PWH
888.
7544
,610
.09
For
subm
issi
on to
N
EDA
.

East
Pro
ject
(F
/S)
com
petit
iven
ess
and
ease
of d
oing
bu
sine
ss; i
nves
ting
in h
uman
cap
ital
and
inno
vativ
e te
chno
logi
es;
and
mat
chin
g sk
ills
deve
lopm
ent w
ith
priv
ate
sect
or
dem
and.
(Exc
hang
e Ra
te: 1
USD
=
PhP5
0.19
4 So
urce
: B
SP R
ate
as o
f 31
Mar
ch 2
017
)
6
Din
agat
(L
eyte
)-Su
rigao
The
proj
ect i
nvol
ves
the
cons
truc
tion
of a
23
kilo
met
er
Und
erw
ater
Tun
nel
brid
ge c
onne
ctin
g Le
yte
VIII
, XIII
DPW
H94
3.43
47,3
54.5
5
On
Mar
ch 2
4, 2
017
, th
e re
ques
t for
the
cond
uct o
f F/S
for
the
proj
ect w
as
forw
arde
d as
par
t of
the
Nat
ionw
ide
Link
Brid
ge
(F/S
)an
d M
inda
nao
Isla
nd.
Isla
nd P
rovi
nces
Li
nk B
ridge
s fo
r Su
stai
ned
Econ
omic
G
row
th P
roje
ct to
th
e D
epar
tmen
t of
Fina
nce,
for
onw
ard
tran
smitt
al to
the
Chi
nese
Gov
ernm
ent.
(Exc
hang
e Ra
te: 1
USD
=
PhP5
0.19
4 So
urce
: B
SP R
ate
as o
f 31
Mar
ch 2
017
)
7Lu
zon-
Sam
ar
Link
Brid
ge
The
proj
ect i
nvol
ves
the
cons
truc
tion
of
thre
e (3
) lon
g sp
an
brid
ges
(Alle
n-Sa
n A
nton
io, 4
.9V,
VIII
DPW
H1,1
48.5
257
,649
.02
On
Mar
ch 2
4, 2
017
, th
e re
ques
t for
the
cond
uct o
f F/S
for
the
proj
ect w
as
forw
arde
d as
par
t of
the
Nat
ionw
ide
(F/S
)
kilo
met
ers;
San
A
nton
io-C
apul
, 8.
5 ki
lom
eter
s;
Cap
ul-M
atno
g, 1
2 ki
lom
eter
s) to
con
nect
Sa
mar
to th
e
Isla
nd P
rovi
nces
Li
nk B
ridge
s fo
r Su
stai
ned
Econ
omic
G
row
th P
roje
ct to
th
e D
epar
tmen
t of
Fina
nce,
for
onw
ard
mai
n is
land
of L
uzon
(A
llen-
Mat
nog)
.tr
ansm
ittal
to th
e C
hine
se G
over
nmen
t.

(Exc
hang
e Ra
te: 1
USD
=
PhP5
0.19
4 So
urce
: B
SP R
ate
as o
f 31
Mar
ch 2
017
)
8B
ohol
-Ley
te
Link
Brid
ge
The
proj
ect i
nvol
ves
the
cons
truc
tion
of a
20
kilo
met
er
long
-spa
n br
idge
, 11
kilo
met
er r
oad
and
a 4
VII,
VIII
DPW
H1,
435.
6672
,061
.28
On
Mar
ch 2
4, 2
017
, th
e re
ques
t for
the
cond
uct o
f F/S
for
the
proj
ect w
as
forw
arde
d as
par
t of
the
Nat
ionw
ide
(F/S
)
kilo
met
er c
ause
way
to
faci
litat
e th
e In
ter-
Regi
onal
Con
nect
ivity
be
twee
n B
ohol
and
Le
yte.
Isla
nd P
rovi
nces
Li
nk B
ridge
s fo
r Su
stai
ned
Econ
omic
G
row
th P
roje
ct to
th
e D
epar
tmen
t of
Fina
nce,
for
onw
ard
tran
smitt
al to
the
Chi
nese
Gov
ernm
ent.
(Exc
hang
e Ra
te: 1
USD
=
PhP5
0.19
4 So
urce
: B
SP R
ate
as o
f 31
Mar
ch 2
017
)
9N
egro
s-C
ebu
Link
Brid
ge
The
proj
ect i
nvol
ves
the
cons
truc
tion
of
a 5
kilo
met
er lo
ng
span
brid
ge w
ith 2
ki
lom
eter
s ca
usew
ay
toV
II, X
VIII
DPW
H28
7.13
14,4
12.2
6
On
Mar
ch 2
4, 2
017
, th
e re
ques
t for
the
cond
uct o
f F/S
for
the
proj
ect w
as
forw
arde
d as
par
t of
the
Nat
ionw
ide
(F/S
)di
rect
ly li
nk N
egro
s an
d C
ebu
Isla
nd P
rovi
nces
Li
nk B
ridge
s fo
r Su
stai
ned
Econ
omic
G
row
th P
roje
ct to
th
e D
epar
tmen
t of
Fina
nce,
for
onw
ard
tran
smitt
al to
the
Chi
nese
Gov
ernm
ent.
(Exc
hang
e Ra
te: 1
USD
=
PhP5
0.19
4 So
urce
: B
SP R
ate
as o
f 31
Mar
ch 2
017
)
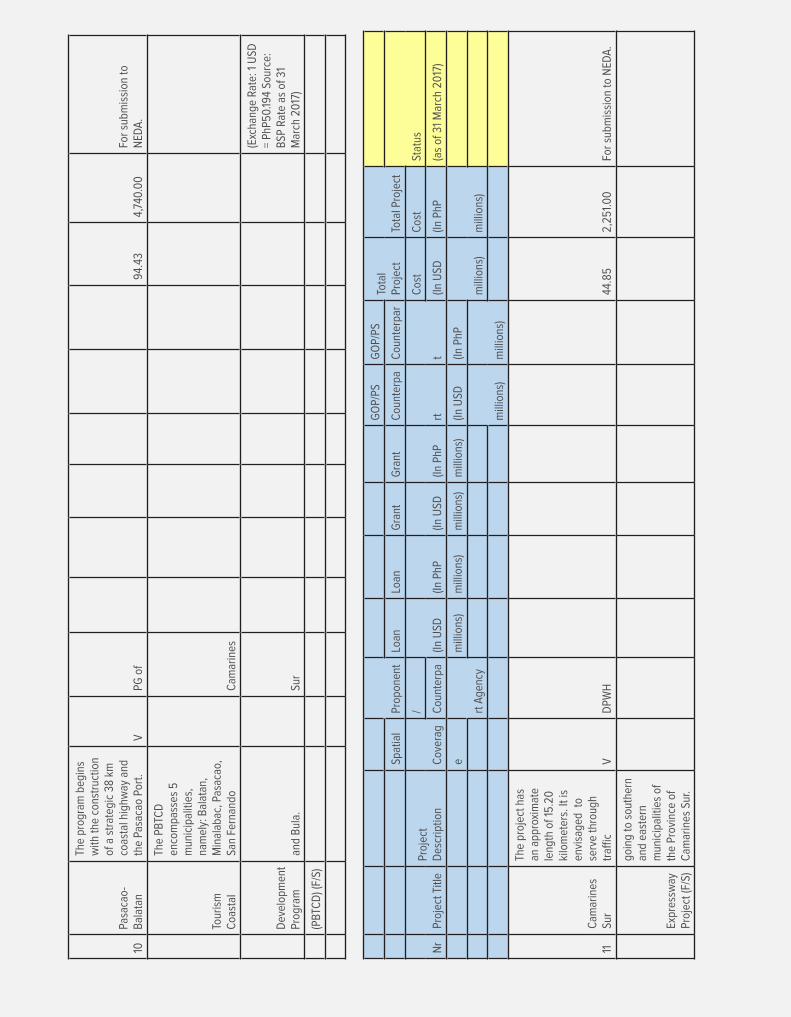
10Pa
saca
o-B
alat
an
The
prog
ram
beg
ins
with
the
cons
truc
tion
of a
str
ateg
ic 3
8 km
co
asta
l hig
hway
and
th
e Pa
saca
o Po
rt.
VPG
of
94.4
34,
740.
00
For
subm
issi
on to
N
EDA
.
Tour
ism
C
oast
al
The
PBTC
D
enco
mpa
sses
5
mun
icip
aliti
es,
nam
ely:
Bal
atan
, M
inal
abac
, Pas
acao
, Sa
n Fe
rnan
doC
amar
ines
Dev
elop
men
t Pr
ogra
man
d B
ula.
Sur
(Exc
hang
e Ra
te: 1
USD
=
PhP5
0.19
4 So
urce
: B
SP R
ate
as o
f 31
Mar
ch 2
017
)
(PB
TCD
) (F/
S)
Prop
onen
t
GO
P/PS
GO
P/PS
Tota
l Pr
ojec
tTo
tal P
roje
ctSp
atia
lLo
anLo
anG
rant
Gra
ntC
ount
erpa
Cou
nter
par
Stat
us
Nr
Proj
ect T
itle
Proj
ect
Des
crip
tion
Cov
erag
/
(In U
SD(In
PhP
(In U
SD(In
PhP
rtt
Cos
tC
ost
Cou
nter
pa(In
USD
(In P
hP(a
s of
31
Mar
ch 2
017
)
e
rt A
genc
y
mill
ions
)m
illio
ns)
mill
ions
)m
illio
ns)
(In U
SD(In
PhP
mill
ions
)m
illio
ns)
mill
ions
)m
illio
ns)
11C
amar
ines
Su
r
The
proj
ect h
as
an a
ppro
xim
ate
leng
th o
f 15.
20
kilo
met
ers.
It is
en
visa
ged
to
serv
e th
roug
h tr
affic
VD
PWH
44.8
52,
251.
00
For
subm
issi
on to
NED
A.
Expr
essw
ay
Proj
ect (
F/S)
goin
g to
sou
ther
n an
d ea
ster
n m
unic
ipal
ities
of
the
Prov
ince
of
Cam
arin
es S
ur.
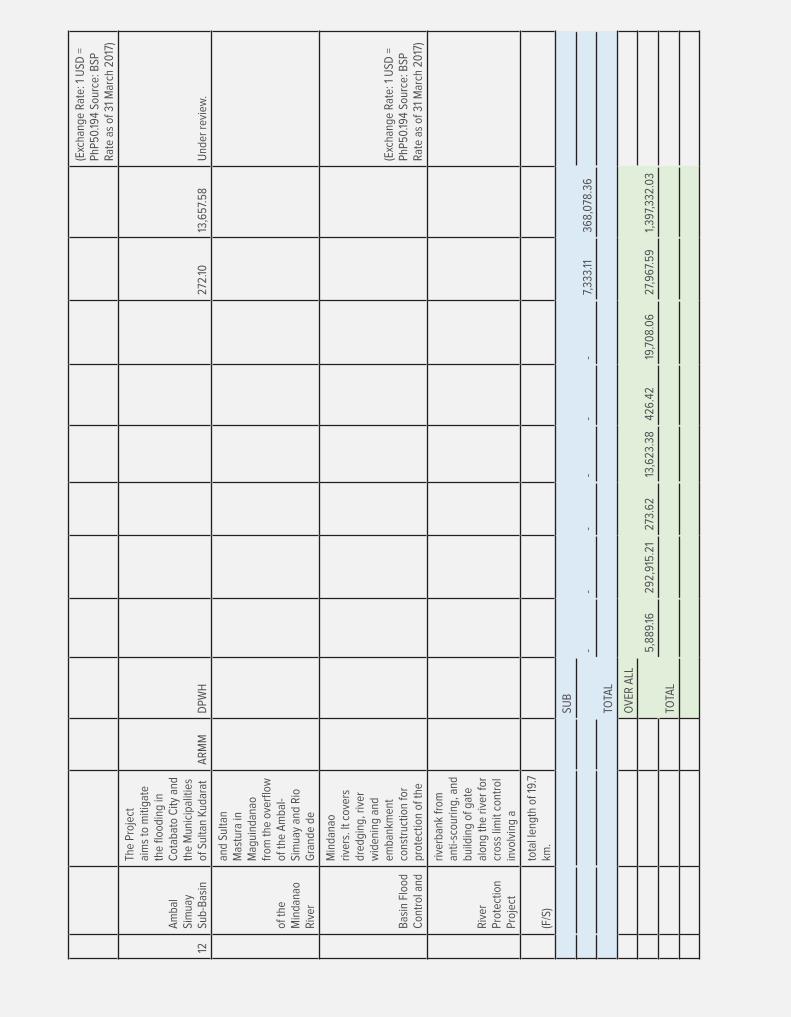
(Exc
hang
e Ra
te: 1
USD
=
PhP5
0.19
4 So
urce
: BSP
Ra
te a
s of
31
Mar
ch 2
017
)
12
Am
bal
Sim
uay
Sub-
Bas
in
The
Proj
ect
aim
s to
miti
gate
th
e flo
odin
g in
C
otab
ato
City
and
th
e M
unic
ipal
ities
of
Sul
tan
Kuda
rat
AR
MM
DPW
H27
2.10
13,6
57.5
8U
nder
rev
iew
.
of th
e M
inda
nao
Riv
er
and
Sulta
n M
astu
ra in
M
agui
ndan
ao
from
the
over
flow
of
the
Am
bal-
Sim
uay
and
Rio
G
rand
e de
Bas
in F
lood
C
ontr
ol a
nd
Min
dana
o riv
ers.
It c
over
s dr
edgi
ng, r
iver
w
iden
ing
and
emba
nkm
ent
cons
truc
tion
for
prot
ectio
n of
the
(Exc
hang
e Ra
te: 1
USD
=
PhP5
0.19
4 So
urce
: BSP
Ra
te a
s of
31
Mar
ch 2
017
)
Riv
er
Prot
ectio
n Pr
ojec
t
river
bank
from
an
ti-sc
ourin
g, a
nd
build
ing
of g
ate
alon
g th
e riv
er fo
r cr
oss
limit
cont
rol
invo
lvin
g a
(F/S
)to
tal l
engt
h of
19.
7 km
.
SUB
--
--
--
7,33
3.11
368,
078
.36
TOTA
L
OV
ER A
LL
5,88
9.16
292,
915.
2127
3.62
13,6
23.3
842
6.42
19,7
08.
06
27,9
67.5
91,
397,
332.
03
TOTA
L
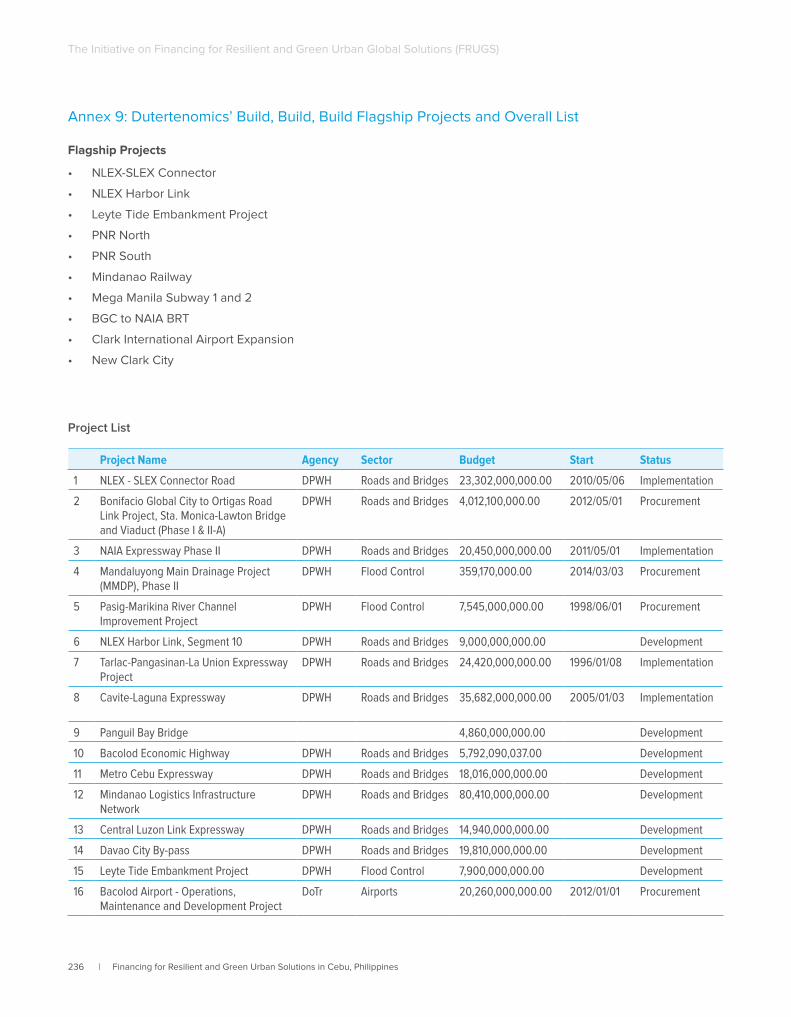
236 | Financing for Resilient and Green Urban Solutions in Cebu, Philippines
The Initiative on Financing for Resilient and Green Urban Global Solutions (FRUGS)
Annex 9: Dutertenomics’ Build, Build, Build Flagship Projects and Overall List
Flagship Projects
• NLEX-SLEX Connector
• NLEX Harbor Link
• Leyte Tide Embankment Project
• PNR North
• PNR South
• Mindanao Railway
• Mega Manila Subway 1 and 2
• BGC to NAIA BRT
• Clark International Airport Expansion
• New Clark City
Project List
Project Name Agency Sector Budget Start Status
1 NLEX - SLEX Connector Road DPWH Roads and Bridges 23,302,000,000.00 2010/05/06 Implementation
2 Bonifacio Global City to Ortigas Road Link Project, Sta. Monica-Lawton Bridge and Viaduct (Phase I & II-A)
DPWH Roads and Bridges 4,012,100,000.00 2012/05/01 Procurement
3 NAIA Expressway Phase II DPWH Roads and Bridges 20,450,000,000.00 2011/05/01 Implementation
4 Mandaluyong Main Drainage Project (MMDP), Phase II
DPWH Flood Control 359,170,000.00 2014/03/03 Procurement
5 Pasig-Marikina River Channel Improvement Project
DPWH Flood Control 7,545,000,000.00 1998/06/01 Procurement
6 NLEX Harbor Link, Segment 10 DPWH Roads and Bridges 9,000,000,000.00 Development
7 Tarlac-Pangasinan-La Union Expressway Project
DPWH Roads and Bridges 24,420,000,000.00 1996/01/08 Implementation
8 Cavite-Laguna Expressway DPWH Roads and Bridges 35,682,000,000.00 2005/01/03 Implementation
9 Panguil Bay Bridge 4,860,000,000.00 Development
10 Bacolod Economic Highway DPWH Roads and Bridges 5,792,090,037.00 Development
11 Metro Cebu Expressway DPWH Roads and Bridges 18,016,000,000.00 Development
12 Mindanao Logistics Infrastructure Network
DPWH Roads and Bridges 80,410,000,000.00 Development
13 Central Luzon Link Expressway DPWH Roads and Bridges 14,940,000,000.00 Development
14 Davao City By-pass DPWH Roads and Bridges 19,810,000,000.00 Development
15 Leyte Tide Embankment Project DPWH Flood Control 7,900,000,000.00 Development
16 Bacolod Airport - Operations, Maintenance and Development Project
DoTr Airports 20,260,000,000.00 2012/01/01 Procurement
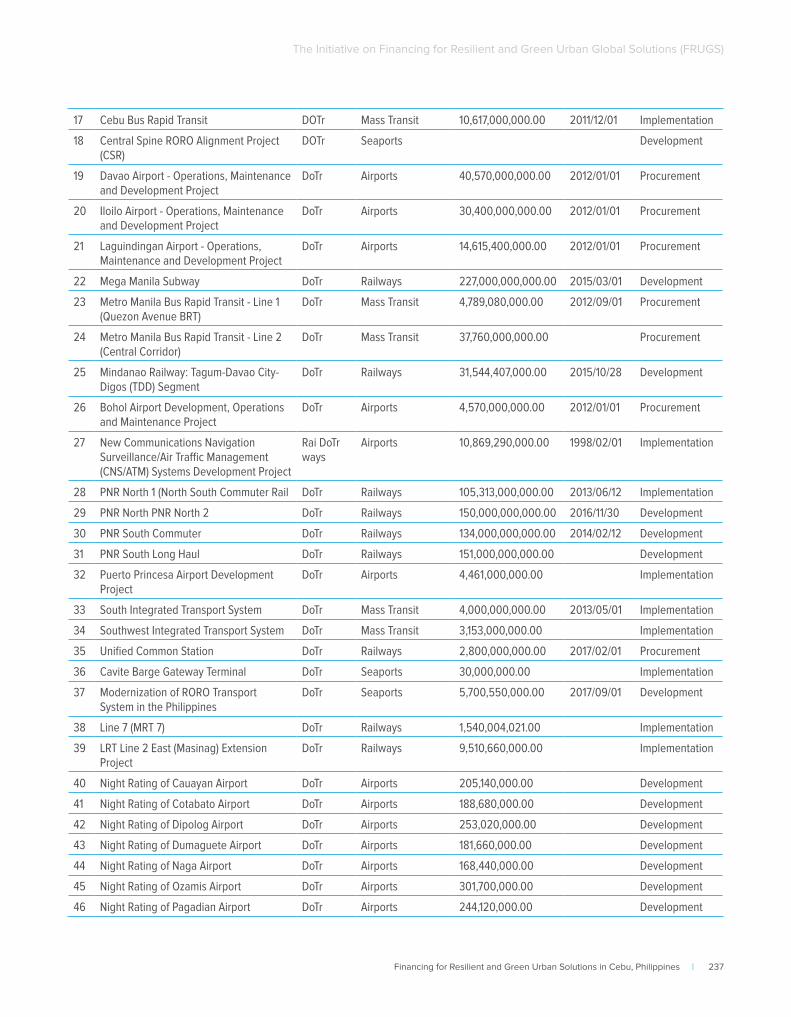
Financing for Resilient and Green Urban Solutions in Cebu, Philippines | 237
The Initiative on Financing for Resilient and Green Urban Global Solutions (FRUGS)
17 Cebu Bus Rapid Transit DOTr Mass Transit 10,617,000,000.00 2011/12/01 Implementation
18 Central Spine RORO Alignment Project (CSR)
DOTr Seaports Development
19 Davao Airport - Operations, Maintenance and Development Project
DoTr Airports 40,570,000,000.00 2012/01/01 Procurement
20 Iloilo Airport - Operations, Maintenance and Development Project
DoTr Airports 30,400,000,000.00 2012/01/01 Procurement
21 Laguindingan Airport - Operations, Maintenance and Development Project
DoTr Airports 14,615,400,000.00 2012/01/01 Procurement
22 Mega Manila Subway DoTr Railways 227,000,000,000.00 2015/03/01 Development
23 Metro Manila Bus Rapid Transit - Line 1 (Quezon Avenue BRT)
DoTr Mass Transit 4,789,080,000.00 2012/09/01 Procurement
24 Metro Manila Bus Rapid Transit - Line 2 (Central Corridor)
DoTr Mass Transit 37,760,000,000.00 Procurement
25 Mindanao Railway: Tagum-Davao City-Digos (TDD) Segment
DoTr Railways 31,544,407,000.00 2015/10/28 Development
26 Bohol Airport Development, Operations and Maintenance Project
DoTr Airports 4,570,000,000.00 2012/01/01 Procurement
27 New Communications Navigation Surveillance/Air Traffic Management (CNS/ATM) Systems Development Project
Rai DoTr ways
Airports 10,869,290,000.00 1998/02/01 Implementation
28 PNR North 1 (North South Commuter Rail DoTr Railways 105,313,000,000.00 2013/06/12 Implementation
29 PNR North PNR North 2 DoTr Railways 150,000,000,000.00 2016/11/30 Development
30 PNR South Commuter DoTr Railways 134,000,000,000.00 2014/02/12 Development
31 PNR South Long Haul DoTr Railways 151,000,000,000.00 Development
32 Puerto Princesa Airport Development Project
DoTr Airports 4,461,000,000.00 Implementation
33 South Integrated Transport System DoTr Mass Transit 4,000,000,000.00 2013/05/01 Implementation
34 Southwest Integrated Transport System DoTr Mass Transit 3,153,000,000.00 Implementation
35 Unified Common Station DoTr Railways 2,800,000,000.00 2017/02/01 Procurement
36 Cavite Barge Gateway Terminal DoTr Seaports 30,000,000.00 Implementation
37 Modernization of RORO Transport System in the Philippines
DoTr Seaports 5,700,550,000.00 2017/09/01 Development
38 Line 7 (MRT 7) DoTr Railways 1,540,004,021.00 Implementation
39 LRT Line 2 East (Masinag) Extension Project
DoTr Railways 9,510,660,000.00 Implementation
40 Night Rating of Cauayan Airport DoTr Airports 205,140,000.00 Development
41 Night Rating of Cotabato Airport DoTr Airports 188,680,000.00 Development
42 Night Rating of Dipolog Airport DoTr Airports 253,020,000.00 Development
43 Night Rating of Dumaguete Airport DoTr Airports 181,660,000.00 Development
44 Night Rating of Naga Airport DoTr Airports 168,440,000.00 Development
45 Night Rating of Ozamis Airport DoTr Airports 301,700,000.00 Development
46 Night Rating of Pagadian Airport DoTr Airports 244,120,000.00 Development
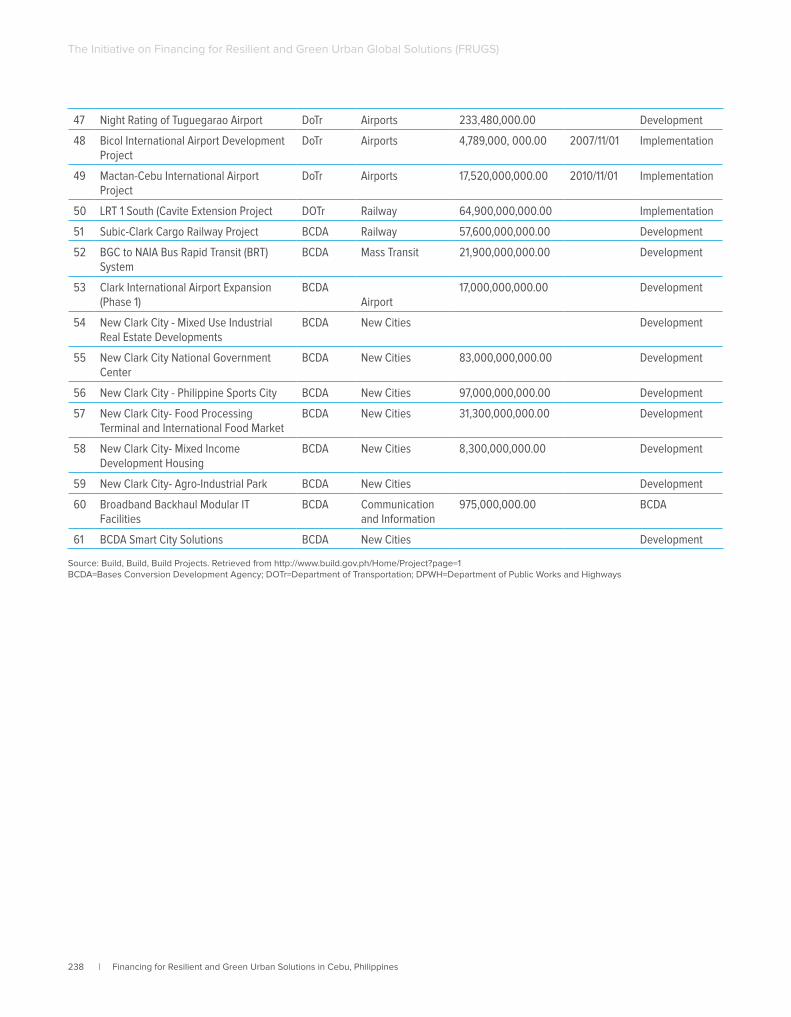
238 | Financing for Resilient and Green Urban Solutions in Cebu, Philippines
The Initiative on Financing for Resilient and Green Urban Global Solutions (FRUGS)
47 Night Rating of Tuguegarao Airport DoTr Airports 233,480,000.00 Development
48 Bicol International Airport Development Project
DoTr Airports 4,789,000, 000.00 2007/11/01 Implementation
49 Mactan-Cebu International Airport Project
DoTr Airports 17,520,000,000.00 2010/11/01 Implementation
50 LRT 1 South (Cavite Extension Project DOTr Railway 64,900,000,000.00 Implementation
51 Subic-Clark Cargo Railway Project BCDA Railway 57,600,000,000.00 Development
52 BGC to NAIA Bus Rapid Transit (BRT) System
BCDA Mass Transit 21,900,000,000.00 Development
53 Clark International Airport Expansion (Phase 1)
BCDAAirport
17,000,000,000.00 Development
54 New Clark City - Mixed Use Industrial Real Estate Developments
BCDA New Cities Development
55 New Clark City National Government Center
BCDA New Cities 83,000,000,000.00 Development
56 New Clark City - Philippine Sports City BCDA New Cities 97,000,000,000.00 Development
57 New Clark City- Food Processing Terminal and International Food Market
BCDA New Cities 31,300,000,000.00 Development
58 New Clark City- Mixed Income Development Housing
BCDA New Cities 8,300,000,000.00 Development
59 New Clark City- Agro-Industrial Park BCDA New Cities Development
60 Broadband Backhaul Modular IT Facilities
BCDA Communication and Information
975,000,000.00 BCDA
61 BCDA Smart City Solutions BCDA New Cities Development
Source: Build, Build, Build Projects. Retrieved from http://www.build.gov.ph/Home/Project?page=1BCDA=Bases Conversion Development Agency; DOTr=Department of Transportation; DPWH=Department of Public Works and Highways
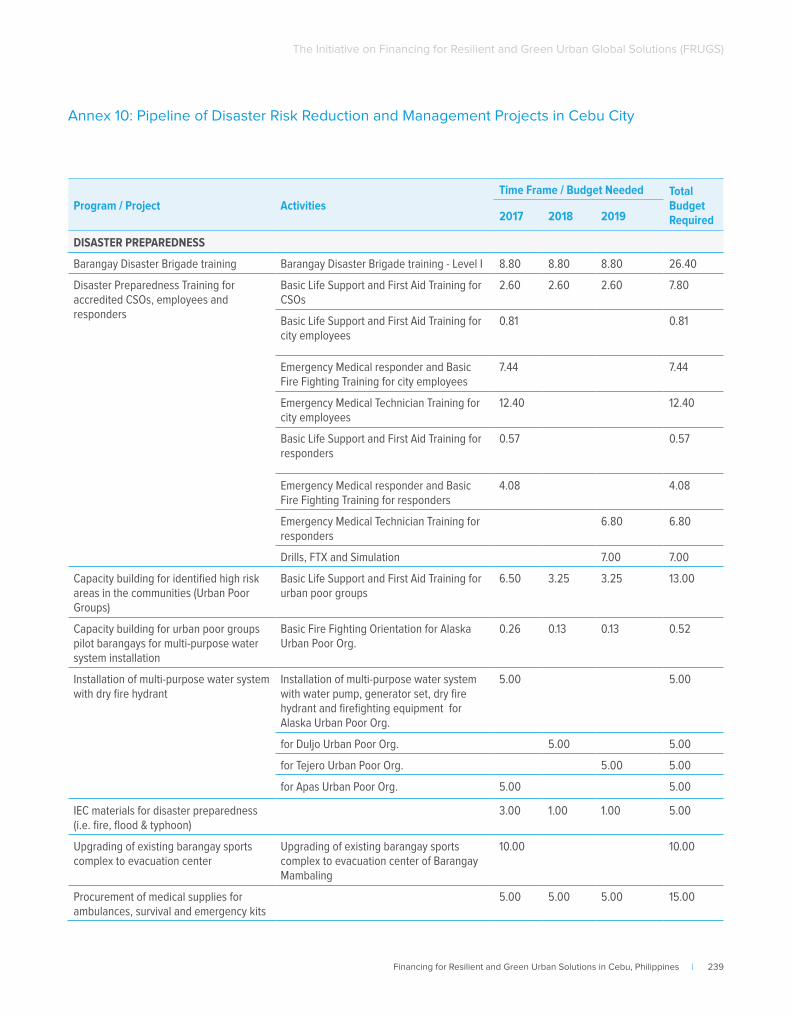
Financing for Resilient and Green Urban Solutions in Cebu, Philippines | 239
The Initiative on Financing for Resilient and Green Urban Global Solutions (FRUGS)
Annex 10: Pipeline of Disaster Risk Reduction and Management Projects in Cebu City
Program / Project ActivitiesTime Frame / Budget Needed Total
Budget Required2017 2018 2019
DISASTER PREPAREDNESS
Barangay Disaster Brigade training Barangay Disaster Brigade training - Level I 8.80 8.80 8.80 26.40
Disaster Preparedness Training for accredited CSOs, employees and responders
Basic Life Support and First Aid Training for CSOs
2.60 2.60 2.60 7.80
Basic Life Support and First Aid Training for city employees
0.81 0.81
Emergency Medical responder and Basic Fire Fighting Training for city employees
7.44 7.44
Emergency Medical Technician Training for city employees
12.40 12.40
Basic Life Support and First Aid Training for responders
0.57 0.57
Emergency Medical responder and Basic Fire Fighting Training for responders
4.08 4.08
Emergency Medical Technician Training for responders
6.80 6.80
Drills, FTX and Simulation 7.00 7.00
Capacity building for identified high risk areas in the communities (Urban Poor Groups)
Basic Life Support and First Aid Training for urban poor groups
6.50 3.25 3.25 13.00
Capacity building for urban poor groups pilot barangays for multi-purpose water system installation
Basic Fire Fighting Orientation for Alaska Urban Poor Org.
0.26 0.13 0.13 0.52
Installation of multi-purpose water system with dry fire hydrant
Installation of multi-purpose water system with water pump, generator set, dry fire hydrant and firefighting equipment for Alaska Urban Poor Org.
5.00 5.00
for Duljo Urban Poor Org. 5.00 5.00
for Tejero Urban Poor Org. 5.00 5.00
for Apas Urban Poor Org. 5.00 5.00
IEC materials for disaster preparedness (i.e. fire, flood & typhoon)
3.00 1.00 1.00 5.00
Upgrading of existing barangay sports complex to evacuation center
Upgrading of existing barangay sports complex to evacuation center of Barangay Mambaling
10.00 10.00
Procurement of medical supplies for ambulances, survival and emergency kits
5.00 5.00 5.00 15.00
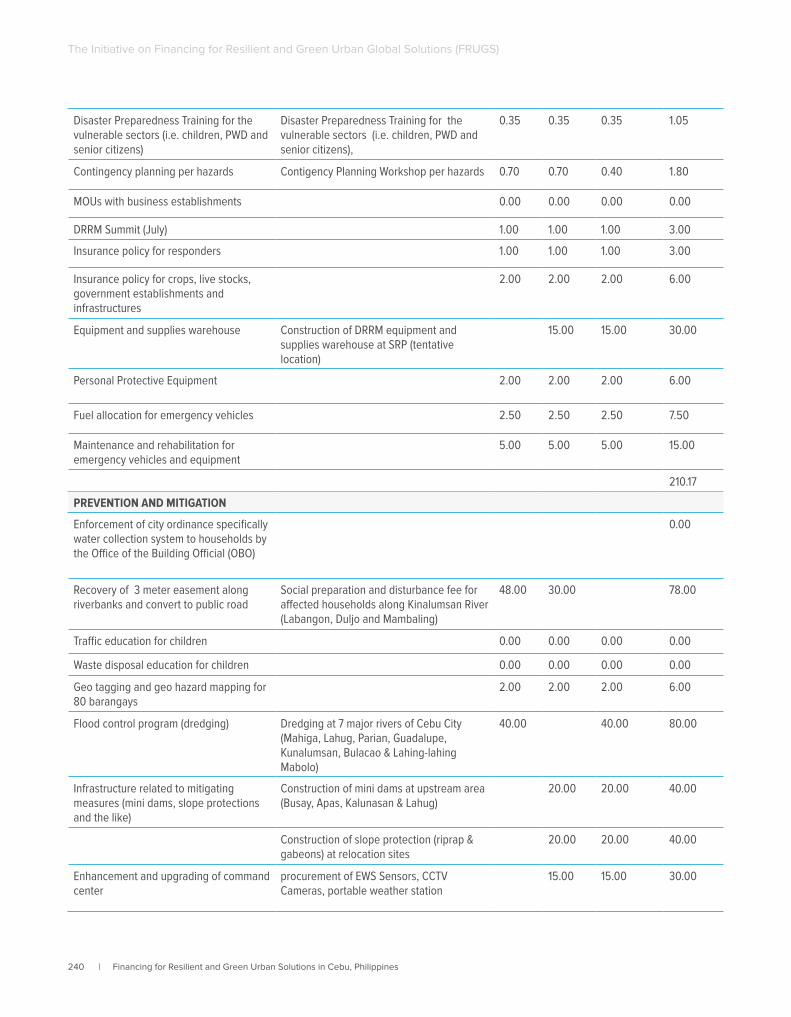
240 | Financing for Resilient and Green Urban Solutions in Cebu, Philippines
The Initiative on Financing for Resilient and Green Urban Global Solutions (FRUGS)
Disaster Preparedness Training for the vulnerable sectors (i.e. children, PWD and senior citizens)
Disaster Preparedness Training for the vulnerable sectors (i.e. children, PWD and senior citizens),
0.35 0.35 0.35 1.05
Contingency planning per hazards Contigency Planning Workshop per hazards 0.70 0.70 0.40 1.80
MOUs with business establishments 0.00 0.00 0.00 0.00
DRRM Summit (July) 1.00 1.00 1.00 3.00
Insurance policy for responders 1.00 1.00 1.00 3.00
Insurance policy for crops, live stocks, government establishments and infrastructures
2.00 2.00 2.00 6.00
Equipment and supplies warehouse Construction of DRRM equipment and supplies warehouse at SRP (tentative location)
15.00 15.00 30.00
Personal Protective Equipment 2.00 2.00 2.00 6.00
Fuel allocation for emergency vehicles 2.50 2.50 2.50 7.50
Maintenance and rehabilitation for emergency vehicles and equipment
5.00 5.00 5.00 15.00
210.17
PREVENTION AND MITIGATION
Enforcement of city ordinance specifically water collection system to households by the Office of the Building Official (OBO)
0.00
Recovery of 3 meter easement along riverbanks and convert to public road
Social preparation and disturbance fee for affected households along Kinalumsan River (Labangon, Duljo and Mambaling)
48.00 30.00 78.00
Traffic education for children 0.00 0.00 0.00 0.00
Waste disposal education for children 0.00 0.00 0.00 0.00
Geo tagging and geo hazard mapping for 80 barangays
2.00 2.00 2.00 6.00
Flood control program (dredging) Dredging at 7 major rivers of Cebu City (Mahiga, Lahug, Parian, Guadalupe, Kunalumsan, Bulacao & Lahing-lahing Mabolo)
40.00 40.00 80.00
Infrastructure related to mitigating measures (mini dams, slope protections and the like)
Construction of mini dams at upstream area (Busay, Apas, Kalunasan & Lahug)
20.00 20.00 40.00
Construction of slope protection (riprap & gabeons) at relocation sites
20.00 20.00 40.00
Enhancement and upgrading of command center
procurement of EWS Sensors, CCTV Cameras, portable weather station
15.00 15.00 30.00
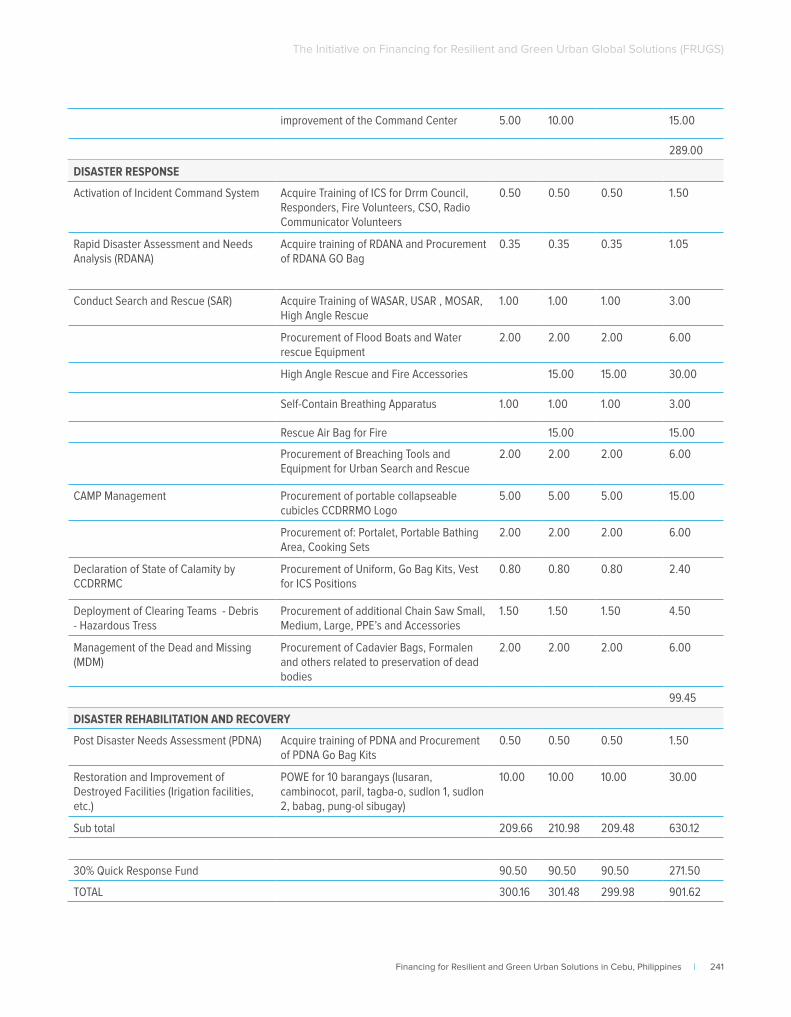
Financing for Resilient and Green Urban Solutions in Cebu, Philippines | 241
The Initiative on Financing for Resilient and Green Urban Global Solutions (FRUGS)
improvement of the Command Center 5.00 10.00 15.00
289.00
DISASTER RESPONSE
Activation of Incident Command System Acquire Training of ICS for Drrm Council, Responders, Fire Volunteers, CSO, Radio Communicator Volunteers
0.50 0.50 0.50 1.50
Rapid Disaster Assessment and Needs Analysis (RDANA)
Acquire training of RDANA and Procurement of RDANA GO Bag
0.35 0.35 0.35 1.05
Conduct Search and Rescue (SAR) Acquire Training of WASAR, USAR , MOSAR, High Angle Rescue
1.00 1.00 1.00 3.00
Procurement of Flood Boats and Water rescue Equipment
2.00 2.00 2.00 6.00
High Angle Rescue and Fire Accessories 15.00 15.00 30.00
Self-Contain Breathing Apparatus 1.00 1.00 1.00 3.00
Rescue Air Bag for Fire 15.00 15.00
Procurement of Breaching Tools and Equipment for Urban Search and Rescue
2.00 2.00 2.00 6.00
CAMP Management Procurement of portable collapseable cubicles CCDRRMO Logo
5.00 5.00 5.00 15.00
Procurement of: Portalet, Portable Bathing Area, Cooking Sets
2.00 2.00 2.00 6.00
Declaration of State of Calamity by CCDRRMC
Procurement of Uniform, Go Bag Kits, Vest for ICS Positions
0.80 0.80 0.80 2.40
Deployment of Clearing Teams - Debris - Hazardous Tress
Procurement of additional Chain Saw Small, Medium, Large, PPE’s and Accessories
1.50 1.50 1.50 4.50
Management of the Dead and Missing (MDM)
Procurement of Cadavier Bags, Formalen and others related to preservation of dead bodies
2.00 2.00 2.00 6.00
99.45
DISASTER REHABILITATION AND RECOVERY
Post Disaster Needs Assessment (PDNA) Acquire training of PDNA and Procurement of PDNA Go Bag Kits
0.50 0.50 0.50 1.50
Restoration and Improvement of Destroyed Facilities (Irigation facilities, etc.)
POWE for 10 barangays (lusaran, cambinocot, paril, tagba-o, sudlon 1, sudlon 2, babag, pung-ol sibugay)
10.00 10.00 10.00 30.00
Sub total 209.66 210.98 209.48 630.12
30% Quick Response Fund 90.50 90.50 90.50 271.50
TOTAL 300.16 301.48 299.98 901.62
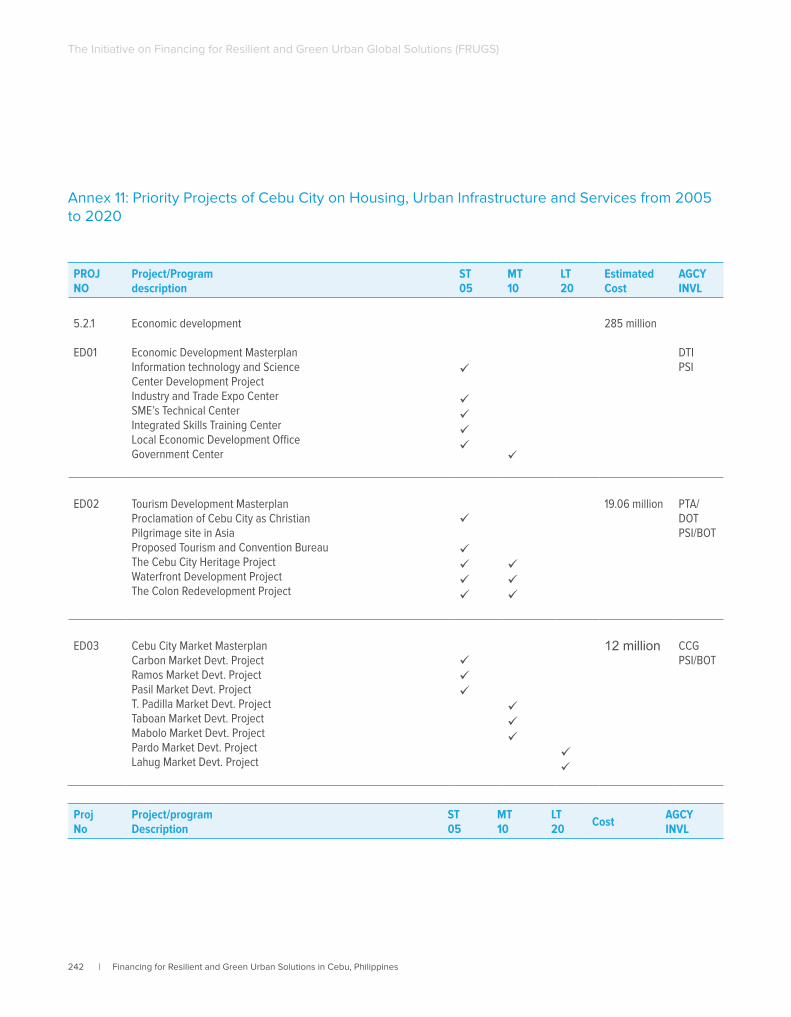
242 | Financing for Resilient and Green Urban Solutions in Cebu, Philippines
The Initiative on Financing for Resilient and Green Urban Global Solutions (FRUGS)
Annex 11: Priority Projects of Cebu City on Housing, Urban Infrastructure and Services from 2005 to 2020
PROJNO
Project/Programdescription
ST05
MT10
LT20
Estimated Cost
AGCYINVL
5.2.1
ED01
Economic development
Economic Development MasterplanInformation technology and ScienceCenter Development ProjectIndustry and Trade Expo CenterSME’s Technical CenterIntegrated Skills Training CenterLocal Economic Development OfficeGovernment Center
285 million
DTIPSI
ED02 Tourism Development MasterplanProclamation of Cebu City as ChristianPilgrimage site in AsiaProposed Tourism and Convention BureauThe Cebu City Heritage ProjectWaterfront Development ProjectThe Colon Redevelopment Project
19.06 million PTA/DOTPSI/BOT
ED03 Cebu City Market MasterplanCarbon Market Devt. ProjectRamos Market Devt. ProjectPasil Market Devt. ProjectT. Padilla Market Devt. ProjectTaboan Market Devt. ProjectMabolo Market Devt. ProjectPardo Market Devt. ProjectLahug Market Devt. Project
12 million CCGPSI/BOT
ProjNo
Project/programDescription
ST05
MT10
LT20 Cost AGCY
INVL
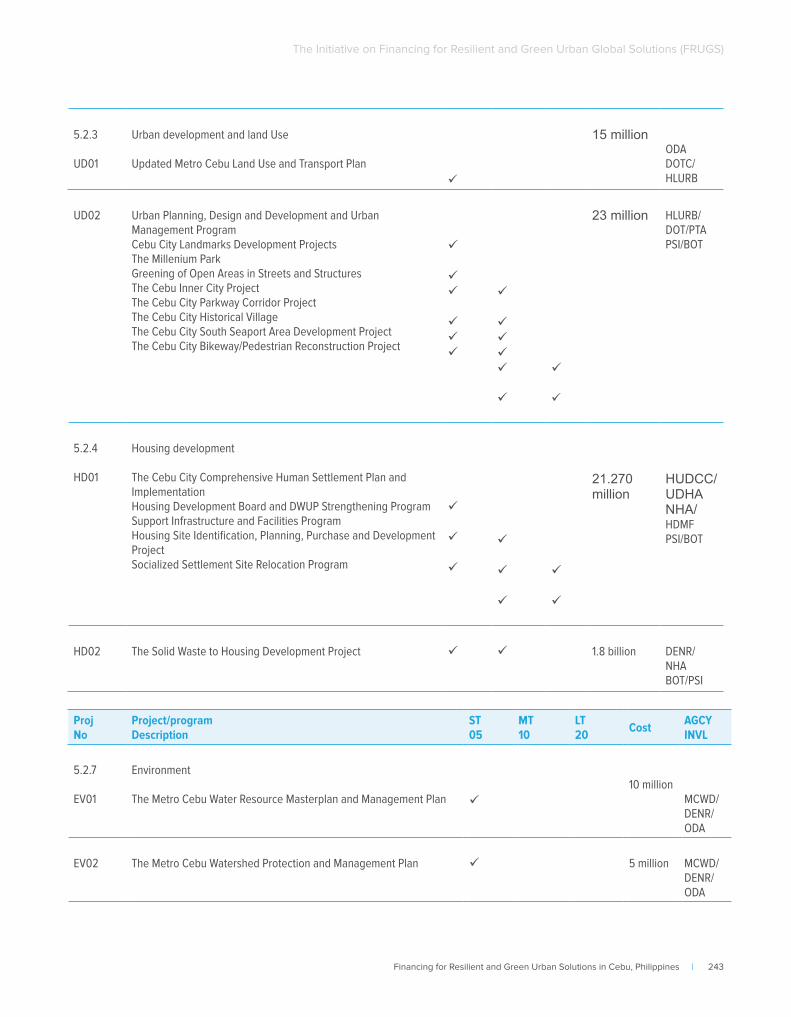
Financing for Resilient and Green Urban Solutions in Cebu, Philippines | 243
The Initiative on Financing for Resilient and Green Urban Global Solutions (FRUGS)
5.2.3
UD01
Urban development and land Use
Updated Metro Cebu Land Use and Transport Plan
15 millionODADOTC/HLURB
UD02 Urban Planning, Design and Development and Urban Management ProgramCebu City Landmarks Development ProjectsThe Millenium ParkGreening of Open Areas in Streets and StructuresThe Cebu Inner City ProjectThe Cebu City Parkway Corridor ProjectThe Cebu City Historical VillageThe Cebu City South Seaport Area Development ProjectThe Cebu City Bikeway/Pedestrian Reconstruction Project
23 million HLURB/DOT/PTAPSI/BOT
5.2.4
HD01
Housing development
The Cebu City Comprehensive Human Settlement Plan and ImplementationHousing Development Board and DWUP Strengthening ProgramSupport Infrastructure and Facilities ProgramHousing Site Identification, Planning, Purchase and Development ProjectSocialized Settlement Site Relocation Program
21.270 million
HUDCC/UDHANHA/HDMFPSI/BOT
HD02 The Solid Waste to Housing Development Project 1.8 billion DENR/NHABOT/PSI
ProjNo
Project/programDescription
ST05
MT10
LT20 Cost AGCY
INVL
5.2.7
EV01
Environment
The Metro Cebu Water Resource Masterplan and Management Plan 10 million
MCWD/DENR/ODA
EV02 The Metro Cebu Watershed Protection and Management Plan 5 million MCWD/DENR/ ODA
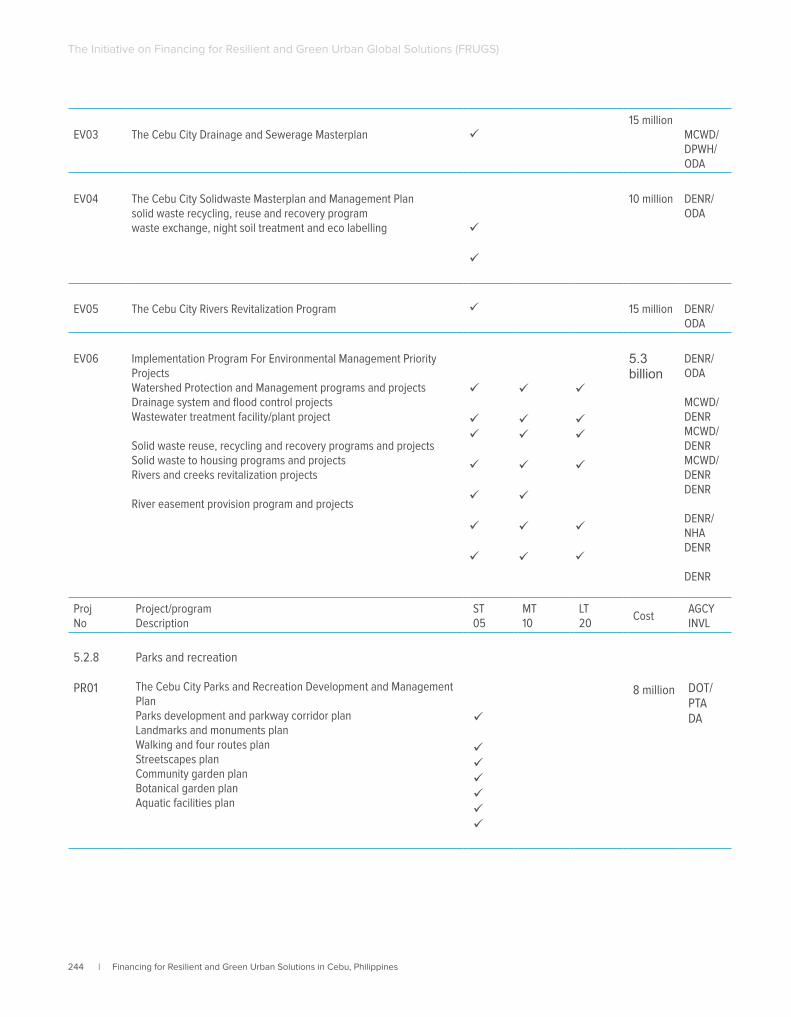
244 | Financing for Resilient and Green Urban Solutions in Cebu, Philippines
The Initiative on Financing for Resilient and Green Urban Global Solutions (FRUGS)
EV03 The Cebu City Drainage and Sewerage Masterplan 15 million
MCWD/DPWH/ODA
EV04 The Cebu City Solidwaste Masterplan and Management Plansolid waste recycling, reuse and recovery programwaste exchange, night soil treatment and eco labelling
10 million DENR/ODA
EV05 The Cebu City Rivers Revitalization Program 15 million DENR/ODA
EV06 Implementation Program For Environmental Management Priority ProjectsWatershed Protection and Management programs and projectsDrainage system and flood control projectsWastewater treatment facility/plant project
Solid waste reuse, recycling and recovery programs and projectsSolid waste to housing programs and projectsRivers and creeks revitalization projects
River easement provision program and projects
5.3 billion
DENR/ODA
MCWD/DENRMCWD/DENRMCWD/DENRDENR
DENR/NHADENR
DENR
ProjNo
Project/programDescription
ST05
MT10
LT20
CostAGCYINVL
5.2.8
PR01
Parks and recreation
The Cebu City Parks and Recreation Development and Management PlanParks development and parkway corridor planLandmarks and monuments planWalking and four routes planStreetscapes planCommunity garden planBotanical garden planAquatic facilities plan
8 million DOT/PTADA
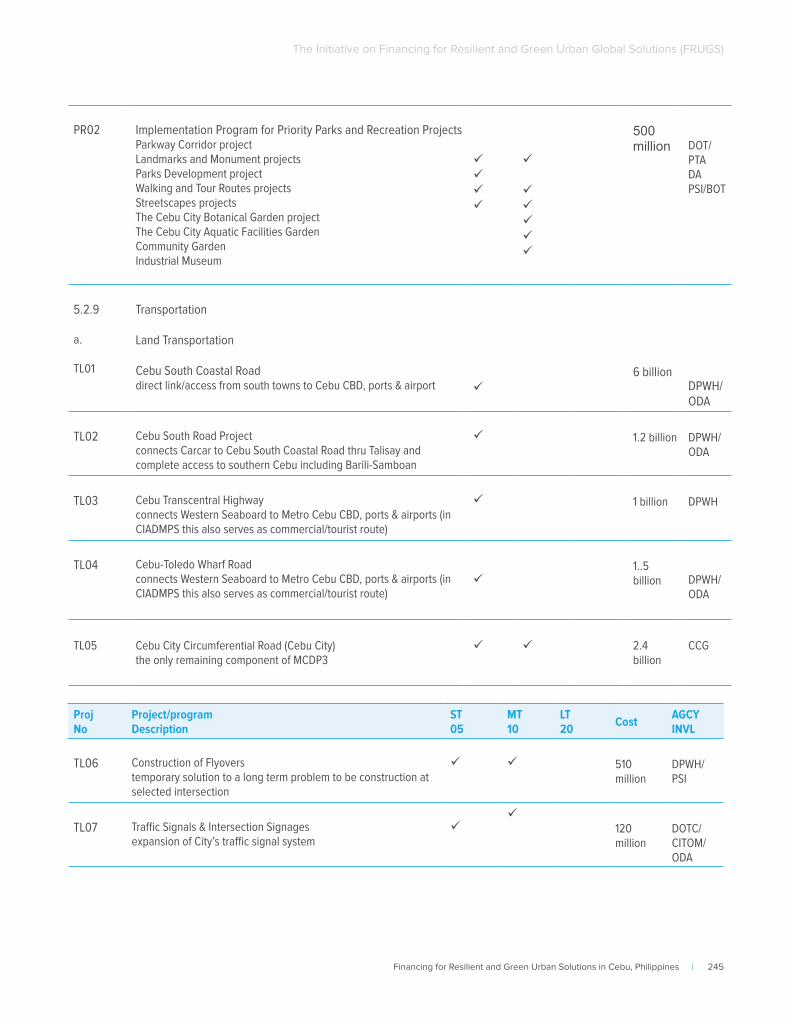
Financing for Resilient and Green Urban Solutions in Cebu, Philippines | 245
The Initiative on Financing for Resilient and Green Urban Global Solutions (FRUGS)
PR02 Implementation Program for Priority Parks and Recreation ProjectsParkway Corridor projectLandmarks and Monument projectsParks Development projectWalking and Tour Routes projectsStreetscapes projectsThe Cebu City Botanical Garden projectThe Cebu City Aquatic Facilities GardenCommunity GardenIndustrial Museum
500 million DOT/
PTADAPSI/BOT
5.2.9
a.
TL01
Transportation
Land Transportation
Cebu South Coastal Roaddirect link/access from south towns to Cebu CBD, ports & airport
6 billion DPWH/ODA
TL02 Cebu South Road Project connects Carcar to Cebu South Coastal Road thru Talisay and complete access to southern Cebu including Barili-Samboan
1.2 billion DPWH/ODA
TL03 Cebu Transcentral Highway connects Western Seaboard to Metro Cebu CBD, ports & airports (in CIADMPS this also serves as commercial/tourist route)
1 billion DPWH
TL04 Cebu-Toledo Wharf Roadconnects Western Seaboard to Metro Cebu CBD, ports & airports (in CIADMPS this also serves as commercial/tourist route)
1..5 billion DPWH/
ODA
TL05 Cebu City Circumferential Road (Cebu City)the only remaining component of MCDP3
2.4 billion
CCG
ProjNo
Project/programDescription
ST05
MT10
LT20 Cost AGCY
INVL
TL06 Construction of Flyovers temporary solution to a long term problem to be construction at selected intersection
510 million
DPWH/PSI
TL07 Traffic Signals & Intersection Signages expansion of City’s traffic signal system
120 million
DOTC/CITOM/ODA
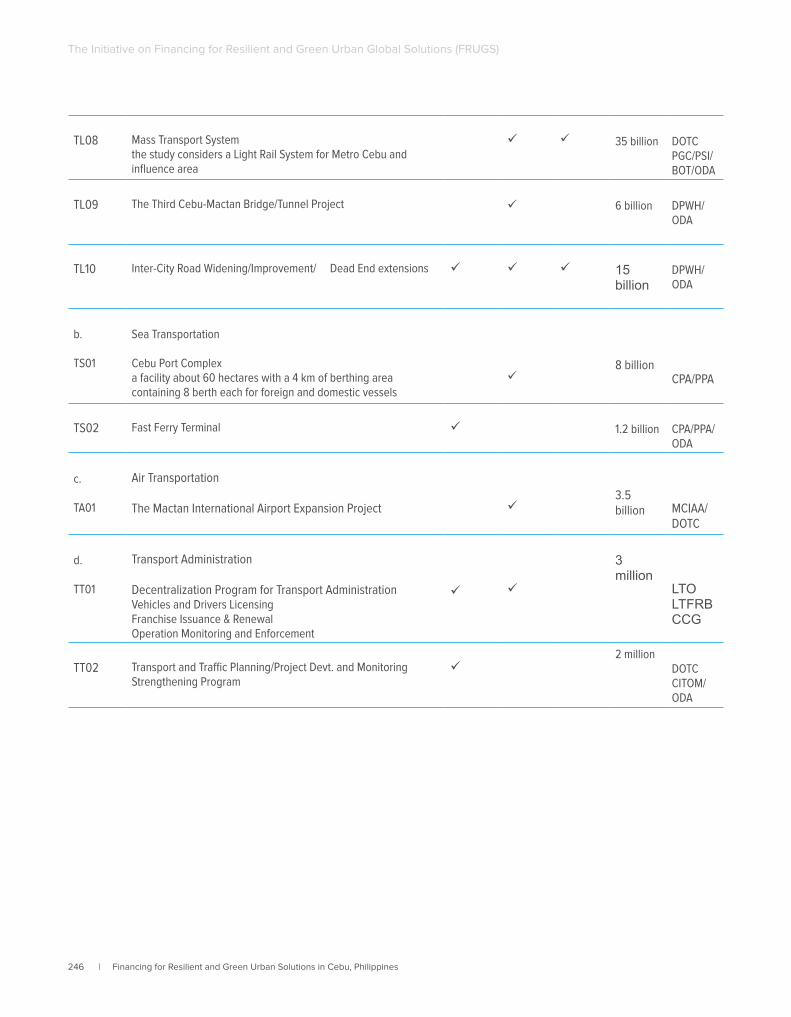
246 | Financing for Resilient and Green Urban Solutions in Cebu, Philippines
The Initiative on Financing for Resilient and Green Urban Global Solutions (FRUGS)
TL08 Mass Transport System the study considers a Light Rail System for Metro Cebu and influence area
35 billion DOTCPGC/PSI/BOT/ODA
TL09 The Third Cebu-Mactan Bridge/Tunnel Project 6 billion DPWH/ODA
TL10 Inter-City Road Widening/Improvement/ Dead End extensions 15 billion
DPWH/ODA
b.
TS01
Sea Transportation
Cebu Port Complexa facility about 60 hectares with a 4 km of berthing area containing 8 berth each for foreign and domestic vessels
8 billion
CPA/PPA
TS02 Fast Ferry Terminal 1.2 billion CPA/PPA/ODA
c.
TA01
Air Transportation
The Mactan International Airport Expansion Project 3.5 billion MCIAA/
DOTC
d.
TT01
Transport Administration
Decentralization Program for Transport AdministrationVehicles and Drivers LicensingFranchise Issuance & RenewalOperation Monitoring and Enforcement
3 million
LTOLTFRBCCG
TT02 Transport and Traffic Planning/Project Devt. and Monitoring Strengthening Program
2 million
DOTCCITOM/ODA
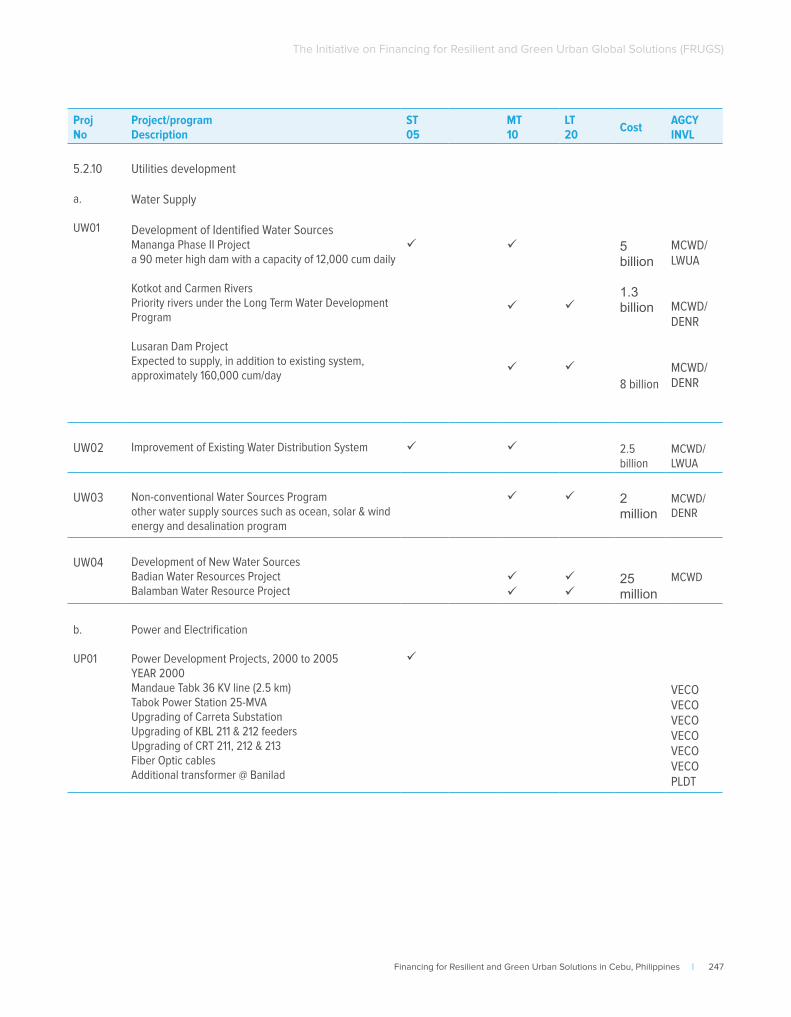
Financing for Resilient and Green Urban Solutions in Cebu, Philippines | 247
The Initiative on Financing for Resilient and Green Urban Global Solutions (FRUGS)
ProjNo
Project/programDescription
ST05
MT10
LT20 Cost AGCY
INVL
5.2.10
a.
UW01
Utilities development
Water Supply
Development of Identified Water SourcesMananga Phase II Project a 90 meter high dam with a capacity of 12,000 cum daily
Kotkot and Carmen RiversPriority rivers under the Long Term Water Development Program
Lusaran Dam ProjectExpected to supply, in addition to existing system, approximately 160,000 cum/day
5 billion
1.3 billion
8 billion
MCWD/LWUA
MCWD/DENR
MCWD/DENR
UW02 Improvement of Existing Water Distribution System 2.5 billion
MCWD/LWUA
UW03 Non-conventional Water Sources Program other water supply sources such as ocean, solar & wind energy and desalination program
2 million
MCWD/DENR
UW04 Development of New Water SourcesBadian Water Resources ProjectBalamban Water Resource Project
25 million
MCWD
b.
UP01
Power and Electrification
Power Development Projects, 2000 to 2005YEAR 2000Mandaue Tabk 36 KV line (2.5 km)Tabok Power Station 25-MVAUpgrading of Carreta SubstationUpgrading of KBL 211 & 212 feedersUpgrading of CRT 211, 212 & 213Fiber Optic cablesAdditional transformer @ Banilad
VECOVECOVECOVECOVECOVECOPLDT
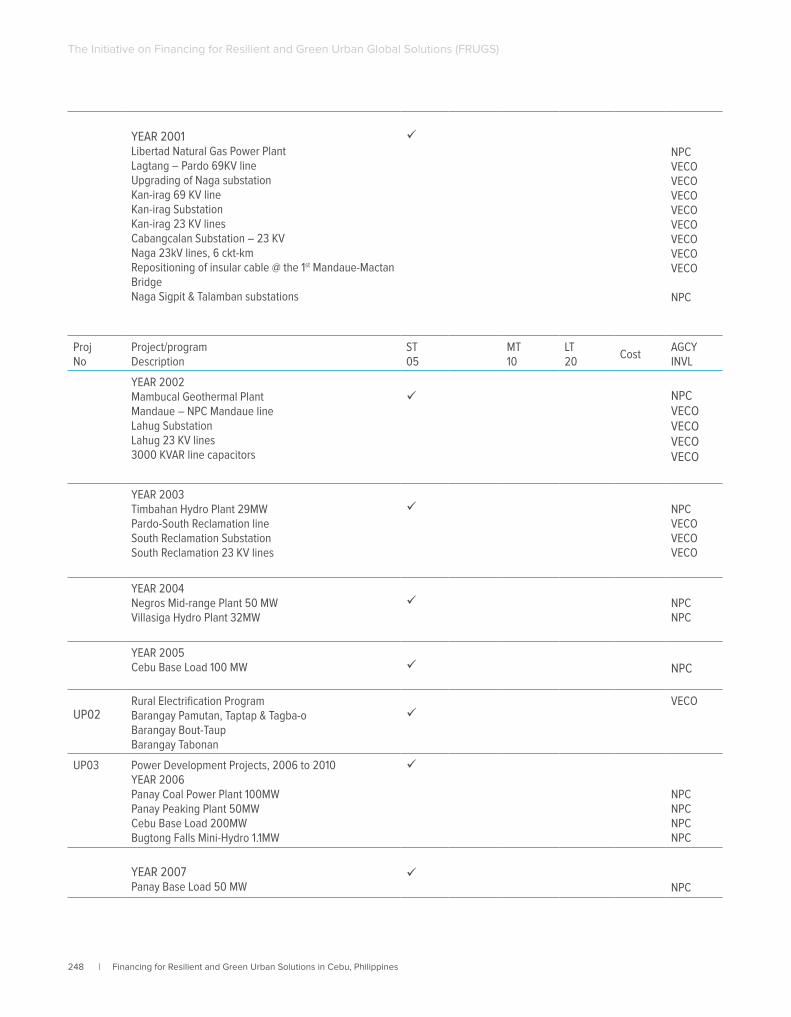
248 | Financing for Resilient and Green Urban Solutions in Cebu, Philippines
The Initiative on Financing for Resilient and Green Urban Global Solutions (FRUGS)
YEAR 2001Libertad Natural Gas Power PlantLagtang – Pardo 69KV lineUpgrading of Naga substationKan-irag 69 KV lineKan-irag SubstationKan-irag 23 KV linesCabangcalan Substation – 23 KVNaga 23kV lines, 6 ckt-kmRepositioning of insular cable @ the 1st Mandaue-Mactan BridgeNaga Sigpit & Talamban substations
NPCVECOVECOVECOVECOVECOVECOVECOVECO
NPC
ProjNo
Project/programDescription
ST05
MT10
LT20
CostAGCYINVL
YEAR 2002Mambucal Geothermal PlantMandaue – NPC Mandaue lineLahug SubstationLahug 23 KV lines3000 KVAR line capacitors
NPCVECOVECOVECOVECO
YEAR 2003Timbahan Hydro Plant 29MWPardo-South Reclamation lineSouth Reclamation SubstationSouth Reclamation 23 KV lines
NPCVECOVECOVECO
YEAR 2004Negros Mid-range Plant 50 MWVillasiga Hydro Plant 32MW
NPCNPC
YEAR 2005Cebu Base Load 100 MW NPC
UP02Rural Electrification ProgramBarangay Pamutan, Taptap & Tagba-oBarangay Bout-TaupBarangay Tabonan
VECO
UP03 Power Development Projects, 2006 to 2010YEAR 2006Panay Coal Power Plant 100MWPanay Peaking Plant 50MWCebu Base Load 200MWBugtong Falls Mini-Hydro 1.1MW
NPCNPCNPCNPC
YEAR 2007Panay Base Load 50 MW
NPC
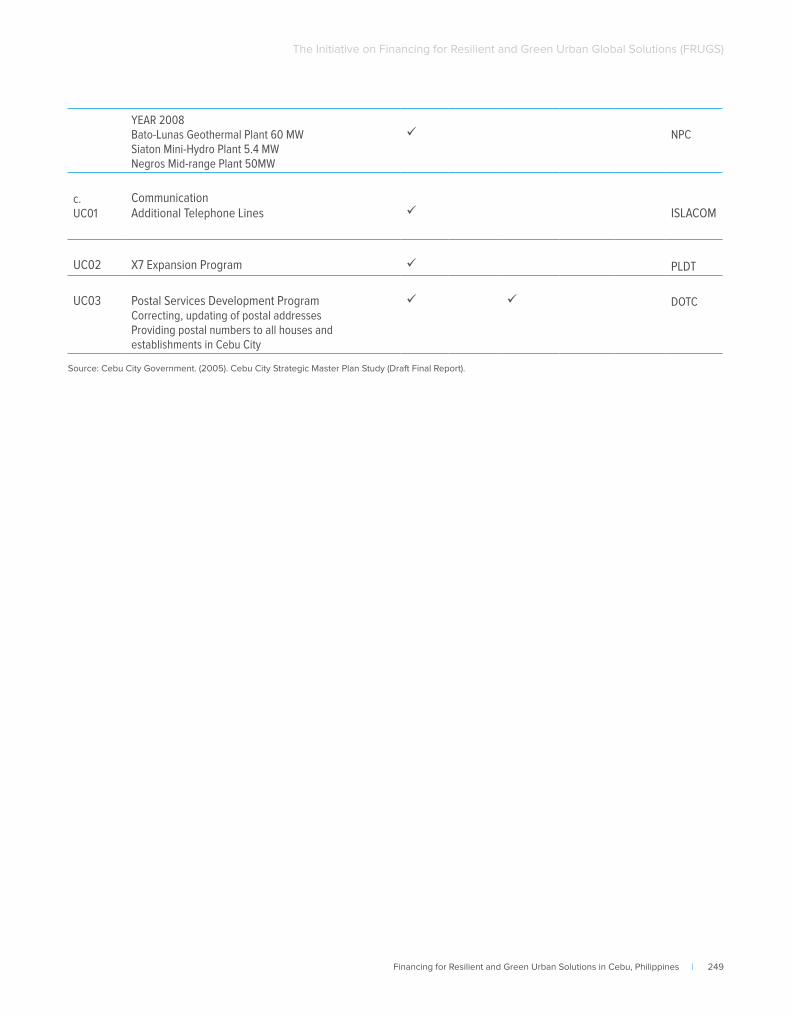
Financing for Resilient and Green Urban Solutions in Cebu, Philippines | 249
The Initiative on Financing for Resilient and Green Urban Global Solutions (FRUGS)
YEAR 2008Bato-Lunas Geothermal Plant 60 MWSiaton Mini-Hydro Plant 5.4 MWNegros Mid-range Plant 50MW
NPC
c.UC01
CommunicationAdditional Telephone Lines ISLACOM
UC02 X7 Expansion Program PLDT
UC03 Postal Services Development ProgramCorrecting, updating of postal addressesProviding postal numbers to all houses and establishments in Cebu City
DOTC
Source: Cebu City Government. (2005). Cebu City Strategic Master Plan Study (Draft Final Report).
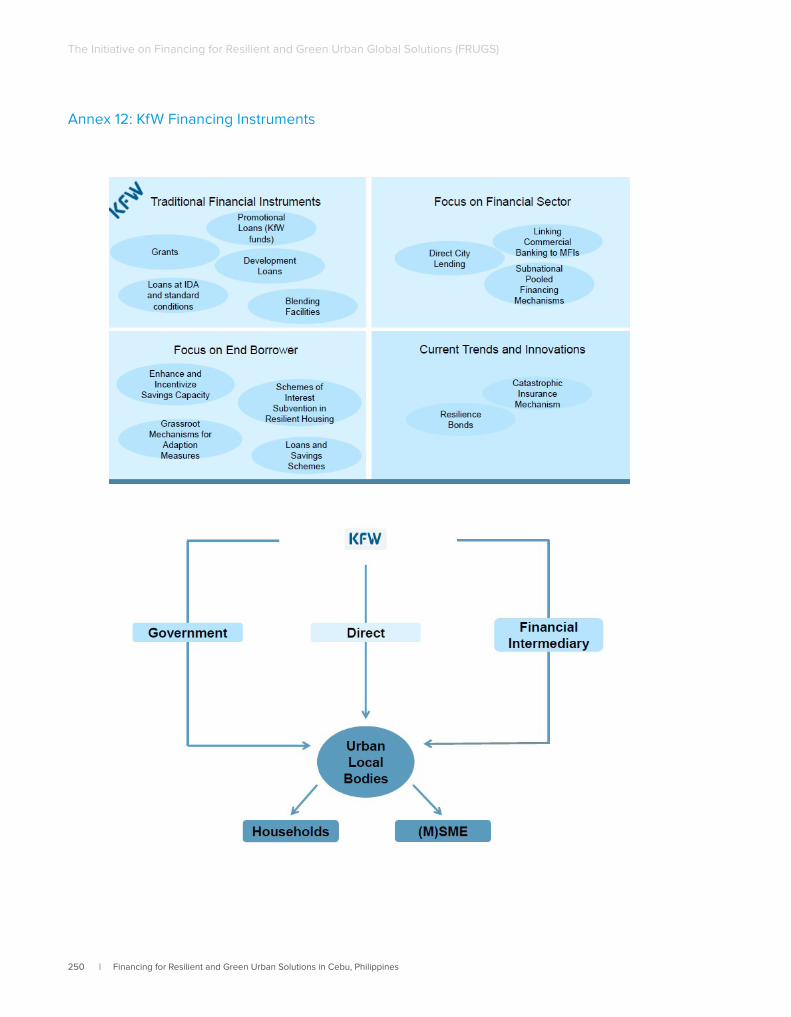
250 | Financing for Resilient and Green Urban Solutions in Cebu, Philippines
The Initiative on Financing for Resilient and Green Urban Global Solutions (FRUGS)
Annex 12: KfW Financing Instruments
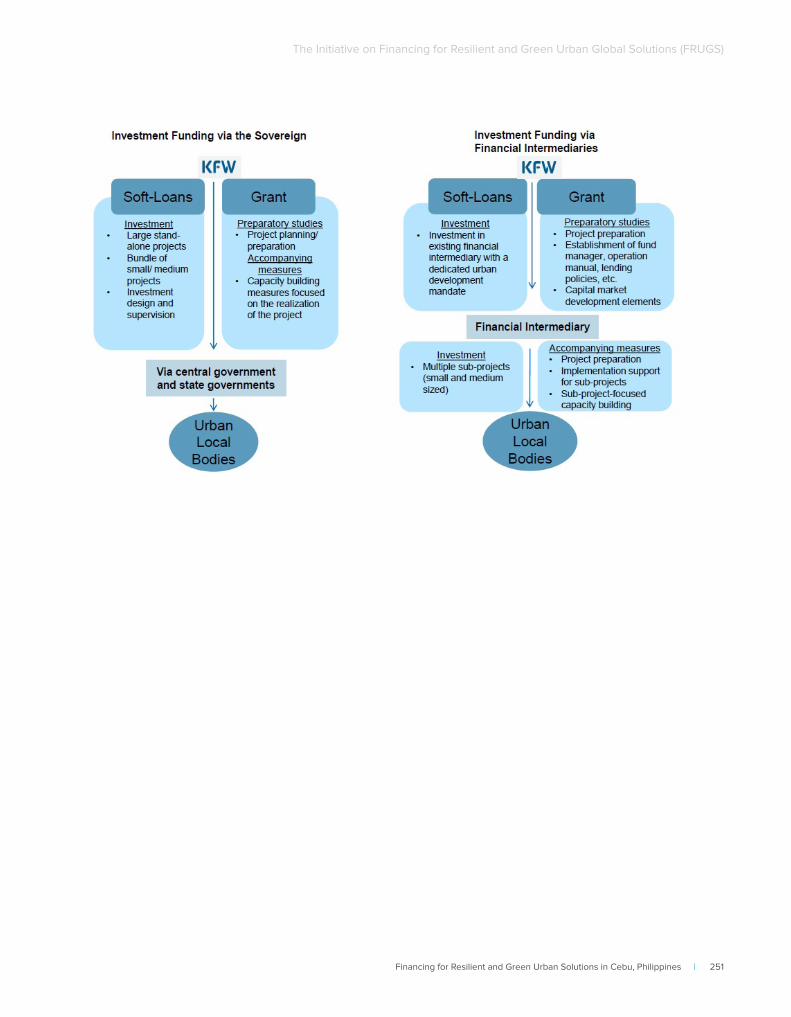
Financing for Resilient and Green Urban Solutions in Cebu, Philippines | 251
The Initiative on Financing for Resilient and Green Urban Global Solutions (FRUGS)
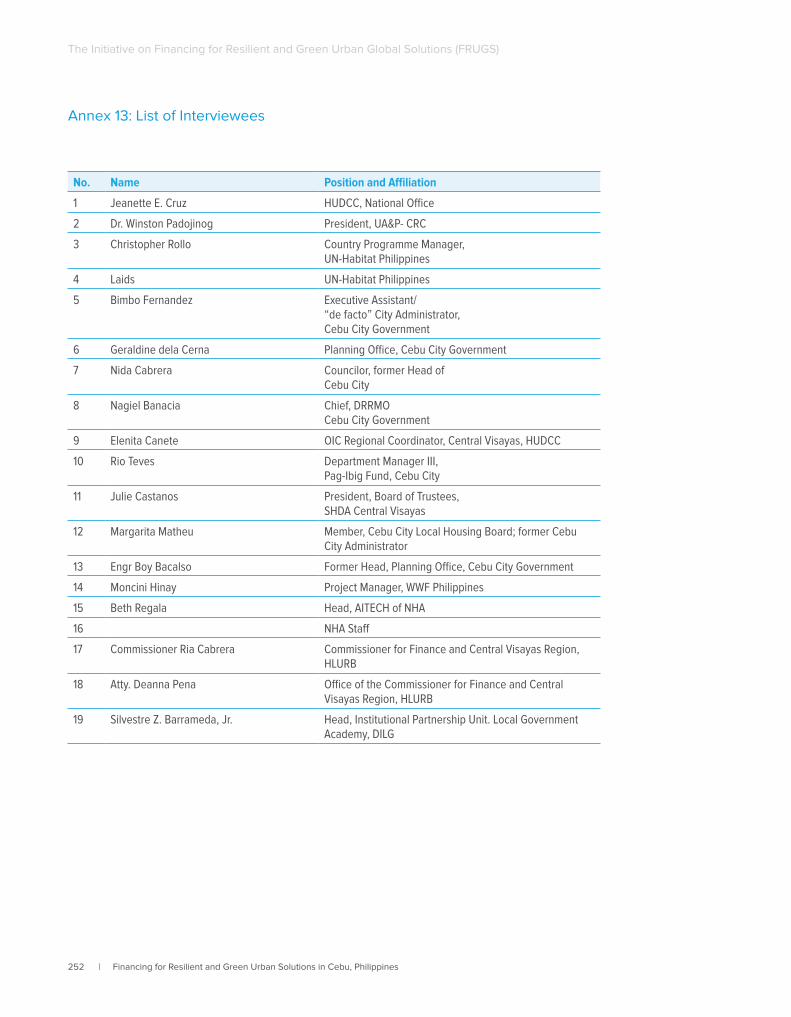
252 | Financing for Resilient and Green Urban Solutions in Cebu, Philippines
The Initiative on Financing for Resilient and Green Urban Global Solutions (FRUGS)
Annex 13: List of Interviewees
No. Name Position and Affiliation
1 Jeanette E. Cruz HUDCC, National Office
2 Dr. Winston Padojinog President, UA&P- CRC
3 Christopher Rollo Country Programme Manager, UN-Habitat Philippines
4 Laids UN-Habitat Philippines
5 Bimbo Fernandez Executive Assistant/ “de facto” City Administrator, Cebu City Government
6 Geraldine dela Cerna Planning Office, Cebu City Government
7 Nida Cabrera Councilor, former Head of Cebu City
8 Nagiel Banacia Chief, DRRMOCebu City Government
9 Elenita Canete OIC Regional Coordinator, Central Visayas, HUDCC
10 Rio Teves Department Manager III, Pag-Ibig Fund, Cebu City
11 Julie Castanos President, Board of Trustees, SHDA Central Visayas
12 Margarita Matheu Member, Cebu City Local Housing Board; former Cebu City Administrator
13 Engr Boy Bacalso Former Head, Planning Office, Cebu City Government
14 Moncini Hinay Project Manager, WWF Philippines
15 Beth Regala Head, AITECH of NHA
16 NHA Staff
17 Commissioner Ria Cabrera Commissioner for Finance and Central Visayas Region, HLURB
18 Atty. Deanna Pena Office of the Commissioner for Finance and Central Visayas Region, HLURB
19 Silvestre Z. Barrameda, Jr. Head, Institutional Partnership Unit. Local Government Academy, DILG
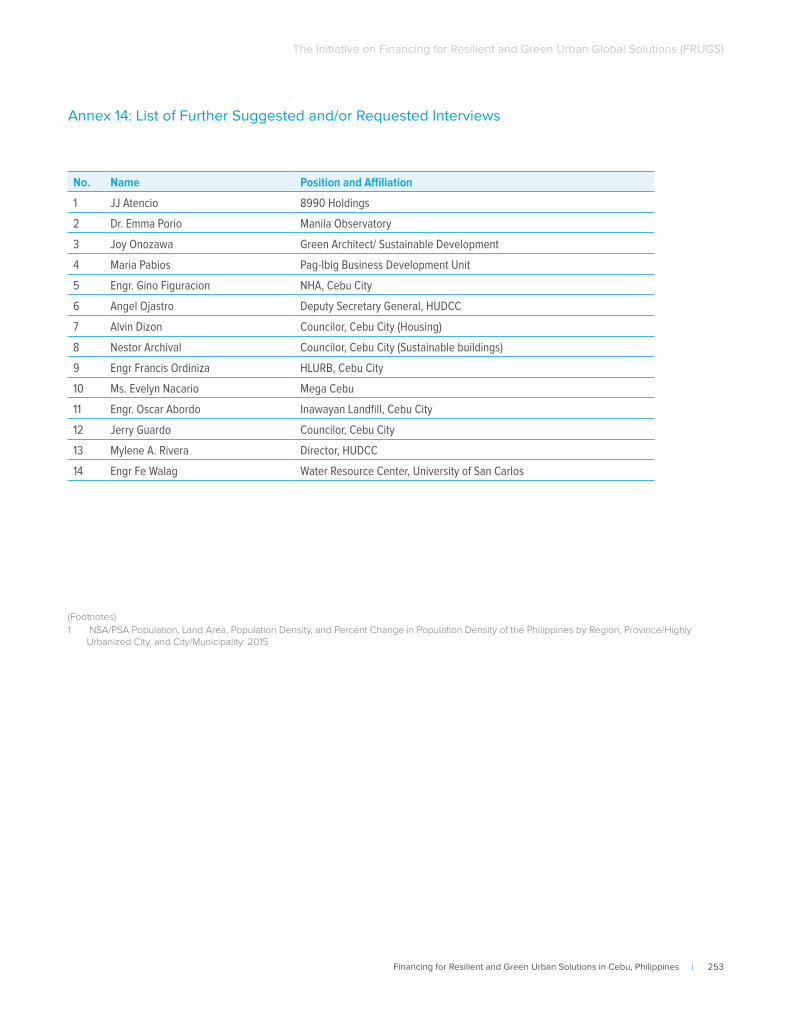
Financing for Resilient and Green Urban Solutions in Cebu, Philippines | 253
The Initiative on Financing for Resilient and Green Urban Global Solutions (FRUGS)
Annex 14: List of Further Suggested and/or Requested Interviews
No. Name Position and Affiliation
1 JJ Atencio 8990 Holdings
2 Dr. Emma Porio Manila Observatory
3 Joy Onozawa Green Architect/ Sustainable Development
4 Maria Pabios Pag-Ibig Business Development Unit
5 Engr. Gino Figuracion NHA, Cebu City
6 Angel Ojastro Deputy Secretary General, HUDCC
7 Alvin Dizon Councilor, Cebu City (Housing)
8 Nestor Archival Councilor, Cebu City (Sustainable buildings)
9 Engr Francis Ordiniza HLURB, Cebu City
10 Ms. Evelyn Nacario Mega Cebu
11 Engr. Oscar Abordo Inawayan Landfill, Cebu City
12 Jerry Guardo Councilor, Cebu City
13 Mylene A. Rivera Director, HUDCC
14 Engr Fe Walag Water Resource Center, University of San Carlos
(Footnotes)
1 NSA/PSA Population, Land Area, Population Density, and Percent Change in Population Density of the Philippines by Region, Province/Highly Urbanized City, and City/Municipality: 2015


Financing for Resilient and Green Urban Solutions in Cebu, Philippines | 255
The Initiative on Financing for Resilient and Green Urban Global Solutions (FRUGS)

256 | Financing for Resilient and Green Urban Solutions in Cebu, Philippines
The Initiative on Financing for Resilient and Green Urban Global Solutions (FRUGS)
Related Documents