Edited by Casandra Bischoff PUBLIC MONEY for PUBLIC SCHOOLS Financing Education in South Eastern Europe

Welcome message from author
This document is posted to help you gain knowledge. Please leave a comment to let me know what you think about it! Share it to your friends and learn new things together.
Transcript
Edited by Casandra Bischoff
PUBLIC MONEY for PUBLIC SCHOOLS
Financing Education in South Eastern Europe

Public Money
for Public SchoolsFinancing Education
in South Eastern Europe
Local Governmentand Public ServiceReform Initiative
Edited by
Casandra Bischoff
Local Government and Public Service Reform Initiative
Open Society Institute–Budapest
Address
Október 6. utca 12
H–1051 Budapest, Hungary
Mailing address
P.O. Box 519
H-1357 Budapest, Hungary
Telephone
(36-1) 327-3104
Fax
(36-1) 327-3105
Web Site
http://lgi.osi.hu/
First published in 2009
by the Local Government and Public Service Reform Initiative, Open Society Institute–Budapest
© OSI/LGI, 2009
ISBN: 978-963-9719-13-2
The opinions expressed herein do not necessarily reflect the views of OSI/LGI but of the authors.
All rights reserved. No part of this book may be reprinted or reproduced or utilized in any form or
by any electronic, mechanical or other means, now known or hereafter invented, including photocopying and
recording, or in any information storage or retrieval system, without permission in writing from the publishers.
Copies of the book can be ordered by e-mail or post from LGI.
Managing editor: Tom Bass
Cover photo: © Panos l Giacomo Pirozzi
Printed in Budapest, Hungary, 2009
Design & Layout: Judit Kovács l Createch Ltd.
OPEN SOCIETY INSTITUTE
TM and Copyright © 2009 Open Society Institute
All rights reserved.
iii
Contents
Foreword ............................................................................................................ vList of Contributors ........................................................................................... viiList of Boxes, Figures, and Tables ....................................................................... xi
INTRODUCTION
Financing Systems for Better Schools
Casandra Bischoff ................................................................................................ 1
CHAPTER 1
Financing Education in Albania
Sherefedin Shehu ................................................................................................. 21
CHAPTER 2
Financing Public Education in Bulgaria
Plamen Danchev and Stefan Ivanov ..................................................................... 49
CHAPTER 3
Financing Education in Croatia
Ivana Batarelo, Željka Podrug, and Tome Apostoloski ............................................ 79
CHAPTER 4
The First Careful Step:
Education Decentralization and Finance in the Republic of Macedonia
Jan Herczyński, Jasna Vidanovska, and Nuri Lacka ............................................... 103
CHAPTER 5
Financing Education in Moldova
Veaceslav Ionita .................................................................................................. 149
CHAPTER 6
Financing Education in Romania: A Legacy of Incomplete Reforms
Casandra Bischoff and Jan Herczyński .................................................................. 173
Index .................................................................................................................. 221

v
Foreword
The idea of the present publication dates back to 2005, when the Local Government
and Public Service Reform Initiative (LGI), a program of the Open Society Institute,
organized a regional South Eastern European policy forum on financing education
under its Fiscal Decentralization Initiative (FDI). LGI has since commissioned papers
by regional experts on education financing to provide officials responsible for local
government finance reform with comparative information about the state of reform in
the region and expert knowledge about policy options that were considered or imple-
mented elsewhere.
As these studies demonstrate, each country in the region has walked its own way when
it came to deciding to what extent and how to decentralize management and financing
of public education. There are no set rules and frameworks for such policies, rather one
common direction: finding a fiscal and management arrangement that ensures that good
quality education is equally available and provided efficiently.
Guiding the direction of such policy reform requires the expertise, mobilization, and
good will of governments, policymakers, and education professionals, and bringing all of
them together to reach consensus, coordinate, and contribute to the reform process are
not simple tasks. This volume presents the thinking and the paths chosen by five South
Eastern European countries (and a comparison to Poland) in order to disentangle the
knot of how to make the most of the education systems in the region. The studies may
not necessarily present the best solutions, but they do open the door to stages where
genuine efforts were invested in providing a level of quality and satisfaction.
I would like to extend my gratefulness to all the authors, who despite their preoccupations
with governance and other important matters, dedicated their time and effort to this
volume and for their patience to make it happen after so much time elapsed: Sherefedin
Shehu (Albania); Plamen Danchev and Stefan Ivanov (Bulgaria); Ivana Batarelo, Zeljka
Podrug, and Tome Apostoloski (Croatia); Jan Herczynski, Jasna Vidanovska, and
Nuri Lacka (Macedonia); Veaceslav Ionita (Moldova); and Casandra Bischoff and Jan
Herczynski (Romania). Special thanks to Jan Herczynski for the consistent and valu-
able advice and comments on the general trends in education in the region. I would
like to thank Casandra Bischoff, who shaped the conclusions and the major findings
vi
into fruition and despite her new commitments at the moment, dedicated her time to
this noble work. Thanks also to Ondrej Simek and Tímea Tóth who made this policy
forum happen four years ago. And finally thanks to Tom Bass whose meticulous edits
have made reading the studies a pleasure.
Irina Faion
Senior Program Manager
Local Government and Public Service Initiative
Open Society Institute–Budapest
Október 6. utca 12
H–1051 Budapest, Hungary
Phone: (+36 1) 327 3104 / ext. 2078
Fax: (+36 1) 327 3105
vii
List of Contributors
Tome Apostoloski is a head at the Expenses Department for Employed Budgetary Us-
ers, at the Ministry of Science, Education, and Sports in Croatia. He holds a B.A. in
Economics from University of Zagreb, Croatia.
Ivana Batarelo is an Assistant Professor of Education at the Faculty of Humanities
and Social Sciences, University of Zagreb, Croatia, where she teaches courses in Adult
Education, School Administration and Management, Information Systems in Educa-
tion, and Online Education. Her main research interests include educational financing,
instructional design, educational technology, and teacher education. She holds a Ph.D.
in Curriculum and Instruction from Arizona State University.
Casandra Bischoff is is an independent consultant with experience in the design and
implementation of policies in the area of public administration reform (good govern-
ance, administrative and fiscal decentralization, institutional development, civil service
reform, unitary-pay reform, public expenditure review, and fiscal administration). She
has worked with development organizations such as the World Bank, UNDP, DFID,
and USAID, and assisted the ministries of administration, education, and labor in
Romania. She also has extensive experience in policy research and has produced policy
papers for institutions such as the Woodrow Wilson Center for International Scholars,
Open Society Institute, and the Center for Policy Studies in Budapest, the Center for
International Development at Harvard University, the World Bank, and USAID. Since
the writing of this book, she has changed course and is currently a life and business
coach holding personal development workshops.
Plamen Danchev is a public finance analyst with 10 years of experience in education
finance and fiscal and sector decentralization. He currently works in Bulgaria for Effective
Solutions Consulting Group, Ltd. He has been involved in the development of policy
options for education management and finance decentralization in Bulgaria and has
been active in promoting and expanding the application of the delegated school budget
system in Bulgarian municipalities. He advocates for the introduction of school-based
management principles in financing and management of schools in Bulgaria as a vehicle
for improving education quality, effectiveness, and efficiency.
viii
P U B L I C M O N E Y F O R P U B L I C S C H O O L S
Jan Herczyński is employed at Interdisciplinary Centre for Mathematical and Compu-
tational Modelling ICM, Warsaw University, Poland. He has a decade of experience in
education finance, in education policy, and in the formulation and analysis of education
strategy. Between 1999 and 2000 he advised the Polish Ministry of National Education
on education finance and decentralization. Between 2002 and 2007, under USAID-
funded projects in Skopje, he advised the Macedonian Ministry of Education and
Science on education decentralization and finance. In both countries he helped prepare
and implement per-student allocation formulas to local governments. Jan Herczyński
has been a consultant and has written over 50 reports on education finance, strategy,
and management in transition countries, including Albania, Bulgaria, Georgia, Kosovo,
Kyrgyzstan, Macedonia, Moldova, Lithuania, Poland, Romania, Serbia, and Ukraine.
Prior to his career in education finance, he worked for 17 years as a lecturer and re-
searcher in applied mathematics at Warsaw University, worked in IT quality assurance
and strategic planning in a major Polish commercial bank, and conducted trainings and
analysis in the field of industrial safety. Jan Herczyński holds a Ph.D. in Mathematics.
Please see online: http://www.esep.pl.
Veaceslav Ionita is an Associate Professor at the Academy of Economic Studies of
Moldova. He has developed curriculum and programs for the Management of Public
Administration Department, and since 1997 he has developed and delivered trainings
and courses in regional policy, local public finance, and decision-making mechanisms
in public management. Veaceslav Ionita has been an expert in public finance, macro-
economic forecasts, and municipal development at the Institute for Development
and Social Initiatives IDIS “Viitorul” for the decade. He is a member of the Special
Parliament Commission for Local Public Administration Reforms, a member of the
Council of Experts to the Supreme Court of Justice, and a representative of IDIS to the
Economic Policy Institutes Network. He has published numerous articles on knowledge
management, unofficial taxation, and fiscal decentralization in South Eastern Europe,
as well as quarterly inputs into the IDIS Economic State Watch on Macroeconomic
Forecasts in Moldova.
Stefan Ivanov works for Club Economica 2000 and is a senior research associate at the
Institute of Economics at the Bulgarian Academy of Science. His fields of expertise
include local finance, intergovernmental transfers, education financing, and fiscal de-
centralization. He also is a consultant at the National Association of Municipalities in
Bulgaria and a member of an inter-institutional group for the development of financing
standards and educational facilities. Most recently, he has contributed to a number of
domestic projects to develop and implement the delegated budget system in Bulgarian
schools.
ix
L i s t o f C o n t r i b u t o r s
Nuri Lacka was a member of the Analytical Unit, the sector of the Macedonian Ministry
of Education and Science responsible for the review and analysis of education data in
Macedonia, as well as for aggregating the available data in electronic form and supplying
all sectors of the Macedonian Ministry of Education and Science.
Željka Podrug is a head of the Decentralized Function Department and Financially Sur-
veillance of National Budget Users, at the Ministry of Science, Education, and Sports.
She holds a B. A. in Economics from University of Zagreb, Croatia.
Sherefedin Shehu is a budget and finance specialist with thirty years of professional
experience. At present, he is working for the Ministry of Finance of Albania as Deputy
Minister. He has held key positions in the ministry and his contribution is broadly
acknowledged in many areas. He has established and managed the National Treasury
System and is involved in drafting and implementation of the budget reform, the estab-
lishment of a modern public expenditure and debt management system, planning the
economy growth, budget expenditures, revenues and investment programs, development
of medium-term budgetary program, negotiation of development loan agreements and
public sector restructuring and privatization. He has chaired the committee for restruc-
turing and led the privatization of the three state-owned banks, and has established the
Bank Assets Resolution Trust. Prior to re-joining the ministry, he worked with USAID
projects in Albania and Serbia, the Fiscal Decentralization Initiative for Central and
Eastern Europe (OSI/LGI), and the World Bank Institute.
Sherefedin Shehu holds a Doctorate Degree in Financial Management and used
to be a professor of public finance, financial management and taxation, and Finance
Department Head at the College of Economics of Tirana University. In 2003 he gradu-
ated cum laude from the Department of Accounting at Parkland College, Champaign,
USA. He has conducted a Fellowship on Public Expenditure and Budget Management
at Glasgow Caledonian University and acquired qualifications abroad on financial
management, and macroeconomic and fiscal policy. He has presented papers at na-
tional and international conferences and written a number of books, articles, guides,
and manuals. In 1998, Barons awarded him a certificate of excellence in Who’s Who in
Global Banking and Finance.
Jasna Vidanovska was a member of the Analytical Unit, the sector of the Macedonian
Ministry of Education and Science responsible for the review and analysis of education
data in Macedonia, as well as for aggregating the available data in electronic form and
supplying all sectors of the Macedonian Ministry of Education and Science.

xi
List of Boxes, Figures, and Tables
INTRODUCTION
Financing Systems for Better Schools
Casandra Bischoff
Figure 1. Education as Percent of GDP .................................................. 12
Table 1. Student–teacher Ratios ............................................................ 17
CHAPTER 1
Financing Education in Albania
Sherefedin Shehu
Table 1. Student Enrollment in General and Vocational
Secondary Education ............................................................... 26
Table 2. Public Education: Changes in Student, Teacher, and School
Numbers, 2001–2004 by Percent ............................................ 27
Table 3. Student Numbers in Private Schools and Growth Rates ........... 27
Table 4. Share of Pre-primary, Primary, and Secondary Education
to GDP (in millions of ALL) ................................................... 30
Table 5. Pre-university Education as a Percent of Public Spending ........ 31
Table 6. Spending per Student in 2003 ................................................. 31
Table 7. Financing Sources in Pre-university Education (Percent) ......... 32
Table 8. Structure of Total Education Expenditures by Budget Categories
(ALL and Percent of Each Item of Total Expenditures/Year) .... 32
Table 9. Structure of Education Expenditures by Budget Categories:
Pre-Primary and Primary Education ....................................... 33
Table 10. Structure of Education Expenditures by Budget Categories:
Secondary (General) ................................................................ 33
Table 11. Structure of Education Expenditures by Budget Categories:
Secondary (Vocational) ............................................................ 33
Table 12. Structure of Education Expenditures by Budget Categories:
Training ................................................................................... 33
Table 13. Private Education, Changes in Student, Teacher, and
School Numbers, 2001–2004 .................................................. 38
Table 14. Student–teacher Ratios ............................................................ 42
xii
P U B L I C M O N E Y F O R P U B L I C S C H O O L S
Table A1.1 Indicators of Spending per Student and Teachers Salaries ........ 48
Table A1.2 Share of the Secondary Education Enrollments to
Graduates from Primary Education (Percent) .......................... 48
Table A1.3 Class Size in 2003–2004 (Student/Classes) .............................. 48
CHAPTER 2
Financing Public Education in Bulgaria
Plamen Danchev and Stefan Ivanov
Table 1. Number of Public General Education Schools, Students
and Teachers ............................................................................ 56
Table 2. Public General Education Schools by Type .............................. 57
Table 3. Number of Public Special Schools, Students, and Teachers ...... 57
Table 4. Students in Public General Education Schools ......................... 58
Table 5. Average Number of Students per Teacher across Stages
of Education ............................................................................ 58
Table 6. Number of Public Vocational Schools, Students,
and Teachers ............................................................................ 59
Table 7. Main Financial Characteristics of Education in Bulgaria .......... 64
Table 8. Trends in Net Enrollment Rates in School Education .............. 70
Table 9. Changes in the Average Grades of Students after DBS
(Percent) .................................................................................. 73
Table 10. Changes in Children’s Success in Admission Tests
(Percent) .................................................................................. 74
Table A1.1. Structure of Education Expenditures of Local Authorities:
2003 vs. 2006 .......................................................................... 78
Table A1.2. Comparison of Gross Annual Remuneration of Teachers
to per Capita GDP .................................................................. 78
CHAPTER 3
Financing Education in Croatia
Ivana Batarelo, Željka Podrug, and Tome Apostoloski
Table 1. Average Teaching Salaries in Relation to per Capita GDP ........ 86
Table 2. Expenditure on Preschool, Primary, Secondary, and Vocational
Education as a Percent of GDP and Public Expenditure .......... 88
Table 3. Percent Division of Education Expenditures from
Central Budget (Split between Types of Cost) .......................... 89
xiii
L i s t o f B o x e s , F i g u r e s , a n d Ta b l e s
Table 4. Percent Division of Education Expenditures of
Decentralized Expenditures for Primary and Secondary
Schools (Split between Types of Cost) ...................................... 90
Table 5. Percent Contributions of National and Local Government
to Education Expenditure (HRK Thousands) .......................... 90
Table 6. Croatian Education Budget for 2007 ....................................... 92
Table 7. Preschool Education Investments from the Central Budget
2001–2006 (HRK Thousands) ................................................ 93
Table 8. Trends in Student Numbers and their Relationship
to Numbers of Teachers, Schools ............................................. 95
CHAPTER 4
The First Careful Step: Education Decentralization and Finance
in the Republic of Macedonia
Jan Herczyński, Jasna Vidanovska, and Nuri Lacka
Figure 1. Allocation of the Education Budget ......................................... 113
Table 1. Indicators for Primary Education ............................................. 110
Table 2. The Evolution of the Student–teacher Ratio
(Primary and Secondary Education) ........................................ 111
Table 3. Secondary Education Finance .................................................. 112
Table 4. Education Expenditures as Percent of State Budget (2003) ...... 112
Table 5. Education Expenditures as Percent of GDP (2003) ................. 112
Table 6. Share of Primary and Secondary Education in the
Total Budget for Education (2003) .......................................... 113
Table 7. Structure of Expenditure in Primary and Secondary
Education by Sources (2003) ................................................... 114
Table 8. Structure of Expenditures by Budget Categories,
Primary Education (1998–2003) ............................................. 114
Table 9. Structure of Expenditures by Budget Categories,
Secondary Education (1998–2003) ......................................... 115
Table 10. Employment Norms for Primary Schools ................................ 116
Table 11. Coefficient for Employee Education Level
(Primary and Secondary Schools) ............................................ 117
Table 12. Student Standard Budget 2003 (Percent) ................................. 119
Table 13. Students by Grade (Primary) ................................................... 121
Table 14. Number of Students in Schools with
Albanian-language Teaching ................................................... 121
xiv
P U B L I C M O N E Y F O R P U B L I C S C H O O L S
Table 15. Number of Students in Schools with
Macedonian-language Teaching ............................................... 122
Table 16. Dropout Rates in Albanian-language Schools .......................... 123
Table 17. Average Dropout Rate
(Separate School Years, Primary Education) ............................. 123
Table 18. Dropout Rates in Macedonian-language Schools ..................... 124
Table 19. Average Dropout Rate
(Separate School Years, Primary Education) ............................. 124
Table 20. Student Numbers in Secondary Schools .................................. 124
Table 21. Basic Data on Primary Schools by Type of Municipality .......... 126
Table 22. Class Sizes and Expenditures per Student by
Type of Municipality, 2003 ...................................................... 127
Table 23. Utilities and Maintenance Costs per Student, 2003 ................. 128
Table 24. Number and Type of Grants in Education ............................... 139
Table 25. Allocation Formula for Primary Education .............................. 141
Table 26. Allocation Formula for Secondary Education .......................... 142
CHAPTER 5
Education Financing in Moldova
Veaceslav Ionita
Figure 1. Structure of the Education System in Moldova ........................ 154
Table 1. School Network Development ................................................. 156
Table 2. Preschool, Primary, Secondary, and Vocational Education
Expenditures as a Percent of GDP and Public Expenditure
(MDL million) ........................................................................ 159
Table 3. Districts and Average Number of Students per Class ............... 162
Table A1.1. Delimitation of Jurisdiction among Administration Levels
(Proposal for Reform) .............................................................. 168
Table A3.1. Division of Education Expenditure between Types of Cost
(Teaching Salaries, etc.) ........................................................... 171
Table A4.1. Percent Division of Education Expenditure between
Types of Cost (Teaching Salaries, etc.) ..................................... 172
Table A5.1. Average Teaching Salaries in Relation to per Capita GDP ........ 172
xv
L i s t o f B o x e s , F i g u r e s , a n d Ta b l e s
CHAPTER 6
Financing Education in Romania: A Legacy of Incomplete Reforms
Casandra Bischoff and Jan Herczyński
Table 1. Distribution of Personal Income Tax at the Local Level ........... 183
Table 2. Education Expenditure in Central Europe
as Percent of GDP (1989–2000) ............................................. 196
Table 3. Percent of Public Spending for Education ................................ 197
Table 4. Student–teacher Ratio for Primary Schools and Gymnasiums .... 198
Table 5. Simulated Student–teacher Ratios by Level of Education ......... 199
Table 6. Class Size in Central Europe .................................................... 199
Table 7. Class Size among Schools ........................................................ 200
Table 8. Spending per Student among Schools (RON) ......................... 200
Table 9. Non-personnel Spending per Student among Schools (RON) ... 201
Table A1.1. Students by County and by Education Level ........................... 210
Table A1.2. Class Size by County and by Education Level .......................... 212
Table A1.3. Personnel Spending per Student by County and
by Education Level .................................................................. 214
Table A4.1 Personnel Spending per Class by County and
by Education Level .................................................................. 216
Table A5.1 Non-Personnel Spending per Student by County and
by Education Level .................................................................. 218

I N T R O D U C T I O N
Financing Systems for Better Schools
Casandra Bischoff


3
I n t r o d u c t i o n : F i n a n c i n g S y s t e m s f o r B e t t e r S c h o o l s
Both centralized and decentralized systems can be good engines to deliver education,
as both the experiences of France—at one end of the decentralization spectrum—and
New Zealand—at the other—attest.
Today, however, the vast majority of countries—and the ones we study in our
report—use shared responsibilities among the various levels of government. Even in
traditionally centralized countries like France, budget decisions have been recently
devolved to a certain extent. On the other hand, in the United States higher levels of
government are now assuming new responsibilities in financing education.
What seems to be important, therefore, is not deciding between decentralization
versus centralization. The more important question is what kind of financing system
can effectively attract the resources of the state, civil society, and the private sector to
achieve national educational goals? What kind of financing arrangement for primary
and secondary education has a positive impact on quality, effectiveness, and efficiency
in education?
The report will examine the financing choices of six countries:
• Albania, where the central government has retained most of the responsibilities
in education, while recently delegating some functions in expenditure manage-
ment, such as maintenance, to the municipalities.
• Bulgaria, where a delegated budget system (DBS) has been implemented in
more than 30 municipalities so far.
• Croatia, where the education system for the most part is still centralized in terms
of management and human resources of schools but where the decentralization
of resource allocation has begun.
• Macedonia, which distinguishes itself as a champion in education reform in South
Eastern Europe and is now ready to implement the second phase of education
decentralization.
• Moldova, with complete centralization for all policy competencies, from the
determination of policy standards in education to the execution of policy.
• Romania, where efforts to decentralize the education sector began as early
as 1995, but where results of this sinuous reform process are still hard to
measure.
The first section of this summary looks briefly at the institutional framework of each
country, both the school management and financial arrangements The second section
will assess the impact of these arrangements on the quality, effectiveness, and efficiency
of the education system and will draw some conclusions.
4
P U B L I C M O N E Y F O R P U B L I C S C H O O L S
INSTITUTIONAL FRAMEWORKS
Several external factors—such as a consistent decline in the school population, changing
demands in labor markets, volatile economic growth, and consequently an increase in
the consumption of private education—seem to be at work in all the countries of our
study. Other internal factors, such as a political environment conducive or constraining
to reform, are important when considering whether to keep or to hand over the control
of certain education functions.
School Management
Albania
The main education functions stay with the central government, which enjoys hegemony
in the education sector through two layers of deconcentrated offices, at the regional and
district level. These units decide on the school network, number of teachers, and also
have the power to hire or dismiss school directors, teachers, and other non-teaching
staff. In terms of teacher salaries, local governments are paymasters and can hire security
personnel who they pay from the local budget.
The only fully decentralized function is maintenance. Municipalities are now given
ownership over school buildings—although the plots where the buildings are located
still belong to the central government.
The Albanian government has given a lot of attention to decentralization policy
in education. Notably, in 2004 the government issued a policy paper on education decen-
tralization, which unfortunately was not followed up with clear changes in legislation.
A pilot project was implemented in Tirana and tested the decentralization of extended
budget execution powers. As a result of this pilot project, extended powers in the budget
execution were transferred to municipalities. The results remain inconclusive though.
Bulgaria
In 2006 the government empowered the school councils in 10 pilot municipalities.
The councils include a representative of the regional inspectorate, one of the municipal
administration, two representatives of the pedagogical staff of the school, and two parent
representatives. The council is responsible for evaluation of the performance of the
school director; proposes the dismissal or appointment of the school director; and the
proposal must be endorsed by the regional inspectorate. School councils are envisaged
to be extended as a mandatory structure in all schools in Bulgaria in 2009.
5
I n t r o d u c t i o n : F i n a n c i n g S y s t e m s f o r B e t t e r S c h o o l s
In the rest of the schools across the country the central government retains the major
competencies such as hiring and dismissal of directors through the ministry and its
deconcentrated units, the regional inspectorates. The director of the school can hire or
fire teachers and non-teaching staff. However, the number of teachers and non-teaching
staff is decided by the center.
The same cannot be said about staffing, class sizes, salaries, and other operational
education expenditure regulations, which have been relaxed starting in 2008. They
are now mostly recommendations. This has had a positive impact on the powers of
directors, who now can determine the number of staff, specific salaries, or individual
teaching hours of their teachers. Moreover, the director now can decide what portion
of the school budget will go for maintenance and for labor costs.
The recommendation to open or close a school is made by the funding authority
(local government for the municipal schools) and submitted to the regional education
inspectorates. The latter checks the circumstances, prepares an opinion, and the recom-
mendation is submitted to a committee appointed by the Minister for Education and
Science. The committee, composed of representatives of the ministry, considers the
recommendations, examines the attached documents, and prepares a recommendation
to open or close a school that the minister then approves in an order.
The maintenance of school buildings and the current operating expenses are covered
by the owner, i.e., the respective ministry for the state schools and the municipality for
the municipal ones.
Croatia
Croatia started the process of decentralization of primary and secondary education in
2001, when the central government transferred the responsibility for financing educa-
tion, healthcare, welfare, and fire departments to local governments. The main principles
underlying the decentralization of financing was the transfer of founding rights. School
founders are commonly larger municipalities.
In the municipalities that were given new responsibilities, the school council
selects the school director. The school council has a fairly balanced composition, with
four school representatives and three representatives of a local government unit. The
ministry does not have any influence over the hiring or dismissal of the director.
However, the ministry is currently contemplating the idea to change the composi-
tion of the school’s councils in such a way as to have a final say in the appointment of
the directors.
The school council also elects the teachers and administrative personnel, subse-
quent to competition. Salaries are calculated on the basis of coefficients regulated by
the central government.
6
P U B L I C M O N E Y F O R P U B L I C S C H O O L S
The establishment and closure of schools are regulated at the level of the town for
primary schools or the municipal level for primary and secondary schools. The same
legal regulations determine class size, namely 30 students (plus/minus two). Teaching
plans and programs are determined on the central level.
Macedonia
A fully centralized system before 2001, Macedonia undertook the devolution of
significant powers to municipalities in many sectors of public life, including educa-
tion. Decentralization of education was implemented in two phases. In Phase 1, the
center transferred limited responsibilities—such as maintenance, repairs, and material
expenditures. Salaries were excluded.
The changes also included an important redesign of the school board, which now
has the authority to select and dismiss the school director, to set the school budget, and
to adopt the school statute. The new system also foresees the introduction of a system
of licensing of school directors.
Phase 2, planned for the period 2007–2009, includes the transfer of further func-
tions to those municipalities that fulfill certain conditions specified in the Law on Local
Government Finance or LLGF. Starting in September 2007, around 50 municipalities
entered the second phase of decentralization.
Moldova
A snapshot of the Moldovan system reveals an almost complete centralization of all compe-
tencies, from the determination of policy standards in education to the execution of policy.
Local governments can only submit proposals for the opening, reorganization, and closing
of schools. Further, the boards of education at the raion level analyze the documents and
submit a proposed decision for approval to the Ministry of Education. Wages and social
and medical insurance expenditures for education personnel are the responsibility of the
deconcentrated departments of the Ministry of Education, at the level of the raion.
The ministry is in charge of the overall management of the school, from the orga-
nizational chart to the selection of school directors and teachers. The director of the
school can hire additional teachers if needed, but only with the approval of the raion.
Inspection and monitoring of school performances and finances are ensured by the
deconcentrated offices of the Ministry of Education.
Local governments are responsible for the maintenance of schools, while capital
works are the responsibility of the central government.
In 2002, the government transferred new powers and tasks to the raions and local
governments, but it failed to provide the necessary financing. An example of an unfunded
7
I n t r o d u c t i o n : F i n a n c i n g S y s t e m s f o r B e t t e r S c h o o l s
mandate would be housing for young teachers who settle in the rural areas. The Ministry
of Education ensures the payment of their salaries. Obviously, since most local govern-
ment revenues were not high enough to cover this additional expenditure, the law was
implemented starting in 2006, when the government allocated around EUR 600 per
academic year for each young teacher.1
Romania
Romania is a country whose policy efforts in education would be best described as stop-
and-go reforms. Unfortunately, the impetus for reform by various education ministers
has often ended as a result of political power struggles. Alternatively, as soon as external
pressures for reform—such as integration into the European Union in 2007—are
discontinued, education seems to fall off the reform agenda.
Attempts to reform education in 2001 were prioritized one more time in 2004, when
the primary and secondary legislation was brought in line with what was intended to
be decentralization to schools. The director of the school became the chairman of the
administration council, the power of the administrative council was strengthened, while
the role of the school director was changed from that of a teacher to that of a manager
held accountable through a managerial contract signed with the inspectorate. School
budgets with revenue and expenditure sides were introduced.
However, the new framework summarized above was implemented in only eight
pilot counties until now. In the rest of the schools across the country the inspectorates
still have significant powers. They nominate the teachers and set up public education
units such as kindergartens, primary schools, middle schools, and vocational and appren-
ticeship schools. The director of the school signs his/her contract with the inspectorate,
not with the local government, so the relationship between the school and the local
community is considerably weakened. Furthermore, the administration council has
only a consultative and advisory role.
Financial Arrangements
Albania
Financing for primary and secondary education remains highly centralized, provided
mainly by the central government. Local governments are responsible for the financing
of basic school maintenance. This includes heating, electricity, telecommunications
(telephones, Internet connections), water, waste disposal, cleaning materials, small
repairs (windows, drains, etc.), and painting. They do make a small contribution to
8
P U B L I C M O N E Y F O R P U B L I C S C H O O L S
salaries, but only for the guards hired in schools. Since their own revenues are insuf-
ficient to finance this function, local governments use part of a general grant allocated
on the basis of a formula. But the issue of underfunding remains.2 Experience shows
that local governments spend only around 16 percent of the general grant on education
(or, excluding Tirana, only 12 percent). As a proportion of the total education budget,
this is far below the average OECD level of over 19 percent.
The remaining responsibilities are delegated and receive almost 100-percent financing
each year through the annual state budget law. Furniture, didactic materials, and student
transportation are financed by the regional units of the ministry (Regional Directorates of
Education or RDE). Similarly, the salaries for the staff employed in schools are financed
entirely by the central government. These are calculated by the Ministry of Education
based on actual employment levels in schools and on average salaries (by education level)
for each municipality. The amounts allocated for salaries are then sent to municipalities,
which pay the school staff. Since 2006 the state has reimbursed 70 percent of the costs
of textbooks for all primary education.3
Bulgaria
Prior to 2002, schools were financed through general budget revenues. Municipalities
raised limited own revenues and received from the state shared taxes by origin and
general subsidies. Like in many other countries in the region, the unclear division of
responsibilities between central and local government in public service provision created
some disincentives for efficient and effective financial management.
In 2003, as a result of a serious decentralization reform, municipalities were delegated
education functions. The expenditures for activities delegated by the state are based on
two different standards (for maintenance and staff salaries) and were generally funded
from personal income tax receipts. In 2007, the previous expenditure standards were
“unified” and converted to a single costing standard per student (quasi-voucher system
implementing the principle “money follows the student”). The design of the new costing
standard stimulates the financing authority (ministries and the local governments) to
adopt their own pattern for the allocation of funds across schools.
In addition to the funds defined through the costing standard, in the course of each
year the municipalities receive subsidies from the Ministry of Finance for additional
remuneration of teachers, subsidies to compensate costs incurred by the municipalities
(such as transportation), subsidies for capital investments from the Ministry of Education
and Science, and free textbooks for first-grade pupils.
In addition, Bulgaria introduced a pilot delegated budget system for secondary
education in 1994. The state gave the school authorities the right to make independent
decisions about administrative, organizational, and financial aspects, and they were held
9
I n t r o d u c t i o n : F i n a n c i n g S y s t e m s f o r B e t t e r S c h o o l s
accountable for the results of these decisions. The powers and responsibilities of munici-
palities shifted from direct management of schools to coordination, methodological
assistance, training, and supervision. Schools became secondary budget holders and
are now able to compile their own budgets and have their own bank accounts. Schools
have also the authority to manage property such as canteens, land, and vacant premises,
and to raise additional revenues.
The delegated school budget system has been expanded nationally in 2008, thus
further increasing the financial and management autonomy of schools.
Croatia
Croatia transferred the responsibility for financing a part of the primary and secondary
education functions to local governments that have sufficient fiscal capacity to do
so. In municipalities with less revenues, the upper administrative level takes over the
responsibility to finance the decentralized competencies. However, many smaller local
governments have expressed an interest in being given further financing rights.
Each year the government and the Ministry of Finance set minimum financial
standards or the cost of a certain function in cooperation with the ministry. In defining
minimum standards the ministry takes into consideration the expenditure needs of local
governments. The needs estimation uses the number of enrolled pupils in a certain year
multiplied by the average annual cost per pupil.
The central government fully covers salaries and partially covers maintenance. For
the functions that were transferred (transportation, remainder of maintenance), local
governments can use two sources for financing. One is a share of the income tax. The
difference between additional income taxes collected locally in towns and municipalities
and the approved minimal standard is received from an equalization fund, the level of
which is decided in the budget law each year.
Macedonia
The main source of education financing is the state budget (95 percent in primary
education and 80 percent in secondary education). Extrabudgetary resources are used
to compensate for a very limited level of budget allocations, especially maintenance.
Schools have separate accounts for each source of income and are not allowed to transfer
money from one account to another without permission from the ministry (since 2007,
without the permission of the appropriate local government).
About 85 to 90 percent of the education budget is generally spent on salaries, eight
percent on goods and services, four percent on student transport, and two percent on
investments.
10
P U B L I C M O N E Y F O R P U B L I C S C H O O L S
During the first phase of decentralization, transferred functions are financed through
categorical grants excluding salaries, and full financing including salaries will start only
in the second phase, through block grants. For the first phase of education decentral-
ization, the ministry uses a per student allocation formula to municipalities. The main
indicator in the formula is population density. The setting of budgets of individual
schools became the responsibility of municipalities and is closely monitored by the
ministry. For the second phase, a new allocation formula is to be designed, since the
present distribution patterns of maintenance expenditures and of total school expen-
ditures are quite different.
Moldova
Education financing is fully centralized in Moldova. The main financing source for
education is the state budget in the form of shared revenues and transfers (grants) for
local governments and shared taxes. The percentage of shared revenues is defined in the
annual budget law. The specific feature of this regulation is that the minimum percentage
of shared revenues to be kept by respective local government should be no less than
50 percent. The second important source is the transfer system. Moldova uses two: an
equalization mechanism and conditional grants. Conditional grants are sent to raions,
which reallocate them to local governments.
Schools can also use own revenues of local governments (from local taxes and other
revenues from renting local facilities) and they can build the own revenues of schools
(i.e., the “school fund,” revenues from extracurricular courses, rental revenues).
Between 1998 and 2003, the financing of education was made through a block
grant (general transfer) that was calculated on the basis of expenditure norms. Local
authorities enjoyed significant discretion over the allocation of the block grant for various
local services. However, given that the need of local governments was constantly larger
than the transfer received, one of the results was that teacher salaries became secondary
in importance and in many cases teachers did not receive their salaries for three to
six months. To address this issue, the central government went back to the system of
categorical grants in 2003.
In order to determine how much financing is needed, the Ministry of Finance uses
expenditure norms that are based on historical budgeting. Maintenance expenditures,
for example, are calculated using the number of students. As a consequence small rural
locations that have a reduced number of students receive less funding for maintenance,
even if these are typically the largest maintenance consumers.
Moldova has an interesting form of voluntary participation by parents in the educa-
tion system. Parents directly finance some functions that are severely underfunded by
the central government, such as salaries of teachers, maintenance, and even capital
11
I n t r o d u c t i o n : F i n a n c i n g S y s t e m s f o r B e t t e r S c h o o l s
expenditures. This is by no means the result of a conscious decentralization policy, but
rather an attempt to compensate for the state’s failure to ensure sufficient financing for
education.
Romania
Romania’s financing mechanism is a two-pillar system that includes global (proportional)
financing and complementary financing. Global financing covers staff salaries, materials
and services, and teacher in-training. This is financed through conditional grants and
comprises over 95 percent of recurrent school budgets. Remaining expenditures, such
as dormitories and cafeterias, student assessment, scholarships and student transporta-
tion, medical check-ups for employees, school contests, investments, and major repairs
are part of complementary financing.
The amounts to be allocated are calculated based on teaching inputs, the most
important being teacher salaries. Despite the fact that a standard cost was introduced
in the legislation in 2001, the main method used to finance primary and secondary
education—with the exception of several pilot counties—continues to be historical
budgeting. The main problem that prevented the implementation of the standard cost
formula was the fact that the costs—calculated based on the legal norms governing
the employment of teachers and non-teachers (including curriculum, class sizes, the
national pay scale) as well as relevant norms (for instance, heating)—turned out to be
unrealistically large. The standard costs resulting from those calculations came out 30
to 40 percent higher than the historical costs of specific types of school, which made
them unacceptable to the Ministry of Finance.
A new education management and finance framework introduced in 2004 was
piloted in all school units of eight pilot counties, with the scope of testing the newly
adopted regulations. The real effect of the pilot project was to increase school autonomy
regarding the employment of teachers and the participation of the school community.
The pilot project is continuing, but there are no immediate plans for national replica-
tion. The second program included 50 school units in three different counties selected
from the initial eight pilot counties, with the main purpose of testing a per-student
formula based on historical costs and transferred as a specific grant to local authorities.
However, there was no official decision regarding the per-student formula to be tested
by the schools, and therefore, no applicable mechanism to test, monitor, and assess it.
The second pilot ended inconclusively in December 2007.
12
P U B L I C M O N E Y F O R P U B L I C S C H O O L S
EVALUATION
This section will look at the impact of the financial settings in the six countries from
the point of view of three issues:
1) Effectiveness in terms of stimulating the quality of teaching;
2) Equity in the allocation of resources; and
3) Efficiency in the allocation of resources and the use of resources by individual
schools.
However, an important structural issue needs to be addressed beforehand, namely
the underfunding of education.
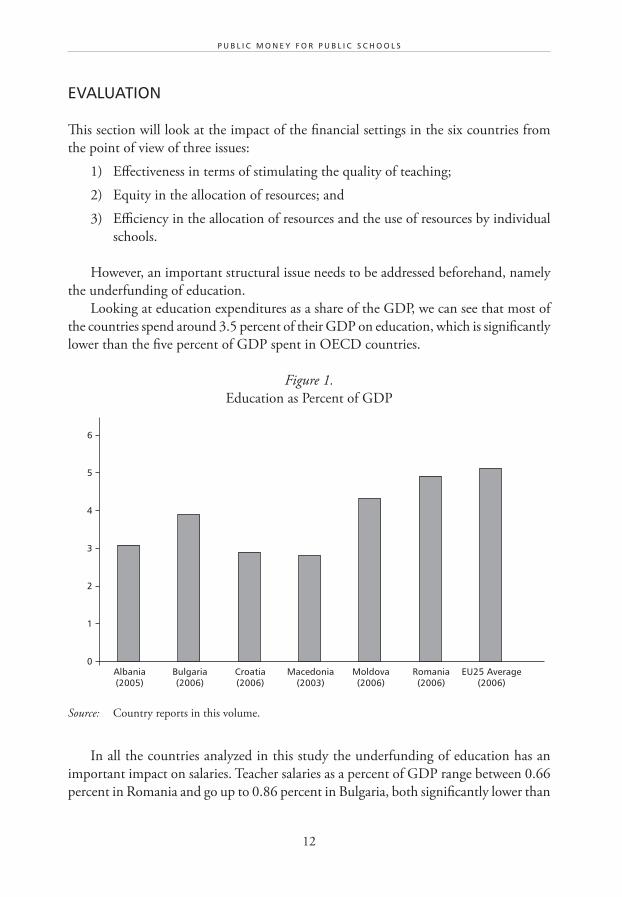
Looking at education expenditures as a share of the GDP, we can see that most of
the countries spend around 3.5 percent of their GDP on education, which is significantly
lower than the five percent of GDP spent in OECD countries.
Figure 1.
Education as Percent of GDP
Source: Country reports in this volume.
In all the countries analyzed in this study the underfunding of education has an
important impact on salaries. Teacher salaries as a percent of GDP range between 0.66
percent in Romania and go up to 0.86 percent in Bulgaria, both significantly lower than
1
2
3
4
5
6
0Albania(2005)
Bulgaria(2006)
Croatia(2006)
Macedonia(2003)
Moldova(2006)
Romania(2006)
EU25 Average(2006)
13
I n t r o d u c t i o n : F i n a n c i n g S y s t e m s f o r B e t t e r S c h o o l s
OECD averages of 1.33 of GDP per capita for primary education and 1.37 of GDP per
capita for secondary education (World Bank Education Policy Note 2007). Here, Croatia
makes a special case, with 1.70 percent of GDP spent on salaries. This can be explained
by the coherent policy of the government to align the increase in the number of teachers
with an increase in the funds for salaries. It is also worth mentioning that teachers in
Croatia have the status of public servants, which gives them a stronger bargaining posi-
tion. The government works within a framework contract with the teacher unions that
regulate the benefits for teachers working in special conditions (e.g., combined classes,
work with students with special needs, schools in remote areas) as well as surpluses for
each additional academic level.
Low salaries have led certain categories of teachers in Romania to the limits of
subsistence. In Bucharest, for example, the basic salary of a young teacher does not
cover even basic expenses, such as rent and utilities.
There are many consequences of inadequate payment. One of them is a loss in the
motivation of teachers to perform at their best, which leads to a decrease in the quality
of teaching. In other countries cases of corruption during national examinations or
competitions for jobs in the academic system have become a worrying phenomenon in
the last five years. Corruption is also reported related to promotions in higher education
and the awarding of Ph.D. degrees.4
Another obvious effect is that teachers search for alternative sources of revenue. In
most of the countries in this report there are two main strategies: either migrating to
wealthier countries or searching for alternative jobs in education. Albanian teachers, for
example, are leaving for cleaning or gardening jobs in Greece, Italy, and Switzerland. This
is, however, associated with a significant loss of social prestige. The second option is to
take more teaching norms in other public or private schools and, alternatively, provide
private tutoring to students. Anecdotal evidence in Albania suggests that in Tirana up
to 80 percent of all gymnasium students, and in other cities at least 30 percent, take
private lessons, either with their own teachers or with teachers whom they recommend.
Moreover, sometimes the pursuit of clients for private tutoring is rather aggressive, even
in cases of talented students who do not need supplementary teaching at all. The situ-
ation is similar in Romania.
Too much private tutoring distorts the dynamics of teaching and learning in schools.
It shifts the focus and expectations of students away from the school while it also creates
a strong incentive for teachers to neglect their school classes in favor of afternoon lessons.
This increases social inequality, because poorer and rural students have less access to
private lessons (Herczyński 2007).
The second important effect of the underfunding of education is a significant decrease
in the quality of school infrastructure. However, deficient school maintenance is also
due to the fragmentation of responsibilities among too many administrative levels, and
it will be treated separately in the following sections.
14
P U B L I C M O N E Y F O R P U B L I C S C H O O L S
Effectiveness
One of the questions regarding effectiveness is whether the volume of school finances
reduces or increases when local governments become responsible for funding schools.
A model of purely local government financing is to be found only in a few places
in the world—such as the United States, where local school districts raise their own
revenues through a tax on private property,5 or some cities in Brazil. However, this
model results in highly unequal spending per student across the municipalities, which
leads most other countries to chose shared financing.
The experiences with shared financing depend on how much responsibility was
transferred to the local governments. In Bulgaria, studies show that local governments
that adopted the delegated budget system allocated additional funds for education from
their own revenues up to 2.6 percent of the total amount spent for schools. This may
seem to be a low figure, but it is a significant increase—almost double—if compared
to the national average of 1.4 percent in municipalities that do not use the delegated
budget system.
In other words, when it is clear what is the minimum that local governments
should spend on a certain function—and that minimum is financed 100 percent from
the center—the local authority tends to add even more from their own revenues. This
conclusion could be supported by a contrast with countries where there is less clarity in
terms of shared responsibilities and no expenditure standards are required. In Albania,
for example, maintenance is fully decentralized. However, since local governments do
not have sufficient own revenues to finance this function, they use a general transfer in
order to finance maintenance—besides many other local services. What typically happens
when maintenance competes for funding with other local services is that it becomes of
secondary importance. Local governments spend less than they could spend—in the
case of Albania around 16 percent of the general transfer on education.
Another question regarding effectiveness is whether decentralization to local govern-
ments or school management increases creativity and responsiveness in terms of the
syllabus and special subjects delivered according to local needs. There is insufficient data
to build on this argument from the countries studied in this report. However, where
local financial responsibility increased (Bulgaria), there is evidence that schools and
municipalities have become more involved in acquiring new inventory and teaching
aids better suited to their local needs.
In the majority of the countries studied here personnel policies remain fully central-
ized and are exercised by the deconcentrated offices of the Ministry of Education. These
units decide on the number of teachers and also hire or fire school directors, teachers,
and other non-teaching staff. Local governments therefore have no ability to effect
the recruitment and retention of effective teachers. Two exceptions are Bulgaria and
Romania, where some school councils6 in pilot programs appoint directors of schools.
15
I n t r o d u c t i o n : F i n a n c i n g S y s t e m s f o r B e t t e r S c h o o l s
However, teacher remuneration remains the responsibility of the central government
in all the countries studied in the report.
Moldova presents a rather unusual situation where parents are deeply involved in
supplementing teachers’ salaries. This compensatory behavior does not help the central
government to resolve the critical issue of underfunding. Another interesting program
that Moldova put in place in 2002 is a financing scheme to attract young teachers to
rural areas, by providing them with housing or with housing subsidies. The central
government would pay the salary of the teacher, while the housing subsidy would be
financed from local budgets. However, this scheme was never sustainable, since the own
revenues were too insufficient to make the program work in a sustainable manner.7
Equity
Four methods can be identified in terms of funds allocation in education (Ross and
Levacic 1999):
• Historic funding or incrementalism, where a school receives funding for the
current year that is the same as it spent the previous year modified up or down
by a few percentage points.
• Bidding, where a school presents a case for funding based on known criteria and
is awarded finance according to how well the funding agency considers that the
bid meets the criteria.
• Discretionary, where a school receives funding according to the opinions and
judgments exercised by the funding agency administrators.
• Formula funding, which distributes the funds to schools according to the needs
of the specific students in each school.
Obviously, the method that ensures equity in the distribution of funds—in both
decentralized or centralized systems—is a formula.
There are two forms of equity that can be included in the formula:
• Horizontal equity—which implies the like treatment of recipients whose needs
are similar.
• Vertical equity—which implies the application of differential funding levels for
recipients whose needs vary.
Needs-based funding is an attempt to determine the learning needs of each category
of student and the cost of resourcing that need (within budget overall constraints) so
that both horizontal and vertical equity considerations are satisfactorily considered.
16
P U B L I C M O N E Y F O R P U B L I C S C H O O L S
Formulae can be used to make the allocation of inputs more equitable or in an attempt
to make the distribution of educational outcomes more equal. Giving schools the same
basic allocation per-student differentiated by grade level is crucial in ensuring horizontal
equity in the allocation of resource inputs to both schools and students. Adding differ-
ential amounts to the basic allocation per-student—so as to fund students differentially
accordant to their educational needs—is a step in promoting vertical equity.
The experience from the countries where the allocation is based on the input costs
of the existing network of educational institutions shows that the system is less fair than
a formula-based distribution of funds taking into account objective needs for schooling.
Fairness can be analyzed by looking at the regional discrepancies in per-student financing.
This is the case of Albania, where the regional variation in per-student maintenance costs
is high in primary education, especially because maintenance is fully decentralized and
there are no norms regulating maintenance expenditures. Tirana has by far the largest
maintenance expenditures in the country, reflecting the relative wealth of the capital.
It spends three times more than the Durres region on the coast. The same happens in
Croatia, Moldova, and Romania.
Before 2005 Macedonia showed the same 3.3:1 ratio in terms of maintenance
variation between the capital and municipalities in the rural areas. The start of the first
phase of decentralization brought with it the transfer of maintenance management to
the local governments, while the financing was ensured from the central government.
The allocation of the funds was done using categorical grants. A formula was put in
place with three main elements:
1) The lump sum, allocated to each municipality irrespective of the number of
students (for primary schools only).
2) The number of weighted students.
3) Lower and upper buffers.
The current design of the formula protects the small municipalities (through the
lump sum), provides more funds to the small schools with small classes where mainte-
nance costs per student are higher, and also protects the municipalities from excessive
changes from previous year’s allocation.8
Bulgaria adopted a new mechanism for funding municipal education activities
following the introduction of the quasi-voucher system in 2007. Local governments in
Bulgaria were grouped in four general groups based on key demographic and geographic
criteria. The costing standard was defined for each of these four groups and mid- to
long-term targets were set according to the implementation of tailored programs for
each of the groups, with the ultimate goal to reduce the factors driving the different
levels of costs for education. The delegated budget system has been nationally expanded
in 2008, further increasing the financial and management autonomy of schools.
17
I n t r o d u c t i o n : F i n a n c i n g S y s t e m s f o r B e t t e r S c h o o l s
Efficiency
Efficiency refers to two situations in the education sector.
First, it refers to the allocation of available funds for education in a way that stimu-
lates the optimization of the school network and staffing. Local administrations need
to be involved in the allocation process, as they are better positioned to assess the need
for (especially primary) education and may also be in a better position to determine
the need for staffing, as they balance their education expenditures with other parts of
the local budget. The role of the central government here is to decide how to allocate
the funds and manage the distribution mechanism.
Second, it refers to the way in which individual schools use their resources and
looks at how much discretion local governments (and schools) have to manage their
own budgets. The starting assumption is that giving a higher authority to local govern-
ments to decide how to spend the allocated resources leads to higher efficiency because
they will become aware of the scarcity of their resources—hence the need to use their
resources efficiently—only when they are in charge of managing those resources. The
role of the central government is to disseminate good practices that would help local
governments use innovative methods to increase efficiency.
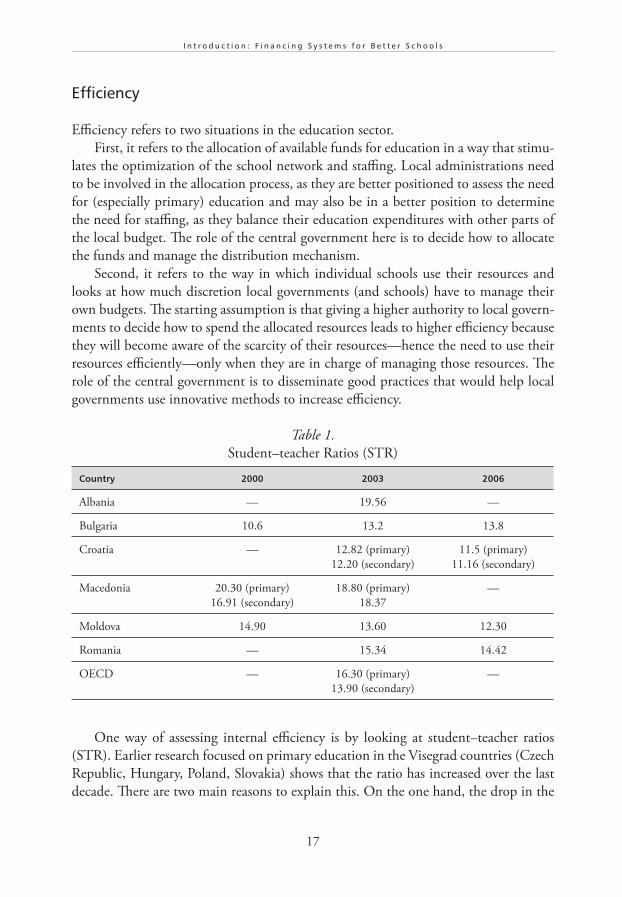
Table 1.
Student–teacher Ratios (STR)
Country 2000 2003 2006
Albania — 19.56 —
Bulgaria 10.6 13.2 13.8
Croatia — 12.82 (primary)
12.20 (secondary)
11.5 (primary)
11.16 (secondary)
Macedonia 20.30 (primary)
16.91 (secondary)
18.80 (primary)
18.37
—
Moldova 14.90 13.60 12.30
Romania — 15.34 14.42
OECD — 16.30 (primary)
13.90 (secondary)
—
One way of assessing internal efficiency is by looking at student–teacher ratios
(STR). Earlier research focused on primary education in the Visegrad countries (Czech
Republic, Hungary, Poland, Slovakia) shows that the ratio has increased over the last
decade. There are two main reasons to explain this. On the one hand, the drop in the
18
P U B L I C M O N E Y F O R P U B L I C S C H O O L S
number of pupils causes an increase of the STR. At the same time, evidence shows that
countries where salaries of teachers are paid by the state (Czech Republic, Slovakia) have
also experienced a rise in the total teaching force. On the contrary, in countries where
the local level is in charge of management and financing of primary schools, the overall
number of teachers has actually decreased.
All of the countries in this study face negative demographic processes; however,
the policy efforts to deal with them vary from country to country. At one end of the
spectrum is Albania, with a high STR of 19.56 (2003), where government efforts were
surpassed by an important internal population migration from rural to urban areas
and from the northern part of the country to the south. Between 2004 and 2007, the
number of primary school students fell by nearly 10 percent. More than 16 percent of
the total decrease in school enrollments occurred in rural schools, while the student
population in urban schools in those regions grew by more than half.
A different case is Croatia, with a relatively low STR that is constantly decreasing.
Besides the similar decrease of number of students in schools, there are several develop-
ments that make Croatia different. The state continues to open new schools, given the
return of refugees and the renewal of schools that were destroyed during the war in the
1990s. As a result Croatia has a continuous increase in number of schools and teachers9
and a tendency to reduce the number of students in the class. From 1994 until 2004,
the average number of students in primary school classes decreased from 24 to 21. This
would imply that the system provides higher-quality teaching to students; however, at
a higher cost for the system.
Macedonia has not adjusted the teaching force to the decreasing student population
either, and the student–teacher ratio decreased by only 7.3 percent. At the same time
the size of classes went down by about 5.2 percent. Still, the student–teacher ratio is in
line with OECD averages of 16.5 students per teacher in primary education and 13.6
students per teacher in secondary education.
In order to deal with the change in the demographics, the Bulgaria government
went for drastic school closures. In Bulgaria, 410 general education schools (of which more
than 90 percent were in rural communities) were closed between 1999 and 2007.
In Romania the number of students fell by three percent, but the number of
teachers grew by two percent between 2003 and 2005. Throughout this period, the
student–teacher ratio fell by five percent. This may be partially due to increased number
of part-time teachers. Overall, the government has not been pursuing an active policy
to improve the efficiency of the sector in a period of serious budget constraints.
Moldova is in the midst of an important and difficult process to transform old
general schools in colleges and high schools. In addition, starting in 2004 there has
been a significant decrease in the number of schools, mainly as a result of the decreasing
number of students. The government has found a solution that has a substantial nega-
tive impact on the quality of teaching. In rural areas with a lower number of students,
19
I n t r o d u c t i o n : F i n a n c i n g S y s t e m s f o r B e t t e r S c h o o l s
classes were amalgamated, meaning that children in the first, second, and third grades
are learning together.
The school management system encourages efficient use of resources in the case
of delegated budgets in Bulgaria as well as in Macedonia, which uses elements in the
formula that encourage efficient spending of resources. For the rest of the countries
efficiency in spending is left at the discretion of individual directors. Although they are
unable to retain savings, they can decrease heating and electricity costs by simply turning
off the heaters or replacing broken windows. They can increase their own revenues by
organizing donor events and collect own revenues for the school, and they can rent
school facilities, although schools never rely solely on this type of earning.
The delegated budget system (DBS) in Bulgaria is a good illustration of a budgeting
system that promotes efficiency. Within this system the municipality transfers the right
to make independent administrative, organizational, and financial decisions to the
school authorities, and they are also held accountable for the results of these decisions.
More specifically, the municipality and the school directors agree upon the mechanism
of allocating resources among schools, while schools become secondary budget holders,
compile their own budgets, and have their own bank accounts.
The experience of Bulgaria shows that delegating budgets to the schools and local
governments is a good solution to regulate relations between municipalities and schools
and increases efficiency overall. The total amount of resources and their allocation among
schools are determined in a transparent and objective manner and it is no longer possible
to make excuses for poor performance or blame others. Each director can calculate the
amount he or she is entitled to, and the amount of the neighboring school. The formula
includes adjustment ratios, buildings, and additional activities like dormitories and help
reflect the specificities of schools at the local level. More funds are available because
schools have incentives to increase their own revenues.
DBS is a good tool for reducing costs, because spending becomes more efficient.
There are incentives to save because the savings are kept by the schools to be spent on
the priorities the schools have identified. Expenditures are more efficient. If in the past
schools contributed to a municipality’s unpaid bills, now they end the year with carry-
over surpluses.
SOURCES CITED
Country reports in this volume.
Herczyński, J. (2007) Current Problems of Education Finance in Albania. Draft paper..
World Bank (2007) Romania Education Policy Note.
Ross, K. and R. Levacic (1999) Needs-based Resource Allocation in Education via Formula Funding of Schools. Paris: International Institute for Educational Planning.
20
P U B L I C M O N E Y F O R P U B L I C S C H O O L S
NOTES
1 This was done with the support of external assistance. It is not clear whether the program
will be implemented further.
2 For a more detailed discussion on the underfunding of Albania education, please see Jan
Herczyński (2007).
3 With the exception of students of poor rural students, to whom the state budget reimburses
90 percent of textbook price.
4 World Bank (2007).
5 Even in the United States, levels of government are now assuming new responsibilities in
financing education
6 The school councils consists of one representative of the regional inspectorate, one repre-
sentative of the municipal administration, two representatives of the pedagogical staff of
the school, and two parent representatives.
7 The scheme was implemented four years later with external financing.
8 For a more detailed analysis of the formula, please see the Macedonia chapter.
9 The increase in the number of teachers is also due to the inclusion of two foreign languages
in the obligatory school curriculum.
C H A P T E R 1
Financing Education in Albania
Sheferedin Shehu

23
F i n a n c i n g E d u c a t i o n i n A l b a n i a
Executive Summary
Albania has built a complete education system from preschools to postgraduate studies.
The government assumes the bulk of the responsibility for financing pre-primary, primary
and secondary education, vocational and technical education, and training and tertiary
education. Public funding covers 100 percent of the recurrent and capital expenditure of
government schools while no funding is provided for private schools.
During its transition towards a market economy, Albania has shown different trends of
education spending. Except for the three years of 1990, 1991, and 1995, public spending
on Albanian pre-university education, as a share of GDP, has steadily decreased, a trend that
repeated itself during the period 1999–2004. Public spending on primary and secondary
education as a share of GDP at the beginning of the transition (1989) was four percent.
At the end of 1998, the share fell to 2.8 percent. Since 1998, the share has also been
decreasing—its lowest level was in 2002 (2.05 percent). Educational spending as a share
of GDP has also been at a lower level than in other countries in transition.
Education spending as a share of total public spending in Albania increased slightly
between 1999 and 2004, except in 2002, when expenditures were lower than in 2000.
This reflected the transition from communism to the market economy, which reduced the
number of state functions, while increasing the government’s role in the social sectors.
Education spending, when compared to total public spending during 1999–2004, was
stable, indicating that education is considered less important than other sectors.
Enrollment in pre-university education had decreased to 61 percent of its historical high
by 1999, but increased to 73 percent by 2003. Since 1999, they have slightly decreased in
primary education, and increased in secondary education. This might explain the low level
of Albania’s government spending on education. The level of spending per student has
been increased as a result of the decreased enrollments, but still remains low compared to
other countries. This again shows the need for increasing the total spending on education
in relation to GDP and general public spending.
Local government law defines education as a shared function. Responsibilities, however,
between central and local governments are not allocated based on a sectoral law as they
should be. Because education is a public service involving both local and national benefits, the
size of local government should be taken into consideration when the new law for defining
local government responsibilities for the education service is drafted. Except for the large
cities, the assignment of responsibilities for the remaining local governments should be
based on the principle of cooperation between the different levels of local governments.
24
P U B L I C M O N E Y F O R P U B L I C S C H O O L S
Budgets for education and training were allocated to both the central and local
government levels without a clear assignment of functions and responsibilities. There are
also no national standards for education that would level out differences in the provision
of education across geographic areas. These policies have resulted in an inefficient and
ineffective use of funds.
During 1999–2003, recurrent expenditures accounted for 76 to 90 percent of the total
education budget, while capital expenditure accounted for the remainder. Of the recurrent
expenditure, wages and social contributions were the largest component, accounting for
96 percent, with only around five percent spent on teaching materials, utilities, and other
maintenance expenditures. Moreover, they have been unequally allocated among districts,
as evinced by the differences between the share of students and the share of budget alloca-
tions by district. In 2003, 21 out of 37 districts received a higher education funding share
than their students’ share.
Financial sources of education funding show that central government sources are
dominant. This is explained by the high degree of centralization. The share of the earmarked
transfers in education funding represents more than 90 percent of total funding. It provides
financing for wages, salaries, social contributions, and capital investments. Central govern-
ment funding allocation is not based on any formula or criteria, but on the sole judgment
of the central government officials. The remaining share of funding is provided by two
sources of local government, a general transfer received from the center, as well as own
revenues. Own revenues are insufficient for the many local needs to be addressed, other
than education.
The central government has also exercised strong control of the education infrastructure,
human resources, supervision, and school planning. Thus, local governments and schools do
not have any say in how to spend the allocated resources. This calls for substantial changes
in responsibility sharing, financing schemes, and managerial autonomy. More specifically,
school operation and maintenance, which are already exercised as a local government func-
tion, should be based on national standards, to ensure that students located in every area
of the country receive the same minimum level of service. The allocation of funds should
be based on the criteria aligned with these national standards. The pool for education
investments should be determined based on situation analysis and education standards,
or linked to specific national tax revenue sources. It should then be allocated by formula or
investment proposals—their ranking based on the predefined criteria and involving local
government representatives in the proposal selection process.
The Ministry of Education (MoE) has developed a national education strategy which aims
to improve the quality standards in education, increase education funding, and decentralize
25
F i n a n c i n g E d u c a t i o n i n A l b a n i a
education functions. Specific measures which require additional financing include school
investments, training of administrators and teachers, reducing student–teacher ratios,
increasing teachers’ salaries, etc. This ambitious plan calls for a careful examination of educa-
tion policies, past and present patterns of educational finance, and overall performance of
the system in order to assess the sustainability of the reform. The first step was taken in
the 2005 budget by providing sources for investment funds for schools in the larger cities
and regions. However, more needs to be done, including the development of criteria for
investment funding allocation and devolving more responsibilities to local government for
school management. This will increase the transparency, equity, effectiveness, and efficiency
of the national budget for education.
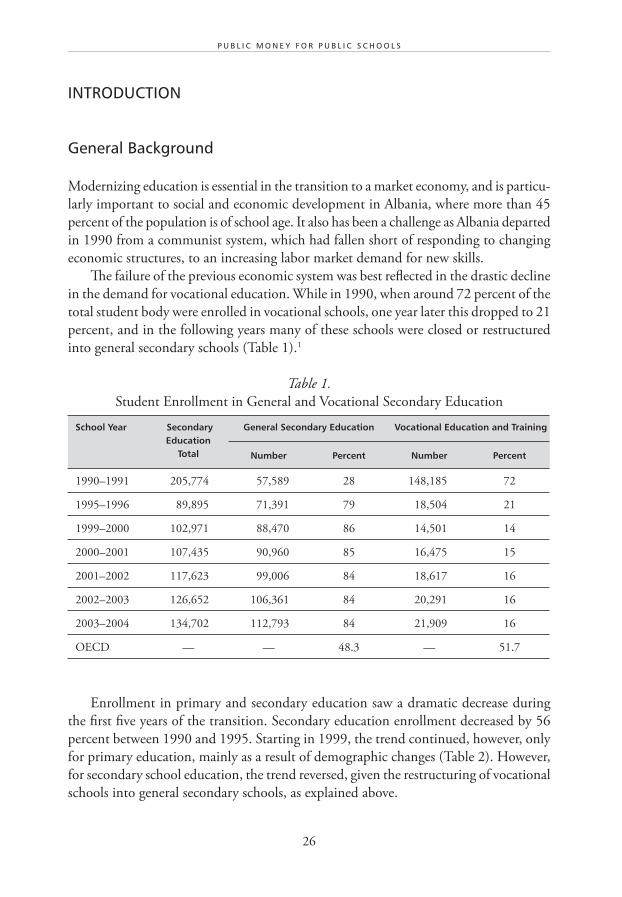
26
P U B L I C M O N E Y F O R P U B L I C S C H O O L S
INTRODUCTION
General Background
Modernizing education is essential in the transition to a market economy, and is particu-
larly important to social and economic development in Albania, where more than 45
percent of the population is of school age. It also has been a challenge as Albania departed
in 1990 from a communist system, which had fallen short of responding to changing
economic structures, to an increasing labor market demand for new skills.
The failure of the previous economic system was best reflected in the drastic decline
in the demand for vocational education. While in 1990, when around 72 percent of the
total student body were enrolled in vocational schools, one year later this dropped to 21
percent, and in the following years many of these schools were closed or restructured
into general secondary schools (Table 1).1
Table 1.
Student Enrollment in General and Vocational Secondary Education
School Year Secondary Education
Total
General Secondary Education Vocational Education and Training
Number Percent Number Percent
1990–1991 205,774 57,589 28 148,185 72
1995–1996 89,895 71,391 79 18,504 21
1999–2000 102,971 88,470 86 14,501 14
2000–2001 107,435 90,960 85 16,475 15
2001–2002 117,623 99,006 84 18,617 16
2002–2003 126,652 106,361 84 20,291 16
2003–2004 134,702 112,793 84 21,909 16
OECD — — 48.3 — 51.7
Enrollment in primary and secondary education saw a dramatic decrease during
the first five years of the transition. Secondary education enrollment decreased by 56
percent between 1990 and 1995. Starting in 1999, the trend continued, however, only
for primary education, mainly as a result of demographic changes (Table 2). However,
for secondary school education, the trend reversed, given the restructuring of vocational
schools into general secondary schools, as explained above.
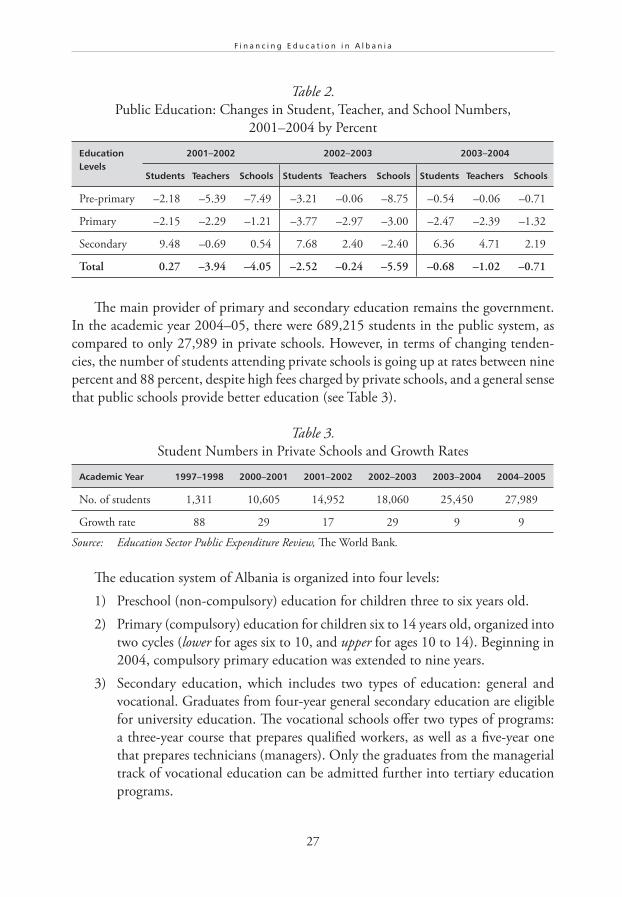
27
F i n a n c i n g E d u c a t i o n i n A l b a n i a
Table 2.
Public Education: Changes in Student, Teacher, and School Numbers,
2001–2004 by Percent
Education Levels
2001–2002 2002–2003 2003–2004
Students Teachers Schools Students Teachers Schools Students Teachers Schools
Pre-primary –2.18 –5.39 –7.49 –3.21 –0.06 –8.75 –0.54 –0.06 –0.71
Primary –2.15 –2.29 –1.21 –3.77 –2.97 –3.00 –2.47 –2.39 –1.32
Secondary 9.48 –0.69 0.54 7.68 2.40 –2.40 6.36 4.71 2.19
Total 0.27 –3.94 –4.05 –2.52 –0.24 –5.59 –0.68 –1.02 –0.71
The main provider of primary and secondary education remains the government.
In the academic year 2004–05, there were 689,215 students in the public system, as
compared to only 27,989 in private schools. However, in terms of changing tenden-
cies, the number of students attending private schools is going up at rates between nine
percent and 88 percent, despite high fees charged by private schools, and a general sense
that public schools provide better education (see Table 3).
Table 3.
Student Numbers in Private Schools and Growth Rates
Academic Year 1997–1998 2000–2001 2001–2002 2002–2003 2003–2004 2004–2005
No. of students 1,311 10,605 14,952 18,060 25,450 27,989
Growth rate 88 29 17 29 9 9
Source: Education Sector Public Expenditure Review, The World Bank.
The education system of Albania is organized into four levels:
1) Preschool (non-compulsory) education for children three to six years old.
2) Primary (compulsory) education for children six to 14 years old, organized into
two cycles (lower for ages six to 10, and upper for ages 10 to 14). Beginning in
2004, compulsory primary education was extended to nine years.
3) Secondary education, which includes two types of education: general and
vocational. Graduates from four-year general secondary education are eligible
for university education. The vocational schools offer two types of programs:
a three-year course that prepares qualified workers, as well as a five-year one
that prepares technicians (managers). Only the graduates from the managerial
track of vocational education can be admitted further into tertiary education
programs.
28
P U B L I C M O N E Y F O R P U B L I C S C H O O L S
4) Tertiary education can be undertaken by students who graduated from general
secondary schools or vocational schools of the second level.
A few technical schools provide so-called secondary social and cultural education,
which includes foreign languages, fine arts, music, sports, and pedagogy. These are,
however, only a few schools in the country, mainly a hold-over of the previous four-year
secondary education system.
Enrollment is free of charge for primary, general secondary education, and
some vocational schools. In some vocational schools students are selected through
competition.
The Status of Education Functions and Responsibilities
Responsibilities in the pre-university education are defined by:
• the Law on Pre-university Education, which provides equal rights to all Albanian
citizens for accessing education at all levels, and describes the primary and general
secondary education system;
• the Law on Secondary Vocational Education and Training, which supports the
development of a common educational system in response to social, economic,
and technological changes, and labor market needs. The law provides for the
right to receive lifelong education and training;
• government decrees and regulations that support the implementation of the
above laws.
The main institutions responsible for the system of education are at the central level
the Ministry of Education (MoE), Regional Directorates of Education (RDE) in 12
regions and in Tirana, District Offices for Education (DOE) in 25 districts,2 as well as
four agencies subordinated to Ministry of Education.3 The RDE and DOE are decon-
centrated offices of the Ministry. Local governments are also involved in the delivery of
some functions within the system (maintenance).
The 1998 Law on Pre-university Education defines education as the sole responsibility
of the central government. At the same time, the additional Law on Local Governments,
adopted in 2000, defines pre-university education as a shared responsibility between local
and central governments, and created confusion over the allocation of responsibilities. In
an attempt to clarify this and speed up the decentralization process, a National Strategy
for Pre-university Education Development was adopted in June 2004. This mandates the
MoE, the Ministry of Finance (MoF), and the Ministry of Interior (MoI), to clarify the
transfer of education responsibilities from central government to the local governments.

29
F i n a n c i n g E d u c a t i o n i n A l b a n i a
Little has been done in this regard, however. The provision of education remains highly
centralized, with its confused financing schemes, as described below.
The only function fully decentralized to local governments is school operation and
maintenance. The property rights, however, have not been transferred to local govern-
ments. Given the fact that own revenues are insufficient to finance maintenance, local
governments use part of a general transfer (allocated through a formula). The remaining
responsibilities are delegated and are financed annually through categorical grants
provided for in the annual state budget law.
In Tirana in 2004, based on the national strategy for education, the central govern-
ment piloted the transfer of financial competences to local governments. This process
proved successful, despite the fact that the city had management capacity problems.
Using the experiences of the pilot program, the central government extended, in 2005,
the financial competences further to the Regional Directorates of Education and munici-
palities. As for smaller cities across the region, the responsibility was taken over by the
Regional Directorates of Education. The MoE retained the responsibility to develop
national standards for education expected to ensure quality in school operation and
maintenance. The results of the past two years show that the delegation of the responsi-
bility should have been preceded by an effort to build the capacity of local governments
in order to increase the rate of success. However, even if the context was imperfect, the
exercise provided a good opportunity to distinguish between the content of education,
now driven by the deconcentrated units of the MoE, and the financial management of
education, which remained the responsibility of local governments.
Personnel policies remain fully centralized and are exercised by the deconcentrated
Regional Directorates of Education. These units decide on the number of teachers and
also hire and dismiss school directors, teachers, and other non-teaching staff. Local
governments are simply the paymasters of the wages and salaries for schools,4 while
the level of salaries is defined by the central government. The Regional Directorates of
Education inspect and monitor school performance within the region.
Regarding the school network, there are no national standards, either for the size
of a school or the establishment or closure of schools. This is made on a case-by-case
basis by the Regional Directorates of Education, based on their assessment of local
demographic developments.
Schools have no authority or discretion over the budget. The only role they play
is the submission of their budget requests in the early stages of the budget process, and
later lobbying or unofficially negotiating with local governments and Regional
Directorates of Education in order to obtain needed funds. This situation reduces
the participation of the communities in the governance of education, while limiting
the involvement of schools boards in minor issues, most often with no impact on the
quality of education.
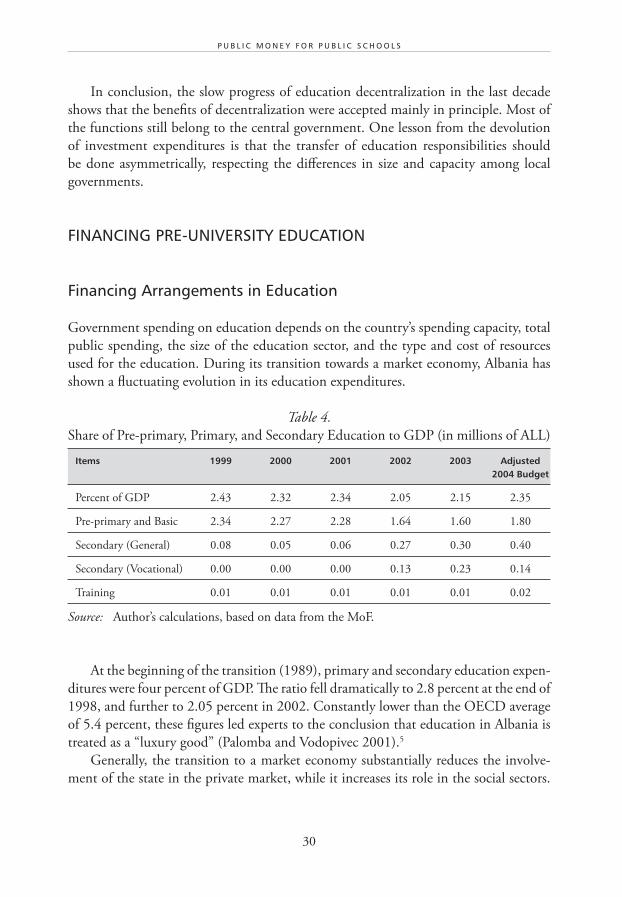
30
P U B L I C M O N E Y F O R P U B L I C S C H O O L S
In conclusion, the slow progress of education decentralization in the last decade
shows that the benefits of decentralization were accepted mainly in principle. Most of
the functions still belong to the central government. One lesson from the devolution
of investment expenditures is that the transfer of education responsibilities should
be done asymmetrically, respecting the differences in size and capacity among local
governments.
FINANCING PRE-UNIVERSITY EDUCATION
Financing Arrangements in Education
Government spending on education depends on the country’s spending capacity, total
public spending, the size of the education sector, and the type and cost of resources
used for the education. During its transition towards a market economy, Albania has
shown a fluctuating evolution in its education expenditures.
Table 4.
Share of Pre-primary, Primary, and Secondary Education to GDP (in millions of ALL)
Items 1999 2000 2001 2002 2003 Adjusted 2004 Budget
Percent of GDP 2.43 2.32 2.34 2.05 2.15 2.35
Pre-primary and Basic 2.34 2.27 2.28 1.64 1.60 1.80
Secondary (General) 0.08 0.05 0.06 0.27 0.30 0.40
Secondary (Vocational) 0.00 0.00 0.00 0.13 0.23 0.14
Training 0.01 0.01 0.01 0.01 0.01 0.02
Source: Author’s calculations, based on data from the MoF.
At the beginning of the transition (1989), primary and secondary education expen-
ditures were four percent of GDP. The ratio fell dramatically to 2.8 percent at the end of
1998, and further to 2.05 percent in 2002. Constantly lower than the OECD average
of 5.4 percent, these figures led experts to the conclusion that education in Albania is
treated as a “luxury good” (Palomba and Vodopivec 2001).5
Generally, the transition to a market economy substantially reduces the involve-
ment of the state in the private market, while it increases its role in the social sectors.
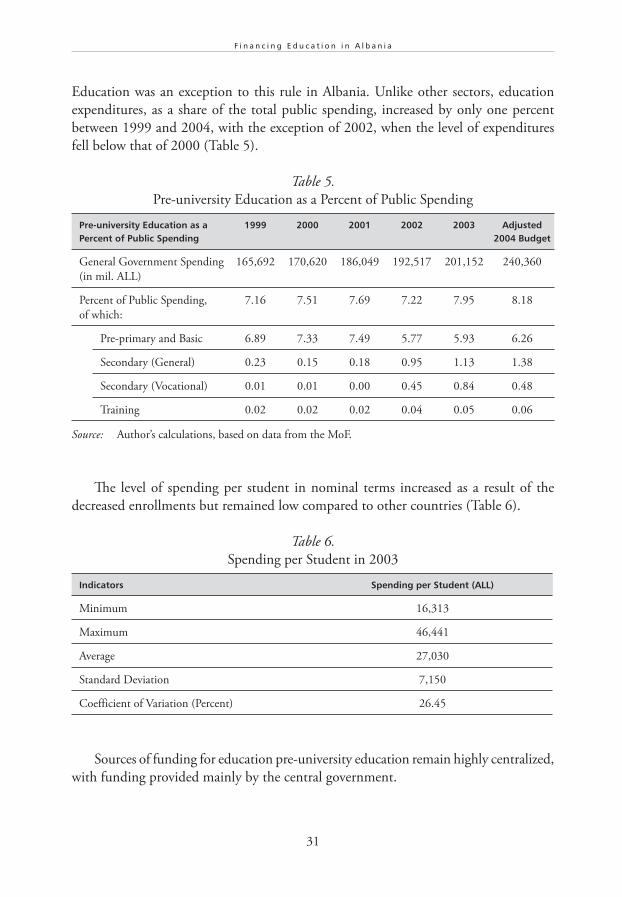
31
F i n a n c i n g E d u c a t i o n i n A l b a n i a
Education was an exception to this rule in Albania. Unlike other sectors, education
expenditures, as a share of the total public spending, increased by only one percent
between 1999 and 2004, with the exception of 2002, when the level of expenditures
fell below that of 2000 (Table 5).
Table 5.
Pre-university Education as a Percent of Public Spending
Pre-university Education as a Percent of Public Spending
1999 2000 2001 2002 2003 Adjusted 2004 Budget
General Government Spending
(in mil. ALL)
165,692 170,620 186,049 192,517 201,152 240,360
Percent of Public Spending,
of which:
7.16 7.51 7.69 7.22 7.95 8.18
Pre-primary and Basic 6.89 7.33 7.49 5.77 5.93 6.26
Secondary (General) 0.23 0.15 0.18 0.95 1.13 1.38
Secondary (Vocational) 0.01 0.01 0.00 0.45 0.84 0.48
Training 0.02 0.02 0.02 0.04 0.05 0.06
Source: Author’s calculations, based on data from the MoF.
The level of spending per student in nominal terms increased as a result of the
decreased enrollments but remained low compared to other countries (Table 6).
Table 6.
Spending per Student in 2003
Indicators Spending per Student (ALL)
Minimum 16,313
Maximum 46,441
Average 27,030
Standard Deviation 7,150
Coefficient of Variation (Percent) 26.45
Sources of funding for education pre-university education remain highly centralized,
with funding provided mainly by the central government.
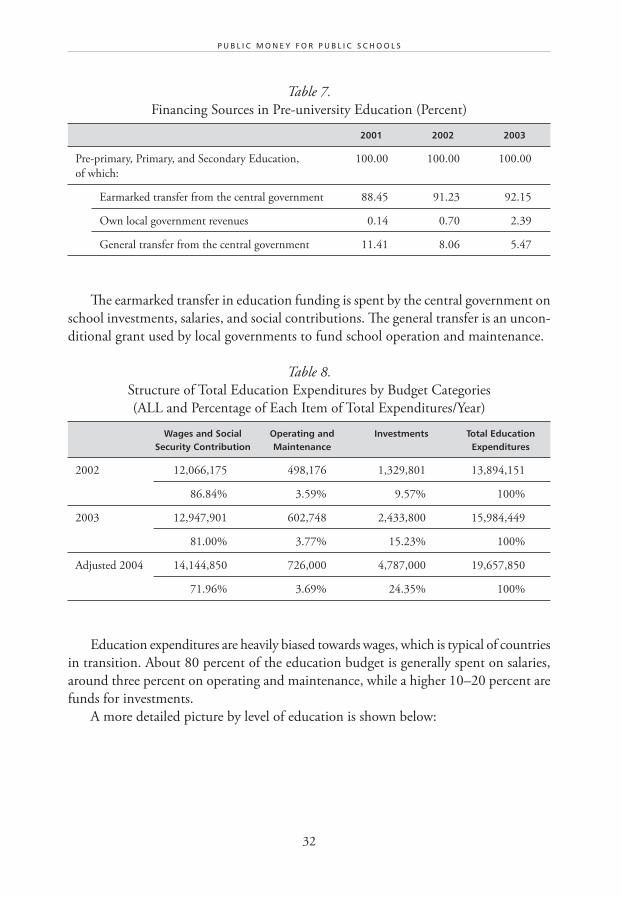
32
P U B L I C M O N E Y F O R P U B L I C S C H O O L S
Table 7.
Financing Sources in Pre-university Education (Percent)
2001 2002 2003
Pre-primary, Primary, and Secondary Education,
of which:
100.00 100.00 100.00
Earmarked transfer from the central government 88.45 91.23 92.15
Own local government revenues 0.14 0.70 2.39
General transfer from the central government 11.41 8.06 5.47
The earmarked transfer in education funding is spent by the central government on
school investments, salaries, and social contributions. The general transfer is an uncon-
ditional grant used by local governments to fund school operation and maintenance.
Table 8.
Structure of Total Education Expenditures by Budget Categories
(ALL and Percentage of Each Item of Total Expenditures/Year)
Wages and Social Security Contribution
Operating and Maintenance
Investments Total Education Expenditures
2002 12,066,175 498,176 1,329,801 13,894,151
86.84% 3.59% 9.57% 100%
2003 12,947,901 602,748 2,433,800 15,984,449
81.00% 3.77% 15.23% 100%
Adjusted 2004 14,144,850 726,000 4,787,000 19,657,850
71.96% 3.69% 24.35% 100%
Education expenditures are heavily biased towards wages, which is typical of countries
in transition. About 80 percent of the education budget is generally spent on salaries,
around three percent on operating and maintenance, while a higher 10–20 percent are
funds for investments.
A more detailed picture by level of education is shown below:
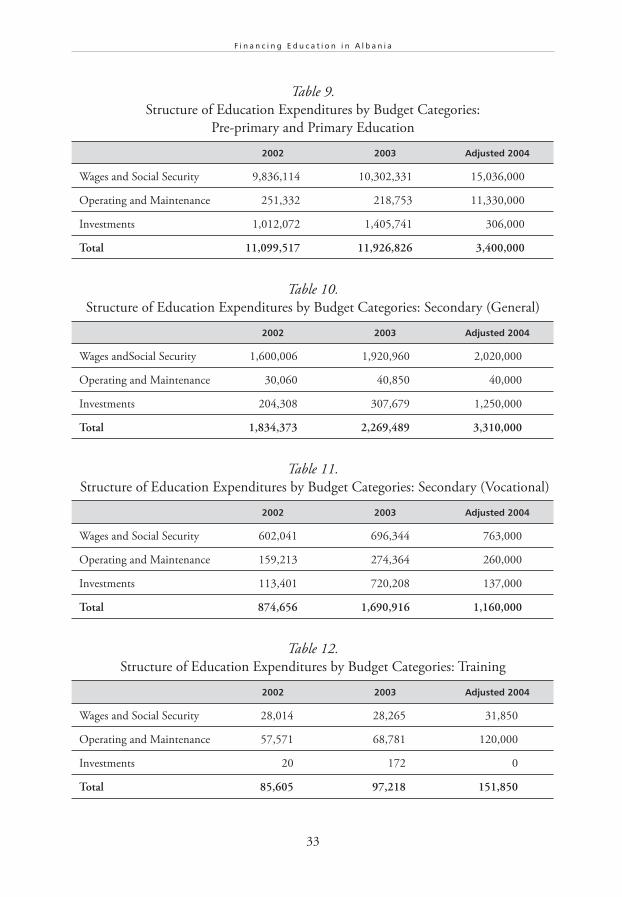
33
F i n a n c i n g E d u c a t i o n i n A l b a n i a
Table 9.
Structure of Education Expenditures by Budget Categories:
Pre-primary and Primary Education
2002 2003 Adjusted 2004
Wages and Social Security 9,836,114 10,302,331 15,036,000
Operating and Maintenance 251,332 218,753 11,330,000
Investments 1,012,072 1,405,741 306,000
Total 11,099,517 11,926,826 3,400,000
Table 10.
Structure of Education Expenditures by Budget Categories: Secondary (General)
2002 2003 Adjusted 2004
Wages andSocial Security 1,600,006 1,920,960 2,020,000
Operating and Maintenance 30,060 40,850 40,000
Investments 204,308 307,679 1,250,000
Total 1,834,373 2,269,489 3,310,000
Table 11.
Structure of Education Expenditures by Budget Categories: Secondary (Vocational)
2002 2003 Adjusted 2004
Wages and Social Security 602,041 696,344 763,000
Operating and Maintenance 159,213 274,364 260,000
Investments 113,401 720,208 137,000
Total 874,656 1,690,916 1,160,000
Table 12.
Structure of Education Expenditures by Budget Categories: Training
2002 2003 Adjusted 2004
Wages and Social Security 28,014 28,265 31,850
Operating and Maintenance 57,571 68,781 120,000
Investments 20 172 0
Total 85,605 97,218 151,850
34
P U B L I C M O N E Y F O R P U B L I C S C H O O L S
The criteria for the allocation of funds from each category vary depending upon
each specific budget category and will thus be described separately. As a general rule,
the central government allocates the funds through categorical grants without using
cost standards or any other allocation criteria in the process.
Investments
Looking at the overall trends in investment expenditures, it is difficult to identify the
main direction of the investment financing policy in Albania. Capital expenditures are
increasing and the growth rates are significant (around 50 percent per year). While
primary and secondary schools receive increasingly larger investment budgets, the
funds for vocational schools are decreasing significantly. In 2004, the capital spending
of vocational secondary education declined by 80 percent.
Initially, the decision for both the level and allocation of investment funds stood
with the MoE. In the early stages of the budget process, local governments submitted a
proposal for school investment needs within their localities. Accordingly, they summa-
rized the existing requests and submitted a final list to the MoE. The MoE centralized
all the lists, and then submitted and negotiated the final proposed amount with the
MoF. Once the budget law was adopted, the Ministry of Finance sent the investment
appropriations to the Ministry of Education, which finally allocated it to specific proj-
ects. Upon budget approval, the list of individual projects to be financed across the
country was prepared. Finally, the list of allocations for specific schools was sent to the
Regional Directorates of Education; these started the bidding and selection process of
the company to undertake the works.
In 2006, the MoE changed the investment policy, aligning it closer with local needs
and priorities. A decentralized system was put in place, where the MoE allocates invest-
ment funds to municipalities. The investment pool was thus divided into very small
pieces, which precipitated the emergence of political pressure to ensure that every munici-
pality received some part of the pie, regardless of their size. This has also narrowed down
the range of capital works to be undertaken, in some cases to just minor repairs.
In 2007, the Ministry of Finance again changed its approach, and switched to a
system of competitive grants. The new system is based on the idea that municipalities
submit investment projects to a competitive selection process by the central government.
Only the best projects would then be selected for funding. The system was introduced
to cover all sectors, not just education. The Ministry of Finance has also imposed a
uniform set of general criteria for the selection of investment projects. Those criteria are
not suitable for education, and the Ministry of Finance had a hard time applying them.
In 2007, however, the process ended up with a small number of substantial projects,
rather than hundreds of minor-repair projects, as in 2006.
35
F i n a n c i n g E d u c a t i o n i n A l b a n i a
The current allocation of investment funds creates large disparities among districts.
Indicators calculated for 2003 show that the allocation of investments does not follow the
number of students enrolled by districts. A comparison between the share of students by
district with the share of investments shows that there are big differences among them.
The maximum for those who received less than their students share is –5.85 percent
and the maximum for those who received more is 2.58 percent. Twenty-one districts
received higher funding as compared to what they should have received according to
the number of students. Sixteen districts were allocated less funds as compared to their
entitled amounts given the number of students served. Even if the percentages look
small, they are very high if we consider that the highest share of students (11 percent)
is in but one district while the other largest districts have less than 6.3 percent of the
total number of students.
During 2002–2004, total spending on education in Albania and the relative share
of investments to total spending increased (Table 6). The increase of the share of invest-
ments is also a result of foreign financing. In various years, donors have provided up to
40 percent of total public investment expenditures for education. Thus, international
donors have played an important role in redirecting the national priorities in Albanian
education.
Among different levels of education, there is no regularity in the share of invest-
ments and recurrent expenditures. Investment spending in Albania only appears to be
concentrated on primary education but, in fact, investment at this level has not been a
priority for Albanian authorities. During 2002–2004 the share of investments fluctu-
ated between 76 percent to 58 percent. Moreover, the share of investments for primary
education in 2004 is lower than in 2002.
Teachers Salaries and Social Security Contributions
True decentralization implies that local governments have the authority to hire and
dismiss school staff within national professional requirements for different categories
of teachers. In practice, however, because funding for salaries is generally large, and
impacts the whole economy, it usually remains centralized or is delegated to local
governments.
Regardless of the degree of decentralization of the function, what is important is
the efficiency and effectiveness of its use. In case it remains centralized, the function
should be delegated based on specific rules, which means that, at a minimum, local
governments should be compensated for the costs incurred from the service. The central
government can control and decide the level of salaries by teachers’ categories, but local
governments should be allowed to make allocations among the education expenditure
items. Another incentive could be the inclusion of salaries in a general transfer pool,
which allows more local government discretion over spending.
36
P U B L I C M O N E Y F O R P U B L I C S C H O O L S
The Albanian education sector is supportive of these good practices, but the central
government retains the responsibility on wages. Local governments are simply the
paymasters, holding no authority for the hiring or dismissing of teachers. The admin-
istrative cost for local governments is not compensated by the central government.
Salaries are calculated on the basis of actual employment levels in schools and on
average salaries (by education level) for each municipality. Funds for salaries are then sent
as a categorical grant to municipalities, who pay the school staff, but are not recorded
either as revenues or expenditures of local governments, though they do appear in
municipal treasury accounts. There is also a small fraction of wage expenditures that is
covered by the local governments. This is mainly due to the employment of an additional
guard or cleaner in some of the schools.6
The main problem of the underfunding of salaries remains. The salary of a primary
school teacher with 15 years of service is about 10 percent below the public sector
average. There is low variation in the pay among teachers. Quality is measured by the
years of experience only, the highest category having over 25 years’ experience. On the
other hand, there is a bonus of up to 30 percent for teachers as an incentive to work in
rural areas. This bonus has contributed to retaining staff living in or close to rural areas,
but has not attracted young and qualified teachers to those regions. Another indicator
of the low level of teacher salaries is their share of total expenditures (Table 8).
The compensation of education staff in Albania accounts for the largest share of
recurrent expenditures. In 2002–2004, 95–96 percent of recurrent spending went to
wages and social contributions (Table 6). The other four to five percent was divided
moderately among utilities, maintenance, teaching materials, scholarships, etc. Also
included are welfare services, which really belong to social protection and not education.
They absorb, on average, over one-fifth of non-staff resources.
The proportion of current expenditures going to salaries is much higher in Albania
than elsewhere. The high share spent on wages is related to a very “tight” educational
budget and not to broad economic inefficiencies. As mentioned above, the number
of teachers is based on rates determined by the MoE, not on the analysis of different
conditions across the country. Taking into consideration the salary level of teachers,
which is lower than other civil servants, and relatively high student–teacher ratios, we
can conclude that the Albanian education sector is subject to severe budget constraints.
The latter can be explained by the low share of non-staff spending. Inadequate financing
has forced administrators to reduce spending on “not immediately necessary” items like
maintenance, utilities, and teaching materials. This strange budget rule has damaged
the quality of education, because within goods and services the priority should be given
to utility bills and small repairs.
37
F i n a n c i n g E d u c a t i o n i n A l b a n i a
Maintenance
Most of Albania’s school structures date back to the 1960s and 1970s in urban areas
and to the 1970s and 1980s in rural areas. Although schools in rural areas were built
later, they were equipped with fewer gymnasiums and laboratories, and many lack even
bathrooms. In urban areas, the situation is different because their facilities are somewhat
better. Many physical facilities in Albanian education are in urgent need of reconstruc-
tion and maintenance. Many schools also lack primary services—and when provided,
they are often of poor quality.
Maintenance is an important education expenditure item. In Albania, by law, mainte-
nance is a shared responsibility. The deconcentrated offices of the Ministry of Education,
the Regional Directorates, finance the acquisition of furniture, teaching materials, and
student transportation. Local governments cover the financing of heating, electricity,
telecommunications, water, waste disposal, cleaning, minor repairs, and painting.
Funding for this function by local governments is ensured through the general
transfer made from the central government. This unconditional grant is allocated to
municipalities on the basis of three criteria: population (70 percent), surface area (15
percent), and urban population (15 percent). Local governments have the necessary but
difficult decision as to how they divide the grants among local priorities. But because
local governments do not have property rights for the schools, there is no incentive for
them to invest in maintenance, which means that often they only allocate a minimum
budget, just enough to keep the school open. Obviously, this is insufficient for an envi-
ronment nurturing quality education. Albania spends typically less than four percent
on maintenance (see Table 8), which is almost five times less than the OECD average
(over 19 percent).
Some researchers argue that a tight education budget not only transfers the cost to
future generations, but is likely to cost the current generation as well. This is supported
by the argument that reducing the government commitment to financing education
has often led to the increase of private coverage of educational costs. Thus, lower public
financing usually implies shifting costs to families. In Albania, this is manifested in the
high growth of private education during 2002–2004, though not by its share of total
education, which remains low due to the low level of income and lack of direct support
from the government.
In conclusion, the financing system lacks an overall strategic vision and includes
several financing mechanisms that are not coherently linked with each other. Central
government financing does not provide any incentives for local governments and schools
to save or spend efficiently. Local government funding exists but is insufficient. Overall,
local governments and schools have a reduced role in the management of their own
budgets.
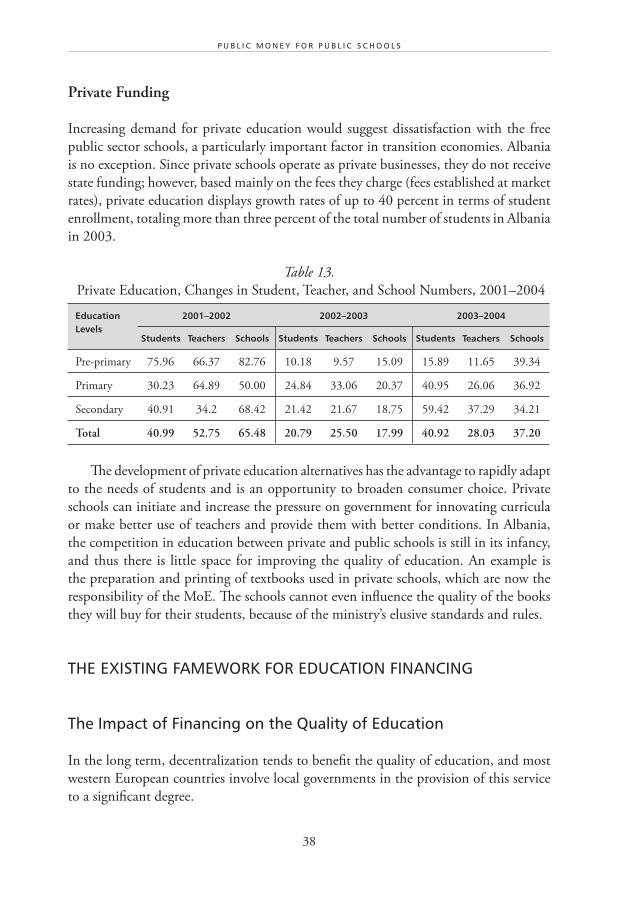
38
P U B L I C M O N E Y F O R P U B L I C S C H O O L S
Private Funding
Increasing demand for private education would suggest dissatisfaction with the free
public sector schools, a particularly important factor in transition economies. Albania
is no exception. Since private schools operate as private businesses, they do not receive
state funding; however, based mainly on the fees they charge (fees established at market
rates), private education displays growth rates of up to 40 percent in terms of student
enrollment, totaling more than three percent of the total number of students in Albania
in 2003.
Table 13.
Private Education, Changes in Student, Teacher, and School Numbers, 2001–2004
Education Levels
2001–2002 2002–2003 2003–2004
Students Teachers Schools Students Teachers Schools Students Teachers Schools
Pre-primary 75.96 66.37 82.76 10.18 9.57 15.09 15.89 11.65 39.34
Primary 30.23 64.89 50.00 24.84 33.06 20.37 40.95 26.06 36.92
Secondary 40.91 34.2 68.42 21.42 21.67 18.75 59.42 37.29 34.21
Total 40.99 52.75 65.48 20.79 25.50 17.99 40.92 28.03 37.20
The development of private education alternatives has the advantage to rapidly adapt
to the needs of students and is an opportunity to broaden consumer choice. Private
schools can initiate and increase the pressure on government for innovating curricula
or make better use of teachers and provide them with better conditions. In Albania,
the competition in education between private and public schools is still in its infancy,
and thus there is little space for improving the quality of education. An example is
the preparation and printing of textbooks used in private schools, which are now the
responsibility of the MoE. The schools cannot even influence the quality of the books
they will buy for their students, because of the ministry’s elusive standards and rules.
THE EXISTING FAMEWORK FOR EDUCATION FINANCING
The Impact of Financing on the Quality of Education
In the long term, decentralization tends to benefit the quality of education, and most
western European countries involve local governments in the provision of this service
to a significant degree.
39
F i n a n c i n g E d u c a t i o n i n A l b a n i a
A thorough analysis of education in Albania shows that that the central government
is still at the beginning of its efforts to decentralize the sector. Local governments,
however, seem to be ready to become a more important participant in education,
judging by the increasing level of own revenues allocated to this sector, up from 0.14
percent in 2002 to 2.39 percent in 2004. Not only do they allocate more within the
responsibilities they are assigned, but in some cases, they are also using their own
revenues to finance functions that are still managed by the central government, such
as school investments.7
School operation and maintenance is the only function fully decentralized to local
governments. Because maintenance is financed through a general transfer, local govern-
ments can now freely decide on what and how much to spend. Frequently, smaller local
governments have nothing left to allocate to maintenance. This does not exclude, at
the same time, positive experiences after the decentralization of the function. Some
larger local governments not only allocated more to maintenance, but also introduced
innovations in the process of the assessment and prioritization of maintenance needs.
For example, some included in the assessment a survey of parental satisfaction.8 With
the involvement of the stakeholders, local officials made decisions that eventually led
to a more efficient use of the sources for school maintenance.
The definition of the transfer pool through a percentage of local taxes collected
creates a problem for small cities which have less buoyant tax bases. Such areas are in a
rather constrained financial situation, where they need to allocate less funds to expensive
public services. This frequently forces them to reduce operating and maintenance costs
which, in turn, leads to a faster deterioration of the school infrastructure. The Ministry
of Finance has improved the allocations for secondary schools through RDE (teaching
equipment, school furniture), but has no fiscal instruments to motivate local govern-
ments to increase their share of education funding.
Unfortunately, the centralized financing schemes do not involve school management
in the process. The director has the sole responsibility to manage the teaching process.
Schools do not have any budget authority, so they cannot play any role in providing better
teaching conditions, materials, or methods.
Low and centrally controlled salary levels do not promote the quality of education.
Local governments have no incentive to attract and retain good teachers, given that the
level of their salaries is outside their authority. Additionally, there is no bonus policy
left at the discretion of local governments to reward good performance, which could
support local governments in attracting and retaining good teachers.
Declining student enrollment was not matched by a similar decrease in the number
of teachers. One cause is the incremental budgeting approach used to finance educa-
tion. This is focused more on inputs (hours of teaching) rather than outputs (results).
In such a system, the opportunity is missed to support real competition among schools
and deliver higher-quality teaching.
40
P U B L I C M O N E Y F O R P U B L I C S C H O O L S
In the larger cities there are more chances for increasing competition among schools,
and thus strengthening parents’ choices. The coexistence of private and state schools
is an opportunity for competition in more developed areas. However, the number of
private schools is still low and parents’ choices relies upon their level of income. In the
future, this could be an area worth considering for an alteration in state policies regarding
support for private education. One aspect for consideration might be the provision of
subsidies for private schools based on the cost per student.
An educational system in which salaries are low and falling, and working conditions
unattractive, cannot be sustainable in the long term. Teachers are aging, the number
of qualified teachers in rural areas is declining, and the low salary level has diminished
teachers’ morale. All of these trends call for substantial changes in the education
financing system through the local governments’ involvement and a more motivated
school management.
Equity in the Allocation of Education Funding
A funding system is equitable if it deals with disparities in cost and income. First, the
cost of providing education varies across schools, depending on factors such as the class
size, geographic location, ethnicity, and special education needs. Equitable financing
may involve higher per-student allocation for students in rural schools with smaller
classes, for example. Second, income is an issue because local government revenues are
a marginal resource for education. Because state funding remains a dominant source of
income, through direct expenditure or intergovernmental transfers, the way in which
its contribution is distributed is fundamental to equity.
The Albanian funding system uses historic costs and incremental adjustments.
Clearly, this system cannot ensure equity in the distribution of funds for education.
Another aspect of inequality in the system is the variation in providing services.
New schools built mostly in larger towns and cities have sports facilities, libraries, or
offer extracurricular activities. Old schools usually do not offer such facilities, and in
rural areas extracurricular activities are very limited.
In regards to school operation and maintenance, variations in the services provided
among regions are a natural consequence of decentralization without a concrete set of
standards. The absence of national standards forces local governments to provide the
service according to their priorities. This would not be a constraint if they had enough
resources. However, as described above, school maintenance is low on the list of local
priorities. Additionally, with no property rights over school facilities, local governments have
little incentive to be motivated and responsible for maintaining education facilities.
Inequalities in funding should be considered an important issue in the process of
decentralizing school responsibilities. The transfer of responsibilities should be followed
by adequate and transparent school financing schemes. As mentioned above, the general
41
F i n a n c i n g E d u c a t i o n i n A l b a n i a
transfer pool’s determination and distribution variables do not take into account the
special needs of different geographic areas. Thus, the decentralization and delegation of
current functions in education are based on the principles of shifting the administrative
burden from central to local governments.
Efficiency in the Allocation and Use of Education Resources
The economic idea of efficiency represents the ratio between what is brought and invested
into the system, and its results. This concept, however, must be redefined in the area
of education. A more efficient redirection of the existing sources of financing, and the
expectation of educational institutions to provide greater value for money, represent
the reality of the majority of the modern education systems. An education system may
be called “efficient” if it attains the maximum level of results using a minimum level
of resources.
From this point of view, a distinction should be made between internal and external
efficiency. Internal efficiency looks at student–teacher ratios and dropout rates, while
external efficiency refers to the education outcomes as they are produced by given educa-
tion resources (or less education resources are used in producing the same amount of
education outcomes).
Internal Efficiency
The main question, when discussing internal efficiency, is how good is the system in
retaining the students in the schools once they enroll. In Albania, the student–teacher
ratio has been decreasing, from 20.22 in 1990, to19.56 in 2003. These changes, however,
are not policy driven but the consequence of an important internal population migra-
tion from the rural to the urban areas, and from the northern part of the country to
the south.
The migration dramatically affected student enrollment which, subsequently, affected
the student–teacher ratios. Between 2004 and 2007, the number of primary school
students fell by nearly 10 percent. More than 16 percent of the total decrease in school
enrollment occurred in rural schools. In some regions, the decline was much higher,
such as the rural schools in the Diber and Tirana areas, where one in four students
left the school. On the contrary, the student population in the urban schools in those
regions grew by more than half.9
The initial result was overcrowding in schools and an increase in class sizes above
accepted OECD ratios. The average class size for primary education in Albania is still in
line with OECD average of 21.9. The average class size, however, for secondary education
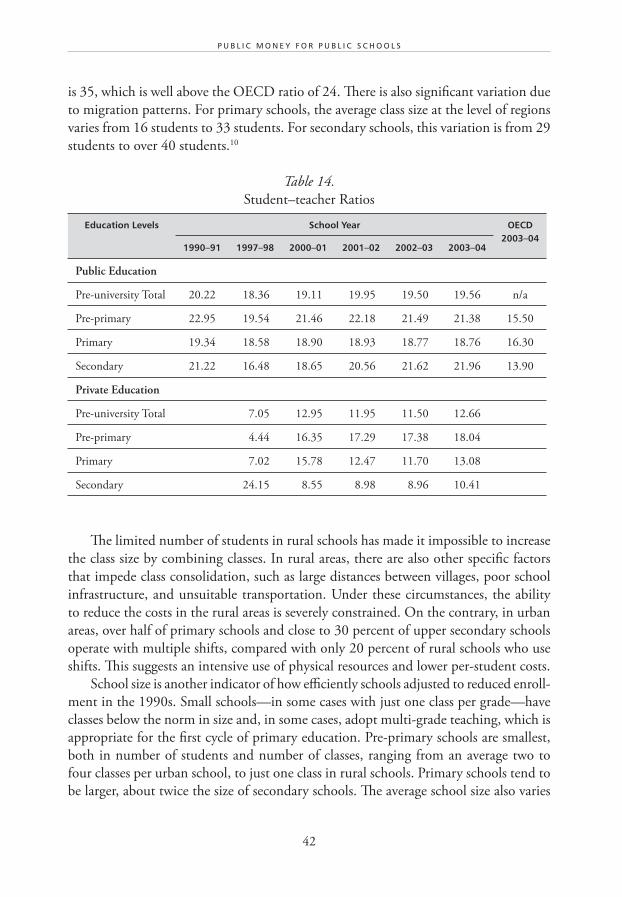
42
P U B L I C M O N E Y F O R P U B L I C S C H O O L S
is 35, which is well above the OECD ratio of 24. There is also significant variation due
to migration patterns. For primary schools, the average class size at the level of regions
varies from 16 students to 33 students. For secondary schools, this variation is from 29
students to over 40 students.10
Table 14.
Student–teacher Ratios
Education Levels School Year OECD 2003–04
1990–91 1997–98 2000–01 2001–02 2002–03 2003–04
Public Education
Pre-university Total 20.22 18.36 19.11 19.95 19.50 19.56 n/a
Pre-primary 22.95 19.54 21.46 22.18 21.49 21.38 15.50
Primary 19.34 18.58 18.90 18.93 18.77 18.76 16.30
Secondary 21.22 16.48 18.65 20.56 21.62 21.96 13.90
Private Education
Pre-university Total 7.05 12.95 11.95 11.50 12.66
Pre-primary 4.44 16.35 17.29 17.38 18.04
Primary 7.02 15.78 12.47 11.70 13.08
Secondary 24.15 8.55 8.98 8.96 10.41
The limited number of students in rural schools has made it impossible to increase
the class size by combining classes. In rural areas, there are also other specific factors
that impede class consolidation, such as large distances between villages, poor school
infrastructure, and unsuitable transportation. Under these circumstances, the ability
to reduce the costs in the rural areas is severely constrained. On the contrary, in urban
areas, over half of primary schools and close to 30 percent of upper secondary schools
operate with multiple shifts, compared with only 20 percent of rural schools who use
shifts. This suggests an intensive use of physical resources and lower per-student costs.
School size is another indicator of how efficiently schools adjusted to reduced enroll-
ment in the 1990s. Small schools—in some cases with just one class per grade—have
classes below the norm in size and, in some cases, adopt multi-grade teaching, which is
appropriate for the first cycle of primary education. Pre-primary schools are smallest,
both in number of students and number of classes, ranging from an average two to
four classes per urban school, to just one class in rural schools. Primary schools tend to
be larger, about twice the size of secondary schools. The average school size also varies
43
F i n a n c i n g E d u c a t i o n i n A l b a n i a
greatly across districts, with schools in the rural north and south being much smaller
than elsewhere in the country.
Although the number of students has fallen, the average school size has not signifi-
cantly changed—except for rural and secondary schools, which have fewer classes.
Secondary schools in the rural areas with only one class per grade allow few efficiency
improvements from combining classes. Moreover, they are expected to have future
reductions in enrollment, which will reduce the student–teacher ratio and increase
costs per student.
External Efficiency
The current Albanian school system does not have mechanisms to control spending in
schools. First, because both school directors and local governments have practically no
financial authority, they do not make any relevant contribution in the efficient use of
resources. The involvement of management and teachers in developing national and local
policies and allocations is occasional and comes only in the form of sharing experiences
or debating in official forums.
In regards to population migration and demographic changes, local initiatives may
have a significant impact on external efficiency. One workable approach might be the
mutual cooperation of local government units in sharing school facilities or providing
other school services.
Another approach—in terms of financing arrangements—could be financing the
local government via block or general grants rather than earmarked funds. Worldwide,
there has been a move towards this approach.11 It is recognized that financing by general
grants leads to a more efficient use of resources. and requires less in terms of centralized
supervision of particular tasks. Albania is far behind other countries in this respect, as
the power of local governments to use resources based on their own priorities in educa-
tion is almost nonexistent: 92 percent of their revenues are earmarked transfers, 5.5
percent are general transfers, and 2.4 percent are own local revenues. Consequently,
local governments in Albania are much more dependent upon transfers from the central
government, and education is subsequently affected.
44
P U B L I C M O N E Y F O R P U B L I C S C H O O L S
CONCLUSION
Summary of the Strengths and Weaknesses of the Overall System for Financing Education
Real resources allocated to education have been decreasing. Tight restrictions on educa-
tion resources have seriously slowed down students’ participation in schools, as well as
the schools’ capacity to provide quality education. Education spending, as a share of
GDP, fell to 2.8 percent in 1998, then climbed to a little below 3.1 percent by 2006.
With this degree of underfunding, higher quality in education is a challenging target.
Most of the educational functions remain with the central government, while
most of its financing is made primarily through earmarked transfers. The only clear
decentralization step is the provision of school operation and maintenance services by
local governments. This is problematic because of the severe underfunding and exces-
sive regional differences. Some of the causes include: school ownership, which remains
with the central government, and the weaknesses of the general transfer distributed by
formula, which is not serving its intended purpose. As a result, in local governments
with low revenue capacity, the share of the local budget allocated for school operation
and maintenance is decreasing.
The ownership of school facilities is another difficult issue. While it has been officially
decided that all municipalities will own the facilities of the public schools within their
territory, the actual transfer of ownership is extremely slow, and most of the facilities
are still owned by the central government. Moreover, this transfer is restricted to the
buildings. The land on which school buildings are located will remain the property of
the republic. This means that after closing a school, the municipality will be unable to
sell the property.12
The investment policy has improved gradually in the last three years. However,
there are still some areas that need improvement: adjusting the criteria for the selection
of investment projects that would accommodate the needs of the education sector,
improving the quality of the investment projects, and better controlling the investment
efforts funded by different donors.
The restructuring of the education sector during the transition to a market economy
has not addressed the demographic shifts in Albania, which, in turn, affect school
enrollment. The drop in enrollment reduced the number of teachers, the number of
classes, and the number of schools, though the reduction in number of teachers was less
than proportional to the reduction in number of students. The student–teacher ratio
declined, but only in rural schools. Conversely, in the urban schools, this ratio remains
much higher than similar ratios in developed economies. We can draw the conclusion
45
F i n a n c i n g E d u c a t i o n i n A l b a n i a
that consolidating schools and reducing the number of teachers are two key objectives
for Albanian schools. Several constraints, such as the geography of the country, poor
physical infrastructure, and the lack of incentives for local governments and school
management are serious constraints to contend with.
Some Recommendations for Improving Education Financing
No reform of education will ever have an impact unless the level of public spending on
education increases. Aside from spending more on education, better and clearer priori-
ties should be identified, such as:
• The school network should be adjusted in order to cope with demographic
changes.
• More financing sources should be allocated and spent on non-wage expenditures
(including maintenance and teacher training) and investments. This is vital to
increasing the quality of education as a whole.
• More education responsibilities should be transferred to local governments
and schools. The Ministry of Education should be dealing only with education
development policies and national standards, and should provide adequate
funding across the country. More discretion on expenditure management should
be left with the lower administrative levels in education. Decentralization will
bring decisions closer to the users of education services, thereby better adapting
allocations to local needs. It will also empower and create a sense of ownership
among school-level stakeholders, and increase transparency and accountability
at all levels.
• The small size of local governments in Albania suggests that the assignment of
responsibilities should be done asymmetrically. Except for the large cities, the
assignment of responsibilities for the remaining local governments should rely
on the principle of cooperation between cities and regions. The good results
from previous decentralization attempts show that partnerships work.
• The transfer of functions should be coupled with changes in education financing
policies, so that decentralized responsibilities are fully covered financially (or at
a minimum, negotiated with local governments). School operation and main-
tenance should be provided by local governments, based on national standards,
which should take into account special needs for different geographic areas
and categories of population. Per-student costs should be calculated and used
in the design of the allocation formula. This method of allocation was already
introduced in a number of transition countries, such as Serbia, Poland, Hungary,
46
P U B L I C M O N E Y F O R P U B L I C S C H O O L S
and Macedonia. The allocation to individual schools can be adjusted based on
specific local factors such as: difficult climatic conditions, poor environment,
the existence of small rural schools, etc. The allocation should be made to the
local governments and the latter should be required to involve school manage-
ment during the budget allocation decision-making.
• The allocation of funds to each local government should be made based on
the criteria which assure the implementation of national standards, to ensure
equity.
• The investment pool and its appropriation should be treated separately from
recurrent spending, and determined based on clear rules created in consultation
with local governments. Options to be considered for determining the pool
for education investments could be: (1) listing priorities based on a situation
analysis by school categories and geographic areas; (2) listing priorities based on
the strategy for achieving national education standards; or (3) linked to specific
national tax-revenue sources. The distribution could be made by formula or
investment proposal rankings based on predefined criteria, and involving local
government representatives in the proposal selection process.
• Wages and salaries are the largest component in education funding and should
be treated carefully. In Albania, the allocation should remain with the central
government, but some marginal powers could be delegated to the local govern-
ments. These powers might include the reallocation of wages and salaries funding
(within limits), the delegation of authority to local governments for changing
the number of teachers, and their hiring based on the national professional
requirements.
SOURCES CITED
Barrow, Michael (1998) “Education after Communism—The Experience of Central and Eastern
European Countries.” Brighton School of Social Sciences, University of Sussex, Falmer,
Brighton. November.
Geremia, Palomba and Milan Vodopivec (2001) “Financing, Efficiency and Equity in Albanian
Education.” Washington, D.C.: World Bank Technical Paper. June.
Herczyński (2007) Current Problems of Education Finance in Albania. Forthcoming.
Ministry of Education of Albania (2004) National Strategy on Pre-university Education
Development. June.
Ministry of Education of Albania (2002–2004) Reports and Information.
Ministry of Finance, Ministry of Local Governments, Ministry of Education (2005) Ordinance
on Implementation of School Investments Budget. February.
47
F i n a n c i n g E d u c a t i o n i n A l b a n i a
Republic of Albania (2000) Law on Organization and Functioning of Local Governments,
No. 8652. July 31.
Xhillari, Lindita and Ylli Cabiri (2005) Education Sector Public Expenditure Review. Washington,
D.C.: The World Bank.
NOTES
1 This explains the sudden increase in the number of students attending general secondary
education, from 28 percent in 1990–91 to 79 percent in 1995–96.
2 In fact, there are 37 districts, though for the regional capitals the directorate plays the role
of the district office.
3 Namely, the Institute for Curricula and Standards, the Center for Training and Qualifications,
the National Center for Assessment and Examination, and the Accreditation Agency.
4 Funds for salaries are allocated by the MoE through a categorical grant, thus local govern-
ments have no discretion over spending.
5 Education expenditure as a percentage of GDP for other countries: 7.5 percent for Slovenia;
5.8 percent for Greece; 4.3 percent for Bulgaria, and 3.6 percent for Macedonia. Source:
country reports at the conference on education finance in South Eastern Europe, organized
by OSI/LGI in Sofia, Bulgaria in March 2005.
6 For a more detailed discussion, see Herczyński (2007).
7 In the case of smaller governments, however, the fact that investments are selected and
financed by the central government continues to be a strong disincentive to local govern-
ments to invest their own resources in the maintenance of capital assets.
8 The assessments were generally financed through foreign technical assistance.
9 For a more detailed discussion on internal migration, please see Herczyński (2007).
10 Herczyński (2007).
11 Article 9 of the European Charter of Local Self-government states that, as a general rule,
block grants are to be preferred to earmarked ones.
12 Based on discussions with an expert of a USAID-funded LDGA project in Tirana.
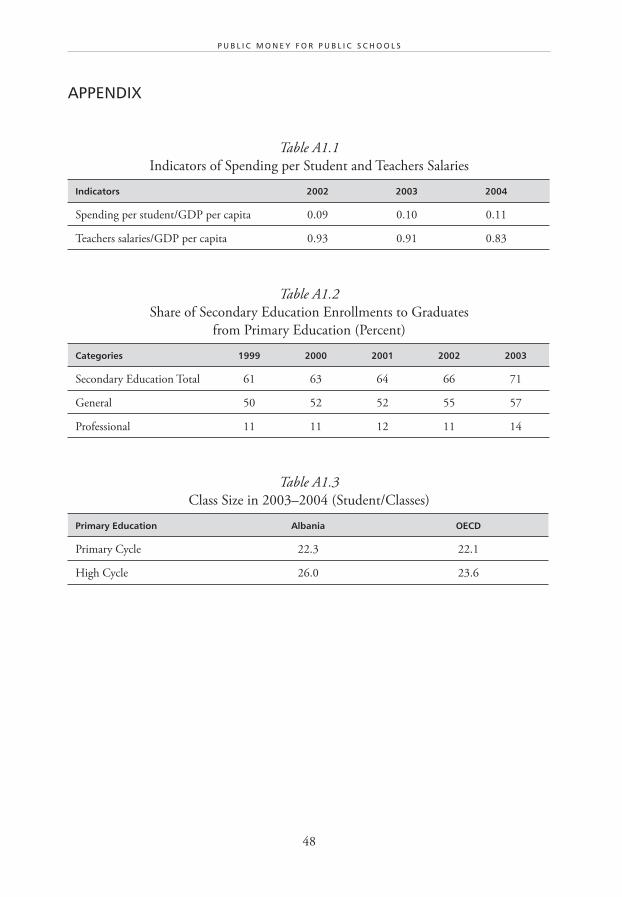
48
P U B L I C M O N E Y F O R P U B L I C S C H O O L S
APPENDIX
Table A1.1
Indicators of Spending per Student and Teachers Salaries
Indicators 2002 2003 2004
Spending per student/GDP per capita 0.09 0.10 0.11
Teachers salaries/GDP per capita 0.93 0.91 0.83
Table A1.2
Share of Secondary Education Enrollments to Graduates
from Primary Education (Percent)
Categories 1999 2000 2001 2002 2003
Secondary Education Total 61 63 64 66 71
General 50 52 52 55 57
Professional 11 11 12 11 14
Table A1.3
Class Size in 2003–2004 (Student/Classes)
Primary Education Albania OECD
Primary Cycle 22.3 22.1
High Cycle 26.0 23.6
C H A P T E R 2
Financing Public Education
in Bulgaria1
Plamen Danchev and Stefan Ivanov 2

51
F i n a n c i n g P u b l i c E d u c a t i o n i n B u l g a r i a
Executive Summary
National education policy in Bulgaria is formed and implemented by the Ministry of
Education and Science (MoES) and is supposed to respond to the demands of the economy
and other sectors of society as well as students themselves. But several areas of education
need assistance and modernization, including equal access to ensure the integration of
disadvantaged groups, tightening the gap between the legal and practical spheres of educa-
tion, management of financial models, teaching and infrastructure, and the development
of a new approach involving all the stakeholders in the education system. The Bulgarian
system is striving to place students at the center of the education system by giving them
more choices.
Many goals are within reach and do not require a complete redesign of the education
system like: updating curricula and new methods of training to develop skills (languages,
information technology) for application in a rapidly changing workplace; improving the
structure and effectiveness of the education sector by making more teachers available to
students and enforcing the obligation to compulsory education; invigorating local schools
through the decentralization of education management and more opportunities for teacher
training; and implementing a financing policy whereby funds follow the student in a bid to
eliminate the unfair economic advantages of some economic groups. Despite these achiev-
able goals outlined in MoES policy, Bulgaria faces severe budgetary constraints and hopes
to design solutions that empower schools without bankrupting its treasury.
The latest data indicates that Bulgaria has seen a 14-percent fall in the number of primary
and secondary schools since 1999 as economic restructuring and a declining number of
students has led to closures across the education system. Schools for children with special
needs and rural schools have been especially effected, though the mix of general education
and vocational schools has remained much the same. Despite this trend to integrate and
close schools, whatever their type, the student–teacher ratio has remained fairly constant,
at around 13 students per teacher for general education and just under 11 students per
teacher in vocational institutions.
Typically, school directors have been appointees of the MoES and its regional inspec-
torates and this has an impact on their efficacy and responsibilities, but a pilot program in
ten municipalities has appointed school directors through a new body, the school council,
composed of fewer central government officials and more local administrators, teachers,
and parents. The expansion of this program across Bulgaria is expected for 2009 and school
directors’ discretion has also been extended to decisions about labor costs, maintenance,
52
P U B L I C M O N E Y F O R P U B L I C S C H O O L S
teaching hours, specific salaries, and number of staff—decisions previously made by the
central government. Own source local funding has also been set aside to improve teachers’
salaries and accountability to the local community. Local authorities may also open or close
a school, while enrollment is subject to the rules of MoES. Curriculum development falls
into the brief of the Regional Inspectorates, along with oversight, and school ownership
remains with the central government, but school maintenance is paid by local authorities.
Who administers what in the Bulgarian education system is not always clear and school
management is a mismatch of local and central responsibilities that often lead to decisions
being made without sufficient funding to implement them.
Bulgaria lags behind other EU countries in terms of education spending as a percentage
of GDP (3.9 percent compared to 5.1 percent, respectively). Since 2007, Bulgaria uses a
quasi-voucher, per-pupil expenditure standard that gives schools more leeway in how they
allocate funds. In addition to the funds received from the budgets of several ministries, they
may also raise money through rentals, services, and donations to spend at their discretion.
Central government funds are allocated for salaries, some maintenance, scholarships, and
capital investments. Further funding is made available through subsidies for teacher remu-
neration, student transport, capital investments, and textbooks for first-graders.
This has been matched by a significant change to the budgeting system, whereby the
budget is delegated to local authorities, and has lead to a more transparent and fairer
distribution of funds. Nonetheless, Bulgaria lacks a coherent quality-monitoring system, has
no external evaluation system of students nor schools, does not stress accountability, does
not encourage competition among schools, has not fostered much in the way of continuing
teacher training, and still suffers from a poor graduation rate for secondary students.
Fiscal decentralization in 2004 brought about a broad range of government reforms
aimed at regulating the relationship between the central government and local governments
in Bulgaria. A Delegated Budget System (DBS) has been implemented in over 30 municipali-
ties, with more slated to join the new program. Within this system, the municipality transfers
the right to make independent decisions about administration, finance, and organization
to the school authorities and they are held accountable for the results of these decisions.
Local governments, once direct managers, now are coordinators, trainers, and supervisors
to schools. Within DBS, the municipality and school directors agree on the mechanism of
allocating resources among schools; schools become secondary budget holders, compile
their own budgets, and have their own bank accounts; and schools have the authority to
manage property such as canteens and vacant premises and to raise additional revenue.
As a consequence, schools have reported better performance, deeper involvement by local
stakeholders, more transparent funding, better equity, reduced costs and more funds,
53
F i n a n c i n g P u b l i c E d u c a t i o n i n B u l g a r i a
better efficiency, autonomy to purchase innovative teaching supplies, and a better and
more efficient relationship with the local authority. An assessment of the true impact of
this budgeting innovation has yet to be in place to answer whether savings are the result
of poorer service quality or core teaching has been cut to expand business opportunities.
Despite these positive outcomes of education finance reform in Bulgaria, some further
steps are recommended, for example, expanding the pilot programs decentralizing respon-
sibilities to local schools, no matter their type; increasing own revenue sources (like local
fees and taxes) for municipalities to fund education; and transferring more powers from
the central to the local level in the areas of re-allocating financial transfers from the state
received on the basis of the costing standard.
The main conclusions of this chapter support the idea that the results of reform towards
fiscal decentralization indeed will be a clearer distribution of responsibilities between
different authorities, a more fair allocation of financial resources between municipalities,
and a higher degree of sustainability and stability. At the same time, reforms generate
new problems, for example, by taking away from the municipalities their power to allocate
financial resources according to local priorities. Also, reform at this stage is unable to stop
the declining quality of education.
54
P U B L I C M O N E Y F O R P U B L I C S C H O O L S
INTRODUCTION
Principles, Aims, and Priorities of the National Education Policy3
National education policy in Bulgaria is formed and implemented by the Ministry
of Education and Science. Ensuring a high quality of education is a national priority
that requires the concerted efforts of Bulgarian society. Education policy is responsive
to changes in the external environment, the needs of the economy, and other sections
of society. Its ambition is to preserve the traditional values that support the education
system and, at the same time, encourage its advancement.
Several principles underpin the process of modernizing Bulgarian education such
as: equal access to the education system to ensure the integration of all disadvantaged
groups; quality of education reflecting the quality of the legal framework; the manage-
ment and financing models; teachers and infrastructure; active partnership between
all stakeholders like governmental institutions, teachers, parents, trade unions, and
nongovernmental organizations; competition between schools and the quality of the
teaching they offer regardless of their form of ownership; and the openness needed to
transform education into a flexible and forward-looking system responsive to changes
in the economy and the requirements of the labor market in the EU.
The main policy directions in modernizing Bulgarian education include quality
education for all, based on the assumption that the education system must preserve
traditional values while, at the same time, seek to align itself with European and interna-
tional standards. Concurrently, a link should be established between education, science,
and economic development priorities in Bulgaria. Equally important is long-term
planning and resourcing to ensure a sustainable development of the education system.
Nevertheless, focusing on the student is the highest priority; therefore, an important
goal is to design the educational process in such a way as to teach students the skills
they will need for professional and personal fulfillment. This is, in other words, placing
the students at the center of the education structure as a way of giving them more flex-
ible choices.
According to the same policy document, in order to achieve the above goals, the
following measures need to be taken in a few priority areas:
• Improve the quality and efficiency of the learning process through:
– Updating curricula;
– Introducing new methods of training which assign an active role to
students;
55
F i n a n c i n g P u b l i c E d u c a t i o n i n B u l g a r i a
– Foreign language learning as a priority;
– Introducing early computer training and information technology in the
teaching process at all levels;
– Introducing modern and objective methods of assessing students at the end
of each stage and level of education;
– Making it possible to apply acquired knowledge and skills in a professional
environment.
• Improve the structure of the education system through:
– Linking the constitutional requirement for compulsory education until the
age of 16 with the respective education level;
– Allowing choice of specialized or professional education, or entry into the
labor market after completion of compulsory education;
– Establishing the transition from one level of education to another, and from
one school type to another after covering uniform education standards;
– Designing flexible forms of teaching to limit the number of students who
drop out early or are not covered by the education system;
– Promoting and encouraging life-long learning.
• Develop the education management system through:
– Regulating the main relations in education by means of legislation;
– Decentralizing the education management system by delegating to schools
authority in financial matters, human resource management, and innova-
tions in the education process;
– Developing viable partnerships in school management by granting rights
and responsibilities to parents and businesses;
– Ensuring training opportunities for teachers and linking good teaching
results with moral and financial rewards as a means of raising the economic
and social status of Bulgarian teachers.
• Link financing with the quality of the education product through:
– Applying a three-component model of financing secondary education based
on uniform standards of maintenance per student, program financing, and
co-financing by the school owner;
– Introducing the principle of the “money follows students” as a means
of reducing and gradually eliminating the correlation between a family’s
economic status and access to quality education;
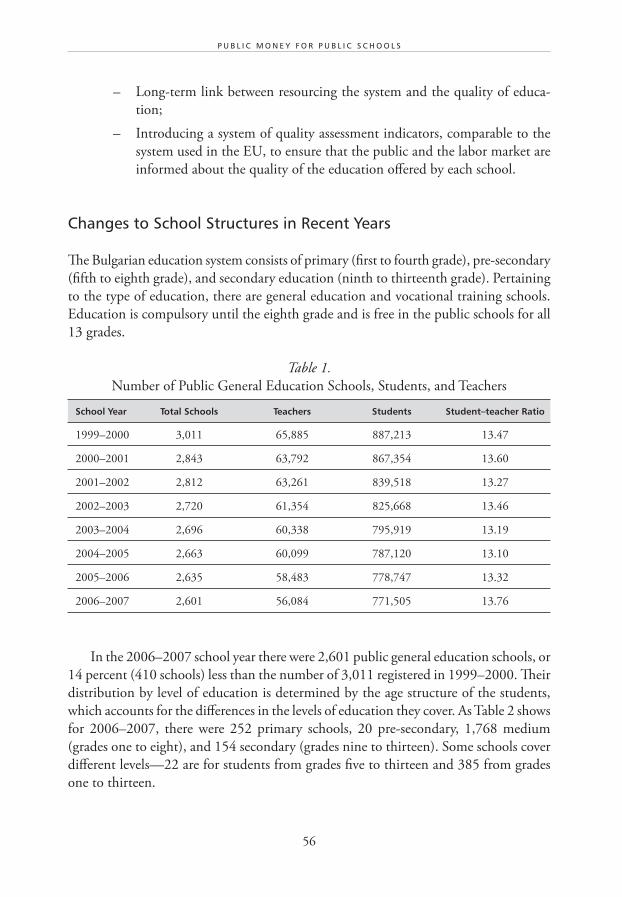
56
P U B L I C M O N E Y F O R P U B L I C S C H O O L S
– Long-term link between resourcing the system and the quality of educa-
tion;
– Introducing a system of quality assessment indicators, comparable to the
system used in the EU, to ensure that the public and the labor market are
informed about the quality of the education offered by each school.
Changes to School Structures in Recent Years
The Bulgarian education system consists of primary (first to fourth grade), pre-secondary
(fifth to eighth grade), and secondary education (ninth to thirteenth grade). Pertaining
to the type of education, there are general education and vocational training schools.
Education is compulsory until the eighth grade and is free in the public schools for all
13 grades.
Table 1.
Number of Public General Education Schools, Students, and Teachers
School Year Total Schools Teachers Students Student–teacher Ratio
1999–2000 3,011 65,885 887,213 13.47
2000–2001 2,843 63,792 867,354 13.60
2001–2002 2,812 63,261 839,518 13.27
2002–2003 2,720 61,354 825,668 13.46
2003–2004 2,696 60,338 795,919 13.19
2004–2005 2,663 60,099 787,120 13.10
2005–2006 2,635 58,483 778,747 13.32
2006–2007 2,601 56,084 771,505 13.76
In the 2006–2007 school year there were 2,601 public general education schools, or
14 percent (410 schools) less than the number of 3,011 registered in 1999–2000. Their
distribution by level of education is determined by the age structure of the students,
which accounts for the differences in the levels of education they cover. As Table 2 shows
for 2006–2007, there were 252 primary schools, 20 pre-secondary, 1,768 medium
(grades one to eight), and 154 secondary (grades nine to thirteen). Some schools cover
different levels—22 are for students from grades five to thirteen and 385 from grades
one to thirteen.
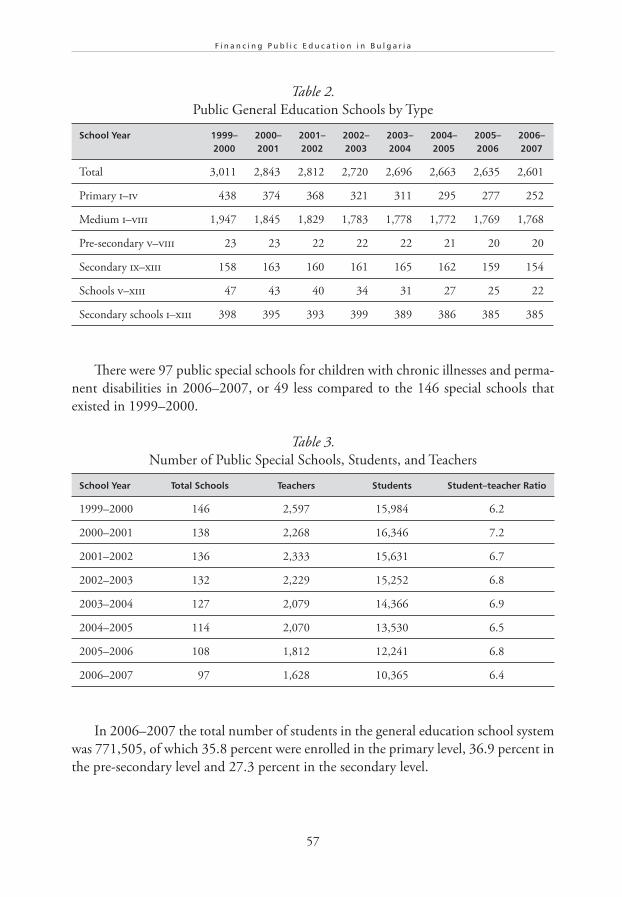
57
F i n a n c i n g P u b l i c E d u c a t i o n i n B u l g a r i a
Table 2.
Public General Education Schools by Type
School Year 1999–2000
2000–2001
2001–2002
2002–2003
2003–2004
2004–2005
2005–2006
2006–2007
Total 3,011 2,843 2,812 2,720 2,696 2,663 2,635 2,601
Primary i–iv 438 374 368 321 311 295 277 252
Medium i–viii 1,947 1,845 1,829 1,783 1,778 1,772 1,769 1,768
Pre-secondary v–viii 23 23 22 22 22 21 20 20
Secondary ix–xiii 158 163 160 161 165 162 159 154
Schools v–xiii 47 43 40 34 31 27 25 22
Secondary schools i–xiii 398 395 393 399 389 386 385 385
There were 97 public special schools for children with chronic illnesses and perma-
nent disabilities in 2006–2007, or 49 less compared to the 146 special schools that
existed in 1999–2000.
Table 3.
Number of Public Special Schools, Students, and Teachers
School Year Total Schools Teachers Students Student–teacher Ratio
1999–2000 146 2,597 15,984 6.2
2000–2001 138 2,268 16,346 7.2
2001–2002 136 2,333 15,631 6.7
2002–2003 132 2,229 15,252 6.8
2003–2004 127 2,079 14,366 6.9
2004–2005 114 2,070 13,530 6.5
2005–2006 108 1,812 12,241 6.8
2006–2007 97 1,628 10,365 6.4
In 2006–2007 the total number of students in the general education school system
was 771,505, of which 35.8 percent were enrolled in the primary level, 36.9 percent in
the pre-secondary level and 27.3 percent in the secondary level.
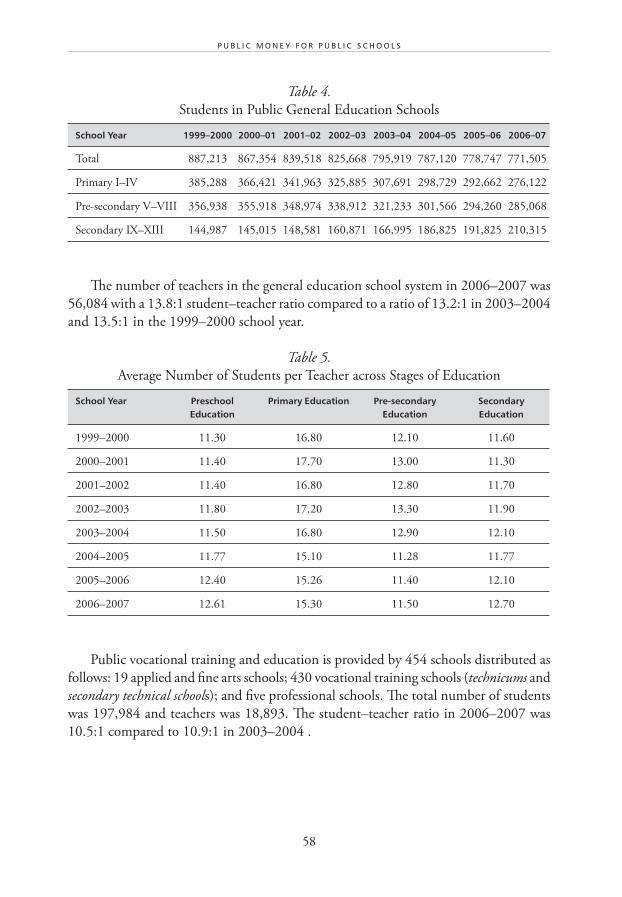
58
P U B L I C M O N E Y F O R P U B L I C S C H O O L S
Table 4.
Students in Public General Education Schools
School Year 1999–2000 2000–01 2001–02 2002–03 2003–04 2004–05 2005–06 2006–07
Total 887,213 867,354 839,518 825,668 795,919 787,120 778,747 771,505
Primary I–IV 385,288 366,421 341,963 325,885 307,691 298,729 292,662 276,122
Pre-secondary V–VIII 356,938 355,918 348,974 338,912 321,233 301,566 294,260 285,068
Secondary IX–XIII 144,987 145,015 148,581 160,871 166,995 186,825 191,825 210,315
The number of teachers in the general education school system in 2006–2007 was
56,084 with a 13.8:1 student–teacher ratio compared to a ratio of 13.2:1 in 2003–2004
and 13.5:1 in the 1999–2000 school year.
Table 5.
Average Number of Students per Teacher across Stages of Education
School Year Preschool Education
Primary Education Pre-secondary Education
Secondary Education
1999–2000 11.30 16.80 12.10 11.60
2000–2001 11.40 17.70 13.00 11.30
2001–2002 11.40 16.80 12.80 11.70
2002–2003 11.80 17.20 13.30 11.90
2003–2004 11.50 16.80 12.90 12.10
2004–2005 11.77 15.10 11.28 11.77
2005–2006 12.40 15.26 11.40 12.10
2006–2007 12.61 15.30 11.50 12.70
Public vocational training and education is provided by 454 schools distributed as
follows: 19 applied and fine arts schools; 430 vocational training schools (technicums and
secondary technical schools); and five professional schools. The total number of students
was 197,984 and teachers was 18,893. The student–teacher ratio in 2006–2007 was
10.5:1 compared to 10.9:1 in 2003–2004 .
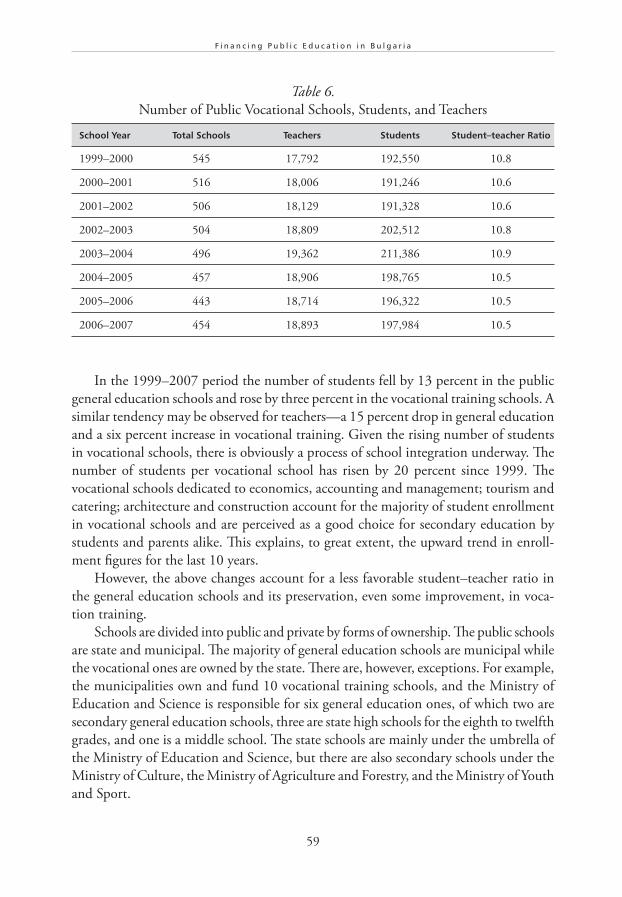
59
F i n a n c i n g P u b l i c E d u c a t i o n i n B u l g a r i a
Table 6.
Number of Public Vocational Schools, Students, and Teachers
School Year Total Schools Teachers Students Student–teacher Ratio
1999–2000 545 17,792 192,550 10.8
2000–2001 516 18,006 191,246 10.6
2001–2002 506 18,129 191,328 10.6
2002–2003 504 18,809 202,512 10.8
2003–2004 496 19,362 211,386 10.9
2004–2005 457 18,906 198,765 10.5
2005–2006 443 18,714 196,322 10.5
2006–2007 454 18,893 197,984 10.5
In the 1999–2007 period the number of students fell by 13 percent in the public
general education schools and rose by three percent in the vocational training schools. A
similar tendency may be observed for teachers—a 15 percent drop in general education
and a six percent increase in vocational training. Given the rising number of students
in vocational schools, there is obviously a process of school integration underway. The
number of students per vocational school has risen by 20 percent since 1999. The
vocational schools dedicated to economics, accounting and management; tourism and
catering; architecture and construction account for the majority of student enrollment
in vocational schools and are perceived as a good choice for secondary education by
students and parents alike. This explains, to great extent, the upward trend in enroll-
ment figures for the last 10 years.
However, the above changes account for a less favorable student–teacher ratio in
the general education schools and its preservation, even some improvement, in voca-
tion training.
Schools are divided into public and private by forms of ownership. The public schools
are state and municipal. The majority of general education schools are municipal while
the vocational ones are owned by the state. There are, however, exceptions. For example,
the municipalities own and fund 10 vocational training schools, and the Ministry of
Education and Science is responsible for six general education ones, of which two are
secondary general education schools, three are state high schools for the eighth to twelfth
grades, and one is a middle school. The state schools are mainly under the umbrella of
the Ministry of Education and Science, but there are also secondary schools under the
Ministry of Culture, the Ministry of Agriculture and Forestry, and the Ministry of Youth
and Sport.
60
P U B L I C M O N E Y F O R P U B L I C S C H O O L S
Private education in Bulgaria is a relatively new concept that started to develop in
1992–1993 when the first private general school appeared. In 1994–1995 the first private
vocational and professional schools were established. In 2006–2007 the number of private
general schools in Bulgaria stood at 60 (2.5 percent) and the students enrolled were only
0.8 percent of all students. For vocational training these figures are slightly higher—52
private vocational schools (10.3 percent) and 1.8 percent of students.
In terms of structure, there has been a stable upward tendency of student enroll-
ment in the private preschool, primary, and middle schools (by 42 percent, 22, and
21 percent, respectively) and a modest increase in private secondary schools (by 11.1
percent) over the period 2004–2007.
Tables 1 to 5 show that the negative demographic processes that are responsible
for the reduction in the number of students and school closures and that have effected
general education as well. The worst effected is the municipal education system. As
can be seen, the period from 1999–2007 has seen the closure of 410 general education
schools, 361 of them in rural communities. Typically, the closed schools were the only
ones in the village. Children have no other option but to attend what is referred to as
“regional schools.” On the one hand, this means that students have to commute or live
away from their families. On the other hand, they have access to better school facilities
and more qualified, competent teachers.
However, even though students may receive better education, and despite the signifi-
cant number of school buses procured by the Ministry of Education over the last three
years, ensuring children’s travel on unpaved rural roads is problematic and usually leads
to the migration of whole families. That is why the closure of rural schools is contrib-
uting to the depopulation of villages. In 2007, such schools were given the statute of
“protected schools,” providing they meet certain criteria. The protected schools are not
subject to closure and are funded using a specific funding allocation standard. In 2007,
the number of protected village schools was 75.
Allocation of Responsibilities between Central and Local Authorities
The allocation of administrative powers and responsibilities for managing schools can be
analyzed from the point of view of: staff—payment and qualification; schools—opening
and closing; maintenance; student enrollment; choice of curricula; and oversight and
monitoring.
Directors of state schools are appointed by the Minister of Education and Science
(with the exception of the applied and fine arts schools which are under the Ministry of
Culture). The directors of municipal schools are appointed by the head of the Regional
Inspectorate on Education. The regional inspectorates are deconcentrated structures of
61
F i n a n c i n g P u b l i c E d u c a t i o n i n B u l g a r i a
the Ministry of Education and Science. The appointment is made through a compe-
tition that is organized by the ministry. The selection panel typically consists of five
members—two from the Ministry of Education and Science, two from the Regional
Inspectorate, and one from the municipality. Clearly, the municipal representative is
little more than an observer. It is not uncommon for that person to be designated by
the Regional Inspectorate.
As of 2006, based on an agreement between the Ministry of Education and the
National Association of Municipalities in the Republic of Bulgaria, the directors of all
schools in 10 pilot municipalities are appointed according to a new procedure and by
a new structure—the school council. The school councils consist of one representative
of the regional inspectorate, one representative of the municipal administration, two
representatives of the pedagogical staff of the school, and two parent representatives.
The school council is responsible for evaluating the performance of the school director;
it proposes the dismissal or appointment of the school director, and the proposal is
endorsed by the Regional Inspectorate. It is envisioned that the school councils become
mandatory structures for all schools in Bulgaria in 2009, after adequate analysis of the
outcomes from the pilot phase and amendments (if necessary) to the structures and
their functions are made.
Teaching and non-teaching staff are hired and fired by the director of the school
within the approved numbers. The central level sets the number of staff by municipali-
ties and the latter allocate it among the schools.
The power to determine salaries is established in regulations on salaries in secondary
education set by the Minister of Education. The financing authority sets an average gross
salary for the school and this becomes the framework in which the director negotiates
individual salaries of teaching and non-teaching staff. An individual salary may not be
less than the salary for the position established in the regulations. For state schools,
the financing authority is the respective ministry, and for municipal schools it is the
municipality that receives the subsidy for education activities from the central budget as
part of the intergovernmental transfer system. Average gross salary growth is determined
annually under the Central Budget Act.
As of 2008, the strict central regulations on staffing, class sizes, salaries, and other
operational education expenditure determinants have been relaxed to the extent that
they have mainly an advisory nature. A new upper limit for class size has been intro-
duced—32 students per class instead of the old maximum level of 25 students per class.
These changes have given extended powers to the school directors, who determine the
number of staff, the specific salaries, and the individual teaching hours of the teachers.
Thus, the school directors are mandated to determine what portion of the school budget
will go for maintenance and what for labor costs.
The Ministry of Education funds the teacher training required by changes in the
curriculum. The municipal councils may also vote on the financing of teacher training
62
P U B L I C M O N E Y F O R P U B L I C S C H O O L S
to the extent permitted by the municipality’s own revenues. Since 2005, additional
funding for teacher training, equivalent to 0.8 percent of the total amount of their
salaries, is provided under the Collective Labor Contract for secondary education in
state and municipal schools.
Schools are licensed or registered by an order of the Minister of Education and
Science. This rule does not apply to the applied and fine arts schools under the Ministry
of Culture.
The recommendation to open or close a school is made by the funding authority
(local government for the municipal schools) and submitted to the Regional Education
Inspectorates. The latter checks the circumstances, prepares an opinion, and the recom-
mendation is then submitted to a committee appointed by the minister for education
and science. The committee, composed of representatives of the Ministry of Education,
considers the recommendations, examines the attached documents, and prepares a
recommendation to open or close a school that the minister then approves in an
order.
The maintenance of school buildings and the current operating expenses are covered
by the owner, i.e., the respective ministry for the state schools and the municipality for
the municipal ones.
Student enrollment is subject to an order by the minister of education, who coor-
dinates with the line minister. The minister of education also approves the number of
students in the municipal schools. Student enrollment in the arts schools is regulated by
the minister of culture. The Ministry of Education and Science regulates the maximum
number of students in a class. This mandate extends to the municipal schools as well.
The curricula for compulsory and specialized education courses, and for compul-
sory vocational training are approved by the minister of education and science. The
curricula for elective courses are coordinated with the experts in the Regional Education
Inspectorates and then are approved by the director of the latter. The curricula for
optional courses in a school are also approved by the director.
The powers of schools in setting the curriculum are limited to elective and
optional courses. Whether a course will be taught depends on the interest of students
and the ability of the school to provide the necessary human and material resources.
These courses are used by schools to promote students’ interests in science, arts,
and sports.
Schools are overseen and monitored by the Ministry of Education and Science and
the Regional Inspectorates (deconcentrated structures of the Ministry of Education). The
oversight functions of the municipalities are directly related to compulsory education
until the age of 16, and school financing and property. They exercise a preventive and
follow-up control of school expenditures, and oversee the use and lease of municipal
property. Until the introduction of the school councils, they had limited control over
the hiring of staff. The school councils now ensure equal participation of municipalities
63
F i n a n c i n g P u b l i c E d u c a t i o n i n B u l g a r i a
and regional inspectorates in the decision-making process related to issues of staff
recruitment and the hiring or firing of school directors.
The municipality has control over staff employment. It has a stronger preventive
and follow-up control over spending, and the use and lease of municipal property.
Despite the significant progress in the transfer of responsibilities from the central
to the local level, the current distribution of administrative powers described above has
several disadvantages:
• There continues to be a mismatch between administrative subordination and
the financial responsibility of the directors of municipal schools. As the mayor
of the municipality is not the employer of the municipal school director, the
latter cannot be held responsible for the ineffective management of municipal
budget funds by the financing authority (the municipality).
• Central authorities frequently make decisions without ensuring that the costs
of implementation are covered.
• There is no national and local system for measuring and monitoring the quality
of education services. The education process is still based on planning and inputs,
i.e., numbers of schools, teachers, and students.
FINANCING FOR SCHOOLS
As can be seen in Table 7, Bulgaria is currently lagging behind other countries in the
EU in the share of education of GDP. In 2006, Bulgaria spent 3.9 percent of its GDP
on public education as opposed to the EU25 average of 5.1 percent.
Table 7 shows a relative decrease in the share of education in GDP and an increase
of its share in the Consolidated State Budget. This is mainly a consequence of the expen-
ditures for education rising at lower rates compared to GDP (most notably in 2001,
2005, and 2006) and at higher rates in relation to public spending as a whole. There
is also an overall upward trend in the share of local education expenditures, which is
partially accounted for by the transfer of some education activities from central to local
funding (e.g., funding of special schools). One can draw the conclusion that Bulgaria
has managed to reach a relative amount of stability in the sector and the public services
provided by the central and local authorities.
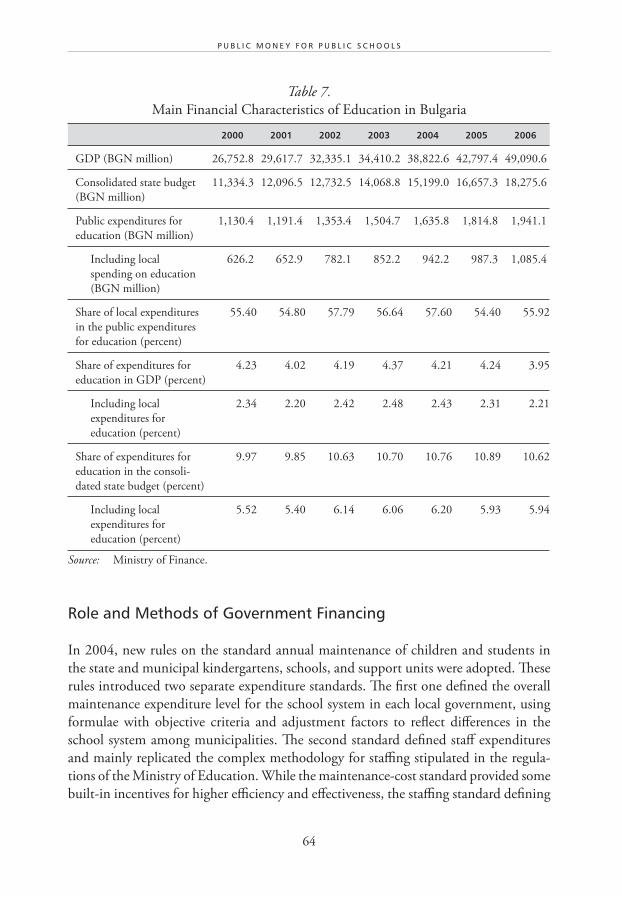
64
P U B L I C M O N E Y F O R P U B L I C S C H O O L S
Table 7.
Main Financial Characteristics of Education in Bulgaria
2000 2001 2002 2003 2004 2005 2006
GDP (BGN million) 26,752.8 29,617.7 32,335.1 34,410.2 38,822.6 42,797.4 49,090.6
Consolidated state budget
(BGN million)
11,334.3 12,096.5 12,732.5 14,068.8 15,199.0 16,657.3 18,275.6
Public expenditures for
education (BGN million)
1,130.4 1,191.4 1,353.4 1,504.7 1,635.8 1,814.8 1,941.1
Including local
spending on education
(BGN million)
626.2 652.9 782.1 852.2 942.2 987.3 1,085.4
Share of local expenditures
in the public expenditures
for education (percent)
55.40 54.80 57.79 56.64 57.60 54.40 55.92
Share of expenditures for
education in GDP (percent)
4.23 4.02 4.19 4.37 4.21 4.24 3.95
Including local
expenditures for
education (percent)
2.34 2.20 2.42 2.48 2.43 2.31 2.21
Share of expenditures for
education in the consoli-
dated state budget (percent)
9.97 9.85 10.63 10.70 10.76 10.89 10.62
Including local
expenditures for
education (percent)
5.52 5.40 6.14 6.06 6.20 5.93 5.94
Source: Ministry of Finance.
Role and Methods of Government Financing
In 2004, new rules on the standard annual maintenance of children and students in
the state and municipal kindergartens, schools, and support units were adopted. These
rules introduced two separate expenditure standards. The first one defined the overall
maintenance expenditure level for the school system in each local government, using
formulae with objective criteria and adjustment factors to reflect differences in the
school system among municipalities. The second standard defined staff expenditures
and mainly replicated the complex methodology for staffing stipulated in the regula-
tions of the Ministry of Education. While the maintenance-cost standard provided some
built-in incentives for higher efficiency and effectiveness, the staffing standard defining
65
F i n a n c i n g P u b l i c E d u c a t i o n i n B u l g a r i a
the larger portion of education spending legitimized the overstaffing patterns typical
of the ministerial regulations.
2007 saw the adoption of a new quasi-voucher system that unified the existing two
separate standards (for maintenance costs and for staffing and labor costs) into a single
per-pupil expenditure standard with no mandate regarding the staffing level. The design
of the new costing standard stimulates the financing authority (ministries and the local
governments) to adopt their own pattern for the allocation of funds across schools and
the existing examples of formula funding of schools in local governments with a delegated
budget system appeared to be an appropriate model to follow. The only centrally imposed
limitation related to the application of the new standard is that the local formula for the
allocation of funds across the schools in the individual municipalities be based on the
number of students in the school with mandatory weight of 80 percent. The remaining
20 percent should be allocated according to criteria and factors agreed upon by the local
administration and the local union of school directors.
Financing for State Schools
State schools are financed from the annual budgets of the Ministry of Education and
Science, the Ministry of Agriculture and Forestry, the Ministry of Culture, and the
Ministry of Youth and Sport.
The state schools are secondary budget holders (with the respective ministry as the
primary one) and they have their own budgets. The sources of revenue are:
• renting out state or municipal property;
• renting out teaching or sports facilities, machines, and equipment owned by
the kindergarten, school, or support unit;
• agricultural lands and forests;
• disposal of compensation vouchers or bills;
• sale of products and services produced in the course of practical training;
• training and creative work, educational, and other services laid down in an order
issued by the minister of education and science;
• donations, bequests, fees, and other sources.
Own revenues are generally used by the school for maintenance or the upgrade of
school infrastructure.
State school expenditures are allocated on the basis of the approved education budget
of the financing authority, as well as a set of criteria. The main criteria, built in a fund
allocation formula for each type of school (vocational, professional or special), are:
66
P U B L I C M O N E Y F O R P U B L I C S C H O O L S
• for salaries and related social security payments—the approved staff size and
the average gross salary of the schools, additional remuneration of staff and the
income policy for the year;
• for maintenance—the type of school, organization of its work, number of
students, cost differences between professional areas, type of heating, etc.;
• for scholarships—number of receiving students and types of scholarships like
social welfare, disabled students, orphans, outstanding performance;
• for capital investments—depending on the needs identified by schools and the
priorities for the year: roof repairs, repairs of heating, electricity, and sewage
systems, amongst others. The final prioritization and decision on the schools’
capital improvement projects is made by the respective ministry responsible for
the state schools.
The state schools have freedom in spending the revenues they raise. It is for them
to decide whether to spend them on maintenance or capital costs. For capital costs
covered by their own revenues the municipalities must coordinate their inclusion in
the investment program with the financing authority.
Financing for Municipal Schools
Prior to 2002, the municipalities funded schools from general budget revenues. They
raised limited own revenues and from the state received shared taxes by origin and
general subsidies. There were no special revenues for the full or partial funding of
education. Widespread financial difficulties resulted in the chronic underfunding of
schools with the consequent deterioration of school infrastructure. Delayed payment
of teacher salaries was a cause of frequent social tension. With local authorities having
no direct control over the running of schools, the rising shortfalls put a lot of pressure
on the municipal budgets.
The absence of rules for allocating resources among the municipalities caused
widespread resentment, even in those for whom the system was relatively favorable.
A contributing factor was the practice of the Ministry of Finance to provide partial
financing to the municipalities at the beginning of the year and later grant additional
subsidies as it saw appropriate or under combined pressure from municipalities. The two
most visible features of the system were the absence of a clear division of responsibilities
between central and local government in public service provision, and disincentives for
efficient and effective financial management.
At the beginning of 2003, the process of fiscal decentralization started in Bulgaria.
Radical changes were introduced in the fiscal relations between the state and the

67
F i n a n c i n g P u b l i c E d u c a t i o n i n B u l g a r i a
municipalities covering shared taxes and subsidies, and the methods by which they were
determined and allocated among municipalities.
The services provided by the municipalities are divided into two groups: services
delegated by the state and local services. The sources from which they are funded are
clearly established. The expenditures for activities delegated by the state are based on
standards that are used for a more accurate estimation of the required resources and for
their allocation among municipalities. These expenditures are funded from personal
income tax receipts and, if they are insufficient, from a general top-up subsidy.
Municipal schools are a service delegated by the state. In 2007, the previous expen-
diture standards were “unified” and converted to a single costing-standard per student
(quasi-voucher system implementing the principle “money follows the student”).
In addition to the funds defined through the costing standard, in the course of the
year the municipalities receive:
• specific subsidies from the Ministry of Finance for additional remuneration of
teachers;
• subsidies to compensate costs incurred by the municipalities, e.g., transport for
students and teachers;
• specific subsidies for capital investments from the Ministry of Education and
Science;
• free textbooks for first-graders. The costs are covered from the budget of the
Ministry of Education and Science, which purchases and distributes them among
schools on the basis of their estimated needs.
The capital investment subsidy and the own revenues set aside for investments are
the framework in which the local authorities allocate financing among schools. There
are no limits on the size of the funds earmarked for education. An exception to this rule
was in 2004 when the State Budget Act set a 60:40 ratio in favor of all delegated tasks,
schools included. This limit proved ineffective and later was removed.
The expenditure standards are used only for the purpose of allocating resources
among municipalities. The latter can plan for individual activities only according to these
standards and have limited powers to reallocate funds among items during the financial
year. They are not allowed to transfer funds from one activity to another.
The local authorities are not expected to apply the standards in allocating resources
among schools. The budget of every school is included in the municipality’s budget.
Unused resources at the end of the year may be freely transferred to fund other services,
local services included.
In 2005, the Ministry of Education and Science established limits on the ability of
municipalities to allocate resources among schools on the basis of the differences between
them. A regulatory act required that each school receive a minimum of 80 percent of the
68
P U B L I C M O N E Y F O R P U B L I C S C H O O L S
funds paid under the maintenance per-student standard. The municipality could redis-
tribute the remaining 20 percent among schools to respond to their special needs.
In 2007, a new mechanism for funding municipal education activities was adopted
following the introduction of the quasi-voucher system. The local governments in Bulgaria
were grouped into four general groups based on key demographic and geographic criteria.
The amount of the costing standard was defined for each of these four groups. Mid-
to long-term targets were set according to the implementation of tailored programs
for each of the groups with the ultimate goal to scale down the factors driving the
different levels of costs for education. In a parallel development, the detailed and strict
regulations on staffing have been relaxed and the responsibilities for defining the
number of staff and class sizes have been shifted to the school directors and the local
administrations. In addition, the delegated budget system (DBS) has been nationally
expanded in 2008, thus further increasing the financial and management autonomy
of the schools.
The implementation of the new system of allocating financial resources among the
municipalities, until 2007, showed that, as a whole, the resources are sufficient. However,
the municipalities lost the right to transfer funds from one function to another, from
one activity within the function to another, and from one item to another. As a result,
the municipalities found themselves in the absurd situation of ending the year with
surpluses in some activities and, at the same time, shortfalls in others. This situation is
likely to remain unchanged even after the quasi-voucher system has been introduced,
as these limitations have been preserved.
However, the positive results from the implementation of the reforms should not
be underestimated. First, the school financing responsibilities are now clearly allocated
between the state and the municipalities. Second, there are smaller differences in school
costs between municipalities. The variation in maintenance costs dramatically and
immediately reduced, from 26 times in 2001 to 1.6 in 2003. Obviously, resources are
allocated in a clear, transparent, and much fairer way; and lastly, there is a long-term
certainty about the funds municipalities will receive from the state.
Looking at long-term reforms, Bulgaria will need to tackle several problems:
• Currently there is no system for monitoring the quality or evaluating the perfor-
mance at various levels. All well-performing school systems place considerable
importance on monitoring and evaluating the quality of the school system as part
of the strategy to secure strong performance. In contrast to most modern educa-
tion systems, Bulgaria does not yet have an objective and transparent framework
to monitor standards against national and international benchmarks. Results
from international comparative studies (for example, PISA) have not been used
for system monitoring or improvement. Bulgaria also lacks a national testing
and evaluation system to measure quality at various levels of the system, and the
planned external assessment, at the end of grades four, seven to eight, and twelve
to thirteen (matura), had yet to be implemented nationwide in 2008.
69
F i n a n c i n g P u b l i c E d u c a t i o n i n B u l g a r i a
• There is no external evaluation system of students or schools based on results.
The absence of a reliable system of external evaluation of schools contributes to
the inability to objectively understand the causes of differences in performance
between schools and to target assistance to underperforming schools. A Center
for Control and Quality Assessment was established in 2005, and could play
an important role in moving forward, but the challenge—as in the past—will
be to establish the needed expertise and to overcome traditional practices and
public/social opposition that have proved formidable in the past.
• Currently, there is no focus on accountability for quality. In part, a result of the
lag in developing an external assessment system, there are no agreed targets at
the national or local levels for teaching and learning results, and no mechanisms
to hold the Ministry of Education, municipalities, or schools accountable for
improving results.
• There is insufficient competition among schools. There are no incentives or
mechanisms to encourage and enable poorly performing schools to improve or
to learn from other schools. Funding mechanisms do not yet link to quality or
equity objectives. Information on school outcomes and good practices is lacking.
Even after the national expansion of the delegated budget system, which ensures
some competition, mechanisms to improve quality and equity have yet to be
developed.
• There is still work to be done on increasing the quality of teachers. Teacher
quality is a key determinant of educational outcomes. The move towards
modern, student-centered curricula imparting basic skills requires a shift in the
paradigm of a teacher—from the traditional role of imparting subject matter to
one of adaptability and innovation regarding curricula and pedagogy. It poses
new challenges and expectations for teachers to work together and to be more
open to productive relationships with parents and local communities. Despite
overstaffing at the aggregate level, there is a shortage of teachers with skills
in specific areas such as foreign languages. Pre-service and in-service training
structures only recently have begun to adequately address the practical needs
of teachers and school staff on the ground. Important recent developments
on this front, however, include the recent adoption of a law to reform teacher
education and the establishment of a National Pedagogic Center, which is to
have a major role in in-service development.
• The participation and completion rates for upper-secondary education need
to be raised, as they are low in comparison with the original EU-10 states.
Completing upper-secondary education is a prerequisite for a dynamic and
competitive European economy: it is the minimum needed to improve the
prospects of individuals in the labor market, to enable their further education
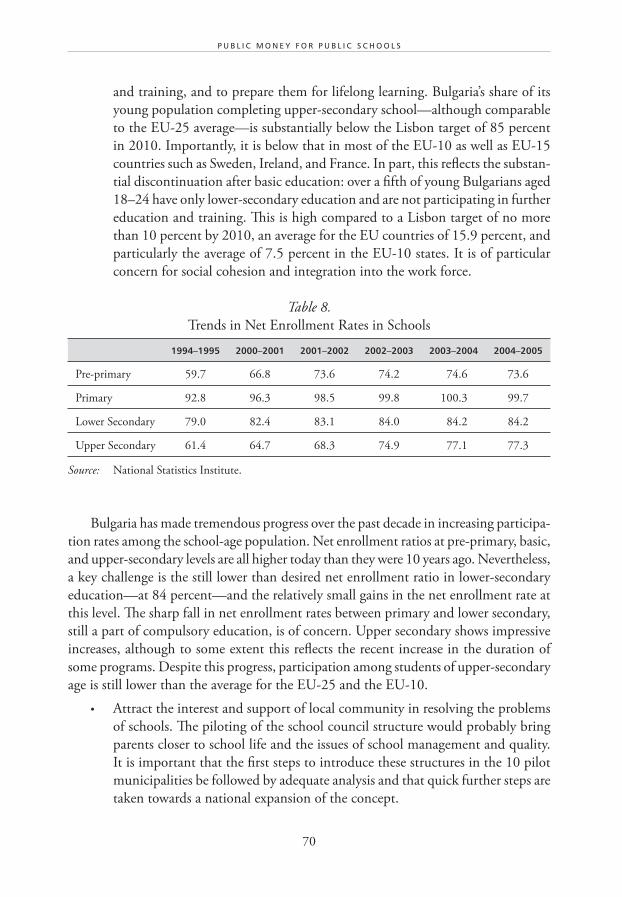
70
P U B L I C M O N E Y F O R P U B L I C S C H O O L S
and training, and to prepare them for lifelong learning. Bulgaria’s share of its
young population completing upper-secondary school—although comparable
to the EU-25 average—is substantially below the Lisbon target of 85 percent
in 2010. Importantly, it is below that in most of the EU-10 as well as EU-15
countries such as Sweden, Ireland, and France. In part, this reflects the substan-
tial discontinuation after basic education: over a fifth of young Bulgarians aged
18–24 have only lower-secondary education and are not participating in further
education and training. This is high compared to a Lisbon target of no more
than 10 percent by 2010, an average for the EU countries of 15.9 percent, and
particularly the average of 7.5 percent in the EU-10 states. It is of particular
concern for social cohesion and integration into the work force.
Table 8.
Trends in Net Enrollment Rates in Schools
1994–1995 2000–2001 2001–2002 2002–2003 2003–2004 2004–2005
Pre-primary 59.7 66.8 73.6 74.2 74.6 73.6
Primary 92.8 96.3 98.5 99.8 100.3 99.7
Lower Secondary 79.0 82.4 83.1 84.0 84.2 84.2
Upper Secondary 61.4 64.7 68.3 74.9 77.1 77.3
Source: National Statistics Institute.
Bulgaria has made tremendous progress over the past decade in increasing participa-
tion rates among the school-age population. Net enrollment ratios at pre-primary, basic,
and upper-secondary levels are all higher today than they were 10 years ago. Nevertheless,
a key challenge is the still lower than desired net enrollment ratio in lower-secondary
education—at 84 percent—and the relatively small gains in the net enrollment rate at
this level. The sharp fall in net enrollment rates between primary and lower secondary,
still a part of compulsory education, is of concern. Upper secondary shows impressive
increases, although to some extent this reflects the recent increase in the duration of
some programs. Despite this progress, participation among students of upper-secondary
age is still lower than the average for the EU-25 and the EU-10.
• Attract the interest and support of local community in resolving the problems
of schools. The piloting of the school council structure would probably bring
parents closer to school life and the issues of school management and quality.
It is important that the first steps to introduce these structures in the 10 pilot
municipalities be followed by adequate analysis and that quick further steps are
taken towards a national expansion of the concept.
71
F i n a n c i n g P u b l i c E d u c a t i o n i n B u l g a r i a
• Finance private schools with public funds. From the taxpayers’ perspective it is
reasonable to consider the option for allocating state funds to private schools
at equal footing with the public schools. The new quasi-voucher system should
facilitate the implementation of that concept and will further enhance competi-
tion among all schools in Bulgaria.
THE DELEGATED BUDGET SYSTEM IN MUNICIPAL SCHOOL FINANCING
The purpose of the reform towards fiscal decentralization is to transfer resources, deci-
sion-making authority, and service provision responsibilities to the lower levels of local
government. The most appropriate institution for the provision of a given service is
determined on the basis of the principle of subsidiary. This is the criterion of allocating
service provision responsibilities among the different levels of public institutions.
The first stage of the reform involves regulating relations among central and local
authorities. At the second stage the same principle is applied within the municipality to
the relations between local government and its structural components, i.e., mayoralties
and the service providers.
The Delegated Budget System (DBS) is a practical illustration of the extension of
this reform towards fiscal decentralization. It has been implemented in more than 30
municipalities. Within this system the municipality transfers to the school authorities
the right to make independent decisions about administrative, organizational, and
financial aspects, and they are also held accountable for the results of these decisions. The
powers and responsibilities of municipalities shift from direct management of schools
to coordination, methodological assistance, training, and supervision.
The main characteristics of DBS are:
• The municipality and the school directors agree on the mechanism of allocating
resources among schools.
• Schools become secondary budget holders, compile their own budgets, and
have their own bank accounts.
• Schools have the authority to manage property such as canteens, land, and
vacant premises, and to raise additional revenues.
A survey of local governments and schools in 10 municipalities about the imple-
mentation of the delegated budget system, conducted in 2004, leads to the following
advantages:
• DBS is a tool to regulate relations between municipalities and schools. The two
sides have clear powers and responsibilities. The total amount of resources and
72
P U B L I C M O N E Y F O R P U B L I C S C H O O L S
their allocation among schools are determined in a transparent and objective
manner. It is no longer possible to make any excuses for poor performance or
blame others.
• A broader range of stakeholders are involved in the decision-making that effects
schools.
• The allocation mechanism is clear and transparent. Each director can calculate the
amount he or she is entitled to, and the amount of the neighboring school.
• More fair allocation and equal treatment of schools is achieved. The formula
used takes into account the specific needs of small schools and schools in rural
communities. The inclusion of adjustment ratios, buildings, and additional
activities like dormitories also help reflect the specificities of schools at the
local level.
• More funds are available because schools have incentives to increase their own
revenues.
• DBS is a tool for reducing costs. Spending is more efficient. There are incentives
to save because the savings are kept by the schools, to be spent on the priorities
they have identified.
• Expenditures are more efficient. In the past, schools contributed to a munici-
pality’s unpaid bills, now they end the year with rollover surpluses.
• More resources and efficient spending have allowed schools to purchase more
and better products needed for their core teaching activities. Because they
have been given greater decision-making powers, school authorities are able
to make decisions about infrastructure maintenance, purchase of teaching aids
and facilities, and offer additional services like computer rooms, participation
in competitions, study visits, and others.
• The first differences in the efficiency of operations between schools have emerged.
The differences are caused by two factors: (1) school staff, its capacity, and
leadership; and (2) the local environment in which the school exists. The type
of income that is raised depends on aspects of this environment; for example,
schools in rural communities own land, while urban ones can offer additional
services like foreign-language courses, other specialized courses, and rent out
vacant space.
• The municipal administration itself has also become more efficient. Instead
of wasting their time on useless paper work, processing of applications, and
other documents, the experts are focusing more on analyzing, monitoring, and
supervising the performance of schools.
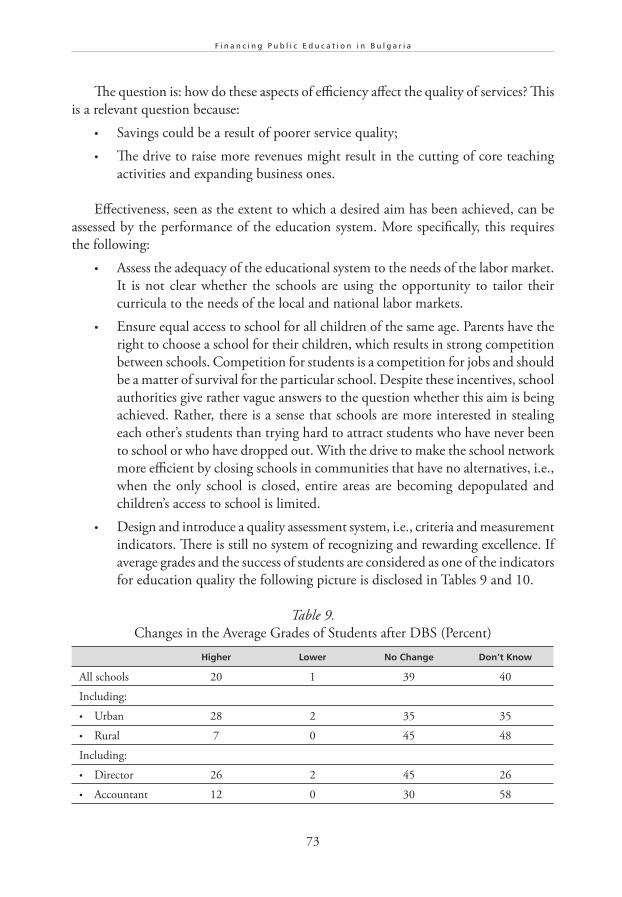
73
F i n a n c i n g P u b l i c E d u c a t i o n i n B u l g a r i a
The question is: how do these aspects of efficiency affect the quality of services? This
is a relevant question because:
• Savings could be a result of poorer service quality;
• The drive to raise more revenues might result in the cutting of core teaching
activities and expanding business ones.
Effectiveness, seen as the extent to which a desired aim has been achieved, can be
assessed by the performance of the education system. More specifically, this requires
the following:
• Assess the adequacy of the educational system to the needs of the labor market.
It is not clear whether the schools are using the opportunity to tailor their
curricula to the needs of the local and national labor markets.
• Ensure equal access to school for all children of the same age. Parents have the
right to choose a school for their children, which results in strong competition
between schools. Competition for students is a competition for jobs and should
be a matter of survival for the particular school. Despite these incentives, school
authorities give rather vague answers to the question whether this aim is being
achieved. Rather, there is a sense that schools are more interested in stealing
each other’s students than trying hard to attract students who have never been
to school or who have dropped out. With the drive to make the school network
more efficient by closing schools in communities that have no alternatives, i.e.,
when the only school is closed, entire areas are becoming depopulated and
children’s access to school is limited.
• Design and introduce a quality assessment system, i.e., criteria and measurement
indicators. There is still no system of recognizing and rewarding excellence. If
average grades and the success of students are considered as one of the indicators
for education quality the following picture is disclosed in Tables 9 and 10.
Table 9.
Changes in the Average Grades of Students after DBS (Percent)
Higher Lower No Change Don’t Know
All schools 20 1 39 40
Including:
• Urban 28 2 35 35
• Rural 7 0 45 48
Including:
• Director 26 2 45 26
• Accountant 12 0 30 58
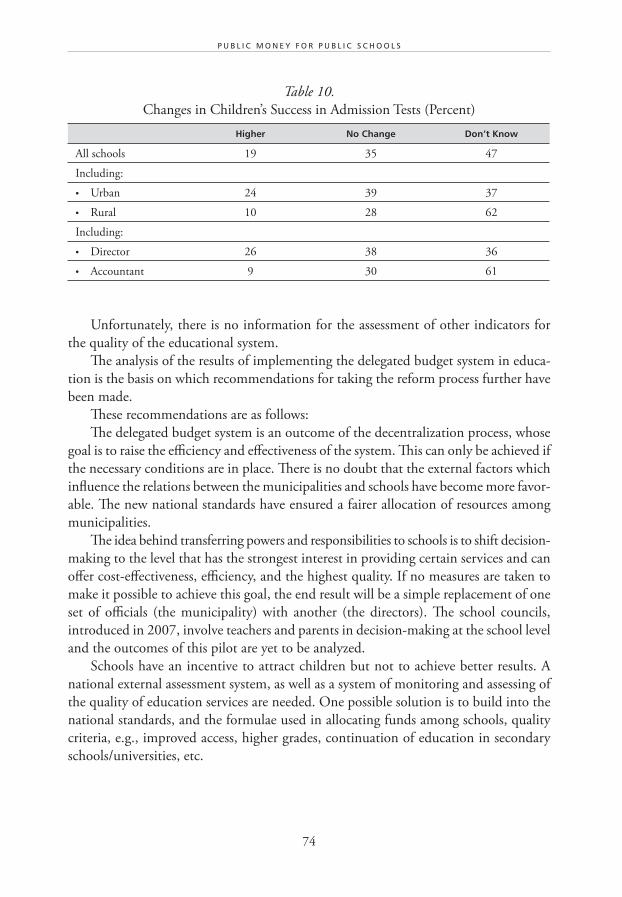
74
P U B L I C M O N E Y F O R P U B L I C S C H O O L S
Table 10.
Changes in Children’s Success in Admission Tests (Percent)
Higher No Change Don’t Know
All schools 19 35 47
Including:
• Urban 24 39 37
• Rural 10 28 62
Including:
• Director 26 38 36
• Accountant 9 30 61
Unfortunately, there is no information for the assessment of other indicators for
the quality of the educational system.
The analysis of the results of implementing the delegated budget system in educa-
tion is the basis on which recommendations for taking the reform process further have
been made.
These recommendations are as follows:
The delegated budget system is an outcome of the decentralization process, whose
goal is to raise the efficiency and effectiveness of the system. This can only be achieved if
the necessary conditions are in place. There is no doubt that the external factors which
influence the relations between the municipalities and schools have become more favor-
able. The new national standards have ensured a fairer allocation of resources among
municipalities.
The idea behind transferring powers and responsibilities to schools is to shift decision-
making to the level that has the strongest interest in providing certain services and can
offer cost-effectiveness, efficiency, and the highest quality. If no measures are taken to
make it possible to achieve this goal, the end result will be a simple replacement of one
set of officials (the municipality) with another (the directors). The school councils,
introduced in 2007, involve teachers and parents in decision-making at the school level
and the outcomes of this pilot are yet to be analyzed.
Schools have an incentive to attract children but not to achieve better results. A
national external assessment system, as well as a system of monitoring and assessing of
the quality of education services are needed. One possible solution is to build into the
national standards, and the formulae used in allocating funds among schools, quality
criteria, e.g., improved access, higher grades, continuation of education in secondary
schools/universities, etc.
75
F i n a n c i n g P u b l i c E d u c a t i o n i n B u l g a r i a
CONCLUSIONS
Several strengths lie within the Bulgarian education system. First, Bulgaria has a fairly
well-preserved national tradition of education as an important means towards success
in life. This clearly explains the success in achieving a certain stability in the financial
responsibilities of authorities to finance the education services provided by the munici-
palities. The introduction of the delegated budget system in municipalities, where a
portion of the money follows the student, is a successful first step towards full decen-
tralization, and has proven a more efficient use of resources. However, these successes
should be carefully analyzed. But it is not very clear whether the cost savings came at
the cost of—or were accompanied by—improved quality and equity. Little information
on outcomes, and limited checks and balances on school directors through participation
of local stakeholders in decisions, are among the constraints that need to be addressed.
Last, Bulgaria has successfully undertaken the necessary steps for establishing private
education.
While acknowledging significant progress, several weaknesses remain to be addressed.
First, municipalities are faced with responsibilities for financing schools that in some cases
are incommensurate with their powers. Second, schools need incentives for increasing
their efficiency and performance. Currently, schools do not have a proper system of
monitoring and assessing the quality of education services.
Obviously, the development of opportunities for schools are dependent upon several
external factors. Decentralization cannot progress without committed government efforts
to implement the national education strategy and to scrutinize quality through a proper
monitoring and evaluation system. Reforms towards decentralization should continue
and should involve more local stakeholders. The latter could, for example, evaluate
the impact of decentralization and could support the dissemination of good practices
extracted from the pilot phase of the introduction of the school council structures.
The main threats to the system of education that should be taken into account are:
potential lack of political goodwill to implement changes, unequal access to education
and, lastly, a declining quality of education services.
The results of the analysis lead to the conclusion that public education faces a large
number of problems. The steps taken in the last few years have led to an increased
decentralization of education service delivery, though they are only a precondition for the
achievement of the broader goals for higher quality, more equality, and better participa-
tion rates in school education. Assistance from outside the sector is still needed.
The main lever for change is the continuation of the reform towards fiscal decen-
tralization in education. Several recommendations could be outlined in this respect.
Firstly, the central government needs to renounce the behavior that impedes a coherent
development of reform. For example, it should align secondary legislation with primary
legislation in a way that enhances local powers. Often, norms in the secondary legisla-
76
P U B L I C M O N E Y F O R P U B L I C S C H O O L S
tion block the transfer of powers regulated in primary legislation. Also, the Ministry of
Education and Science, and other central government bodies need to stop bypassing
municipalities and providing financial resources directly to schools (such as resources
for repair works allocated by the Ministry of Education). Last but not least, the level
of funding for delegated services should be increased. The state seems to think that
by adopting the standards it has fulfilled its responsibilities and this explains the poor
financial management at the level of municipalities. A more dangerous tendency is the
attitude, even among municipal structures, that the centralization of activities is the
only way to solve problems (some examples are the maintenance standards of 2005,
the wish of directors to be financed directly by the Ministry of Education and Science,
or the wish of municipal finance officers that kindergartens become a service delegated
by the state).
In our opinion, fiscal decentralization in education will require the following next
steps:
• Decentralize further responsibilities from the central to the local level, for other
types of schools. A useful step that is already in the pipeline for implementa-
tion in 2009 would be to transfer the management and financing of vocational
training schools from the central level, where they are now, to the municipali-
ties.
• Increase the level of own revenue sources for the municipalities to enable them
to fund a higher proportion of education services. Constitutional amendments
adopted in 2007 significantly increased the fiscal autonomy and the taxing
powers of local governments, though the initial results are yet to be seen.
• Transfer powers from the central to the local levels in the areas of reallocating the
financial transfers from the state received on the basis of the costing standard.
• Overall, allocate more financial resources to the education sector.
NOTES
1 Paper prepared by the Local Government Initiative, Sofia, April 2005. The Local Government
Initiative is implemented by RTI under USAID Contract Number EEU-I-00-99-00014-00,
the Local Government Assistance Initiative Services, IQC, Task Order 802.
2 The conclusions and opinions expressed in this report are personal and do not necessarily
coincide with the official position of the Ministry of Finance, the Ministry of Education and
Science, and the National Association of Municipalities. The authors would like to thank:
Elisaveta Panyovska and Mariana Lambova (Ministry of Education and Science); Mariana
Moteva (Ministry of Finance); Ginka Chavdarova, Daniela Ushatova, Sava Popov, and Rositsa
Georgieva (National Association of Municipalities) for their advice and information.
77
F i n a n c i n g P u b l i c E d u c a t i o n i n B u l g a r i a
3 The main policy document asserting the main principles, aims, and priorities of the national
education policy is the Strategy for Modernization of Bulgarian School Education System,
developed by the Ministry of Education. This policy document was replaced in 2006 by
a new policy document adopted by Parliament, the Program for Development of School
and Preschool Education for the Period 2006–2015. The latter has a philosophy oriented
towards the decentralization of both funding and decision-making to municipal and school
levels and contains specific measures and a schedule for implementation.
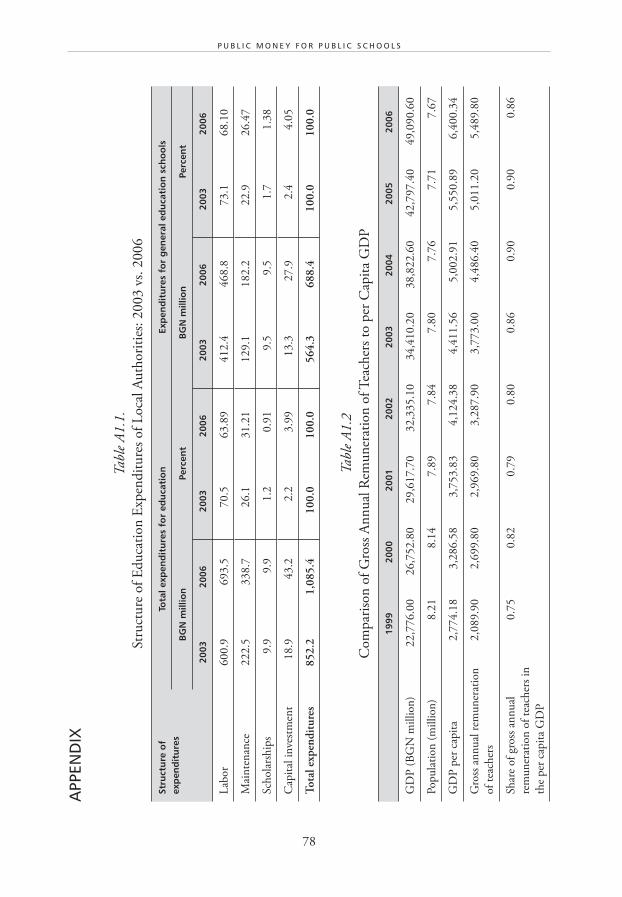
78
P U B L I C M O N E Y F O R P U B L I C S C H O O L S
APP
END
IX
Tab
le A
1.1
.
Stru
ctu
re o
f E
du
cati
on
Exp
end
itu
res
of
Loca
l A
uth
ori
ties
: 2003 v
s. 2
006
Stru
ctu
re o
f ex
pen
dit
ure
sTo
tal e
xpen
dit
ure
s fo
r ed
uca
tio
nEx
pen
dit
ure
s fo
r g
ener
al e
du
cati
on
sch
oo
ls
BG
N m
illio
nPe
rcen
tB
GN
mill
ion
Perc
ent
20
03
20
06
20
03
20
06
20
03
20
06
20
03
20
06
Lab
or
600.9
693.5
70.5
63.8
9412.4
468.8
73.1
68.1
0
Mai
nte
nan
ce222.5
338.7
26.1
31.2
1129.1
182.2
22.9
26.4
7
Sch
ola
rsh
ips
9.9
9.9
1.2
0.9
19.5
9.5
1.7
1.3
8
Cap
ital
in
vest
men
t18.9
43.2
2.2
3.9
913.3
27.9
2.4
4.0
5
To
tal
exp
end
itu
res
85
2.2
1,0
85
.41
00
.01
00
.05
64
.36
88
.41
00
.01
00
.0
Tab
le A
1.2
Com
par
ison
of
Gro
ss A
nn
ual
Rem
un
erat
ion
of T
each
ers
to p
er C
apit
a G
DP
19
99
20
00
20
01
20
02
20
03
20
04
20
05
20
06
GD
P (
BG
N m
illi
on
)22,7
76.0
026,7
52.8
029,6
17.7
032,3
35.1
034,4
10.2
038,8
22.6
042,7
97.4
049,0
90.6
0
Pop
ula
tion
(m
illi
on
)8.2
18.1
47.8
97.8
47.8
07.7
67.7
17.6
7
GD
P p
er c
apit
a2,7
74.1
83,2
86.5
83,7
53.8
34,1
24.3
84,4
11.5
65,0
02.9
15,5
50.8
96,4
00.3
4
Gro
ss a
nn
ual
rem
un
erat
ion
of
teac
her
s
2,0
89.9
02,6
99.8
02,9
69.8
03,2
87.9
03,7
73.0
04,4
86.4
05,0
11.2
05,4
89.8
0
Shar
e of
gross
an
nu
al
rem
un
erat
ion
of
teac
her
s in
the
per
cap
ita
GD
P
0.7
50.8
20.7
90.8
00.8
60.9
00.9
00.8
6
C H A P T E R 3
Financing Education in Croatia
Ivana Batarelo, Željka Podrug, and Tome Apostoloski

81
F i n a n c i n g E d u c a t i o n i n C r o a t i a
Executive Summary
Fiscal decentralization of the education sector in Croatia began in 2001 with changes to
three key laws on primary schools, secondary schools, and local government financing. This
reform has involved a breadth of local and state actors, most notably the Ministry of Science,
Education, and Sport (MoSES), its regional units, its agencies, city halls, and schools, in
addition to reforms passing financial responsibility to local governments for other sectors
like healthcare and welfare. In the matrix of the reform of education financing, MoSES
retains overall responsibility for all levels of the education system and MoSES is the main
policymaking body with the most financial responsibility and control.
However, the reform entailed the central government withdrawing its total financing for
material costs and expenditure while continuing to pay salaries in full. The remaining financial
obligations were taken by local governments, newly empowered to have a percentage of
income tax within their authority in addition to grants from a national equalization fund for
municipalities requiring a top-up in the financial capacity to fund their schools. Qualified
local governments that could take this burden stood to gain a 10 percent increase in income
tax revenues: 2.9 percent of this financed primary education and two percent secondary
schools. Since 2007, the rate has increased to 3.1 and 2.2 percent, respectively.
Each year, in cooperation with the Ministry of Finance, MoSES sets the minimum finan-
cial standards, taking into consideration the expenditure needs of each local government.
This allocation is based on the number of enrolled pupils multiplied by the average cost per
pupil. An average cost is determined for each local government. An equalization fund also
has been designed to absorb the excess funds from those local governments that report
outperforming financial results. In 2006, only one town had excess revenue for the fund.
The decentralization of primary and secondary school finances is based on the transfer
of the founding rights to the primary and secondary schools, which include the obliga-
tion for the partial financing of educational programs. School councils choose the school
director, elect the teachers and administrative personnel, but teachers’ salaries are regulated
and determined by the central government and a contract with the teacher’s trade unions.
Expenditure for teachers’ salaries declined from 3.28 to 1.70 percent of GDP between 2001
and 2006, in contrast to a 20.8 percent growth in GDP in the same period due to the end of
the Balkan wars and the return of tourism revenues. Training is almost exclusively the domain
of the Education and Teacher Training Agency, a leading nonprofit public institution.
82
P U B L I C M O N E Y F O R P U B L I C S C H O O L S
Amendments to the laws of 2001 allow local governments to open and close schools,
determine class size, while central government determines the curricula. Most local govern-
ment also use additional income taxes, collected locally, to meet the gap between types of
education expenditures that are met by the central government and those that are not, like
the transport of children who live more than three kilometers from school or children with
special needs. This is where equalization funds operate, too, but the formula based on per-
student average cost is flawed in that it does not take into account local differences. Private
schools are also permitted to apply for funding, though they are few in number. Preschools
are strictly organized and funded on a local basis, but co-financing is still available from the
central government for pupils with special needs or from ethnic minorities.
Local government has gained more opportunities for efficiency and accountability
through the decentralization of education financing. And the education sector has responded
to these allocations by stressing more languages, allowing parents to choose schools, and
an increase in the number of teachers.
Due to financial decentralization efforts, significant changes have occurred in terms of
resource allocation over the past three years. Education financing experts recognize that
the main advantages of decentralization are related to the fact that the management of
expenditures is in the vicinity of the actual schools that are better able to recognize their
own needs. Expenditure norms for primary and secondary education are determined at the
level of municipalities and towns.
For the future, the financing of education in Croatia should focus on clearer financing
policies that might include: structuring the allocation formula, an improvement of the
financial status of teachers, and strengthening the leadership and managerial knowledge
of teachers and school directors. What began in finance will be continued in other relevant
areas (i.e., management, curriculum, and human resources) in the years to come.
83
F i n a n c i n g E d u c a t i o n i n C r o a t i a
INTRODUCTION: GENERAL BACKGROUND
The Croatian system of education includes preschool, primary, secondary, and univer-
sity education. Preschool education is delivered to children between six months and
six years of age. Compulsory education in Croatia begins with primary education and
includes eight years of schooling. Primary school education is obligatory and free of
charge for all children aged seven to fifteen. The secondary-school system in Croatia
includes general education (such as grammar schools) and vocational education. There
are two types of vocational schools: those that provide a classical, vocational education
with practical training at school, and others that offer dual programs. Dual programs
combine apprenticeships at a business as well as vocational education at a vocational
school within one course. The entire pre-primary education, compulsory primary, and
secondary education is provided by the public, private, and church educational insti-
tutions, public schools, and other educational institutions. By law, citizens can open
private schools and learning centers.1
Education Responsibilities
A large number of regional and nongovernmental institutions, research institutes, and
trade unions are involved in the decentralization of the Croatian education system.
Governance in education is ensured on three levels: central—the Ministry of Science,
Education, and Sport (MoSES); regional (21 counties); regional units of the MoSES
(counties are grouped in the six regional departments of the Education and Teacher
Training Agency, which focuses on quality control and evaluation); city halls (32 towns);
and local (schools).
MoSES retains the overall responsibility for all levels of the education system. Hence,
MoSES is the main policymaking body with the most financial responsibility and
control. All the functions in education, apart from primary education, are transferred to
the municipalities, according to their fiscal capacity. The decentralized expenditures of
primary schools in towns with lower fiscal capacity are taken over by the municipalities.2
However, starting in 2007, towns showed an increasing interest in financing primary
schools from their own budgets and are requesting a further transfer of founder rights
for primary schools from the level of the municipality to the town.
The process of fiscal decentralization started with amendments to the Law on
Primary Schools,3 the Law on Secondary Schools,4 and the Law on Financing Units of
Local Self-government and Government5 in 2001. The central government transferred
the responsibility for financing education, healthcare, welfare, and fire departments
to the local government units. The central government covered the financing for only
a portion of the education costs (that is, for material costs and expenditures for the
84
P U B L I C M O N E Y F O R P U B L I C S C H O O L S
procurement of non-financial assets), while it ensured the full financing of salaries. The
financing of the decentralized functions was taken on by local government units with
greater fiscal capacities.6
The decentralization of primary and secondary school finances is based on the transfer
of founding rights to primary and secondary schools. The founding rights include an
obligation for the partial financing of educational programs.
Schools became owners of their school buildings in January 2002. Currently, there
are 53 school founders in Croatia. However, school owners cannot sell or rent the school
building without the agreement of the school founders. School founders are commonly
towns or municipalities.7 The school statute regulates the amount of resources and
sources of financing that school owners have control. Towns have founding rights for
establishing primary schools, while municipalities have founding rights for the estab-
lishment of primary and secondary schools. The primary schools of poorer and smaller
towns are funded on the municipality level. All municipalities have at least one town
that is serving as a school founder. The Ministry of Finance determines which towns
can be school founders, based on criteria that will be detailed later in this chapter.
The school founders currently have two financing sources that add up to the expen-
diture norms (minimal financial standards) set for the decentralized functions:
1) Their primary source of income is a percentage of income tax, as determined
by the central government
2) Their secondary source of income is the Equalization Fund, an additional part
of the income tax that central government cedes to local government units with
lower fiscal capacities for financing the decentralized functions. The govern-
ment sets the fund for the local governments that took on the financing of the
decentralized functions, but are unable to finance them from the revenue they
obtained from income tax. What that has meant in practice is that the local
governments that undertook the financing of all the decentralized functions were
able to increase their share of income tax by 10 percent. Out of this percentage,
local governments received 2.9 percent of the income tax to finance primary
education and two percent for the financing of secondary school education.
Since January 2007, the rate increased to 3.1 percent for primary education
and 2.2 for secondary education.
The minimum financial standards that need to be met by each local government
are set each year by the Ministry of Education in cooperation with the government and
Ministry of Finance. In defining minimum financial standards, the ministry takes into
consideration the expenditure needs of individual local governments. For example, the
criterion for the allocation of resources to cover materials and financial expenditures
in secondary schools equals the number of enrolled pupils in a certain year multiplied
85
F i n a n c i n g E d u c a t i o n i n C r o a t i a
by the average annual cost per pupil. The average annual cost is set for each individual
local government unit.
The level of resources between schools fluctuates given the different economic
capacity of the local governments across Croatia. In the towns where minimum standards
are met and financial achievements surpass 100 percent, a surplus is returned to the state
budget in accordance to the equalization mechanisms. In 2006, however, there was only
one town in Croatia whose financial achievements were over 100 percent.
The rules for appointing the school staff (such as school directors, teachers, and
non-teaching staff) are included in existing primary and secondary school laws. The
main body in charge of the selection of the school director is the school council, which
consists of:
• four school representatives (three teachers and one parent) and
• three representatives of a local government unit.
In 2005, amendments to the Law on Primary Schools8 and the Law on Secondary
Schools9 established a new relationship between school founders and school owners. At
present, the school council can formulate a school statute, but only with the approval of
the school founder. The school statute is a written law enacted by MoSES, containing
the preamble, provisions, and rules for implementing such legislation. MoSES does not
have influence on a school director’s election and the minister can remove the school
director only if she or he is breaking the law. According to some unofficial propositions,
in the future, a school council might be changed to include four representatives from
the town or municipality (the school founders), and three school representatives. Based
on this proposal, the minister would have to approve an elected school director.
The school council elects the teachers, school director, and administrative personnel,
subsequent to the publishing of a job announcement. The salary of teachers, school
directors, and administrative personnel is calculated on the basis of coefficients regulated
by the central government.10 Teachers in Croatia have public servant status; therefore,
a framework contract with the teacher unions regulates the benefits that teachers are
entitled to receive for working under special conditions (such as combined classes,
specialized work with students with special needs, teaching in schools in remote areas)
and surpluses for academic levels.
As Table 1 shows, the average salaries for teachers decreased significantly, from 3.28
to 1.70 percent of GDP between 2001 and 2006.11
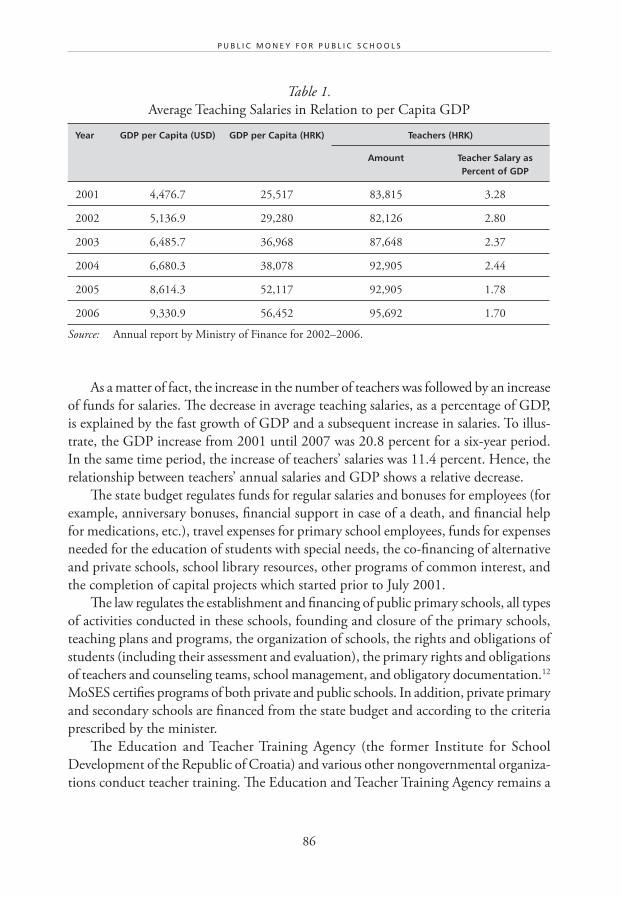
86
P U B L I C M O N E Y F O R P U B L I C S C H O O L S
Table 1.
Average Teaching Salaries in Relation to per Capita GDP
Year GDP per Capita (USD) GDP per Capita (HRK) Teachers (HRK)
Amount Teacher Salary as Percent of GDP
2001 4,476.7 25,517 83,815 3.28
2002 5,136.9 29,280 82,126 2.80
2003 6,485.7 36,968 87,648 2.37
2004 6,680.3 38,078 92,905 2.44
2005 8,614.3 52,117 92,905 1.78
2006 9,330.9 56,452 95,692 1.70
Source: Annual report by Ministry of Finance for 2002–2006.
As a matter of fact, the increase in the number of teachers was followed by an increase
of funds for salaries. The decrease in average teaching salaries, as a percentage of GDP,
is explained by the fast growth of GDP and a subsequent increase in salaries. To illus-
trate, the GDP increase from 2001 until 2007 was 20.8 percent for a six-year period.
In the same time period, the increase of teachers’ salaries was 11.4 percent. Hence, the
relationship between teachers’ annual salaries and GDP shows a relative decrease.
The state budget regulates funds for regular salaries and bonuses for employees (for
example, anniversary bonuses, financial support in case of a death, and financial help
for medications, etc.), travel expenses for primary school employees, funds for expenses
needed for the education of students with special needs, the co-financing of alternative
and private schools, school library resources, other programs of common interest, and
the completion of capital projects which started prior to July 2001.
The law regulates the establishment and financing of public primary schools, all types
of activities conducted in these schools, founding and closure of the primary schools,
teaching plans and programs, the organization of schools, the rights and obligations of
students (including their assessment and evaluation), the primary rights and obligations
of teachers and counseling teams, school management, and obligatory documentation.12
MoSES certifies programs of both private and public schools. In addition, private primary
and secondary schools are financed from the state budget and according to the criteria
prescribed by the minister.
The Education and Teacher Training Agency (the former Institute for School
Development of the Republic of Croatia) and various other nongovernmental organiza-
tions conduct teacher training. The Education and Teacher Training Agency remains a
87
F i n a n c i n g E d u c a t i o n i n C r o a t i a
leading nonprofit public institution that offers professional support (teacher training,
inspection, and monitoring) at the level of preschool, primary, and secondary school
education. The agency has a network of six branch offices (Zagreb, Rijeka, Zadar, Split,
Varaždin, and Osijek). The agency in its current form was established in December
2003. Previously, it was an agency of the ministry.
According to the Law on Primary Schools and the Law on Secondary Schools, the
establishment or closure of a school is regulated at the level of the town for primary
schools or the municipality level for primary and secondary schools. The same regula-
tions determine class size and suggest that classes should have 30 students (plus or minus
two). Furthermore, in Croatia, there is a partial inclusion of students with special needs
both at the primary13 and secondary14 school level. If there is a student with special needs
in a class, the regulations state that the total number of students in a class should not
exceed 25. Teaching plans and programs are determined at the central level. Currently,
teaching plans and programs are passing through a process of content reduction.
BASIC STRUCTURE OF EDUCATION FINANCING
The process of public sector decentralization officially started in July 2001, when the
Croatian Parliament passed the laws through which the financing of certain functions
and costs of primary and secondary education were transferred from the national budget
to the budgets of towns and municipalities. The resources needed for the implementa-
tion of the policy were also provided for.
Educational provisions are directly linked to educational financing, hence the increase
of education expenditures as a percentage of GDP. Public expenditure should positively
influence educational opportunities in Croatia. In 2002, public expenditures experienced
a large increase due to the inclusion of both the retirement and health funds. Thus,
education decreased as a percentage of participation in public expenditure (see Table
2). Although the nominal values increased, the relative values decreased. In conclusion,
education expenditures increased significantly in the last six years.
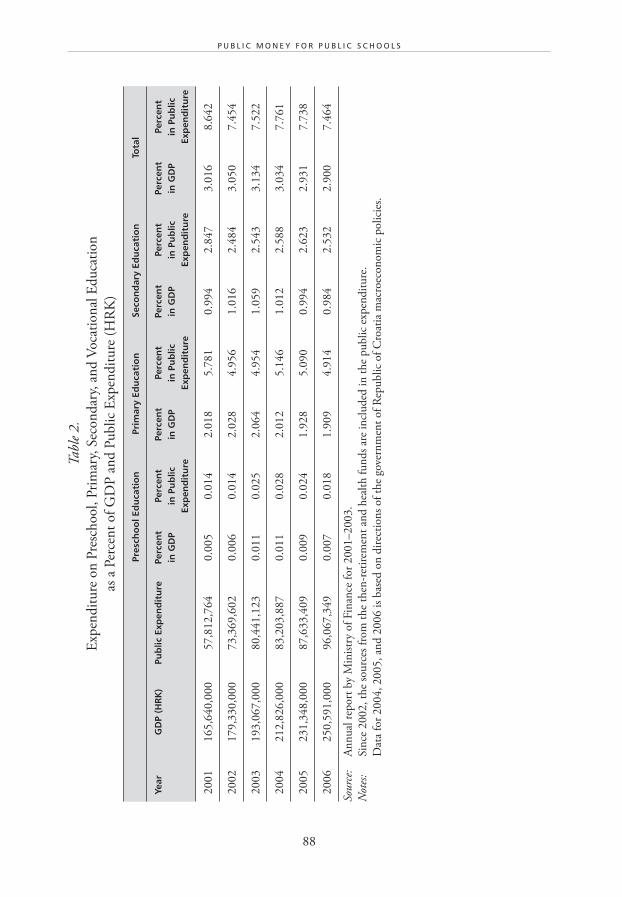
88
P U B L I C M O N E Y F O R P U B L I C S C H O O L S
Tab
le 2
.
Exp
end
itu
re o
n P
resc
hool, P
rim
ary,
Sec
on
dar
y, a
nd
Voca
tion
al E
du
cati
on
as a
Per
cen
t of
GD
P a
nd
Pu
bli
c E
xpen
dit
ure
(H
RK
)
Pres
cho
ol E
du
cati
on
Prim
ary
Edu
cati
on
Seco
nd
ary
Edu
cati
on
Tota
l
Year
GD
P (H
RK
)Pu
blic
Exp
end
itu
rePe
rcen
t in
GD
PPe
rcen
t in
Pu
blic
Ex
pen
dit
ure
Perc
ent
in G
DP
Perc
ent
in P
ub
lic
Exp
end
itu
re
Perc
ent
in G
DP
Perc
ent
in P
ub
lic
Exp
end
itu
re
Perc
ent
in G
DP
Perc
ent
in P
ub
lic
Exp
end
itu
re
2001
165,6
40,0
00
57,8
12,7
64
0.0
05
0.0
14
2.0
18
5.7
81
0.9
94
2.8
47
3.0
16
8.6
42
2002
179,3
30,0
00
73,3
69,6
02
0.0
06
0.0
14
2.0
28
4.9
56
1.0
16
2.4
84
3.0
50
7.4
54
2003
193,0
67,0
00
80,4
41,1
23
0.0
11
0.0
25
2.0
64
4.9
54
1.0
59
2.5
43
3.1
34
7.5
22
2004
212,8
26,0
00
83,2
03,8
87
0.0
11
0.0
28
2.0
12
5.1
46
1.0
12
2.5
88
3.0
34
7.7
61
2005
231,3
48,0
00
87,6
33,4
09
0.0
09
0.0
24
1.9
28
5.0
90
0.9
94
2.6
23
2.9
31
7.7
38
2006
250,5
91,0
00
96,0
67,3
49
0.0
07
0.0
18
1.9
09
4.9
14
0.9
84
2.5
32
2.9
00
7.4
64
Sourc
e:
An
nu
al r
eport
by
Min
istr
y of
Fin
ance
for
2001–2003.
Not
es:
Sin
ce 2
002, th
e so
urc
es f
rom
th
e th
en-r
etir
emen
t an
d h
ealt
h f
un
ds
are
incl
ud
ed i
n t
he
pu
bli
c ex
pen
dit
ure
.
Dat
a fo
r 2004, 2005, an
d 2
006 i
s bas
ed o
n d
irec
tion
s of
the
gove
rnm
ent
of
Rep
ubli
c of
Cro
atia
mac
roec
on
om
ic p
oli
cies
.
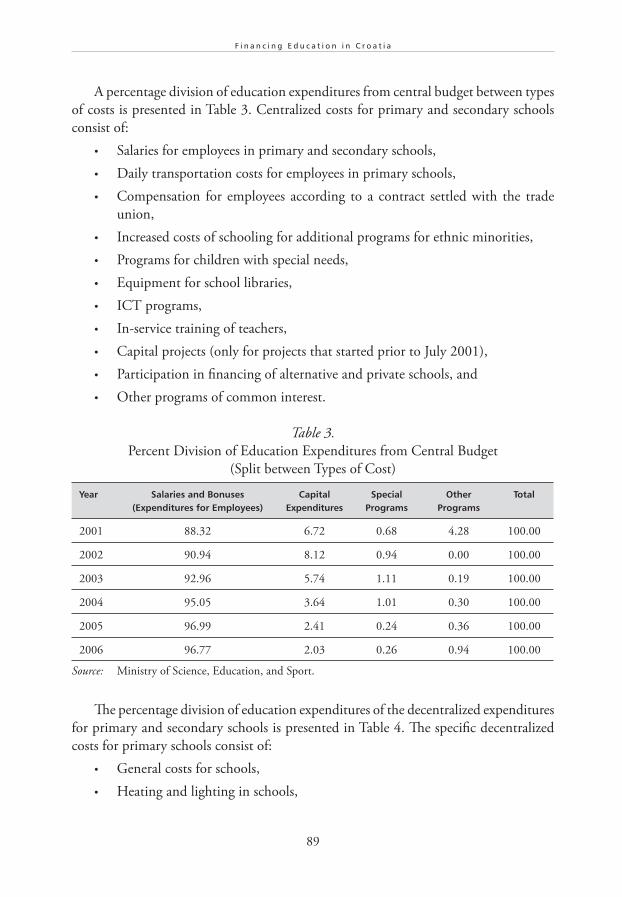
89
F i n a n c i n g E d u c a t i o n i n C r o a t i a
A percentage division of education expenditures from central budget between types
of costs is presented in Table 3. Centralized costs for primary and secondary schools
consist of:
• Salaries for employees in primary and secondary schools,
• Daily transportation costs for employees in primary schools,
• Compensation for employees according to a contract settled with the trade
union,
• Increased costs of schooling for additional programs for ethnic minorities,
• Programs for children with special needs,
• Equipment for school libraries,
• ICT programs,
• In-service training of teachers,
• Capital projects (only for projects that started prior to July 2001),
• Participation in financing of alternative and private schools, and
• Other programs of common interest.
Table 3.
Percent Division of Education Expenditures from Central Budget
(Split between Types of Cost)
Year Salaries and Bonuses (Expenditures for Employees)
Capital Expenditures
Special Programs
Other Programs
Total
2001 88.32 6.72 0.68 4.28 100.00
2002 90.94 8.12 0.94 0.00 100.00
2003 92.96 5.74 1.11 0.19 100.00
2004 95.05 3.64 1.01 0.30 100.00
2005 96.99 2.41 0.24 0.36 100.00
2006 96.77 2.03 0.26 0.94 100.00
Source: Ministry of Science, Education, and Sport.
The percentage division of education expenditures of the decentralized expenditures
for primary and secondary schools is presented in Table 4. The specific decentralized
costs for primary schools consist of:
• General costs for schools,
• Heating and lighting in schools,

90
P U B L I C M O N E Y F O R P U B L I C S C H O O L S
• Transportation for students (when the distance from a student’s home address
to the school is more than three kilometers for students in grades one to four,
or more than five kilometers for students in grades five to eight),
• Maintenance of schools and equipment, and
• Capital expenditures (according to the standards approved by the Ministry).
Table 4.
Percent Division of Education Expenditures of Decentralized Expenditures for
Primary and Secondary Schools (Split between Types of Cost)
Year Material and Financial Expenditures
Maintenance, Investments and Capital Expenditures
2001 94.56 5.44
2002 84.48 15.52
2003 76.58 23.42
2004 75.60 24.40
2005 71.77 28.23
2006 71.61 28.39
Source: Ministry of Science, Education, and Sport.
Each year the level of resources directed toward decentralized costs changes. One
can notice an increase in the level of funding for capital expenditures. Since the start
of the decentralization of education financing, there has been a visible increase in the
yearly percentage of the contribution of local government revenues and equalization
funds allocated to education (Table 5).
Table 5.
Percent Contributions of National and Local Government to Education Expenditure
(HRK thousands)
Sources 2001* 2002 2003 2004 2005 2006
Total funds 4,987,984 5,458,695 6,030,140 6,434,351 6,759,535 7,152,907
Local government
contribution to education326,896 881,763 1,068,615 1,111,692 1,265,003 1,333,712
Percent of contributions
for decentralized sources6.55 16.15 17.72 17.28 18.71 18.64
Source: Ministry of Science, Education, and Sport.
Note: * Decentralized since July 1, 2001.
91
F i n a n c i n g E d u c a t i o n i n C r o a t i a
The specific decentralized costs of secondary schools consist of:
• General costs for schools,
• Heating and lighting in schools,
• Transportation costs for employees,
• Participation in costs of boarding dormitories for students (a total of 53 boarding
houses),
• Maintenance of schools and equipment, and
• Capital expenditures (according to the standards approved by the ministry).
A notable decreasing trend in capital expenditures financed from the central budget
has influenced the increase of funds at the local level (see Tables 4 and 5). These funds
are distributed to the local government (towns or municipalities), according to the
number of school buildings, classes, and students.
The amounts of planned costs for different MoSES’s programs15 are shown in Table 6.
Most of the local governments in Croatia use additional income taxes, collected
locally. The difference between additional, locally-collected income taxes in towns
and municipalities, and the level of resources needed to cover the minimal standard,
is received from equalization funds (e.g., for the maintenance of old school buildings,
regional-level student competitions, additional programs for students, and the transport
of students that live less than three kilometers from school). Equalization funds are allo-
cated in the annual State Budget Law. This sum is defined annually, placed in the Ministry
of Finance, then distributed among three bodies (MoSES, the Ministry of Health and
Social Welfare, and the Croatian National Protection and Rescue Directorate).
For example, the criterion for the allocation of resources to cover material and
financial expenditure in secondary schools equals the number of enrolled pupils in a
certain year multiplied by the average annual cost per pupil. The average annual cost is
set for each individual local government unit.
Croatian education finance experts believe that the methodology for fund allocation
should be based on a per-student formula. While the current method—based on an
average per-student cost—does take into account some differences in per-student costs
generated by population density,16 equally important factors are not adjusted for—such
as heating cost differences, transportation issues, minorities, students with special
needs, etc. A formula would make things more straightforward and would increase the
efficiency in fund distribution.
Private primary and secondary schools can be co-financed by the state budget,
according to criteria identified by the minister. Resources for co-financing are secured
in the central budget.17 The resources approved for the current expenses are based on
measures approved by the minister and amount to 30 percent of the educational cost
for students in public schools. The ministry subsidizes private schools based on a policy
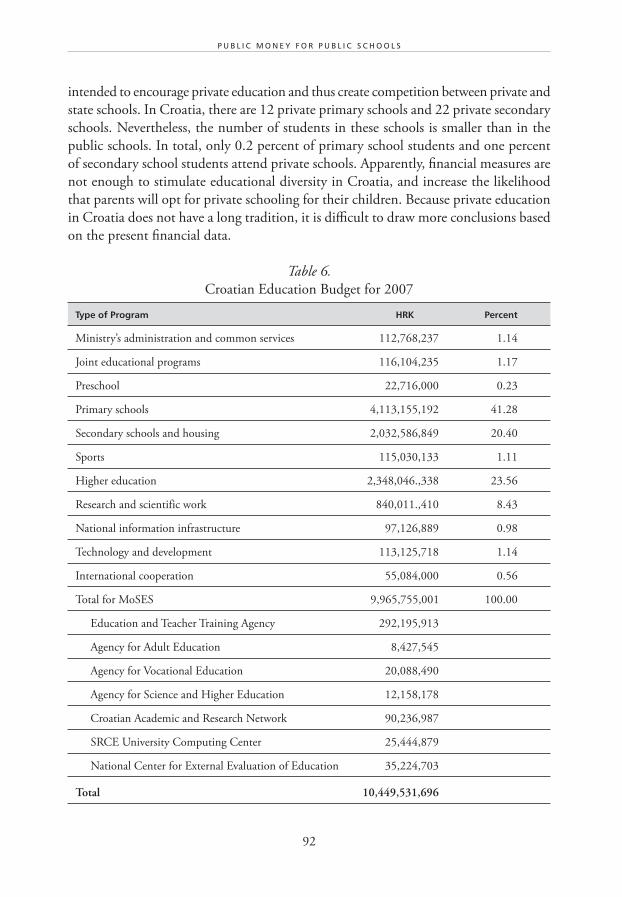
92
P U B L I C M O N E Y F O R P U B L I C S C H O O L S
intended to encourage private education and thus create competition between private and
state schools. In Croatia, there are 12 private primary schools and 22 private secondary
schools. Nevertheless, the number of students in these schools is smaller than in the
public schools. In total, only 0.2 percent of primary school students and one percent
of secondary school students attend private schools. Apparently, financial measures are
not enough to stimulate educational diversity in Croatia, and increase the likelihood
that parents will opt for private schooling for their children. Because private education
in Croatia does not have a long tradition, it is difficult to draw more conclusions based
on the present financial data.
Table 6.
Croatian Education Budget for 2007
Type of Program HRK Percent
Ministry’s administration and common services 112,768,237 1.14
Joint educational programs 116,104,235 1.17
Preschool 22,716,000 0.23
Primary schools 4,113,155,192 41.28
Secondary schools and housing 2,032,586,849 20.40
Sports 115,030,133 1.11
Higher education 2,348,046.,338 23.56
Research and scientific work 840,011.,410 8.43
National information infrastructure 97,126,889 0.98
Technology and development 113,125,718 1.14
International cooperation 55,084,000 0.56
Total for MoSES 9,965,755,001 100.00
Education and Teacher Training Agency 292,195,913
Agency for Adult Education 8,427,545
Agency for Vocational Education 20,088,490
Agency for Science and Higher Education 12,158,178
Croatian Academic and Research Network 90,236,987
SRCE University Computing Center 25,444,879
National Center for External Evaluation of Education 35,224,703
Total 10,449,531,696
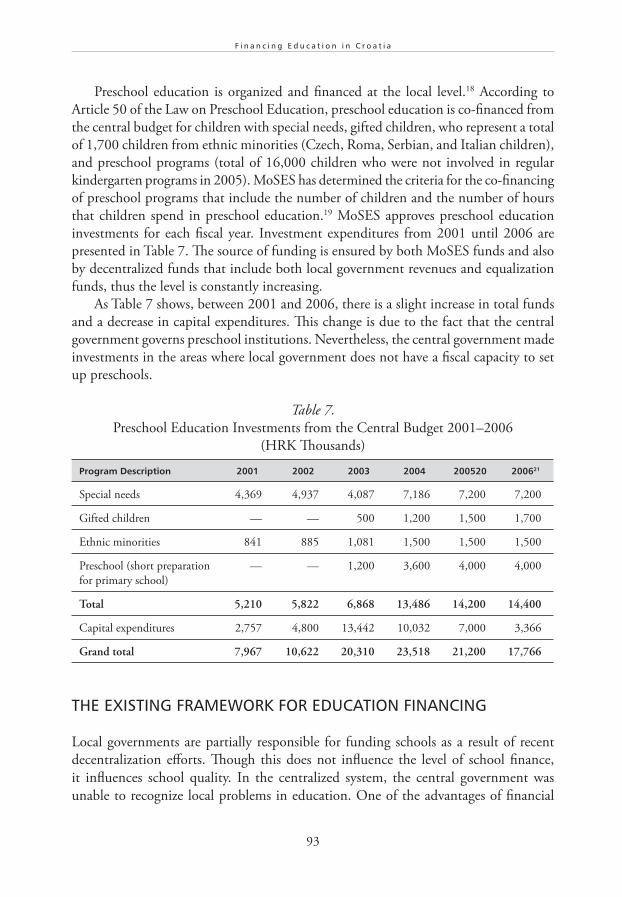
93
F i n a n c i n g E d u c a t i o n i n C r o a t i a
Preschool education is organized and financed at the local level.18 According to
Article 50 of the Law on Preschool Education, preschool education is co-financed from
the central budget for children with special needs, gifted children, who represent a total
of 1,700 children from ethnic minorities (Czech, Roma, Serbian, and Italian children),
and preschool programs (total of 16,000 children who were not involved in regular
kindergarten programs in 2005). MoSES has determined the criteria for the co-financing
of preschool programs that include the number of children and the number of hours
that children spend in preschool education.19 MoSES approves preschool education
investments for each fiscal year. Investment expenditures from 2001 until 2006 are
presented in Table 7. The source of funding is ensured by both MoSES funds and also
by decentralized funds that include both local government revenues and equalization
funds, thus the level is constantly increasing.
As Table 7 shows, between 2001 and 2006, there is a slight increase in total funds
and a decrease in capital expenditures. This change is due to the fact that the central
government governs preschool institutions. Nevertheless, the central government made
investments in the areas where local government does not have a fiscal capacity to set
up preschools.
Table 7.
Preschool Education Investments from the Central Budget 2001–2006
(HRK Thousands)
Program Description 2001 2002 2003 2004 200520 200621
Special needs 4,369 4,937 4,087 7,186 7,200 7,200
Gifted children — — 500 1,200 1,500 1,700
Ethnic minorities 841 885 1,081 1,500 1,500 1,500
Preschool (short preparation
for primary school)
— — 1,200 3,600 4,000 4,000
Total 5,210 5,822 6,868 13,486 14,200 14,400
Capital expenditures 2,757 4,800 13,442 10,032 7,000 3,366
Grand total 7,967 10,622 20,310 23,518 21,200 17,766
THE EXISTING FRAMEWORK FOR EDUCATION FINANCING
Local governments are partially responsible for funding schools as a result of recent
decentralization efforts. Though this does not influence the level of school finance,
it influences school quality. In the centralized system, the central government was
unable to recognize local problems in education. One of the advantages of financial
94
P U B L I C M O N E Y F O R P U B L I C S C H O O L S
decentralization is in the fact the local government has better insight into region-specific
problems and can channel funds to address the specific needs of a school.
The secondary-school network was always under municipal responsibility. Thus,
decentralization had no significant impact on the curriculum in the secondary schools.
Nevertheless, the level of expenditures increased and there has been a noticeable impact
on the proliferation of schools. An increase in school numbers occurred in all parts of
Croatia, not only in the areas where refugees returned. The reason for this is directly
linked to the planned transfer to one-shift schools, while most of the schools are still
working in two shifts.
In addition to the funds provided by the center—which cover the minimum stan-
dards in education—local governments are encouraged to participate in the financing
of primary and secondary education. Consequently, local governments offer grants
for student participation in local competitions, purchase school equipment, etc. State
competitions are financed from the central budget. Additionally, schools raise their own
revenues from donations and can earn money by renting school premises. This source
of revenue is monitored by the school founders, but is not reported to the MoSES.
MoSES monitors and analyses total expenditures for decentralized functions in 21
counties and 32 towns. In each fiscal year, the monitoring is conducted through tables
for the two periods: January through June and January through December.
The current education system has insufficient capabilities to cope with the structural
change presented by decentralization. Improvements in the quality of education are
not possible in the absence of skilled human resources, such as local financial experts
and managers. There is a definite need to strengthen the capacity of school directors,
specialists in education, and financial experts at the level of the local government.
Additionally, there is an ongoing need to bring teachers to remote areas. Existing
administrative and financial arrangements do not attract and retain good teachers.
Complete financial decentralization would negatively impact teacher salaries in poorer
areas where local government are not in the position to offer attractive salaries. This
should be compensated with other government forms of support, such as subsidized
home loans.22
According to the data there exists a decrease in the student–teacher ratio (see Table
8). This is directly related to demographic changes and the decrease of the student popu-
lation in schools. Although there is a decrease in number of students in classes, there is
no change in the number of actual classes. Consequently, in the time period from 1994
until 2004, the average number of students in primary school classes decreased from
24 to 21 (MoSES 2005).23 This change is related to the apparent drop in the birth rate
and the continuous increase in number of schools and teachers.
There was a visible increase in the number of schools from 2001 to 2006, which was
due to the return of refugees and renewal of schools destroyed during the war. These
new schools have opened in areas under special state concern.24
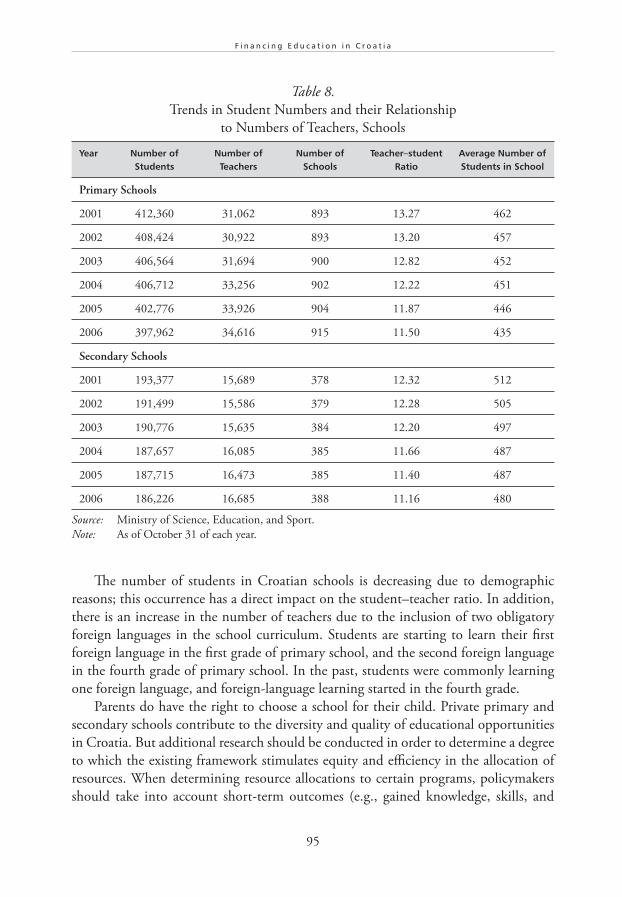
95
F i n a n c i n g E d u c a t i o n i n C r o a t i a
Table 8.
Trends in Student Numbers and their Relationship
to Numbers of Teachers, Schools
Year Number of Students
Number of Teachers
Number of Schools
Teacher–student Ratio
Average Number of Students in School
Primary Schools
2001 412,360 31,062 893 13.27 462
2002 408,424 30,922 893 13.20 457
2003 406,564 31,694 900 12.82 452
2004 406,712 33,256 902 12.22 451
2005 402,776 33,926 904 11.87 446
2006 397,962 34,616 915 11.50 435
Secondary Schools
2001 193,377 15,689 378 12.32 512
2002 191,499 15,586 379 12.28 505
2003 190,776 15,635 384 12.20 497
2004 187,657 16,085 385 11.66 487
2005 187,715 16,473 385 11.40 487
2006 186,226 16,685 388 11.16 480
Source: Ministry of Science, Education, and Sport.
Note: As of October 31 of each year.
The number of students in Croatian schools is decreasing due to demographic
reasons; this occurrence has a direct impact on the student–teacher ratio. In addition,
there is an increase in the number of teachers due to the inclusion of two obligatory
foreign languages in the school curriculum. Students are starting to learn their first
foreign language in the first grade of primary school, and the second foreign language
in the fourth grade of primary school. In the past, students were commonly learning
one foreign language, and foreign-language learning started in the fourth grade.
Parents do have the right to choose a school for their child. Private primary and
secondary schools contribute to the diversity and quality of educational opportunities
in Croatia. But additional research should be conducted in order to determine a degree
to which the existing framework stimulates equity and efficiency in the allocation of
resources. When determining resource allocations to certain programs, policymakers
should take into account short-term outcomes (e.g., gained knowledge, skills, and
96
P U B L I C M O N E Y F O R P U B L I C S C H O O L S
competencies) and long-term outcomes (e.g., employability of students that graduate
from certain secondary school programs).
Equity in the allocation of resources is obtained by the Equalization Fund. The
fund serves those towns and counties that do not meet the minimum standards as
determined by MoSES. The main difference between towns and municipalities is,
in fact, that municipalities and towns that are opening new schools do receive larger
funds. It is important to emphasize that additional resources from equalization funds
are received when the local governments prove that they are opening new programs.
These are regular equalization fund resources, as just one town in Croatia is meeting the
minimal standards, while the majority of towns and counties are meeting just 35–40
percent of the minimum standards.25 The minimum standards, which are expenditure
based, are set by the government each year and announced in the official periodicals.
The additional funds are not included in the macroeconomic indicators of the cost of
living stated by the central government. All of the municipalities and towns have the
same index of growth, and the principle of solidarity and equality is followed. Still, if
the municipality or town is wealthy they can devote more money to their schools. It is
important that the state guarantees the same minimum standards for all.
It is important to emphasize that local governments are receiving additional funds
for larger numbers of new students and for new schools. Nevertheless, when there is a
decrease in the number of students, the funds for the particular school do not decrease.
Since the school funding is not directly linked to inter-school competition for students,
it is possible to conclude that the current educational finances do not stimulate a variety
of educational offerings. Nevertheless, the variety of educational offerings is stimulated
by additional financing for the education of minorities, while religious and private
education stimulate the variety.
School management can encourage the efficient use of resources, but cannot
significantly contribute to expenditure efficiency. Still, if the school director has an
entrepreneur’s attitude, she or he can do a lot for the school. The school director can
organize donor events and collect money for the school. Also, it is common to rent the
school facilities, though schools never solely rely on this type of income. Funds that are
collected through donor events and the renting of school facilities are under the direct
monitoring of the school founders (the local government) and the school owner (the
school) for elementary schools. This cannot be done without the approval of a school
founder (this would be the town for primary schools or a municipality for primary and
secondary schools).
The teacher unions support teachers’ rights and also have an impact on the national
and local educational policies in Croatia. Since salary policies have never been decen-
tralized, this responsibility is managed from the center, though unions also have an
influence on salaries.
The majority of the schools have expressed their satisfaction with the decentraliza-
tion of educational finances. However, there are some complaints—coming mainly from
97
F i n a n c i n g E d u c a t i o n i n C r o a t i a
schools—pertaining to the increased control of local governments over the allocation
of local resources.
CONCLUSION
The Croatian education system is centralized in terms of schools’ management and
human resources, as well as in the establishment and implementation of the curriculum.
Due to financial decentralization efforts, in the last three years, significant changes
occurred in terms of resource allocation. Not all of them, however, are what is needed.
While towns and municipalities are able to better relate to the needs of schools, there
are significant disparities among the regions in terms of resource allocation.
When working from the central position, there is a desire to act equally towards
everybody, though on certain occasions, this is neither possible nor appropriate. Hence,
it is not surprising that ongoing decentralization efforts are accepted by interested parties,
both at the level of local and central governments. The closure and opening of schools
is left to local governments, which creates the opportunity for school network ratio-
nalization, but the distribution of the students among schools is not well defined and
frequently interferes with the school networks. While certain municipalities managed to
find appropriate school-network solutions, others are not in a position to plan an entirely
efficient school network. These are school networks that include remote mountainous
areas and islands, where the central government wants to retain the population and thus
it is necessary to keep open schools with a small number of pupils. The local education-
finance specialists plan the minimum standards at the local level and then address them
to MoSES. These local government plans are based on macroeconomic guidelines from
Ministry of Finance for each fiscal year. These plans are collected and negotiated with
the MoSES financial experts, where the Ministry of Finance acknowledges the minimum
standards in accordance with the yearly state budget. Hence, minimal standards that are
prepared by the financial department of the MoSES are based on plans of 53 founders
(transfer of school founding rights happened on January 1, 2002) and are accepted by
the central government after negotiations with the Ministry of Finance. Based on these
standards, each municipality and county has a clear idea of how much money they
have for each year. Local government acts independently with regard to how they will
divide these funds to the schools. If the municipality is rich, they can invest additional
funds in education.
In the years to come, additional financial decentralization measures will be imple-
mented. According to these measures, salaries for auxiliary personnel will be financed
from local budgets. This, however, is the only portion of the salary policy that will prob-
ably be decentralized, as it would be extremely difficult to decentralize teacher salaries,
which would lead to understaffing in the areas with lower income levels. The founder
98
P U B L I C M O N E Y F O R P U B L I C S C H O O L S
of the schools will finance overheads and current maintenance, minor investments, and
equipment. The founder will also finance capital investments, while the central state
can intervene when the fiscal capacity of the local government is lower.
It is crucial to establish clearer educational financing policies to address several
problems, such as the low number of students that are attending private schools or
alternative programs offered by public schools. Prior to deciding on the allocation of
resources, policymakers should determine the viability of the existing programs based
on their outcomes.
It is important to emphasize that, in the period from 2001 to 2007, the financial
decentralization system passed through many changes and improvements. The process
of financial decentralization is influenced by the fact that there is no unique political
decision on further financial decentralization efforts. One of the proposals was to place
salary funds on a local level and assure money for salaries in equalization funds. The
MoSES financial experts currently are working on an acceptable model for the decen-
tralization of salaries, where local governments would have increased powers in deciding
the level of salaries for teachers.
Current financing arrangements cannot address the problem of the lack of teachers
in the remote areas. The trend of decreasing salaries will endanger the quality of teaching
as well as professional selection mechanisms for teachers. Consequently, it is necessary
to improve teachers’ financial status.
School directors’ readiness to hold managerial functions would enhance the variety
of the educational offerings for their schools. Furthermore, it is necessary to extend
teachers’ leadership responsibilities, which should match their competences and expe-
rience. Various forms of in-service training would positively influence opportunities
for a more flexible deployment of teachers. For this reason, it is necessary to establish
leadership and management training courses for both teachers and school directors.
In his review of the status of decentralization efforts in four Central European
countries, Davey (2002)26 concluded that neither of these efforts offers an ideal solution.
Still, examples from other countries might be useful in the further decentralization of
Croatian education, and in structuring the formula for the division of funds.
SOURCES CITED
Act on the Territories of Counties, Towns, and Municipalities in the Republic of Croatia (1997)
Official Gazette. No. 10.
Bajo, A. and M. Bronić (2005) Fiscal Decentralization in Croatia. Occasional Paper No. 25.
Constitution of the Republic of Croatia (1998) Official Gazette. No. 8.
Croatian National Bank (2008) Exchange Rates Archive (2001–2006). Available online: http://
www.hnb.hr.
99
F i n a n c i n g E d u c a t i o n i n C r o a t i a
Davey, K. (2002) Balancing National and Local Responsibilities: Education Management and Finance in Four Central European Countries. Budapest: Local Government and Public Service
Reform Initiative.
Declaration of the Law on Primary Schools (1990) Official Gazette. No. 59.
Law on Amendments to the Law on Primary Schools (2001) Official Gazette. No. 59.
Law on Amendments to the Law on Primary Schools (2005) Official Gazette. No. 76.
Law on Amendments to the Law on Secondary Schools (2001) Official Gazette. No. 59.
Law on Amendments to the Law on Secondary Schools (2005) Official Gazette. No. 81.
Law on Areas of Special State Concern (2002) Official Gazette. No. 88.
Law on Financing Units of Local Self-government and Government (2001) Official Gazette. No. 59.
Law on Preschool Education (1997) Official Gazette. No. 10.
Ministry of Finance (2001) “Decentralization of Public Sector in Croatia.” Available online:
http://unpan1.un.org/intradoc/groups/public/documents/UNTC/UNPAN017656.pdf.
Ministry of Science, Education, and Sports (2005) Unpublished data.
——— Education, and Sports (2006) Unpublished data.
——— (2007) “Decision on Subsidized Home Loans.” Available online: http://www.mzos.hr.
Regulation of Names for Work Positions and Coefficients of Each Specific Position in the Public
Service (2001) Official Gazette. No. 38.
Regulations of Methods of Disposition of Funds from the State Budget and Measures of
Co-financing Preschool Education (1997) Official Gazette. No. 134.
Regulations on Primary School Education of Students with Developmental Difficulties (1991)
Official Gazette. No. 23.
Regulations on Secondary School Education of Students with Developmental Difficulties and
Severe Developmental Difficulties (1992) Official Gazette. No. 86.
State Budget of the Republic of Croatia for 2005 (2004) Official Gazette. No. 171.
State Budget of the Republic of Croatia for 2006 (2005) Official Gazette. No. 148.
State Budget of the Republic of Croatia for 2007 (2006) Official Gazette. No. 137.
NOTES
1 Constitution of the Republic of Croatia (1998) Official Gazette. No. 8.
2 Ministry of Finance (2001) Decentralization of Public Sector in Croatia. Available online:
http://unpan1.un.org/intradoc/groups/public/documents/UNTC/UNPAN017656.pdf.
3 Law on Amendments to the Law on Primary Schools (2001) Official Gazette. No. 59.
4 Law on Amendments to the Law on Secondary Schools (2001) Official Gazette. No. 59.

100
P U B L I C M O N E Y F O R P U B L I C S C H O O L S
5 Law on Financing Units of Local Self-government and Government (2001) Official Gazette. No. 59.
6 Of the 570 local government units, 53 of them assumed the obligation of financing the
decentralized functions in 2001. In addition, from 2002, the financing of fire departments
was taken on by 83 local government units (municipalities and cities). For more details on
the process of fiscal decentralization, please see Bajo and Bronić 2005.
7 The local self-government system in Croatia includes 421 municipalities, 122 towns, 20
counties, and the City of Zagreb (a special territorial unit with the status of a county).
More details are in the Act on the Territories of Counties, Towns, and Municipalities in the
Republic of Croatia (1997). Official Gazette. No. 10.
8 Law on Amendments to the Law on Primary Schools (2005) Official Gazette. No. 76.
9 Law on Amendments to the Law on Secondary Schools (2005) Official Gazette. No. 81.
10 Regulation of Names for Work Positions and Coefficients of Each Specific Position in the
Public Service (2001) Official Gazette. No. 38.
11 The parity of HRK to EUR in the time period 2001–2006 ranged from HRK 7.3 to 7.7
to EUR 1. The Croatian National Bank (2008) Exchange Rates Archive (2001–2006).
Available online: http://www.hnb.hr.
12 Declaration of the Law on Primary School (1990) Official Gazette. No. 59.
13 Regulations on Primary School Education of Students with Developmental Difficulties
(1991) Official Gazette. N0. 23.
14 Regulations on Secondary School Education of Students with Developmental Difficulties
and Severe Developmental Difficulties (1992) Official Gazette. No. 86.
15 State Budget of the Republic of Croatia for 2007 (2006). Official Gazette. No. 137.
16 This method still creates variations in funds allocated to schools. A school with a large number
of students receives substantial amounts of money, even in the cases when this money is not
needed. Conversely, schools with a small number of students commonly lack the necessary
funds, given the lower number of students. For example, smaller schools are usually placed
in remote areas that have cold winters. Therefore, it is likely that they would spend most of
the allocated money on heating.
17 According to MoSES unpublished data, the secured amounts for 2005 are: HRK 2,000,000
(EUR 264,860) for primary schools, and HRK 3,800,000 (EUR 503,230) for secondary
schools.
18 Law on Preschool Education (1997) Official Gazette. No. 10.
19 Regulations of Methods of Disposition of Funds from the State Budget and Measures of
Co-financing Preschool Education (1997) Official Gazette. No. 134.
20 State Budget of the Republic of Croatia for 2005 (2004) Official Gazette. No. 171.
21 State Budget of the Republic of Croatia for 2006 (2005) Official Gazette. No. 148.
22 This had already started in 2007. For more details, see MoSES (2007) Decision on Subsidized
Home Loans. September. Available online: http://www.mzos.hr/.
101
F i n a n c i n g E d u c a t i o n i n C r o a t i a
23 Ministry of Science, Education, and Sports (2005) Unpublished data.
24 The Law on the Areas of Special State Concern (2002) Official Gazette. No. 88.
25 Ministry of Science, Education, and Sports (2006) Unpublished data.
26 Davey, K. (2002) Balancing National and Local Responsibilities: Education Management and Finance in Four Central European Countries. Budapest: Local Government and Public Service
Reform Initiative.

C H A P T E R 4
The First Careful Step:
Education Decentralization and
Finance in the Republic of Macedonia
Jan Herczyński, Jasna Vidanovska, and Nuri Lacka1
Interdisciplinary Center for Mathematical and Computational Modelling ICM Warsaw University, Poland
Insterdyscyplinarne Centrum Modelo-wania Matematyczne i Komputerowego ICM
Uniwersytet Warszawski, Polska

105
T h e F i r s t C a r e f u l S t e p : E d u c a t i o n D e c e n t r a l i z a t i o n a n d F i n a n c e i n t h e R e p u b l i c o f M a c e d o n i a
Executive Summary
Emerging during the Balkan wars of the 1990s, Macedonia voted for an independence refer-
endum and escaped the armed conflict that destroyed many other former Yugoslav republics.
But it experienced its own ethnic strife and limited civil war in 2001 that ended with the
signing of the Ohrid Agreement. Since then Macedonia started a unique attempt to defuse
ethnic tension through a far-reaching decentralization of all major social functions.
The 2001 Ohrid agreement brought about a complete turnaround in the policies pursued
by the Macedonian central government, which had before, in response to economic decline
following independence, centralized the country. For over a decade, the education sector
was financed directly from the central budgets, because Yugoslavian-type local councils
were too poor to even pay teacher salaries. No longer autonomous, schools were made the
direct responsibility of the Ministry of Education and Science (MoES). School boards powers
were severely restricted, and even their statutory powers, such as opinions regarding the
appointment of school directors, were frequently disregarded by MoES. The Ohrid Agreement
reversed this trend. Between 2004 and 2005, the process really began when new structures
of financing were put in place and more responsibilities were devolved from the central
government to local governments.
Macedonia, like all post-communist countries, was facing a serious demographic
decline, which particularly affected education. Between 1999–2003, the number of students
in primary school decreased about nine percent, class size decreased by 3.7 percent, and
teachers by 1.7 percent. Still, Macedonia’s student–teacher ratio remained compatible with
the OECD average: 16.5 in primary education and 13.6 in secondary. As a percentage of
GDP, expenditures for primary and secondary education had fallen from 3.19 percent in
1998 to 2.84 percent in 2003.
The budgeting system developed in Macedonia recognized different sources of funds
for schools: from the state budget, own revenues (including rent of school properties and
some payments from parents, such as a participation fee in secondary education), and
grants and donations (mainly from foreign donors); schools had to prepare a separate
financial plan for each revenue stream. In reality, extrabudgetary resources covered only a
fraction of overall school’s budget and no funds could be transferred between categories
even if shortages appeared. Of a typical school’s budget, about 85–90 percent was spent
on salaries, eight percent on goods and services, four percent on student transport, and
two percent on investments.
106
P U B L I C M O N E Y F O R P U B L I C S C H O O L S
The budget for teachers’ salaries was calculated in two steps, on the basis of two norms.
The number of teaching positions first was determined on the basis of teaching plans for
every grade in every type of school as established by the Bureau for the Development of
Education. Class size was also subject to its approval. The number of classes was then used
to allocate teaching positions. Salaries were awarded according to a set of criteria on quali-
fications, seniority, and other factors in addition to a base coefficient, the UNR, or normative
unqualified employee, the amount of which has only been amended once, in 2002.
Interestingly, equity in education has internalized divisions over ethnicity and rural/urban
divisions within the territorial-administrative units of Macedonia. A complicated portrait
emerges from a comparison of schools, class sizes, and expenditures per student in Skopje,
large cities (over 50,000 inhabitants), small cities, rural municipalities, and Macedonia as a
whole. Indeed, the demand for education is so high in some Albanian areas, whether urban
or rural, that students attend school in morning and afternoon shifts. This is less likely in
Macedonian schools, partly because of different birth rates in the two communities.
The Law on Local Government of 2002 was the first of a series of legal acts, including
the Law on Local Government Finance of 2004, amendments to the laws on primary and
secondary education in the same year, and also the Law on Territorial Division—redefining
municipality boundaries to reduce the number from 124 to 85—that completely changed
the legal and financial framework within which local governments operate.
In particular, local authorities were given more opportunities to levy local fees and
charges, and received block, categorical, and capital grants from the central government,
as well as shares of personal income tax. An equalization fund, albeit rather weak, was
also put into place.
Phase I of decentralization transferred responsibilities for maintenance, repairs and
material expenditures to municipalities. While the responsibilities regarding “establishing,
financing, and administering of primary and secondary schools” were transferred to munici-
palities, school boards were re-empowered to select and dismiss the school director, form
a budget, and adopt school statutes. However, numerous legal intricacies regarding the
ownership of school facilities have hampered and delayed their transfer to local govern-
ments. Phase II of decentralization included transfer of responsibilities for salaries.
The decentralization process in Macedonia was accompanied by many training programs
for local officials (usually funded by donors), by production and distribution of guidebooks
and other supportive documentation for both local administrations and the school boards,
and by some institutional framework designed to limit conflicts (managed by the Ministry of
Local Governments). Nevertheless, the process was not easy to implement, due to opposi-
107
T h e F i r s t C a r e f u l S t e p : E d u c a t i o n D e c e n t r a l i z a t i o n a n d F i n a n c e i n t h e R e p u b l i c o f M a c e d o n i a
tion from many sources within the country. Consolidation of municipalities was one of the
most controversial steps.
Certainly, many rural municipalities faced an extraordinary challenge in funding and
maintaining their schools, especially in rural and mountainous areas. To address this issue,
MoES adopted specific formulas for allocation of categorical and block grants in education.
The lump sum in the allocation formula is provided for the basic fixed costs of education.
The per-student amount is then weighted according to population density. A separate
formula was used for the categorical grant for student transportation. Overall, Macedonia
has been successful in designing and implementing a formula driven system of financing
education.
By all accounts, education decentralization has given local governments real power, and
they have taken seriously their duties to assess, manage, and rebuild their schools, optimize
the networks, and improve the budgeting process. Urgent tasks for the future include
addressing past school debts, completing the transfer of ownership of school properties,
introducing proper monitoring procedures and tools, and adopting a modified normative
on school conditions and teaching aids and equipment. None of this could have happened
without the overriding political determination to implement the Ohrid Agreement and
without a long planning and preparation stage.
108
P U B L I C M O N E Y F O R P U B L I C S C H O O L S
INTRODUCTION
The Republic of Macedonia emerged from the disintegrating Socialist Federal Republic
of Yugoslavia in a relatively calm manner, through an independence referendum and
without the armed conflicts that devastated many other former Yugoslav republics.
Nevertheless, the country faced quite severe tensions. Some of those tensions were
external in nature, due to continuing conflicts in surrounding countries (the conflict
in Kosovo and tension with Greece over Macedonian national symbols and its consti-
tutional name, see ICG 2001a). The main source of internal tension was the economic
collapse of the country, with GDP to this day still more than 20 percent below its 1990
level. The country also experienced a short-lived armed insurrection in 2001 (a spillover
from the conflict in Kosovo, see ICG 2001b), which was terminated with the signing in
Ohrid of the Framework Agreement. The Ohrid Agreement defines the basic directions
of the future development of Macedonia, namely, the devolution of significant powers
to municipalities in many sectors of the public life, including education.
The decentralization effort undertaken in Macedonia since 2001 is a dramatic and
complete reversal of policies pursued since independence in 1992. Indeed, in response
to economic difficulties and the general turmoil in the surrounding Balkan countries,
the newly independent Macedonia abandoned the Yugoslav tradition of local self-
government and centralized all sectors. The 34 former municipalities, with their far-
reaching autonomy and financial independence, were broken in 1996 into 124 much
smaller and much weaker jurisdictions, with very little authority and very small budgets.
The ill-defined revenues of municipalities, especially a very complex and irrational
equalization system, together with inadequate budgetary control and poor auditing,
quickly saddled the municipalities with ever-growing debt.
The centralization was particularly severe in the education sector, within both the
political and financial dimensions. The political dimension of centralization was to
break the schools’ autonomy and to make schools directly responsible to the Ministry of
Education and Science (MoES). Thus, although formerly influential school boards still
functioned, their powers were taken away and transferred to the ministry. All respon-
sibility for the development of schools, their closure and opening, was taken over by
MoES. The most extreme and painful example of this process was the nomination and
dismissal of all school directors in the country by the decision of the minister himself.
The school boards retained some advisory role, but their voice was routinely disregarded,
leading to politicization of the process of selection of school directors. The resulting
turnover of school directors had a lasting and damaging effect on education. At the
same time, centralization meant that some schools received preferential treatment due
to their better links with the responsible ministry officials.
The financial dimension of centralization was no less extreme than the political
one. Budgets of all the schools were decided by the MoES, which decided on the
109
T h e F i r s t C a r e f u l S t e p : E d u c a t i o n D e c e n t r a l i z a t i o n a n d F i n a n c e i n t h e R e p u b l i c o f M a c e d o n i a
use of funds allocated from the state budget, and the approval of which was required
for the use of funds earned by the schools. All school expenditures went through the
centralized treasury system operated by the Ministry of Finance. Thus, for instance, if a
student wanted to buy a subscription to Drugarche (Little Friend, a weekly for children
aged 7–12), the money for this purpose had to be included in the financial plan of the
school, in the own revenues part of the budget. Parents paid the subscription to the
school, the school deposited the funds in the treasury system, the money after a few days
reached the school account of the treasury system, and the director finally authorized the
payment to the publisher. If the subscription was not included in the financial plan, the
director could not make the payment order, with the Ministry of Finance responsible
for verifying that all transactions were within the pre-defined limits, by every school,
by every detailed budget line, and by the source of funds (budget funds, own revenues,
grants, or other).
Nevertheless, as already indicated, the new thinking about public governance in
general, and about the management and financing of education in particular, following
the Ohrid Agreement, very strongly favors decentralization. Initially construed as a way
of resolving ethnic tensions, decentralization is now seen as a new way for the evolu-
tion of the Macedonian state. For the education sector, this poses an entirely new set of
challenges and difficulties, and much to the credit of Macedonian authorities, a serious
debate and analysis is ongoing, with a growing number of ministries actively involved
in the shaping of the new structure of responsibilities and financing. Among the most
active of those is the Ministry of Education and Science, which adopted an Education
Decentralization Strategy in 2004. MoES has thus made the first careful steps towards
decentralization of education and already has accumulated significant decentralization
experiences.
Our report is structured to reflect the initial situation of complete centralization, the
preparations to begin decentralization in 2004–2005, and the first experiences of decen-
tralization as implemented in 2005. First, we analyze the financing of the initial central-
ized system, with special emphasis not only on the normative budgeting procedures, but
on the equity and efficiency of the Macedonian education system. Then we review the
preparations for decentralization, and the planning of the MoES to manage and finance
decentralized education. We outline this new experience in the last section.
MANAGEMENT AND FINANCING OF CENTRALIZED EDUCATION SYSTEM
In the introduction, we described some extreme examples of education centralization
in Macedonia. The primary motivation to centralize was to control spending, especially
the spending on salaries, in a period of fiscal constraints. A system of allocation norms
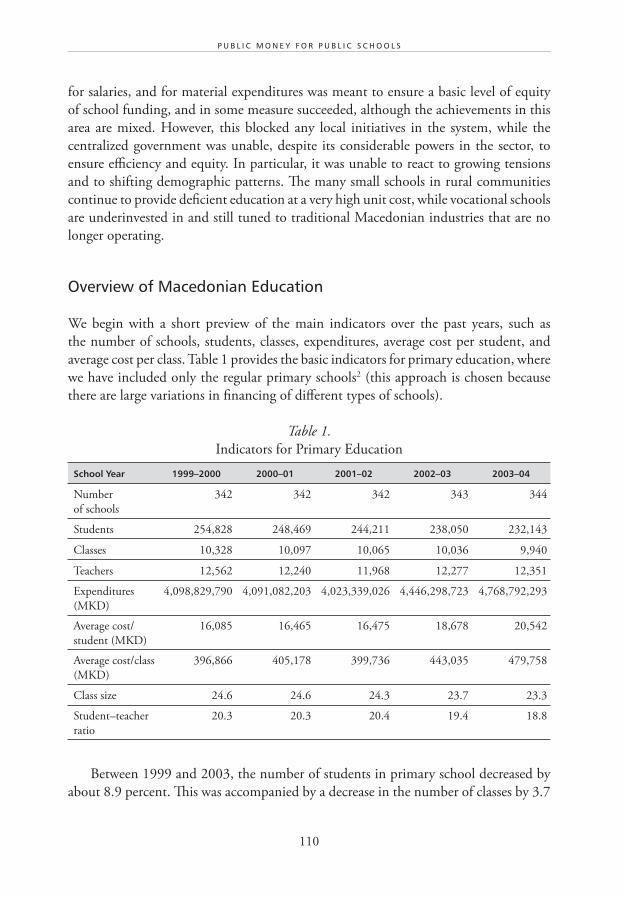
110
P U B L I C M O N E Y F O R P U B L I C S C H O O L S
for salaries, and for material expenditures was meant to ensure a basic level of equity
of school funding, and in some measure succeeded, although the achievements in this
area are mixed. However, this blocked any local initiatives in the system, while the
centralized government was unable, despite its considerable powers in the sector, to
ensure efficiency and equity. In particular, it was unable to react to growing tensions
and to shifting demographic patterns. The many small schools in rural communities
continue to provide deficient education at a very high unit cost, while vocational schools
are underinvested in and still tuned to traditional Macedonian industries that are no
longer operating.
Overview of Macedonian Education
We begin with a short preview of the main indicators over the past years, such as
the number of schools, students, classes, expenditures, average cost per student, and
average cost per class. Table 1 provides the basic indicators for primary education, where
we have included only the regular primary schools2 (this approach is chosen because
there are large variations in financing of different types of schools).
Table 1.
Indicators for Primary Education
School Year 1999–2000 2000–01 2001–02 2002–03 2003–04
Number
of schools
342 342 342 343 344
Students 254,828 248,469 244,211 238,050 232,143
Classes 10,328 10,097 10,065 10,036 9,940
Teachers 12,562 12,240 11,968 12,277 12,351
Expenditures
(MKD)
4,098,829,790 4,091,082,203 4,023,339,026 4,446,298,723 4,768,792,293
Average cost/
student (MKD)
16,085 16,465 16,475 18,678 20,542
Average cost/class
(MKD)
396,866 405,178 399,736 443,035 479,758
Class size 24.6 24.6 24.3 23.7 23.3
Student–teacher
ratio
20.3 20.3 20.4 19.4 18.8
Between 1999 and 2003, the number of students in primary school decreased by
about 8.9 percent. This was accompanied by a decrease in the number of classes by 3.7
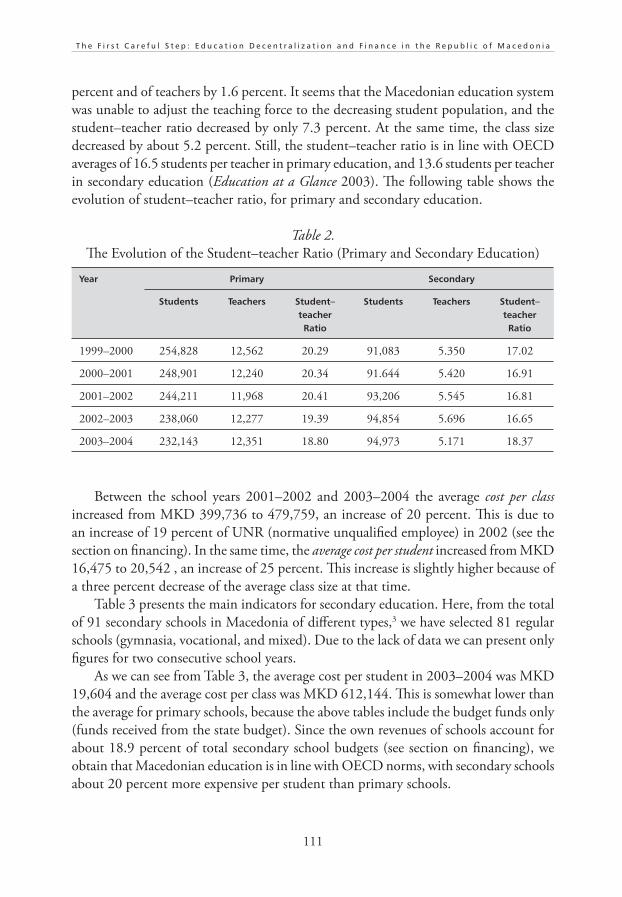
111
T h e F i r s t C a r e f u l S t e p : E d u c a t i o n D e c e n t r a l i z a t i o n a n d F i n a n c e i n t h e R e p u b l i c o f M a c e d o n i a
percent and of teachers by 1.6 percent. It seems that the Macedonian education system
was unable to adjust the teaching force to the decreasing student population, and the
student–teacher ratio decreased by only 7.3 percent. At the same time, the class size
decreased by about 5.2 percent. Still, the student–teacher ratio is in line with OECD
averages of 16.5 students per teacher in primary education, and 13.6 students per teacher
in secondary education (Education at a Glance 2003). The following table shows the
evolution of student–teacher ratio, for primary and secondary education.
Table 2.
The Evolution of the Student–teacher Ratio (Primary and Secondary Education)
Year Primary Secondary
Students Teachers Student– teacher Ratio
Students Teachers Student– teacher Ratio
1999–2000 254,828 12,562 20.29 91,083 5.350 17.02
2000–2001 248,901 12,240 20.34 91.644 5.420 16.91
2001–2002 244,211 11,968 20.41 93,206 5.545 16.81
2002–2003 238,060 12,277 19.39 94,854 5.696 16.65
2003–2004 232,143 12,351 18.80 94,973 5.171 18.37
Between the school years 2001–2002 and 2003–2004 the average cost per class
increased from MKD 399,736 to 479,759, an increase of 20 percent. This is due to
an increase of 19 percent of UNR (normative unqualified employee) in 2002 (see the
section on financing). In the same time, the average cost per student increased from MKD
16,475 to 20,542 , an increase of 25 percent. This increase is slightly higher because of
a three percent decrease of the average class size at that time.
Table 3 presents the main indicators for secondary education. Here, from the total
of 91 secondary schools in Macedonia of different types,3 we have selected 81 regular
schools (gymnasia, vocational, and mixed). Due to the lack of data we can present only
figures for two consecutive school years.
As we can see from Table 3, the average cost per student in 2003–2004 was MKD
19,604 and the average cost per class was MKD 612,144. This is somewhat lower than
the average for primary schools, because the above tables include the budget funds only
(funds received from the state budget). Since the own revenues of schools account for
about 18.9 percent of total secondary school budgets (see section on financing), we
obtain that Macedonian education is in line with OECD norms, with secondary schools
about 20 percent more expensive per student than primary schools.
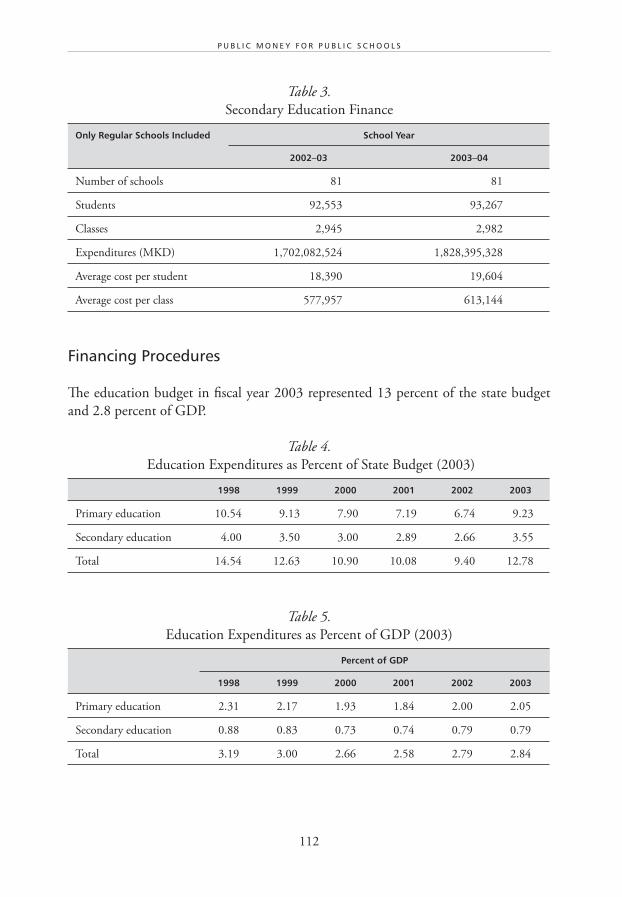
112
P U B L I C M O N E Y F O R P U B L I C S C H O O L S
Table 3.
Secondary Education Finance
Only Regular Schools Included School Year
2002–03 2003–04
Number of schools 81 81
Students 92,553 93,267
Classes 2,945 2,982
Expenditures (MKD) 1,702,082,524 1,828,395,328
Average cost per student 18,390 19,604
Average cost per class 577,957 613,144
Financing Procedures
The education budget in fiscal year 2003 represented 13 percent of the state budget
and 2.8 percent of GDP.
Table 4.
Education Expenditures as Percent of State Budget (2003)
1998 1999 2000 2001 2002 2003
Primary education 10.54 9.13 7.90 7.19 6.74 9.23
Secondary education 4.00 3.50 3.00 2.89 2.66 3.55
Total 14.54 12.63 10.90 10.08 9.40 12.78
Table 5.
Education Expenditures as Percent of GDP (2003)
Percent of GDP
1998 1999 2000 2001 2002 2003
Primary education 2.31 2.17 1.93 1.84 2.00 2.05
Secondary education 0.88 0.83 0.73 0.74 0.79 0.79
Total 3.19 3.00 2.66 2.58 2.79 2.84
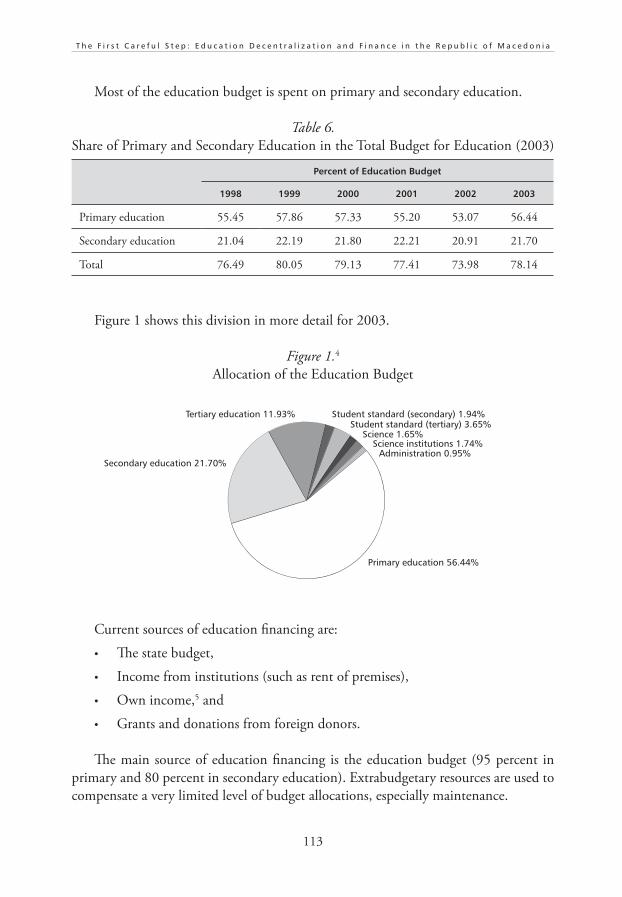
113
T h e F i r s t C a r e f u l S t e p : E d u c a t i o n D e c e n t r a l i z a t i o n a n d F i n a n c e i n t h e R e p u b l i c o f M a c e d o n i a
Most of the education budget is spent on primary and secondary education.
Table 6.
Share of Primary and Secondary Education in the Total Budget for Education (2003)
Percent of Education Budget
1998 1999 2000 2001 2002 2003
Primary education 55.45 57.86 57.33 55.20 53.07 56.44
Secondary education 21.04 22.19 21.80 22.21 20.91 21.70
Total 76.49 80.05 79.13 77.41 73.98 78.14
Figure 1 shows this division in more detail for 2003.
Figure 1.4
Allocation of the Education Budget
Current sources of education financing are:
• The state budget,
• Income from institutions (such as rent of premises),
• Own income,5 and
• Grants and donations from foreign donors.
The main source of education financing is the education budget (95 percent in
primary and 80 percent in secondary education). Extrabudgetary resources are used to
compensate a very limited level of budget allocations, especially maintenance.
Primary education 56.44%
Secondary education 21.70%
Tertiary education 11.93% Student standard (secondary) 1.94%Student standard (tertiary) 3.65%
Science 1.65%
Administration 0.95%Science institutions 1.74%
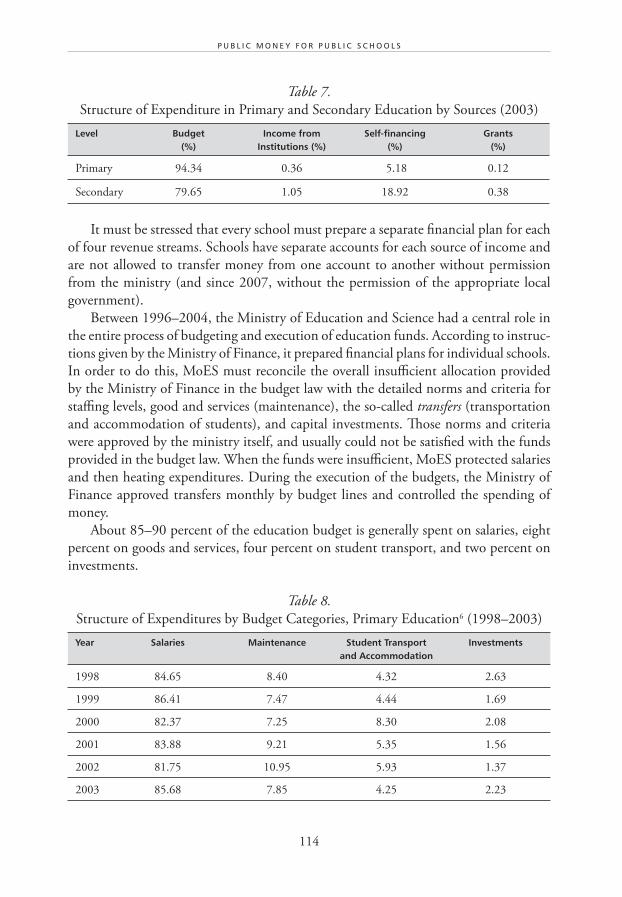
114
P U B L I C M O N E Y F O R P U B L I C S C H O O L S
Table 7.
Structure of Expenditure in Primary and Secondary Education by Sources (2003)
Level Budget(%)
Income from Institutions (%)
Self-financing(%)
Grants(%)
Primary 94.34 0.36 5.18 0.12
Secondary 79.65 1.05 18.92 0.38
It must be stressed that every school must prepare a separate financial plan for each
of four revenue streams. Schools have separate accounts for each source of income and
are not allowed to transfer money from one account to another without permission
from the ministry (and since 2007, without the permission of the appropriate local
government).
Between 1996–2004, the Ministry of Education and Science had a central role in
the entire process of budgeting and execution of education funds. According to instruc-
tions given by the Ministry of Finance, it prepared financial plans for individual schools.
In order to do this, MoES must reconcile the overall insufficient allocation provided
by the Ministry of Finance in the budget law with the detailed norms and criteria for
staffing levels, good and services (maintenance), the so-called transfers (transportation
and accommodation of students), and capital investments. Those norms and criteria
were approved by the ministry itself, and usually could not be satisfied with the funds
provided in the budget law. When the funds were insufficient, MoES protected salaries
and then heating expenditures. During the execution of the budgets, the Ministry of
Finance approved transfers monthly by budget lines and controlled the spending of
money.
About 85–90 percent of the education budget is generally spent on salaries, eight
percent on goods and services, four percent on student transport, and two percent on
investments.
Table 8.
Structure of Expenditures by Budget Categories, Primary Education6 (1998–2003)
Year Salaries Maintenance Student Transport and Accommodation
Investments
1998 84.65 8.40 4.32 2.63
1999 86.41 7.47 4.44 1.69
2000 82.37 7.25 8.30 2.08
2001 83.88 9.21 5.35 1.56
2002 81.75 10.95 5.93 1.37
2003 85.68 7.85 4.25 2.23
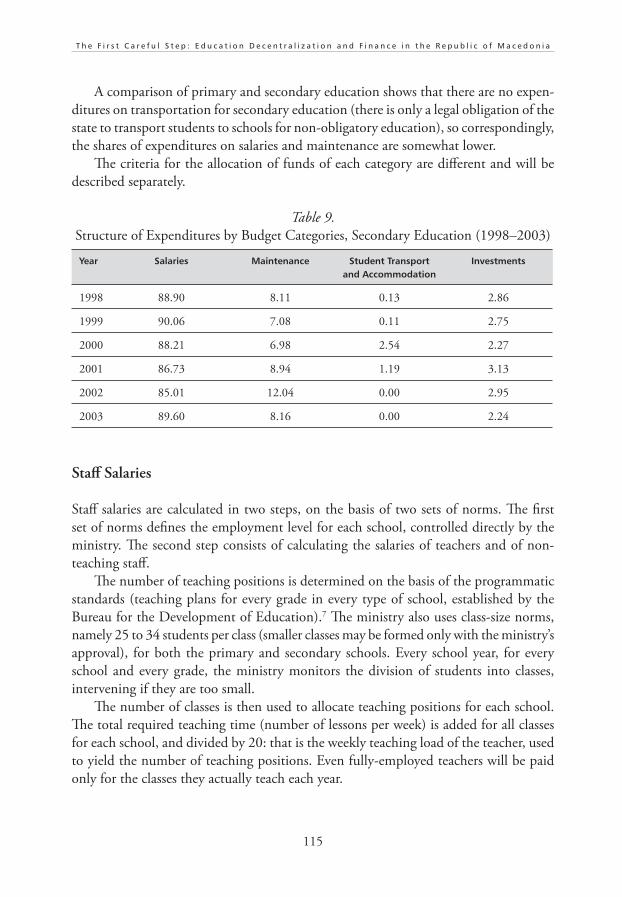
115
T h e F i r s t C a r e f u l S t e p : E d u c a t i o n D e c e n t r a l i z a t i o n a n d F i n a n c e i n t h e R e p u b l i c o f M a c e d o n i a
A comparison of primary and secondary education shows that there are no expen-
ditures on transportation for secondary education (there is only a legal obligation of the
state to transport students to schools for non-obligatory education), so correspondingly,
the shares of expenditures on salaries and maintenance are somewhat lower.
The criteria for the allocation of funds of each category are different and will be
described separately.
Table 9.
Structure of Expenditures by Budget Categories, Secondary Education (1998–2003)
Year Salaries Maintenance Student Transport and Accommodation
Investments
1998 88.90 8.11 0.13 2.86
1999 90.06 7.08 0.11 2.75
2000 88.21 6.98 2.54 2.27
2001 86.73 8.94 1.19 3.13
2002 85.01 12.04 0.00 2.95
2003 89.60 8.16 0.00 2.24
Staff Salaries
Staff salaries are calculated in two steps, on the basis of two sets of norms. The first
set of norms defines the employment level for each school, controlled directly by the
ministry. The second step consists of calculating the salaries of teachers and of non-
teaching staff.
The number of teaching positions is determined on the basis of the programmatic
standards (teaching plans for every grade in every type of school, established by the
Bureau for the Development of Education).7 The ministry also uses class-size norms,
namely 25 to 34 students per class (smaller classes may be formed only with the ministry’s
approval), for both the primary and secondary schools. Every school year, for every
school and every grade, the ministry monitors the division of students into classes,
intervening if they are too small.
The number of classes is then used to allocate teaching positions for each school.
The total required teaching time (number of lessons per week) is added for all classes
for each school, and divided by 20: that is the weekly teaching load of the teacher, used
to yield the number of teaching positions. Even fully-employed teachers will be paid
only for the classes they actually teach each year.
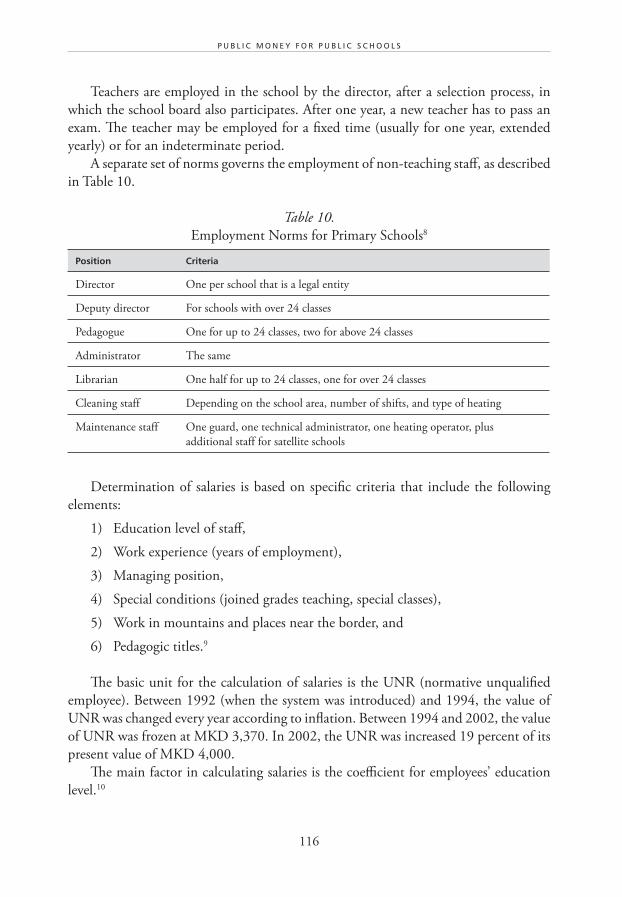
116
P U B L I C M O N E Y F O R P U B L I C S C H O O L S
Teachers are employed in the school by the director, after a selection process, in
which the school board also participates. After one year, a new teacher has to pass an
exam. The teacher may be employed for a fixed time (usually for one year, extended
yearly) or for an indeterminate period.
A separate set of norms governs the employment of non-teaching staff, as described
in Table 10.
Table 10.
Employment Norms for Primary Schools8
Position Criteria
Director One per school that is a legal entity
Deputy director For schools with over 24 classes
Pedagogue One for up to 24 classes, two for above 24 classes
Administrator The same
Librarian One half for up to 24 classes, one for over 24 classes
Cleaning staff Depending on the school area, number of shifts, and type of heating
Maintenance staff One guard, one technical administrator, one heating operator, plus
additional staff for satellite schools
Determination of salaries is based on specific criteria that include the following
elements:
1) Education level of staff,
2) Work experience (years of employment),
3) Managing position,
4) Special conditions (joined grades teaching, special classes),
5) Work in mountains and places near the border, and
6) Pedagogic titles.9
The basic unit for the calculation of salaries is the UNR (normative unqualified
employee). Between 1992 (when the system was introduced) and 1994, the value of
UNR was changed every year according to inflation. Between 1994 and 2002, the value
of UNR was frozen at MKD 3,370. In 2002, the UNR was increased 19 percent of its
present value of MKD 4,000.
The main factor in calculating salaries is the coefficient for employees’ education
level.10
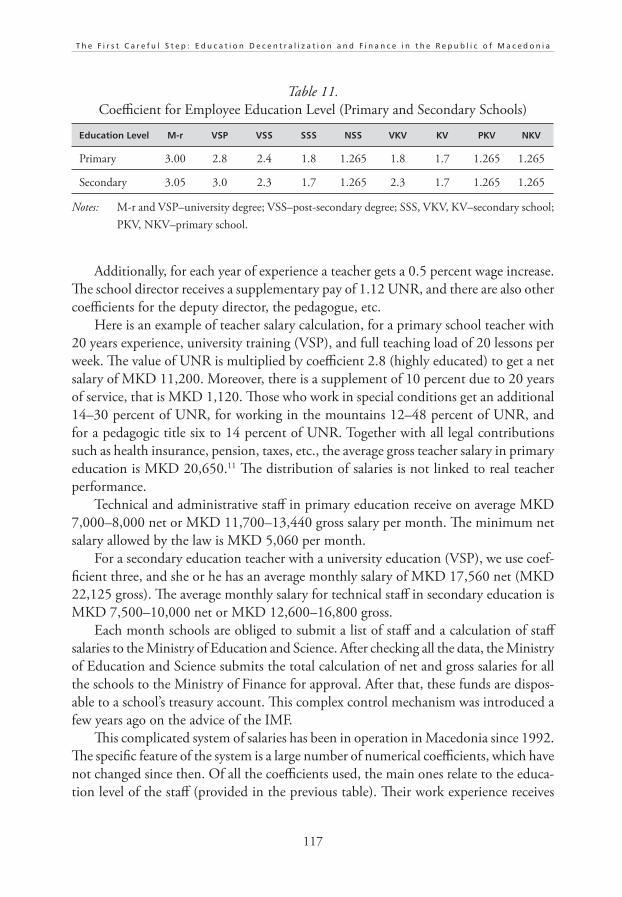
117
T h e F i r s t C a r e f u l S t e p : E d u c a t i o n D e c e n t r a l i z a t i o n a n d F i n a n c e i n t h e R e p u b l i c o f M a c e d o n i a
Table 11.
Coefficient for Employee Education Level (Primary and Secondary Schools)
Education Level M-r VSP VSS SSS NSS VKV KV PKV NKV
Primary 3.00 2.8 2.4 1.8 1.265 1.8 1.7 1.265 1.265
Secondary 3.05 3.0 2.3 1.7 1.265 2.3 1.7 1.265 1.265
Notes: M-r and VSP–university degree; VSS–post-secondary degree; SSS, VKV, KV–secondary school;
PKV, NKV–primary school.
Additionally, for each year of experience a teacher gets a 0.5 percent wage increase.
The school director receives a supplementary pay of 1.12 UNR, and there are also other
coefficients for the deputy director, the pedagogue, etc.
Here is an example of teacher salary calculation, for a primary school teacher with
20 years experience, university training (VSP), and full teaching load of 20 lessons per
week. The value of UNR is multiplied by coefficient 2.8 (highly educated) to get a net
salary of MKD 11,200. Moreover, there is a supplement of 10 percent due to 20 years
of service, that is MKD 1,120. Those who work in special conditions get an additional
14–30 percent of UNR, for working in the mountains 12–48 percent of UNR, and
for a pedagogic title six to 14 percent of UNR. Together with all legal contributions
such as health insurance, pension, taxes, etc., the average gross teacher salary in primary
education is MKD 20,650.11 The distribution of salaries is not linked to real teacher
performance.
Technical and administrative staff in primary education receive on average MKD
7,000–8,000 net or MKD 11,700–13,440 gross salary per month. The minimum net
salary allowed by the law is MKD 5,060 per month.
For a secondary education teacher with a university education (VSP), we use coef-
ficient three, and she or he has an average monthly salary of MKD 17,560 net (MKD
22,125 gross). The average monthly salary for technical staff in secondary education is
MKD 7,500–10,000 net or MKD 12,600–16,800 gross.
Each month schools are obliged to submit a list of staff and a calculation of staff
salaries to the Ministry of Education and Science. After checking all the data, the Ministry
of Education and Science submits the total calculation of net and gross salaries for all
the schools to the Ministry of Finance for approval. After that, these funds are dispos-
able to a school’s treasury account. This complex control mechanism was introduced a
few years ago on the advice of the IMF.
This complicated system of salaries has been in operation in Macedonia since 1992.
The specific feature of the system is a large number of numerical coefficients, which have
not changed since then. Of all the coefficients used, the main ones relate to the educa-
tion level of the staff (provided in the previous table). Their work experience receives
118
P U B L I C M O N E Y F O R P U B L I C S C H O O L S
a very low weight, and therefore the teacher salaries do not change much during their
professional careers. The school director receives about 40 percent more than an average
teacher. The main change introduced in recent years into the system was the increase of
UNR. In the last 11 years, the value of UNR was changed only once, in 2002.
Goods and Services
Until 2005, funds for maintenance (good and services) had to be planned and allocated
according to criteria prepared by the departments for planning of the ministry. Because
of the restrictive budget policy, there was not enough money to cover the real needs of
schools, and debts regularly became a problem. The previous year’s spending was also
taken into account during the process of planning, as the starting point for possible
incremental changes.
In primary education, electricity, water, taxes, city rent, and communal expenses had
been fully paid monthly after the receipt of the invoices by the schools. In secondary
education, the ministry covered only part of the expenses, using criteria such as space,
and classes, while the rest was covered by the schools’ own incomes (on average around
20 percent).
Heating costs were planned and paid according to the school space (square meters),
number of shifts (1, 1.5, 2, 2.5, or 3),12 type of heating (wood, oil, coal, central heating),
and current prices. The allocation was based on norms defined and maintained by
MoES, often defined in kind (liters of heating oil, cubic meters of wood), and classifying
of schools based on the number of shifts. Of course, those norms cannot and do not
depend on key factors, which in reality influence the heating costs, such as the quality
of windows, and the control over keeping the windows closed.
Other costs like telephone, post, office supplies, teaching materials, tools, cleaning
materials, etc., are allocated to schools on the basis of the number of classes.
Transfers (Student Transport and Accommodation)
Transport is organized only for primary school students who live more than two kilo-
meters from school.
Schools select the transportation company (the best offer in the tender organized
by the school) and sign the contracts. Every month they submit to the ministry the
number of students transported, distance, and transport costs, on the basis of invoices
received. The ministry paid those invoices. Since 2005, this responsibility was transferred
to municipalities. On average, 20,000 students are transported every month. The costs
depend on the distance, but average costs are MKD 1,000 per student monthly.
Moreover, there are 14 dormitories in the primary education system. On average,
300 students are accommodated every school year. About 200 students use dormito-
ries, while about 100 students are residents in households (with families taking care of
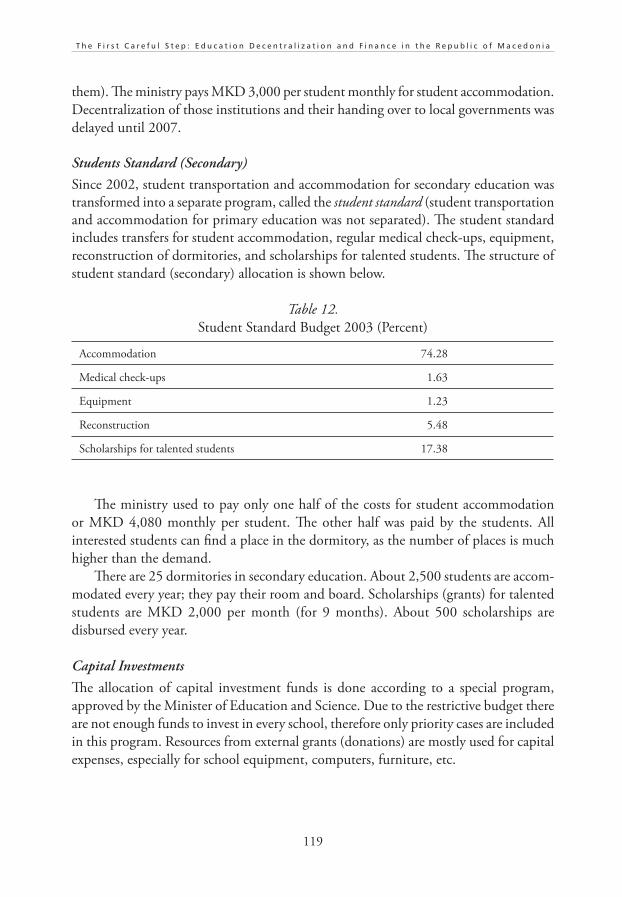
119
T h e F i r s t C a r e f u l S t e p : E d u c a t i o n D e c e n t r a l i z a t i o n a n d F i n a n c e i n t h e R e p u b l i c o f M a c e d o n i a
them). The ministry pays MKD 3,000 per student monthly for student accommodation.
Decentralization of those institutions and their handing over to local governments was
delayed until 2007.
Students Standard (Secondary)
Since 2002, student transportation and accommodation for secondary education was
transformed into a separate program, called the student standard (student transportation
and accommodation for primary education was not separated). The student standard
includes transfers for student accommodation, regular medical check-ups, equipment,
reconstruction of dormitories, and scholarships for talented students. The structure of
student standard (secondary) allocation is shown below.
Table 12.
Student Standard Budget 2003 (Percent)
Accommodation 74.28
Medical check-ups 1.63
Equipment 1.23
Reconstruction 5.48
Scholarships for talented students 17.38
The ministry used to pay only one half of the costs for student accommodation
or MKD 4,080 monthly per student. The other half was paid by the students. All
interested students can find a place in the dormitory, as the number of places is much
higher than the demand.
There are 25 dormitories in secondary education. About 2,500 students are accom-
modated every year; they pay their room and board. Scholarships (grants) for talented
students are MKD 2,000 per month (for 9 months). About 500 scholarships are
disbursed every year.
Capital Investments
The allocation of capital investment funds is done according to a special program,
approved by the Minister of Education and Science. Due to the restrictive budget there
are not enough funds to invest in every school, therefore only priority cases are included
in this program. Resources from external grants (donations) are mostly used for capital
expenses, especially for school equipment, computers, furniture, etc.
120
P U B L I C M O N E Y F O R P U B L I C S C H O O L S
Problems of External Efficiency
The description of financing procedures highlights some serious problems of the external
efficiency of Macedonian education. There are no built-in mechanisms that control the
spending of the schools. Since the effort to save can only be made at the local level, but
the savings accrue at the central level, the schools do not cooperate with the ministry in
this respect. For instance, if the schools manage to use less heating oil than prescribed
by the norms (see above), the ministry will just need to pay less. If the school uses more
heating oil than planned, MoES will cover the bill.
The lack of incentives to improve efficiency is also seen in the large number of
expenditure items that are paid by MoES based on received invoices. The schools
have no interest in, for instance, shutting down all its electrical equipment in order to
decrease electricity costs.
The main non-salary expenditure item is heating, and it is here that the lack of
efficiency mechanisms can be most dramatically seen. The allocation of funds is based
on the surface of heated space, and therefore the school has no interest in reducing this
space even if student numbers are decreasing. Over years, this has led to some very inef-
ficient uses of school space, with very large rural schools serving a handful of students
(see below).
The situation is slightly better with the secondary schools, which do pay a proportion
of maintenance costs (about 20 percent) in a sort of co-financing scheme. This makes
the schools more sensitive to efficiency issues.
Internal Efficiency of Macedonian Education
The discussion of the internal efficiency of the education system, that is, of how efficient
the system is in keeping the students in the schools once enrolled, is always difficult
because it requires careful analysis of what happens to the student cohort over years.
In the case of Macedonian education, we are able to make some estimates about the
primary education for the whole country, and they also are broken down by the language
of instruction for the two main ethnic communities, Macedonians and Albanians. This
approach allows us to disregard the problems of students changing schools. For this
analysis we have used student numbers by grade, as shown in the following tables:
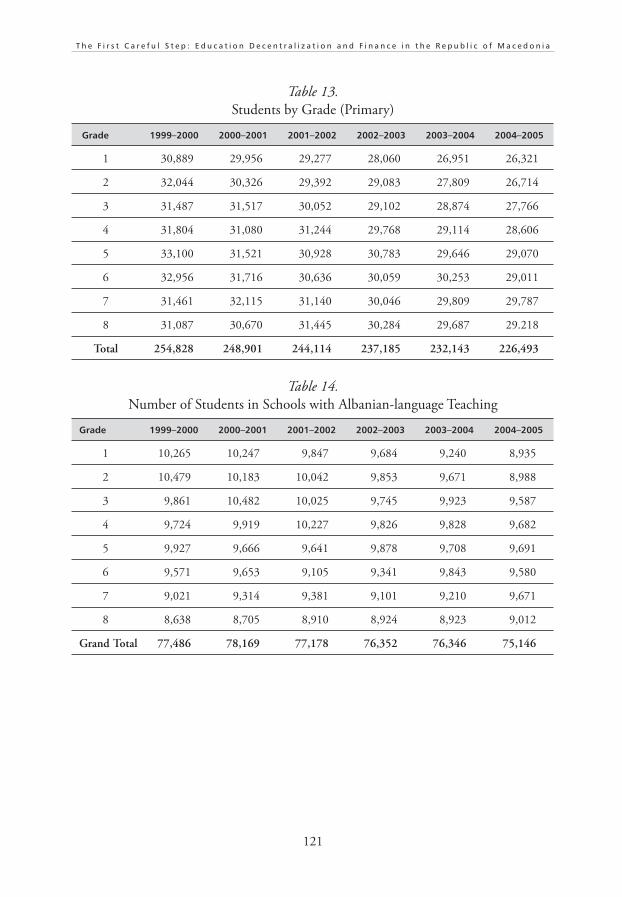
121
T h e F i r s t C a r e f u l S t e p : E d u c a t i o n D e c e n t r a l i z a t i o n a n d F i n a n c e i n t h e R e p u b l i c o f M a c e d o n i a
Table 13.
Students by Grade (Primary)
Grade 1999–2000 2000–2001 2001–2002 2002–2003 2003–2004 2004–2005
1 30,889 29,956 29,277 28,060 26,951 26,321
2 32,044 30,326 29,392 29,083 27,809 26,714
3 31,487 31,517 30,052 29,102 28,874 27,766
4 31,804 31,080 31,244 29,768 29,114 28,606
5 33,100 31,521 30,928 30,783 29,646 29,070
6 32,956 31,716 30,636 30,059 30,253 29,011
7 31,461 32,115 31,140 30,046 29,809 29,787
8 31,087 30,670 31,445 30,284 29,687 29.218
Total 254,828 248,901 244,114 237,185 232,143 226,493
Table 14.
Number of Students in Schools with Albanian-language Teaching
Grade 1999–2000 2000–2001 2001–2002 2002–2003 2003–2004 2004–2005
1 10,265 10,247 9,847 9,684 9,240 8,935
2 10,479 10,183 10,042 9,853 9,671 8,988
3 9,861 10,482 10,025 9,745 9,923 9,587
4 9,724 9,919 10,227 9,826 9,828 9,682
5 9,927 9,666 9,641 9,878 9,708 9,691
6 9,571 9,653 9,105 9,341 9,843 9,580
7 9,021 9,314 9,381 9,101 9,210 9,671
8 8,638 8,705 8,910 8,924 8,923 9,012
Grand Total 77,486 78,169 77,178 76,352 76,346 75,146
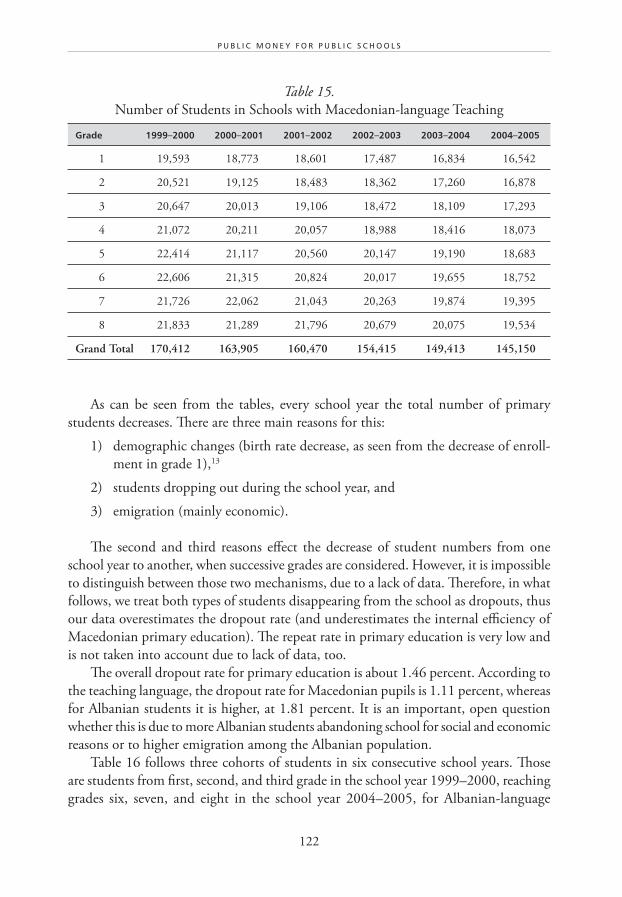
122
P U B L I C M O N E Y F O R P U B L I C S C H O O L S
Table 15.
Number of Students in Schools with Macedonian-language Teaching
Grade 1999–2000 2000–2001 2001–2002 2002–2003 2003–2004 2004–2005
1 19,593 18,773 18,601 17,487 16,834 16,542
2 20,521 19,125 18,483 18,362 17,260 16,878
3 20,647 20,013 19,106 18,472 18,109 17,293
4 21,072 20,211 20,057 18,988 18,416 18,073
5 22,414 21,117 20,560 20,147 19,190 18,683
6 22,606 21,315 20,824 20,017 19,655 18,752
7 21,726 22,062 21,043 20,263 19,874 19,395
8 21,833 21,289 21,796 20,679 20,075 19,534
Grand Total 170,412 163,905 160,470 154,415 149,413 145,150
As can be seen from the tables, every school year the total number of primary
students decreases. There are three main reasons for this:
1) demographic changes (birth rate decrease, as seen from the decrease of enroll-
ment in grade 1),13
2) students dropping out during the school year, and
3) emigration (mainly economic).
The second and third reasons effect the decrease of student numbers from one
school year to another, when successive grades are considered. However, it is impossible
to distinguish between those two mechanisms, due to a lack of data. Therefore, in what
follows, we treat both types of students disappearing from the school as dropouts, thus
our data overestimates the dropout rate (and underestimates the internal efficiency of
Macedonian primary education). The repeat rate in primary education is very low and
is not taken into account due to lack of data, too.
The overall dropout rate for primary education is about 1.46 percent. According to
the teaching language, the dropout rate for Macedonian pupils is 1.11 percent, whereas
for Albanian students it is higher, at 1.81 percent. It is an important, open question
whether this is due to more Albanian students abandoning school for social and economic
reasons or to higher emigration among the Albanian population.
Table 16 follows three cohorts of students in six consecutive school years. Those
are students from first, second, and third grade in the school year 1999–2000, reaching
grades six, seven, and eight in the school year 2004–2005, for Albanian-language
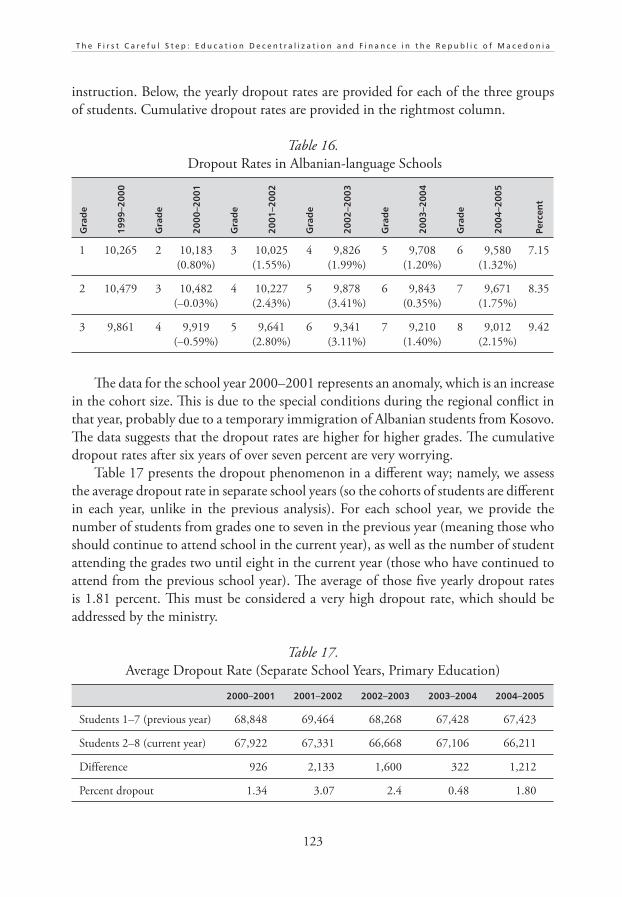
123
T h e F i r s t C a r e f u l S t e p : E d u c a t i o n D e c e n t r a l i z a t i o n a n d F i n a n c e i n t h e R e p u b l i c o f M a c e d o n i a
instruction. Below, the yearly dropout rates are provided for each of the three groups
of students. Cumulative dropout rates are provided in the rightmost column.
Table 16.
Dropout Rates in Albanian-language Schools
Gra
de
19
99
–20
00
Gra
de
20
00
–20
01
Gra
de
20
01
–20
02
Gra
de
20
02
–20
03
Gra
de
20
03
–20
04
Gra
de
20
04
–20
05
Perc
ent
1 10,265 2 10,183
(0.80%)
3 10,025
(1.55%)
4 9,826
(1.99%)
5 9,708
(1.20%)
6 9,580
(1.32%)
7.15
2 10,479 3 10,482
(–0.03%)
4 10,227
(2.43%)
5 9,878
(3.41%)
6 9,843
(0.35%)
7 9,671
(1.75%)
8.35
3 9,861 4 9,919
(–0.59%)
5 9,641
(2.80%)
6 9,341
(3.11%)
7 9,210
(1.40%)
8 9,012
(2.15%)
9.42
The data for the school year 2000–2001 represents an anomaly, which is an increase
in the cohort size. This is due to the special conditions during the regional conflict in
that year, probably due to a temporary immigration of Albanian students from Kosovo.
The data suggests that the dropout rates are higher for higher grades. The cumulative
dropout rates after six years of over seven percent are very worrying.
Table 17 presents the dropout phenomenon in a different way; namely, we assess
the average dropout rate in separate school years (so the cohorts of students are different
in each year, unlike in the previous analysis). For each school year, we provide the
number of students from grades one to seven in the previous year (meaning those who
should continue to attend school in the current year), as well as the number of student
attending the grades two until eight in the current year (those who have continued to
attend from the previous school year). The average of those five yearly dropout rates
is 1.81 percent. This must be considered a very high dropout rate, which should be
addressed by the ministry.
Table 17.
Average Dropout Rate (Separate School Years, Primary Education)
2000–2001 2001–2002 2002–2003 2003–2004 2004–2005
Students 1–7 (previous year) 68,848 69,464 68,268 67,428 67,423
Students 2–8 (current year) 67,922 67,331 66,668 67,106 66,211
Difference 926 2,133 1,600 322 1,212
Percent dropout 1.34 3.07 2.4 0.48 1.80
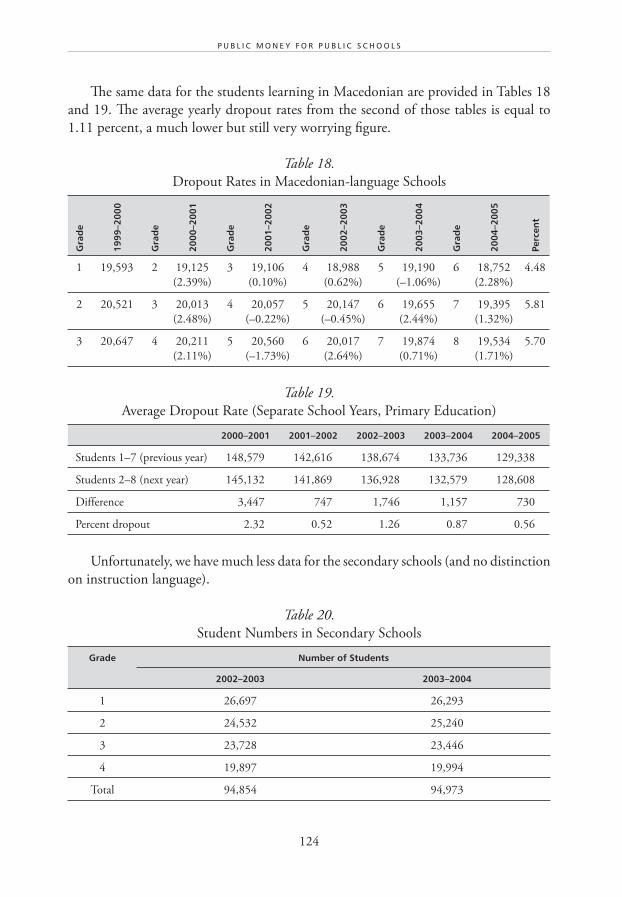
124
P U B L I C M O N E Y F O R P U B L I C S C H O O L S
The same data for the students learning in Macedonian are provided in Tables 18
and 19. The average yearly dropout rates from the second of those tables is equal to
1.11 percent, a much lower but still very worrying figure.
Table 18.
Dropout Rates in Macedonian-language Schools
Gra
de
19
99
–20
00
Gra
de
20
00
–20
01
Gra
de
20
01
–20
02
Gra
de
20
02
–20
03
Gra
de
20
03
–20
04
Gra
de
20
04
–20
05
Perc
ent
1 19,593 2 19,125
(2.39%)
3 19,106
(0.10%)
4 18,988
(0.62%)
5 19,190
(–1.06%)
6 18,752
(2.28%)
4.48
2 20,521 3 20,013
(2.48%)
4 20,057
(–0.22%)
5 20,147
(–0.45%)
6 19,655
(2.44%)
7 19,395
(1.32%)
5.81
3 20,647 4 20,211
(2.11%)
5 20,560
(–1.73%)
6 20,017
(2.64%)
7 19,874
(0.71%)
8 19,534
(1.71%)
5.70
Table 19.
Average Dropout Rate (Separate School Years, Primary Education)
2000–2001 2001–2002 2002–2003 2003–2004 2004–2005
Students 1–7 (previous year) 148,579 142,616 138,674 133,736 129,338
Students 2–8 (next year) 145,132 141,869 136,928 132,579 128,608
Difference 3,447 747 1,746 1,157 730
Percent dropout 2.32 0.52 1.26 0.87 0.56
Unfortunately, we have much less data for the secondary schools (and no distinction
on instruction language).
Table 20.
Student Numbers in Secondary Schools
Grade Number of Students
2002–2003 2003–2004
1 26,697 26,293
2 24,532 25,240
3 23,728 23,446
4 19,897 19,994
Total 94,854 94,973
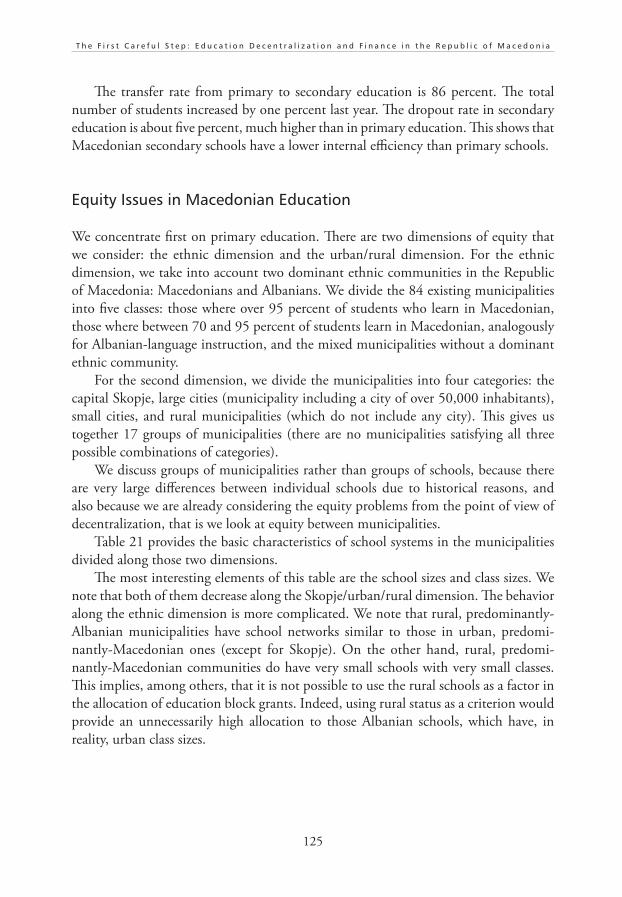
125
T h e F i r s t C a r e f u l S t e p : E d u c a t i o n D e c e n t r a l i z a t i o n a n d F i n a n c e i n t h e R e p u b l i c o f M a c e d o n i a
The transfer rate from primary to secondary education is 86 percent. The total
number of students increased by one percent last year. The dropout rate in secondary
education is about five percent, much higher than in primary education. This shows that
Macedonian secondary schools have a lower internal efficiency than primary schools.
Equity Issues in Macedonian Education
We concentrate first on primary education. There are two dimensions of equity that
we consider: the ethnic dimension and the urban/rural dimension. For the ethnic
dimension, we take into account two dominant ethnic communities in the Republic
of Macedonia: Macedonians and Albanians. We divide the 84 existing municipalities
into five classes: those where over 95 percent of students who learn in Macedonian,
those where between 70 and 95 percent of students learn in Macedonian, analogously
for Albanian-language instruction, and the mixed municipalities without a dominant
ethnic community.
For the second dimension, we divide the municipalities into four categories: the
capital Skopje, large cities (municipality including a city of over 50,000 inhabitants),
small cities, and rural municipalities (which do not include any city). This gives us
together 17 groups of municipalities (there are no municipalities satisfying all three
possible combinations of categories).
We discuss groups of municipalities rather than groups of schools, because there
are very large differences between individual schools due to historical reasons, and
also because we are already considering the equity problems from the point of view of
decentralization, that is we look at equity between municipalities.
Table 21 provides the basic characteristics of school systems in the municipalities
divided along those two dimensions.
The most interesting elements of this table are the school sizes and class sizes. We
note that both of them decrease along the Skopje/urban/rural dimension. The behavior
along the ethnic dimension is more complicated. We note that rural, predominantly-
Albanian municipalities have school networks similar to those in urban, predomi-
nantly-Macedonian ones (except for Skopje). On the other hand, rural, predomi-
nantly-Macedonian communities do have very small schools with very small classes.
This implies, among others, that it is not possible to use the rural schools as a factor in
the allocation of education block grants. Indeed, using rural status as a criterion would
provide an unnecessarily high allocation to those Albanian schools, which have, in
reality, urban class sizes.
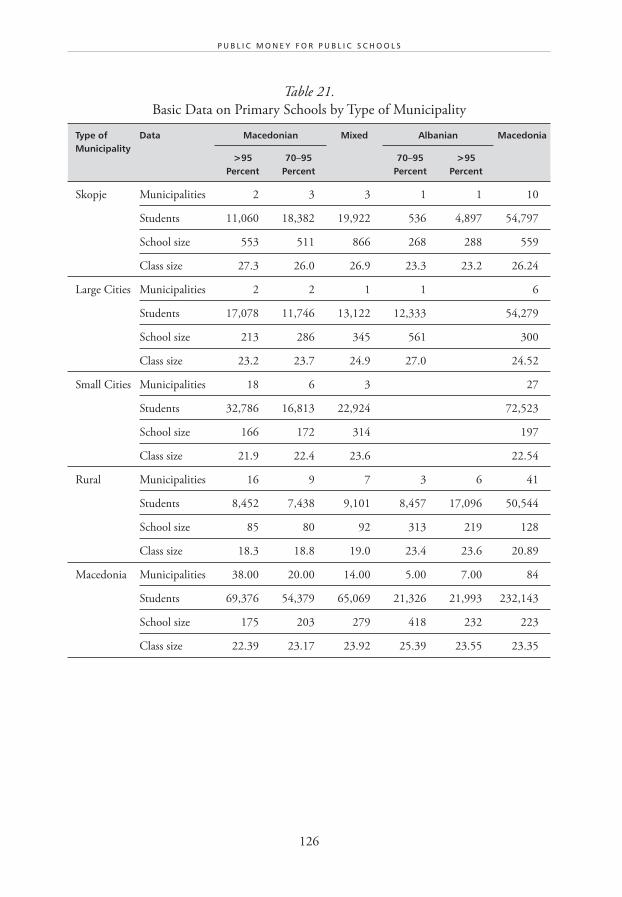
126
P U B L I C M O N E Y F O R P U B L I C S C H O O L S
Table 21.
Basic Data on Primary Schools by Type of Municipality
Type of Municipality
Data Macedonian Mixed Albanian Macedonia
>95 Percent
70–95 Percent
70–95 Percent
>95 Percent
Skopje Municipalities 2 3 3 1 1 10
Students 11,060 18,382 19,922 536 4,897 54,797
School size 553 511 866 268 288 559
Class size 27.3 26.0 26.9 23.3 23.2 26.24
Large Cities Municipalities 2 2 1 1 6
Students 17,078 11,746 13,122 12,333 54,279
School size 213 286 345 561 300
Class size 23.2 23.7 24.9 27.0 24.52
Small Cities Municipalities 18 6 3 27
Students 32,786 16,813 22,924 72,523
School size 166 172 314 197
Class size 21.9 22.4 23.6 22.54
Rural Municipalities 16 9 7 3 6 41
Students 8,452 7,438 9,101 8,457 17,096 50,544
School size 85 80 92 313 219 128
Class size 18.3 18.8 19.0 23.4 23.6 20.89
Macedonia Municipalities 38.00 20.00 14.00 5.00 7.00 84
Students 69,376 54,379 65,069 21,326 21,993 232,143
School size 175 203 279 418 232 223
Class size 22.39 23.17 23.92 25.39 23.55 23.35
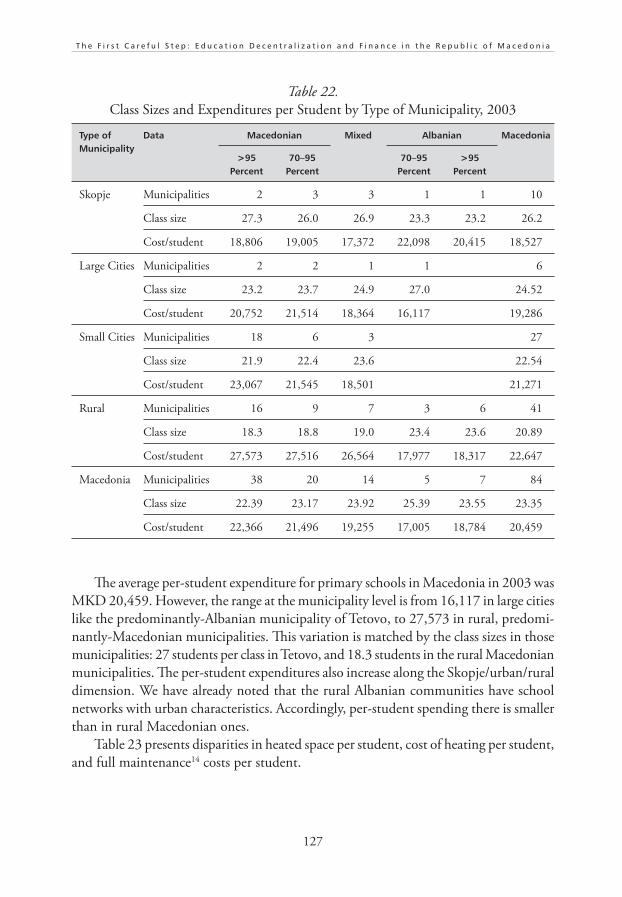
127
T h e F i r s t C a r e f u l S t e p : E d u c a t i o n D e c e n t r a l i z a t i o n a n d F i n a n c e i n t h e R e p u b l i c o f M a c e d o n i a
Table 22.
Class Sizes and Expenditures per Student by Type of Municipality, 2003
Type of Municipality
Data Macedonian Mixed Albanian Macedonia
>95 Percent
70–95 Percent
70–95 Percent
>95 Percent
Skopje Municipalities 2 3 3 1 1 10
Class size 27.3 26.0 26.9 23.3 23.2 26.2
Cost/student 18,806 19,005 17,372 22,098 20,415 18,527
Large Cities Municipalities 2 2 1 1 6
Class size 23.2 23.7 24.9 27.0 24.52
Cost/student 20,752 21,514 18,364 16,117 19,286
Small Cities Municipalities 18 6 3 27
Class size 21.9 22.4 23.6 22.54
Cost/student 23,067 21,545 18,501 21,271
Rural Municipalities 16 9 7 3 6 41
Class size 18.3 18.8 19.0 23.4 23.6 20.89
Cost/student 27,573 27,516 26,564 17,977 18,317 22,647
Macedonia Municipalities 38 20 14 5 7 84
Class size 22.39 23.17 23.92 25.39 23.55 23.35
Cost/student 22,366 21,496 19,255 17,005 18,784 20,459
The average per-student expenditure for primary schools in Macedonia in 2003 was
MKD 20,459. However, the range at the municipality level is from 16,117 in large cities
like the predominantly-Albanian municipality of Tetovo, to 27,573 in rural, predomi-
nantly-Macedonian municipalities. This variation is matched by the class sizes in those
municipalities: 27 students per class in Tetovo, and 18.3 students in the rural Macedonian
municipalities. The per-student expenditures also increase along the Skopje/urban/rural
dimension. We have already noted that the rural Albanian communities have school
networks with urban characteristics. Accordingly, per-student spending there is smaller
than in rural Macedonian ones.
Table 23 presents disparities in heated space per student, cost of heating per student,
and full maintenance14 costs per student.
128
P U B L I C M O N E Y F O R P U B L I C S C H O O L S
Table 23.
Utilities and Maintenance15 Costs per Student, 2003
Type of Municipality
Data Macedonian Mixed Albanian Macedonia
>95 Percent
70–95 Percent
70–95 Percent
>95 Percent
Skopje Municipalities 2 3 3 1 1 10
Heated space
for students
5.54 5.42 4.41 2.65 2.77 4.81
Heating cost/
student
1,362 1,974 1,588 1,000 760 1,592
Maintenance/
student
5,057 3,980 3,199 2,388 1,042 3,635
Large Cities Municipalities 2 2 1 1 6
Heated space
for students
4.13 4.58 3.37 2.04 3.57
Heating cost/
student
1,086 1,321 878 694 997
Maintenance/
student
2,210 3,863 1,210 857 2,018
Small Cities Municipalities 18 6 3 27
Heated space
for students
5.39 3.22 2.94 4.11
Heating cost/
student
1,311 2,245 804 1,136
Maintenance/
student
2,504 1,309 1,035 1,763
Rural Municipalities 16 9 7 3 6 41
Heated space
for students
4.28 4.40 4.00 2.39 2.03 3.17
Heating cost
per student
1,114 1,211 964 721 568 851
Maintenance
per student
2,076 1,705 1,424 753 612 1,188
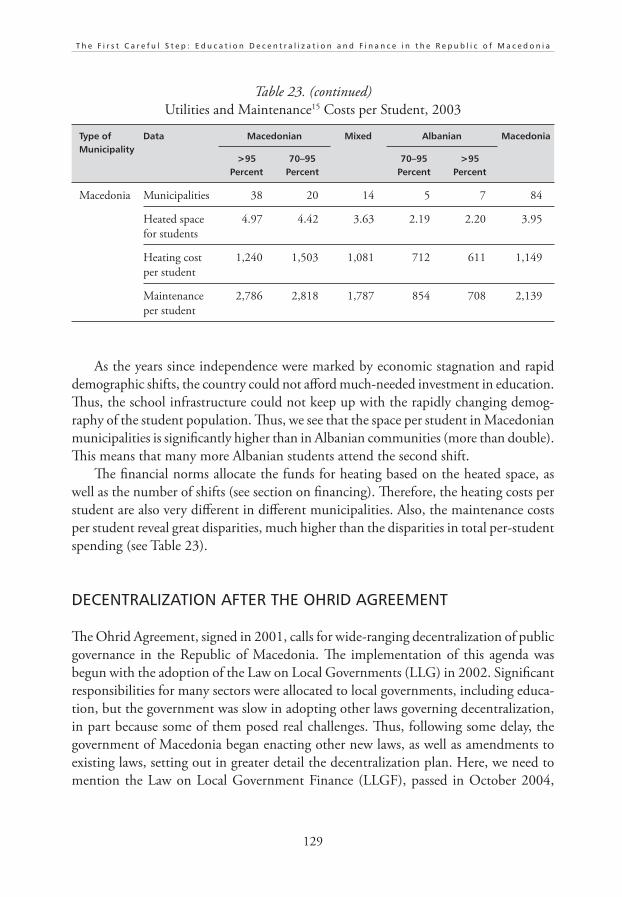
129
T h e F i r s t C a r e f u l S t e p : E d u c a t i o n D e c e n t r a l i z a t i o n a n d F i n a n c e i n t h e R e p u b l i c o f M a c e d o n i a
Type of Municipality
Data Macedonian Mixed Albanian Macedonia
>95 Percent
70–95 Percent
70–95 Percent
>95Percent
Macedonia Municipalities 38 20 14 5 7 84
Heated space
for students
4.97 4.42 3.63 2.19 2.20 3.95
Heating cost
per student
1,240 1,503 1,081 712 611 1,149
Maintenance
per student
2,786 2,818 1,787 854 708 2,139
As the years since independence were marked by economic stagnation and rapid
demographic shifts, the country could not afford much-needed investment in education.
Thus, the school infrastructure could not keep up with the rapidly changing demog-
raphy of the student population. Thus, we see that the space per student in Macedonian
municipalities is significantly higher than in Albanian communities (more than double).
This means that many more Albanian students attend the second shift.
The financial norms allocate the funds for heating based on the heated space, as
well as the number of shifts (see section on financing). Therefore, the heating costs per
student are also very different in different municipalities. Also, the maintenance costs
per student reveal great disparities, much higher than the disparities in total per-student
spending (see Table 23).
DECENTRALIZATION AFTER THE OHRID AGREEMENT
The Ohrid Agreement, signed in 2001, calls for wide-ranging decentralization of public
governance in the Republic of Macedonia. The implementation of this agenda was
begun with the adoption of the Law on Local Governments (LLG) in 2002. Significant
responsibilities for many sectors were allocated to local governments, including educa-
tion, but the government was slow in adopting other laws governing decentralization,
in part because some of them posed real challenges. Thus, following some delay, the
government of Macedonia began enacting other new laws, as well as amendments to
existing laws, setting out in greater detail the decentralization plan. Here, we need to
mention the Law on Local Government Finance (LLGF), passed in October 2004,
Table 23. (continued)
Utilities and Maintenance15 Costs per Student, 2003
130
P U B L I C M O N E Y F O R P U B L I C S C H O O L S
the amendments to the Law on Primary Education (LPE) and the Law on Secondary
Education (LSE), passed in September 2004. The final law important for education was
the Law on the Territorial Division of Macedonia, passed in November 2004. That law
redefined the municipal boundaries and reduced their number from 124 to 85. Those
laws form the basic legal framework of education decentralization in Macedonia.
Here, we discuss the implications of LLGF and of its specific provisions defining the
phases of fiscal decentralization for the education sector. We also review how education
adapted to this overall decentralization framework. Internal institutional preparations for
education decentralization undertaken by the ministry are the subject of this section.
Character and Phases of Fiscal Decentralization
The Law on Local Governments clearly prescribes to municipalities an important role
in the education sector. Article 22 lists the activities for the performance of which the
municipalities will be responsible. Item 8 of this list defines activities for education:
“establishing, financing and administering of primary and secondary schools, in coopera-
tion with the central government, in accordance with the law; organizing of transporta-
tion of students, and their accommodation in dormitories.” As Levitas (2002) points
out, this is broad language and it is the task of MoES to define in practical, legal terms
the meaning of those responsibilities and the manner in which they will be transferred
to municipalities.
The Law of Local Government Finance adopted in 2004 defines a clear framework
for the finances of local governments in Macedonia. In Articles 4 and 8 it lists the
revenues of local governments as:
1) Own revenues, including:
a) Local taxes (property, on the transfer of property, on inheritance, etc.),
b) Local fees (for placing signs and announcements, for using roads, tourist
fees, for public lighting, for environmental protection, etc.),
c) Local charges (for urbanization of land, for utilization of assets, etc.).
2) Grants from the budget of the Republic of Macedonia and from the Funds:16
a) Income from the personal income tax,
b) Income from value added tax (VAT),
c) Block grants (for financing basic municipal competencies listed in Article
22 of LLGF, that is, education, must be based on a formula using need
indicators),
d) Categorical grants (for financing of specific activities),
131
T h e F i r s t C a r e f u l S t e p : E d u c a t i o n D e c e n t r a l i z a t i o n a n d F i n a n c e i n t h e R e p u b l i c o f M a c e d o n i a
e) Capital grants (for financing investments),
f ) Grants for delegated competencies (for financing a function delegated by
a central administration to a municipality).
Moreover, the LLGF calls for establishing of an Ordinance on the Methodology of
Allocation of Block Grants to municipalities, with formulas for the allocation of block
grants. Thus, it is clear that education responsibilities of municipalities were to be
financed through a block grant, calculated for each local government using a formula
based on indicators of need, reflected by the number of students of schools of various
type and level. We discuss below the types of grants used and the contents of those
ordinances.
LLGF in Articles 44 and 45 also defines the two separate phases of fiscal decen-
tralization. During Phase I, transferred responsibilities were to be financed through
categorical grants, with the exclusion of salaries. The starting date of the first phase was
planned for January 1, 2005, but had to be postponed due to controversies over the
new territorial division and to the postponement of the new local elections (initially
planned for November, then scheduled for March the following year). The start date
was eventually July 1, 2005. The full budgetary responsibility, including the salaries,
was to be passed to the municipalities in the second phase, at least three years later.
The law also included some conditions to be met before the start of the first phase (for
all municipalities together) and of the second phase (for each municipality separately).
The division of the process into two phases and the conditions of beginning each phase
were suggested by the International Monetary Fund, and were motivated by the fear
that poor fiscal management by the municipalities might contribute to an excessive
budget deficit.
Thus, during Phase I, only the responsibilities for maintenance, repairs, and material
expenditures were transferred to the municipalities. Fragmentation of the school budgets
became unavoidable, with the major part (about 90 percent on average MoES) provided
by MoES to every school in the same manner as in the past, while the remaining parts
were provided by municipalities from the categorical grants, supplemented in some
cases by own revenues of the municipalities.
Management and Financing of Decentralized Education
The amendments to the laws on primary and on secondary education provide a detailed
specification of the general transfer of responsibility on “establishing, financing, and
administering of primary and secondary schools” to municipalities, as dictated by the
LLGF. The laws redesign the role of the school board, by allocating it very significant
powers, including the authority to select and dismiss the school director, to set the
132
P U B L I C M O N E Y F O R P U B L I C S C H O O L S
school budget, and to adopt the school statute. The selected candidate is now
appointed by the mayor, in accordance with the LLGF. Parents are assured one-third of
the places on the school board, and the local governments about the same (the remaining
places will be filled by the school employees). The school director, depending on the
school board with which he or she will workclosely, thus becomes a much stronger
function, and what is even more important, a much more stable function. Hopefully,
the very frequent replacement of the school director for transient political reasons
will be stopped.
The new laws also foresee the introduction of a system of licensing of school directors.
This is a welcome step towards better professional preparation of managing cadres in
Macedonian schools, though the new system is not yet clearly defined. What is worrying
is that the laws mandate the almost immediate introduction of the new system (within
less than two years), while the experience of more developed countries (such as national
Headship Qualifications in the United Kingdom) shows that a transition period of five
years or more is very useful.
The key responsibility of the founding organ—in other words, the owner of the
school—is assigned to municipalities (with the exception of special and artistic schools).
The founding rights also include the ownership of school property and the right to open
and close schools, although the latter actions require prior approval of MoES. The transfer
of property ownership to the new school founder is especially complicated because the
legal status of many of those properties was unclear in 2005 and is still in limbo.
Nevertheless, the new laws take into account the phasing of fiscal decentralization,
as defined by the Law on Local Government Finance (LLGF). The main provisions
regarding the founders and the school boards came into force with the beginning of
Phase I. The laws formulate the basic principles of the financing of education (use of
the per-student formula), but do not provide details as to how this may be translated
into a numerical formula.
The Ministry of Education, in its Education Decentralization Strategy (see MoES
2004), also planned to transfer to municipalities in the first phase, together with the
responsibility for maintenance, the responsibility for the salaries of the technical staff
(cleaners, guards, gardeners, drivers, operators of the heating systems, and the like).
Such a move partially breaks with the fragmentation of education finance, by linking
the maintenance functions with the salaries of people responsible for carrying out those
functions. Moreover, as seen from the earlier analysis, it is the variation of technical
staff between the schools and between the municipalities that is one of the most diffi-
cult equity issues in Macedonian education. MoES entered into negotiations with the
Ministry of Finance over this provision of LLGF, which is in contradiction with the
MoES decentralization strategy, but without success.
The amended laws on education also allocate to municipalities the responsibility for
organizing the transportation of students to schools, in line with Article 22 of LLGF.
133
T h e F i r s t C a r e f u l S t e p : E d u c a t i o n D e c e n t r a l i z a t i o n a n d F i n a n c e i n t h e R e p u b l i c o f M a c e d o n i a
However, the municipalities may delegate this responsibility to schools, and thus decide
to continue with the present system of schools organizing the transportation tenders
themselves.
As described in the previous section, decentralization was planned to begin on July 1,
2005, in the middle of the fiscal year. This made planning the new financing mechanisms
difficult, and in particular called for a half-year transition until the end of 2005.
For the transition half-year period until the end of fiscal year 2005, it was assumed
that it would not be preferable to use a per-student formula to allocate the education
funds to municipalities, because the maintenance plans of schools had already been
approved and were in the middle of being executed. Therefore, the ministry thought of
using those plans as a basis for the allocation of categorical grants, on the assumption
that this would not lead to a contradiction with the newly amended education laws.
The main difficulty with this plan was that education institutions regularly run end-
of-year deficits, paid off with the new year’s allocation. This, in turn, has led to new
debts accumulating during the current fiscal year. When the decentralization process
started, MoES could not clean the debt situation and transfer to municipalities only the
responsibility for current expenditures. Two difficult problems appeared: how to assess
the level of debt to be paid off, and how to find the funds to pay off this debt.
For the first phase of education decentralization, the ministry prepared a per-student
allocation formula to municipalities. A number of factors were considered for use in the
formula and then rejected, such as rural school students (because some rural communi-
ties are very large and have city-like structure of school networks). The main objective
indicator, which seemed compatible with the historical allocation patterns, was popula-
tion density. The setting of budgets of individual schools became the responsibility of
the municipalities, though closely monitored by the ministry.
For the second phase, the allocation formula will almost certainly have to change,
because the present distribution patterns of maintenance expenditures and of full school
expenditures are quite different. However, the Ministry will be able to use the experience
gained during the first phase and to adjust its formula approach accordingly.
Finally, we return to the issues of external efficiency of the education system in
Macedonia, as discussed above in the context of centralized system. There are two ways
in which decentralization can contribute to introducing efficiency mechanisms:
1) Local governments, closely monitoring the expenditures of their schools, will be
able to assess the impact on investment in better windows and roofs on heating
expenses, and will therefore be able to lower the current costs through good
investment and maintenance of schools.
2) The allocation formula, based primarily on student numbers, will put pressure
on the local governments to adjust the school network to the demographic
shifts.
134
P U B L I C M O N E Y F O R P U B L I C S C H O O L S
Preparations of the Ministry
MoES carefully prepared the first phase of decentralization and set up an analytical
unit to gather, for the first time, all enrollment and financial data about all Macedonian
schools, primary and secondary. The unit began producing reviews and analysis, as well
as supporting the activities of other sectors of MoES.
Subsequently, MoES prepared for the technical and legal work necessary to transfer
the ownership of school facilities to municipalities. Here, a compromise had to be found
between the desire to transfer the ownership as soon as possible and the necessity to
clarify the ownership status of the properties.
Following the adoption of the laws, MoES prepared a series of bylaws and ordinances
to define the practical steps and procedures necessary to manage the decentralized educa-
tion sector. The main open and difficult issue here was how to define the responsibilities
of municipalities with respect to their schools in the sphere of maintenance. Before 2005,
many of the norms and prescriptions concerning school equipment were not met in the
schools because the requirements were unrealistically high. The challenge was how to
adjust the requirements and make them easier to be implemented, but not retreat from
higher education standards. Finally, it was not very clear what legal mechanisms were
needed to enforce the standards defined in the ordinances passed by the ministry.
A new per-student allocation formula to define the block grants to municipalities was
prepared, simulated, and discussed within the ministry. The analytical unit prepared a
computer tool to perform those simulations and to analyze the impact of various alloca-
tion scenarios. The simulations were presented and discussed with other ministries.
Open Problems
Despite the fact that Macedonia adopted a carefully prepared set of legal laws, and that
the Ministry of Education and Science made some significant internal preparations for
decentralization, there remained significant open problems that MoES could not address
before starting the decentralization process. Some of them were:
1) No significant work on raising the education management capacities of the
municipalities was implemented. The local elections brought changes in the
composition of local councils, but the new local leaders did not have sufficient
experience and understanding of the complex problems in the education
sphere.
2) An analogous problem appeared for the new members of the school boards.
The long and rich history of strong school boards in Macedonia suffered a
135
T h e F i r s t C a r e f u l S t e p : E d u c a t i o n D e c e n t r a l i z a t i o n a n d F i n a n c e i n t h e R e p u b l i c o f M a c e d o n i a
15-year break, and it was not at all clear that the people with the experience
and the skills would be selected to the school boards. Moreover, those may have
been somewhat different skills, given the very different political and economic
context of managing schools in what was Socialist Yugoslavia and the present.
The ministry prepared a written guidebook for their members, but it proved to
be insufficient for increasing the capacity of the boards.
3) The rationalization of rural schools was a very difficult problem for many reasons.
The sharing of responsibility for schools between municipalities (maintenance)
and the ministry (salaries) during the first phase of decentralization made the
resolution of those conflicts even more difficult.
4) The municipalities will also become the founders of the secondary schools, and
this will pose a number of even more difficult planning and coordination issues.
The vocational schools, especially, will need restructuring in accordance with the
needs of the labor market, which will in all cases extend far beyond the bound-
aries of the municipalities. Also here MoES and the municipalities will need
to learn to cooperate, rather than quarrel, and the ministry should already be
planning proper mechanisms and procedures for this necessary cooperation.
5) There were no mechanisms in place to protect the schools serving ethnic commu-
nities who are subject to discrimination by the local majority, both financial
and managerial.
THE FIRST PHASE (2005–2007)
In the present section we summarize the experience of the first phase of education
decentralization in Macedonia. We also include some preliminary comments on the
pilot phase for the second phase of decentralization, which began in mid-2007 in
selected municipalities (about 10 were considered ready to be included in this pilot).
Here, we describe what has happened and then describe the use of categorical and
block grants in education, and a more technical description of the allocation formulas
for categorical grants for school maintenance in 2006 and 2007. Finally, we provide
some assessment of the situation and the lessons drawn. This part is heavily based on
reports by Jan Herczynski, Challenges of the Second Phase of Education Decentralization
in Macedonia and Towards the Formula for Block Grants in Macedonia, written in 2007
for the USAID-funded project Making Decentralization Work (MDW).
136
P U B L I C M O N E Y F O R P U B L I C S C H O O L S
The First Phase
The first phase of education decentralization in the Republic of Macedonia started on
July 1, 2005. Long preparations for decentralization undertaken by the Macedonian
Ministry of Education and Science (MoES) included the adoption of a strategy for educa-
tion decentralization in June 2004, and significant amendments to the Law on Primary
Education and the Law on Secondary Education,17 passed by Macedonian Parliament
in September 2004. MoES has transferred complete responsibility for school mainte-
nance and student transportation to local governments, while retaining responsibility
for teacher and non-teacher salaries.18
Simultaneously, the Ministry of Finance prepared the basic framework of fiscal decen-
tralization in the Law of Local Government Finance (LLGF), adopted by Macedonian
Parliament in August 2004. This framework includes:
1) A schedule for fiscal decentralization, including its division into two phases
(phase I—maintenance, and phase II—salaries).
2) New types of intergovernmental transfers, namely categorical grants for phase I
and block grants for phase II, to finance decentralized functions to local govern-
ments.
3) Responsibility of the line ministries to monitor the effective use of categorical
and block grants.
Initially, the starting date for decentralization was planned for January 1, 2005,
but there were delays due to political processes, especially the disputes surrounding
the consolidation of Macedonian municipalities in 2004 (including a referendum on
the issue in October 2004). Eventually, the government of Macedonia decided that, in
order to limit the delays, the first phase would be postponed not by one year, but only
by half a year. That is why the first phase began in the middle of the fiscal year of 2005.
This was not an easy beginning. Some difficulties that appeared may be formulated as
follows:
1) Central government did not pay old school debts,19 so the courts were still
demanding the schools and municipalities pay their creditors.
2) There was no effective financial monitoring tools and corrective procedures at
the disposal of Ministry of Education and Science. Consequently, the ministry
was unable to respond to various cases of mismanagement.
3) The schools were transferred to municipalities in varied technical conditions
and with very different levels of equipment. Many municipalities are unable to
improve those conditions.
137
T h e F i r s t C a r e f u l S t e p : E d u c a t i o n D e c e n t r a l i z a t i o n a n d F i n a n c e i n t h e R e p u b l i c o f M a c e d o n i a
4) The transfer to municipalities of ownership of school properties was delayed
and remains incomplete. Unclear conditions of many of the properties are a
barrier to rapid progress.
5) MoES still has not defined the new normative on school conditions and equip-
ment, so the exact responsibilities of municipalities are not clearly defined.20
6) The allocation formula for categorical grants has not been subject of public
debate and there are still many misconceptions and uncertainties regarding it.
7) There are three categorical grants: for maintenance of primary and secondary
schools, and for student transport. This increases the complexity of the alloca-
tion formulas and reduces the freedom of local governments to manage their
school networks.
Moreover, some problems were a direct result of the start of decentralization in the
middle of the fiscal year. The definition of the pool for education categorical grants in
2005 was difficult because of seasonal variation of education expenditures; consequently
many municipalities considered that they have received insufficient funding. Also, the
detailed registration of school debts incurred in 2005 prior to July was made more
difficult.21 Those problems, of course, were relevant only in 2005.
Categorical and Block Grants
The Law on Local Government Finance of 2004 foresees two types of grants that
can be used to finance activities decentralized to local governments: categorical and
block grants. The categorical grants are used to finance specific activities within a
sector, while the block grants are used to finance whole sectors. The definition of those
grants in the LLGF (Articles 25 and 26) makes no reference to what type of activities
or expenditures the grants may cover. In other words, the government of Macedonia
is free to define such grants as what best suits its strategies and policies in any sector,
including education.
The difference between the categorical grants and block grants appears in connec-
tion with decentralization in Article 45 of LLGF. Namely, the law clearly states that
during the first phase decentralized functions will be financed through categorical grants
excluding salaries, and full financing of the sectors including the salaries will start only
in the second phase, with block grants. This has led a number of specialists in MoES
to believe that categorical grants are for maintenance only, and only the block grants
can be used in the second phase. However, both those conclusions are incorrect, as the
definitions of LLGF recalled above clearly show.
138
P U B L I C M O N E Y F O R P U B L I C S C H O O L S
Indeed, in the future MoES will be using both types of grants to finance education,
though in different ways and for different purposes. Block grants, as grants directed
to the whole sector, will be the main instrument of financing the operational costs of
providing education, that is, of the operating and financing of schools. Those grants have
to be allocated to municipalities through an allocation formula based on the numbers
of students of specific categories, and should be rather stable, to protect education from
excessive changes. Here, stability means that MoES should not change radically from
year to year, either the allocation formula or the amounts allocated to each munici-
pality. Nevertheless, there will certainly be changes in the allocation formulas, because
the education priorities of the ministry may change in time. Thus, for example MoES
may decide at any time that more support is needed for small rural schools, and may
increase the appropriate factors used in the formula.22
Categorical grants will be used to finance specific programs or projects within
the education sector, to achieve specific policy goals of MoES. It is possible to use the
categorical grants for many purposes, for example:
1) Financing specific types of extracurricular activities, such as sports;
2) Supporting specific programs, such as teacher in-service training;
3) Improving access to education by vulnerable or minority groups of students;
4) Promoting academic excellence in specific subjects or areas.
Block grants are not suitable financing instruments for those types of education
policies, because they can be used by municipalities in any way they want, as long as
the expenditures are within the education sector. Categorical grants in education, unlike
the block grants, may change significantly from year to year in the amounts involved
and in the allocation criteria. Indeed, some may be used for a few years and then be
replaced by other categorical grants, addressed to different groups of students. On the
other hand, the categorical grants are likely to remain rather small in terms of allocated
funds compared to block grants.
We note that the implementation of some policy initiatives of the ministry may
require using both types of grants. For example, the integration of handicapped students
in mainstream education may be facilitated in two parallel ways:
1) Specific projects, such as the training of teachers or the provision of specialized
equipment to the schools, may be financed through categorical grants;
2) An overall introduction of integrated teaching may be encouraged by introducing
a small weight in the allocation formula based on the number of handicapped
children receiving education in mainstream schools.
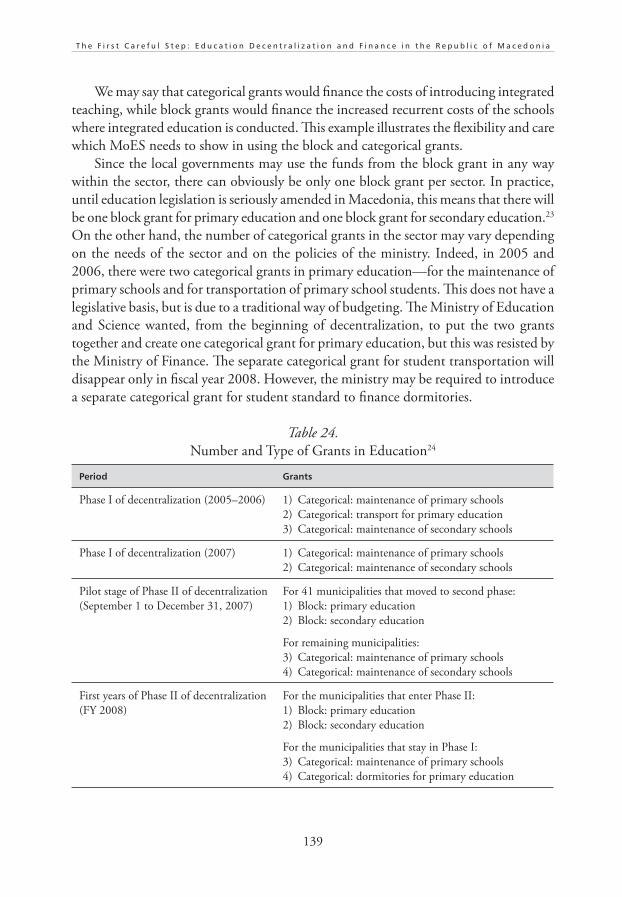
139
T h e F i r s t C a r e f u l S t e p : E d u c a t i o n D e c e n t r a l i z a t i o n a n d F i n a n c e i n t h e R e p u b l i c o f M a c e d o n i a
We may say that categorical grants would finance the costs of introducing integrated
teaching, while block grants would finance the increased recurrent costs of the schools
where integrated education is conducted. This example illustrates the flexibility and care
which MoES needs to show in using the block and categorical grants.
Since the local governments may use the funds from the block grant in any way
within the sector, there can obviously be only one block grant per sector. In practice,
until education legislation is seriously amended in Macedonia, this means that there will
be one block grant for primary education and one block grant for secondary education.23
On the other hand, the number of categorical grants in the sector may vary depending
on the needs of the sector and on the policies of the ministry. Indeed, in 2005 and
2006, there were two categorical grants in primary education—for the maintenance of
primary schools and for transportation of primary school students. This does not have a
legislative basis, but is due to a traditional way of budgeting. The Ministry of Education
and Science wanted, from the beginning of decentralization, to put the two grants
together and create one categorical grant for primary education, but this was resisted by
the Ministry of Finance. The separate categorical grant for student transportation will
disappear only in fiscal year 2008. However, the ministry may be required to introduce
a separate categorical grant for student standard to finance dormitories.
Table 24.
Number and Type of Grants in Education24
Period Grants
Phase I of decentralization (2005–2006) 1) Categorical: maintenance of primary schools
2) Categorical: transport for primary education
3) Categorical: maintenance of secondary schools
Phase I of decentralization (2007) 1) Categorical: maintenance of primary schools
2) Categorical: maintenance of secondary schools
Pilot stage of Phase II of decentralization
(September 1 to December 31, 2007)
For 41 municipalities that moved to second phase:
1) Block: primary education
2) Block: secondary education
For remaining municipalities:
3) Categorical: maintenance of primary schools
4) Categorical: maintenance of secondary schools
First years of Phase II of decentralization
(FY 2008)
For the municipalities that enter Phase II:
1) Block: primary education
2) Block: secondary education
For the municipalities that stay in Phase I:
3) Categorical: maintenance of primary schools
4) Categorical: dormitories for primary education

140
P U B L I C M O N E Y F O R P U B L I C S C H O O L S
Period Grants
Complete implementation of Phase II
(probably from FY 2009)
1) Block: primary education
2) Block: secondary education
In addition possibly:
3) Categorical: grants for specific programs defined
by MoES (such as support for vulnerable students,
subsidies for student food, improvement in IT
equipment)
In practice, of course, as the categorical grant is a new policy instrument, it should
be initially used very carefully, with strong emphasis on monitoring and reporting by
the municipalities.
Allocation Formulas for Categorical Grants for Maintenance
Two goals guided the design of the allocation formula for the categorical grants during
Phase I of education decentralization: that the formulas for primary and secondary
school maintenance should be similar,25 and that the overall structure of the formula may
be also used for the block grants, though with possibly different factors and different
numerical values of coefficients. This means that, if that structure is maintained,26 the
beginning of Phase II will not bring major changes or surprises in the formula itself. In
the present section, we will briefly review this present structure, so that discussion of
possible changes in subsequent sections will be easier to understand.
There are three main elements of the formula:
1) The lump sum, allocated to each municipality irrespective of the number of
students (for primary schools only).
2) For each municipality the number of weighted students is calculated. The
following groups of students are included in this calculation, apart from the
physical number of students:
a) For primary schools, students attending school located in municipalities
with low population density.
b) For secondary schools, also students attending gymnasiums.
3) Lower and upper buffers used to protect the municipalities from excessive
changes from the previous year’s allocation (in 2007, only for primary educa-
tion).
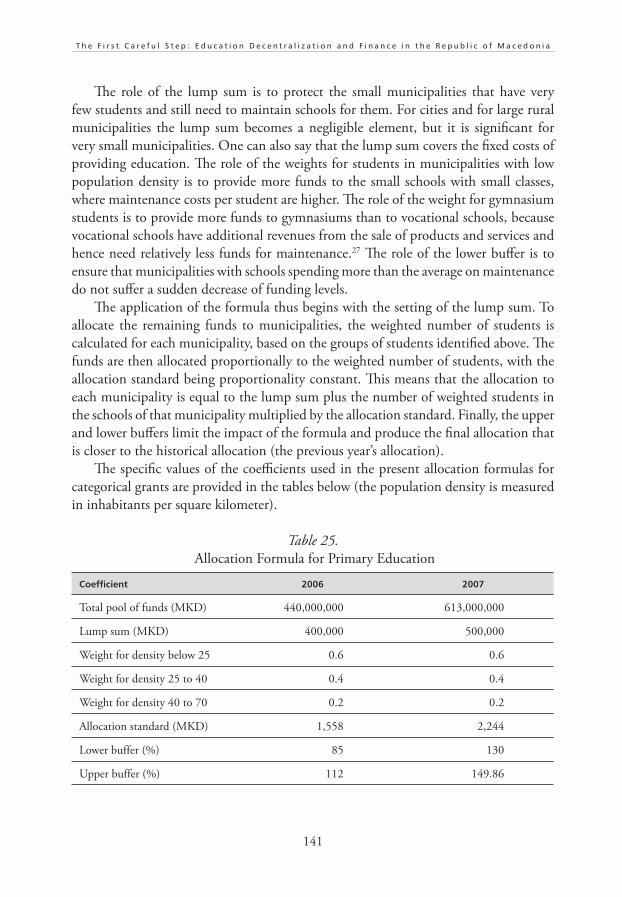
141
T h e F i r s t C a r e f u l S t e p : E d u c a t i o n D e c e n t r a l i z a t i o n a n d F i n a n c e i n t h e R e p u b l i c o f M a c e d o n i a
The role of the lump sum is to protect the small municipalities that have very
few students and still need to maintain schools for them. For cities and for large rural
municipalities the lump sum becomes a negligible element, but it is significant for
very small municipalities. One can also say that the lump sum covers the fixed costs of
providing education. The role of the weights for students in municipalities with low
population density is to provide more funds to the small schools with small classes,
where maintenance costs per student are higher. The role of the weight for gymnasium
students is to provide more funds to gymnasiums than to vocational schools, because
vocational schools have additional revenues from the sale of products and services and
hence need relatively less funds for maintenance.27 The role of the lower buffer is to
ensure that municipalities with schools spending more than the average on maintenance
do not suffer a sudden decrease of funding levels.
The application of the formula thus begins with the setting of the lump sum. To
allocate the remaining funds to municipalities, the weighted number of students is
calculated for each municipality, based on the groups of students identified above. The
funds are then allocated proportionally to the weighted number of students, with the
allocation standard being proportionality constant. This means that the allocation to
each municipality is equal to the lump sum plus the number of weighted students in
the schools of that municipality multiplied by the allocation standard. Finally, the upper
and lower buffers limit the impact of the formula and produce the final allocation that
is closer to the historical allocation (the previous year’s allocation).
The specific values of the coefficients used in the present allocation formulas for
categorical grants are provided in the tables below (the population density is measured
in inhabitants per square kilometer).
Table 25.
Allocation Formula for Primary Education
Coefficient 2006 2007
Total pool of funds (MKD) 440,000,000 613,000,000
Lump sum (MKD) 400,000 500,000
Weight for density below 25 0.6 0.6
Weight for density 25 to 40 0.4 0.4
Weight for density 40 to 70 0.2 0.2
Allocation standard (MKD) 1,558 2,244
Lower buffer (%) 85 130
Upper buffer (%) 112 149.86
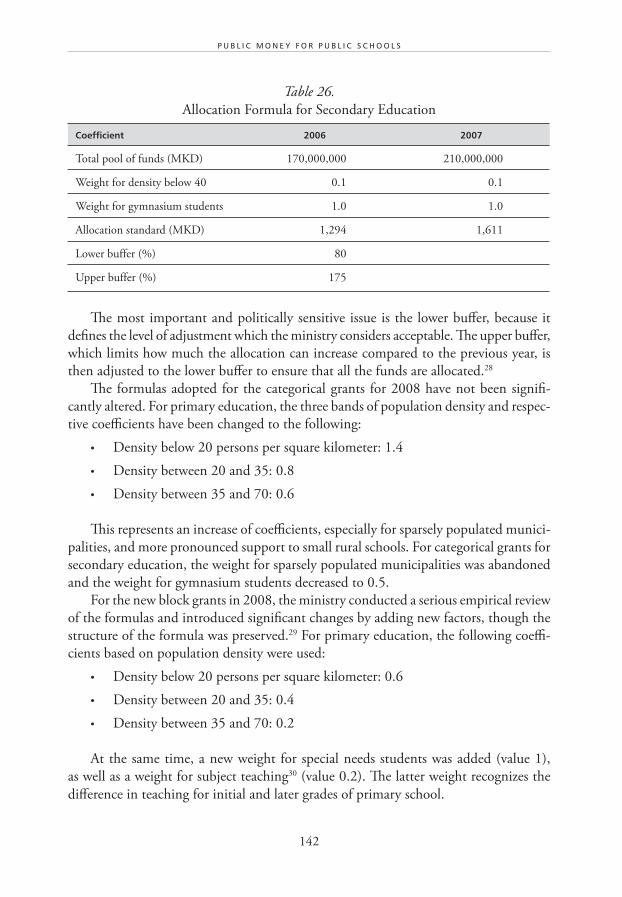
142
P U B L I C M O N E Y F O R P U B L I C S C H O O L S
Table 26.
Allocation Formula for Secondary Education
Coefficient 2006 2007
Total pool of funds (MKD) 170,000,000 210,000,000
Weight for density below 40 0.1 0.1
Weight for gymnasium students 1.0 1.0
Allocation standard (MKD) 1,294 1,611
Lower buffer (%) 80
Upper buffer (%) 175
The most important and politically sensitive issue is the lower buffer, because it
defines the level of adjustment which the ministry considers acceptable. The upper buffer,
which limits how much the allocation can increase compared to the previous year, is
then adjusted to the lower buffer to ensure that all the funds are allocated.28
The formulas adopted for the categorical grants for 2008 have not been signifi-
cantly altered. For primary education, the three bands of population density and respec-
tive coefficients have been changed to the following:
• Density below 20 persons per square kilometer: 1.4
• Density between 20 and 35: 0.8
• Density between 35 and 70: 0.6
This represents an increase of coefficients, especially for sparsely populated munici-
palities, and more pronounced support to small rural schools. For categorical grants for
secondary education, the weight for sparsely populated municipalities was abandoned
and the weight for gymnasium students decreased to 0.5.
For the new block grants in 2008, the ministry conducted a serious empirical review
of the formulas and introduced significant changes by adding new factors, though the
structure of the formula was preserved.29 For primary education, the following coeffi-
cients based on population density were used:
• Density below 20 persons per square kilometer: 0.6
• Density between 20 and 35: 0.4
• Density between 35 and 70: 0.2
At the same time, a new weight for special needs students was added (value 1),
as well as a weight for subject teaching30 (value 0.2). The latter weight recognizes the
difference in teaching for initial and later grades of primary school.

143
T h e F i r s t C a r e f u l S t e p : E d u c a t i o n D e c e n t r a l i z a t i o n a n d F i n a n c e i n t h e R e p u b l i c o f M a c e d o n i a
For block grants for secondary education, the main new element is using the lump
sum (which was not used for categorical grants for secondary education). The weight
for gymnasium students was reduced to a very low value of 0.1.
We thus see that the ministry was able to adapt the factors and the coefficients used
in the formula to serve the block grants, which allocate to municipalities significantly
more funds than the categorical grants for school maintenance.
CONCLUSIONS
Despite the delayed start and initial problem, the first phase of education decentraliza-
tion in Macedonia must be considered a major success. By transferring to municipalities
a limited responsibility in the education sector, restricted to school maintenance and
student transportation, MoES ensured a relatively smooth decentralization process.
Education decentralization in Macedonia became a fact, and municipalities have in
reality taken over their new responsibilities, often demanding more powers in the sector.
An example is the demand by ZELS (Association of Local Governments of Macedonia)
that mayors be given more influence over the appointment of school directors, for
the transfer of responsibilities was associated with the transfer of funds in the form of
categorical education grants. There were, of course, disputes regarding the level of the
allocation of the funds, but the municipalities took an increasingly active attitude to the
budgeting of maintenance in their schools (as we discuss below). In its serious approach
to education decentralization, Macedonia is one of the most advanced countries in
South Eastern Europe.31
Municipalities are now asserting their new powers in the education sector in a
number of ways. The changes of municipalities as new owners of schools have many
faces, of course. Some are changing their administrative structure and establishing
special units responsible for education sector within their local administrations.32 Some
are deliberating and adopting local education strategies, including long-term visions of
their school systems.33
The most important change regards the municipal role in the budgeting process.
Although restricted to school maintenance, some municipalities have begun the serious
work of assessing the relative conditions of their schools, as well as the relative needs of
recurrent funding and investments.34 The new procedures are based on a more transparent
process, in which information from different schools and for successive budget years is
evaluated to assess the budget requests from the schools. Similarly, municipalities have
begun to review and streamline the organization and financing of student transporta-
tion, which in many cases became quite irrational under the previous decentralized
system. Here, the main effort was to review the actual transportation routes and ensure
that they were as efficient as possible. Finally, some municipalities have begun a serious
144
P U B L I C M O N E Y F O R P U B L I C S C H O O L S
effort in the optimization of school networks, including the consolidation of schools
and the redrafting of school catchment areas.35 It is precisely this process of establishing
new rules and procedures that will, hopefully, lead to a more efficient management and
use of resources, and ultimately to provision of better education.36
At the same time, the Ministry of Education is also adapting to the new management
and financing of education. A restructuring of the ministry is taking place, including
the setting up of a specific unit to analyze and monitor the performance of the decen-
tralized education system. Regional representatives of the ministry and their staff have
been incorporated to larger municipalities to reflect changes in the responsibilities. New
laws have redefined the roles of the State Education Inspectorate and the Bureau for
Education Development.
However, the efforts to complete the first phase of education decentralization are
incomplete. We list the most urgent tasks ahead, which certainly should be resolved
prior to the beginning of the second phase:
1) Clearing up of old school debts. This is an old problem, which has received signifi-
cant attention recently, and progress has been achieved. Indeed, ZELS estimates
that by January 2007 about 90 percent of old debts were paid off. MoES should
insist on the rapid finalization of this problem. It would be good to compile
and agree with the municipalities on a list of all remaining outstanding debts.
2) Transfer of ownership of school properties. Currently, a specific, small unit of the
Ministry of Finance is charged with clearing the situation of those properties and
of successively passing them to the municipalities. This system is dysfunctional;
it delays the clearing of the cadastre of school properties and their transfer to
the municipalities. MoES should propose a more realistic and faster procedure
to ensure that the municipalities receive legal ownership of school facilities.
3) Introduction of proper monitoring tools and procedures. The present situation,
when the ministry has only limited and incomplete monitoring capacities is
unsafe for the education system, because it does not allow urgent intervention
in cases when the law is broken or local decisions are inconsistent with the legal
regulations. The ministry finds it difficult to monitor even the disbursement
of categorical grants and is quite unable to monitor, during the fiscal year, the
categorical grants that are used only for education. Again, cooperation with
the Ministry of Finance should improve (including better access to treasury
system data). Of course, the scope for misuse of funds and the need for good
monitoring will increase in the second phase.
4) Adoption of a modified normative on conditions in schools and on teaching aids
and equipment.37 A draft normative prepared by MoES needs to be discussed
with all stakeholders and adopted. The normative should define the minimum
standards of school space, furniture, and teaching equipment to be maintained in
145
T h e F i r s t C a r e f u l S t e p : E d u c a t i o n D e c e n t r a l i z a t i o n a n d F i n a n c e i n t h e R e p u b l i c o f M a c e d o n i a
schools. Without such a normative the responsibilities of municipalities remain
ill defined, and the ministry will not be able to fulfill its role of ensuring that
all students in Macedonian schools enjoy basic minimal conditions.
It is worthwhile to formulate the lessons learned during the first phase of education
decentralization. Firstly, it is important to note that Ministry of Education and Science
had to define its decentralization strategy within the overall decentralization framework
defined by the Ministry of Finance. MoES did not have to invent its own procedures,
it simply had to intelligently use the framework developed in the LLGF. As the second
phase becomes a reality, the Ministry of Finance should provide similar clarity on how
the management of employees and salaries will be transferred to municipalities.
Secondly, the relative success of the first phase was in part due to a long preparation
process led by the ministry. This included the adoption of a sectoral strategy and prepa-
ration of significant amendments to education laws. Within the ministry, in a series of
workshops and seminars, a consensus was built which allowed common understanding
and the implementation of reforms. Creation of a consensus within the ministry and with
other key education institutions, such as the Bureau for the Development of Education
or State Education Inspectorate is crucial for the success of the second phase.
Finally, the start of the first phase was preceded by a public information campaign,
addressed to the general public and to specific institutions. Local governments received
a lot of training and support, part of it financed by the international community. The
second phase should also be introduced with information campaigns. However, due
to different nature of the second phase, the main target of the campaign should be
municipalities, school boards, and teachers.
SOURCES CITED
Bureau for the Development of Education (2004) Draft National Strategy for Education Development
in the Republic of Macedonia. Skopje: Bureau for the Development of Education.
Halasz, G. (2000) An Education Policy Strategy for Macedonia. Skopje: World Bank Office.
Herczyński, J. (2004) Key Problems of Per-student Financing of Education in Phase I of Education
Decentralization in Macedonia. Report. Skopje: LGRP.
——— (2007) Challenges of the Second Phase of Education Decentralization in Macedonia. Report.
Skopje: Making Decentralization Work, USAID.
——— (2007) Towards the Formula for Block Grants in Macedonia. Report. Skopje: Making
Decentralization Work, USAID.
Hoxha, E., ed. (2007) Municipal Management of Schools: Guidebook. Skopje: MMMS.
146
P U B L I C M O N E Y F O R P U B L I C S C H O O L S
International Crisis Group (2001a) Macedonia’s Name: Why the Dispute Matters and How to
Resolve It? Skopje/Brussels:ICG Balkan Report 122.
International Crisis Group (2001b) Macedonia: War on Hold. Skopje/Brussels: ICG Balkan
Briefing.
Levitas, T. (2002) Preparing for Education Decentralization in Macedonia: Issues, Directions, Actions. Report. Skopje: LGRP.
Levitas, T. and J. Herczyński (2003) The Principles of Education Finance in a Decentralized Education System. Memo for the Ministry of Education and Science, Skopje. Report. Skopje:
LGRP.
Ministry of Education and Science (2004) Education Decentralization Strategy: Education Finance. Skopje: MoES.
OECD (2001) Thematic Review of National Policies for Education: FYROM. Vienna: OECD.
Sobranie na Republika Makedonija (1995) Law on Primary Education. Skopje.
Sobranie na Republika Makedonija (1995) Law on Secondary Education. Skopje.
Sobranie na Republika Makedonija (2002) Law on Local Governments of January 24, 2002.Skopje.
Sobranie na Republika Makedonija (2004) Law Amending the Law on Primary Education. Skopje.
Sobranie na Republika Makedonija (2004) Law Amending the Law on Secondary Education. Skopje.
Sobranie na Republika Makedonija (2004) Law on Local Government Finance of September 6, 2004. Skopje.
NOTES
1 We express our gratitude to Mr. Muamet Demiri, formerly of MoES, to Mrs. Liljana
Ristovska and to Mr. Bill Althaus of the former MDW project for support and cooperation.
We are indebted to our colleague Tony Levitas, whose understanding of social and political
implications proved to be an invaluable asset in our work. The views expressed in the report
are of the authors’ only, and do not reflect the opinions of the Ministry of Education and
Science, of the project Make Decentralization Work, nor of the United Stated Agency for
International Development.
2 There are five types of primary schools: regular, music, special (two types), and primary
school for adults.
3 In secondary education there are five types of schools: gymnasium, vocational, mixed
(gymnasium and vocational), music, and special.
4 As described later in the paper; since 2002 student transportation and accommodation for
secondary education were turned into a separate program, called the “student standard.”
147
T h e F i r s t C a r e f u l S t e p : E d u c a t i o n D e c e n t r a l i z a t i o n a n d F i n a n c e i n t h e R e p u b l i c o f M a c e d o n i a
5 Includes: voluntary yearly fee (called “participation fee”) paid by students at the beginning
of the school year, and income from selling of goods and services. Among those services are
external examinations provided by secondary schools for adult learners.
6 Teacher training and scholarship are provided directly from the ministry to teacher-training
providers and to students, respectively. Manuals are paid for by parents.
7 The Bureau for the Development of Education is a professional institution, subordinated to
the ministry, responsible for developing curricula and teaching materials, and for providing
teacher in-service training.
8 Those norms will most likely be soon replaced by more general recommendations, as
municipalities become responsible for salaries and employment.
9 There are two titles for teachers given by school commission: exemplary and special exem-
plary.
10 Explanation: M-r and VSP–university degree; VSS–post-secondary degree; SSS, VKV,
KV–secondary school; PKV, NKV–primary school.
11 USD 1 = MKD 50; EUR 1 = MKD 62 as of 2005.
12 The criteria provide detailed definitions of what it means for the school to have 1.5 or 2.5
shifts.
13 It is estimated that the enrollment rate in grade one of primary schools is about 95 percent
and steadily increasing.
14 This includes energy (electricity, heating), water, communal services, materials, small repairs,
telephones, etc.
15 This includes energy (electricity, heating), water, communal services, materials, small repairs,
telephones, etc.
16 They are various off-budget funds financed in part from the state budget, and in part from
own revenues, responsible for specific functions such as roads.
17 The amended laws transferred school founding rights to local governments and introduced
new provisions for education finance.
18 Education decentralization in Macedonia has, thus far, administrative and fiscal dimensions,
and has not yet touched on the areas of curriculum, textbooks, or monitoring of quality.
19 A large part of those debts were due to school directors ordering major repairs or investments
in their schools without having first secured MoES funds for those projects.
20 Draft normative was prepared by MoES in mid-2007 and will be presumably adopted in
2008 following consultations with local governments.
21 Problematic areas included invoices for services provided to the school during the first six
months of 2005, but received by the schools after July 1.
22 In the current allocation formula, this would mean increasing the lump sum and the values
of coefficients for low population density.
23 Two separate laws on primary and secondary education provide separate legal regulations
and legally require separate block grants.
148
P U B L I C M O N E Y F O R P U B L I C S C H O O L S
24 LLGF states that a municipality needs to meet certain conditions in order to qualify for Phase 2 of decentralization. On September 1, 2007, 41 municipalities moved to Phase 2. On January 1, 2008, nine more joined them.
25 We do not discuss here the allocation formula for student transportation, based on the number of student-kilometers, because this was a transition formula. As discussed in the previous section, MoES wanted to join this categorical grant with the maintenance grant for primary education. This was achieved only for FY 2007, due to resistance from the Ministry of Finance. We also do not discuss the formula used for the second half of 2005, when the ministry decided that use of a per-student formula for half a year is not possible, and used a simple allocation proportional to historical expenditures on school maintenance.
26 Of course, the ministry may change the structure of the formula as it sees fit.
27 The lower per-student allocation of maintenance funds to vocational schools is a specific Macedonian phenomenon, related to the fact that vocational secondary schools finance some of their maintenance costs from own revenues, such as sale of services. If all elements of the school budgets are included, with teacher salaries, then the per-student allocations of vocational schools become somewhat higher than those of general education schools.
28 Specifically, this means the following: the setting of the lower buffer defines the amount of funds which needs to be provided to municipalities. The pure formula without the buffer would allocate less to some municipalities. The funds that should be allocated according to the lower buffer are obtained from applying the upper buffer to the municipalities which had historically lower costs.
29 We discuss formulas for block grants in 2008. For the last four months of 2007 it was decided not to use per-student formulas for the block grants, but to allocate them proportionally to historical expenditures (similarly to the second half of 2005).
30 “Subject teaching” refers to grades five to eight, where students have different subjects. Initial instruction is called “class teaching.”
31 It is not surprising that Macedonia hosted a regional conference on education decentraliza-tion in Ohrid in May 2006. The conference was attended by high-level representatives of education ministries from almost all Balkan countries. It was clear from the presentations in Ohrid that Macedonia was most systematic and advanced among the participating coun-tries.
32 Among other examples, this has happened in the municipality of Strumica, see Hoxha 2007.
33 This was the approach taken in municipality of Tearce, see Hoxha 2007.
34 The new procedures were adopted by many municipalities, see Hoxha 2007.
35 Resen conducted a far-reaching review both of student transportation and of networks, see Hoxha 2007.
36 The experiences and procedures of the first phase of decentralization have been summarized in Municipal Management of Schools: Guidebook, edited by Ella Hoxha.
37 A report commissioned by USAID/DP demonstrated that the conditions in secondary schools are relatively adequate, so the new normative is needed, especially for the primary
schools.
C H A P T E R 5
Financing Education in Moldova
Veaceslav Ionita

151
F i n a n c i n g E d u c a t i o n i n M o l d o v a
Executive Summary
Education reform in the Republic of Moldova has been an ongoing process that has involved
not only the rethinking of the role of public authorities in the education sector but also
changes to the principles of education itself.
After passing a new Constitution in 1994, Moldova began the changes to make its
national education system reflect modern, democratic values. Two pieces of legislation
were critical to its implementation, the Law on Education No. 547 of 1995 and the Law on
Local Public Finance No. 127 of 2003. This was matched with secondary legislation as well
as some specific goals outlined in Moldova’s Poverty Reduction Strategy Paper of 2004.
The first step of education reform de-politicized the system and expunged the curriculum
of ideology, while a second step reorganized the schools and a third step was planned
in concert with the decentralization of central government fiscal authority. Despite the
efforts of this well-intentioned change on the part of the central government, economic
and demographic declines have contributed to a falling number of schools and poorer
quality education.
What had been modeled in Moldova on the Soviet educational system of general schools
has diversified into a multileveled system of preschools and primary and secondary schools
culminating in high schools and vocational schools based on European standards obligatory
for students until the age of 16. The baccalaureate is the final degree qualification for those
students wishing to continue to university; vocational students who reach the qualifica-
tion of technician may also apply. In theory, Moldova now has a modern curriculum that
corresponds to the developments and demands of its labor market.
Many anomalies and problems remain, for example, the insertion of “high school” level
courses in rural schools to augment the lack of transport and accommodation for rural high
school students to attend larger regional schools. Likewise, preschools suffered from a long
period of economic shortages when local authorities were burdened with the debts and
poor maintenance of these preschools formerly run by kolkhoz. Many preschools closed and
some eventually re-opened. Today, only 60 percent of preschool students are enrolled.
Moldova’s central government has planned a slow release of its authority in the
financing, organization, and assessment of the education sector; however, policy and its
execution remains its remit. Even if the law legislated responsibility to municipalities for
preschool and primary and secondary schools, this may not be the case due to restrictions
on the catchment area of the school concerned. For example, professional schools are
under the jurisdiction of the districts or raions and some raions also may control boarding
152
P U B L I C M O N E Y F O R P U B L I C S C H O O L S
schools and high school hostels. The raion-level board of education has the authority
to close, reorganize, or open schools. The Ministry of Education, which ultimately holds
responsibility for all policy and decisions regarding schools in Moldova, can also make this
decision if deemed necessary. Wages and social and health benefits are paid by the raion
departments of the Ministry of Education, but so poor is the pay and benefit package
for teachers, and by default the revenue of schools, especially in rural areas, that some
communities have developed an informal wage and revenue top-up scheme in order to
keep their schools open. At the same time, the ministry has delegated new responsibilities
to local authorities without ensuring funding sources like grants, taxes, or own revenues
for their implementation. To compound the arbitrary attitude of the Ministry of Education
towards decentralizing finances and management, local schools are still unable to choose
and hire their own directors.
In 2003, education expenditures in Moldova made up six percent of GDP and about
a quarter of the state budget. Funds for education are shared and divided according to
revenues from a local percentage of corporate, personal, and road taxes; and general and
allocated transfers in addition to own revenue of local governments and schools. School
budgets are estimated by local authorities, submitted to the central government, then aver-
aged through data from the Department of Statistics and Sociology, and funds are then
administered as categorical grants, though this is prone to change.
In conclusion, the reforms have been piecemeal and incomplete. Decentralization started
in 1999, but efforts were discontinued in 2003. In 2006, decentralization was re-initiated,
and the idea to involve more local government authorities in the delivery of education was
put back on the public agenda. Unfortunately, a coherent financing framework was not
developed and the unclear allocation of responsibilities has contributed to the problems
of a Moldovan education system beset by poor infrastructure, low efficiency, and high
teaching costs. External assistance has come from international donors like the World
Bank and UNICEF that have implemented a number of projects (particularly meals and
maintenance), but this has not yielded an overall improvement in the performance of the
education system, one of the sole services provided by local authorities. These problems
are systematic and especially acute in rural schools, which typically need more revenue to
function. Solving these problems requires a clear allocation of educational and financial
responsibilities legislated on the national level, freeing decision-making from the Ministry
of Education and giving more fiscal autonomy to local authorities.

153
F i n a n c i n g E d u c a t i o n i n M o l d o v a
THE GENERAL SYSTEM OF EDUCATION
Since the proclamation of its independence, Moldova has initiated political, economic,
and social changes aimed at creating a market economy based on private and public
property, free initiative, and competition. In 1994, the Moldovan Parliament adopted
the Constitution of the Republic of Moldova, confirming the right of all citizens to
education, with no limitation or discrimination, and compulsory education was declared
free of charge in all state institutions. The transition from a centrally-planned economy
to a market economy called for changes in the educational policies of the newly-formed
independent state. The task ahead was to build a modern and democratic national
educational system, based on both national and universal values.
The main policy document of the government for education is the State Program
of Educational Development,1 which provides for the implementation of the Law on
Education 547/1995. Policy directions in the reform of education are also embodied
in the Law on Local Public Finances 123/2003 and other secondary legislation. All the
above define the structure of the system and financing principles.
Another key policy document is the Poverty Reduction Strategy Paper (PRSP),
adopted by the Parliament in Law 398-XV/2004, which puts forth the three pillars of
the government’s poverty reduction strategy:
(i) sustainable and inclusive economic growth that will provide the
population with productive employment; (ii) human development poli-
cies emphasizing increased access to basic services (especially primary
medical services and primary education); and (iii) social protection
policies targeting those most in need.
Education, along with the economic growth and protection of those in need, is
considered one of the main factors ensuring the sustainable development of the country.
Various donors active in Moldova, such as the World Bank, the European Foundation
for Professional Training, UNICEF, and the Soros Foundation–Moldova acknowledge
the importance of education and support the reform. Some of the most important
projects implemented with donor assistance are:
• IPEP (Individual Preschool Education Program), financed by the UNICEF
Cooperation Program.
• The project on general education reform in Moldova, co-financed by the World
Bank and designed for primary and secondary education (grades one through
ten). The main objective of this project was to improve quality in education
by modernizing the syllabus, drafting new manuals, developing the capacity of
teachers, creating and implementing new pedagogic techniques, and creating a
modern system to assess school performance.
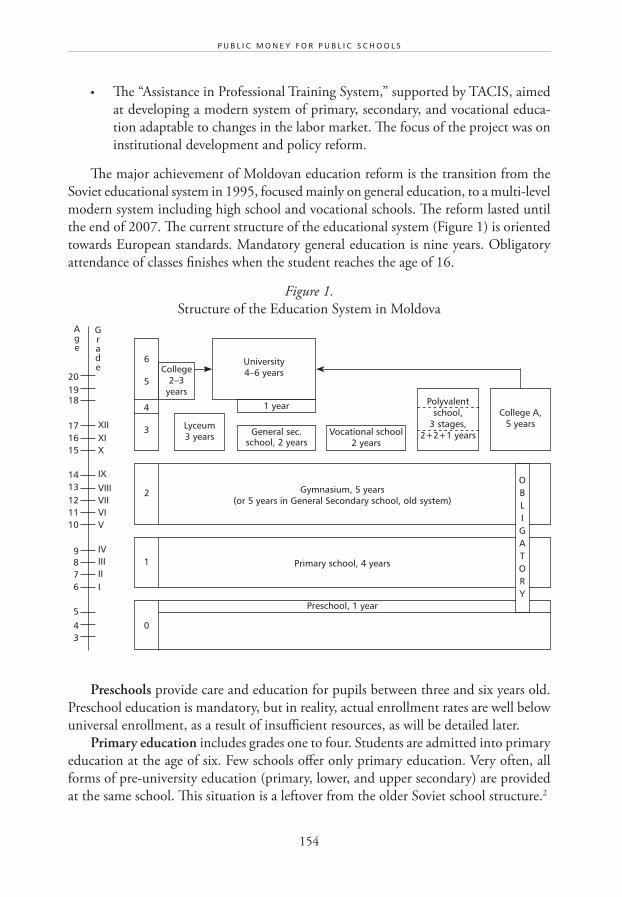
154
P U B L I C M O N E Y F O R P U B L I C S C H O O L S
• The “Assistance in Professional Training System,” supported by TACIS, aimed
at developing a modern system of primary, secondary, and vocational educa-
tion adaptable to changes in the labor market. The focus of the project was on
institutional development and policy reform.
The major achievement of Moldovan education reform is the transition from the
Soviet educational system in 1995, focused mainly on general education, to a multi-level
modern system including high school and vocational schools. The reform lasted until
the end of 2007. The current structure of the educational system (Figure 1) is oriented
towards European standards. Mandatory general education is nine years. Obligatory
attendance of classes finishes when the student reaches the age of 16.
Figure 1.
Structure of the Education System in Moldova
Preschools provide care and education for pupils between three and six years old.
Preschool education is mandatory, but in reality, actual enrollment rates are well below
universal enrollment, as a result of insufficient resources, as will be detailed later.
Primary education includes grades one to four. Students are admitted into primary
education at the age of six. Few schools offer only primary education. Very often, all
forms of pre-university education (primary, lower, and upper secondary) are provided
at the same school. This situation is a leftover from the older Soviet school structure.2
201918
17
College2–3
years
1615
1413121110
9876
5
43
XIIXIX
IX
VIIIVIIVIV
IVIIIIII
Preschool, 1 year
Primary school, 4 years
Gymnasium, 5 years(or 5 years in General Secondary school, old system)
OBLIGATORY
College A,5 years
Polyvalent school,
3 stages,2+2+1 yearsVocational school
2 yearsGeneral sec.
school, 2 years
Lyceum3 years
1 year
University4–6 years
6
5
4
3
2
1
0
Grade
Age
155
F i n a n c i n g E d u c a t i o n i n M o l d o v a
Lower-secondary education include grades five to nine. This level of education is
offered in gymnasiums, general secondary schools (GSS), and high schools.
Upper-secondary education. Under the old system, upper-secondary education
consisted of grades 10 and 11 delivered in high schools; under the new system, high
schools include grades 10–12. Students graduating from high schools get the bacca-
laureate degree that is a prerequisite for admission to university.
Starting in 2008, all general secondary schools (GSS) are transformed into high
schools. This process is slow, however. Currently, there are only two “high schools” in
the real sense of the word. The most common situation is that all levels of education are
provided in one school unit, where the same teachers provide education to gymnasium
and high school students alike. In the rural areas, given the small student population,
an excessive form of school consolidation takes place. The rural school hosts students
in all forms of education, from primary to high school,3 with teachers delivering several
topics—such as chemistry, mathematics, physics, and biology—for all levels of educa-
tion. While this has some positive impact on the internal migration of students, the
main impact is a significantly lower quality in teaching.
Vocational education is offered in two forms: professional and polyvalent
education.
Professional programs vary in duration. Typically, these programs accept students who
have completed lower-secondary education. Students who graduate from vocational
schools cannot apply for university studies.
Polyvalent programs are structured in a three-level structure:
• Upon completion of the lower-secondary education program, students are
accepted in a polyvalent program, which they can graduate from in one year,
with a certificate of worker.
• Students who decide that they want to continue their studies can go for the
second level of the polyvalent school, based on a competitive process. Upon
graduation, they obtain a certificate of skilled worker.
• Finally, students who go for the third level obtain a certificate of technician.
Students graduating from polyvalent schools can apply to universities.
At present, the majority of polyvalent schools are being transformed into colleges.
Most colleges accept students graduating from GSS (grade 11) and high schools
(grade 12), but some colleges (pedagogical colleges and colleges of art and music) accept
gymnasium graduates (grade nine). The duration of study is five years for grade-nine
graduates, three years for grade-11 graduates, and two years for grade-12 graduates. After
four years of study in a pedagogical college, or three years in another college, students
are entitled to compete for the baccalaureate. If successful, they may be admitted into
university. If they decide to continue onto higher education, students take a special
program (three years instead of four years after high school).
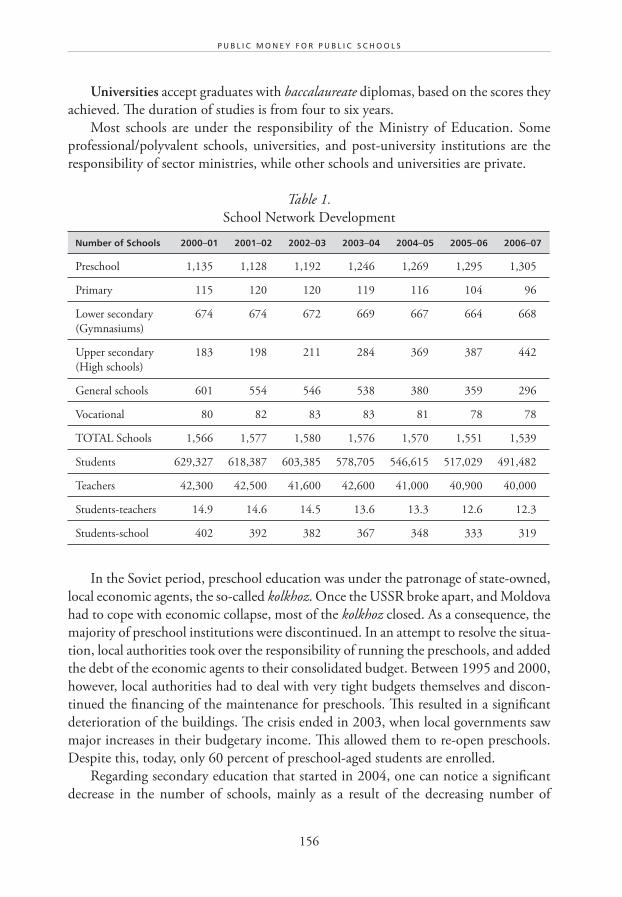
156
P U B L I C M O N E Y F O R P U B L I C S C H O O L S
Universities accept graduates with baccalaureate diplomas, based on the scores they
achieved. The duration of studies is from four to six years.
Most schools are under the responsibility of the Ministry of Education. Some
professional/polyvalent schools, universities, and post-university institutions are the
responsibility of sector ministries, while other schools and universities are private.
Table 1.
School Network Development
Number of Schools 2000–01 2001–02 2002–03 2003–04 2004–05 2005–06 2006–07
Preschool 1,135 1,128 1,192 1,246 1,269 1,295 1,305
Primary 115 120 120 119 116 104 96
Lower secondary
(Gymnasiums)
674 674 672 669 667 664 668
Upper secondary
(High schools)
183 198 211 284 369 387 442
General schools 601 554 546 538 380 359 296
Vocational 80 82 83 83 81 78 78
TOTAL Schools 1,566 1,577 1,580 1,576 1,570 1,551 1,539
Students 629,327 618,387 603,385 578,705 546,615 517,029 491,482
Teachers 42,300 42,500 41,600 42,600 41,000 40,900 40,000
Students-teachers 14.9 14.6 14.5 13.6 13.3 12.6 12.3
Students-school 402 392 382 367 348 333 319
In the Soviet period, preschool education was under the patronage of state-owned,
local economic agents, the so-called kolkhoz. Once the USSR broke apart, and Moldova
had to cope with economic collapse, most of the kolkhoz closed. As a consequence, the
majority of preschool institutions were discontinued. In an attempt to resolve the situa-
tion, local authorities took over the responsibility of running the preschools, and added
the debt of the economic agents to their consolidated budget. Between 1995 and 2000,
however, local authorities had to deal with very tight budgets themselves and discon-
tinued the financing of the maintenance for preschools. This resulted in a significant
deterioration of the buildings. The crisis ended in 2003, when local governments saw
major increases in their budgetary income. This allowed them to re-open preschools.
Despite this, today, only 60 percent of preschool-aged students are enrolled.
Regarding secondary education that started in 2004, one can notice a significant
decrease in the number of schools, mainly as a result of the decreasing number of
157
F i n a n c i n g E d u c a t i o n i n M o l d o v a
students. Additionally, the quality of education delivered decreased significantly, mainly
as a result of the cumbersome process of turning old general schools in colleges and
high schools.
Access of rural students to high schools is difficult. One impediment is the lack
of transportation; the second is the absence of accommodation for the students. The
central government’s solution is to insert “high school” classes into existing rural schools,
as mentioned above.
DIVISION OF RESPONSIBILITIES AMONG LEVELS OF GOVERNMENT
The central government is planning to slowly give up its authority in areas such as
organization, financing, and assessment of education. However, a snapshot of the system
reveals almost complete centralization for all policy competencies, from the determina-
tion of policy standards in education to the execution of policy.
The allocation of education responsibilities among different levels of government is
regulated by the Law on Education 547/95, the Law on Local Public Finances 123/2003,
and other secondary legislation. According to the Law on Local Authorities (Articles
10–13), first-level local governments (municipalities) are responsible for preschool,
primary, and high school education. In some cases, high schools are under the jurisdiction
of a higher administrative level than the municipality, namely the districts (or raions).
The state also delegated professional education, boarding schools, and high school hostels
to raions.4 The principle according to which a high school is considered either under
the municipal or raion subordination is determined by the catchment areas—whether
students are attracted from the municipality only or also from the whole raion.
Local governments can submit proposals for opening, reorganization, and closing
schools.5 The Board of Education6 at the raion level then analyzes the documents and
submits a proposed decision for approval to the Ministry of Education. In the case
of high schools, special, and professional schools that are subordinated to the central
authorities, the Ministry of Education makes the decision. Obviously, the Ministry of
Education needs to submit the ultimate decision for government approval.
Wages, social, and medical insurance expenditures for education personnel are the
responsibility of the deconcentrated departments of the Ministry of Education, at the
level of the raion.
The government frequently transfers new powers and tasks to the raions and local
governments without any financial support. An example of an unfunded mandate is
Governmental Decision 542/2002, which mandates paid housing—or payment of
mortgage interest—by local authorities for young teachers who settle in rural areas. The
Ministry of Education should ensure their salaries. Because the local government revenues
were not high enough to cover this additional expenditure, the law was implemented
158
P U B L I C M O N E Y F O R P U B L I C S C H O O L S
starting in 2006, when the government allocated around EUR 600 per academic year
for each young teacher.7
At present, most of the local governments in the rural areas, as well as a large number
of rural small municipalities, are facing an acute personnel crisis. In order to address this
situation, the Ministry of Education attempted several approaches. One of them was to
overburden existing teachers with larger teaching norms. Currently, many of the teachers
in the rural areas have a norm twice or almost three times higher than teachers in urban
schools. A second approach is requesting a teacher to teach several topics. Finally, retired
teachers were offered their old jobs or new teaching positions.
The ministry is in charge of the overall management of the school, from the orga-
nizational chart to the selection of school directors and teachers. The director of the
school, however, can hire additional teachers if needed, but only with the approval of
the raion. Inspection and monitoring of school performances and finances are ensured
by the deconcentrated offices of the Ministry of Education.
Local governments are responsible for maintenance of schools, while capital works
are under the responsibility of the central government. Capital projects are financed
through categorical grants.
An area that is still untouched is support for private education. Central government
has failed to create adequate conditions to support the growth of private education,
such as a definition of standards or the involvement of the private sector in financing
and management of professional education.
THE BASIC STRUCTURE OF EDUCATION FINANCING
The education budget in fiscal year 2003 represented 26 percent of the state budget
and six percent of GDP.
The main financing sources for education are:
1. State budget, in the form of shared revenues and transfers (grants) for local
governments:
• State taxes, like corporate income tax, personal income tax, and charges from
roads, are a source of shared revenues. Part of the revenues collected are
retained locally, while the remaining portion goes to the central government
budget. The percentage of shared revenues is defined annually by the budget
law. The specific feature of this regulation is that the minimum percentage
of shared revenues to be kept by respective local government should not be
less than 50 percent.8
• Transfers (grants) are calculated by a formula. There are two types of trans-
fers. First, there is a general transfer. The amount of the general transfer is
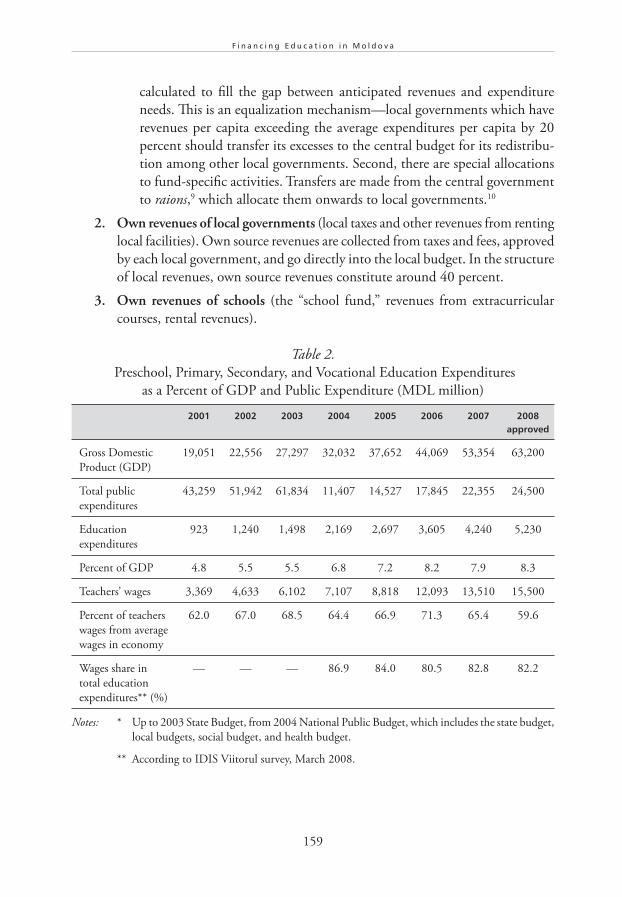
159
F i n a n c i n g E d u c a t i o n i n M o l d o v a
calculated to fill the gap between anticipated revenues and expenditure
needs. This is an equalization mechanism—local governments which have
revenues per capita exceeding the average expenditures per capita by 20
percent should transfer its excesses to the central budget for its redistribu-
tion among other local governments. Second, there are special allocations
to fund-specific activities. Transfers are made from the central government
to raions,9 which allocate them onwards to local governments.10
2. Own revenues of local governments (local taxes and other revenues from renting
local facilities). Own source revenues are collected from taxes and fees, approved
by each local government, and go directly into the local budget. In the structure
of local revenues, own source revenues constitute around 40 percent.
3. Own revenues of schools (the “school fund,” revenues from extracurricular
courses, rental revenues).
Table 2.
Preschool, Primary, Secondary, and Vocational Education Expenditures
as a Percent of GDP and Public Expenditure (MDL million)
2001 2002 2003 2004 2005 2006 2007 2008 approved
Gross Domestic
Product (GDP)
19,051 22,556 27,297 32,032 37,652 44,069 53,354 63,200
Total public
expenditures
43,259 51,942 61,834 11,407 14,527 17,845 22,355 24,500
Education
expenditures
923 1,240 1,498 2,169 2,697 3,605 4,240 5,230
Percent of GDP 4.8 5.5 5.5 6.8 7.2 8.2 7.9 8.3
Teachers’ wages 3,369 4,633 6,102 7,107 8,818 12,093 13,510 15,500
Percent of teachers
wages from average
wages in economy
62.0 67.0 68.5 64.4 66.9 71.3 65.4 59.6
Wages share in
total education
expenditures** (%)
— — — 86.9 84.0 80.5 82.8 82.2
Notes: * Up to 2003 State Budget, from 2004 National Public Budget, which includes the state budget,
local budgets, social budget, and health budget.
** According to IDIS Viitorul survey, March 2008.
160
P U B L I C M O N E Y F O R P U B L I C S C H O O L S
At the time of budget preparation, the Ministry of Finance communicates the
methodology of developing the budget to local governments. Local governments need
to present their estimates of expenditures to the Ministry of Finance. They include in
their budget proposals the school budgets.
School budgets are composed using the number of potential students in the raion at
the beginning of the year and at the end of reporting year. These numbers are provided by
the Statistics and Sociology Department. Next, based on the existing school population,
average expenditures are estimated. This approach introduces several distortions. In the
case of preschools, for example, only around 60 percent of the students are currently
enrolled in preschool education. However, current budget planning starts from the
assumption that all students aged three to six in each raion are enrolled, and average
costs are used to create the budget proposal. The planned budgets reflect much higher
needs than reality. The same goes for primary and secondary education.
Between 1998 and 2003, financing of education was made through a block grant
(general transfer) which was calculated on the basis of expenditure norms. Local authori-
ties enjoyed significant discretion over the allocation of the block grant for various local
services. However, given that the need of local governments was constantly larger than
the transfer received, one of the results was that teacher salaries became secondary in
importance and, in many cases, teachers would not receive their salaries for three to
six months. To address this issue, the central government went back to the system of
categorical grants in 2003.
Currently, salary expenditures are secured in a conditional grant allocated to local
governments through annual budget laws. The central government sends the funds for
salaries to the raions, and the raions pay the school personnel directly. The local govern-
ment records the salary payments in its accounting system, though it neither sees nor
“touches” the money.
The raions also pay funds for maintenance. Capital grants are allocated in the state
budget by the central government and sent directly to the local governments, which
pay on behalf of the school (the school is tertiary budget coordinator).
Maintenance amounts to about 20 percent of the education portion of the local
budget, and is co-financed by local governments. In order to cover this need, local
governments should routinely allocate twice the grant received from the center. While
wealthier local governments have managed to cover this need, poorer local governments
have been critically underfunded for maintenance.
More than maintenance, the financing of major school repairs by local governments
is on the decrease. Within tight budget constraints, their contribution amounts to more
than half of the total capital expenditures.
Parents of students are an important contributor to the education budget in Moldova.
It is current practice that parents contribute to teachers’ salaries. In Chisinau, for example,
teachers can receive about one additional salary that has been collected by the parents.
161
F i n a n c i n g E d u c a t i o n i n M o l d o v a
ASSESSMENT OF EXISTING FRAMEWORK FOR EDUCATION FINANCING
Good Governance and Improvement of the Education System
The main problems of the education system in Moldova are the unclear allocation of
responsibilities between levels of government, incoherent fiscal decentralization reforms,
and, as a result, significant gaps between the autonomy of local communities, as it is
defined in various policy documents, and how this actually takes place.
The efficiency of the school network is hindered by several factors:
• In Moldova’s northern and southern regions especially, the distance between
rural communities is large. This significantly increases the cost of transportation
if a consolidation of schools is undertaken.
• Many districts have a high level of ethnic diversity, which means teaching in
several languages aside from the official one. This increases teaching costs in
schools, where topics can be taught in two languages (Moldavian and Russian),
if consolidation is considered.
• A continuous decrease in student population.
• School infrastructure is a holdover from the Soviet times and is very expensive
to maintain.
The average number of students in a class is around 22, though this indicator differs
from district to district.
The vast majority of small local governments have slight deviations from the national
average. There are two extremes, however. In one, municipalities of Chişinău and Bălţi
have over 25 students in class, while the other six districts (at the bottom of Table 3)
have less than 20 students. Additionally, in some urban areas, there are schools with a
few classes with over 34 students. This is a result of not just a gradual decrease in the
student population,11 but also of recent migration of students from the rural to urban
areas. Obviously, this increases the pressure over local governments in terms of school
network rationalization.
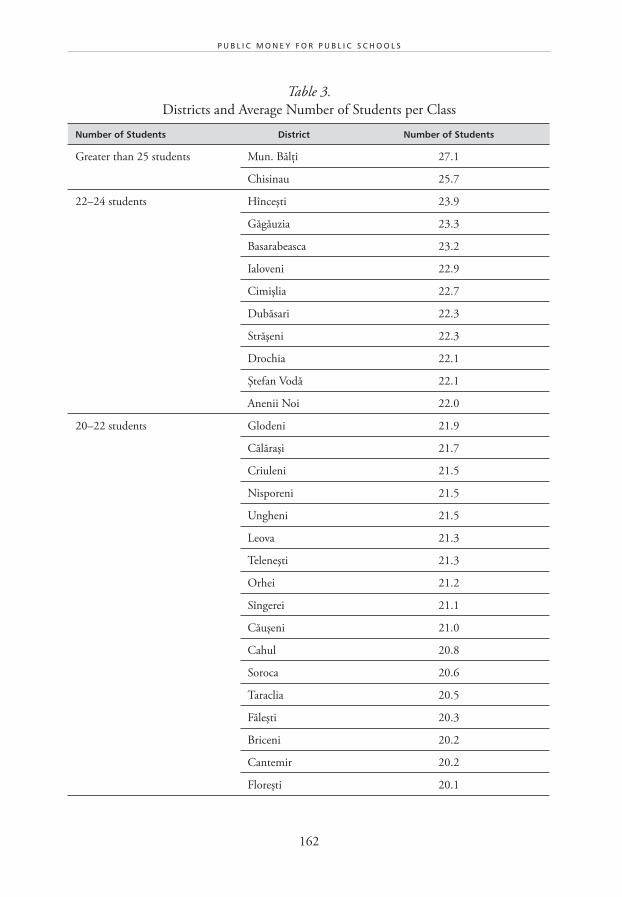
162
P U B L I C M O N E Y F O R P U B L I C S C H O O L S
Table 3.
Districts and Average Number of Students per Class
Number of Students District Number of Students
Greater than 25 students Mun. Bălţi 27.1
Chisinau 25.7
22–24 students Hînceşti 23.9
Găgăuzia 23.3
Basarabeasca 23.2
Ialoveni 22.9
Cimişlia 22.7
Dubăsari 22.3
Străşeni 22.3
Drochia 22.1
Ştefan Vodă 22.1
Anenii Noi 22.0
20–22 students Glodeni 21.9
Călăraşi 21.7
Criuleni 21.5
Nisporeni 21.5
Ungheni 21.5
Leova 21.3
Teleneşti 21.3
Orhei 21.2
Sîngerei 21.1
Căuşeni 21.0
Cahul 20.8
Soroca 20.6
Taraclia 20.5
Făleşti 20.3
Briceni 20.2
Cantemir 20.2
Floreşti 20.1
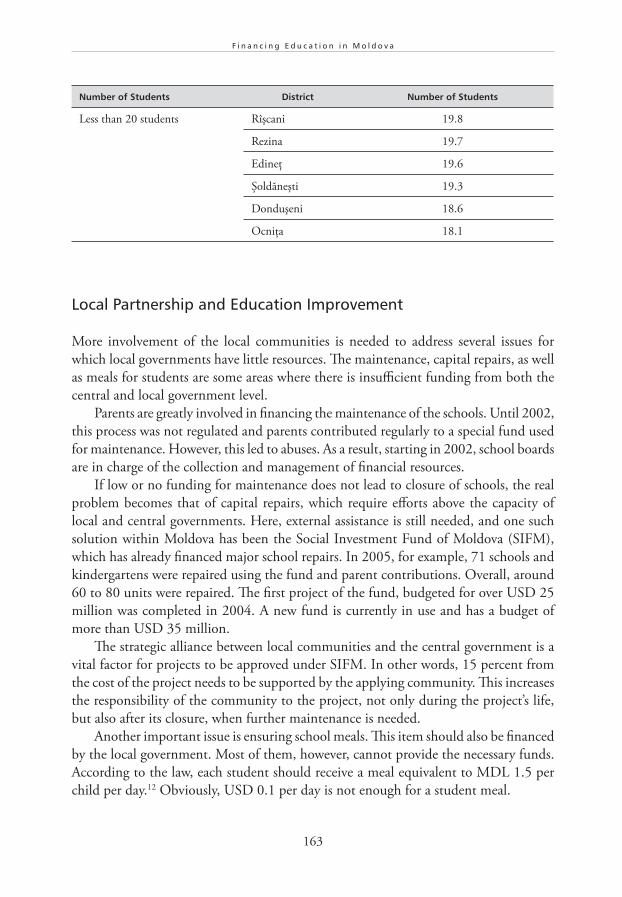
163
F i n a n c i n g E d u c a t i o n i n M o l d o v a
Number of Students District Number of Students
Less than 20 students Rîşcani 19.8
Rezina 19.7
Edineţ 19.6
Şoldăneşti 19.3
Donduşeni 18.6
Ocniţa 18.1
Local Partnership and Education Improvement
More involvement of the local communities is needed to address several issues for
which local governments have little resources. The maintenance, capital repairs, as well
as meals for students are some areas where there is insufficient funding from both the
central and local government level.
Parents are greatly involved in financing the maintenance of the schools. Until 2002,
this process was not regulated and parents contributed regularly to a special fund used
for maintenance. However, this led to abuses. As a result, starting in 2002, school boards
are in charge of the collection and management of financial resources.
If low or no funding for maintenance does not lead to closure of schools, the real
problem becomes that of capital repairs, which require efforts above the capacity of
local and central governments. Here, external assistance is still needed, and one such
solution within Moldova has been the Social Investment Fund of Moldova (SIFM),
which has already financed major school repairs. In 2005, for example, 71 schools and
kindergartens were repaired using the fund and parent contributions. Overall, around
60 to 80 units were repaired. The first project of the fund, budgeted for over USD 25
million was completed in 2004. A new fund is currently in use and has a budget of
more than USD 35 million.
The strategic alliance between local communities and the central government is a
vital factor for projects to be approved under SIFM. In other words, 15 percent from
the cost of the project needs to be supported by the applying community. This increases
the responsibility of the community to the project, not only during the project’s life,
but also after its closure, when further maintenance is needed.
Another important issue is ensuring school meals. This item should also be financed
by the local government. Most of them, however, cannot provide the necessary funds.
According to the law, each student should receive a meal equivalent to MDL 1.5 per
child per day.12 Obviously, USD 0.1 per day is not enough for a student meal.
164
P U B L I C M O N E Y F O R P U B L I C S C H O O L S
Since 2000, an international organization was the main financing source for the
meal program. In 2004, when the program ended, the organization started to look for
additional financing solutions. They contacted a local organization (IDIS Viitorul), and
together they organized a number of conferences on the local, regional, and national
levels where they promoted the creation of extrabudgetary funds at the local level as a
source of financing school meals for students. More details on this initiative are described
in Appendix 2.
Flaws in the fiscal framework also lead to inefficiency. One specific issue is inefficient
expenditure norms elaborated by the Ministry of Finance. Expenditure estimates are
based on the availability of resources rather than on need. Expenditure needs should
be assessed based on real needs, such as the percentage of elderly in the population or
the number of school-age children.
Exemplifying this is the estimate of maintenance expenditures, which are now
calculated based on the number of students. As a consequence, small rural locations
that have a reduced number of students also have a disadvantage compared to bigger
locations. While there is a causality between these two variables, there are several other
ways to better reflect the needs—and use it for budget-planning purposes—such as the
use of coefficients.
This would involve using a coefficient such as k1 = 1.3 for those local governments
with a population lower than 1,000 inhabitants. In order to encourage local authorities
to concentrate resources, and to avoid opening schools in very small locations, another
adjusting coefficient could be used where students need to walk more than seven kilo-
meters to the school (such as k2 = 1.2).
The final calculation of the cost for a student who has to attend school in another
locality could be performed in the following way:S = S0 x k1 x k2, in which S0 is the
amount allocated for a student regardless of the location, and S is the adjusted amount
received in the case of a small local government where students need to walk more than
seven kilometers to school.13
CONCLUSION
The Overall System for Financing Education
Until 1998, education was financed using categorical grants for each budget item.
In other words, local governments would receive money separately for each education
function (salaries, maintenance, etc.), and could not change the destination of the
funds. Starting from 1999, when local self-governance became the goal for public
administration reform, the financing of education used a single per-student norm.
165
F i n a n c i n g E d u c a t i o n i n M o l d o v a
Still many municipalities encountered difficulties in organizing the educational
process and providing a well-functioning school. As a result, many of them were
delaying payment of teachers’ wages. Then the central government returned to
a more centralized system, where teacher salaries are now paid directly from the
national budget to schools. Paradoxically, the local budget is adopted together with
teachers’ salaries (50–70 percent of the local budget), though the local authorities actually
manage only 30–50 percent of the budget. Moreover, beginning in 2002, the teachers’
wages have increased much faster when compared to the norms for this item. If, in 2001,
salaries constituted around 50–60 percent of the budget for education, then at present
it may reach 70–90 percent. The remainder of the budget is insufficient to ensure the
minimum funds necessary for the functioning of schools, and local governments are too
constrained to allocate own revenues to education. Presently, the vast majority of local
governments at the community level provide only one single service—education.
The current model used to estimate costs has a set of deficiencies:
• the aggregated funding level is calculated per student, whereas teacher salaries
are determined on the basis of hours taught;
• the number of classes decreases from year to year, and in rural localities the
number of groups with less students increases, a consequence of demographics
in the republic;
• schools are allocated almost equal amounts for electricity, heat, water, etc., while
the tariffs for these services vary across the country. Regional discrepancies in
financing maintenance occur as a result of an inefficient expenditure norm
calculated based on average expenditures. This affects the rural schools which
have greater needs for financing.
A New Methodology to Calculate Normative Education Expenditures
The current legislation does not clearly stipulate the competences of each administra-
tive level, nor does it guarantee the financing sources necessary for the performance of
these competences. As a consequence, a doubling-up of competences and confusion in
the implementation of functions very often happens. The financing arrangements also
reflect the lack of clarity in the allocation of responsibilities.
In the short term, the existing system should be altered by introducing an adjustment
coefficient that could add to the existent expenditure norms. For the small localities, an
adjustment coefficient of 30–40 percent should be used. In other words, these localities
should get 30–40 percent over the basic sum. In the long term, however, a completely
new financing system should be created.
166
P U B L I C M O N E Y F O R P U B L I C S C H O O L S
To that end, the following steps could be taken:
1) Create sectoral legislation, including a separate law for the allocation of respon-
sibilities in education for each administrative level. The delimitation of compe-
tences should be accomplished considering the following: (i) administrative
capacity and (ii) the right of decision-making for the qualified authorities.
More specifically, maintenance should be under the authority of local govern-
ments, while capital investments should be undertaken by the raions. This way,
this delimitation of authorities will ensure the good functioning of the educa-
tional system: each administrative level will have total freedom concerning the
decisions regarding the modality of organizing the education within its limits of
empowerment. The municipalities should have the right to decide how to heat,
repair, or purchase materials for their schools. The raions should be empowered
to decide, where, when, and how will the capital investments be performed.
And the state should decide about the size of teachers’ salaries. This way, the
decisions taken by one level will not affect other levels.
2) Reform of the system of public finances. At present, local governments are
completely dependent on the raions and the central government in terms of
collecting revenues and managing expenditures. Local governments have no
discretion in drafting local budgets; local budgets are adopted by the raion
council and further approved by the Ministry of Finance. A new system of local
public administration has to be conceived in a way so that each administrative
level receives sufficient own resources, in order to be able to exercise its own
competences established by law.
In other words, in Moldova, the improvement of the system of education financing
should include a more clear allocation of responsibilities and a local government finance
system that would enhance local fiscal autonomy.
NOTES
1 No. 337-XIII/1994.
2 Until 1996, Moldova had two parallel education systems: one based on the Soviet system
and the new one. In the first system “general education” was provided, which meant that no
distinction was made between primary and secondary, so one school would host students
for both levels. Today, there are still many schools where the two systems coexist, where half
of the school studies according to the Soviet system and the other half (usually the better
students) studies in a system divided by lower- and upper-secondary education. The closure
of the old general schools should be finalized by 2010.
167
F i n a n c i n g E d u c a t i o n i n M o l d o v a
3 The so-called “high school classes.”
4 Until 1999, Moldova was divided into 33 raions, each of them with a population of
70,000–90,000 people. After the 1999 reform, 12 districts were created and replaced the
raions. The districts, however, were less developed economically than the raions, and could
not address the problems that were under the jurisdiction of raions. This was a perfect reason
for the Communist Party to return to the raion system in 2003, putting a halt to all reforms.
Districts lost responsibility for boarding schools, high school hostels, special boarding schools,
professional schools, and art schools. The 2003 halt severely affected the autonomy of local
governments, to the degree that in 2005 Moldova was at risk of being eliminated from the
Council of Europe. At present, Moldova has an obligation towards the Council of Europe
to improve the quality of local autonomy, including in the domain of education.
6 Article 40/1, Law of Education 547/1995.
7 The boards of education at the raion level are a strange mixture of local and deconcentrated
government. The raion is secondary local government. Each raion is governed by a locally-
elected council. Raion councils elect executive committees from among their members.
The board of education employees are, however, under the jurisdiction of the Ministry of
Education. Essentially, a local government level is running a deconcentrated department of
the ministry.
7 This was accomplished with the support of external assistance. It is not clear whether the
program will be implemented further.
8 Given the economic reality of Moldova, the only local governments that share its revenues
with the central government are local authorities of municipalities of Chisinau (the capital)
and Balti (the second largest city). All other territorial units keep their full revenues from
“taxes on business activity” (FY 2006 State Budget, Appendix 23). For more details, see
Morozov (2006).
9 There are no clear rules for allocation. In practice, the “list of needs” is established based on
a per-capita normative revised by each raion, using its own methods. This creates a situation
where the norms included in the transfer calculations received from the state budget do not
correspond with those included in the transfers from raions to local governments. Therefore,
some local governments receive more transfers than others of the same size. In an attempt
to make the allocation process more transparent and predictable, some raions (Orhei, for
example) created their own coefficients in order to offer transparency and predictability in
allocating funds to local governments. These coefficients are not monitored by the central
government.
10 The Municipality of Chisinau receives the least transfer revenue (just five percent of its total
revenue comes from general transfers). The remaining local governments account for 10
percent up to 80 percent of their total revenue from general transfers.
11 In the last three years the number of students decreased by 30 percent.
12 USD 1 = MDL 12.5.
13 This is a proposal of IDIS Viitorul, suggested in 2002, that was tested in eight local govern-
ments from three regions in Moldova.
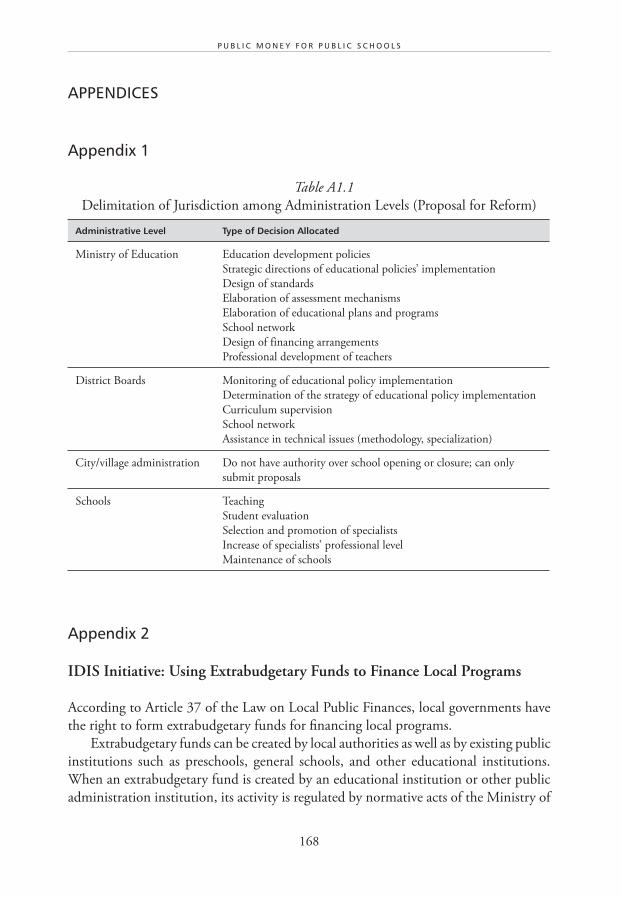
168
P U B L I C M O N E Y F O R P U B L I C S C H O O L S
APPENDICES
Appendix 1
Table A1.1
Delimitation of Jurisdiction among Administration Levels (Proposal for Reform)
Administrative Level Type of Decision Allocated
Ministry of Education Education development policies
Strategic directions of educational policies’ implementation
Design of standards
Elaboration of assessment mechanisms
Elaboration of educational plans and programs
School network
Design of financing arrangements
Professional development of teachers
District Boards Monitoring of educational policy implementation
Determination of the strategy of educational policy implementation
Curriculum supervision
School network
Assistance in technical issues (methodology, specialization)
City/village administration Do not have authority over school opening or closure; can only
submit proposals
Schools Teaching
Student evaluation
Selection and promotion of specialists
Increase of specialists’ professional level
Maintenance of schools
Appendix 2
IDIS Initiative: Using Extrabudgetary Funds to Finance Local Programs
According to Article 37 of the Law on Local Public Finances, local governments have
the right to form extrabudgetary funds for financing local programs.
Extrabudgetary funds can be created by local authorities as well as by existing public
institutions such as preschools, general schools, and other educational institutions.
When an extrabudgetary fund is created by an educational institution or other public
administration institution, its activity is regulated by normative acts of the Ministry of
169
F i n a n c i n g E d u c a t i o n i n M o l d o v a
Finance. When the fund is created by local authorities its activity is regulated by the
Law on Local Public Finances.
The best way of extrabudgetary fund creation is at the local level, which would almost
exclude direct any implication of the central authorities within the process.
According to the Law on Public Authorities, the set up of extrabudgetary funds is
within the jurisdiction of local or raion councils. There exists a rule that must be observed
during the entire period of the extrabudgetary fund’s existence: every financial operation
has to be executed with well-written documentation.
According to the Fiscal Code (Article12, p. 3) and Law on Local Public Finances
(Article 37, p. 3), the accumulation and utilization of financial funds is performed using
a special account of a specific organization opened at territorial treasury.
According to the Law on Public Local Finances (Article 37, p. 2) and the Law
on Budgetary System and Budget Process (Article 12), extrabudgetary reserves are
formed of:
• Voluntary contributions of physical persons and legal entities;
• Revenues obtained from local lotteries, competitions, and other activities orga-
nized by local authorities;
• Revenues of institutions obtained from services rendered, works executed, or from
other activities allowed according to the legislation and other regulating acts.
The most important problem society faces in the process of this fund formation is
the question of how to attract the interest of donors. As a rule, people will only grant
money for solutions to real problems. If we try to create an extrabudgetary fund for the
solution of the problems, the essence of which are not understood by the population,
we will likely meet failure. The only solution is to explain the work to the population.
Obviously, people better understand problems they face directly. For example, parents are
aware of the question of meals provided in school, and as a consequence they are potential
partners in any fund created to address this problem. We should take into consideration
the fact that they are, at the same time, representatives of local entrepreneurs.
According to Article 2 of the Law on Philanthropy and Sponsorship 1420-XV,
October 2002, sponsorship is considered as the financing of programs or activities
within the domain of education, but Article 21 of this law presumes some tax conces-
sions for grantors, which are stipulated in the Fiscal Code (Article 36, p. 1). The grantor
can deduct from taxable income expenses that deal with philanthropic or sponsorship
activity, but the deducted sum cannot exceed 10 percent of taxable income.
In order to have access to the above mentioned tax concessions, there exists the
necessity of these donations’ confirmation according to the legal framework that is
stipulated in the Regulation on Philanthropic or Sponsorship Donations (Number
489) from May 1998.
170
P U B L I C M O N E Y F O R P U B L I C S C H O O L S
According to the form of donation, they can be confirmed:
• If donations were made in a monetary form, and a confirming document is
supplied from the donor in a free form that attests receiving of money free of
charge and which is signed by the director and chief accountant of organization
or beneficiary.
• In the case of donations of non-monetary origin, the confirmation of the dona-
tion can be made in the following way: donation contract is concluded in a free
from, but in written form and in case of donation in the form of real estate a
deed should be registered.
Thus, a simple receipt that contains two written rows, where the donation amount
is indicated, needs to be issued. It is sufficient to show this document to the fiscal
authorities. It is valid and for physical persons when there appears necessity to present
a declaration of revenues.
Aside from sponsorship, there are other ways to replenish extrabudgetary funds. If a
city/village administration or other public institution obtain some revenues, then upon
decision of local council, the partial or full amount of these funds can be assigned to
extrabudgetary funds. First, these actions permit directional usage of resources obtained.
Second, there problems can be eliminated throughout the process of the transfer-sums
calculation. In some cases, when a city/village administration obtained revenues that
were not planned in the location’s budget, district authorities can reduce the sum of
transfers designed for this administration. In other words, in this case cash flow does
not change, and the local administration has no interest in the increase of the location’s
budget revenues. As a rule, an increase in local budget revenues results in a decrease of
transfers from district or state budget. That is why the importance of additional resources
transfers in extra budgetary funds cannot be misunderstood.
One of the advantages of extrabudgetary funds is that when using financial resources
through them, expenses decrease up to 20 percent, as stipulated by the Fiscal Code,
Chapter 4, Article103, paragraph 1.4, which states that:
VAT is not paid on the resources from the state budget and extra-
budgetary funds for special purposes for financing different activities,
with the condition that these funds constitute no less than 40 percent
of the total funds designed for these activities.
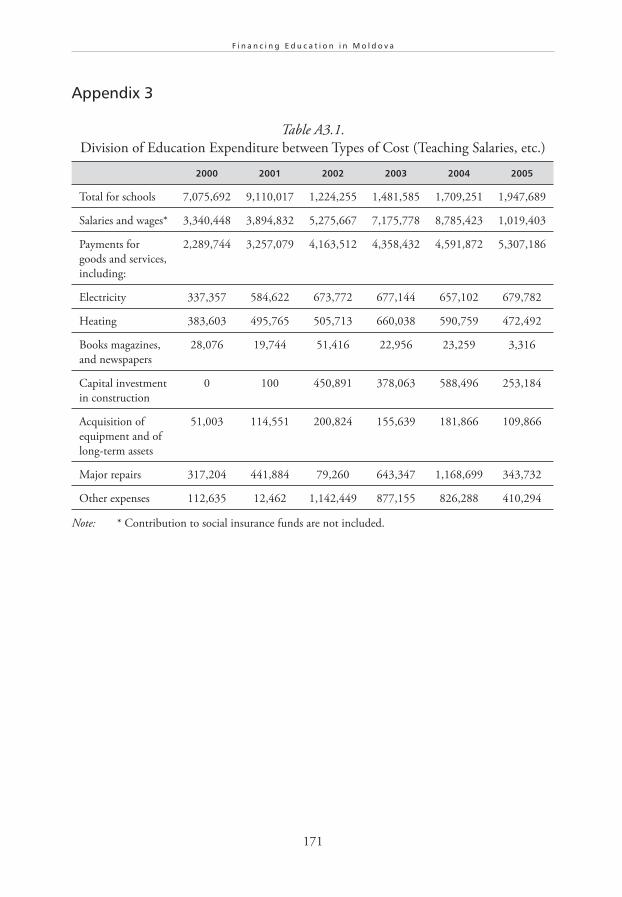
171
F i n a n c i n g E d u c a t i o n i n M o l d o v a
Appendix 3
Table A3.1.
Division of Education Expenditure between Types of Cost (Teaching Salaries, etc.)
2000 2001 2002 2003 2004 2005
Total for schools 7,075,692 9,110,017 1,224,255 1,481,585 1,709,251 1,947,689
Salaries and wages* 3,340,448 3,894,832 5,275,667 7,175,778 8,785,423 1,019,403
Payments for
goods and services,
including:
2,289,744 3,257,079 4,163,512 4,358,432 4,591,872 5,307,186
Electricity 337,357 584,622 673,772 677,144 657,102 679,782
Heating 383,603 495,765 505,713 660,038 590,759 472,492
Books magazines,
and newspapers
28,076 19,744 51,416 22,956 23,259 3,316
Capital investment
in construction
0 100 450,891 378,063 588,496 253,184
Acquisition of
equipment and of
long-term assets
51,003 114,551 200,824 155,639 181,866 109,866
Major repairs 317,204 441,884 79,260 643,347 1,168,699 343,732
Other expenses 112,635 12,462 1,142,449 877,155 826,288 410,294
Note: * Contribution to social insurance funds are not included.
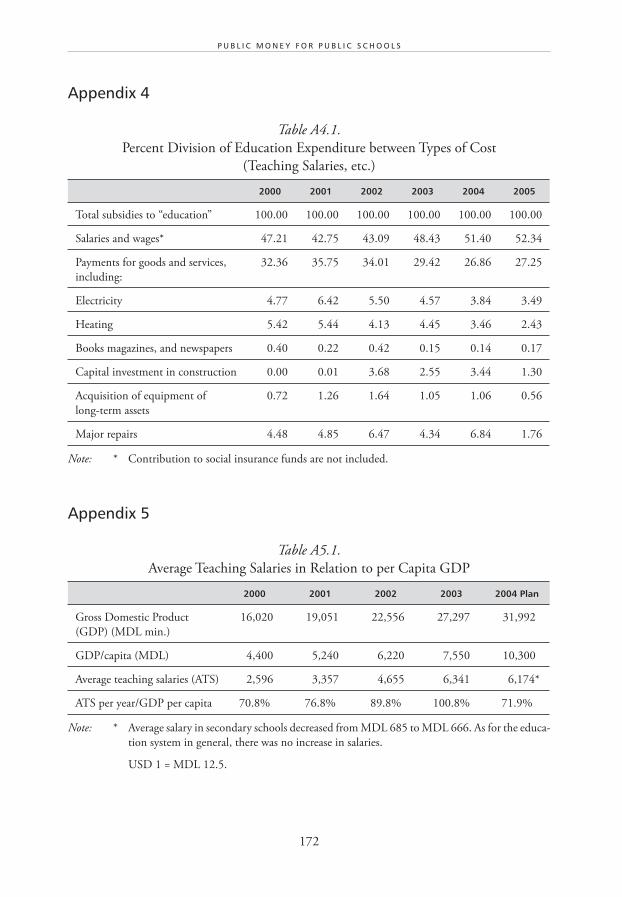
172
P U B L I C M O N E Y F O R P U B L I C S C H O O L S
Appendix 4
Table A4.1.
Percent Division of Education Expenditure between Types of Cost
(Teaching Salaries, etc.)
2000 2001 2002 2003 2004 2005
Total subsidies to “education” 100.00 100.00 100.00 100.00 100.00 100.00
Salaries and wages* 47.21 42.75 43.09 48.43 51.40 52.34
Payments for goods and services,
including:
32.36 35.75 34.01 29.42 26.86 27.25
Electricity 4.77 6.42 5.50 4.57 3.84 3.49
Heating 5.42 5.44 4.13 4.45 3.46 2.43
Books magazines, and newspapers 0.40 0.22 0.42 0.15 0.14 0.17
Capital investment in construction 0.00 0.01 3.68 2.55 3.44 1.30
Acquisition of equipment of
long-term assets
0.72 1.26 1.64 1.05 1.06 0.56
Major repairs 4.48 4.85 6.47 4.34 6.84 1.76
Note: * Contribution to social insurance funds are not included.
Appendix 5
Table A5.1.
Average Teaching Salaries in Relation to per Capita GDP
2000 2001 2002 2003 2004 Plan
Gross Domestic Product
(GDP) (MDL min.)
16,020 19,051 22,556 27,297 31,992
GDP/capita (MDL) 4,400 5,240 6,220 7,550 10,300
Average teaching salaries (ATS) 2,596 3,357 4,655 6,341 6,174*
ATS per year/GDP per capita 70.8% 76.8% 89.8% 100.8% 71.9%
Note: * Average salary in secondary schools decreased from MDL 685 to MDL 666. As for the educa-
tion system in general, there was no increase in salaries.
USD 1 = MDL 12.5.
C H A P T E R 6
Financing Education in Romania:
A Legacy of Incomplete Reforms
Casandra Bischoff and Jan Herczyński 1
Interdisciplinary Center for Mathematical and Computational Modelling ICM Warsaw University, Poland
Insterdyscyplinarne Centrum Modelo-wania Matematyczne i Komputerowego ICM
Uniwersytet Warszawski, Polska

175
F i n a n c i n g E d u c a t i o n i n R o m a n i a : A L e g a c y o f I n c o m p l e t e R e f o r m s
Executive Summary
Today’s reformers of the education sector in Romania have inherited a deeply fragmented
management and financing system embedded in a confused decentralization framework.
Their task is to review the results of 18 years of incomplete reforms and to design a realistic
and forceful strategy to complete them. This chapter aims to help the Romanian Ministry
of Education, Research, and Youth (MERY) and its regional and county departments as well
as local authorities in this regard.
A timeline of reform for the first and second half of the 1990s would place the reform
in two phases of planning and partial implementation, respectively. The pace then slowed
until 2004 when a new framework was tested in some pilot counties in order to strengthen
school autonomy. New laws are about to come into effect at the time of writing that will
formalize new arrangements for preschools and school staff but the reform will stall without
further incentives and political will.
Several problems lie in the path of Romania reformers. The primary student population
has declined by 11 percent in five years from 2001 to 2007 and this decline will soon hit the
secondary schools. Over 1,300 rural schools have fewer than ten students, with an average
of 53 students per school in rural areas compared to 345 students per school in cities. This
inherited fragmented network of rural schools is creating almost insurmountable barriers to
efficient and equitable education in rural areas. Over 20 percent of primary school gradu-
ates do not continue to secondary or vocational schools. Secondary education faces its own
serious challenges. Vocational education is overburdened with large student numbers per
teacher compared to elite general academic schools. Low salaries have contributed to many
teachers seeking additional employment or lessons.
As Romania gradually shed the economic, political, and social trauma of communism,
its leaders maintained a centralized state where power was based on regional represen-
tatives of the central government in 42 counties (judete). The education system was no
different. Deconcentrated units of MERY, the county school inspectorates (Inspectorul Scolar
Judetian), were responsible for implementing national norms in the education sector in the
respective county under its authority. This system, whereby staff, costs, directors, expen-
ditures, and policy have been decided for each school by the inspectorates, by default the
central government, is still in place in 2008 (except for the eight counties under a limited
pilot project since 2004, with no plans for replication nationwide). This not only precluded
the creation of a system of more autonomous and accountable schools, but also excluded
local governments from playing a major role in the sector. At the same time, however, this
176
P U B L I C M O N E Y F O R P U B L I C S C H O O L S
centralized system was able to implement centrally mandated curriculum, textbook, and
teacher training reforms.
In 1995, a new education law (No. 85) guaranteed children the right to free education
free of ideology. Administrative boards were established, along with other school manage-
ment structures; but giving them real power to make decisions was indefinitely postponed
by the central government. At the same time, the law made local governments responsible
for budgeting and financing maintenance, deepening the differences between the cities and
rural areas. This is because the main revenues of the county and local councils are shares
of local taxes, although a relatively weak national equalization fund is also in place. Local
governments have a fair degree of discretion in the area of funding maintenance. At the
same time, teacher and non-teacher salaries are the exclusive domain of the inspectorates
and MERY. Although the funds for salaries nominally flow through the judete budgets, under
a perverse system of sume defalcate, their use is tightly controlled by the center.
Under the terms of the Programmatic Adjustment Loan of 2004 from the World Bank,
Romania recommitted to the decentralization of education finance and management, in
the context of a larger reform of public administration. This has yet to be translated into
law, even if the framework and proposals were there in 2004, while the debate about
targeting decentralization to schools or local governments remained unresolved. Conflicts
in the current legislation have confusingly assigned fiscal and management responsibility
to all parties, including the central government. Except in eight pilot counties, the county
inspectorates control the opening, management, and closing of kindergartens, primary and
middle schools, and vocational and scholarship schools; they hold the contracts with the
school directors, not the local government or wider community.
Financing arrangements are also complicated by inconsistencies in the new education
law of 2004 (No. 354) on financial flows for education (own revenues or education grant)
and fragmentation in the financing system. Difficulties of setting the basic-per-student cost
standard and unresolved debates over the criteria of the methodological norms that should
determine it have stalled effective implementation of the law. A lack of a clear leadership
regarding education decentralization and disagreements between different ministries have
been counterproductive to meaningful progress.
In theory, the new legislation supports decentralization as a basic management principle
for managing and financing education with a per-student cost standard mandated by the
central government. Costs are supposed to be calculated according to differences in basic,
complementary, and compensatory financing, although the definitions of these categories
are confusing. The National Council for Pre-university Education Financing should be respon-
sible for determining this amount in consultation with other stakeholders. But without an
177
F i n a n c i n g E d u c a t i o n i n R o m a n i a : A L e g a c y o f I n c o m p l e t e R e f o r m s
effective assessment mechanism to measure whether the standard cost is appropriate, this
institution has not been very assertive under the watch of its parent organization, MERY.
No established system of cost standard has been so far discussed and approved, and thus
the financial provisions of the 2004 law remain unimplemented.
A specific Romanian dissolution of budgetary responsibility, called a “budgeting
vacuum” in the report, contributed both to underfinancing and to low external efficiency.
Consequently, Romania sits at the bottom of the scale for resources devoted to education
in the region (3.1 percent of GDP in 2001, compared to an OECD average of five percent),
even if overall spending has increased. A dramatic fall in student numbers (annually five
percent) has exacerbated the inefficiencies in the school system. Disparities between rural
and urban localities are not effectively addressed, leading to inequity.
It does not seem likely that the confused managerial and financial arrangements
plaguing Romanian education can be reformed without a more fundamental review of what
Romania wants to do with its centralized governance system. The Ministry of Education,
Research, and Youth needs to develop a coherent decentralization strategy, in line with the
overall decentralization process, and to address the main real challenges, that is fragmented
school networks, a low scholarization rate for secondary education, and inadequate educa-
tion quality. This, in turn, may create a space for informed discussions regarding what cost
standards are needed and how they should be implemented.
178
P U B L I C M O N E Y F O R P U B L I C S C H O O L S
INTRODUCTION
In the early 1990s, all transition countries faced significant problems in developing new
management and financing structures for their education systems, and Romania was no
exception. The economic decline was severe and recovery much delayed. Turbulent polit-
ical processes did not create the stability necessary for a measured and rational devolution
of authorities from the highly centralized education system characteristic of communist
regimes. In those adverse circumstances, Romania did make remarkably determined efforts
in modernizing, streamlining, and decentralizing its education sector. It is, nevertheless,
not surprising that those efforts were not fully consistent or coordinated.
Today’s reformers of Romanian education have inherited a deeply fragmented
management and financing system, embedded in a confused decentralization framework.
Their task is to review the results of 18 years of incomplete reforms of the sector, and to
design a realistic and forceful strategy to complete those reforms. The present report, in
part, aims at helping the Ministry of Education, Research, and Youth (MERY) achieve
the first of those objectives.
The identification of stages of education reform in Romania has been subject to
much discussion (for instance, Velea and Botnariuc 2002, Halasz 2002, Berryman et al.
2006), and is largely dependent on the focus of specific research.2 However, the focus of
education finance, adopted in the present report, justifies the following timeline:
• 1990–1995: preparatory phase, during which most of the reforms were reactions
to the excesses of the communist period, including de-communization and
removal of overly ideological education content; the focus was the adoption of
an interim curriculum; the reforms were introduced in legal documents of the
government of Romania (ordinances and decisions) and of MERY (orders), and
implemented by the ministry and by deconcentrated county offices of MERY
Inspectoratul Scolar Judetean (ISJ); the preparatory phase concluded with the
adoption of the Law on Education 85/1995 (it reduced obligatory schooling to
eight years); the school finances were still completely centralized through ISJ.
• 1995–2000: reform phase, based on the new education law and supported by
World Bank projects3 and by the EU;4 a new coherent national curriculum
was defined (including a balance between the compulsory and elective courses)
and multiple textbooks introduced (three or four textbooks per each grade and
subject); the implementation of the reforms was in part delegated to a number of
national councils working alongside the ministry; in 1999 compulsory education
was extended to nine years of education; the financing of school maintenance
was devolved to local governments, while a principle of per-student financing
was put into Law 85/1995, although never implemented; in 2001 the funds for
school staff salaries were channelled through local budgets, thus creating some
tension as they are still fully controlled by the ministry.
179
F i n a n c i n g E d u c a t i o n i n R o m a n i a : A L e g a c y o f I n c o m p l e t e R e f o r m s
• 2000–2004: the slowing of reforms, with a reduction of the elective courses in
the school curricula and suspension of further moves towards the increased
autonomy of individual schools; introduction of an incentive mechanism to
attract qualified teachers in rural areas; transfer of capital expenditures to the
level of local governments.5
• In 2004, Romania introduced a new framework of education finance and
management, as described in some detail in Section 2; the framework foresees
increased school autonomy and a new financing system based on standard costs,
though its implementation remained only partial. A number of pilot projects
were designed but only partially implemented.
• In 2008, MERY prepared from education laws, including the new law on pre-
university education and the new law concerning teaching personnel. These new
laws are currently undergoing public debate and will most likely be enforced
starting this year.
The incomplete character and slow implementation of reforms in the education
sector did not allow Romania to effectively tackle its difficult external problems, which it
shares with its neighbors in the region. Following Voicu and Begu (1999), Halasz (2002),
and Herczyński (2005 and 2006), we can propose the following list of main problems,
directly pertinent to the institutional and financial arrangements in education:
• The demographic decline of the student population. Between the school years
2001–2002 and 2006–2007, the number of students in primary schools fell by
11 percent, and the decline will continue at a higher rate still. The decline will
soon hit the secondary education system, too. While in the cities this process
may bring improvements in the class size and allow better access of students
to teachers and to other school resources, in the rural areas this threatens the
financial viability of providing education and will significantly increase the
per-student costs without any improvement in quality.
• The urban-rural divide in education—namely small rural schools providing
education of insufficient quality and lacking qualified teachers and proper
equipment. The operation of these schools threatens the equity of the educa-
tion system and is a source of serious inefficiencies. The average school size is
53 students in rural areas and 345 students in the cities, and over 1,300 rural
schools have fewer than 10 students (Voicu and Begu 1999).
• Insufficient level of transition from primary to secondary education. In the school
year 2006–2007, 97 percent of seven- to 10-year-old children were enrolled in
schools, 95 percent of 11–14 year olds , and only 75.7 percent of 15–18 year
olds (INS 2008). This means that over 20 percent of graduates of primary schools
do not continue their education at all, not even in basic vocational schools.
180
P U B L I C M O N E Y F O R P U B L I C S C H O O L S
• Excessive share of vocational education students in secondary education. In 2006-
2007, the vocational schools taught 23 percent of all secondary school students.
This national average, however, hides significant regional variations. While in
Bucharest 16 percent of all secondary students attend vocational schools, in Iasi
County we find 28 percent (see Appendix, Table A1.1).
• Vocational education has an excessive number of students—namely over 31 students
per teacher, compared to 12 students per teacher in general academic schools
(see Voicu and Begu 1999). This must significantly impact the teaching quality
of vocational schools and reveals an inherited preference for high-quality, elite,
general academic schools.
• Low teacher salaries force many teachers to seek additional part-time employment.
The average teacher’s salary is equal to 0.66 of GDP/capita, a low level compared
to the OECD average of 1.33 of GDP/capita for primary education and 1.37
of GDP/capita for secondary education (see World Bank Education Policy Note
2007). This is a common problem in transitional economies, where govern-
ments are afraid to undertake more active policies with respect to teachers, by
increasing their teaching load to western European standards, decreasing the
number of teachers employed, and raising their salaries. While this is a difficult
strategy to design and implement, without such a strategy it will be difficult to
ensure that all teachers treat their work in schools as their main employment.
Each of these significant problems requires careful analysis, and each has a signifi-
cant impact on the management and financing of Romanian education. Moreover, it
is clear that decentralization limits the range of available policy options, and influences
the costs and manner of implementing those policy options.
In December 2004, a new government was elected. Administrative and fiscal reforms
in Romania were accelerated, in part in response to the challenge of imminent acces-
sion to the European Union. MERY was among the most active participants in the new
reform movement, pressing for a far-reaching decentralization of education. The new
initiatives and programs are, however, beyond the scope of this report, since their full
implementation has not yet really begun.
Accordingly, the structure of this report is as follows. First, we review the education
law of 1995 and the fragmented managerial and financial system it created. Secondly, we
discuss the revised framework introduced in 2004, which tried but failed to complete
the reform process. Thirdly, we describe some key open issues of education finance in
Romania, and in the final section we conclude with some recommendations.
181
F i n a n c i n g E d u c a t i o n i n R o m a n i a : A L e g a c y o f I n c o m p l e t e R e f o r m s
REFORM EFFORTS 1990–2004
The Romanian Centralized Model: Inspectoratul Scolar Judetean
In the early 1990s, as successive political leaders tried to steer the economy away from
collapse, Romania continued to maintain a highly centralized system. This system was
based on regional representatives of the central government in 42 counties (judete),
directly nominated and controlled by the central government. The education sector was
no exception, and the county-level deconcentrated offices of the Ministry of Education
and Research, called Inspectoratul Scolar Judetian (ISJ) or County School Inspectorates,
were responsible for implementing national norms concerning employment conditions,
enrollments, curricula, graduation examinations, budgeting, class sizes, and other func-
tions. They planned the detailed budgets of all their schools, and executed those budgets
under difficult conditions of scarcity and poverty. The inspectorates also controlled the
division of students into classes and the teaching plans of every school, and paid all their
expenses, including salaries. The inspectorates not only nominated school directors,
but also organized the selection process for the employment of teachers and effectively
employed all teachers in the country. Thus, the school directors had little influence on
the selection of their teaching staff. This unique feature of Romanian education is still
operational in 2008 (with the exception of eight counties that have been included in a
pilot program in 2004) and will be discussed in some detail in our report.6
This prolonging of centralization had both fortunate and unfortunate consequences.
On the one hand, during the period of contracting economy and decreasing allocation
for all social functions, the government’s patronage provided some measure of support
and protection and helped ensure some basic standards across Romania. For instance,
the schools were the only national-level institution able to distribute to all students
across the country their fixed monthly allowance.7 On the other hand, the retention of
centralized governance slowed down the development of local governments and more
autonomous and accountable schools. School staff, especially school heads, their deputies,
and accountants, were not learning responsible management of institutions or budgeting
procedures. It also promoted the attitude that pedagogical, organizational, and financing
norms defined in Bucharest were to be the main guidelines for the operation of the
schools, and impeded any moves towards a more rational use of school recourses.
The managerial and financial tasks of the inspectorates, exercised in such difficult
conditions, also made it difficult for them to acquire new skills and capacities, such as
monitoring teaching quality and education results, in preparation for a different future
role in the decentralized education system.
182
P U B L I C M O N E Y F O R P U B L I C S C H O O L S
The Education Law of 1995
1995 is generally considered to represent the first significant step towards education
decentralization in Romania. The work on a new law governing the education sector
was initiated in 1993 and the process was finalized in July 1995. Abrogating the old
education law 28/1978, the new law 85/1995 put Romanian education on a sound
legal basis, guaranteeing education for all children, free of charge, and free of ideological
distortion. For pre-university education there were several innovations. The law estab-
lished administration boards (councils) that could be involved in the administrative
decision-making process. The councils had to include five to 11 members.8 Preparatory
groups at the preschool level were also established to ensure the continuity between
preschool and primary school.
However, while the law laid down the basis of school-based management structures,
it gave schools little power over critical issues such as personnel policies. Recruitment
of the director and teaching staff remained with the central government, through IJS.
According to the law, the inspectorate appointed directors of primary schools for a
four-year term, while the ministry appointed the directors of secondary and vocational
schools.9 Typically, the director was a teacher, who was paid a supplement for under-
taking limited managerial responsibilities, for which he or she had no specific training
or professional accreditation. Only later, in 2004, was the school manager position
institutionalized and the director released from his or her teaching duties.
The new law also introduced two important new elements. The first was to transfer
to local governments the responsibility for financing school maintenance. Article 167
(2) clearly states that, “The repair and maintenance costs of physical and material facili-
ties of pre-university education units are financed by local councils from specific state
budget appropriations and from local budgets, as well as from their own resources.” This
certainly represents a serious step in education finance decentralization in Romania. Its
actual scope and consequences, evident today in the form of substantial fragmentation,
are analyzed next.
The second new element was the requirement that the allocation of funds to each
school be based on a per-student amount. Article 169 (5) says, somewhat cryptically,
that:
The basis for the calculus of allocations to each education unit and
institution represents the amount from the state budget that is decided
per preschooler, schoolchild or student in respect of level and specifics
of the educational process, as well as other indicators specific for educa-
tion, especially those concerning the quality of education.
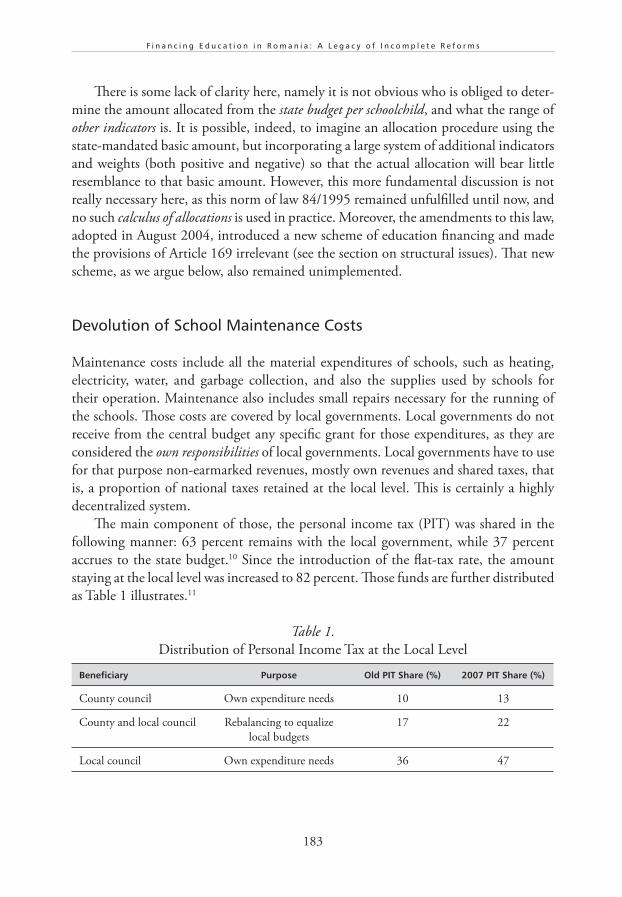
183
F i n a n c i n g E d u c a t i o n i n R o m a n i a : A L e g a c y o f I n c o m p l e t e R e f o r m s
There is some lack of clarity here, namely it is not obvious who is obliged to deter-
mine the amount allocated from the state budget per schoolchild, and what the range of
other indicators is. It is possible, indeed, to imagine an allocation procedure using the
state-mandated basic amount, but incorporating a large system of additional indicators
and weights (both positive and negative) so that the actual allocation will bear little
resemblance to that basic amount. However, this more fundamental discussion is not
really necessary here, as this norm of law 84/1995 remained unfulfilled until now, and
no such calculus of allocations is used in practice. Moreover, the amendments to this law,
adopted in August 2004, introduced a new scheme of education financing and made
the provisions of Article 169 irrelevant (see the section on structural issues). That new
scheme, as we argue below, also remained unimplemented.
Devolution of School Maintenance Costs
Maintenance costs include all the material expenditures of schools, such as heating,
electricity, water, and garbage collection, and also the supplies used by schools for
their operation. Maintenance also includes small repairs necessary for the running of
the schools. Those costs are covered by local governments. Local governments do not
receive from the central budget any specific grant for those expenditures, as they are
considered the own responsibilities of local governments. Local governments have to use
for that purpose non-earmarked revenues, mostly own revenues and shared taxes, that
is, a proportion of national taxes retained at the local level. This is certainly a highly
decentralized system.
The main component of those, the personal income tax (PIT) was shared in the
following manner: 63 percent remains with the local government, while 37 percent
accrues to the state budget.10 Since the introduction of the flat-tax rate, the amount
staying at the local level was increased to 82 percent. Those funds are further distributed
as Table 1 illustrates.11
Table 1.
Distribution of Personal Income Tax at the Local Level
Beneficiary Purpose Old PIT Share (%) 2007 PIT Share (%)
County council Own expenditure needs 10 13
County and local council Rebalancing to equalize
local budgets
17 22
Local council Own expenditure needs 36 47
184
P U B L I C M O N E Y F O R P U B L I C S C H O O L S
The distribution of the local share of the taxes is important, because it demonstrates
several problems, such as the politicization and unpredictability in the financing system,
as described below.
Firstly, about half of the PIT income of local councils is collected by the county
and redistributed among the local budgets according to several rules.12 The rebalancing
is applied to help local councils deliver public services such as education, health, trans-
port, and so on. This politicizes the budget process, in that one level of local govern-
ment is involved in deciding on the budgets of other local governments (local councils)
in the areas in which it does not have managerial responsibility (such as education).
Additionally, it is worth noting that the county council does not have sufficient data
to analyze the sectoral needs of the local councils and therefore has to work in close
collaboration with the school inspector.13 This implies that the deconcentrated MERY
apparatus has some influence over the allocation of maintenance funds, but it is indirect
and is not governed by a clear division of responsibilities.
Secondly, the other half of the PIT shares, retained at the local level, provide very
different amounts depending on the wealth of the jurisdiction. Consequently, rich
jurisdictions from the western part of the country have significantly more funds at their
disposal and can spend much more on school operations than poorer municipalities
in Moldova. The same applies to equalization through the rebalancing component of
shared PIT. It has a rather limited impact, because it is localized. Indeed, there will be
many relatively rich counties, which will have at their disposal quite significant funds
for the rebalancing of budgets. At the same time, the poorer counties in Moldova, for
instance, will also have their own much smaller equalization funds.
We note that Romania also has a national equalization system. This system allocates
the funds again to the level of counties, where deconcetrated offices of the Ministry of
Public Finances as well as county councils further distribute the funds, according to
several rules.14
A proper equalization system must include the whole country and has no need of
counties as intermediaries in distribution. Instead, it should be operated by the central
administration using a simple equalization formula and must be applied uniformly and
transparently to all local governments. It is clear that the neither the county level systems
of rebalancing nor nationwide equalization system meet those criteria.
The uneven distribution of PIT shares, and of PIT-based equalization formula, is
fully reflected in severe regional differences in per-student maintenance expenditures.
At the level of counties, those expenditures for primary education range from RON
464 to RON 4,755, a more than tenfold difference (see the section of structural issues
and the Appendix). Neither the inspectorates nor MERY monitor those differences,
in part because they have not been assigned any administrative tools and responsibili-
ties to do so. The responsibility for determining the maintenance and materials part
of school budgets thus rests exclusively with the local governments, and they seem to
185
F i n a n c i n g E d u c a t i o n i n R o m a n i a : A L e g a c y o f I n c o m p l e t e R e f o r m s
enjoy remarkable freedom in this area. For instance, in a complex of vocational schools,
the own income generated by the school is quite considerable, because the school has
turned an unused student dormitory into a type of low-cost hotel and is allowed to
keep all the income generated in this way. Therefore, the local government decided not
to assign any maintenance funds from its own budget to that school. Leaving aside the
question of whether this is a rational decision,15 we note that this is in sharp contrast
with other schools, which for their maintenance funding depend completely on the
local council budget. This also shows that there are no uniform financing standards that
local governments need to follow.
Nevertheless, it is worth pointing out that in many schools there were clear signs
of recent (within the last two years) investments by the local governments. Since no
capital investment funds are allocated for education in the central budget, all those
local improvements in school equipment must have been financed from local resources.
Thus, the local councils must have analyzed their options and budgetary possibilities,
and decided on their priorities in the sector. This means that even with very limited
managerial responsibilities in the sector, local councils have already begun to behave as
committed owners of their schools.
Salaries of Education Staff
The salaries portion of the school budget, in contrast, is strictly controlled by an elaborate
system of employment norms. Indeed, every year all the pre-university schools submit
to ISJ their enrollment plans. The enrollment plans include the numbers of students,
classes, teaching positions, and other non-teaching staff (administration and technical),
and should be verified by the school inspectorate concerning proper applications of the
norms. The norms include:
• class sizes (10 to 20 for preschool groups; 10 to 25 for grade one; 10 to 30 for
grade five; while classes in the intermediate grades will simply continue from
the previous school year),
• teaching time for class (maximum 30 hours per week),
• teaching load for a teacher (18 hours per week),
• norms for non-teaching staff.
The school inspectorate aggregates enrollment plans of individual schools into a
county enrollment plan sent to MERY. It is clear that it is no longer possible to verify
whether the employment norms are applied correctly at this level of aggregation. Instead,
the aggregated enrollment plans serve as an employment plan for the county, and its main
purpose is budgetary planning. Finally, MERY constructs the national enrollment plan
186
P U B L I C M O N E Y F O R P U B L I C S C H O O L S
through aggregation of county-level plans, and the national plan is approved through a
government decision. In theory, this should provide a comprehensive system of checks
and balances; in practice, however, we note a certain dilution of responsibilities. Indeed,
while it seems clear that the main managerial authority rests with the school inspector-
ates, their decisions are not final and are in theory subject to verification and approval
by higher authorities, up to the government itself. In particular, if MERY is unable
to secure the national enrollment plan as follows from aggregation of county plans,
necessary and non-transparent cuts have to be introduced at lower levels (managed of
course by ISJ).
Once enrollment plans have been approved, they are used to determine the salaries
portion of the education budget of the counties. Here again, the Ministry of Finance
depends on the data provided by school inspectorates, namely the data required to
establish the salaries of individual teachers (education levels, seniority, professional
qualifications). The national budget determines specific expenditures needs of the
counties on education salaries.
However, at present, Romania lacks any system of sectoral transfers16 from the central
budget to local governments, apart from investment grants. This makes it impossible to
correctly account for the transfers for education salaries at the central level. The solution
adopted by the Ministry of Finance is to use the VAT revenues of the central budget17
to finance salaries. Initially, the so-called sume defalcate din VAT (retained or deducted
amounts from VAT revenues) were defined as negative accounting entries under the VAT
revenues of the state budget. Since 2004, they have been defined separately as expendi-
tures of the central budget and are stated for each county as a part of the yearly budget
laws. In the absence of well-defined sectoral grants for education, the system of retained
amounts becomes a type of per-teacher grant to counties for school staff salaries.
Once the state budget is approved, the counties then determine the education
budgets of all their local councils by allocating to them the received sume defalcate.
This is more or less a mechanical exercise, since the allocation for education salaries
was based on submissions of the counties (together with the School Inspectorates).
Also, the local government merely transfers those funds to schools (and employees are
paid in cash). Since neither the county nor the local councils have any influence on
the payment amounts, their role in this part of the school budgets seems to be purely
technical. We can say that the devolution of school staff salaries to local governments
in Romania has a purely accounting component.
Consequently, while the maintenance portion of education finance has been
excessively decentralized, without proper monitoring mechanisms, the salaries portion
remains strictly centralized.
187
F i n a n c i n g E d u c a t i o n i n R o m a n i a : A L e g a c y o f I n c o m p l e t e R e f o r m s
THE LEGISLATIVE FRAMEWORK OF 2004
In 2004, the government of Romania committed itself to decentralize the finances and
management of the education system, under the conditionalities of a Programmatic
Adjustment Loan (PAL) from the World Bank. It also adopted a new Strategy for the
Reform of Public Administration, promising larger sectoral and fiscal decentraliza-
tion. The Ministry of Public Administration introduced a separate Framework Law on
Decentralization, which also made room for the future reallocation of sectoral responsi-
bilities (such as education). The Ministry of Education, Research, and Youth adopted a
new legislative framework intended to reform and simplify the education management
and finances.18 Unfortunately, those reform initiatives were not well coordinated.19
The legislation adopted by MERY in 2004 reflects the fragmentation in policy-
making described above. There was no official strategic document drafted by MERY to
target decentralization specifically. The reform document for pre-university education20
mentions an objective that is related to decentralization: “the reform aims (…) the
progressive decentralization of decisions and responsibilities in forecasting, allocating and
using financing sources and the material base of the education units.”21 Nevertheless, as
we discuss in some detail below, the new legislative framework remained inconsistent and
did not resolve all the tensions apparent in the fragmented management and financing
system. The new education decentralization strategy, approved by the government of
Romania in December 2005, provides a much clearer vision of a future system. It states
clear objectives like strengthening school autonomy and reducing the role of the ISJ.
However, the objectives of that strategy have not been translated into laws.
First, we will discuss how the new legal framework defines managerial issues (the
allocation of responsibilities to institutions) and what the proposals for the financing
system are.
Institutional Arrangements
There are many accounts in the literature of the two basic options for devolving new
responsibilities—to schools or to local governments.22 The debate about the target of
decentralization has been fierce in the region, given the strong and frequently opposing
interests of the central and local administration, not to mention the schools themselves
and other education professionals. Romania is no exception, with its strong labor union
market and its emergence from a highly centralized pre-1990 education system.
The primary and secondary legislation, adopted in 2004, shows that the previous
government decided upon a costly and ineffective combination of both options. On the
one hand, the legislation seems to confirm the central role of the school itself and gives
leverage to its bodies of management. An amendment to the Law of Education23 provides
that, “the school is run by the administration council. The director of the school is the
188
P U B L I C M O N E Y F O R P U B L I C S C H O O L S
chairman of the administration council.” This is a clarification from the old version of
the law that nominated the director for running the school with the help of the teachers’
and administrative council. Further on, the strengthening of the administrative council
through further managerial responsibilities; the change in the role of the school director,
from teacher to a manager held accountable through a managerial contract signed with
the inspectorate;24 and the introduction of school budgets with revenue and expenditure
sides—all these imply the transformation of the school into a self-managing institution.
This is very much in line with the decentralization of schools.
On the other hand, the same body of legislation sets the financing responsibilities
with various levels of government. Article 28 of Methodological Norms clearly states that
at the local level the local council establishes the quantum of funds allocated to each
education unit, based on a long list of indicators, namely the:
… number of pupils at each level of education, type and specialty, enrolled
in the respective education units, the standard costs per gymnasium pupil
in urban areas, correctional coefficients for each level of education, type,
and specialty, in urban or rural areas,25 the possible number of pupils
to be enrolled in a classroom determined solely by demographic causes,
share of pupils belonging to other nationalities enrolled in the education
unit, and the volume of local councils’ self-generated income and their
quantum, that can be allocated to education.
This makes local councils ultimately responsible for defining the budgetary alloca-
tions of all the schools in its territory. Additionally, the system of national, county, and
commune commissions for education finance are tasked with defining per-student costs
at each level of the system for the schools in their jurisdiction. This is consistent with
decentralization to local governments.
However, despite moving towards both school-based and local-government-based
model of education decentralization, the new framework retains significant power with
regard to the inspectorates. The present system of teacher nominations by the ISJ with no
role for the school director is unchanged, except in a limited way in eight pilot counties.
As a result, Law 354/2004 maintains the consultative and advisory role of the admin-
istration council and does not increase the autonomy of the school in the pedagogical
process, for instance, by allowing some freedom in the use of teaching time.
The inspectorate continues to have significant power: they set up public education
units such as kindergartens, primary schools, middle schools, vocational, and appren-
ticeship schools.26 The director of the school signs his or her contract with the inspec-
torate, not with the local government, so the relationship between the school and the
local community is considerably weakened. Thus, the director is less accountable to the
community he or she serves, and more to the inspectorate, as the inspector evaluates his
or her performance in managing the school. This is a complicated situation, given that,
189
F i n a n c i n g E d u c a t i o n i n R o m a n i a : A L e g a c y o f I n c o m p l e t e R e f o r m s
according to the Methodological Norms, the inspector decides on the level of payment
for the director based on some objective criteria (e.g., the number of students, the size
of the school) and also on some that are less objective (such as performance evaluation
run not by an independent body, but also by the inspectorate).27
Financing Arrangements
We will discuss the following education finance issues as regulated by the 2004
legislation:
• determination of financial flows for education (own income or education
grant),
• fragmentation of the new financing system,
• the basic per-student amount, and
• the allocation procedures.
Determination of Financial Flows for Education
The legislative framework does not clearly resolve which education function or service
is financed from own income or from an education grant. Article 167, paragraph 1 of
the Education Law, as amended by Law 354/2004, states that pre-university schools
are financed from “funds allocated through local budgets (…) from the state budget
and other sources, according to the law.” Later in the law the central funds source is
specified: “financing is ensured (…) from the shares deducted from some incomes of
the state budget and from other incomes of the local budgets.”28 The issue is, will those
shares be defined as fixed percentages valid across the country, making this similar to
own revenues financing, or will they be determined as amounts separately calculated
for each municipality (based perhaps on standard costs), similar to a grant from the
central budget?29
In the first case, education finance would be firmly based on own income,30 in
accordance with Article 167, paragraph 8. However, in this case, the system of standard
costs elaborated in the Methodological Norms will remain relevant only for the setting
of the budgets of individual schools. This would create an unclear situation, when the
deducted shares may differ significantly from the sum of individual school budgets in a
locality. For many rural jurisdictions this certainly will become an unfunded mandate,
when their own revenues will be insufficient to cover the costs of school budgets deter-
mined through a formula.
190
P U B L I C M O N E Y F O R P U B L I C S C H O O L S
In the second case, the standard costs would be used to calculate the required
expenditures of schools and the resulting funds would be deducted from some revenue
streams of the central budget. An open question then becomes how to account in this
system for the financing of maintenance, presently based on the fixed shares of PIT.
The Fragmentation of the New Financing System
The financing mechanism, as defined in Article 167 of the Education Law amended by
Law 354/2004, is a two-pillar system that includes global (proportional) financing and
complementary financing. Global financing covers staff salaries, materials, services, and
teacher in-training. Remaining expenditures, such as dormitories and cafeterias, student
assessment, scholarships, student transportation, medical check-ups for employees,
school contests, investments, and major repairs are part of complementary financing.
Global financing will comprise over 95 percent of recurrent school budgets. It will be
calculated through a formula, using the standard costs. Those funds are supposed to be
“deducted from some incomes of state budget,” mostly from VAT revenues. Funds for
complementary financing will come from local budgets, and their level will reflect the
possibilities of localities.
The new legislation decreases the fragmentation of the present financing system by
including school maintenance in the global financing. Some issues remain, however.
One problem concerns auxiliary education expenditures, such as student transpor-
tation, dormitories, and cafeterias. Those expenditures, unlike investments and major
repairs, are recurrent expenditures, cannot be postponed, and need to be financed in a
stable, regular way, usually throughout the school year. The level of those expenditures
should depend on the number of users, for instance, where there is a need to transport
students or to locate them in dormitories due to low population density and the diffi-
culties of maintaining a dense school network. If the level of this expenditure depends
upon the availability of funds in the local budget, then access to school in remote, poor
areas, especially in the mountains, may be threatened.
There is also a free-rider problem related to the use of own funds to finance dormi-
tories. The users of dormitories are students coming from outside a given locality. When
allocating their own revenues to fund the dormitories, the local council is, in fact, using
local taxes to provide better education for children from another city or village. Local
councils may be reluctant to financially support the education of outsiders. From their
point of view, closing a dormitory would significantly reduce the cost of education in the
city, without a negative effect on the people most important to the local council—that
is, the voters.
191
F i n a n c i n g E d u c a t i o n i n R o m a n i a : A L e g a c y o f I n c o m p l e t e R e f o r m s
Basic Per-student Amount
According to the Methodological Norms, the allocation formula should be based on a
number of correction coefficients for the type and level of school, for urban and rural
areas, etc., as well as on the basic per-student amount, namely the per-student cost of a
gymnasium student in an urban area. The determination of that basic per-student cost
may prove to be difficult politically and technically.
The difficulty lies in the need to reconcile two requirements: that the per-student
cost reflects the actual minimum cost of providing education for one student, and that
the total funds for education should not exceed the ability of the national budget to
support education. Those requirements are in conflict and the resolution is far from
easy.
The Methodological Norms builds the budget using a bottom-up approach.31 The cost
of providing education is calculated according to the required factors, of which the most
important are teacher salaries. The main danger of this calculation is that the overall
budgetary request from MERY to the Finance Ministry may turn out to be unrealistically
large, which may cause political difficulties and controversies. Indeed, the calculations
performed by the National Council for Financing of Pre-university Education (CNFIPS)
are based on the legal norms governing the employment of teachers and non-teachers
(including curriculum, class sizes, the national pay scale) and on other relevant norms
(such as for heating). The calculations also use many institutional assumptions (class
and school size, teacher education level) and lead to a definition of many standard costs
for different types and locations of schools (over 20 such types). The standard costs
resulting from those calculations are invariably higher than historical costs of specific
types of schools.32 This means that they cannot be used for the allocation process, as
this would lead to the allocation of significantly higher funds than those available for
education in the state budget. There is a risk that the whole financing system proposed
by the Methodological Norms cannot be implemented, unless some new calculations
produce much lower values for the standard costs.33
The Allocation Procedure
According to the Methodological Norms, the allocation procedure is performed in three
steps: central to county budgets, county to local budgets, local budgets to schools.
During all three steps a formula with some corrective coefficients will be employed.
The Methodological Norms are not clear about how this will work. Articles 28 (b)
and (c) say that the allocation at the county and local levels will be accomplished using
standard costs and the corrective coefficients to reflect local conditions, and that those
coefficients will be “calculated and registered in the calculation methodology.” This
192
P U B L I C M O N E Y F O R P U B L I C S C H O O L S
seems to imply that those coefficients will be valid for the whole country. However,
Article 33 says that county and local councils will approve the levels of per-student costs
on their territory. This implies that different formulas will used, with possibly different
basic per-student costs.
Officials of the Ministry of Education, Research, and Youth state that they plan to
use a national formula applicable at all the three steps, with the same nationally defined
coefficients, but with the right to alter the coefficients at the local level. This will mean
that the ministry will take full responsibility for the funding level of each school, with
the corresponding political burden (the role of the local governments will be reduced
to the approval of the structure of the schools’ budgets). The financing system is likely
to become very rigid. With limited and somewhat unreliable information about the
individual schools, the decisions made by the ministry may lead to serious problems
for some schools. In conclusion, while it represents a significant departure from the
traditional, arbitrary financing, this choice severely limits the influence of local govern-
ments in the sector. If this happens, the ministry may require some additional financing
mechanisms, such as an education reserve fund, to deal with any serious discrepancies
between the new rigid formula and the existing financing levels.
The allocation system is complicated even further because of the three-step procedure
and the involvement of two levels of government: the central level and the local level.
The central level (the ministry) defines the overall level of funding and the allocation
principles, while the local level is responsible for the administration of individual school
budgets. However, there is also responsibility at the medium level, the county, that is
less clear and may lead to a significant politicization of the system. The principle that
is usually applied is that of direct funding, by means of allocating the funds for the
function directly to the administrative organ executing this function. Since the county
has no direct managerial authority in the operations of individual schools (apart from
special schools), the passage of the education funds through the county budget is both
unnecessary and dangerous. It is unnecessary because the same formula at the national
level can allocate the funds for special schools to the counties and the funds for regular
schools to the communes. This is dangerous because it will increase room for covert
negotiations and for intergovernmental disputes. From the education financing formula
point of view, the removal of counties from the allocation procedure would contribute
significantly to its transparency and simplicity.
The Pilot Programs
As a consequence of the new education management and finance framework, MERY
decided to start two limited pilot programs. The first one started in 200434 in all school
units of eight pilot counties to test newly-adopted regulations on management and

193
F i n a n c i n g E d u c a t i o n i n R o m a n i a : A L e g a c y o f I n c o m p l e t e R e f o r m s
financing. The real effect of the project was to increase school autonomy in regard to
the employment of teachers and the participation of the school community. The pilot
program is continuing, although there are no immediate plans for national replication.
The second program was designed to be implemented in the school year 2006–2007
and considered 50 selected school units in three different counties35 selected from the
initial eight pilot counties, with the main purpose of testing a per-student formula based
on historical costs and transferred as a specific grant to local authorities. However, there
was no official decision regarding the per-student formula to be tested by the schools,
and therefore, no applicable mechanism to test, monitor, or assess. The second pilot
ended inconclusively in December 2007.
The Proposed 2008 Law on Education and Teacher Statute
The new draft law on pre-university education continues to define decentralization as one
of the basic principles in managing education. Moreover, it maintains the concept of a
per-student standard cost that will be established yearly at the central level, and mandated
through a government decision. The methodology of cost calculation differentiates
between basic, complementary, and compensatory financing of education. Only the
basic financing (which includes personnel expenses—like teacher training, textbooks,
maintenance expenditures) is to be calculated in accordance to:
• the number of students in a given school;
• the previously established standard cost;
• the differentiation coefficients (relating to the education level, the student
population density in the area, to specific disadvantages, and to the complexity
of the qualifications that the school provides).
CNFIPS (National Council for Pre-university Education Financing) is to be
responsible for the decision regarding the standard cost and the different allocation
coefficients. This MERY institution was created in 2003, in order to collect data on
education finance, to calculate the per-student and personnel costs at the national
level, and to monitor and assess the standard cost implementation in the eight pilot
counties. However, CNFIPS began to decrease its staff, and undertake fewer and fewer
responsibilities and activities until it effectively collapsed, which explains why MERY
no longer has current calculations of the standard costs or current centralized data
regarding per-student expenditures. The only data connected to the efficiency of the
system that MERY can use in its policy decisions is personnel spending (the Ministry of
Finance can provide this data by centralizing budgetary executions from local councils).
In addition, MERY does not receive complete budget reports from the schools, which
194
P U B L I C M O N E Y F O R P U B L I C S C H O O L S
means that it cannot monitor the use of the funds in pre-university education, either
by region, by level and type of education, or from year to year. The efficiency of the use
of scarce resources is not controlled. Instead, MERY concentrates on controlling the
specific education inputs in each school (class sizes, teaching provided to each class,
individual teacher salaries).
Article 113 of the new law states that the amount considered to represent the
basic financing will be allocated to the school through the local budgets, but some
Methodological Norms are needed to clarify this point. In particular, it remains unclear
if the retained amounts discussed earlier will still be used for this purpose.
With regard to complementary financing—scholarships, maintaining of dormitories
and cafeterias, building renovations, investments, and different bonuses for teachers
and students—the amounts needed will come from local budgets and from the central
budget, in the case of national investment programs, and for covering some proportion of
scholarship expenses. How this proportion is going to be established remains unclear.
Compensatory financing is to be ensured from the local and state budgets (a certain
proportion, established yearly) for expenses such as teaching in a minority’s language
or financing special-needs education, based on an allocation formula: the number of
students that will benefit from compensatory financing, the standard cost, and the
differentiation coefficient for level of education, and for the program that benefits
from compensatory financing.
The funds resulting from all three types of financing will be transferred to the local
level based on a contract, signed by the school director and the main credit coordi-
nator.
Overall, we may conclude that the new proposals unfortunately have failed thus
far to introduce greater clarity and transparency to the funding of schools. The compli-
cated system of basic, complementary, and compensatory funding is likely to remain
unimplemented as the system defined in 2004.
STRUCTURAL ISSUES OF ROMANIAN EDUCATION FINANCE
In the present section we will discuss a number of structural issues, which are a conse-
quence of the peculiar system of the financing of Romanian education. The under-
financing of Romanian education, the budgeting vacuum, and the external efficiency of
the system are long-term problems that have been inherited from the previous govern-
ments of Romania and require similarly long-term, difficult solutions.
195
F i n a n c i n g E d u c a t i o n i n R o m a n i a : A L e g a c y o f I n c o m p l e t e R e f o r m s
Budgeting Vacuum
Above we described the financing of school maintenance as fully decentralized and
exhibiting dramatic disparities across counties, while salaries are fully controlled by
MERY, although technically the responsibility of local councils.36
This very unusual approach37 to decentralization has resulted in a sort of budgeting
vacuum in the budget process: the ministry most interested in the level and manner of
financing of schools is not fully involved in the budget process for any part of school
budgeting. For school maintenance, towns and cities are fully responsible, and neither
need nor request any involvement from MERY. For the salaries, the main responsible
institution is Ministry of Public Finance, which does not need to consult either with
MERY or the local governments, and introduces changes from year to year without
prior discussion with MERY. Moreover, the funds flow through the budgets of local
governments, but municipalities, towns, and localities have no influence at all on school
employment, or on the setting of salaries, and therefore are similarly uninvolved in the
budget process.
The budgeting vacuum is the single most important problem of the budgeting process
of MERY and impacts not just budget issues but all aspects of managing and steering
the Romanian education system. Indeed, the ministry cannot be politically responsible
for the efficient use of resources devoted to education if its influence over the ways the
funds are allocated and spent is so limited. This is especially important for the use of
teacher resources. The employment of teachers is strictly controlled by the ISJ through
applying national class-size norms and curriculum requirements. However, there is
little incentive to save money by consolidating schools in the face of declining student
numbers (and declining system efficiency). In fact, the consolidation of schools is always
a painful process, with resistance from both the parents and teachers. The main argu-
ment for school consolidation is that the funds saved by a more efficient school network
will provide improved education for the larger, consolidated schools. But, at present, if
MERY goes through the difficult process of consolidation, the savings will not accrue
to the sector and will disappear in the general budget because the retained amounts
from VAT for salaries will simply become smaller. Similarly, MERY finds it difficult
to plan and cost any major reforms of the sector, such as a lengthening of obligatory
education or increased enrollment in general academic secondary schools. This is because
the present budget process does not use data which can serve as the basis of projections
under various reform scenarios. Moreover, no policymaking institution at the central
level is responsible for taking into account the long-term financial and managerial effects
of demographic processes, decisions about school networks, curriculum changes, and
changing teacher numbers.
The most important negative consequence of the budgeting vacuum is that the
budgeting process is seen as a pure accounting activity. Thus, for salaries, rather than
considering various tradeoffs between school, class size, and teacher employment, the
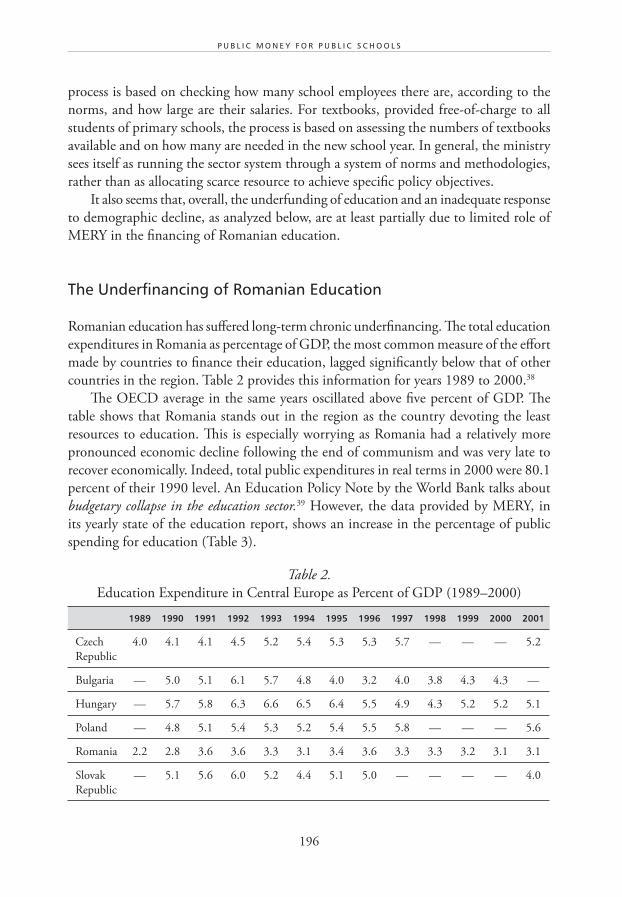
196
P U B L I C M O N E Y F O R P U B L I C S C H O O L S
process is based on checking how many school employees there are, according to the
norms, and how large are their salaries. For textbooks, provided free-of-charge to all
students of primary schools, the process is based on assessing the numbers of textbooks
available and on how many are needed in the new school year. In general, the ministry
sees itself as running the sector system through a system of norms and methodologies,
rather than as allocating scarce resource to achieve specific policy objectives.
It also seems that, overall, the underfunding of education and an inadequate response
to demographic decline, as analyzed below, are at least partially due to limited role of
MERY in the financing of Romanian education.
The Underfinancing of Romanian Education
Romanian education has suffered long-term chronic underfinancing. The total education
expenditures in Romania as percentage of GDP, the most common measure of the effort
made by countries to finance their education, lagged significantly below that of other
countries in the region. Table 2 provides this information for years 1989 to 2000.38
The OECD average in the same years oscillated above five percent of GDP. The
table shows that Romania stands out in the region as the country devoting the least
resources to education. This is especially worrying as Romania had a relatively more
pronounced economic decline following the end of communism and was very late to
recover economically. Indeed, total public expenditures in real terms in 2000 were 80.1
percent of their 1990 level. An Education Policy Note by the World Bank talks about
budgetary collapse in the education sector.39 However, the data provided by MERY, in
its yearly state of the education report, shows an increase in the percentage of public
spending for education (Table 3).
Table 2.
Education Expenditure in Central Europe as Percent of GDP (1989–2000)
1989 1990 1991 1992 1993 1994 1995 1996 1997 1998 1999 2000 2001
Czech
Republic
4.0 4.1 4.1 4.5 5.2 5.4 5.3 5.3 5.7 — — — 5.2
Bulgaria — 5.0 5.1 6.1 5.7 4.8 4.0 3.2 4.0 3.8 4.3 4.3 —
Hungary — 5.7 5.8 6.3 6.6 6.5 6.4 5.5 4.9 4.3 5.2 5.2 5.1
Poland — 4.8 5.1 5.4 5.3 5.2 5.4 5.5 5.8 — — — 5.6
Romania 2.2 2.8 3.6 3.6 3.3 3.1 3.4 3.6 3.3 3.3 3.2 3.1 3.1
Slovak
Republic
— 5.1 5.6 6.0 5.2 4.4 5.1 5.0 — — — — 4.0
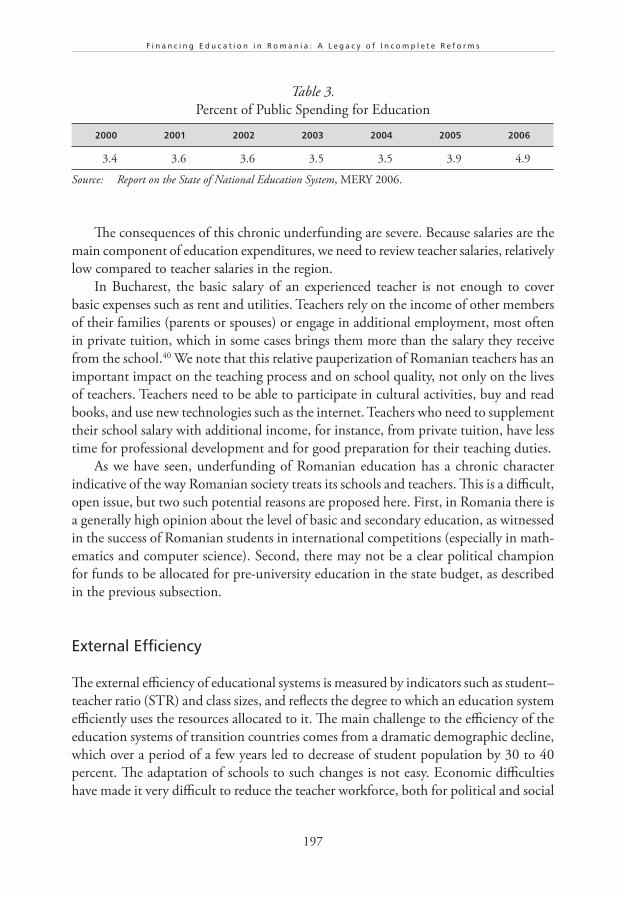
197
F i n a n c i n g E d u c a t i o n i n R o m a n i a : A L e g a c y o f I n c o m p l e t e R e f o r m s
Table 3.
Percent of Public Spending for Education
2000 2001 2002 2003 2004 2005 2006
3.4 3.6 3.6 3.5 3.5 3.9 4.9
Source: Report on the State of National Education System, MERY 2006.
The consequences of this chronic underfunding are severe. Because salaries are the
main component of education expenditures, we need to review teacher salaries, relatively
low compared to teacher salaries in the region.
In Bucharest, the basic salary of an experienced teacher is not enough to cover
basic expenses such as rent and utilities. Teachers rely on the income of other members
of their families (parents or spouses) or engage in additional employment, most often
in private tuition, which in some cases brings them more than the salary they receive
from the school.40 We note that this relative pauperization of Romanian teachers has an
important impact on the teaching process and on school quality, not only on the lives
of teachers. Teachers need to be able to participate in cultural activities, buy and read
books, and use new technologies such as the internet. Teachers who need to supplement
their school salary with additional income, for instance, from private tuition, have less
time for professional development and for good preparation for their teaching duties.
As we have seen, underfunding of Romanian education has a chronic character
indicative of the way Romanian society treats its schools and teachers. This is a difficult,
open issue, but two such potential reasons are proposed here. First, in Romania there is
a generally high opinion about the level of basic and secondary education, as witnessed
in the success of Romanian students in international competitions (especially in math-
ematics and computer science). Second, there may not be a clear political champion
for funds to be allocated for pre-university education in the state budget, as described
in the previous subsection.
External Efficiency
The external efficiency of educational systems is measured by indicators such as student–
teacher ratio (STR) and class sizes, and reflects the degree to which an education system
efficiently uses the resources allocated to it. The main challenge to the efficiency of the
education systems of transition countries comes from a dramatic demographic decline,
which over a period of a few years led to decrease of student population by 30 to 40
percent. The adaptation of schools to such changes is not easy. Economic difficulties
have made it very difficult to reduce the teacher workforce, both for political and social
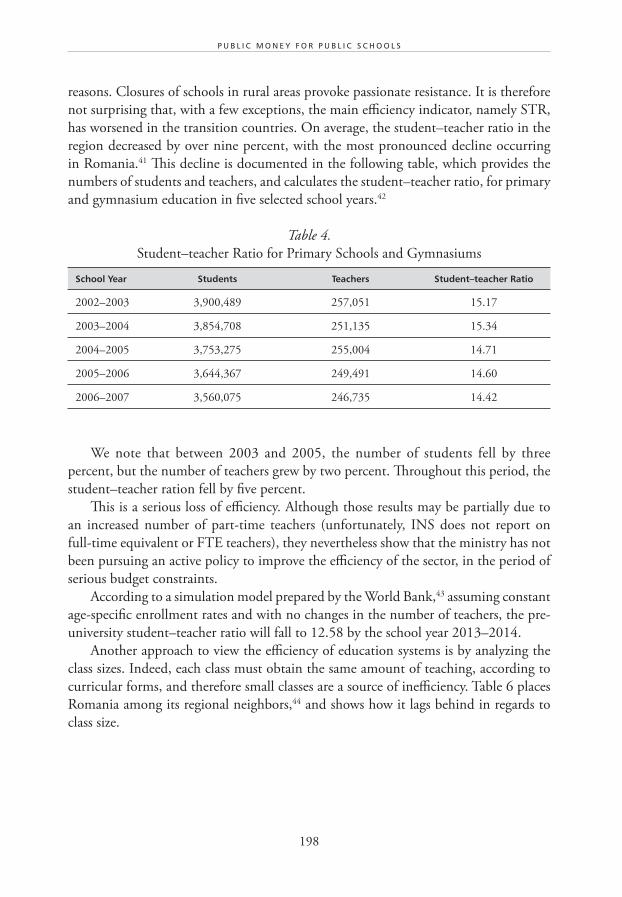
198
P U B L I C M O N E Y F O R P U B L I C S C H O O L S
reasons. Closures of schools in rural areas provoke passionate resistance. It is therefore
not surprising that, with a few exceptions, the main efficiency indicator, namely STR,
has worsened in the transition countries. On average, the student–teacher ratio in the
region decreased by over nine percent, with the most pronounced decline occurring
in Romania.41 This decline is documented in the following table, which provides the
numbers of students and teachers, and calculates the student–teacher ratio, for primary
and gymnasium education in five selected school years.42
Table 4.
Student–teacher Ratio for Primary Schools and Gymnasiums
School Year Students Teachers Student–teacher Ratio
2002–2003 3,900,489 257,051 15.17
2003–2004 3,854,708 251,135 15.34
2004–2005 3,753,275 255,004 14.71
2005–2006 3,644,367 249,491 14.60
2006–2007 3,560,075 246,735 14.42
We note that between 2003 and 2005, the number of students fell by three
percent, but the number of teachers grew by two percent. Throughout this period, the
student–teacher ration fell by five percent.
This is a serious loss of efficiency. Although those results may be partially due to
an increased number of part-time teachers (unfortunately, INS does not report on
full-time equivalent or FTE teachers), they nevertheless show that the ministry has not
been pursuing an active policy to improve the efficiency of the sector, in the period of
serious budget constraints.
According to a simulation model prepared by the World Bank,43 assuming constant
age-specific enrollment rates and with no changes in the number of teachers, the pre-
university student–teacher ratio will fall to 12.58 by the school year 2013–2014.
Another approach to view the efficiency of education systems is by analyzing the
class sizes. Indeed, each class must obtain the same amount of teaching, according to
curricular forms, and therefore small classes are a source of inefficiency. Table 6 places
Romania among its regional neighbors,44 and shows how it lags behind in regards to
class size.

199
F i n a n c i n g E d u c a t i o n i n R o m a n i a : A L e g a c y o f I n c o m p l e t e R e f o r m s
Table 5.
Simulated Student–teacher Ratios, by Level of Education
Academic Year Preschool Basic Education Upper Secondary Higher Education
2004–2005 18.37 13.72 12.17 18.48
2005–2006 19.24 12.96 12.07 17.06
2006–2007 18.93 12.65 11.53 17.15
2007–2008 18.36 12.55 10.76 17.38
2008–2009 18.35 12.48 9.90 17.57
2009–2010 18.32 12.50 9.10 17.53
2010–2011 18.21 12.60 8.44 17.13
2011–2012 18.01 12.70 7.94 16.36
2012–2013 17.73 12.79 7.67 15.33
2013–2014 17.37 12.77 7.60 14.17
Source: Public Expenditure and Institutional Review (PEIR) Simulation Model, World Bank, 2006, in
Romania Education Policy Note, World Bank 2007.
Table 6.
Class Size in Central Europe
Primary Lower Secondary
Czech Republic 20.8 23.3
Hungary 20.5 21.5
Poland 20.8 24.6
Slovak Republic 20.2 23.0
Romania 19.1 21.5
The decreasing efficiency of Romanian education over the last decade shows that
MERY finds it difficult to prepare a coherent strategy to adjust the system to the
demographic decline. It seems likely that one source of this difficulty is the excessive
reliance on norms and methodologies, rather than on direct incentive systems, such as
per-student financing, to improve efficient use of resource.
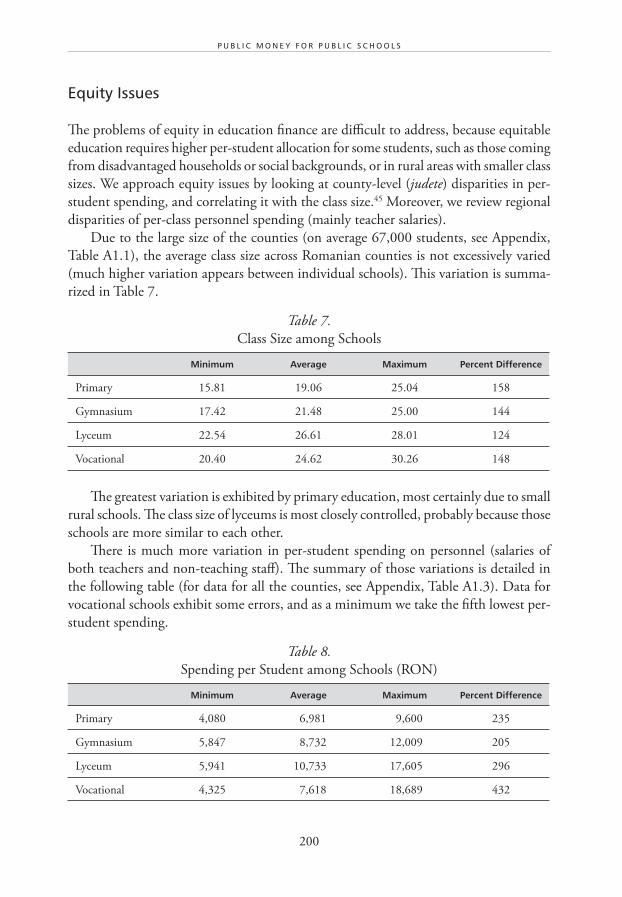
200
P U B L I C M O N E Y F O R P U B L I C S C H O O L S
Equity Issues
The problems of equity in education finance are difficult to address, because equitable
education requires higher per-student allocation for some students, such as those coming
from disadvantaged households or social backgrounds, or in rural areas with smaller class
sizes. We approach equity issues by looking at county-level (judete) disparities in per-
student spending, and correlating it with the class size.45 Moreover, we review regional
disparities of per-class personnel spending (mainly teacher salaries).
Due to the large size of the counties (on average 67,000 students, see Appendix,
Table A1.1), the average class size across Romanian counties is not excessively varied
(much higher variation appears between individual schools). This variation is summa-
rized in Table 7.
Table 7.
Class Size among Schools
Minimum Average Maximum Percent Difference
Primary 15.81 19.06 25.04 158
Gymnasium 17.42 21.48 25.00 144
Lyceum 22.54 26.61 28.01 124
Vocational 20.40 24.62 30.26 148
The greatest variation is exhibited by primary education, most certainly due to small
rural schools. The class size of lyceums is most closely controlled, probably because those
schools are more similar to each other.
There is much more variation in per-student spending on personnel (salaries of
both teachers and non-teaching staff). The summary of those variations is detailed in
the following table (for data for all the counties, see Appendix, Table A1.3). Data for
vocational schools exhibit some errors, and as a minimum we take the fifth lowest per-
student spending.
Table 8.
Spending per Student among Schools (RON)
Minimum Average Maximum Percent Difference
Primary 4,080 6,981 9,600 235
Gymnasium 5,847 8,732 12,009 205
Lyceum 5,941 10,733 17,605 296
Vocational 4,325 7,618 18,689 432
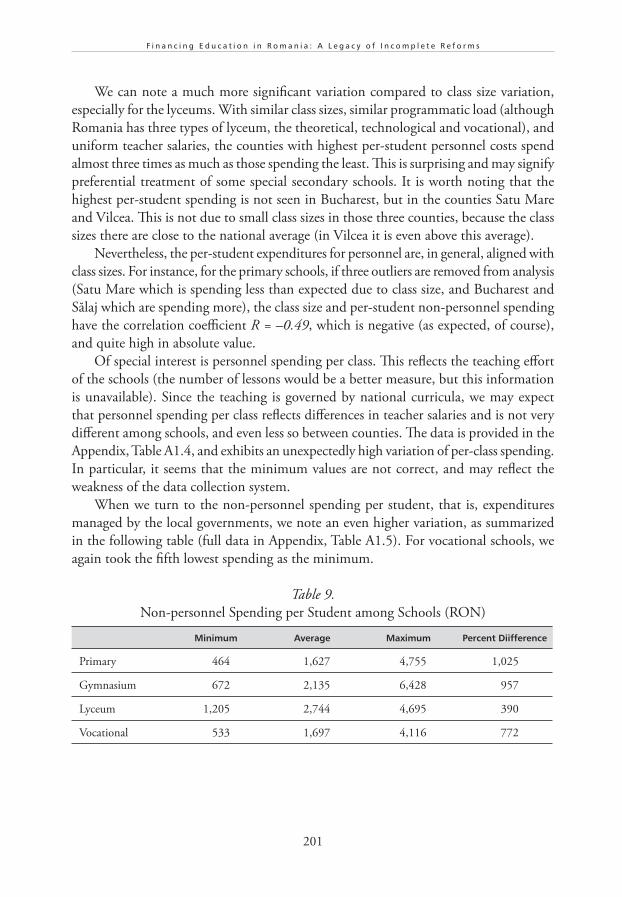
201
F i n a n c i n g E d u c a t i o n i n R o m a n i a : A L e g a c y o f I n c o m p l e t e R e f o r m s
We can note a much more significant variation compared to class size variation,
especially for the lyceums. With similar class sizes, similar programmatic load (although
Romania has three types of lyceum, the theoretical, technological and vocational), and
uniform teacher salaries, the counties with highest per-student personnel costs spend
almost three times as much as those spending the least. This is surprising and may signify
preferential treatment of some special secondary schools. It is worth noting that the
highest per-student spending is not seen in Bucharest, but in the counties Satu Mare
and Vilcea. This is not due to small class sizes in those three counties, because the class
sizes there are close to the national average (in Vilcea it is even above this average).
Nevertheless, the per-student expenditures for personnel are, in general, aligned with
class sizes. For instance, for the primary schools, if three outliers are removed from analysis
(Satu Mare which is spending less than expected due to class size, and Bucharest and
Sălaj which are spending more), the class size and per-student non-personnel spending
have the correlation coefficient R = –0.49, which is negative (as expected, of course),
and quite high in absolute value.
Of special interest is personnel spending per class. This reflects the teaching effort
of the schools (the number of lessons would be a better measure, but this information
is unavailable). Since the teaching is governed by national curricula, we may expect
that personnel spending per class reflects differences in teacher salaries and is not very
different among schools, and even less so between counties. The data is provided in the
Appendix, Table A1.4, and exhibits an unexpectedly high variation of per-class spending.
In particular, it seems that the minimum values are not correct, and may reflect the
weakness of the data collection system.
When we turn to the non-personnel spending per student, that is, expenditures
managed by the local governments, we note an even higher variation, as summarized
in the following table (full data in Appendix, Table A1.5). For vocational schools, we
again took the fifth lowest spending as the minimum.
Table 9.
Non-personnel Spending per Student among Schools (RON)
Minimum Average Maximum Percent Diifference
Primary 464 1,627 4,755 1,025
Gymnasium 672 2,135 6,428 957
Lyceum 1,205 2,744 4,695 390
Vocational 533 1,697 4,116 772
202
P U B L I C M O N E Y F O R P U B L I C S C H O O L S
The discrepancies between the lowest and highest per-student non-personnel
spending are remarkable. They are almost certainly dictated mainly by the level of own
revenues of the jurisdictions. Moreover, those discrepancies at the level of the individual
schools are certain to be more pronounced. We also note that there are counties with
low or high per-student, non-personnel spending for all the levels of education. The
highest spender is of course Bucharest (for primary and gymnasium it is highest, for the
other two it is close to the highest). The low spenders are Ilfov, Satu Mare, and Vaslui
counties. This is quite remarkable, since Satu Mare is at the same time a county with
high per-student personnel spending.
If we review the correlation between the class sizes and non-personnel, per-student
expenditures, we obtain the coefficient R = 0.21, not only small, but, most surpris-
ingly, positive (in counties with larger classes, non-personnel expenditures per student
are higher!).
We can only formulate the hypothesis that the transfer of the responsibility for the
non-salary portion of the school budgets to local governments, and at the same time
the absence of monitoring of those expenditures by the ministry, led to serious equity
problems in school maintenance.
CONCLUSIONS
As we have indicated in a number of places in the present report, the new Romanian
government seems to be determined to take the necessary but difficult steps and
bring the long, drawn-out education reform to completion. This is especially true of
decentralization. Education decentralization is a policy objective that will structure the
future functioning of the sector and will influence the financing mechanisms and the
delivery of education. The government already adopted, in December 2005, an educa-
tion decentralization strategy, formulating not only objectives and stages but also the
inherent risks and risk-minimizing measures.
Nevertheless, the challenges facing the education reformers in Romania go far beyond
decentralization problems, and in the present final section we briefly formulate some
recommendations for further action.
As is evident from the discussion in the first sections of this chapter, the Ministry
of Education, Research, and Youth should accept the need to deal with the inconsisten-
cies of the present, inherited legislation. The changes proposed in the draft education
legislation of 2008 are insufficient to introduce clarity, transparency, and stability in
education finance. Only a consistent, clear legislation supports a proper decentralization
process. The region has seen examples of compromised decentralization efforts because
of improper policy, as occurred in Poland in 1997, when the selected 40 large cities
returned the secondary schools to the Polish Education Ministry, for which they had
earlier taken responsibility.46
203
F i n a n c i n g E d u c a t i o n i n R o m a n i a : A L e g a c y o f I n c o m p l e t e R e f o r m s
The ministry should also review the Framework Law on Decentralization elabo-
rated by the Ministry of Interior and Administrative Reform, as well as plans for fiscal
decentralization of the Finance Ministry. The Framework Law on Decentralization
will define how decentralization will proceed in other sectors, and MERY should try
to achieve some measure of harmony. Fiscal decentralization will define the available
financial mechanisms, such as proper categorical and block grants, which will be used
to allocate the education funds to local governments. Close cooperation with other
ministries is therefore necessary.
The ministry should address the problem of the chronic underfunding of Romanian
education, without fuelling inflation pressures. The teacher salaries should be increased
together with the teacher workload, to bring the Romanian education system closer to
European standards.
MERY must define the balance between empowering the schools and empowering
the municipalities.47 While those two dimensions of decentralization are in many respects
complementary, on a number of key questions they may clash (e.g., the financing of
schools, and the opening and closing of schools). Since the schools are now subordinated
to higher-level institutions, and much effort is necessary not only to allocate them greater
autonomy but also to increase their capacities. It seems that, for some time to come, local
governments in Romania should retain a large measure of control of schools, especially
of school budgets. The ministry should review and decide who will control, among
others, the pedagogical process, the employment levels, the selection and evaluation
of school directors, the selection and evaluation of teachers and of non-teaching staff,
the adoption of specific profiles by the schools, school development plans, linkage to
the labor market, and psychological services rendered to the schools. In general, school
autonomy dictates that the school itself should have most responsibility in those areas,
but the skills and capacities required for those functions may not be there yet.
Conditioned on those decisions, the ministry must define a stable and transparent
system of financing. The regional experience (as well as Romanian legislation) tells us that
this should be some form of per-student formula. We do not believe that the standard
cost calculations, as defined in the current legislation, may serve as the basis for such a
system. Although many different solutions are possible, it is important to remember that
the financing system will become the sphere of discussion and compromise in the debates
on the development of the sector, held between the ministry, the local governments,
the trade unions, and other education stakeholders (including in particular professional
associations of teachers and school directors). Therefore, the financing system should be
sufficiently simple, and its basic parameters (numerical weights, buffers) should have a
clear strategic role in education.
The ministry must also reconcile the per-student allocation formula with the
nationally mandated pay scale of teachers. This is the source of severe tensions in many
countries. One of the problems is that the national pay scale places some expenditure
204
P U B L I C M O N E Y F O R P U B L I C S C H O O L S
obligations on local governments, which the per-student formula may be unable to
satisfy, if the employment levels, due to some specific conditions, are much higher than
average. The national pay scale also limits the freedom of local governments in changing
the structure of the costs of their schools. On the other hand, the national pay scale is
correctly seen by the teachers as the basic defence against the perceived arbitrariness of
local governments.
Finally, the ministry should introduce mechanisms to objectively measure school
performance and to assess the impact of education reforms on student outcomes. This is
necessary if the ministry wants to improve the unsatisfactory results of Romanian students
in internationally comparable tests such as TIMMS and PISA, as noted earlier.
SOURCES CITED
Berryman, S., A. Gove, D. Sapatoru, and A. Tirca (2006) “Evaluation of the World Bank
Assistance to Basic Education. Case Study for Romania.” World Bank.
Caraman, S., ed. (2003) “The Status of Fiscal Decentralization in Romania.” Report for the
National Union of County Councils of Romania, Bucharest.
Dogaru, I. (2002) “Formula de finantare a invantamantului preuniversitar din Romania.”
Bucharest: National Council for Financing of Pre-university Education (CNFIPS).
Fiszbein, A., ed. (2002) “Decentralizing Education in Transition Societies, Case Studies from
Central and Eastern Europe.” World Bank.
Halasz, G.(2002) “Romania Education Study: Report on Education Finance and Management.”
Bucharest: World Bank.
Herczyński, J. (2005) “Getting Ready for Take-Off? Current Issues of Education Decentralization
in Romania.” Bucharest: CNFIPS.
Herczyński, J. (2006) “Report on the Quality of the Budgeting Process in MER.” Bucharest.
Ionita, S. (2003) “Halfway There: Assessing Intergovernmental Fiscal Equalization in Romania.”
SAR Working Papers 25.
Institutul National de Statistica (2004) Anuarul Statistic de Romaniei–2003, Bucharest (Available
online: http://www.insse.ro).
Institutul National de Statistica (2007) Anuarul Statistic al Romaniei–2007, Bucharest.
Levitas, T. and J. Herczyński (2002) “Decentralization, Local Governments and Education
Reform in Post-communist Poland.” In: K. Davey (ed.) “Balancing National and Local
Responsibilities.” Budapest: LGI/OSI.
Ministry of Education, Research, and Youth (2001) The Romanian Education System: National Report. Bucharest.
Ministry of Education, Research, and Youth (2007) The Romanian Education System: National Report. Bucharest.
205
F i n a n c i n g E d u c a t i o n i n R o m a n i a : A L e g a c y o f I n c o m p l e t e R e f o r m s
OECD (2005) Education at a Glance. OECD Indicators 2005. Paris: OECD.
Velea, S. and P. Botnariuc (2002) Education Reform in Romania During the Last 12 Years, Working paper for CEU Education Policy Course, Hungary.
Voicu, Begu L. (1999) “An Analysis of the Structure, Costs and Efficiency of Romania’s Pre-
university Education System.” Bucharest: World Bank.
World Bank (2001) Country Assistance Strategy. Romania.
World Bank (2002) Education Policy Note. Romania.
World Bank (2007) Municipal Finance Policy Note, Romania.
LEGISLATION AND GOVERNMENT OFFICIAL DOCUMENTS
Law 349/2004, which amends the Teacher Status Law 128/1997, passed by the Romanian
Parliament on July 14, 2004.
Law 354/2004, which amends the Education Law 84/1995, passed by the Romanian Parliament
on July 15, 2004.
Methodological Norms for Financing and Administration of Pre-university Education
Units (Methodological Norms), approved by Government Decision in November 2004.
Norma metodologica din 07/06/2001 Publicat in Monitorul Oficial din 19/06/2001, pentru finan-tarea invatamantului preuniversitar de stat.
Note no 10671/08.09.2000, Reforma in invatamantul rural (aspecte specifice); Precizari ale Ministrului Educatiei Nationale, Andrei Marga.
Annual Budget Law of 2000.
Ministerul Educatiei si Cercetarii, Strategia dezvoltarii invatamintului preuniversitar in perioada
2001–2004, 2002.
NOTES
1 The authors were fortunate in having good research support from Adina Simandan, formerly
of MERY and now of Ministry of Interior and Reform of Administration, who helped to
update this report and wrote the sections on the current proposals of legislative changes.
2 This difficulty in the timeline of the reforms of the Romanian education points in itself to
the turbulent nature of the process.
3 The Education Reform Project financed textbooks and supplementary materials, equipment,
computer hardware and software, technical assistance, external and local training, prepara-
tion of studies, and non-salary operating costs.
4 Phare supported vocational education reform.
206
P U B L I C M O N E Y F O R P U B L I C S C H O O L S
5 Through the Annual Budget Law of 2000.
6 The present report does not take into account the current wave of reforms, initiated in 2008,
aimed at changing managerial practices in Romanian education.
7 This monthly allowance, called alocatii si alte ajutoare pentru copii, is allocated through
schools to all children in Romania attending schools irrespective of their social status (see
Herczyński 2006). The current value of the allowance is RON 40 (around EUR 9).
8 The council included the school director, his deputy, chief accountant, and representatives
of teachers (elected by the teacher council), of parents, of the local government unit, and
also of students (for secondary and postsecondary schools). The administration board could
also include representatives of the local business community.
9 In theory, for both primary and secondary schools there was a competitive process where
credentials and professional experience are requested. In practice, however, director appoint-
ment was very often a result of the political bargaining among local politicians.
10 Based on discussions with the Ministry of Finance. A review of local government finance is
provided in S. Caraman (ed.), The Status of Fiscal Decentralization in Romania, 2003.
11 Public Finance Law 273/2006.
12 The lump sum is distributed among counties on the basis of land area (30 percent) and fiscal
capacity (70 percent). The latter is determined by calculating a “fiscal gap” for each county
as the difference between the per-capita PIT tax revenues of the county and the average for
all counties, multiplied by the population of the county. Fiscal gaps are then aggregated for
the country as a whole. Each county’s share of the aggregate fiscal gap determines its share
(of this portion) of the lump sum. For a more detailed discussion, please see: Municipal Finance Policy Note, World Bank, 2007.
13 Based on interviews with ISJ and county councils.
14 Criteria used by the national system are part of permanent legislation, but a portion of the
amount used in the equalization process is decided on an annual basis, in the budget laws.
A very focused discussion of both systems is laid out in the Municipal Finance Policy Note, World Bank, 2007.
15 This assessment would have to include a comparison of all the maintenance budgets of
the schools in the area and a determination as to whether the degree to which the needs
of different schools are fulfilled is more or less similar. If the maintenance budget of that
specific school is markedly higher or markedly lower than the maintenance budgets of nearby
schools, and moreover if that difference is not part of a conscious policy of the local govern-
ment recognizing different needs of individual schools, we may argue that the arrangement
reached is not justifiable.
16 Those sectoral grants are based on certain measures of need, specific to the sector (for educa-
tion, the number of students is commonly used), and are either categorical (conditional)
or block (unconditional) grants. The law must also define the budgetary procedures and
reporting requirements for the grants. Both PIT shares and existing equalization systems
are non-sectoral grants.
207
F i n a n c i n g E d u c a t i o n i n R o m a n i a : A L e g a c y o f I n c o m p l e t e R e f o r m s
17 VAT revenues were chosen for simplicity and because this revenue stream is sufficiently
robust to support such negative accounting. Nevertheless, there is no budgetary link (beyond
accounting) between VAT revenues and the education allocation, contrary to what many
education stakeholders in Romania believe.
18 Law 349/2004, which amends Law 128/1997 on teacher status, passed by the Romanian
Parliament on July 14, 2004; Law 354/2004, which amends the Education Law 84/1995,
passed by the Romanian Parliament on July 15, 2004; and the Methodological Norms for
Financing and Administration of Pre-university Education Units (Methodological Norms),
approved by the Government Decision in November 2004.
19 Even more surprisingly, they were not harmonized with Ministry of Finance plans for fiscal
decentralization.
20 “Strategia dezvoltarii invatamintului preuniversitar in perioada 2001–2004.” Document of
the Ministry of Education, 2002. Available online: http://www.ro.edu.
21 Paragraph 22.
22 See Halasz 2002 and Herczyński 2005 for a discussion in the context of Romanian educa-
tion.
23 Article 13 of Law 354/2004.
24 See Article 21 of the Law 128/1997 regarding the teacher statute, as amended by Law
349/2004.
25 It is worth noting that Article 20 allows the range of acceptable corrective coefficient to be
rather large. Besides factors such as rural/urban location, level of education and profile of
the school, corrective coefficients may include the socioeconomic conditions of the school
population, school performance, and specific technical conditions of each school.
26 Education Law, Article 142, paragraph d.
27 Methodological norms, Article 13, paragraph 2.
28 Law 354, Article 167, paragraph 3.
29 And to the current system of retained amounts from VAT, except that those are calculated
on a per-teacher basis.
30 Here, we use the classification of shared taxes as own income of jurisdictions, even if the
tax base, rates, and exemptions are beyond the control of local governments. This classifica-
tion is common in transition countries, but is rejected by the OECD, because it blurs the
distinction between shared taxes and the undisputed own income of local governments,
such as property taxes.
31 There is also a top-down approach in building the formula, by which the ministry defines
the coefficients to be used in the allocation process and then simulates the effects of various
values of the coefficients. This calculation is also open to some criticism, namely that the basic
per-student amount obtained in this way is insufficient. On the other hand, this approach
guarantees the compliance with the budgetary process at the central level and removes the
negotiated nature of the per-student amount.
208
P U B L I C M O N E Y F O R P U B L I C S C H O O L S
32 See Dogaru 2002, Annex to Chapter 2. Recent versions of the standard costs were typically
30 percent to 40 percent higher than actual costs of providing education in schools (based
on interviews with CNFIPS).
33 Generating lower standard costs does not seem likely. For instance, the CNFIPS calculation
for the standard cost for rural primary school assumes a school size of 500, while in general
rural school are much smaller and therefore have higher costs per student.
34 Government Decision No. 1942/2004 by which eight pilot counties were nominated (Brăila,
Cluj, Dolj, Harghita, Iaşi, Neamţ, Satu Mare and Sibiu).
35 Ordin privind organizarea şi derularea fazei-pilot “Managementul administrativ şi financiar al şcolii într-un mediu descentralizat,” signed between MERY and MIRA (Ministry of Interior
and Administrative Reform).
36 The discussion in the present section draws on J. Herczyński 2006.
37 In decentralized education systems, like in the United Kingdom or in Poland, the funds flow
from the center to lower levels (to schools in the United Kingdom, to local governments in
Poland) according to a formula designed by the Ministry of Education. In other countries
(Belgium), the funds for salaries are sent from the ministry directly to school staff, while the
school director retains considerable autonomy in how she or he runs the school. In contrast,
Romania keeps strong managerial control of school activities, but has decentralized the flow
of funds.
38 Sources: Halasz 2002, Berryman et al. 2006.
39 World Bank 2002.
40 Based on interviews with school directors and teachers.
41 See Halasz 2002.
42 Data from INS, Bucharest 2007.
43 Education Policy Note 2007.
44 For Romania data from Appendix, Table A1.1, for other countries OECD 2005.
45 Class size is the key driver of per-student costs.
46 The conflict was mainly over the financing of those schools, see Levitas and Herczyński
2002.
47 See Halasz 2002 and Herczyński 2005 for in-depth discussion in the context of Romanian
education.
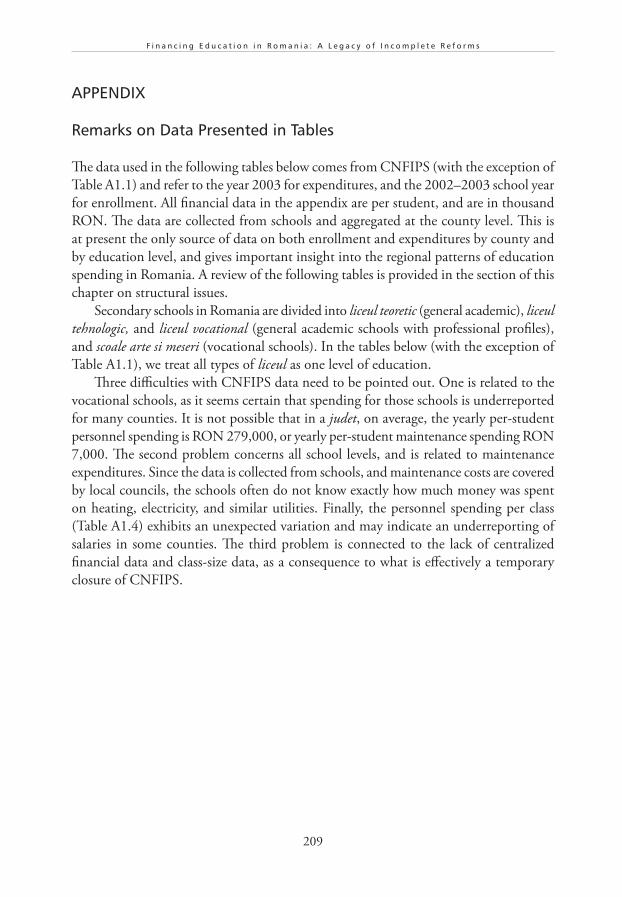
209
F i n a n c i n g E d u c a t i o n i n R o m a n i a : A L e g a c y o f I n c o m p l e t e R e f o r m s
APPENDIX
Remarks on Data Presented in Tables
The data used in the following tables below comes from CNFIPS (with the exception of
Table A1.1) and refer to the year 2003 for expenditures, and the 2002–2003 school year
for enrollment. All financial data in the appendix are per student, and are in thousand
RON. The data are collected from schools and aggregated at the county level. This is
at present the only source of data on both enrollment and expenditures by county and
by education level, and gives important insight into the regional patterns of education
spending in Romania. A review of the following tables is provided in the section of this
chapter on structural issues.
Secondary schools in Romania are divided into liceul teoretic (general academic), liceul
tehnologic, and liceul vocational (general academic schools with professional profiles),
and scoale arte si meseri (vocational schools). In the tables below (with the exception of
Table A1.1), we treat all types of liceul as one level of education.
Three difficulties with CNFIPS data need to be pointed out. One is related to the
vocational schools, as it seems certain that spending for those schools is underreported
for many counties. It is not possible that in a judet, on average, the yearly per-student
personnel spending is RON 279,000, or yearly per-student maintenance spending RON
7,000. The second problem concerns all school levels, and is related to maintenance
expenditures. Since the data is collected from schools, and maintenance costs are covered
by local councils, the schools often do not know exactly how much money was spent
on heating, electricity, and similar utilities. Finally, the personnel spending per class
(Table A1.4) exhibits an unexpected variation and may indicate an underreporting of
salaries in some counties. The third problem is connected to the lack of centralized
financial data and class-size data, as a consequence to what is effectively a temporary
closure of CNFIPS.
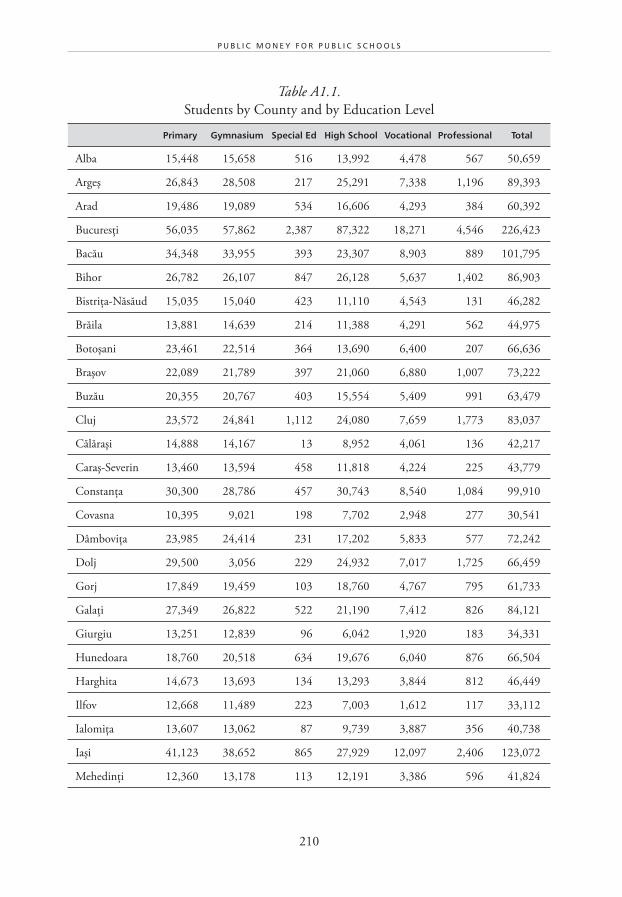
210
P U B L I C M O N E Y F O R P U B L I C S C H O O L S
Table A1.1.
Students by County and by Education Level
Primary Gymnasium Special Ed High School Vocational Professional Total
Alba 15,448 15,658 516 13,992 4,478 567 50,659
Argeş 26,843 28,508 217 25,291 7,338 1,196 89,393
Arad 19,486 19,089 534 16,606 4,293 384 60,392
Bucuresţi 56,035 57,862 2,387 87,322 18,271 4,546 226,423
Bacău 34,348 33,955 393 23,307 8,903 889 101,795
Bihor 26,782 26,107 847 26,128 5,637 1,402 86,903
Bistriţa-Năsăud 15,035 15,040 423 11,110 4,543 131 46,282
Brăila 13,881 14,639 214 11,388 4,291 562 44,975
Botoşani 23,461 22,514 364 13,690 6,400 207 66,636
Braşov 22,089 21,789 397 21,060 6,880 1,007 73,222
Buzău 20,355 20,767 403 15,554 5,409 991 63,479
Cluj 23,572 24,841 1,112 24,080 7,659 1,773 83,037
Călăraşi 14,888 14,167 13 8,952 4,061 136 42,217
Caraş-Severin 13,460 13,594 458 11,818 4,224 225 43,779
Constanţa 30,300 28,786 457 30,743 8,540 1,084 99,910
Covasna 10,395 9,021 198 7,702 2,948 277 30,541
Dâmboviţa 23,985 24,414 231 17,202 5,833 577 72,242
Dolj 29,500 3,056 229 24,932 7,017 1,725 66,459
Gorj 17,849 19,459 103 18,760 4,767 795 61,733
Galaţi 27,349 26,822 522 21,190 7,412 826 84,121
Giurgiu 13,251 12,839 96 6,042 1,920 183 34,331
Hunedoara 18,760 20,518 634 19,676 6,040 876 66,504
Harghita 14,673 13,693 134 13,293 3,844 812 46,449
Ilfov 12,668 11,489 223 7,003 1,612 117 33,112
Ialomiţa 13,607 13,062 87 9,739 3,887 356 40,738
Iaşi 41,123 38,652 865 27,929 12,097 2,406 123,072
Mehedinţi 12,360 13,178 113 12,191 3,386 596 41,824
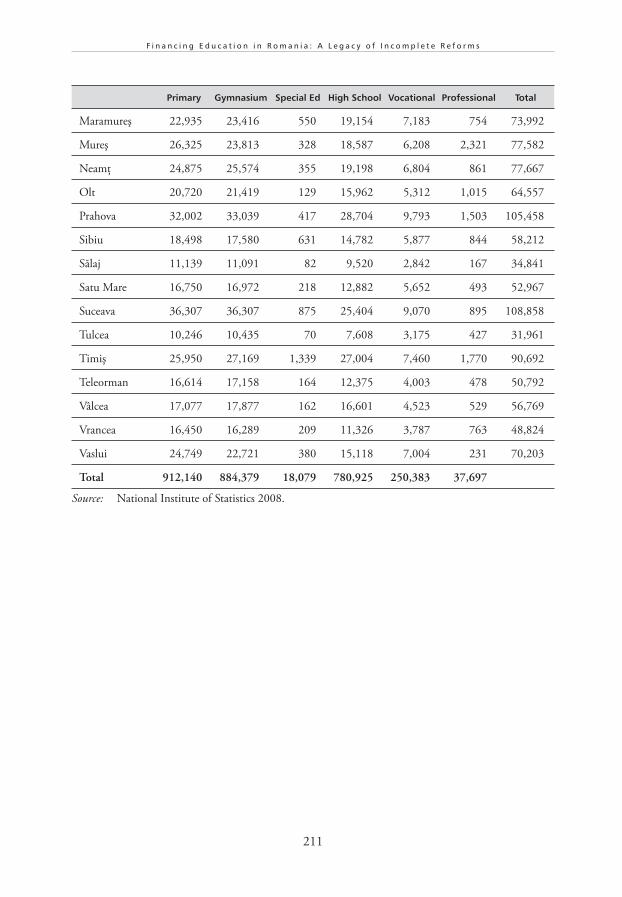
211
F i n a n c i n g E d u c a t i o n i n R o m a n i a : A L e g a c y o f I n c o m p l e t e R e f o r m s
Primary Gymnasium Special Ed High School Vocational Professional Total
Maramureş 22,935 23,416 550 19,154 7,183 754 73,992
Mureş 26,325 23,813 328 18,587 6,208 2,321 77,582
Neamţ 24,875 25,574 355 19,198 6,804 861 77,667
Olt 20,720 21,419 129 15,962 5,312 1,015 64,557
Prahova 32,002 33,039 417 28,704 9,793 1,503 105,458
Sibiu 18,498 17,580 631 14,782 5,877 844 58,212
Sălaj 11,139 11,091 82 9,520 2,842 167 34,841
Satu Mare 16,750 16,972 218 12,882 5,652 493 52,967
Suceava 36,307 36,307 875 25,404 9,070 895 108,858
Tulcea 10,246 10,435 70 7,608 3,175 427 31,961
Timiş 25,950 27,169 1,339 27,004 7,460 1,770 90,692
Teleorman 16,614 17,158 164 12,375 4,003 478 50,792
Vâlcea 17,077 17,877 162 16,601 4,523 529 56,769
Vrancea 16,450 16,289 209 11,326 3,787 763 48,824
Vaslui 24,749 22,721 380 15,118 7,004 231 70,203
Total 912,140 884,379 18,079 780,925 250,383 37,697
Source: National Institute of Statistics 2008.

212
P U B L I C M O N E Y F O R P U B L I C S C H O O L S
Table A1.2
Class Size by County and by Education Level
Primary Gymnasium Lyceum Vocational
Percent Percent Percent Percent
Alba 16.72 87.76 20.12 93.68 27.13 101.95 24.15 98.10
Argeş 18.07 94.83 20.38 94.88 27.41 103.02 23.27 94.54
Arad 19.23 100.90 21.58 100.46 26.87 101.00 23.80 96.68
Bucuresţi 22.73 119.27 24.69 114.97 27.79 104.45 23.78 96.59
Bacău 19.53 102.47 22.40 104.26 26.59 99.93 25.62 104.08
Bihor 17.84 93.64 20.08 93.49 27.39 102.95 25.67 104.28
Bistriţa-Năsăud 17.58 92.27 19.71 91.76 26.96 101.31 25.24 102.53
Brăila 19.14 100.42 21.46 99.89 26.26 98.69 21.04 85.45
Botoşani 18.44 96.74 20.43 95.10 26.14 98.24 26.61 108.11
Braşov 18.87 98.99 21.16 98.51 26.57 99.85 21.38 86.86
Buzău 17.63 92.51 20.48 95.33 26.62 100.05 24.45 99.31
Cluj 18.06 94.76 20.88 97.19 26.54 99.75 22.86 92.87
Călăraşi 20.07 105.31 23.25 108.22 24.86 93.44 26.51 107.67
Caraş-Severin 18.57 97.43 20.28 94.40 27.67 103.98 25.18 102.30
Constanţa 21.40 112.29 21.75 101.27 26.60 99.95 24.24 98.48
Covasna 16.01 84.01 17.97 83.66 22.54 84.70 22.76 92.45
Dâmboviţa 19.25 100.99 21.58 100.49 26.75 100.52 26.69 108.40
Dolj 19.41 101.86 21.21 98.76 25.91 97.37 25.01 101.60
Gorj 18.19 95.44 21.33 99.29 27.28 102.52 24.46 99.34
Galaţi 21.76 114.19 22.78 106.04 27.16 102.08 25.17 102.23
Giurgiu 20.10 105.45 22.38 104.20 27.46 103.20 23.74 96.44
Hunedoara 19.25 101.04 23.04 107.27 26.52 99.68 23.89 97.04
Harghita 15.81 82.96 19.13 89.05 22.68 85.25 23.94 97.25
Ilfov 19.57 102.69 22.88 106.54 26.68 100.27 20.40 82.85
Ialomiţa 21.46 112.59 24.03 111.89 26.54 99.75 25.81 104.83
Iaşi 19.51 102.40 23.16 107.82 26.50 99.57 26.00 105.60
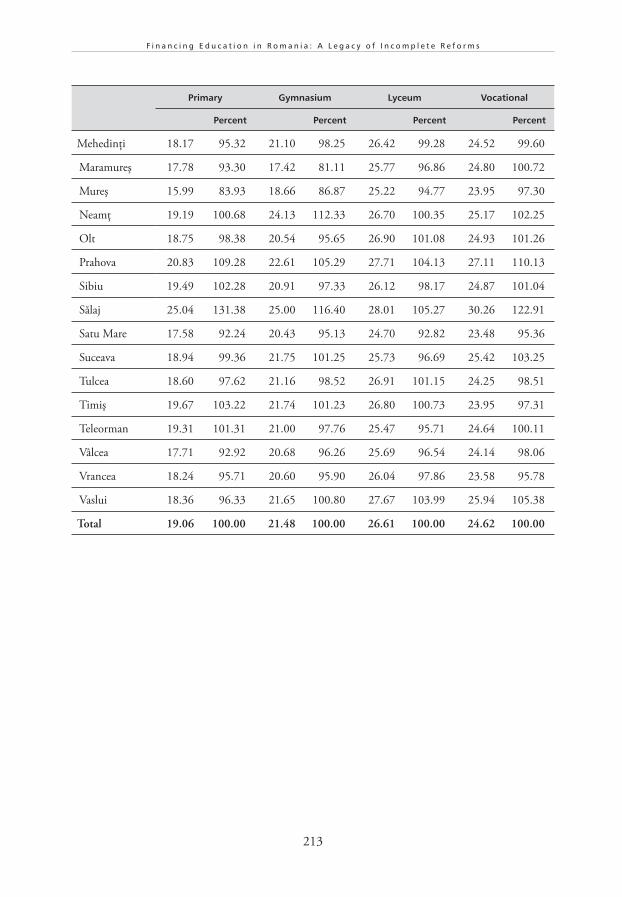
213
F i n a n c i n g E d u c a t i o n i n R o m a n i a : A L e g a c y o f I n c o m p l e t e R e f o r m s
Primary Gymnasium Lyceum Vocational
Percent Percent Percent Percent
Mehedinţi 18.17 95.32 21.10 98.25 26.42 99.28 24.52 99.60
Maramureş 17.78 93.30 17.42 81.11 25.77 96.86 24.80 100.72
Mureş 15.99 83.93 18.66 86.87 25.22 94.77 23.95 97.30
Neamţ 19.19 100.68 24.13 112.33 26.70 100.35 25.17 102.25
Olt 18.75 98.38 20.54 95.65 26.90 101.08 24.93 101.26
Prahova 20.83 109.28 22.61 105.29 27.71 104.13 27.11 110.13
Sibiu 19.49 102.28 20.91 97.33 26.12 98.17 24.87 101.04
Sălaj 25.04 131.38 25.00 116.40 28.01 105.27 30.26 122.91
Satu Mare 17.58 92.24 20.43 95.13 24.70 92.82 23.48 95.36
Suceava 18.94 99.36 21.75 101.25 25.73 96.69 25.42 103.25
Tulcea 18.60 97.62 21.16 98.52 26.91 101.15 24.25 98.51
Timiş 19.67 103.22 21.74 101.23 26.80 100.73 23.95 97.31
Teleorman 19.31 101.31 21.00 97.76 25.47 95.71 24.64 100.11
Vâlcea 17.71 92.92 20.68 96.26 25.69 96.54 24.14 98.06
Vrancea 18.24 95.71 20.60 95.90 26.04 97.86 23.58 95.78
Vaslui 18.36 96.33 21.65 100.80 27.67 103.99 25.94 105.38
Total 19.06 100.00 21.48 100.00 26.61 100.00 24.62 100.00
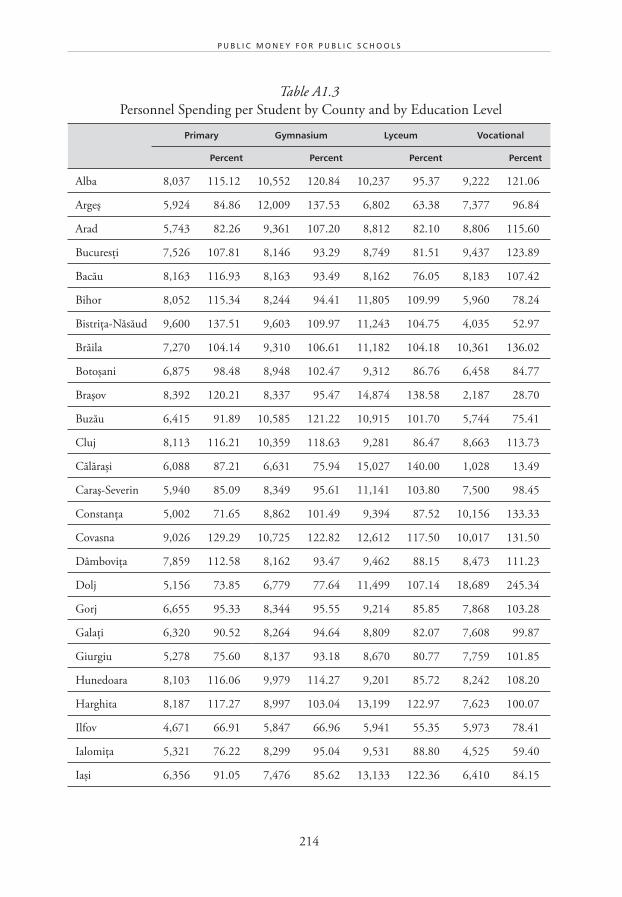
214
P U B L I C M O N E Y F O R P U B L I C S C H O O L S
Table A1.3
Personnel Spending per Student by County and by Education Level
Primary Gymnasium Lyceum Vocational
Percent Percent Percent Percent
Alba 8,037 115.12 10,552 120.84 10,237 95.37 9,222 121.06
Argeş 5,924 84.86 12,009 137.53 6,802 63.38 7,377 96.84
Arad 5,743 82.26 9,361 107.20 8,812 82.10 8,806 115.60
Bucuresţi 7,526 107.81 8,146 93.29 8,749 81.51 9,437 123.89
Bacău 8,163 116.93 8,163 93.49 8,162 76.05 8,183 107.42
Bihor 8,052 115.34 8,244 94.41 11,805 109.99 5,960 78.24
Bistriţa-Năsăud 9,600 137.51 9,603 109.97 11,243 104.75 4,035 52.97
Brăila 7,270 104.14 9,310 106.61 11,182 104.18 10,361 136.02
Botoşani 6,875 98.48 8,948 102.47 9,312 86.76 6,458 84.77
Braşov 8,392 120.21 8,337 95.47 14,874 138.58 2,187 28.70
Buzău 6,415 91.89 10,585 121.22 10,915 101.70 5,744 75.41
Cluj 8,113 116.21 10,359 118.63 9,281 86.47 8,663 113.73
Călăraşi 6,088 87.21 6,631 75.94 15,027 140.00 1,028 13.49
Caraş-Severin 5,940 85.09 8,349 95.61 11,141 103.80 7,500 98.45
Constanţa 5,002 71.65 8,862 101.49 9,394 87.52 10,156 133.33
Covasna 9,026 129.29 10,725 122.82 12,612 117.50 10,017 131.50
Dâmboviţa 7,859 112.58 8,162 93.47 9,462 88.15 8,473 111.23
Dolj 5,156 73.85 6,779 77.64 11,499 107.14 18,689 245.34
Gorj 6,655 95.33 8,344 95.55 9,214 85.85 7,868 103.28
Galaţi 6,320 90.52 8,264 94.64 8,809 82.07 7,608 99.87
Giurgiu 5,278 75.60 8,137 93.18 8,670 80.77 7,759 101.85
Hunedoara 8,103 116.06 9,979 114.27 9,201 85.72 8,242 108.20
Harghita 8,187 117.27 8,997 103.04 13,199 122.97 7,623 100.07
Ilfov 4,671 66.91 5,847 66.96 5,941 55.35 5,973 78.41
Ialomiţa 5,321 76.22 8,299 95.04 9,531 88.80 4,525 59.40
Iaşi 6,356 91.05 7,476 85.62 13,133 122.36 6,410 84.15
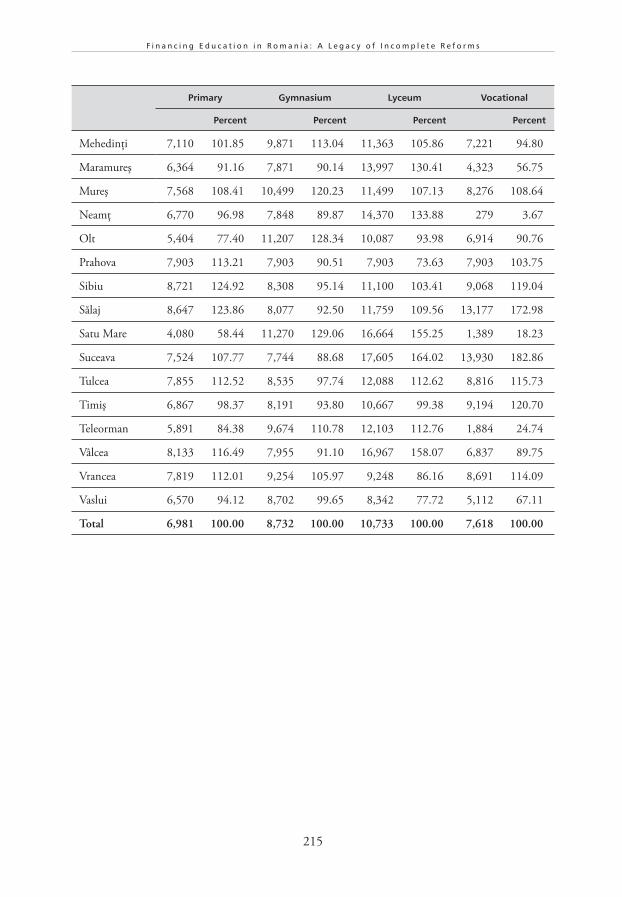
215
F i n a n c i n g E d u c a t i o n i n R o m a n i a : A L e g a c y o f I n c o m p l e t e R e f o r m s
Primary Gymnasium Lyceum Vocational
Percent Percent Percent Percent
Mehedinţi 7,110 101.85 9,871 113.04 11,363 105.86 7,221 94.80
Maramureş 6,364 91.16 7,871 90.14 13,997 130.41 4,323 56.75
Mureş 7,568 108.41 10,499 120.23 11,499 107.13 8,276 108.64
Neamţ 6,770 96.98 7,848 89.87 14,370 133.88 279 3.67
Olt 5,404 77.40 11,207 128.34 10,087 93.98 6,914 90.76
Prahova 7,903 113.21 7,903 90.51 7,903 73.63 7,903 103.75
Sibiu 8,721 124.92 8,308 95.14 11,100 103.41 9,068 119.04
Sălaj 8,647 123.86 8,077 92.50 11,759 109.56 13,177 172.98
Satu Mare 4,080 58.44 11,270 129.06 16,664 155.25 1,389 18.23
Suceava 7,524 107.77 7,744 88.68 17,605 164.02 13,930 182.86
Tulcea 7,855 112.52 8,535 97.74 12,088 112.62 8,816 115.73
Timiş 6,867 98.37 8,191 93.80 10,667 99.38 9,194 120.70
Teleorman 5,891 84.38 9,674 110.78 12,103 112.76 1,884 24.74
Vâlcea 8,133 116.49 7,955 91.10 16,967 158.07 6,837 89.75
Vrancea 7,819 112.01 9,254 105.97 9,248 86.16 8,691 114.09
Vaslui 6,570 94.12 8,702 99.65 8,342 77.72 5,112 67.11
Total 6,981 100.00 8,732 100.00 10,733 100.00 7,618 100.00
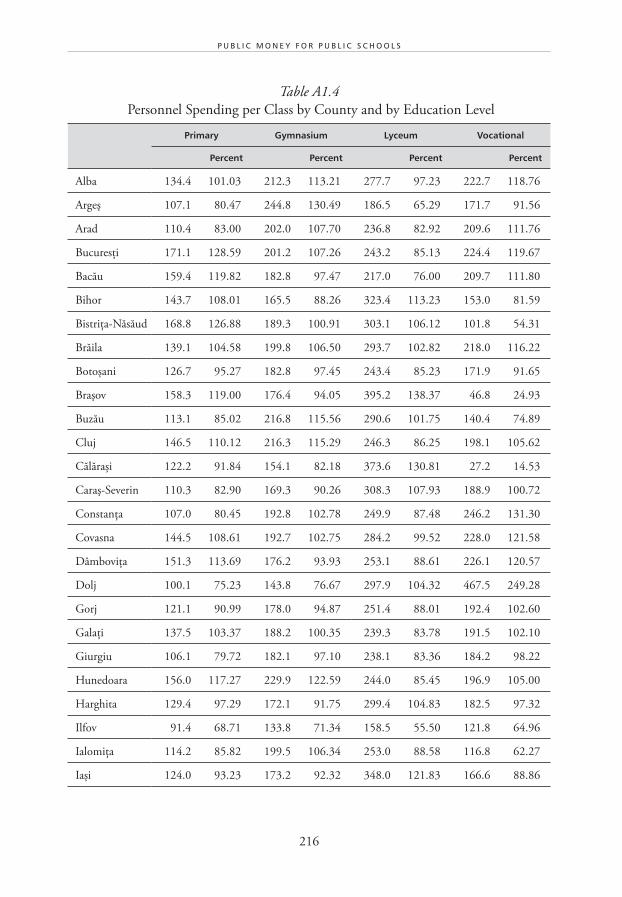
216
P U B L I C M O N E Y F O R P U B L I C S C H O O L S
Table A1.4
Personnel Spending per Class by County and by Education Level
Primary Gymnasium Lyceum Vocational
Percent Percent Percent Percent
Alba 134.4 101.03 212.3 113.21 277.7 97.23 222.7 118.76
Argeş 107.1 80.47 244.8 130.49 186.5 65.29 171.7 91.56
Arad 110.4 83.00 202.0 107.70 236.8 82.92 209.6 111.76
Bucuresţi 171.1 128.59 201.2 107.26 243.2 85.13 224.4 119.67
Bacău 159.4 119.82 182.8 97.47 217.0 76.00 209.7 111.80
Bihor 143.7 108.01 165.5 88.26 323.4 113.23 153.0 81.59
Bistriţa-Năsăud 168.8 126.88 189.3 100.91 303.1 106.12 101.8 54.31
Brăila 139.1 104.58 199.8 106.50 293.7 102.82 218.0 116.22
Botoşani 126.7 95.27 182.8 97.45 243.4 85.23 171.9 91.65
Braşov 158.3 119.00 176.4 94.05 395.2 138.37 46.8 24.93
Buzău 113.1 85.02 216.8 115.56 290.6 101.75 140.4 74.89
Cluj 146.5 110.12 216.3 115.29 246.3 86.25 198.1 105.62
Călăraşi 122.2 91.84 154.1 82.18 373.6 130.81 27.2 14.53
Caraş-Severin 110.3 82.90 169.3 90.26 308.3 107.93 188.9 100.72
Constanţa 107.0 80.45 192.8 102.78 249.9 87.48 246.2 131.30
Covasna 144.5 108.61 192.7 102.75 284.2 99.52 228.0 121.58
Dâmboviţa 151.3 113.69 176.2 93.93 253.1 88.61 226.1 120.57
Dolj 100.1 75.23 143.8 76.67 297.9 104.32 467.5 249.28
Gorj 121.1 90.99 178.0 94.87 251.4 88.01 192.4 102.60
Galaţi 137.5 103.37 188.2 100.35 239.3 83.78 191.5 102.10
Giurgiu 106.1 79.72 182.1 97.10 238.1 83.36 184.2 98.22
Hunedoara 156.0 117.27 229.9 122.59 244.0 85.45 196.9 105.00
Harghita 129.4 97.29 172.1 91.75 299.4 104.83 182.5 97.32
Ilfov 91.4 68.71 133.8 71.34 158.5 55.50 121.8 64.96
Ialomiţa 114.2 85.82 199.5 106.34 253.0 88.58 116.8 62.27
Iaşi 124.0 93.23 173.2 92.32 348.0 121.83 166.6 88.86
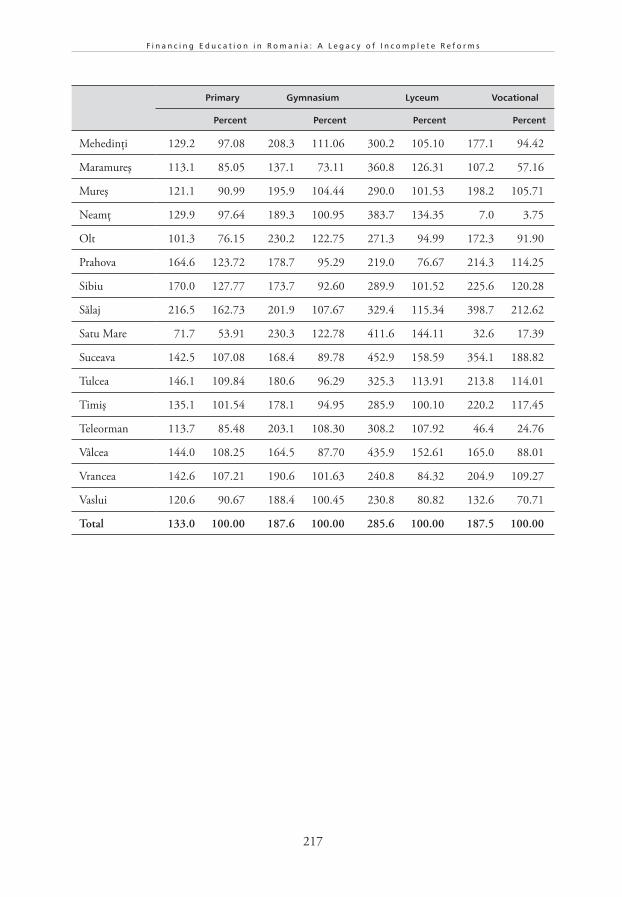
217
F i n a n c i n g E d u c a t i o n i n R o m a n i a : A L e g a c y o f I n c o m p l e t e R e f o r m s
Primary Gymnasium Lyceum Vocational
Percent Percent Percent Percent
Mehedinţi 129.2 97.08 208.3 111.06 300.2 105.10 177.1 94.42
Maramureş 113.1 85.05 137.1 73.11 360.8 126.31 107.2 57.16
Mureş 121.1 90.99 195.9 104.44 290.0 101.53 198.2 105.71
Neamţ 129.9 97.64 189.3 100.95 383.7 134.35 7.0 3.75
Olt 101.3 76.15 230.2 122.75 271.3 94.99 172.3 91.90
Prahova 164.6 123.72 178.7 95.29 219.0 76.67 214.3 114.25
Sibiu 170.0 127.77 173.7 92.60 289.9 101.52 225.6 120.28
Sălaj 216.5 162.73 201.9 107.67 329.4 115.34 398.7 212.62
Satu Mare 71.7 53.91 230.3 122.78 411.6 144.11 32.6 17.39
Suceava 142.5 107.08 168.4 89.78 452.9 158.59 354.1 188.82
Tulcea 146.1 109.84 180.6 96.29 325.3 113.91 213.8 114.01
Timiş 135.1 101.54 178.1 94.95 285.9 100.10 220.2 117.45
Teleorman 113.7 85.48 203.1 108.30 308.2 107.92 46.4 24.76
Vâlcea 144.0 108.25 164.5 87.70 435.9 152.61 165.0 88.01
Vrancea 142.6 107.21 190.6 101.63 240.8 84.32 204.9 109.27
Vaslui 120.6 90.67 188.4 100.45 230.8 80.82 132.6 70.71
Total 133.0 100.00 187.6 100.00 285.6 100.00 187.5 100.00
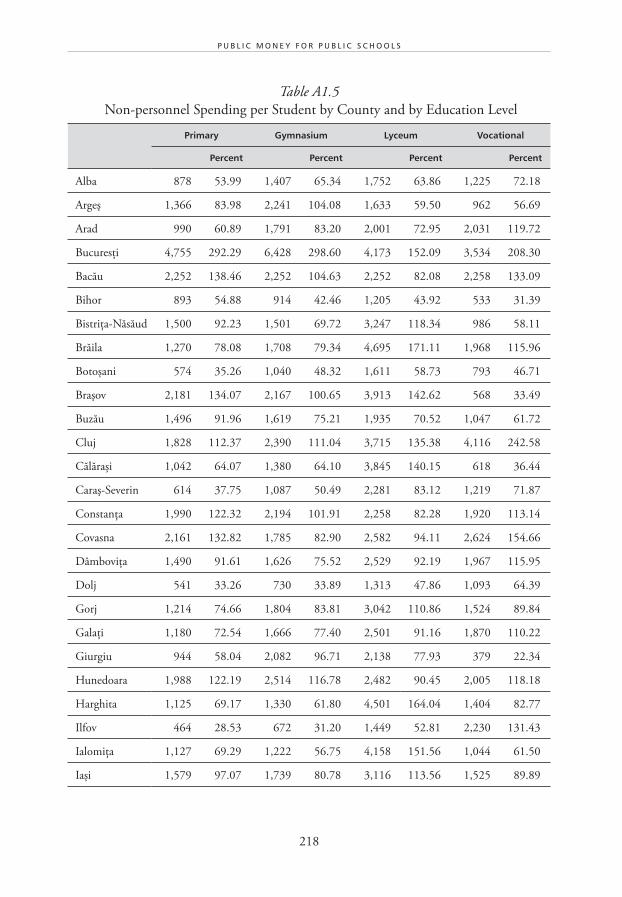
218
P U B L I C M O N E Y F O R P U B L I C S C H O O L S
Table A1.5
Non-personnel Spending per Student by County and by Education Level
Primary Gymnasium Lyceum Vocational
Percent Percent Percent Percent
Alba 878 53.99 1,407 65.34 1,752 63.86 1,225 72.18
Argeş 1,366 83.98 2,241 104.08 1,633 59.50 962 56.69
Arad 990 60.89 1,791 83.20 2,001 72.95 2,031 119.72
Bucuresţi 4,755 292.29 6,428 298.60 4,173 152.09 3,534 208.30
Bacău 2,252 138.46 2,252 104.63 2,252 82.08 2,258 133.09
Bihor 893 54.88 914 42.46 1,205 43.92 533 31.39
Bistriţa-Năsăud 1,500 92.23 1,501 69.72 3,247 118.34 986 58.11
Brăila 1,270 78.08 1,708 79.34 4,695 171.11 1,968 115.96
Botoşani 574 35.26 1,040 48.32 1,611 58.73 793 46.71
Braşov 2,181 134.07 2,167 100.65 3,913 142.62 568 33.49
Buzău 1,496 91.96 1,619 75.21 1,935 70.52 1,047 61.72
Cluj 1,828 112.37 2,390 111.04 3,715 135.38 4,116 242.58
Călăraşi 1,042 64.07 1,380 64.10 3,845 140.15 618 36.44
Caraş-Severin 614 37.75 1,087 50.49 2,281 83.12 1,219 71.87
Constanţa 1,990 122.32 2,194 101.91 2,258 82.28 1,920 113.14
Covasna 2,161 132.82 1,785 82.90 2,582 94.11 2,624 154.66
Dâmboviţa 1,490 91.61 1,626 75.52 2,529 92.19 1,967 115.95
Dolj 541 33.26 730 33.89 1,313 47.86 1,093 64.39
Gorj 1,214 74.66 1,804 83.81 3,042 110.86 1,524 89.84
Galaţi 1,180 72.54 1,666 77.40 2,501 91.16 1,870 110.22
Giurgiu 944 58.04 2,082 96.71 2,138 77.93 379 22.34
Hunedoara 1,988 122.19 2,514 116.78 2,482 90.45 2,005 118.18
Harghita 1,125 69.17 1,330 61.80 4,501 164.04 1,404 82.77
Ilfov 464 28.53 672 31.20 1,449 52.81 2,230 131.43
Ialomiţa 1,127 69.29 1,222 56.75 4,158 151.56 1,044 61.50
Iaşi 1,579 97.07 1,739 80.78 3,116 113.56 1,525 89.89

219
F i n a n c i n g E d u c a t i o n i n R o m a n i a : A L e g a c y o f I n c o m p l e t e R e f o r m s
Primary Gymnasium Lyceum Vocational
Percent Percent Percent Percent
Mehedinţi 761 46.76 1,176 54.61 2,661 96.98 1,298 76.50
Maramureş 769 47.29 832 38.67 2,989 108.93 647 38.12
Mureş 1,373 84.39 3,364 156.28 1,881 68.55 1,170 68.94
Neamţ 2,040 125.40 2,175 101.04 2,589 94.38 309 18.20
Olt 2,563 157.53 1,083 50.29 2,406 87.71 656 38.64
Prahova 1,863 114.55 1,863 86.56 1,955 71.25 1,957 115.36
Sibiu 1,456 89.53 1,387 64.45 2,071 75.49 1,967 115.94
Sălaj 1,227 75.45 1,291 59.99 3,618 131.87 1,788 105.37
Satu Mare 769 47.29 3,795 176.31 2,571 93.72 7 0.41
Suceava 2,360 145.10 2,605 121.02 2,443 89.04 2,931 172.76
Tulcea 1,362 83.74 1,823 84.69 3,302 120.35 2,906 171.25
Timiş 1,337 82.20 1,444 67.07 2,618 95.42 2,767 163.08
Teleorman 633 38.89 2,738 127.17 1,867 68.03 256 15.06
Vâlcea 1,416 87.07 1,631 75.79 3,233 117.82 986 58.12
Vrancea 2,343 144.04 2,607 121.09 3,765 137.23 2,266 133.53
Vaslui 599 36.84 934 43.37 1,819 66.29 974 57.38
Total 1,627 100.00 2,153 100.00 2,744 100.00 1,697 100.00

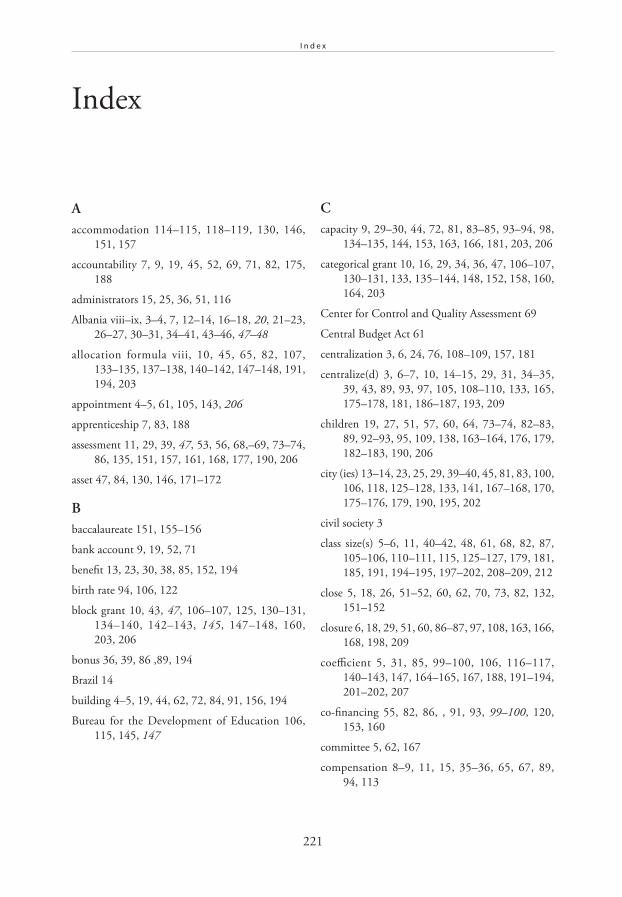
221
I n d e x
Index
A
accommodation 114–115, 118–119, 130, 146,
151, 157
accountability 7, 9, 19, 45, 52, 69, 71, 82, 175,
188
administrators 15, 25, 36, 51, 116
Albania viii–ix, 3–4, 7, 12–14, 16–18, 20, 21–23,
26–27, 30–31, 34–41, 43–46, 47–48
allocation formula viii, 10, 45, 65, 82, 107,
133–135, 137–138, 140–142, 147–148, 191,
194, 203
appointment 4–5, 61, 105, 143, 206
apprenticeship 7, 83, 188
assessment 11, 29, 39, 47, 53, 56, 68,–69, 73–74,
86, 135, 151, 157, 161, 168, 177, 190, 206
asset 47, 84, 130, 146, 171–172
B
baccalaureate 151, 155–156
bank account 9, 19, 52, 71
benefit 13, 23, 30, 38, 85, 152, 194
birth rate 94, 106, 122
block grant 10, 43, 47, 106–107, 125, 130–131,
134–140, 142–143, 145, 147–148, 160,
203, 206
bonus 36, 39, 86 ,89, 194
Brazil 14
building 4–5, 19, 44, 62, 72, 84, 91, 156, 194
Bureau for the Development of Education 106,
115, 145, 147
C
capacity 9, 29–30, 44, 72, 81, 83–85, 93–94, 98,
134–135, 144, 153, 163, 166, 181, 203, 206
categorical grant 10, 16, 29, 34, 36, 47, 106–107,
130–131, 133, 135–144, 148, 152, 158, 160,
164, 203
Center for Control and Quality Assessment 69
Central Budget Act 61
centralization 3, 6, 24, 76, 108–109, 157, 181
centralize(d) 3, 6–7, 10, 14–15, 29, 31, 34–35,
39, 43, 89, 93, 97, 105, 108–110, 133, 165,
175–178, 181, 186–187, 193, 209
children 19, 27, 51, 57, 60, 64, 73–74, 82–83,
89, 92–93, 95, 109, 138, 163–164, 176, 179,
182–183, 190, 206
city (ies) 13–14, 23, 25, 29, 39–40, 45, 81, 83, 100,
106, 118, 125–128, 133, 141, 167–168, 170,
175–176, 179, 190, 195, 202
civil society 3
class size(s) 5–6, 11, 40–42, 48, 61, 68, 82, 87,
105–106, 110–111, 115, 125–127, 179, 181,
185, 191, 194–195, 197–202, 208–209, 212
close 5, 18, 26, 51–52, 60, 62, 70, 73, 82, 132,
151–152
closure 6, 18, 29, 51, 60, 86–87, 97, 108, 163, 166,
168, 198, 209
coefficient 5, 31, 85, 99–100, 106, 116–117,
140–143, 147, 164–165, 167, 188, 191–194,
201–202, 207
co-financing 55, 82, 86, , 91, 93, 99–100, 120,
153, 160
committee 5, 62, 167
compensation 8–9, 11, 15, 35–36, 65, 67, 89,
94, 113
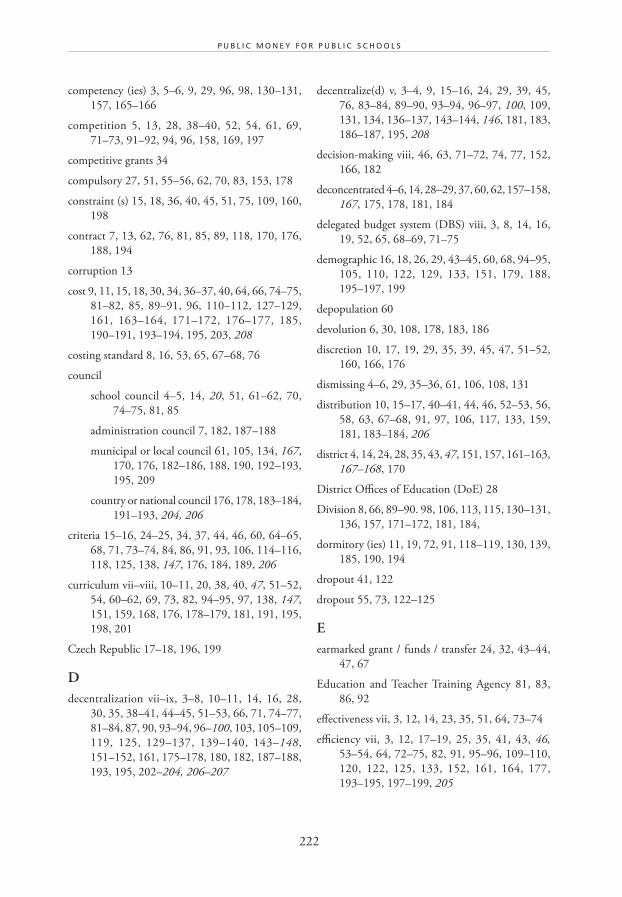
222
P U B L I C M O N E Y F O R P U B L I C S C H O O L S
competency (ies) 3, 5–6, 9, 29, 96, 98, 130–131,
157, 165–166
competition 5, 13, 28, 38–40, 52, 54, 61, 69,
71–73, 91–92, 94, 96, 158, 169, 197
competitive grants 34
compulsory 27, 51, 55–56, 62, 70, 83, 153, 178
constraint (s) 15, 18, 36, 40, 45, 51, 75, 109, 160,
198
contract 7, 13, 62, 76, 81, 85, 89, 118, 170, 176,
188, 194
corruption 13
cost 9, 11, 15, 18, 30, 34, 36–37, 40, 64, 66, 74–75,
81–82, 85, 89–91, 96, 110–112, 127–129,
161, 163–164, 171–172, 176–177, 185,
190–191, 193–194, 195, 203, 208
costing standard 8, 16, 53, 65, 67–68, 76
council
school council 4–5, 14, 20, 51, 61–62, 70,
74–75, 81, 85
administration council 7, 182, 187–188
municipal or local council 61, 105, 134, 167,
170, 176, 182–186, 188, 190, 192–193,
195, 209
country or national council 176, 178, 183–184,
191–193, 204, 206
criteria 15–16, 24–25, 34, 37, 44, 46, 60, 64–65,
68, 71, 73–74, 84, 86, 91, 93, 106, 114–116,
118, 125, 138, 147, 176, 184, 189, 206
curriculum vii–viii, 10–11, 20, 38, 40, 47, 51–52,
54, 60–62, 69, 73, 82, 94–95, 97, 138, 147,
151, 159, 168, 176, 178–179, 181, 191, 195,
198, 201
Czech Republic 17–18, 196, 199
D
decentralization vii–ix, 3–8, 10–11, 14, 16, 28,
30, 35, 38–41, 44–45, 51–53, 66, 71, 74–77,
81–84, 87, 90, 93–94, 96–100, 103, 105–109,
119, 125, 129–137, 139–140, 143–148,
151–152, 161, 175–178, 180, 182, 187–188,
193, 195, 202–204, 206–207
decentralize(d) v, 3–4, 9, 15–16, 24, 29, 39, 45,
76, 83–84, 89–90, 93–94, 96–97, 100, 109,
131, 134, 136–137, 143–144, 146, 181, 183,
186–187, 195, 208
decision-making viii, 46, 63, 71–72, 74, 77, 152,
166, 182
deconcentrated 4–6, 14, 28–29, 37, 60, 62, 157–158,
167, 175, 178, 181, 184
delegated budget system (DBS) viii, 3, 8, 14, 16,
19, 52, 65, 68–69, 71–75
demographic 16, 18, 26, 29, 43–45, 60, 68, 94–95,
105, 110, 122, 129, 133, 151, 179, 188,
195–197, 199
depopulation 60
devolution 6, 30, 108, 178, 183, 186
discretion 10, 17, 19, 29, 35, 39, 45, 47, 51–52,
160, 166, 176
dismissing 4–6, 29, 35–36, 61, 106, 108, 131
distribution 10, 15–17, 40–41, 44, 46, 52–53, 56,
58, 63, 67–68, 91, 97, 106, 117, 133, 159,
181, 183–184, 206
district 4, 14, 24, 28, 35, 43, 47, 151, 157, 161–163,
167–168, 170
District Offices of Education (DoE) 28
Division 8, 66, 89–90. 98, 106, 113, 115, 130–131,
136, 157, 171–172, 181, 184,
dormitory (ies) 11, 19, 72, 91, 118–119, 130, 139,
185, 190, 194
dropout 41, 122
dropout 55, 73, 122–125
E
earmarked grant / funds / transfer 24, 32, 43–44,
47, 67
Education and Teacher Training Agency 81, 83,
86, 92
effectiveness vii, 3, 12, 14, 23, 35, 51, 64, 73–74
efficiency vii, 3, 12, 17–19, 25, 35, 41, 43, 46,
53–54, 64, 72–75, 82, 91, 95–96, 109–110,
120, 122, 125, 133, 152, 161, 164, 177,
193–195, 197–199, 205
223
I n d e x
electricity 7, 19, 37, 66, 118, 120, 147, 165,
171–172, 183, 209
enrollment 18, 23, 26, 28, 31, 35, 38–39, 41–44,
48, 52, 57, 59–60, 62, 70, 81, 84, 91, 120,
122, 134, 147, 151, 154, 156, 160, 179, 181,
185–186, 188, 195, 198, 209
equalization fund 9–10, 81–82, 84, 90–91, 93, 96,
98, 106, 176, 184
Equalization Fund 9, 81–82, 84, 90–91, 93, 96, 98,
106, 176, 184 ,
equity 12, 15–16, 25, 40, 46, 52, 69, 75, 95–96,
106, 109–110, 125, 132, 177, 179, 200, 202
ethnicity 40, 106
EU 7, 52, 54, 56, 63,
EU 10 69–70, 76, 178, 180,
EU 15 70
EU 25 12, 63, 70
excellence ix, 73, 138
extrabudgetary 9, 105, 113, 164, 168–170
F
firing 5, 14, 61, 63
fixed costs 107, 141
formula 8, 10–11, 15–16, 19–20, 24, 29, 44–46,
64–65, 72, 74, 82, 91, 98, 107, 130–135,
137–138, 140–143, 145, 147–148, 158, 184,
189–194, 203–104, 207–208
founder 5, 83–85, 94, 96–98, 132, 135
founding rights 5, 55, 68, 81, 83–84, 97, 132,
147
France 3, 70
function(s) 3–4, 6, 8–10, 14, 23–25, 28–30, 35, 37,
39, 41, 44–45, 47, 61–62, 68, 83–84, 87, 94,
98, 100, 105, 131–132, 136–137, 147, 152,
164–165, 181, 189, 192, 203
funding authority 5, 8, 10, 14, 52, 61–63, 65–67,
75, 78, 152, 156, 160, 168–169
G
GDP 12–13, 23, 30, 44, 47, 48, 52, 63–64, 78, 81,
85–88, 105, 108, 112, 152, 158–159, 172,
177, 180, 196
geographic 16, 24, 40–41, 45–46, 68
governance v, vii, 29, 83, 109, 129, 161, 164,
177, 181
grade 8, 16, 19, 42–43, 52, 56, 59, 65, 67–68,
73–74, 90, 95, 106, 115–116, 120–124, 142,
147–148, 153–155, 178, 185
grammar school 83
grant 8, 10–11, 16, 29, 32, 34, 36–37, 43, 47, 55,
66, 81, 94, 105–107, 109, 113–114, 119, 125,
130–131, 133–145, 147–148, 152, 158, 160,
164, 169, 176, 183, 186, 189, 193, 203, 206
growth ix, 4, 27, 34, 37–38, 61, 81, 86, 96, 153,
158
gymnasium 13, 37, 111, 140–143, 146, 154–156,
188, 191, 198, 200–202, 210–219
H
heating 7, 11, 19, 37, 66, 89, 91, 100, 114, 116,
118, 120, 127–129, 132–133, 147, 171–172,
183, 191, 209
hegemony 4
hiring 4–6, 8, 14, 29, 35–36, 46, 61–63, 152,
158
historical budgeting 10–11
horizontal 15–16
hours 5, 39, 52, 61, 93, 165, 185
human resources 3, 24, 55, 62, 82, 94, 97
Hungary 17, 45, 196, 199
I
incentive 8, 13, 19, 35–37, 39–40, 45, 64, 69,
72–75, 120, 175, 179, 195, 199
income tax 8–9, 67, 81–82, 84, 91, 106, 130,
158, 183
index (indices) 96
inspectorate 4–5, 7, 20, 51–52, 60–63, 144–145,
175–176, 181–182, 184–186, 188–189
Inspectorul Scholar Judetean (ISJ) (County School
Inspectorate) 178, 181, 185–188, 195, 206
internet 7, 197
in-training 11, 190
224
P U B L I C M O N E Y F O R P U B L I C S C H O O L S
investment ix, 8–9, 11, 24–25, 30, 32–35, 39,
44–47, 52, 66–67, 78, 90, 93, 98, 105,
114–115, 119, 129, 131, 133, 143, 147, 163,
166, 171–172, 185–186, 190, 194
K
kindergarten 7, 64–65, 76, 93, 163, 176, 188
kolkhoz 151, 156
L
Law on Local Government Finance (LLGF) 6, 106,
129–132, 136–137, 145, 148
lease 62–63
legislation 4, 7, 11, 55, 75–76, 85, 139, 151–153,
157, 165–166, 169, 176, 187–190, 202–203,
205–206
locality (ies) 34, 164–165, 177, 189–190, 195
lump sum 16, 107, 140–141, 143, 147, 206
M
Macedonia v, viii–ix, 3, 6, 9, 12, 16–20, 46–47, 103,
105–111, 117, 120, 122, 124–130, 132–137,
139, 143, 145–148
macroeconomic indicator 96
maintenance 3–10, 13–14, 16, 24, 28–29, 32–33,
36–37, 39–40, 44–45, 47, 51–52, 55, 60–62,
64–66, 68, 72, 76, 78, 90–91, 98, 106, 113,
116, 118, 120, 127–129, 131–137, 139–141,
143, 148, 151–152, 156, 158, 160, 163–166,
168, 176, 178, 182–186, 190, 193, 195, 202,
206, 209
management v, vi–ix, 3–4, 6, 8–9, 11, 14, 16,
18–19, 25, 29, 37, 39, 40, 43, 45–46, 51–52,
54–55, 59, 63, 66, 68, 70–71, 76, 82, 86,
96–98, 109, 131, 134, 136, 144–145, 148,
152, 158, 163, 175–176, 178–182, 187, 192,
204, 208
mandate 7, 28, 61–62, 65, 132, 157, 176, 183,
189, 193, 203
migration 13, 18, 41–43, 47, 60, 122–123, 155,
161
minister ix, 5, 7, 60–62, 85–86, 91, 108, 119,
205
Ministry of Education (MoE) viii–ix, 6–8, 14, 24,
28, 34, 37, 45–46, 51, 54, 59–62, 64, 69,
77, 84, 132, 144, 152, 156–158, 167–168,
207–208
Ministry of Education and Science (MoES) viii–ix,
5, 8, 59–62, 65, 67, 76, 105, 107–109, 114,
117–120, 130–140, 143–145, 146–148
Ministry of Education, Research, and Youth
(MERY) 175, 177–178, 187, 192–197, 199,
202–203, 204–205
Ministry of Finance (MoF) ix, 8–11, 28, 34, 39, 46,
64, 66–67, 76, 81, 84, 86, 88, 91, 97, 99, 109,
114, 117, 132, 136, 139, 144–145, 148, 160,
164, 166, 186, 193, 206–207
Ministry of Health 91
Ministry of Interior (MoI) 28, 203, 205, 208
Ministry of Science, Education, and Sport vii, ix,
81, 83, 85–86, 89–98, 100
money 8–9, 41, 52, 55, 67, 75, 94, 96–98, 100, 109,
114, 118, 160, 164, 169–170, 195, 209
N
National Association of Municipalities in the
Republic of Bulgaria viii, 61, 76
National Council for Financing Pre–university
Education 176, 191, 193, 204, 208–209
National Pedagogic Center 69
need(s) 9, 13–17, 19, 23–25, 28, 34, 37–41, 44–45,
51, 54, 66–69, 72–73, 81–82, 84–87, 89, 91,
93–94, 97, 118, 130–131, 135, 139, 142–143,
159, 164–165, 167, 183–184, 186, 194, 206
New Zealand 3
nongovernmental organization (NGO) 54, 83, 86
non-earmarked revenues 183
non-teacher 11, 136, 176, 191
normative unqualified employee (UNR) 106, 111,
116–118
norms 10–11, 13, 16, 42, 75, 82, 84, 106, 109, 111,
114–116, 118, 120, 129, 134, 147, 158, 160,
164–165, 167, 175–176, 181, 185, 188–189,
1911, 194–196, 199, 205, 207
225
I n d e x
O
official (s) v, 24, 39, 51, 74, 106, 108, 192
open 37, 69, 97, 122, 134, 180, 190, 197, 207
opening 6, 60, 96–97, 108, 157, 164, 168, 176, 203
optimization 17, 144
oversight 52, 60, 62
own revenues 8, 10, 14–15, 19, 24, 29, 39, 53, 62,
65–67, 72, 76, 94, 105, 109, 111, 130–131,
147–148, 152, 159, 165, 176, 183, 189–190,
202
P
parent 4, 10, 15, 20, 40, 51, 54–55, 59, 61, 69–70,
73–74, 82, 85, 92, 95, 105, 109, 132, 147, 160,
163, 169, 195, 197, 206
payment 7, 13, 60, 66, 105, 109, 157, 160, 165,
171–172, 186, 189
pedagogy 28, 69
performance 4, 6, 19, 25, 29, 39, 52, 61, 66, 68–69,
72–73, 75, 117, 130, 144, 152–153, 158, 165,
188–189, 204, 207
personal income tax 8, 67, 106, 130, 158, 183
pilot county (ies) 7, 11, 175–176, 188, 192–193,
208
pilot municipality (ies) 4, 61, 70
pilot program 14, 29, 51, 53, 181, 192–193
pilot project 4, 11, 175, 179
Poland v, viii, 17, 45, 103, 173, 196, 199, 202,
204, 208
population 4, 10, 18, 26, 37, 41, 43, 45, 70, 78,
91, 94, 97, 107, 110, 122, 129, 133, 140–142,
147, 153, 155, 160–161, 164, 167, 169, 175,
179, 190, 193, 197, 206–207
power (s) 4–7, 9, 43, 46, 53, 60–63, 67, 71–72,
74–76, 81, 98, 105–108, 110, 131, 143, 157,
166, 175–176, 182, 188, 203
pre-primary 23. 27. 30–33. 38. 42. 70. 83
preschool 23, 27, 58, 60, 77, 82–83, 87–88, 92–93,
99–100, 151, 153–154, 156–157, 159–160,
168, 175, 182, 185, 199
pre-secondary 56–58
pre-university 23, 28, 30–32, 42, 46, 154, 176,
182, 185, 187, 189, 191, 193–194, 197,
204–205, 207
primary school 6–7, 16, 18, 36, 41–42, 56, 81,
83–87, 89, 92–96, 99–100, 105, 110–111,
116–118, 125–127, 139–140, 142, 146–148,
154, 175, 179, 182, 188, 196, 198, 201, 208
private sector 3, 158
property 9, 14, 29, 37, 40, 44, 52, 62–63, 65, 71,
105, 107, 130, 132, 134, 137, 144, 153, 207
proposal 4, 6, 24, 34, 46, 61, 85, 98, 157, 160,
167–168, 176, 187, 194, 205
provision 8, 24, 29, 38, 40, 44, 66, 71, 85, 87, 130,
132, 138, 144, 147, 177, 183
public servant 13, 85
pupil 8–9, 18, 52, 65, 81–82, 84–85, 91, 97, 122,
154, 188
Q
qualification ix, 47, 60, 106, 132, 151, 186, 193
quality v, vii–viii, 3, 12–13, 18, 24, 29, 36–40,
44–45, 52–56, 63, 68–70, 73–75, 83, 93–96,
98, 118, 147, 151, 153, 155, 157, 167, 177,
179–182, 197, 204
quasi-voucher 8, 16, 52, 65, 67–68, 71
R
raion 6, 10, 151–152, 157–160, 166, 167, 169
reallocate 10, 67
reallocation 46, 187
recommendation 5, 45, 62, 74–75, 147, 180, 202
recruitment 14, 63, 182
reform v, vii, ix, 3–4, 7–8, 25, 45, 52–53, 68–69, 71,
74–75, 81, 99, 101, 145, 151–154, 161, 164,
166–168, 173, 175–181, 187, 195, 202–204,
205–206, 208
refugees 18, 94
region v, 8, 18, 25, 28–29, 36, 40–42, 45, 94, 97,
161, 167, 177, 179, 187, 194, 196–198, 202
regional v, viii, 4–5, 8, 16, 20, 28–29, 34, 37 ,44,
47, 51–52, 60–63, 81, 83, 91, 123, 144, 148,
151, 164–165, 175, 180–181, 184, 198, 200,
203, 209
226
P U B L I C M O N E Y F O R P U B L I C S C H O O L S
Regional Education Inspectorate 5, 62
Regional Directorate of Education (RDE) 8, 28–29,
34, 37
Regional Inspectorate 4–5, 20, 51–52, 60–63
regulation 5–6, 10–11, 28, 61, 64–65, 68, 87,
99–100, 144, 147, 158, 169, 192
remuneration 8, 15, 52, 66–67, 78
repairs 6–7, 11, 34, 36–37, 66, 76, 106, 131, 147,
160, 163, 166, 171–172, 182–183, 190
resource (s) 3, 9, 12, 16–17, 19, 24, 30, 36, 40–44,
47, 52–53, 55, 62, 66–68, 71–72, 74–76, 82,
84–87, 90–91, 94–98, 105, 113, 119, 144,
154, 163–164, 166, 170, 177, 179, 182, 185,
194–197, 195
responsibility 3, 5–6, 8–10, 13–15, 20, 23–25,
28–30, 36–40, 45, 52–53, 55, 60, 63, 66,
68, 71, 74, 76, 81, 83, 94, 96, 98, 99, 101,
105–106, 108–109, 118, 129–137, 143–145,
151–152, 156–158, 161, 163, 165, 167,
176–177, 182–188, 192–193, 195, 202–204
results 3–4, 7–11, 14, 18–19, 23, 26, 29, 31, 35, 39,
41, 44–45, 52–53, 55, 68–69, 71, 73–76, 81,
93, 108, 137, 154, 156–157, 160–161, 163,
165, 175, 178, 181, 188, 198, 204, 206
retention 14, 181
revenue ix, 7–10, 13–15, 19, 24, 29, 32, 36,
39–40, 43–44, 46, 52–53, 62, 65–67, 71–73,
76, 81, 84, 90, 93–94, 105, 108–109, 111,
114, 130–131, 141, 147, 148, 152, 157–159,
165–167, 169–170, 176, 183, 186, 188–190,
202, 206–207
rights 5, 8–9, 19, 28–29, 37, 40, 52, 55, 68, 71,
73, 81, 83–84, 86, 95–97, 132, 147, 153, 166,
168, 176, 192
Roma 93
rules 31, 34–36, 38, 46–47, 52, 62, 64, 66–67, 85,
144, 167, 169–170, 184
rural 7, 10, 13, 15–16, 18, 20, 36–37, 40–44, 46,
51, 60, 72–74, 106–107, 110, 120, 125–128,
133, 135, 138, 141–142, 151–152, 155, 157–
158, 161, 164–165, 175–177, 179, 188–189,
191, 198, 200, 205, 207–208
S
salary (ies) 4–13, 15, 18, 24–25, 29, 32, 35–36,
39–40, 46–48, 52, 61–62, 66, 81, 84–86, 89,
94, 96–98, 105–106, 109–110, 114–118, 120,
131–132, 135–137, 146, 147–148, 157, 160,
164–166, 171–172, 175–176, 178, 180–181,
185–186, 190–191, 194–197, 200–203, 205,
208–209
scholarship (s) 11, 36, 52, 66, 78, 119, 147, 176,
190, 194
school boards 6, 29, 105–106, 108, 116, 131–132,
134–135, 145, 163
school bus 60
school director 4–7, 14, 19, 29, 39, 43, 51–52,
60–63, 65, 68, 71–76, 81–82, 85, 94, 96,
98, 105–106, 108–109, 116–118, 131–132,
143, 147, 152, 158, 170, 175–176, 181–182,
187–189, 194, 203, 206, 208
secondary school 6, 26 ,28, 34, 39, 42–43, 51, 57,
59–60, 70, 74, 81, 83–87, 89–92, 94–96,
99–100, 106, 111, 115, 117, 120, 124–125,
130–131, 135, 137, 139–140, 147–148, 151,
154–155, 172, 175, 180, 195, 201–202, 206,
209
security 4, 32–33, 35, 66
shared financing 14, 24, 31, 39, 63–64
shared tax (es) 8–10, 66–67, 84, 106, 176, 183–184,
190, 206–207
size 5–6, 11, 18, 23, 29–30, 34, 40–43, 45, 48, 61,
66–68, 82, 87, 105–106, 110–111, 115, 123,
125–127, 166–167, 179, 181, 185, 189, 191,
194–195, 197–202, 208–209, 212
Slovakia 17–18
special needs 13, 41, 45, 51, 68, 82, 85–87, 89–91,
93, 141, 194
special state concern 94, 99, 101
spending 14, 19, 23, 30–31, 34–36, 43–48, 51,
63–66, 72, 109, 114, 118, 120, 127, 129,
141, 177, 193, 196–197, 200–202, 209, 214,
216, 218
staff 4–5, 8, 11, 14, 20, 29, 35–36, 52, 60–62,
64–66, 68–69, 72, 85, 97, 114–117, 132,
144, 175, 178, 181–182, 185–186, 190, 193,
200, 203, 208
227
I n d e x
standard viii, 3, 6. 8–9, 14, 16, 24, 29, 34, 38, 40,
45–46, 52–55, 60, 64–65, 67–68, 74, 76, 81,
84–85, 90–91, 94, 96–97, 113, 115, 119, 134,
139, 141–142, 144, 146, 151, 154, 157–158,
168, 176–177, 179–181, 185, 188–191,
193–194, 203, 208
state budget 9–10, 20, 60, 63–64, 85–86, 91,
97, 99–100, 105, 109, 111–113, 147, 152,
158–160, 167, 170, 182–183, 186, 189–191,
194, 197
state budget law 8, 29, 67, 91,
strategy viii, 13, 24, 28–29, 37, 46, 68, 75, 77, 109,
132, 136–137, 143, 145–146, 151, 153, 163,
168, 175, 177–178, 180, 187, 199, 202–203,
205, 207
student numbers 10, 16, 18, 27,36, 38, 42–44,
47, 51, 55, 57–60, 62, 65–66, 87, 92, 94–96,
98, 100, 105, 110, 118, 120–125, 131, 133,
140–141, 161–164, 167, 175, 177, 179–180,
189, 193–195, 206
student–teacher ratio (STR) 17–18, 25, 36, 41–44,
51, 56–59, 94–95, 105, 110–111, 197–199
subsidy 8, 15, 40, 52, 61, 66–67, 71, 91, 94,
99–100, 140, 172
supervision 9, 24, 45, 71, 168
surplus (es) 13, 19, 68, 72, 85
T
TACIS 154
teachers’ unions 13, 85, 96
textbook (s) 8, 20, 38, 52, 67, 147, 176, 178, 193,
196, 205
town(s) 6, 9, 40, 81–85, 87, 91, 94, 96–98, 100,
195
trade union 54, 81, 83, 203
training 4, 9, 11, 23–26, 28, 30–31, 33, 45, 47,
51–52, 54–56, 58–62, 65, 69–71, 76, 81, 83,
86–87, 89, 92, 98, 106, 117, 138, 145, 147,
153–154, 176, 182, 190, 193, 205
transfer 5–6, 10, 14, 16, 19, 24, 28–30, 32, 35, 37,
39–41, 43–45, 52–53, 61, 67, 71, 76, 83–84,
94, 106, 114, 119, 131–134, 136, 143, 152,
158–160, 167, 170, 179, 182, 186,
transfer pool 35, 39, 41
transparency 25, 45, 167, 192, 194, 202
transportation 8–9, 11, 37, 42, 89–91, 107,
114–115, 118–119, 130, 132–133, 136, 139,
143, 146, 148, 157, 161, 190
treasury ix, 36, 51, 109, 117, 144, 169
U
underfunding 8, 10, 12–13, 15, 20, 36, 44, 66, 160,
196–197, 203
understaffing 97
UNICEF 152–153
United States 3, 14, 20
Urban 18, 37, 41–42, 44, 72–74, 106, 125, 127,
158, 161, 177, 179, 188, 191, 207
USAID vii–ix, 47, 76, 135, 145, 148
V
value added tax (VAT) 130, 170, 186, 190, 195,
207
vertical 15–16
vocation 59
vocational 7, 23, 26–28, 30–31, 33–34, 51, 56,
58–60, 62, 65, 76, 83, 88, 92, 110–111, 135,
141, 146, 148, 151, 154–156, 159, 175–176,
179–180, 182, 185, 188, 200–201, 205,
209–219
voucher 8, 16, 52, 65, 67–68, 71
W
wage (s) policy 46
war 18, 81, 94, 105, 146
waste 7, 37
water 7, 37, 118, 147, 165, 183
World Bank vii, ix, 13, 19–20, 27, 46–47, 145,
152–153, 176, 178, 180, 187, 196, 198–199,
204–208

228
P U B L I C M O N E Y F O R P U B L I C S C H O O L S

719132789639
ISBN9789639719132
9OPEN SOCIETY INSTITUTE
Local Governmentand Public ServiceReform Initiative
How to properly finance public schools has long been a top concern of national and local governments. In the last two decades in South Eastern Europe, government entities have often competed for and shared funds within a legislative miasma of conflicting responsibilities and unfunded mandates, while also attempting larger reforms to decentralize government. At the core of this conflict are perplexing problems for decision-makers. How to ensure accountability and efficiency in managing schools and in the use of funds targeted for education? How to simultaneously give schools the freedom to choose the best strategies in terms of quality and equality while also facing geographic, economic, and financial barriers? Inevitably, the answer is a balancing act of compromises and short-term solutions, not always conducive to transparency or optimization, and not even ensuring consensus and stability.
This six-country anthology compares reforms and experiences in Albania, Bulgaria, Croatia, Macedonia, Moldova, and Romania. An introduction by Casandra Bischoff reviews what changes have happened across South Eastern Europe and points to some changes that may offer more hope for the future of the education sector.
Compiled by a team of experts from across the region, Public Money for Public Schools goes on to discuss the complex makeup of local government and school budgets, the distribution of funds from national to local levels, the dilemmas of motivating an aging and unhappy teacher workforce, and the practical options for local governments and their constituents in managing and funding their schools. It also takes a broader look at the education system and government entities concerned with reform, decentralization, equality, and the overall national budget.
Related Documents