Financial Trends Third Quarter 2021 October 20, 2021 Please direct inquiries to: Mark Bette Senior Vice President, Director of Investor Relations (312) 444-2301 or [email protected] Briar Rose Vice President, Investor Relations (312) 557-5297 or [email protected] The historical financial results and trends reflected in this report are not indicative of future financial results and trends for Northern Trust Corporation. This report should be read in conjunction with the Corporation's Third Quarter 2021 earnings press release, 2020 Annual Report to Shareholders, and periodic reports to the Securities and Exchange Commission, all of which contain additional information about factors that could affect the Corporation's future financial results and trends. The Corporation assumes no obligation to update this report.

Welcome message from author
This document is posted to help you gain knowledge. Please leave a comment to let me know what you think about it! Share it to your friends and learn new things together.
Transcript

Financial Trends Third Quarter 2021 October 20, 2021
Please direct inquiries to: Mark BetteSenior Vice President, Director of Investor Relations (312) 444-2301 or [email protected]
Briar RoseVice President, Investor Relations (312) 557-5297 or [email protected]
The historical financial results and trends reflected in this report are not indicative of future financial results and trends for Northern Trust Corporation. This report should be read in conjunction with the Corporation's Third Quarter 2021 earnings press release, 2020 Annual Report to Shareholders, and periodic reports to the Securities and Exchange Commission, all of which contain additional information about factors that could affect the Corporation's future financial results and trends. The Corporation assumes no obligation to update this report.

TABLE OF CONTENTS
1 7
Financial Summary Balance Sheet Mix Trends
2 8
Income Statement Interest Rate Trends
3 9
Net Income Trends Asset Quality
4 10
Fee Detail Trust Assets
5 11
Balance Sheet (EOP) Reconciliation to FTE
6 12
Balance Sheet Trends Reconciliation to FTE (Ratios)

Northern Trust CorporationFINANCIAL SUMMARY
($ in Millions except per share information)
2020 2021
2016 2017 2018 2019 2020 1st Qtr 2nd Qtr 3rd Qtr 4th Qtr 1st Qtr 2nd Qtr 3rd Qtr* 4th Qtr
Profitability:
$ 1,032.5 $ 1,199.0 $ 1,556.4 $ 1,492.2 $ 1,209.3 Net Income $ 360.6 $ 313.3 $ 294.5 $ 240.9 $ 375.1 $ 368.1 $ 395.7
990.4 1,130.4 1,489.9 1,428.9 1,141.0 Earnings Allocated to Common and Potential 326.2 305.1 275.0 234.7 355.2 360.2 376.5
Common Shares
$ 4.35 $ 4.95 $ 6.68 $ 6.66 $ 5.48 Basic Earnings Per Share $ 1.56 $ 1.47 $ 1.32 $ 1.13 $ 1.71 $ 1.73 $ 1.81 4.32 4.92 6.64 6.63 5.46 Diluted Earnings Per Share 1.55 1.46 1.32 1.12 1.70 1.72 1.80
8% 14% 35% —% (18%) Diluted EPS Growth over Previous Year 5% (17%) (22%) (34%) 10% 18% 36%
11.9 % 12.6 % 16.2 % 14.9 % 11.2 % Return on Average Common Equity 13.4 % 12.2 % 10.5 % 8.8 % 13.7 % 13.7 % 13.7 %
0.89 % 1.00 % 1.27 % 1.27 % 0.88 % Return on Average Assets 1.17 % 0.91 % 0.83 % 0.67 % 0.99 % 0.96 % 1.00 %
30.9 % 31.0 % 33.3 % 32.4 % 27.1 % Profit Margin (pre-tax) (FTE**) 29.4 % 27.1 % 26.6 % 25.1 % 31.6 % 31.1 % 32.2 %
20.7 % 22.1 % 25.9 % 24.4 % 19.7 % Profit Margin (after-tax) (FTE**) 22.6 % 20.7 % 19.7 % 15.7 % 23.6 % 23.2 % 24.1 %
74.7 % 72.8 % 72.3 % 72.0 % 75.9 % Noninterest Income to Total Revenue (FTE**) 73.9 % 74.9 % 77.5 % 77.5 % 78.2 % 78.4 % 78.3 %
62.3 % 63.4 % 62.5 % 63.1 % 65.1 % Trust Fees to Total Revenue (FTE**) 62.9 % 63.5 % 67.2 % 67.0 % 66.9 % 67.7 % 67.6 %
31.9 % 26.6 % 20.5 % 23.2 % 25.7 % Effective Tax Rate (US GAAP) 21.8 % 22.3 % 24.5 % 35.5 % 24.4 % 24.3 % 23.6 %
33.1 % 28.6 % 22.1 % 24.5 % 27.2 % Effective Tax Rate (FTE**) 23.1 % 23.8 % 26.0 % 37.3 % 25.4 % 25.6 % 25.2 %
Capital Ratios:
Standardized Approach
11.8 % 12.6 % 12.9 % 12.7 % 12.8 % Common Equity Tier 1 Capital 11.7 % 13.4 % 13.4 % 12.8 % 12.0 % 12.0 % 11.9 %
12.9 % 13.8 % 14.1 % 14.5 % 13.9 % Tier 1 Capital 12.8 % 14.6 % 14.5 % 13.9 % 13.0 % 13.1 % 12.9 %
14.5 % 15.8 % 16.1 % 16.3 % 15.6 % Total Capital 14.5 % 16.5 % 16.5 % 15.6 % 14.5 % 14.5 % 14.3 %
8.0 % 7.8 % 8.0 % 8.7 % 7.6 % Tier 1 Leverage 8.1 % 7.6 % 7.7 % 7.6 % 6.9 % 7.1 % 7.1 %
Advanced Approach
12.4 % 13.5 % 13.7 % 13.2 % 13.4 % Common Equity Tier 1 Capital 12.9 % 13.9 % 13.9 % 13.4 % 12.8 % 13.1 % 13.0 %
13.7 % 14.8 % 15.0 % 15.0 % 14.5 % Tier 1 Capital 14.1 % 15.2 % 15.1 % 14.5 % 14.0 % 14.2 % 14.1 %
15.1 % 16.7 % 16.9 % 16.8 % 15.9 % Total Capital 15.7 % 16.8 % 16.7 % 15.9 % 15.2 % 15.5 % 15.4 %
8.0 % 7.8 % 8.0 % 8.7 % 7.6 % Tier 1 Leverage 8.1 % 7.6 % 7.7 % 7.6 % 6.9 % 7.1 % 7.1 %
6.8 % 6.8 % 7.0 % 7.6 % 8.6 % Supplementary Leverage (a) (b) 7.2 % 9.0 % 8.8 % 8.6 % 8.1 % 8.2 % 8.4 %
Per Share Information / Ratios:
$ 1.48 $ 1.60 $ 1.94 $ 2.60 $ 2.80 Cash Dividends Declared Per Common Share $ 0.70 $ 0.70 $ 0.70 $ 0.70 $ 0.70 $ 0.70 $ 0.70
34 % 33 % 29 % 39 % 51 % Dividend Payout Ratio 45 % 48 % 53 % 63 % 41 % 41 % 39 %
$ 89.05 $ 99.89 $ 83.59 $ 106.24 $ 93.14 Market Value Per Share (End of Period) $ 75.46 $ 79.34 $ 77.97 $ 93.14 $ 105.11 $ 115.62 $ 107.81
20.6 20.3 12.6 16.0 17.1 Stock Price Multiple of Earnings 11.3 12.4 12.9 17.1 18.8 19.7 17.0
(based on trailing 4 quarters of diluted EPS)
$ 38.88 $ 41.28 $ 43.95 $ 46.82 $ 51.87 Book Value Per Common Share (End of Period) $ 48.04 $ 50.45 $ 51.38 $ 51.87 $ 50.80 $ 52.49 $ 53.04
* Capital ratios for the current quarter are considered preliminary until the Form 10-Q is filed with the Securities and Exchange Commission.
** Fully taxable equivalent (FTE). Presentation on an FTE basis is a non-generally accepted accounting principle financial measure. Please refer to the Reconciliation to Fully Taxable Equivalent - Ratios on page 12 for further detail.
(a) Effective January 1, 2018, the Corporation and Bank are subject to a minimum supplementary leverage ratio of 3 percent.
(b) From April 1, 2020, through April 1, 2021, the Federal Reserve issued temporary Supplementary Leverage Ratio (SLR) relief that required Northern Trust to exclude U.S. Treasury balances from the SLR. Please see the Northern Trust Corporation Pillar 3 disclosures for further SLR discussion. 1

Northern Trust CorporationINCOME STATEMENT
($ in Millions except per share information)
NINE MONTHS CHANGE THIRD QUARTER CHANGE
2021 2020 $ % 2021 2020 $ %
$ 1,862.2 $ 1,725.5 $ 136.7 8 % C&IS Trust, Investment and Other Servicing Fees $ 630.2 $ 584.9 $ 45.3 8 %
1,387.9 1,243.4 144.5 12 % WM Trust, Investment and Other Servicing Fees 480.8 418.9 61.9 15 %
3,250.1 2,968.9 281.2 9 % Total Fees 1,111.0 1,003.8 107.2 11 %
215.7 221.8 (6.1) (3) % Foreign Exchange Trading Income 66.4 61.6 4.8 8 %
33.7 34.0 (0.3) (1) % Treasury Management Fees 11.2 11.6 (0.4) (3) %
104.3 100.9 3.4 3 % Security Commissions and Trading Income 36.5 26.0 10.5 40 %
171.6 144.4 27.2 19 % Other Operating Income 62.3 53.5 8.8 17 %
— 0.1 (0.1) N/M Investment Security Gains (Losses), net — — — N/M
3,775.4 3,470.1 305.3 9 % Total Noninterest Income 1,287.4 1,156.5 130.9 11 %
1,069.9 1,314.6 (244.7) (19) % Interest Income (FTE*) 362.0 363.3 (1.3) — %
22.2 182.1 (159.9) (88) % Interest Expense 4.9 26.8 (21.9) (82) %
1,047.7 1,132.5 (84.8) (7) % Net Interest Income (FTE*) 357.1 336.5 20.6 6 %
4,823.1 4,602.6 220.5 5 % Total Revenue (FTE*) 1,644.5 1,493.0 151.5 10 %
(70.0) 127.5 (197.5) N/M Provision for Credit Losses (13.0) 0.5 (13.5) N/M
1,500.8 1,421.8 79.0 6 % Compensation 496.0 461.7 34.3 7 %
323.5 285.8 37.7 13 % Employee Benefits 101.7 97.5 4.2 4 %
625.2 555.0 70.2 13 % Outside Services 210.7 186.0 24.7 13 %
540.2 497.1 43.1 9 % Equipment and Software 185.2 170.7 14.5 8 %
156.9 162.9 (6.0) (4) % Occupancy 53.9 51.8 2.1 4 %
220.4 274.6 (54.2) (20) % Other Operating Expense 81.2 127.0 (45.8) (36) %
3,367.0 3,197.2 169.8 5 % Total Noninterest Expense 1,128.7 1,094.7 34.0 3 %
1,526.1 1,277.9 248.2 19 % Income before Income Taxes (FTE*) 528.8 397.8 131.0 33 %
361.6 285.8 75.8 27 % Provision for Income Taxes 122.4 95.4 27.0 28 %
25.6 23.7 1.9 8 % Taxable Equivalent Adjustment 10.7 7.9 2.8 36 %
387.2 309.5 77.7 25 % Total Taxes (FTE*) 133.1 103.3 29.8 29 %
$ 1,138.9 $ 968.4 $ 170.5 18 % Net Income $ 395.7 $ 294.5 $ 101.2 34 %
$ 37.1 $ 51.5 $ (14.4) (28) % Dividends on Preferred Stock** $ 16.2 $ 16.2 $ — — %
9.9 10.6 (0.7) (7) % Earnings Allocated to Participating Securities 3.0 3.3 (0.3) (9) %
1,091.9 906.3 185.6 20 % Earnings Allocated to Common and Potential Common Shares 376.5 275.0 101.5 37 %
$ 5.24 $ 4.35 $ 0.89 21 % Earnings Per Share - Basic $ 1.81 $ 1.32 $ 0.49 37 %
$ 5.22 $ 4.34 $ 0.88 20 % Earnings Per Share - Diluted $ 1.80 $ 1.32 $ 0.48 37 %
208,199 208,351 Average Basic Shares (000s) 208,116 208,106
209,003 209,023 Average Diluted Shares (000s) 208,923 208,688
207,661 208,121 End of Period Shares Outstanding (000s) 207,661 208,121
N/M - Not meaningful
* Fully taxable equivalent (FTE). Presentation on an FTE basis is a non-generally accepted accounting principle financial measure. Please refer to the Reconciliation to Fully Taxable Equivalent on page 11 for further detail.
** Dividends on Preferred Stock in the first quarter of 2020 includes $11.5 million related to the difference between the redemption amount of the Corporation's Series C Non-Cumulative Perpetual Preferred Stock, which was redeemed in the first quarter of 2020, and its carrying value.
2

Northern Trust CorporationNET INCOME TRENDS
($ in Millions except per share information)
2020 2021
2016 2017 2018 2019 2020 1st Qtr 2nd Qtr 3rd Qtr 4th Qtr 1st Qtr 2nd Qtr 3rd Qtr 4th Qtr
$ 1,787.8 $ 1,984.5 $ 2,173.1 $ 2,211.5 $ 2,321.6 C&IS Trust, Investment and Other Servicing Fees $ 574.4 $ 566.2 $ 584.9 $ 596.1 $ 620.5 $ 611.5 $ 630.2
1,320.3 1,449.8 1,580.6 1,640.6 1,673.4 WM Trust, Investment and Other Servicing Fees 429.2 395.3 418.9 430.0 443.2 463.9 480.8
3,108.1 3,434.3 3,753.7 3,852.1 3,995.0 Total Fees 1,003.6 961.5 1,003.8 1,026.1 1,063.7 1,075.4 1,111.0
236.6 209.9 307.2 250.9 290.4 Foreign Exchange Trading Income 88.9 71.3 61.6 68.6 78.7 70.6 66.4
62.8 56.4 51.8 44.5 45.4 Treasury Management Fees 11.0 11.4 11.6 11.4 11.2 11.3 11.2
81.4 89.6 98.3 103.6 133.2 Security Commissions and Trading Income 41.7 33.2 26.0 32.3 34.8 33.0 36.5
241.2 157.5 127.5 145.5 194.0 Other Operating Income 34.4 56.5 53.5 49.6 54.9 54.4 62.3
(3.2) (1.6) (1.0) (1.4) (0.4) Investment Security Gains (Losses), net — 0.1 — (0.5) — — —
3,726.9 3,946.1 4,337.5 4,395.2 4,657.6 Total Noninterest Income 1,179.6 1,134.0 1,156.5 1,187.5 1,243.3 1,244.7 1,287.4
1,260.0 1,475.0 1,663.9 1,710.7 1,477.6 Net Interest Income (FTE*) 416.2 379.8 336.5 345.1 346.7 343.9 357.1
4,986.9 5,421.1 6,001.4 6,105.9 6,135.2 Total Revenue (FTE*) 1,595.8 1,513.8 1,493.0 1,532.6 1,590.0 1,588.6 1,644.5
(26.0) (28.0) (14.5) (14.5) 125.0 Provision for Credit Losses 61.0 66.0 0.5 (2.5) (30.0) (27.0) (13.0)
1,541.1 1,733.7 1,806.9 1,859.0 1,947.1 Compensation 499.8 460.3 461.7 525.3 518.5 486.3 496.0
293.3 319.9 356.7 355.2 387.7 Employee Benefits 97.9 90.4 97.5 101.9 103.4 118.4 101.7
627.1 668.4 739.4 774.5 763.1 Outside Services 192.8 176.2 186.0 208.1 196.4 218.1 210.7
467.4 524.0 582.2 612.1 673.5 Equipment and Software 162.2 164.2 170.7 176.4 176.7 178.3 185.2
177.4 191.8 201.1 212.9 230.1 Occupancy 51.1 60.0 51.8 67.2 50.8 52.2 53.9
364.4 331.6 330.6 329.8 346.7 Other Operating Expense 61.8 85.8 127.0 72.1 71.7 67.5 81.2
3,470.7 3,769.4 4,016.9 4,143.5 4,348.2 Total Noninterest Expense 1,065.6 1,036.9 1,094.7 1,151.0 1,117.5 1,120.8 1,128.7
1,542.2 1,679.7 1,999.0 1,976.9 1,662.0 Income before Income Taxes (FTE*) 469.2 410.9 397.8 384.1 502.5 494.8 528.8
484.6 434.9 401.4 451.9 418.3 Provision for Income Taxes 100.5 89.9 95.4 132.5 120.8 118.4 122.4
25.1 45.8 41.2 32.8 34.4 Taxable Equivalent Adjustment 8.1 7.7 7.9 10.7 6.6 8.3 10.7
509.7 480.7 442.6 484.7 452.7 Total Taxes (FTE*) 108.6 97.6 103.3 143.2 127.4 126.7 133.1
$ 1,032.5 $ 1,199.0 $ 1,556.4 $ 1,492.2 $ 1,209.3 Net Income $ 360.6 $ 313.3 $ 294.5 $ 240.9 $ 375.1 $ 368.1 $ 395.7
$ 4.35 $ 4.95 $ 6.68 $ 6.66 $ 5.48 Earnings Per Share - Basic $ 1.56 $ 1.47 $ 1.32 $ 1.13 $ 1.71 $ 1.73 $ 1.81
4.32 4.92 6.64 6.63 5.46 Earnings Per Share - Diluted 1.55 1.46 1.32 1.12 1.70 1.72 1.80
229,151 229,654 224,488 215,601 209,008 Average Diluted Shares (000s) 209,817 208,568 208,688 208,962 208,946 209,138 208,923
$ 23.4 $ 49.8 $ 46.4 $ 46.4 $ 56.2 Preferred Dividends** $ 30.5 $ 4.8 $ 16.2 $ 4.7 $ 16.2 $ 4.7 $ 16.2
* Fully taxable equivalent (FTE). Presentation on an FTE basis is a non-generally accepted accounting principle financial measure. Please refer to the Reconciliation to Fully Taxable Equivalent on page 11 for further detail.
** Dividends on Preferred Stock in the first quarter of 2020 includes $11.5 million related to the difference between the redemption amount of the Corporation's Series C Non-Cumulative Perpetual Preferred Stock, which was redeemed in the first quarter of 2020, and its carrying value.
3

Northern Trust CorporationTRUST, INVESTMENT AND OTHER SERVICING FEES DETAIL
($ in Millions)
2020 2021
2016 2017 2018 2019 2020 1st Qtr 2nd Qtr 3rd Qtr 4th Qtr 1st Qtr 2nd Qtr 3rd Qtr 4th Qtr
Corporate & Institutional Services
$ 1,182.2 $ 1,342.1 $ 1,501.1 $ 1,549.3 $ 1,586.1 Custody & Fund Administration $ 394.9 $ 376.3 $ 395.0 $ 419.9 $ 446.0 $ 454.9 $ 460.2
371.8 403.5 436.8 445.7 511.1 Investment Management 120.8 128.4 136.8 125.1 115.9 100.7 113.6
97.7 96.4 102.0 87.2 88.0 Securities Lending 23.4 27.3 19.7 17.6 18.2 19.5 20.2
136.1 142.6 133.2 129.3 136.4 Other 35.3 34.2 33.4 33.5 40.4 36.4 36.2
$ 1,787.8 $ 1,984.6 $ 2,173.1 $ 2,211.5 $ 2,321.6 Total C&IS Trust, Investment and Other Servicing Fees $ 574.4 $ 566.2 $ 584.9 $ 596.1 $ 620.5 $ 611.5 $ 630.2
Wealth Management
$ 523.8 $ 575.5 $ 607.8 $ 619.3 $ 607.3 Central $ 159.4 $ 142.1 $ 151.1 $ 154.7 $ 164.2 $ 174.3 $ 178.8
334.4 356.2 401.7 422.2 442.1 East 111.5 104.2 110.9 115.5 119.0 127.2 130.2
268.9 291.7 320.0 330.9 337.7 West 87.0 80.0 84.7 86.0 90.8 93.8 97.0
193.2 226.3 251.1 268.2 286.3 Global Family Office 71.3 69.0 72.2 73.8 69.2 68.6 74.8
$ 1,320.3 $ 1,449.7 $ 1,580.6 $ 1,640.6 $ 1,673.4 Total WM Trust, Investment and Other Servicing Fees $ 429.2 $ 395.3 $ 418.9 $ 430.0 $ 443.2 $ 463.9 $ 480.8
4
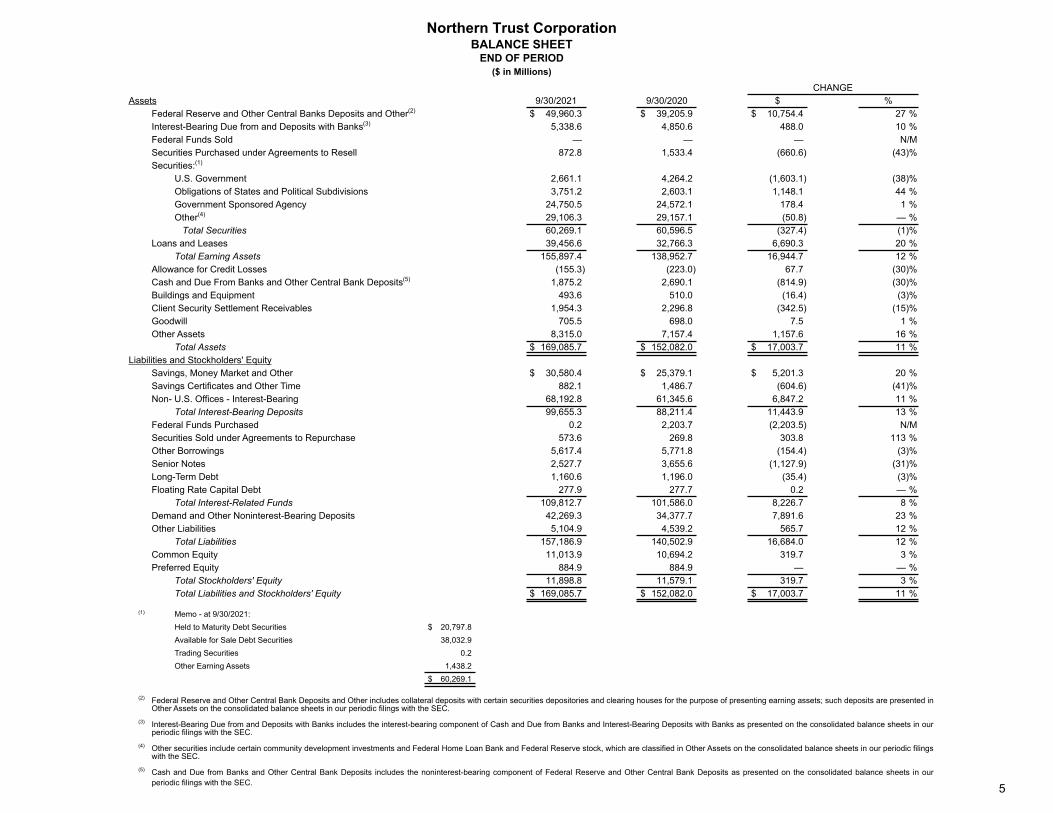
Northern Trust CorporationBALANCE SHEET
END OF PERIOD($ in Millions)
CHANGEAssets 9/30/2021 9/30/2020 $ %
Federal Reserve and Other Central Banks Deposits and Other(2) $ 49,960.3 $ 39,205.9 $ 10,754.4 27 %Interest-Bearing Due from and Deposits with Banks(3) 5,338.6 4,850.6 488.0 10 %Federal Funds Sold — — — N/MSecurities Purchased under Agreements to Resell 872.8 1,533.4 (660.6) (43) %Securities:(1)
U.S. Government 2,661.1 4,264.2 (1,603.1) (38) %Obligations of States and Political Subdivisions 3,751.2 2,603.1 1,148.1 44 %Government Sponsored Agency 24,750.5 24,572.1 178.4 1 %Other(4) 29,106.3 29,157.1 (50.8) — % Total Securities 60,269.1 60,596.5 (327.4) (1) %
Loans and Leases 39,456.6 32,766.3 6,690.3 20 %Total Earning Assets 155,897.4 138,952.7 16,944.7 12 %
Allowance for Credit Losses (155.3) (223.0) 67.7 (30) %Cash and Due From Banks and Other Central Bank Deposits(5) 1,875.2 2,690.1 (814.9) (30) %Buildings and Equipment 493.6 510.0 (16.4) (3) %Client Security Settlement Receivables 1,954.3 2,296.8 (342.5) (15) %Goodwill 705.5 698.0 7.5 1 %Other Assets 8,315.0 7,157.4 1,157.6 16 %
Total Assets $ 169,085.7 $ 152,082.0 $ 17,003.7 11 %Liabilities and Stockholders' Equity
Savings, Money Market and Other $ 30,580.4 $ 25,379.1 $ 5,201.3 20 %Savings Certificates and Other Time 882.1 1,486.7 (604.6) (41) %Non- U.S. Offices - Interest-Bearing 68,192.8 61,345.6 6,847.2 11 %
Total Interest-Bearing Deposits 99,655.3 88,211.4 11,443.9 13 %Federal Funds Purchased 0.2 2,203.7 (2,203.5) N/MSecurities Sold under Agreements to Repurchase 573.6 269.8 303.8 113 %Other Borrowings 5,617.4 5,771.8 (154.4) (3) %Senior Notes 2,527.7 3,655.6 (1,127.9) (31) %Long-Term Debt 1,160.6 1,196.0 (35.4) (3) %Floating Rate Capital Debt 277.9 277.7 0.2 — %
Total Interest-Related Funds 109,812.7 101,586.0 8,226.7 8 %Demand and Other Noninterest-Bearing Deposits 42,269.3 34,377.7 7,891.6 23 %Other Liabilities 5,104.9 4,539.2 565.7 12 %
Total Liabilities 157,186.9 140,502.9 16,684.0 12 %Common Equity 11,013.9 10,694.2 319.7 3 %Preferred Equity 884.9 884.9 — — %
Total Stockholders' Equity 11,898.8 11,579.1 319.7 3 %Total Liabilities and Stockholders' Equity $ 169,085.7 $ 152,082.0 $ 17,003.7 11 %
(1) Memo - at 9/30/2021:Held to Maturity Debt Securities $ 20,797.8 Available for Sale Debt Securities 38,032.9 Trading Securities 0.2 Other Earning Assets 1,438.2
$ 60,269.1
(2) Federal Reserve and Other Central Bank Deposits and Other includes collateral deposits with certain securities depositories and clearing houses for the purpose of presenting earning assets; such deposits are presented in Other Assets on the consolidated balance sheets in our periodic filings with the SEC.
(3) Interest-Bearing Due from and Deposits with Banks includes the interest-bearing component of Cash and Due from Banks and Interest-Bearing Deposits with Banks as presented on the consolidated balance sheets in our periodic filings with the SEC.
(4) Other securities include certain community development investments and Federal Home Loan Bank and Federal Reserve stock, which are classified in Other Assets on the consolidated balance sheets in our periodic filings with the SEC.
(5) Cash and Due from Banks and Other Central Bank Deposits includes the noninterest-bearing component of Federal Reserve and Other Central Bank Deposits as presented on the consolidated balance sheets in our periodic filings with the SEC. 5

Northern Trust CorporationBALANCE SHEET TRENDS
PERIOD AVERAGES(1)
($ in Millions)
2020 20212016 2017 2018 2019 2020 Assets 1st Qtr 2nd Qtr 3rd Qtr 4th Qtr 1st Qtr 2nd Qtr 3rd Qtr 4th Qtr
$ 20,434 $ 23,904 $ 23,899 $ 18,528 $ 27,921 Federal Reserve and Other Central Banks Deposits and Other(2) $ 19,826 $ 30,299 $ 31,602 $ 29,896 $ 37,140 $ 37,425 $ 40,541 8,743 7,143 6,023 5,997 5,401 Interest-Bearing Due from and Deposits with Banks(3) 5,838 5,506 4,816 5,449 6,464 6,737 5,165 12 18 21 13 2 Federal Funds Sold 6 — 2 1 — — — 1,764 1,832 1,478 835 1,253 Securities Purchased under Agreements to Resell 662 986 1,790 1,566 1,551 1,012 841
Securities: 7,073 6,342 5,737 5,297 4,257 U.S. Government 4,639 4,472 4,291 3,631 2,877 2,676 2,669 586 887 725 981 2,194 Obligations of States and Political Subdivisions 1,723 1,835 2,319 2,891 3,199 3,373 3,691 17,421 17,987 20,683 22,634 23,970 Government Sponsored Agency 23,366 23,398 24,028 25,077 24,846 24,521 24,414 16,961 19,499 23,136 21,773 25,635 Other(4) 22,235 23,179 27,434 29,629 30,310 30,000 28,221 42,041 44,716 50,281 50,684 56,057 Total Securities 51,963 52,884 58,072 61,227 61,231 60,570 58,996 34,044 33,565 32,029 31,053 33,499 Loans and Leases 32,316 35,507 33,085 33,096 34,201 36,282 38,411 107,038 111,178 113,731 107,109 124,133 Total Earning Assets 110,611 125,182 129,368 131,235 140,589 142,024 143,953
(193) (157) (126) (111) (178) Allowance for Credit Losses (110) (160) (218) (223) (199) (177) (161) 2,035 2,583 2,534 2,394 2,603 Cash and Due From Banks and Other Central Bank Deposits(5) 2,723 2,967 2,293 2,435 2,615 2,403 2,012 446 466 439 426 509 Buildings and Equipment 501 507 512 517 509 505 500 1,137 892 1,002 1,070 1,358 Client Security Settlement Receivables 1,531 1,298 1,155 1,448 1,669 1,533 1,284 525 544 643 683 695 Goodwill 693 690 698 702 707 708 709 4,583 4,101 4,725 5,981 7,691 Other Assets 8,221 8,288 7,118 7,149 7,367 7,305 8,156 $ 115,570 $ 119,607 $ 122,947 $ 117,551 $ 136,811 Total Assets $ 124,171 $ 138,771 $ 140,925 $ 143,262 $ 153,256 $ 154,300 $ 156,453
Liabilities and Equity$ 15,142 $ 15,576 $ 15,149 $ 16,578 $ 23,396 Savings, Money Market and Other $ 20,251 $ 24,017 $ 24,305 $ 24,984 $ 26,736 $ 27,427 $ 28,472 1,432 1,273 871 868 1,266 Savings Certificates and Other Time 960 1,404 1,502 1,198 924 899 871 50,808 56,583 58,557 54,885 60,486 Non- U.S. Offices - Interest-Bearing 54,543 63,593 61,835 61,944 68,306 69,202 70,211 67,383 73,432 74,577 72,331 85,149 Total Interest-Bearing Deposits 75,754 89,013 87,642 88,126 95,965 97,528 99,554 618 1,103 2,763 1,267 981 Federal Funds Purchased 1,916 1,181 276 563 406 195 166 847 739 525 339 218 Securities Sold under Agreements to Repurchase 334 171 185 184 90 229 293 4,872 4,854 7,496 7,753 6,401 Other Borrowings 7,451 6,008 6,168 5,984 4,681 5,196 5,527 1,497 1,497 1,704 2,389 3,234 Senior Notes 2,615 3,333 3,666 3,315 3,058 3,023 2,841 1,392 1,519 1,297 1,139 1,189 Long-Term Debt 1,169 1,198 1,199 1,191 1,179 1,169 1,166 277 277 278 278 278 Floating Rate Capital Debt 278 278 278 278 278 278 278 76,886 83,422 88,638 85,495 97,450 Total Interest-Related Funds 89,517 101,182 99,414 99,641 105,656 107,617 109,824 26,231 23,073 20,527 17,456 23,362 Demand and Other Noninterest-Bearing Deposits 19,332 21,857 25,202 26,998 30,451 30,469 30,241 3,368 3,132 3,553 3,952 4,806 Other Liabilities 4,535 4,690 4,906 5,090 5,611 4,663 4,534 106,485 109,627 112,718 106,903 125,618 Total Liabilities 113,384 127,729 129,523 131,729 141,718 142,749 144,600 8,500 9,099 9,347 9,705 10,307 Common Equity 9,898 10,157 10,518 10,648 10,653 10,666 10,968 585 882 882 943 886 Preferred Equity 889 885 885 885 885 885 885 9,085 9,981 10,229 10,648 11,193 Total Stockholders' Equity 10,787 11,041 11,403 11,533 11,537 11,551 11,853 $ 115,570 $ 119,607 $ 122,947 $ 117,551 $ 136,811 Total Liabilities and Stockholders' Equity $ 124,171 $ 138,771 $ 140,925 $ 143,262 $ 153,256 $ 154,300 $ 156,453
$ 30,152 $ 27,756 $ 25,093 $ 21,614 $ 26,683 Net Noninterest-Related Funds $ 21,094 $ 24,000 $ 29,954 $ 31,594 $ 34,933 $ 34,407 $ 34,129
(1) Summations may not equal due to rounding(2) Federal Reserve and Other Central Bank Deposits and Other includes collateral deposits with certain securities depositories and clearing houses for the purpose of presenting earning assets; such deposits are presented in Other Assets on the consolidated balance
sheets in our periodic filings with the SEC.(3) Interest-Bearing Due from and Deposits with Banks includes the interest-bearing component of Cash and Due from Banks and Interest-Bearing Deposits with Banks as presented on the consolidated balance sheets in our periodic filings with the SEC.(4) Other securities include certain community development investments and Federal Home Loan Bank and Federal Reserve stock, which are classified in Other Assets on the consolidated balance sheets in our periodic filings with the SEC.(5) Cash and Due from Banks and Other Central Bank Deposits includes the noninterest-bearing component of Federal Reserve and Other Central Bank Deposits as presented on the consolidated balance sheets in our periodic filings with the SEC.
6

Northern Trust CorporationBALANCE SHEET MIX TRENDS
PERIOD AVERAGES(1)
2020 20212016 2017 2018 2019 2020 Assets 1st Qtr 2nd Qtr 3rd Qtr 4th Qtr 1st Qtr 2nd Qtr 3rd Qtr 4th Qtr 17.7 % 20.0 % 19.4 % 15.8 % 20.4 % Federal Reserve and Other Central Banks Deposits and Other(2) 16.0 % 21.8 % 22.4 % 20.9 % 24.2 % 24.3 % 25.9 % 7.6 6.0 4.9 5.1 3.9 Interest-Bearing Due from and Deposits with Banks(3) 4.7 4.0 3.4 3.8 4.2 4.4 3.3 — — — — — Federal Funds Sold — — — — — — —
1.5 1.5 1.2 0.7 0.9 Securities Purchased under Agreements to Resell 0.5 0.7 1.3 1.1 1.0 0.7 0.5 Securities:
6.1 5.3 4.7 4.5 3.1 U.S. Government 3.7 3.2 3.0 2.5 1.9 1.7 1.7 0.5 0.7 0.6 0.8 1.6 Obligations of States and Political Subdivisions 1.4 1.3 1.6 2.0 2.1 2.2 2.4
15.1 15.0 16.8 19.3 17.5 Government Sponsored Agency 18.8 16.9 17.0 17.5 16.2 15.9 15.6 14.7 16.3 18.8 18.5 18.7 Other(4) 17.9 16.7 19.5 20.7 19.8 19.4 18.0 36.4 37.4 40.9 43.1 41.0 Total Securities 41.8 38.1 41.2 42.7 40.0 39.3 37.7 29.5 28.1 26.1 26.4 24.5 Loans and Leases 26.0 25.6 23.5 23.1 22.3 23.5 24.6 92.6 93.0 92.5 91.1 90.7 Total Earning Assets 89.1 90.2 91.8 91.6 91.7 92.0 92.0
(0.2) (0.1) (0.1) (0.1) (0.1) Allowance for Credit Losses (0.1) (0.1) (0.2) (0.2) (0.1) (0.1) (0.1) 1.8 2.2 2.1 2.0 1.9 Cash and Due From Banks and Other Central Bank Deposits(5) 2.2 2.1 1.6 1.7 1.7 1.6 1.3 0.4 0.4 0.4 0.4 0.4 Buildings and Equipment 0.4 0.4 0.4 0.4 0.3 0.3 0.3 1.0 0.7 0.8 0.9 1.0 Client Security Settlement Receivables 1.2 0.9 0.8 1.0 1.1 1.0 0.8 0.5 0.5 0.5 0.6 0.5 Goodwill 0.6 0.5 0.5 0.5 0.5 0.5 0.5 4.0 3.4 3.8 5.1 5.6 Other Assets 6.6 6.0 5.1 5.0 4.8 4.7 5.2
100.0 % 100.0 % 100.0 % 100.0 % 100.0 % Total Assets 100.0 % 100.0 % 100.0 % 100.0 % 100.0 % 100.0 % 100.0 %
Liabilities and Equity 13.1 % 13.0 % 12.3 % 14.1 % 17.1 % Savings, Money Market and Other 16.3 % 17.3 % 17.2 % 17.4 % 17.4 % 17.8 % 18.2 % 1.2 1.1 0.7 0.7 0.9 Savings Certificates and Other Time 0.8 1.0 1.1 0.8 0.6 0.6 0.6
44.0 47.3 47.6 46.7 44.2 Non- U.S. Offices - Interest-Bearing 43.9 45.8 43.9 43.2 44.6 44.8 44.9 58.3 61.4 60.7 61.5 62.2 Total Interest-Bearing Deposits 61.0 64.1 62.2 61.5 62.6 63.2 63.6 0.5 0.9 2.2 1.1 0.7 Federal Funds Purchased 1.5 0.9 0.2 0.4 0.3 0.1 0.1 0.7 0.6 0.4 0.3 0.2 Securities Sold under Agreements to Repurchase 0.3 0.1 0.1 0.1 0.1 0.1 0.2 4.2 4.1 6.1 6.6 4.7 Other Borrowings 6.0 4.3 4.4 4.2 3.1 3.4 3.5 1.3 1.3 1.4 2.0 2.4 Senior Notes 2.1 2.4 2.6 2.3 2.0 2.0 1.8 1.2 1.3 1.1 1.0 0.9 Long-Term Debt 0.9 0.9 0.9 0.8 0.8 0.8 0.7 0.2 0.2 0.2 0.2 0.2 Floating Rate Capital Debt 0.2 0.2 0.2 0.2 0.2 0.2 0.2
66.5 69.7 72.1 72.7 71.2 Total Interest-Related Funds 72.1 72.9 70.5 69.6 68.9 69.7 70.2 22.7 19.3 16.7 14.8 17.1 Demand and Other Noninterest-Bearing Deposits 15.6 15.8 17.9 18.8 19.9 19.7 19.3 2.9 2.6 2.9 3.4 3.5 Other Liabilities 3.7 3.4 3.5 3.6 3.7 3.0 2.9
92.1 91.7 91.7 90.9 91.8 Total Liabilities 91.3 92.0 91.9 91.9 92.5 92.5 92.4 7.4 7.6 7.6 8.3 7.5 Common Equity 8.0 7.3 7.5 7.4 7.0 6.9 7.0 0.5 0.7 0.7 0.8 0.6 Preferred Equity 0.7 0.6 0.6 0.6 0.6 0.6 0.6 7.9 8.3 8.3 9.1 8.2 Total Stockholders' Equity 8.7 8.0 8.1 8.1 7.5 7.5 7.6
100.0 % 100.0 % 100.0 % 100.0 % 100.0 % Total Liabilities and Stockholders' Equity 100.0 % 100.0 % 100.0 % 100.0 % 100.0 % 100.0 % 100.0 %
(1) Summations may not equal due to rounding(2) Federal Reserve and Other Central Bank Deposits and Other includes collateral deposits with certain securities depositories and clearing houses for the purpose of presenting earning assets; such deposits are presented in Other Assets on the
consolidated balance sheets in our periodic filings with the SEC.(3) Interest-Bearing Due from and Deposits with Banks includes the interest-bearing component of Cash and Due from Banks and Interest-Bearing Deposits with Banks as presented on the consolidated balance sheets in our periodic filings with the SEC.(4) Other securities include certain community development investments and Federal Home Loan Bank and Federal Reserve stock, which are classified in Other Assets on the consolidated balance sheets in our periodic filings with the SEC.(5) Cash and Due from Banks and Other Central Bank Deposits includes the noninterest-bearing component of Federal Reserve and Other Central Bank Deposits as presented on the consolidated balance sheets in our periodic filings with the SEC.
7

Northern Trust CorporationINTEREST RATE TRENDS (FTE(1) Basis)
PERIOD AVERAGES
Net Interest Income (FTE Adjusted), a non-GAAP financial measure, includes adjustments to a fully taxable equivalent basis for loans and securities. A reconciliation of net interest income, net interest margin, and net interest spread on a GAAP basis to net interest income, net interest margin, and net interest spread on an FTE basis, respectively, (each of which is a non-GAAP financial measure) is provided on pages 11 and 12. Net interest margin is calculated by dividing annualized net interest income by average interest-earning assets. Net interest spread is calculated as the difference between the interest rate earned (annualized interest income divided by average interest-earning assets) and the interest rate incurred (annualized interest expense divided by average interest-related funds).
2020 2021
2016 2017 2018 2019 2020 Earnings Assets 1st Qtr 2nd Qtr 3rd Qtr 4th Qtr 1st Qtr 2nd Qtr 3rd Qtr 4th Qtr
0.45 % 0.65 % 0.87 % 0.98 % 0.10 %Federal Reserve and Other Central Banks Deposits and Other(2) 0.47 % 0.05 % 0.02 % 0.01 % — % 0.01 % 0.04 %
0.73 0.89 1.16 1.21 0.41 Interest-Bearing Due from and Deposits with Banks(3) 0.88 0.33 0.23 0.18 0.15 0.16 0.15
0.78 1.39 2.18 2.73 1.37 Federal Funds Sold 1.88 0.53 0.43 0.41 0.41 0.41 0.41
1.04 1.48 2.22 2.10 0.31 Securities Purchased under Agreements to Resell 0.96 0.22 0.21 0.22 0.27 0.34 0.38
Securities:
1.10 1.41 1.89 2.09 1.48 U.S. Government 1.88 1.60 1.23 1.14 1.02 1.03 1.01
1.94 1.48 1.91 2.49 2.20 Obligations of States and Political Subdivisions 2.46 2.43 2.12 1.97 1.96 1.99 1.96
1.02 1.57 2.20 2.58 1.71 Government Sponsored Agency 2.13 1.88 1.46 1.39 1.36 1.20 1.14
1.12 1.30 1.59 1.75 1.26 Other(4) 1.67 1.34 1.10 1.06 0.99 1.03 1.10
1.09 1.43 1.88 2.17 1.51 Total Securities 1.92 1.64 1.30 1.24 1.19 1.15 1.17
2.38 2.77 3.45 3.74 2.32 Loans and Leases 3.13 2.15 2.02 2.03 2.05 1.91 1.87
1.35 % 1.63 % 2.08 % 2.36 % 1.35 % Total Earning Assets 1.95 % 1.33 % 1.12 % 1.10 % 1.03 % 0.99 % 1.00 %
Interest-Bearing Funds
0.08 % 0.16 % 0.54 % 0.97 % 0.20 % Savings, Money Market and Other 0.61 % 0.12 % 0.09 % 0.07 % 0.06 % 0.04 % 0.04 %
0.58 0.74 0.90 1.86 1.30 Savings Certificates and Other Time 1.91 1.42 1.07 0.98 0.67 0.49 0.53
0.12 0.26 0.50 0.57 (0.03) Non- U.S. Offices - Interest-Bearing 0.19 (0.08) (0.08) (0.10) (0.11) (0.11) (0.12)
0.12 0.25 0.52 0.68 0.06 Total Interest-Bearing Deposits 0.32 — (0.02) (0.04) (0.06) (0.06) (0.07)
0.25 0.95 1.82 2.05 0.22 Federal Funds Purchased 0.42 0.01 0.04 0.07 0.06 (0.95) 0.09
0.27 0.81 1.48 1.89 0.47 Securities Sold under Agreements to Repurchase 1.16 0.05 0.04 0.04 0.07 0.03 0.06
0.37 1.04 2.00 2.34 0.71 Other Borrowings 1.58 0.43 0.32 0.31 0.30 0.25 0.26
3.13 3.13 3.13 3.04 2.24 Senior Notes 2.76 2.39 2.08 1.87 1.82 1.82 1.64
1.90 2.58 3.47 3.36 2.24 Long-Term Debt 2.90 2.35 1.91 1.81 1.83 1.83 1.79
1.25 1.75 2.72 2.98 1.52 Floating Rate Capital Debt 2.41 2.24 0.64 0.82 0.81 0.76 0.75
0.24 % 0.41 % 0.79 % 0.96 % 0.21 % Total Interest-Related Funds 0.54 % 0.14 % 0.11 % 0.07 % 0.04 % 0.03 % 0.02 %
1.11 % 1.22 % 1.29 % 1.40 % 1.14 % Net Interest Spread 1.41 % 1.19 % 1.01 % 1.03 % 0.99 % 0.96 % 0.98 %
1.18 % 1.33 % 1.46 % 1.60 % 1.19 % Net Interest Margin 1.51 % 1.22 % 1.03 % 1.05 % 1.00 % 0.97 % 0.98 %
(1) Fully taxable equivalent. The 2018 through 2021 FTE adjustments are based on a federal income tax rate of 21% and the 2016 through 2017 FTE adjustments are based on a federal income tax rate of 35%, where the rate is adjusted for applicable state income taxes, net of related federal tax benefit.
(2) Federal Reserve and Other Central Bank Deposits and Other includes collateral deposits with certain securities depositories and clearing houses for the purpose of presenting earning assets; such deposits are presented in Other Assets on the consolidated balance sheets in our periodic filings with the SEC.
(3) Interest-Bearing Due from and Deposits with Banks includes the interest-bearing component of Cash and Due from Banks and Interest-Bearing Deposits with Banks as presented on the consolidated balance sheets in our periodic filings with the SEC.(4) Other securities include certain community development investments and Federal Home Loan Bank and Federal Reserve stock, which are classified in Other Assets on the consolidated balance sheets in our periodic filings with the SEC.
Note The yields on the US Government, Government Sponsored Agency and Other lines in the Securities Portfolio for 2016 have been restated to reflect a reclassification in the interest income ascribed to each category. The yield for the Total Securities portfolio was not impacted by the aforementioned reclassification.
8

Northern Trust CorporationASSET QUALITY
END OF PERIOD($ in Millions)
2020 2021
2016 2017 2018 2019 2020 1st Qtr 2nd Qtr 3rd Qtr 4th Qtr 1st Qtr 2nd Qtr 3rd Qtr 4th Qtr
$ 233.3 $ 192.0 $ 153.8 $ 138.2 $ 124.4 Beginning Allowance for Credit Losses $ 124.4 $ 198.4 $ 267.0 $ 267.9 $ 259.9 $ 230.8 $ 207.0
— — — — 13.7 Cumulative Effect Adjustment* 13.7 — — — — — —
(26.0) (28.0) (14.5) (14.5) 125.0 Provision for Credit Losses 61.0 66.0 0.5 (2.5) (30.0) (27.0) (13.0)
(Charge-offs) Recoveries
(27.3) (21.5) (10.1) (6.5) (9.7) Charge-offs (1.8) (0.4) (0.8) (6.7) (0.4) — —
12.1 11.3 9.0 7.2 6.5 Recoveries 1.1 3.0 1.2 1.2 1.3 3.2 1.1
(15.2) (10.2) (1.1) 0.7 (3.2) Net (Charge-offs) Recoveries (0.7) 2.6 0.4 (5.5) 0.9 3.2 1.1
(0.1) — — — — Effect of Foreign Exchange Rates — — — — — — —
$ 192.0 $ 153.8 $ 138.2 $ 124.4 $ 259.9 Ending Allowance for Credit Losses $ 198.4 $ 267.0 $ 267.9 $ 259.9 $ 230.8 $ 207.0 $ 195.1
Allowance for Credit Losses Assigned to:
$ 161.0 $ 131.2 $ 112.6 $ 104.5 $ 190.7 Loans and Leases $ 147.2 $ 210.2 $ 215.4 $ 190.7 $ 165.4 $ 148.8 $ 143.9
31.0 22.6 25.6 19.9 61.1 Undrawn Loan Commitments and Standby Letters of Credit 40.4 49.0 44.9 61.1 55.1 46.5 39.8
— — — — 8.1 Debt Securities and Other Financial Assets 10.8 7.8 7.6 8.1 10.3 11.7 11.4
$ 192.0 $ 153.8 $ 138.2 $ 124.4 $ 259.9 Total Allowance for Credit Losses $ 198.4 $ 267.0 $ 267.9 $ 259.9 $ 230.8 $ 207.0 $ 195.1
$ 34,044 $ 33,565 $ 32,029 $ 31,053 $ 33,499 Average Loans and Leases Outstanding $ 32,316 $ 35,507 $ 33,085 $ 33,096 $ 34,201 $ 36,282 $ 38,411
Annualized Loan-Related Net (Charge-offs) Recoveries to
(0.04) % (0.03) % — % — % (0.01) % Average Loans and Leases (0.01) % 0.03 % — % (0.07) % 0.01 % 0.04 % 0.01 %
$ 33,822 $ 32,592 $ 32,490 $ 31,410 $ 33,760 End of Period Loans and Leases Outstanding $ 37,838 $ 33,757 $ 32,766 $ 33,760 $ 34,344 $ 37,407 $ 39,457
Allowance for Credit Losses Assigned to Loans
0.48 % 0.40 % 0.35 % 0.33 % 0.56 % and Leases to Total Loans and Leases 0.39 % 0.62 % 0.66 % 0.56 % 0.48 % 0.40 % 0.36 %
Nonaccrual Assets
$ 160.2 $ 150.7 $ 109.3 $ 83.6 $ 131.7 Nonaccrual Loans and Leases $ 103.9 $ 98.5 $ 98.0 $ 131.7 $ 123.8 $ 106.5 $ 141.0
5.2 4.6 8.4 3.2 0.7 Other Real Estate Owned (OREO) 1.6 0.9 0.9 0.7 1.5 0.2 0.2
$ 165.4 $ 155.3 $ 117.7 $ 86.8 $ 132.4 Total Nonaccrual Assets $ 105.5 $ 99.4 $ 98.9 $ 132.4 $ 125.3 $ 106.7 $ 141.2
0.49 % 0.48 % 0.36 % 0.28 % 0.39 % Nonaccrual Assets to Loans and Leases and OREO 0.28 % 0.29 % 0.30 % 0.39 % 0.36 % 0.29 % 0.36 %
Loan and Lease Allowance to Nonaccrual
1.0x 0.9x 1.0x 1.3x 1.4x Loans and Leases Coverage 1.4x 2.1x 2.2x 1.4x 1.3x 1.4x 1.0x
* Upon the January 1, 2020 adoption of ASU 2016-13, Northern Trust increased the allowance for credit losses by $13.7 million, with a corresponding cumulative effect adjustment to decrease retained earnings $10.1 million, net of tax.
9

Northern Trust CorporationASSETS UNDER MANAGEMENT AND CUSTODY
END OF PERIOD($ in Billions)
2020 20212016 2017 2018 2019 2020 1st Qtr 2nd Qtr 3rd Qtr 4th Qtr 1st Qtr 2nd Qtr 3rd Qtr 4th Qtr
Assets under Management$ 694.0 $ 871.2 $ 790.8 $ 917.5 $ 1,057.5 Corporate & Institutional Services $ 842.6 $ 954.0 $ 993.2 $ 1,057.5 $ 1,093.7 $ 1,168.3 $ 1,159.5
Asset allocation: 363.4 443.3 403.3 483.8 551.7 Equities 377.2 461.2 492.4 551.7 573.5 616.0 594.9 91.3 111.9 105.3 114.6 120.1 Fixed Income Securities 113.9 113.9 118.8 120.1 117.1 132.6 127.9 127.5 148.5 132.4 156.1 198.8 Cash and Other Assets 184.4 213.2 209.1 198.8 201.9 220.4 228.6 111.8 167.5 149.8 163.0 186.9 Securities Lending Collateral 167.1 165.7 172.9 186.9 201.2 199.3 208.1 $ 248.4 $ 289.8 $ 278.6 $ 313.8 $ 347.8 Wealth Management $ 276.7 $ 303.8 $ 318.5 $ 347.8 $ 355.4 $ 371.1 $ 372.9
Asset allocation: 117.2 149.0 130.9 167.0 182.0 Equities 127.3 147.3 156.4 182.0 196.1 211.8 211.5 69.2 71.6 73.0 79.2 84.7 Fixed Income Securities 75.9 79.2 82.8 84.7 81.8 82.3 82.7 61.8 69.0 74.6 67.5 81.1 Cash and Other Assets 73.5 77.3 79.3 81.1 77.5 77.0 78.7 0.2 0.2 0.1 0.1 — Securities Lending Collateral — — — — — — — $ 942.4 $ 1,161.0 $ 1,069.4 $ 1,231.3 $ 1,405.3 Total Assets under Management $ 1,119.3 $ 1,257.8 $ 1,311.7 $ 1,405.3 $ 1,449.1 $ 1,539.4 $ 1,532.4
Asset allocation:$ 480.6 $ 592.3 $ 534.2 $ 650.8 $ 733.7 Equities $ 504.5 $ 608.5 $ 648.8 $ 733.7 $ 769.6 $ 827.8 $ 806.4 160.5 183.5 178.3 193.8 204.8 Fixed Income Securities 189.8 193.1 201.6 204.8 198.9 214.9 210.6 189.3 217.5 207.0 223.6 279.9 Cash and Other Assets 257.9 290.5 288.4 279.9 279.4 297.4 307.3 112.0 167.7 149.9 163.1 186.9 Securities Lending Collateral 167.1 165.7 172.9 186.9 201.2 199.3 208.1
Assets under Custody / Administration 7,987.0 $ 10,066.8 $ 9,490.5 $ 11,311.6 $ 13,653.1 Corporate & Institutional Services $ 10,236.5 $ 11,347.1 $ 12,263.2 $ 13,653.1 $ 13,876.3 $ 14,754.1 $ 14,799.8 554.3 655.8 634.8 738.8 879.4 Wealth Management 640.1 751.2 814.4 879.4 918.8 973.0 976.0 $ 8,541.3 $ 10,722.6 $ 10,125.3 $ 12,050.4 $ 14,532.5 Total Assets under Custody / Administration $ 10,876.6 $ 12,098.3 $ 13,077.6 $ 14,532.5 $ 14,795.1 $ 15,727.1 $ 15,775.8
Assets under Custody$ 6,176.9 $ 7,439.1 $ 6,971.0 $ 8,497.8 $ 10,387.7 Corporate & Institutional Services $ 7,620.8 $ 8,542.7 $ 9,312.2 $ 10,387.7 $ 10,618.0 $ 11,260.8 $ 11,283.6
Asset allocation: 2,761.6 3,400.1 3,043.0 3,866.6 4,751.0 Equities 3,044.8 3,661.4 4,045.0 4,751.0 5,005.7 5,334.8 5,298.8 2,313.6 2,755.2 2,700.2 3,102.3 3,742.6 Fixed Income Securities 3,006.2 3,211.1 3,486.8 3,742.6 3,688.4 3,892.9 3,908.3 989.9 1,116.3 1,078.0 1,365.9 1,707.2 Cash and Other Assets 1,402.7 1,504.5 1,607.5 1,707.2 1,722.7 1,833.8 1,868.4 111.8 167.5 149.8 163.0 186.9 Securities Lending Collateral 167.1 165.7 172.9 186.9 201.2 199.3 208.1 $ 543.6 $ 645.5 $ 622.9 $ 735.7 $ 875.1 Wealth Management $ 633.9 $ 747.9 $ 810.4 $ 875.1 $ 916.2 $ 967.8 $ 962.9
Asset allocation: 296.4 375.6 336.5 432.0 542.9 Equities 331.6 441.4 487.2 542.9 575.0 616.3 600.7 120.7 121.3 122.2 134.3 128.3 Fixed Income Securities 126.0 126.0 127.8 128.3 130.3 136.7 138.2 126.3 148.4 164.1 169.3 203.9 Cash and Other Assets 176.3 180.5 195.4 203.9 210.9 214.8 224.0 0.2 0.2 0.1 0.1 — Securities Lending Collateral — — — — — — — $ 6,720.5 $ 8,084.6 $ 7,593.9 $ 9,233.5 $ 11,262.8 Total Assets under Custody $ 8,254.7 $ 9,290.6 $ 10,122.6 $ 11,262.8 $ 11,534.2 $ 12,228.6 $ 12,246.5
Asset allocation:$ 3,058.0 $ 3,775.7 $ 3,379.5 $ 4,298.6 $ 5,293.9 Equities $ 3,376.4 $ 4,102.8 $ 4,532.2 $ 5,293.9 $ 5,580.7 $ 5,951.0 $ 5,899.5 2,434.3 2,876.5 2,822.4 3,236.6 3,870.9 Fixed Income Securities 3,132.2 3,337.1 3,614.6 3,870.9 3,818.7 4,029.6 4,046.5 1,116.2 1,264.7 1,242.1 1,535.2 1,911.1 Cash and Other Assets 1,579.0 1,685.0 1,802.9 1,911.1 1,933.6 2,048.7 2,092.4 112.0 167.7 149.9 163.1 186.9 Securities Lending Collateral 167.1 165.7 172.9 186.9 201.2 199.3 208.1
Memo$ 69.3 $ 87.1 $ 83.5 $ 94.2 $ 114.0 WM Global Family Office AUM $ 89.6 $ 96.8 $ 103.2 $ 114.0 $ 114.3 $ 119.7 $ 120.4 347.7 422.9 405.5 474.1 600.7 WM Global Family Office AUC 409.8 504.1 556.0 600.7 635.2 675.4 668.9 3,966.0 4,937.6 4,700.3 5,894.6 7,424.5 Global Custody Assets * 5,218.4 5,881.5 6,537.1 7,424.5 7,562.2 8,062.5 8,069.4
* Includes the assets of non-U.S. clients plus global custody assets of U.S. clients
10

Northern Trust CorporationRECONCILIATION TO FULLY TAXABLE EQUIVALENT
($ in Millions)
Northern Trust presents certain financial measures on a fully taxable equivalent (FTE) basis, which is a non-generally accepted accounting principle (GAAP). Management believes an FTE presentation provides a clearer indication of these financial measures for comparative purposes.
Net interest income (FTE) – Non-GAAP and net interest margin (FTE) – Non-GAAP and other FTE measures include the tax equivalent adjustments on tax-exempt income, consistent with industry practice. The adjustments are based on the federal income tax rate, where the rate is adjusted for applicable state income taxes, net of related federal tax benefit. When adjusted to an FTE basis, yields on taxable, nontaxable, and partially taxable assets are comparable; however, the adjustment to an FTE basis has no impact on net income. Below is a reconciliation of the financial measures presented on an FTE basis.
NINE MONTHS
NINE MONTHS 2020 2021
2016 2017 2018 2019 2020 2020 2021 1st Qtr 2nd Qtr 3rd Qtr 4th Qtr 1st Qtr 2nd Qtr 3rd Qtr 4th Qtr
$ 1,416.9 $ 1,769.4 $ 2,321.4 $ 2,499.9 $ 1,643.5 $ 1,290.9 $ 1,044.3 Interest Income - GAAP $ 529.2 $ 406.3 $ 355.4 $ 352.6 $ 349.9 $ 343.1 $ 351.3 25.1 45.8 41.2 32.8 34.4 23.7 25.6 Add: FTE Adjustment 8.1 7.7 7.9 10.7 6.6 8.3 10.7 1,442.0 1,815.2 2,362.6 2,532.7 1,677.9 1,314.6 1,069.9 Interest Income (FTE) - Non-GAAP 537.3 414.0 363.3 363.3 356.5 351.4 362.0
1,234.9 1,429.2 1,622.7 1,677.9 1,443.2 1,108.8 1,022.1 Net Interest Income - GAAP 408.1 372.1 328.6 334.4 340.1 335.6 346.4 25.1 45.8 41.2 32.8 34.4 23.7 25.6 Add: FTE Adjustment 8.1 7.7 7.9 10.7 6.6 8.3 10.7 1,260.0 1,475.0 1,663.9 1,710.7 1,477.6 1,132.5 1,047.7 Net Interest Income (FTE) - Non-GAAP 416.2 379.8 336.5 345.1 346.7 343.9 357.1
4,961.8 5,375.3 5,960.2 6,073.1 6,100.8 4,578.9 4,797.5 Total Revenue - GAAP 1,587.7 1,506.1 1,485.1 1,521.9 1,583.4 1,580.3 1,633.8 25.1 45.8 41.2 32.8 34.4 23.7 25.6 Add: FTE Adjustment 8.1 7.7 7.9 10.7 6.6 8.3 10.7 4,986.9 5,421.1 6,001.4 6,105.9 6,135.2 4,602.6 4,823.1 Total Revenue (FTE) - Non-GAAP 1,595.8 1,513.8 1,493.0 1,532.6 1,590.0 1,588.6 1,644.5
1,517.1 1,633.9 1,957.8 1,944.1 1,627.6 1,254.2 1,500.5 Income before Income Taxes - GAAP 461.1 403.2 389.9 373.4 495.9 486.5 518.1 25.1 45.8 41.2 32.8 34.4 23.7 25.6 Add: FTE Adjustment 8.1 7.7 7.9 10.7 6.6 8.3 10.7 1,542.2 1,679.7 1,999.0 1,976.9 1,662.0 1,277.9 1,526.1 Income before Income Taxes (FTE) - Non-GAAP 469.2 410.9 397.8 384.1 502.5 494.8 528.8
484.6 434.9 401.4 451.9 418.3 285.8 361.6 Provision for Income Taxes - GAAP 100.5 89.9 95.4 132.5 120.8 118.4 122.4 25.1 45.8 41.2 32.8 34.4 23.7 25.6 Add: FTE Adjustment 8.1 7.7 7.9 10.7 6.6 8.3 10.7 509.7 480.7 442.6 484.7 452.7 309.5 387.2 Provision for Income Taxes (FTE) - Non-GAAP 108.6 97.6 103.3 143.2 127.4 126.7 133.1
11

Northern Trust CorporationRECONCILIATION TO FULLY TAXABLE EQUIVALENT
RATIOS
Northern Trust presents certain financial measures on a fully taxable equivalent (FTE) basis, which is a non-generally accepted accounting principle (GAAP). Management believes an FTE presentation provides a clearer indication of these financial measures for comparative purposes.
Net interest income (FTE) – Non-GAAP and net interest margin (FTE) – Non-GAAP and other FTE measures include the tax equivalent adjustments on tax-exempt income, consistent with industry practice. The adjustments are based on the federal income tax rate, where the rate is adjusted for applicable state income taxes, net of related federal tax benefit. When adjusted to an FTE basis, yields on taxable, nontaxable, and partially taxable assets are comparable; however, the adjustment to an FTE basis has no impact on net income. Below is a reconciliation of the financial ratios presented on an FTE basis.
2020 20212016 2017 2018 2019 2020 1st Qtr 2nd Qtr 3rd Qtr 4th Qtr 1st Qtr 2nd Qtr 3rd Qtr 4th Qtr
30.6 % 30.4 % 32.8 % 32.0 % 26.7 % Profit Margin (pre-tax) - GAAP (1) 29.0 % 26.8 % 26.3 % 24.5 % 31.3 % 30.8 % 31.7 % 30.9 % 31.0 % 33.3 % 32.4 % 27.1 % Profit Margin (pre-tax) (FTE) - Non-GAAP (1) 29.4 % 27.1 % 26.6 % 25.1 % 31.6 % 31.1 % 32.2 %
20.8 % 22.3 % 26.1 % 24.6 % 19.8 % Profit Margin (after-tax) - GAAP (2) 22.7 % 20.8 % 19.8 % 15.8 % 23.7 % 23.3 % 24.2 % 20.7 % 22.1 % 25.9 % 24.4 % 19.7 % Profit Margin (after-tax) (FTE) - Non-GAAP (2) 22.6 % 20.7 % 19.7 % 15.7 % 23.6 % 23.2 % 24.1 %
31.9 % 26.6 % 20.5 % 23.2 % 25.7 % Effective Tax Rate - GAAP (3) 21.8 % 22.3 % 24.5 % 35.5 % 24.4 % 24.3 % 23.6 % 33.1 % 28.6 % 22.1 % 24.5 % 27.2 % Effective Tax Rate (FTE) - Non-GAAP (3) 23.1 % 23.8 % 26.0 % 37.3 % 25.4 % 25.6 % 25.2 %
75.1 % 73.4 % 72.8 % 72.4 % 76.3 % Noninterest Income to Total Revenue - GAAP (4) 74.3 % 75.3 % 77.9 % 78.0 % 78.5 % 78.8 % 78.8 % 74.7 % 72.8 % 72.3 % 72.0 % 75.9 % Noninterest Income to Total Revenue (FTE) - Non-GAAP (4) 73.9 % 74.9 % 77.5 % 77.5 % 78.2 % 78.4 % 78.3 %
62.6 % 63.9 % 63.0 % 63.4 % 65.5 % Trust Fees to Total Revenue - GAAP (5) 63.2 % 63.8 % 67.6 % 67.4 % 67.2 % 68.1 % 68.0 % 62.3 % 63.4 % 62.5 % 63.1 % 65.1 % Trust Fees to Total Revenue (FTE) - Non-GAAP (5) 62.9 % 63.5 % 67.2 % 67.0 % 66.9 % 67.7 % 67.6 %
1.08 % 1.18 % 1.25 % 1.37 % 1.11 % Net Interest Spread - GAAP (6) 1.38 % 1.17 % 0.98 % 1.00 % 0.97 % 0.94 % 0.95 % 1.11 % 1.22 % 1.29 % 1.40 % 1.14 % Net Interest Spread (FTE) - Non-GAAP (6) 1.41 % 1.19 % 1.01 % 1.03 % 0.99 % 0.96 % 0.98 %
1.15 % 1.29 % 1.43 % 1.57 % 1.16 % Net Interest Margin - GAAP (7) 1.48 % 1.20 % 1.01 % 1.01 % 0.98 % 0.95 % 0.95 % 1.18 % 1.33 % 1.46 % 1.60 % 1.19 % Net Interest Margin (FTE) - Non-GAAP (7) 1.51 % 1.22 % 1.03 % 1.05 % 1.00 % 0.97 % 0.98 %
(1) Profit margin (pre-tax) is calculated by dividing income before income taxes by total revenue. Profit margin (pre-tax) on an FTE basis is calculated by dividing income before income taxes on an FTE basis by total revenue on an FTE basis.(2) Profit margin (after-tax) is calculated by dividing net income by total revenue. Profit margin (after-tax) on an FTE basis is calculated by dividing net income by total revenue on an FTE basis.(3) Effective tax rate is calculated by dividing the provision for income taxes by income before income taxes. Effective tax rate on an FTE basis is calculated by dividing the provision for income taxes on an FTE basis by income before income taxes on an FTE basis. (4) Noninterest income to total revenue is calculated by dividing noninterest income by total revenue. Noninterest income to total revenue on an FTE basis is calculated by dividing noninterest income by total revenue on an FTE basis.(5) Trust fees to total revenue is calculated by dividing total trust, investment and other servicing fees by total revenue. Trust fees to total revenue on an FTE basis is calculated by dividing total trust, investment and other servicing fees by total revenue on an FTE
basis.(6) Net interest spread is calculated as the difference between the interest rate earned (annualized interest income divided by average interest-earning assets) and the interest rate incurred (annualized interest expense divided by average interest-related funds). Net
interest spread on an FTE basis is calculated as the difference between the interest rate earned (annualized interest income on an FTE basis divided by average interest-earning assets) and the interest rate incurred (annualized interest expense divided by average interest-related funds).
(7) Net interest margin is calculated by dividing annualized net interest income by average interest-earning assets. Net interest margin on an FTE basis is calculated by dividing annualized net interest income on an FTE basis by average interest-earning assets.
12
Related Documents