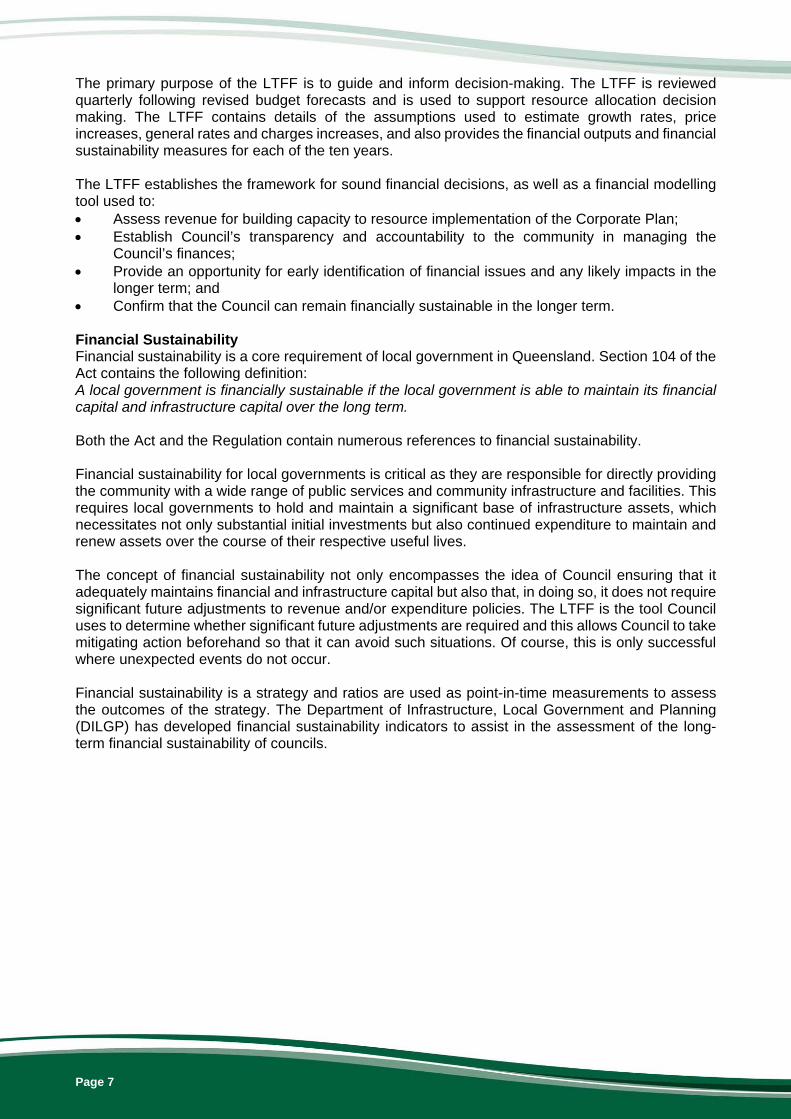
Financial Sustainability Strategy 2019 - 2028 Financial Sustainability Strategy Community Needs & Expectations Affordable Services Sustainable Infrastructure

Welcome message from author
This document is posted to help you gain knowledge. Please leave a comment to let me know what you think about it! Share it to your friends and learn new things together.
Transcript
Financial Sustainability Strategy 2019 - 2028
Financial Sustainability
Strategy
Community Needs & Expectations
Affordable Services
Sustainable Infrastructure
CONTENTS
1 Executive Summary .......................................................................................... 1
2 Strategy Background ........................................................................................ 2
2.1 Scenic Rim Profile ...................................................................................... 2
2.2 Scenic Rim Regional Council ..................................................................... 3
2.3 Link to Strategic Plans ................................................................................ 4
2.4 Background ................................................................................................ 5
2.5 Factors Impacting Financial Sustainability ................................................ 11
3 Strategy Vision ................................................................................................ 16
3.1 Objectives of the Strategy ......................................................................... 16
4 Strategy Outcomes and Performance Measures .......................................... 17
5 Abbreviations .................................................................................................. 22
6 Long Term Financial Forecast ....................................................................... 23
6.1 Foreward .................................................................................................. 23
6.2 Assumptions ............................................................................................. 23
6.3 Major Risks and Challenges ..................................................................... 25
6.4 Budgeted Financial Statements ................................................................ 25
6.5 Sensitivity Analysis ................................................................................... 31
7 Supporting References ................................................................................... 33
Date Strategy was endorsed by ET
27 April 2015
Date Strategy was approved by Council
24 June 2015; 23 June 2016; 15 June 2017; 13 June 2018
Strategy Review Date 30 June 2019
Page 1
1 Executive Summary The Financial Sustainability Strategy provides Council with an agreed roadmap for managing its financial resources and processes and is aligned with the objectives and priorities of the Corporate Plan. This strategy establishes the framework under which sound and sustainable financial decisions can be made, outlines the economic environment that Council operates in and identifies the major challenges to be addressed by the strategy. Within the framework of this strategy, guidance is provided to support decision making with respect to capital and operating revenue and expenditure, asset and service management levels and procurement operations. Council measures the effectiveness of its strategy through its long term financial forecast (LTFF) that is governed by a series of strategies, planned responses and associated financial stability and sustainability targets to measure performance. This strategy will be implemented though the alignment of Council’s LTFF to the strategy deliverables. It must also be recognised that financial sustainability cannot occur without a strong underlying system of asset management. The alignment of asset management and financial sustainability outcomes will be critical to the success of this strategy as will the identification of appropriate service levels to support the community. Financial sustainability is a legislative requirement of the Local Government Act 2009. A strategy is considered necessary to ensure that Council acts responsibly in the allocation of scarce resources and avoids a situation in which financial and infrastructure capital are not maintained at appropriate levels thereby leaving a liability for future generations.
Page 2
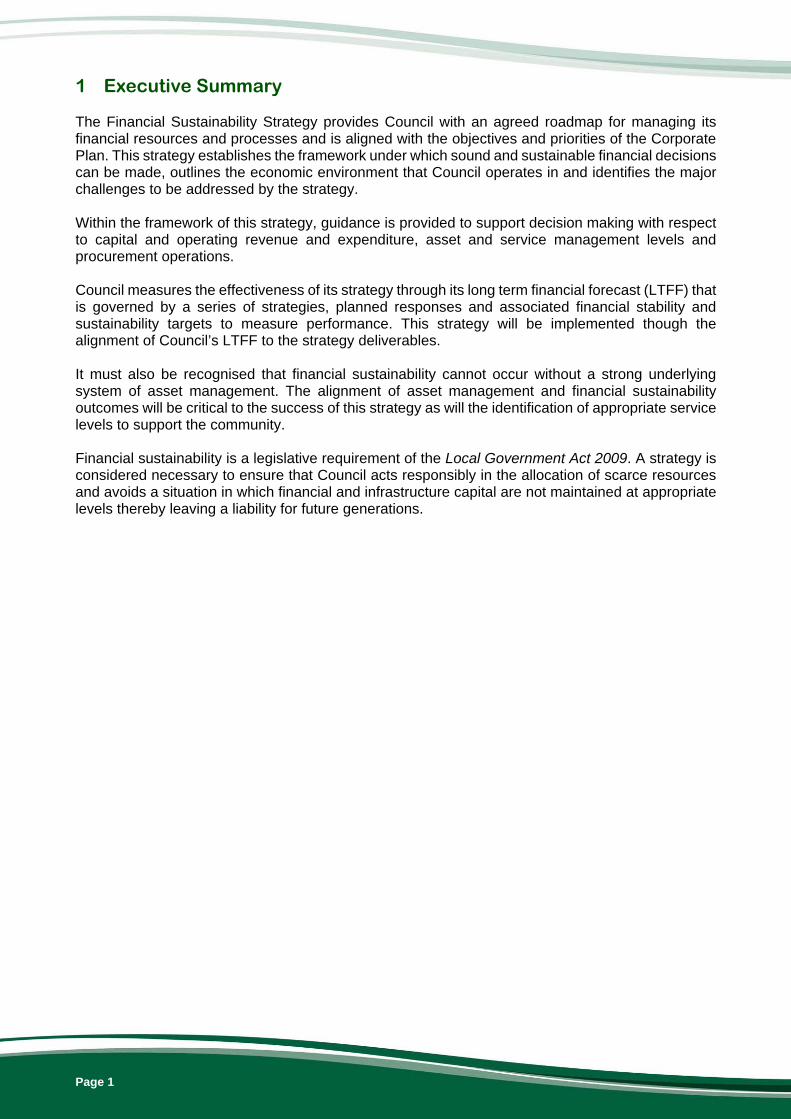
2 Strategy Background 2.1 Scenic Rim Profile Scenic Rim Location The Scenic Rim region is located in South East Queensland approximately an hour south of the Brisbane CBD and 30 minutes west of the Gold Coast. Covering an area of 4,256km2 the region consists of a diverse range of landscapes including rich agricultural and grazing land, world heritage listed national parks, and urban and rural living environments. The region has three main townships at Beaudesert, Boonah and Tamborine Mountain as well as many unique rural townships and villages.
Scenic Rim Demographic There were approximately 41,735 persons residing in the Scenic Rim Region in 2017, representing an increase of 760 persons or 1.85% from the level in 2016. The five year average annual growth rate for Scenic Rim is 1.8%, slightly above the Queensland average of 1.6% for the same period. Scenic Rim’s relatively low population density means that it has a lower rate base than city-based regions from which to raise revenues to maintain infrastructure and provide services. Future population growth is likely to increase as a result of general Queensland population growth trends and development in the Bromelton State Development Area (BSDA).
Page 3
Scenic Rim Economy Key drivers of the Scenic Rim economy are agriculture, construction and retail trade, which represented approximately 47% of total industry turnover in the region in 2016. Smaller, but important, industries operating in the region include manufacturing, wholesale trade, tourism, transport and professional services along with many others. Council expects growth to occur in all industries into the future with emphasis on industrial development, residential housing construction and rail freight transport. The first rail freight transport depot was constructed in the BSDA in 2016-17 representing an important step to significant future development of the BSDA and the generation of both direct and indirect new jobs in the region. The announcement of funding for inland rail in the 2017 Federal Government's budget will also benefit the BSDA. Key issues that have impacted the economic development of the region include: Limited local employment opportunities; Lack of road and rail transport infrastructure to support the development of industry, particularly
the BDSA; Lack of public transport options leaving people living in the region reliant on car transport; The Scenic Rim local government area has the lowest average wages in South East
Queensland and is also lower than the Queensland average; Urban settlements are spread across a large and dispersed area and located close to city
areas; this leads to people living in the region looking outside the region for more attractive shopping options and strong competition from these areas limits the ability for local business to grow and diversify.
While these issues will continue to be evident, development of the BSDA and the associated economic growth will assist to alleviate some impacts. Council is also investing in social infrastructure programs to assist with attracting new residents and retaining existing residents in the region. 2.2 Scenic Rim Regional Council Scenic Rim Regional Council was formed in 2008 by the amalgamation of Beaudesert and Boonah Shire Councils, with the transfer of a substantial area to Logan City Council and a small area from Ipswich City Council. This ‘amalgamation’ was unique in that the population of the resulting council was significantly smaller than the larger of the former councils. This meant that the new council had to scale back its workforce. At the time it was identified that this was to be one of the most challenging amalgamations resulting from the local government reform in Queensland. The resulting council was left with the responsibility of a large rural road network and the same level of shared services that were previously spread across a larger number of ratepayers. At the time high population growth was expected to occur by the State Government due to the development of the BSDA; however, actual population growth has been well below expectations due to the both global and national economic conditions resulting in the BSDA not progressing as forecast. Council is governed by a popularly-elected Mayor and one Councillor for each of the region's six electoral divisions. Council employs approximately 363 full time equivalent employees who work within four directorates being: 1. Chief Executive Office 2. Finance and Information Services 3. Infrastructure Services 4. Regional Services
Page 4
The main public services that Council provides include: Animal control and regulation Building and plumbing inspection services Cultural centres at Beaudesert and Boonah Customer service centres at Beaudesert, Boonah and Tamborine Mountain Disaster management functions Economic development and tourism Environmental programs and services Healthy and active programs Maintenance of community buildings including public halls and public toilets Maintenance of parks, reserves, sporting areas and cemeteries Planning and development services Public infrastructure maintenance and construction including roads, bridges footpaths and
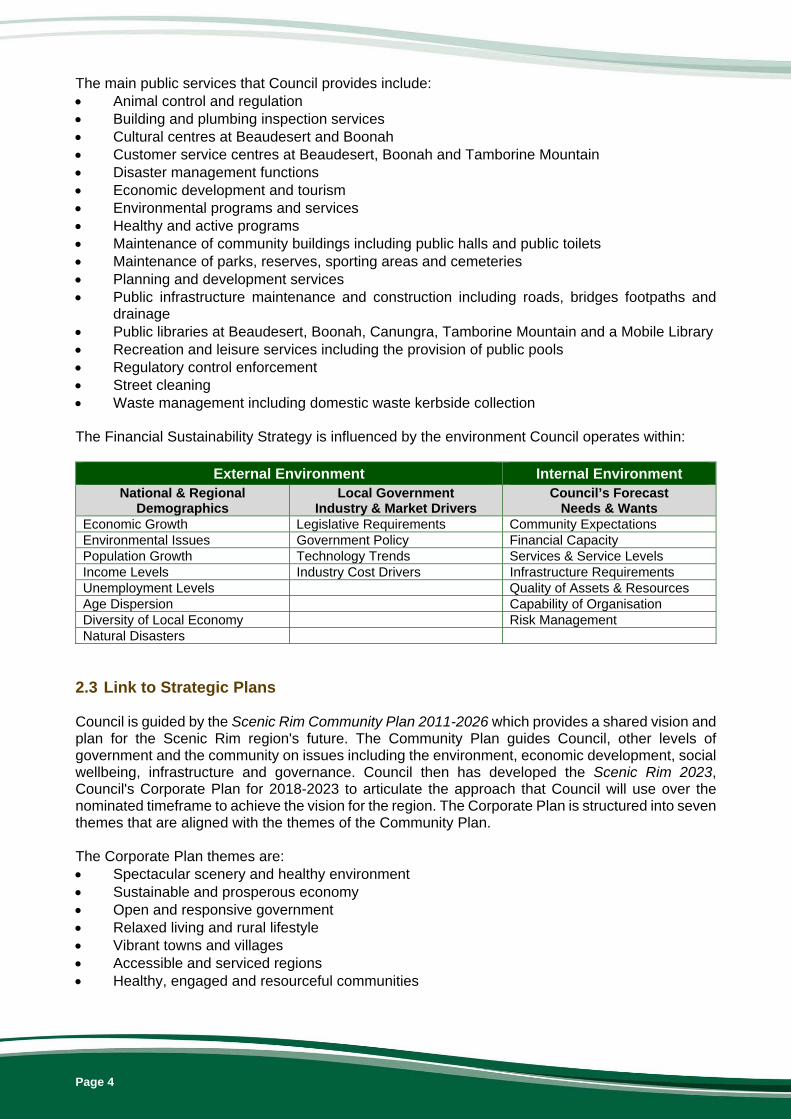
drainage Public libraries at Beaudesert, Boonah, Canungra, Tamborine Mountain and a Mobile Library Recreation and leisure services including the provision of public pools Regulatory control enforcement Street cleaning Waste management including domestic waste kerbside collection The Financial Sustainability Strategy is influenced by the environment Council operates within:
External Environment Internal Environment National & Regional
Demographics Local Government
Industry & Market Drivers Council’s Forecast
Needs & Wants Economic Growth Legislative Requirements Community Expectations Environmental Issues Government Policy Financial Capacity Population Growth Technology Trends Services & Service Levels Income Levels Industry Cost Drivers Infrastructure Requirements Unemployment Levels Quality of Assets & Resources Age Dispersion Capability of Organisation Diversity of Local Economy Risk Management Natural Disasters
2.3 Link to Strategic Plans Council is guided by the Scenic Rim Community Plan 2011-2026 which provides a shared vision and plan for the Scenic Rim region's future. The Community Plan guides Council, other levels of government and the community on issues including the environment, economic development, social wellbeing, infrastructure and governance. Council then has developed the Scenic Rim 2023, Council's Corporate Plan for 2018-2023 to articulate the approach that Council will use over the nominated timeframe to achieve the vision for the region. The Corporate Plan is structured into seven themes that are aligned with the themes of the Community Plan. The Corporate Plan themes are: Spectacular scenery and healthy environment Sustainable and prosperous economy Open and responsive government Relaxed living and rural lifestyle Vibrant towns and villages Accessible and serviced regions Healthy, engaged and resourceful communities
Page 5
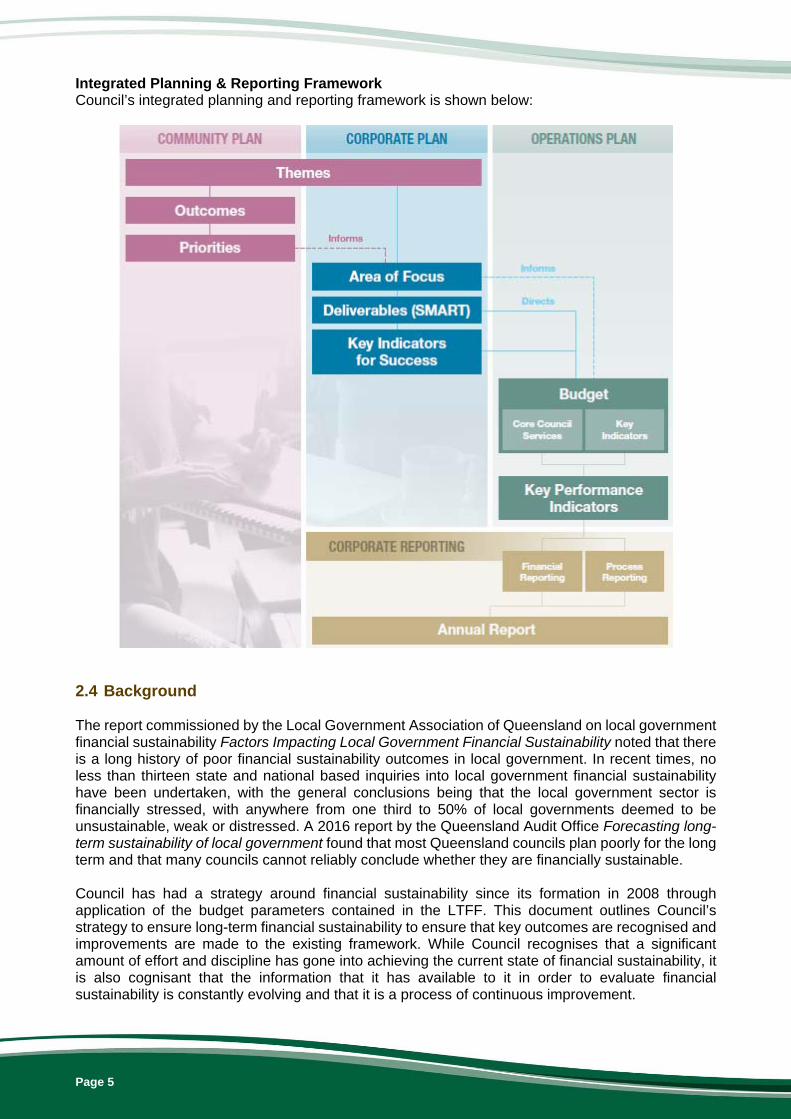
Integrated Planning & Reporting Framework Council’s integrated planning and reporting framework is shown below:
2.4 Background The report commissioned by the Local Government Association of Queensland on local government financial sustainability Factors Impacting Local Government Financial Sustainability noted that there is a long history of poor financial sustainability outcomes in local government. In recent times, no less than thirteen state and national based inquiries into local government financial sustainability have been undertaken, with the general conclusions being that the local government sector is financially stressed, with anywhere from one third to 50% of local governments deemed to be unsustainable, weak or distressed. A 2016 report by the Queensland Audit Office Forecasting long-term sustainability of local government found that most Queensland councils plan poorly for the long term and that many councils cannot reliably conclude whether they are financially sustainable. Council has had a strategy around financial sustainability since its formation in 2008 through application of the budget parameters contained in the LTFF. This document outlines Council’s strategy to ensure long-term financial sustainability to ensure that key outcomes are recognised and improvements are made to the existing framework. While Council recognises that a significant amount of effort and discipline has gone into achieving the current state of financial sustainability, it is also cognisant that the information that it has available to it in order to evaluate financial sustainability is constantly evolving and that it is a process of continuous improvement.
Page 6
Financial Sustainability Reviews In 2008 the Local Government Reform Commission stated in its report that Beaudesert Shire Council was likely to be rated at best as Weak in terms of financial sustainability and the new council would also likely be Weak. The former Boonah Shire Council was assessed by Queensland Treasury Corporation (QTC) as being Weak with a Developing (uncertain) outlook. According to QTC Weak was defined as: A local government with an acceptable capacity to meet its financial commitments in the short to medium term and a limited capacity in the long term. It is unlikely to be able to manage unforseen financial shocks and any advertise changes in its business and in general economic conditions without the need for significant revenue or expense adjustments. It may experience difficulty in managing core business risks. Upon formation in 2008, Council undertook an independent review of financial sustainability using Orion Consulting Network as part of the development of the 2009-10 budget and LTFF. Orion provided advice to Council on the indicators and assumptions in the LTFF to assist Council in setting its budget parameters. This review demonstrated that, provided Council continued with the recommended budget parameters contained in the LTFF, the financial sustainability indicator targets recommended by QTC could be achieved from 2011-12 onwards. Since that time Council has continued to keep financial sustainability as its focus. As a consequence, the Department of Local Government rated Council in a strong financial position for the 2010-11 financial year. For the 2011-12 budget and LTFF Council again engaged Orion Consulting Network to provide advice to Council on the indicators and assumptions to be used and provide an opinion on whether the forecast was financially sustainable. Between these two reviews three significant things occurred: 1. Queensland Urban Utilities was formed on 1 July 2010 and took over the Council’s water and
wastewater distribution and retail responsibilities; 2. Substantial flooding occurred through December 2010 and January 2011 triggering the
National Disaster Relief and Recovery Arrangements (NDRRA), which resulted in restoration works identified to be carried out over the following two years; and
3. Council adopted a new organisational structure as part of an organisational review. The review found that Council had remained within the recommended budget parameters and was achieving the financial sustainability indicator targets recommended by QTC from 2011-12 onwards. Further substantial flooding occurring after 2010-11 in 2012 and 2013 also triggered NDRRA and has resulted in a total flood restoration program of over $100 million being spent in the Scenic Rim region. Council has undertaken a further three independent financial sustainability reviews with the latest conducted by Orion Consulting Network in April 2016. This review found Council was on track to achieve long term financial sustainability, with no sustainability issues that required immediate addressing. Long Term Financial Forecast Council is required by Section 104 of the Local Government Act 2009 (the Act) and Section 169 of the Local Government Regulation 2012 (the Regulation) to prepare a LTFF. The LTFF is a ten year financial forecast which includes income, expenditure, related cash flow projections, liabilities and equity and the value of assets.
Page 7
The primary purpose of the LTFF is to guide and inform decision-making. The LTFF is reviewed quarterly following revised budget forecasts and is used to support resource allocation decision making. The LTFF contains details of the assumptions used to estimate growth rates, price increases, general rates and charges increases, and also provides the financial outputs and financial sustainability measures for each of the ten years. The LTFF establishes the framework for sound financial decisions, as well as a financial modelling tool used to: Assess revenue for building capacity to resource implementation of the Corporate Plan; Establish Council’s transparency and accountability to the community in managing the
Council’s finances; Provide an opportunity for early identification of financial issues and any likely impacts in the
longer term; and Confirm that the Council can remain financially sustainable in the longer term. Financial Sustainability Financial sustainability is a core requirement of local government in Queensland. Section 104 of the Act contains the following definition: A local government is financially sustainable if the local government is able to maintain its financial capital and infrastructure capital over the long term. Both the Act and the Regulation contain numerous references to financial sustainability. Financial sustainability for local governments is critical as they are responsible for directly providing the community with a wide range of public services and community infrastructure and facilities. This requires local governments to hold and maintain a significant base of infrastructure assets, which necessitates not only substantial initial investments but also continued expenditure to maintain and renew assets over the course of their respective useful lives. The concept of financial sustainability not only encompasses the idea of Council ensuring that it adequately maintains financial and infrastructure capital but also that, in doing so, it does not require significant future adjustments to revenue and/or expenditure policies. The LTFF is the tool Council uses to determine whether significant future adjustments are required and this allows Council to take mitigating action beforehand so that it can avoid such situations. Of course, this is only successful where unexpected events do not occur. Financial sustainability is a strategy and ratios are used as point-in-time measurements to assess the outcomes of the strategy. The Department of Infrastructure, Local Government and Planning (DILGP) has developed financial sustainability indicators to assist in the assessment of the long-term financial sustainability of councils.
Page 8
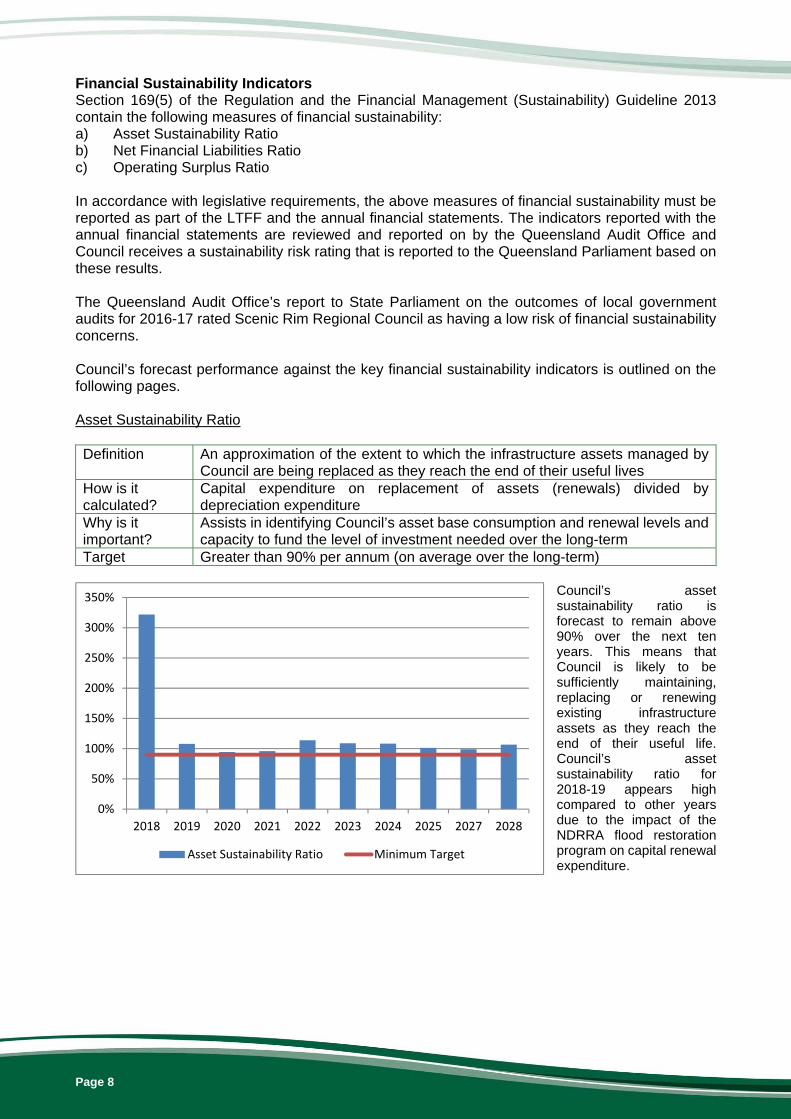
Financial Sustainability Indicators Section 169(5) of the Regulation and the Financial Management (Sustainability) Guideline 2013 contain the following measures of financial sustainability: a) Asset Sustainability Ratio b) Net Financial Liabilities Ratio c) Operating Surplus Ratio In accordance with legislative requirements, the above measures of financial sustainability must be reported as part of the LTFF and the annual financial statements. The indicators reported with the annual financial statements are reviewed and reported on by the Queensland Audit Office and Council receives a sustainability risk rating that is reported to the Queensland Parliament based on these results. The Queensland Audit Office’s report to State Parliament on the outcomes of local government audits for 2016-17 rated Scenic Rim Regional Council as having a low risk of financial sustainability concerns. Council’s forecast performance against the key financial sustainability indicators is outlined on the following pages. Asset Sustainability Ratio Definition An approximation of the extent to which the infrastructure assets managed by
Council are being replaced as they reach the end of their useful lives How is it calculated?
Capital expenditure on replacement of assets (renewals) divided by depreciation expenditure
Why is it important?
Assists in identifying Council’s asset base consumption and renewal levels and capacity to fund the level of investment needed over the long-term
Target Greater than 90% per annum (on average over the long-term)
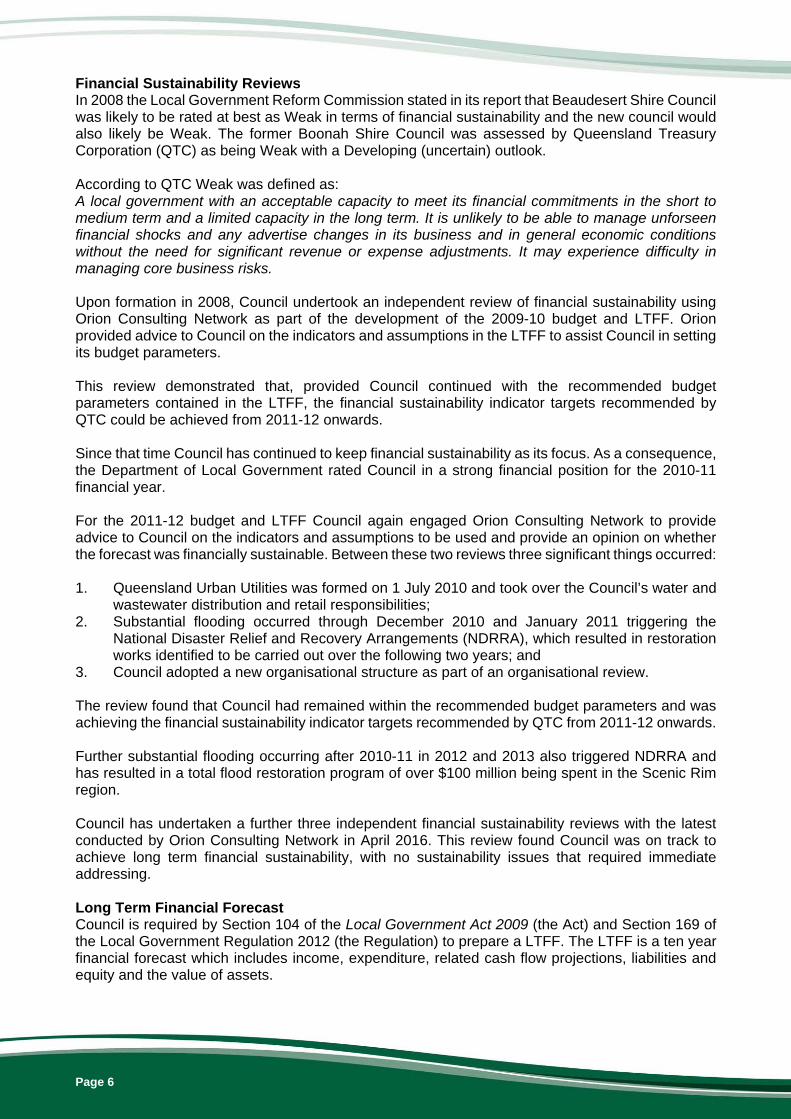
Council’s asset sustainability ratio is forecast to remain above 90% over the next ten years. This means that Council is likely to be sufficiently maintaining, replacing or renewing existing infrastructure assets as they reach the end of their useful life. Council’s asset sustainability ratio for 2018-19 appears high compared to other years due to the impact of the NDRRA flood restoration program on capital renewal expenditure.
0%
50%
100%
150%
200%
250%
300%
350%
2018 2019 2020 2021 2022 2023 2024 2025 2027 2028
Asset Sustainability Ratio Minimum Target
Page 9
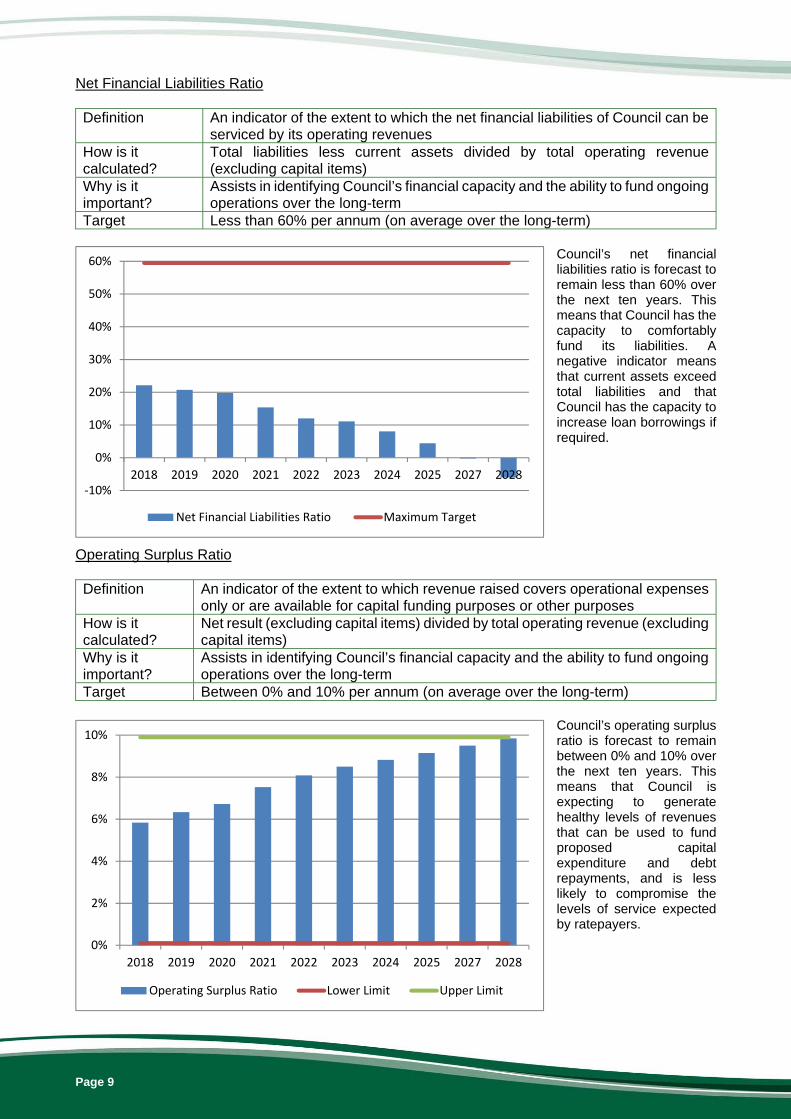
Net Financial Liabilities Ratio Definition An indicator of the extent to which the net financial liabilities of Council can be
serviced by its operating revenues How is it calculated?
Total liabilities less current assets divided by total operating revenue (excluding capital items)
Why is it important?
Assists in identifying Council’s financial capacity and the ability to fund ongoing operations over the long-term
Target Less than 60% per annum (on average over the long-term)
Council’s net financial liabilities ratio is forecast to remain less than 60% over the next ten years. This means that Council has the capacity to comfortably fund its liabilities. A negative indicator means that current assets exceed total liabilities and that Council has the capacity to increase loan borrowings if required.
Operating Surplus Ratio Definition An indicator of the extent to which revenue raised covers operational expenses
only or are available for capital funding purposes or other purposes How is it calculated?
Net result (excluding capital items) divided by total operating revenue (excluding capital items)
Why is it important?
Assists in identifying Council’s financial capacity and the ability to fund ongoing operations over the long-term
Target Between 0% and 10% per annum (on average over the long-term)
Council’s operating surplus ratio is forecast to remain between 0% and 10% over the next ten years. This means that Council is expecting to generate healthy levels of revenues that can be used to fund proposed capital expenditure and debt repayments, and is less likely to compromise the levels of service expected by ratepayers.
‐10%
0%
10%
20%
30%
40%
50%
60%
2018 2019 2020 2021 2022 2023 2024 2025 2027 2028
Net Financial Liabilities Ratio Maximum Target
0%
2%
4%
6%
8%
10%
2018 2019 2020 2021 2022 2023 2024 2025 2027 2028
Operating Surplus Ratio Lower Limit Upper Limit
Page 10
Long Term Asset Management Plan Council is required by Section 167 of the Regulation to prepare a long term asset management plan for a period of at least ten years, which must: a) provide for strategies to ensure the sustainable management of the assets mentioned in the
local government’s asset register and the infrastructure of the local government; b) state the estimated capital expenditure for renewing, upgrading and extending the assets for
the period covered by the plan; and c) be part of, and consistent with, the LTFF. Local Government Infrastructure Plan Council is required by the Sustainable Planning (Infrastructure Charges) and Other Legislation Amendment Act 2014 to prepare a Local Government Infrastructure Plan (LGIP). An LGIP is that part of the planning scheme and identifies Council's plans for trunk infrastructure necessary to service urban development at the desired standard of service in a coordinated, efficient and financially sustainable manner. The purpose of an LGIP is to: integrate infrastructure planning with the land use planning identified in the planning scheme; provide transparency regarding a local government's intentions for the provision of trunk
infrastructure; enable a local government to estimate the cost of infrastructure provision to assist its long term
financial planning; ensure that trunk infrastructure is planned and provided in an efficient and orderly manner; and provide a basis for the imposition of conditions about infrastructure on development approvals. Asset Management Council has a comprehensive system and strong culture of asset management embedded into the organisation through the following documents, structures and systems. Documentation Asset Management Policy Asset Management Strategy Asset Management Plans Asset Management Improvement Plan Ten Year Capital Expenditure Forecasts Structures Asset Management Steering Committee Asset Management Working Group Asset Management Section Systems Capital Expenditure Prioritisation Models Alignment of asset management system with international standard ISO 55001:2014, Asset
Management - Management systems: Requirements Regular asset condition assessments and valuations A strong asset management system is essential for financial sustainability. A weak system of asset management will not produce outputs that Council can have confidence in. These outputs are used to evaluate the success of the LTFF in funding asset management plan (AMP) funding requirements. If this was not able to occur with a reasonable level of confidence then Council would not be able to evaluate its financial sustainability.
Page 11
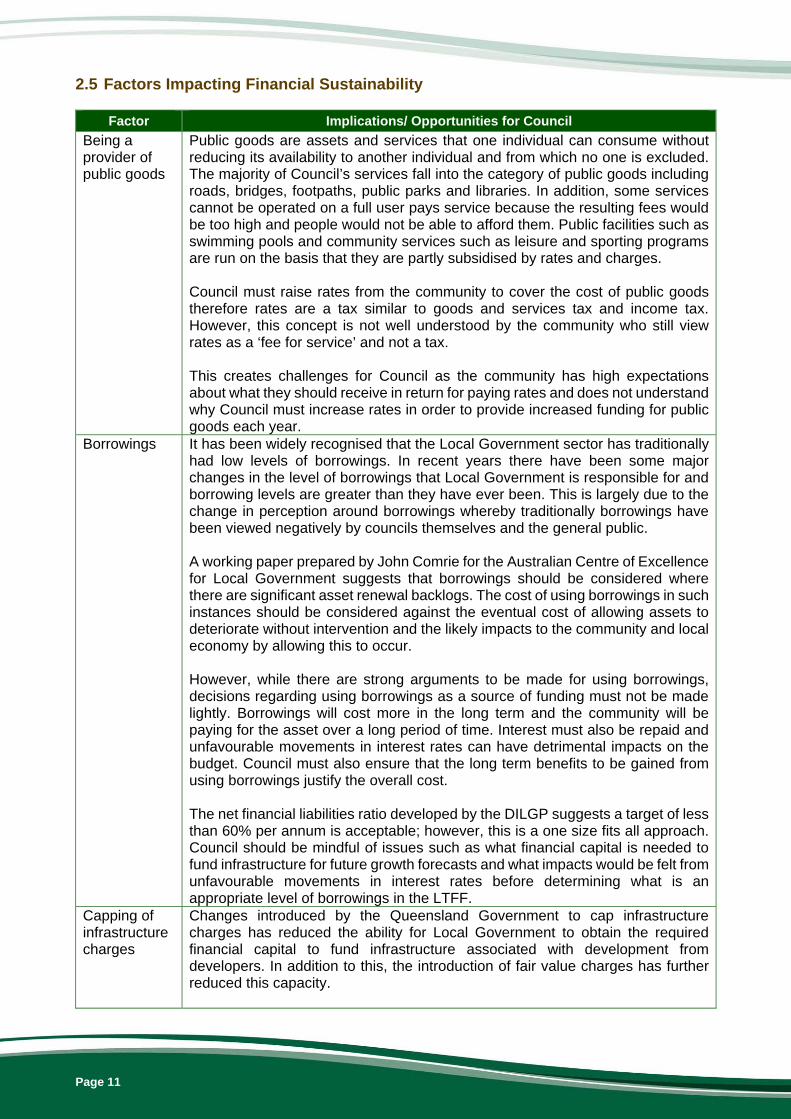
2.5 Factors Impacting Financial Sustainability
Factor Implications/ Opportunities for Council
Being a provider of public goods
Public goods are assets and services that one individual can consume without reducing its availability to another individual and from which no one is excluded. The majority of Council’s services fall into the category of public goods including roads, bridges, footpaths, public parks and libraries. In addition, some services cannot be operated on a full user pays service because the resulting fees would be too high and people would not be able to afford them. Public facilities such as swimming pools and community services such as leisure and sporting programs are run on the basis that they are partly subsidised by rates and charges. Council must raise rates from the community to cover the cost of public goods therefore rates are a tax similar to goods and services tax and income tax. However, this concept is not well understood by the community who still view rates as a ‘fee for service’ and not a tax. This creates challenges for Council as the community has high expectations about what they should receive in return for paying rates and does not understand why Council must increase rates in order to provide increased funding for public goods each year.
Borrowings It has been widely recognised that the Local Government sector has traditionally had low levels of borrowings. In recent years there have been some major changes in the level of borrowings that Local Government is responsible for and borrowing levels are greater than they have ever been. This is largely due to the change in perception around borrowings whereby traditionally borrowings have been viewed negatively by councils themselves and the general public. A working paper prepared by John Comrie for the Australian Centre of Excellence for Local Government suggests that borrowings should be considered where there are significant asset renewal backlogs. The cost of using borrowings in such instances should be considered against the eventual cost of allowing assets to deteriorate without intervention and the likely impacts to the community and local economy by allowing this to occur. However, while there are strong arguments to be made for using borrowings, decisions regarding using borrowings as a source of funding must not be made lightly. Borrowings will cost more in the long term and the community will be paying for the asset over a long period of time. Interest must also be repaid and unfavourable movements in interest rates can have detrimental impacts on the budget. Council must also ensure that the long term benefits to be gained from using borrowings justify the overall cost. The net financial liabilities ratio developed by the DILGP suggests a target of less than 60% per annum is acceptable; however, this is a one size fits all approach. Council should be mindful of issues such as what financial capital is needed to fund infrastructure for future growth forecasts and what impacts would be felt from unfavourable movements in interest rates before determining what is an appropriate level of borrowings in the LTFF.
Capping of infrastructure charges
Changes introduced by the Queensland Government to cap infrastructure charges has reduced the ability for Local Government to obtain the required financial capital to fund infrastructure associated with development from developers. In addition to this, the introduction of fair value charges has further reduced this capacity.
Page 12
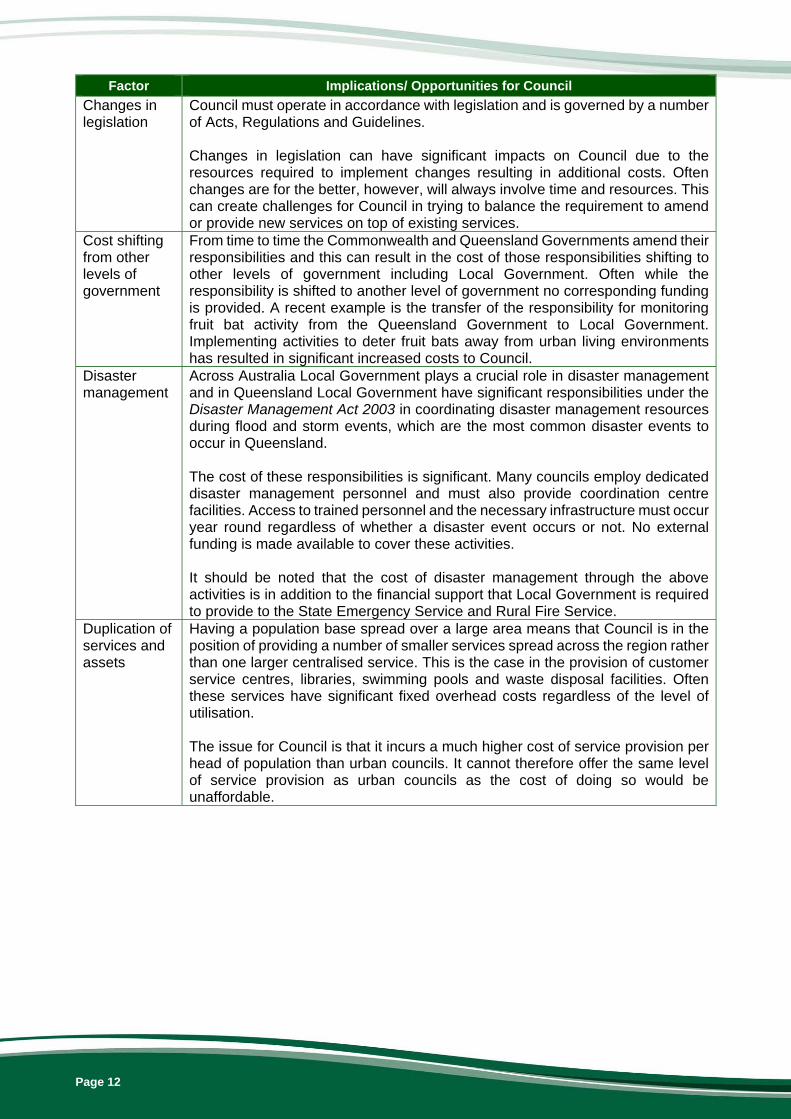
Factor Implications/ Opportunities for Council
Changes in legislation
Council must operate in accordance with legislation and is governed by a number of Acts, Regulations and Guidelines. Changes in legislation can have significant impacts on Council due to the resources required to implement changes resulting in additional costs. Often changes are for the better, however, will always involve time and resources. This can create challenges for Council in trying to balance the requirement to amend or provide new services on top of existing services.
Cost shifting from other levels of government
From time to time the Commonwealth and Queensland Governments amend their responsibilities and this can result in the cost of those responsibilities shifting to other levels of government including Local Government. Often while the responsibility is shifted to another level of government no corresponding funding is provided. A recent example is the transfer of the responsibility for monitoring fruit bat activity from the Queensland Government to Local Government. Implementing activities to deter fruit bats away from urban living environments has resulted in significant increased costs to Council.
Disaster management
Across Australia Local Government plays a crucial role in disaster management and in Queensland Local Government have significant responsibilities under the Disaster Management Act 2003 in coordinating disaster management resources during flood and storm events, which are the most common disaster events to occur in Queensland. The cost of these responsibilities is significant. Many councils employ dedicated disaster management personnel and must also provide coordination centre facilities. Access to trained personnel and the necessary infrastructure must occur year round regardless of whether a disaster event occurs or not. No external funding is made available to cover these activities. It should be noted that the cost of disaster management through the above activities is in addition to the financial support that Local Government is required to provide to the State Emergency Service and Rural Fire Service.
Duplication of services and assets
Having a population base spread over a large area means that Council is in the position of providing a number of smaller services spread across the region rather than one larger centralised service. This is the case in the provision of customer service centres, libraries, swimming pools and waste disposal facilities. Often these services have significant fixed overhead costs regardless of the level of utilisation. The issue for Council is that it incurs a much higher cost of service provision per head of population than urban councils. It cannot therefore offer the same level of service provision as urban councils as the cost of doing so would be unaffordable.
Page 13
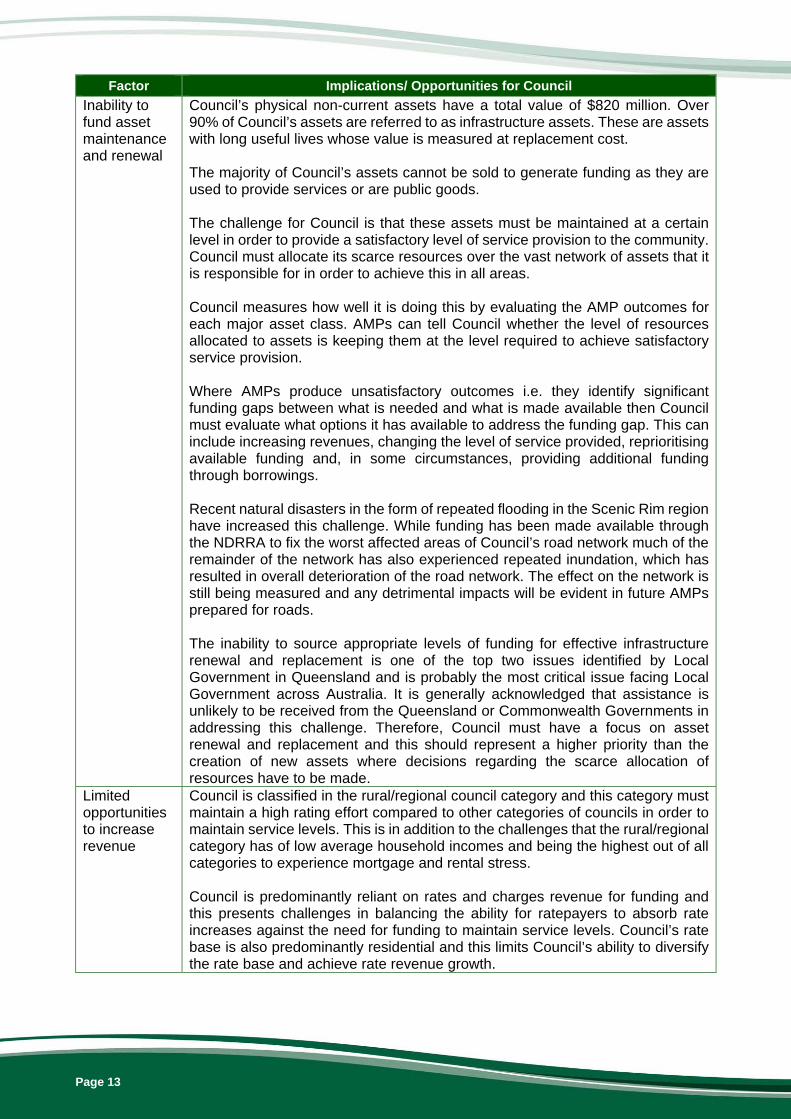
Factor Implications/ Opportunities for Council
Inability to fund asset maintenance and renewal
Council’s physical non-current assets have a total value of $820 million. Over 90% of Council’s assets are referred to as infrastructure assets. These are assets with long useful lives whose value is measured at replacement cost. The majority of Council’s assets cannot be sold to generate funding as they are used to provide services or are public goods. The challenge for Council is that these assets must be maintained at a certain level in order to provide a satisfactory level of service provision to the community. Council must allocate its scarce resources over the vast network of assets that it is responsible for in order to achieve this in all areas. Council measures how well it is doing this by evaluating the AMP outcomes for each major asset class. AMPs can tell Council whether the level of resources allocated to assets is keeping them at the level required to achieve satisfactory service provision. Where AMPs produce unsatisfactory outcomes i.e. they identify significant funding gaps between what is needed and what is made available then Council must evaluate what options it has available to address the funding gap. This can include increasing revenues, changing the level of service provided, reprioritising available funding and, in some circumstances, providing additional funding through borrowings. Recent natural disasters in the form of repeated flooding in the Scenic Rim region have increased this challenge. While funding has been made available through the NDRRA to fix the worst affected areas of Council’s road network much of the remainder of the network has also experienced repeated inundation, which has resulted in overall deterioration of the road network. The effect on the network is still being measured and any detrimental impacts will be evident in future AMPs prepared for roads. The inability to source appropriate levels of funding for effective infrastructure renewal and replacement is one of the top two issues identified by Local Government in Queensland and is probably the most critical issue facing Local Government across Australia. It is generally acknowledged that assistance is unlikely to be received from the Queensland or Commonwealth Governments in addressing this challenge. Therefore, Council must have a focus on asset renewal and replacement and this should represent a higher priority than the creation of new assets where decisions regarding the scarce allocation of resources have to be made.
Limited opportunities to increase revenue
Council is classified in the rural/regional council category and this category must maintain a high rating effort compared to other categories of councils in order to maintain service levels. This is in addition to the challenges that the rural/regional category has of low average household incomes and being the highest out of all categories to experience mortgage and rental stress. Council is predominantly reliant on rates and charges revenue for funding and this presents challenges in balancing the ability for ratepayers to absorb rate increases against the need for funding to maintain service levels. Council’s rate base is also predominantly residential and this limits Council’s ability to diversify the rate base and achieve rate revenue growth.
Page 14
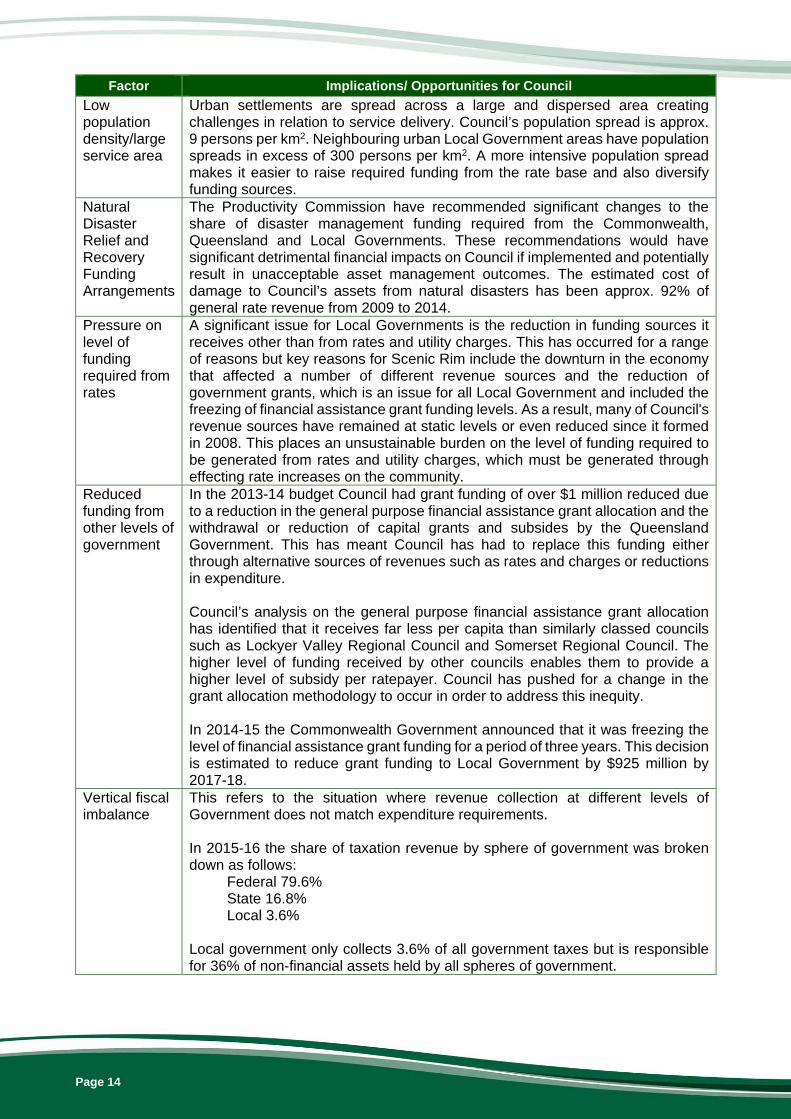
Factor Implications/ Opportunities for Council
Low population density/large service area
Urban settlements are spread across a large and dispersed area creating challenges in relation to service delivery. Council’s population spread is approx. 9 persons per km2. Neighbouring urban Local Government areas have population spreads in excess of 300 persons per km2. A more intensive population spread makes it easier to raise required funding from the rate base and also diversify funding sources.
Natural Disaster Relief and Recovery Funding Arrangements
The Productivity Commission have recommended significant changes to the share of disaster management funding required from the Commonwealth, Queensland and Local Governments. These recommendations would have significant detrimental financial impacts on Council if implemented and potentially result in unacceptable asset management outcomes. The estimated cost of damage to Council’s assets from natural disasters has been approx. 92% of general rate revenue from 2009 to 2014.
Pressure on level of funding required from rates
A significant issue for Local Governments is the reduction in funding sources it receives other than from rates and utility charges. This has occurred for a range of reasons but key reasons for Scenic Rim include the downturn in the economy that affected a number of different revenue sources and the reduction of government grants, which is an issue for all Local Government and included the freezing of financial assistance grant funding levels. As a result, many of Council's revenue sources have remained at static levels or even reduced since it formed in 2008. This places an unsustainable burden on the level of funding required to be generated from rates and utility charges, which must be generated through effecting rate increases on the community.
Reduced funding from other levels of government
In the 2013-14 budget Council had grant funding of over $1 million reduced due to a reduction in the general purpose financial assistance grant allocation and the withdrawal or reduction of capital grants and subsides by the Queensland Government. This has meant Council has had to replace this funding either through alternative sources of revenues such as rates and charges or reductions in expenditure. Council’s analysis on the general purpose financial assistance grant allocation has identified that it receives far less per capita than similarly classed councils such as Lockyer Valley Regional Council and Somerset Regional Council. The higher level of funding received by other councils enables them to provide a higher level of subsidy per ratepayer. Council has pushed for a change in the grant allocation methodology to occur in order to address this inequity. In 2014-15 the Commonwealth Government announced that it was freezing the level of financial assistance grant funding for a period of three years. This decision is estimated to reduce grant funding to Local Government by $925 million by 2017-18.
Vertical fiscal imbalance
This refers to the situation where revenue collection at different levels of Government does not match expenditure requirements. In 2015-16 the share of taxation revenue by sphere of government was broken down as follows:
Federal 79.6% State 16.8% Local 3.6%
Local government only collects 3.6% of all government taxes but is responsible for 36% of non-financial assets held by all spheres of government.

Page 15
Factor Implications/ Opportunities for Council
Horizontal fiscal imbalance
This refers to different abilities to raise revenue and different expenditure requirements at the same level of government. Local Governments have different capacities to raise revenues as well as expenditure needs. Whilst this is partly addressed through financial assistance grant allocation methodologies, the maintenance of these is outside the control of Local Government.
Page 16
3 Strategy Vision Consistent with Council’s theme of Organisational Sustainability contained in the Corporate Plan, the vision of the financial sustainability strategy is: To ensure Scenic Rim Regional Council remains financially sustainable in the short, medium, and long term. 3.1 Objectives of the Strategy The objectives are to: Maintain key financial sustainability indicator results in line with DILGP targets; Provide sufficient funding to meet AMP requirements over the long term where agreed and
affordable service levels are identified; Provide sufficient funding to meet capital expenditure requirements identified in the LGIP to
support future development and population growth; Ensure adequate funding is available to provide efficient and effective services to the
community; Ensure key financial risks have been considered and are reflected in financial forecasts; Achieve and maintain fair and equitable revenue structures that consider the cost of providing
services and the level of subsidy provided from rates; Address key inter-generational infrastructure and service issues, which allows any significant
financial burden to be spread over a number of years and not impact adversely on current or future ratepayers.
Ensure prudent management of investments and loan borrowings; Ensure that Council considers the full lifecycle cost of all proposals prior to making
commitments for expenditure; and Ensure robust systems remain in place around the development and management of budgets
and the LTFF.
Page 17
4 Strategy Outcomes and Performance Measures
Strategy Statement:
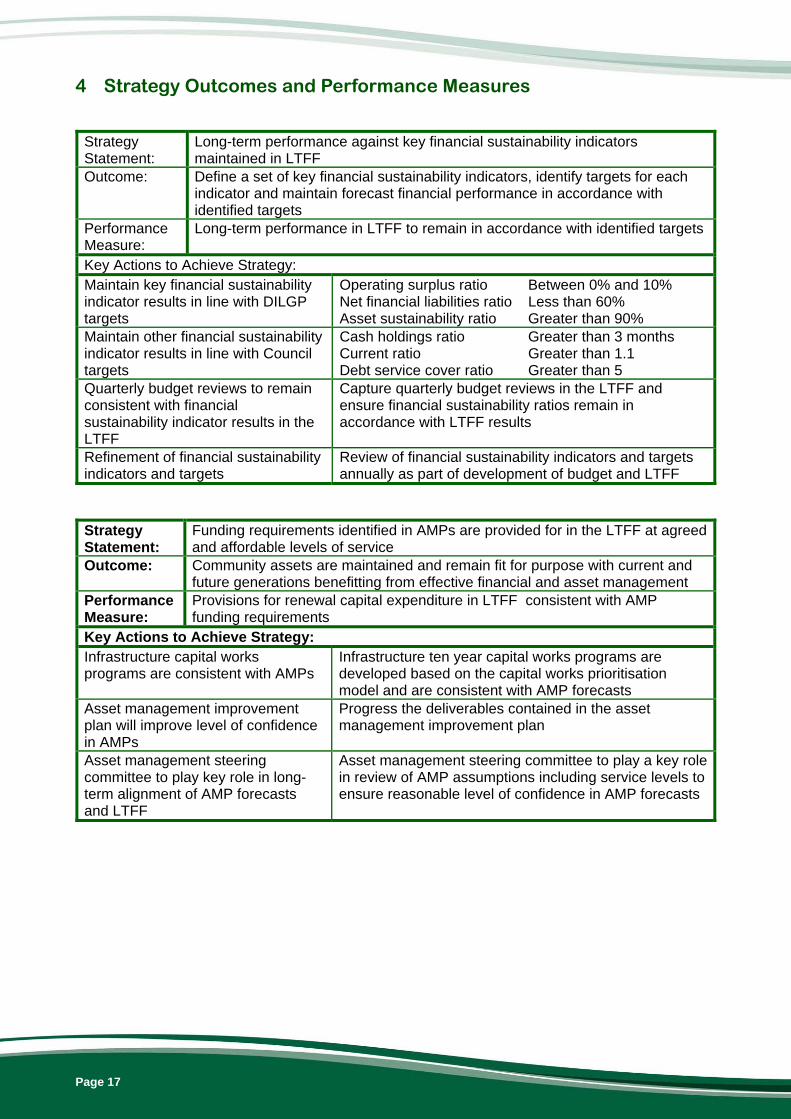
Long-term performance against key financial sustainability indicators maintained in LTFF
Outcome: Define a set of key financial sustainability indicators, identify targets for each indicator and maintain forecast financial performance in accordance with identified targets
Performance Measure:
Long-term performance in LTFF to remain in accordance with identified targets
Key Actions to Achieve Strategy: Maintain key financial sustainability indicator results in line with DILGP targets
Operating surplus ratio Between 0% and 10% Net financial liabilities ratio Less than 60% Asset sustainability ratio Greater than 90%
Maintain other financial sustainability indicator results in line with Council targets
Cash holdings ratio Greater than 3 months Current ratio Greater than 1.1 Debt service cover ratio Greater than 5
Quarterly budget reviews to remain consistent with financial sustainability indicator results in the LTFF
Capture quarterly budget reviews in the LTFF and ensure financial sustainability ratios remain in accordance with LTFF results
Refinement of financial sustainability indicators and targets
Review of financial sustainability indicators and targets annually as part of development of budget and LTFF
Strategy Statement:
Funding requirements identified in AMPs are provided for in the LTFF at agreed and affordable levels of service
Outcome: Community assets are maintained and remain fit for purpose with current and future generations benefitting from effective financial and asset management
Performance Measure:
Provisions for renewal capital expenditure in LTFF consistent with AMP funding requirements
Key Actions to Achieve Strategy: Infrastructure capital works programs are consistent with AMPs
Infrastructure ten year capital works programs are developed based on the capital works prioritisation model and are consistent with AMP forecasts
Asset management improvement plan will improve level of confidence in AMPs
Progress the deliverables contained in the asset management improvement plan
Asset management steering committee to play key role in long-term alignment of AMP forecasts and LTFF
Asset management steering committee to play a key role in review of AMP assumptions including service levels to ensure reasonable level of confidence in AMP forecasts
Page 18
Strategy Statement:
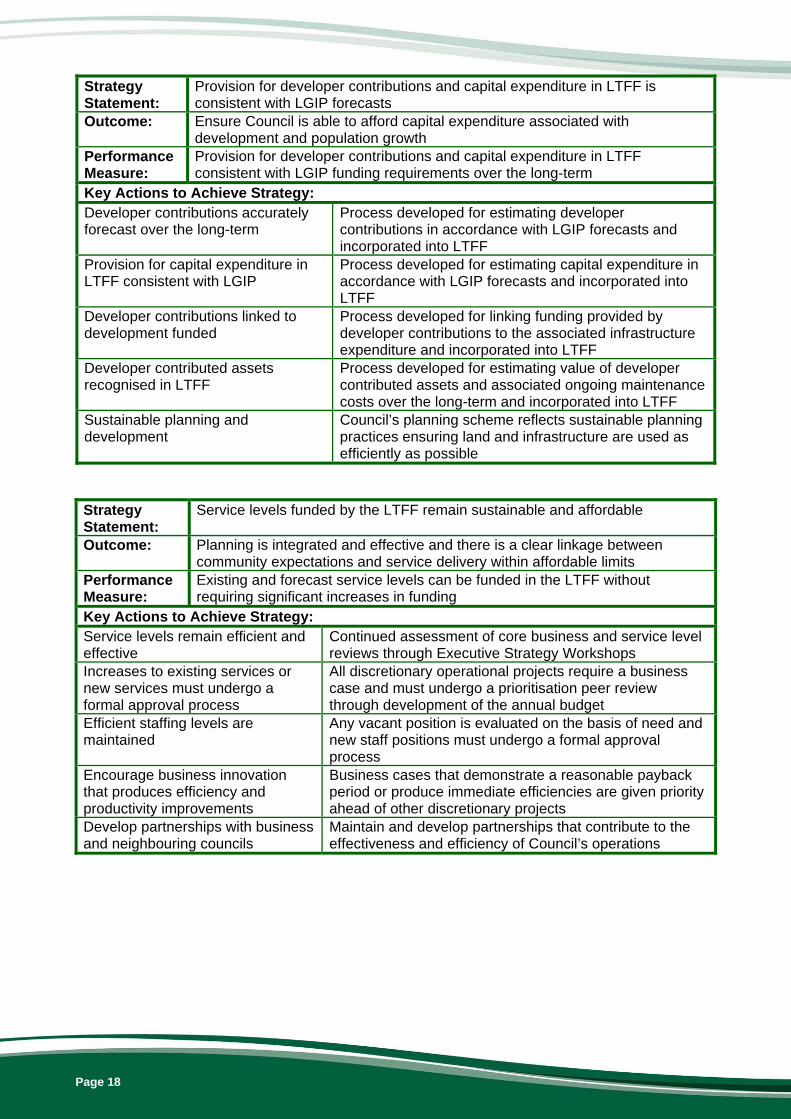
Provision for developer contributions and capital expenditure in LTFF is consistent with LGIP forecasts
Outcome: Ensure Council is able to afford capital expenditure associated with development and population growth
Performance Measure:
Provision for developer contributions and capital expenditure in LTFF consistent with LGIP funding requirements over the long-term
Key Actions to Achieve Strategy: Developer contributions accurately forecast over the long-term
Process developed for estimating developer contributions in accordance with LGIP forecasts and incorporated into LTFF
Provision for capital expenditure in LTFF consistent with LGIP
Process developed for estimating capital expenditure in accordance with LGIP forecasts and incorporated into LTFF
Developer contributions linked to development funded
Process developed for linking funding provided by developer contributions to the associated infrastructure expenditure and incorporated into LTFF
Developer contributed assets recognised in LTFF
Process developed for estimating value of developer contributed assets and associated ongoing maintenance costs over the long-term and incorporated into LTFF
Sustainable planning and development
Council’s planning scheme reflects sustainable planning practices ensuring land and infrastructure are used as efficiently as possible
Strategy Statement:
Service levels funded by the LTFF remain sustainable and affordable
Outcome: Planning is integrated and effective and there is a clear linkage between community expectations and service delivery within affordable limits
Performance Measure:
Existing and forecast service levels can be funded in the LTFF without requiring significant increases in funding
Key Actions to Achieve Strategy: Service levels remain efficient and effective
Continued assessment of core business and service level reviews through Executive Strategy Workshops
Increases to existing services or new services must undergo a formal approval process
All discretionary operational projects require a business case and must undergo a prioritisation peer review through development of the annual budget
Efficient staffing levels are maintained
Any vacant position is evaluated on the basis of need and new staff positions must undergo a formal approval process
Encourage business innovation that produces efficiency and productivity improvements
Business cases that demonstrate a reasonable payback period or produce immediate efficiencies are given priority ahead of other discretionary projects
Develop partnerships with business and neighbouring councils
Maintain and develop partnerships that contribute to the effectiveness and efficiency of Council’s operations
Page 19
Strategy Statement:
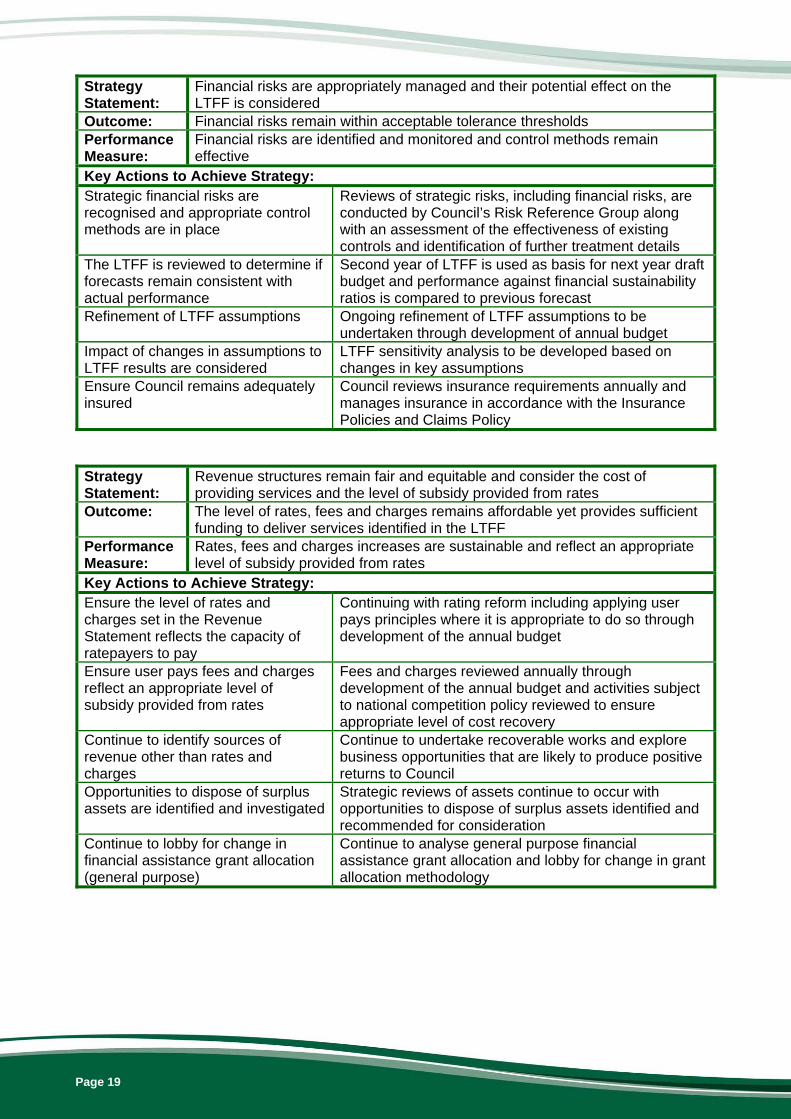
Financial risks are appropriately managed and their potential effect on the LTFF is considered
Outcome: Financial risks remain within acceptable tolerance thresholds Performance Measure:
Financial risks are identified and monitored and control methods remain effective
Key Actions to Achieve Strategy: Strategic financial risks are recognised and appropriate control methods are in place
Reviews of strategic risks, including financial risks, are conducted by Council’s Risk Reference Group along with an assessment of the effectiveness of existing controls and identification of further treatment details
The LTFF is reviewed to determine if forecasts remain consistent with actual performance
Second year of LTFF is used as basis for next year draft budget and performance against financial sustainability ratios is compared to previous forecast
Refinement of LTFF assumptions Ongoing refinement of LTFF assumptions to be undertaken through development of annual budget
Impact of changes in assumptions to LTFF results are considered
LTFF sensitivity analysis to be developed based on changes in key assumptions
Ensure Council remains adequately insured
Council reviews insurance requirements annually and manages insurance in accordance with the Insurance Policies and Claims Policy
Strategy Statement:
Revenue structures remain fair and equitable and consider the cost of providing services and the level of subsidy provided from rates
Outcome: The level of rates, fees and charges remains affordable yet provides sufficient funding to deliver services identified in the LTFF
Performance Measure:
Rates, fees and charges increases are sustainable and reflect an appropriate level of subsidy provided from rates
Key Actions to Achieve Strategy: Ensure the level of rates and charges set in the Revenue Statement reflects the capacity of ratepayers to pay
Continuing with rating reform including applying user pays principles where it is appropriate to do so through development of the annual budget
Ensure user pays fees and charges reflect an appropriate level of subsidy provided from rates
Fees and charges reviewed annually through development of the annual budget and activities subject to national competition policy reviewed to ensure appropriate level of cost recovery
Continue to identify sources of revenue other than rates and charges
Continue to undertake recoverable works and explore business opportunities that are likely to produce positive returns to Council
Opportunities to dispose of surplus assets are identified and investigated
Strategic reviews of assets continue to occur with opportunities to dispose of surplus assets identified and recommended for consideration
Continue to lobby for change in financial assistance grant allocation (general purpose)
Continue to analyse general purpose financial assistance grant allocation and lobby for change in grant allocation methodology
Page 20
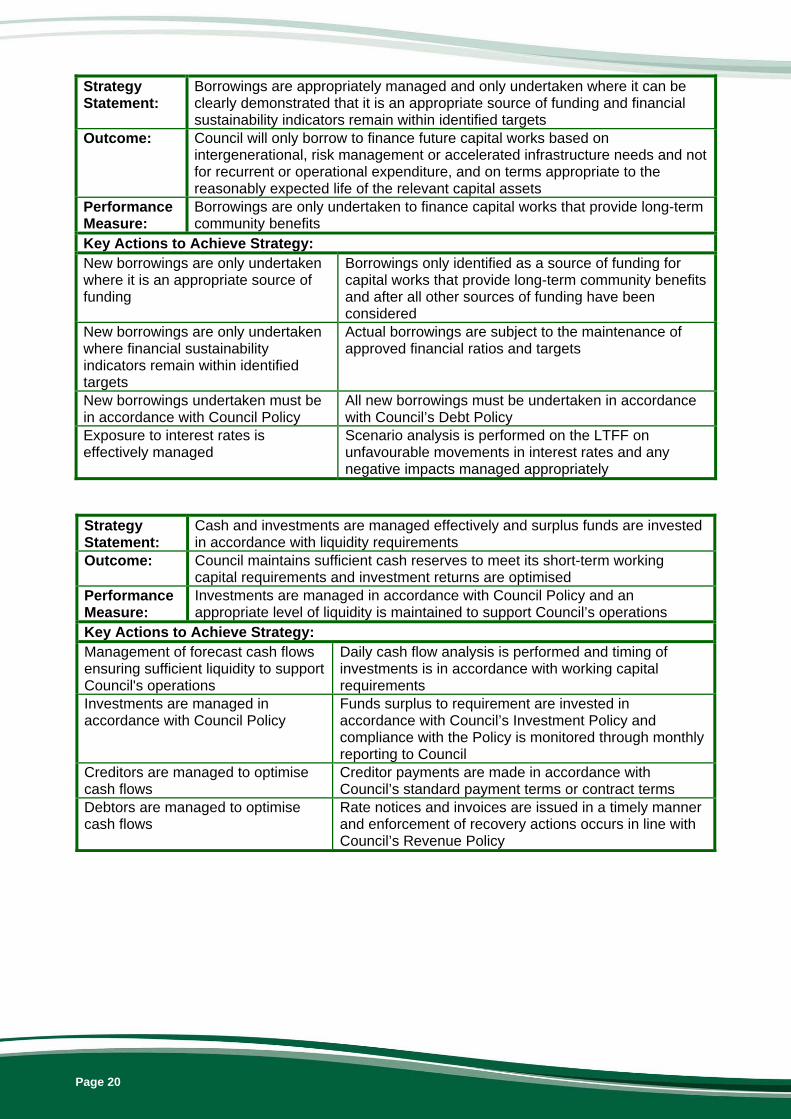
Strategy Statement:
Borrowings are appropriately managed and only undertaken where it can be clearly demonstrated that it is an appropriate source of funding and financial sustainability indicators remain within identified targets
Outcome: Council will only borrow to finance future capital works based on intergenerational, risk management or accelerated infrastructure needs and not for recurrent or operational expenditure, and on terms appropriate to the reasonably expected life of the relevant capital assets
Performance Measure:
Borrowings are only undertaken to finance capital works that provide long-term community benefits
Key Actions to Achieve Strategy: New borrowings are only undertaken where it is an appropriate source of funding
Borrowings only identified as a source of funding for capital works that provide long-term community benefits and after all other sources of funding have been considered
New borrowings are only undertaken where financial sustainability indicators remain within identified targets
Actual borrowings are subject to the maintenance of approved financial ratios and targets
New borrowings undertaken must be in accordance with Council Policy
All new borrowings must be undertaken in accordance with Council’s Debt Policy
Exposure to interest rates is effectively managed
Scenario analysis is performed on the LTFF on unfavourable movements in interest rates and any negative impacts managed appropriately
Strategy Statement:
Cash and investments are managed effectively and surplus funds are invested in accordance with liquidity requirements
Outcome: Council maintains sufficient cash reserves to meet its short-term working capital requirements and investment returns are optimised
Performance Measure:
Investments are managed in accordance with Council Policy and an appropriate level of liquidity is maintained to support Council’s operations
Key Actions to Achieve Strategy: Management of forecast cash flows ensuring sufficient liquidity to support Council's operations
Daily cash flow analysis is performed and timing of investments is in accordance with working capital requirements
Investments are managed in accordance with Council Policy
Funds surplus to requirement are invested in accordance with Council’s Investment Policy and compliance with the Policy is monitored through monthly reporting to Council
Creditors are managed to optimise cash flows
Creditor payments are made in accordance with Council’s standard payment terms or contract terms
Debtors are managed to optimise cash flows
Rate notices and invoices are issued in a timely manner and enforcement of recovery actions occurs in line with Council’s Revenue Policy
Page 21
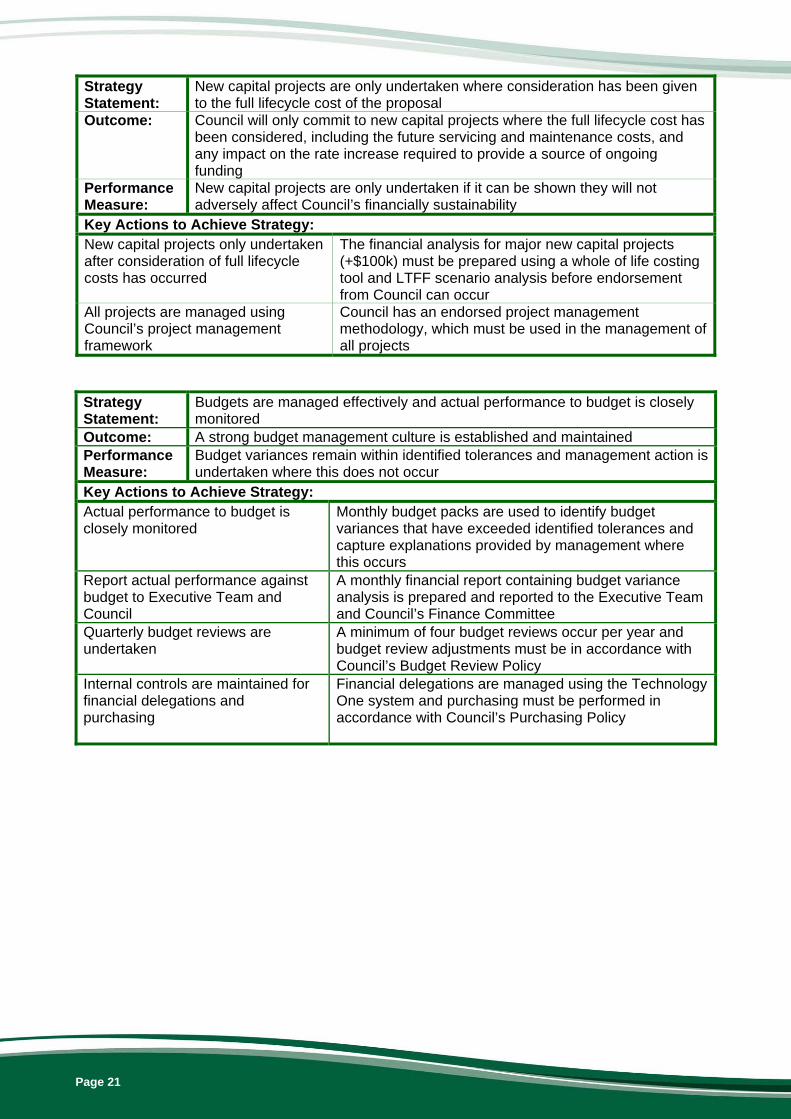
Strategy Statement:
New capital projects are only undertaken where consideration has been given to the full lifecycle cost of the proposal
Outcome: Council will only commit to new capital projects where the full lifecycle cost has been considered, including the future servicing and maintenance costs, and any impact on the rate increase required to provide a source of ongoing funding
Performance Measure:
New capital projects are only undertaken if it can be shown they will not adversely affect Council’s financially sustainability
Key Actions to Achieve Strategy: New capital projects only undertaken after consideration of full lifecycle costs has occurred
The financial analysis for major new capital projects (+$100k) must be prepared using a whole of life costing tool and LTFF scenario analysis before endorsement from Council can occur
All projects are managed using Council’s project management framework
Council has an endorsed project management methodology, which must be used in the management of all projects
Strategy Statement:
Budgets are managed effectively and actual performance to budget is closely monitored
Outcome: A strong budget management culture is established and maintained Performance Measure:
Budget variances remain within identified tolerances and management action is undertaken where this does not occur
Key Actions to Achieve Strategy: Actual performance to budget is closely monitored
Monthly budget packs are used to identify budget variances that have exceeded identified tolerances and capture explanations provided by management where this occurs
Report actual performance against budget to Executive Team and Council
A monthly financial report containing budget variance analysis is prepared and reported to the Executive Team and Council’s Finance Committee
Quarterly budget reviews are undertaken
A minimum of four budget reviews occur per year and budget review adjustments must be in accordance with Council’s Budget Review Policy
Internal controls are maintained for financial delegations and purchasing
Financial delegations are managed using the Technology One system and purchasing must be performed in accordance with Council’s Purchasing Policy
Page 22
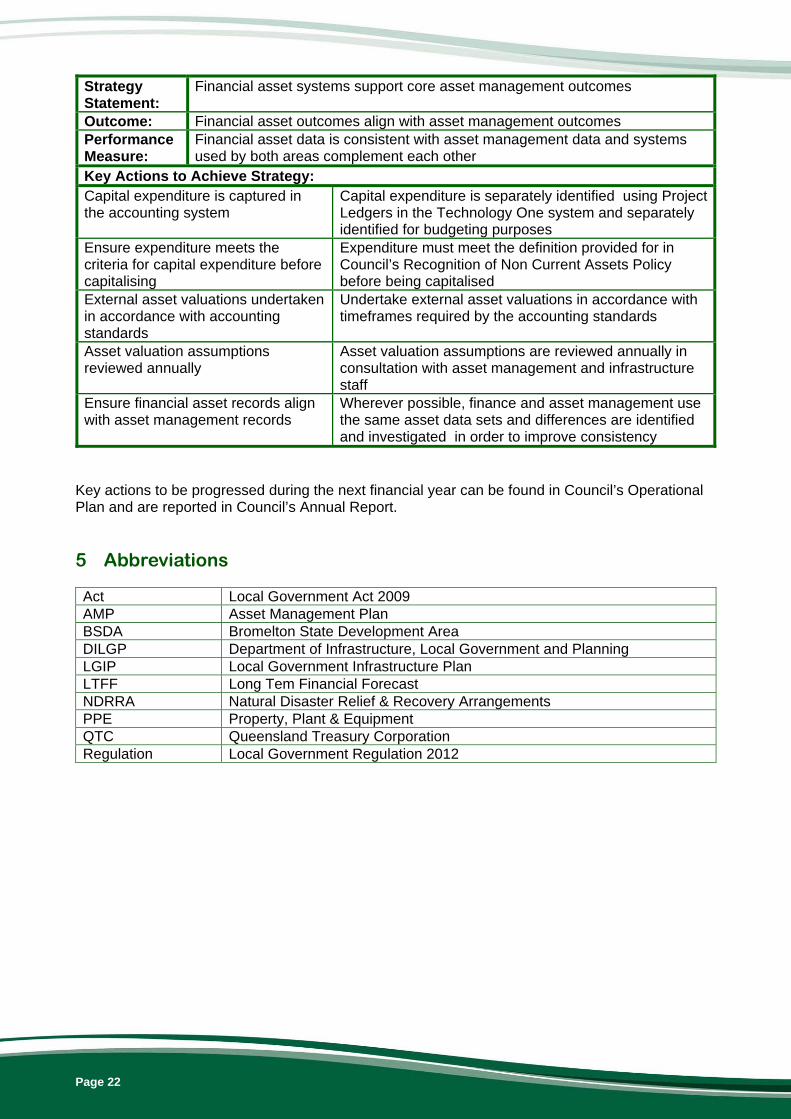
Strategy Statement:
Financial asset systems support core asset management outcomes
Outcome: Financial asset outcomes align with asset management outcomes Performance Measure:
Financial asset data is consistent with asset management data and systems used by both areas complement each other
Key Actions to Achieve Strategy: Capital expenditure is captured in the accounting system
Capital expenditure is separately identified using Project Ledgers in the Technology One system and separately identified for budgeting purposes
Ensure expenditure meets the criteria for capital expenditure before capitalising
Expenditure must meet the definition provided for in Council’s Recognition of Non Current Assets Policy before being capitalised
External asset valuations undertaken in accordance with accounting standards
Undertake external asset valuations in accordance with timeframes required by the accounting standards
Asset valuation assumptions reviewed annually
Asset valuation assumptions are reviewed annually in consultation with asset management and infrastructure staff
Ensure financial asset records align with asset management records
Wherever possible, finance and asset management use the same asset data sets and differences are identified and investigated in order to improve consistency
Key actions to be progressed during the next financial year can be found in Council’s Operational Plan and are reported in Council’s Annual Report.
5 Abbreviations Act Local Government Act 2009 AMP Asset Management Plan BSDA Bromelton State Development Area DILGP Department of Infrastructure, Local Government and Planning LGIP Local Government Infrastructure Plan LTFF Long Tem Financial Forecast NDRRA Natural Disaster Relief & Recovery Arrangements PPE Property, Plant & Equipment QTC Queensland Treasury Corporation Regulation Local Government Regulation 2012
Page 23
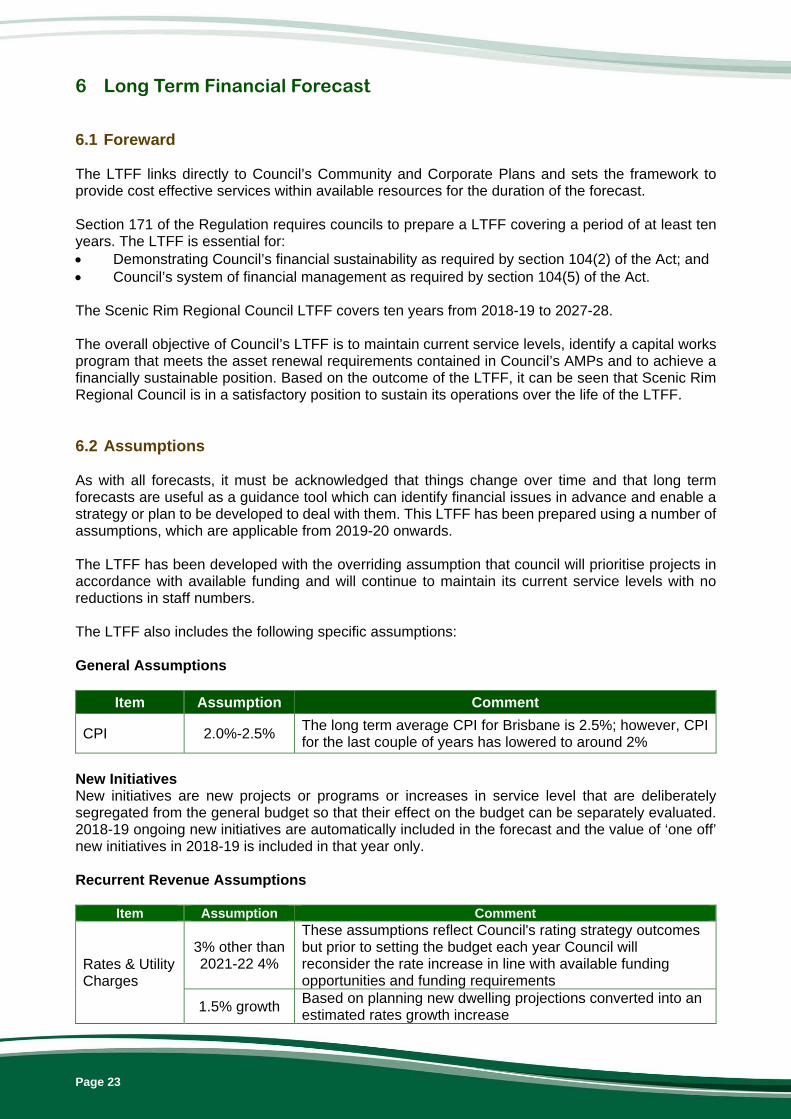
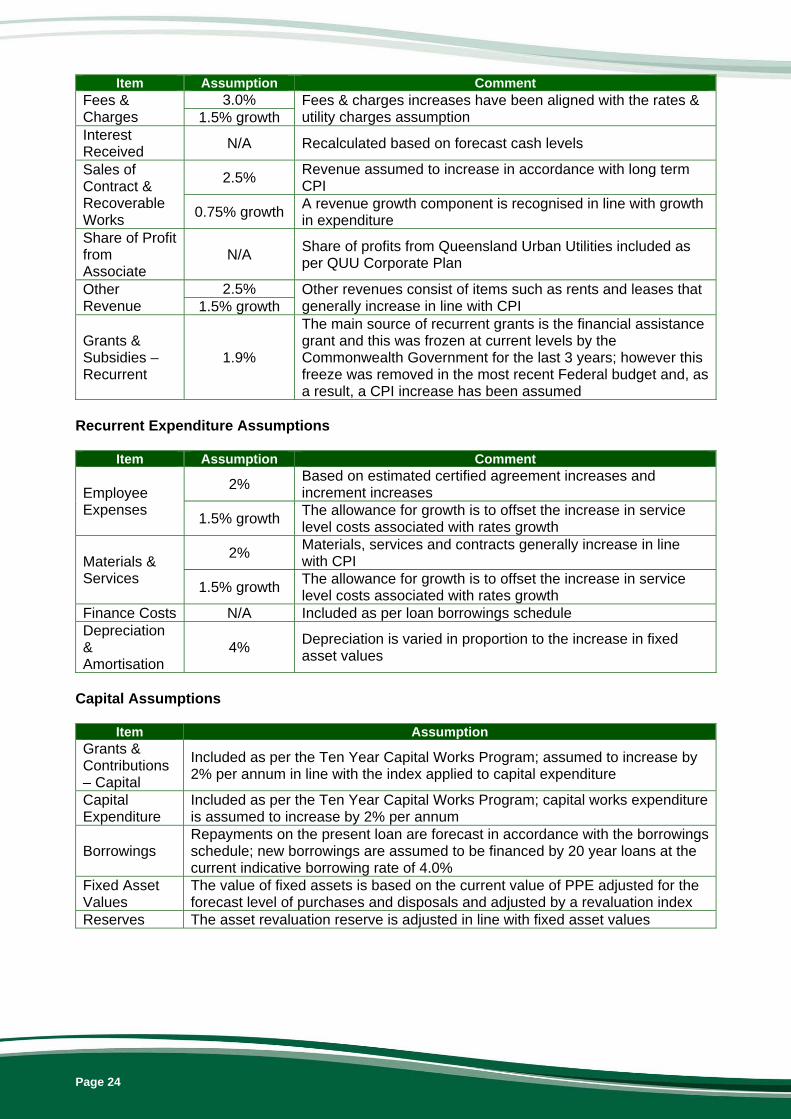
6 Long Term Financial Forecast 6.1 Foreward The LTFF links directly to Council’s Community and Corporate Plans and sets the framework to provide cost effective services within available resources for the duration of the forecast. Section 171 of the Regulation requires councils to prepare a LTFF covering a period of at least ten years. The LTFF is essential for: Demonstrating Council’s financial sustainability as required by section 104(2) of the Act; and Council’s system of financial management as required by section 104(5) of the Act. The Scenic Rim Regional Council LTFF covers ten years from 2018-19 to 2027-28. The overall objective of Council’s LTFF is to maintain current service levels, identify a capital works program that meets the asset renewal requirements contained in Council’s AMPs and to achieve a financially sustainable position. Based on the outcome of the LTFF, it can be seen that Scenic Rim Regional Council is in a satisfactory position to sustain its operations over the life of the LTFF. 6.2 Assumptions As with all forecasts, it must be acknowledged that things change over time and that long term forecasts are useful as a guidance tool which can identify financial issues in advance and enable a strategy or plan to be developed to deal with them. This LTFF has been prepared using a number of assumptions, which are applicable from 2019-20 onwards. The LTFF has been developed with the overriding assumption that council will prioritise projects in accordance with available funding and will continue to maintain its current service levels with no reductions in staff numbers. The LTFF also includes the following specific assumptions: General Assumptions
Item Assumption Comment
CPI 2.0%-2.5% The long term average CPI for Brisbane is 2.5%; however, CPI for the last couple of years has lowered to around 2%
New Initiatives New initiatives are new projects or programs or increases in service level that are deliberately segregated from the general budget so that their effect on the budget can be separately evaluated. 2018-19 ongoing new initiatives are automatically included in the forecast and the value of ‘one off’ new initiatives in 2018-19 is included in that year only. Recurrent Revenue Assumptions
Item Assumption Comment
Rates & Utility Charges
3% other than 2021-22 4%
These assumptions reflect Council's rating strategy outcomes but prior to setting the budget each year Council will reconsider the rate increase in line with available funding opportunities and funding requirements
1.5% growth Based on planning new dwelling projections converted into an estimated rates growth increase
Page 24
Item Assumption Comment Fees & Charges
3.0% Fees & charges increases have been aligned with the rates & utility charges assumption 1.5% growth
Interest Received
N/A Recalculated based on forecast cash levels
Sales of Contract & Recoverable Works
2.5% Revenue assumed to increase in accordance with long term CPI
0.75% growth A revenue growth component is recognised in line with growth in expenditure
Share of Profit from Associate
N/A Share of profits from Queensland Urban Utilities included as per QUU Corporate Plan
Other Revenue
2.5% Other revenues consist of items such as rents and leases that generally increase in line with CPI 1.5% growth
Grants & Subsidies – Recurrent
1.9%
The main source of recurrent grants is the financial assistance grant and this was frozen at current levels by the Commonwealth Government for the last 3 years; however this freeze was removed in the most recent Federal budget and, as a result, a CPI increase has been assumed
Recurrent Expenditure Assumptions
Item Assumption Comment
Employee Expenses
2% Based on estimated certified agreement increases and increment increases
1.5% growth The allowance for growth is to offset the increase in service level costs associated with rates growth
Materials & Services
2% Materials, services and contracts generally increase in line with CPI
1.5% growth The allowance for growth is to offset the increase in service level costs associated with rates growth
Finance Costs N/A Included as per loan borrowings schedule Depreciation & Amortisation
4% Depreciation is varied in proportion to the increase in fixed asset values
Capital Assumptions
Item Assumption Grants & Contributions – Capital
Included as per the Ten Year Capital Works Program; assumed to increase by 2% per annum in line with the index applied to capital expenditure
Capital Expenditure
Included as per the Ten Year Capital Works Program; capital works expenditure is assumed to increase by 2% per annum
Borrowings Repayments on the present loan are forecast in accordance with the borrowings schedule; new borrowings are assumed to be financed by 20 year loans at the current indicative borrowing rate of 4.0%
Fixed Asset Values
The value of fixed assets is based on the current value of PPE adjusted for the forecast level of purchases and disposals and adjusted by a revaluation index
Reserves The asset revaluation reserve is adjusted in line with fixed asset values
Page 25
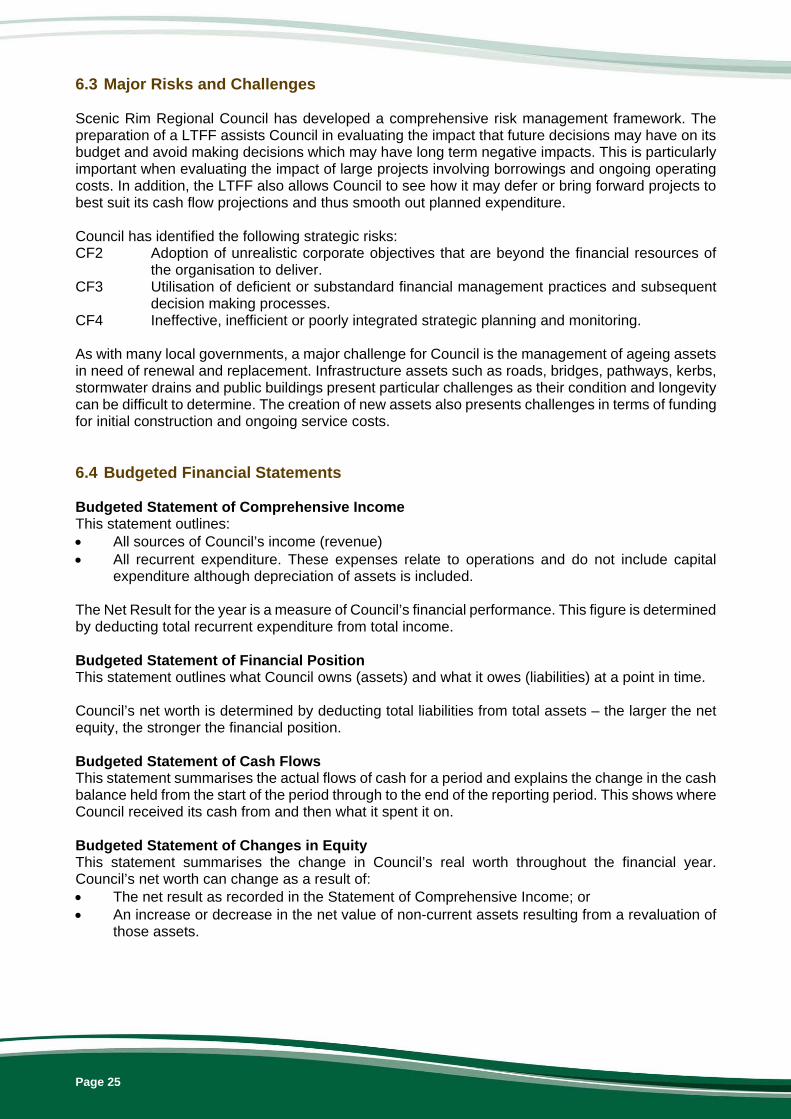
6.3 Major Risks and Challenges Scenic Rim Regional Council has developed a comprehensive risk management framework. The preparation of a LTFF assists Council in evaluating the impact that future decisions may have on its budget and avoid making decisions which may have long term negative impacts. This is particularly important when evaluating the impact of large projects involving borrowings and ongoing operating costs. In addition, the LTFF also allows Council to see how it may defer or bring forward projects to best suit its cash flow projections and thus smooth out planned expenditure. Council has identified the following strategic risks: CF2 Adoption of unrealistic corporate objectives that are beyond the financial resources of
the organisation to deliver. CF3 Utilisation of deficient or substandard financial management practices and subsequent
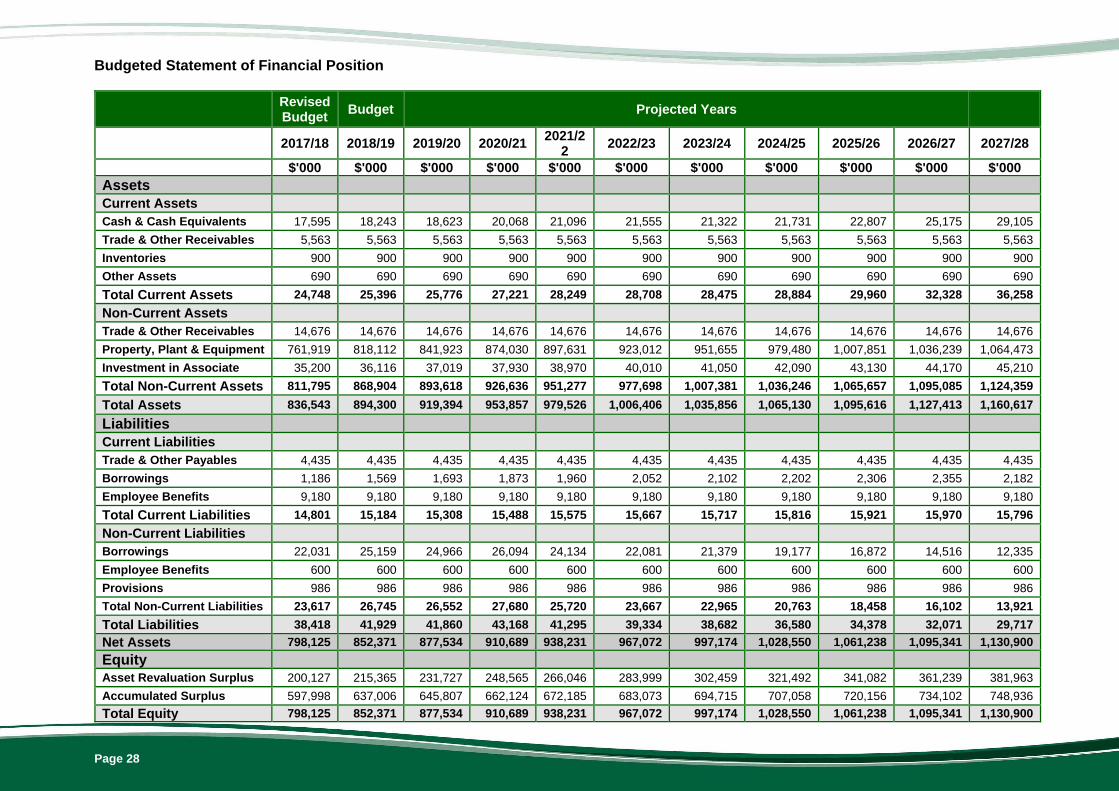
decision making processes. CF4 Ineffective, inefficient or poorly integrated strategic planning and monitoring. As with many local governments, a major challenge for Council is the management of ageing assets in need of renewal and replacement. Infrastructure assets such as roads, bridges, pathways, kerbs, stormwater drains and public buildings present particular challenges as their condition and longevity can be difficult to determine. The creation of new assets also presents challenges in terms of funding for initial construction and ongoing service costs. 6.4 Budgeted Financial Statements Budgeted Statement of Comprehensive Income This statement outlines: All sources of Council’s income (revenue) All recurrent expenditure. These expenses relate to operations and do not include capital
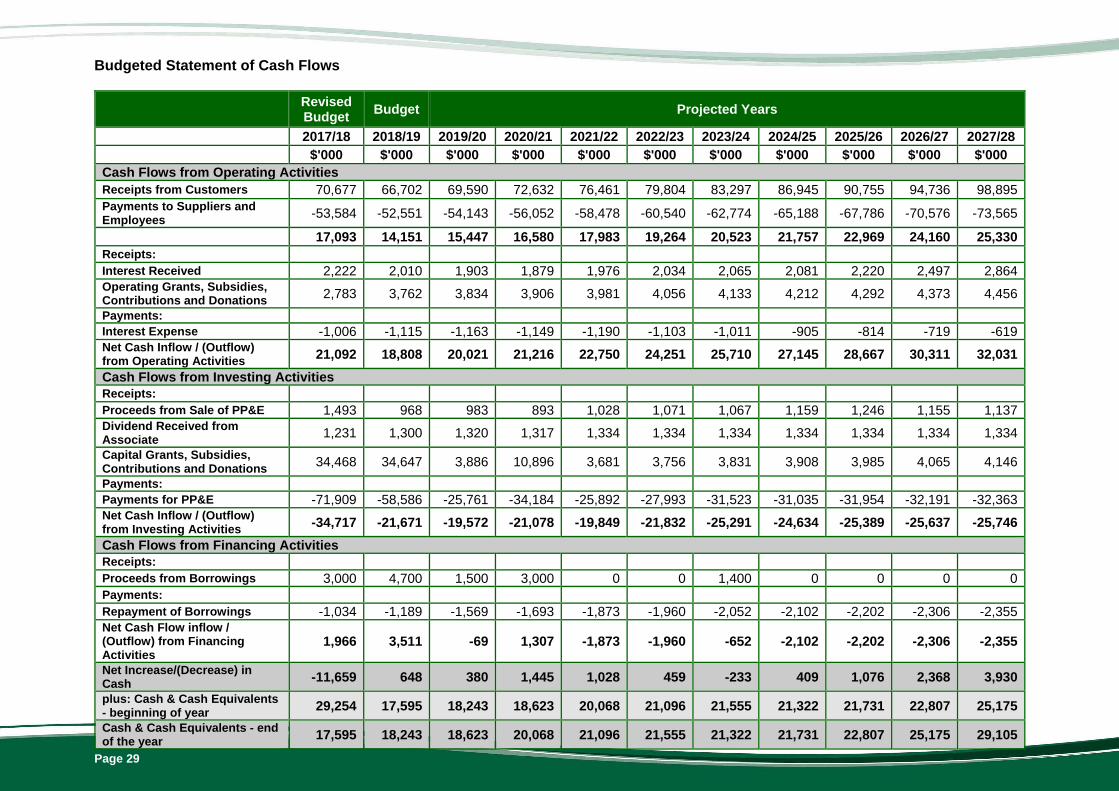
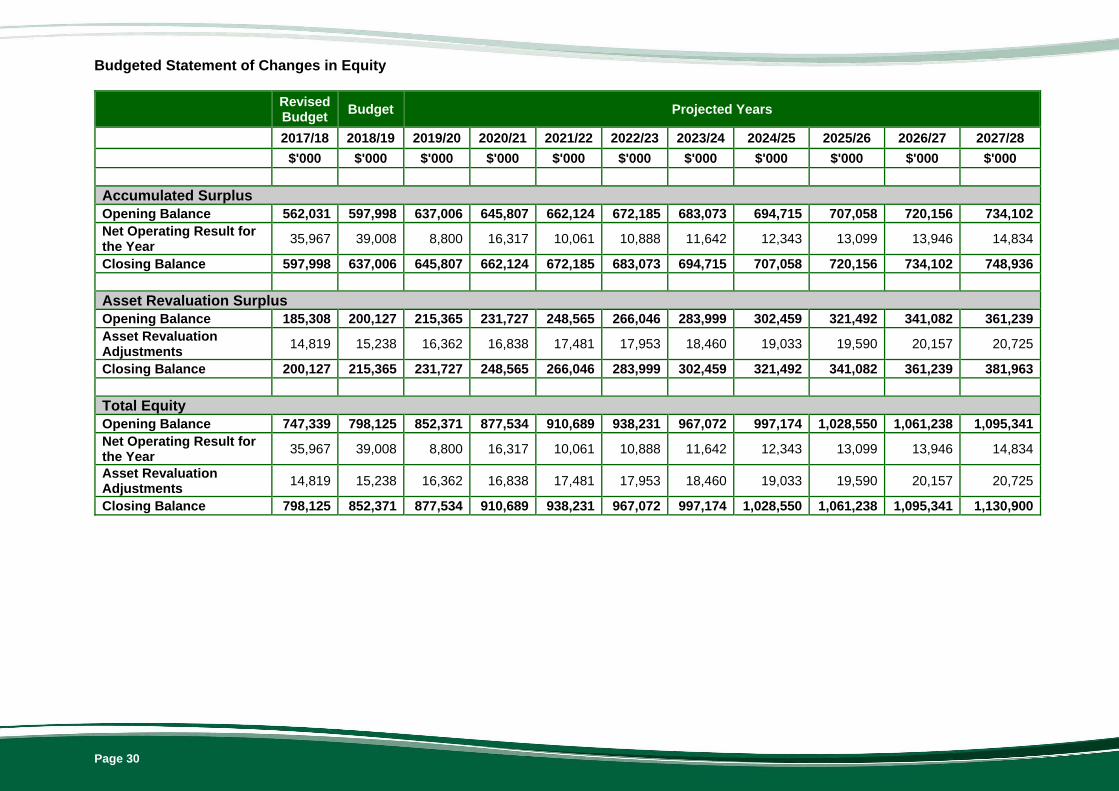
expenditure although depreciation of assets is included. The Net Result for the year is a measure of Council’s financial performance. This figure is determined by deducting total recurrent expenditure from total income. Budgeted Statement of Financial Position This statement outlines what Council owns (assets) and what it owes (liabilities) at a point in time. Council’s net worth is determined by deducting total liabilities from total assets – the larger the net equity, the stronger the financial position. Budgeted Statement of Cash Flows This statement summarises the actual flows of cash for a period and explains the change in the cash balance held from the start of the period through to the end of the reporting period. This shows where Council received its cash from and then what it spent it on. Budgeted Statement of Changes in Equity This statement summarises the change in Council’s real worth throughout the financial year. Council’s net worth can change as a result of: The net result as recorded in the Statement of Comprehensive Income; or An increase or decrease in the net value of non-current assets resulting from a revaluation of
those assets.
Page 26
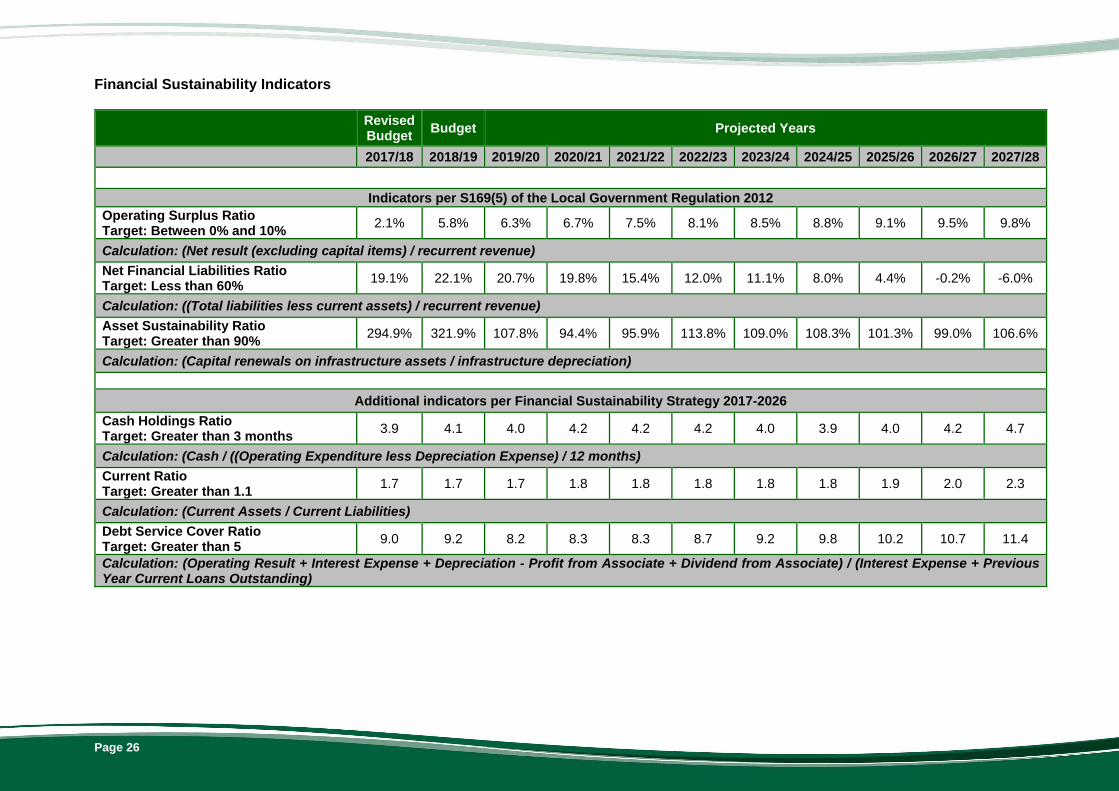
Financial Sustainability Indicators
Revised Budget
Budget Projected Years
2017/18 2018/19 2019/20 2020/21 2021/22 2022/23 2023/24 2024/25 2025/26 2026/27 2027/28
Indicators per S169(5) of the Local Government Regulation 2012 Operating Surplus Ratio Target: Between 0% and 10%
2.1% 5.8% 6.3% 6.7% 7.5% 8.1% 8.5% 8.8% 9.1% 9.5% 9.8%
Calculation: (Net result (excluding capital items) / recurrent revenue) Net Financial Liabilities Ratio Target: Less than 60%
19.1% 22.1% 20.7% 19.8% 15.4% 12.0% 11.1% 8.0% 4.4% -0.2% -6.0%
Calculation: ((Total liabilities less current assets) / recurrent revenue) Asset Sustainability Ratio Target: Greater than 90%
294.9% 321.9% 107.8% 94.4% 95.9% 113.8% 109.0% 108.3% 101.3% 99.0% 106.6%
Calculation: (Capital renewals on infrastructure assets / infrastructure depreciation)
Additional indicators per Financial Sustainability Strategy 2017-2026
Cash Holdings Ratio Target: Greater than 3 months
3.9 4.1 4.0 4.2 4.2 4.2 4.0 3.9 4.0 4.2 4.7
Calculation: (Cash / ((Operating Expenditure less Depreciation Expense) / 12 months) Current Ratio Target: Greater than 1.1
1.7 1.7 1.7 1.8 1.8 1.8 1.8 1.8 1.9 2.0 2.3
Calculation: (Current Assets / Current Liabilities) Debt Service Cover Ratio Target: Greater than 5
9.0 9.2 8.2 8.3 8.3 8.7 9.2 9.8 10.2 10.7 11.4
Calculation: (Operating Result + Interest Expense + Depreciation - Profit from Associate + Dividend from Associate) / (Interest Expense + Previous Year Current Loans Outstanding)
Page 27
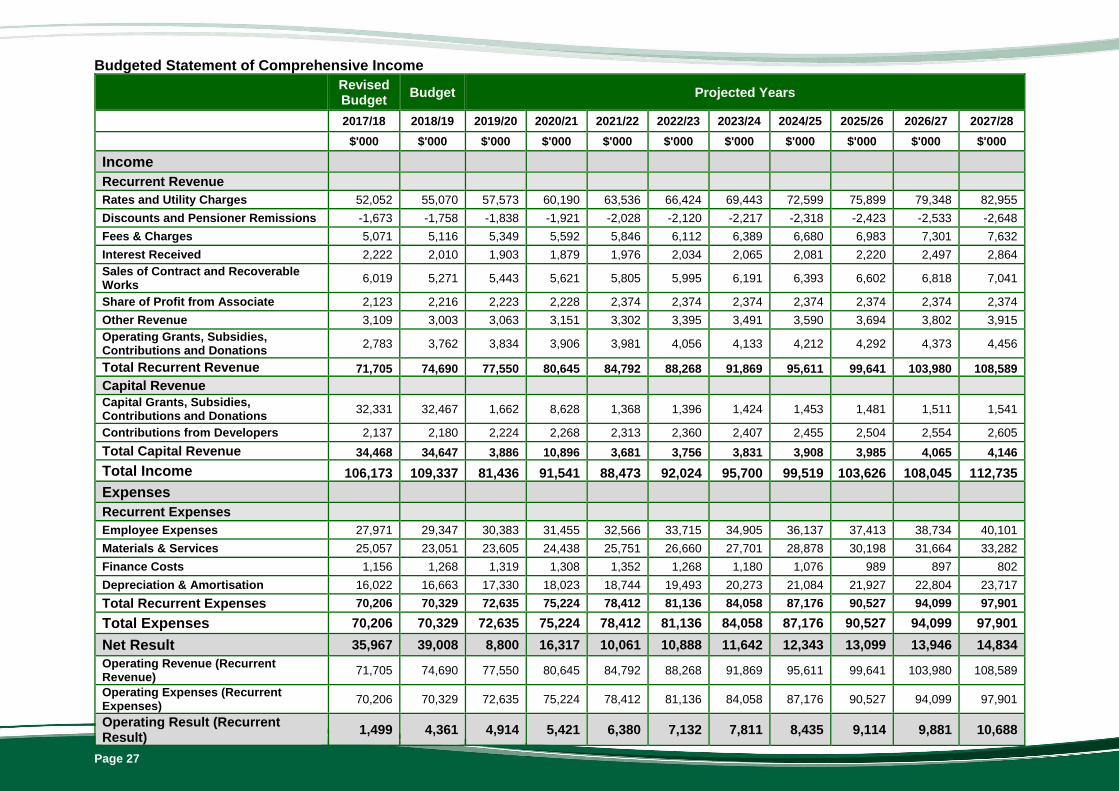
Budgeted Statement of Comprehensive Income
Revised Budget
Budget Projected Years
2017/18 2018/19 2019/20 2020/21 2021/22 2022/23 2023/24 2024/25 2025/26 2026/27 2027/28
$'000 $'000 $'000 $'000 $'000 $'000 $'000 $'000 $'000 $'000 $'000
Income
Recurrent Revenue
Rates and Utility Charges 52,052 55,070 57,573 60,190 63,536 66,424 69,443 72,599 75,899 79,348 82,955
Discounts and Pensioner Remissions -1,673 -1,758 -1,838 -1,921 -2,028 -2,120 -2,217 -2,318 -2,423 -2,533 -2,648
Fees & Charges 5,071 5,116 5,349 5,592 5,846 6,112 6,389 6,680 6,983 7,301 7,632
Interest Received 2,222 2,010 1,903 1,879 1,976 2,034 2,065 2,081 2,220 2,497 2,864 Sales of Contract and Recoverable Works
6,019 5,271 5,443 5,621 5,805 5,995 6,191 6,393 6,602 6,818 7,041
Share of Profit from Associate 2,123 2,216 2,223 2,228 2,374 2,374 2,374 2,374 2,374 2,374 2,374
Other Revenue 3,109 3,003 3,063 3,151 3,302 3,395 3,491 3,590 3,694 3,802 3,915 Operating Grants, Subsidies, Contributions and Donations
2,783 3,762 3,834 3,906 3,981 4,056 4,133 4,212 4,292 4,373 4,456
Total Recurrent Revenue 71,705 74,690 77,550 80,645 84,792 88,268 91,869 95,611 99,641 103,980 108,589
Capital Revenue
Capital Grants, Subsidies, Contributions and Donations
32,331 32,467 1,662 8,628 1,368 1,396 1,424 1,453 1,481 1,511 1,541
Contributions from Developers 2,137 2,180 2,224 2,268 2,313 2,360 2,407 2,455 2,504 2,554 2,605
Total Capital Revenue 34,468 34,647 3,886 10,896 3,681 3,756 3,831 3,908 3,985 4,065 4,146
Total Income 106,173 109,337 81,436 91,541 88,473 92,024 95,700 99,519 103,626 108,045 112,735
Expenses
Recurrent Expenses
Employee Expenses 27,971 29,347 30,383 31,455 32,566 33,715 34,905 36,137 37,413 38,734 40,101
Materials & Services 25,057 23,051 23,605 24,438 25,751 26,660 27,701 28,878 30,198 31,664 33,282
Finance Costs 1,156 1,268 1,319 1,308 1,352 1,268 1,180 1,076 989 897 802
Depreciation & Amortisation 16,022 16,663 17,330 18,023 18,744 19,493 20,273 21,084 21,927 22,804 23,717
Total Recurrent Expenses 70,206 70,329 72,635 75,224 78,412 81,136 84,058 87,176 90,527 94,099 97,901
Total Expenses 70,206 70,329 72,635 75,224 78,412 81,136 84,058 87,176 90,527 94,099 97,901
Net Result 35,967 39,008 8,800 16,317 10,061 10,888 11,642 12,343 13,099 13,946 14,834 Operating Revenue (Recurrent Revenue)
71,705 74,690 77,550 80,645 84,792 88,268 91,869 95,611 99,641 103,980 108,589
Operating Expenses (Recurrent Expenses)
70,206 70,329 72,635 75,224 78,412 81,136 84,058 87,176 90,527 94,099 97,901
Operating Result (Recurrent Result)
1,499 4,361 4,914 5,421 6,380 7,132 7,811 8,435 9,114 9,881 10,688
Page 28
Budgeted Statement of Financial Position
Revised Budget
Budget Projected Years
2017/18 2018/19 2019/20 2020/21 2021/2
2 2022/23 2023/24 2024/25 2025/26 2026/27 2027/28
$'000 $'000 $'000 $'000 $'000 $'000 $'000 $'000 $'000 $'000 $'000 Assets Current Assets Cash & Cash Equivalents 17,595 18,243 18,623 20,068 21,096 21,555 21,322 21,731 22,807 25,175 29,105
Trade & Other Receivables 5,563 5,563 5,563 5,563 5,563 5,563 5,563 5,563 5,563 5,563 5,563
Inventories 900 900 900 900 900 900 900 900 900 900 900
Other Assets 690 690 690 690 690 690 690 690 690 690 690
Total Current Assets 24,748 25,396 25,776 27,221 28,249 28,708 28,475 28,884 29,960 32,328 36,258
Non-Current Assets
Trade & Other Receivables 14,676 14,676 14,676 14,676 14,676 14,676 14,676 14,676 14,676 14,676 14,676
Property, Plant & Equipment 761,919 818,112 841,923 874,030 897,631 923,012 951,655 979,480 1,007,851 1,036,239 1,064,473
Investment in Associate 35,200 36,116 37,019 37,930 38,970 40,010 41,050 42,090 43,130 44,170 45,210
Total Non-Current Assets 811,795 868,904 893,618 926,636 951,277 977,698 1,007,381 1,036,246 1,065,657 1,095,085 1,124,359
Total Assets 836,543 894,300 919,394 953,857 979,526 1,006,406 1,035,856 1,065,130 1,095,616 1,127,413 1,160,617
Liabilities
Current Liabilities
Trade & Other Payables 4,435 4,435 4,435 4,435 4,435 4,435 4,435 4,435 4,435 4,435 4,435
Borrowings 1,186 1,569 1,693 1,873 1,960 2,052 2,102 2,202 2,306 2,355 2,182
Employee Benefits 9,180 9,180 9,180 9,180 9,180 9,180 9,180 9,180 9,180 9,180 9,180
Total Current Liabilities 14,801 15,184 15,308 15,488 15,575 15,667 15,717 15,816 15,921 15,970 15,796
Non-Current Liabilities
Borrowings 22,031 25,159 24,966 26,094 24,134 22,081 21,379 19,177 16,872 14,516 12,335
Employee Benefits 600 600 600 600 600 600 600 600 600 600 600
Provisions 986 986 986 986 986 986 986 986 986 986 986
Total Non-Current Liabilities 23,617 26,745 26,552 27,680 25,720 23,667 22,965 20,763 18,458 16,102 13,921
Total Liabilities 38,418 41,929 41,860 43,168 41,295 39,334 38,682 36,580 34,378 32,071 29,717
Net Assets 798,125 852,371 877,534 910,689 938,231 967,072 997,174 1,028,550 1,061,238 1,095,341 1,130,900
Equity
Asset Revaluation Surplus 200,127 215,365 231,727 248,565 266,046 283,999 302,459 321,492 341,082 361,239 381,963
Accumulated Surplus 597,998 637,006 645,807 662,124 672,185 683,073 694,715 707,058 720,156 734,102 748,936
Total Equity 798,125 852,371 877,534 910,689 938,231 967,072 997,174 1,028,550 1,061,238 1,095,341 1,130,900
Page 29
Budgeted Statement of Cash Flows
Revised Budget
Budget Projected Years
2017/18 2018/19 2019/20 2020/21 2021/22 2022/23 2023/24 2024/25 2025/26 2026/27 2027/28 $'000 $'000 $'000 $'000 $'000 $'000 $'000 $'000 $'000 $'000 $'000 Cash Flows from Operating Activities Receipts from Customers 70,677 66,702 69,590 72,632 76,461 79,804 83,297 86,945 90,755 94,736 98,895 Payments to Suppliers and Employees -53,584 -52,551 -54,143 -56,052 -58,478 -60,540 -62,774 -65,188 -67,786 -70,576 -73,565
17,093 14,151 15,447 16,580 17,983 19,264 20,523 21,757 22,969 24,160 25,330 Receipts:
Interest Received 2,222 2,010 1,903 1,879 1,976 2,034 2,065 2,081 2,220 2,497 2,864 Operating Grants, Subsidies, Contributions and Donations 2,783 3,762 3,834 3,906 3,981 4,056 4,133 4,212 4,292 4,373 4,456
Payments:
Interest Expense -1,006 -1,115 -1,163 -1,149 -1,190 -1,103 -1,011 -905 -814 -719 -619 Net Cash Inflow / (Outflow) from Operating Activities 21,092 18,808 20,021 21,216 22,750 24,251 25,710 27,145 28,667 30,311 32,031
Cash Flows from Investing Activities Receipts:
Proceeds from Sale of PP&E 1,493 968 983 893 1,028 1,071 1,067 1,159 1,246 1,155 1,137 Dividend Received from Associate 1,231 1,300 1,320 1,317 1,334 1,334 1,334 1,334 1,334 1,334 1,334
Capital Grants, Subsidies, Contributions and Donations 34,468 34,647 3,886 10,896 3,681 3,756 3,831 3,908 3,985 4,065 4,146
Payments:
Payments for PP&E -71,909 -58,586 -25,761 -34,184 -25,892 -27,993 -31,523 -31,035 -31,954 -32,191 -32,363 Net Cash Inflow / (Outflow) from Investing Activities -34,717 -21,671 -19,572 -21,078 -19,849 -21,832 -25,291 -24,634 -25,389 -25,637 -25,746
Cash Flows from Financing Activities Receipts:
Proceeds from Borrowings 3,000 4,700 1,500 3,000 0 0 1,400 0 0 0 0 Payments:
Repayment of Borrowings -1,034 -1,189 -1,569 -1,693 -1,873 -1,960 -2,052 -2,102 -2,202 -2,306 -2,355 Net Cash Flow inflow / (Outflow) from Financing Activities
1,966 3,511 -69 1,307 -1,873 -1,960 -652 -2,102 -2,202 -2,306 -2,355
Net Increase/(Decrease) in Cash -11,659 648 380 1,445 1,028 459 -233 409 1,076 2,368 3,930
plus: Cash & Cash Equivalents - beginning of year 29,254 17,595 18,243 18,623 20,068 21,096 21,555 21,322 21,731 22,807 25,175
Cash & Cash Equivalents - end of the year 17,595 18,243 18,623 20,068 21,096 21,555 21,322 21,731 22,807 25,175 29,105
Page 30
Budgeted Statement of Changes in Equity
Revised Budget
Budget Projected Years
2017/18 2018/19 2019/20 2020/21 2021/22 2022/23 2023/24 2024/25 2025/26 2026/27 2027/28
$'000 $'000 $'000 $'000 $'000 $'000 $'000 $'000 $'000 $'000 $'000
Accumulated Surplus Opening Balance 562,031 597,998 637,006 645,807 662,124 672,185 683,073 694,715 707,058 720,156 734,102 Net Operating Result for the Year
35,967 39,008 8,800 16,317 10,061 10,888 11,642 12,343 13,099 13,946 14,834
Closing Balance 597,998 637,006 645,807 662,124 672,185 683,073 694,715 707,058 720,156 734,102 748,936
Asset Revaluation Surplus Opening Balance 185,308 200,127 215,365 231,727 248,565 266,046 283,999 302,459 321,492 341,082 361,239 Asset Revaluation Adjustments
14,819 15,238 16,362 16,838 17,481 17,953 18,460 19,033 19,590 20,157 20,725
Closing Balance 200,127 215,365 231,727 248,565 266,046 283,999 302,459 321,492 341,082 361,239 381,963
Total Equity Opening Balance 747,339 798,125 852,371 877,534 910,689 938,231 967,072 997,174 1,028,550 1,061,238 1,095,341 Net Operating Result for the Year
35,967 39,008 8,800 16,317 10,061 10,888 11,642 12,343 13,099 13,946 14,834
Asset Revaluation Adjustments
14,819 15,238 16,362 16,838 17,481 17,953 18,460 19,033 19,590 20,157 20,725
Closing Balance 798,125 852,371 877,534 910,689 938,231 967,072 997,174 1,028,550 1,061,238 1,095,341 1,130,900
Page 31
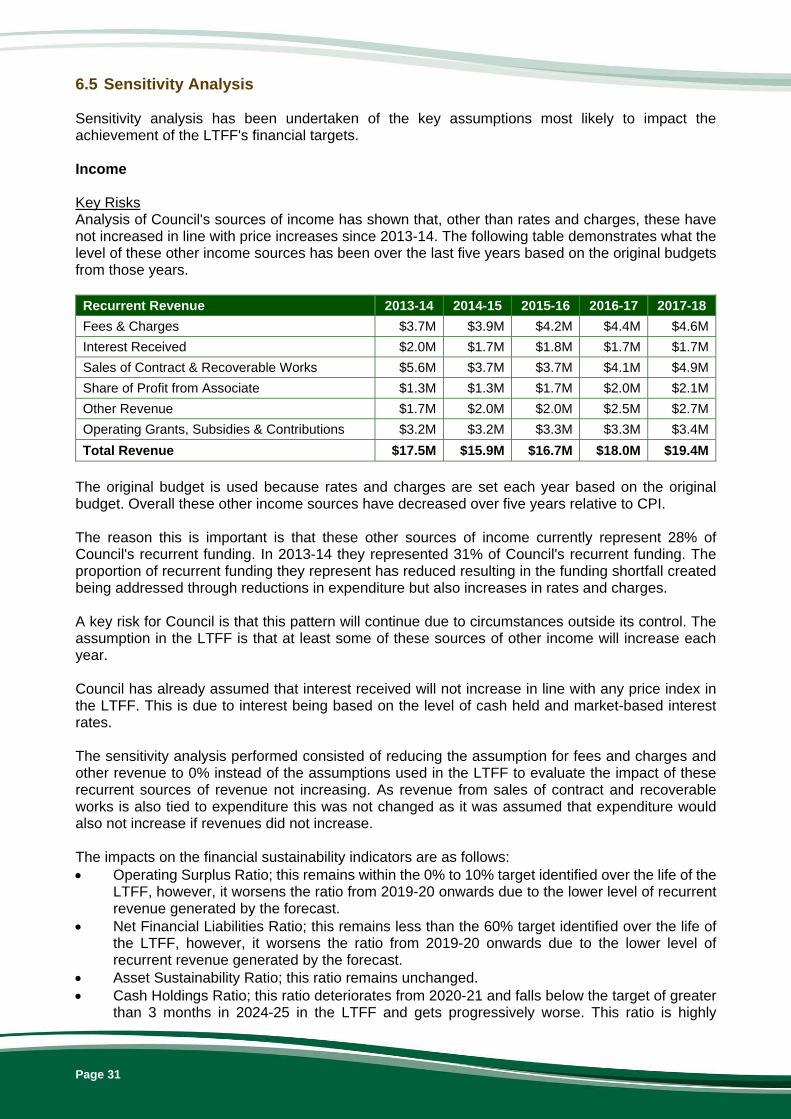
6.5 Sensitivity Analysis Sensitivity analysis has been undertaken of the key assumptions most likely to impact the achievement of the LTFF's financial targets. Income Key Risks Analysis of Council's sources of income has shown that, other than rates and charges, these have not increased in line with price increases since 2013-14. The following table demonstrates what the level of these other income sources has been over the last five years based on the original budgets from those years.
Recurrent Revenue 2013-14 2014-15 2015-16 2016-17 2017-18
Fees & Charges $3.7M $3.9M $4.2M $4.4M $4.6M
Interest Received $2.0M $1.7M $1.8M $1.7M $1.7M
Sales of Contract & Recoverable Works $5.6M $3.7M $3.7M $4.1M $4.9M
Share of Profit from Associate $1.3M $1.3M $1.7M $2.0M $2.1M
Other Revenue $1.7M $2.0M $2.0M $2.5M $2.7M
Operating Grants, Subsidies & Contributions $3.2M $3.2M $3.3M $3.3M $3.4M
Total Revenue $17.5M $15.9M $16.7M $18.0M $19.4M
The original budget is used because rates and charges are set each year based on the original budget. Overall these other income sources have decreased over five years relative to CPI. The reason this is important is that these other sources of income currently represent 28% of Council's recurrent funding. In 2013-14 they represented 31% of Council's recurrent funding. The proportion of recurrent funding they represent has reduced resulting in the funding shortfall created being addressed through reductions in expenditure but also increases in rates and charges. A key risk for Council is that this pattern will continue due to circumstances outside its control. The assumption in the LTFF is that at least some of these sources of other income will increase each year. Council has already assumed that interest received will not increase in line with any price index in the LTFF. This is due to interest being based on the level of cash held and market-based interest rates. The sensitivity analysis performed consisted of reducing the assumption for fees and charges and other revenue to 0% instead of the assumptions used in the LTFF to evaluate the impact of these recurrent sources of revenue not increasing. As revenue from sales of contract and recoverable works is also tied to expenditure this was not changed as it was assumed that expenditure would also not increase if revenues did not increase. The impacts on the financial sustainability indicators are as follows: Operating Surplus Ratio; this remains within the 0% to 10% target identified over the life of the
LTFF, however, it worsens the ratio from 2019-20 onwards due to the lower level of recurrent revenue generated by the forecast.
Net Financial Liabilities Ratio; this remains less than the 60% target identified over the life of the LTFF, however, it worsens the ratio from 2019-20 onwards due to the lower level of recurrent revenue generated by the forecast.
Asset Sustainability Ratio; this ratio remains unchanged. Cash Holdings Ratio; this ratio deteriorates from 2020-21 and falls below the target of greater
than 3 months in 2024-25 in the LTFF and gets progressively worse. This ratio is highly
Page 32
sensitive to any change in the assumptions relating to recurrent income due to the compounding nature that any change in recurrent funding has on cash.
Current Ratio; this ratio worsens from 2020-21 onwards. Debt Service Cover Ratio; this ratio remains greater than 5 over the life of the LTFF, however,
it worsens from 2019-20 onwards due to the lower level of recurrent revenue generated by the forecast.
The conclusion that can be drawn from the sensitivity analysis is that, if sources of income other than rates and charges do not increase in line with price increases, Council cannot allow this to occur without undertaking a corrective change as the resulting effect on the financial sustainability ratios is unsustainable. This would likely take the form of reducing expenditure or increasing rates and charges. Expenditure Key Risks The key risk to Council's financial sustainability is a lift in recurrent expenditure without an associated lift in recurrent sources of funding. Areas where this could occur are employee costs and materials and services. The sensitivity analysis performed consisted of increasing the assumption for employee costs and materials and services from 2% to 2.5% over the life of the LTFF to evaluate the impact of these recurrent expenditures increasing by more than what has been assumed in the forecast. The impacts on the financial sustainability indicators are as follows: Operating Surplus Ratio; this remains within the 0% to 10% target identified over the life of the
LTFF, however, it worsens the ratio from 2019-20 onwards due to the higher level of recurrent expenditure generated by the forecast.
Net Financial Liabilities Ratio; this remains less than the 60% target identified over the life of the LTFF, however, it worsens the ratio from 2019-20 onwards due to the higher level of recurrent expenditure generated by the forecast.
Asset Sustainability Ratio; this ratio remains unchanged. Cash Holdings Ratio; this ratio deteriorates and falls below the target of greater than 3 months
in 2024-25 in the LTFF although it worsens from 2020-21 onwards. This ratio is highly sensitive to any change in the assumptions relating to recurrent expenditure due to the compounding nature that any change in recurrent expenditure has on cash.
Current Ratio; this ratio worsens from 2020-21 onwards. Debt Service Cover Ratio; this ratio remains greater than 5 over the life of the LTFF, however,
it worsens from 2019-20 onwards due to the higher level of recurrent expenditure generated by the forecast.
The conclusion that can be drawn from the sensitivity analysis is that, if recurrent expenditures increase by more than what is assumed in the forecast, Council cannot allow this to occur without undertaking a corrective change as the resulting effect on the financial sustainability ratios is unsustainable. This would likely take the form of increasing rates and charges. Another key risk for expenditure is any change in disaster management funding arrangements that increases the exposure of local government. A key challenge for Council is that it does not have cash reserves to draw upon in the event that it may be required to make substantial contributions towards disaster management. If these funding arrangements were to change in future, this would present a significant funding issue.
Page 33
7 Supporting References Local Government Act 2009 Local Government Regulation 2012 Financial Management (Sustainability) Guideline 2013 Scenic Rim Community Plan 2011-2026 Scenic Rim Regional Council Corporate Plan 2018-2023 Scenic Rim Regional Council Operational Plan 2018/2019 Scenic Rim Regional Council Budget Forecast Financial Sustainability (June 2009) Orion Consulting Network Scenic Rim Regional Council Budget Forecast Financial Sustainability (June 2011) Orion Consulting Network Scenic Rim Regional Council Financial Sustainability Review (December 2013) Queensland Treasury Corporation Scenic Rim Regional Council Financial Health Review & Next Term Outlook (April 2016) Orion Consulting Network National State of the Assets (November 2014) Jeff Roorda and Associates for the Australian Local Government Association Results of Audit: Local Government Entities 2015-16 (April 2017) Queensland Audit Office https://www.qao.qld.gov.au/sites/all/libraries/pdf.js/web/viewer.html?file=https%3A%2F%2Fwww.qao.qld.gov.au%2Fsites%2Fqao%2Ffiles%2Freports%2Flocal_government_entities-2015-16_results_of_financial_audits_report_13-2016-17.pdf Forecasting long-term sustainability of local government (October 2016) Queensland Audit Office https://www.qao.qld.gov.au/sites/all/libraries/pdf.js/web/viewer.html?file=https%3A%2F%2Fwww.qao.qld.gov.au%2Fsites%2Fqao%2Ffiles%2Freports%2Fforecasting_long-term_sustainability_of_local_government_0.pdf In Our Hands: Strengthening Local Government Revenue for the 21st Centuary (February 2013) Australian Centre for Excellence for Local Government (ACELG) http://www.acelg.org.au/news/stronger-local-government-revenues Factors Impacting Local Government Financial Sustainability: A Council Segment Approach (September 2013) Local Government Association of Queensland (LGAQ) [http://www.lgaq.asn.au/documents/10136/13500/Factors%20Impacting%20Local%20Government%20Financial%20Sustainability%20A%20Council%20Segment%20Approach%20-%20Final%20Report%2020130926.pdf] Report of the Local Government Reform Commission - Volume 1 (July 2007) Local Government Reform Commission http://www.parliament.qld.gov.au/documents/TableOffice/TabledPapers/2007/TP1809-2007.pdf
-ooOoo-
Related Documents