This PDF is a section o the Unilever Annua l Report and Accounts 2009 provided to Unilever’ s shareho lders. It does not contain sufcient inormation to allow a ull understanding o the results o the Unilever Group and the state o a airs o Unilever N.V., Unilever PLC or the Unilever Group. For urther in ormation the Unilever Annual Report and Accounts 2009 should be consulted. Certain sections o the Unilever Annual Report and Acco unts 2009 have been audited. These are on pages 79 to 128, 131 to 132 and those parts noted as audited within the Directors’ Remuner ation Report on pages 71 to 73. The maintenance and integrity o the Unilever website is the responsibility o the Directors; the work carried out by the auditors does not involve consideration o these matters. Accordingly, the auditors accept no responsibility or any changes that may have occurred to the fnancial statements since they were initially placed on the website. Legislation in the United Kingdom and the Netherlands governing the preparation and disseminat ion o fnanci al statements may di er rom legislation in other jurisdictions. Disclaimer Except where you are a shareholder, this material is provided or in ormation purposes only and is not, in particular, intended to con er any legal rights on you. The Annual Report and Accou nts does not constitute an invitation to invest in Unilever shares. Any decisions you make in reliance on this in ormation are solely your responsibility. The in ormation is given as o the dates specifed, is not updated, and any orward-looking statements are made subject to the reser vations specifed on the fnal page o the Report. Unilever accep ts no responsibility or any inor mation on other websites that may be accessed rom this site by hyperlinks.

Welcome message from author
This document is posted to help you gain knowledge. Please leave a comment to let me know what you think about it! Share it to your friends and learn new things together.
Transcript
8/8/2019 Financial Statements AR09
http://slidepdf.com/reader/full/financial-statements-ar09 1/54
This PDF is a section o the Unilever Annual Report and Accounts 2009 provided to Unilever’sshareholders. It does not contain sufcient inormation to allow a ull understanding othe results o the Unilever Group and the state o aairs o Unilever N.V., Unilever PLC orthe Unilever Group. For urther inormation the Unilever Annual Report and Accounts 2009should be consulted.
Certain sections o the Unilever Annual Report and Accounts 2009 have been audited.These are on pages 79 to 128, 131 to 132 and those parts noted as audited within theDirectors’ Remuneration Report on pages 71 to 73.
The maintenance and integrity o the Unilever website is the responsibility o the Directors;the work carried out by the auditors does not involve consideration o these matters.Accordingly, the auditors accept no responsibility or any changes that may have occurredto the fnancial statements since they were initially placed on the website.
Legislation in the United Kingdom and the Netherlands governing the preparation anddissemination o fnancial statements may dier rom legislation in other jurisdictions.
Disclaimer Except where you are a shareholder, this material is provided or inormation
purposes only and is not, in particular, intended to coner any legal rights on you.
The Annual Report and Accounts does not constitute an invitation to invest in Unilevershares. Any decisions you make in reliance on this inormation are solely your responsibility.
The inormation is given as o the dates specifed, is not updated, and any orward-lookingstatements are made subject to the reservations specifed on the fnal page o the Report.
Unilever accepts no responsibility or any inormation on other websites that may beaccessed rom this site by hyperlinks.
8/8/2019 Financial Statements AR09
http://slidepdf.com/reader/full/financial-statements-ar09 2/54
Statement of Directors’ responsibilities
Annual accountsThe Directors are required by Part 9 of Book 2 of the Civil Code in
the Netherlands and the United Kingdom Companies Act 2006
to prepare accounts for each financial year which give a true and
fair view of the state of affairs of the Unilever Group, and the NV
and PLC entities as at the end of the financial year and of theprofit or loss and cash flows for that year.
The Directors consider that, in preparing the accounts, the Group
and the NV and PLC entities have used the most appropriate
accounting policies, consistently applied and supported by
reasonable and prudent judgements and estimates, and that all
International Financial Reporting Standards as adopted by the EU
and as issued by the International Accounting Standards Board
(in the case of the consolidated accounts) and United Kingdom
accounting standards (in the case of the parent company accounts)
which they consider to be applicable have been followed.
The Directors have responsibility for ensuring that NV and PLCkeep accounting records which disclose with reasonable accuracy
their financial position and which enable the Directors to ensure
that the accounts comply with the relevant legislation. They also
have a general responsibility for taking such steps as are
reasonably open to them to safeguard the assets of the Group,
and to prevent and detect fraud and other irregularities.
This statement, which should be read in conjunction with the
Auditors’ report, is made with a view to distinguishing for
shareholders the respective responsibilities of the Directors
and of the auditors in relation to the accounts.
A copy of the financial statements of the Unilever Group is
placed on our website at www.unilever.com/investorrelations Themaintenance and integrity of the website are the responsibility of
the Directors, and the work carried out by the auditors does not
involve consideration of these matters. Accordingly, the auditors
accept no responsibility for any changes that may have occurred
to the financial statements since they were initially placed on the
website. Legislation in the United Kingdom and the Netherlands
governing the preparation and dissemination of financial
statements may differ from legislation in other jurisdictions.
UK law sets out additional responsibilities for the Directors of
PLC regarding disclosure of information to auditors. Disclosure
in respect of these responsibilities is made on page 143.
Directors’ responsibility statementEach of the Directors confirms that, to the best of his or her
knowledge:
• the financial statements which have been prepared in
accordance with International Financial Reporting Standards asadopted by the EU and as issued by the International
Accounting Standards Board (in the case of the consolidated
accounts) and United Kingdom accounting standards (in the
case of the PLC parent company accounts) and United Kingdom
accounting standards and Part 9 of Book 2 of the Dutch Civil
Code (in the case of the NV parent company accounts), give a
true and fair view of the assets, liabilities, financial position and
profit or loss of the Group and the NV and PLC entities taken as
a whole; and
• the Report of the Directors includes a fair review of the
development and performance of the business and the position
of the Group and the NV and the PLC entities taken as a whole,
together with a description of the principal risks anduncertainties they face.
The Directors and their functions are listed on pages 22 and 23.
Going concernThe activities of the Group, together with the factors likely to
affect its future development, performance and position are set
out on pages 1 to 21 and 25 to 36. The financial position of the
Group, its cash flows, liquidity position and borrowing facilities are
described in the Financial Review 2009 on pages 37 to 46 and the
Financial Review 2008 on pages 47 to 49. In addition, we describe
in note 15 on pages 104 to 110: the Group’s objectives, policies
and processes for managing its capital; its financial risk
management objectives; details of its financial instruments andhedging activities; and its exposures to credit and liquidity risk.
The Group has considerable financial resources together with
established business relationships with many customers and
suppliers in countries throughout the world. As a consequence,
the Directors believe that the Group is well placed to manage its
business risks successfully despite the current uncertain outlook.
After making enquiries, the Directors have a reasonable
expectation that the Group has adequate resources to continue in
operational existence for the foreseeable future. Accordingly, they
continue to adopt the going concern basis in preparing the Annual
Report and Accounts.
Internal and disclosure controls and procedures
Please refer to pages 30 to 34 for a discussion of Unilever’s
principal risk factors and to page 35 for commentary on the
Group’s approach to risk management and control.
76 Unilever Annual Report and Accounts 2009
Financial statements
8/8/2019 Financial Statements AR09
http://slidepdf.com/reader/full/financial-statements-ar09 3/54
Auditor’s report Netherlands
Unilever Annual Report and Accounts 2009 77
Independent auditor’s report to the shareholdersof Unilever N.V.
Report on the consolidated financial statementsWe have audited the consolidated financial statements which are
part of the Annual Report 2009 of the Unilever Group for the yearended 31 December 2009 which comprise the consolidated
income statement, consolidated balance sheet, consolidated cash
flow statement, consolidated statement of comprehensive income,
consolidated statement of changes in equity and the related notes
on pages 79 to 128 and 131 to 132.
We have reported separately on the company accounts of Unilever
N.V. for the year ended 31 December 2009.
Directors’ responsibility
The Directors are responsible for the preparation and fair
presentation of the consolidated financial statements in
accordance with International Financial Reporting Standards asadopted by the European Union and as issued by the International
Accounting Standards Board and with Part 9 of Book 2 of the
Netherlands Civil Code, and for the preparation of the Report of
the Directors in accordance with Part 9 of Book 2 of the
Netherlands Civil Code. This responsibility includes: designing,
implementing and maintaining internal control relevant to the
preparation and fair presentation of the consolidated financial
statements that are free from material misstatement, whether due
to fraud or error; selecting and applying appropriate accounting
policies; and making accounting estimates that are reasonable in
the circumstances.
Auditor’s responsibility
Our responsibility is to express an opinion on the consolidatedfinancial statements based on our audit. We conducted our audit
in accordance with Dutch law. This law requires that we comply
with ethical requirements and plan and perform the audit to
obtain reasonable assurance whether the consolidated financial
statements are free from material misstatement.
An audit involves performing procedures to obtain audit evidence
about the amounts and disclosures in the consolidated financial
statements. The procedures selected depend on the auditor’s
judgement, including the assessment of the risks of material
misstatement of the consolidated financial statements, whether
due to fraud or error. In making those risk assessments, theauditor considers internal control relevant to the entity’s
preparation and fair presentation of the consolidated financial
statements in order to design audit procedures that are
appropriate in the circumstances, but not for the purpose of
expressing an opinion on the effectiveness of the entity’s internal
control. An audit also includes evaluating the appropriateness of
accounting policies used and the reasonableness of accounting
estimates made by the Directors, as well as evaluating the overall
presentation of the consolidated financial statements.
We believe that the audit evidence we have obtained is sufficient
and appropriate to provide a basis for our audit opinion.
Opinion
In our opinion, the consolidated financial statements give a true
and fair view of the financial position of the Unilever Group as at
31 December 2009, and of its result and its cash flows for the year
then ended in accordance with International Financial Reporting
Standards as adopted by the European Union and as issued by the
International Accounting Standards Board and
with Part 9 of Book 2 of the Netherlands Civil Code.
Report on other legal and regulatory requirementsPursuant to the legal requirement under 2:393 sub 5 part f
of the Netherlands Civil Code, we report, to the extent of our
competence, that the Report of the Directors is consistent with the
consolidated financial statements as required by 2:391 sub 4 ofthe Netherlands Civil Code.
Rotterdam, The Netherlands, 2 March 2010
PricewaterhouseCoopers Accountants N.V.
R A J Swaak RA
8/8/2019 Financial Statements AR09
http://slidepdf.com/reader/full/financial-statements-ar09 4/54
Auditor’s report United Kingdom
78 Unilever Annual Report and Accounts 2009
Financial statements
Independent auditors’ report to the members of UnileverPLC on the consolidated financial stetements
We have audited the consolidated financial statements of the
Unilever Group for the year ended 31 December 2009 which
comprise the consolidated income statement, consolidated
balance sheet, consolidated cash flow statement, consolidatedstatement of comprehensive income, consolidated statement of
changes in equity, the related notes on pages 79 to 128, and
principal group companies and non-current investments on pages
131 and 132. These consolidated financial statements have been
prepared under the accounting policies set out in note 1 on pages
83 to 86. The financial reporting framework that has been applied
in their preparation is applicable law and International Financial
Reporting Standards (IFRSs) as adopted by the European Union.
Respective responsibilities of Directors and auditors
As explained more fully in the Statement of Directors’
responsibilities set out on page 76, the directors are responsible for
the preparation of the group financial statements and for beingsatisfied that they give a true and fair view. Our responsibility is to
audit the consolidated financial statements in accordance with
applicable law and International Standards on Auditing (UK and
Ireland). Those standards require us to comply with the Auditing
Practices Board’s Ethical Standards for Auditors.
This report, including the opinions, has been prepared for and only
for the shareholders of Unilever PLC as a body in accordance with
Chapter 3 of Part 16 of the Companies Act 2006 and for no other
purpose. We do not, in giving these opinions, accept or assume
responsibility for any other purpose or to any other person to
whom this report is shown or into whose hands it may come save
where expressly agreed by our prior consent in writing.
Scope of the audit of financial statements
An audit involves obtaining evidence about the amounts and
disclosures in the financial statements sufficient to give reasonable
assurance that the financial statements are free from material
misstatement, whether caused by fraud or error. This includes an
assessment of: whether the accounting policies are appropriate to
the Group’s circumstances and have been consistently applied and
adequately disclosed; the reasonableness of significant accounting
estimates made by the directors; and the overall presentation of
the financial statements.
Opinion on financial statements
In our opinion the Group financial statements:
• give a true and fair view of the state of the Group’s affairs as at
31 December 2009 and of its profit and cash flows for the yearthen ended;
• have been properly prepared in accordance with IFRSs asadopted by the European Union; and
• have been prepared in accordance with the requirements of theCompanies Act 2006 and Article 4 of the IAS Regulation.
Separate opinion in relation to IFRS as issued by the IASB
As explained in note 1 to the consolidated financial statements,
the Group in addition to complying with its legal obligation to
apply IFRSs as adopted by the European Union, has also applied
IFRSs as issued by the International Accounting Standards Board,
(IASB).
In our opinion the Group financial statements comply with IFRSs as
issued by the IASB.
Opinion on other matter prescribed by the Companies Act
2006
In our opinion the information given in the Report of the Directors
for the financial year for which the Group financial statements are
prepared is consistent with the Group financial statements.
Matters on which we are required to report by exception
We have nothing to report in respect of the following:
Under the Companies Act 2006 we are required to report to you
if, in our opinion:
• certain disclosures of directors’ remuneration specified by law
are not made; or
• we have not received all the information and explanations we
require for our audit.
Under the Listing Rules we are required to review:
• the Directors’ statement, set out on page 76, in relation to
going concern; and
• the part of the Corporate Governance statement relating to the
company’s compliance with the nine provisions of the 2008Combined Code specified for our review.
Other matter
We have reported separately on the parent company accounts of
Unilever PLC for the year ended 31 December 2009 and on the
information in the Directors’ Remuneration Report that is
described as having been audited.
Richard Sexton(Senior Statutory Auditor)
For and on behalf of PricewaterhouseCoopers LLP
Chartered Accountants and Statutory Auditors
London, United Kingdom
2 March 2010
8/8/2019 Financial Statements AR09
http://slidepdf.com/reader/full/financial-statements-ar09 5/54
Financial statements Unilever Group
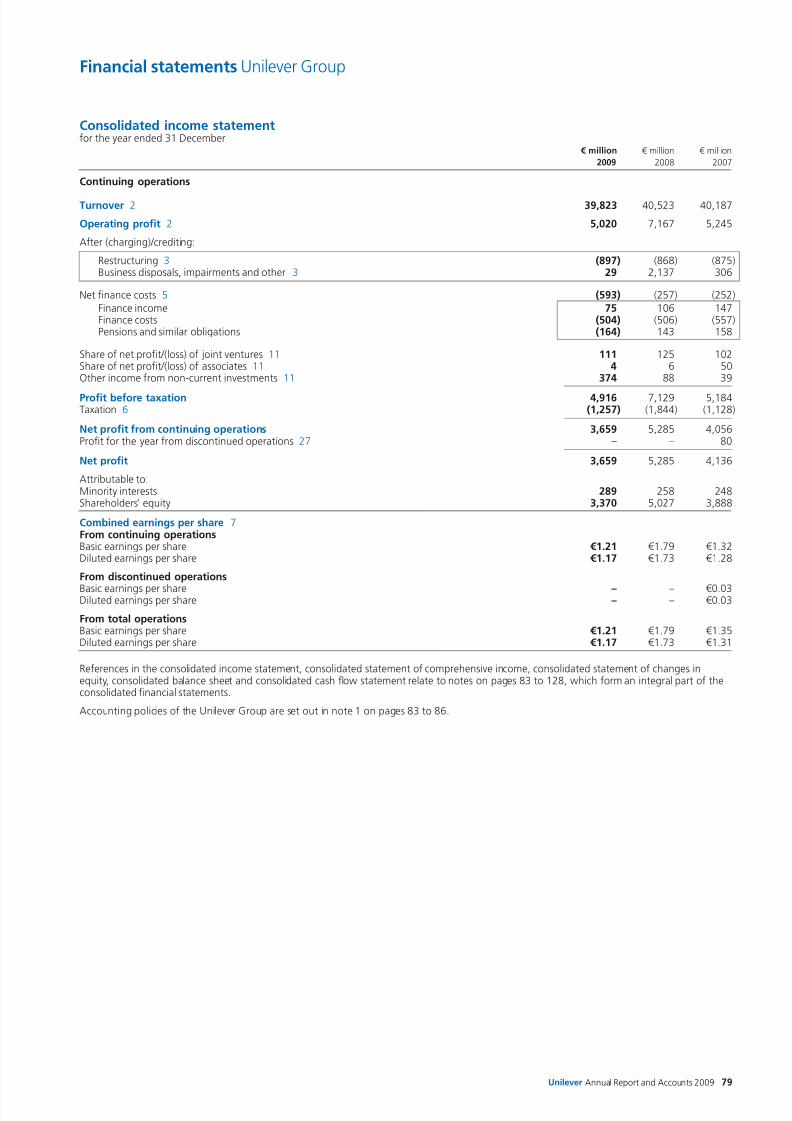
Consolidated income statementfor the year ended 31 December
€ million € million € million
2009 2008 2007
Continuing operations
Turnover 2 39,823 40,523 40,187
Operating profit 2 5,020 7,167 5,245
After (charging)/crediting:
Restructuring 3 (897) (868) (875)Business disposals, impairments and other 3 29 2,137 306
Net finance costs 5 (593) (257) (252)
Finance income 75 106 147Finance costs (504) (506) (557)Pensions and similar obligations (164) 143 158
Share of net profit/(loss) of joint ventures 11 111 125 102Share of net profit/(loss) of associates 11 4 6 50Other income from non-current investments 11 374 88 39
Profit before taxation 4,916 7,129 5,184Taxation 6 (1,257) (1,844) (1,128)
Net profit from continuing operations 3,659 5,285 4,056Profit for the year from discontinued operations 27 – – 80
Net profit 3,659 5,285 4,136
Attributable to:Minority interests 289 258 248Shareholders’ equity 3,370 5,027 3,888
Combined earnings per share 7From continuing operationsBasic earnings per share €1.21 €1.79 €1.32Diluted earnings per share €1.17 €1.73 €1.28
From discontinued operations
Basic earnings per share – – €0.03Diluted earnings per share – – €0.03
From total operationsBasic earnings per share €1.21 €1.79 €1.35Diluted earnings per share €1.17 €1.73 €1.31
References in the consolidated income statement, consolidated statement of comprehensive income, consolidated statement of changes inequity, consolidated balance sheet and consolidated cash flow statement relate to notes on pages 83 to 128, which form an integral part of theconsolidated financial statements.
Accounting policies of the Unilever Group are set out in note 1 on pages 83 to 86.
Unilever Annual Report and Accounts 2009 79
8/8/2019 Financial Statements AR09
http://slidepdf.com/reader/full/financial-statements-ar09 6/54
Financial statements Unilever Group
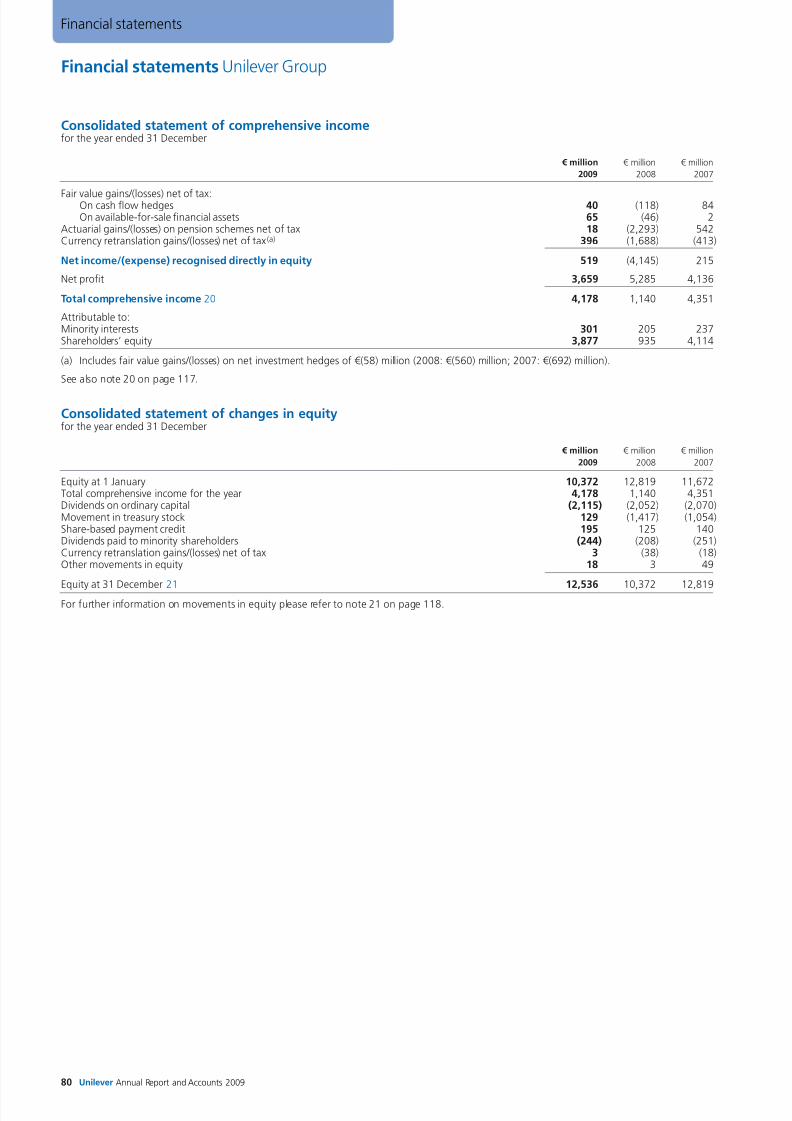
Consolidated statement of comprehensive incomefor the year ended 31 December
€ million € million € million
2009 2008 2007
Fair value gains/(losses) net of tax:On cash flow hedges 40 (118) 84On available-for-sale financial assets 65 (46) 2
Actuarial gains/(losses) on pension schemes net of tax 18 (2,293) 542Currency retranslation gains/(losses) net of tax(a) 396 (1,688) (413)
Net income/(expense) recognised directly in equity 519 (4,145) 215
Net profit 3,659 5,285 4,136
Total comprehensive income 20 4,178 1,140 4,351
Attributable to:Minority interests 301 205 237Shareholders’ equity 3,877 935 4,114
(a) Includes fair value gains/(losses) on net investment hedges of €(58) million (2008: €(560) million; 2007: €(692) million).
See also note 20 on page 117.
Consolidated statement of changes in equityfor the year ended 31 December
€ million € million € million
2009 2008 2007
Equity at 1 January 10,372 12,819 11,672Total comprehensive income for the year 4,178 1,140 4,351Dividends on ordinary capital (2,115) (2,052) (2,070)Movement in treasury stock 129 (1,417) (1,054)Share-based payment credit 195 125 140Dividends paid to minority shareholders (244) (208) (251)Currency retranslation gains/(losses) net of tax 3 (38) (18)Other movements in equity 18 3 49
Equity at 31 December 21 12,536 10,372 12,819
For further information on movements in equity please refer to note 21 on page 118.
80 Unilever Annual Report and Accounts 2009
Financial statements
8/8/2019 Financial Statements AR09
http://slidepdf.com/reader/full/financial-statements-ar09 7/54
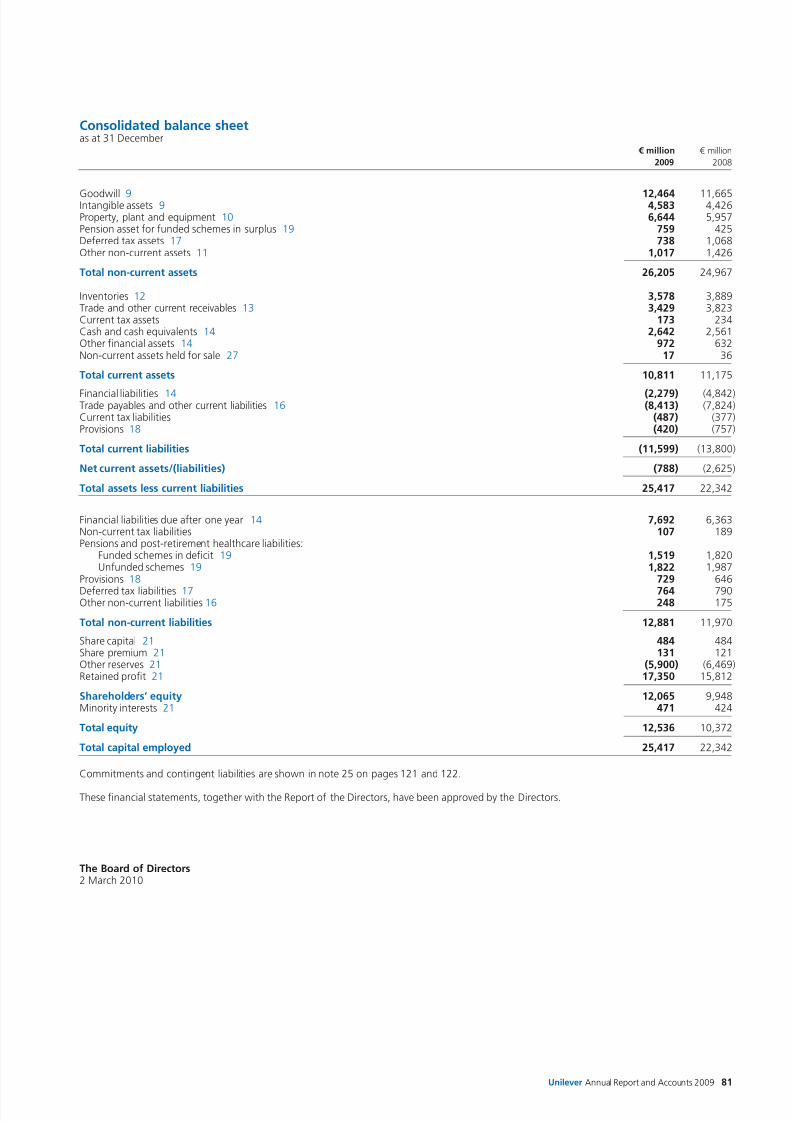
Consolidated balance sheetas at 31 December
€ million € million
2009 2008
Goodwill 9 12,464 11,665Intangible assets 9 4,583 4,426Property, plant and equipment 10 6,644 5,957Pension asset for funded schemes in surplus 19 759 425Deferred tax assets 17 738 1,068Other non-current assets 11 1,017 1,426
Total non-current assets 26,205 24,967
Inventories 12 3,578 3,889Trade and other current receivables 13 3,429 3,823Current tax assets 173 234Cash and cash equivalents 14 2,642 2,561Other financial assets 14 972 632Non-current assets held for sale 27 17 36
Total current assets 10,811 11,175
Financial liabilities 14 (2,279) (4,842)Trade payables and other current liabilities 16 (8,413) (7,824)Current tax liabilities (487) (377)Provisions 18 (420) (757)
Total current liabilities (11,599) (13,800)
Net current assets/(liabilities) (788) (2,625)
Total assets less current liabilities 25,417 22,342
Financial liabilities due after one year 14 7,692 6,363Non-current tax liabilities 107 189Pensions and post-retirement healthcare liabilities:
Funded schemes in deficit 19 1,519 1,820Unfunded schemes 19 1,822 1,987
Provisions 18 729 646Deferred tax liabilities 17 764 790Other non-current liabilities 16 248 175
Total non-current liabilities 12,881 11,970
Share capital 21 484 484Share premium 21 131 121Other reserves 21 (5,900) (6,469)Retained profit 21 17,350 15,812
Shareholders’ equity 12,065 9,948Minority interests 21 471 424
Total equity 12,536 10,372
Total capital employed 25,417 22,342
Commitments and contingent liabilities are shown in note 25 on pages 121 and 122.
These financial statements, together with the Report of the Directors, have been approved by the Directors.
The Board of Directors2 March 2010
Unilever Annual Report and Accounts 2009 81
8/8/2019 Financial Statements AR09
http://slidepdf.com/reader/full/financial-statements-ar09 8/54
Financial statements Unilever Group
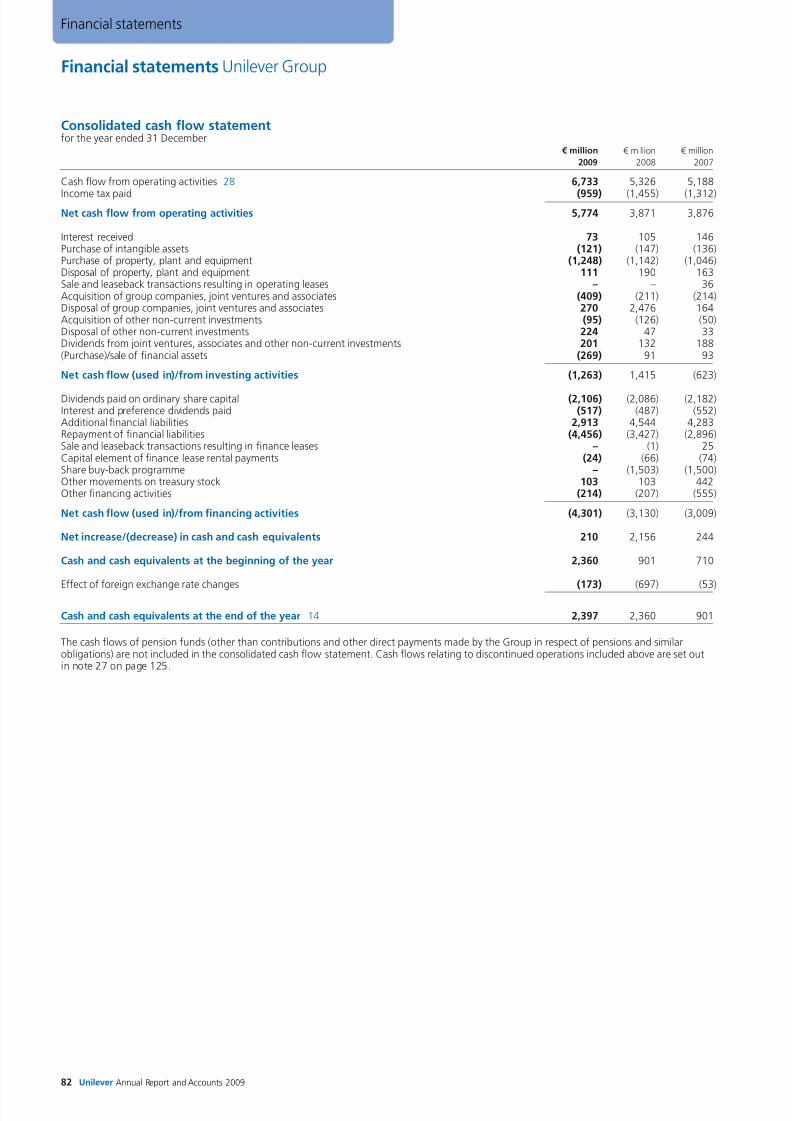
Consolidated cash flow statementfor the year ended 31 December
€ million € million € million
2009 2008 2007
Cash flow from operating activities 28 6,733 5,326 5,188
Income tax paid (959) (1,455) (1,312)
Net cash flow from operating activities 5,774 3,871 3,876
Interest received 73 105 146Purchase of intangible assets (121) (147) (136)Purchase of property, plant and equipment (1,248) (1,142) (1,046)Disposal of property, plant and equipment 111 190 163Sale and leaseback transactions resulting in operating leases – – 36Acquisition of group companies, joint ventures and associates (409) (211) (214)Disposal of group companies, joint ventures and associates 270 2,476 164Acquisition of other non-current investments (95) (126) (50)Disposal of other non-current investments 224 47 33Dividends from joint ventures, associates and other non-current investments 201 132 188(Purchase)/sale of financial assets (269) 91 93
Net cash flow (used in)/from investing activities (1,263) 1,415 (623)
Dividends paid on ordinary share capital (2,106) (2,086) (2,182)Interest and preference dividends paid (517) (487) (552)Additional financial liabilities 2,913 4,544 4,283Repayment of financial liabilities (4,456) (3,427) (2,896)Sale and leaseback transactions resulting in finance leases – (1) 25Capital element of finance lease rental payments (24) (66) (74)Share buy-back programme – (1,503) (1,500)Other movements on treasury stock 103 103 442Other financing activities (214) (207) (555)
Net cash flow (used in)/from financing activities (4,301) (3,130) (3,009)
Net increase/(decrease) in cash and cash equivalents 210 2,156 244
Cash and cash equivalents at the beginning of the year 2,360 901 710
Effect of foreign exchange rate changes (173) (697) (53)
Cash and cash equivalents at the end of the year 14 2,397 2,360 901
The cash flows of pension funds (other than contributions and other direct payments made by the Group in respect of pensions and similarobligations) are not included in the consolidated cash flow statement. Cash flows relating to discontinued operations included above are set outin note 27 on page 125.
82 Unilever Annual Report and Accounts 2009
Financial statements
8/8/2019 Financial Statements AR09
http://slidepdf.com/reader/full/financial-statements-ar09 9/54
Notes to the consolidated financial statements Unilever Group
Unilever Annual Report and Accounts 2009 83
1 Accounting information and policies
The accounting policies adopted are the same as those which appliedfor the previous financial year, except as set out below under theheading of ‘Recent accounting developments’.
UnileverThe two parent companies, NV and PLC, together with their groupcompanies, operate as a single economic entity (the Unilever Group,also referred to as Unilever or the Group). NV and PLC have the sameDirectors and are linked by a series of agreements, including anEqualisation Agreement, which are designed so that the position ofthe shareholders of both companies is as nearly as possible the sameas if they held shares in a single company.
The Equalisation Agreement provides that both companies adoptthe same accounting principles and requires as a general rulethe dividends and other rights and benefits (including rights onliquidation) attaching to each €0.16 nominal of ordinary share capitalof NV to be equal in value at the relevant rate of exchange to thedividends and other rights and benefits attaching to each 31 ⁄ 9pnominal of ordinary share capital of PLC, as if each such unit of capitalformed part of the ordinary capital of one and the same company.
For additional information please refer to ‘Corporate governance’on page 56.
Basis of consolidationDue to the operational and contractual arrangements referred toabove, NV and PLC form a single reporting entity for the purposesof presenting consolidated accounts. Accordingly, the accounts ofUnilever are presented by both NV and PLC as their respectiveconsolidated accounts. Group companies included in the consolidationare those companies controlled by NV or PLC. Control exists when theGroup has the power to govern the financial and operating policies ofan entity so as to obtain benefits from its activities.
The net assets and results of acquired businesses are included in theconsolidated accounts from their respective dates of acquisition, beingthe date on which the Group obtains control. The results of disposed
businesses are included in the consolidated accounts up to their dateof disposal, being the date control ceases.
Inter-company transactions and balances are eliminated.
Companies legislation and accounting standardsThe consolidated accounts have been prepared in accordance withInternational Financial Reporting Standards (IFRS) as adopted bythe European Union (EU), IFRIC Interpretations and in accordance withPart 9 of Book 2 of the Civil Code in the Netherlands and the UnitedKingdom Companies Act 2006. They are also in compliance with IFRSas issued by the International Accounting Standards Board.
The accounts are prepared under the historical cost convention unlessotherwise indicated.
The accounting policies adopted are consistent with those of the
previous financial year except as set out on page 86.
Foreign currenciesItems included in the financial statements of group companies aremeasured using the currency of the primary economic environment inwhich each entity operates (its functional currency). The consolidatedfinancial statements are presented in euros. The functional currenciesof NV and PLC are euros and sterling respectively.
Foreign currency transactions are translated into the functionalcurrency using the exchange rates prevailing at the dates of thetransactions. Foreign exchange gains and losses resulting from thesettlement of such transactions and from the translation at year-endexchange rates of monetary assets and liabilities denominated inforeign currencies are recognised in the income statement, exceptwhen deferred in equity as qualifying hedges. Those arising on trading
transactions are taken to operating profit; those arising on cash,financial assets and financial liabilities are classified as finance incomeor cost.
In preparing the consolidated financial statements, the incomestatement, the cash flow statement and all other movements in assetsand liabilities are translated at average rates of exchange. The balancesheet, other than the ordinary share capital of NV and PLC, istranslated at year-end rates of exchange. In the case of hyper-inflationary economies the accounts are adjusted to reflect current
price levels and remove the influences of inflation before beingtranslated.
The ordinary share capital of NV and PLC is translated in accordancewith the Equalisation Agreement. The difference between the resultingvalue for PLC and the value derived by applying the year-end rate ofexchange is taken to other reserves (see note 23 on page 119).
The effects of exchange rate changes during the year on netassets at the beginning of the year are recorded as a movement inshareholders’ equity, as is the difference between profit of the yearretained at average rates of exchange and at year-end rates ofexchange. For these purposes net assets include loans between groupcompanies and related foreign exchange contracts, if any, for whichsettlement is neither planned nor likely to occur in the foreseeablefuture. Exchange gains/losses on hedges of net assets are also recorded
as a movement in equity.
Cumulative exchange differences arising since the date of transition toIFRS of 1 January 2004 are reported as a separate component of otherreserves (see note 23 on page 119). In the event of disposal or partdisposal of an interest in a group company either through sale or as aresult of a repayment of capital, the cumulative exchange difference isrecognised in the income statement as part of the profit or loss ondisposal of group companies.
Business combinationsBusiness combinations are accounted for using the acquisitionaccounting method. This involves recognising identifiable assetsand liabilities of the acquired business at fair value as at the dateof acquisition.
Acquisitions of minority interests are accounted for using the parent
entity method, whereby the difference between the considerationand the book value of the share of the net assets acquired isrecognised as goodwill.
GoodwillGoodwill (being the difference between the fair value of considerationpaid for new interests in group companies and the fair value of theGroup’s share of their net identifiable assets and contingent liabilitiesat the date of acquisition) is capitalised. Goodwill is not amortised, butis subject to an annual review for impairment (or more frequently ifnecessary). Any impairment is charged to the income statement as itarises.
For the purpose of impairment testing, goodwill acquired in a businesscombination is, from the acquisition date, allocated to each of theGroup’s cash generating units, or groups of cash generating units, that
are expected to benefit from the synergies of the combination,irrespective of whether other assets or liabilities of the acquiredbusiness are assigned to those units or group of units. Each unit orgroup of units to which the goodwill is allocated represents the lowestlevel within the Group at which the goodwill is monitored for internalmanagement purposes, and is not larger than an operating segment.
Intangible assetsOn acquisition of group companies, Unilever recognises any specificallyidentifiable intangible assets separately from goodwill, initiallymeasuring the intangible assets at fair value as at the date ofacquisition. Separately purchased intangible assets are initiallymeasured at cost. Finite-lived intangible assets mainly comprisepatented and non-patented technology, know-how and software.These assets are capitalised and amortised on a straight-line basis inthe income statement over the period of their expected useful lives, orthe period of legal rights if shorter, none of which exceeds ten years.
Periods in excess of five years are used only where the Directors aresatisfied that the life of these assets will clearly exceed that period.
8/8/2019 Financial Statements AR09
http://slidepdf.com/reader/full/financial-statements-ar09 10/54
Notes to the consolidated financial statements Unilever Group
84 Unilever Annual Report and Accounts 2009
Financial statements
1 Accounting information and policies (continued)
Indefinite-lived intangibles are not amortised, but are subject to anannual review for impairment (or more frequently if necessary).Any impairment is charged to the income statement as it arises.
Unilever monitors the level of product development costs againstall the criteria set out in IAS 38. These include the requirement toestablish that a flow of economic benefits is probable before costs arecapitalised. For Unilever this is evident only shortly before a product islaunched into the market. The level of costs incurred after thesecriteria have been met is currently insignificant.
Property, plant and equipmentProperty, plant and equipment is stated at cost less depreciationand impairment. Eligible borrowing costs are capitalised as part of thecost of an asset. Depreciation is provided on a straight-line basis atpercentages of cost based on the expected average useful lives of theassets and their residual values which are reviewed at least annually.Estimated useful lives by major class of assets are as follows:
Freehold buildings 40 years(no depreciation on freehold land)
Leasehold buildings 40 years*Plant and equipment 2–20 years
*or life of lease if less than 40 years
Property, plant and equipment is subject to review for impairmentif triggering events or circumstances indicate that this is necessary.Any impairment is charged to the income statement as it arises.
Other non-current assetsJoint ventures are undertakings in which the Group has an interest andwhich are jointly controlled by the Group and one or more otherparties. Associates are undertakings in which the Group has aninvestment and can exercise significant influence.
Interests in joint ventures and associates are accounted for using the
equity method and are stated in the consolidated balance sheet atcost, adjusted for the movement in the Group’s share of their netassets and liabilities. The Group’s share of the profit or loss after taxof joint ventures and associates is included in the Group’s consolidatedprofit before taxation.
Biological assets are stated at fair value less costs to sell.
Financial instruments
Financial assetsThe classification of financial assets is determined at initial recognitiondepending on the purpose for which they were acquired. Anyimpairment is recognised in the income statement as it arises.
Held-to-maturity investments
Held-to-maturity investments are assets with set cash flows and fixedmaturities which Unilever intends to hold to maturity. They are held atcost plus interest using the effective interest method, less anyimpairments.
Loans and receivablesLoans and receivables have set payments and are not quoted in anactive market. They arise when the Group provides money, goods orservices. Loans and receivables are included in the balance sheet atamortised cost.
Short-term loans and receivables are initially measured at originalinvoice amount less any impairments.
Financial assets at fair value through profit or lossA financial asset is in this category if it is intended to be sold in the
short term. They are current assets if they are expected to be realisedwithin 12 months. Transaction costs related to the purchase of theassets are expensed as incurred. Derivatives are classified here unlessthey are designated as hedges. Gains and losses arising from changesin value are included in the income statement.
Available-for-sale financial assetsAvailable-for-sale financial assets are assets that are designated in thiscategory or not classified in any of the other categories. They are non-current assets unless the Group intends to dispose of them within 12months. Changes in value are recognised in equity until the investmentis sold or impaired, when they are included in the income statement.
Interest on available-for-sale securities is calculated using the effectiveinterest rate method and recognised within other income. Dividendson equity investments are also recognised within other income.
Financial liabilitiesFinancial liabilities are recognised initially at fair value, net oftransaction costs. They are subsequently held at amortised cost unlessthey are part of a fair value hedge. Any difference between theamount on initial recognition and the redemption value is recognisedin the income statement using the effective interest method.
Short-term financial liabilities are measured at original invoice amount.
DerivativesDerivatives are measured on the balance sheet at fair value and are
used primarily to manage the r isks of changes in exchange and interestrates. The Group uses foreign exchange forward contracts, interestrate swap contracts and forward rate agreements to hedge theseexposures. The Group also uses commodity contracts to hedge someraw materials. Contracts that can be settled in cash are treated asfinancial instruments. The Group does not use derivative financialinstruments for speculative purposes.
Changes in the fair value of derivatives that do not qualify for hedgeaccounting are recognised in the income statement as they arise.
Cash flow hedgesChanges in the value of derivatives used as hedges of future cashflows are recognised in equity with any ineffective portion recognisedin the income statement. If the cash flow hedge results in therecognition of a non-financial asset or a liability the gain or loss on thederivative is included in the initial measurement of that asset or
liability. For other cash flow hedges amounts deferred in equity aretaken to the income statement when the hedged item affects profitor loss.
When a hedging instrument no longer qualifies for hedge accounting,any cumulative gain or loss is retained in equity until the forecastedtransaction occurs. If a hedged transaction is no longer expected tooccur, the cumulative gain or loss is transferred to the incomestatement.
Fair value hedgesIn an effective fair value hedge, the hedged item is adjusted forchanges in fair value, with the corresponding entry in the incomestatement. Gains and losses on the hedging instrument are recognisedin the income statement. In a fully effective hedge the adjustments tothe income statement are of equal and opposite value. For non-
derivatives only the foreign currency element can be a hedginginstrument.
Net investment hedgesNet investment hedges are hedges of exchange risks from investmentsin foreign subsidiaries. Gains and losses are recognised in equity. Theaccumulated gains and losses are taken to the income statement whenthe foreign operation is sold or partially disposed.
Valuation principlesThe fair values of quoted investments are based on current bid prices.For listed securities where the market is not liquid, and for unlistedsecurities, the Group uses valuation techniques. These include the useof recent arm’s length transactions, reference to other instruments thatare substantially the same and discounted cash flow calculations.
8/8/2019 Financial Statements AR09
http://slidepdf.com/reader/full/financial-statements-ar09 11/54Unilever Annual Report and Accounts 2009 85
1 Accounting information and policies (continued)
Impairment of financial instrumentsAt each balance sheet date the Group assesses whether there isevidence that financial assets are impaired. A significant or prolongedfall in value below cost is considered in determining whether an asset
is impaired. For available-for-sale financial assets the cumulative loss isremoved from equity and recognised in the income statement. Anysubsequent reversals of impairment losses on available-for-sale equityinstruments are not recognised in the income statement.
InventoriesInventories are valued at the lower of weighted average cost and netrealisable value. Cost comprises direct costs and, where appropriate,a proportion of attributable production overheads.
Cash and cash equivalentsFor the purpose of preparation of the cash flow statement, cash andcash equivalents includes cash at bank and in hand, highly liquidinterest-bearing securities with original maturities of three monthsor less, investments in money market funds with insignificant risk ofchanges in value, and bank overdrafts.
Pensions and similar obligationsThe operating and financing costs of defined benefit plans arerecognised separately in the income statement. Service costs aresystematically allocated over the service lives of employees, andfinancing costs are recognised in the periods in which they arise. Thecosts of individual events such as past service benefit enhancements,settlements and curtailments are recognised immediately in the incomestatement. Variations from expected costs, arising from the experienceof the plans or changes in actuarial assumptions, are recognisedimmediately in the statement of comprehensive income. The definedbenefit plan surplus or deficit in the balance sheet comprises the totalfor each plan of the fair value of plan assets less the present value ofthe defined benefit obligation (using a discount rate based on highquality corporate bonds).
The charges to the income statement for defined contribution plans
are the company contributions payable, and the assets and liabilitiesof such plans are not included in the balance sheet of the Group.
All defined benefit plans are subject to regular actuarial review usingthe projected unit method, either by external consultants or byactuaries employed by Unilever. Group policy is that the mostimportant plans, representing approximately 80% of the definedbenefit liabilities, are formally valued every year; other principal plans,accounting for approximately a further 15% of liabilities, have theirliabilities updated each year. Group policy for the remaining plansrequires a full actuarial valuation at least every three years. Asset valuesfor all plans are updated every year.
TaxationIncome tax on the profit or loss for the year comprises current anddeferred tax. Income tax is recognised in the income statement exceptto the extent that it relates to items recognised directly in equity.
Current tax is the expected tax payable on the taxable income forthe year, using tax rates enacted or substantively enacted at thebalance sheet date, and any adjustments to tax payable in respectof previous years.
Deferred taxation is recognised using the liability method on taxabletemporary differences between the tax base and the accounting baseof items included in the balance sheet of the Group. The followingtemporary differences are not provided for: goodwill not deductible fortax purposes, the initial recognition of assets or liabilities that affectneither accounting nor taxable profit, and differences relating toinvestments in subsidiaries to the extent that they will probably notreverse in the forseeable future. The amount of deferred tax providedis based on the expected manner of realisation or settlement of thecarrying amount of assets and liabilities, using tax rates prevailing at
the year end unless future rates have been enacted or substantivelyenacted.
A deferred tax asset is recognised only to the extent that it is probablethat future taxable profits will be available against which the asset can
be utilised. Deferred tax assets are reduced to the extent that it is nolonger probable that the related tax benefit will be realised.
ProvisionsProvisions are recognised when either a legal or constructiveobligation, as a result of a past event, exists at the balance sheet date
and where the amount of the obligation can be reliably estimated.
Segment informationSegment information is provided based on the geographic segmentsof the management structure of the Group. Additional information isprovided by product area.
Revenue recognitionTurnover comprises sales of goods and services after deduction ofdiscounts and sales taxes. It does not include sales between groupcompanies. Discounts given by Unilever include rebates, pricereductions and incentives given to customers, promotional couponingand trade communication costs.
Turnover is recognised when the risks and rewards of the underlyingproducts and services have been substantially transferred to the
customer. Revenue from services is recognised as the servicesare performed. Interest income is recognised as interest accruesusing the effective interest method.
Research and market support costsExpenditure on research and market support, such as advertising,is charged to the income statement when incurred.
LeasesLeases are classified as finance leases whenever the terms of the leasetransfer substantially all the risks and rewards of ownership to thelessee. All other leases are classified as operating leases.
Assets held under finance leases are recognised as non-current assetsof the Group at their fair value at the date of commencement ofthe lease or, if lower, at the present value of the minimum leasepayments. These assets are depreciated on a straight-line basis over
the shorter of the useful life of the asset and the lease term. Thecorresponding liability to the lessor is included in the balance sheet asa finance lease obligation. Lease payments are apportioned betweenfinance charges and reduction of the lease obligation so as to achievea constant rate of interest on the remaining balance of the liability.Finance charges are charged directly against income.
Lease payments under operating leases are charged to the incomestatement on a straight-line basis over the term of the lease.
Share-based paymentsThe economic cost of awarding shares and share options to employeesis reflected by recording a charge in the income statement equivalentto the fair value of the benefit awarded over the vesting period. Thefair value is determined with reference to option pricing models,principally adjusted Black-Scholes models or a multinomial pricing
model.
Shares held by employee share trustsThe assets and liabilities of certain PLC trusts, NV and groupcompanies which purchase and hold NV and PLC shares to satisfyoptions granted are included in the consolidated accounts. The bookvalue of shares held is deducted from other reserves, and trusts’borrowings are included in the Group’s liabilities. The costs of thetrusts are included in the results of the Group. These shares areexcluded from the calculation of earnings per share.
Assets held for saleAssets and groups of assets and liabilities which comprise disposalgroups are classified as ‘held for sale’ when all of the following criteriaare met: a decision has been made to sell, the assets are available forsale immediately, the assets are being actively marketed, and a sale hasbeen or is expected to be concluded within twelve months of
the balance sheet date. Assets and disposal groups held for saleare valued at the lower of book value or fair value less disposalcosts. Assets held for sale are not depreciated.
8/8/2019 Financial Statements AR09
http://slidepdf.com/reader/full/financial-statements-ar09 12/54
Notes to the consolidated financial statements Unilever Group
86 Unilever Annual Report and Accounts 2009
Financial statements
1 Accounting information and policies (continued)
Critical accounting estimates and judgementsEstimates and judgements are continually evaluated and are basedon historical experience and other factors, including expectationsof future events that are believed to be reasonable under the
circumstances.
The preparation of financial statements requires management to makeestimates and assumptions concerning the future. The resultingaccounting estimates will, by definition, seldom equal the relatedactual results. The estimates and assumptions that have a significantrisk of causing a material adjustment to the carrying amounts of assetsand liabilities within the next financial year are discussed below.
Income statement presentationOn the face of the income statement, costs and revenues relatingto restructuring, business disposals and impairments are disclosed.In addition, individual items judged to be significant are disclosedseparately. These are material in terms of nature and amount. Thesedisclosures are given in order to provide additional information to helpusers better understand financial performance.
Impairment of goodwill and indefinite-lived intangible assetsImpairment reviews in respect of goodwill and indefinite-livedintangible assets are performed at least annually. More regular reviewsare performed if events indicate that this is necessary. Examples ofsuch triggering events would include a significant plannedrestructuring, a major change in market conditions or technology,expectations of future operating losses, or negative cash flows.
The recoverable amounts of cash-generating units are determinedbased on the higher of fair value less costs to sell and value-in-usecalculations. These calculations require the use of estimates. Detailsof key assumptions made are set out in note 9 on page 94.
Retirement benefitsPension accounting requires certain assumptions to be made in orderto value our obligations and to determine the charges to be made
to the income statement. These figures are particularly sensitive toassumptions for discount rates, mortality, inflation rates and expectedlong-term rates of return on assets. Details of assumptions made aregiven in note 19 on pages 113 to 115.
TaxationThe Group is subject to taxes in numerous jurisdictions. Significant judgement is required in determining worldwide provision for taxes.There are many transactions and calculations during the ordinarycourse of business for which the ultimate tax determination isuncertain. The Group recognises liabilities for anticipated tax auditissues based on estimates of whether additional taxes will be due.Where the final tax outcome of these matters is different from theamounts that were initially recorded, such differences will impact theincome tax and deferred tax provisions in the period in which suchdetermination is made.
ProvisionsProvision is made, among other reasons, for legal matters, disputedindirect taxes, employee termination costs and restructuring wherea legal or constructive obligation exists at the balance sheet date anda reliable estimate can be made of the likely outcome. The nature ofthese costs is such that judgement has to be applied to estimate thetiming and amount of cash outflows.
Recent accounting developments
Adopted by the GroupThe Group adopted IFRS 7 ‘Financial Instruments: Disclosures’amendments (effective for periods beginning on or after 1 January2009) which requires additional disclosures about fair value
measurement and liquidity risk.
IFRS 8 ‘Operating Segments’ (effective for periods beginning onor after 1 January 2009) has replaced IAS 14 Segment Reporting andintroduced a management approach to segment reporting.
We have implemented the Revised IAS 1 ‘Presentation of FinancialStatements’ relating to the presentation of the statement ofcomprehensive income.
The Group has also adopted the following new and amended IFRSsand IFRIC interpretations with no material impact:
• Amendment to IFRS 2 ‘Share-based Payment’ relating to vestingconditions and cancellations.
• Revised IAS 23 ‘Borrowing Costs’ relating to capitalisation of
borrowing costs.• IFRIC 13 ‘Customer Loyalty Programmes’ requiring customer loyaltycredits to be accounted for as a separate component of the salestransaction in which they are granted.
• IFRIC 16 ‘Hedges of a Net Investment in a Foreign Operation’relating to guidance on the accounting for hedges of a netinvestment in foreign operations.
• IFRIC 18 ‘Transfers of Assets from Customers’ relating to treatmentof items of property plant and equipment or cash to acquire orconstruct such assets received from customers.
Not adopted by the GroupThe Group is currently assessing the impact of the following revisedstandards and interpretations or amendments that are not yeteffective. These changes will be adopted on the effective dates notedand are not expected to have a material impact on the Group’s resultsof operations, financial position or disclosures:
• IFRS 3 ‘Business Combinations (Revised)’ and IAS 27 ‘Consolidatedand Separate Financial Statements (Amended)’ (effective for periodsbeginning on or after 1 July 2009). The changes will affect futureacquisitions or loss of control of subsidiaries and transactions withnon-controlling interests.
• IFRS 2 (Amendments), ‘Group cash-settled and share-basedpayment transactions’ (effective 1 January 2010).
• Amendment to IAS 39 ‘Financial Instruments: Recognition andMeasurement – Eligible Hedged Items’ (effective for periodsbeginning or on 1 July 2009).
• IFRIC 17, ‘Distribution of non-cash assets to owners’ (effective forperiods beginning on or after 1 July 2009).
• Improvements to IFRSs (issued April 2009) (effective for periodsbeginning on or after 1 January 2010).
8/8/2019 Financial Statements AR09
http://slidepdf.com/reader/full/financial-statements-ar09 13/54Unilever Annual Report and Accounts 2009 87
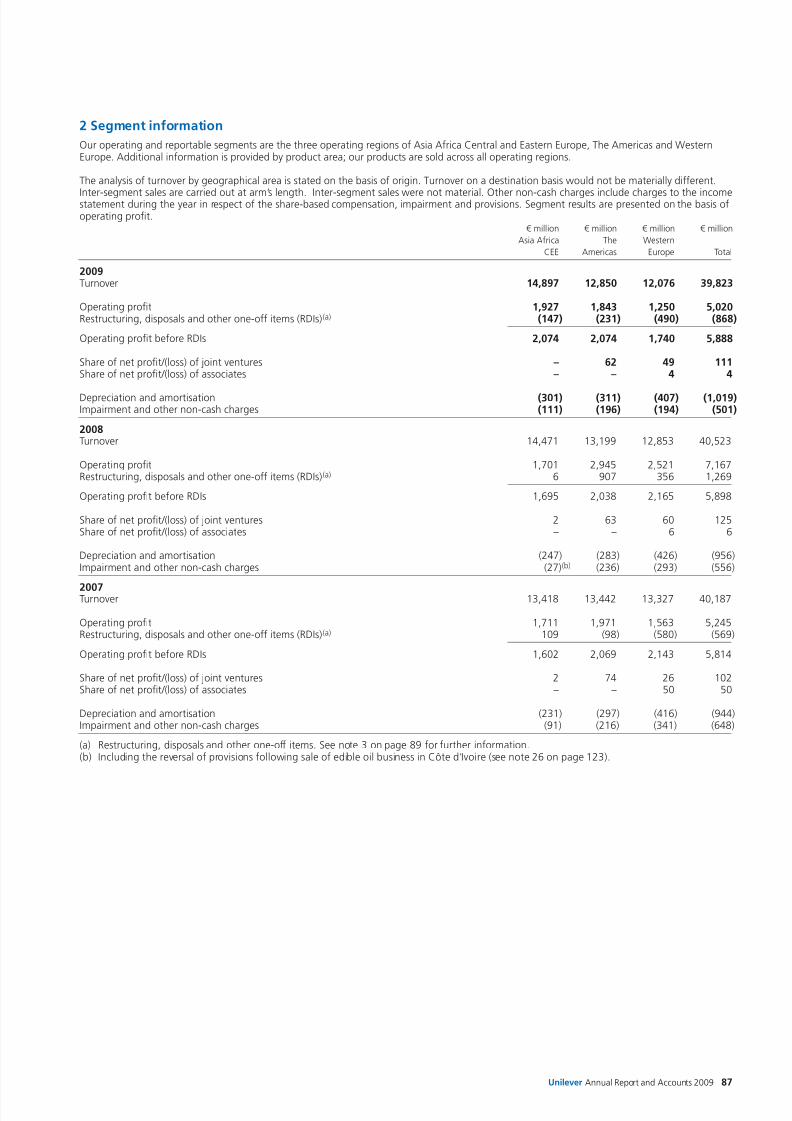
2 Segment information
Our operating and reportable segments are the three operating regions of Asia Africa Central and Eastern Europe, The Americas and WesternEurope. Additional information is provided by product area; our products are sold across all operating regions.
The analysis of turnover by geographical area is stated on the basis of origin. Turnover on a destination basis would not be materially different.
Inter-segment sales are carried out at arm’s length. Inter-segment sales were not material. Other non-cash charges include charges to the incomestatement during the year in respect of the share-based compensation, impairment and provisions. Segment results are presented on the basis ofoperating profit.
€ million € million € million € million
Asia Africa The Western
CEE Americas Europe Total
2009Turnover 14,897 12,850 12,076 39,823
Operating profit 1,927 1,843 1,250 5,020Restructuring, disposals and other one-off items (RDIs)(a) (147) (231) (490) (868)
Operating profit before RDIs 2,074 2,074 1,740 5,888
Share of net profit/(loss) of joint ventures – 62 49 111Share of net profit/(loss) of associates – – 4 4
Depreciation and amortisation (301) (311) (407) (1,019)Impairment and other non-cash charges (111) (196) (194) (501)
2008Turnover 14,471 13,199 12,853 40,523
Operating profit 1,701 2,945 2,521 7,167Restructuring, disposals and other one-off items (RDIs)(a) 6 907 356 1,269
Operating profit before RDIs 1,695 2,038 2,165 5,898
Share of net profit/(loss) of joint ventures 2 63 60 125Share of net profit/(loss) of associates – – 6 6
Depreciation and amortisation (247) (283) (426) (956)Impairment and other non-cash charges (27)(b) (236) (293) (556)
2007Turnover 13,418 13,442 13,327 40,187
Operating profit 1,711 1,971 1,563 5,245Restructuring, disposals and other one-off items (RDIs)(a) 109 (98) (580) (569)
Operating profit before RDIs 1,602 2,069 2,143 5,814
Share of net profit/(loss) of joint ventures 2 74 26 102Share of net profit/(loss) of associates – – 50 50
Depreciation and amortisation (231) (297) (416) (944)Impairment and other non-cash charges (91) (216) (341) (648)
(a) Restructuring, disposals and other one-off items. See note 3 on page 89 for further information.(b) Including the reversal of provisions following sale of edible oil business in Côte d’Ivoire (see note 26 on page 123).
8/8/2019 Financial Statements AR09
http://slidepdf.com/reader/full/financial-statements-ar09 14/54
Notes to the consolidated financial statements Unilever Group
88 Unilever Annual Report and Accounts 2009
Financial statements
2 Segment information (continued)
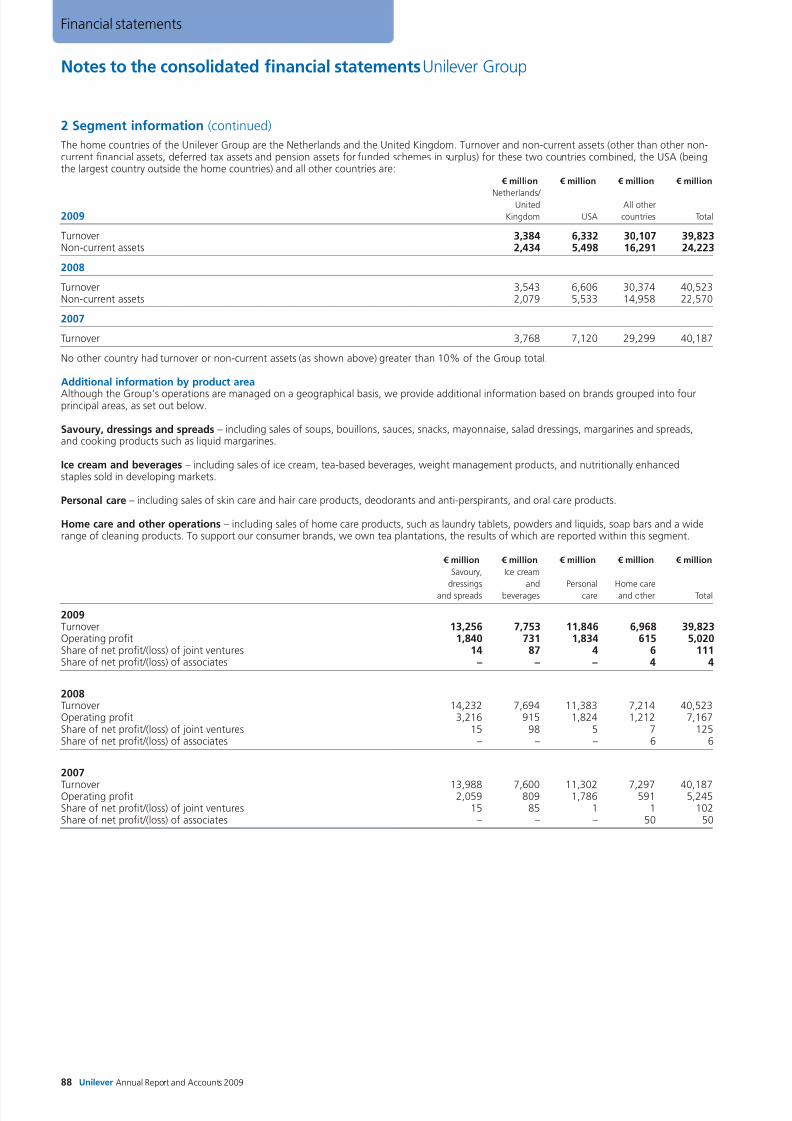
The home countries of the Unilever Group are the Netherlands and the United Kingdom. Turnover and non-current assets (other than other non-current financial assets, deferred tax assets and pension assets for funded schemes in surplus) for these two countries combined, the USA (beingthe largest country outside the home countries) and all other countries are:
€ million € million € million € million
Netherlands/ United All other
2009 Kingdom USA countries Total
Turnover 3,384 6,332 30,107 39,823Non-current assets 2,434 5,498 16,291 24,223
2008
Turnover 3,543 6,606 30,374 40,523Non-current assets 2,079 5,533 14,958 22,570
2007
Turnover 3,768 7,120 29,299 40,187
No other country had turnover or non-current assets (as shown above) greater than 10% of the Group total.
Additional information by product area
Although the Group’s operations are managed on a geographical basis, we provide additional information based on brands grouped into fourprincipal areas, as set out below.
Savoury, dressings and spreads – including sales of soups, bouillons, sauces, snacks, mayonnaise, salad dressings, margarines and spreads,and cooking products such as liquid margarines.
Ice cream and beverages – including sales of ice cream, tea-based beverages, weight management products, and nutritionally enhancedstaples sold in developing markets.
Personal care – including sales of skin care and hair care products, deodorants and anti-perspirants, and oral care products.
Home care and other operations – including sales of home care products, such as laundry tablets, powders and liquids, soap bars and a widerange of cleaning products. To support our consumer brands, we own tea plantations, the results of which are reported within this segment.
€ million € million € million € million € million
Savoury, Ice cream
dressings and Personal Home careand spreads beverages care and other Total
2009Turnover 13,256 7,753 11,846 6,968 39,823Operating profit 1,840 731 1,834 615 5,020Share of net profit/(loss) of joint ventures 14 87 4 6 111Share of net profit/(loss) of associates – – – 4 4
2008Turnover 14,232 7,694 11,383 7,214 40,523Operating profit 3,216 915 1,824 1,212 7,167Share of net profit/(loss) of joint ventures 15 98 5 7 125Share of net profit/(loss) of associates – – – 6 6
2007
Turnover 13,988 7,600 11,302 7,297 40,187Operating profit 2,059 809 1,786 591 5,245Share of net profit/(loss) of joint ventures 15 85 1 1 102Share of net profit/(loss) of associates – – – 50 50
8/8/2019 Financial Statements AR09
http://slidepdf.com/reader/full/financial-statements-ar09 15/54Unilever Annual Report and Accounts 2009 89
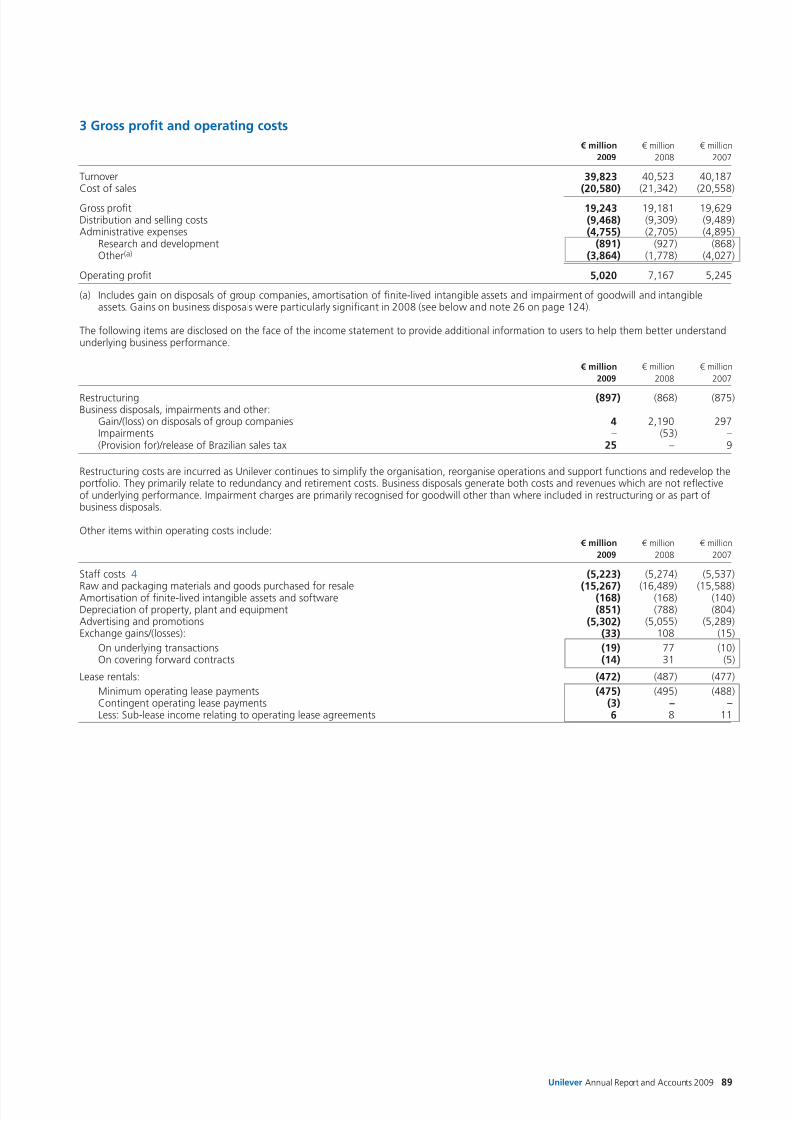
3 Gross profit and operating costs
€ million € million € million
2009 2008 2007
Turnover 39,823 40,523 40,187Cost of sales (20,580) (21,342) (20,558)
Gross profit 19,243 19,181 19,629Distribution and selling costs (9,468) (9,309) (9,489)Administrative expenses (4,755) (2,705) (4,895)
Research and development (891) (927) (868)Other(a) (3,864) (1,778) (4,027)
Operating profit 5,020 7,167 5,245
(a) Includes gain on disposals of group companies, amortisation of finite-lived intangible assets and impairment of goodwill and intangibleassets. Gains on business disposals were particularly significant in 2008 (see below and note 26 on page 124).
The following items are disclosed on the face of the income statement to provide additional information to users to help them better understandunderlying business performance.
€ million € million € million
2009 2008 2007
Restructuring (897) (868) (875)Business disposals, impairments and other:
Gain/(loss) on disposals of group companies 4 2,190 297Impairments – (53) –(Provision for)/release of Brazilian sales tax 25 – 9
Restructuring costs are incurred as Unilever continues to simplify the organisation, reorganise operations and support functions and redevelop theportfolio. They primarily relate to redundancy and retirement costs. Business disposals generate both costs and revenues which are not reflectiveof underlying performance. Impairment charges are primarily recognised for goodwill other than where included in restructuring or as part ofbusiness disposals.
Other items within operating costs include: € million € million € million
2009 2008 2007
Staff costs 4 (5,223) (5,274) (5,537)
Raw and packaging materials and goods purchased for resale (15,267) (16,489) (15,588)Amortisation of finite-lived intangible assets and software (168) (168) (140)Depreciation of property, plant and equipment (851) (788) (804)Advertising and promotions (5,302) (5,055) (5,289)Exchange gains/(losses): (33) 108 (15)
On underlying transactions (19) 77 (10)On covering forward contracts (14) 31 (5)
Lease rentals: (472) (487) (477)
Minimum operating lease payments (475) (495) (488)Contingent operating lease payments (3) – –Less: Sub-lease income relating to operating lease agreements 6 8 11
8/8/2019 Financial Statements AR09
http://slidepdf.com/reader/full/financial-statements-ar09 16/54
Notes to the consolidated financial statements Unilever Group
90 Unilever Annual Report and Accounts 2009
Financial statements
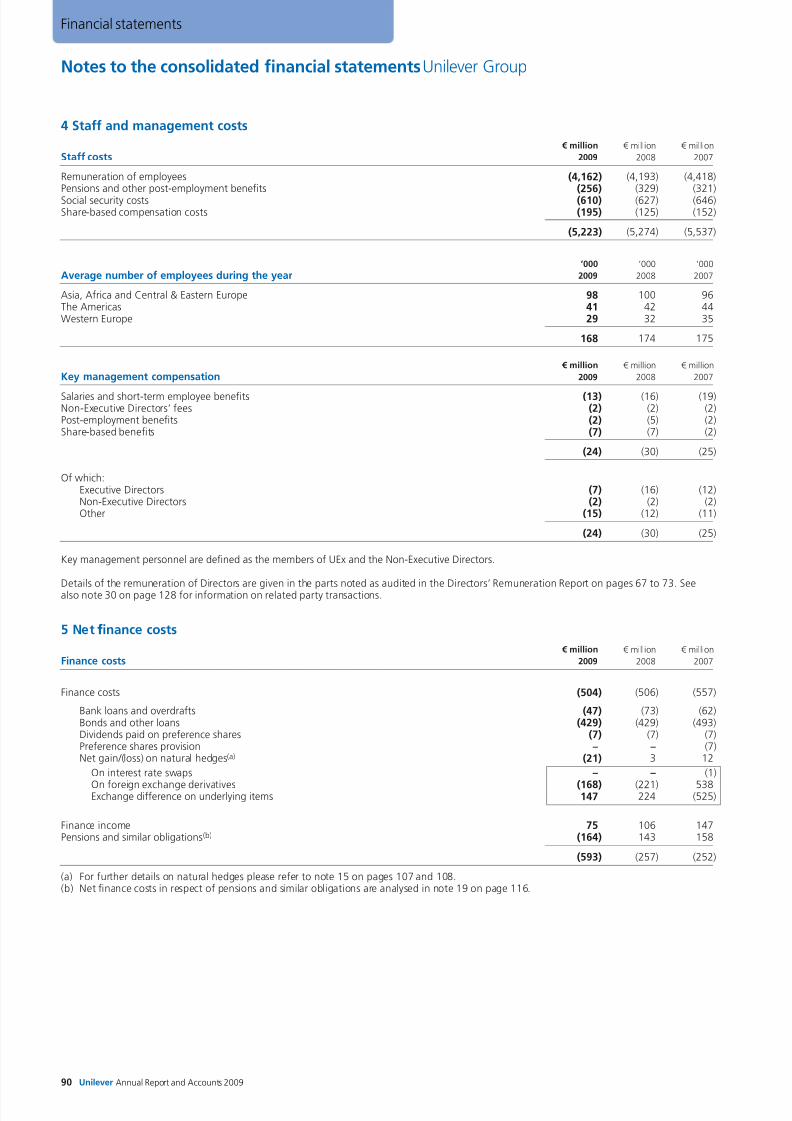
4 Staff and management costs
€ million € million € million
Staff costs 2009 2008 2007
Remuneration of employees (4,162) (4,193) (4,418)Pensions and other post-employment benefits (256) (329) (321)Social security costs (610) (627) (646)Share-based compensation costs (195) (125) (152)
(5,223) (5,274) (5,537)
’000 ’000 ’000
Average number of employees during the year 2009 2008 2007
Asia, Africa and Central & Eastern Europe 98 100 96The Americas 41 42 44Western Europe 29 32 35
168 174 175
€ million € million € million
Key management compensation 2009 2008 2007
Salaries and short-term employee benefits (13) (16) (19)Non-Executive Directors’ fees (2) (2) (2)Post-employment benefits (2) (5) (2)Share-based benefits (7) (7) (2)
(24) (30) (25)
Of which:Executive Directors (7) (16) (12)Non-Executive Directors (2) (2) (2)Other (15) (12) (11)
(24) (30) (25)
Key management personnel are defined as the members of UEx and the Non-Executive Directors.
Details of the remuneration of Directors are given in the parts noted as audited in the Directors’ Remuneration Report on pages 67 to 73. Seealso note 30 on page 128 for information on related party transactions.
5 Net ffinance costs
€ million € million € million
Finance costs 2009 2008 2007
Finance costs (504) (506) (557)
Bank loans and overdrafts (47) (73) (62)Bonds and other loans (429) (429) (493)Dividends paid on preference shares (7) (7) (7)Preference shares provision – – (7)Net gain/(loss) on natural hedges(a) (21) 3 12
On interest rate swaps – – (1)
On foreign exchange derivatives (168) (221) 538Exchange difference on underlying items 147 224 (525)
Finance income 75 106 147Pensions and similar obligations(b) (164) 143 158
(593) (257) (252)
(a) For further details on natural hedges please refer to note 15 on pages 107 and 108.(b) Net finance costs in respect of pensions and similar obligations are analysed in note 19 on page 116.
8/8/2019 Financial Statements AR09
http://slidepdf.com/reader/full/financial-statements-ar09 17/54Unilever Annual Report and Accounts 2009 91
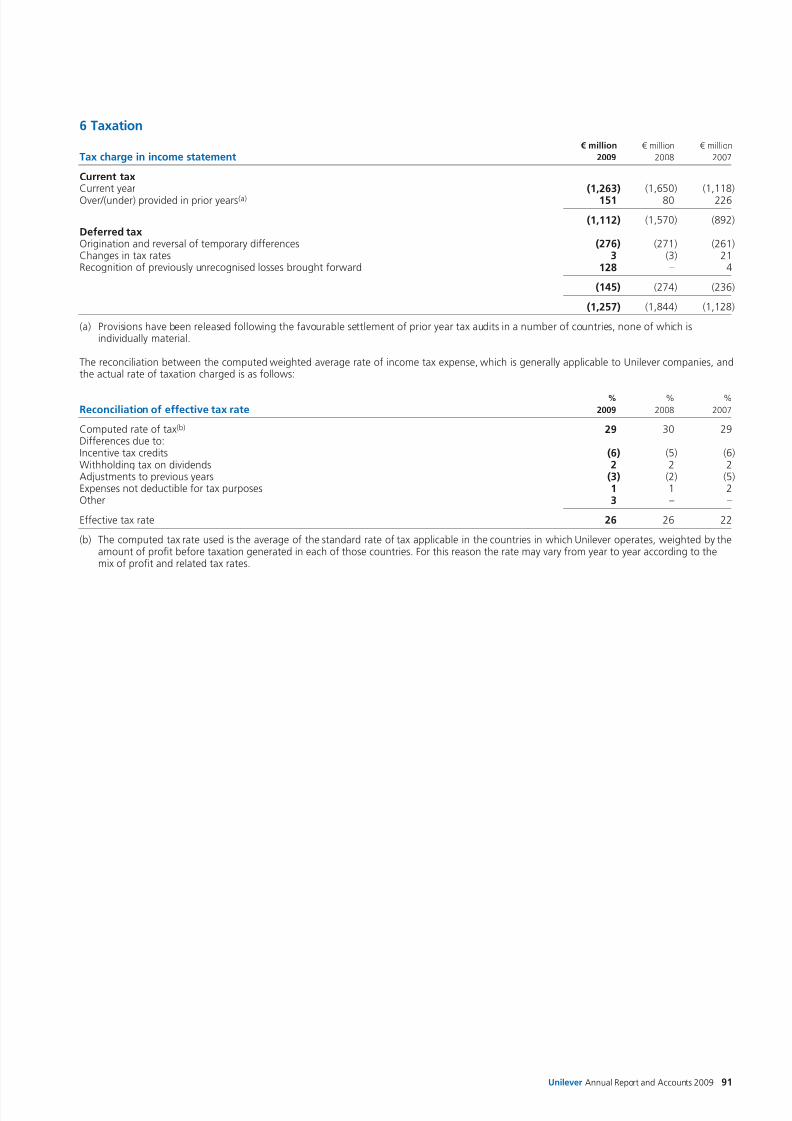
6 Taxation
€ million € million € million
Tax charge in income statement 2009 2008 2007
Current taxCurrent year (1,263) (1,650) (1,118)Over/(under) provided in prior years(a) 151 80 226
(1,112) (1,570) (892)Deferred taxOrigination and reversal of temporary differences (276) (271) (261)Changes in tax rates 3 (3) 21Recognition of previously unrecognised losses brought forward 128 – 4
(145) (274) (236)
(1,257) (1,844) (1,128)
(a) Provisions have been released following the favourable settlement of prior year tax audits in a number of countries, none of which isindividually material.
The reconciliation between the computed weighted average rate of income tax expense, which is generally applicable to Unilever companies, andthe actual rate of taxation charged is as follows:
% % %
Reconciliation of effective tax rate 2009 2008 2007
Computed rate of tax(b) 29 30 29Differences due to:Incentive tax credits (6) (5) (6)Withholding tax on dividends 2 2 2Adjustments to previous years (3) (2) (5)Expenses not deductible for tax purposes 1 1 2Other 3 – –
Effective tax rate 26 26 22
(b) The computed tax rate used is the average of the standard rate of tax applicable in the countries in which Unilever operates, weighted by theamount of profit before taxation generated in each of those countries. For this reason the rate may vary from year to year according to themix of profit and related tax rates.
8/8/2019 Financial Statements AR09
http://slidepdf.com/reader/full/financial-statements-ar09 18/54
Notes to the consolidated financial statements Unilever Group
92 Unilever Annual Report and Accounts 2009
Financial statements
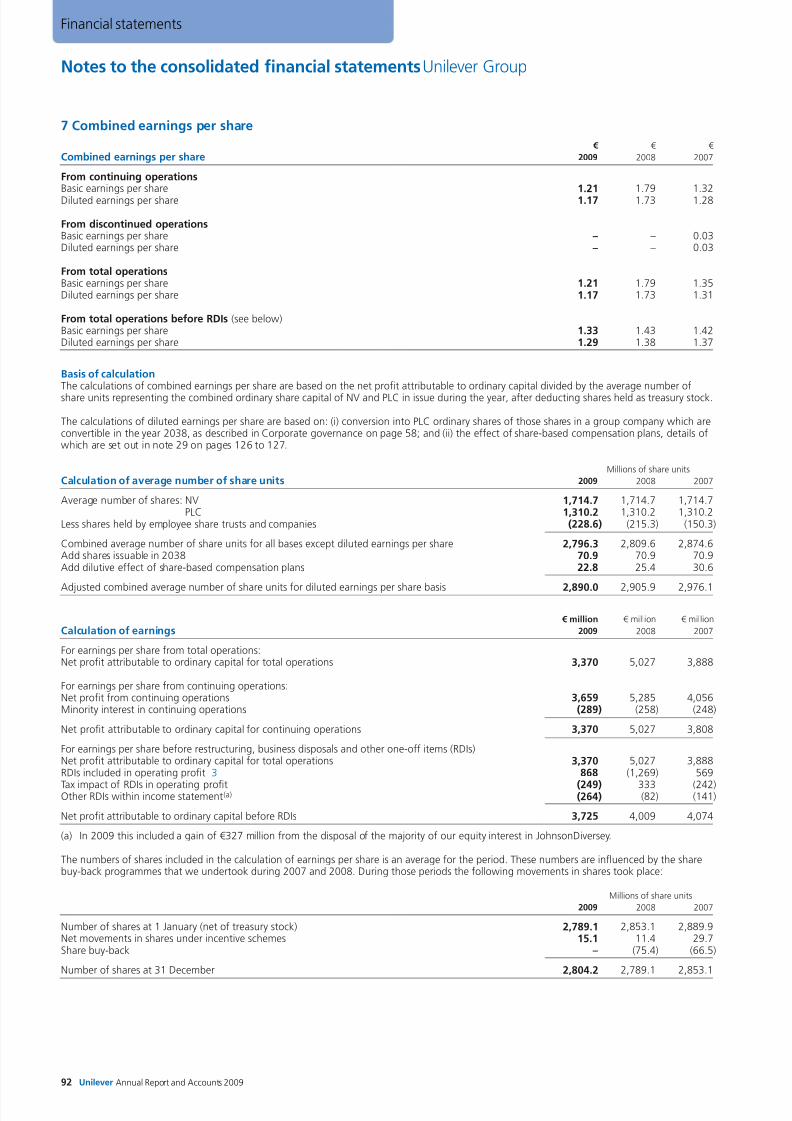
7 Combined earnings per share
€ € €
Combined earnings per share 2009 2008 2007
From continuing operationsBasic earnings per share 1.21 1.79 1.32Diluted earnings per share 1.17 1.73 1.28
From discontinued operationsBasic earnings per share – – 0.03Diluted earnings per share – – 0.03
From total operationsBasic earnings per share 1.21 1.79 1.35Diluted earnings per share 1.17 1.73 1.31
From total operations before RDIs (see below)Basic earnings per share 1.33 1.43 1.42Diluted earnings per share 1.29 1.38 1.37
Basis of calculation
The calculations of combined earnings per share are based on the net profit attributable to ordinary capital divided by the average number ofshare units representing the combined ordinary share capital of NV and PLC in issue during the year, after deducting shares held as treasury stock.
The calculations of diluted earnings per share are based on: (i) conversion into PLC ordinary shares of those shares in a group company which areconvertible in the year 2038, as described in Corporate governance on page 58; and (ii) the effect of share-based compensation plans, details ofwhich are set out in note 29 on pages 126 to 127.
Millions of share units
Calculation of average number of share units 2009 2008 2007
Average number of shares: NV 1,714.7 1,714.7 1,714.7PLC 1,310.2 1,310.2 1,310.2
Less shares held by employee share trusts and companies (228.6) (215.3) (150.3)
Combined average number of share units for all bases except diluted earnings per share 2,796.3 2,809.6 2,874.6Add shares issuable in 2038 70.9 70.9 70.9Add dilutive effect of share-based compensation plans 22.8 25.4 30.6
Adjusted combined average number of share units for diluted earnings per share basis 2,890.0 2,905.9 2,976.1
€ million € million € million
Calculation of earnings 2009 2008 2007
For earnings per share from total operations:Net profit attributable to ordinary capital for total operations 3,370 5,027 3,888
For earnings per share from continuing operations:Net profit from continuing operations 3,659 5,285 4,056Minority interest in continuing operations (289) (258) (248)
Net profit attributable to ordinary capital for continuing operations 3,370 5,027 3,808
For earnings per share before restructuring, business disposals and other one-off items (RDIs)Net profit attributable to ordinary capital for total operations 3,370 5,027 3,888RDIs included in operating profit 3 868 (1,269) 569
Tax impact of RDIs in operating profit (249) 333 (242)Other RDIs within income statement(a) (264) (82) (141)
Net profit attributable to ordinary capital before RDIs 3,725 4,009 4,074
(a) In 2009 this included a gain of €327 million from the disposal of the majority of our equity interest in JohnsonDiversey.
The numbers of shares included in the calculation of earnings per share is an average for the period. These numbers are influenced by the sharebuy-back programmes that we undertook during 2007 and 2008. During those periods the following movements in shares took place:
Millions of share units
2009 2008 2007
Number of shares at 1 January (net of treasury stock) 2,789.1 2,853.1 2,889.9Net movements in shares under incentive schemes 15.1 11.4 29.7Share buy-back – (75.4) (66.5)
Number of shares at 31 December 2,804.2 2,789.1 2,853.1
8/8/2019 Financial Statements AR09
http://slidepdf.com/reader/full/financial-statements-ar09 19/54Unilever Annual Report and Accounts 2009 93
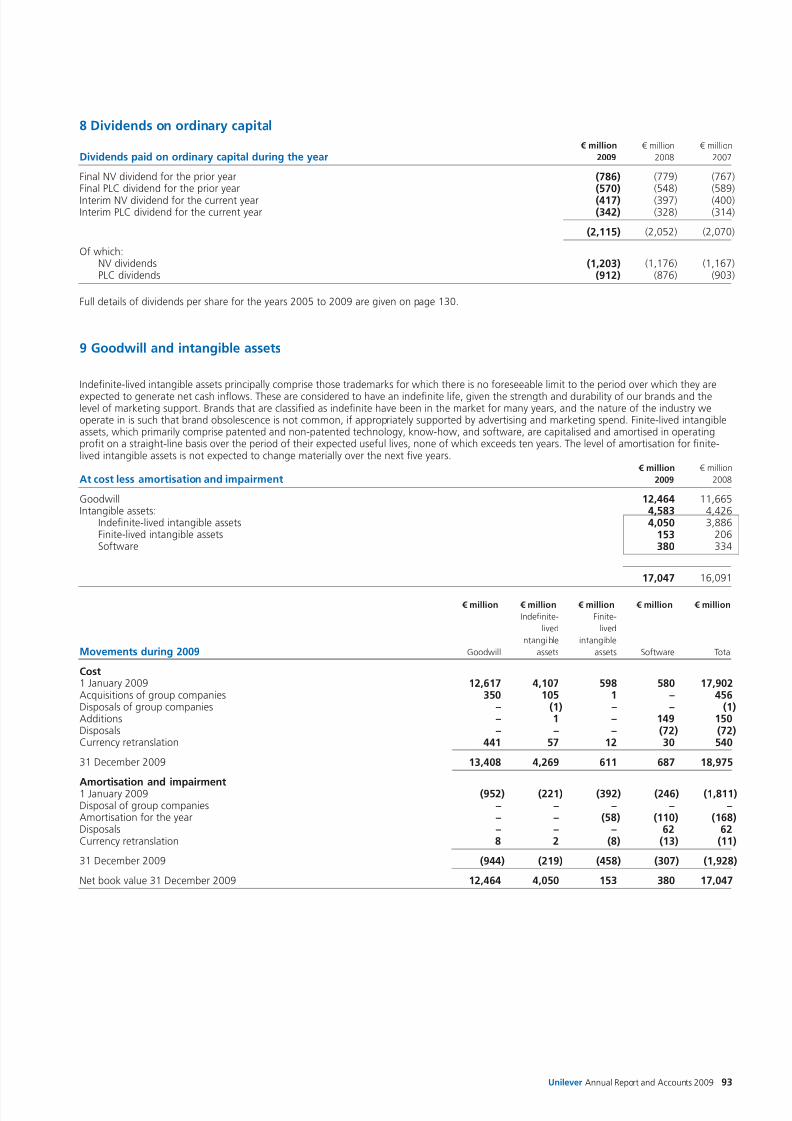
8 Dividends on ordinary capital
€ million € million € million
Dividends paid on ordinary capital during the year 2009 2008 2007
Final NV dividend for the prior year (786) (779) (767)Final PLC dividend for the prior year (570) (548) (589)Interim NV dividend for the current year (417) (397) (400)Interim PLC dividend for the current year (342) (328) (314)
(2,115) (2,052) (2,070)
Of which:NV dividends (1,203) (1,176) (1,167)PLC dividends (912) (876) (903)
Full details of dividends per share for the years 2005 to 2009 are given on page 130.
9 Goodwill and intangible assets
Indefinite-lived intangible assets principally comprise those trademarks for which there is no foreseeable limit to the period over which they areexpected to generate net cash inflows. These are considered to have an indefinite life, given the strength and durability of our brands and thelevel of marketing support. Brands that are classified as indefinite have been in the market for many years, and the nature of the industry weoperate in is such that brand obsolescence is not common, if appropriately supported by advertising and marketing spend. Finite-lived intangibleassets, which primarily comprise patented and non-patented technology, know-how, and software, are capitalised and amortised in operatingprofit on a straight-line basis over the period of their expected useful lives, none of which exceeds ten years. The level of amortisation for finite-lived intangible assets is not expected to change materially over the next five years.
€ million € million
At cost less amortisation and impairment 2009 2008
Goodwill 12,464 11,665Intangible assets: 4,583 4,426
Indefinite-lived intangible assets 4,050 3,886Finite-lived intangible assets 153 206Software 380 334
17,047 16,091
€ million € million € million € million € million
Indefinite- Finite-
lived lived
intangible intangible
Movements during 2009 Goodwill assets assets Software Total
Cost1 January 2009 12,617 4,107 598 580 17,902Acquisitions of group companies 350 105 1 – 456Disposals of group companies – (1) – – (1)Additions – 1 – 149 150Disposals – – – (72) (72)Currency retranslation 441 57 12 30 540
31 December 2009 13,408 4,269 611 687 18,975
Amortisation and impairment1 January 2009 (952) (221) (392) (246) (1,811)Disposal of group companies – – – – –Amortisation for the year – – (58) (110) (168)Disposals – – – 62 62Currency retranslation 8 2 (8) (13) (11)
31 December 2009 (944) (219) (458) (307) (1,928)
Net book value 31 December 2009 12,464 4,050 153 380 17,047
8/8/2019 Financial Statements AR09
http://slidepdf.com/reader/full/financial-statements-ar09 20/54
Notes to the consolidated financial statements Unilever Group
94 Unilever Annual Report and Accounts 2009
Financial statements
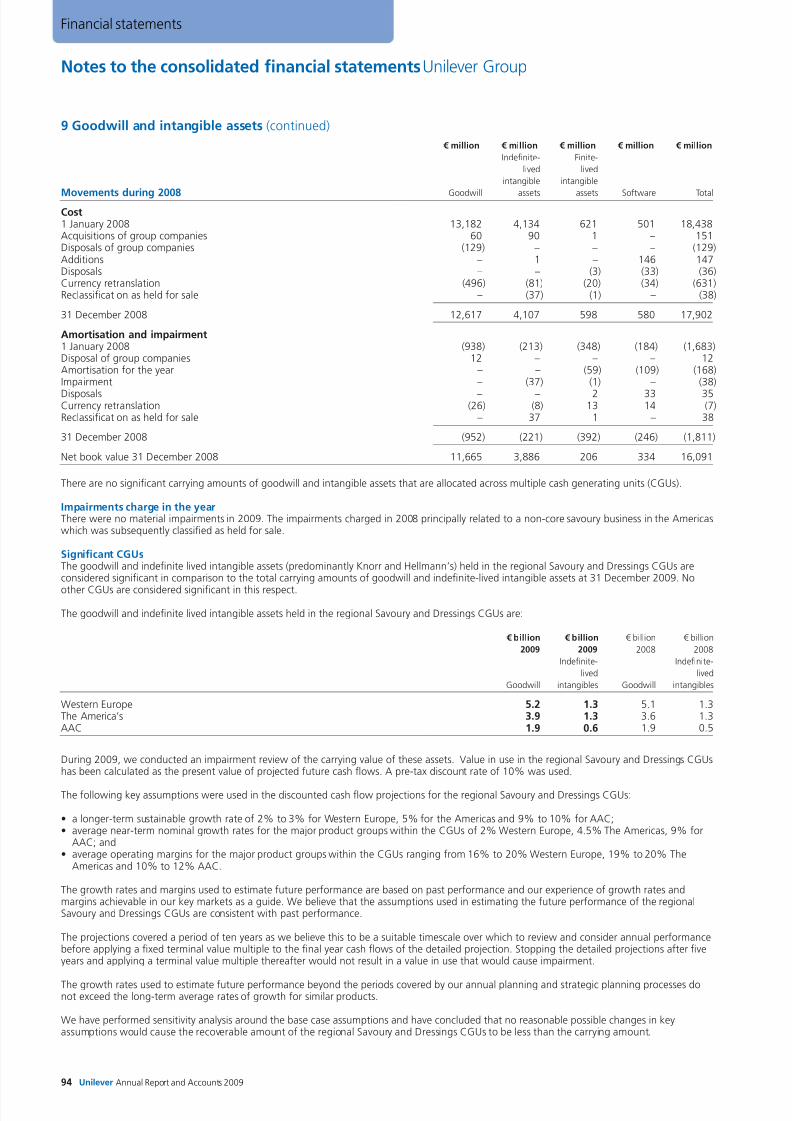
9 Goodwill and intangible assets (continued)
€ million € million € million € million € million
Indefinite- Finite-
lived lived
intangible intangible
Movements during 2008 Goodwill assets assets Software Total
Cost1 January 2008 13,182 4,134 621 501 18,438Acquisitions of group companies 60 90 1 – 151Disposals of group companies (129) – – – (129)Additions – 1 – 146 147Disposals – – (3) (33) (36)Currency retranslation (496) (81) (20) (34) (631)Reclassification as held for sale – (37) (1) – (38)
31 December 2008 12,617 4,107 598 580 17,902
Amortisation and impairment1 January 2008 (938) (213) (348) (184) (1,683)Disposal of group companies 12 – – – 12Amortisation for the year – – (59) (109) (168)Impairment – (37) (1) – (38)
Disposals – – 2 33 35Currency retranslation (26) (8) 13 14 (7)Reclassification as held for sale – 37 1 – 38
31 December 2008 (952) (221) (392) (246) (1,811)
Net book value 31 December 2008 11,665 3,886 206 334 16,091
There are no significant carrying amounts of goodwill and intangible assets that are allocated across multiple cash generating units (CGUs).
Impairments charge in the yearThere were no material impairments in 2009. The impairments charged in 2008 principally related to a non-core savoury business in the Americaswhich was subsequently classified as held for sale.
Significant CGUsThe goodwill and indefinite lived intangible assets (predominantly Knorr and Hellmann’s) held in the regional Savoury and Dressings CGUs areconsidered significant in comparison to the total carrying amounts of goodwill and indefinite-lived intangible assets at 31 December 2009. No
other CGUs are considered significant in this respect.
The goodwill and indefinite lived intangible assets held in the regional Savoury and Dressings CGUs are:
€ billion € billion € billion € billion
2009 2009 2008 2008
Indefinite- Indefinite-
lived lived
Goodwill intangibles Goodwill intangibles
Western Europe 5.2 1.3 5.1 1.3The America’s 3.9 1.3 3.6 1.3AAC 1.9 0.6 1.9 0.5
During 2009, we conducted an impairment review of the carrying value of these assets. Value in use in the regional Savoury and Dressings CGUshas been calculated as the present value of projected future cash flows. A pre-tax discount rate of 10% was used.
The following key assumptions were used in the discounted cash flow projections for the regional Savoury and Dressings CGUs:
• a longer-term sustainable growth rate of 2% to 3% for Western Europe, 5% for the Americas and 9% to 10% for AAC;• average near-term nominal growth rates for the major product groups within the CGUs of 2% Western Europe, 4.5% The Americas, 9% for
AAC; and• average operating margins for the major product groups within the CGUs ranging from 16% to 20% Western Europe, 19% to 20% The
Americas and 10% to 12% AAC.
The growth rates and margins used to estimate future performance are based on past performance and our experience of growth rates andmargins achievable in our key markets as a guide. We believe that the assumptions used in estimating the future performance of the regionalSavoury and Dressings CGUs are consistent with past performance.
The projections covered a period of ten years as we believe this to be a suitable timescale over which to review and consider annual performancebefore applying a fixed terminal value multiple to the final year cash flows of the detailed projection. Stopping the detailed projections after fiveyears and applying a terminal value multiple thereafter would not result in a value in use that would cause impairment.
The growth rates used to estimate future performance beyond the periods covered by our annual planning and strategic planning processes donot exceed the long-term average rates of growth for similar products.
We have performed sensitivity analysis around the base case assumptions and have concluded that no reasonable possible changes in keyassumptions would cause the recoverable amount of the regional Savoury and Dressings CGUs to be less than the carrying amount.
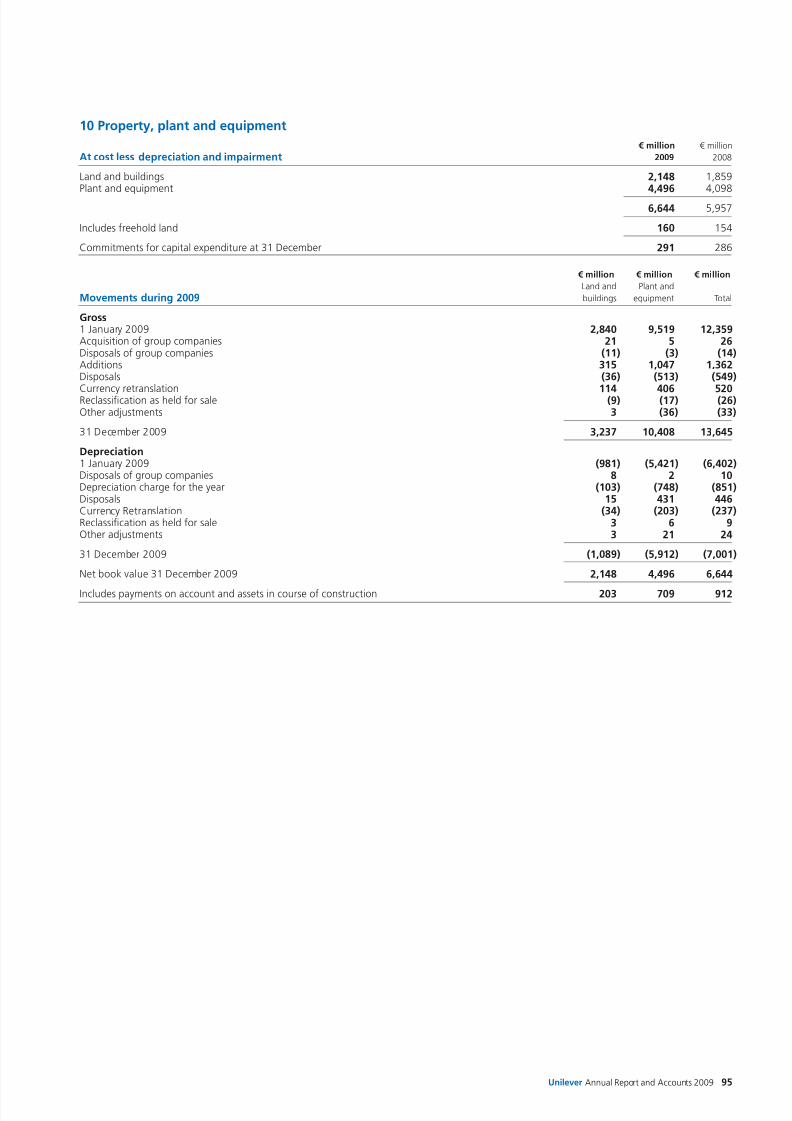
8/8/2019 Financial Statements AR09
http://slidepdf.com/reader/full/financial-statements-ar09 21/54Unilever Annual Report and Accounts 2009 95
10 Property, plant and equipment
€ million € million
At cost less depreciation and impairment 2009 2008
Land and buildings 2,148 1,859Plant and equipment 4,496 4,098
6,644 5,957
Includes freehold land 160 154
Commitments for capital expenditure at 31 December 291 286
€ million € million € million
Land and Plant and
Movements during 2009 buildings equipment Total
Gross1 January 2009 2,840 9,519 12,359Acquisition of group companies 21 5 26Disposals of group companies (11) (3) (14)Additions 315 1,047 1,362Disposals (36) (513) (549)
Currency retranslation 114 406 520Reclassification as held for sale (9) (17) (26)Other adjustments 3 (36) (33)
31 December 2009 3,237 10,408 13,645
Depreciation1 January 2009 (981) (5,421) (6,402)Disposals of group companies 8 2 10Depreciation charge for the year (103) (748) (851)Disposals 15 431 446Currency Retranslation (34) (203) (237)Reclassification as held for sale 3 6 9Other adjustments 3 21 24
31 December 2009 (1,089) (5,912) (7,001)
Net book value 31 December 2009 2,148 4,496 6,644
Includes payments on account and assets in course of construction 203 709 912
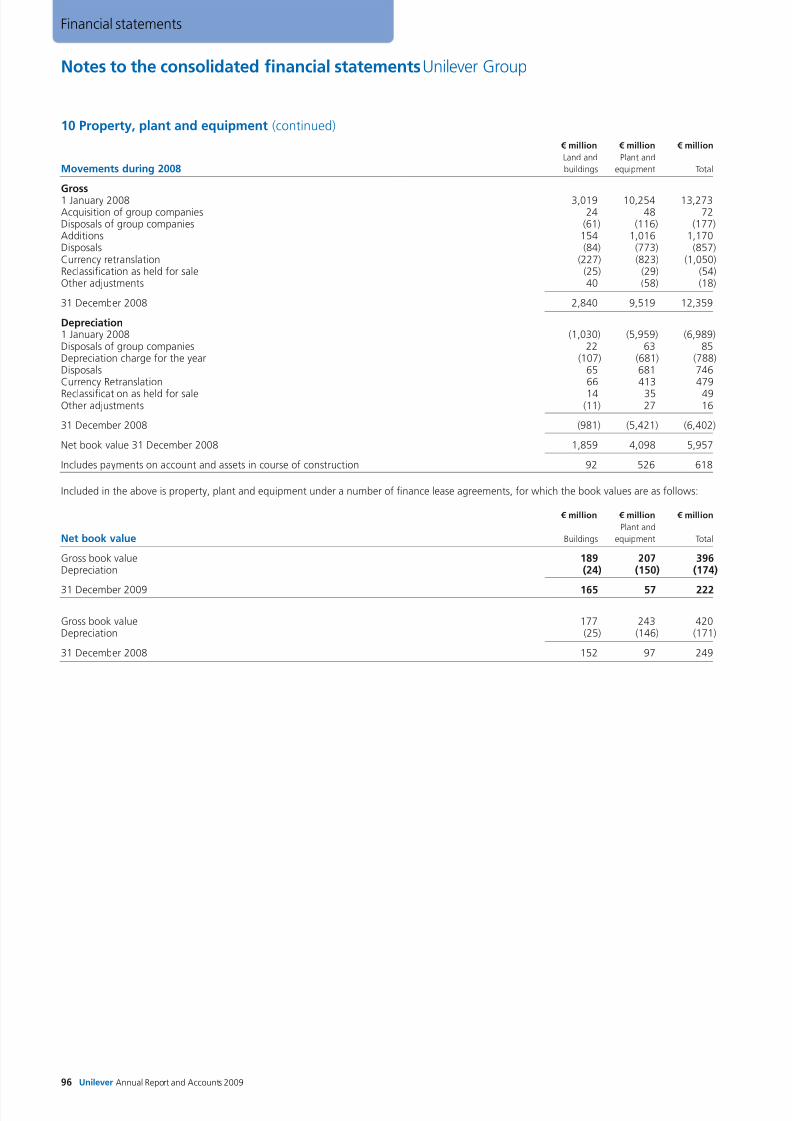
8/8/2019 Financial Statements AR09
http://slidepdf.com/reader/full/financial-statements-ar09 22/54
Notes to the consolidated financial statements Unilever Group
96 Unilever Annual Report and Accounts 2009
Financial statements
10 Property, plant and equipment (continued)
€ million € million € million
Land and Plant and
Movements during 2008 buildings equipment Total
Gross1 January 2008 3,019 10,254 13,273Acquisition of group companies 24 48 72Disposals of group companies (61) (116) (177)Additions 154 1,016 1,170Disposals (84) (773) (857)Currency retranslation (227) (823) (1,050)Reclassification as held for sale (25) (29) (54)Other adjustments 40 (58) (18)
31 December 2008 2,840 9,519 12,359
Depreciation1 January 2008 (1,030) (5,959) (6,989)Disposals of group companies 22 63 85Depreciation charge for the year (107) (681) (788)Disposals 65 681 746Currency Retranslation 66 413 479
Reclassification as held for sale 14 35 49Other adjustments (11) 27 16
31 December 2008 (981) (5,421) (6,402)
Net book value 31 December 2008 1,859 4,098 5,957
Includes payments on account and assets in course of construction 92 526 618
Included in the above is property, plant and equipment under a number of finance lease agreements, for which the book values are as follows:
€ million € million € million
Plant and
Net book value Buildings equipment Total
Gross book value 189 207 396Depreciation (24) (150) (174)
31 December 2009 165 57 222
Gross book value 177 243 420Depreciation (25) (146) (171)
31 December 2008 152 97 249
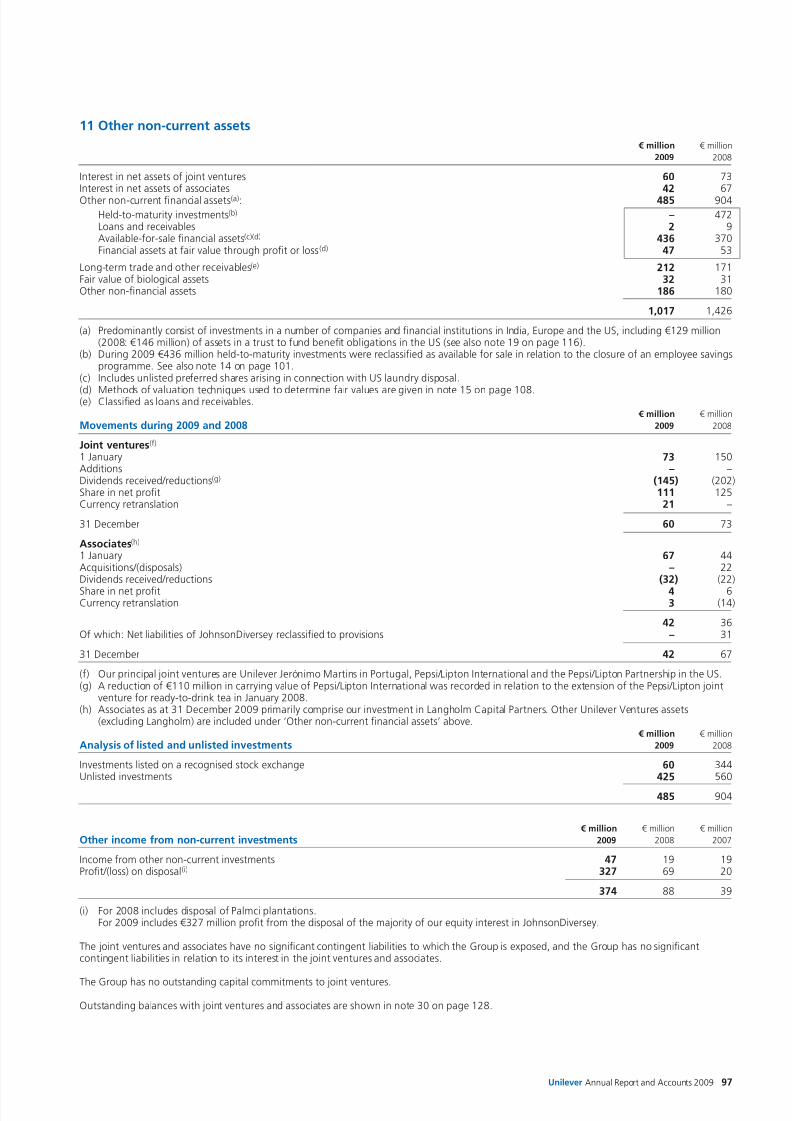
8/8/2019 Financial Statements AR09
http://slidepdf.com/reader/full/financial-statements-ar09 23/54Unilever Annual Report and Accounts 2009 97
11 Other non-current assets
€ million € million
2009 2008
Interest in net assets of joint ventures 60 73Interest in net assets of associates 42 67Other non-current financial assets(a): 485 904
Held-to-maturity investments(b) – 472Loans and receivables 2 9Available-for-sale financial assets(c)(d) 436 370Financial assets at fair value through profit or loss (d) 47 53
Long-term trade and other receivables(e) 212 171Fair value of biological assets 32 31Other non-financial assets 186 180
1,017 1,426
(a) Predominantly consist of investments in a number of companies and financial institutions in India, Europe and the US, including €129 million(2008: €146 million) of assets in a trust to fund benefit obligations in the US (see also note 19 on page 116).
(b) During 2009 €436 million held-to-maturity investments were reclassified as available for sale in relation to the closure of an employee savingsprogramme. See also note 14 on page 101.
(c) Includes unlisted preferred shares arising in connection with US laundry disposal.
(d) Methods of valuation techniques used to determine fair values are given in note 15 on page 108.(e) Classified as loans and receivables.
€ million € million
Movements during 2009 and 2008 2009 2008
Joint ventures(f)
1 January 73 150Additions – –Dividends received/reductions(g) (145) (202)Share in net profit 111 125Currency retranslation 21 –
31 December 60 73
Associates(h)
1 January 67 44Acquisitions/(disposals) – 22Dividends received/reductions (32) (22)Share in net profit 4 6Currency retranslation 3 (14)
42 36Of which: Net liabilities of JohnsonDiversey reclassified to provisions – 31
31 December 42 67
(f) Our principal joint ventures are Unilever Jerónimo Martins in Portugal, Pepsi/Lipton International and the Pepsi/Lipton Partnership in the US.(g) A reduction of €110 million in carrying value of Pepsi/Lipton International was recorded in relation to the extension of the Pepsi/Lipton joint
venture for ready-to-drink tea in January 2008.(h) Associates as at 31 December 2009 primarily comprise our investment in Langholm Capital Partners. Other Unilever Ventures assets
(excluding Langholm) are included under ‘Other non-current financial assets’ above. € million € million
Analysis of listed and unlisted investments 2009 2008
Investments listed on a recognised stock exchange 60 344
Unlisted investments 425 560485 904
€ million € million € million
Other income from non-current investments 2009 2008 2007
Income from other non-current investments 47 19 19Profit/(loss) on disposal(i) 327 69 20
374 88 39
(i) For 2008 includes disposal of Palmci plantations.For 2009 includes €327 million profit from the disposal of the majority of our equity interest in JohnsonDiversey.
The joint ventures and associates have no significant contingent liabilities to which the Group is exposed, and the Group has no significantcontingent liabilities in relation to its interest in the joint ventures and associates.
The Group has no outstanding capital commitments to joint ventures.
Outstanding balances with joint ventures and associates are shown in note 30 on page 128.
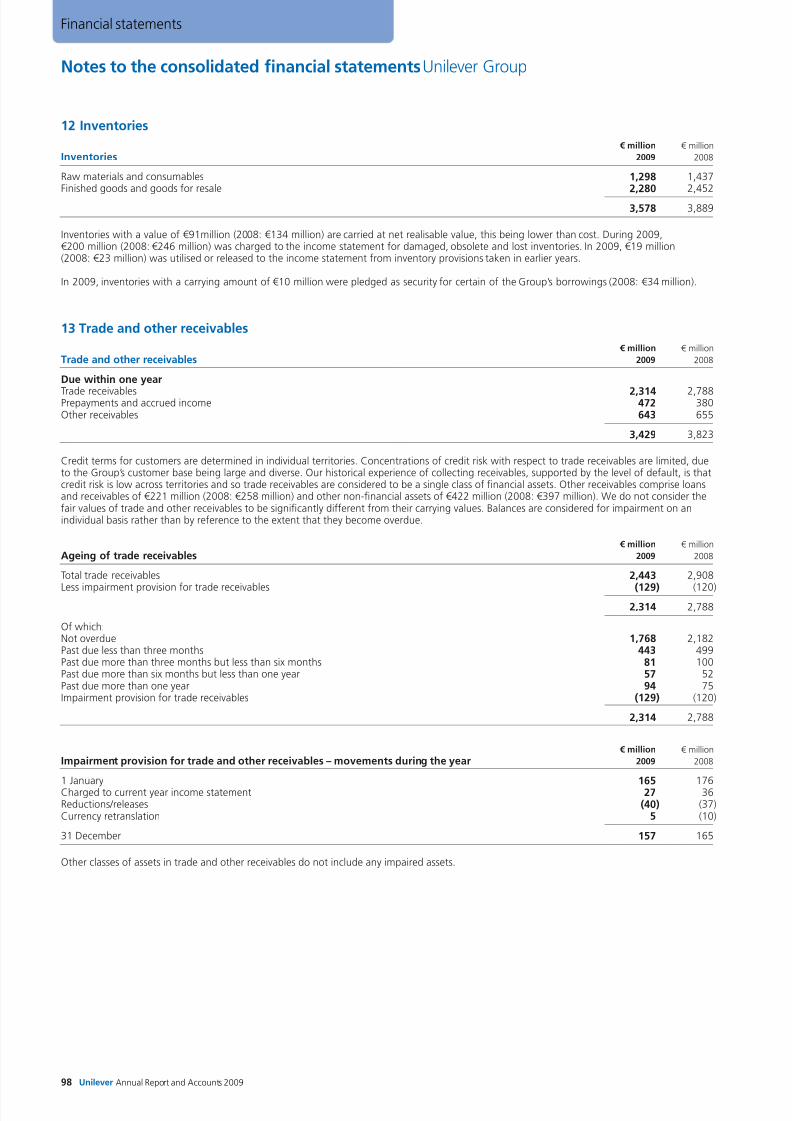
8/8/2019 Financial Statements AR09
http://slidepdf.com/reader/full/financial-statements-ar09 24/54
Notes to the consolidated financial statements Unilever Group
98 Unilever Annual Report and Accounts 2009
Financial statements
12 Inventories
€ million € million
Inventories 2009 2008
Raw materials and consumables 1,298 1,437Finished goods and goods for resale 2,280 2,452
3,578 3,889
Inventories with a value of €91million (2008: €134 million) are carried at net realisable value, this being lower than cost. During 2009,€200 million (2008: €246 million) was charged to the income statement for damaged, obsolete and lost inventories. In 2009, €19 million(2008: €23 million) was utilised or released to the income statement from inventory provisions taken in earlier years.
In 2009, inventories with a carrying amount of €10 million were pledged as security for certain of the Group’s borrowings (2008: €34 million).
13 Trade and other receivables
€ million € million
Trade and other receivables 2009 2008
Due within one year
Trade receivables 2,314 2,788Prepayments and accrued income 472 380Other receivables 643 655
3,429 3,823
Credit terms for customers are determined in individual territories. Concentrations of credit risk with respect to trade receivables are limited, dueto the Group’s customer base being large and diverse. Our historical experience of collecting receivables, supported by the level of default, is thatcredit risk is low across territories and so trade receivables are considered to be a single class of financial assets. Other receivables comprise loansand receivables of €221 million (2008: €258 million) and other non-financial assets of €422 million (2008: €397 million). We do not consider thefair values of trade and other receivables to be significantly different from their carrying values. Balances are considered for impairment on anindividual basis rather than by reference to the extent that they become overdue.
€ million € million
Ageing of trade receivables 2009 2008
Total trade receivables 2,443 2,908
Less impairment provision for trade receivables (129) (120)
2,314 2,788
Of which:Not overdue 1,768 2,182Past due less than three months 443 499Past due more than three months but less than six months 81 100Past due more than six months but less than one year 57 52Past due more than one year 94 75Impairment provision for trade receivables (129) (120)
2,314 2,788
€ million € million
Impairment provision for trade and other receivables – movements during the year 2009 2008
1 January 165 176Charged to current year income statement 27 36Reductions/releases (40) (37)Currency retranslation 5 (10)
31 December 157 165
Other classes of assets in trade and other receivables do not include any impaired assets.
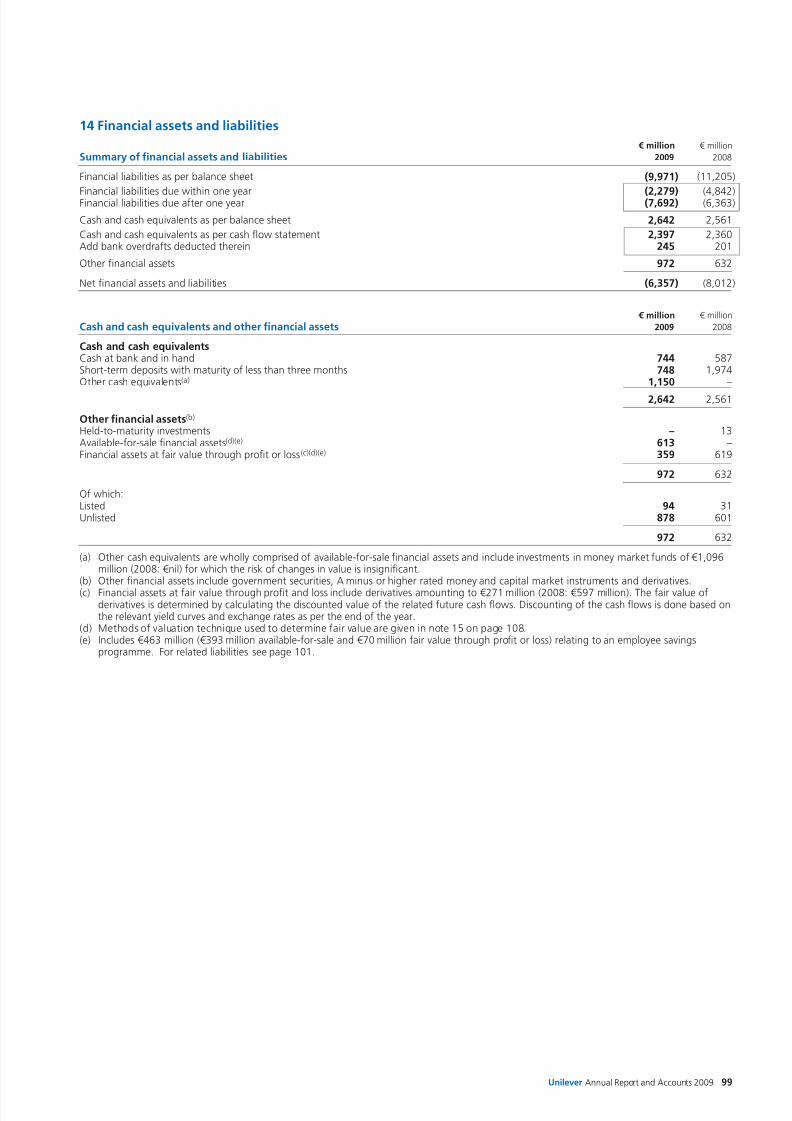
8/8/2019 Financial Statements AR09
http://slidepdf.com/reader/full/financial-statements-ar09 25/54Unilever Annual Report and Accounts 2009 99
14 Financial assets and liabilities
€ million € million
Summary of financial assets and liabilities 2009 2008
Financial liabilities as per balance sheet (9,971) (11,205)
Financial liabilities due within one year (2,279) (4,842)Financial liabilities due after one year (7,692) (6,363)
Cash and cash equivalents as per balance sheet 2,642 2,561
Cash and cash equivalents as per cash flow statement 2,397 2,360Add bank overdrafts deducted therein 245 201
Other financial assets 972 632
Net financial assets and liabilities (6,357) (8,012)
€ million € million
Cash and cash equivalents and other financial assets 2009 2008
Cash and cash equivalentsCash at bank and in hand 744 587Short-term deposits with maturity of less than three months 748 1,974Other cash equivalents(a) 1,150 –
2,642 2,561
Other financial assets(b)
Held-to-maturity investments – 13Available-for-sale financial assets(d)(e) 613 –Financial assets at fair value through profit or loss (c)(d)(e) 359 619
972 632
Of which:Listed 94 31Unlisted 878 601
972 632
(a) Other cash equivalents are wholly comprised of available-for-sale financial assets and include investments in money market funds of €1,096million (2008: €nil) for which the risk of changes in value is insignificant.
(b) Other financial assets include government securities, A minus or higher rated money and capital market instruments and derivatives.(c) Financial assets at fair value through profit and loss include derivatives amounting to €271 million (2008: €597 million). The fair value ofderivatives is determined by calculating the discounted value of the related future cash flows. Discounting of the cash flows is done based onthe relevant yield curves and exchange rates as per the end of the year.
(d) Methods of valuation technique used to determine fair value are given in note 15 on page 108.(e) Includes €463 million (€393 million available-for-sale and €70 million fair value through profit or loss) relating to an employee savings
programme. For related liabilities see page 101.
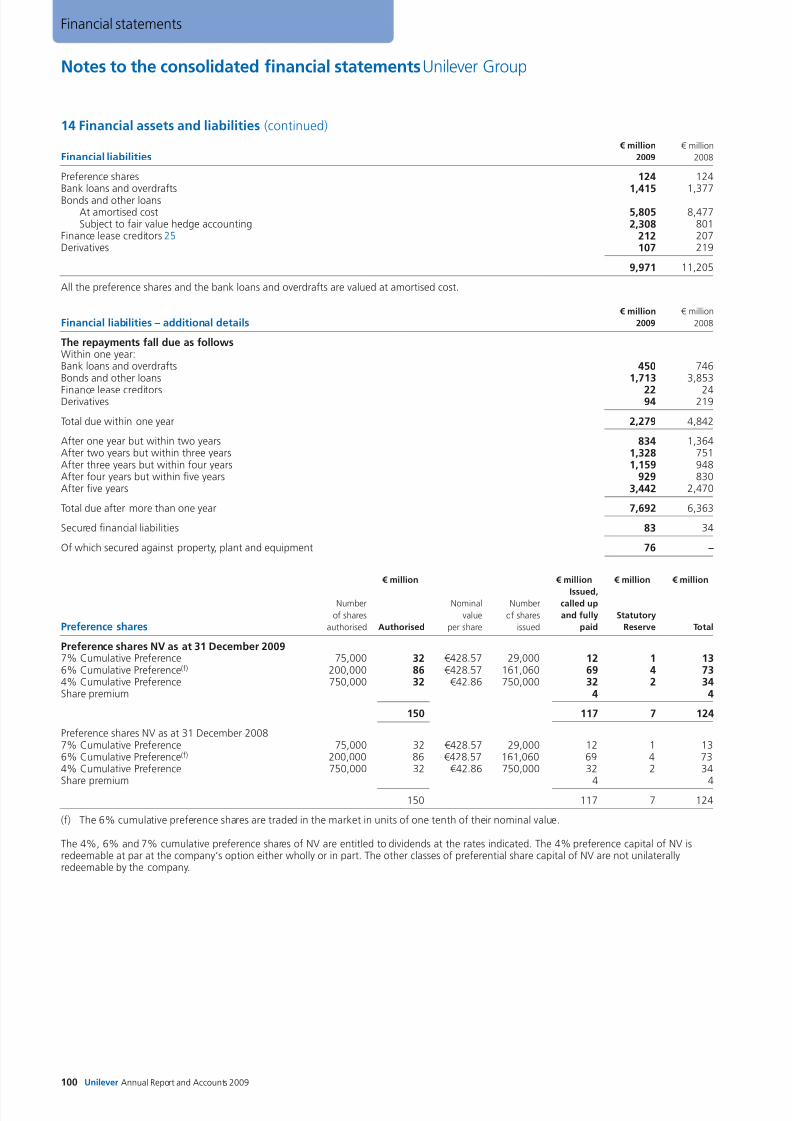
8/8/2019 Financial Statements AR09
http://slidepdf.com/reader/full/financial-statements-ar09 26/54
Notes to the consolidated financial statements Unilever Group
100 Unilever Annual Report and Accounts 2009
Financial statements
14 Financial assets and liabilities (continued)
€ million € million
Financial liabilities 2009 2008
Preference shares 124 124Bank loans and overdrafts 1,415 1,377Bonds and other loans
At amortised cost 5,805 8,477Subject to fair value hedge accounting 2,308 801
Finance lease creditors 25 212 207Derivatives 107 219
9,971 11,205
All the preference shares and the bank loans and overdrafts are valued at amortised cost.
€ million € million
Financial liabilities – additional details 2009 2008
The repayments fall due as followsWithin one year:Bank loans and overdrafts 450 746Bonds and other loans 1,713 3,853
Finance lease creditors 22 24Derivatives 94 219
Total due within one year 2,279 4,842
After one year but within two years 834 1,364After two years but within three years 1,328 751After three years but within four years 1,159 948After four years but within five years 929 830After five years 3,442 2,470
Total due after more than one year 7,692 6,363
Secured financial liabilities 83 34
Of which secured against property, plant and equipment 76 –
€ million € million € million € million
Issued,
Number Nominal Number called up
of shares value of shares and fully Statutory
Preference shares authorised Authorised per share issued paid Reserve Total
Preference shares NV as at 31 December 20097% Cumulative Preference 75,000 32 €428.57 29,000 12 1 136% Cumulative Preference(f) 200,000 86 €428.57 161,060 69 4 734% Cumulative Preference 750,000 32 €42.86 750,000 32 2 34Share premium 4 4
150 117 7 124
Preference shares NV as at 31 December 20087% Cumulative Preference 75,000 32 €428.57 29,000 12 1 136% Cumulative Preference(f) 200,000 86 €428.57 161,060 69 4 734% Cumulative Preference 750,000 32 €42.86 750,000 32 2 34
Share premium 4 4
150 117 7 124
(f) The 6% cumulative preference shares are traded in the market in units of one tenth of their nominal value.
The 4%, 6% and 7% cumulative preference shares of NV are entitled to dividends at the rates indicated. The 4% preference capital of NV isredeemable at par at the company‘s option either wholly or in part. The other classes of preferential share capital of NV are not unilaterallyredeemable by the company.
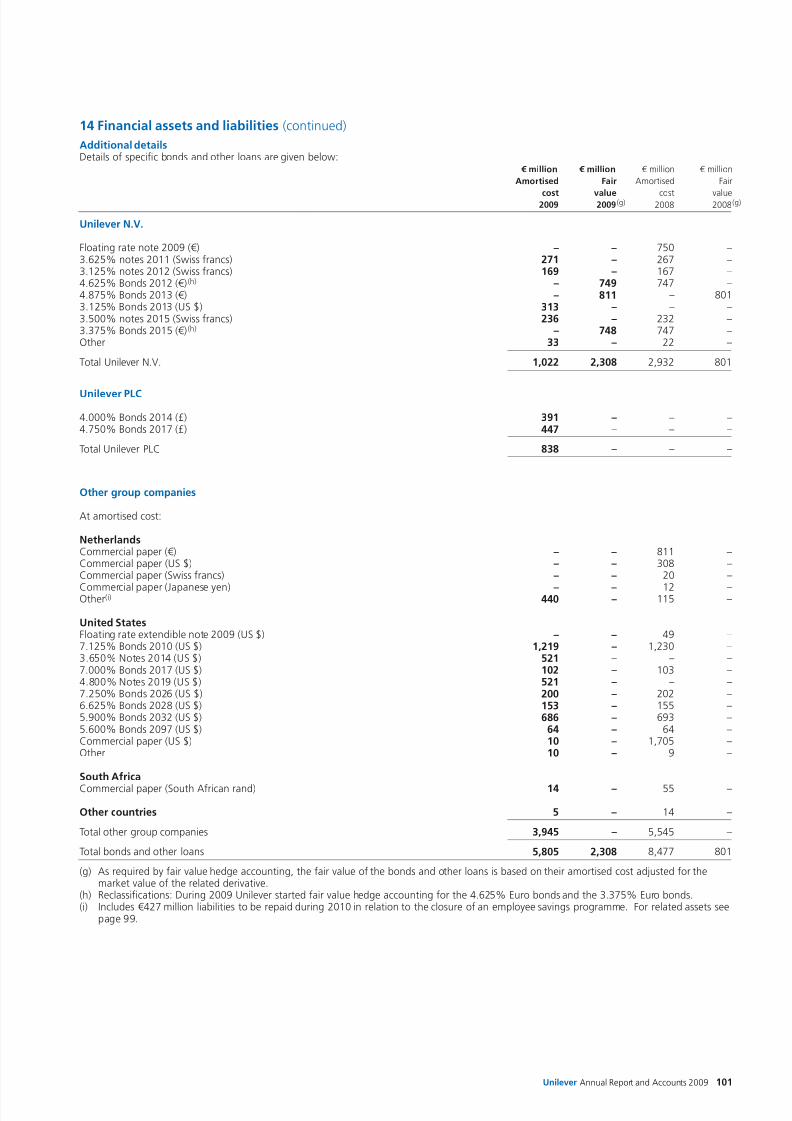
8/8/2019 Financial Statements AR09
http://slidepdf.com/reader/full/financial-statements-ar09 27/54Unilever Annual Report and Accounts 2009 101
14 Financial assets and liabilities (continued)
Additional detailsDetails of specific bonds and other loans are given below:
€ million € million € million € million
Amortised Fair Amortised Fair
cost value cost value2009 2009(g) 2008 2008(g)
Unilever N.V.
Floating rate note 2009 (€) – – 750 –3.625% notes 2011 (Swiss francs) 271 – 267 –3.125% notes 2012 (Swiss francs) 169 – 167 –4.625% Bonds 2012 (€)(h) – 749 747 –4.875% Bonds 2013 (€) – 811 – 8013.125% Bonds 2013 (US $) 313 – – –3.500% notes 2015 (Swiss francs) 236 – 232 –3.375% Bonds 2015 (€)(h) – 748 747 –Other 33 – 22 –
Total Unilever N.V. 1,022 2,308 2,932 801
Unilever PLC
4.000% Bonds 2014 (£) 391 – – –4.750% Bonds 2017 (£) 447 – – –
Total Unilever PLC 838 – – –
Other group companies
At amortised cost:
NetherlandsCommercial paper (€) – – 811 –Commercial paper (US $) – – 308 –Commercial paper (Swiss francs) – – 20 –
Commercial paper (Japanese yen) – – 12 –Other(i) 440 – 115 –
United StatesFloating rate extendible note 2009 (US $) – – 49 –7.125% Bonds 2010 (US $) 1,219 – 1,230 –3.650% Notes 2014 (US $) 521 – – –7.000% Bonds 2017 (US $) 102 – 103 –4.800% Notes 2019 (US $) 521 – – –7.250% Bonds 2026 (US $) 200 – 202 –6.625% Bonds 2028 (US $) 153 – 155 –5.900% Bonds 2032 (US $) 686 – 693 –5.600% Bonds 2097 (US $) 64 – 64 –Commercial paper (US $) 10 – 1,705 –Other 10 – 9 –
South AfricaCommercial paper (South African rand) 14 – 55 –
Other countries 5 – 14 –
Total other group companies 3,945 – 5,545 –
Total bonds and other loans 5,805 2,308 8,477 801
(g) As required by fair value hedge accounting, the fair value of the bonds and other loans is based on their amortised cost adjusted for themarket value of the related derivative.
(h) Reclassifications: During 2009 Unilever started fair value hedge accounting for the 4.625% Euro bonds and the 3.375% Euro bonds.(i) Includes €427 million liabilities to be repaid during 2010 in relation to the closure of an employee savings programme. For related assets see
page 99.
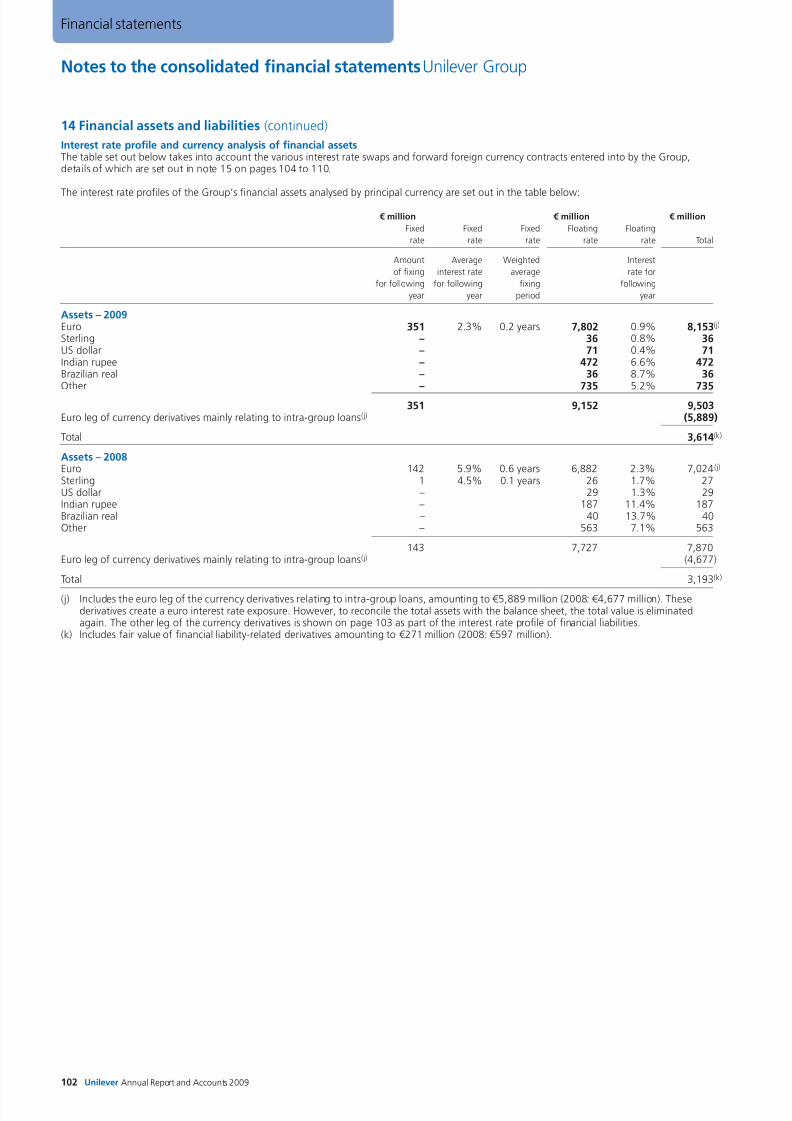
8/8/2019 Financial Statements AR09
http://slidepdf.com/reader/full/financial-statements-ar09 28/54
Notes to the consolidated financial statements Unilever Group
102 Unilever Annual Report and Accounts 2009
Financial statements
14 Financial assets and liabilities (continued)
Interest rate profile and currency analysis of financial assetsThe table set out below takes into account the various interest rate swaps and forward foreign currency contracts entered into by the Group,details of which are set out in note 15 on pages 104 to 110.
The interest rate profiles of the Group’s financial assets analysed by principal currency are set out in the table below:
€ million € million € million
Fixed Fixed Fixed Floating Floating
rate rate rate rate rate Total
Amount Average Weighted Interest
of fixing interest rate average rate for
for following for following fixing following
year year period year
Assets – 2009Euro 351 2.3% 0.2 years 7,802 0.9% 8,153(j)
Sterling – 36 0.8% 36US dollar – 71 0.4% 71Indian rupee – 472 6.6% 472Brazilian real – 36 8.7% 36
Other – 735 5.2% 735351 9,152 9,503
Euro leg of currency derivatives mainly relating to intra-group loans (j) (5,889)
Total 3,614(k)
Assets – 2008Euro 142 5.9% 0.6 years 6,882 2.3% 7,024(j)
Sterling 1 4.5% 0.1 years 26 1.7% 27US dollar – 29 1.3% 29Indian rupee – 187 11.4% 187Brazilian real – 40 13.7% 40Other – 563 7.1% 563
143 7,727 7,870Euro leg of currency derivatives mainly relating to intra-group loans (j) (4,677)
Total 3,193(k)
(j) Includes the euro leg of the currency derivatives relating to intra-group loans, amounting to €5,889 million (2008: €4,677 million). Thesederivatives create a euro interest rate exposure. However, to reconcile the total assets with the balance sheet, the total value is eliminatedagain. The other leg of the currency derivatives is shown on page 103 as part of the interest rate profile of financial liabilities.
(k) Includes fair value of financial liability-related derivatives amounting to €271 million (2008: €597 million).
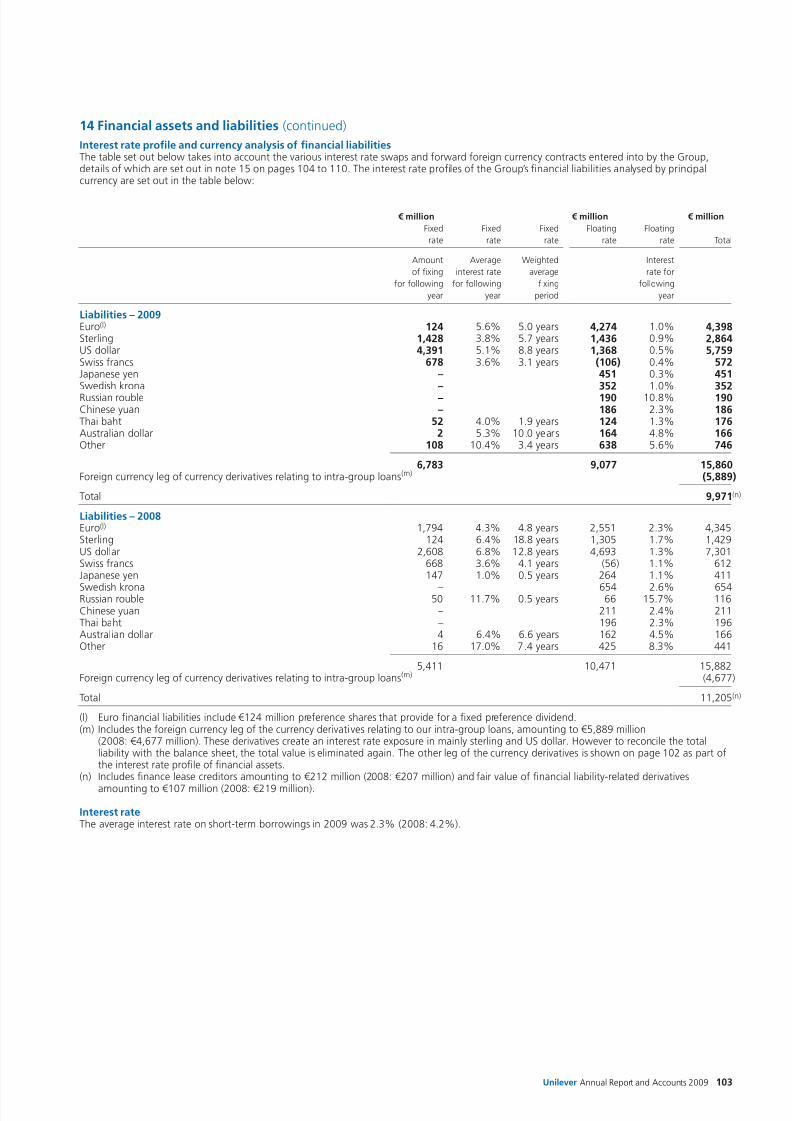
8/8/2019 Financial Statements AR09
http://slidepdf.com/reader/full/financial-statements-ar09 29/54Unilever Annual Report and Accounts 2009 103
14 Financial assets and liabilities (continued)
Interest rate profile and currency analysis of financial liabilitiesThe table set out below takes into account the various interest rate swaps and forward foreign currency contracts entered into by the Group,details of which are set out in note 15 on pages 104 to 110. The interest rate profiles of the Group’s financial liabilities analysed by principalcurrency are set out in the table below:
€ million € million € million
Fixed Fixed Fixed Floating Floating
rate rate rate rate rate Total
Amount Average Weighted Interest
of fixing interest rate average rate for
for following for following fixing following
year year period year
Liabilities – 2009Euro(l) 124 5.6% 5.0 years 4,274 1.0% 4,398Sterling 1,428 3.8% 5.7 years 1,436 0.9% 2,864US dollar 4,391 5.1% 8.8 years 1,368 0.5% 5,759Swiss francs 678 3.6% 3.1 years (106) 0.4% 572Japanese yen – 451 0.3% 451
Swedish krona – 352 1.0% 352Russian rouble – 190 10.8% 190Chinese yuan – 186 2.3% 186Thai baht 52 4.0% 1.9 years 124 1.3% 176Australian dollar 2 5.3% 10.0 years 164 4.8% 166Other 108 10.4% 3.4 years 638 5.6% 746
6,783 9,077 15,860Foreign currency leg of currency derivatives relating to intra-group loans (m) (5,889)
Total 9,971(n)
Liabilities – 2008Euro(l) 1,794 4.3% 4.8 years 2,551 2.3% 4,345Sterling 124 6.4% 18.8 years 1,305 1.7% 1,429US dollar 2,608 6.8% 12.8 years 4,693 1.3% 7,301Swiss francs 668 3.6% 4.1 years (56) 1.1% 612Japanese yen 147 1.0% 0.5 years 264 1.1% 411
Swedish krona – 654 2.6% 654Russian rouble 50 11.7% 0.5 years 66 15.7% 116Chinese yuan – 211 2.4% 211Thai baht – 196 2.3% 196Australian dollar 4 6.4% 6.6 years 162 4.5% 166Other 16 17.0% 7.4 years 425 8.3% 441
5,411 10,471 15,882Foreign currency leg of currency derivatives relating to intra-group loans (m) (4,677)
Total 11,205(n)
(l) Euro financial liabilities include €124 million preference shares that provide for a fixed preference dividend.(m) Includes the foreign currency leg of the currency derivatives relating to our intra-group loans, amounting to €5,889 million
(2008: €4,677 million). These derivatives create an interest rate exposure in mainly sterling and US dollar. However to reconcile the totalliability with the balance sheet, the total value is eliminated again. The other leg of the currency derivatives is shown on page 102 as part ofthe interest rate profile of financial assets.
(n) Includes finance lease creditors amounting to €212 million (2008: €207 million) and fair value of financial liability-related derivativesamounting to €107 million (2008: €219 million).
Interest rateThe average interest rate on short-term borrowings in 2009 was 2.3% (2008: 4.2%).
8/8/2019 Financial Statements AR09
http://slidepdf.com/reader/full/financial-statements-ar09 30/54
Notes to the consolidated financial statements Unilever Group
104 Unilever Annual Report and Accounts 2009
Financial statements
15 Financial instruments and treasury risk management
Uncertainty and volatility in the financial markets: impact on TreasuryWe believe our strong single-A rating and active financial management have served us well in the current financial uncertainty. Maintaining ourstrong single-A rating has been and will remain a key priority.
To cope with the volatility and uncertainty in the financial markets, we undertook, amongst others, the following actions:
Liquidity management:• During 2009 we issued four bonds at competitive rates for a total of €2.2 billion to take advantage of historically low long term interest rates;• As a result, we have been able to keep commercial paper at a low level, issuing at significant discounts to Libor, when needed; and• As the business successfully managed working capital positions throughout the year, Unilever closed the year with a cash and cash equivalents
balance of around €2.6 billion.
Counterparty exposures:We regularly reviewed and tightened counterparty limits. Banking exposures were actively monitored on a daily basis. During the year most ofour deposits remained on an overnight basis providing maximum flexibility. Unilever benefits from collateral agreements with our principal banks(see also page 106) based on which banks need to deposit securities and/or cash as collateral for their obligations in respect of derivative financialinstruments. Unilever did not encounter any material counterparty exposure loss from financial institutions during 2009.
Funding costs:Throughout the year, in general, credit spreads have decreased significantly but remain volatile. During 2009 we were able to issue commercialpaper and bonds at competitive rates, with a very good reception by the markets.
Bank facility renewal:Our bank facilities are renewed annually. On 31 December 2009 we had US $6,050 million of undrawn committed facilities. For further details,see ’Liquidity risk' section below.
Treasury risk managementUnilever manages a variety of market risks, including the effects of changes in foreign exchange rates, interest rates, liquidity and counterpartyrisks.
Currency risksBecause of Unilever’s broad operational reach, it is subject to risks from changes in foreign currency values that could affect earnings. As a practicalmatter, it is not feasible to fully hedge these fluctuations. Unilever does have a foreign exchange policy that requires operating companies to managetrading and financial foreign exchange exposures within prescribed limits. This is achieved primarily through the use of forward foreign exchangecontracts. On a case-by-case basis, depending on potential income statement volatility that can be caused by the fair value movement of thederivative, companies decide whether or not to apply cash flow hedge accounting. Regional groups monitor compliance with this foreignexchange policy. At the end of 2009, there was no material exposure from companies holding assets and liabilities other than in their functional
currency.
In addition, as Unilever conducts business in many foreign currencies but publishes its financial statements and measures its performance in euros,it is subject to exchange risk due to the effects that exchange rate movements have on the translation of the underlying net assets of its foreignsubsidiaries. Unilever aims to minimise its foreign exchange exposure in operating companies by borrowing in the local currency, except whereinhibited by local regulations, lack of local liquidity or local market conditions. For those countries that in the view of management have asubstantial retranslation risk, Unilever may decide on a case-by-case basis, taking into account amongst other factors the impact on the incomestatement, to hedge such net investments. This is achieved through the use of forward foreign exchange contracts on which hedge accounting isapplied. Nevertheless, from time to time, currency revaluations on unhedged investments will trigger exchange translation movements in thebalance sheet.
Interest rate risksUnilever has an interest rate management policy aimed at achieving an optimal balance between fixed and floating rate interest rate exposures onexpected net debt (gross borrowings minus cash and cash equivalents). The objective of the policy is to minimise annual interest costs and toreduce volatility. This is achieved by issuing fixed rate long-term debt and by modifying the interest rate exposure of debt and cash positionsthrough the use of interest rate swaps. The fixing levels for the next five years are managed within agreed fixing bands, with minimum andmaximum fixing level percentages, decreasing by 10 percentage points per calendar year. The minimum level is set to avoid unacceptable interest
cost volatility and the maximum level is set to prevent over-fixing, recognising that future debt levels can be volatile.
At the end of 2009, interest rates were fixed on approximately 95% of the projected net of cash and financial liability positions for 2010, slightlyhigher than 90%, the upper limit of the band due to the good cash delivery from the business and 75% for 2011 (compared with 56% for 2009and 51% for 2010 at the end of 2008).
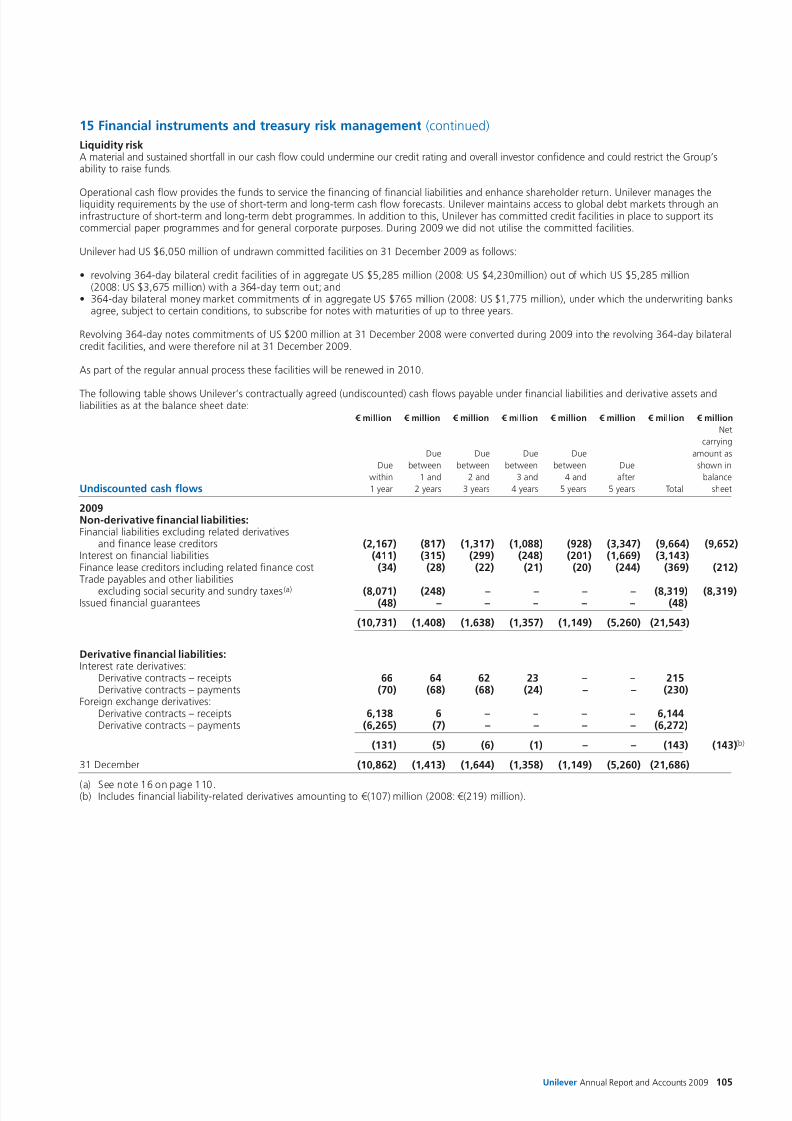
8/8/2019 Financial Statements AR09
http://slidepdf.com/reader/full/financial-statements-ar09 31/54Unilever Annual Report and Accounts 2009 105
15 Financial instruments and treasury risk management (continued)
Liquidity riskA material and sustained shortfall in our cash flow could undermine our credit rating and overall investor confidence and could restrict the Group’sability to raise funds.
Operational cash flow provides the funds to service the financing of financial liabilities and enhance shareholder return. Unilever manages theliquidity requirements by the use of short-term and long-term cash flow forecasts. Unilever maintains access to global debt markets through aninfrastructure of short-term and long-term debt programmes. In addition to this, Unilever has committed credit facilities in place to support itscommercial paper programmes and for general corporate purposes. During 2009 we did not utilise the committed facilities.
Unilever had US $6,050 million of undrawn committed facilities on 31 December 2009 as follows:
• revolving 364-day bilateral credit facilities of in aggregate US $5,285 million (2008: US $4,230million) out of which US $5,285 million(2008: US $3,675 million) with a 364-day term out; and
• 364-day bilateral money market commitments of in aggregate US $765 million (2008: US $1,775 million), under which the underwriting banksagree, subject to certain conditions, to subscribe for notes with maturities of up to three years.
Revolving 364-day notes commitments of US $200 million at 31 December 2008 were converted during 2009 into the revolving 364-day bilateralcredit facilities, and were therefore nil at 31 December 2009.
As part of the regular annual process these facilities will be renewed in 2010.
The following table shows Unilever’s contractually agreed (undiscounted) cash flows payable under financial liabilities and derivative assets andliabilities as at the balance sheet date:
€ million € million € million € million € million € million € million € million
Net
carrying
Due Due Due Due amount as
Due between between between between Due shown in
within 1 and 2 and 3 and 4 and after balance
Undiscounted cash flows 1 year 2 years 3 years 4 years 5 years 5 years Total sheet
2009Non-derivative financial liabilities:Financial liabilities excluding related derivatives
and finance lease creditors (2,167) (817) (1,317) (1,088) (928) (3,347) (9,664) (9,652)Interest on financial liabilities (411) (315) (299) (248) (201) (1,669) (3,143)Finance lease creditors including related finance cost (34) (28) (22) (21) (20) (244) (369) (212)Trade payables and other liabilities
excluding social security and sundry taxes (a) (8,071) (248) – – – – (8,319) (8,319)Issued financial guarantees (48) – – – – – (48)
(10,731) (1,408) (1,638) (1,357) (1,149) (5,260) (21,543)
Derivative financial liabilities:Interest rate derivatives:
Derivative contracts – receipts 66 64 62 23 – – 215Derivative contracts – payments (70) (68) (68) (24) – – (230)
Foreign exchange derivatives:Derivative contracts – receipts 6,138 6 – – – – 6,144Derivative contracts – payments (6,265) (7) – – – – (6,272)
(131) (5) (6) (1) – – (143) (143)(b)
31 December (10,862) (1,413) (1,644) (1,358) (1,149) (5,260) (21,686)
(a) See note 16 on page 110.(b) Includes financial liability-related derivatives amounting to €(107) million (2008: €(219) million).
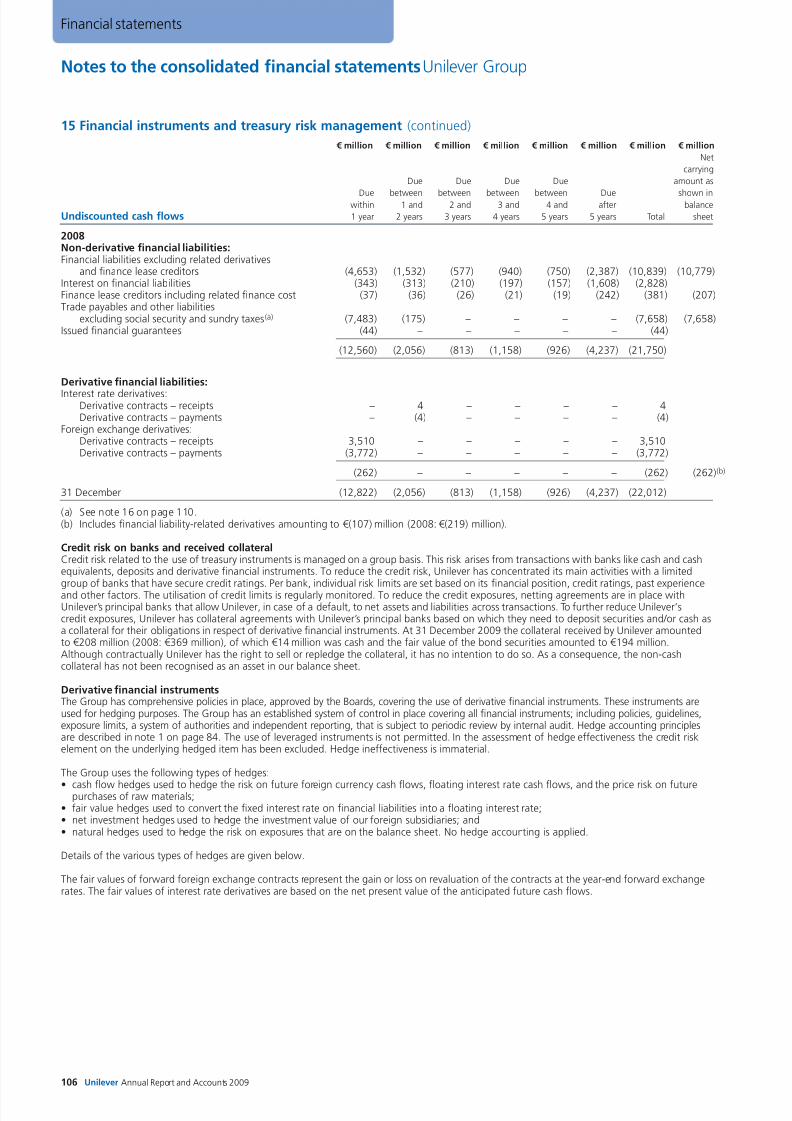
8/8/2019 Financial Statements AR09
http://slidepdf.com/reader/full/financial-statements-ar09 32/54
Notes to the consolidated financial statements Unilever Group
106 Unilever Annual Report and Accounts 2009
Financial statements
15 Financial instruments and treasury risk management (continued)
€ million € million € million € million € million € million € million € million
Net
carrying
Due Due Due Due amount as
Due between between between between Due shown inwithin 1 and 2 and 3 and 4 and after balance
Undiscounted cash flows 1 year 2 years 3 years 4 years 5 years 5 years Total sheet
2008Non-derivative financial liabilities:Financial liabilities excluding related derivatives
and finance lease creditors (4,653) (1,532) (577) (940) (750) (2,387) (10,839) (10,779)Interest on financial liabilities (343) (313) (210) (197) (157) (1,608) (2,828)Finance lease creditors including related finance cost (37) (36) (26) (21) (19) (242) (381) (207)Trade payables and other liabilities
excluding social security and sundry taxes(a) (7,483) (175) – – – – (7,658) (7,658)Issued financial guarantees (44) – – – – – (44)
(12,560) (2,056) (813) (1,158) (926) (4,237) (21,750)
Derivative financial liabilities:
Interest rate derivatives:Derivative contracts – receipts – 4 – – – – 4Derivative contracts – payments – (4) – – – – (4)
Foreign exchange derivatives:Derivative contracts – receipts 3,510 – – – – – 3,510Derivative contracts – payments (3,772) – – – – – (3,772)
(262) – – – – – (262) (262)(b)
31 December (12,822) (2,056) (813) (1,158) (926) (4,237) (22,012)
(a) See note 16 on page 110.(b) Includes financial liability-related derivatives amounting to €(107) million (2008: €(219) million).
Credit risk on banks and received collateralCredit risk related to the use of treasury instruments is managed on a group basis. This risk arises from transactions with banks like cash and cashequivalents, deposits and derivative financial instruments. To reduce the credit risk, Unilever has concentrated its main activities with a limited
group of banks that have secure credit ratings. Per bank, individual risk limits are set based on its financial position, credit ratings, past experienceand other factors. The utilisation of credit limits is regularly monitored. To reduce the credit exposures, netting agreements are in place withUnilever’s principal banks that allow Unilever, in case of a default, to net assets and liabilities across transactions. To further reduce Unilever’scredit exposures, Unilever has collateral agreements with Unilever’s principal banks based on which they need to deposit securities and/or cash asa collateral for their obligations in respect of derivative financial instruments. At 31 December 2009 the collateral received by Unilever amountedto €208 million (2008: €369 million), of which €14 million was cash and the fair value of the bond securities amounted to €194 million.Although contractually Unilever has the right to sell or repledge the collateral, it has no intention to do so. As a consequence, the non-cashcollateral has not been recognised as an asset in our balance sheet.
Derivative financial instrumentsThe Group has comprehensive policies in place, approved by the Boards, covering the use of derivative financial instruments. These instruments areused for hedging purposes. The Group has an established system of control in place covering all financial instruments; including policies, guidelines,exposure limits, a system of authorities and independent reporting, that is subject to periodic review by internal audit. Hedge accounting principlesare described in note 1 on page 84. The use of leveraged instruments is not permitted. In the assessment of hedge effectiveness the credit riskelement on the underlying hedged item has been excluded. Hedge ineffectiveness is immaterial.
The Group uses the following types of hedges:
• cash flow hedges used to hedge the risk on future foreign currency cash flows, floating interest rate cash flows, and the price risk on futurepurchases of raw materials;
• fair value hedges used to convert the fixed interest rate on financial liabilities into a floating interest rate;• net investment hedges used to hedge the investment value of our foreign subsidiaries; and• natural hedges used to hedge the risk on exposures that are on the balance sheet. No hedge accounting is applied.
Details of the various types of hedges are given below.
The fair values of forward foreign exchange contracts represent the gain or loss on revaluation of the contracts at the year-end forward exchangerates. The fair values of interest rate derivatives are based on the net present value of the anticipated future cash flows.
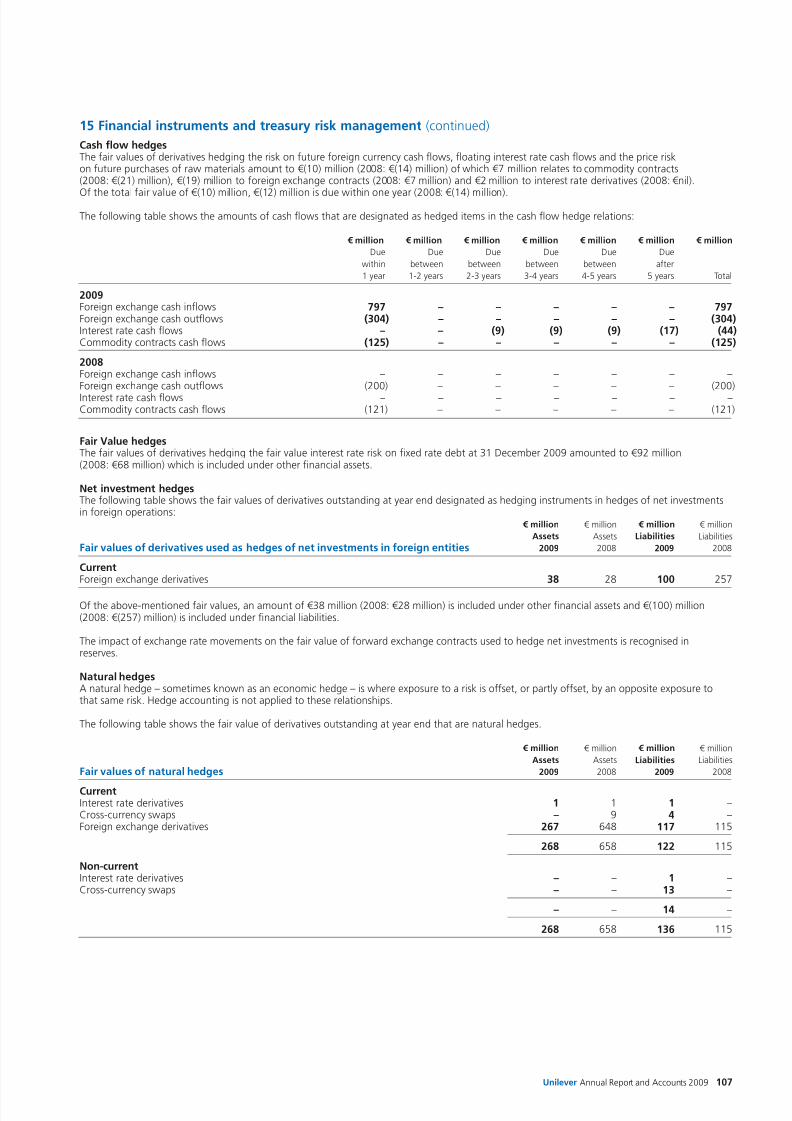
8/8/2019 Financial Statements AR09
http://slidepdf.com/reader/full/financial-statements-ar09 33/54Unilever Annual Report and Accounts 2009 107
15 Financial instruments and treasury risk management (continued)
Cash flow hedgesThe fair values of derivatives hedging the risk on future foreign currency cash flows, floating interest rate cash flows and the price riskon future purchases of raw materials amount to €(10) million (2008: €(14) million) of which €7 million relates to commodity contracts(2008: €(21) million), €(19) million to foreign exchange contracts (2008: €7 million) and €2 million to interest rate derivatives (2008: €nil).
Of the total fair value of €(10) million, €(12) million is due within one year (2008: €(14) million).
The following table shows the amounts of cash flows that are designated as hedged items in the cash flow hedge relations:
€ million € million € million € million € million € million € million
Due Due Due Due Due Due
within between between between between after
1 year 1-2 years 2-3 years 3-4 years 4-5 years 5 years Total
2009Foreign exchange cash inflows 797 – – – – – 797Foreign exchange cash outflows (304) – – – – – (304)Interest rate cash flows – – (9) (9) (9) (17) (44)Commodity contracts cash flows (125) – – – – – (125)
2008Foreign exchange cash inflows – – – – – – –
Foreign exchange cash outflows (200) – – – – – (200)Interest rate cash flows – – – – – – –Commodity contracts cash flows (121) – – – – – (121)
Fair Value hedgesThe fair values of derivatives hedging the fair value interest rate risk on fixed rate debt at 31 December 2009 amounted to €92 million(2008: €68 million) which is included under other financial assets.
Net investment hedgesThe following table shows the fair values of derivatives outstanding at year end designated as hedging instruments in hedges of net investmentsin foreign operations:
€ million € million € million € million
Assets Assets Liabilities Liabilities
Fair values of derivatives used as hedges of net investments in foreign entities 2009 2008 2009 2008
CurrentForeign exchange derivatives 38 28 100 257
Of the above-mentioned fair values, an amount of €38 million (2008: €28 million) is included under other financial assets and €(100) million(2008: €(257) million) is included under financial liabilities.
The impact of exchange rate movements on the fair value of forward exchange contracts used to hedge net investments is recognised inreserves.
Natural hedgesA natural hedge – sometimes known as an economic hedge – is where exposure to a risk is offset, or partly offset, by an opposite exposure tothat same risk. Hedge accounting is not applied to these relationships.
The following table shows the fair value of derivatives outstanding at year end that are natural hedges.
€ million € million € million € million
Assets Assets Liabilities Liabilities
Fair values of natural hedges 2009 2008 2009 2008
CurrentInterest rate derivatives 1 1 1 –Cross-currency swaps – 9 4 –Foreign exchange derivatives 267 648 117 115
268 658 122 115
Non-currentInterest rate derivatives – – 1 –Cross-currency swaps – – 13 –
– – 14 –
268 658 136 115
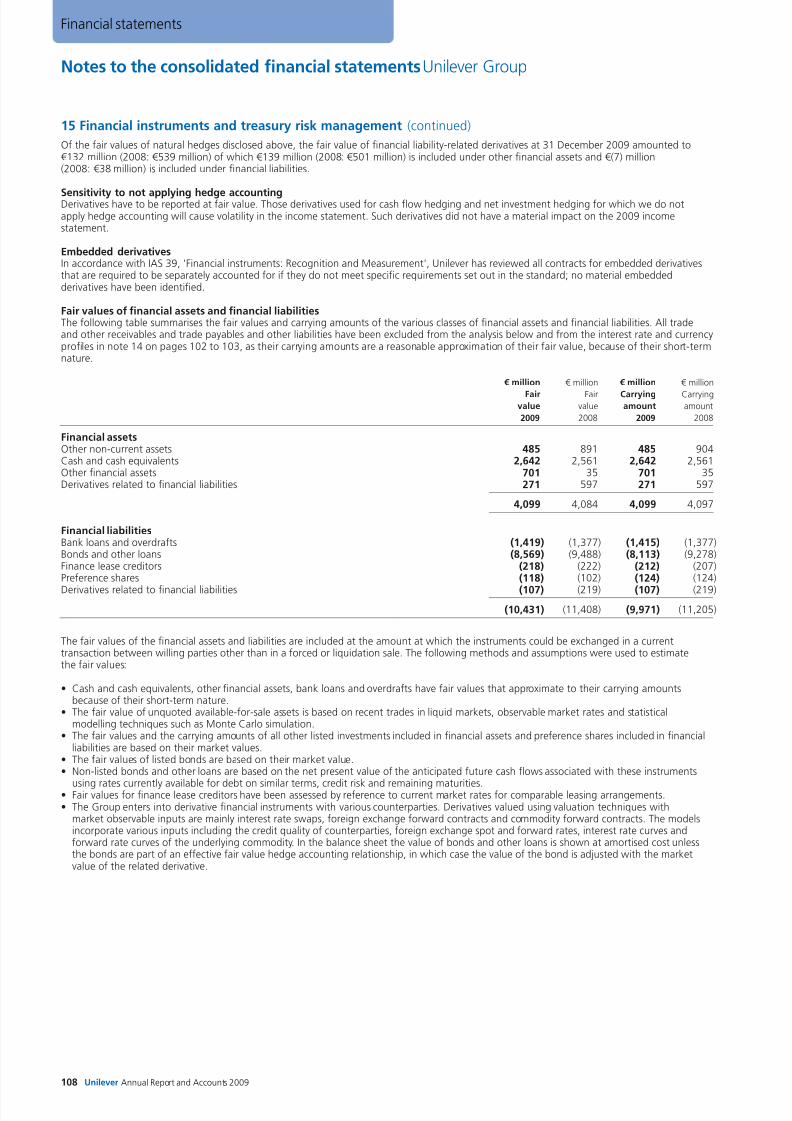
8/8/2019 Financial Statements AR09
http://slidepdf.com/reader/full/financial-statements-ar09 34/54
Notes to the consolidated financial statements Unilever Group
108 Unilever Annual Report and Accounts 2009
Financial statements
15 Financial instruments and treasury risk management (continued)
Of the fair values of natural hedges disclosed above, the fair value of financial liability-related derivatives at 31 December 2009 amounted to€132 million (2008: €539 million) of which €139 million (2008: €501 million) is included under other financial assets and €(7) million(2008: €38 million) is included under financial liabilities.
Sensitivity to not applying hedge accountingDerivatives have to be reported at fair value. Those derivatives used for cash flow hedging and net investment hedging for which we do notapply hedge accounting will cause volatility in the income statement. Such derivatives did not have a material impact on the 2009 incomestatement.
Embedded derivativesIn accordance with IAS 39, 'Financial instruments: Recognition and Measurement', Unilever has reviewed all contracts for embedded derivativesthat are required to be separately accounted for if they do not meet specific requirements set out in the standard; no material embeddedderivatives have been identified.
Fair values of financial assets and financial liabilitiesThe following table summarises the fair values and carrying amounts of the various classes of financial assets and financial liabilities. All tradeand other receivables and trade payables and other liabilities have been excluded from the analysis below and from the interest rate and currencyprofiles in note 14 on pages 102 to 103, as their carrying amounts are a reasonable approximation of their fair value, because of their short-termnature.
€ million € million € million € million
Fair Fair Carrying Carrying
value value amount amount
2009 2008 2009 2008
Financial assetsOther non-current assets 485 891 485 904Cash and cash equivalents 2,642 2,561 2,642 2,561Other financial assets 701 35 701 35Derivatives related to financial liabilities 271 597 271 597
4,099 4,084 4,099 4,097
Financial liabilitiesBank loans and overdrafts (1,419) (1,377) (1,415) (1,377)Bonds and other loans (8,569) (9,488) (8,113) (9,278)Finance lease creditors (218) (222) (212) (207)Preference shares (118) (102) (124) (124)
Derivatives related to financial liabilities (107) (219) (107) (219)
(10,431) (11,408) (9,971) (11,205)
The fair values of the financial assets and liabilities are included at the amount at which the instruments could be exchanged in a currenttransaction between willing parties other than in a forced or liquidation sale. The following methods and assumptions were used to estimatethe fair values:
• Cash and cash equivalents, other financial assets, bank loans and overdrafts have fair values that approximate to their carrying amountsbecause of their short-term nature.
• The fair value of unquoted available-for-sale assets is based on recent trades in liquid markets, observable market rates and statisticalmodelling techniques such as Monte Carlo simulation.
• The fair values and the carrying amounts of all other listed investments included in financial assets and preference shares included in financialliabilities are based on their market values.
• The fair values of listed bonds are based on their market value.• Non-listed bonds and other loans are based on the net present value of the anticipated future cash flows associated with these instruments
using rates currently available for debt on similar terms, credit risk and remaining maturities.• Fair values for finance lease creditors have been assessed by reference to current market rates for comparable leasing arrangements.• The Group enters into derivative financial instruments with various counterparties. Derivatives valued using valuation techniques with
market observable inputs are mainly interest rate swaps, foreign exchange forward contracts and commodity forward contracts. The modelsincorporate various inputs including the credit quality of counterparties, foreign exchange spot and forward rates, interest rate curves andforward rate curves of the underlying commodity. In the balance sheet the value of bonds and other loans is shown at amortised cost unlessthe bonds are part of an effective fair value hedge accounting relationship, in which case the value of the bond is adjusted with the marketvalue of the related derivative.
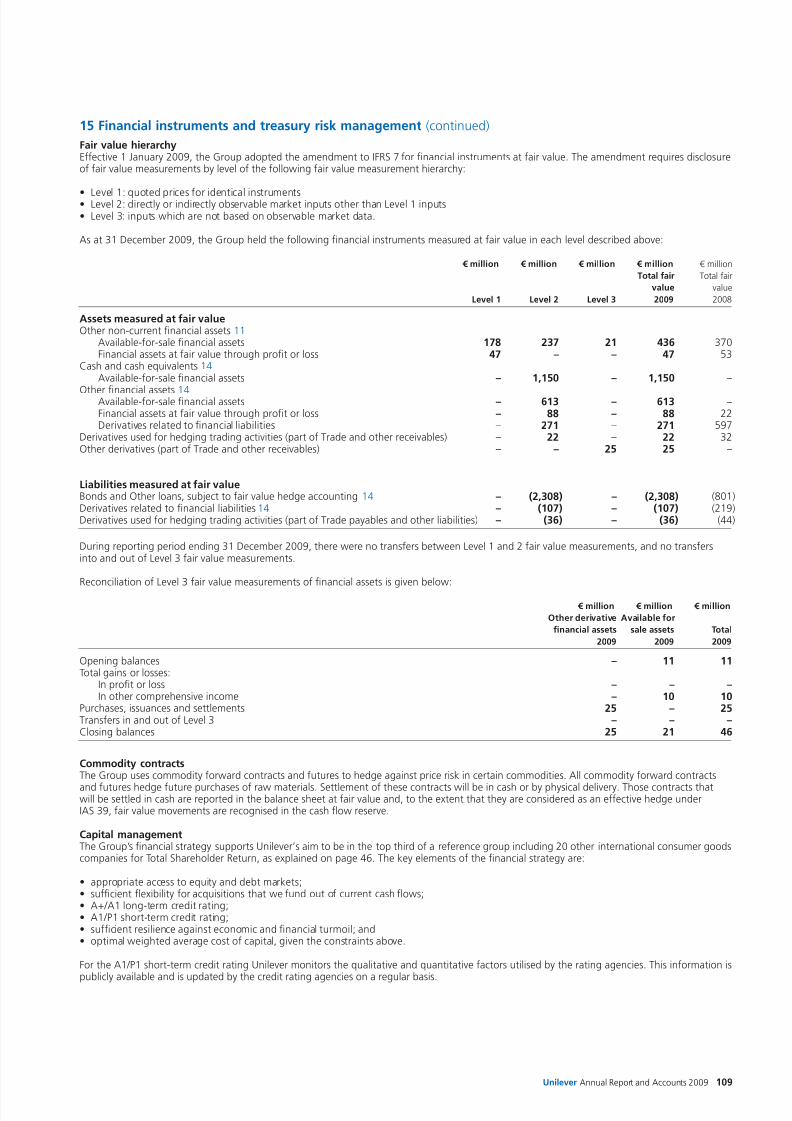
8/8/2019 Financial Statements AR09
http://slidepdf.com/reader/full/financial-statements-ar09 35/54Unilever Annual Report and Accounts 2009 109
15 Financial instruments and treasury risk management (continued)
Fair value hierarchyEffective 1 January 2009, the Group adopted the amendment to IFRS 7 for financial instruments at fair value. The amendment requires disclosureof fair value measurements by level of the following fair value measurement hierarchy:
• Level 1: quoted prices for identical instruments• Level 2: directly or indirectly observable market inputs other than Level 1 inputs• Level 3: inputs which are not based on observable market data.
As at 31 December 2009, the Group held the following financial instruments measured at fair value in each level described above:
€ million € million € million € million € million
Total fair Total fair
value value
Level 1 Level 2 Level 3 2009 2008
Assets measured at fair valueOther non-current financial assets 11
Available-for-sale financial assets 178 237 21 436 370Financial assets at fair value through profit or loss 47 – – 47 53
Cash and cash equivalents 14Available-for-sale financial assets – 1,150 – 1,150 –
Other financial assets 14Available-for-sale financial assets – 613 – 613 –Financial assets at fair value through profit or loss – 88 – 88 22Derivatives related to financial liabilities – 271 – 271 597
Derivatives used for hedging trading activities (part of Trade and other receivables) – 22 – 22 32Other derivatives (part of Trade and other receivables) – – 25 25 –
Liabilities measured at fair valueBonds and Other loans, subject to fair value hedge accounting 14 – (2,308) – (2,308) (801)Derivatives related to financial liabilities 14 – (107) – (107) (219)Derivatives used for hedging trading activities (part of Trade payables and other liabilities) – (36) – (36) (44)
During reporting period ending 31 December 2009, there were no transfers between Level 1 and 2 fair value measurements, and no transfersinto and out of Level 3 fair value measurements.
Reconciliation of Level 3 fair value measurements of financial assets is given below:
€ million € million € million
Other derivative Available for
financial assets sale assets Total
2009 2009 2009
Opening balances – 11 11Total gains or losses:
In profit or loss – – –In other comprehensive income – 10 10
Purchases, issuances and settlements 25 – 25Transfers in and out of Level 3 – – –Closing balances 25 21 46
Commodity contractsThe Group uses commodity forward contracts and futures to hedge against price risk in certain commodities. All commodity forward contractsand futures hedge future purchases of raw materials. Settlement of these contracts will be in cash or by physical delivery. Those contracts thatwill be settled in cash are reported in the balance sheet at fair value and, to the extent that they are considered as an effective hedge underIAS 39, fair value movements are recognised in the cash flow reserve.
Capital managementThe Group’s financial strategy supports Unilever’s aim to be in the top third of a reference group including 20 other international consumer goodscompanies for Total Shareholder Return, as explained on page 46. The key elements of the financial strategy are:
• appropriate access to equity and debt markets;• sufficient flexibility for acquisitions that we fund out of current cash flows;• A+/A1 long-term credit rating;• A1/P1 short-term credit rating;• sufficient resilience against economic and financial turmoil; and• optimal weighted average cost of capital, given the constraints above.
For the A1/P1 short-term credit rating Unilever monitors the qualitative and quantitative factors utilised by the rating agencies. This information is
publicly available and is updated by the credit rating agencies on a regular basis.
8/8/2019 Financial Statements AR09
http://slidepdf.com/reader/full/financial-statements-ar09 36/54
Notes to the consolidated financial statements Unilever Group
110 Unilever Annual Report and Accounts 2009
Financial statements
15 Financial instruments and treasury risk management (continued)
The capital structure of Unilever is based on management’s judgement of the appropriate balancing of all key elements of its financial strategy inorder to meet its strategic and day-to-day needs. We consider the amount of capital in proportion to risk and manage the capital structure andmake adjustments to it in the light of changes in economic conditions and the risk characteristics of the underlying assets. Unilever will takeappropriate steps in order to maintain, or if necessary adjust, the capital structure. Annually the overall funding plan is presented to the Board for
approval.
Return on Invested Capital continues to be one of Unilever's key performance measures. Within this definition we have defined the componentsof our Invested Capital. See page 45 for the details of this definition and the calculation of Unilever's Return on Invested Capital.
Unilever is not subject to covenants in any of its significant financing agreements.
Income statement sensitivity to changes in foreign exchange ratesThe values of debt, investments and related hedging instruments, denominated in currencies other than the functional currency of the entitiesholding them, are subject to exchange rate movements. The translation risk on the foreign exchange receivables and payables is excluded fromthis sensitivity analysis as the risk is considered to be immaterial because positions will remain within prescribed limits (see currency risks onpage 104).
The remaining unhedged foreign exchange positions at 31 December 2009 amount to €2 million (2008: €45 million). A reasonably possible 10%change in rates would lead to a €0.2 million movement in the income statement (2008: €5 million), based on a linear calculation of ourexposure.
Income statement sensitivity to changes in interest rateInterest rate risks are presented by way of sensitivity analysis. As described on page 104, Unilever has an interest rate management policy aimedat optimising net interest cost and reducing volatility in the income statement. As part of this policy, part of the financial assets and financialliabilities have fixed interest rates and are no longer exposed to changes in the floating rates. The remaining floating part of our financial assetsand financial liabilities (see interest rate profile tables on pages 102 for the assets and 103 for the liabilities) is exposed to changes in the floatinginterest rates.
The analysis below shows the sensitivity of the income statement to a reasonably possible one percentage point change in floating interest rateson a full-year basis.
Sensitivity to a reasonably possible
one percentage point change in
floating rates as at 31 December
€ million € million
2009 2008
Financial assets 92 77Financial liabilities (91) (105)
Net investment hedges: sensitivity relating to changes in foreign exchange ratesTo reduce the retranslation risk of Unilever's investments in foreign subsidiaries, Unilever uses net investment hedges. The fair values of these netinvestment hedges are subject to exchange rate movements and changes in these fair values are recognised directly in equity and will offset theretranslation impact of the related subsidiary.
At 31 December 2009 the nominal value of these net investment hedges amounts to €4.9 billion (2008: €5.1 billion) mainly consisting of US$/€contracts. A reasonably possible 10% change in rates would lead to a fair value movement of €486 million (2008: €513 million). This movementwould be fully offset by an opposite movement on the retranslation of the book equity of the foreign subsidiary.
Cash flow hedges: sensitivity relating to changes in interest rates and foreign exchange ratesUnilever uses on a limited scale both interest rate and forex cash flow hedges. The fair values of these instruments are subject to changes ininterest rates and exchange rates. Because of the limited use of these instruments and the amount of Unilever's equity, possible changes ininterest rates and exchange rates will not lead to fair value movements that will have a material impact on Unilever's equity.
16 Trade payables and other liabilities
€ million € million
Trade and other payables 2009 2008
Due within one yearTrade payables 3,982 3,873Accruals 3,504 2,720Social security and sundry taxes 342 341Others 585 890
8,413 7,824
Due after more than one yearAccruals 104 102Others 144 73
248 175
Total trade payables and other liabilities 8,661 7,999
The amounts shown above do not include any payables due after more than five years. Trade payables and other liabilities are valued at historiccost, which where appropriate approximates their amortised cost.
8/8/2019 Financial Statements AR09
http://slidepdf.com/reader/full/financial-statements-ar09 37/54Unilever Annual Report and Accounts 2009 111
17 Deferred taxation
€ million € million € million € million
As at 1 As at 31
January Income(a) December
Movements in 2009 2009 statement Equity(b) 2009
Pensions and similar obligations 809 (206) (11) 592Provisions 612 (46) 85 651Goodwill and intangible assets (823) (61) (60) (944)Accelerated tax depreciation (555) 49 (19) (525)Tax losses(c) 105 61 (84) 82Fair value gains (6) – (18) (24)Fair value losses 40 2 (40) 2Share-based payments 100 24 22 146Other (4) 8 (10) (6)
278 (169) (135) (26)
(a) The difference of €24 million between the income statement movement of €(169) million and the income statement charge of €(145) millionas disclosed in note 6 on page 91, is due to a reclassification between deferred and current tax relating to the prior year.
(b) Of the total movement in equity of €(135) million, €59 million arises as a result of currency retranslation and €(29) million as a result ofacquisitions and disposals.
(c) Of the €(84) million movement on Equity €(103) million arises as a result of the federal tax settlement in Brazil. Legislation in Brazil allowed
companies to settle these outstanding tax liabilities by offset against accumulated tax losses. See note 25 on page 122.
€ million € million € million € million
As at 1 As at 31
January Income December
Movements in 2008 2008 statement Equity(a) 2008
Pensions and similar obligations 200 (177) 786 809Provisions 786 (103) (71) 612Goodwill and intangible assets (780) (34) (9) (823)Accelerated tax depreciation (598) (2) 45 (555)Tax losses 84 (7) 28 105Fair value gains (8) (5) 7 (6)Fair value losses 8 (3) 35 40Share-based payments 101 57 (58) 100Other (3) – (1) (4)
(210) (274) 762 278
(a) Of the total movement in equity of €762 million, €87 million arises as a result of currency retranslation and €8 million as a result ofacquisitions and disposals.
At the balance sheet date, the Group has unused tax losses of €1,283 million and tax credits amounting to €32 million available for offsetagainst future taxable profits. Deferred tax assets have not been recognised in respect of unused tax losses of €1,006 million and tax creditsof €32 million, as it is not probable that there will be future taxable profits within the entities against which the losses can be utilised. Themajority of these tax losses and credits arise in tax jurisdictions where they do not expire with the exception of €412 million of state andfederal tax losses in the US which expire between now and 2029.
Other deductible temporary differences of €110 million have not been recognised as a deferred tax asset. There is no expiry date for thesedifferences.
At the balance sheet date, the aggregate amount of temporary differences associated with undistributed earnings of subsidiaries for whichdeferred tax liabilities have not been recognised was €1,319 million (2008: €967 million). No liability has been recognised in respect of thesedifferences because the Group is in a position to control the timing of the reversal of the temporary differences, and it is probable that such
differences will not reverse in the foreseeable future.
8/8/2019 Financial Statements AR09
http://slidepdf.com/reader/full/financial-statements-ar09 38/54
17 Deferred taxation (continued)
Deferred income tax assets and liabilities are offset when there is a legally enforceable right to set off current tax assets against current taxliabilities and when the deferred income taxes relate to the same fiscal authority. The following amounts, determined after appropriate offsetting,are shown in the consolidated balance sheet:
€ million € million € million € million € million € millionAssets Assets Liabilities Liabilities Total Total
Deferred tax assets and liabilities 2009 2008 2009 2008 2009 2008
Pensions and similar obligations 674 887 (82) (78) 592 809Provisions 556 619 95 (7) 651 612Goodwill and intangible assets (370) (345) (574) (478) (944) (823)Accelerated tax depreciation (302) (368) (223) (187) (525) (555)Tax losses 68 103 14 2 82 105Fair value gains (17) – (7) (6) (24) (6)Fair value losses 3 43 (1) (3) 2 40Share-based payments 104 100 42 – 146 100Other 22 29 (28) (33) (6) (4)
738 1,068 (764) (790) (26) 278
Of which deferred tax to be recovered/(settled) after
more than 12 months 408 736 (741) (717) (333) 19
18 Provisions
€ million € million
Provisions 2009 2008
Due within one year 420 757Due after one year 729 646
Total provisions 1,149 1,403
€ million € million € million € million € million € million
Restructuring Legal Disputed Net liability Other
Movements during 2009 provisions provisions indirect taxes of associate provisions Total
1 January 2009 504 60 544 31 264 1,403Disposal of group companies – – – (25) – (25)Income statement:
New charges 339 10 90 – 74 513Releases (93) (3) (85) – (26) (207)
Utilisation (361) (31) (278) – (45) (715)Currency retranslation 11 – 176 (6) (1) 180
31 December 2009 400 36 447 – 266 1,149
Restructuring provisions primarily relate to early retirement and redundancy costs, the most significant of which relate to the formation of newmulti-country organisations and several factory closures; no projects are individually material. Legal provisions are comprised of many claims, ofwhich none is individually material. Further information is given in note 25 on page 122.
The provision for disputed indirect taxes is comprised of a number of small disputed items. The largest elements of the provision relate todisputes with the Brazilian authorities. Because of the nature of the disputes, the timing of the utilisation of the provisions, and any associated
cash outflows, is uncertain. The majority of the disputed items attract an interest charge. For further information please refer to note 25 onpage 122.
No individual item within the other provisions balance is significant. Unilever expects that the issues relating to these restructuring, legal andother provisions will be substantively resolved over the next five years.
Notes to the consolidated financial statements Unilever Group
112 Unilever Annual Report and Accounts 2009
Financial statements
8/8/2019 Financial Statements AR09
http://slidepdf.com/reader/full/financial-statements-ar09 39/54Unilever Annual Report and Accounts 2009 113
19 Pensions and similar obligations
Description of plansIn many countries the Group operates defined benefit pension plans based on employee pensionable remuneration and length of service.The majority of these plans are externally funded. The Group also provides other post-employment benefits, mainly post-employment healthcareplans in the United States. These plans are predominantly unfunded. The Group also operates a number of defined contribution plans, the assets
of which are held in external funds.
The majority of the Group’s externally funded plans are established as trusts, foundations or similar entities. The operation of these entitiesis governed by local regulations and practice in each country, as is the nature of the relationship between the Group and the trustees(or equivalent) and their composition.
Exposure to risksPension assets and liabilities (pre-tax) of €14,413 million and €16,995 million respectively are held on the Group’s balance sheet as at31 December 2009. Movements in equity markets, interest rates, inflation and life expectancy could materially affect the level of surpluses anddeficits in these schemes, and could prompt the need for the Group to make additional pension contributions, or to reduce pensioncontributions, in the future. The key assumptions used to value our pension liabilities are set out below and on pages 114 and 115.
Investment strategyThe Group’s investment strategy in respect of its funded pension plans is implemented within the framework of the various statutoryrequirements of the territories where the plans are based. The Group has developed policy guidelines for the allocation of assets to differentclasses with the objective of controlling risk and maintaining the right balance between risk and long-term returns in order to limit the cost to the
Group of the benefits provided. To achieve this, investments are well diversified, such that the failure of any single investment would not have amaterial impact on the overall level of assets. The plans invest the largest proportion of the assets in equities which the Group believes offer thebest returns over the long term commensurate with an acceptable level of risk. The pension funds also have a proportion of assets invested inproperty, bonds, hedge funds and cash. The majority of assets are managed by a number of external fund managers with a small proportionmanaged in-house. Unilever has a pooled investment vehicle (Univest) which it believes offers its pension plans around the world a simplifiedexternally managed investment vehicle to implement their strategic asset allocation models, currently for bonds, equities and hedge funds. Theaim is to provide a high quality, well-diversified, risk-controlled vehicle.
AssumptionsWith the objective of presenting the assets and liabilities of the pensions and other post-employment benefit plans at their fair value on thebalance sheet, assumptions under IAS 19 are set by reference to market conditions at the valuation date. The actuarial assumptions used tocalculate the benefit obligations vary according to the country in which the plan is situated. The following table shows the assumptions,weighted by liabilities, used to value the principal defined benefit plans (which cover approximately 95% of total pension liabilities) and the plansproviding other post-employment benefits, and in addition the expected long-term rates of return on assets, weighted by asset value.
31 December 2009 31 December 2008 31 December 2007 31 December 2006
Other Other Other OtherPrincipal post- Principal post- Principal post- Principal post-
defined employ- defined employ- defined employ- defined employ-
benefit ment benefit ment benefit ment benefit ment
pension benefit pension benefit pension benefit pension benefit
plans plans plans plans plans plans plans plans
Discount rate 5.5% 5.8% 6.1% 5.8% 5.8% 6.1% 5.1% 5.9%Inflation 2.6% n/a 2.4% n/a 2.6% n/a 2.5% n/aRate of increase in salaries 3.7% 4.0% 3.5% 4.0% 3.8% 4.0% 3.7% 4.0%Rate of increase for pensions
in payment (where provided) 2.6% n/a 2.4% n/a 2.5% n/a 2.3% n/aRate of increase for pensions in
deferment (where provided) 2.8% n/a 2.6% n/a 2.7% n/a 2.7% n/aLong-term medical cost inflation n/a 5.0% n/a 5.0% n/a 5.0% n/a 5.0%Expected long-term rates of return:
Equities 7.9% 7.4% 8.0% 7.8%
Bonds 4.8% 4.7% 4.9% 4.9%Property 6.4% 5.8% 6.6% 6.3%Others 6.0% 5.4% 6.3% 6.3%
Weighted average asset return 6.7% 6.3% 7.0% 6.9%
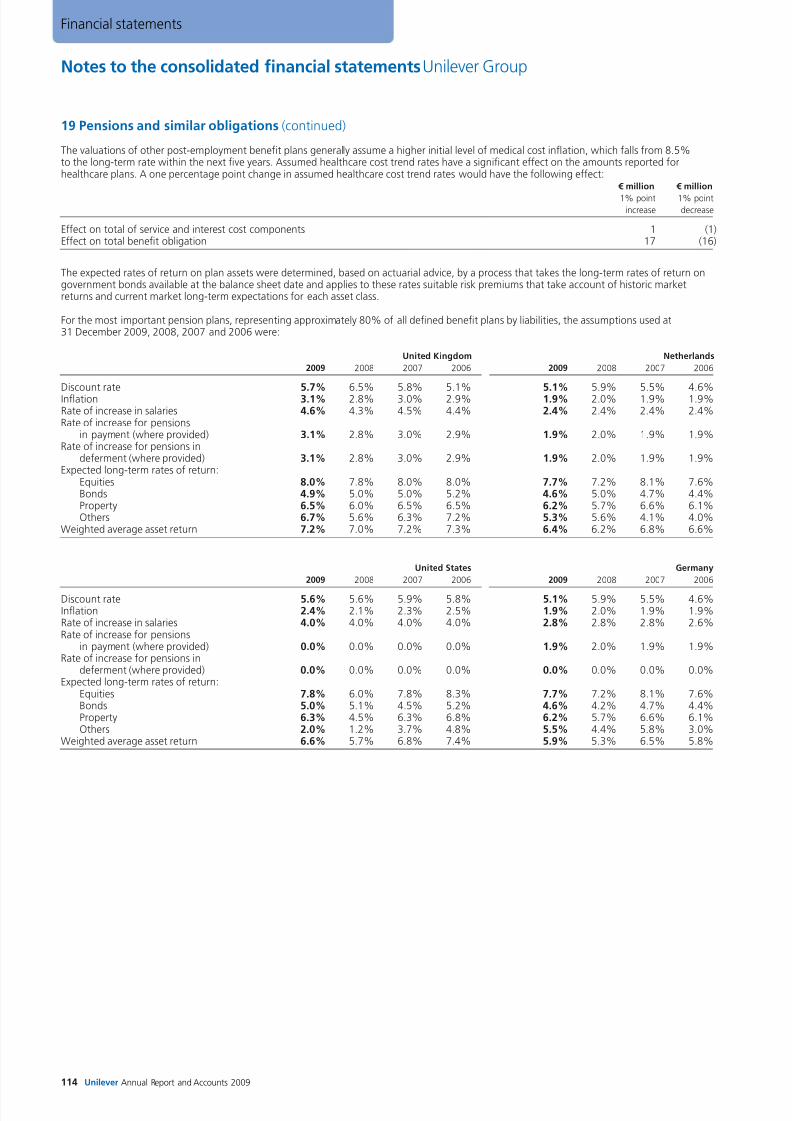
8/8/2019 Financial Statements AR09
http://slidepdf.com/reader/full/financial-statements-ar09 40/54
19 Pensions and similar obligations (continued)
The valuations of other post-employment benefit plans generally assume a higher initial level of medical cost inflation, which falls from 8.5%to the long-term rate within the next five years. Assumed healthcare cost trend rates have a significant effect on the amounts reported forhealthcare plans. A one percentage point change in assumed healthcare cost trend rates would have the following effect:
€ million € million
1% point 1% pointincrease decrease
Effect on total of service and interest cost components 1 (1)Effect on total benefit obligation 17 (16)
The expected rates of return on plan assets were determined, based on actuarial advice, by a process that takes the long-term rates of return ongovernment bonds available at the balance sheet date and applies to these rates suitable risk premiums that take account of historic marketreturns and current market long-term expectations for each asset class.
For the most important pension plans, representing approximately 80% of all defined benefit plans by liabilities, the assumptions used at31 December 2009, 2008, 2007 and 2006 were:
United Kingdom Netherlands
2009 2008 2007 2006 2009 2008 2007 2006
Discount rate 5.7% 6.5% 5.8% 5.1% 5.1% 5.9% 5.5% 4.6%Inflation 3.1% 2.8% 3.0% 2.9% 1.9% 2.0% 1.9% 1.9%Rate of increase in salaries 4.6% 4.3% 4.5% 4.4% 2.4% 2.4% 2.4% 2.4%Rate of increase for pensions
in payment (where provided) 3.1% 2.8% 3.0% 2.9% 1.9% 2.0% 1.9% 1.9%Rate of increase for pensions in
deferment (where provided) 3.1% 2.8% 3.0% 2.9% 1.9% 2.0% 1.9% 1.9%Expected long-term rates of return:
Equities 8.0% 7.8% 8.0% 8.0% 7.7% 7.2% 8.1% 7.6%Bonds 4.9% 5.0% 5.0% 5.2% 4.6% 5.0% 4.7% 4.4%Property 6.5% 6.0% 6.5% 6.5% 6.2% 5.7% 6.6% 6.1%Others 6.7% 5.6% 6.3% 7.2% 5.3% 5.6% 4.1% 4.0%
Weighted average asset return 7.2% 7.0% 7.2% 7.3% 6.4% 6.2% 6.8% 6.6%
United States Germany
2009 2008 2007 2006 2009 2008 2007 2006
Discount rate 5.6% 5.6% 5.9% 5.8% 5.1% 5.9% 5.5% 4.6%Inflation 2.4% 2.1% 2.3% 2.5% 1.9% 2.0% 1.9% 1.9%Rate of increase in salaries 4.0% 4.0% 4.0% 4.0% 2.8% 2.8% 2.8% 2.6%Rate of increase for pensions
in payment (where provided) 0.0% 0.0% 0.0% 0.0% 1.9% 2.0% 1.9% 1.9%Rate of increase for pensions in
deferment (where provided) 0.0% 0.0% 0.0% 0.0% 0.0% 0.0% 0.0% 0.0%Expected long-term rates of return:
Equities 7.8% 6.0% 7.8% 8.3% 7.7% 7.2% 8.1% 7.6%Bonds 5.0% 5.1% 4.5% 5.2% 4.6% 4.2% 4.7% 4.4%Property 6.3% 4.5% 6.3% 6.8% 6.2% 5.7% 6.6% 6.1%Others 2.0% 1.2% 3.7% 4.8% 5.5% 4.4% 5.8% 3.0%
Weighted average asset return 6.6% 5.7% 6.8% 7.4% 5.9% 5.3% 6.5% 5.8%
Notes to the consolidated financial statements Unilever Group
114 Unilever Annual Report and Accounts 2009
Financial statements
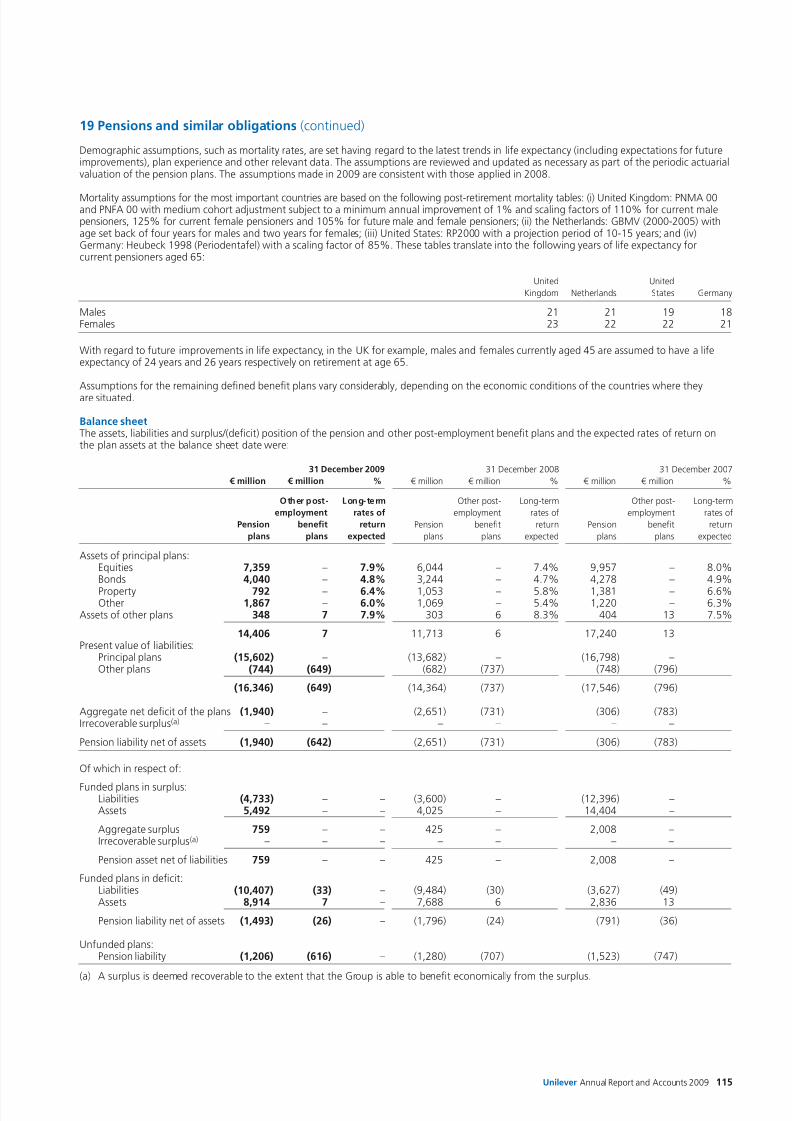
8/8/2019 Financial Statements AR09
http://slidepdf.com/reader/full/financial-statements-ar09 41/54Unilever Annual Report and Accounts 2009 115
19 Pensions and similar obligations (continued)
Demographic assumptions, such as mortality rates, are set having regard to the latest trends in life expectancy (including expectations for futureimprovements), plan experience and other relevant data. The assumptions are reviewed and updated as necessary as part of the periodic actuarialvaluation of the pension plans. The assumptions made in 2009 are consistent with those applied in 2008.
Mortality assumptions for the most important countries are based on the following post-retirement mortality tables: (i) United Kingdom: PNMA 00and PNFA 00 with medium cohort adjustment subject to a minimum annual improvement of 1% and scaling factors of 110% for current malepensioners, 125% for current female pensioners and 105% for future male and female pensioners; (ii) the Netherlands: GBMV (2000-2005) withage set back of four years for males and two years for females; (iii) United States: RP2000 with a projection period of 10-15 years; and (iv)Germany: Heubeck 1998 (Periodentafel) with a scaling factor of 85%. These tables translate into the following years of life expectancy forcurrent pensioners aged 65:
United United
Kingdom Netherlands States Germany
Males 21 21 19 18Females 23 22 22 21
With regard to future improvements in life expectancy, in the UK for example, males and females currently aged 45 are assumed to have a lifeexpectancy of 24 years and 26 years respectively on retirement at age 65.
Assumptions for the remaining defined benefit plans vary considerably, depending on the economic conditions of the countries where theyare situated.
Balance sheetThe assets, liabilities and surplus/(deficit) position of the pension and other post-employment benefit plans and the expected rates of return onthe plan assets at the balance sheet date were:
31 December 2009 31 December 2008 31 December 2007
€ million € million % € million € million % € million € million %
Other post- Long-term Other post- Long-term Other post- Long-term
employment rates of employment rates of employment rates of
Pension benefit return Pension benefit return Pension benefit return
plans plans expected plans plans expected plans plans expected
Assets of principal plans:Equities 7,359 – 7.9% 6,044 – 7.4% 9,957 – 8.0%Bonds 4,040 – 4.8% 3,244 – 4.7% 4,278 – 4.9%Property 792 – 6.4% 1,053 – 5.8% 1,381 – 6.6%Other 1,867 – 6.0% 1,069 – 5.4% 1,220 – 6.3%
Assets of other plans 348 7 7.9% 303 6 8.3% 404 13 7.5%
14,406 7 11,713 6 17,240 13Present value of liabilities:
Principal plans (15,602) – (13,682) – (16,798) –Other plans (744) (649) (682) (737) (748) (796)
(16,346) (649) (14,364) (737) (17,546) (796)
Aggregate net deficit of the plans (1,940) – (2,651) (731) (306) (783)Irrecoverable surplus(a) – – – – – –
Pension liability net of assets (1,940) (642) (2,651) (731) (306) (783)
Of which in respect of:
Funded plans in surplus:Liabilities (4,733) – – (3,600) – (12,396) –Assets 5,492 – – 4,025 – 14,404 –
Aggregate surplus 759 – – 425 – 2,008 –Irrecoverable surplus(a) – – – – – – –
Pension asset net of liabilities 759 – – 425 – 2,008 –
Funded plans in deficit:Liabilities (10,407) (33) – (9,484) (30) (3,627) (49)Assets 8,914 7 – 7,688 6 2,836 13
Pension liability net of assets (1,493) (26) – (1,796) (24) (791) (36)
Unfunded plans:Pension liability (1,206) (616) – (1,280) (707) (1,523) (747)
(a) A surplus is deemed recoverable to the extent that the Group is able to benefit economically from the surplus.
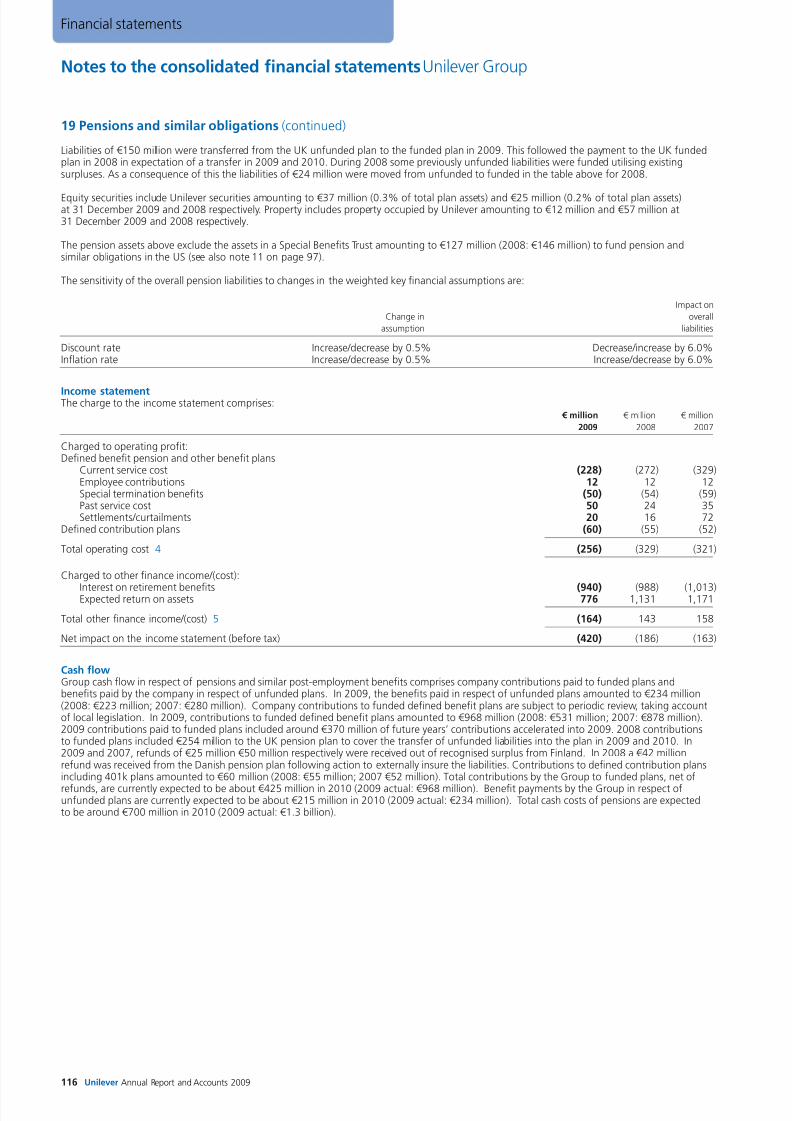
8/8/2019 Financial Statements AR09
http://slidepdf.com/reader/full/financial-statements-ar09 42/54
19 Pensions and similar obligations (continued)
Liabilities of €150 million were transferred from the UK unfunded plan to the funded plan in 2009. This followed the payment to the UK fundedplan in 2008 in expectation of a transfer in 2009 and 2010. During 2008 some previously unfunded liabilities were funded utilising existingsurpluses. As a consequence of this the liabilities of €24 million were moved from unfunded to funded in the table above for 2008.
Equity securities include Unilever securities amounting to €37 million (0.3% of total plan assets) and €25 million (0.2% of total plan assets)at 31 December 2009 and 2008 respectively. Property includes property occupied by Unilever amounting to €12 million and €57 million at31 December 2009 and 2008 respectively.
The pension assets above exclude the assets in a Special Benefits Trust amounting to €127 million (2008: €146 million) to fund pension andsimilar obligations in the US (see also note 11 on page 97).
The sensitivity of the overall pension liabilities to changes in the weighted key financial assumptions are:
Impact on
Change in overall
assumption liabilities
Discount rate Increase/decrease by 0.5% Decrease/increase by 6.0%Inflation rate Increase/decrease by 0.5% Increase/decrease by 6.0%
Income statementThe charge to the income statement comprises:
€ million € million € million
2009 2008 2007
Charged to operating profit:Defined benefit pension and other benefit plans
Current service cost (228) (272) (329)Employee contributions 12 12 12Special termination benefits (50) (54) (59)Past service cost 50 24 35Settlements/curtailments 20 16 72
Defined contribution plans (60) (55) (52)
Total operating cost 4 (256) (329) (321)
Charged to other finance income/(cost):
Interest on retirement benefits (940) (988) (1,013)Expected return on assets 776 1,131 1,171
Total other finance income/(cost) 5 (164) 143 158
Net impact on the income statement (before tax) (420) (186) (163)
Cash flowGroup cash flow in respect of pensions and similar post-employment benefits comprises company contributions paid to funded plans andbenefits paid by the company in respect of unfunded plans. In 2009, the benefits paid in respect of unfunded plans amounted to €234 million(2008: €223 million; 2007: €280 million). Company contributions to funded defined benefit plans are subject to periodic review, taking accountof local legislation. In 2009, contributions to funded defined benefit plans amounted to €968 million (2008: €531 million; 2007: €878 million).2009 contributions paid to funded plans included around €370 million of future years’ contributions accelerated into 2009. 2008 contributionsto funded plans included €254 million to the UK pension plan to cover the transfer of unfunded liabilities into the plan in 2009 and 2010. In2009 and 2007, refunds of €25 million €50 million respectively were received out of recognised surplus from Finland. In 2008 a €42 millionrefund was received from the Danish pension plan following action to externally insure the liabilities. Contributions to defined contribution plans
including 401k plans amounted to €60 million (2008: €55 million; 2007 €52 million). Total contributions by the Group to funded plans, net ofrefunds, are currently expected to be about €425 million in 2010 (2009 actual: €968 million). Benefit payments by the Group in respect ofunfunded plans are currently expected to be about €215 million in 2010 (2009 actual: €234 million). Total cash costs of pensions are expectedto be around €700 million in 2010 (2009 actual: €1.3 billion).
Notes to the consolidated financial statements Unilever Group
116 Unilever Annual Report and Accounts 2009
Financial statements
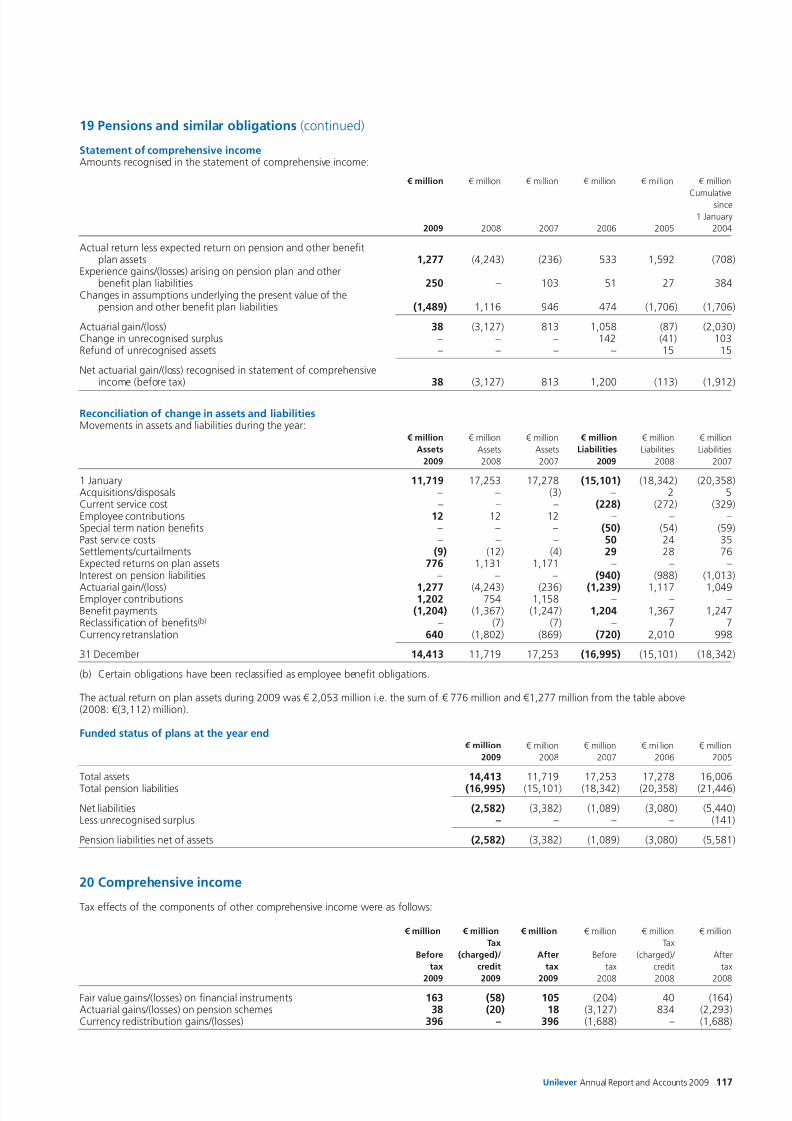
8/8/2019 Financial Statements AR09
http://slidepdf.com/reader/full/financial-statements-ar09 43/54Unilever Annual Report and Accounts 2009 117
19 Pensions and similar obligations (continued)
Statement of comprehensive incomeAmounts recognised in the statement of comprehensive income:
€ million € million € million € million € million € million
Cumulativesince
1 January
2009 2008 2007 2006 2005 2004
Actual return less expected return on pension and other benefitplan assets 1,277 (4,243) (236) 533 1,592 (708)
Experience gains/(losses) arising on pension plan and otherbenefit plan liabilities 250 – 103 51 27 384
Changes in assumptions underlying the present value of thepension and other benefit plan liabilities (1,489) 1,116 946 474 (1,706) (1,706)
Actuarial gain/(loss) 38 (3,127) 813 1,058 (87) (2,030)Change in unrecognised surplus – – – 142 (41) 103Refund of unrecognised assets – – – – 15 15
Net actuarial gain/(loss) recognised in statement of comprehensiveincome (before tax) 38 (3,127) 813 1,200 (113) (1,912)
Reconciliation of change in assets and liabilitiesMovements in assets and liabilities during the year:
€ million € million € million € million € million € million
Assets Assets Assets Liabilities Liabilities Liabilities
2009 2008 2007 2009 2008 2007
1 January 11,719 17,253 17,278 (15,101) (18,342) (20,358)Acquisitions/disposals – – (3) – 2 5Current service cost – – – (228) (272) (329)Employee contributions 12 12 12 – – –Special termination benefits – – – (50) (54) (59)Past service costs – – – 50 24 35Settlements/curtailments (9) (12) (4) 29 28 76Expected returns on plan assets 776 1,131 1,171 – – –Interest on pension liabilities – – – (940) (988) (1,013)
Actuarial gain/(loss) 1,277 (4,243) (236) (1,239) 1,117 1,049Employer contributions 1,202 754 1,158 – – –Benefit payments (1,204) (1,367) (1,247) 1,204 1,367 1,247Reclassification of benefits(b) – (7) (7) – 7 7Currency retranslation 640 (1,802) (869) (720) 2,010 998
31 December 14,413 11,719 17,253 (16,995) (15,101) (18,342)
(b) Certain obligations have been reclassified as employee benefit obligations.
The actual return on plan assets during 2009 was € 2,053 million i.e. the sum of € 776 million and €1,277 million from the table above(2008: €(3,112) million).
Funded status of plans at the year end € million € million € million € million € million
2009 2008 2007 2006 2005
Total assets 14,413 11,719 17,253 17,278 16,006Total pension liabilities (16,995) (15,101) (18,342) (20,358) (21,446)
Net liabilities (2,582) (3,382) (1,089) (3,080) (5,440)Less unrecognised surplus – – – – (141)
Pension liabilities net of assets (2,582) (3,382) (1,089) (3,080) (5,581)
20 Comprehensive income
Tax effects of the components of other comprehensive income were as follows:
€ million € million € million € million € million € million
Tax Tax
Before (charged)/ After Before (charged)/ After
tax credit tax tax credit tax
2009 2009 2009 2008 2008 2008
Fair value gains/(losses) on financial instruments 163 (58) 105 (204) 40 (164)Actuarial gains/(losses) on pension schemes 38 (20) 18 (3,127) 834 (2,293)Currency redistribution gains/(losses) 396 – 396 (1,688) – (1,688)
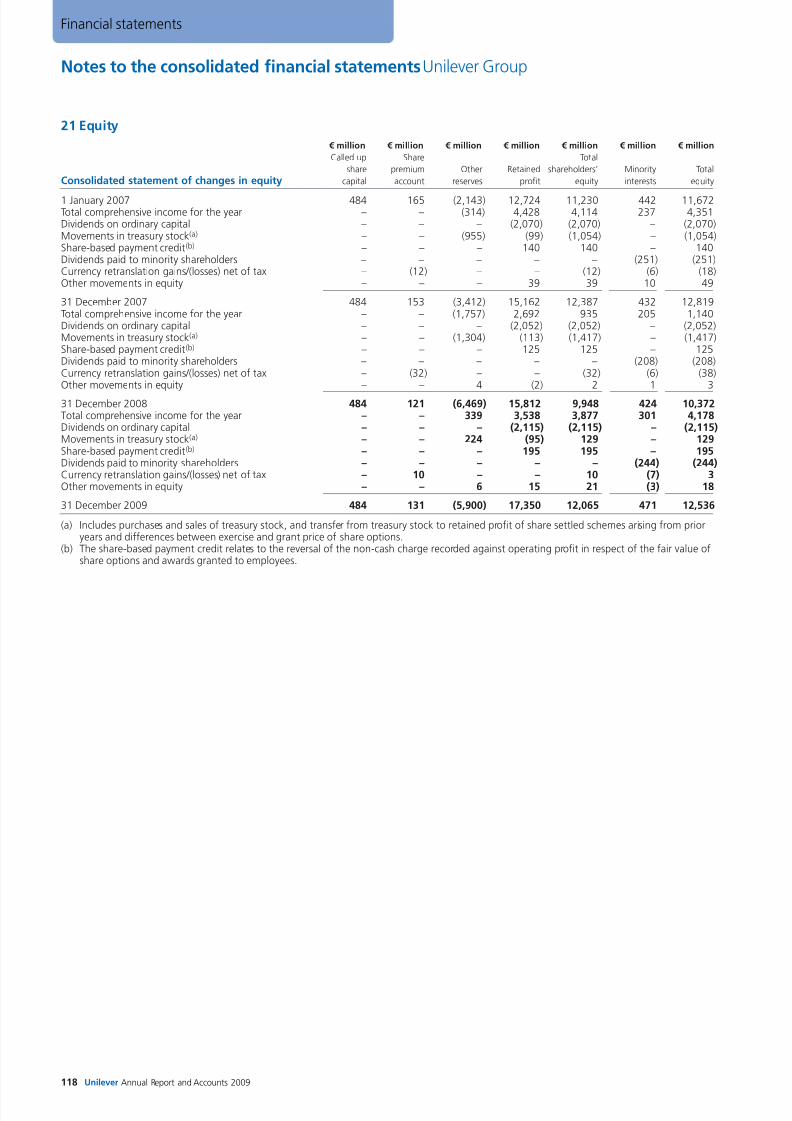
8/8/2019 Financial Statements AR09
http://slidepdf.com/reader/full/financial-statements-ar09 44/54
21 Equity
€ million € million € million € million € million € million € million
Called up Share Total
share premium Other Retained shareholders’ Minority Total
Consolidated statement of changes in equity capital account reserves profit equity interests equity
1 January 2007 484 165 (2,143) 12,724 11,230 442 11,672Total comprehensive income for the year – – (314) 4,428 4,114 237 4,351Dividends on ordinary capital – – – (2,070) (2,070) – (2,070)Movements in treasury stock(a) – – (955) (99) (1,054) – (1,054)Share-based payment credit(b) – – – 140 140 – 140Dividends paid to minority shareholders – – – – – (251) (251)Currency retranslation gains/(losses) net of tax – (12) – – (12) (6) (18)Other movements in equity – – – 39 39 10 49
31 December 2007 484 153 (3,412) 15,162 12,387 432 12,819Total comprehensive income for the year – – (1,757) 2,692 935 205 1,140Dividends on ordinary capital – – – (2,052) (2,052) – (2,052)Movements in treasury stock(a) – – (1,304) (113) (1,417) – (1,417)Share-based payment credit(b) – – – 125 125 – 125Dividends paid to minority shareholders – – – – – (208) (208)Currency retranslation gains/(losses) net of tax – (32) – – (32) (6) (38)Other movements in equity – – 4 (2) 2 1 3
31 December 2008 484 121 (6,469) 15,812 9,948 424 10,372Total comprehensive income for the year – – 339 3,538 3,877 301 4,178Dividends on ordinary capital – – – (2,115) (2,115) – (2,115)Movements in treasury stock(a) – – 224 (95) 129 – 129Share-based payment credit(b) – – – 195 195 – 195Dividends paid to minority shareholders – – – – – (244) (244)Currency retranslation gains/(losses) net of tax – 10 – – 10 (7) 3Other movements in equity – – 6 15 21 (3) 18
31 December 2009 484 131 (5,900) 17,350 12,065 471 12,536
(a) Includes purchases and sales of treasury stock, and transfer from treasury stock to retained profit of share settled schemes arising from prioryears and differences between exercise and grant price of share options.
(b) The share-based payment credit relates to the reversal of the non-cash charge recorded against operating profit in respect of the fair value ofshare options and awards granted to employees.
Notes to the consolidated financial statements Unilever Group
118 Unilever Annual Report and Accounts 2009
Financial statements
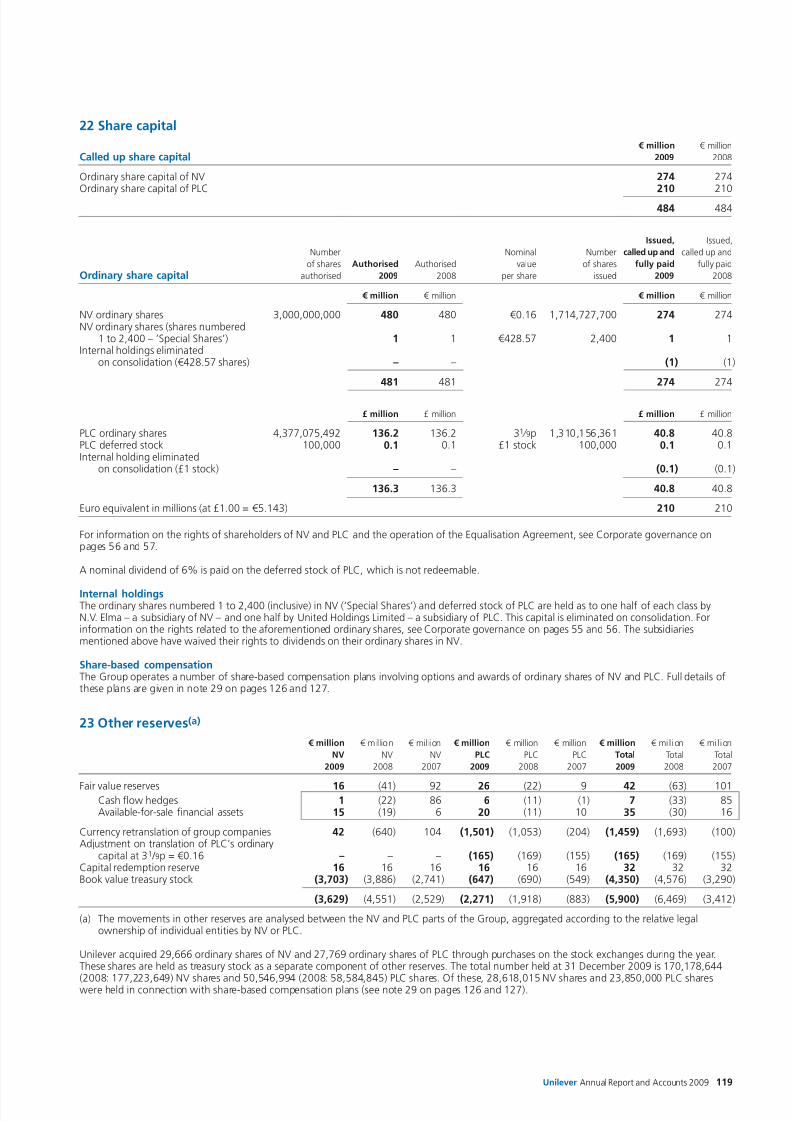
8/8/2019 Financial Statements AR09
http://slidepdf.com/reader/full/financial-statements-ar09 45/54Unilever Annual Report and Accounts 2009 119
22 Share capital
€ million € million
Called up share capital 2009 2008
Ordinary share capital of NV 274 274Ordinary share capital of PLC 210 210
484 484
Issued, Issued,
Number Nominal Number called up and called up and
of shares Authorised Authorised value of shares fully paid fully paid
Ordinary share capital authorised 2009 2008 per share issued 2009 2008
€ million € million € million € million
NV ordinary shares 3,000,000,000 480 480 €0.16 1,714,727,700 274 274NV ordinary shares (shares numbered
1 to 2,400 – ’Special Shares’) 1 1 €428.57 2,400 1 1Internal holdings eliminated
on consolidation (€428.57 shares) – – (1) (1)
481 481 274 274
£ million £ million £ million £ million
PLC ordinary shares 4,377,075,492 136.2 136.2 31 ⁄ 9p 1,310,156,361 40.8 40.8PLC deferred stock 100,000 0.1 0.1 £1 stock 100,000 0.1 0.1Internal holding eliminated
on consolidation (£1 stock) – – (0.1) (0.1)
136.3 136.3 40.8 40.8
Euro equivalent in millions (at £1.00 = €5.143) 210 210
For information on the rights of shareholders of NV and PLC and the operation of the Equalisation Agreement, see Corporate governance onpages 56 and 57.
A nominal dividend of 6% is paid on the deferred stock of PLC, which is not redeemable.
Internal holdingsThe ordinary shares numbered 1 to 2,400 (inclusive) in NV (‘Special Shares’) and deferred stock of PLC are held as to one half of each class byN.V. Elma – a subsidiary of NV – and one half by United Holdings Limited – a subsidiary of PLC. This capital is eliminated on consolidation. Forinformation on the rights related to the aforementioned ordinary shares, see Corporate governance on pages 55 and 56. The subsidiariesmentioned above have waived their rights to dividends on their ordinary shares in NV.
Share-based compensationThe Group operates a number of share-based compensation plans involving options and awards of ordinary shares of NV and PLC. Full details ofthese plans are given in note 29 on pages 126 and 127.
23 Other reserves(a)
€ million € mil lion € mil lion € million € million € million € million € mi llion € mi llion
NV NV NV PLC PLC PLC Total Total Total
2009 2008 2007 2009 2008 2007 2009 2008 2007
Fair value reserves 16 (41) 92 26 (22) 9 42 (63) 101
Cash flow hedges 1 (22) 86 6 (11) (1) 7 (33) 85Available-for-sale financial assets 15 (19) 6 20 (11) 10 35 (30) 16
Currency retranslation of group companies 42 (640) 104 (1,501) (1,053) (204) (1,459) (1,693) (100)Adjustment on translation of PLC’s ordinary
capital at 31 / 9p = €0.16 – – – (165) (169) (155) (165) (169) (155)Capital redemption reserve 16 16 16 16 16 16 32 32 32Book value treasury stock (3,703) (3,886) (2,741) (647) (690) (549) (4,350) (4,576) (3,290)
(3,629) (4,551) (2,529) (2,271) (1,918) (883) (5,900) (6,469) (3,412)
(a) The movements in other reserves are analysed between the NV and PLC parts of the Group, aggregated according to the relative legalownership of individual entities by NV or PLC.
Unilever acquired 29,666 ordinary shares of NV and 27,769 ordinary shares of PLC through purchases on the stock exchanges during the year.These shares are held as treasury stock as a separate component of other reserves. The total number held at 31 December 2009 is 170,178,644
(2008: 177,223,649) NV shares and 50,546,994 (2008: 58,584,845) PLC shares. Of these, 28,618,015 NV shares and 23,850,000 PLC shareswere held in connection with share-based compensation plans (see note 29 on pages 126 and 127).
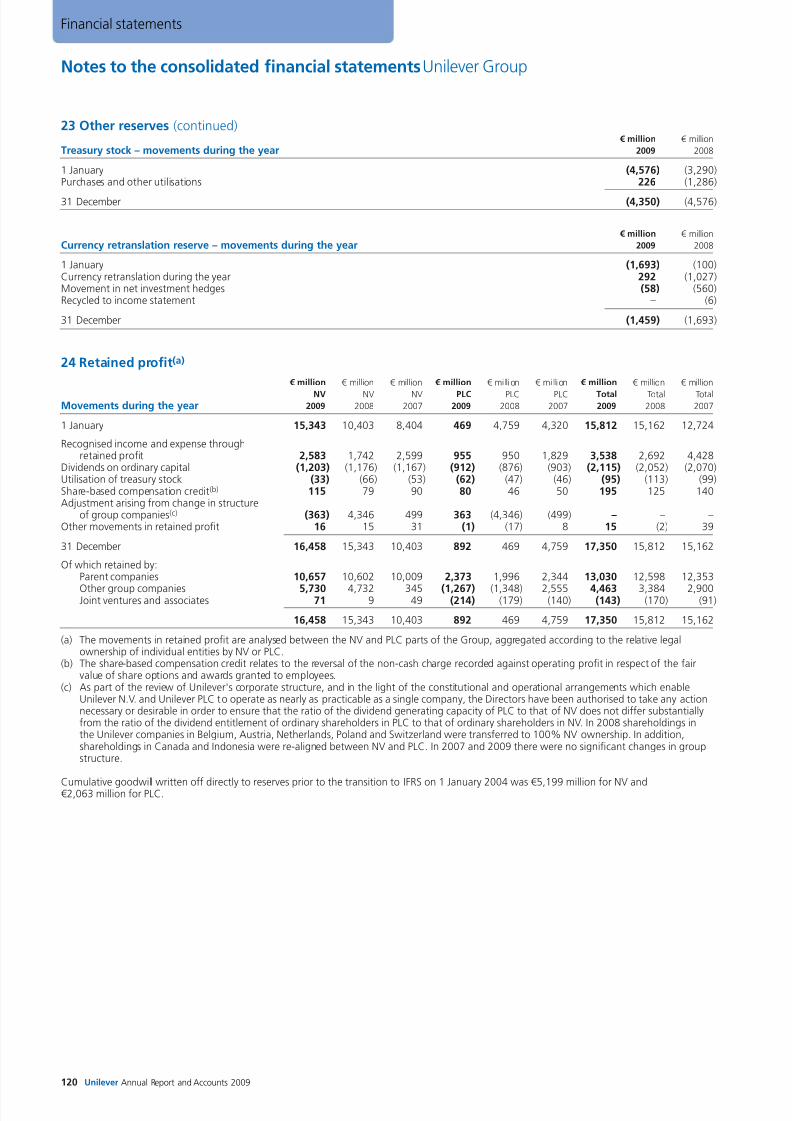
8/8/2019 Financial Statements AR09
http://slidepdf.com/reader/full/financial-statements-ar09 46/54
23 Other reserves (continued) € million € million
Treasury stock – movements during the year 2009 2008
1 January (4,576) (3,290)Purchases and other utilisations 226 (1,286)
31 December (4,350) (4,576)
€ million € million
Currency retranslation reserve – movements during the year 2009 2008
1 January (1,693) (100)Currency retranslation during the year 292 (1,027)Movement in net investment hedges (58) (560)Recycled to income statement – (6)
31 December (1,459) (1,693)
24 Retained profit(a)
€ million € million € million € million € mi llion € mi llion € million € million € million
NV NV NV PLC PLC PLC Total Total Total
Movements during the year 2009 2008 2007 2009 2008 2007 2009 2008 2007
1 January 15,343 10,403 8,404 469 4,759 4,320 15,812 15,162 12,724
Recognised income and expense throughretained profit 2,583 1,742 2,599 955 950 1,829 3,538 2,692 4,428
Dividends on ordinary capital (1,203) (1,176) (1,167) (912) (876) (903) (2,115) (2,052) (2,070)Utilisation of treasury stock (33) (66) (53) (62) (47) (46) (95) (113) (99)Share-based compensation credit(b) 115 79 90 80 46 50 195 125 140Adjustment arising from change in structure
of group companies(c) (363) 4,346 499 363 (4,346) (499) – – –Other movements in retained profit 16 15 31 (1) (17) 8 15 (2) 39
31 December 16,458 15,343 10,403 892 469 4,759 17,350 15,812 15,162
Of which retained by:Parent companies 10,657 10,602 10,009 2,373 1,996 2,344 13,030 12,598 12,353
Other group companies 5,730 4,732 345 (1,267) (1,348) 2,555 4,463 3,384 2,900Joint ventures and associates 71 9 49 (214) (179) (140) (143) (170) (91)
16,458 15,343 10,403 892 469 4,759 17,350 15,812 15,162
(a) The movements in retained profit are analysed between the NV and PLC parts of the Group, aggregated according to the relative legalownership of individual entities by NV or PLC.
(b) The share-based compensation credit relates to the reversal of the non-cash charge recorded against operating profit in respect of the fairvalue of share options and awards granted to employees.
(c) As part of the review of Unilever's corporate structure, and in the light of the constitutional and operational arrangements which enableUnilever N.V. and Unilever PLC to operate as nearly as practicable as a single company, the Directors have been authorised to take any actionnecessary or desirable in order to ensure that the ratio of the dividend generating capacity of PLC to that of NV does not differ substantiallyfrom the ratio of the dividend entitlement of ordinary shareholders in PLC to that of ordinary shareholders in NV. In 2008 shareholdings inthe Unilever companies in Belgium, Austria, Netherlands, Poland and Switzerland were transferred to 100% NV ownership. In addition,shareholdings in Canada and Indonesia were re-aligned between NV and PLC. In 2007 and 2009 there were no significant changes in groupstructure.
Cumulative goodwill written off directly to reserves prior to the transition to IFRS on 1 January 2004 was €5,199 million for NV and€2,063 million for PLC.
Notes to the consolidated financial statements Unilever Group
120 Unilever Annual Report and Accounts 2009
Financial statements
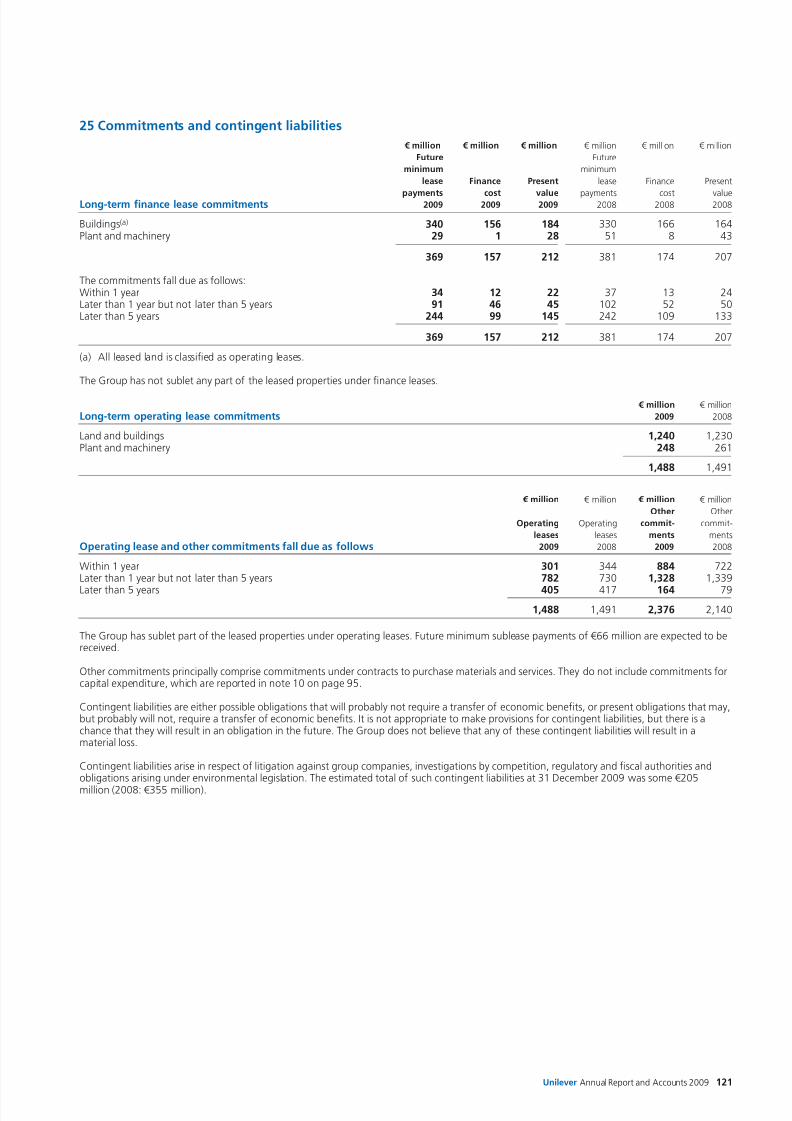
8/8/2019 Financial Statements AR09
http://slidepdf.com/reader/full/financial-statements-ar09 47/54Unilever Annual Report and Accounts 2009 121
25 Commitments and contingent liabilities
€ million € million € million € million € million € million
Future Future
minimum minimum
lease Finance Present lease Finance Present
payments cost value payments cost valueLong-term finance lease commitments 2009 2009 2009 2008 2008 2008
Buildings(a) 340 156 184 330 166 164Plant and machinery 29 1 28 51 8 43
369 157 212 381 174 207
The commitments fall due as follows:Within 1 year 34 12 22 37 13 24Later than 1 year but not later than 5 years 91 46 45 102 52 50Later than 5 years 244 99 145 242 109 133
369 157 212 381 174 207
(a) All leased land is classified as operating leases.
The Group has not sublet any part of the leased properties under finance leases.
€ million € million
Long-term operating lease commitments 2009 2008
Land and buildings 1,240 1,230Plant and machinery 248 261
1,488 1,491
€ million € million € million € million
Other Other
Operating Operating commit- commit-
leases leases ments ments
Operating lease and other commitments fall due as follows 2009 2008 2009 2008
Within 1 year 301 344 884 722Later than 1 year but not later than 5 years 782 730 1,328 1,339
Later than 5 years 405 417 164 79
1,488 1,491 2,376 2,140
The Group has sublet part of the leased properties under operating leases. Future minimum sublease payments of €66 million are expected to bereceived.
Other commitments principally comprise commitments under contracts to purchase materials and services. They do not include commitments forcapital expenditure, which are reported in note 10 on page 95.
Contingent liabilities are either possible obligations that will probably not require a transfer of economic benefits, or present obligations that may,but probably will not, require a transfer of economic benefits. It is not appropriate to make provisions for contingent liabilities, but there is achance that they will result in an obligation in the future. The Group does not believe that any of these contingent liabilities will result in amaterial loss.
Contingent liabilities arise in respect of litigation against group companies, investigations by competition, regulatory and fiscal authorities and
obligations arising under environmental legislation. The estimated total of such contingent liabilities at 31 December 2009 was some €205million (2008: €355 million).
8/8/2019 Financial Statements AR09
http://slidepdf.com/reader/full/financial-statements-ar09 48/54
25 Commitments and contingent liabilities (continued)
Legal proceedingsDetails of significant outstanding legal proceedings and ongoing regulatory investigations are as follows:
Competition investigations
As previously reported, in June 2008 the European Commission initiated an investigation into potential competition law infringements in theEuropean Union in relation to consumer detergents. Unilever has received a number of requests for information from the European Commissionregarding the investigation and has been subject to unannounced investigations at some of its premises. The investigation is ongoing althoughno statement of objections against Unilever has been issued to date. It is too early to reliably assess the ultimate resolution or to estimate thefines which the Commission will seek to impose on Unilever as a result of this investigation. Therefore no provision has been made. However,substantial fines can be levied as a result of European Commission investigations. Fines imposed in other sectors for violations of competitionrules have amounted to hundreds of millions of euros.
In December 2009, Unilever received separate statements of objection from the French competition authority and from the Italian competitionauthority in connection with investigations into certain product markets in France and Italy respectively. An earlier decision by the Greek authorityfining Unilever in relation to alleged restrictions on parallel trade within certain of its contracts with retailers in Greece is under appeal.Appropriate provisions have been made in relation to these investigations and the fining decision.
In addition and as previously reported, Unilever is involved in a number of other ongoing investigations by national competition authorities.These include investigations in Belgium, France, Germany and The Netherlands. These investigations are at various stages and concern a varietyof product markets. In several cases it is not clear that the authorities will seek to impose a fine on Unilever, and in others it is too early to be able
reasonably to assess the level of fines which the authorities may seek to impose.
It is Unilever’s policy to co-operate fully with the competition authorities in the context of all ongoing investigations. In addition, Unileverreinforces and enhances its internal competition law compliance procedures on an ongoing basis.
Tax cases BrazilDuring 2004 the Federal Supreme Court in Brazil (local acronym STF) announced a review of certain cases that it had previously decided in favourof taxpayers. Because of this action, we established a provision in 2004 for the potential repayment of sales tax credits in the event that the casesestablishing precedents in our favour are reversed. Since that time we continue to monitor the situation and have made changes as appropriateto the amount provided.
In June 2007, the Supreme Court ruled against the taxpayers in one of these cases. Industry associations (of which Unilever is a member)attempted to negotiate a settlement with the Federal Revenue Service to reduce or avoid the payment of interest and/or penalties on suchamounts. On 3 December 2008 the negotiations resulted in the publication of a settlement by the Brazilian government, open to all taxpayersincluding Unilever. This settlement was ratified by the President of Brazil in 2009 and was subsequently supported by further legislation whichincreased the discount on the interest payable. Unilever made a payment on October 29th, 2009 to settle the claim and this matter is nowresolved.
Also during 2004 in Brazil, and in common with many other businesses operating in that country, one of our Brazilian subsidiaries received anotice of infringement from the Federal Revenue Service. The notice alleges that a 2001 reorganisation of our local corporate structure wasundertaken without valid business purpose. The dispute is in court and if upheld, will result in a tax payment relating to years from 2001 to thepresent day. The 2001 reorganisation was comparable with restructurings done by many companies in Brazil. We believe that the likelihood of asuccessful challenge by the tax authorities is remote. While this view is supported by the opinion of outside counsel there can be no guarantee ofsuccess in court.
Notes to the consolidated financial statements Unilever Group
122 Unilever Annual Report and Accounts 2009
Financial statements
8/8/2019 Financial Statements AR09
http://slidepdf.com/reader/full/financial-statements-ar09 49/54Unilever Annual Report and Accounts 2009 123
26 Acquisitions and disposals
On 2 April 2009 we announced the completion of our purchase of the global TIGI professional hair product business and its supporting advancededucation academies. TIGI’s major brands include Bed Head, Catwalk and S-Factor. Turnover of the business worldwide in 2008 was aroundUS $250 million. The cash consideration of $411.5 million was made on a cash and debt free basis. In addition, further limited payments relatedto future growth may be made contingent upon meeting certain thresholds.
On 23 June 2009 we announced that we had increased our holding in our business in Vietnam to 100%, following an agreement with Vinachemwho previously owned 33.3% of the business.
On 3 July 2009 we completed the acquisition of Baltimor Holding ZAO’s sauces business in Russia. The acquisition includes ketchup, mayonnaiseand tomato paste business under the Baltimor, Pomo d’Oro and Vostochniy Gourmand brands – accounting for turnover of around €70 million in2008 – and a production facility at Kolpino, near St Petersburg.
On 3 September 2009 we announced the sale of our oil palm plantation business in the Democratic Republic of Congo to Feronia Inc, for anundisclosed sum.
On 25 September 2009 we announced a binding offer to acquire the personal care business of the Sara Lee Corporation for €1.275 billion incash. The Sara Lee brands involved include Sanex, Radox and Duschdas, and generated annual sales in excess of €750 million in the year endingJune 2009. The transaction is subject to regulatory approval and consultation with European Works Councils, and is expected to be completed bythe third quarter of 2010.
On 24 November 2009 we completed the sale of our interest in JohnsonDiversey. The cash consideration received was US $390 million, whichincluded both the originally announced cash consideration of US $158 million plus the proceeds of the sale of the 10.5% senior notes inJohnsonDiversey Holdings, Inc. We retain a 4% interest in JohnsonDiversey in the form of warrants. See also note 11 on page 97.
2008With effect from 1 January 2008, we entered into an expanded international partnership with PepsiCo for the marketing and distribution ofready-to-drink tea products under the Lipton brand.
On 3 January 2008 we completed the sale of the Boursin brand to Le Groupe Bel for €400 million. The turnover of this brand in 2007 wasapproximately €100 million.
On 2 April 2008 we completed the acquisition of Inmarko, the leading Russian ice cream company. The company had a turnover in 2007 ofapproximately €115 million.
On 31 July 2008 we completed the sale of our Lawry’s and Adolph’s branded seasoning blends and marinades business in the US andCanada to McCormick & Company, Incorporated for €410 million. The combined annual turnover of the business in 2007 was approximately€100 million.
On 9 September 2008 we completed the sale of our North American laundry business in the US, Canada and Puerto Rico to Vestar CapitalPartners, a leading global private equity firm, for consideration of approximately US $1.45 billion, consisting mainly of cash, along with preferredshares and warrants. These businesses had a combined turnover in 2007 of approximately US $1.0 billion.
On 5 November 2008 we completed the sale of Komili, our olive oil brand in Turkey, to Ana Gida, part of the Anadolu Group.
On 4 December 2008 we completed the sale of our edible oil business in Côte d’Ivoire, together with interests in local oil palm plantations Palmciand PHCI, to SIFCA, the parent company of an Ivorian agro-industry group, and to a 50:50 joint venture between two Singapore-basedcompanies, Wilmar International Limited and Olam International Limited. At the same time we acquired the soap business of Cosmivoire, asubsidiary of SIFCA.
On 23 December 2008 we completed the disposal of our Bertolli olive oil and vinegar business to Grupo SOS for a consideration of €630 million.The transaction was structured as a worldwide perpetual licence by Unilever of the Bertolli brand in respect of olive oil and premium vinegar. Thetransaction included the sale of the Italian Maya, Dante and San Giorgio olive oil and seed oil businesses, as well as the factory at Inveruno, Italy.
2007During 2007 we purchased minority interests in subsidiary companies in Greece and India. We invested in a new venture fund, Physic Ventures,which is accounted for as an associate, and made additional investments in two other venture companies, Spa and Salon International Limitedand Langholm Capital, both of which are accounted for as associates.
With effect from 1 October 2007, Unilever and Remgro Ltd. reached agreement to reorganise their respective shareholdings in the Unileverbusinesses in South Africa and Israel. In the reorganised shareholding Unilever has a majority share in a single South African business and fullyowns the Unilever Israel foods and home and personal care business. As a result of this transaction, Unilever reported a profit on disposal of€214 million and goodwill of €168 million.
On 1 January 2007, Unilever completed the restructuring of its Portuguese businesses. The result of the reorganisation is that Unilever now hasa 55% share of the combined Portuguese entity, called Unilever Jerónimo Martins. The combined business includes the foods and home andpersonal care businesses. The remaining 45% interest is held by Jerónimo Martins Group. The structure of the agreement is such that there is
joint control of the newly formed entity and so it is accounted for by Unilever as a joint venture.
Other disposals in 2007 included the sale of local Brazilian margarine brands. In addition, to further develop our healthy heart brand margarine,Becel, in Brazil we established a joint venture with Perdigão.
8/8/2019 Financial Statements AR09
http://slidepdf.com/reader/full/financial-statements-ar09 50/54
Notes to the consolidated financial statements Unilever Group
26 Acquisitions and disposals (continued)
€ million € million € million
Disposals 2009 2008 2007
Goodwill and intangible assets 1 117 5Other non-current assets 1 145 44Current assets 3 227 117Trade creditors and other payables – (61) (48)Provisions for liabilities and charges 1 (5) (34)Minority interest – – 71
Net assets sold 6 423 155(Gain)/loss on recycling of currency retranslation on disposal – (6) (1)Profit on sale attributable to Unilever 7 2,237 399
Consideration(a) 13 2,654 553
Cash 11 2,453 168Cash balances of businesses sold – (15) (4)Financial assets, cash deposits and financial liabilities of businesses sold 2 15 113Non-cash items and deferred consideration(a) – 201 276
(a) For 2007, includes €214 million fair value economic swap in South Africa.
The results of disposed businesses are included in the consolidated accounts up to their date of disposal.
The following table sets out the effect of acquisitions in 2009, 2008 and 2007 on the consolidated balance sheet. The fair values currentlyestablished for all acquisitions made in 2009 are provisional. The goodwill arising on these transactions has been capitalised and is subjectto an annual review for impairment (or more frequently if necessary) in accordance with our accounting policies as set out in note 1 on pages83 and 84. Any impairment is charged to the income statement as it arises. Detailed information relating to goodwill is given in note 9 on pages93 and 94.
€ million € million € million
Acquisitions 2009 2008 2007
Net assets acquired 128 151 94Goodwill arising in subsidiaries 350 60 334
Consideration 478 211 428
In 2007, consideration consisted of €214 million cash, principally relating to acquisitions of minority interest, and €214 million fair valueeconomic swap in South Africa.
124 Unilever Annual Report and Accounts 2009
Financial statements
8/8/2019 Financial Statements AR09
http://slidepdf.com/reader/full/financial-statements-ar09 51/54
27 Assets held for sale and discontinued operations
An analysis of the result of discontinued operations, and the result recognised on disposal of discontinued operations is as follows:
€ million € million € million
Income statement of discontinued operations 2009 2008 2007
Turnover – – –Expenses – – –
Operating profit – – –Net finance costs – – –
Profit before tax – – –Taxation – – –
Profit after taxation – – –
Gain/(loss) on disposal of discontinued operations(a) – – 89Recycling of currency retranslation upon disposal – – –Taxation arising on disposal – – (9)
Gain/(loss) after taxation on disposal – – 80
Net profit from discontinued operations – – 80
(a) In 2007, a one-off gain of €50 million was recognised for future performance-based consideration from the sale of UCI.
€ million € million € million
Summary cash flow statement of discontinued operations 2009 2008 2007
Net cash flow from/(used in) operating activities – – (4)Net cash flow from/(used in) investing activities – – 80Net cash flow from/(used in) financing activities – – –
Net increase/(decrease) in cash and cash equivalents – – 76
€ million € million
Assets classified as held for sale 2009 2008
Disposal groups held for sale
Property, plant and equipment 7 7Inventories 1 15Trade and other receivables – –
8 22
Non-current assets held for saleProperty, plant and equipment 9 14
9 14
Total assets at 31 December 2009 are included in the geographical segments as follows: Asia, Africa and Central & Eastern Europe €3 million;The Americas €14 million; Western Europe € nil.
Unilever Annual Report and Accounts 2009 125
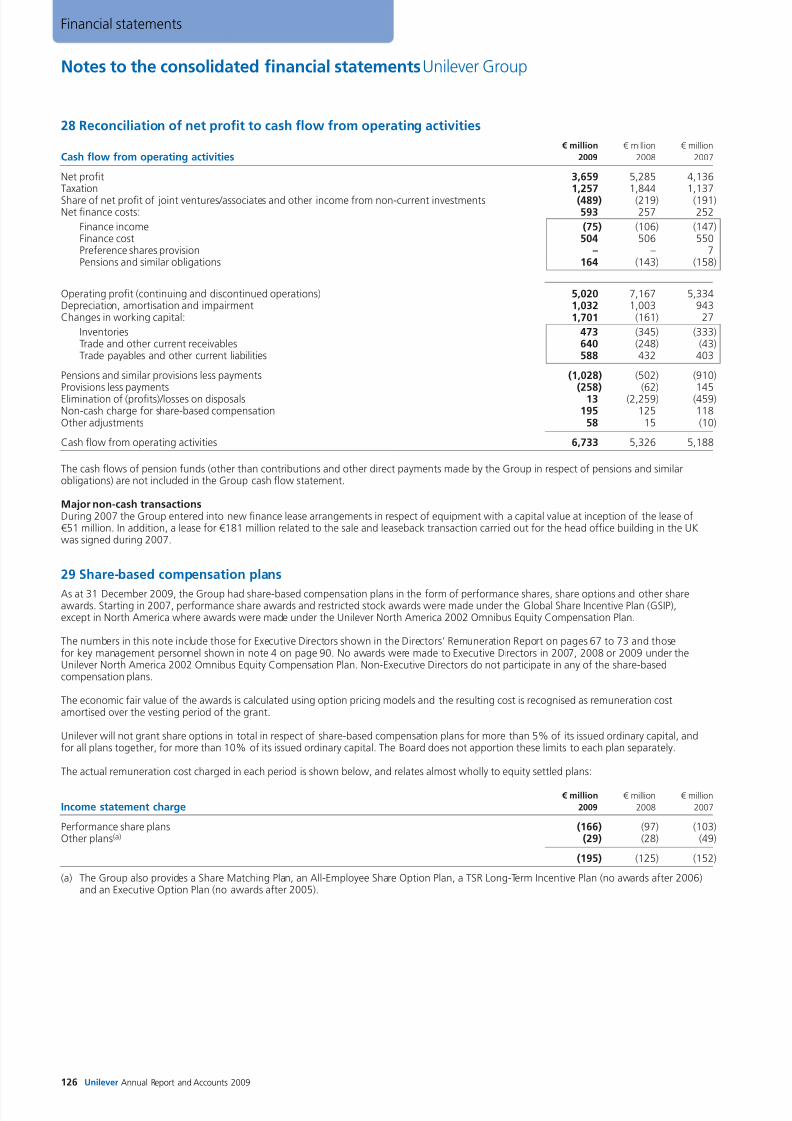
8/8/2019 Financial Statements AR09
http://slidepdf.com/reader/full/financial-statements-ar09 52/54
Notes to the consolidated financial statements Unilever Group
28 Reconciliation of net profit to cash flow from operating activities
€ million € million € million
Cash flow from operating activities 2009 2008 2007
Net profit 3,659 5,285 4,136Taxation 1,257 1,844 1,137Share of net profit of joint ventures/associates and other income from non-current investments (489) (219) (191)Net finance costs: 593 257 252
Finance income (75) (106) (147)Finance cost 504 506 550Preference shares provision – – 7Pensions and similar obligations 164 (143) (158)
Operating profit (continuing and discontinued operations) 5,020 7,167 5,334Depreciation, amortisation and impairment 1,032 1,003 943Changes in working capital: 1,701 (161) 27
Inventories 473 (345) (333)Trade and other current receivables 640 (248) (43)Trade payables and other current liabilities 588 432 403
Pensions and similar provisions less payments (1,028) (502) (910)
Provisions less payments (258) (62) 145Elimination of (profits)/losses on disposals 13 (2,259) (459)Non-cash charge for share-based compensation 195 125 118Other adjustments 58 15 (10)
Cash flow from operating activities 6,733 5,326 5,188
The cash flows of pension funds (other than contributions and other direct payments made by the Group in respect of pensions and similarobligations) are not included in the Group cash flow statement.
Major non-cash transactionsDuring 2007 the Group entered into new finance lease arrangements in respect of equipment with a capital value at inception of the lease of€51 million. In addition, a lease for €181 million related to the sale and leaseback transaction carried out for the head office building in the UKwas signed during 2007.
29 Share-based compensation plans
As at 31 December 2009, the Group had share-based compensation plans in the form of performance shares, share options and other shareawards. Starting in 2007, performance share awards and restricted stock awards were made under the Global Share Incentive Plan (GSIP),except in North America where awards were made under the Unilever North America 2002 Omnibus Equity Compensation Plan.
The numbers in this note include those for Executive Directors shown in the Directors’ Remuneration Report on pages 67 to 73 and thosefor key management personnel shown in note 4 on page 90. No awards were made to Executive Directors in 2007, 2008 or 2009 under theUnilever North America 2002 Omnibus Equity Compensation Plan. Non-Executive Directors do not participate in any of the share-basedcompensation plans.
The economic fair value of the awards is calculated using option pricing models and the resulting cost is recognised as remuneration costamortised over the vesting period of the grant.
Unilever will not grant share options in total in respect of share-based compensation plans for more than 5% of its issued ordinary capital, andfor all plans together, for more than 10% of its issued ordinary capital. The Board does not apportion these limits to each plan separately.
The actual remuneration cost charged in each period is shown below, and relates almost wholly to equity settled plans:
€ million € million € million
Income statement charge 2009 2008 2007
Performance share plans (166) (97) (103)Other plans(a) (29) (28) (49)
(195) (125) (152)
(a) The Group also provides a Share Matching Plan, an All-Employee Share Option Plan, a TSR Long-Term Incentive Plan (no awards after 2006)and an Executive Option Plan (no awards after 2005).
126 Unilever Annual Report and Accounts 2009
Financial statements
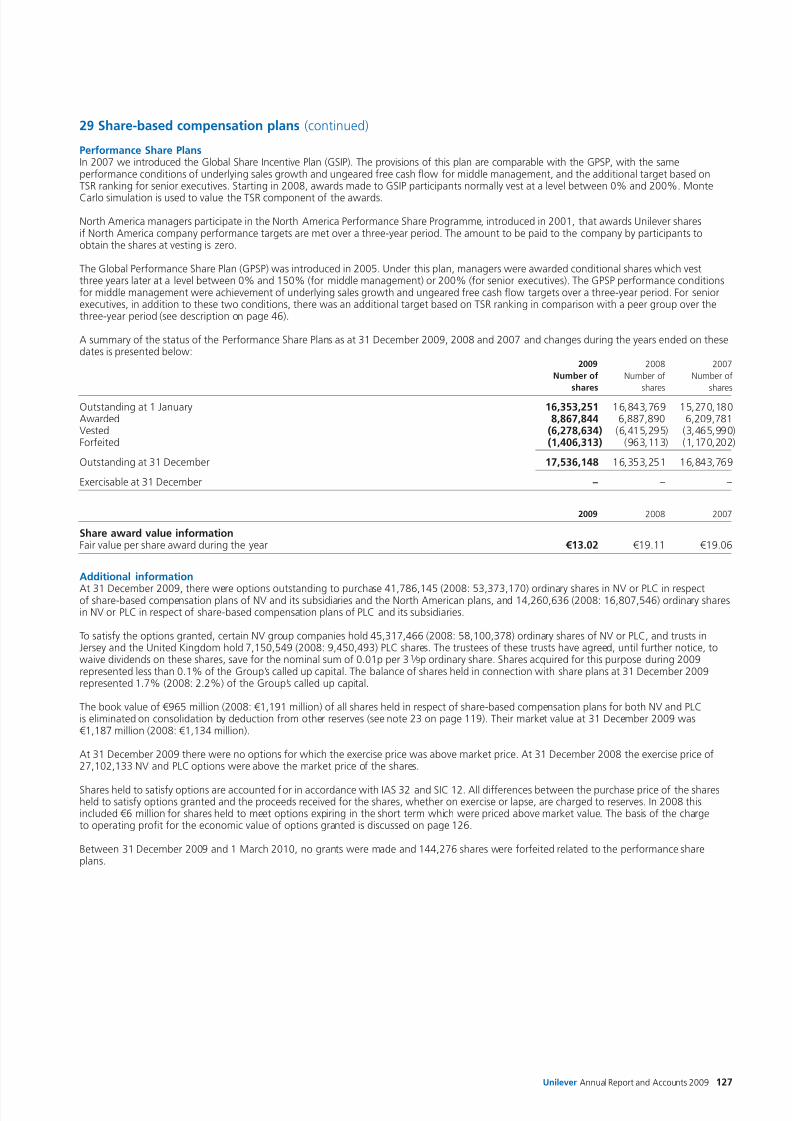
8/8/2019 Financial Statements AR09
http://slidepdf.com/reader/full/financial-statements-ar09 53/54
29 Share-based compensation plans (continued)
Performance Share PlansIn 2007 we introduced the Global Share Incentive Plan (GSIP). The provisions of this plan are comparable with the GPSP, with the sameperformance conditions of underlying sales growth and ungeared free cash flow for middle management, and the additional target based onTSR ranking for senior executives. Starting in 2008, awards made to GSIP participants normally vest at a level between 0% and 200%. Monte
Carlo simulation is used to value the TSR component of the awards.
North America managers participate in the North America Performance Share Programme, introduced in 2001, that awards Unilever sharesif North America company performance targets are met over a three-year period. The amount to be paid to the company by participants toobtain the shares at vesting is zero.
The Global Performance Share Plan (GPSP) was introduced in 2005. Under this plan, managers were awarded conditional shares which vestthree years later at a level between 0% and 150% (for middle management) or 200% (for senior executives). The GPSP performance conditionsfor middle management were achievement of underlying sales growth and ungeared free cash flow targets over a three-year period. For seniorexecutives, in addition to these two conditions, there was an additional target based on TSR ranking in comparison with a peer group over thethree-year period (see description on page 46).
A summary of the status of the Performance Share Plans as at 31 December 2009, 2008 and 2007 and changes during the years ended on thesedates is presented below:
2009 2008 2007
Number of Number of Number of
shares shares shares
Outstanding at 1 January 16,353,251 16,843,769 15,270,180Awarded 8,867,844 6,887,890 6,209,781Vested (6,278,634) (6,415,295) (3,465,990)Forfeited (1,406,313) (963,113) (1,170,202)
Outstanding at 31 December 17,536,148 16,353,251 16,843,769
Exercisable at 31 December – – –
2009 2008 2007
Share award value informationFair value per share award during the year €13.02 €19.11 €19.06
Additional information
At 31 December 2009, there were options outstanding to purchase 41,786,145 (2008: 53,373,170) ordinary shares in NV or PLC in respectof share-based compensation plans of NV and its subsidiaries and the North American plans, and 14,260,636 (2008: 16,807,546) ordinary sharesin NV or PLC in respect of share-based compensation plans of PLC and its subsidiaries.
To satisfy the options granted, certain NV group companies hold 45,317,466 (2008: 58,100,378) ordinary shares of NV or PLC, and trusts inJersey and the United Kingdom hold 7,150,549 (2008: 9,450,493) PLC shares. The trustees of these trusts have agreed, until further notice, towaive dividends on these shares, save for the nominal sum of 0.01p per 31 ⁄ 9p ordinary share. Shares acquired for this purpose during 2009represented less than 0.1% of the Group’s called up capital. The balance of shares held in connection with share plans at 31 December 2009represented 1.7% (2008: 2.2%) of the Group’s called up capital.
The book value of €965 million (2008: €1,191 million) of all shares held in respect of share-based compensation plans for both NV and PLCis eliminated on consolidation by deduction from other reserves (see note 23 on page 119). Their market value at 31 December 2009 was€1,187 million (2008: €1,134 million).
At 31 December 2009 there were no options for which the exercise price was above market price. At 31 December 2008 the exercise price of27,102,133 NV and PLC options were above the market price of the shares.
Shares held to satisfy options are accounted for in accordance with IAS 32 and SIC 12. All differences between the purchase price of the sharesheld to satisfy options granted and the proceeds received for the shares, whether on exercise or lapse, are charged to reserves. In 2008 thisincluded €6 million for shares held to meet options expiring in the short term which were priced above market value. The basis of the chargeto operating profit for the economic value of options granted is discussed on page 126.
Between 31 December 2009 and 1 March 2010, no grants were made and 144,276 shares were forfeited related to the performance shareplans.
Unilever Annual Report and Accounts 2009 127
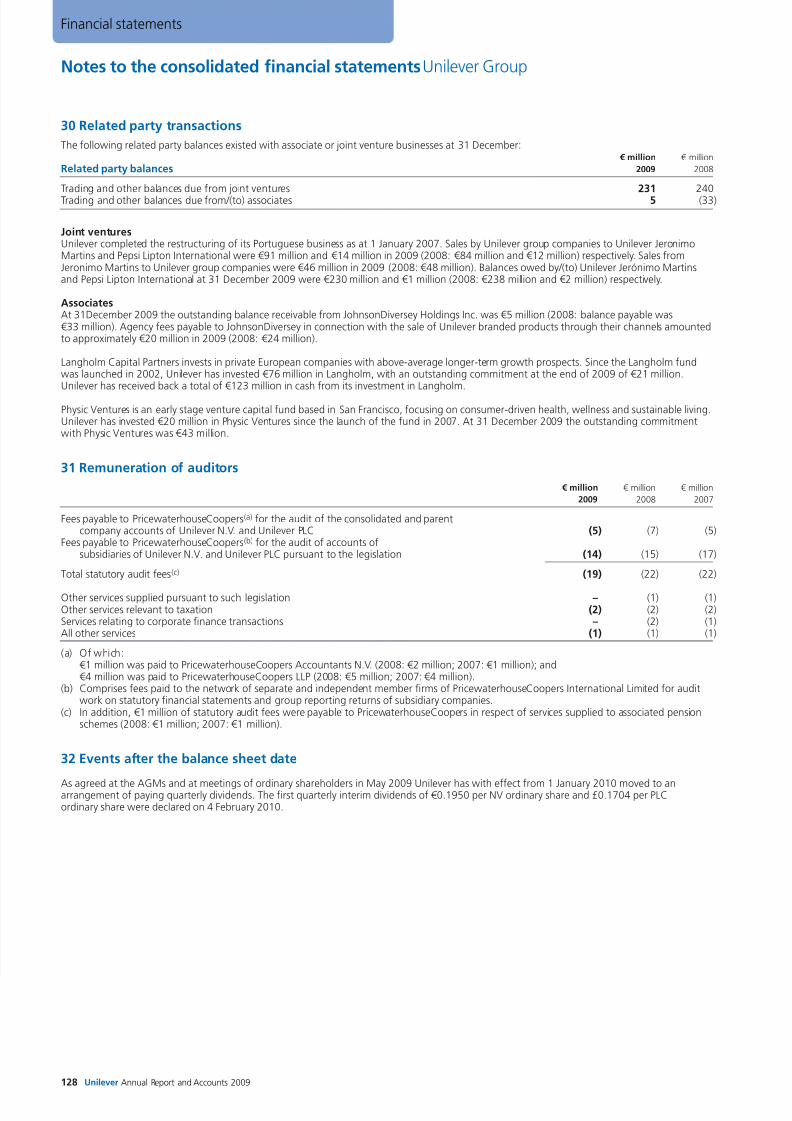
8/8/2019 Financial Statements AR09
http://slidepdf.com/reader/full/financial-statements-ar09 54/54
Notes to the consolidated financial statements Unilever Group
30 Related party transactions
The following related party balances existed with associate or joint venture businesses at 31 December: € million € million
Related party balances 2009 2008
Trading and other balances due from joint ventures 231 240Trading and other balances due from/(to) associates 5 (33)
Joint venturesUnilever completed the restructuring of its Portuguese business as at 1 January 2007. Sales by Unilever group companies to Unilever JeronimoMartins and Pepsi Lipton International were €91 million and €14 million in 2009 (2008: €84 million and €12 million) respectively. Sales fromJeronimo Martins to Unilever group companies were €46 million in 2009 (2008: €48 million). Balances owed by/(to) Unilever Jerónimo Martinsand Pepsi Lipton International at 31 December 2009 were €230 million and €1 million (2008: €238 million and €2 million) respectively.
AssociatesAt 31December 2009 the outstanding balance receivable from JohnsonDiversey Holdings Inc. was €5 million (2008: balance payable was€33 million). Agency fees payable to JohnsonDiversey in connection with the sale of Unilever branded products through their channels amountedto approximately €20 million in 2009 (2008: €24 million).
Langholm Capital Partners invests in private European companies with above-average longer-term growth prospects. Since the Langholm fundwas launched in 2002, Unilever has invested €76 million in Langholm, with an outstanding commitment at the end of 2009 of €21 million.
Unilever has received back a total of €123 million in cash from its investment in Langholm.
Physic Ventures is an early stage venture capital fund based in San Francisco, focusing on consumer-driven health, wellness and sustainable living.Unilever has invested €20 million in Physic Ventures since the launch of the fund in 2007. At 31 December 2009 the outstanding commitmentwith Physic Ventures was €43 million.
31 Remuneration of auditors
€ million € million € million
2009 2008 2007
Fees payable to PricewaterhouseCoopers(a) for the audit of the consolidated and parentcompany accounts of Unilever N.V. and Unilever PLC (5) (7) (5)
Fees payable to PricewaterhouseCoopers(b) for the audit of accounts ofsubsidiaries of Unilever N.V. and Unilever PLC pursuant to the legislation (14) (15) (17)
Total statutory audit fees(c) (19) (22) (22)
Other services supplied pursuant to such legislation – (1) (1)Other services relevant to taxation (2) (2) (2)Services relating to corporate finance transactions – (2) (1)All other services (1) (1) (1)
(a) Of which:€1 million was paid to PricewaterhouseCoopers Accountants N.V. (2008: €2 million; 2007: €1 million); and€4 million was paid to PricewaterhouseCoopers LLP (2008: €5 million; 2007: €4 million).
(b) Comprises fees paid to the network of separate and independent member firms of PricewaterhouseCoopers International Limited for auditwork on statutory financial statements and group reporting returns of subsidiary companies.
(c) In addition, €1 million of statutory audit fees were payable to PricewaterhouseCoopers in respect of services supplied to associated pensionschemes (2008: €1 million; 2007: €1 million).
32 Events after the balance sheet date
As agreed at the AGMs and at meetings of ordinary shareholders in May 2009 Unilever has with effect from 1 January 2010 moved to anarrangement of paying quarterly dividends. The first quarterly interim dividends of €0.1950 per NV ordinary share and £0.1704 per PLCordinary share were declared on 4 February 2010.
Financial statements
Related Documents