Financial Statements and Reports 2019 Arup Group Limited

Welcome message from author
This document is posted to help you gain knowledge. Please leave a comment to let me know what you think about it! Share it to your friends and learn new things together.
Transcript

Financial Statements and Reports 2019 Arup Group Limited
Arup Group Limited and its subsidiary undertakings | Financial Statements and Reports for the year ended 31 March 2019
Contents
3 Chairman's foreword
4 Strategic report
5 Directors’ report
7 Independent auditors’ report
9 Consolidated income statement
9 Consolidated statement of comprehensive income
10 Consolidated balance sheet
11 Company balance sheet
12 Consolidated statement of changes in equity
12 Company statement of changes in equity
13 Consolidated statement of cash flows
14 Notes to the financial statements
Arup Group Limited and its subsidiary undertakings | Financial Statements and Reports for the year ended 31 March 2019
Chairman’s foreword
Chairman's foreword for the year ended 31 March 2019 3
Arup has continued to create work of real quality and make a positive contribution to communities in every corner of the world, despite these uncertain and turbulent times.
Our financial position remains robust. However, our real strength lies with our members who continue to demonstrate both ingenuity and determination, however big the challenge.
Sustainable developmentThere is no escaping the fact that the global geo-political situation is volatile and it’s getting harder for any business to plan with certainty. Equally, other factors like rapid urbanisation, social inequality, climate change and the constantly expanding impact of new technology are all having a major effect on the clients we work for.
These issues are all related. That’s why we took the decision in 2017 to build our response around the United Nations Sustainable Development Goals (SDGs). The comprehensive, action-based nature of these goals aligns with our own values. As advisors, designers and engineers, we see these issues up close, every day. The SDGs offer us a platform to do something substantive across every facet of our operations, and they’re providing additional impetus to many of the good things our firm has already been doing for some time.
Geographic strengthAgainst a turbulent global picture, we have again performed well across all our regions and all our markets this year. Revenue – a consequence of our success rather than an end in itself – has grown by 9.9% to £1,714.8m, with operating profit (before staff profit-sharing) of £135.4m.
We have helped shape a better world in 143 countries this year. And in each of our five regions, we want to be where the challenges are and where there is an opportunity for us to make a difference.
In North America we continue to see an increasing demand for our services in both the US and Canada. Our work here has been hugely varied, from iconic projects like the redevelopment of Seattle’s Space Needle, to our specialist acoustic collaboration with the musician Björk.
Another area of rapid expansion is South East Asia. We have strengthened and grown our operations in Vietnam this year and expect to continue increasing our presence in Singapore, Thailand, Indonesia and the Philippines. Mactan-Cebu Philippines Airport is a good example of the impact we are making.
Expanding impactFor much of our history, design, architecture, planning and engineering has been Arup’s main focus. Over the last decade our advisory services have grown in importance.
These advisory services, anchored in our technical expertise, are now making a real difference to our clients’ businesses. Technical experts are working hand-in-hand with colleagues skilled in strategy, economics, finance, sustainability, operations and change management.
Together, our work allows clients to, for example, understand the viability and potential benefits of proposed schemes, enabling them to invest with greater confidence. It also allows them to improve the development and performance of assets ranging from industrial plants to airports. Our work advising the hugely complex London Power Tunnels project clearly illustrates the benefits we can bring.
Digital leadershipDigital technology, in all its different forms, is another area of significant development. We’re making huge strides forward in the way we collect, manage and use data to inform everything we do. We’re also rapidly expanding our use of automation, machine learning and artificial intelligence to solve new and greater problems.
With our clients, advanced technology is expanding our ambitions and capabilities. Enhanced modelling techniques are making designs for ground-breaking structures like the Forest Tower in Denmark possible. Machine learning is helping us implement more effective flood management strategies, with benefits for vulnerable communities around the world. Meanwhile, our use of blockchain technology is allowing young homeless people in Berlin to access critical services without the need for bank accounts or credit cards.
Getting the most out of digital advances is as much about people as processing power, and our firm-wide digital transformation programme is beginning to pay dividends. The tools our people develop and the data they depend on are being shared in new ways, enabling a greater level of collaboration than ever before.
Membership mindsetOur founder, Sir Ove Arup, often spoke about the importance of people. How people are ‘members’ of organisations they want to be part of. Their participation is voluntary, and a reflection of what Sir Ove called ‘unity and enthusiasm’. Everyone at Arup is always eager to nurture this mindset, ensuring a thriving and collaborative culture for all our members.
This will see us increasingly welcoming people with a wider range of skills. It also sees us actively celebrating diversity and inclusion. In a traditionally male dominated profession we can’t create perfect gender balance overnight. What we can do is make it a constant focus and measure our progress year-by-year.
As I begin my time as Chairman, I’m conscious that I am very much a steward. My goal is clear – to ensure that our firm continues to do great work to the benefit of our clients and communities, through a team of talented people who are happy and fulfilled.
Alan Belfield Chairman, Arup Group
Arup Group Limited and its subsidiary undertakings | Financial Statements and Reports for the year ended 31 March 2019
4
The directors present their strategic report for Arup Group Limited (the ''Company'') together with its subsidiaries (the ''Group'') for the year ended 31 March 2019 which was approved by the board of directors.
Review of the businessThese are the results for the Group for the financial year ended 31 March 2019. The results show a profit for the financial year of £12.9m (restated 2018: £82.5m).
The prior years' financial statements were restated due to changes in accounting standards. The impacts of these changes are explained in note 31.
The net assets as at 31 March 2019 are £278.5m (restated 2018: £247.7m; restated 1 April 2017: £147.5m).
The performance and development of the Group is in line with the expectations of the directors.
The principal area of risk and operating uncertainty for the business is its ability to continue to secure new projects and deliver the performance of existing projects in line with management's objectives. To monitor these, the directors use the following key performance indicators ("KPIs"):
• Revenue and profit per person are financial KPIs used to monitor the continued contribution to the Group. In calculating profit per person, profit is stated before income tax, dividends and staff profit-sharing. For the year ended 31 March 2019, revenue per person was £116k (2018: £113k) and profit per person was £9k (2018: £13k).
• Staff turnover is a key non-financial measure of business performance. For the year ended 31 March 2019, staff turnover was 11.6% (2018: 11.3%).
By order of the Board
M J Ansley-Young Company Secretary
28 October 2019
Registered Office: 13 Fitzroy Street, London, W1T 4BQ, UK
Strategic report
Strategic report for the year ended 31 March 2018
Arup Group Limited and its subsidiary undertakings | Financial Statements and Reports for the year ended 31 March 2019
5
The directors present their report together with the audited consolidated financial statements of the Group and the audited financial statements of the Company for the year ended 31 March 2019 which were approved by the board of directors.
The capital of the Company is divided into equity shares, which are held in trust for the benefit of the employees (past and present) of the Group, and voting shares that are held by Ove Arup Partnership Charitable Trust.
Principal activitiesThe Group practices in the field of design and consulting engineering services, in architecture and in other related professional skills.
Future developmentsThe Group will continue to operate in similar markets. The Group has a solid, diversified portfolio and a breadth of quality employees that will help to exploit opportunities.
DividendsThe directors do not recommend a dividend for the year ending 31 March 2019 (2018: nil).
DirectorsThe directors of the Company during the year and up to the date of signing these financial statements were as follows:
P A Bailey (Resigned 31 March 2019) A J Belfield T G A Carfrae P J Chamley P A Coughlan (Appointed 1 April 2019) F M Cousins I Dedring (Appointed 1 April 2019) J A Frost G S Hodkinson (Resigned 31 March 2019) M K Y Kwok D M Mitchell G Shore (Resigned 30 June 2019) T J Stone M S Tweedie (Resigned 30 September 2019) T J F Whyte
Directors’ remunerationDirectors' remuneration has been disclosed in note 6 to the financial statements.
Directors’ indemnitiesAs permitted by the Company's Articles of Association, the directors have the benefit of an indemnity which is a qualifying third party indemnity provision as defined by section 234 of the Companies Act 2006. The indemnity was in force throughout the financial year and is currently in force. The Company also purchased and maintained throughout the financial year Directors’ and Officers’ Liability Insurance in respect of itself, its directors and officers.
Independent auditorsThe Company's auditors, PricewaterhouseCoopers LLP, have indicated their willingness to continue in office for another financial year.
Directors’ report
Directors' report for the year ended 31 March 2019
Financial risk managementThe Group's financial assets and liabilities comprise cash at bank, trade and other receivables and trade and other payables, whose main purpose is to maintain adequate finance for the Group's operations.
The Group is exposed to a number of financial risks and actively mitigates the risk of financial loss. The key aspects are:
• Foreign exchange risk: where possible the Group matches its currency earnings with currency costs. Where this is not possible, appropriate derivative contracts may be used. There is no speculative use of financial instruments;
• Interest rate risk: the Group currently does not hedge interest rate risk, however the need to do so is regularly reviewed;
• Credit risk: the main exposure to credit risk is on amounts due from customers. Controls and procedures are in place to mitigate this risk. Cash investments are held with banks with a minimum credit rating of A-3 / P2; and
• Liquidity risk: cash flow forecasts are prepared to ensure that sufficient funds are available to meet the Group's liabilities as and when they fall due.
Note 1 in the notes to the financial statements provides further information on accounting for exchange rate differences.
Research and developmentThe Group engages in research and development on an ad-hoc basis as required to complete projects during the normal course of business. Costs incurred in research are immediately expensed to the income statement, whilst development costs are assessed for capitalisation against the criteria of International Accounting Standard ("IAS") 38 'Intangible Assets'.
EmployeesThe maintenance of a highly skilled workforce is key to the future of the Group. Health and Safety matters are regularly reviewed by the directors and it is their policy to ensure that:
• full and fair consideration is given to all applications for employment made by disabled persons, having regard to their capabilities;
• when existing employees become disabled (whether from illness or accident) every reasonable effort is made to continue to provide suitable employment either in the same, or by training, in an alternative job; and
• disabled persons are given equal consideration for training, career development and opportunities for promotion within the Group.
The Group communicates actively with its employees who are encouraged to express their views on major policy issues. 'Working at Arup' surveys are conducted to obtain feedback from employees. This survey is confidential and is used alongside consultation with employees where appropriate.
Twice a year, employees are provided with a performance report containing financial information. Employees are informed of significant business issues via the use of email, discussions with senior management, the Group's intranet and in-house publications.
Employee involvement in the Group's performance is encouraged and maintained via participation in a staff profit-sharing scheme.

Arup Group Limited and its subsidiary undertakings | Financial Statements and Reports for the year ended 31 March 2019
6 Directors’ report for the year ended 31 March 2019
Directors’ report (continued)
Statement of directors’ responsibilitiesThe directors are responsible for preparing the Financial Statements and Reports in accordance with applicable law and regulation.
Company law requires the directors to prepare financial statements for each financial year. Under that law the directors have prepared the Group financial statements in accordance with International Financial Reporting Standards ("IFRSs") as adopted by the European Union, and the Company financial statements in accordance with United Kingdom Generally Accepted Accounting Practice (United Kingdom Accounting Standards, comprising Financial Reporting Standard 101 'Reduced Disclosure Framework' ("FRS 101") and applicable law). Under company law the directors must not approve the financial statements unless they are satisfied that they give a true and fair view of the state of affairs of the Group and the Company and of the profit or loss of the Group and the Company for that period. In preparing these financial statements, the directors are required to:
• select suitable accounting policies and then apply them consistently;
• state whether applicable IFRSs as adopted by the European Union have been followed for the Group financial statements and applicable United Kingdom Accounting Standards, comprising FRS 101, have been followed for the Company financial statements, subject to any material departures disclosed and explained in the financial statements;
• make judgements and accounting estimates that are reasonable and prudent; and
• prepare the financial statements on the going concern basis unless it is inappropriate to presume that the Group and the Company will continue in business.
The directors are also responsible for safeguarding the assets of the Group and the Company and hence for taking reasonable steps for the prevention and detection of fraud and other irregularities.
The directors are responsible for keeping adequate accounting records that: are sufficient to show and explain the Group's and the Company’s transactions; and disclose with reasonable accuracy at any time the financial position of the Group and the Company; and enable them to ensure that the financial statements comply with the Companies Act 2006 and, as regards the Group financial statements, Article 4 of the IAS Regulation.
The directors are responsible for the maintenance and integrity of the Group’s website. Legislation in the United Kingdom governing the preparation and dissemination of financial statements may differ from legislation in other jurisdictions.
Disclosure of information to auditorsIn the case of each director in office at the date the Directors’ report is approved:
• so far as the director is aware, there is no relevant audit information of which the Company’s auditors are unaware; and
• they have taken all the steps that they ought to have taken as a director in order to make themselves aware of any relevant audit information and to establish that the Company’s auditors are aware of that information.
GovernanceDuring the year, a review was undertaken of the Company’s corporate governance framework.
The directors have agreed that, given the size and complexity of the business, the UK Corporate Governance Code 2018 (the "Code") is the most suitable and will be adopted. The Company will be reporting against the Code in the next financial year (31 March 2020).
By order of the Board
M J Ansley-Young Company Secretary
28 October 2019
Registered Office: 13 Fitzroy Street, London, W1T 4BQ, UK
Arup Group Limited and its subsidiary undertakings | Financial Statements and Reports for the year ended 31 March 2019
7Independent auditors’ report for the year ended 31 March 2019
Independent auditors’ report to the members of Arup Group Limited
Report on the audit of the financial statements
OpinionIn our opinion:
• Arup Group Limited’s Group financial statements and Company financial statements (the “financial statements”) give a true and fair view of the state of the Group’s and of the Company’s affairs as at 31 March 2019 and of the Group’s profit and cash flows for the year then ended;
• the Group financial statements have been properly prepared in accordance with International Financial Reporting Standards (IFRSs) as adopted by the European Union;
• the Company financial statements have been properly prepared in accordance with United Kingdom Generally Accepted Accounting Practice (United Kingdom Accounting Standards, comprising FRS 101 “Reduced Disclosure Framework”, and applicable law); and
• the financial statements have been prepared in accordance with the requirements of the Companies Act 2006.
We have audited the financial statements, included within the “Financial Statements and Reports”, which comprise: the consolidated and Company balance sheets as at 31 March 2019; the consolidated income statement and consolidated statement of comprehensive income, the consolidated statement of cash flows, the consolidated and Company statements of changes in equity for the year then ended; the accounting policies; and the notes to the financial statements.
Basis for opinionWe conducted our audit in accordance with International Standards on Auditing (UK) (“ISAs (UK)”) and applicable law. Our responsibilities under ISAs (UK) are further described in the Auditors’ responsibilities for the audit of the financial statements section of our report. We believe that the audit evidence we have obtained is sufficient and appropriate to provide a basis for our opinion.
IndependenceWe remained independent of the Group in accordance with the ethical requirements that are relevant to our audit of the financial statements in the UK, which includes the FRC’s Ethical Standard, and we have fulfilled our other ethical responsibilities in accordance with these requirements.
Conclusions relating to going concernISAs (UK) require us to report to you when:
• the directors’ use of the going concern basis of accounting in the preparation of the financial statements is not appropriate; or
• the directors have not disclosed in the financial statements any identified material uncertainties that may cast significant doubt about the Group’s and Company’s ability to continue to adopt the going concern basis of accounting for a period of at least twelve months from the date when the financial statements are authorised for issue.
We have nothing to report in respect of the above matters.
However, because not all future events or conditions can be predicted, this statement is not a guarantee as to the Group’s and Company’s ability to continue as a going concern. For example, the terms on which the United Kingdom may withdraw from the European Union are not clear, and it is difficult to evaluate all of the potential implications on the Group’s trade, customers, suppliers and the wider economy.
Reporting on other informationThe other information comprises all of the information in the “Financial Statements and Reports” other than the financial statements and our auditors’ report thereon. The directors are responsible for the other information. Our opinion on the financial statements does not cover the other information and, accordingly, we do not express an audit opinion or, except to the extent otherwise explicitly stated in this report, any form of assurance thereon.
In connection with our audit of the financial statements, our responsibility is to read the other information and, in doing so, consider whether the other information is materially inconsistent with the financial statements or our knowledge obtained in the audit, or otherwise appears to be materially misstated. If we identify an apparent material inconsistency or material misstatement, we are required to perform procedures to conclude whether there is a material misstatement of the financial statements or a material misstatement of the other information. If, based on the work we have performed, we conclude that there is a material misstatement of this other information, we are required to report that fact. We have nothing to report based on these responsibilities.
With respect to the Strategic Report and Directors’ Report, we also considered whether the disclosures required by the UK Companies Act 2006 have been included.
Based on the responsibilities described above and our work undertaken in the course of the audit, ISAs (UK) require us also to report certain opinions and matters as described below.
Strategic Report and Directors' ReportIn our opinion, based on the work undertaken in the course of the audit, the information given in the Strategic Report and Directors’ Report for the year ended 31 March 2019 is consistent with the financial statements and has been prepared in accordance with applicable legal requirements.
In light of the knowledge and understanding of the Group and Company and their environment obtained in the course of the audit, we did not identify any material misstatements in the Strategic Report and Directors’ Report.
Responsibilities for the financial statements and the auditResponsibilities of the directors for the financial statementsAs explained more fully in the Statement of directors' responsibilities set out on page 6, the directors are responsible for the preparation of the financial statements in accordance with the applicable framework and for being satisfied that they give a true and fair view. The directors are also responsible for such internal control as they determine is necessary to enable the preparation of financial statements that are free from material misstatement, whether due to fraud or error.
In preparing the financial statements, the directors are responsible for assessing the Group’s and the Company’s ability to continue as a
Arup Group Limited and its subsidiary undertakings | Financial Statements and Reports for the year ended 31 March 2019
8 Independent auditors’ report for the year ended 31 March 2019
Independent auditors’ report to the members of Arup Group Limited (continued)
going concern, disclosing as applicable, matters related to going concern and using the going concern basis of accounting unless the directors either intend to liquidate the Group or the Company or to cease operations, or have no realistic alternative but to do so.
Auditors’ responsibilities for the audit of the financial statementsOur objectives are to obtain reasonable assurance about whether the financial statements as a whole are free from material misstatement, whether due to fraud or error, and to issue an auditors’ report that includes our opinion. Reasonable assurance is a high level of assurance, but is not a guarantee that an audit conducted in accordance with ISAs (UK) will always detect a material misstatement when it exists. Misstatements can arise from fraud or error and are considered material if, individually or in the aggregate, they could reasonably be expected to influence the economic decisions of users taken on the basis of these financial statements.
A further description of our responsibilities for the audit of the financial statements is located on the FRC’s website at: www.frc.org.uk/auditorsresponsibilities. This description forms part of our auditors’ report.
Use of this reportThis report, including the opinions, has been prepared for and only for the Company’s members as a body in accordance with Chapter 3 of Part 16 of the Companies Act 2006 and for no other purpose. We do not, in giving these opinions, accept or assume responsibility for any other purpose or to any other person to whom this report is shown or into whose hands it may come save where expressly agreed by our prior consent in writing.
Other required reporting
Companies Act 2006 exception reportingUnder the Companies Act 2006 we are required to report to you if, in our opinion:
• we have not received all the information and explanations we require for our audit; or
• adequate accounting records have not been kept by the Company, or returns adequate for our audit have not been received from branches not visited by us; or
• certain disclosures of directors’ remuneration specified by law are not made; or
• the Company financial statements are not in agreement with the accounting records and returns.
We have no exceptions to report arising from this responsibility.
Craig Skelton (Senior Statutory Auditor)For and on behalf of PricewaterhouseCoopers LLP Chartered Accountants and Statutory Auditors
London
28 October 2019
Arup Group Limited and its subsidiary undertakings | Financial Statements and Reports for the year ended 31 March 2019
9Consolidated income statement and consolidated statement of comprehensive income for the year ended 31 March 2019
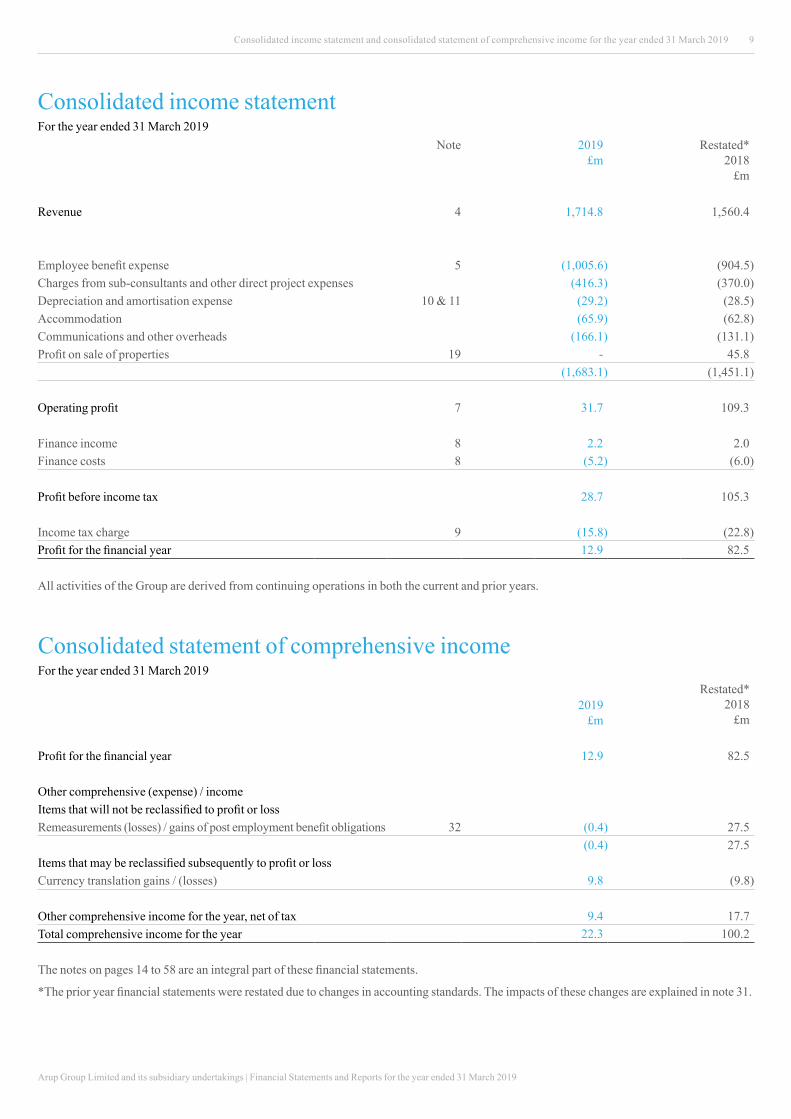
Consolidated statement of comprehensive incomeFor the year ended 31 March 2019
2019£m
Restated* 2018
£m
Profit for the financial year 12.9 82.5
Other comprehensive (expense) / incomeItems that will not be reclassified to profit or lossRemeasurements (losses) / gains of post employment benefit obligations 32 (0.4) 27.5
(0.4) 27.5 Items that may be reclassified subsequently to profit or lossCurrency translation gains / (losses) 9.8 (9.8)
Other comprehensive income for the year, net of tax 9.4 17.7 Total comprehensive income for the year 22.3 100.2
The notes on pages 14 to 58 are an integral part of these financial statements.
*The prior year financial statements were restated due to changes in accounting standards. The impacts of these changes are explained in note 31.
Consolidated income statementFor the year ended 31 March 2019
Note
2019
£m
Restated* 2018
£m
Revenue 4 1,714.8 1,560.4
Employee benefit expense 5 (1,005.6) (904.5)Charges from sub-consultants and other direct project expenses (416.3) (370.0)Depreciation and amortisation expense 10 & 11 (29.2) (28.5)Accommodation (65.9) (62.8)Communications and other overheads (166.1) (131.1)Profit on sale of properties 19 - 45.8 (1,683.1) (1,451.1)
Operating profit 7 31.7 109.3
Finance income 8 2.2 2.0 Finance costs 8 (5.2) (6.0)
Profit before income tax 28.7 105.3
Income tax charge 9 (15.8) (22.8)Profit for the financial year 12.9 82.5
All activities of the Group are derived from continuing operations in both the current and prior years.
Arup Group Limited and its subsidiary undertakings | Financial Statements and Reports for the year ended 31 March 2019
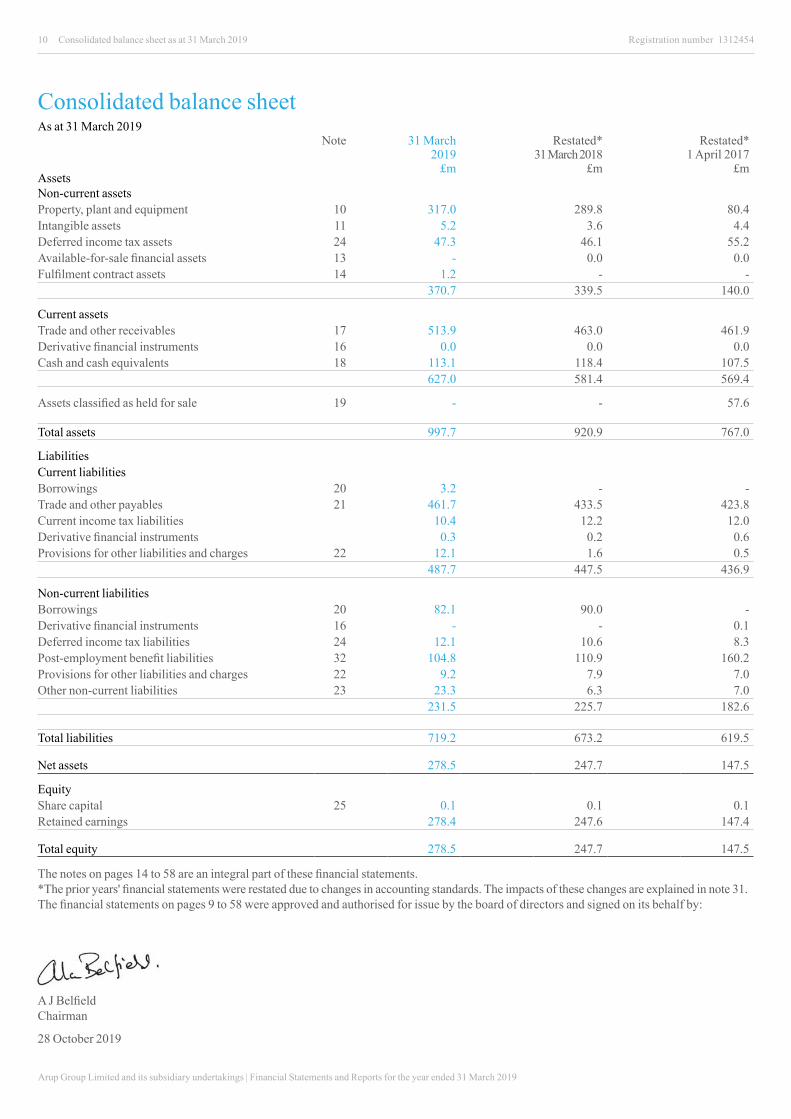
10 Consolidated balance sheet as at 31 March 2019
Consolidated balance sheetAs at 31 March 2019
Note
31 March 2019
£m
Restated* 31 March 2018
£m
Restated* 1 April 2017
£mAssetsNon-current assetsProperty, plant and equipment 10 317.0 289.8 80.4 Intangible assets 11 5.2 3.6 4.4 Deferred income tax assets 24 47.3 46.1 55.2 Available-for-sale financial assets 13 - 0.0 0.0 Fulfilment contract assets 14 1.2 - -
370.7 339.5 140.0
Current assetsTrade and other receivables 17 513.9 463.0 461.9 Derivative financial instruments 16 0.0 0.0 0.0 Cash and cash equivalents 18 113.1 118.4 107.5
627.0 581.4 569.4
Assets classified as held for sale 19 - - 57.6
Total assets 997.7 920.9 767.0
LiabilitiesCurrent liabilitiesBorrowings 20 3.2 - - Trade and other payables 21 461.7 433.5 423.8 Current income tax liabilities 10.4 12.2 12.0 Derivative financial instruments 0.3 0.2 0.6 Provisions for other liabilities and charges 22 12.1 1.6 0.5 487.7 447.5 436.9
Non-current liabilitiesBorrowings 20 82.1 90.0 - Derivative financial instruments 16 - - 0.1 Deferred income tax liabilities 24 12.1 10.6 8.3 Post-employment benefit liabilities 32 104.8 110.9 160.2 Provisions for other liabilities and charges 22 9.2 7.9 7.0 Other non-current liabilities 23 23.3 6.3 7.0 231.5 225.7 182.6
Total liabilities 719.2 673.2 619.5
Net assets 278.5 247.7 147.5
EquityShare capital 25 0.1 0.1 0.1 Retained earnings 278.4 247.6 147.4
Total equity 278.5 247.7 147.5
The notes on pages 14 to 58 are an integral part of these financial statements. *The prior years' financial statements were restated due to changes in accounting standards. The impacts of these changes are explained in note 31. The financial statements on pages 9 to 58 were approved and authorised for issue by the board of directors and signed on its behalf by:
A J Belfield Chairman
28 October 2019
Registration number 1312454
Arup Group Limited and its subsidiary undertakings | Financial Statements and Reports for the year ended 31 March 2019
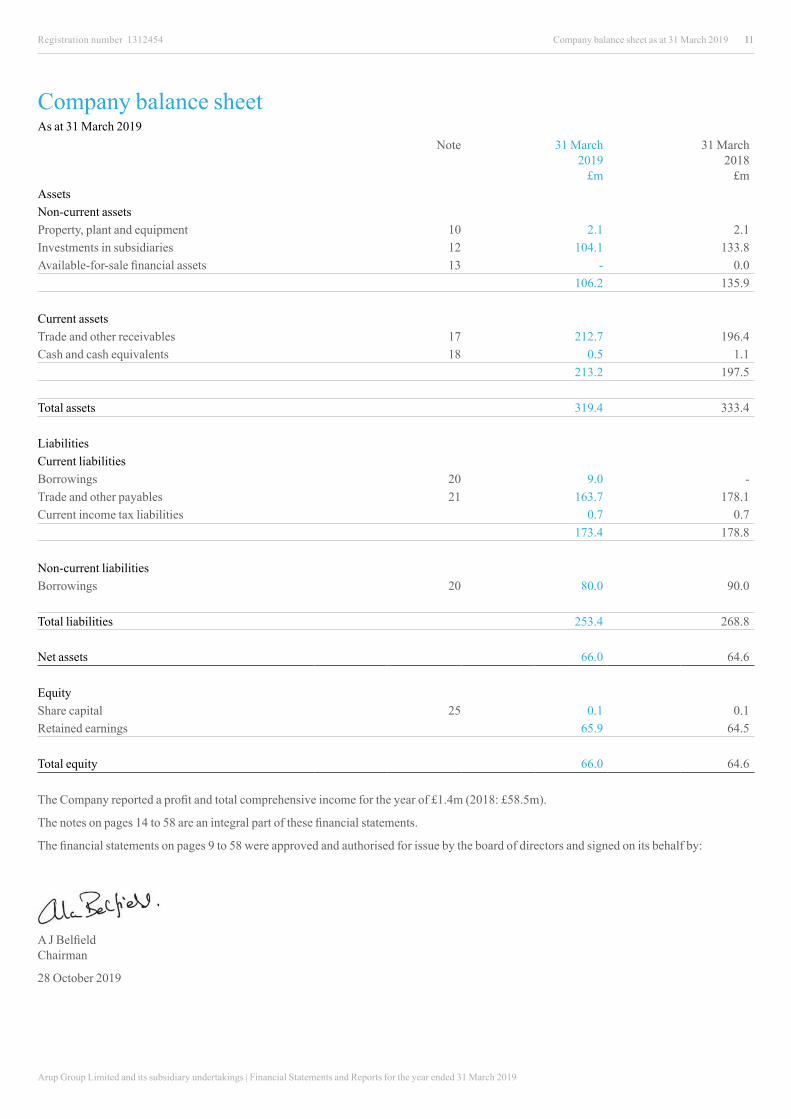
11 11Company balance sheet as at 31 March 2019Registration number 1312454
Company balance sheetAs at 31 March 2019
Note
31 March
2019 £m
31 March 2018
£mAssetsNon-current assets Property, plant and equipment 10 2.1 2.1 Investments in subsidiaries 12 104.1 133.8 Available-for-sale financial assets 13 - 0.0
106.2 135.9
Current assetsTrade and other receivables 17 212.7 196.4 Cash and cash equivalents 18 0.5 1.1
213.2 197.5
Total assets 319.4 333.4
LiabilitiesCurrent liabilities Borrowings 20 9.0 -Trade and other payables 21 163.7 178.1 Current income tax liabilities 0.7 0.7
173.4 178.8
Non-current liabilitiesBorrowings 20 80.0 90.0
Total liabilities 253.4 268.8
Net assets 66.0 64.6
EquityShare capital 25 0.1 0.1 Retained earnings 65.9 64.5
Total equity 66.0 64.6
The Company reported a profit and total comprehensive income for the year of £1.4m (2018: £58.5m).
The notes on pages 14 to 58 are an integral part of these financial statements.
The financial statements on pages 9 to 58 were approved and authorised for issue by the board of directors and signed on its behalf by:
A J Belfield Chairman
28 October 2019
Arup Group Limited and its subsidiary undertakings | Financial Statements and Reports for the year ended 31 March 2019
12
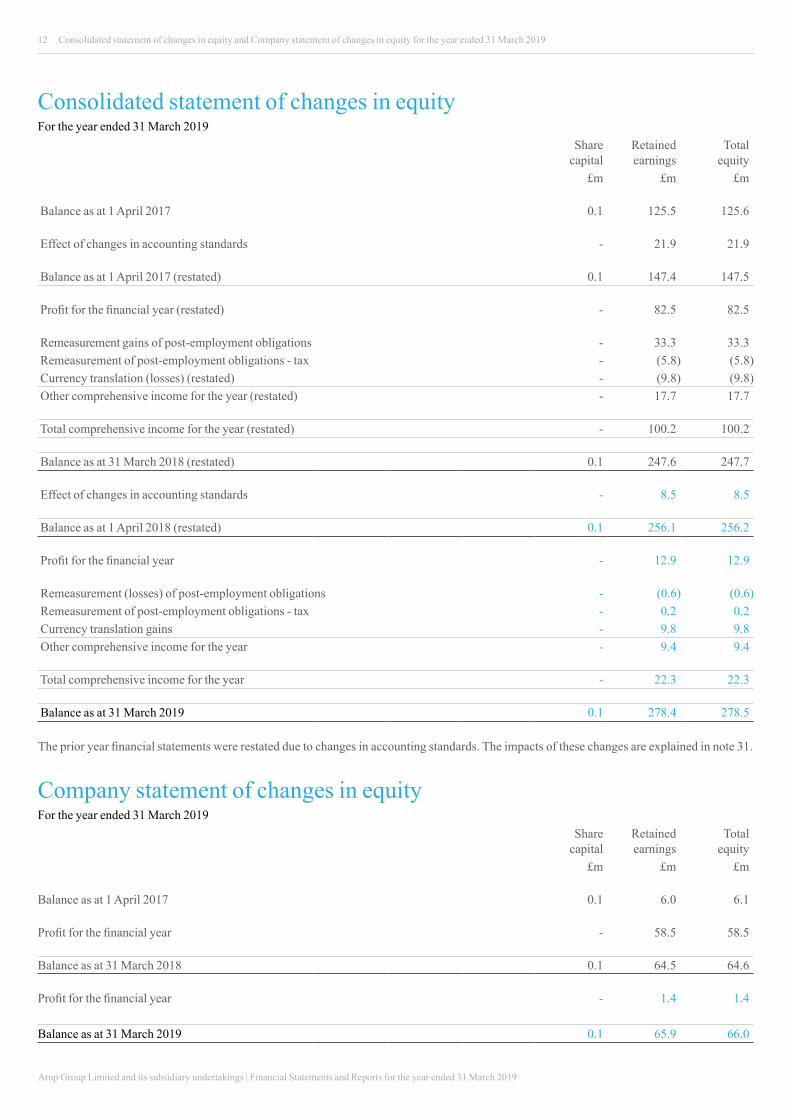
Consolidated statement of changes in equityFor the year ended 31 March 2019
Share
capital Retained earnings
Total equity
£m £m £m
Balance as at 1 April 2017 0.1 125.5 125.6
Effect of changes in accounting standards - 21.9 21.9
Balance as at 1 April 2017 (restated) 0.1 147.4 147.5
Profit for the financial year (restated) - 82.5 82.5
Remeasurement gains of post-employment obligations - 33.3 33.3 Remeasurement of post-employment obligations - tax - (5.8) (5.8) Currency translation (losses) (restated) - (9.8) (9.8) Other comprehensive income for the year (restated) - 17.7 17.7
Total comprehensive income for the year (restated) - 100.2 100.2
Balance as at 31 March 2018 (restated) 0.1 247.6 247.7
Effect of changes in accounting standards - 8.5 8.5
Balance as at 1 April 2018 (restated) 0.1 256.1 256.2
Profit for the financial year - 12.9 12.9
Remeasurement (losses) of post-employment obligations - (0.6) (0.6) Remeasurement of post-employment obligations - tax - 0.2 0.2 Currency translation gains - 9.8 9.8 Other comprehensive income for the year - 9.4 9.4
Total comprehensive income for the year - 22.3 22.3
Balance as at 31 March 2019 0.1 278.4 278.5
The prior year financial statements were restated due to changes in accounting standards. The impacts of these changes are explained in note 31.
Company statement of changes in equityFor the year ended 31 March 2019
Share
capital Retained earnings
Total equity
£m £m £m
Balance as at 1 April 2017 0.1 6.0 6.1
Profit for the financial year - 58.5 58.5
Balance as at 31 March 2018 0.1 64.5 64.6
Profit for the financial year - 1.4 1.4
Balance as at 31 March 2019 0.1 65.9 66.0
Consolidated statement of changes in equity and Company statement of changes in equity for the year ended 31 March 2019
Arup Group Limited and its subsidiary undertakings | Financial Statements and Reports for the year ended 31 March 2019
13Consolidated statement of cash flows for the year ended 31 March 2019
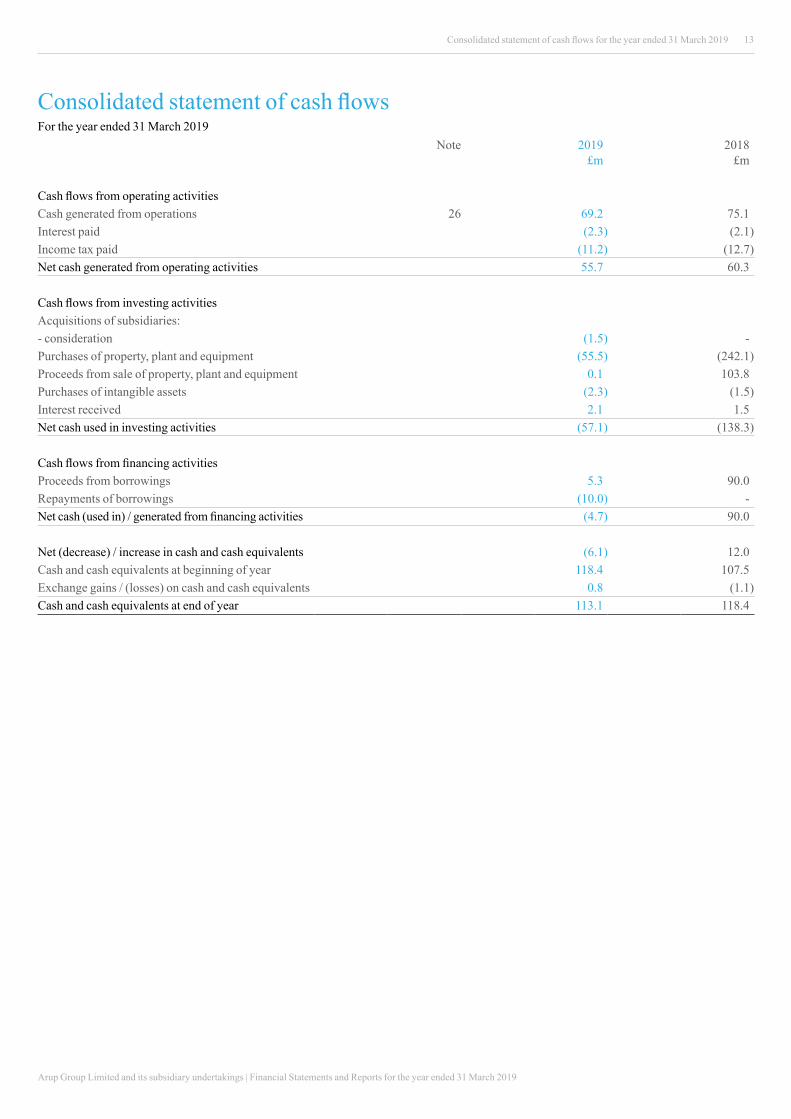
Consolidated statement of cash flowsFor the year ended 31 March 2019
Note 2019
£m2018
£m Cash flows from operating activitiesCash generated from operations 26 69.2 75.1 Interest paid (2.3) (2.1)Income tax paid (11.2) (12.7)Net cash generated from operating activities 55.7 60.3
Cash flows from investing activitiesAcquisitions of subsidiaries:- consideration (1.5) - Purchases of property, plant and equipment (55.5) (242.1)Proceeds from sale of property, plant and equipment 0.1 103.8 Purchases of intangible assets (2.3) (1.5)Interest received 2.1 1.5 Net cash used in investing activities (57.1) (138.3)
Cash flows from financing activitiesProceeds from borrowings 5.3 90.0 Repayments of borrowings (10.0) - Net cash (used in) / generated from financing activities (4.7) 90.0
Net (decrease) / increase in cash and cash equivalents (6.1) 12.0 Cash and cash equivalents at beginning of year 118.4 107.5 Exchange gains / (losses) on cash and cash equivalents 0.8 (1.1)Cash and cash equivalents at end of year 113.1 118.4
Arup Group Limited and its subsidiary undertakings | Financial Statements and Reports for the year ended 31 March 2019
14 Notes to the financial statements for the year ended 31 March 2019
1 Basis of preparationArup Group Limited is a private limited company which is incorporated in England and Wales. The address of the registered office is 13 Fitzroy Street, London, W1T 4BQ, UK.
Accounting policies that relate to the financial statements as a whole are set out below, while those that relate to specific areas of the financial statements are shown in the corresponding note. All accounting policies have been consistently applied to all the years presented, unless otherwise stated.
GroupThe Group's consolidated financial statements have been prepared in accordance with IFRSs and IFRS Interpretations Committee ("IFRS IC" or "IFRIC") interpretations as adopted by the European Union and the Companies Act 2006 as applicable to companies reporting under IFRSs. These financial statements have been prepared under the historical cost convention, except for financial assets and liabilities that are measured at fair values at the end of each reporting period, as explained in the accounting policies.
The preparation of financial statements in conformity with IFRSs require the use of certain critical accounting estimates. It also requires management to exercise its judgement in the process of applying the Group's accounting policies. The areas involving a higher degree of judgement or complexity, or areas where assumptions and estimates are significant to the preparation of the consolidated financial statements are disclosed in note 3.
CompanyThe Company's financial statements have been prepared in accordance with FRS 101 and the Companies Act 2006. The Company has early adopted FRS 101 (March 2018).
These financial statements have been prepared under the historical cost convention, except for financial assets and liabilities that are measured at fair values at the end of each reporting period, as explained in the accounting policies.
The Company has not presented an income statement or statement of comprehensive income as permitted by Section 408(3) of the Companies Act 2006.
The profit and total comprehensive income for the year was £1.4m (2018: £58.5m).
The following exemptions from the requirements of IFRS have been applied in the preparation of these financial statements, in accordance with FRS 101:
- Paragraphs 62, B64(d), B64(e), B64(g), B64(h), B64(j) to B64(m), B64(n)(ii), B64(o)(ii), B64(p), B64(q)(ii), B66 and B67 of IFRS 3, ‘Business Combinations’;
- Paragraph 33(c) of IFRS 5, ‘Non-current Assets Held for Sale and Discontinued Operations’;
- IFRS 7, ‘Financial Instruments: Disclosures’;
- Paragraphs 91 to 99 of IFRS 13, ‘Fair Value Measurement’ (disclosure of valuation techniques and inputs used for fair value measurement of assets and liabilities);
- The requirements of the second sentence of paragraph 110 and paragraphs 113(a), 114, 115, 118, 119(a) to (c), 120 to 127 and 129 of IFRS 15, 'Revenue from Contracts with Customers';
- Paragraph 38 of IAS 1, 'Presentation of Financial Statements' comparative information requirements in respect of:
- 79(a)(iv) of IAS 1, ‘Presentation of Financial Statements’ (reconciliation of the number of shares outstanding at the beginning and end of the period);
- 73(e) of IAS 16, ‘Property, Plant and Equipment’ (reconciliation of the carrying amount at the beginning and end of the period);
- 118(e) of IAS 38, ‘Intangible Assets’ (reconciliation of the carrying amount at the beginning and end of the period); and
- 76 and 79(d) of IAS 40, ‘Investment Property’ (reconciliation of the carrying amount at the beginning and end of the period).
- The following paragraphs of IAS 1:
- 10(d) (statement of cash flows);
- 10(f) (a statement of financial position as at the beginning of the preceding period when an entity applies an accounting policy retrospectively or makes a retrospective restatement of items in its financial statements, or when it reclassifies items in its financial statements);
- 16 (statement of compliance with IFRSs);
- 38A (requirement for minimum of two primary statements including cash flow statements);
- 38B-D (additional comparative information);
- 40A-D (requirements for a third statement of financial position);
- 111 (cash flow statement information); and
- 134-136 (capital management disclosures).
- IAS 7, ‘Statement of cash flows’;
- Paragraphs 30 and 31 of IAS 8, 'Accounting policies, changes in accounting estimates and errors' (requirement for the disclosure of information when an entity has not applied a new IFRS that has been issued but is not yet effective);
- Paragraph 17 of IAS 24, ‘Related party disclosures’ (key management compensation); and
- IAS 24 (disclosure of related parties entered into between two or more members of a group providing that the parties are wholly owned by the group).
Going concernThe directors have a reasonable expectation that the Group has adequate resources to continue in operational existence for the foreseeable future and therefore continue to adopt the going concern basis in preparing the financial statements.
Notes to the financial statementsFor the year ended 31 March 2019
Arup Group Limited and its subsidiary undertakings | Financial Statements and Reports for the year ended 31 March 2019
15Notes to the financial statements for the year ended 31 March 2019
1 Basis of preparation (continued)Changes in accounting policies and disclosuresNew standards, amendments and interpretations - IFRS 9, 'Financial Instruments' is a new standard which enhances the ability of investors and other users of financial information to understand the accounting for financial assets and reduces complexity. The standard uses a single approach to determine whether a financial asset is measured at amortised cost or fair value, replacing the various rules in IAS 39, 'Financial Instruments: Recognition and Measurement'.
- IFRS 15, 'Revenue from Contracts with Customers' is a new standard based on a five-step model framework, which replaces all existing revenue recognition standards. The standard requires revenue to depict the transfer of promised goods or services to customers in an amount that reflects the consideration the entity expects to be entitled to in exchange for those goods or services.
The Group adopted IFRS 9 and IFRS 15 on 1 April 2018. The impacts of the new standards on the Group are explained in note 31. There are no other amendments to accounting standards or IFRIC interpretations that are effective for the year ended 31 March 2019, that have had a material impact on the Group.
New standards, amendments and interpretations not yet adopted by the GroupThe following new accounting standards and interpretations have been published that are not mandatory for the year ended 31 March 2019 and have not been early adopted by the Group: - IFRS 16, 'Leases' is a new standard which sets out the principles for the recognition, measurement, presentation and disclosure of leases for both parties to a contract. The standard eliminates the classification of leases as either operating leases or finance leases as required by IAS 17, 'Leases', and instead, introduces a single lessee accounting model. A lessee will be required to recognise assets and liabilities for all leases with a term of more than 12 months and depreciate lease assets separately from interest on lease liabilities in the income statement. This standard is effective for accounting periods commencing on or after 1 January 2019.
Management is currently assessing the impact of the new standards, amendments and interpretations that are not yet effective. Based on the assessments undertaken to date:
- IFRS 16: In the year ending 31 March 2019, the Group had 197 operating leases with £59.0m recognised in the income statement and £321.3m recognised as lease commitments in note 28. We anticipate the impact to the balance sheet to be greater than the current lease commitments, largely due to IFRS 16 requiring expected lease renewals to be included in the assessment.
Foreign currency translationFunctional and presentation currencyThe Company's functional currency is pound sterling (£). The financial statements are presented in pound sterling, which is the Group's presentation currency.
Transactions and balancesForeign currency transactions are translated into the functional currency using the exchange rates prevailing at the dates of the transactions or valuation where items are remeasured. Foreign exchange gains and losses resulting from the settlement of such transactions and from the translation at year-end exchange rates of monetary assets and liabilities denominated in foreign currencies are recognised in the income statement.
Impairment of non-financial assetsAt each balance sheet date, the Group assesses whether there is objective evidence that an asset or group of assets is impaired. An impairment loss is recognised for the amount by which the carrying amount of the asset exceeds its recoverable amount. The recoverable amount is the higher of the fair value less costs to sell and value in use.
Financial assetsClassificationThe Group classifies its financial assets in the following categories: at fair value through profit or loss; and loans and receivables. The classification depends on the purpose for which the financial assets were acquired. Management determines the classification of its financial assets at initial recognition.
Financial assets at fair value through profit or loss ("FVPL")Financial assets at FVPL are financial assets held for trading. A financial asset is classified in this category if acquired principally for the purpose of selling in the short term. Derivatives are also categorised as held for trading. Assets in this category are classified as current assets if expected to be settled within 12 months, otherwise they are classified as non-current.
Loans and receivablesLoans and receivables are non-derivative financial assets with fixed or determinable payments that are not quoted in an active market. They are included in current assets, except where the maturity is greater than 12 months after the balance sheet date, in which case they are included as non-current assets. The Group's loans and receivables comprise 'Trade and other receivables' and 'Cash and cash equivalents' in the balance sheet.
Recognition and measurementRegular purchases and sales of financial assets are recognised on the trade date (the date on which the Group commits to purchase or sell the asset). Investments are initially recognised at fair value plus transaction costs for all financial assets not carried at FVPL. Financial assets carried at FVPL are initially recognised at fair value, and transaction costs are expensed in the income statement. Financial assets are derecognised when the rights to receive cash flows from the investments have expired or the Group has transferred substantially all risks and rewards of ownership. Loans and receivables are subsequently carried at amortised cost using the effective interest method.
Offsetting financial instrumentsFinancial assets and liabilities are offset and the net amount reported in the balance sheet when there is a legally enforceable right to offset the recognised amounts and there is an intention to settle on a net basis or realise the asset and settle the liability simultaneously.
Notes to the financial statements (continued)For the year ended 31 March 2019
Arup Group Limited and its subsidiary undertakings | Financial Statements and Reports for the year ended 31 March 2019
16
Impairment of financial assetsAssets carried at amortised costAssets are tested for impairment whenever events or changes in circumstances indicate that the carrying amount might not be recoverable. An impairment loss is recognised for the amount by which the asset’s carrying amount exceeds its recoverable amount. The recoverable amount is the higher of an asset’s fair value less costs of disposal and value in use. For the purposes of assessing impairment, assets are grouped at the lowest levels for which there are separately identifiable cash inflows, which are largely independent of the cash inflows from other assets or groups of assets (cash-generating units).
The Group applies the simplified approach for IFRS 9 when measuring expected credit losses which uses a lifetime expected loss allowance for all trade receivables and contract assets. To measure the expected credit losses, trade receivables and amounts recoverable on contracts (contract assets) have been grouped based on shared credit risk characteristics and the days past due. The contract assets relate to unbilled work in progress and have substantially the same risk characteristics as the trade receivables for the same types of contracts. The Group has therefore concluded that the expected loss rates for trade receivables are a reasonable approximation of the loss rates for the contract assets. The expected loss rates are based on payment profiles of sales over a period of 36 months for the three preceding financial years (excluding the current financial year) and the corresponding historical credit losses experienced within this period. The historical loss rates are adjusted to reflect current and forward-looking information on the customers' ability to settle the receivables.
2 Financial risk management
2.1 Financial risk factorsThe Group's activities expose it to a variety of financial risks: market risk (including foreign exchange risk and interest rate risk), credit risk and liquidity risk. The Group's overall risk management programme focuses on the unpredictability of financial markets and seeks to minimise potential adverse effects on the Group's financial performance. The Group uses derivative financial instruments to manage certain risk exposures.
Risk management is carried out by a central treasury department ("Group Treasury") under policies approved by the board of directors. Group Treasury identifies, evaluates and hedges financial risks in close co-operation with the Group's operating units. The board provides written principles for overall risk management, as well as written policies covering specific areas, such as foreign exchange risk, interest rate risk, credit risk, use of derivative financial instruments and investment of excess liquidity.
a) Market riski) Foreign exchange riskThe Group operates in a number of international territories. Each business undertakes a large proportion of its commercial transactions within its local market and in its local functional currency. Foreign exchange risk arises from commercial transactions undertaken in currencies other than the local functional currency, from financial assets and liabilities denominated in currencies other than the local functional currency and on the Group's investments in foreign operations.
Group policy is for each business to undertake commercial transactions in its own functional currency whenever possible. When this is not possible, the Group manages its foreign currency exchange risk from future commercial transactions using appropriate derivative contracts arranged by Group Treasury. Cash flows are reviewed on a monthly basis throughout the duration of projects and the future cover is amended as appropriate.
The Group has certain investments in foreign operations, whose net assets are exposed to foreign currency translation risk. A proportion of the currency exposure arising from the net assets of the Group's foreign operations is managed through borrowings denominated in the relevant foreign currencies.
The Group's primary exposure to foreign exchange risk on unhedged financial assets and liabilities arises mainly in respect of movements between the euro and pound sterling, the Hong Kong dollar and pound sterling and between the US dollar and pound sterling.
Notes to the financial statements for the year ended 31 March 2019
Notes to the financial statements (continued)For the year ended 31 March 2019
Notes to the financial statements
1 Basis of preparation (continued)
Arup Group Limited and its subsidiary undertakings | Financial Statements and Reports for the year ended 31 March 2019
17Notes to the financial statements for the year ended 31 March 2019
Notes to the financial statements (continued)For the year ended 31 March 2019
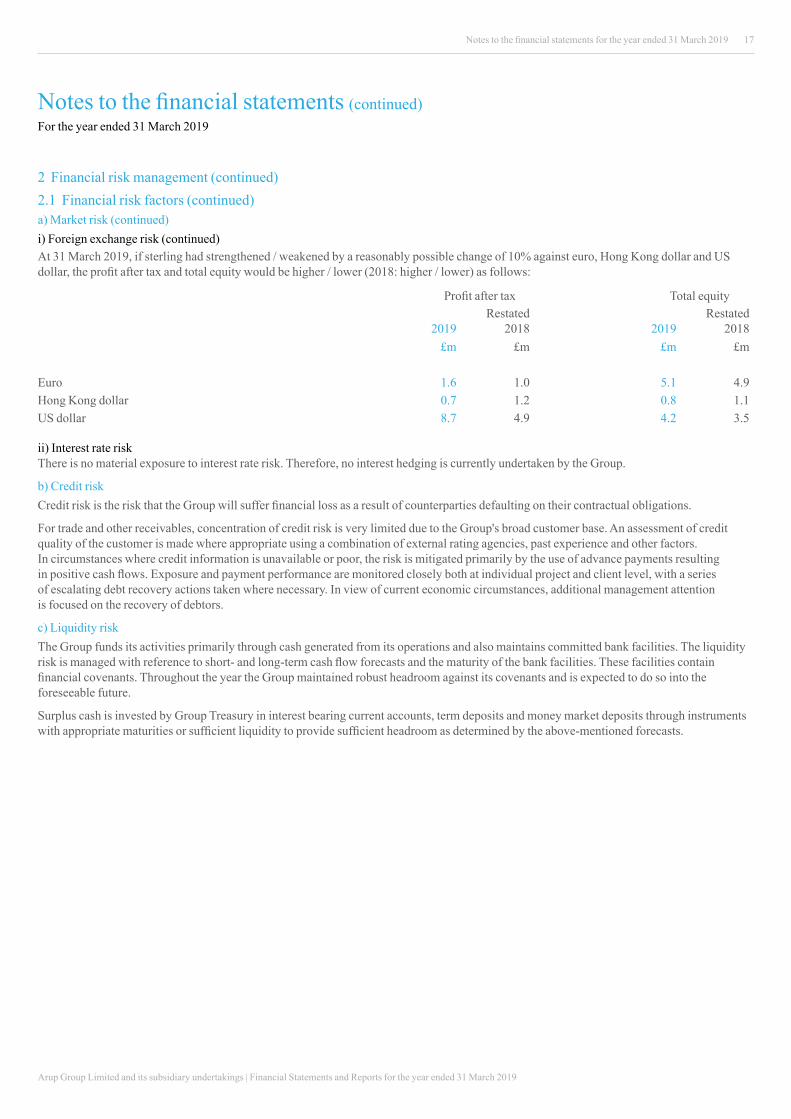
At 31 March 2019, if sterling had strengthened / weakened by a reasonably possible change of 10% against euro, Hong Kong dollar and US dollar, the profit after tax and total equity would be higher / lower (2018: higher / lower) as follows:
Profit after tax Total equity
2019Restated
2018 2019Restated
2018£m £m £m £m
Euro 1.6 1.0 5.1 4.9 Hong Kong dollar 0.7 1.2 0.8 1.1 US dollar 8.7 4.9 4.2 3.5
ii) Interest rate riskThere is no material exposure to interest rate risk. Therefore, no interest hedging is currently undertaken by the Group.
b) Credit riskCredit risk is the risk that the Group will suffer financial loss as a result of counterparties defaulting on their contractual obligations.
For trade and other receivables, concentration of credit risk is very limited due to the Group's broad customer base. An assessment of credit quality of the customer is made where appropriate using a combination of external rating agencies, past experience and other factors. In circumstances where credit information is unavailable or poor, the risk is mitigated primarily by the use of advance payments resulting in positive cash flows. Exposure and payment performance are monitored closely both at individual project and client level, with a series of escalating debt recovery actions taken where necessary. In view of current economic circumstances, additional management attention is focused on the recovery of debtors.
c) Liquidity riskThe Group funds its activities primarily through cash generated from its operations and also maintains committed bank facilities. The liquidity risk is managed with reference to short- and long-term cash flow forecasts and the maturity of the bank facilities. These facilities contain financial covenants. Throughout the year the Group maintained robust headroom against its covenants and is expected to do so into the foreseeable future.
Surplus cash is invested by Group Treasury in interest bearing current accounts, term deposits and money market deposits through instruments with appropriate maturities or sufficient liquidity to provide sufficient headroom as determined by the above-mentioned forecasts.
2 Financial risk management (continued)2.1 Financial risk factors (continued)a) Market risk (continued)i) Foreign exchange risk (continued)

Arup Group Limited and its subsidiary undertakings | Financial Statements and Reports for the year ended 31 March 2019
18 Notes to the financial statements for the year ended 31 March 2019
Notes to the financial statements (continued)For the year ended 31 March 2019
2.2 Capital risk managementThe Group is a long-term business, held in trust for the principal benefit of its employees. This ownership model means that it is not able to raise equity externally. The Group’s objectives when managing capital (defined as net debt plus equity) are to safeguard its ability to continue as a going concern, provide returns for its employees and to avoid debt funding.
The Group manages capital to ensure an appropriate balance between investing in employees, clients and profit.
2.3 Fair value estimationThe fair value hierarchy prioritises the inputs used to measure fair value into three broad levels. These have been defined as follows:
• quoted prices (unadjusted) in active markets for identical assets or liabilities (Level 1);
• inputs other than quoted prices included within Level 1 that are observable for the asset or liability, either directly (that is, as prices) or indirectly (that is, derived from prices) (Level 2); and
• inputs for the asset or liability that are not based on observable market data (that is, unobservable inputs) (Level 3).
2 Financial risk management (continued)2.1 Financial risk factors (continued)c) Liquidity risk (continued)
The table below analyses the Group's non-derivative financial liabilities and net settled derivative financial liabilities into relevant maturity groupings based on the remaining period between the balance sheet date and the contractual maturity date. The amounts disclosed in the table are the contractual undiscounted cash flows.
On demand or within 1 year
Between 1 and 2 years
Between 2 and 5 years
Over 5 years
As at 31 March 2019 £m £m £m £m
Loan from related party 3.2 2.1 - -Bank loan - 10.0 70.0 - Derivative financial instruments 0.3 - - - Trade and other payables excluding non-financial liabilities 198.2 - - -
On demand or within 1 year
Between 1 and 2 years
Between 2 and 5 years
Over 5 years
As at 31 March 2018 £m £m £m £m
Bank loan 10.0 10.0 70.0 - Derivative financial instruments 0.2 - - - Trade and other payables excluding non-financial liabilities 200.0 - 2.1 -
On demand or within 1 year
Between 1 and 2 years
Between 2 and 5 years
Over 5 years
As at 1 April 2017 £m £m £m £m
Bank loan - - - - Derivative financial instruments 0.1 0.6 - - Trade and other payables excluding non-financial liabilities 208.5 - - -
Arup Group Limited and its subsidiary undertakings | Financial Statements and Reports for the year ended 31 March 2019
19Notes to the financial statements for the year ended 31 March 2019
Notes to the financial statements (continued)For the year ended 31 March 2019
Level 1 financial instrumentsThe fair value of financial instruments traded in active markets is based on quoted market prices at the balance sheet date. A market is regarded as active if quoted prices are readily and regularly available from an exchange, dealer, broker, industry group, pricing service, or regulatory agency and those prices represent actual and regularly occurring market transactions on an arm's length basis.
Level 2 financial instrumentsThe fair value of financial instruments that are not traded in an active market is determined by using valuation techniques. These valuation techniques maximise the use of observable market data where it is available and rely as little as possible on entity specific estimates. If all significant inputs required to fair value an instrument are observable, the instrument is included in Level 2. The fair value of forward foreign exchange contracts is determined using quoted forward exchange rates at the reporting date and yield curves derived from quoted interest rates matching the maturities of the foreign exchange contracts.
Level 3 financial instrumentsIf one or more of the significant inputs is not based on observable market data, the instrument is included in Level 3.
Specific valuation techniques used to value financial instruments include:
• quoted market prices or dealer quotes for similar instruments;
• the fair value of interest rate swaps is calculated as the present value of the estimated future cash flows based on observable yield curves;
• the fair value of forward foreign exchange contracts is determined using forward exchange rates at the balance sheet date, with the resulting value discounted back to the present value; and
• other techniques, such as discounted cash flow analysis, are used to determine fair value for the remaining financial instruments.
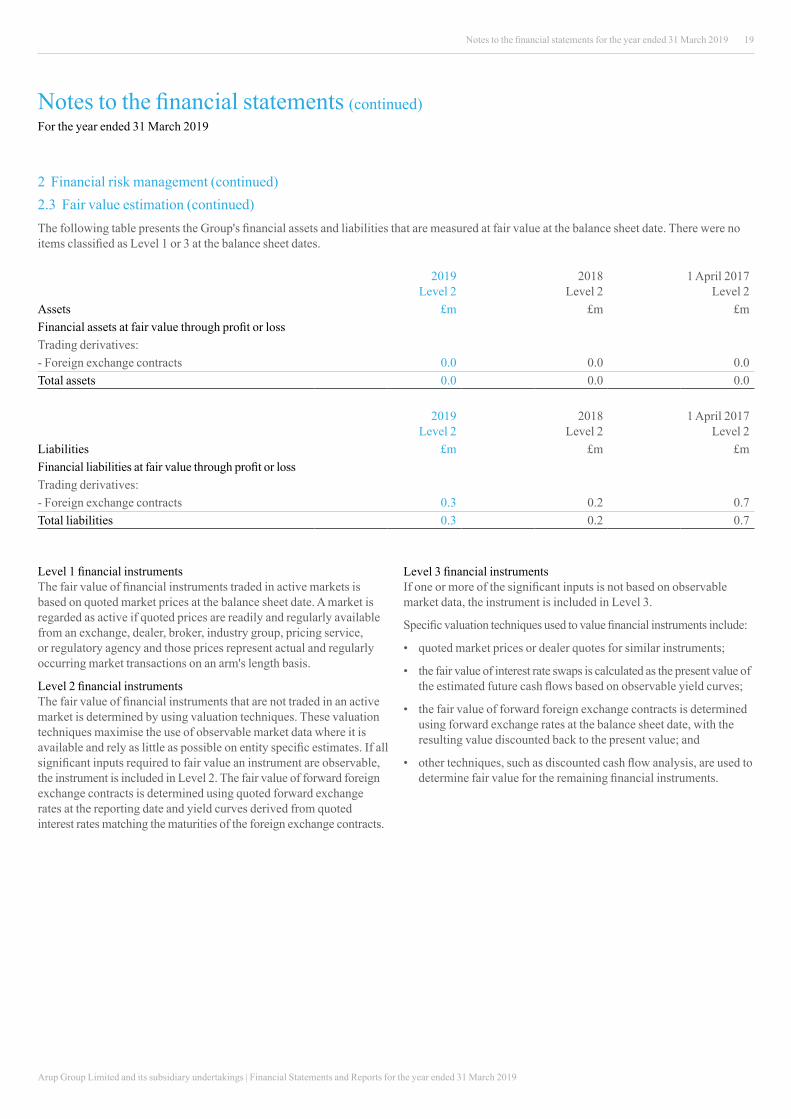
2 Financial risk management (continued)2.3 Fair value estimation (continued) The following table presents the Group's financial assets and liabilities that are measured at fair value at the balance sheet date. There were no items classified as Level 1 or 3 at the balance sheet dates.
2019
Level 2
2018
Level 2
1 April 2017 Level 2
Assets £m £m £m Financial assets at fair value through profit or lossTrading derivatives:- Foreign exchange contracts 0.0 0.0 0.0 Total assets 0.0 0.0 0.0
2019 Level 2
2018 Level 2
1 April 2017 Level 2
Liabilities £m £m £m Financial liabilities at fair value through profit or lossTrading derivatives:- Foreign exchange contracts 0.3 0.2 0.7 Total liabilities 0.3 0.2 0.7
Arup Group Limited and its subsidiary undertakings | Financial Statements and Reports for the year ended 31 March 2019
20 Notes to the financial statements for the year ended 31 March 2019
Notes to the financial statements (continued)For the year ended 31 March 2019
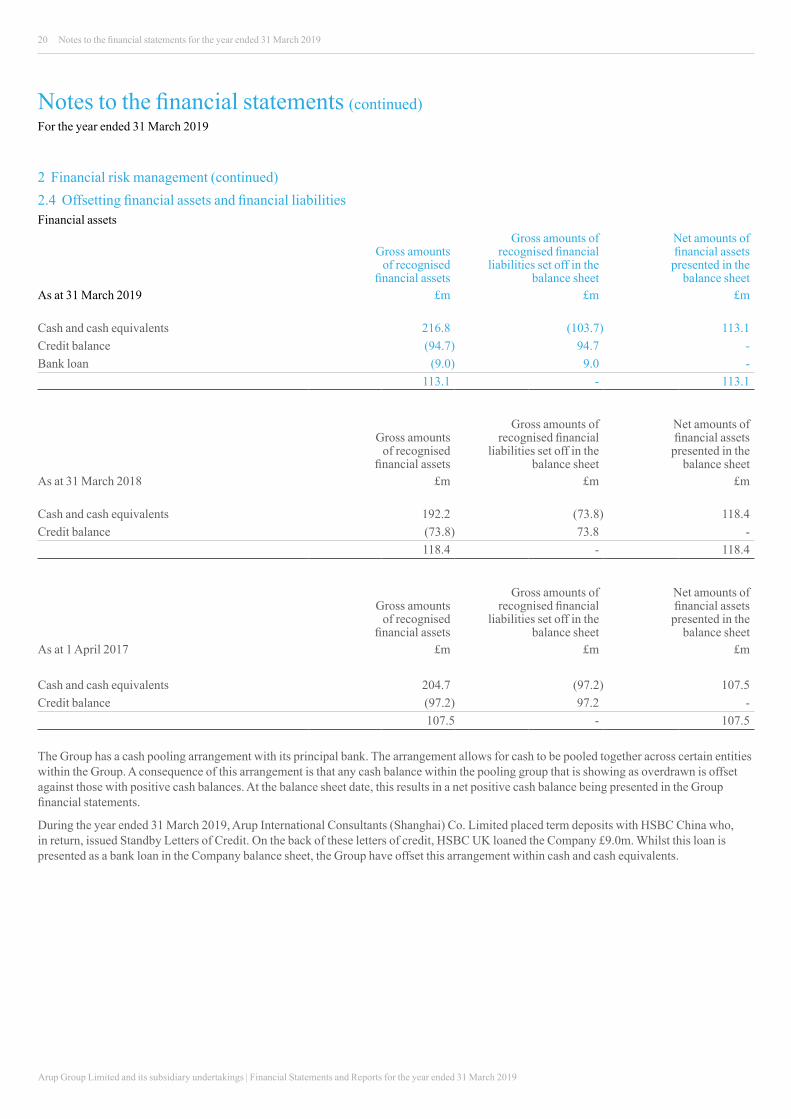
2 Financial risk management (continued)2.4 Offsetting financial assets and financial liabilitiesFinancial assets
Gross amounts of recognised
financial assets
Gross amounts of recognised financial
liabilities set off in the balance sheet
Net amounts of financial assets
presented in the balance sheet
As at 31 March 2019 £m £m £m
Cash and cash equivalents 216.8 (103.7) 113.1 Credit balance (94.7) 94.7 - Bank loan (9.0) 9.0 -
113.1 - 113.1
Gross amounts
of recognised financial assets
Gross amounts of recognised financial
liabilities set off in the balance sheet
Net amounts of financial assets
presented in the balance sheet
As at 31 March 2018 £m £m £m
Cash and cash equivalents 192.2 (73.8) 118.4 Credit balance (73.8) 73.8 -
118.4 - 118.4
Gross amounts
of recognised financial assets
Gross amounts of recognised financial
liabilities set off in the balance sheet
Net amounts of financial assets
presented in the balance sheet
As at 1 April 2017 £m £m £m
Cash and cash equivalents 204.7 (97.2) 107.5 Credit balance (97.2) 97.2 -
107.5 - 107.5
The Group has a cash pooling arrangement with its principal bank. The arrangement allows for cash to be pooled together across certain entities within the Group. A consequence of this arrangement is that any cash balance within the pooling group that is showing as overdrawn is offset against those with positive cash balances. At the balance sheet date, this results in a net positive cash balance being presented in the Group financial statements.
During the year ended 31 March 2019, Arup International Consultants (Shanghai) Co. Limited placed term deposits with HSBC China who, in return, issued Standby Letters of Credit. On the back of these letters of credit, HSBC UK loaned the Company £9.0m. Whilst this loan is presented as a bank loan in the Company balance sheet, the Group have offset this arrangement within cash and cash equivalents.
Arup Group Limited and its subsidiary undertakings | Financial Statements and Reports for the year ended 31 March 2019
21Notes to the financial statements for the year ended 31 March 2019
Notes to the financial statements (continued)For the year ended 31 March 2019
3 Critical accounting estimates and judgementsThe Group makes estimates and assumptions concerning the future. The resulting accounting estimates will, by definition, seldom equal the related actual results. The estimates and assumptions that have a significant risk of causing a material adjustment to the carrying amounts of assets and liabilities within the next financial year are addressed below.
Contract accounting (estimates and judgements)The Group's revenue accounting policy (note 4) is central to how the Group values the work it has carried out in each financial year. This policy requires forecasts to be made on the current percentage complete and the projected outcomes of projects. These forecasts require estimates and judgements to be made on changes in, for example, percentage completion, work scope and costs to completion. While the estimates made are based on professional judgements, subsequent events may mean that estimates calculated prove to be inaccurate, with a consequent effect on the reported result.
As a consequence of the multi-year lifespan of the Group’s contracts, measuring the outcome of the performance obligations can take time. Assuming the project is forecasted to make a profit, the Group recognises revenue only to the extent of the costs incurred until the project reaches 50% complete on a standard risk project and 95% on a high risk project. Management have reviewed projects across the Group and have used their judgement to establish these percentages. Once a non-onerous project reaches 50% / 95% complete, profit is recognised in line with its percentage completion.
Impairment of trade receivables and amounts recoverable on contracts (estimates and judgements)The Group makes an estimate of the recoverable value of trade receivables and amounts recoverable on contracts (contract assets). When assessing impairment, management considers factors including the credit rating of the receivable, the ageing profile of receivables and historical experience. The Group applies the simplified approach for IFRS 9 when measuring expected credit losses which uses a lifetime expected loss allowance for all trade receivables and contract assets. See note 17 for the net carrying amount of the receivables and associated impairment provision.
Defined benefit pension schemes (estimates and judgements)The present value of the pension obligations depends on a number of factors that are determined on an actuarial basis using a number of assumptions. The assumptions used in determining the net cost / (income) for pensions include the discount rate. Any changes in these assumptions will impact the carrying amount of pension obligations.
An estimate of the sensitivity to changes in key assumptions is disclosed in note 32.
Professional indemnity insurance (estimates and judgements)From time to time the Group receives claims from clients with regards to work performed on projects. The Group has professional indemnity insurance in place for such situations. Significant judgement is required to determine whether a provision should be put in place for these claims. Accounting estimates are made to value these claims utilising both internal and external sources as well as the result of past experience. Assumptions are used in making these estimates and as such subsequent events may mean that they prove to be inaccurate, with an adjustment made in a future year.4 Revenue
Group The Group mainly operates in the business of design and consultancy engineering. Revenue represents the value of work performed on contracts in the year. For contracts on which revenue exceeds fees rendered, the excess is included as amounts recoverable on contracts (contract assets) within trade and other receivables. For contracts on which fees rendered exceed revenue, the excess is included as deferred income (contract liabilities) within trade and other payables. The value of long term contracts is based on recoverable costs plus attributable profit. Cost is defined as staff costs and related overheads plus project expenses.As projects reach stages where it is considered that their outcome can be reasonably foreseen, proportions of the expected total profit are brought into the financial statements. Provision is made for all known and anticipated losses.No element of financing is present. Sales are made with a credit term of 30 days (on average across the Group), which is consistent with market practice. The total revenue recognised in the year that was included in contract liabilities at the beginning of the year was £216.6m (2018: £203.5m).The total revenue recognised in the year from performance obligations satisfied (or partially satisfied) in previous years was £1,355.3m (2018: £1,136.4m). The aggregate amount of the transaction price allocated to long-term contracts that are partially or fully unsatisfied at the balance sheet date is £1,492.1m (2018: £1,259.3m). The Group expects that this will be recognised over the next 1 to 10 years.The Group derives revenue from the provision of services over time in the following geographical regions:
2019 £m
Restated 2018
£mRevenue by destinationUnited Kingdom 630.4 570.4 Americas 376.9 334.5 Australasia 291.7 215.8 Asia 210.7 211.1 Europe 162.0 168.0 Middle East & Africa 43.1 60.6
1,714.8 1,560.4
Arup Group Limited and its subsidiary undertakings | Financial Statements and Reports for the year ended 31 March 2019
22
Notes to the financial statements (continued)For the year ended 31 March 2019
Notes to the financial statements for the year ended 31 March 2019
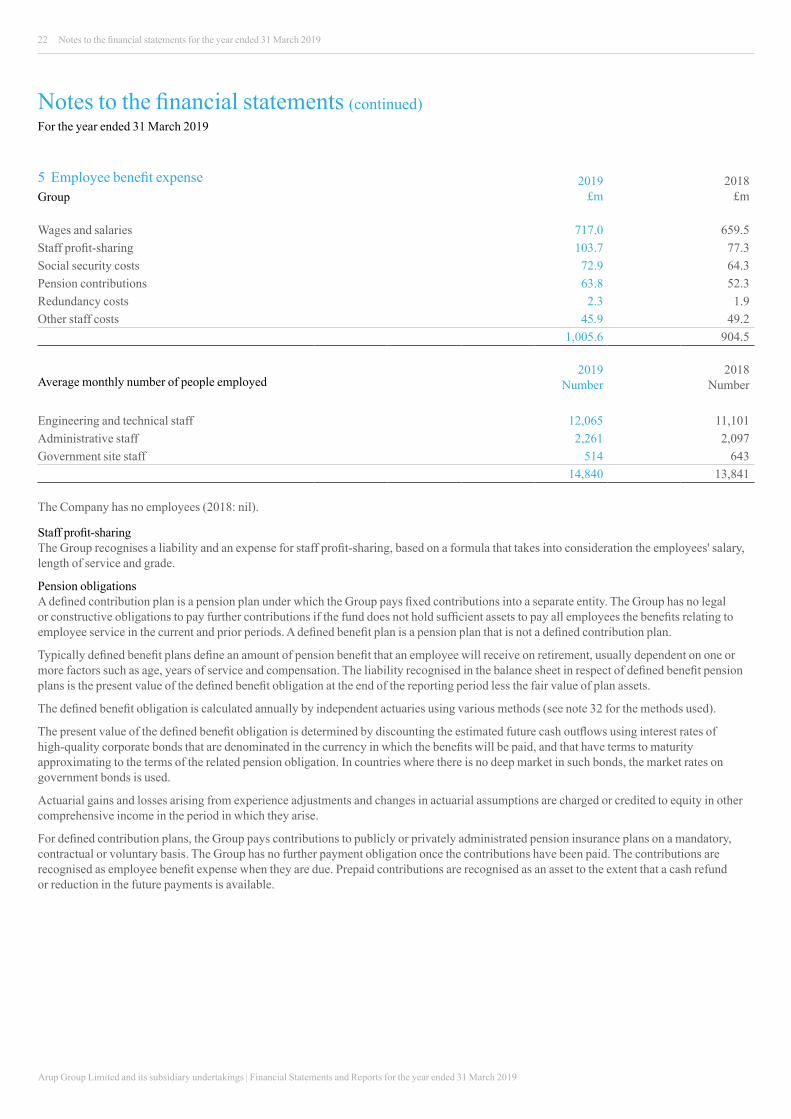
5 Employee benefit expenseGroup
2019 £m
2018 £m
Wages and salaries 717.0 659.5 Staff profit-sharing 103.7 77.3 Social security costs 72.9 64.3 Pension contributions 63.8 52.3 Redundancy costs 2.3 1.9 Other staff costs 45.9 49.2
1,005.6 904.5
2019Number
2018NumberAverage monthly number of people employed
Engineering and technical staff 12,065 11,101 Administrative staff 2,261 2,097 Government site staff 514 643
14,840 13,841
The Company has no employees (2018: nil).
Staff profit-sharingThe Group recognises a liability and an expense for staff profit-sharing, based on a formula that takes into consideration the employees' salary, length of service and grade.
Pension obligationsA defined contribution plan is a pension plan under which the Group pays fixed contributions into a separate entity. The Group has no legal or constructive obligations to pay further contributions if the fund does not hold sufficient assets to pay all employees the benefits relating to employee service in the current and prior periods. A defined benefit plan is a pension plan that is not a defined contribution plan.
Typically defined benefit plans define an amount of pension benefit that an employee will receive on retirement, usually dependent on one or more factors such as age, years of service and compensation. The liability recognised in the balance sheet in respect of defined benefit pension plans is the present value of the defined benefit obligation at the end of the reporting period less the fair value of plan assets.
The defined benefit obligation is calculated annually by independent actuaries using various methods (see note 32 for the methods used).
The present value of the defined benefit obligation is determined by discounting the estimated future cash outflows using interest rates of high-quality corporate bonds that are denominated in the currency in which the benefits will be paid, and that have terms to maturity approximating to the terms of the related pension obligation. In countries where there is no deep market in such bonds, the market rates on government bonds is used.
Actuarial gains and losses arising from experience adjustments and changes in actuarial assumptions are charged or credited to equity in other comprehensive income in the period in which they arise.
For defined contribution plans, the Group pays contributions to publicly or privately administrated pension insurance plans on a mandatory, contractual or voluntary basis. The Group has no further payment obligation once the contributions have been paid. The contributions are recognised as employee benefit expense when they are due. Prepaid contributions are recognised as an asset to the extent that a cash refund or reduction in the future payments is available.
Arup Group Limited and its subsidiary undertakings | Financial Statements and Reports for the year ended 31 March 2019
23Notes to the financial statements for the year ended 31 March 2019
Notes to the financial statements (continued)For the year ended 31 March 2019
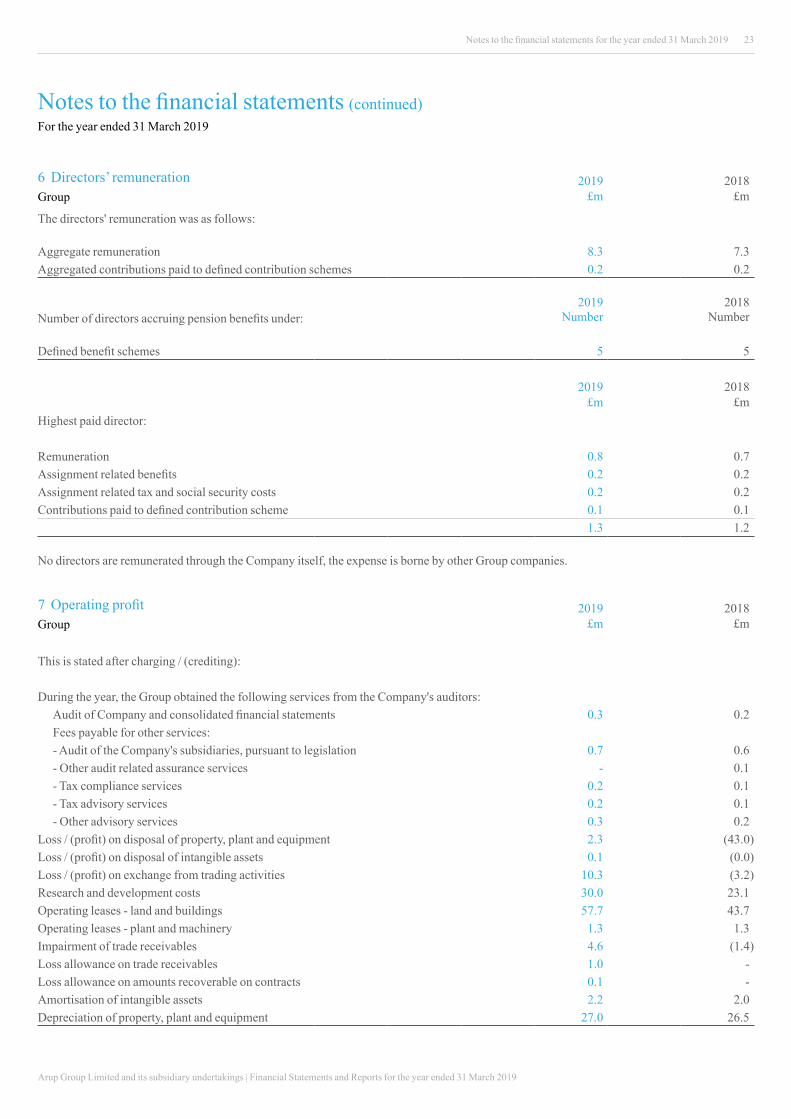
6 Directors’ remunerationGroup
2019£m
2018£m
The directors' remuneration was as follows:
Aggregate remuneration 8.3 7.3 Aggregated contributions paid to defined contribution schemes 0.2 0.2
Number of directors accruing pension benefits under:2019
Number2018
Number
Defined benefit schemes 5 5
2019 £m
2018 £m
Highest paid director:
Remuneration 0.8 0.7 Assignment related benefits 0.2 0.2 Assignment related tax and social security costs 0.2 0.2 Contributions paid to defined contribution scheme 0.1 0.1
1.3 1.2
No directors are remunerated through the Company itself, the expense is borne by other Group companies.
7 Operating profitGroup
2019£m
2018 £m
This is stated after charging / (crediting):
During the year, the Group obtained the following services from the Company's auditors:Audit of Company and consolidated financial statements 0.3 0.2 Fees payable for other services:- Audit of the Company's subsidiaries, pursuant to legislation 0.7 0.6 - Other audit related assurance services - 0.1 - Tax compliance services 0.2 0.1 - Tax advisory services 0.2 0.1 - Other advisory services 0.3 0.2
Loss / (profit) on disposal of property, plant and equipment 2.3 (43.0)Loss / (profit) on disposal of intangible assets 0.1 (0.0)Loss / (profit) on exchange from trading activities 10.3 (3.2)Research and development costs 30.0 23.1 Operating leases - land and buildings 57.7 43.7 Operating leases - plant and machinery 1.3 1.3 Impairment of trade receivables 4.6 (1.4)Loss allowance on trade receivables 1.0 - Loss allowance on amounts recoverable on contracts 0.1 - Amortisation of intangible assets 2.2 2.0 Depreciation of property, plant and equipment 27.0 26.5
Arup Group Limited and its subsidiary undertakings | Financial Statements and Reports for the year ended 31 March 2019
24 Notes to the financial statements for the year ended 31 March 2019
Notes to the financial statements (continued)For the year ended 31 March 2019
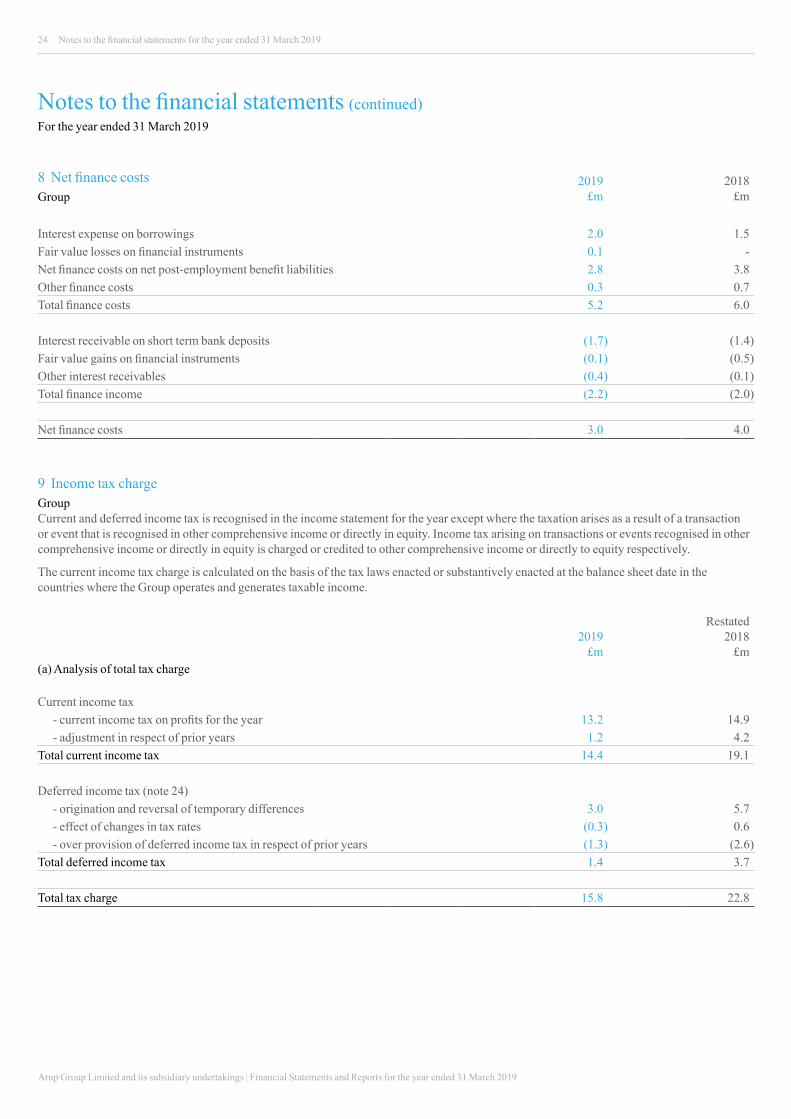
8 Net finance costsGroup
2019 £m
2018 £m
Interest expense on borrowings 2.0 1.5 Fair value losses on financial instruments 0.1 - Net finance costs on net post-employment benefit liabilities 2.8 3.8 Other finance costs 0.3 0.7 Total finance costs 5.2 6.0
Interest receivable on short term bank deposits (1.7) (1.4)Fair value gains on financial instruments (0.1) (0.5)Other interest receivables (0.4) (0.1)Total finance income (2.2) (2.0)
Net finance costs 3.0 4.0
9 Income tax chargeGroupCurrent and deferred income tax is recognised in the income statement for the year except where the taxation arises as a result of a transaction or event that is recognised in other comprehensive income or directly in equity. Income tax arising on transactions or events recognised in other comprehensive income or directly in equity is charged or credited to other comprehensive income or directly to equity respectively.
The current income tax charge is calculated on the basis of the tax laws enacted or substantively enacted at the balance sheet date in the countries where the Group operates and generates taxable income.
2019 £m
Restated 2018
£m(a) Analysis of total tax charge
Current income tax- current income tax on profits for the year 13.2 14.9 - adjustment in respect of prior years 1.2 4.2
Total current income tax 14.4 19.1
Deferred income tax (note 24)- origination and reversal of temporary differences 3.0 5.7 - effect of changes in tax rates (0.3) 0.6 - over provision of deferred income tax in respect of prior years (1.3) (2.6)
Total deferred income tax 1.4 3.7
Total tax charge 15.8 22.8
Arup Group Limited and its subsidiary undertakings | Financial Statements and Reports for the year ended 31 March 2019
25Notes to the financial statements for the year ended 31 March 2019
Notes to the financial statements (continued)For the year ended 31 March 2019
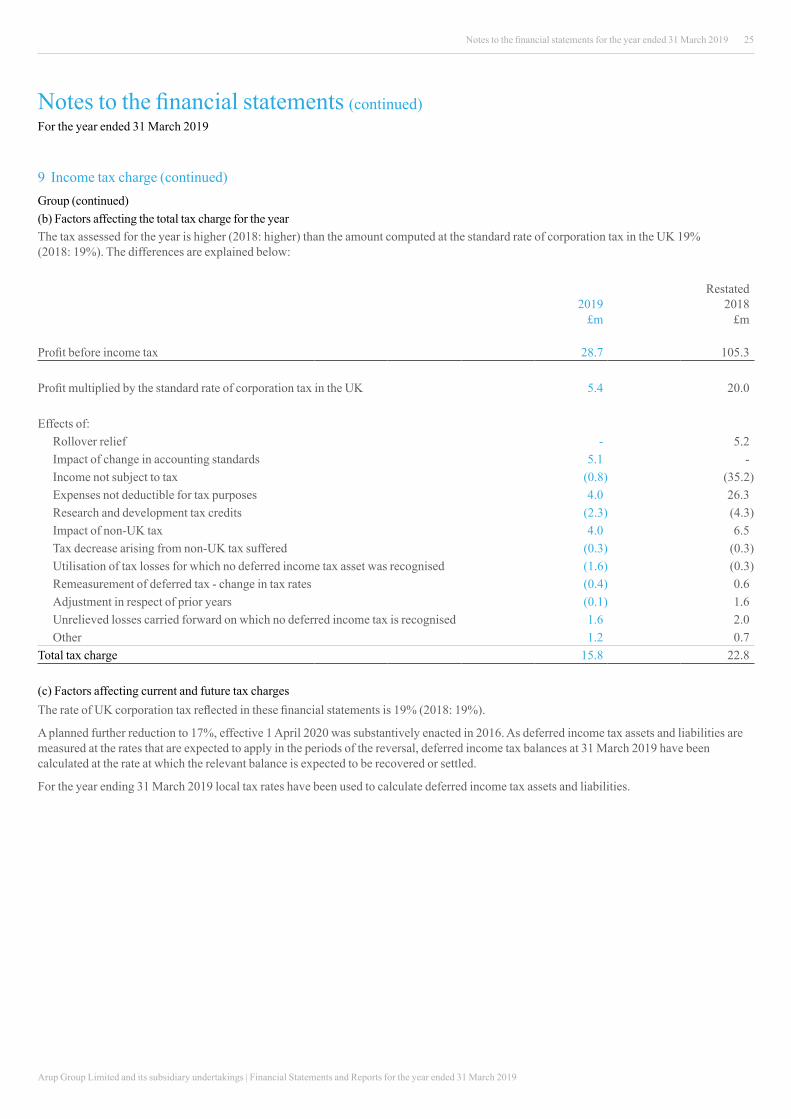
9 Income tax charge (continued)Group (continued)(b) Factors affecting the total tax charge for the year The tax assessed for the year is higher (2018: higher) than the amount computed at the standard rate of corporation tax in the UK 19% (2018: 19%). The differences are explained below:
2019 £m
Restated 2018
£m
Profit before income tax 28.7 105.3
Profit multiplied by the standard rate of corporation tax in the UK 5.4 20.0
Effects of:Rollover relief - 5.2Impact of change in accounting standards 5.1 -Income not subject to tax (0.8) (35.2) Expenses not deductible for tax purposes 4.0 26.3Research and development tax credits (2.3) (4.3) Impact of non-UK tax 4.0 6.5Tax decrease arising from non-UK tax suffered (0.3) (0.3)Utilisation of tax losses for which no deferred income tax asset was recognised (1.6) (0.3)Remeasurement of deferred tax - change in tax rates (0.4) 0.6Adjustment in respect of prior years (0.1) 1.6Unrelieved losses carried forward on which no deferred income tax is recognised 1.6 2.0Other 1.2 0.7
Total tax charge 15.8 22.8
(c) Factors affecting current and future tax charges The rate of UK corporation tax reflected in these financial statements is 19% (2018: 19%).
A planned further reduction to 17%, effective 1 April 2020 was substantively enacted in 2016. As deferred income tax assets and liabilities are measured at the rates that are expected to apply in the periods of the reversal, deferred income tax balances at 31 March 2019 have been calculated at the rate at which the relevant balance is expected to be recovered or settled.
For the year ending 31 March 2019 local tax rates have been used to calculate deferred income tax assets and liabilities.
Arup Group Limited and its subsidiary undertakings | Financial Statements and Reports for the year ended 31 March 2019
26 Notes to the financial statements for the year ended 31 March 2019
Notes to the financial statements (continued)For the year ended 31 March 2019
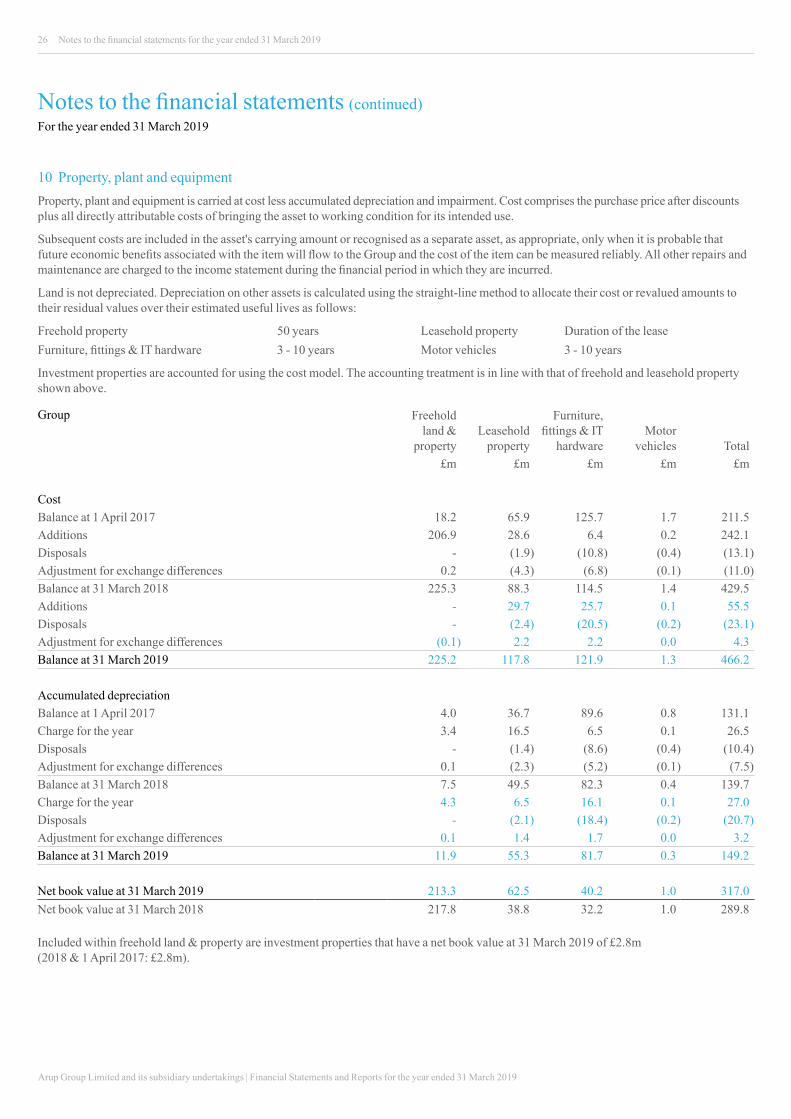
10 Property, plant and equipmentProperty, plant and equipment is carried at cost less accumulated depreciation and impairment. Cost comprises the purchase price after discounts plus all directly attributable costs of bringing the asset to working condition for its intended use.
Subsequent costs are included in the asset's carrying amount or recognised as a separate asset, as appropriate, only when it is probable that future economic benefits associated with the item will flow to the Group and the cost of the item can be measured reliably. All other repairs and maintenance are charged to the income statement during the financial period in which they are incurred.
Land is not depreciated. Depreciation on other assets is calculated using the straight-line method to allocate their cost or revalued amounts to their residual values over their estimated useful lives as follows:
Freehold property 50 years Leasehold property Duration of the lease Furniture, fittings & IT hardware 3 - 10 years Motor vehicles 3 - 10 years
Investment properties are accounted for using the cost model. The accounting treatment is in line with that of freehold and leasehold property shown above.
Group Freehold land &
propertyLeasehold
property
Furniture, fittings & IT
hardwareMotor
vehicles Total£m £m £m £m £m
CostBalance at 1 April 2017 18.2 65.9 125.7 1.7 211.5 Additions 206.9 28.6 6.4 0.2 242.1 Disposals - (1.9) (10.8) (0.4) (13.1)Adjustment for exchange differences 0.2 (4.3) (6.8) (0.1) (11.0)Balance at 31 March 2018 225.3 88.3 114.5 1.4 429.5 Additions - 29.7 25.7 0.1 55.5 Disposals - (2.4) (20.5) (0.2) (23.1)Adjustment for exchange differences (0.1) 2.2 2.2 0.0 4.3 Balance at 31 March 2019 225.2 117.8 121.9 1.3 466.2
Accumulated depreciationBalance at 1 April 2017 4.0 36.7 89.6 0.8 131.1 Charge for the year 3.4 16.5 6.5 0.1 26.5 Disposals - (1.4) (8.6) (0.4) (10.4)Adjustment for exchange differences 0.1 (2.3) (5.2) (0.1) (7.5)Balance at 31 March 2018 7.5 49.5 82.3 0.4 139.7 Charge for the year 4.3 6.5 16.1 0.1 27.0 Disposals - (2.1) (18.4) (0.2) (20.7)Adjustment for exchange differences 0.1 1.4 1.7 0.0 3.2 Balance at 31 March 2019 11.9 55.3 81.7 0.3 149.2
Net book value at 31 March 2019 213.3 62.5 40.2 1.0 317.0 Net book value at 31 March 2018 217.8 38.8 32.2 1.0 289.8
Included within freehold land & property are investment properties that have a net book value at 31 March 2019 of £2.8m (2018 & 1 April 2017: £2.8m).

Arup Group Limited and its subsidiary undertakings | Financial Statements and Reports for the year ended 31 March 2019
27Notes to the financial statements for the year ended 31 March 2019
Notes to the financial statements (continued)For the year ended 31 March 2019
11 Intangible assetsAcquired computer software is capitalised on the basis of the costs incurred to acquire and bring into use the specific software. These costs are amortised using the straight-line method to allocate the cost of the software over its useful economic life of between 2 and 5 years. Computer software is stated at cost less accumulated amortisation.
GoodwillComputer
software TotalGroup £m £m £m
CostBalance at 1 April 2017 - 17.0 17.0 Additions - 1.5 1.5 Disposals - (0.3) (0.3)Adjustment for exchange differences - (1.0) (1.0)Balance at 31 March 2018 - 17.2 17.2 Additions 1.5 2.3 3.8 Disposals - (2.6) (2.6)Adjustment for exchange differences - 0.4 0.4 Balance at 31 March 2019 1.5 17.3 18.8
Accumulated amortisationBalance at 1 April 2017 - 12.6 12.6 Amortisation charge for the year - 2.0 2.0 Disposals - (0.3) (0.3)Adjustment for exchange differences - (0.7) (0.7)Balance at 31 March 2018 - 13.6 13.6 Amortisation charge for the year - 2.2 2.2 Disposals - (2.5) (2.5)Adjustment for exchange differences - 0.3 0.3 Balance at 31 March 2019 - 13.6 13.6
Net book value at 31 March 2019 1.5 3.7 5.2 Net book value at 31 March 2018 - 3.6 3.6
The Company has no intangible assets (2018: nil)On 28 September 2018, the Group acquired Consoer Townsend Envirodyne Engineers of New York Inc. (subsequently renamed Arup US, Inc.) for £1.5m. On acquisition, the company held no assets and after performing an intangible asset review, it was deemed that goodwill had been acquired.Arup US, Inc. provides design and consulting engineering services. An impairment assessment has been performed on goodwill, considering Arup US, Inc. as the cash-generating unit. For the year ending 31 March 2019, no impairment was required.
10 Property, plant and equipment (continued)Company
Leasehold property
£mCostBalance at 1 April 2018 and 31 March 2019 3.6
Accumulated depreciationBalance at 1 April 2018 1.5 Charge for the year 0.0Balance at 31 March 2019 1.5
Net book value at 31 March 2019 2.1 Net book value at 31 March 2018 2.1
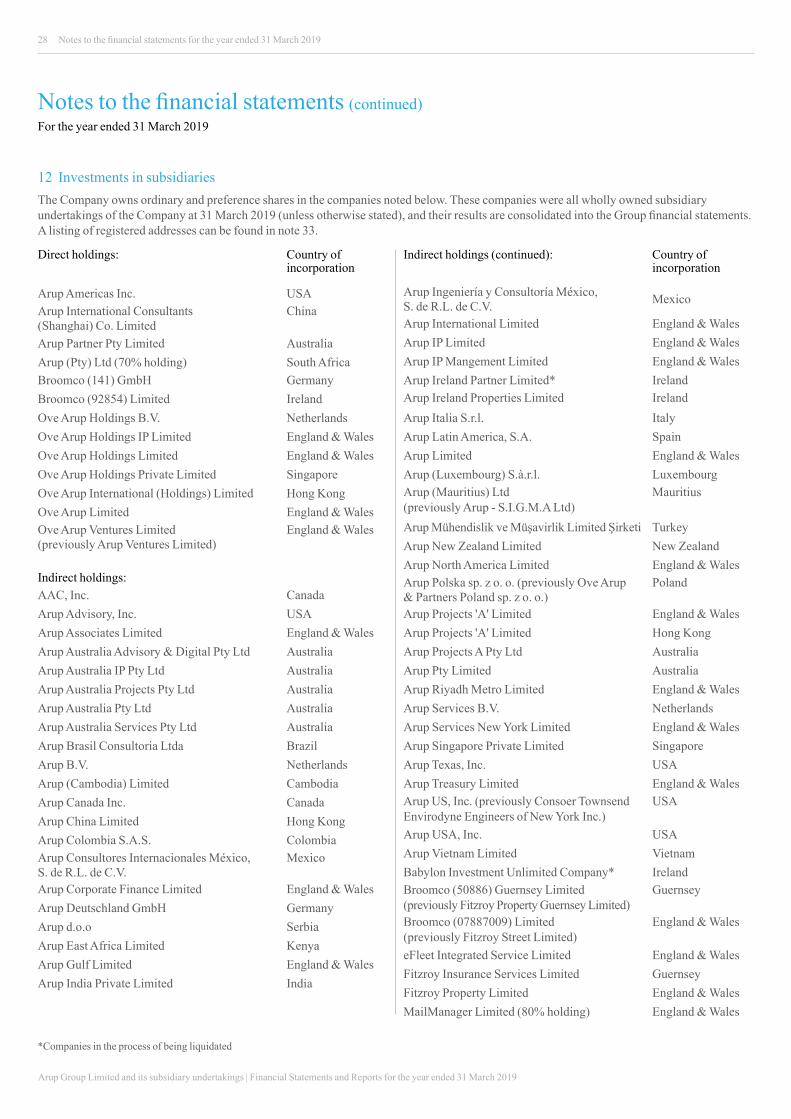
Arup Group Limited and its subsidiary undertakings | Financial Statements and Reports for the year ended 31 March 2019
28 Notes to the financial statements for the year ended 31 March 2019
Notes to the financial statements (continued)For the year ended 31 March 2019
Direct holdings: Country of incorporation
Arup Americas Inc. USAArup International Consultants (Shanghai) Co. Limited
China
Arup Partner Pty Limited AustraliaArup (Pty) Ltd (70% holding) South AfricaBroomco (141) GmbH GermanyBroomco (92854) Limited IrelandOve Arup Holdings B.V. NetherlandsOve Arup Holdings IP Limited England & WalesOve Arup Holdings Limited England & WalesOve Arup Holdings Private Limited SingaporeOve Arup International (Holdings) Limited Hong KongOve Arup Limited England & WalesOve Arup Ventures Limited (previously Arup Ventures Limited)
England & Wales
Indirect holdings:AAC, Inc. CanadaArup Advisory, Inc. USAArup Associates Limited England & WalesArup Australia Advisory & Digital Pty Ltd AustraliaArup Australia IP Pty Ltd AustraliaArup Australia Projects Pty Ltd AustraliaArup Australia Pty Ltd AustraliaArup Australia Services Pty Ltd AustraliaArup Brasil Consultoria Ltda BrazilArup B.V. NetherlandsArup (Cambodia) Limited CambodiaArup Canada Inc. CanadaArup China Limited Hong KongArup Colombia S.A.S. ColombiaArup Consultores Internacionales México, S. de R.L. de C.V.
Mexico
Arup Corporate Finance Limited England & WalesArup Deutschland GmbH GermanyArup d.o.o SerbiaArup East Africa Limited KenyaArup Gulf Limited England & WalesArup India Private Limited India
*Companies in the process of being liquidated
12 Investments in subsidiaries The Company owns ordinary and preference shares in the companies noted below. These companies were all wholly owned subsidiary undertakings of the Company at 31 March 2019 (unless otherwise stated), and their results are consolidated into the Group financial statements. A listing of registered addresses can be found in note 33.
Indirect holdings (continued): Country of incorporation
Arup Ingeniería y Consultoría México, S. de R.L. de C.V. Mexico
Arup International Limited England & WalesArup IP Limited England & WalesArup IP Mangement Limited England & WalesArup Ireland Partner Limited* IrelandArup Ireland Properties Limited IrelandArup Italia S.r.l. ItalyArup Latin America, S.A. SpainArup Limited England & WalesArup (Luxembourg) S.à.r.l. LuxembourgArup (Mauritius) Ltd (previously Arup - S.I.G.M.A Ltd)
Mauritius
Arup Mühendislik ve Müşavirlik Limited Şirketi TurkeyArup New Zealand Limited New ZealandArup North America Limited England & WalesArup Polska sp. z o. o. (previously Ove Arup & Partners Poland sp. z o. o.)
Poland
Arup Projects 'A' Limited England & WalesArup Projects 'A' Limited Hong KongArup Projects A Pty Ltd AustraliaArup Pty Limited AustraliaArup Riyadh Metro Limited England & WalesArup Services B.V. NetherlandsArup Services New York Limited England & WalesArup Singapore Private Limited SingaporeArup Texas, Inc. USAArup Treasury Limited England & WalesArup US, Inc. (previously Consoer Townsend Envirodyne Engineers of New York Inc.)
USA
Arup USA, Inc. USAArup Vietnam Limited VietnamBabylon Investment Unlimited Company* IrelandBroomco (50886) Guernsey Limited (previously Fitzroy Property Guernsey Limited)
Guernsey
Broomco (07887009) Limited (previously Fitzroy Street Limited)
England & Wales
eFleet Integrated Service Limited England & WalesFitzroy Insurance Services Limited GuernseyFitzroy Property Limited England & WalesMailManager Limited (80% holding) England & Wales
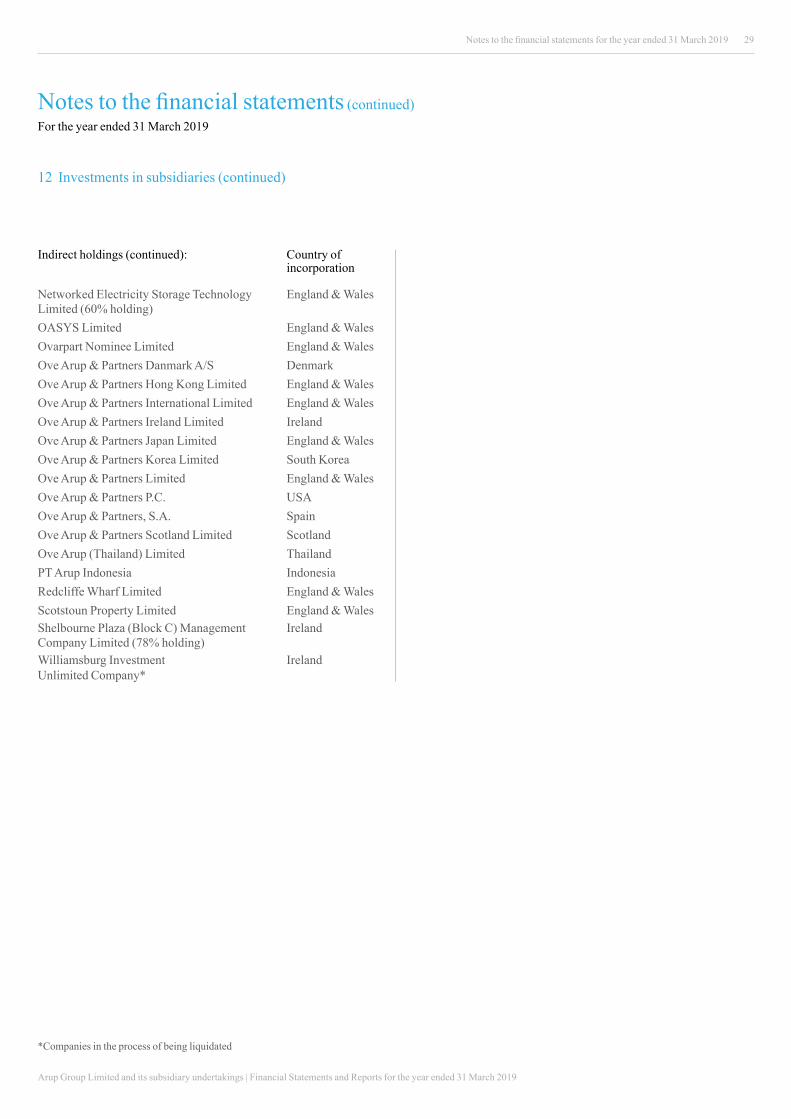
Arup Group Limited and its subsidiary undertakings | Financial Statements and Reports for the year ended 31 March 2019
29Notes to the financial statements for the year ended 31 March 2019
Notes to the financial statements (continued)For the year ended 31 March 2019
12 Investments in subsidiaries (continued)
Networked Electricity Storage Technology Limited (60% holding)
England & Wales
OASYS Limited England & WalesOvarpart Nominee Limited England & WalesOve Arup & Partners Danmark A/S DenmarkOve Arup & Partners Hong Kong Limited England & WalesOve Arup & Partners International Limited England & WalesOve Arup & Partners Ireland Limited IrelandOve Arup & Partners Japan Limited England & WalesOve Arup & Partners Korea Limited South KoreaOve Arup & Partners Limited England & WalesOve Arup & Partners P.C. USAOve Arup & Partners, S.A. SpainOve Arup & Partners Scotland Limited ScotlandOve Arup (Thailand) Limited ThailandPT Arup Indonesia IndonesiaRedcliffe Wharf Limited England & WalesScotstoun Property Limited England & WalesShelbourne Plaza (Block C) Management Company Limited (78% holding)
Ireland
Williamsburg Investment Unlimited Company*
Ireland
Indirect holdings (continued): Country of incorporation
*Companies in the process of being liquidated
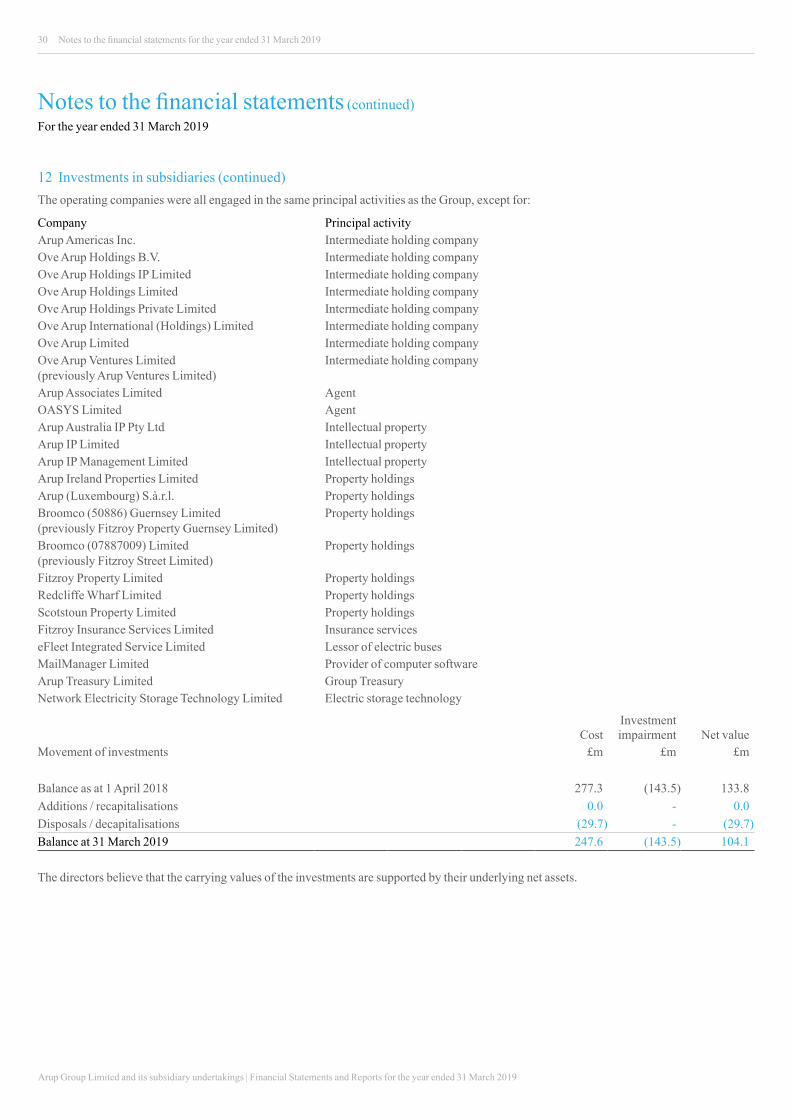
Arup Group Limited and its subsidiary undertakings | Financial Statements and Reports for the year ended 31 March 2019
30 Notes to the financial statements for the year ended 31 March 2019
Notes to the financial statements (continued)For the year ended 31 March 2019
12 Investments in subsidiaries (continued)The operating companies were all engaged in the same principal activities as the Group, except for:
Company Principal activity Arup Americas Inc. Intermediate holding companyOve Arup Holdings B.V. Intermediate holding companyOve Arup Holdings IP Limited Intermediate holding companyOve Arup Holdings Limited Intermediate holding companyOve Arup Holdings Private Limited Intermediate holding companyOve Arup International (Holdings) Limited Intermediate holding companyOve Arup Limited Intermediate holding companyOve Arup Ventures Limited Intermediate holding company (previously Arup Ventures Limited) Arup Associates Limited AgentOASYS Limited AgentArup Australia IP Pty Ltd Intellectual propertyArup IP Limited Intellectual propertyArup IP Management Limited Intellectual property Arup Ireland Properties Limited Property holdings Arup (Luxembourg) S.à.r.l. Property holdingsBroomco (50886) Guernsey Limited Property holdings (previously Fitzroy Property Guernsey Limited) Broomco (07887009) Limited Property holdings (previously Fitzroy Street Limited) Fitzroy Property Limited Property holdingsRedcliffe Wharf Limited Property holdingsScotstoun Property Limited Property holdingsFitzroy Insurance Services Limited Insurance serviceseFleet Integrated Service Limited Lessor of electric busesMailManager Limited Provider of computer softwareArup Treasury Limited Group TreasuryNetwork Electricity Storage Technology Limited Electric storage technology
CostInvestment impairment Net value
Movement of investments £m £m £m
Balance as at 1 April 2018 277.3 (143.5) 133.8 Additions / recapitalisations 0.0 - 0.0 Disposals / decapitalisations (29.7) - (29.7)Balance at 31 March 2019 247.6 (143.5) 104.1
The directors believe that the carrying values of the investments are supported by their underlying net assets.
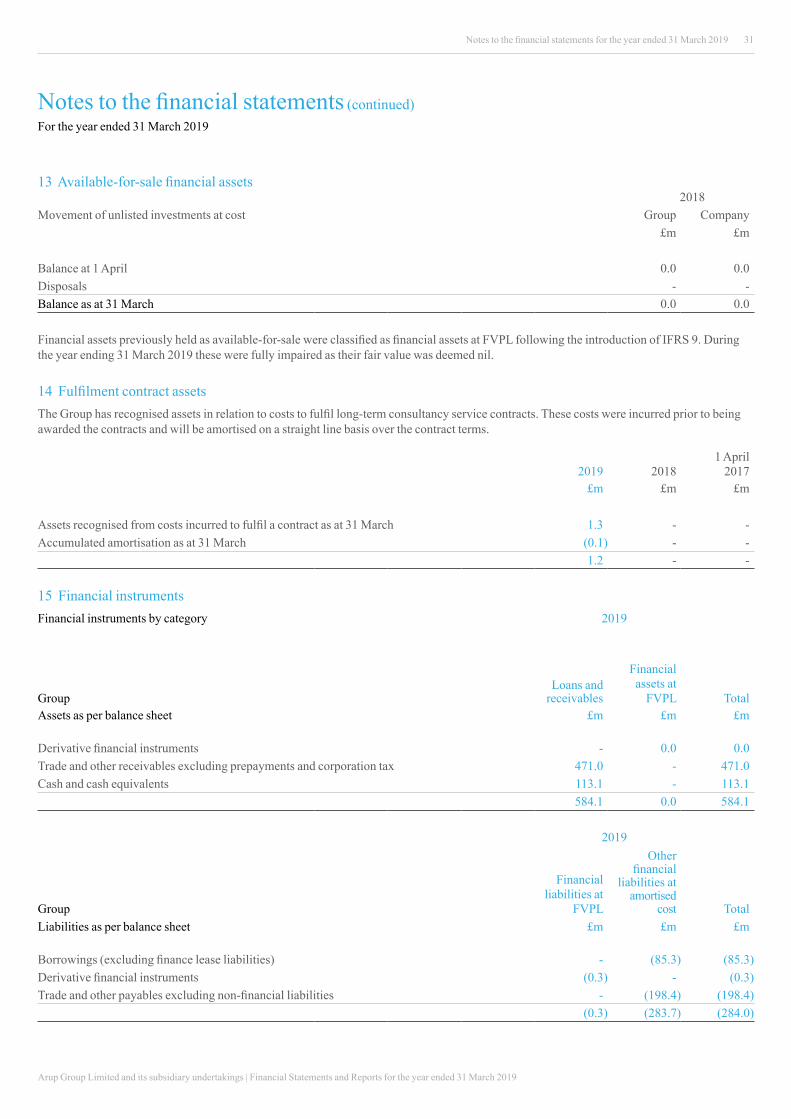
Arup Group Limited and its subsidiary undertakings | Financial Statements and Reports for the year ended 31 March 2019
31Notes to the financial statements for the year ended 31 March 2019
Notes to the financial statements (continued)For the year ended 31 March 2019
13 Available-for-sale financial assets2018
Movement of unlisted investments at cost Group Company£m £m
Balance at 1 April 0.0 0.0Disposals - - Balance as at 31 March 0.0 0.0
Financial assets previously held as available-for-sale were classified as financial assets at FVPL following the introduction of IFRS 9. During the year ending 31 March 2019 these were fully impaired as their fair value was deemed nil.
14 Fulfilment contract assetsThe Group has recognised assets in relation to costs to fulfil long-term consultancy service contracts. These costs were incurred prior to being awarded the contracts and will be amortised on a straight line basis over the contract terms.
2019 20181 April
2017£m £m £m
Assets recognised from costs incurred to fulfil a contract as at 31 March 1.3 - - Accumulated amortisation as at 31 March (0.1) - -
1.2 - -
15 Financial instrumentsFinancial instruments by category 2019
GroupLoans and
receivables
Financial assets at
FVPL TotalAssets as per balance sheet £m £m £m
Derivative financial instruments - 0.0 0.0 Trade and other receivables excluding prepayments and corporation tax 471.0 - 471.0 Cash and cash equivalents 113.1 - 113.1
584.1 0.0 584.1
2019
Group
Financial liabilities at
FVPL
Other financial
liabilities at amortised
cost
TotalLiabilities as per balance sheet £m £m £m
Borrowings (excluding finance lease liabilities) - (85.3) (85.3)Derivative financial instruments (0.3) - (0.3)Trade and other payables excluding non-financial liabilities - (198.4) (198.4)
(0.3) (283.7) (284.0)
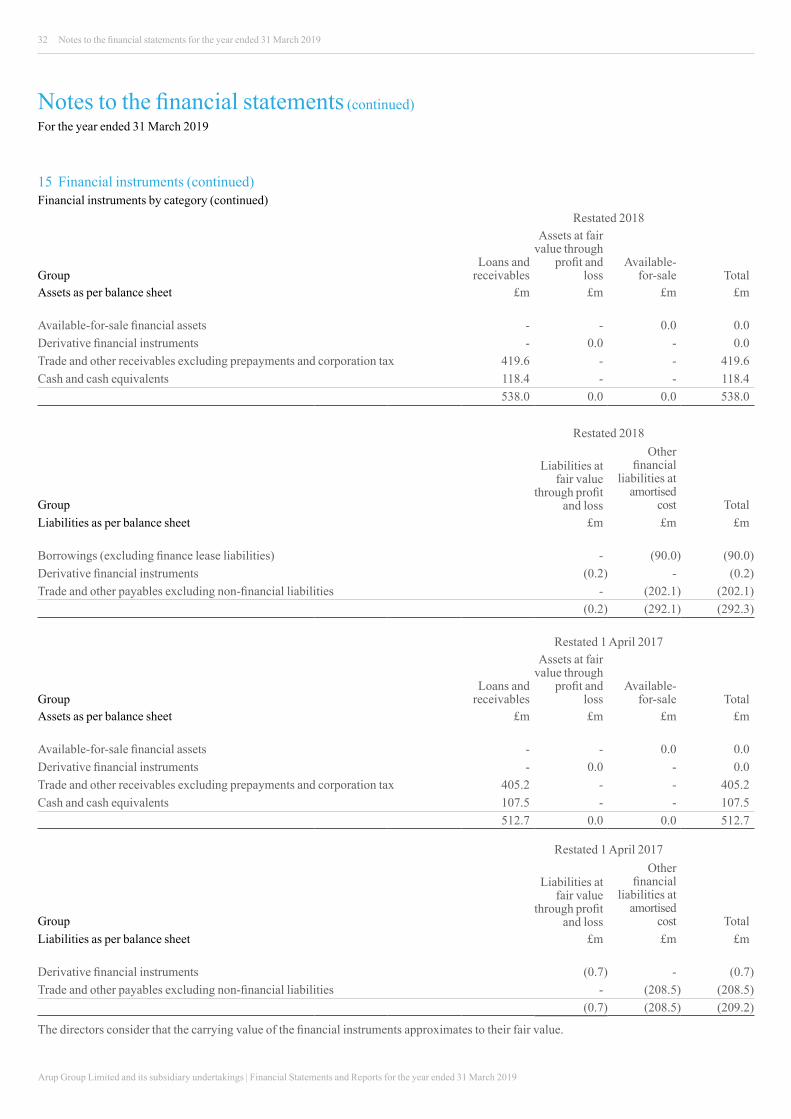
Arup Group Limited and its subsidiary undertakings | Financial Statements and Reports for the year ended 31 March 2019
32 Notes to the financial statements for the year ended 31 March 2019
Notes to the financial statements (continued)For the year ended 31 March 2019
15 Financial instruments (continued)Financial instruments by category (continued)
Restated 2018
GroupLoans and
receivables
Assets at fair value through
profit and loss
Available-for-sale
TotalAssets as per balance sheet £m £m £m £m
Available-for-sale financial assets - - 0.0 0.0 Derivative financial instruments - 0.0 - 0.0 Trade and other receivables excluding prepayments and corporation tax 419.6 - - 419.6 Cash and cash equivalents 118.4 - - 118.4
538.0 0.0 0.0 538.0
Restated 2018
Group
Liabilities at fair value
through profit and loss
Other financial
liabilities at amortised
cost
TotalLiabilities as per balance sheet £m £m £m
Borrowings (excluding finance lease liabilities) - (90.0) (90.0)Derivative financial instruments (0.2) - (0.2)Trade and other payables excluding non-financial liabilities - (202.1) (202.1)
(0.2) (292.1) (292.3)
Restated 1 April 2017
GroupLoans and
receivables
Assets at fair value through
profit and loss
Available-for-sale
TotalAssets as per balance sheet £m £m £m £m
Available-for-sale financial assets - - 0.0 0.0 Derivative financial instruments - 0.0 - 0.0 Trade and other receivables excluding prepayments and corporation tax 405.2 - - 405.2 Cash and cash equivalents 107.5 - - 107.5
512.7 0.0 0.0 512.7
Restated 1 April 2017
Group
Liabilities at fair value
through profit and loss
Other financial
liabilities at amortised
cost
TotalLiabilities as per balance sheet £m £m £m
Derivative financial instruments (0.7) - (0.7)Trade and other payables excluding non-financial liabilities - (208.5) (208.5)
(0.7) (208.5) (209.2)
The directors consider that the carrying value of the financial instruments approximates to their fair value.
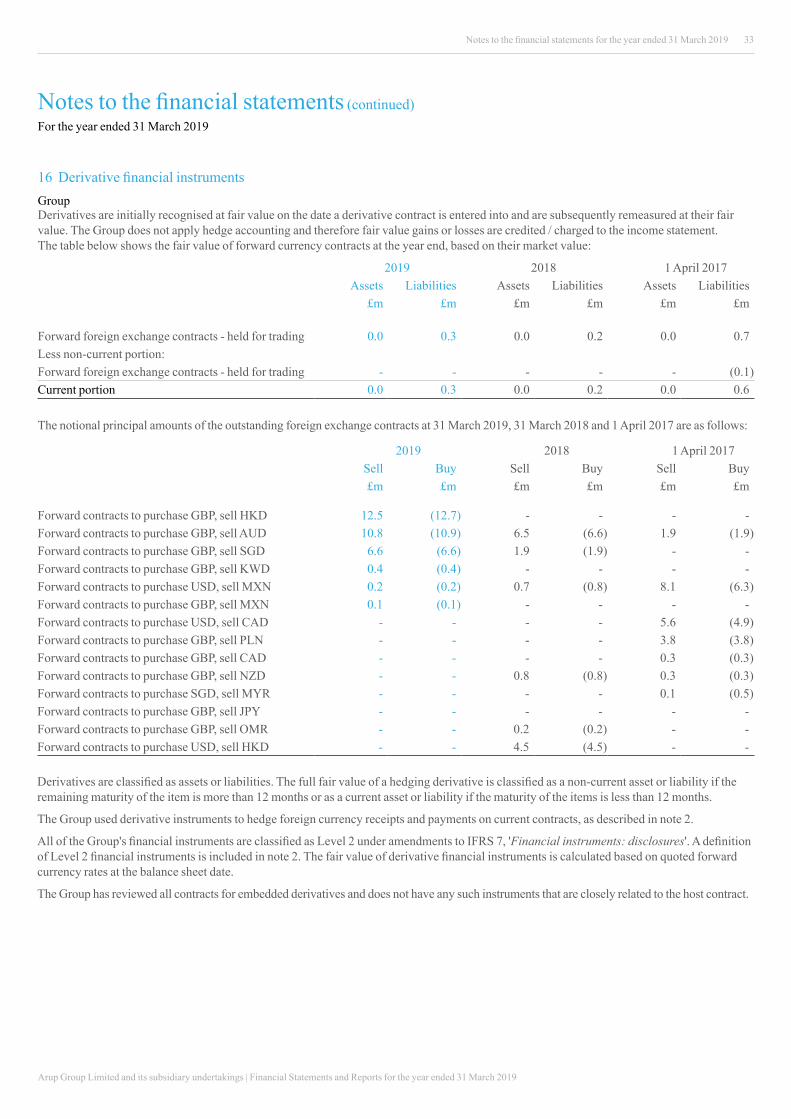
Arup Group Limited and its subsidiary undertakings | Financial Statements and Reports for the year ended 31 March 2019
33Notes to the financial statements for the year ended 31 March 2019
Notes to the financial statements (continued)For the year ended 31 March 2019
16 Derivative financial instrumentsGroupDerivatives are initially recognised at fair value on the date a derivative contract is entered into and are subsequently remeasured at their fair value. The Group does not apply hedge accounting and therefore fair value gains or losses are credited / charged to the income statement. The table below shows the fair value of forward currency contracts at the year end, based on their market value:
2019 2018 1 April 2017Assets Liabilities Assets Liabilities Assets Liabilities
£m £m £m £m £m £m
Forward foreign exchange contracts - held for trading 0.0 0.3 0.0 0.2 0.0 0.7 Less non-current portion:Forward foreign exchange contracts - held for trading - - - - - (0.1)Current portion 0.0 0.3 0.0 0.2 0.0 0.6
The notional principal amounts of the outstanding foreign exchange contracts at 31 March 2019, 31 March 2018 and 1 April 2017 are as follows:
2019 2018 1 April 2017Sell Buy Sell Buy Sell Buy£m £m £m £m £m £m
Forward contracts to purchase GBP, sell HKD 12.5 (12.7) - - - - Forward contracts to purchase GBP, sell AUD 10.8 (10.9) 6.5 (6.6) 1.9 (1.9)Forward contracts to purchase GBP, sell SGD 6.6 (6.6) 1.9 (1.9) - - Forward contracts to purchase GBP, sell KWD 0.4 (0.4) - - - - Forward contracts to purchase USD, sell MXN 0.2 (0.2) 0.7 (0.8) 8.1 (6.3)Forward contracts to purchase GBP, sell MXN 0.1 (0.1) - - - - Forward contracts to purchase USD, sell CAD - - - - 5.6 (4.9)Forward contracts to purchase GBP, sell PLN - - - - 3.8 (3.8)Forward contracts to purchase GBP, sell CAD - - - - 0.3 (0.3)Forward contracts to purchase GBP, sell NZD - - 0.8 (0.8) 0.3 (0.3)Forward contracts to purchase SGD, sell MYR - - - - 0.1 (0.5)Forward contracts to purchase GBP, sell JPY - - - - - - Forward contracts to purchase GBP, sell OMR - - 0.2 (0.2) - - Forward contracts to purchase USD, sell HKD - - 4.5 (4.5) - -
Derivatives are classified as assets or liabilities. The full fair value of a hedging derivative is classified as a non-current asset or liability if the remaining maturity of the item is more than 12 months or as a current asset or liability if the maturity of the items is less than 12 months.
The Group used derivative instruments to hedge foreign currency receipts and payments on current contracts, as described in note 2.
All of the Group's financial instruments are classified as Level 2 under amendments to IFRS 7, 'Financial instruments: disclosures'. A definition of Level 2 financial instruments is included in note 2. The fair value of derivative financial instruments is calculated based on quoted forward currency rates at the balance sheet date.
The Group has reviewed all contracts for embedded derivatives and does not have any such instruments that are closely related to the host contract.
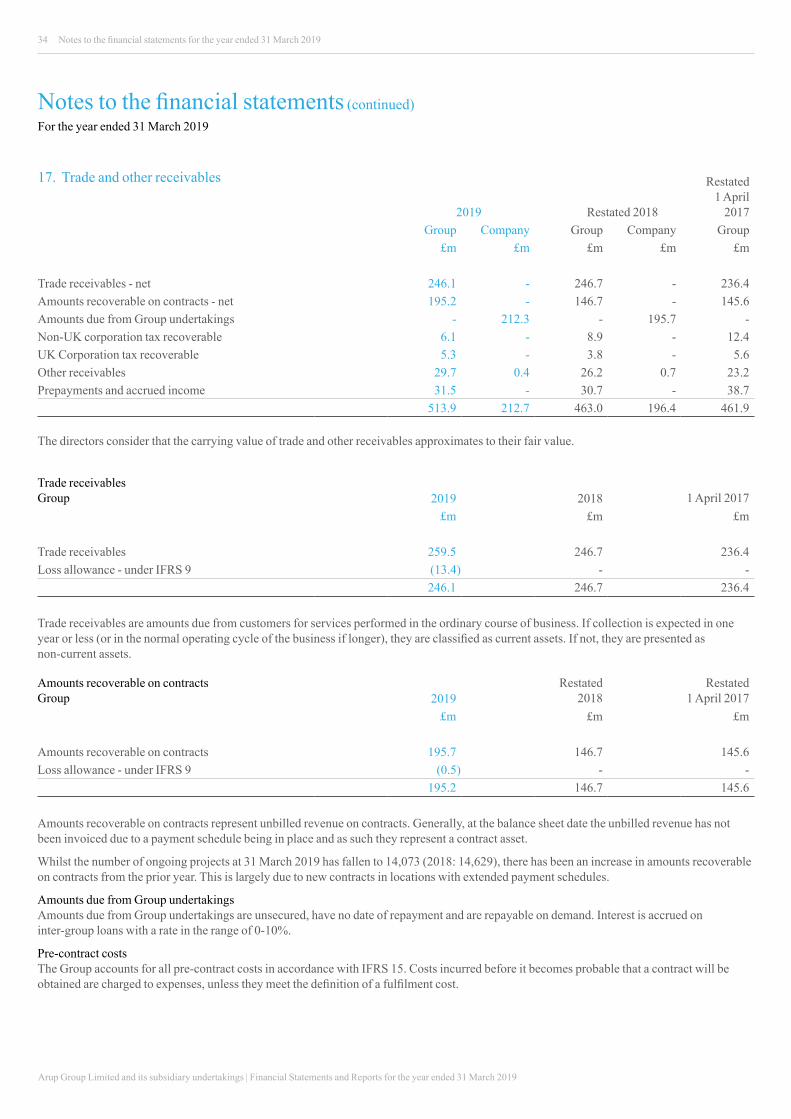
Arup Group Limited and its subsidiary undertakings | Financial Statements and Reports for the year ended 31 March 2019
34 Notes to the financial statements for the year ended 31 March 2019
Notes to the financial statements (continued)For the year ended 31 March 2019
17. Trade and other receivables
2019 Restated 2018
Restated 1 April
2017Group Company Group Company Group
£m £m £m £m £m
Trade receivables - net 246.1 - 246.7 - 236.4 Amounts recoverable on contracts - net 195.2 - 146.7 - 145.6 Amounts due from Group undertakings - 212.3 - 195.7 - Non-UK corporation tax recoverable 6.1 - 8.9 - 12.4 UK Corporation tax recoverable 5.3 - 3.8 - 5.6 Other receivables 29.7 0.4 26.2 0.7 23.2 Prepayments and accrued income 31.5 - 30.7 - 38.7
513.9 212.7 463.0 196.4 461.9
The directors consider that the carrying value of trade and other receivables approximates to their fair value.
Trade receivables Group 2019 2018
1 April 2017
£m £m £m
Trade receivables 259.5 246.7 236.4 Loss allowance - under IFRS 9 (13.4) - -
246.1 246.7 236.4
Trade receivables are amounts due from customers for services performed in the ordinary course of business. If collection is expected in one year or less (or in the normal operating cycle of the business if longer), they are classified as current assets. If not, they are presented as non-current assets.
Amounts recoverable on contracts Group 2019
Restated 2018
Restated 1 April 2017
£m £m £m
Amounts recoverable on contracts 195.7 146.7 145.6 Loss allowance - under IFRS 9 (0.5) - -
195.2 146.7 145.6
Amounts recoverable on contracts represent unbilled revenue on contracts. Generally, at the balance sheet date the unbilled revenue has not been invoiced due to a payment schedule being in place and as such they represent a contract asset.
Whilst the number of ongoing projects at 31 March 2019 has fallen to 14,073 (2018: 14,629), there has been an increase in amounts recoverable on contracts from the prior year. This is largely due to new contracts in locations with extended payment schedules.
Amounts due from Group undertakingsAmounts due from Group undertakings are unsecured, have no date of repayment and are repayable on demand. Interest is accrued on inter-group loans with a rate in the range of 0-10%.
Pre-contract costsThe Group accounts for all pre-contract costs in accordance with IFRS 15. Costs incurred before it becomes probable that a contract will be obtained are charged to expenses, unless they meet the definition of a fulfilment cost.
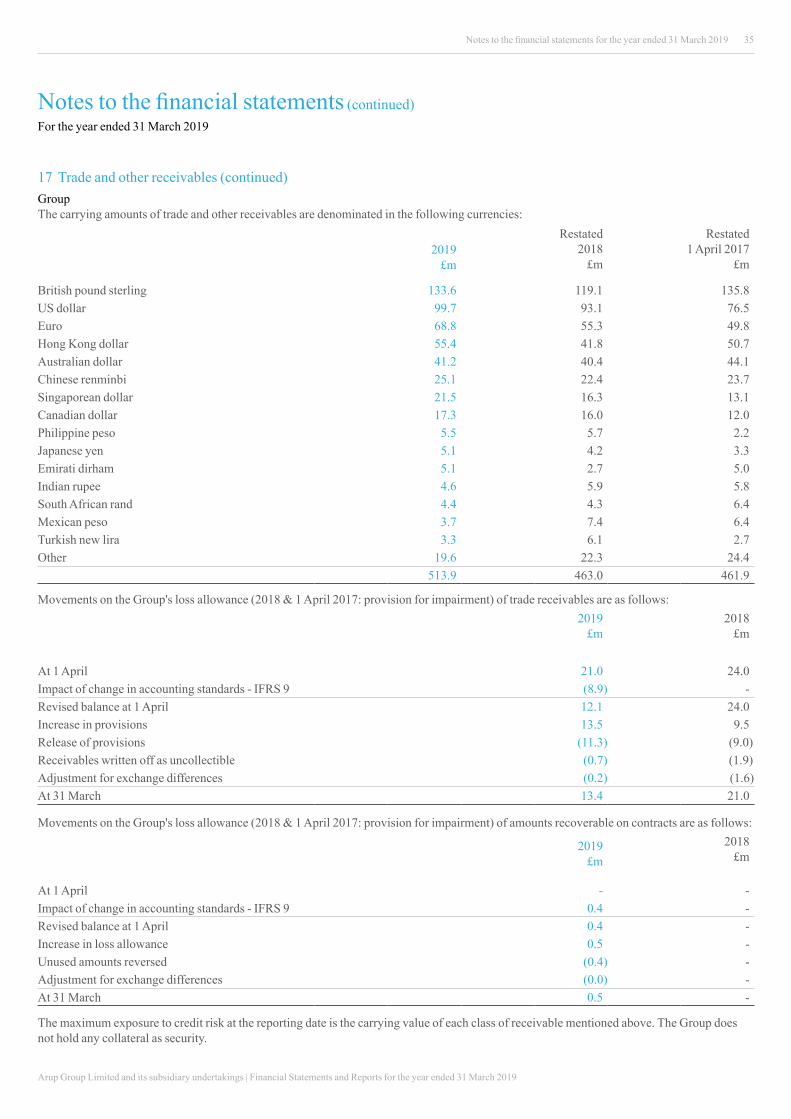
Arup Group Limited and its subsidiary undertakings | Financial Statements and Reports for the year ended 31 March 2019
35Notes to the financial statements for the year ended 31 March 2019
Notes to the financial statements (continued)For the year ended 31 March 2019
17 Trade and other receivables (continued)GroupThe carrying amounts of trade and other receivables are denominated in the following currencies:
2019£m
Restated 2018
£m
Restated 1 April 2017
£m
British pound sterling 133.6 119.1 135.8 US dollar 99.7 93.1 76.5 Euro 68.8 55.3 49.8 Hong Kong dollar 55.4 41.8 50.7 Australian dollar 41.2 40.4 44.1 Chinese renminbi 25.1 22.4 23.7 Singaporean dollar 21.5 16.3 13.1 Canadian dollar 17.3 16.0 12.0 Philippine peso 5.5 5.7 2.2 Japanese yen 5.1 4.2 3.3 Emirati dirham 5.1 2.7 5.0 Indian rupee 4.6 5.9 5.8 South African rand 4.4 4.3 6.4 Mexican peso 3.7 7.4 6.4 Turkish new lira 3.3 6.1 2.7 Other 19.6 22.3 24.4
513.9 463.0 461.9
Movements on the Group's loss allowance (2018 & 1 April 2017: provision for impairment) of trade receivables are as follows:2019
£m2018
£m
At 1 April 21.0 24.0 Impact of change in accounting standards - IFRS 9 (8.9) - Revised balance at 1 April 12.1 24.0 Increase in provisions 13.5 9.5 Release of provisions (11.3) (9.0)Receivables written off as uncollectible (0.7) (1.9)Adjustment for exchange differences (0.2) (1.6)At 31 March 13.4 21.0
Movements on the Group's loss allowance (2018 & 1 April 2017: provision for impairment) of amounts recoverable on contracts are as follows:
2019£m
2018£m
At 1 April - - Impact of change in accounting standards - IFRS 9 0.4 - Revised balance at 1 April 0.4 -Increase in loss allowance 0.5 - Unused amounts reversed (0.4) - Adjustment for exchange differences (0.0) - At 31 March 0.5 -
The maximum exposure to credit risk at the reporting date is the carrying value of each class of receivable mentioned above. The Group does not hold any collateral as security.
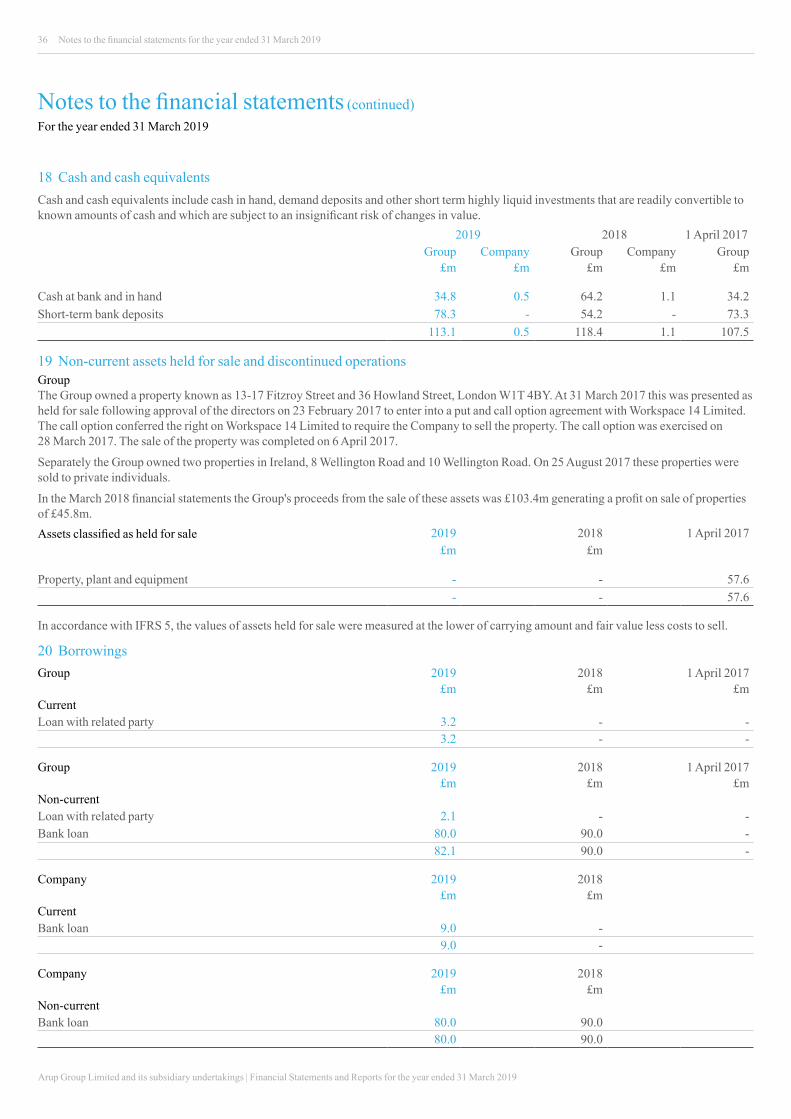
Arup Group Limited and its subsidiary undertakings | Financial Statements and Reports for the year ended 31 March 2019
36 Notes to the financial statements for the year ended 31 March 2019
Notes to the financial statements (continued)For the year ended 31 March 2019
18 Cash and cash equivalentsCash and cash equivalents include cash in hand, demand deposits and other short term highly liquid investments that are readily convertible to known amounts of cash and which are subject to an insignificant risk of changes in value.
2019 2018 1 April 2017 Group Company Group Company Group
£m £m £m £m £m
Cash at bank and in hand 34.8 0.5 64.2 1.1 34.2 Short-term bank deposits 78.3 - 54.2 - 73.3
113.1 0.5 118.4 1.1 107.5
19 Non-current assets held for sale and discontinued operationsGroup The Group owned a property known as 13-17 Fitzroy Street and 36 Howland Street, London W1T 4BY. At 31 March 2017 this was presented as held for sale following approval of the directors on 23 February 2017 to enter into a put and call option agreement with Workspace 14 Limited. The call option conferred the right on Workspace 14 Limited to require the Company to sell the property. The call option was exercised on 28 March 2017. The sale of the property was completed on 6 April 2017.
Separately the Group owned two properties in Ireland, 8 Wellington Road and 10 Wellington Road. On 25 August 2017 these properties were sold to private individuals.
In the March 2018 financial statements the Group's proceeds from the sale of these assets was £103.4m generating a profit on sale of properties of £45.8m.Assets classified as held for sale 2019 2018 1 April 2017
£m £m
Property, plant and equipment - - 57.6 - - 57.6
In accordance with IFRS 5, the values of assets held for sale were measured at the lower of carrying amount and fair value less costs to sell.
20 BorrowingsGroup 2019 2018 1 April 2017
£m £m £mCurrentLoan with related party 3.2 - -
3.2 - -
Group 2019 2018 1 April 2017 £m £m £m
Non-currentLoan with related party 2.1 - - Bank loan 80.0 90.0 -
82.1 90.0 -
Company 2019 2018£m £m
CurrentBank loan 9.0 -
9.0 -
Company 2019 2018£m £m
Non-currentBank loan 80.0 90.0
80.0 90.0
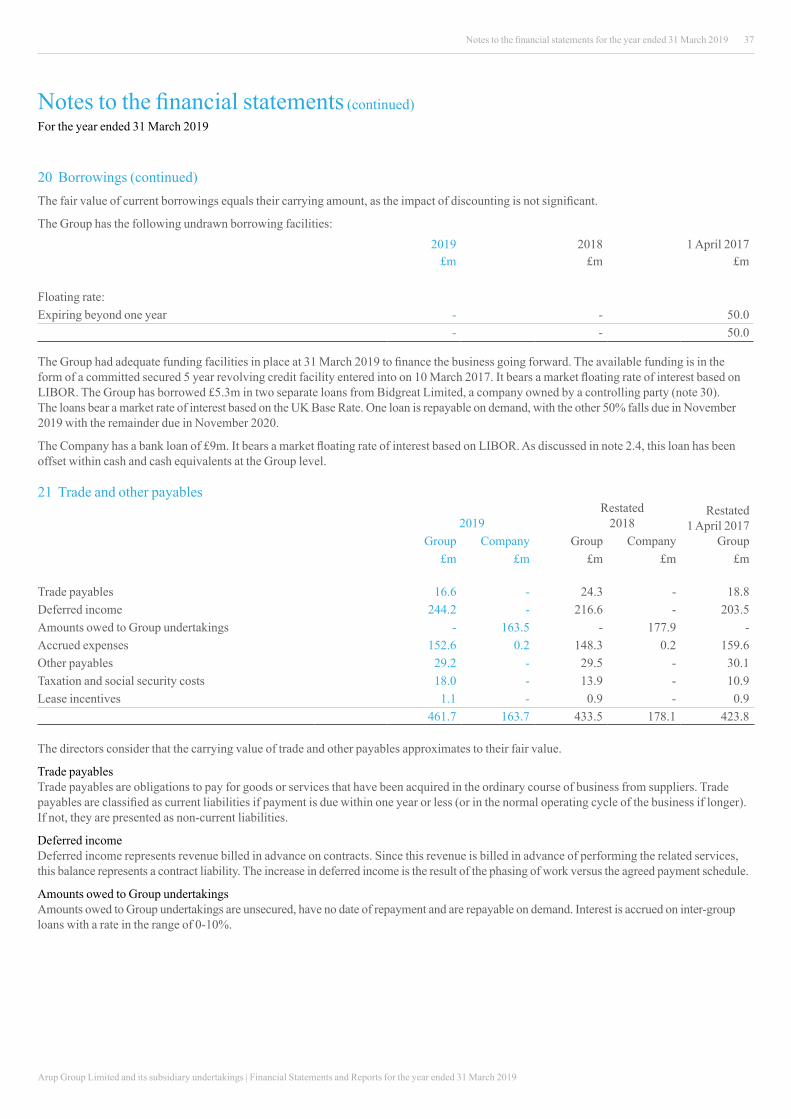
Arup Group Limited and its subsidiary undertakings | Financial Statements and Reports for the year ended 31 March 2019
37Notes to the financial statements for the year ended 31 March 2019
Notes to the financial statements (continued)For the year ended 31 March 2019
20 Borrowings (continued)The fair value of current borrowings equals their carrying amount, as the impact of discounting is not significant.
The Group has the following undrawn borrowing facilities:2019 2018 1 April 2017
£m £m £m
Floating rate:Expiring beyond one year - - 50.0
- - 50.0
The Group had adequate funding facilities in place at 31 March 2019 to finance the business going forward. The available funding is in the form of a committed secured 5 year revolving credit facility entered into on 10 March 2017. It bears a market floating rate of interest based on LIBOR. The Group has borrowed £5.3m in two separate loans from Bidgreat Limited, a company owned by a controlling party (note 30). The loans bear a market rate of interest based on the UK Base Rate. One loan is repayable on demand, with the other 50% falls due in November 2019 with the remainder due in November 2020.
The Company has a bank loan of £9m. It bears a market floating rate of interest based on LIBOR. As discussed in note 2.4, this loan has been offset within cash and cash equivalents at the Group level.
21 Trade and other payables
2019Restated
2018Restated
1 April 2017 GroupGroup Company Group Company
£m £m £m £m £m
Trade payables 16.6 - 24.3 - 18.8 Deferred income 244.2 - 216.6 - 203.5 Amounts owed to Group undertakings - 163.5 - 177.9 - Accrued expenses 152.6 0.2 148.3 0.2 159.6 Other payables 29.2 - 29.5 - 30.1 Taxation and social security costs 18.0 - 13.9 - 10.9 Lease incentives 1.1 - 0.9 - 0.9
461.7 163.7 433.5 178.1 423.8
The directors consider that the carrying value of trade and other payables approximates to their fair value.
Trade payablesTrade payables are obligations to pay for goods or services that have been acquired in the ordinary course of business from suppliers. Trade payables are classified as current liabilities if payment is due within one year or less (or in the normal operating cycle of the business if longer). If not, they are presented as non-current liabilities.
Deferred incomeDeferred income represents revenue billed in advance on contracts. Since this revenue is billed in advance of performing the related services, this balance represents a contract liability. The increase in deferred income is the result of the phasing of work versus the agreed payment schedule.
Amounts owed to Group undertakingsAmounts owed to Group undertakings are unsecured, have no date of repayment and are repayable on demand. Interest is accrued on inter-group loans with a rate in the range of 0-10%.
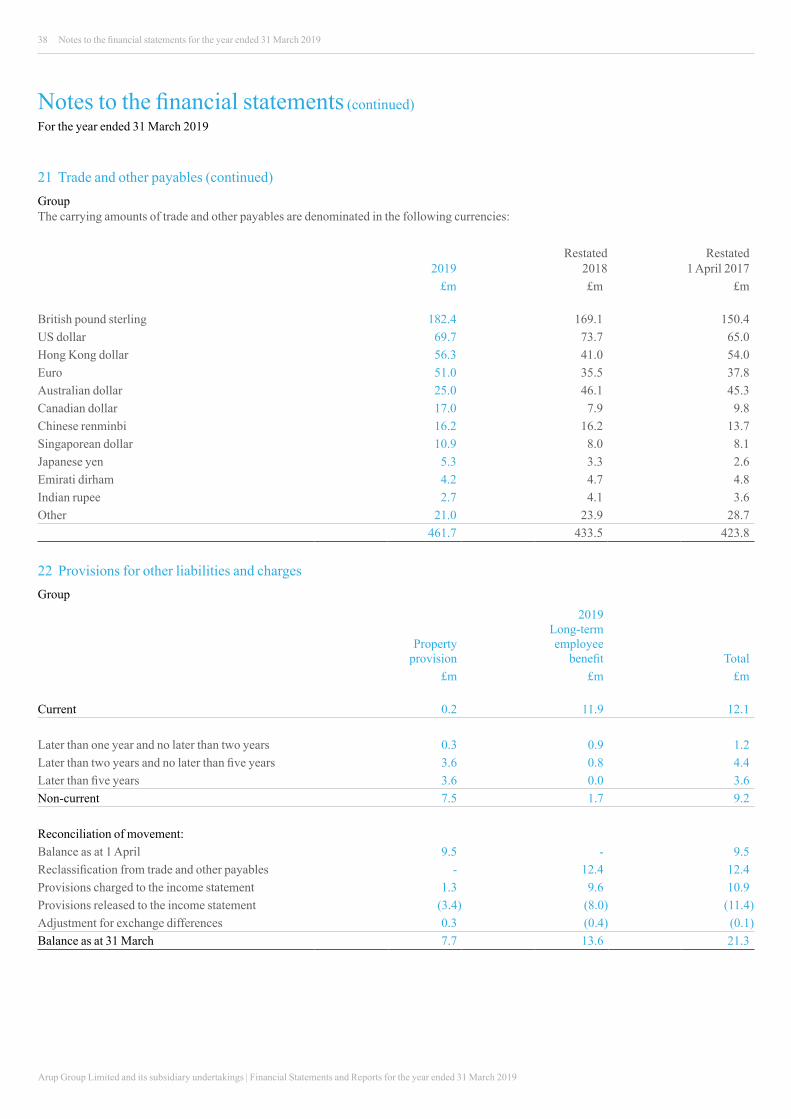
Arup Group Limited and its subsidiary undertakings | Financial Statements and Reports for the year ended 31 March 2019
38 Notes to the financial statements for the year ended 31 March 2019
Notes to the financial statements (continued)For the year ended 31 March 2019
22 Provisions for other liabilities and chargesGroup
Property provision
2019 Long-term employee
benefit Total£m £m £m
Current 0.2 11.9 12.1
Later than one year and no later than two years 0.3 0.9 1.2 Later than two years and no later than five years 3.6 0.8 4.4 Later than five years 3.6 0.0 3.6 Non-current 7.5 1.7 9.2
Reconciliation of movement:Balance as at 1 April 9.5 - 9.5 Reclassification from trade and other payables - 12.4 12.4 Provisions charged to the income statement 1.3 9.6 10.9 Provisions released to the income statement (3.4) (8.0) (11.4)Adjustment for exchange differences 0.3 (0.4) (0.1)Balance as at 31 March 7.7 13.6 21.3
Restated2018
Restated 1 April 20172019
£m £m £m
British pound sterling 182.4 169.1 150.4 US dollar 69.7 73.7 65.0 Hong Kong dollar 56.3 41.0 54.0 Euro 51.0 35.5 37.8 Australian dollar 25.0 46.1 45.3 Canadian dollar 17.0 7.9 9.8 Chinese renminbi 16.2 16.2 13.7 Singaporean dollar 10.9 8.0 8.1 Japanese yen 5.3 3.3 2.6 Emirati dirham 4.2 4.7 4.8 Indian rupee 2.7 4.1 3.6 Other 21.0 23.9 28.7
461.7 433.5 423.8
Group The carrying amounts of trade and other payables are denominated in the following currencies:
21 Trade and other payables (continued)

Arup Group Limited and its subsidiary undertakings | Financial Statements and Reports for the year ended 31 March 2019
39Notes to the financial statements for the year ended 31 March 2019
Notes to the financial statements (continued)For the year ended 31 March 2019
2018 Property
provision
1 April 2017 Property
provision£m £m
Current 1.6 0.5
Later than one year and no later than two years 0.3 1.6 Later than two years and no later than five years 2.2 0.7 Later than five years 5.4 4.7 Non-current 7.9 7.0
Reconciliation of movement:Balance as at 1 April 7.5 Provisions charged to the income statement 3.2 Provisions released to the income statement (0.5)Adjustment for exchange differences (0.7)Balance as at 31 March 9.5
Provisions for other liabilities
Provisions are recognised when the Group has a present legal or constructive obligation as a result of past events, it is probable that an outflow of resources will be required to settle the obligation and the amount has been reliably estimated.
Property provisionThe Group is required to perform dilapidation repairs on leased properties prior to the properties being vacated at the end of their lease term. Provision for such costs is made where a legal obligation is identified and the liability can be reasonably quantified.
Long-term employee benefit obligationsIn Australia, employees who work 10 years with a company are entitled to additional annual leave called long service leave. Long service leave covers all unconditional entitlements where employees have completed more than 10 years service and where employees are entitled to pro-rata payments in certain circumstances. The majority of the provision is presented as current, since the Group does not have an unconditional right to defer settlement for any of these obligations. However, based on past experience, the Group does not expect all employees to take the full amount of accrued leave or require payment within the next 12 months. Those amounts have been classified as non-current.
In previous years this provision has been classified within accruals (2018: £12.4m; 1 April 2017: £12.8m).
The Company has no provisions for other liabilities and charges (2018: nil)
23 Other non-current liabilities
2019 Lease
incentives
2018 Lease
incentives
1 April 2017 Lease
incentivesGroup £m £m £m
Later than one year and no later than two years 1.5 0.9 0.8 Later than two years and no later than five years 6.2 2.9 2.4Later than five years 15.6 2.5 3.8
23.3 6.3 7.0
The Company has no provisions for other non-current liabilities (2018: nil).
22 Provisions for other liabilities and charges (continued)Group (continued)
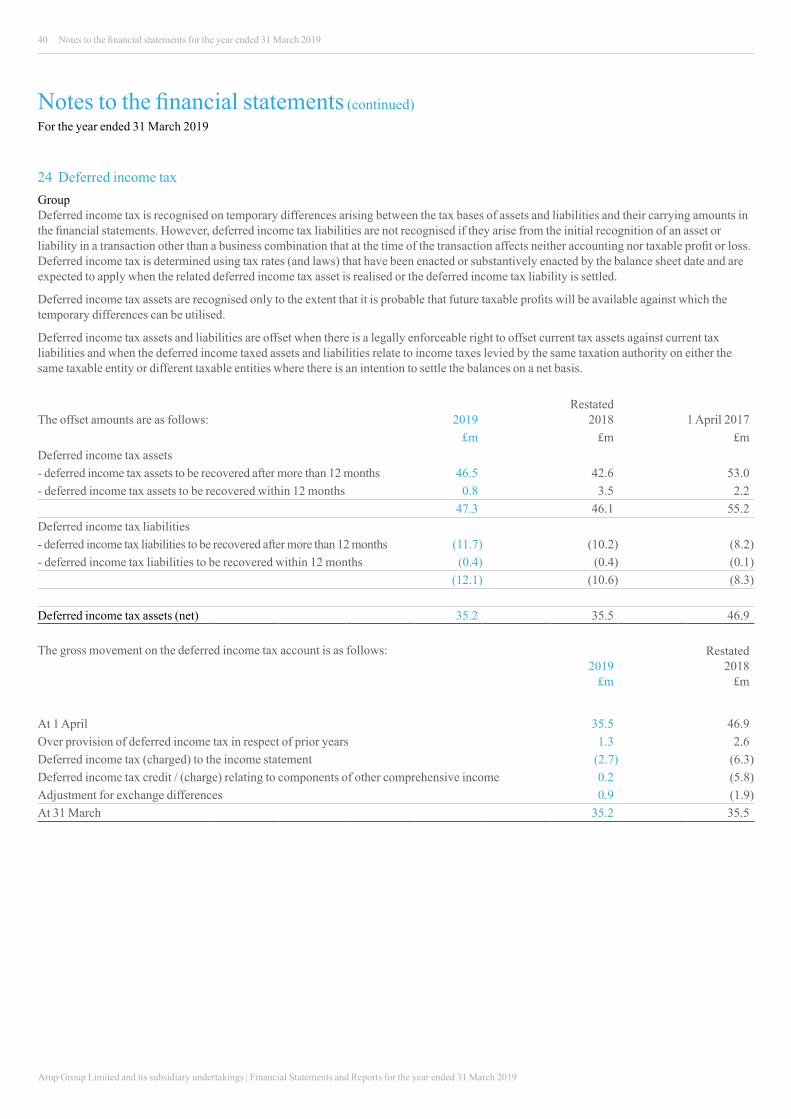
Arup Group Limited and its subsidiary undertakings | Financial Statements and Reports for the year ended 31 March 2019
40 Notes to the financial statements for the year ended 31 March 2019
Notes to the financial statements (continued)For the year ended 31 March 2019
24 Deferred income taxGroupDeferred income tax is recognised on temporary differences arising between the tax bases of assets and liabilities and their carrying amounts in the financial statements. However, deferred income tax liabilities are not recognised if they arise from the initial recognition of an asset or liability in a transaction other than a business combination that at the time of the transaction affects neither accounting nor taxable profit or loss. Deferred income tax is determined using tax rates (and laws) that have been enacted or substantively enacted by the balance sheet date and are expected to apply when the related deferred income tax asset is realised or the deferred income tax liability is settled.
Deferred income tax assets are recognised only to the extent that it is probable that future taxable profits will be available against which the temporary differences can be utilised.
Deferred income tax assets and liabilities are offset when there is a legally enforceable right to offset current tax assets against current tax liabilities and when the deferred income taxed assets and liabilities relate to income taxes levied by the same taxation authority on either the same taxable entity or different taxable entities where there is an intention to settle the balances on a net basis.
The offset amounts are as follows: 2019Restated
2018
1 April 2017£m £m £m
Deferred income tax assets- deferred income tax assets to be recovered after more than 12 months 46.5 42.6 53.0- deferred income tax assets to be recovered within 12 months 0.8 3.5 2.2
47.3 46.1 55.2Deferred income tax liabilities- deferred income tax liabilities to be recovered after more than 12 months (11.7) (10.2) (8.2) - deferred income tax liabilities to be recovered within 12 months (0.4) (0.4) (0.1)
(12.1) (10.6) (8.3)
Deferred income tax assets (net) 35.2 35.5 46.9
The gross movement on the deferred income tax account is as follows:2019
£m
Restated 2018
£m
At 1 April 35.5 46.9 Over provision of deferred income tax in respect of prior years 1.3 2.6 Deferred income tax (charged) to the income statement (2.7) (6.3)Deferred income tax credit / (charge) relating to components of other comprehensive income 0.2 (5.8)Adjustment for exchange differences 0.9 (1.9)At 31 March 35.2 35.5
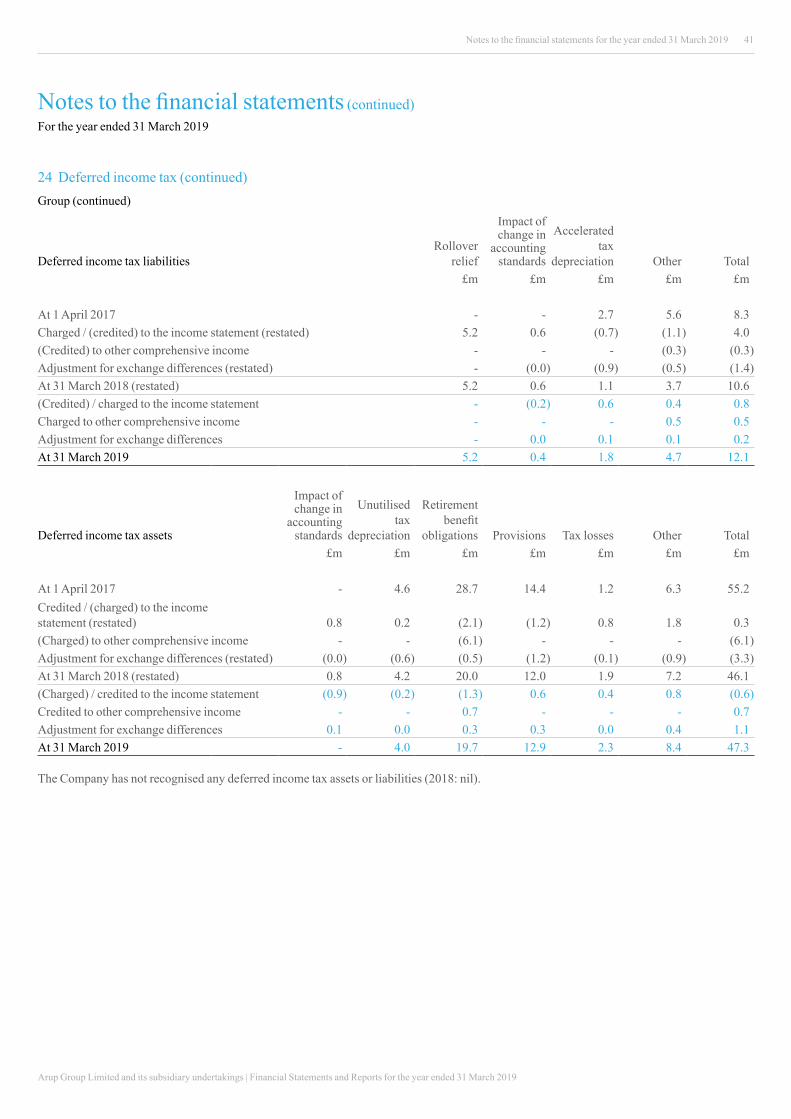
Arup Group Limited and its subsidiary undertakings | Financial Statements and Reports for the year ended 31 March 2019
41Notes to the financial statements for the year ended 31 March 2019
Notes to the financial statements (continued)For the year ended 31 March 2019
Deferred income tax liabilitiesRollover
relief
Impact of change in
accounting standards
Accelerated tax
depreciation Other Total£m £m £m £m £m
At 1 April 2017 - - 2.7 5.6 8.3 Charged / (credited) to the income statement (restated) 5.2 0.6 (0.7) (1.1) 4.0 (Credited) to other comprehensive income - - - (0.3) (0.3)Adjustment for exchange differences (restated) - (0.0) (0.9) (0.5) (1.4)At 31 March 2018 (restated) 5.2 0.6 1.1 3.7 10.6 (Credited) / charged to the income statement - (0.2) 0.6 0.4 0.8 Charged to other comprehensive income - - - 0.5 0.5 Adjustment for exchange differences - 0.0 0.1 0.1 0.2 At 31 March 2019 5.2 0.4 1.8 4.7 12.1
Deferred income tax assets
Impact of change in
accounting standards
Unutilised tax
depreciation
Retirement benefit
obligations Provisions Tax losses Other Total£m £m £m £m £m £m £m
At 1 April 2017 - 4.6 28.7 14.4 1.2 6.3 55.2 Credited / (charged) to the income statement (restated) 0.8 0.2 (2.1) (1.2) 0.8 1.8 0.3 (Charged) to other comprehensive income - - (6.1) - - - (6.1)Adjustment for exchange differences (restated) (0.0) (0.6) (0.5) (1.2) (0.1) (0.9) (3.3)At 31 March 2018 (restated) 0.8 4.2 20.0 12.0 1.9 7.2 46.1 (Charged) / credited to the income statement (0.9) (0.2) (1.3) 0.6 0.4 0.8 (0.6)Credited to other comprehensive income - - 0.7 - - - 0.7 Adjustment for exchange differences 0.1 0.0 0.3 0.3 0.0 0.4 1.1 At 31 March 2019 - 4.0 19.7 12.9 2.3 8.4 47.3
The Company has not recognised any deferred income tax assets or liabilities (2018: nil).
24 Deferred income tax (continued)Group (continued)
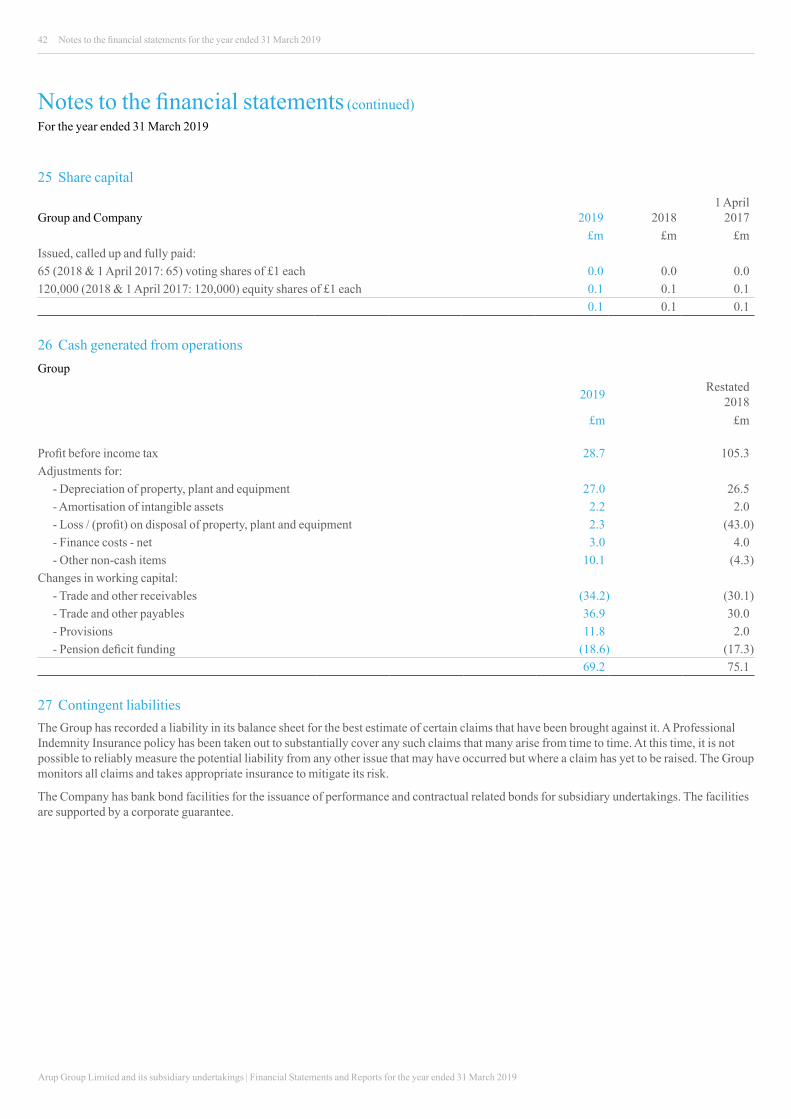
Arup Group Limited and its subsidiary undertakings | Financial Statements and Reports for the year ended 31 March 2019
42 Notes to the financial statements for the year ended 31 March 2019
Notes to the financial statements (continued)For the year ended 31 March 2019
25 Share capital
1 April 2017Group and Company 2019 2018
£m £m £mIssued, called up and fully paid:65 (2018 & 1 April 2017: 65) voting shares of £1 each 0.0 0.0 0.0 120,000 (2018 & 1 April 2017: 120,000) equity shares of £1 each 0.1 0.1 0.1
0.1 0.1 0.1
26 Cash generated from operationsGroup
2019 Restated 2018
£m £m
Profit before income tax 28.7 105.3 Adjustments for:
- Depreciation of property, plant and equipment 27.0 26.5 - Amortisation of intangible assets 2.2 2.0 - Loss / (profit) on disposal of property, plant and equipment 2.3 (43.0)- Finance costs - net 3.0 4.0 - Other non-cash items 10.1 (4.3)
Changes in working capital:- Trade and other receivables (34.2) (30.1)- Trade and other payables 36.9 30.0 - Provisions 11.8 2.0 - Pension deficit funding (18.6) (17.3)
69.2 75.1
27 Contingent liabilitiesThe Group has recorded a liability in its balance sheet for the best estimate of certain claims that have been brought against it. A Professional Indemnity Insurance policy has been taken out to substantially cover any such claims that many arise from time to time. At this time, it is not possible to reliably measure the potential liability from any other issue that may have occurred but where a claim has yet to be raised. The Group monitors all claims and takes appropriate insurance to mitigate its risk.
The Company has bank bond facilities for the issuance of performance and contractual related bonds for subsidiary undertakings. The facilities are supported by a corporate guarantee.

Arup Group Limited and its subsidiary undertakings | Financial Statements and Reports for the year ended 31 March 2019
43Notes to the financial statements for the year ended 31 March 2019
Notes to the financial statements (continued)For the year ended 31 March 2019
28 CommitmentsOperating lease commitmentsLeases in which a significant portion of the risks and rewards of ownership are retained by the lessor are classified as operating leases. Payments made under operating leases (net of any incentives received from the lessor) are charged to the income statement on a straight-line basis over the period of the lease.
At the end of the financial year, the future aggregate minimum lease payments under non-cancellable operating leases are payable as follows:
Group 2019 2018
Property
Vehicles, plant and
equipment Property
Vehicles, plant and
equipment£m £m £m £m
No later than one year 43.8 1.4 43.0 1.1 Later than one year and no later than five years 144.9 2.0 125.1 2.2Later than five years 129.2 - 55.6 -
The Company had no operating lease commitments as at 31 March 2019 (2018: nil).
29 Related partiesThe Group received loans from Bidgreat Limited, a related party, of £5.3m (2018 & 1 April 2017: nil). The Company had no transactions with related parties (2018: nil).
Key management compensation Key management includes the Company directors, the Company Secretary and the officers to the board. The compensation paid or payable to key management for employee services is shown below:
2019 2018£m £m
Aggregate remuneration 9.9 8.8Aggregate contributions paid to defined contribution schemes 0.3 0.3
10.2 9.1
30 Controlling partyThe Company is owned by Ove Arup Partnership Employee Trust, Ove Arup Partnership Charitable Trust and The Arup Service Trust. The controlling party is Ove Arup Partnership Charitable Trust.
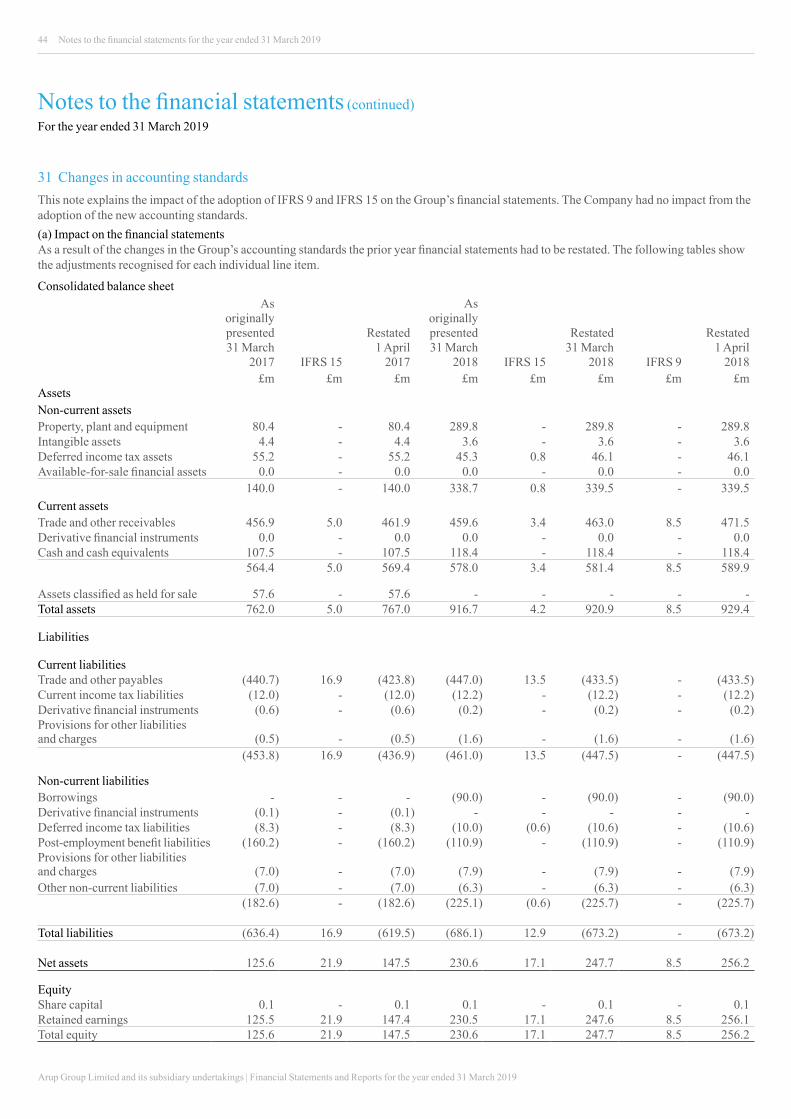
Arup Group Limited and its subsidiary undertakings | Financial Statements and Reports for the year ended 31 March 2019
44 Notes to the financial statements for the year ended 31 March 2019
Notes to the financial statements (continued)For the year ended 31 March 2019
31 Changes in accounting standardsThis note explains the impact of the adoption of IFRS 9 and IFRS 15 on the Group’s financial statements. The Company had no impact from the adoption of the new accounting standards.(a) Impact on the financial statementsAs a result of the changes in the Group’s accounting standards the prior year financial statements had to be restated. The following tables show the adjustments recognised for each individual line item.
Consolidated balance sheetAs
originally presented 31 March
2017 IFRS 15
Restated 1 April
2017
As originally presented 31 March
2018 IFRS 15
Restated 31 March
2018 IFRS 9
Restated 1 April
2018£m £m £m £m £m £m £m £m
AssetsNon-current assetsProperty, plant and equipment 80.4 - 80.4 289.8 - 289.8 - 289.8 Intangible assets 4.4 - 4.4 3.6 - 3.6 - 3.6 Deferred income tax assets 55.2 - 55.2 45.3 0.8 46.1 - 46.1 Available-for-sale financial assets 0.0 - 0.0 0.0 - 0.0 - 0.0
140.0 - 140.0 338.7 0.8 339.5 - 339.5 Current assetsTrade and other receivables 456.9 5.0 461.9 459.6 3.4 463.0 8.5 471.5 Derivative financial instruments 0.0 - 0.0 0.0 - 0.0 - 0.0 Cash and cash equivalents 107.5 - 107.5 118.4 - 118.4 - 118.4
564.4 5.0 569.4 578.0 3.4 581.4 8.5 589.9
Assets classified as held for sale 57.6 - 57.6 - - - - - Total assets 762.0 5.0 767.0 916.7 4.2 920.9 8.5 929.4
Liabilities
Current liabilitiesTrade and other payables (440.7) 16.9 (423.8) (447.0) 13.5 (433.5) - (433.5)Current income tax liabilities (12.0) - (12.0) (12.2) - (12.2) - (12.2)Derivative financial instruments (0.6) - (0.6) (0.2) - (0.2) - (0.2)Provisions for other liabilities and charges (0.5) - (0.5) (1.6) - (1.6) - (1.6)
(453.8) 16.9 (436.9) (461.0) 13.5 (447.5) - (447.5)
Non-current liabilitiesBorrowings - - - (90.0) - (90.0) - (90.0)Derivative financial instruments (0.1) - (0.1) - - - - - Deferred income tax liabilities (8.3) - (8.3) (10.0) (0.6) (10.6) - (10.6)Post-employment benefit liabilities (160.2) - (160.2) (110.9) - (110.9) - (110.9)Provisions for other liabilities and charges (7.0) - (7.0) (7.9) - (7.9) - (7.9)Other non-current liabilities (7.0) - (7.0) (6.3) - (6.3) - (6.3)
(182.6) - (182.6) (225.1) (0.6) (225.7) - (225.7)
Total liabilities (636.4) 16.9 (619.5) (686.1) 12.9 (673.2) - (673.2)
Net assets 125.6 21.9 147.5 230.6 17.1 247.7 8.5 256.2
EquityShare capital 0.1 - 0.1 0.1 - 0.1 - 0.1 Retained earnings 125.5 21.9 147.4 230.5 17.1 247.6 8.5 256.1 Total equity 125.6 21.9 147.5 230.6 17.1 247.7 8.5 256.2
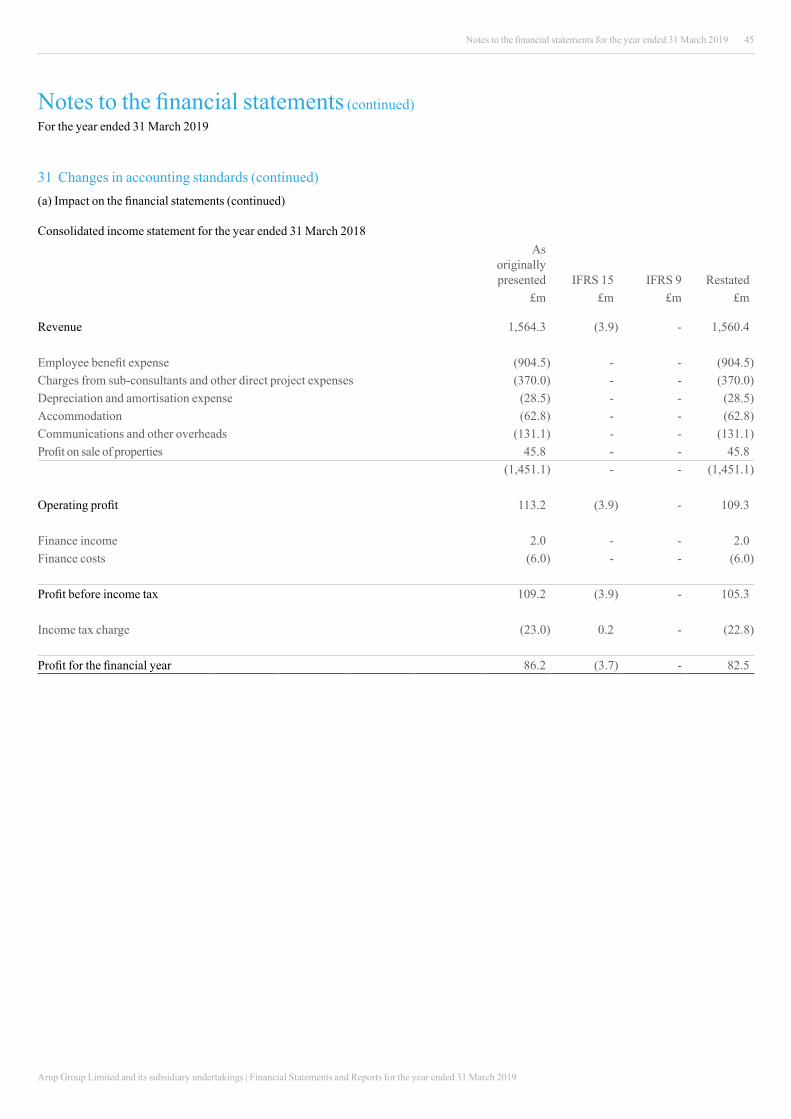
Arup Group Limited and its subsidiary undertakings | Financial Statements and Reports for the year ended 31 March 2019
45Notes to the financial statements for the year ended 31 March 2019
Notes to the financial statements (continued)For the year ended 31 March 2019
31 Changes in accounting standards (continued)(a) Impact on the financial statements (continued)
Consolidated income statement for the year ended 31 March 2018As
originally presented IFRS 15 IFRS 9 Restated
£m £m £m £m
Revenue 1,564.3 (3.9) - 1,560.4
Employee benefit expense (904.5) - - (904.5)Charges from sub-consultants and other direct project expenses (370.0) - - (370.0)Depreciation and amortisation expense (28.5) - - (28.5)Accommodation (62.8) - - (62.8)Communications and other overheads (131.1) - - (131.1)Profit on sale of properties 45.8 - - 45.8
(1,451.1) - - (1,451.1)
Operating profit 113.2 (3.9) - 109.3
Finance income 2.0 - - 2.0 Finance costs (6.0) - - (6.0)
Profit before income tax 109.2 (3.9) - 105.3
Income tax charge (23.0) 0.2 - (22.8)
Profit for the financial year 86.2 (3.7) - 82.5
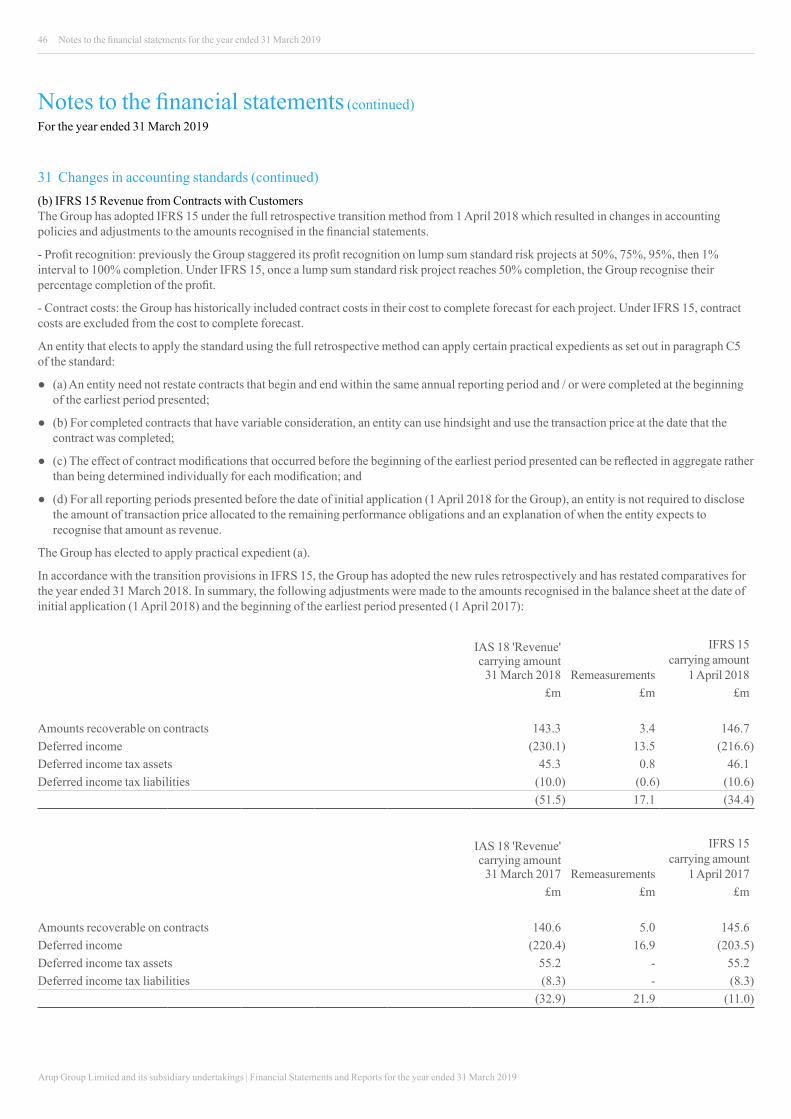
Arup Group Limited and its subsidiary undertakings | Financial Statements and Reports for the year ended 31 March 2019
46 Notes to the financial statements for the year ended 31 March 2019
Notes to the financial statements (continued)For the year ended 31 March 2019
31 Changes in accounting standards (continued)(b) IFRS 15 Revenue from Contracts with CustomersThe Group has adopted IFRS 15 under the full retrospective transition method from 1 April 2018 which resulted in changes in accounting policies and adjustments to the amounts recognised in the financial statements.
- Profit recognition: previously the Group staggered its profit recognition on lump sum standard risk projects at 50%, 75%, 95%, then 1% interval to 100% completion. Under IFRS 15, once a lump sum standard risk project reaches 50% completion, the Group recognise their percentage completion of the profit.
- Contract costs: the Group has historically included contract costs in their cost to complete forecast for each project. Under IFRS 15, contract costs are excluded from the cost to complete forecast.
An entity that elects to apply the standard using the full retrospective method can apply certain practical expedients as set out in paragraph C5 of the standard:
● (a) An entity need not restate contracts that begin and end within the same annual reporting period and / or were completed at the beginning of the earliest period presented;
● (b) For completed contracts that have variable consideration, an entity can use hindsight and use the transaction price at the date that the contract was completed;
● (c) The effect of contract modifications that occurred before the beginning of the earliest period presented can be reflected in aggregate rather than being determined individually for each modification; and
● (d) For all reporting periods presented before the date of initial application (1 April 2018 for the Group), an entity is not required to disclose the amount of transaction price allocated to the remaining performance obligations and an explanation of when the entity expects to recognise that amount as revenue.
The Group has elected to apply practical expedient (a).
In accordance with the transition provisions in IFRS 15, the Group has adopted the new rules retrospectively and has restated comparatives for the year ended 31 March 2018. In summary, the following adjustments were made to the amounts recognised in the balance sheet at the date of initial application (1 April 2018) and the beginning of the earliest period presented (1 April 2017):
IAS 18 'Revenue' carrying amount
31 March 2018 Remeasurements
IFRS 15 carrying amount
1 April 2018 £m £m £m
Amounts recoverable on contracts 143.3 3.4 146.7 Deferred income (230.1) 13.5 (216.6)Deferred income tax assets 45.3 0.8 46.1 Deferred income tax liabilities (10.0) (0.6) (10.6)
(51.5) 17.1 (34.4)
IAS 18 'Revenue' carrying amount
31 March 2017 Remeasurements
IFRS 15 carrying amount
1 April 2017£m £m £m
Amounts recoverable on contracts 140.6 5.0 145.6 Deferred income (220.4) 16.9 (203.5)Deferred income tax assets 55.2 - 55.2 Deferred income tax liabilities (8.3) - (8.3)
(32.9) 21.9 (11.0)
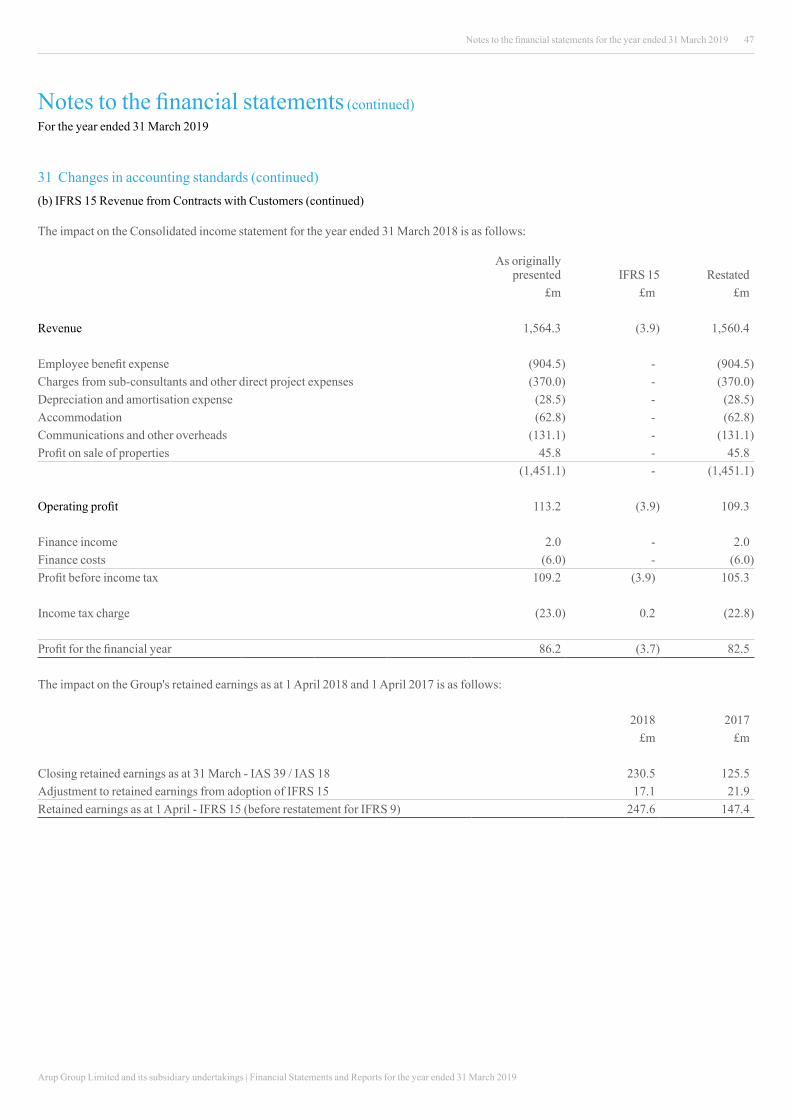
Arup Group Limited and its subsidiary undertakings | Financial Statements and Reports for the year ended 31 March 2019
47
Notes to the financial statements (continued)For the year ended 31 March 2019
Notes to the financial statements for the year ended 31 March 2019
31 Changes in accounting standards (continued)(b) IFRS 15 Revenue from Contracts with Customers (continued)
The impact on the Consolidated income statement for the year ended 31 March 2018 is as follows:
As originally presented IFRS 15 Restated
£m £m £m
Revenue 1,564.3 (3.9) 1,560.4
Employee benefit expense (904.5) - (904.5)Charges from sub-consultants and other direct project expenses (370.0) - (370.0)Depreciation and amortisation expense (28.5) - (28.5)Accommodation (62.8) - (62.8)Communications and other overheads (131.1) - (131.1)Profit on sale of properties 45.8 - 45.8
(1,451.1) - (1,451.1)
Operating profit 113.2 (3.9) 109.3
Finance income 2.0 - 2.0 Finance costs (6.0) - (6.0)Profit before income tax 109.2 (3.9) 105.3
Income tax charge (23.0) 0.2 (22.8)
Profit for the financial year 86.2 (3.7) 82.5
The impact on the Group's retained earnings as at 1 April 2018 and 1 April 2017 is as follows:
2018 2017£m £m
Closing retained earnings as at 31 March - IAS 39 / IAS 18 230.5 125.5 Adjustment to retained earnings from adoption of IFRS 15 17.1 21.9 Retained earnings as at 1 April - IFRS 15 (before restatement for IFRS 9) 247.6 147.4
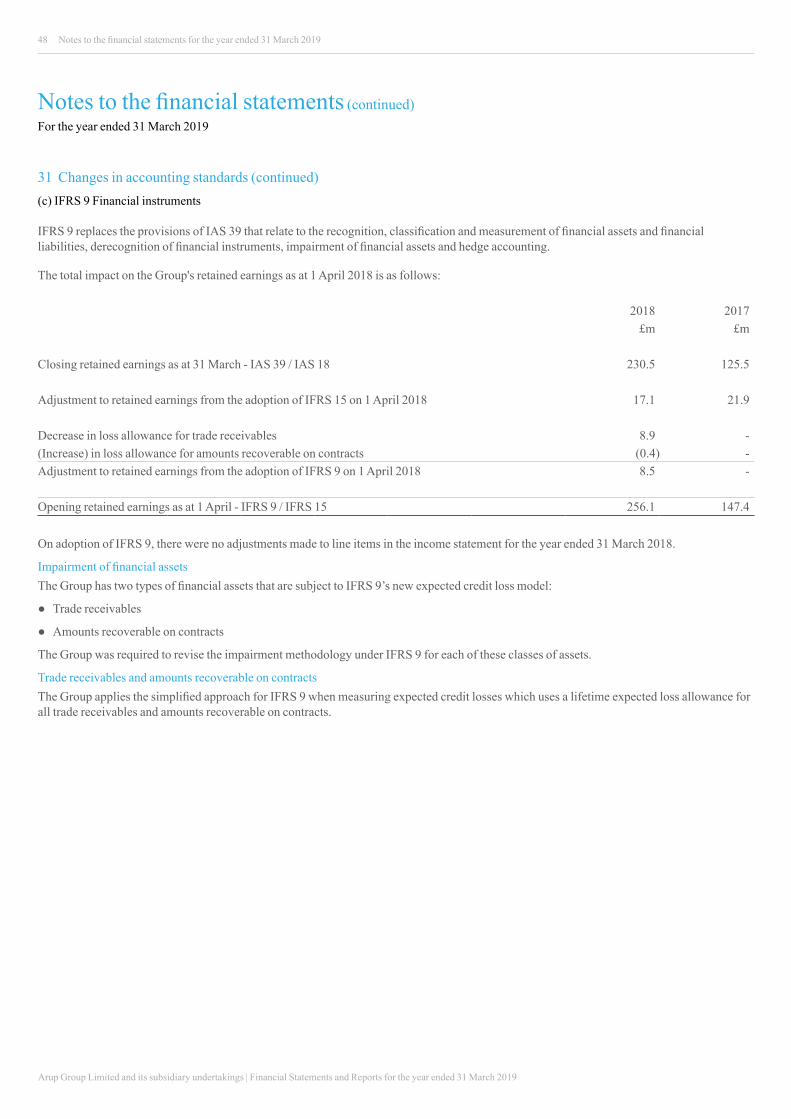
Arup Group Limited and its subsidiary undertakings | Financial Statements and Reports for the year ended 31 March 2019
48
Notes to the financial statements (continued)For the year ended 31 March 2019
Notes to the financial statements for the year ended 31 March 2019
31 Changes in accounting standards (continued)(c) IFRS 9 Financial instruments
IFRS 9 replaces the provisions of IAS 39 that relate to the recognition, classification and measurement of financial assets and financial liabilities, derecognition of financial instruments, impairment of financial assets and hedge accounting.
The total impact on the Group's retained earnings as at 1 April 2018 is as follows:
2018 2017£m £m
Closing retained earnings as at 31 March - IAS 39 / IAS 18 230.5 125.5
Adjustment to retained earnings from the adoption of IFRS 15 on 1 April 2018 17.1 21.9
Decrease in loss allowance for trade receivables 8.9 - (Increase) in loss allowance for amounts recoverable on contracts (0.4) - Adjustment to retained earnings from the adoption of IFRS 9 on 1 April 2018 8.5 -
Opening retained earnings as at 1 April - IFRS 9 / IFRS 15 256.1 147.4
On adoption of IFRS 9, there were no adjustments made to line items in the income statement for the year ended 31 March 2018.
Impairment of financial assetsThe Group has two types of financial assets that are subject to IFRS 9’s new expected credit loss model:
● Trade receivables
● Amounts recoverable on contracts
The Group was required to revise the impairment methodology under IFRS 9 for each of these classes of assets.
Trade receivables and amounts recoverable on contractsThe Group applies the simplified approach for IFRS 9 when measuring expected credit losses which uses a lifetime expected loss allowance for all trade receivables and amounts recoverable on contracts.
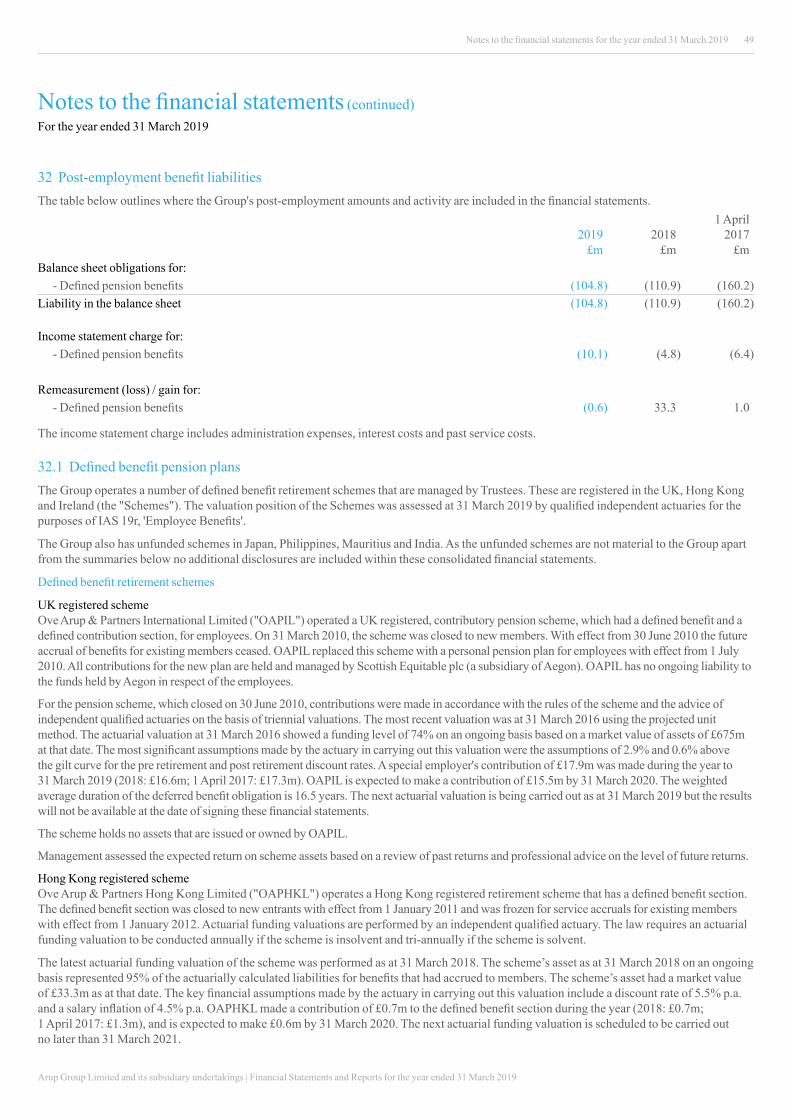
Arup Group Limited and its subsidiary undertakings | Financial Statements and Reports for the year ended 31 March 2019
49
Notes to the financial statements (continued)For the year ended 31 March 2019
Notes to the financial statements for the year ended 31 March 2019
32 Post-employment benefit liabilitiesThe table below outlines where the Group's post-employment amounts and activity are included in the financial statements.
2019£m
2018£m
1 April 2017
£mBalance sheet obligations for:
- Defined pension benefits (104.8) (110.9) (160.2)Liability in the balance sheet (104.8) (110.9) (160.2)
Income statement charge for:- Defined pension benefits (10.1) (4.8) (6.4)
Remeasurement (loss) / gain for:- Defined pension benefits (0.6) 33.3 1.0
The income statement charge includes administration expenses, interest costs and past service costs.
32.1 Defined benefit pension plansThe Group operates a number of defined benefit retirement schemes that are managed by Trustees. These are registered in the UK, Hong Kong and Ireland (the "Schemes"). The valuation position of the Schemes was assessed at 31 March 2019 by qualified independent actuaries for the purposes of IAS 19r, 'Employee Benefits'.
The Group also has unfunded schemes in Japan, Philippines, Mauritius and India. As the unfunded schemes are not material to the Group apart from the summaries below no additional disclosures are included within these consolidated financial statements.
Defined benefit retirement schemes
UK registered schemeOve Arup & Partners International Limited ("OAPIL") operated a UK registered, contributory pension scheme, which had a defined benefit and a defined contribution section, for employees. On 31 March 2010, the scheme was closed to new members. With effect from 30 June 2010 the future accrual of benefits for existing members ceased. OAPIL replaced this scheme with a personal pension plan for employees with effect from 1 July 2010. All contributions for the new plan are held and managed by Scottish Equitable plc (a subsidiary of Aegon). OAPIL has no ongoing liability to the funds held by Aegon in respect of the employees.
For the pension scheme, which closed on 30 June 2010, contributions were made in accordance with the rules of the scheme and the advice of independent qualified actuaries on the basis of triennial valuations. The most recent valuation was at 31 March 2016 using the projected unit method. The actuarial valuation at 31 March 2016 showed a funding level of 74% on an ongoing basis based on a market value of assets of £675m at that date. The most significant assumptions made by the actuary in carrying out this valuation were the assumptions of 2.9% and 0.6% above the gilt curve for the pre retirement and post retirement discount rates. A special employer's contribution of £17.9m was made during the year to 31 March 2019 (2018: £16.6m; 1 April 2017: £17.3m). OAPIL is expected to make a contribution of £15.5m by 31 March 2020. The weighted average duration of the deferred benefit obligation is 16.5 years. The next actuarial valuation is being carried out as at 31 March 2019 but the results will not be available at the date of signing these financial statements.
The scheme holds no assets that are issued or owned by OAPIL.
Management assessed the expected return on scheme assets based on a review of past returns and professional advice on the level of future returns.
Hong Kong registered schemeOve Arup & Partners Hong Kong Limited ("OAPHKL") operates a Hong Kong registered retirement scheme that has a defined benefit section. The defined benefit section was closed to new entrants with effect from 1 January 2011 and was frozen for service accruals for existing members with effect from 1 January 2012. Actuarial funding valuations are performed by an independent qualified actuary. The law requires an actuarial funding valuation to be conducted annually if the scheme is insolvent and tri-annually if the scheme is solvent.
The latest actuarial funding valuation of the scheme was performed as at 31 March 2018. The scheme’s asset as at 31 March 2018 on an ongoing basis represented 95% of the actuarially calculated liabilities for benefits that had accrued to members. The scheme’s asset had a market value of £33.3m as at that date. The key financial assumptions made by the actuary in carrying out this valuation include a discount rate of 5.5% p.a. and a salary inflation of 4.5% p.a. OAPHKL made a contribution of £0.7m to the defined benefit section during the year (2018: £0.7m; 1 April 2017: £1.3m), and is expected to make £0.6m by 31 March 2020. The next actuarial funding valuation is scheduled to be carried out no later than 31 March 2021.
Arup Group Limited and its subsidiary undertakings | Financial Statements and Reports for the year ended 31 March 2019
50 Notes to the financial statements for the year ended 31 March 2019
Notes to the financial statements (continued)For the year ended 31 March 2019
32 Post-employment benefit liabilities (continued)32.1 Defined benefit pension plans (continued) Defined benefit retirement schemes (continued)
Ireland registered schemeOve Arup & Partners Ireland Limited ("OAPI") operates an Ireland registered defined benefit pension scheme and a defined contribution scheme.
The assets of the defined benefit scheme are held in separate trustee administered funds. The pension cost, in respect of the defined benefit scheme, has been assessed in accordance with the advice of an independent qualified actuary using the attained age method of funding which provides for benefits over the working lifetime of the membership. Formal actuarial valuations are carried out every three years. The latest full valuation was at 1 April 2016. The results of that valuation confirmed that the scheme had a past service surplus of £1.8m and a funding ratio of 103%. This report is not available for public inspection. A special employer's contribution of £0.043m was made during the year to 31 March 2019 (2018: £0.040m; 1 April 2017: £0.036m). OAPI does not expect to make a contribution in the year ending 31 March 2020 inline with the recommendation from the 2016 triennial actuarial valuation.
Unfunded schemes
Japan unfunded schemeOve Arup & Partners Japan Limited provides a retirement allowance to employees. Provision is made in accordance with the advice of independent qualified actuaries. The most recent valuation was at 31 March 2019 using the projected unit method. The most significant assumptions made by the actuary in carrying out this valuation were that the discount rate would be 0.4% (2018: 0.5%; 1 April 2017: 0.6%) per annum and that salary inflation would be 4.0% (2018 & 1 April 2017: 4.0%) per annum. There was an employer contribution for the year to 31 March 2019 of £30,547 (2018: £21,950; 1 April 2017: £29,073).
Philippines unfunded schemeOve Arup & Partners Hong Kong Limited - Philippines branch operates a retirement benefit scheme in the Philippines which requires an actuarial valuation yearly. As at 31 March 2019 the scheme was valued at £0.01m (2018: £0.05m; 1 April 2017: £0.11m ) which is held within post-employment benefit liabilities. The actuarial gain for the year on this scheme was £0.02m (2018: £0.03m; 1 April 2017: £0.05m) which has been recorded in the statement of comprehensive income. As the liability is not material to the Company, no additional disclosure is included within these financial statements.
Mauritius unfunded schemeArup (Mauritius) Ltd provides a retirement allowance to its employees. Provision is made in accordance with the advice of independent qualified actuaries. The most recent actuarial valuation of the plan assets and the present value of the defined benefit obligations were carried out at 31 March 2019. The pension liability recognised in the financial statements was £0.2m (2018: £0.2m; 1 April 2017: £0.1m).
India unfunded schemeArup India Private Limited ("AIPL") provides a retirement allowance 'gratuity' to its employees. Gratuity is payable to all eligible employees of AIPL in terms of provisions of the payment of Gratuity Act. Valuations in respect of gratuity have been carried out by an independent actuary, as at the balance sheet date, under the projected Unit Credit Method. The pension liability recognised in the financial statements was £0.2m (2018: £0.1m; 1 April 2017: £0.2m).

Arup Group Limited and its subsidiary undertakings | Financial Statements and Reports for the year ended 31 March 2019
51Notes to the financial statements for the year ended 31 March 2019
Notes to the financial statements (continued)For the year ended 31 March 2019
32 Post-employment benefit liabilities (continued)32.1 Defined benefit pension plans (continued) Further disclosure on the Schemes
The amounts recognised in the balance sheet are determined as follows:
2019£m
2018£m
1 April 2017
£m
Present value of funded obligations (1,023.5) (984.6) (1,032.3)Fair value of plan assets 922.4 876.7 875.0 Deficit of funded plans (101.1) (107.9) (157.3)
The movement in the defined benefit liability over the year is as follows:Present value of obligation
Fair value of plan assets Total
£m £m £m
At 1 April 2017 (1,032.3) 875.0 (157.3)Administration expenses - (0.9) (0.9)Past service cost (incl. curtailments) - - - Interest (expense) / income (25.3) 21.5 (3.8)
(1,057.6) 895.6 (162.0)Remeasurements:
- Return on plan assets, excluding amounts included in interest income - 13.7 13.7 - Gains from change in demographic assumptions 7.5 - 7.5 - Gains from change in financial assumptions 21.1 - 21.1 - Experience losses (8.4) - (8.4)
20.2 13.7 33.9
Contributions: Employers - 17.3 17.3 Payments from plans: benefit payments 46.9 (46.9) - Adjustment for exchange differences 5.9 (3.0) 2.9 At 31 March 2018 (984.6) 876.7 (107.9)
Administration expenses - (1.1) (1.1)Past service cost (incl. curtailments) (6.4) - (6.4)Interest (expense) / income (25.2) 22.6 (2.6)
(1,016.2) 898.2 (118.0)Remeasurements:- Return on plan assets, excluding amounts included in interest income - 39.3 39.3 - Gains from change in demographic assumptions 21.3 - 21.3 - Losses from change in financial assumptions (60.3) - (60.3)- Experience losses (0.7) - (0.7)
(39.7) 39.3 (0.4)
Contributions: Employers - 18.6 18.6 Payments from plans: benefit payments 35.3 (35.3) - Adjustment for exchange differences (2.9) 1.6 (1.3)At 31 March 2019 (1,023.5) 922.4 (101.1)
Post service cost (incl. curtailments) relates to the provision of £6.4m (2018: nil) for the impact of Guaranteed Minimum Pension equalisation.

Arup Group Limited and its subsidiary undertakings | Financial Statements and Reports for the year ended 31 March 2019
52 Notes to the financial statements for the year ended 31 March 2019
Notes to the financial statements (continued)For the year ended 31 March 2019
32 Post-employment benefit liabilities (continued)32.1 Defined benefit pension plans (continued) Further disclosure on the Schemes (continued)The defined benefit obligation and plan assets are composed by country as follows:
UK Hong Kong
2019 20181 April
2017 2019 20181 April
2017 £m £m £m £m £m £m
Present value of obligations (919.7) (879.5) (917.0) (51.1) (49.5) (62.9)Fair value of plan assets 829.3 782.3 779.1 31.3 33.3 36.1
(90.4) (97.2) (137.9) (19.8) (16.2) (26.8)
Ireland
2019 20181 April
2017 £m £m £m
Present value of obligations (52.8) (55.6) (52.4)Fair value of plan assets 61.8 61.1 59.8
9.0 5.5 7.4
The significant actuarial assumptions were as follows:UK Hong Kong
2019 20181 April
2017 2019 20181 April
2017
Discount rate 2.4% 2.7% 2.6% 1.6% 2.0% 1.7%Salary growth rate N/A N/A N/A 4.0% 4.5% 4.0% / 4.5%*Retail Price Index inflation 3.2% 3.1% 3.2% 2.5% 2.5% 2.5%Consumer Price Index inflation 2.1% 1.9% 1.9% N/A N/A N/APension growth rate:
- Pre 88 Guaranteed Minimum Pension 0.0% 0.0% 0.0% N/A N/A N/A- Post 88 Guaranteed Minimum Pension 1.8% 1.7% 1.7% N/A N/A N/A- NGMP accrued before 1 October 2006 (5% LPI) 3.0% 2.9% 3.0% N/A N/A N/A- Pension accrued after 30 September 2016 (2.5% LPI) 1.9% 1.9% 1.9% N/A N/A N/A
Ireland
2019 20181 April
2017
Discount rate 1.5% 1.7% 1.9%Salary growth rate N/A N/A N/ARetail Price Index inflation 1.3% 1.7% 1.6%Consumer Price Index inflation N/A N/A N/APension growth rate:- Pre 88 Guaranteed Minimum Pension N/A N/A N/A- Post 88 Guaranteed Minimum Pension N/A N/A N/A- NGMP accrued before 1 October 2006 (5% LPI) N/A N/A N/A- Pension accrued after 30 September 2016 (2.5% LPI) N/A N/A N/A
*4.0% for the first year, 4.5% p.a. thereafter.

Arup Group Limited and its subsidiary undertakings | Financial Statements and Reports for the year ended 31 March 2019
53Notes to the financial statements for the year ended 31 March 2019
Notes to the financial statements (continued)For the year ended 31 March 2019
32 Post-employment benefit liabilities (continued)32.1 Defined benefit pension plans (continued) Further disclosure on the Schemes (continued)
Mortality %
UK113% S2 tables (2018: 113% S2 tables; 1 April 2017: 113% S2 table) for males and 114% S2 tables (2018: 114% S2 tables; 1 April 2017: 114% S2 tables) for females using the CMI 2018 (2018: CMI 2017; 1 April 2017: CMI 2016) projections, allowing for LTR of 1% per annum.
Hong Kong2019 Hong Kong
Life Tables 2017 (p.a.)2018 Hong Kong
Life Tables 2016 (p.a.)1 April 2017 Hong Kong Life Tables 2015 (p.a.)
Attained age Male Female Male Female Male Female25 0.040 0.021 0.040 0.018 0.035 0.01530 0.046 0.022 0.055 0.022 0.042 0.02235 0.072 0.032 0.073 0.031 0.063 0.03340 0.114 0.052 0.104 0.059 0.119 0.06045 0.170 0.094 0.163 0.092 0.170 0.10050 0.263 0.155 0.253 0.142 0.253 0.15355 0.408 0.216 0.426 0.216 0.420 0.22960 0.653 0.318 0.700 0.335 0.669 0.33465 1.010 0.492 1.055 0.499 1.039 0.509
Ireland88% of ILT15 tables (males) and 91% of ILT15 tables (females) with CSO improvements from 2011 onwards (2018: no change; 1 April 2017: no change).
Cash commutation for 2019, 2018 and 2017For the UK, 25% of members' pensions are assumed to be taken as cash on current terms, for Hong Kong a 100% lump sum is taken on retirement and for Ireland no cash commutations are assumed to be taken.
Assumed life expectations on retirement Assumptions regarding future mortality are set based on actuarial advice in accordance with published statistics and experience in each territory. These assumptions translate into an average life expectancy in years for a pensioner retiring at age 65 for the UK and age 62 for Ireland. Assumed life expectation is not shown for Hong Kong as 100% of their pension scheme benefit is paid on retirement.
UK Ireland
2019 2018 1 April
2017 2019 2018 1 April
2017 Years Years Years Years Years Years
Retiring at the end of the reporting period:- Male 20.4 20.9 21.0 24.4 24.2 24.1 - Female 22.2 22.7 22.8 26.9 26.8 26.7
Retiring 20 years after the end of the reporting period:
- Male 21.4 21.9 22.1 26.4 26.3 26.2 - Female 23.4 23.9 24.0 28.7 28.6 28.5
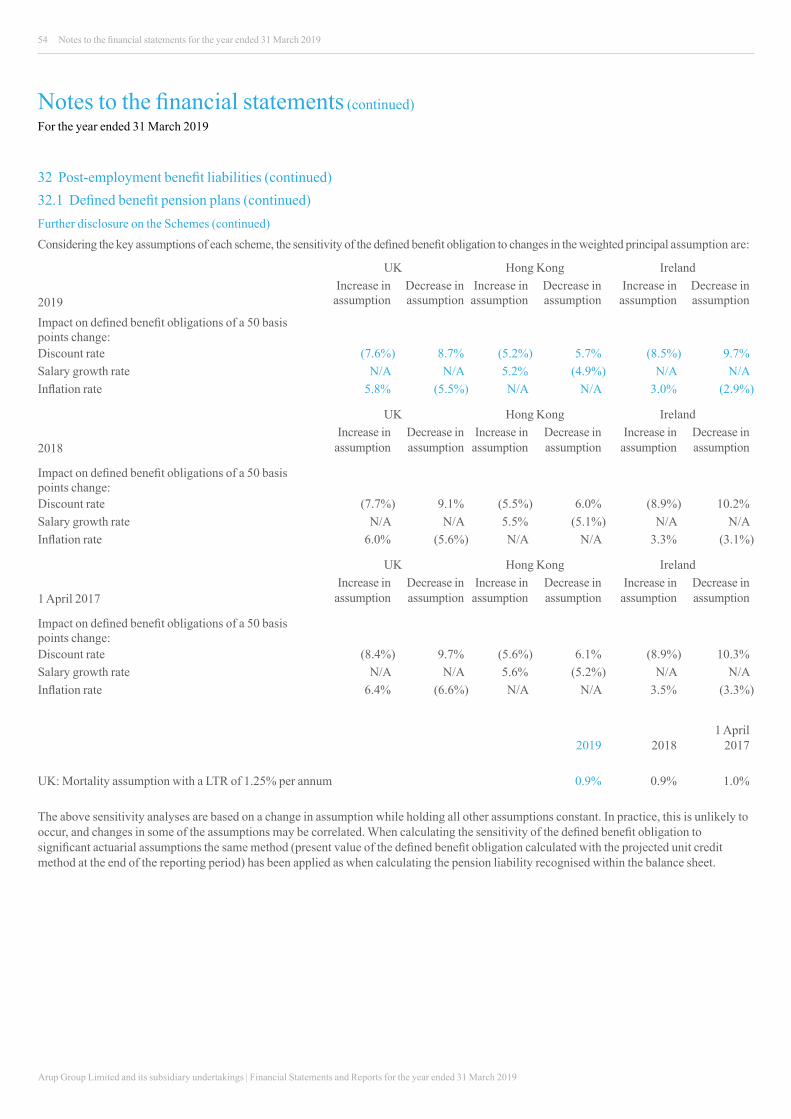
Arup Group Limited and its subsidiary undertakings | Financial Statements and Reports for the year ended 31 March 2019
54 Notes to the financial statements for the year ended 31 March 2019
Notes to the financial statements (continued)For the year ended 31 March 2019
32 Post-employment benefit liabilities (continued)32.1 Defined benefit pension plans (continued) Further disclosure on the Schemes (continued)Considering the key assumptions of each scheme, the sensitivity of the defined benefit obligation to changes in the weighted principal assumption are:
UK Hong Kong Ireland
2019Increase in assumption
Decrease in assumption
Increase in assumption
Decrease in assumption
Increase in assumption
Decrease in assumption
Impact on defined benefit obligations of a 50 basis points change:Discount rate (7.6%) 8.7% (5.2%) 5.7% (8.5%) 9.7%Salary growth rate N/A N/A 5.2% (4.9%) N/A N/AInflation rate 5.8% (5.5%) N/A N/A 3.0% (2.9%)
UK Hong Kong Ireland
2018Increase in
assumptionDecrease in assumption
Increase in assumption
Decrease in assumption
Increase in assumption
Decrease in assumption
Impact on defined benefit obligations of a 50 basis points change:Discount rate (7.7%) 9.1% (5.5%) 6.0% (8.9%) 10.2%Salary growth rate N/A N/A 5.5% (5.1%) N/A N/AInflation rate 6.0% (5.6%) N/A N/A 3.3% (3.1%)
UK Hong Kong Ireland
1 April 2017Increase in
assumptionDecrease in assumption
Increase in assumption
Decrease in assumption
Increase in assumption
Decrease in assumption
Impact on defined benefit obligations of a 50 basis points change:Discount rate (8.4%) 9.7% (5.6%) 6.1% (8.9%) 10.3%Salary growth rate N/A N/A 5.6% (5.2%) N/A N/AInflation rate 6.4% (6.6%) N/A N/A 3.5% (3.3%)
2019 20181 April
2017
UK: Mortality assumption with a LTR of 1.25% per annum 0.9% 0.9% 1.0%
The above sensitivity analyses are based on a change in assumption while holding all other assumptions constant. In practice, this is unlikely to occur, and changes in some of the assumptions may be correlated. When calculating the sensitivity of the defined benefit obligation to significant actuarial assumptions the same method (present value of the defined benefit obligation calculated with the projected unit credit method at the end of the reporting period) has been applied as when calculating the pension liability recognised within the balance sheet.
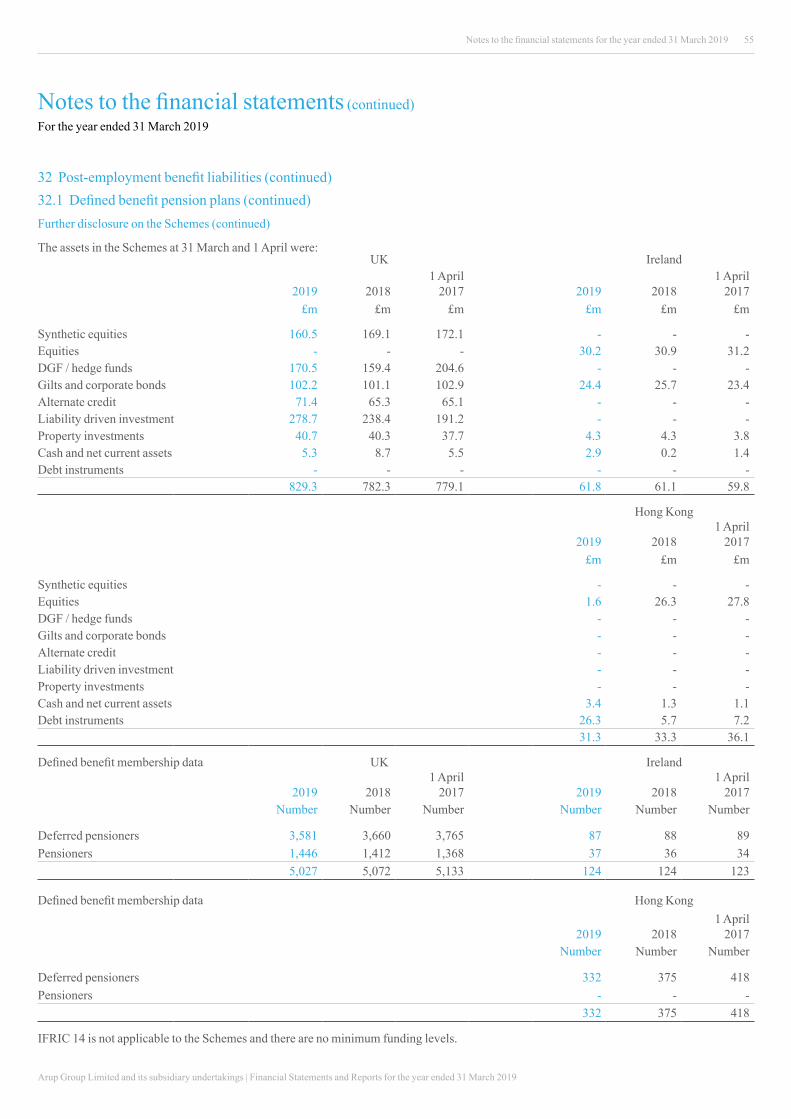
Arup Group Limited and its subsidiary undertakings | Financial Statements and Reports for the year ended 31 March 2019
55Notes to the financial statements for the year ended 31 March 2019
Notes to the financial statements (continued)For the year ended 31 March 2019
32 Post-employment benefit liabilities (continued)32.1 Defined benefit pension plans (continued) Further disclosure on the Schemes (continued)
The assets in the Schemes at 31 March and 1 April were: UK Ireland
2019 20181 April
2017 2019 20181 April
2017 £m £m £m £m £m £m
Synthetic equities 160.5 169.1 172.1 - - - Equities - - - 30.2 30.9 31.2 DGF / hedge funds 170.5 159.4 204.6 - - - Gilts and corporate bonds 102.2 101.1 102.9 24.4 25.7 23.4 Alternate credit 71.4 65.3 65.1 - - - Liability driven investment 278.7 238.4 191.2 - - - Property investments 40.7 40.3 37.7 4.3 4.3 3.8 Cash and net current assets 5.3 8.7 5.5 2.9 0.2 1.4 Debt instruments - - - - - -
829.3 782.3 779.1 61.8 61.1 59.8
Hong Kong
2019 20181 April
2017 £m £m £m
Synthetic equities - - - Equities 1.6 26.3 27.8 DGF / hedge funds - - - Gilts and corporate bonds - - - Alternate credit - - - Liability driven investment - - - Property investments - - - Cash and net current assets 3.4 1.3 1.1 Debt instruments 26.3 5.7 7.2
31.3 33.3 36.1
Defined benefit membership data UK Ireland
2019 20181 April
2017 2019 20181 April
2017 Number Number Number Number Number Number
Deferred pensioners 3,581 3,660 3,765 87 88 89 Pensioners 1,446 1,412 1,368 37 36 34
5,027 5,072 5,133 124 124 123
Defined benefit membership data Hong Kong
2019 20181 April
2017 Number Number Number
Deferred pensioners 332 375 418 Pensioners - - -
332 375 418
IFRIC 14 is not applicable to the Schemes and there are no minimum funding levels.
Arup Group Limited and its subsidiary undertakings | Financial Statements and Reports for the year ended 31 March 2019
56 Notes to the financial statements for the year ended 31 March 2019
Notes to the financial statements (continued)For the year ended 31 March 2019
32 Post-employment benefit liabilities (continued)32.2 Post-employment benefit liabilities – risksThrough its defined benefit pension Schemes the Group is exposed to a number of risks, the most significant of which are detailed below:
Asset volatilityThe retirement benefit liabilities of the Schemes are calculated using a discount rate set with reference to corporate bond yields. If the Schemes' assets underperform this yield, this will create a deficit. The Schemes hold a significant proportion of synthetic equities and equities, which are expected to outperform corporate bonds in the long term while exposing the Group to greater volatility and valuation risk in the short term.
Changes in bond yieldsA decrease in corporate bond yields will increase the Schemes' liabilities. This would be partially offset by an increase in the value of the Schemes’ bond holdings.
Inflation riskSome of the Group pension obligations are linked to inflation, and higher inflation will lead to higher liabilities (although, in most cases, caps on the level of inflationary increases are in place to protect the Schemes against extreme inflation). Whilst some of the Schemes’ assets are real in nature and so loosely correlated with inflation (e.g. synthetic equities, equities, index-linked gilts), some of the Schemes’ assets are not expected to move in line with inflation (e.g. corporate bonds) and therefore an increase in inflation is likely to also increase the deficit.
Life expectancyThe majority of the Schemes' obligations are to provide benefits for the life of the member, so increases in life expectancy will result in an increase in the Schemes' liabilities.
Credit riskThe Schemes invest in pooled investment vehicles and are therefore exposed to direct credit risk in relation to the solvency of the investment manager and custodian of those funds.
Direct credit risk arising from pooled investment vehicles is mitigated by the underlying assets of the pooled funds being ring-fenced from the investment managers, the regulatory environments in which the pooled fund managers operate and diversification of the Schemes' investments across a number of pooled funds. The Schemes’ Trustees, with the help of their advisers, carry out due diligence checks prior to the appointment of any new investment manager or fund, and monitor for changes to the operating environment of the existing investments either through reports from the investment consultants or questioning in meetings with the managers. Due to their nature pooled funds are unrated.
Currency riskThe Schemes are also subject to currency risk indirectly because they invest in overseas investments. This is particularly the case in the UK’s synthetic equity funds. The UK scheme holds overseas synthetic equities funds exposure of £160.5m (2018: £169.1m; 1 April 2017: £172.1m) of which 50% of the currency risk is hedged. If the hedged / unhedged allocation for any of the overseas synthetic equity region lies more than 5% away from the 50% / 50% split, on a weekly basis the investment manager will be required to rebalance the split for that region.
The bonds and the diversified growth and hedge funds will vary the degree to which they hedge currency risk. Currency risk is accepted where this facilitates overseas investments, taking into account the risks and expected reward.
Counterparty riskThe Schemes are exposed to collateral management and counterparty risk in relation to the derivative instruments used within its investment arrangements. The collateral requirement and counterparty exposure will be managed by the Scheme’s investment manager and regularly monitored by the relevant Trustees.
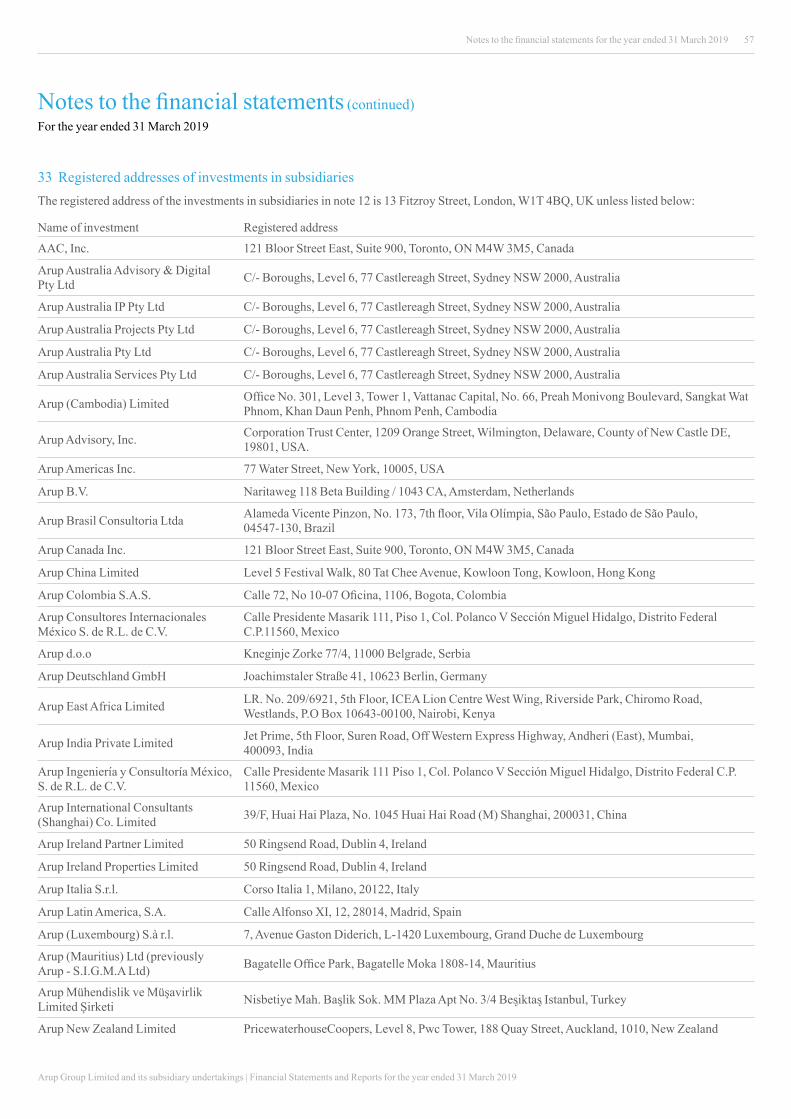
Arup Group Limited and its subsidiary undertakings | Financial Statements and Reports for the year ended 31 March 2019
57Notes to the financial statements for the year ended 31 March 2019
Notes to the financial statements (continued)For the year ended 31 March 2019
33 Registered addresses of investments in subsidiariesThe registered address of the investments in subsidiaries in note 12 is 13 Fitzroy Street, London, W1T 4BQ, UK unless listed below:
Name of investment Registered address
AAC, Inc. 121 Bloor Street East, Suite 900, Toronto, ON M4W 3M5, Canada
Arup Australia Advisory & Digital Pty Ltd C/- Boroughs, Level 6, 77 Castlereagh Street, Sydney NSW 2000, Australia
Arup Australia IP Pty Ltd C/- Boroughs, Level 6, 77 Castlereagh Street, Sydney NSW 2000, Australia
Arup Australia Projects Pty Ltd C/- Boroughs, Level 6, 77 Castlereagh Street, Sydney NSW 2000, Australia
Arup Australia Pty Ltd C/- Boroughs, Level 6, 77 Castlereagh Street, Sydney NSW 2000, Australia
Arup Australia Services Pty Ltd C/- Boroughs, Level 6, 77 Castlereagh Street, Sydney NSW 2000, Australia
Arup (Cambodia) Limited Office No. 301, Level 3, Tower 1, Vattanac Capital, No. 66, Preah Monivong Boulevard, Sangkat Wat Phnom, Khan Daun Penh, Phnom Penh, Cambodia
Arup Advisory, Inc. Corporation Trust Center, 1209 Orange Street, Wilmington, Delaware, County of New Castle DE, 19801, USA.
Arup Americas Inc. 77 Water Street, New York, 10005, USA
Arup B.V. Naritaweg 118 Beta Building / 1043 CA, Amsterdam, Netherlands
Arup Brasil Consultoria Ltda Alameda Vicente Pinzon, No. 173, 7th floor, Vila Olímpia, São Paulo, Estado de São Paulo, 04547-130, Brazil
Arup Canada Inc. 121 Bloor Street East, Suite 900, Toronto, ON M4W 3M5, Canada
Arup China Limited Level 5 Festival Walk, 80 Tat Chee Avenue, Kowloon Tong, Kowloon, Hong Kong
Arup Colombia S.A.S. Calle 72, No 10-07 Oficina, 1106, Bogota, Colombia
Arup Consultores Internacionales México S. de R.L. de C.V.
Calle Presidente Masarik 111, Piso 1, Col. Polanco V Sección Miguel Hidalgo, Distrito Federal C.P.11560, Mexico
Arup d.o.o Kneginje Zorke 77/4, 11000 Belgrade, Serbia
Arup Deutschland GmbH Joachimstaler Straße 41, 10623 Berlin, Germany
Arup East Africa Limited LR. No. 209/6921, 5th Floor, ICEA Lion Centre West Wing, Riverside Park, Chiromo Road, Westlands, P.O Box 10643-00100, Nairobi, Kenya
Arup India Private Limited Jet Prime, 5th Floor, Suren Road, Off Western Express Highway, Andheri (East), Mumbai, 400093, India
Arup Ingeniería y Consultoría México, S. de R.L. de C.V.
Calle Presidente Masarik 111 Piso 1, Col. Polanco V Sección Miguel Hidalgo, Distrito Federal C.P. 11560, Mexico
Arup International Consultants (Shanghai) Co. Limited 39/F, Huai Hai Plaza, No. 1045 Huai Hai Road (M) Shanghai, 200031, China
Arup Ireland Partner Limited 50 Ringsend Road, Dublin 4, Ireland
Arup Ireland Properties Limited 50 Ringsend Road, Dublin 4, Ireland
Arup Italia S.r.l. Corso Italia 1, Milano, 20122, Italy
Arup Latin America, S.A. Calle Alfonso XI, 12, 28014, Madrid, Spain
Arup (Luxembourg) S.à r.l. 7, Avenue Gaston Diderich, L-1420 Luxembourg, Grand Duche de Luxembourg
Arup (Mauritius) Ltd (previously Arup - S.I.G.M.A Ltd) Bagatelle Office Park, Bagatelle Moka 1808-14, Mauritius
Arup Mühendislik ve Müşavirlik Limited Şirketi Nisbetiye Mah. Baᶊlik Sok. MM Plaza Apt No. 3/4 Beᶊiktaᶊ Istanbul, Turkey
Arup New Zealand Limited PricewaterhouseCoopers, Level 8, Pwc Tower, 188 Quay Street, Auckland, 1010, New Zealand
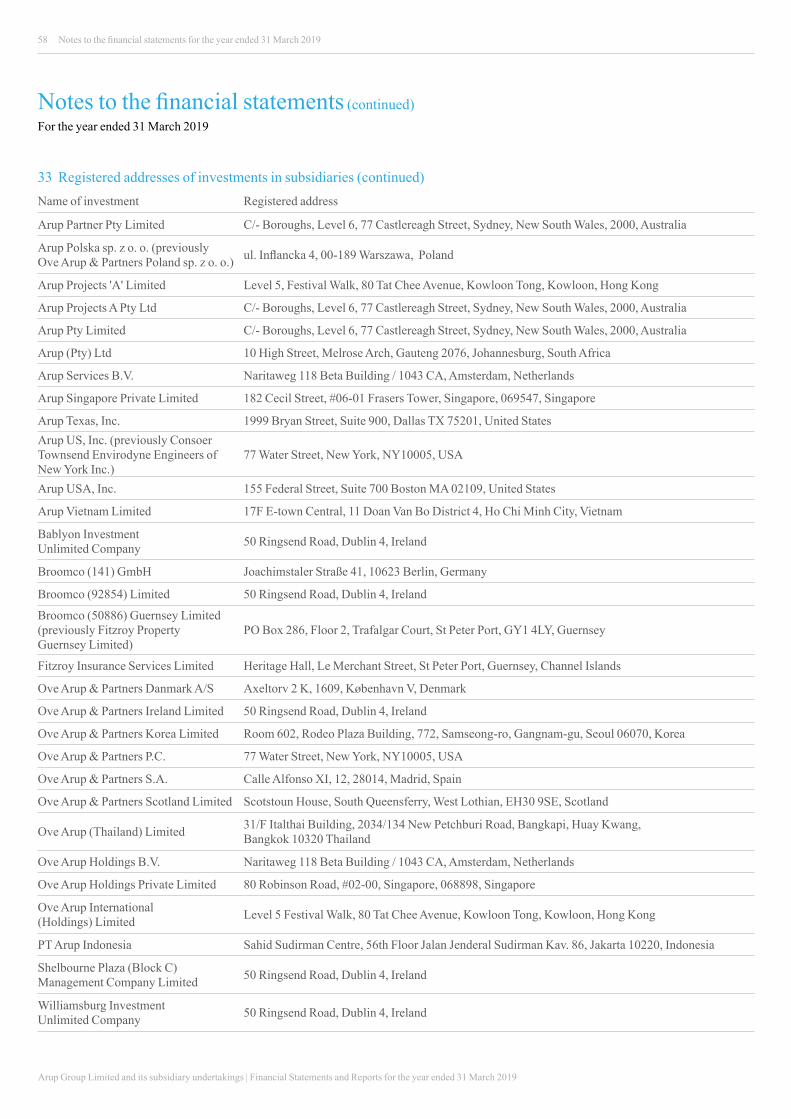
Arup Group Limited and its subsidiary undertakings | Financial Statements and Reports for the year ended 31 March 2019
58
Arup Partner Pty Limited C/- Boroughs, Level 6, 77 Castlereagh Street, Sydney, New South Wales, 2000, Australia
Arup Polska sp. z o. o. (previously Ove Arup & Partners Poland sp. z o. o.) ul. Inflancka 4, 00-189 Warszawa, Poland
Arup Projects 'A' Limited Level 5, Festival Walk, 80 Tat Chee Avenue, Kowloon Tong, Kowloon, Hong Kong
Arup Projects A Pty Ltd C/- Boroughs, Level 6, 77 Castlereagh Street, Sydney, New South Wales, 2000, Australia
Arup Pty Limited C/- Boroughs, Level 6, 77 Castlereagh Street, Sydney, New South Wales, 2000, Australia
Arup (Pty) Ltd 10 High Street, Melrose Arch, Gauteng 2076, Johannesburg, South Africa
Arup Services B.V. Naritaweg 118 Beta Building / 1043 CA, Amsterdam, Netherlands
Arup Singapore Private Limited 182 Cecil Street, #06-01 Frasers Tower, Singapore, 069547, Singapore
Arup Texas, Inc. 1999 Bryan Street, Suite 900, Dallas TX 75201, United StatesArup US, Inc. (previously Consoer Townsend Envirodyne Engineers of New York Inc.)
77 Water Street, New York, NY10005, USA
Arup USA, Inc. 155 Federal Street, Suite 700 Boston MA 02109, United States
Arup Vietnam Limited 17F E-town Central, 11 Doan Van Bo District 4, Ho Chi Minh City, Vietnam
Bablyon Investment Unlimited Company 50 Ringsend Road, Dublin 4, Ireland
Broomco (141) GmbH Joachimstaler Straße 41, 10623 Berlin, Germany
Broomco (92854) Limited 50 Ringsend Road, Dublin 4, Ireland
Broomco (50886) Guernsey Limited (previously Fitzroy Property Guernsey Limited)
PO Box 286, Floor 2, Trafalgar Court, St Peter Port, GY1 4LY, Guernsey
Fitzroy Insurance Services Limited Heritage Hall, Le Merchant Street, St Peter Port, Guernsey, Channel Islands
Ove Arup & Partners Danmark A/S Axeltorv 2 K, 1609, København V, Denmark
Ove Arup & Partners Ireland Limited 50 Ringsend Road, Dublin 4, Ireland
Ove Arup & Partners Korea Limited Room 602, Rodeo Plaza Building, 772, Samseong-ro, Gangnam-gu, Seoul 06070, Korea
Ove Arup & Partners P.C. 77 Water Street, New York, NY10005, USA
Ove Arup & Partners S.A. Calle Alfonso XI, 12, 28014, Madrid, Spain
Ove Arup & Partners Scotland Limited Scotstoun House, South Queensferry, West Lothian, EH30 9SE, Scotland
Ove Arup (Thailand) Limited 31/F Italthai Building, 2034/134 New Petchburi Road, Bangkapi, Huay Kwang, Bangkok 10320 Thailand
Ove Arup Holdings B.V. Naritaweg 118 Beta Building / 1043 CA, Amsterdam, Netherlands
Ove Arup Holdings Private Limited 80 Robinson Road, #02-00, Singapore, 068898, Singapore
Ove Arup International (Holdings) Limited Level 5 Festival Walk, 80 Tat Chee Avenue, Kowloon Tong, Kowloon, Hong Kong
PT Arup Indonesia Sahid Sudirman Centre, 56th Floor Jalan Jenderal Sudirman Kav. 86, Jakarta 10220, Indonesia
Shelbourne Plaza (Block C) Management Company Limited 50 Ringsend Road, Dublin 4, Ireland
Williamsburg Investment Unlimited Company 50 Ringsend Road, Dublin 4, Ireland
Notes to the financial statements for the year ended 31 March 2019
Notes to the financial statements (continued)For the year ended 31 March 2019
33 Registered addresses of investments in subsidiaries (continued) Name of investment Registered address

R E G I S T E R E D O F F I C E
Arup Group13 Fitzroy Street London, W1T 4BQ United Kingdom
Related Documents