Financial Statements 2018

Welcome message from author
This document is posted to help you gain knowledge. Please leave a comment to let me know what you think about it! Share it to your friends and learn new things together.
Transcript

FinancialStatements2018

02 Airbus / Financial Statements 2018
FinancialStatements
03 Airbus / Financial Statements 2018
1Airbus SE IFRS Consolidated Financial Statements
2Notes to the IFRSConsolidated Financial Statements
3Airbus SE IFRS Company Financial Statements
4Notes to the IFRS Company Financial Statements
5Other Supplementary Information Including the Independent Auditor’s Report

Chapter
04 Airbus / Financial Statements 2018
1
05 Airbus / Financial Statements 2018
Airbus SE – IFRS Consolidated Income Statement for the years ended 31 December 2018 and 2017 06
Airbus SE – IFRS Consolidated Statement of Comprehensive Income for the years ended 31 December 2018 and 2017 07
Airbus SE – IFRS Consolidated Statement of Financial Position for the years ended 31 December 2018 and 2017 08
Airbus SE – IFRS Consolidated Statement of Cash Flows for the years ended 31 December 2018 and 2017 10
Airbus SE – IFRS Consolidated Statement of Changes in Equity for the years ended 31 December 2018 and 2017 11
1Airbus SE IFRS Consolidated Financial Statements
06 Airbus / Financial Statements 2018
Airbus SE – IFRS Consolidated Financial Statements /
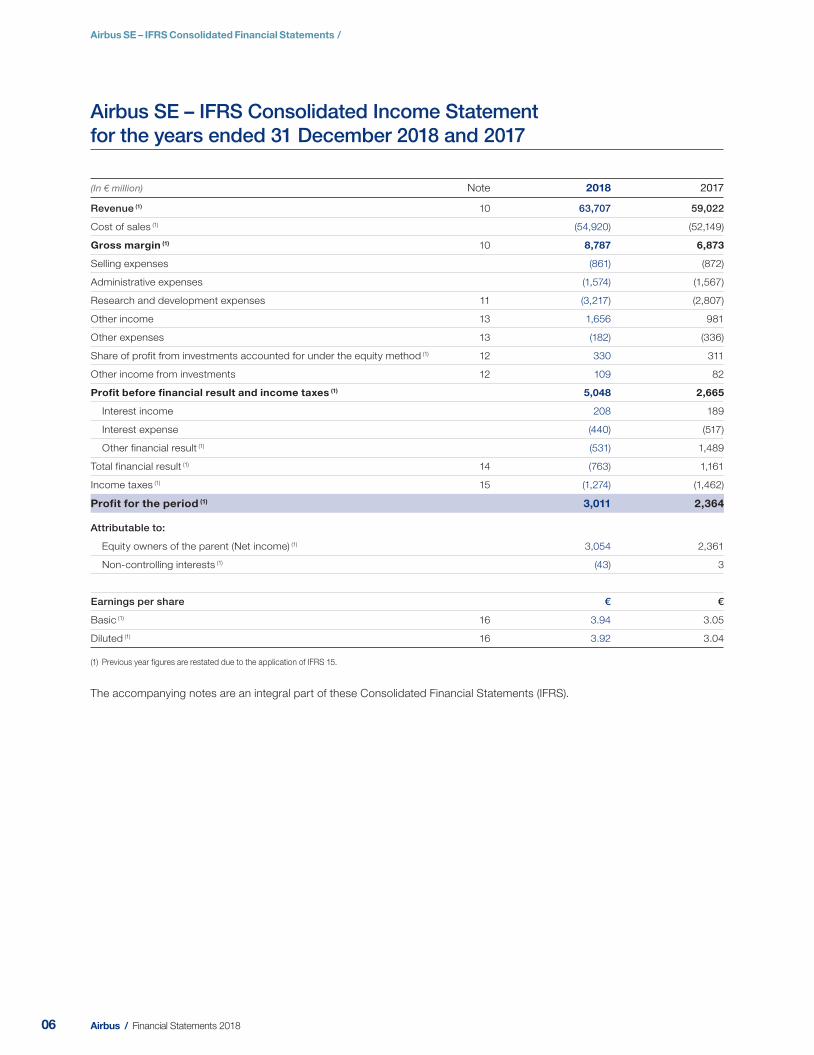
Airbus SE – IFRS Consolidated Income Statementfor the years ended 31 December 2018 and 2017
(I n € million) Note 2018 201 7
Revenue (1) 10 63,707 59,022
Cost of sales (1) (54,920) (52,149)
Gross margin (1) 10 8,787 6,873
Selling expenses (861) (872)
Administrative expenses (1,574) (1,567)
Research and development expenses 11 (3,217) (2,807)
Other income 13 1,656 981
Other expenses 13 (182) (336)
Share of profit from investments accounted for under the equity method (1) 12 330 311
Other income from investments 12 109 82
Profit before financial result and income taxes (1) 5,048 2,665
Interest income 208 189
Interest expense (440) (517)
Other financial result (1) (531) 1,489
Total financial result (1) 14 (763) 1,161
Income taxes (1) 15 (1,274) (1,462)
Profit for the period (1) 3,011 2,364
Attributable to:
Equity owners of the parent (Net income) (1) 3,054 2,361
Non-controlling interests (1) (43) 3
Earnings per share € €
Basic (1) 16 3.94 3.05
Diluted (1) 16 3.92 3.04
(1) Previous year figures are restated due to the application of IFRS 15.
The accompanying notes are an integral part of these Consolidated Financial Statements (IFRS).

07 Airbus / Financial Statements 2018
Airbus SE – IFRS Consolidated Financial Statements /
FINANCIAL STATEMENTS 2018
1
Airbus SE – IFRS Consolidated Statement of Comprehensive Income for the years ended 31 D ecember 2018 and 2017
(In € million) Note 2018 2017
Profit for the period (1) 3,011 2,364
Other comprehensive income
Items that will not be reclassified to profit or loss:
Remeasurement of the defined benefit pension plans (552) 116
Change in fair value of financial assets (2) (249) 0
Share of change from investments accounted for under the equity method 3 61
Income tax relating to items that will not be reclassified 15 (2) (26)
Items that may be reclassified to profit or loss:
Foreign currency translation differences for foreign operations 108 (526)
Change in fair value of cash flow hedges 35 (2,959) 10,636
Change in fair value of financial assets (2) (80) 396
Share of change from investments accounted for under the equity method (11) (3)
Income tax relating to items that may be reclassified 15 728 (2,881)
Other comprehensive income, net of tax (3,014) 7,773
Total comprehensive income for the period (1) (3) 10,137
Attributable to:
Equity owners of the parent (1) 72 10,099
Non-controlling interests (1) (75) 38
(1) Previous year figures are restated due to the application of IFRS 15.
(2) IFRS 9 new classification category (prior year-end: change in fair value of available-for-sale financial assets).
The accompanying notes are an integral part of these Consolidated Financial Statements (IFRS).

08 Airbus / Financial Statements 2018
Airbus SE – IFRS Consolidated Financial Statements /
Airbus SE – IFRS Consolidated Statement of Financial Position for the years ended 31 D ecember 2018 and 2017
(In € million) Note 2018 2017 Opening 2017,
restated
Assets
Non-current assets
Intangible assets 17 16,726 11,629 12,068
Property, plant and equipment 18 16,773 16,610 16,913
Investment property 3 3 5
Investments accounted for under the equity method (1) 7 1,693 1,617 1,569
Other investments and other long-term financial assets 19 3,811 4,204 3,655
Non-current contract assets (1) 20 65 1 0
Non-current other financial assets 23 1,108 2,980 976
Non-current other assets (1) 24 888 975 1,201
Deferred tax assets (1) 15 4,835 4,562 8,080
Non-current securities 34 10,662 10,944 9,897
Total non-current assets (1) 56,564 53,525 54,364
Current assets
Inventories (1) 21 31,891 29,737 28,107
Trade receivables (1) 20 6,078 5,487 6,383
Current portion of other long-term financial assets 19 489 529 522
Current contract assets (1) 20 789 496 469
Current other financial assets 23 1,811 1,979 1,257
Current other assets (1) 24 4,246 2,937 2,613
Current tax assets 1,451 914 1,110
Current securities 34 2,132 1,627 1,551
Cash and cash equivalents 34 9,413 12,016 10,143
Total current assets (1) 58,300 55,722 52,155
Assets and disposal group of assets classified as held for sale 6 334 202 1,148
Total assets (1) 115,198 109,449 107,667
(1) Previous year figures are restated due to the application of IFRS 15.

09 Airbus / Financial Statements 2018
Airbus SE – IFRS Consolidated Financial Statements /
FINANCIAL STATEMENTS 2018
1
(In € million) Note 2018 2017 Opening 2017,
restated
Equity and liabilities
Equity attributable to equity owners of the parent
Capital stock 777 775 773
Share premium 2,941 2,826 2,745
Retained earnings (1) 5,923 4,399 2,891
Accumulated other comprehensive income 134 2,742 (4,845)
Treasury shares (51) (2) (3)
Total equity attributable to equity owners of the parent 9,724 10,740 1,561
Non-controlling interests (1) (5) 2 (5)
Total equity (1) 32 9,719 10,742 1,556
Liabilities
Non-current liabilities
Non-current provisions (1) 22 11,571 9,779 10,178
Long-term financing liabilities 34 7,463 8,984 8,791
Non-current contract liabilities (1) 20 15,832 16,013 14,642
Non-current other financial liabilities (1) 23 8,009 6,704 12,965
Non-current other liabilities (1) 24 460 298 310
Deferred tax liabilities (1) 15 1,318 1,002 1,104
Non-current deferred income (1) 40 42 133
Total non-current liabilities (1) 44,693 42,822 48,123
Current liabilities
Current provisions (1) 22 7,317 6,272 5,941
Short-term financing liabilities 34 1,463 2,212 1,687
Trade liabilities (1) 20 16,237 13,406 12,921
Current contract liabilities (1) 20 26,229 25,943 25,655
Current other financial liabilities (1) 23 2,462 2,050 5,644
Current other liabilities (1) 24 5,288 3,909 3,421
Current tax liabilities 732 1,481 1,126
Current deferred income (1) 626 506 602
Total current liabilities (1) 60,354 55,779 56,997
Disposal group of liabilities classified as held for sale 6 432 106 991
Total liabilities (1) 105,479 98,707 106,111
Total equity and liabilities (1) 115,198 109,449 107,667
(1) Previous year figures are restated due to the application of IFRS 15.
The accompanying notes are an integral part of these Consolidated Financial Statements (IFRS).
10 Airbus / Financial Statements 2018
Airbus SE – IFRS Consolidated Financial Statements /
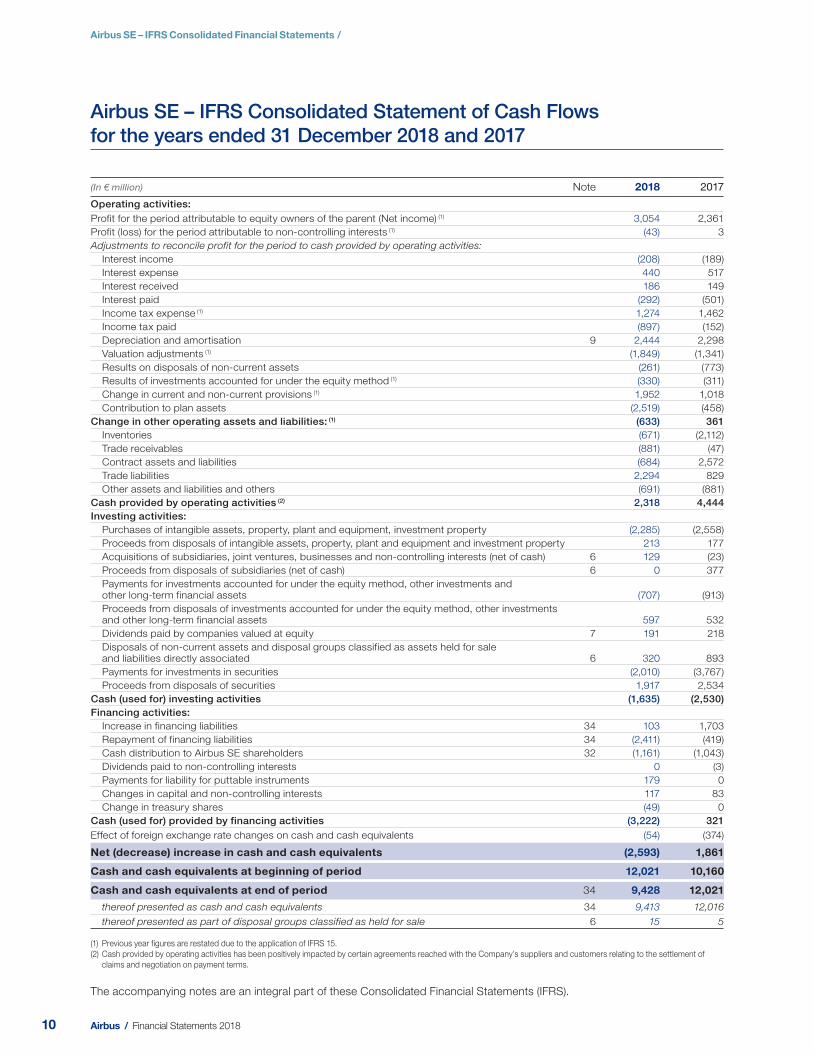
Airbus SE – IFRS Consolidated Statement of Cash Flowsfor the years ended 31 D ecember 2018 and 2017
(In € million) Note 2018 2017
Operating activities: Profit for the period attributable to equity owners of the parent (Net income) (1) 3,054 2,361
Profit (loss) for the period attributable to non-controlling interests (1) (43) 3
Adjustments to reconcile profit for the period to cash provided by operating activities:
Interest income (208) (189)
Interest expense 440 517
Interest received 186 149
Interest paid (292) (501)
Income tax expense (1) 1,274 1,462
Income tax paid (897) (152)
Depreciation and amortisation 9 2,444 2,298
Valuation adjustments (1) (1,849) (1,341)
Results on disposals of non-current assets (261) (773)
Results of investments accounted for under the equity method (1) (330) (311)
Change in current and non-current provisions (1) 1,952 1,018
Contribution to plan assets (2,519) (458)
Change in other operating assets and liabilities: (1) (633) 361 Inventories (671) (2,112)
Trade receivables (881) (47)
Contract assets and liabilities (684) 2,572
Trade liabilities 2,294 829
Other assets and liabilities and others (691) (881)
Cash provided by operating activities (2) 2,318 4,444 Investing activities:
Purchases of intangible assets, property, plant and equipment, investment property (2,285) (2,558)
Proceeds from disposals of intangible assets, property, plant and equipment and investment property 213 177
Acquisitions of subsidiaries, joint ventures, businesses and non-controlling interests (net of cash) 6 129 (23)
Proceeds from disposals of subsidiaries (net of cash) 6 0 377
Payments for investments accounted for under the equity method, other investments and other long-term financial assets (707) (913)
Proceeds from disposals of investments accounted for under the equity method, other investments and other long-term financial assets 597 532
Dividends paid by companies valued at equity 7 191 218
Disposals of non-current assets and disposal groups classified as assets held for sale and liabilities directly associated 6 320 893
Payments for investments in securities (2,010) (3,767)
Proceeds from disposals of securities 1,917 2,534
Cash (used for) investing activities (1,635) (2,530) Financing activities:
Increase in financing liabilities 34 103 1,703
Repayment of financing liabilities 34 (2,411) (419)
Cash distribution to Airbus SE shareholders 32 (1,161) (1,043)
Dividends paid to non-controlling interests 0 (3)
Payments for liability for puttable instruments 179 0
Changes in capital and non-controlling interests 117 83
Change in treasury shares (49) 0
Cash (used for) provided by financing activities (3,222) 321 Effect of foreign exchange rate changes on cash and cash equivalents (54) (374)
Net (decrease) increase in cash and cash equivalents (2,593) 1,861
Cash and cash equivalents at beginning of period 12,021 10,160
Cash and cash equivalents at end of period 34 9,428 12,021
thereof presented as cash and cash equivalents 34 9,413 12,016
thereof presented as part of disposal groups classified as held for sale 6 15 5
(1) Previous year figures are restated due to the application of IFRS 15.
(2) Cash provided by operating activities has been positively impacted by certain agreements reached with the Company’s suppliers and customers relating to the settlement of
claims and negotiation on payment terms.
The accompanying notes are an integral part of these Consolidated Financial Statements (IFRS).
11 Airbus / Financial Statements 2018
Airbus SE – IFRS Consolidated Financial Statements /
FINANCIAL STATEMENTS 2018
1
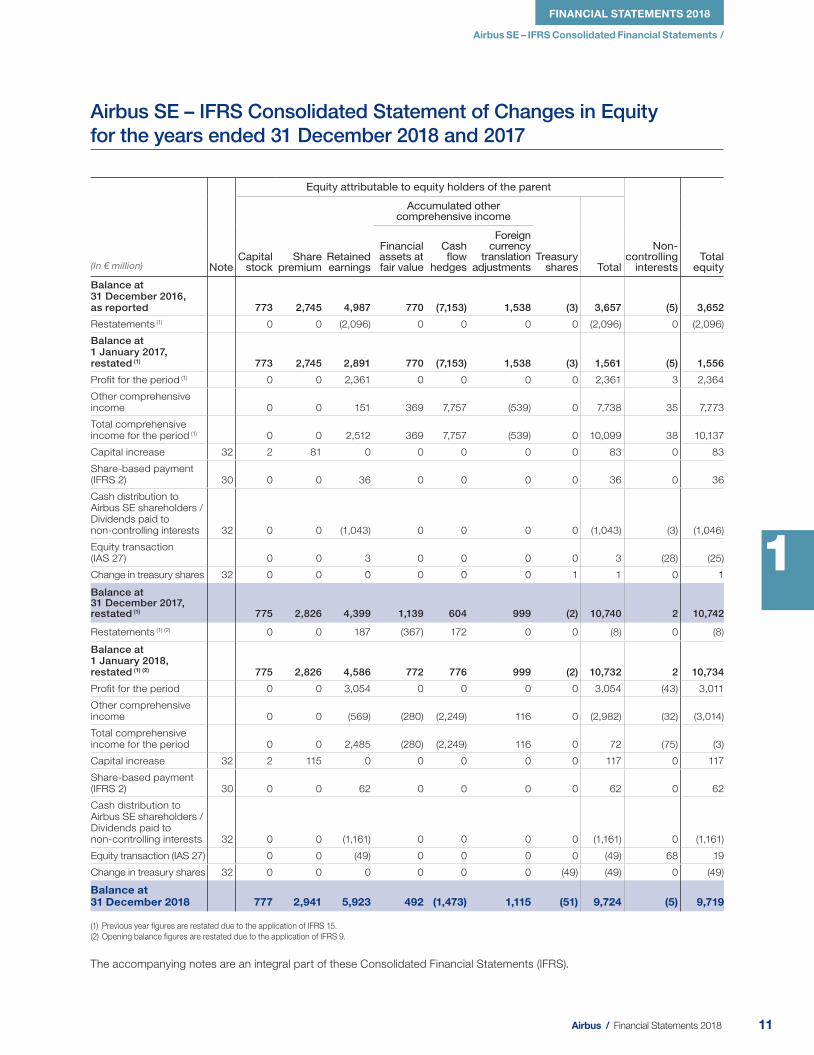
Airbus SE – IFRS Consolidated Statement of Changes in Equity for the years ended 3 1 December 2018 and 20 17
(In € million) Note
Equity attributable to equity holders of the parent
Non-controlling
interests Total
equity Capital
stock Share
premium Retained earnings
Accumulated other comprehensive income
Treasury shares Total
Financial assets at fair value
Cash flow
hedges
Foreign currency
translation adjustments
Balance at 31 December 2016, as reported 773 2,745 4,987 770 (7,153) 1,538 (3) 3,657 (5) 3,652
Restatements (1) 0 0 (2,096) 0 0 0 0 (2,096) 0 (2,096)
Balance at 1 January 2017, restated (1) 773 2,745 2,891 770 (7,153) 1,538 (3) 1,561 (5) 1,556
Profit for the period (1) 0 0 2,361 0 0 0 0 2,361 3 2,364
Other comprehensive income 0 0 151 369 7,757 (539) 0 7,738 35 7,773
Total comprehensive income for the period (1) 0 0 2,512 369 7,757 (539) 0 10,099 38 10,137
Capital increase 32 2 81 0 0 0 0 0 83 0 83
Share-based payment (IFRS 2) 30 0 0 36 0 0 0 0 36 0 36
Cash distribution to Airbus SE shareholders / Dividends paid to non-controlling interests 32 0 0 (1,043) 0 0 0 0 (1,043) (3) (1,046)
Equity transaction (IAS 27) 0 0 3 0 0 0 0 3 (28) (25)
Change in treasury shares 32 0 0 0 0 0 0 1 1 0 1
Balance at 31 December 2017, restated (1) 775 2,826 4,399 1,139 604 999 (2) 10,740 2 10,742
Restatements (1) (2) 0 0 187 (367) 172 0 0 (8) 0 (8)
Balance at 1 January 2018, restated (1) (2) 775 2,826 4,586 772 776 999 (2) 10,732 2 10,734
Profit for the period 0 0 3,054 0 0 0 0 3,054 (43) 3,011
Other comprehensive income 0 0 (569) (280) (2,249) 116 0 (2,982) (32) (3,014)
Total comprehensive income for the period 0 0 2,485 (280) (2,249) 116 0 72 (75) (3)
Capital increase 32 2 115 0 0 0 0 0 117 0 117
Share-based payment (IFRS 2) 30 0 0 62 0 0 0 0 62 0 62
Cash distribution to Airbus SE shareholders / Dividends paid to non-controlling interests 32 0 0 (1,161) 0 0 0 0 (1,161) 0 (1,161)
Equity transaction (IAS 27) 0 0 (49) 0 0 0 0 (49) 68 19
Change in treasury shares 32 0 0 0 0 0 0 (49) (49) 0 (49)
Balance at 31 December 2018 777 2,941 5,923 492 (1,473) 1,115 (51) 9,724 (5) 9,719
(1) Previous year figures are restated due to the application of IFRS 15.
(2) Opening balance figures are restated due to the application of IFRS 9.
The accompanying notes are an integral part of these Consolidated Financial Statements (IFRS).

Chapter
12 Airbus / Financial Statements 2018
2
13 Airbus / Financial Statements 2018
2
2.1 Basis of Preparation 15
2.2 Airbus Structure 25
2.3 Segment Information 32
2.4 Airbus Performance 34
2.5 Operational Assets and Liabilities 40
2.6 Employees Costs and Benefi ts 53
2.7 Capital Structure and Financial Instruments 66
2.8 Other Notes 85
2.9 Appendix “Simplifi ed Airbus Structure ” 88
Notes to the IFRS Consolidated Financial Statements

14 Airbus / Financial Statements 2018
Notes to the IFRS Consolidated Financial Statements /
2.1 Basis of Preparation 151. The Company 15
2. Signifi cant Accounting Policies 15
3. Key Estimates and Judgements 16
4. Change in Accounting Policies and Disclosures 18
2.2 Airbus Structure 255. Scope of Consolidation 25
6. Acquisitions and Disposals 25
7. Investments Accounted for under
the Equity Method 29
8. Related Party Transactions 31
2.3 Segment Information 329. Segment Information 32
2.4 Airbus Performance 3410. Revenue and Gross Margin 34
11. Research and Development Expenses 35
12. Share of Profi t from Investments Accounted
for under the Equity Method and Other Income
from Investments 36
13. Other Income and Other Expenses 36
14. Total Financial Result 36
15. Income Tax 37
16. Earnings per Share 40
2.5 Operational Assets and Liabilities 4017. Intangible Assets 40
18. Property, Plant and Equipment 43
19. Other Investments and Other Long-Term
Financial Assets 45
20. Contract Assets, Contract Liabilities
and Trade Receivables, and Trade Liabilities 45
21. Inventories 46
22. Provisions, Contingent Assets and
Contingent Liabilities 47
23. Other Financial Assets and Other Financial
Liabilities 48
24. Other Assets and Other Liabilities 49
25. Sales Financing Transactions 50
2.6 Employees Costs and Benefi ts 5326. Number of Employees 53
27. Personnel Expenses 53
28. Personnel-Related Provisions 53
29. Post-Employment Benefi ts 54
30. Share-Based Payment 60
31. Remuneration 62
2.7 Capital Structure and Financial Instruments 6632. Total Equity 66
33. Capital Management 67
34. Net Cash 68
35. Information about Financial Instruments 71
2.8 Other Notes 8536. Litigation and Claims 85
37. Auditor Fees 87
38. Events after the Reporting Date 87
2.9 Appendix “Simplifi ed Airbus Structure ” 88
Contents
2.1 Basis of Preparation
15 Airbus / Financial Statements 2018
Notes to the IFRS Consolidated Financial Statements /
FINANCIAL STATEMENTS 2018
2
2.1 Basis of Preparation
1. The Company
The accompanying IFRS Consolidated Financial Statements
present the fi nancial position and the results of operations of
Airbus SE and its subsidiaries, a European public limited- liability
company (Societas Europaea) with its seat (statutaire zetel)
in Amsterdam, The Netherlands, its registered address at
Mendelweg 30, 2333 CS Leiden, The Netherlands, and
registered with the Dutch Commercial Register (Handelsregister)
under number 24288945. The Company reportable segments
are Airbus, Airbus Helicopters and Airbus Defence and Space
(see “— Note 9: Segment Information”). The Company is
listed on the European stock exchanges in Paris, Frankfurt
am Main, Madrid, Barcelona, Valencia and Bilbao. The IFRS
Consolidated Financial Statements were authorised for issue
by the Company’s Board of Directors on 13 February 2019.
2. Signifi cant Accounting Policies
Basis of preparation — The Company’s Consolidated
Financial Statements are prepared in accordance with
International Financial Reporting Standards (“IFRS”), issued
by the International Accounting Standards Board (“IASB”) as
endorsed by the European Union (“EU”) and Part 9 of Book 2
of the Netherlands Civil Code. When reference is made to IFRS,
this intends to be EU-IFRS.
The Consolidated Financial Statements have been prepared
on a historical cost basis, unless otherwise indicated. They are
prepared and reported in euro (“€”) and all values are rounded
to the nearest million appropriately. Due to rounding, numbers
presented may not add up precisely to the totals provided and
percentages may not precisely refl ect the absolute fi gures.
The Company describes the accounting policies applied
in each of the individual notes to the fi nancial statements
and avoids repeating the text of the standard, unless this is
considered relevant to the understanding of the note’s content.
On 1 January 2018, the Company has implemented the new
standards IFRS 15 “Revenue from Contracts with Customers”
and IFRS 9 “Financial Instruments”. As a result, the Company
has changed its accounting policies for revenue recognition
and for the accounting of fi nancial instruments, as detailed in
“— Note 4: Change in Accounting Policies and Disclosures”.
The most signifi cant accounting policies are described below,
and have been updated accordingly.
Revenue recognition — Revenue is recognised when the
Company transfers control of the promised goods or services
to the customer. The Company measures revenue, for the
consideration to which the Company is expected to be entitled in
exchange for transferring promised goods or services. Variable
considerations are included in the transaction price when it
is highly probable that there will be no signifi cant reversal of
the revenue in the future. The Company identifi es the various
performance obligations of the contract and allocates the
transaction price to these performance obligations. Advances
and pre-delivery payments (contract liabilities) are normal and
not considered a signifi cant fi nancing component as they are
intended to protect the Company from the customer failing to
complete its obligations under the contract.
Revenue from the sale of commercial aircraft is recognised
at a point in time (i.e. at the delivery of the aircraft). The Company
estimates the amount of price concession as a reduction of both
revenue and cost of sales.
Revenue from the sale of military aircraft, space systems and services — When control of produced goods or rendered
services is transferred over time to the customer, revenue is
recognised over time, i.e. under the percentage of completion
method (“PoC” method).
The Company transfers control over time when:
- it produces a good with no alternative use and the Company
has an irrevocable right to payment (including a reasonable
margin) for the work completed to date, in the event of contract
termination at the convenience of customers (e.g. Tiger
contract, A400M development performance obligation); or
- it creates a good which is controlled by the customer as the
good is created or enhanced (e.g. Eurofi ghter contracts, some
border security contracts); or
-the customer simultaneously receives and consumes
the benefi ts provided by the Company (e.g. maintenance
contracts).
For the application of the over time method (PoC method), the
measurement of progress towards complete satisfaction of a
performance obligation is based on inputs (i.e. cost incurred).
When none of the criteria stated above have been met, revenue
is recognised at a point in time. Revenue has been recognised
at the delivery of aircraft under IFRS 15 from the sale of military
transport aircraft, from the A400M launch contract and most
of NH90 serial helicopters’ contracts.
Provisions for onerous contracts — The Company records
provisions for onerous contracts when it becomes probable
that the total contract costs will exceed total contract revenue.
Before a provision for onerous contracts is recorded, the related
assets under construction are measured at their net realisable
value and written-off if necessary. Onerous contracts are
identifi ed by monitoring the progress of the contract together
with the underlying programme status. An estimate of the
related contract costs is made, which requires signifi cant and
16 Airbus / Financial Statements 2018
Notes to the IFRS Consolidated Financial Statements / 2.1 Basis of Preparation
complex assumptions, judgements and estimates related to
achieving certain performance standards as well as estimates
involving warranty costs (see “— Note 3: Key Estimates and
Judgements”, “— Note 10: Revenue and Gross Margin” and
“— Note 22: Provisions, Contingent Assets and Contingent
Liabilities”).
Research and development expenses — The costs for
self- initiated research are expensed when incurred. The costs
for self-initiated development are capitalised when:
-the product or process is technically feasible and clearly
defi ned (i.e. the critical design review is fi nalised);
-adequate resources are available to successfully complete
the development;
-the benefi ts from the assets are demonstrated (a market
exists or the internal usefulness is demonstrated) and the
costs attributable to the projects are reliably measured;
-the Company intends to produce and market or use the
developed product or process and can demonstrate its
profi tability.
Income tax credits granted for research and development
activities are deducted from corresponding expenses or from
capitalised amounts when earned.
Capitalised development costs, are recognised either as
intangible assets or, when the related development activities
lead to the construction of specialised tooling for production
(“jigs and tools”), or involve the design, construction and testing
of prototypes and models, as property, plant and equipment.
Capitalised development costs are generally amortised over
the estimated number of units produced. If the number of units
produced cannot be estimated reliably, they are amortised over
the estimated useful life of the internally generated intangible
asset. Amortisation of capitalised development costs is
recognised in cost of sales.
Inventories are measured at the lower of acquisition cost
(generally the average cost) or manufacturing cost and net
realisable value. Manufacturing costs comprise all costs
that are directly attributable to the manufacturing process,
such as direct material and labour, and production related
overheads (based on normal operating capacity and normal
consumption of material, labour and other production costs),
including depreciation charges. Net realisable value is the
estimated selling price in the ordinary course of the business
less the estimated costs to complete the sale.
Transactions in foreign currency, i.e. transactions in
currencies other than the functional currency of an entity
of the Company, are translated into the functional currency
at the foreign exchange rate prevailing at the transaction
date. Monetary assets and liabilities denominated in foreign
currencies at the end of the reporting period are remeasured
into the functional currency at the exchange rate in effect at
that date. Except when deferred in equity as qualifying cash
fl ow hedges (see “— Note 35: Information about Financial
Instruments”), these foreign exchange remeasurement gains
and losses are recognised, in line with the underlying item:
- in profit before finance costs and income taxes if the
substance of the transaction is commercial (including sales
fi nancing transactions); and
- in fi nance costs for fi nancial transactions.
Non-monetary assets and liabilities denominated in foreign
currencies that are stated at historical cost are translated
into functional currency at the foreign exchange rate in effect
at the date of the transaction. Translation differences on
non-monetary fi nancial assets and liabilities that are measured
at fair value are reported as part of the fair value gain or loss.
However, translation differences of non-monetary fi nancial
assets measured at fair value and classifi ed as fair value
through other comprehensive income (“OCI”) are included in
accumulated other comprehensive income (“AOCI”).
Hedge accounting — Most of the Company’s revenue is
denominated in US dollar (“US$”), while a major portion of
its costs are incurred in euro. The Company is signifi cantly
exposed to the risk of changes in US$/€ exchange rates.
Furthermore, the Company is exposed, though to a much
lesser extent, to foreign exchange risk arising from costs
incurred in currencies other than the euro and to other market
risks such as interest rate risk, commodity price and equity
price risk.
In order to manage and mitigate those risks, the Company
enters into derivative contracts. The Company applies cash
fl ow hedge accounting to its derivative contracts whenever the
relevant IFRS criteria can be met. Hedge accounting ensures
that derivative gains or losses are recognised in profi t or loss
(mainly as part of the revenue) in the same period that the
hedged items or transactions affect profi t or loss.
The major portion of the Company’s derivative contracts is
accounted for under the cash fl ow hedge model. The fair value
hedge model is used only for certain interest rate derivatives.
Derivative contracts which do not qualify for hedge accounting
are accounted for at fair value through profi t and loss; any
related gains or losses being recognised in fi nancial result.
The Company’s hedging strategies and hedge accounting
policies are described in more detail in “— Note 35: Information
about Financial Instruments”.
3. Key Estimates and Judgements
The preparation of the Company’s Consolidated Financial
Statements requires the use of estimates and assumptions.
In preparing these financial statements, management
exercises its best judgement based upon its experience and
the circumstances prevailing at that time. The estimates and
assumptions are based on available information and conditions
at the end of the fi nancial period presented and are reviewed
on an ongoing basis. Key estimates and judgements that
have a signifi cant infl uence on the amounts recognised in the
Company’s Consolidated Financial Statements are mentioned
below:

17 Airbus / Financial Statements 2018
Notes to the IFRS Consolidated Financial Statements /
FINANCIAL STATEMENTS 2018
2.1 Basis of Preparation
2
Revenue recognition for performance obligations transferred over time — The PoC method is used to
recognise revenue for performance obligations transferred
over time. This method places considerable importance on
accurate estimates at completion as well as on the extent of
progress towards completion. For the determination of the
progress of the performance obligations, signifi cant estimates
include total contract costs, remaining costs to completion,
total contract revenue, contract risks and other judgements.
The management of the operating Divisions continually
review all estimates involved in such performance obligations
and adjusts them as necessary (see “— Note 20: Contract
Assets, Contract Liabilities and Trade Receivables, and Trade
Liabilities”).
Provisions — The evaluation of provisions, such as onerous
contracts, warranty costs, restructuring measures and legal
proceedings are based on best available estimates. Onerous
contracts are identifi ed by monitoring the progress of the
contract and the underlying programme performance. The
associated estimates of the relevant contract costs, require
signifi cant judgement related to performance achievements
including estimates involving warranty costs. Depending on
the size and nature of the Company’s contracts and related
programmes, the extent of assumptions, judgements and
estimates in these monitoring processes differs. In particular,
the introduction of commercial or military aircraft programmes
(e.g. A400M) or major derivative aircraft programmes involves
an increased level of estimates and judgements associated
with the expected development, production and certifi cation
schedules and expected cost components.
The Company makes estimates and provides across the
programmes, for costs related to identifi ed in service technical
issues for which solutions have been defi ned, and for which
the associated costs can be reliably estimated taking into
consideration the latest facts and circumstances. The
Company is contractually liable for the repair or replacement
of the defective parts but not for any other damages whether
direct, indirect, incidental or consequential (including loss of
revenue, profi t or use). However, in view of overall commercial
relationships, contract adjustments may occur, and must be
considered on a case by case basis.
Estimates and judgements are subject to change based
on new information as contracts and related programmes
progress. Furthermore, the complex design and manufacturing
processes of the Company’s industry require challenging
integration and coordination along the supply chain including
an ongoing assessment of suppliers’ assertions which
may additionally impact the outcome of these monitoring
processes (see “— Note 10: Revenue and Gross Margin” and
“— Note 22: Provisions, Contingent Assets and Contingent
Liabilities”).
Employee benefi ts — The Company accounts for pension
and other post-retirement benefits in accordance with
actuarial valuations. These valuations rely on statistical and
other factors in order to anticipate future events. The actuarial
assumptions may differ materially from actual developments
due to changing market and economic conditions and
therefore result in a signifi cant change in post-retirement
employee benefi t obligations and the related future expense
(see “— Note 29: Post-Employment Benefi ts”).
Legal contingencies — Airbus companies are parties
to litigations related to a number of matters as described
in “— Note 36: Litigation and Claims”. The outcome of
these matters may have a material effect on the financial
position, results of operations or cash flows of the Company.
Management regularly analyses current information about
these matters and provides provisions for probable cash
outflows, including the estimate of legal expenses to resolve
the matters. Internal and external lawyers are used for
these assessments. In making the decision regarding the
need for provisions, management considers the degree of
probability of an unfavourable outcome and the ability to
make a sufficiently reliable estimate of the amount of loss.
The filing of a suit or formal assertion of a claim against
the Airbus companies or the disclosure of any such suit or
assertion, does not automatically indicate that a provision
may be appropriate.
Income taxes — The Company operates and earns income
in numerous countries and is subject to changing tax laws
in multiple jurisdictions within these countries. Signifi cant
judgements are necessary in determining the worldwide
income tax liabilities. Although management believes that it
has made reasonable estimates about the fi nal outcome of
tax uncertainties, no assurance can be given that the fi nal
tax outcome of these matters will be consistent with what
is refl ected in the historical income tax provisions. At each
end of the reporting period, the Company assesses whether
the realisation of future tax benefi ts is probable to recognise
deferred tax assets. This assessment requires the exercise of
judgement on the part of management with respect to, among
other things, benefi ts that could be realised from available tax
strategies and future taxable income, as well as other positive
and negative factors. The recorded amount of total deferred
tax assets could be reduced, through valuation allowances
recognition, if estimates of projected future taxable income
and benefi ts from available tax strategies are lowered, or if
changes in current tax regulations are enacted that impose
restrictions on the timing or extent of the Company’s ability to
utilise future tax benefi ts. The basis for the recoverability test
of deferred tax assets is the same as the Company’s latest
operative planning also taking into account certain qualitative
aspects regarding the nature of the temporary differences.
Qualitative factors include but are not limited to an entity’s
history of planning accuracy, performance records, business
model, backlog, existence of long-term contracts as well as
the nature of temporary differences (see “— Note 15: Income
Tax”).
Other subjects that involve assumptions and estimates are
further described in the respective notes (see “— Note 6:
Acquisitions and Disposals”, “— Note 17: Intangible Assets”
and “— Note 20: Contract Assets, Contract Liabilities and
Trade Receivables, and Trade Liabilities”).

18 Airbus / Financial Statements 2018
Notes to the IFRS Consolidated Financial Statements / 2.1 Basis of Preparation
4. Change in Accounting Policies and Disclosures
The accounting policies applied by the Company for preparing its 2018 year-end Consolidated Financial Statements are t he
same as applied for the previous year, except for the fi rst application of the new standards described below. Amendments,
improvements to and interpretations of standards effective from 1 January 2018 have no material impact on the Consolid ated
Financial Statements.
New, Revised or Amended IFRS Standards and Interpretations Applied from 1 January 2018
IFRS 15 “Revenue from Contracts with Customers”
In May 2014, the IASB issued IFRS 15 which establishes a
single comprehensive framework for determining when to
recognise revenue and how much revenue to recognise.
IFRS 15 replaced the former revenue recognition standards
IAS 18 “Revenue” and IAS 11 “Construction C ontracts” and
related interpretations. The core principle of IFRS 15 is that
an entity recognises revenue to depict the transfer of control
of the promised goods or services (performance obligations)
in an amount that refl ects the consideration to which that
entity is entitled.
The Company adopted the new standard on 1 January 2018,
using the full retrospective transition method. Accordingly, the
Company restated the comparative 2017 results included in the
2018 IFRS Consolidated Financial Statements. The opening
equity was restated as of 1 January 2017.
The Company has elected the practical expedients for
completed contracts and contract modifi cations. As a result,
the Company has not restated completed contracts which
began and ended within 2017 or which were completed at the
beginning of 1 January 2017. The Company used transaction
prices at the date contracts were completed rather than
estimating variable consideration amounts in the comparative
reporting periods. The Company has refl ected the aggregate
effect of all of the modifi cations that occur before 1 January
2017 in identifying the performance obligations, determining
and allocating the transaction price.
The application of those practical expedients allows an
ef ficient implementation of the standard especially on
complex transactions (e.g. contractual amendments on
military contracts) and a provision of relevant information
under IFRS 15.
The Company has used the practical expedient applicable to
the disclosure on the amount of the transaction price allocated
to the remaining performance obligations (i.e. backlog) and
an explanation of when it expects to recognise the amount as
revenue without any comparative information.
The Company revised its accounting policies relative to revenue
recognition, to implement IFRS 15 as described in “— Note 2:
Signifi cant Accounting Policies”. The most signifi cant changes
result from the following:
-S everal performance obligations are identifi ed instead of
recognising a single contract margin under IAS 11 (e.g.
A400M, NH90 contracts). In some cases, the over time
method (PoC method) revenue recognition criteria are
not fulfi lled under IFRS 15. In particular, for A350 launch
contracts, A400M series production and certain NH90
contracts, revenue and production costs relative to the
manufacture of aircraft are recognised at a point in time
(e.g. upon delivery of the aircraft to the customer).
-U nder IFRS 15, measurement of the revenue takes into
account variable consideration constraints in order to achieve
high likelihood that a signifi cant reversal of the recognised
revenue will not occur in the future. The constraint in
assessing revenue at completion for some contracts (A400M)
generates a decrease in recognised revenue.
-F or the application of the over time method (PoC method),
the Company measures its progress towards complete
satisfaction of performance obligations based on inputs
(i.e. cost incurred) rather than on outputs (i.e. milestones
achieved). For the Company’s current long-term construction
contracts, progresses were usually measured based on
milestones achieved (e.g. Tiger programme, satellites, orbital
infrastructures). Under IFRS 15, the Company measures
progress of work performed using a cost-to-cost approach,
whenever control of the work performed transfers to the
customer over time.
IFRS 15 also impacts the presentation of the revenue from
the sales of engines. Under IAS 18, the Company recognised
revenue based on the amount of its contracts with its
customers, unless it had confi rmation of the amount of the
price concession. In contrast, IFRS 15 requires the Company
to estimate the amount of price concession in all cases and to
treat the price concession as a reduction of revenue and cost
of sales. Under IFRS 15, revenue and cost of sales decrease
by the amount of the estimated concession granted by the
Company’s engine supplier to their customers.
In addition to these changes, IFRS 15 introduced a new class of
assets and liabilities “contract assets” and “contract liabilities”:
-A contract asset represents the Company’s right to
consideration in exchange for goods or services that the
Company has transferred to a customer when that right is
conditioned by something other than the passage of time
(e.g. revenue recognised from the application of the PoC
method before the Company has a right to invoice. Prior to
the implementation of IFRS 15, unbilled revenue was reported
within “trade receivables”).
-A contract liability represents the Company’s obligation
to transfer goods or services to a customer for which the
customer has paid a consideration (e.g. contract liabilities
mainly include the customer advance payments received
which were reported prior to the implementation of IFRS 15
within “other liabilities”).
For any individual contract, either a contract asset or a contract
liability is presented on a net basis.
The distinction between non-current and current presentation
remains unchanged.
19 Airbus / Financial Statements 2018
Notes to the IFRS Consolidated Financial Statements /
FINANCIAL STATEMENTS 2018
2.1 Basis of Preparation
2
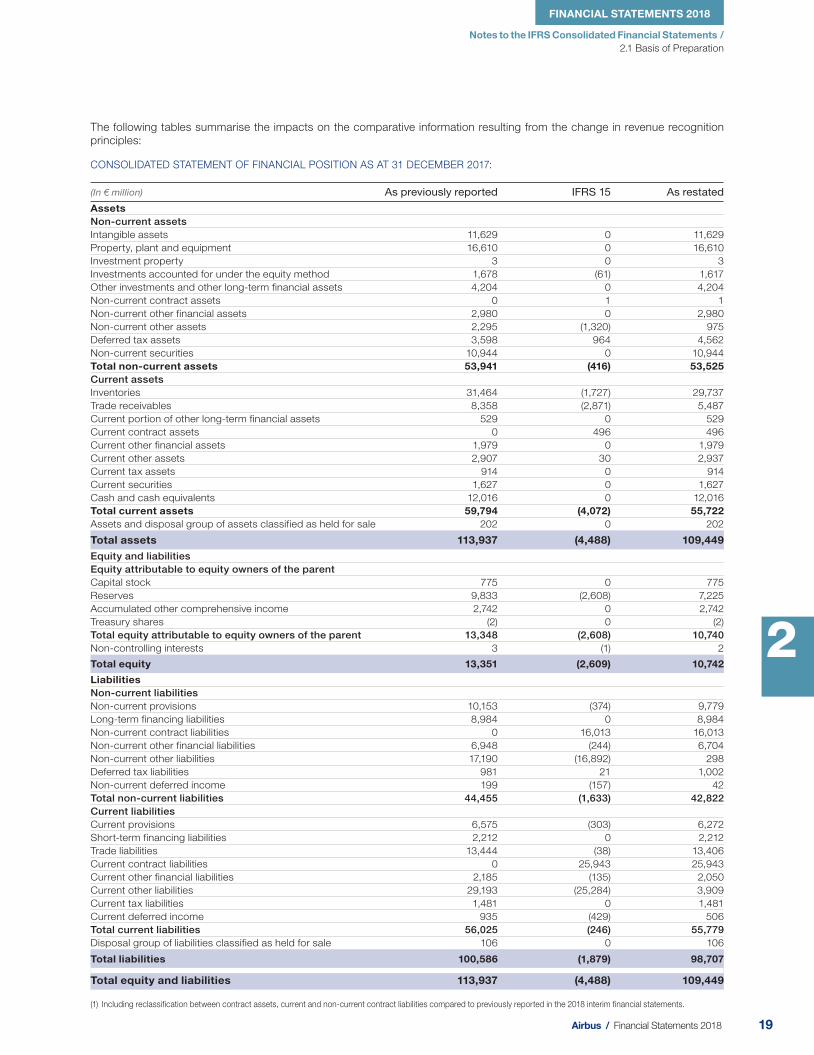
The following tables summarise the impacts on the comparative information resulting from the change in revenue recognition
principles:
CONSOLIDATED STATEMENT OF FINANCIAL POSITION AS AT 31 DECEMBER 2017:
(In € million) As previously reported IFRS 15 As restated
Assets Non-current assets Intangible assets 11,629 0 11,629
Property, plant and equipment 16,610 0 16,610
Investment property 3 0 3
Investments accounted for under the equity method 1,678 (61) 1,617
Other investments and other long-term financial assets 4,204 0 4,204
Non-current contract assets 0 1 1
Non-current other financial assets 2,980 0 2,980
Non-current other assets 2,295 (1,320) 975
Deferred tax assets 3,598 964 4,562
Non-current securities 10,944 0 10,944
Total non-current assets 53,941 (416) 53,525 Current assets Inventories 31,464 (1,727) 29,737
Trade receivables 8,358 (2,871) 5,487
Current portion of other long-term financial assets 529 0 529
Current contract assets 0 496 496
Current other financial assets 1,979 0 1,979
Current other assets 2,907 30 2,937
Current tax assets 914 0 914
Current securities 1,627 0 1,627
Cash and cash equivalents 12,016 0 12,016
Total current assets 59,794 (4,072) 55,722 Assets and disposal group of assets classified as held for sale 202 0 202
Total assets 113,937 (4,488) 109,449 Equity and liabilities Equity attributable to equity owners of the parent Capital stock 775 0 775
Reserves 9,833 (2,608) 7,225
Accumulated other comprehensive income 2,742 0 2,742
Treasury shares (2) 0 (2)
Total equity attributable to equity owners of the parent 13,348 (2,608) 10,740 Non-controlling interests 3 (1) 2
Total equity 13,351 (2,609) 10,742
Liabilities Non-current liabilities Non-current provisions 10,153 (374) 9,779
Long-term financing liabilities 8,984 0 8,984
Non-current contract liabilities 0 16,013 16,013
Non-current other financial liabilities 6,948 (244) 6,704
Non-current other liabilities 17,190 (16,892) 298
Deferred tax liabilities 981 21 1,002
Non-current deferred income 199 (157) 42
Total non-current liabilities 44,455 (1,633) 42,822 Current liabilities Current provisions 6,575 (303) 6,272
Short-term financing liabilities 2,212 0 2,212
Trade liabilities 13,444 (38) 13,406
Current contract liabilities 0 25,943 25,943
Current other financial liabilities 2,185 (135) 2,050
Current other liabilities 29,193 (25,284) 3,909
Current tax liabilities 1,481 0 1,481
Current deferred income 935 (429) 506
Total current liabilities 56,025 (246) 55,779 Disposal group of liabilities classified as held for sale 106 0 106
Total liabilities 100,586 (1,879) 98,707
Total equity and liabilities 113,937 (4,488) 109,449
(1) Including reclassification between contract assets, current and non-current contract liabilities compared to previously reported in the 2018 interim financial statements.

20 Airbus / Financial Statements 2018
Notes to the IFRS Consolidated Financial Statements / 2.1 Basis of Preparation
CONSOLIDATED STATEMENT OF FINANCIAL POSITION AS AT 1 JANUARY 2017:
(In € million) As previously reported IFRS 15 As restated
Assets Non-current assets Intangible assets 12,068 0 12,068
Property, plant and equipment 16,913 0 16,913
Investment property 5 0 5
Investments accounted for under the equity method 1,608 (39) 1,569
Other investments and other long-term financial assets 3,655 0 3,655
Non-current contract assets 0 0 0
Non-current other financial assets 976 0 976
Non-current other assets 2,358 (1,157) 1,201
Deferred tax assets 7,557 523 8,080
Non-current securities 9,897 0 9,897
Total non-current assets 55,037 (673) 54,364 Current assets Inventories 29,688 (1,581) 28,107
Trade receivables 8,101 (1,718) 6,383
Current portion of other long-term financial assets 522 0 522
Current contract assets 0 469 469
Current other financial assets 1,257 0 1,257
Current other assets 2,576 37 2,613
Current tax assets 1,110 0 1,110
Current securities 1,551 0 1,551
Cash and cash equivalents 10,143 0 10,143
Total current assets 54,948 (2,793) 52,155 Assets and disposal group of assets classified as held for sale 1,148 0 1,148
Total assets 111,133 (3,466) 107,667 Equity and liabilities Equity attributable to equity owners of the parent Capital stock 773 0 773
Reserves 7,732 (2,096) 5,636
Accumulated other comprehensive income (4,845) 0 (4,845)
Treasury shares (3) 0 (3)
Total equity attributable to equity owners of the parent 3,657 (2,096) 1,561 Non-controlling interests (5) 0 (5)
Total equity 3,652 (2,096) 1,556
Liabilities Non-current liabilities Non-current provisions 10,826 (648) 10,178
Long-term financing liabilities 8,791 0 8,791
Non-current contract liabilities 0 14,642 14,642
Non-current other financial liabilities 13,313 (348) 12,965
Non-current other liabilities 16,279 (15,969) 310
Deferred tax liabilities 1,292 (188) 1,104
Non-current deferred income 288 (155) 133
Total non-current liabilities 50,789 (2,666) 48,123 Current liabilities Current provisions 6,143 (202) 5,941
Short-term financing liabilities 1,687 0 1,687
Trade liabilities 12,532 389 12,921
Current contract liabilities 0 25,655 25,655
Current other financial liabilities 5,761 (117) 5,644
Current other liabilities 27,535 (24,114) 3,421
Current tax liabilities 1,126 0 1,126
Current deferred income 917 (315) 602
Total current liabilities 55,701 1,296 56,997 Disposal group of liabilities classified as held for sale 991 0 991
Total liabilities 107,481 (1,370) 106,111
Total equity and liabilities 111,133 (3,466) 107,667

21 Airbus / Financial Statements 2018
Notes to the IFRS Consolidated Financial Statements /
FINANCIAL STATEMENTS 2018
2.1 Basis of Preparation
2
CONSOLIDATED INCOME STATEMENT FOR THE YEAR ENDED 31 DECEMBER 2017:
(In € million) As previously reported IFRS 15 As restated
Revenue 66,767 (7,745) 59,022
Cost of sales (59,160) 7,011 (52,149)
Gross margin 7,607 (734) 6,873
Selling expenses (872) 0 (872)
Administrative expenses (1,567) 0 (1,567)
Research and development expenses (2,807) 0 (2,807)
Other income 981 0 981
Other expenses (336) 0 (336)
Share of profit from investments accounted for under the equity method 333 (22) 311
Other income from investments 82 0 82
Profit before financial result and income taxes 3,421 (756) 2,665
Interest income 189 0 189
Interest expense (517) 0 (517)
Other financial result 1,477 12 1,489
Total financial result 1,149 12 1,161
Income taxes (1,693) 231 (1,462)
Profit for the period 2,877 (513) 2,364
Attributable to:
Equity owners of the parent (Net income) 2,873 (512) 2,361
Non-controlling interests 4 (1) 3
Earnings per share € € €
Basic 3.71 (0.66) 3.05
Diluted 3.70 (0.66) 3.04
IFRS 9 “Financial Instruments”
IFRS 9, published in July 2014, replaces the existing
guidance in IAS 39 “Financial instruments: recognition and
measurement”. IFRS 9 includes revised guidance on the
classification and measurement of financial instruments,
including a new expected credit loss model for calculating
impairment on fi nancial assets, and the new general hedge
accounting requirements. It also carries forward the guidance
on recognition and derecognition of fi nancial instruments from
IAS 39.
The Company adopted the new standard on 1 January 2018
and has elected to apply the limited exemption in IFRS 9
relating to transition for classifi cation and measurement and
impairment, and accordingly has not restated comparative
periods in the year of initial application. As a consequence, any
adjustments to carrying amounts of fi nancial assets or liabilities
are recognised at the beginning of the reporting period, with
the difference recognised in opening equity.
Classification and Measurement
From 1 January 2018, the Company classifi es its fi nancial
assets according to IFRS 9 using the following measurement
categories:
-those to be measured at amortised cost; and
-those to be measured subsequently at fair value (either
through OCI or through profi t and loss).
The classifi cation depends on the Company’s business model
for managing the fi nancial assets and the contractual terms
of the cash fl ows.
Financial assets at amortised cost — This category
comprises assets that are held for collection of contractual
cash fl ows where those cash fl ows represent solely payments
of principal and interest. It includes trade receivables.
Financial assets at fair value through OCI — This category
comprises:
(i) E quity investments that are not held for trading. With the
exception of dividends received, the associated gains and
losses (including any related foreign exchange component)
are recognised in OCI. Unlike the treatment of “available-for-
sale” equity investments under IAS 39, amounts presented
in OCI are not subsequently transferred to profit and loss
on derecognition of the equity investment nor in the event
of an impairment. The Company has remeasured non-listed
equity investments for which no quoted market prices are
available at fair value and determined the fair values of these
equity investments using valuation methods such as net
asset values or a comparable company valuation multiples
technique.
22 Airbus / Financial Statements 2018
Notes to the IFRS Consolidated Financial Statements / 2.1 Basis of Preparation
(ii) D ebt instruments where contractual cash flows are solely
payments of principal and interest, and that are held both for
sales and collecting contractual cash flows. These instruments
include the bond securities portfolio and are measured in a
manner similar to the “available-for- sale” debt instruments under
IAS 39.
Financial assets at fair value through profi t and loss — This
category comprises all other fi nancial assets (e.g. derivative
instruments) that are to be measured at fair value (including
equity investments for which the Company did not elect to
present changes in fair value in OCI).
The impact of IFRS 9 on the classifi cation and measurement
of fi nancial assets is set out in the “measurement categories of
fi nancial instruments” table.
Impairment
From January 2018, the Company assesses on a forward- looking
basis the expected credit losses associated with its debt
instruments carried at amortised cost and fair value through
OCI. The Company applies the low credit risk exemption allowing
the Company to assume that there is no signifi cant increase
in credit risk since initial recognition of a fi nancial instrument,
if the instrument is determined to have low credit risk at the
reporting date. Similarly, the Company has determined that
its trade receivables and contract assets generally have low
credit risk. The Company has applied the simplifi ed approach
permitted by IFRS 9 of measuring expected credit losses of
trade receivables and contract assets on a life-time basis from
initial recognition.
Hedge Accounting
Hedging instruments in place as at 31 December 2017 qualify
as hedges under IFRS 9. The Company’s risk management
strategies and hedge documentation are aligned with the
requirement of the new standard and hedge accounting
continues to apply.
With the adoption of IFRS 9, the Company accounts for changes
in the time value of its foreign currency options as a cost of
hedging through OCI and recognises them as a separate
component of equity. The cumulative cost-of-hedging will be
reclassifi ed to profi t or loss when the hedged transaction affects
profi t or loss.
Applying the cost-of-hedging guidance to foreign currency
options retrospectively results in an increase of the 2018 opening
balance of AOCI by € +172 million on a net of tax basis and a
corresponding decrease of the opening balance of retained
earnings. As a result, retrospective application does not change
the total equity as of 1 January 2018 that would otherwise have
been reported.
New Hedge Strategy
As of 30 June 2018, the Company adopted a new hedge strategy
to hedge its net exposure (US dollar revenue less US dollar cost)
resulting from commercial aircraft deliveries of specifi c aircraft
types. The strategy more closely aligns hedge accounting with
risk management activities.
Under the new strategy the foreign exchange derivatives
used as hedging instruments are designated as a hedge of
a portion of the cash fl ows received for each of a number of
deliveries of a specifi c aircraft type that are expected to occur
in a given month. In contrast to the fi rst fl ow approach that was
previously used (which is described in “— Note 35.1: Financial
Risk Management”), the new strategy assigns the hedging
instruments to a specifi ed number of monthly deliveries of a
specifi c aircraft type and hence will allow the hedge result to
move along with the hedged deliveries in the event of a shift
in deliveries.
If such a shift in hedged deliveries occurs, hedge ineffectiveness
will arise to the extent the maturities of the hedging instrument
and the expected timing of the hedged cash fl ows are no longer
perfectly aligned. In order to minimise such ineffectiveness the
Company will close the timing gap by rolling over hedges to
new maturities, using foreign exchange swap contracts. The
hedge results will move along with the hedged deliveries.
In addition, the Company will designate the risk of changes
in the spot element as the hedged risk in order to eliminate
the ineffectiveness resulting from changes in forward points
between different maturities. The forward element will be
accounted for as a cost of hedging similar to the time value
of options.
According to the prospective application requirement of IFRS 9,
the fair values of the legacy portfolio in place at inception of the
new strategy continue to be assigned to the previous fi rst fl ow
hedge regime and remain in the hedge reserve in OCI, to be
recognised in profi t and loss only at maturity of the originally
hedged cash fl ows (unless those cash fl ows are no longer
expected to occur).
As a result of prospective application, the hedging instruments
designated under the new strategy will have a non-zero fair
value at hedge inception, which may create some small
ineffectiveness.
Another source of ineffectiveness will be the counterparty
credit risk inherent in the hedge portfolio. As such, credit risk
is absent from the hedged cash fl ows. However, since netting
arrangements are in place with all the hedge counterparties
and the Company has a policy of trading with investment grade
counterparties only, the credit risk arising from its hedging
instruments, and associated changes in credit risk, have
historically been negligible and are expected to remain so.
The hedging strategies otherwise used by the group are
essentially the same as those used before transition to IFRS 9
and are described in detail in “— Note 35.1: Financial Risk
Management”. In some cases, the currency basis spread was
excluded from the hedge on transition to IFRS 9 in order to
improve hedge effectiveness. Changes in the currency basis
spread will be accounted for as a cost of hedging similar to the
time value of options. This change in the hedge designation
had no impact on OCI or equity as of 1 January 2018, nor will
it affect future profi t and loss when the hedges mature (unless
exceptional circumstances apply).

23 Airbus / Financial Statements 2018
Notes to the IFRS Consolidated Financial Statements /
FINANCIAL STATEMENTS 2018
2.1 Basis of Preparation
2
IFRS 9 Total Equity Impacts
The total impact on the Company’s equity due to IFRS 9 as at 1 January 2018 is as follows:
(In € million) 1 January 2018
Opening equity - IAS 39 10,742
Increase in expected loss allowance for trade receivables and contract assets (7)
Increase in expected loss allowance for other financial assets (4)
Deferred tax effects 3
Adjustments to equity from adoption of IFRS 9 (8)
Opening equity - IFRS 9 10,734
The following table shows the measurement categories of fi nancial instruments:
(In € million) Measurement categories
according to IAS 39
Carrying amount according
to IAS 39 at 31 December 2017
Measurement categories according to IFRS 9
Carrying amount according
to IFRS 9 at 1 January 2018
Assets
Other investments and other long-term financial assets
Equity investments Available-for-sale 2,441 Fair value through OCI 1,088
Fair value through profit and loss 1,353
Customer financing Loans and receivables 771 Fair value through profit and loss 771
Other loans Loans and receivables 1,521 Amortised cost 1,521
Trade receivables (1) Loans and receivables 5,487 Amortised cost 5,487
Contract assets (1) Loans and receivables 497 Amortised cost 497
Other financial assets
Derivative instruments (2) Fair value through profit and loss 3,564 Fair value through profit and loss 3,564
Non-derivative instruments Loans and receivables 1,395 Amortised cost 1,395
Securities Available-for-sale 12,571 Fair value through OCI 12,571
Cash and cash equivalents
Fair value through profit and loss 6,256 Fair value through profit and loss 6,256
Available-for-sale 2,085 Fair value through OCI 900
Fair value through profit and loss 1,185
Loans and receivables 3,675 Amortised cost 3,675
Total (1) 40,263 40,263
Liabilities
Financing liabilities
Bonds and commercial papers
Amortised cost (7,063) Amortised cost (7,063)
Liabilities to financial institutions and others Amortised cost (3,792) Amortised cost (3,792)
Finance lease liabilities Other (342) Other (342)
Other financial liabilities
Derivative instruments (2) Fair value through profit and loss (2,271) Fair value through profit and loss (2,271)
European Governments’ refundable advances
Amortised cost (5,901) Amortised cost (5,901)
Others (1) Amortised cost (582) Amortised cost (582)
Trade liabilities (1) Amortised cost (13,406) Amortised cost (13,406)
Total (1) (33,357) (33,357)
(1) Previous year figures are restated due to the application of IFRS 15.
(2) Most derivative instruments are designated as hedging instruments in cash flow hedges.

24 Airbus / Financial Statements 2018
Notes to the IFRS Consolidated Financial Statements / 2.1 Basis of Preparation
New, Revised or Amended IFRS Standards and Interpretations Issued but not yet AppliedA number of new or revised standards, amendments and improvements to standards as well as interpretations are not yet effective
for the year ended 31 December 2018 and have not been applied in preparing these Consolidated Financial Statements and
early adoption is not planned:
Standards and amendments IASB effective date for annual reporting
periods beginning on or after Endorsement status
IFRS 16 “Leases” 1 January 2019 Endorsed
IFRIC 23 “Uncertainty over Income Tax Treatments” 1 January 2019 Endorsed
Amendments to IAS 19: Plan amendment, curtailment or settlement 1 January 2019 Not yet endorsed
Amendments to IAS 28: Long-term interests in associates and joint ventures 1 January 2019 Endorsed
Annual improvements to IFRS standards 2015-2017 1 January 2019 Not yet endorsed
Amendments to IFRS 3: Definition of a business 1 January 2020 Not yet endorsed
Amendments to IAS 1 and IAS 8: Definition of material 1 January 2020 Not yet endorsed
IFRS 16 “Leases”
In May 2016, the IASB published the new standard IFRS 16,
which replaces the existing guidance on leases, including
IAS 17 “Leases”, IFRIC 4 “Determining Whether an Arrangement
Contains a Lease”, SIC- 15 “Operating Leases—Incentives”, and
SIC- 27 “Evaluating the Substance of Transactions Involving the
Legal Form of a Lease”. IFRS 16 introduces a uniform lessee
accounting model. Applying that model, a lessee is required to
recognise a right-of-use asset representing the lessee’s right
to use the underlying asset and a fi nancial liability representing
the lessee’s obligation to make future lease payments.
There are exemptions for short-term leases and leases of low-
value assets. Lessor accounting remains comparable to that
provided by the existing leases standard: lessors continue to
classify their leases as operating leases or fi nance leases. The
standard shall be applied for the fi rst time in the fi rst reporting
period of a fi scal year that begins on or after 1 January 2019.
The transition to the new lease accounting from the existing
rules will be accomplished using the modifi ed retrospective
method according to IFRS 16, therefore, the cumulative effect
of adopting IFRS 16 will be recognised as an adjustment to the
opening balance of retained earnings at 1 January 2019, with
no restatement of comparative information.
The Company intends to use the following practical expedients
provided by the standard at transition date:
-T he previous determination pursuant to IAS 17 and IFRIC 4
of whether a contract is a lease will be maintained for existing
contracts, in accordance with IFRS 16.
-O n initial application of IFRS 16 to operating leases, the
right-of-use to the leased asset will generally be measured
at the amount of the lease liability, using the discount rate at
the date of initial application. Where accrued lease liabilities
existed, the right-of-use asset will be adjusted by the amount
of the accrued lease liability under IFRS 16. Under IFRS 16,
the measurement of the right-of-use at initial application will
not include initial direct costs. In some cases, the value of
right-of-use assets may differ from the value of the liabilities
due to offsetting against existing provisions or as a result of
valuation allowances.
-N ot to apply the new recognition requirements to short-term
leases and to leases of low value assets as soon as the new
standard is effective.
The Company’s operating leases mainly relate to real estate
assets, company cars and equipment. The Company has fi nalised
the implementation of a software to be used both to manage the
Company’s leases and to generate IFRS 16 calculations. So far,
the most signifi cant potential impact identifi ed by the Company
relates to its operating leases of real estate assets (such as land,
warehouses, storage facilities and offi ces).
The fi nal impact of IFRS 16 on the Company’s Consolidated
Financial Statements in the period of initial application will depend
on future economic conditions, including incremental borrowing
rates to be applied for the computation of the lease liability present
value as of 1 January 2019, the composition of the lease portfolio
at that date and the estimation of the lease terms, as extension
and early termination options offered by lease agreements will
need to be included in the calculation of the liability if their exercise
or non-exercise is considered reasonably certain.
The analysis conducted as part of the Company wide project on
initial application resulted in the probable recognition of lease
liabilities totalling from € 1.2 billion to € 1.5 billion (1 January
2019) as a result of the transition. Net cash will decrease
accordingly due to the increase in lease liabilities. The impact
of applying IFRS 16 on profi t before fi nance costs and income
taxes and profi t for the period will not be signifi cant. The
change in presentation of operating lease expenses will result
in a corresponding improvement in cash fl ows from operating
activities and a decline in cash fl ows from fi nancing activities.
IFRIC 23 “Uncertainty over Income Tax Treatments”
On May 2017, the IASB issued IFRIC 23 “Uncertainty over Income
Tax Treatments”. The interpretation clarifi es the recognition and
measurement requirements when there is uncertainty over
income tax treatments. In assessing the uncertainty, an entity
shall consider whether it is probable that a taxation authority
will accept the uncertain tax treatment. IFRIC 23 is effective for
annual reporting periods beginning on or after 1 January 2019,
while earlier application is permitted.
The Company is currently assessing the impacts of adopting
the interpretation on the Company’s Consolidated Financial
Statements which might trigger some reclassifi cation from
provisions to tax liabilities.

25 Airbus / Financial Statements 2018
Notes to the IFRS Consolidated Financial Statements /
FINANCIAL STATEMENTS 2018
2.2 Airbus Structure
2
2.2 Airbus Structure
5. Scope of C onsolidation
6. Acquisitions and Disposals
Consolid ation — The Company’s Consolidated Financial
Statements include the financial statements of Airbus SE
and all material subsidiaries controlled by the Company. The
Company’s subsidiaries prepare their fi nancial statements at the
same reporting date as the Company’s Consolidated Financial
Statements (see Appendix “Simplifi ed Airbus Structure” c hart ).
Subsidiaries are entities controlled by the Company including
so-called structured entities, which are created to accomplish
a narrow and well-defi ned objective (see “— Note 25: Sales
Financing Transactions”). They are fully consolidated from the
date control commences to the date control ceases.
The assessment of control of a structured entity is performed in
three steps. In a fi rst step, the Company identifi es the relevant
activities of the structured entities (which may include managing
lease receivables, managing the sale or re-lease at the end of
the lease and managing the sale or re-lease on default) and in a
second step, the Company assesses which activity is expected
to have the most signifi cant impact on the structured entities’
return. Finally, the Company determines which party or parties
control this activity.
The Company’s interests in equity-accounted investees
comprise investments in associates and joint ventures. Such
investments are accounted for under the equity method and
are initially recognised at cost.
The fi nancial statements of the Company’s investments in
associates and joint ventures are generally prepared for the
same reporting period as for the parent company. Adjustments
are made where necessary to bring the accounting policies and
accounting periods in line with those of the Company.
PERIMETER OF CONSOLIDATION
(Number of companies)
31 December
2018 2017
Fully consolidated entities 189 207
Investments accounted for under the equity method
in joint ventures 45 40
in associates 19 23
Total 253 270
For more details related to unconsolidated and consolidated structured entities, see “— Note 25: Sales Financing Transactions”.
Business combinations are accounted for using the acquisition
method, as at the acquisition date, which is the date on which
control is transferred to the Company.
The determination of the fair value of the acquired assets and
the assumed liabilities which are the basis for the measurement
of goodwill requires significant estimates. Land, buildings
and equipment are usually independently appraised while
marketable securities are valued at market prices. If intangible
assets are identifi ed, depending on the type of intangible asset
and the complexity of determining its fair value, the Company
either consults with an independent external valuation expert
or develops the fair value internally, using appropriate valuation
techniques which are generally based on a forecast of the total
expected future net cash fl ows.
These evaluations are linked closely to the assumptions made
by management regarding the future performance of the assets
concerned and the discount rate applied.
Loss of control, loss of joint control, loss of signifi cant infl uence — Upon loss of control of a subsidiary, the assets
and liabilities and any components of the Company’s equity
related to the subsidiary are derecognised. Any gain or loss
arising from the loss of control is recognised within other
income or other expenses in the Consolidated Income
Statement. If the Company retains any interest in the previous
subsidiary, such interest is measured at fair value at the date
the control is lost.

26 Airbus / Financial Statements 2018
Notes to the IFRS Consolidated Financial Statements / 2.2 Airbus Structure
Assets and liabilities of a material subsidiary for which a loss of
control is highly probable are classifi ed as assets and liabilities
held for sale when the Company has received sufficient
evidence that the loss of control will occur in the 12 months after
the classifi cation. These assets and liabilities are presented
after elimination of intercompany transactions.
When the loss of signifi cant infl uence or the loss of joint control
of an investment accounted under for the equity method
is highly probable and is excepted to occur in the coming
12 months, this associate or joint venture is classifi ed as an
asset held for sale.
Sale of investment in an associate or joint venture — Any
gain or loss arising from the disposal of investment accounted
for under the equity method is recognised within share of profi t
from investments.
6.1 AcquisitionsOn 16 October 2017, Airbus, Bombardier Inc. (“Bombardier”)
and Investissement Québec (“IQ”) signed an agreement
that brings together Airbus’ global reach and scale with
Bombardier’s newest, state-of-the-art jet aircraft family. Under
the agreement, Airbus will provide procurement, sales and
marketing, and customer support expertise to the C Series Aircraft Limited Partnership (“CSALP”), the entity that
manufactures and sells the C Series. The partnership brings
together two complementary product lines.
On 8 June 2018, having received all required regulatory
approvals, Airbus, Bombardier and IQ closed the C Series
transaction effective on 1 July 2018.
On 1 July 2018, Airbus has taken the control of C Series
programme and acquired 50.01% Class A ownership units
in CSALP. Bombardier and IQ will own 33.55% and 16.44%,
respectively. Airbus has consolidated CSALP using the full
integration method effective from 1 July 2018. At closing, Airbus
paid US$ 1 per share to assume a net liability. Technology and
inventories are the main assets acquired. Airbus has assumed
the liabilities of CSALP which are mainly related to customer
contracts in the backlog, trade payables, advance payments
received and refundable advance liabilities. The functional
currency of CSALP is US dollar.
Bombardier will continue with its current funding plan of
CSALP. Bombardier will fund the cash shortfalls of CSALP,
if required, during the second half of 2018, up to a maximum
of US$ 225 million; during 2019, up to a maximum of
US$ 350 million; and up to a maximum aggregate amount of
US$ 350 million over the following two years, in consideration
for non-voting participating Class B common units of CSALP.
Airbus has the choice to reimburse Bombardier’s funding for
the nominal amount plus a yearly 2% interest or for an amount
equal to the fair value of the shares of CSALP at the purchase
date of Class A ownership units.
Airbus benefi ts from call rights in respect of all of Bombardier’s
interests in CSALP at fair market value, with the amount for
Class B shares subscribed by Bombardier capped at the
invested amount plus accrued interests if any, including a
call right exercisable no earlier than 7.5 years following the
closing, except in the event of certain changes in the control of
Bombardier, in which case the right is accelerated. Airbus also
benefi ts from call rights in respect of all IQ’s interests in CSALP
at fair market value no earlier than 4.5 years following the closing.
Bombardier benefi ts from a corresponding put right whereby
it could require that Airbus acquire its interest at fair market
value after the expiry of the same period. IQ will also benefi t
from tag along rights in connection with a sale by Bombardier
of its interests in the partnership.
Airbus used the full goodwill approach to account for this
transaction. Bombardier’s and IQ’s interests in CSALP
are measured at their estimated fair value. The fair value
measurement of the assets acquired and liabilities assumed has
been performed by an independent expert. According to IFRS 3,
the fair values of acquired assets and assumed liabilities have
been determined excluding Airbus specifi c synergies (mainly
with respect to volumes sold and manufacturing costs).
The transaction has been approved by the Board of Directors
of both Airbus and Bombardier, as well as the Cabinet of the
Government of Québec. The partnership’s head offi ce, primary
assembly line and related functions will be based in Mirabel,
Québec (Canada).
27 Airbus / Financial Statements 2018
Notes to the IFRS Consolidated Financial Statements /
FINANCIAL STATEMENTS 2018
2.2 Airbus Structure
2
The following table summarises the fi nal allocation of the purchase price to the acquired assets and the assumed liabilities at the
acquisition date:
(In € million) Total
Intangible assets (1) 1,377
Property, plant and equipment 252
Deferred tax assets 86
Inventories (2) 660
Trade receivables 8
Other financial assets 350
Other assets 93
Cash and cash equivalents 129
Total assets acquired 2,955
Provisions / Acquired customer contracts (3) 2,609
Deferred tax liabilities 77
Trade liabilities 270
Contract liabilities 685
Other financial liabilities 827
Other liabilities 356
Total liabilities assumed 4,824
Net assets assumed 1,870
Non-controlling interests (at fair value, i.e. including synergies provided by the acquirer) (4) 2,246
Consideration transferred (5) (225)
Goodwill arising on acquisition (6) 3,891
(1) Intangible assets: Mainly include the acquired technology for the A220 programme. The fair value of the programme was measured using the “multi-excess earnings method” and
is equal to the present value of the after-tax cash flows attributable to future deliveries excluding existing contracts in the backlog which are valued separately. The technology will
be amortised over the expected number of aircraft to be delivered over the programme useful life.
(2) Inventories: The fair value of the inventories has been measured considering net contractual selling prices.
(3) Acquired customer contracts: This represents the present value of the excess of expected fulfilment costs over contractual selling prices for all acquired customer contracts in the
backlog. Estimated fulfilment costs include both direct costs that will be recognised in gross margin and contributory asset charges to reflect the return required on other assets that
contribute to the generation of the forecast cash flows. This liability will be released as a reduction of cost of sales based on the delivered aircraft considered in the measurement of
the liability.
(4) Non-controlling interests: Airbus has recognised a financial liability at fair value for the estimated exercise price of the written put options on non-controlling interests (Bombardier
put option and IQ tag along). According to the accounting policy of the C ompany, changes in the fair value of the liability are recognised directly in equity.
(5) Consideration transferred: Airbus paid US$ 1 per share (754 shares) to acquire 50.01% of CSALP and received 100,000,000 warrants which are each entitled to one Class B
Bombardier common share at a strike price equal to the US equivalent of Can$ 2.29. The fair value amounted to US$ 263 million as at 1 July 2018. As a result, the consideration
transferred is negative.
(6) Goodwill: The goodwill mostly represents Airbus specific synergies expected from the acquisition, which have been excluded from the fair value measurement of the identifiable net
assets. These synergies mainly relate to higher expected volumes of aircraft sold and lower manufacturing costs. CSALP is part of the cash generating unit (“CGU”) Airbus and will
be tested for impairment on an annual basis. The opening balance sheet after purchase price allocation of CSALP has been audited as at 1 July 2018. In accordance with IFRS 3
“Business Combinations”, the opening balance sheet of CSALP might vary during the 12 month allocation period which ends 1 July 2019. Airbus will retrospectively adjust the initial
accounting to reflect new information that would have affected the recognition or the measurement of these amounts as of 1 July 2018.
6.2 DisposalsOn 7 March 2018, the Company fi nalised the sale of Plant Holdings, Inc., held by the Airbus DS Communications Inc.
business, to Motorola Solutions after receiving the required
regulatory approvals. Airbus Defence and Space recognised a
gain of € 159 million, reported in other income.
On 1 October 2018, the Company completed the disposal of its
subsidiary Compañía Española de Sistemas Aeronáuticos, S.A. (“CESA”) to Héroux-Devtek Inc. (“Héroux-Devtek”), for a
purchase price of € 114 million.
On 28 February 2017, the Company sold its defence electronics business, a leading global provider of mission-critical sensors,
integrated systems and services for premium defence and
security applications mainly based in Ulm (Germany), to affi liates
of KKR & Co. L.P. (the acquirer), a leading global investment
fi rm. The German defence electronics business was sold for
€ 823 million, Airbus Defence and Space recognised a net gain
on sale of € 604 million. The closing for the French defence
electronics business will occur after full separation of the business
sold from Airbus other business activities and is expected to take
place in 2018. The divestment is part of the strategic review of
the Airbus Defence and Space business portfolio. The assets
and liabilities of this company were classifi ed as a disposal
group held for sale as of 31 December 2016. With respect to
extending security clearance for the Airbus Defence and Space
business, Airbus made a 25.1% reinvestment into Hensoldt
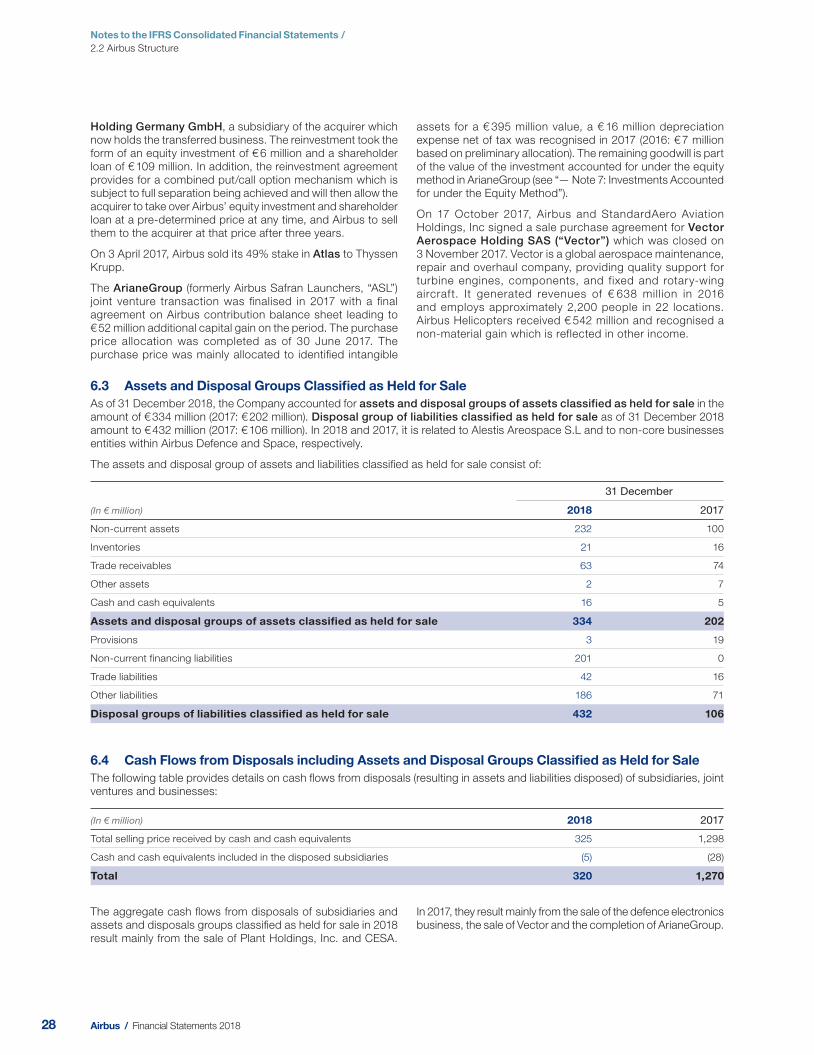
28 Airbus / Financial Statements 2018
Notes to the IFRS Consolidated Financial Statements / 2.2 Airbus Structure
Holding Germany GmbH, a subsidiary of the acquirer which
now holds the transferred business. The reinvestment took the
form of an equity investment of € 6 million and a shareholder
loan of € 109 million. In addition, the reinvestment agreement
provides for a combined put/call option mechanism which is
subject to full separation being achieved and will then allow the
acquirer to take over Airbus’ equity investment and shareholder
loan at a pre-determined price at any time, and Airbus to sell
them to the acquirer at that price after three years.
On 3 April 2017, Airbus sold its 49% stake in Atlas to Thyssen
Krupp.
The ArianeGroup (formerly Airbus Safran Launchers, “ASL”)
joint venture transaction was fi nalised in 2017 with a fi nal
agreement on Airbus contribution balance sheet leading to
€ 52 million additional capital gain on the period. The purchase
price allocation was completed as of 30 June 2017. The
purchase price was mainly allocated to identifi ed intangible
assets for a € 395 million value, a € 16 million depreciation
expense net of tax was recognised in 2017 (2016: € 7 million
based on preliminary allocation). The remaining goodwill is part
of the value of the investment accounted for under the equity
method in ArianeGroup (see “— Note 7: Investments Accounted
for under the Equity Method”).
On 17 October 2017, Airbus and StandardAero Aviation
Holdings, Inc signed a sale purchase agreement for Vector Aerospace Holding SAS (“Vector”) which was closed on
3 November 2017. Vector is a global aerospace maintenance,
repair and overhaul company, providing quality support for
turbine engines, components, and fixed and rotary-wing
aircraft. It generated revenues of € 638 million in 2016
and employs approximately 2,200 people in 22 locations.
Airbus Helicopters received € 542 million and recognised a
non- material gain which is reflected in other income.
6.3 Assets and Disposal Groups Classifi ed as Held for SaleAs of 31 December 2018, the Company accounted for assets and dispo sal groups of assets classified as held for sale in the
amount of € 334 million (2017: € 202 million). Disposal group of liabilities classified a s held for sale as of 31 December 2018
amount to € 432 million (2017: € 106 million). In 2018 and 2017, it is related to Alestis Areosp ace S.L and to non-core businesses
entities within Airbus Defence and Space, respectively.
The assets and disposal group of assets and liabilities classifi ed as held for sale consist of:
(In € million)
31 December
2018 2017
Non-current assets 232 100
Inventories 21 16
Trade receivables 63 74
Other assets 2 7
Cash and cash equivalents 16 5
Assets and disposal groups of assets classified as held for sale 334 202
Provisions 3 19
Non-current financing liabilities 201 0
Trade liabilities 42 16
Other liabilities 186 71
Disposal groups of liabilities classified as held for sale 432 106
6.4 Cash Flows from Disposals including Assets and Disposal Groups Classifi ed as Held for SaleThe following table provides details on cash fl ows from disposals (resulting in assets and liabilities disposed) of subsidiaries, joint
ventures and businesses:
(In € million) 2018 2017
Total selling price received by cash and cash equivalents 325 1,298
Cash and cash equivalents included in the disposed subsidiaries (5) (28)
Total 320 1,270
The aggregate cash fl ows from disposals of subsidiaries and
assets and disposals groups classifi ed as held for sale in 2018
result mainly from the sale of Plant Holdings, Inc. and CESA.
In 2017, they result mainly from the sale of the defence electronics
business, the sale of Vector and the completion of ArianeGroup.
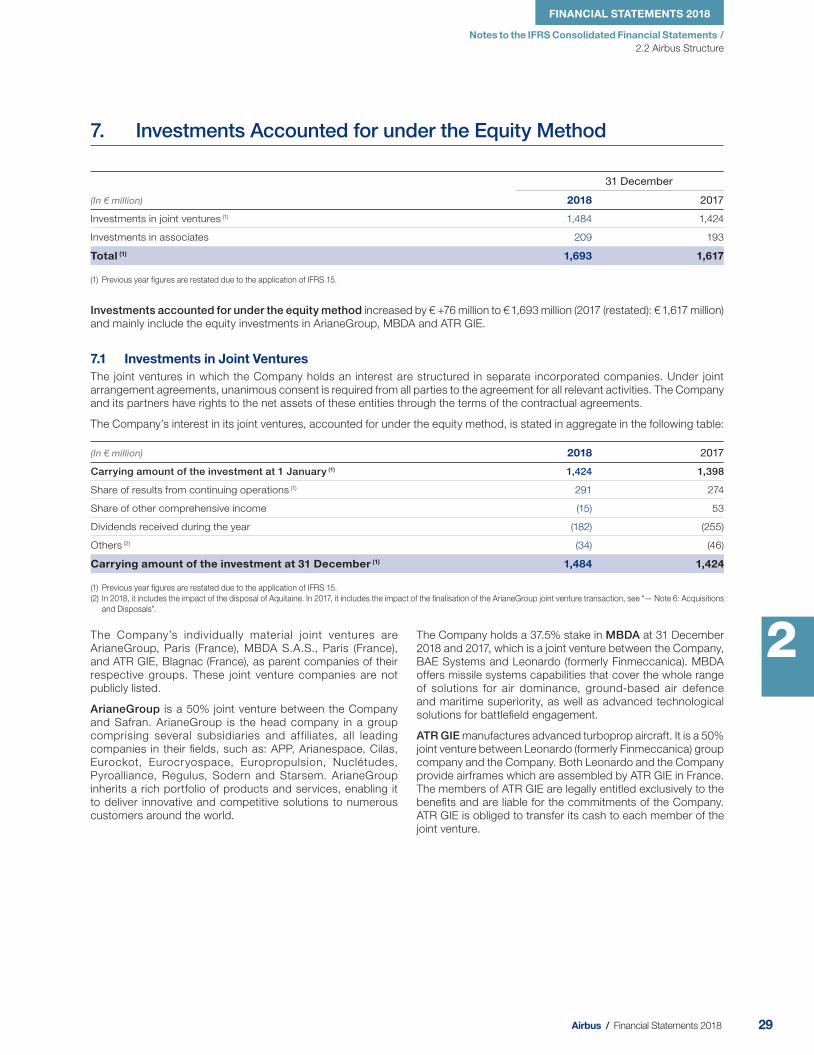
29 Airbus / Financial Statements 2018
Notes to the IFRS Consolidated Financial Statements /
FINANCIAL STATEMENTS 2018
2.2 Airbus Structure
2
7. Investments Accounted for under the Equity Method
(In € million)
31 December
2018 2017
Investments in joint ventures (1) 1,484 1,424
Investments in associates 209 193
Total (1) 1,693 1,617
(1) Previous year figures are restated due to the application of IFRS 15.
Investments accounted for under the equity method increased by € +76 million to € 1,693 million (2017 ( restated): € 1,617 million)
and mainly include the equity investments in ArianeGroup, MBDA and ATR GIE.
7.1 Investments in Joint VenturesThe joint ventures in which the Company holds an interest are structured in separate incorporated companies. Under joint
arrangement agreements, unanimous consent is required from all parties to the agreement for all relevant activities. The Company
and its partners have rights to the net assets of these entities through the terms of the contractual agreements.
The Company’s interest in its joint ventures, accounted for under the equity method, is stated in aggregate in the following table:
(In € million) 2018 2017
Carrying amount of the investment at 1 January (1) 1,424 1,398
Share of results from continuing operations (1) 291 274
Share of other comprehensive income (15) 53
Dividends received during the year (182) (255)
Others (2) (34) (46)
Carrying amount of the investment at 31 December (1) 1,484 1,424
(1) Previous year figures are restated due to the application of IFRS 15.
(2) In 2 018, it includes the impact of the disposal of Aquitaine. In 2017, it includes the impact of the finalisation of the ArianeGroup joint venture transaction, see “— Note 6: Acquisitions
and Disposals”.
The Company’s individually material joint ventures are
ArianeGroup, Paris (France), MBDA S.A.S., Paris (France),
and ATR GIE, Blagnac (France), as parent companies of their
respective groups. These joint venture companies are not
publicly listed.
ArianeGroup is a 50% joint venture between the Company
and Safran. ArianeGroup is the head company in a group
comprising several subsidiaries and affiliates, all leading
companies in their fi elds, such as: APP, Arianespace, Cilas,
Eurockot, Eurocryospace, Europropulsion, Nuclétudes,
Pyroalliance, Regulus, Sodern and Starsem. ArianeGroup
inherits a rich portfolio of products and services, enabling it
to deliver innovative and competitive solutions to numerous
customers around the world.
The Company holds a 37.5% stake in MBDA at 3 1 December
2018 and 2017, which is a joint venture between the Company,
BAE Systems and Leonardo (formerly Finmeccanica). MBDA
offers missile systems capabilities that cover the whole range
of solutions for air dominance, ground-based air defence
and maritime superiority, as well as advanced technological
solutions for battlefi eld engagement.
ATR GIE manufactures advanced turboprop aircraft. It is a 50%
joint venture between Leonardo (formerly Finmeccanica) group
company and the Company. Both Leonardo and the Company
provide airframes which are assembled by ATR GIE in France.
The members of ATR GIE are legally entitled exclusively to the
benefi ts and are liable for the commitments of the Company.
ATR GIE is obliged to transfer its cash to each member of the
joint venture.

30 Airbus / Financial Statements 2018
Notes to the IFRS Consolidated Financial Statements / 2.2 Airbus Structure
The following table summarises fi nancial information for ArianeGroup, MBDA and ATR GIE based on their Consolidated Financial
Statements prepared in accordance with IFRS:
(In € million)
ArianeGroup MBDA ATR GIE
2018 2017 2018 2017 2018 2017
Revenue (1) 3,587 3,221 3,164 2,982 1,498 1,600
Depreciation and amortisation (128) (112) (107) (95) (19) (42)
Interest income 5 2 9 9 0 0
Interest expense (1) (3) (9) (6) (6) 0 0
Income tax expense (1) (83) (58) (99) (92) (3) (7)
Profit from continuing operations (1) 251 228 239 201 193 265
Other comprehensive income (14) 38 5 145 0 0
Total comprehensive income (100%) (1) 237 266 244 346 193 265 Non-current assets (1) 5,748 5,578 2,437 2,385 172 159
Current assets (1) 6,626 5,360 7,654 6,728 674 743
thereof cash and cash equivalents 507 807 2,658 2,818 3 8
Non-current liabilities 688 495 1,046 1,145 87 131
thereof non-current financial liabilities (excluding trade and other payables and provisions) 137 31 9 0 0 0
Current liabilities (1) 7,514 6,448 8,462 7,537 460 426
thereof current financial liabilities (excluding trade and other payables and provisions) 28 36 6 55 0 0
Total equity (100%) (1) 4,172 3,995 583 431 299 345 Equity attributable to the equity owners of the parent (1) 4,157 3,988 583 431 299 345
Non-controlling interests 15 7 0 0 0 0
(1) Previous year figures are restated due to the application of IFRS 15.
(In € million)
ArianeGroup MBDA ATR GIE
2018 2017 2018 2017 2018 2017
The Company’s interest in equity on investee (1) 2,078 1,994 218 162 150 173
Goodwill 244 244 282 282 0 0
PPA adjustments, net of tax (1,519) (1,520) 0 0 0 0
The Company DS PPA (including 2016 A6 catch-up) (37) (17) 0 0 0 0
Contingent liability release adjustment (25) (15) 0 0 0 0
Fair value adjustments and modifications for differences in accounting policies (1) (21) 10 (11) (12) 0 0
Dividend adjustment 0 0 (26) (35) 0 0
Elimination of downstream inventory 2 2 0 0 (4) (4)
Carrying amount of the investment at 31 December (1) 722 698 463 397 146 169
(1) Previous year figures are restated due to the application of IFRS 15.
The development of these investments is as follows: (1)
(In € million)
ArianeGroup MBDA ATR GIE
2018 2017 2018 2017 2018 2017
Carrying amount of the investment at 1 January 698 694 397 320 169 224
Share of results from continuing operations 88 68 91 76 98 133
Share of other comprehensive income (8) 13 (1) 54 4 (14)
Dividends received during the year (26) (25) (26) (53) (125) (174)
Changes in consolidation 0 0 0 0 0 0
Others (30) (52) 2 0 0 0
Carrying amount of the investment at 31 December 722 698 463 397 146 169
(1) Previous year figures are restated due to the application of IFRS 15.
The Company’s share of contingent liabilities as of 31 December 2018 relating to MBDA is € 420 million (2017 : € 308 million).

31 Airbus / Financial Statements 2018
Notes to the IFRS Consolidated Financial Statements /
FINANCIAL STATEMENTS 2018
2.2 Airbus Structure
2
7.2 Investments in AssociatesThe Company’s interests in associates, accounted for under the equity method, are stated in aggregate in the following table:
(In € million) 2018 2017
Carrying amount of the investment at 1 January 193 171
Share of results from continuing operations 39 37
Share of other comprehensive income 11 (7)
Dividends received during the year (36) (8)
Changes in consolidation 1 0
Others 1 0
Carrying amount of the investment at 31 December 209 193
The cumulative unrecognised comprehensive loss for these associates amounts to € -30 million and € -47 million as of 31 December
2018 and 2017, r espectively (thereof € 17 million for the period).
8. Related Party Transactions
(In € million)
Sales of goods and
services and other income
Purchases of goods and
services and other expenses
Receivables due at
31 December
Payables due at
31 December
Loans granted / Other receivables
due at 31 December
Loans received / Other liabilities due
at 31 December
2018
Total transactions
with associates 13 222 3 39 95 20
Total transactions
with joint ventures 2,197 209 1,200 1,175 0 1,121
2017 (1)
Total transactions with associates 7 234 5 39 92 14
Total transactions with joint ventures 2,615 425 989 463 1 1,076
(1) Previous year figures are restated due to the application of IFRS 15.
Transactions with unconsolidated subsidiaries are immaterial to
the Company’s Consolidated Financial Statements.
As of 3 1 December 2018, the Company granted guarantees of
€ 129 million to Air Tanker Group in the UK (2017 : € 152 million).
For information regarding the funding of the Company’s pension
plans, which are considered as related parties, see “— Note 29:
Post-Employment Benefi ts”.
The information relative to compensation and benefi ts granted
to Members of the Executive Committee and Board of Directors
are disclosed in “— Note 31: Remuneration”.

32 Airbus / Financial Statements 2018
Notes to the IFRS Consolidated Financial Statements / 2.3 Segment Information
2.3 Segment Information
The Company operates in three reportable segments which refl ect the internal organisational and management structure according
to the nature of the products and services provided.
-Airbus (formerly Airbus Commercial Aircraf t and
Headquarters) — Development, manufacturing, marketing
and sale of commercial jet aircraft of more than 100 seats;
aircraft conversion and related services; development,
manufacturing, marketing and sale of regional turboprop
aircraft and aircraft components. It also includes the holding
function of the Company and its bank activities.
-Airbus Helicopters — Development, manufacturing,
marketing and sale of civil and military helicopters; provision
of helicopter related services.
-Airbus Defence and Space — Military Aircraft design,
development, delivery, and support of military aircraft
such as combat, mission, transport and tanker aircraft as
well as Unmanned Aerial systems and their associated
services. Space Systems design , development, delivery, and
support of full range of civil and defence space systems for
telecommunications, earth observations, navigation, science
and orbital systems. Communication, Intelligence & Security
provision of services around data processing from platforms,
secure communication and cyber security. In addition, the
main joint ventures design, develop, deliver, and support
missile systems as well as space launcher systems.
9. Segment Information
The following table presents information with respect to the Company’s business segments. As a rule, inter-segment transfers
are carried out on an arm’s length basis. Inter-segment sales predominantly take place between Airbus and Airbus Defence
and Space and between Airbus Helicopters and Airbus. Other activities not allocable to the reportable segments, together with
consolidation effects, are disclosed in the column “Transversal/Eliminations”.
The Company uses EBIT as a key indicator of its economic performance.
Business segment information for the year ended 31 December 2018 is as follows:
(In € million) Airbus Airbus
Helicopters
Airbus Defence
and Space Transversal / Eliminations
Consolidated Airbus
Total revenue 47,970 5,934 11,063 0 64,967
Internal revenue (771) (411) (78) 0 (1,260)
Revenue 47,199 5,523 10,985 0 63,707
thereof:
sales of goods at a point in time 44,175 2,917 3,080 0 50,172
sales of goods over time 23 362 4,579 0 4,964
services, including sales of spare parts 3,001 2,244 3,326 0 8,571
Profit before finance result and income taxes (EBIT) 4,295 366 676 (289) 5,048
thereof:
depreciation and amortisation 1,794 167 457 26 2,444
research and development expenses (2,214) (315) (328) (360) (3,217)
share of profit from investments accounted for under the equity method 114 10 206 0 330
additions to other provisions (1) (2,843) (569) (1,652) 8 (5,056)
Interest result (232)
Other financial result (531)
Income taxes (1,274)
Profit for the period 3,011
(1) See “— Note 22: Provisions, Contingent Assets and Contingent Liabilities”.
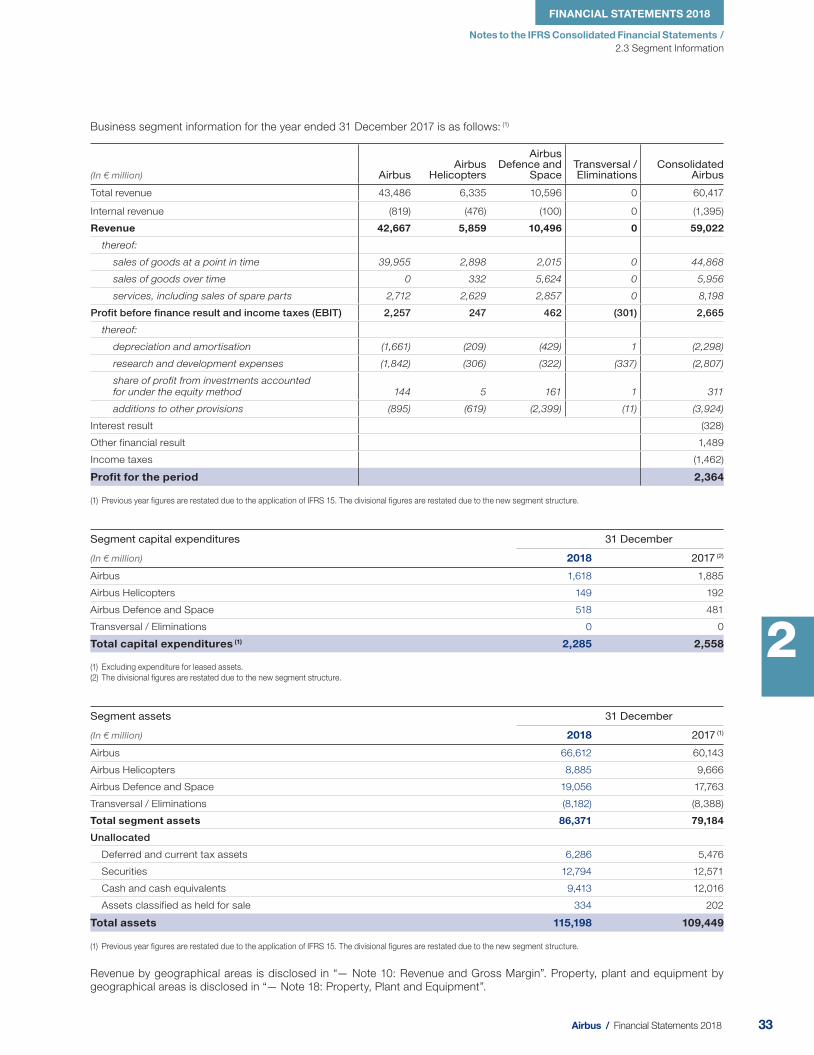
33 Airbus / Financial Statements 2018
Notes to the IFRS Consolidated Financial Statements /
FINANCIAL STATEMENTS 2018
2.3 Segment Information
2
Business segment information for the year ended 31 December 2017 is as follows: (1)
(In € million) Airbus Airbus
Helicopters
Airbus Defence and
Space Transversal / Eliminations
Consolidated Airbus
Total revenue 43,486 6,335 10,596 0 60,417
Internal revenue (819) (476) (100) 0 (1,395)
Revenue 42,667 5,859 10,496 0 59,022
thereof:
sales of goods at a point in time 39,955 2,898 2,015 0 44,868
sales of goods over time 0 332 5,624 0 5,956
services, including sales of spare parts 2,712 2,629 2,857 0 8,198
Profit before finance result and income taxes (EBIT) 2,257 247 462 (301) 2,665
thereof:
depreciation and amortisation (1,661) (209) (429) 1 (2,298)
research and development expenses (1,842) (306) (322) (337) (2,807)
share of profit from investments accounted for under the equity method 144 5 161 1 311
additions to other provisions (895) (619) (2,399) (11) (3,924)
Interest result (328)
Other financial result 1,489
Income taxes (1,462)
Profit for the period 2,364
(1) Previous year figures are restated due to the application of IFRS 15. The divisional figures are restated due to the new segment structure.
Segment capital expenditures 31 December
(In € million) 2018 2017 (2)
Airbus 1,618 1,885
Airbus Helicopters 149 192
Airbus Defence and Space 518 481
Transversal / Eliminations 0 0
Total capital expenditures (1) 2,285 2,558
(1) Excluding expenditure for leased assets.
(2) The divisional figures are restated due to the new segment structure.
Segment assets 31 December
(In € million) 2018 2017 (1)
Airbus 66,612 60,143
Airbus Helicopters 8,885 9,666
Airbus Defence and Space 19,056 17,763
Transversal / Eliminations (8,182) (8,388)
Total segment assets 86,371 79,184
Unallocated
Deferred and current tax assets 6,286 5,476
Securities 12,794 12,571
Cash and cash equivalents 9,413 12,016
Assets classified as held for sale 334 202
Total assets 115,198 109,449
(1) Previous year figures are restated due to the application of IFRS 15. The divisional figures are restated due to the new segment structure.
Revenue by geographical areas is disclosed in “— Note 10: Revenue and Gross Margin”. Property, plant and equipment by
geographical areas is disclosed in “— Note 18: Property, Plant and Equipment”.
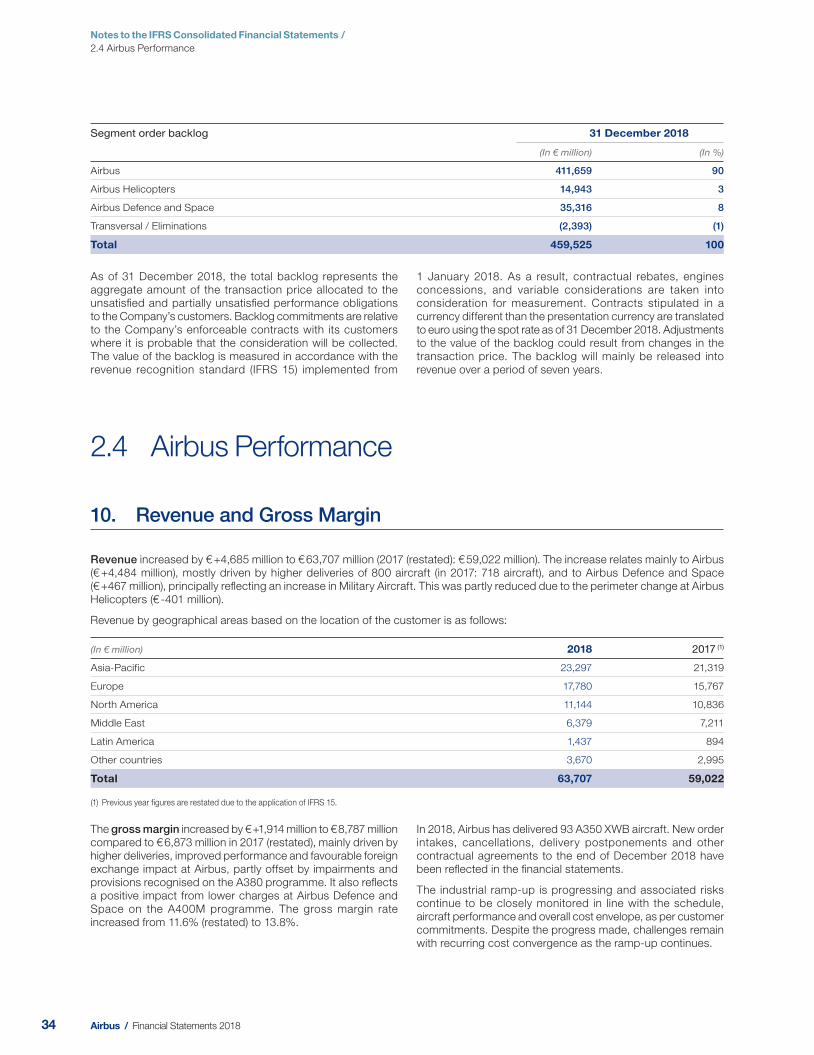
34 Airbus / Financial Statements 2018
Notes to the IFRS Consolidated Financial Statements / 2.4 Airbus Performance
Segment order backlog 31 December 2018
(In € million) ( In %)
Airbus 411,659 90
Airbus Helicopters 14,943 3
Airbus Defence and Space 35,316 8
Transversal / Eliminations (2,393) (1)
Total 459,525 100
As of 31 December 2018, the total backlog represents the
aggregate amount of the transaction price allocated to the
unsatisfi ed and partially unsatisfi ed performance obligations
to the Company’s customers. Backlog commitments are relative
to the Company’s enforceable contracts with its customers
where it is probable that the consideration will be collected.
The value of the backlog is measured in accordance with the
revenue recognition standard (IFRS 15) implemented from
1 January 2018. As a result, contractual rebates, engines
concessions, and variable considerations are taken into
consideration for measurement. Contracts stipulated in a
currency different than the presentation currency are translated
to euro using the spot rate as of 31 December 2018. Adjustments
to the value of the backlog could result from changes in the
transaction price. The backlog will mainly be released into
revenue over a period of seven years.
2.4 Airbus Performance
10. Revenue and Gross Margin
Revenue increased by € +4,685 million to € 63,707 million (2017 (rest ated): € 59,022 million). The increase relates mainly to Airbus
(€ +4,484 million), mostly driven by higher deliveries of 800 aircraft (in 2017: 718 aircraft), and to Airbus Defence and Space
(€ +467 million), principally refl ecting an increase in Military Aircraft. This was partly reduced due to the perimeter change at Airbus
Helicopters (€ -401 million).
Revenue by geographical areas based on the location of the customer is as follows:
(In € million) 2018 2017 (1)
Asia-Pacific 23,297 21,319
Europe 17,780 15,767
North America 11,144 10,836
Middle East 6,379 7,211
Latin America 1,437 894
Other countries 3,670 2,995
Total 63,707 59,022
(1) Previous year figures are restated due to the application of IFRS 15.
The gross margin increased by € +1,914 million to € 8,787 million
compared to € 6,873 million in 2017 (res tated), mainly driven by
higher deliveries, improved performance and favourable foreign
exchange impact at Airbus, partly offset by impairments and
provisions recognised on the A380 programme. It also refl ects
a positive impact from lower charges at Airbus Defence and
Space on the A400M programme. The gross margin rate
increased from 11.6% (restated) to 13.8%.
In 2018, Air bus has delivered 93 A350 XWB aircraft. New order
intakes, cancellations, delivery postponements and other
contractual agreements to the end of December 2018 have
been refl ected in the fi nancial statements.
The industrial ramp-up is progressing and associated risks
continue to be closely monitored in line with the schedule,
aircraft performance and overall cost envelope, as per customer
commitments. Despite the progress made, challenges remain
with recurring cost convergence as the ramp-up continues.
35 Airbus / Financial Statements 2018
Notes to the IFRS Consolidated Financial Statements /
FINANCIAL STATEMENTS 2018
2.4 Airbus Performance
2
In 2018, the Company’s largest A380 operator has reviewed
its aircraft fl eet strategy going forward and has concluded it is
forced to restructure and reduce its A380 order by 39 aircraft.
The Company entered into discussions with the customer
in late 2018 which fi nally resulted in the signature of a head
of agreement on 11 February 2019. Without this customer’s
A380 order, the Company has no substantial order backlog
and no basis to sustain A380 production, despite all sales and
marketing efforts in recent years. As a consequence of this
decision, deliveries of the A380 will cease in 2021.
At year-end 2018, in view of the above, the Company has
reassessed accordingly the expected market assumptions and
the recoverability and depreciation method of specifi c assets
allocated to the A380 programme. As a result, the Company
has impaired specifi c A380 assets in the amount of € 167 million,
recognised an onerous contract provision for an amount of
€ 1,257 million and updated the measurement of refundable
advances including interest accretion for a total amount of
€ 1,426 million. As a consequence, the recognition of the
onerous contract provision as well as other specifi c provisions
and the remeasurement of the liabilities have negatively affected
the consolidated income statement before taxes by a net
€ 463 million in EBIT and positively impacted the other fi nancial
result by € 177 million.
17 A400M aircraft were delivered in 2018. In total, 74 aircraft
have been delivered as of 31 December 2018. The Company
continued with development activities toward achieving the
revised capability roadmap with the achievement of an important
development milestone according to schedule. Retrofi t activities
are progressing in line with the customer agreed plan.
In 2017, the Company entered into discussions with OCCAR
and the customer Nations that resulted in the signature of a
Declaration of Intent (“DOI”) on 7 February 2018 agreeing on a
global re-baselining of the contract, including a revised aircraft
delivery schedule, an updated technical capability roadmap and
a revised retrofi t schedule. The DOI represents an important
step towards reaching a contractually binding agreement also
mitigating the commercial exposure while satisfying customer
needs with regard to capabilities and availability of the aircraft.
A detailed review of the programme concluded in the fourth
quarter of 2017 including an estimate of the fi nancial impacts
of the above mentioned adaptations on schedule, capabilities
and retrofi t resulted in an update of the loss making contract
provision of € 1,299 million for the year 2017 (restated equivalent
loss following the implementation of IFRS 15 was € 992 million
for the year 2017).
In 2018, the Company has been working together with OCCAR
and concluded the negotiations on a contract amendment. The
customer Nations are now set to endorse the agreement to allow
pursuing the domestic approval processes with the objective
to sign the contract amendment in the fi rst half-year 2019.
In the fourth quarter 2018 an update of the contract estimate at
completion has triggered a net additional charge of € 436 million.
This refl ects the outcome of the negotiations, updated estimates
on the export scenario during the launch contract phase of
the A400M programme as well as applicable escalation and
some cost increases. Risks remain on development of technical
capabilities and the associated costs, on securing suffi cient
export orders in time, on aircraft operational reliability in
particular with regards to engines, and on cost reductions as
per the revised baseline.
The A400M contractual SOC 1, SOC 1.5, SOC 2, SOC 2.5
and SOC 3 development milestones remain to be achieved.
SOC 1 fell due end October 2013, SOC 1.5 fell due end
December 2014, SOC 2 end of December 2015 and SOC 2.5
end of October 2017.
The associated termination rights became exercisable by
OCCAR on 1 November 2014, 1 January 2016, and 1 January
2017, respectively. Management judges that it is highly unlikely
that any of these termination rights will be exercised as with the
upcoming contract amendment these termination rights will be
completely reviewed.
11. Research and Development Expenses
Research and developm ent expenses increased by € +410 milli on to € 3,217 million compared to € 2,807 million in 2017, primarily
refl ecting R&D activities on the A320 programme. In addition, an amount of € 91 million of development costs has been capitalised,
mainly related to Airbus Helicopters programmes.

36 Airbus / Financial Statements 2018
Notes to the IFRS Consolidated Financial Statements / 2.4 Airbus Performance
12. Share of Profi t from Investments Accounted for under the Equity Method and Other Income from Investments
(In € million) 2018 2017
Share of profit from investments in joint ventures (1) 291 274
Share of profit from investments in associates 39 37
Share of profit from investments accounted for under the equity method (1) 330 311
Other income from investments 109 82
(1) Previous year figures are restated due to the application of IFRS 15.
Share of profit from investments under the equity method and other income from investments increased by € +46 million
to € 439 million compared to € 393 million in 2017 (res tated).
13. Other Income and Other Expenses
Other income increased by € +675 million to € 1,656 million
compared to € 981 million in 2017. This increase is mainly related
to the release of liabilities on the A380 programme and the gain of
€ 159 million following the disposal of Plant Holdings, Inc. In 2017,
it mainly inclu ded the capital gain of € 604 million from the sale of
the defence electronics business at Airbus Defence and Space.
For more details, see “— Note 6: Acquisitions and Disposals”).
Other expenses decreased by € -154 million to € -182 million
compared to € -336 million in 2017, which included the arbitral
award relating to the Republic of China (Taiwan). For more
details, see “— Note 36: Litigation and Claims”.
14. Total Financial Result
Interest income deri ved from the Company’s asset management and lending activities is recognised as interest accrues, using
the effective interest rate method.
(In € million) 2018 2017
Interests on European Governments’ refundable advances (181) (270)
Others (51) (58)
Total interest result (1 ) (232) (328)
Change in fair value measurement of financial instruments (340) 392
Foreign exchange translations on monetary items (238) 219
Unwinding of discounted provisions (2 ) (44) (49)
Others 91 927
Total other financial result (2 ) (531) 1,489
Total (2 ) (763) 1,161
(1 ) In 2 018, the total interest income amounts to € 208 million (2017 : € 189 million) for financial assets which are not measured at fair value through profit or loss. For financial liabilities
which are not measured at fair value through profit or loss € -440 million (2017: € -5 17 million) are recognised as total interest expenses. Both amounts are calculated by using the
effective interest method.
(2 ) Previous year figures are restated due to the application of IFRS 15.
Total financial result deteriorated by € -1,924 million to
€ -763 million compared to € 1,161 million in 2017 (res tated). This
is due to a negative impact from foreign exchange valuation of
monetary items and the revaluation of fi nancial instruments, partly
compensated by the net effect of the change of treatment of
certain fi nancial instruments under IFRS 9. In addition, in 2017 it
included the impact of the decrease in the European Governments’
refundable advances primarily related to the A380 programme.
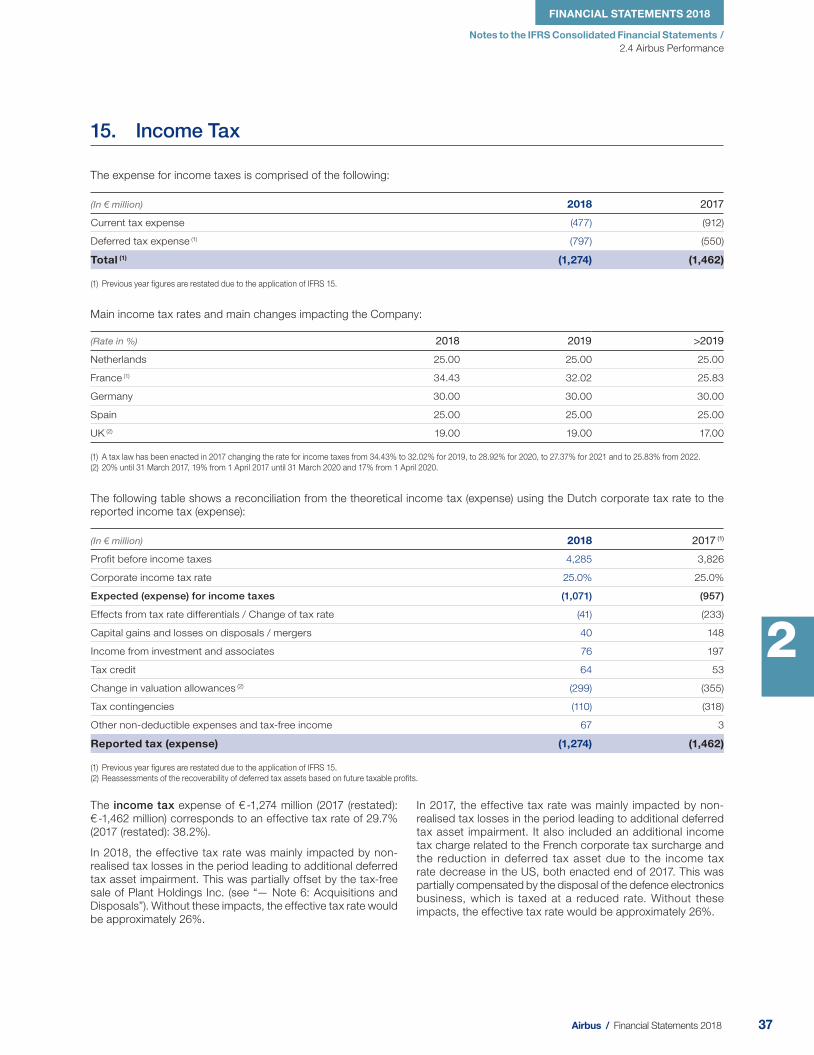
37 Airbus / Financial Statements 2018
Notes to the IFRS Consolidated Financial Statements /
FINANCIAL STATEMENTS 2018
2.4 Airbus Performance
2
15. Income Tax
The expense for income taxes is comprised of the following:
(In € million) 2018 2017
Current tax expense (477) (912)
Deferred tax expense (1) (797) (550)
Total (1) (1,274) (1,462)
(1) Previous year figures are restated due to the application of IFRS 15.
Main income tax rates and main changes impacting the Company:
(Rate in %) 2018 2019 > 2019
Netherlands 25.00 25.00 25.00
France (1) 34.43 32.02 25.83
Germany 30.00 30.00 30.00
Spain 25.00 25.00 25.00
UK (2) 19.00 19.00 17.00
(1) A tax law has been enacted in 2017 changing the rate for income taxes from 34.43% to 32.02% for 2019, to 28.92% for 2020, to 27.37% for 2021 and to 25.83% from 2022.
(2) 20% until 31 March 2017, 19% from 1 April 2017 until 31 March 2020 and 17% from 1 April 2020.
The following table shows a reconciliation from the theoretical income tax (expense) using the Dutch corporate tax rate to the
reported income tax (expense):
(In € million) 2018 2017 (1)
Profit before income taxes 4,285 3,826
Corporate income tax rate 25.0% 25.0%
Expected (expense) for income taxes (1,071) (957)
Effects from tax rate differentials / Change of tax rate (41) (233)
Capital gains and losses on disposals / mergers 40 148
Income from investment and associates 76 197
Tax credit 64 53
Change in valuation allowances (2) (299) (355)
Tax contingencies (110) (318)
Other non-deductible expenses and tax-free income 67 3
Reported tax (expense) (1,274) (1,462)
(1) Previous year figures are restated due to the application of IFRS 15.
(2) Reassessments of the recoverability of deferred tax assets based on future taxable profits.
The income tax expense of € -1,274 million (201 7 (restated):
€ -1,462 million) corresponds to an effective tax rate of 29.7%
(2017 (restated): 38.2%).
In 2018, the effective tax rate was mainly impacted by non-
realised tax losses in the period leading to additional deferred
tax asset impairment. This was partially offset by the tax-free
sale of Plant Holdings Inc. (see “— Note 6: Acquisitions and
Disposals”). Without these impacts, the effective tax rate would
be approximately 26%.
In 2017, th e effective tax rate was mainly impacted by non-
realised tax losses in the period leading to additional deferred
tax asset impairment. It also included an additional income
tax charge related to the French corporate tax surcharge and
the reduction in deferred tax asset due to the income tax
rate decrease in the US, both enacted end of 2017. This was
partially compensated by the disposal of the defence electronics
business, which is taxed at a reduced rate. Without these
impacts, the effective tax rate would be approximately 26%.
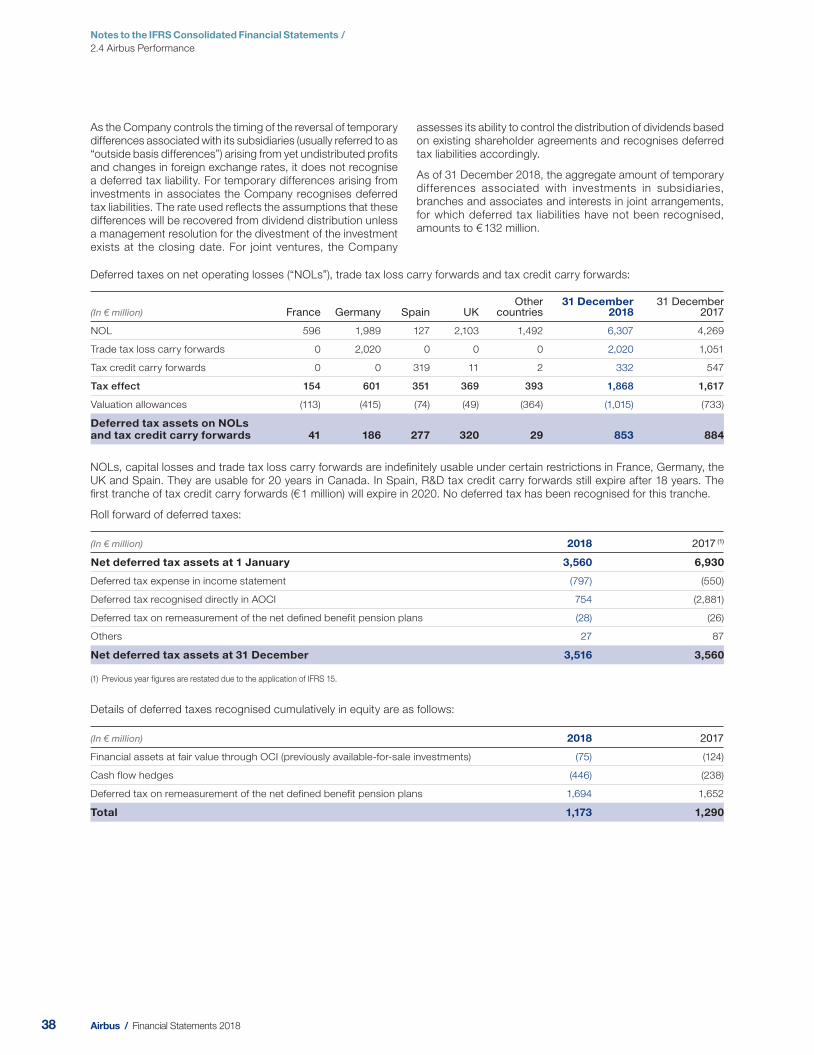
38 Airbus / Financial Statements 2018
Notes to the IFRS Consolidated Financial Statements / 2.4 Airbus Performance
As the Company controls the timing of the reversal of temporary
differences associated with its subsidiaries (usually referred to as
“outside basis differences”) arising from yet undistributed profi ts
and changes in foreign exchange rates, it does not recognise
a deferred tax liability. For temporary differences arising from
investments in associates the Company recognises deferred
tax liabilities. The rate used refl ects the assumptions that these
differences will be recovered from dividend distribution unless
a management resolution for the divestment of the investment
exists at the closing date. For joint ventures, the Company
assesses its ability to control the distribution of dividends based
on existing shareholder agreements and recognises deferred
tax liabilities accordingly.
As of 31 Decem ber 2018, the aggregate amount of temporary
differences associated with investments in subsidiaries,
branches and associates and interests in joint arrangements,
for which deferred tax liabilities have not been recognised,
amounts to € 132 million.
Deferred taxes on net operating losses (“NOLs”), trade tax loss carry forwards and tax credit carry forwards:
(In € million) France Germany Spain UK Other
countries 31 December
2018 31 December
2017
NOL 596 1,989 127 2,103 1,492 6,307 4,269
Trade tax loss carry forwards 0 2,020 0 0 0 2,020 1,051
Tax credit carry forwards 0 0 319 11 2 332 547
Tax effect 154 601 351 369 393 1,868 1,617
Valuation allowances (113) (415) (74) (49) (364) (1,015) (733)
Deferred tax assets on NOL s and tax credit carry forwards 41 186 277 320 29 853 884
NOLs, capital losses and trade tax loss carry forwards are indefi nitely usable under certain restrictions in France, Germany, the
UK and Spain. They are usable for 20 years in Canada. In Spain, R&D tax credit carry forwards still expire after 18 years. The
fi rst tranche of tax credit carry forwards (€ 1 million) will expire in 2020. No deferred tax has been recognised for this tranche.
Roll forward of deferred taxes:
(In € million) 2018 2017 (1)
Net deferred tax assets at 1 January 3,560 6,930
Deferred tax expense in income statement (797) (550)
Deferred tax recognised directly in AOCI 754 (2,881)
Deferred tax on remeasurement of the net defined benefit pension plans (28) (26)
Others 27 87
Net deferred tax assets at 31 December 3,516 3,560
(1) Previous year figures are restated due to the application of IFRS 15.
Details of deferred taxes recognised cumulatively in equity are as follows:
(In € million) 2018 2017
Financial assets at fair value through OCI (previously available-for-sale investments) (75) (124)
Cash flow hedges (446) (238)
Deferred tax on remeasurement of the net defined benefit pension plans 1,694 1,652
Total 1,173 1,290

39 Airbus / Financial Statements 2018
Notes to the IFRS Consolidated Financial Statements /
FINANCIAL STATEMENTS 2018
2.4 Airbus Performance
2
Deferred income taxes as of 31 December 2018 are related to the following assets and liabilities:
(In € million)
1 January 2018 (1) Other movements Movement through income statement 31 December 2018
Deferred tax
assets
Deferred tax
liabilities OCI /
IAS 19 Others (2)
R&D tax
credits
Deferred tax benefit (expense)
Deferred tax
assets
Deferred tax
liabilities
Intangible assets 70 (586) 0 0 0 201 147 (462)
Property, plant and equipment 681 (1,257) 0 1 0 177 613 (1,011)
Investments and other long-term financial assets 559 (167) 0 9 0 1,001 1,416 (14)
Inventories 1,376 (1,871) 0 0 0 1,898 1,416 (13)
Receivables and other assets 3,553 (3,286) 590 (61) 0 (1,831) 646 (1,681)
Prepaid expenses 0 (2) 0 0 0 14 12 0
Provisions for retirement plans 1,480 0 (156) 27 0 (713) 695 (57)
Other provisions 3,508 (1,239) 0 0 0 (335) 1,890 44
Liabilities 2,504 (2,211) 123 (4) 0 (1,214) 887 (1,689)
Deferred income (94) (67) 0 0 0 98 0 (63)
NOLs and tax credit carry forwards 1,617 0 0 86 (41) 206 1,868 0
Deferred tax assets (liabilities) before offsetting 15,254 (10,686) 557 58 (41) (498) 9,590 (4,946)
Valuation allowances on deferred tax assets (1,008) 0 169 11 0 (299) (1,127) 0
Set-off (9,684) 9,684 0 0 0 0 (3,628) 3,628
Net deferred tax assets (liabilities) 4,562 (1,002) 726 69 (41) (797) 4,835 (1,318)
(1) Previous year figures are restated due to the application of IFRS 15.
(2) “Others” mainly comprises changes in the consolidation scope and foreign exchange rate effects.
Deferred income taxes as of 31 December 2017 are related to the following assets and liabilities: (1)
(In € million)
1 January 2017 Other movements Movement through income statement 31 December 2017
Deferred tax
assets
Deferred tax
liabilities OCI /
IAS 19 Others (2)
R&D tax
credits
Deferred tax benefit (expense)
Deferred tax
assets
Deferred tax
liabilities
Intangible assets 70 (610) 0 15 0 9 70 (586)
Property, plant and equipment 741 (1,384) 0 (48) 0 115 681 (1,257)
Investments and other long-term financial assets 204 (303) 0 39 0 452 559 (167)
Inventories 1,431 (1,222) 0 45 0 (749) 1,376 (1,871)
Receivables and other assets 2,695 (1,011) (918) 52 0 (551) 3,553 (3,286)
Prepaid expenses 1 0 0 0 0 (3) 0 (2)
Provisions for retirement plans 1,420 0 (34) 32 0 62 1,480 0
Other provisions 3,720 (1,492) 0 9 0 32 3,508 (1,239)
Liabilities 4,564 (2,676) (2,159) (3) 0 567 2,504 (2,211)
Deferred income 19 (102) 0 (77) 0 (1) (94) (67)
NOLs and tax credit carry forwards 1,706 0 0 0 39 (128) 1,617 0
Deferred tax assets (liabilities) before offsetting 16,571 (8,800) (3,111) 64 39 (195) 15,254 (10,686)
Valuation allowances on deferred tax assets (795) 0 204 (62) 0 (355) (1,008) 0
Set-off (7,696) 7,696 0 0 0 0 (9,684) 9,684
Net deferred tax assets (liabilities) 8,080 (1,104) (2,907) 2 39 (550) 4,562 (1,002)
(1) Previous year figures are restated due to the application of IFRS 15.
(2) “Others” mainly comprises changes in the consolidation scope and foreign exchange rate effects.

40 Airbus / Financial Statements 2018
Notes to the IFRS Consolidated Financial Statements / 2.5 Operational Assets and Liabilities
16. Earnings per Share
2018 2017
Profit for the period attributable to equity owners of the parent (Net income) (1) € 3, 054 million € 2, 361 million
Weighted average number of ordinary shares 775,167,941 773,772,702
Basic earnings per share (1) € 3. 94 € 3. 05
(1) Previous year figures are restated due to the application of IFRS 15.
Diluted earnings per share – The Company’s categories of
dilutive potential ordinary shares are share-settled Performance
Units relating to Long-Term Incentive Plans (“LTIP”) and the convertible bond issued on 1 July 2015. During 2018, the
average price of the Company’s shares exceeded the exercise
price of the share-settled Performance Units and therefore
752,107 shares (2017: 505,536 shares) were considered in the
calculation of diluted earnings per share. The dilutive effect of
the convertible bond was also considered in the calculation of
diluted earnings per share in 2018, b y adding back € 7 million
of interest expense to the profi t for the period attributable to
equity owners of the parent (2017: € 7 million) and by including
5,022,990 of dilutive potential ordinary shares.
2018 2017
Profit for the period attributable to equity owners of the parent (Net income), adjusted for diluted calculation (1) € 3, 061 million € 2, 368 million
Weighted average number of ordinary shares (diluted) (2) 780,943,038 779,301,228
Diluted earnings per share (1) € 3. 92 € 3. 04
(1) Previous year figures are restated due to the application of IFRS 15.
(2) Dilution assumes conversion of all potential ordinary shares.
2.5 Operational Assets and Liabilities
17. Intangible Assets
Intangible assets comprise (i) goodwill (see “— Note 5: Scope of Consolidation”), (ii) capitalised development costs (see “— Note 2:
Signifi cant Accounting Policies”) and (iii) other intangible assets, e.g. internally developed software and acquired intangible assets.
Intangible assets with fi nite useful lives are generally amortised on a straight-line basis over their respective estimated useful lives
(3 to 10 years) to their estimated residual values.
31 Decem ber 2018 and 2017 comp rise the following:
(In € million)
31 December 2018 31 December 2017
Gross amount
Amortisation /Impairment
Net book value
Gross amount
Amortisation / Impairment
Net book value
Goodwill 14,077 (1,038) 13,039 10,180 (1,040) 9,141
Capitalised development costs 3,070 (1,488) 1,582 3,104 (1,340) 1,763
Other intangible assets 4,572 (2,467) 2,105 3,135 (2,409) 725
Total 21,719 (4,993) 16,726 16,418 (4,789) 11,629
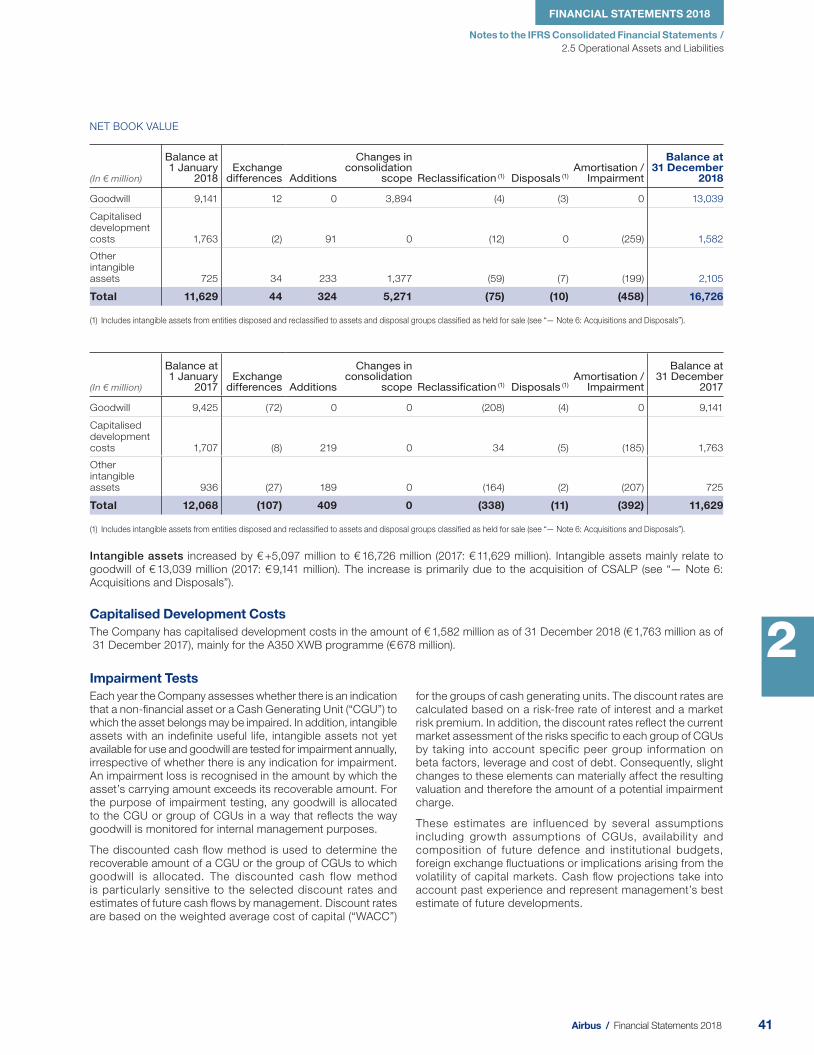
41 Airbus / Financial Statements 2018
Notes to the IFRS Consolidated Financial Statements /
FINANCIAL STATEMENTS 2018
2.5 Operational Assets and Liabilities
2
NET BOOK VALUE
(In € million)
Balance at 1 January
2018 Exchange
differences Additions
Changes in consolidation
scope Reclassification (1) Disposals (1) Amortisation /
Impairment
Balance at 31 December
2018
Goodwill 9,141 12 0 3,894 (4) (3) 0 13,039
Capitalised development costs 1,763 (2) 91 0 (12) 0 (259) 1,582
Other intangible assets 725 34 233 1,377 (59) (7) (199) 2,105
Total 11,629 44 324 5,271 (75) (10) (458) 16,726
(1) Includes intangible assets from entities disposed and reclassified to assets and disposal groups classified as held for sale (see “— Note 6: Acquisitions and Disposals”).
(In € million)
Balance at 1 January
2017 Exchange
differences Additions
Changes in consolidation
scope Reclassification (1) Disposals (1) Amortisation /
Impairment
Balance at 31 December
2017
Goodwill 9,425 (72) 0 0 (208) (4) 0 9,141
Capitalised development costs 1,707 (8) 219 0 34 (5) (185) 1,763
Other intangible assets 936 (27) 189 0 (164) (2) (207) 725
Total 12,068 (107) 409 0 (338) (11) (392) 11,629
(1) Includes intangible assets from entities disposed and reclassified to assets and disposal groups classified as held for sale (see “— Note 6: Acquisitions and Disposals”).
Intangible assets increased by € +5,097 million to € 16,726 million (2017: € 11,629 million). Intangible assets mainly relate to
goodwill of € 13,039 million (2017: € 9,14 1 million). The increase is primarily due to the acquisition of CSALP (see “— Note 6:
Acquisitions and Disposals”).
Capitalised Development CostsThe Company has capitalised development costs in the amount of € 1,582 million as of 31 December 2018 (€ 1,76 3 million as of
31 December 2017), mainly fo r the A350 XWB programme (€ 678 million).
Impairment TestsEach year the Company assesses whether there is an indication
that a non-fi nancial asset or a Cash Generating Unit (“CGU”) to
which the asset belongs may be impaired. In addition, intangible
assets with an indefi nite useful life, intangible assets not yet
available for use and goodwill are tested for impairment annually,
irrespective of whether there is any indication for impairment.
An impairment loss is recognised in the amount by which the
asset’s carrying amount exceeds its recoverable amount. For
the purpose of impairment testing, any goodwill is allocated
to the CGU or group of CGUs in a way that refl ects the way
goodwill is monitored for internal management purposes.
The discounted cash fl ow method is used to determine the
recoverable amount of a CGU or the group of CGUs to which
goodwill is allocated. The discounted cash flow method
is particularly sensitive to the selected discount rates and
estimates of future cash fl ows by management. Discount rates
are based on the weighted average cost of capital (“WACC”)
for the groups of cash generating units. The discount rates are
calculated based on a risk-free rate of interest and a market
risk premium. In addition, the discount rates refl ect the current
market assessment of the risks specifi c to each group of CGUs
by taking into account specifi c peer group information on
beta factors, leverage and cost of debt. Consequently, slight
changes to these elements can materially affect the resulting
valuation and therefore the amount of a potential impairment
charge.
These estimates are influenced by several assumptions
including growth assumptions of CGUs, availability and
composition of future defence and institutional budgets,
foreign exchange fl uctuations or implications arising from the
volatility of capital markets. Cash fl ow projections take into
account past experience and represent management’s best
estimate of future developments.

42 Airbus / Financial Statements 2018
Notes to the IFRS Consolidated Financial Statements / 2.5 Operational Assets and Liabilities
As of 31 December 2018 and 2017, goodw ill was allocated to C GUs or group of CGUs and is summarised in the following schedule:
(In € million) Airbus Airbus
Helicopters
Airbus Defence
and Space Transversal / Eliminations
Consolidated Airbus
Goodwill as of 31 December 2018 10,759 128 2,152 0 13,039
Goodwill as of 31 December 2017 (1) 6,852 129 2,160 0 9,141
(1) Previous year figures are restated due to the application of IFRS 15. The divisional figures are restated due to the new segment structure.
The goodwill mainly relates to the creation of the Company in 2000 and the Airbus Combination in 2001.
The annual impairment tests performed in 2018 led to no impairment charge.
General Assumptions Applied in the Planning Process
The basis for determining the recoverable amount is the value in
use of the CGUs. Generally, cash fl ow projections used for the
Company’s impairment testing are based on operative planning.
The operative planning, used for the impairment test, is based on
the following key assumptions which are relevant for all CGUs:
- increase of expected future labour expenses of 2.0% ( 2017:
2.0%);
-future interest rates projected per geographical market, for
the European Monetary Union, the UK and the US;
-future exchange rate of 1.25 US$/€ (20 17: 1.25 US$/€) to
convert in euro the portion of future US dollar which is
not hedged (see “— Note 35: Information about Financial
Instruments”).
General economic data derived from external macroeconomic
and fi nancial studies have been used to derive the general key
assumptions.
In addition to these general planning assumptions, the following
additional CGU specific assumptions, which represent
management’s current best assessment as of the date of
these Consolidated Financial Statements, have been applied
in individual CGUs.
Airbus
-The planning takes into account the current production rate
assumptions and provides an assessment of expected future
deliveries on that basis.
-In the absence of long-term fi nancial reference, expected cash
fl ows generated beyond the planning horizon are considered
through a terminal value.
-Long-term commercial assumptions in respect of market
share, deliveries and market value are based on General
Market Forecast updated in 2018. Th e development of market
share per segment considers enlargement of the competition
as per current best assessment. Current market evolutions
are considered through sensitivities.
-Due to the signifi cant hedge portfolio, the carrying value
and planned cash fl ows of the CGU Airbus are materially
infl uenced.
-Cash fl ows are discounted using a euro weighted pre-tax
WACC of 10.6% (2017: 9. 6%).
Airbus Helicopters
-The planning takes into account the evolution of programmes
based upon the current backlog and an assessment of order
intake for platforms and services.
-In the absence of long-term fi nancial reference, expected cash
fl ows generated beyond the planning horizon are considered
through a terminal value.
-Long-term commercial assumptions in respect of market
share, deliveries and market value are based on the helicopter
market forecast considering the decrease over recent years
in the civil and parapublic market partially driven by decrease
of investment in oil and gas, needs of helicopter fl eet renewal
and growth markers and the increase of Airbus Helicopters
market share in this environment. Current market evolutions
are considered through sensitivities.
-Cash fl ows are discounted using a euro weighted pre-tax
WACC of 10.4% (2017: 9. 7%).
Airbus Defence and Space
-Overall the defence and space markets are expected to grow
at a steady rate during the period of the operative planning
horizon.
-Business growth is underpinned by growing defence
opportunities boosted after fi nalisation of the successful
portfolio re-shaping programme. Underlying performance
is improved by focusing on project delivery, cost control and
effi ciency.
-In the absence of long-term fi nancial reference, expected cash
fl ows generated beyond the planning horizon are considered
through a terminal value.
-Cash fl ows are discounted using a euro weighted pre-tax
WACC of 9.1% (2017: 8. 3%).
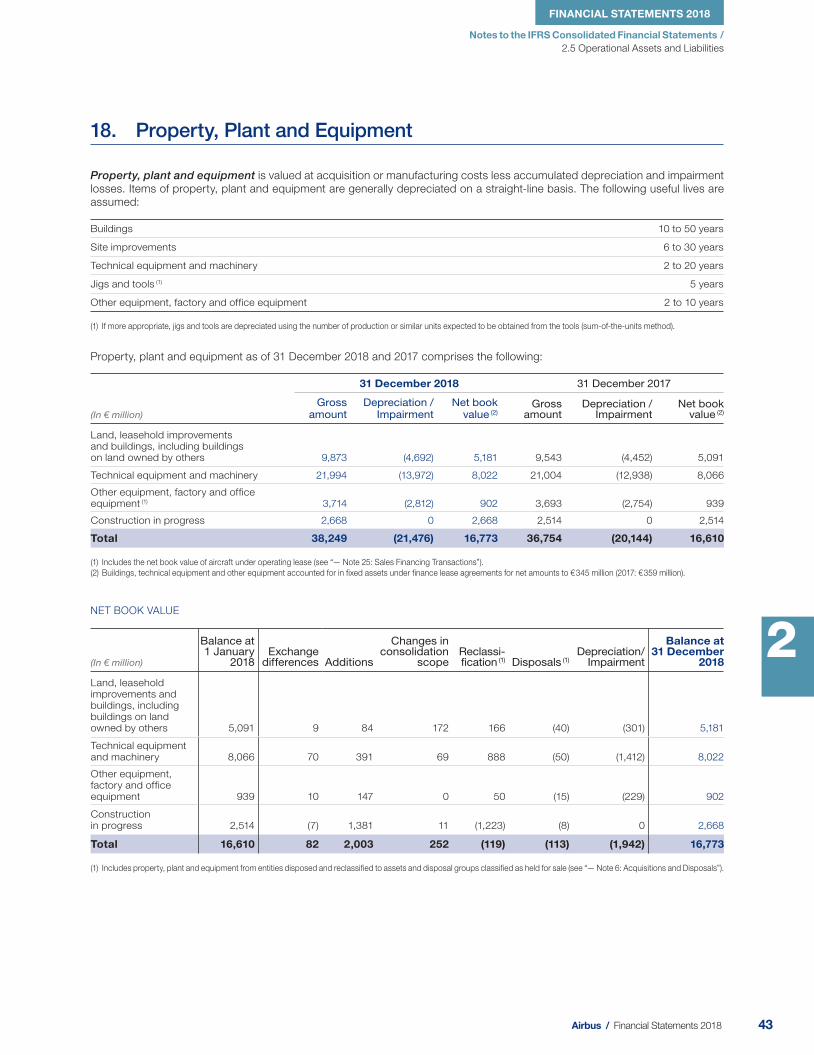
43 Airbus / Financial Statements 2018
Notes to the IFRS Consolidated Financial Statements /
FINANCIAL STATEMENTS 2018
2.5 Operational Assets and Liabilities
2
18. Property, Plant and Equipment
Property, plant and equipment is valued at acquisition or manufacturing costs less accumulated depreciation and impairment
losses. Items of property, plant and equipment are generally depreciated on a straight-line basis. The following useful lives are
assumed:
Buildings 10 to 50 years
Site improvements 6 to 30 years
Technical equipment and machinery 2 to 20 years
Jigs and tools (1) 5 years
Other equipment, factory and office equipment 2 to 10 years
(1) If more appropriate, jigs and tools are depreciated using the number of production or similar units expected to be obtained from the tools (sum-of-the-units method).
Property, plant and equipment as of 31 December 2018 and 2 017 comprises the following:
(In € million)
31 December 2018 31 December 2017
Gross amount
Depreciation /Impairment
Net book value (2 )
Gross amount
Depreciation /Impairment
Net book value (2 )
Land, leasehold improvements and buildings, including buildings on land owned by others 9,873 (4,692) 5,181 9,543 (4,452) 5,091
Technical equipment and machinery 21,994 (13,972) 8,022 21,004 (12,938) 8,066
Other equipment, factory and office equipment (1 ) 3,714 (2,812) 902 3,693 (2,754) 939
Construction in progress 2,668 0 2,668 2,514 0 2,514
Total 38,249 (21,476) 16,773 36,754 (20,144) 16,610
(1) Includes the net book value of aircraft under operating lease (see “— Note 25: Sales Financing Transactions”).
(2) Buildings, technical equipment and other equipment accounted for in fixed assets under finance lease agreements for net amounts to € 345 million (2017: € 359 million).
NET BOOK VALUE
(In € million)
Balance at 1 January
2018 Exchange
differences Additions
Changes in consolidation
scope Reclassi-fication (1) Disposals (1)
Depreciation/Impairment
Balance at 31 December
2018
Land, leasehold improvements and buildings, including buildings on land owned by others 5,091 9 84 172 166 (40) (301) 5,181
Technical equipment and machinery 8,066 70 391 69 888 (50) (1,412) 8,022
Other equipment, factory and office equipment 939 10 147 0 50 (15) (229) 902
Construction in progress 2,514 (7) 1,381 11 (1,223) (8) 0 2,668
Total 16,610 82 2,003 252 (119) (113) (1,942) 16,773
(1) Includes property, plant and equipment from entities disposed and reclassified to assets and disposal groups classified as held for sale (see “— Note 6: Acquisitions and Disposals”).

44 Airbus / Financial Statements 2018
Notes to the IFRS Consolidated Financial Statements / 2.5 Operational Assets and Liabilities
(In € million)
Balance at 1 January
2017Exchange
differences Additions
Changes in consolidation
scope Reclassi-fication (1) Disposals (1)
Depreciation/Impairment
Balance at 31 December
2017
Land, leasehold improvements and buildings, including buildings on land owned by others 5,192 (58) 123 (1) 167 (41) (291) 5,091
Technical equipment and machinery 8,255 (128) 429 7 900 (17) (1,380) 8,066
Other equipment, factory and office equipment 994 (29) 335 3 79 (220) (223) 939
Construction in progress 2,472 (22) 1,452 0 (1,384) (4) 0 2,514
Total 16,913 (237) 2,339 9 (238) (282) (1,894) 16,610
(1) Includes property, plant and equipment from entities disposed and reclassified to assets and disposal groups classified as held for sale (see “— Note 6: Acquisitions and Disposals”).
Property, plant and equipment increased by € +163 million to € 16,773 million (2017: € 16,610 million), mainly at Airbus Defence
and Space (€ +150 million).
For details on assets related to lease arrangements on sales fi nancing, see “— Note 25: Sales Financing Transactions”.
PROPERTY, PLANT AND EQUIPMENT BY GEOGRAPHICAL AREAS
(In € million)
31 December
2018 2017
France 7,630 7,222
Germany 4,281 4,649
UK 2,141 2,193
Spain 1,500 1,613
Other countries 1,176 881
Total 16,728 16,558
(1) Property, plant and equipment by geographical areas excludes leased assets of € 45 million (201 7: € 52 million).
Off-Balance Sheet CommitmentsCommitments related to property, plant and equipment comprise contractual commitments for future capital
expenditures and contractual commitments for purchases of
“Land, leasehold improvements and buildings including buildings
on land owned by others” (€ 256 million as of 31 Dec ember 2018,
2017: € 257 million).
Future nominal operating lease payments (for the Company as
a lessee) for rental and lease agreements not relating to aircraft
sales fi nancing amount to € 1,494 million as of 31 December
2 018 (2017: € 1,025 million), and relate mainly to procurement
operations (e.g. facility leases).
Maturities as of 31 December 2018 and 2017 are as follow s:
(In € million)
31 December
2018 2017
Not later than 1 year 261 202
Later than 1 year and not later than 5 years 696 516
Later than 5 years 537 307
Total 1,494 1,025

45 Airbus / Financial Statements 2018
Notes to the IFRS Consolidated Financial Statements /
FINANCIAL STATEMENTS 2018
2.5 Operational Assets and Liabilities
2
19. Other Investments and Other Long-Term Financial Assets
(In € million)
31 December
2018 2017
Other investments 2,267 2,441
Other long-term financial assets 1,544 1,763
Total non-current other investments and other long-term financial assets 3,811 4,204
Current portion of other long-term financial assets 489 529
Total 4,300 4,733
Contract Assets, Contract Liabilities and Trade ReceivablesSignifi cant changes in contract assets and contract liabilities during the period are as follows:
(In € million)
2018
Contract assets Contract liabilities
Revenue recognised that was included in the contract liability balance at 1 January - (23,464)
Increase due to cash received, excluding amounts recognised as revenue - 23,472
Transfers from contract assets recognised at the beginning of the period (2,740) -
Increase as a result of changes in the measure of progress 3,074 -
As of 31 December 2018, trade receivables amounting to € 583 million (2017: € 964 million) will mature after more than one year.
Other investments mainly comprise the Company’s
participations. The signifi cant participations at 31 December
2018 include the remaining investment in Dassault Aviation
( 9.89%, 2 017: 9.93%) amounting to € 999 million (2017
€ 1,071 million).
Other long-term financial assets and the current portion of other long-term financial assets include other loans in
the amount of € 1,523 million as of 31 Decembe r 2018 (2017:
€ 1,5 21 million), and the sales fi nancing activities in the form
of fi nance lease receivables and loans from aircraft fi nancing.
20. Contract A ssets, Contract Liabilities and Trade Receivables, and Trade Liabilities
Contract assets represent the Company’s right to consideration
in exchange for goods or services that the Company has
transferred to a customer when that right is conditioned by
something other than the passage of time (e.g. revenue
recognised from the application of the PoC method before the
Company has a right to invoice).
Contract liabilities represent the Company’s obligation to transfer
goods or services to a customer for which the Company has
received consideration, or for which an amount of consideration
is due from the customer (e.g. advance payments received ).
Net contract assets and contract liabilities are determined
for each contract separately. For serial contracts, contract
liabilities are presented in current contract liabilities, if revenues
are expected within the next twelve months or material expenses
for the manufacturing process have already occurred. For
long- term production contracts (e.g. governmental contracts
such as A400M, Tiger, NH90), contract liabilities are classifi ed as
current when the relating inventories or receivables are expected
to be recognised within the normal operating cycle of the long-
term contract.
Trade receivables arise when the Company provides goods
or services directly to a customer with no intention of trading
the receivable. Trade receivables include claims arising from
revenue recognition that are not yet settled by the debtor as
well as receivables relating to construction contracts. Trade
receivables are initially recognised at their transaction prices
and are subsequently measured at amortised cost less any
allowances for impairment. Gains and losses are recognised
in the Consolidated Income Statement when the receivables
are derecognised, impaired or amortised.
Impairment and allowances of trade receivables and contract assets are measured at an amount equal to the
life-time expected loss as described in “— Note 4: Change in
Accounting Policies and Disclosures”.

46 Airbus / Financial Statements 2018
Notes to the IFRS Consolidated Financial Statements / 2.5 Operational Assets and Liabilities
The respective movement in the allowance for doubtful accounts in respect of trade receivables and contract assets during the
period was as follows:
(In € million) 2018 2017 (1)
Allowance balance at 1 January (252) (245)
Foreign currency translation adjustment (5) 2
Utilisations / disposals and business combinations 28 37
Additions (40) (46)
Allowance balance at 31 December (2) (269) (252)
(1) Previous year figures are restated due to the application of IFRS 15.
(2) Thereof, € 2 million relates to contracts assets (2017: € 3 million).
Trade LiabilitiesTrade liabilities of € 16,237 million (201 7 (restated): € 13,406 million) increased by € +2,831 million, mainly in Airbus.
As of 31 Decemb er 2018, trade liabilities amounting to € 29 million (2017: € 24 mi llion) will mature after more than one year.
21. Inventories
(In € million)
31 December 2018 31 December 2017 (1)
Gross amount
Write-down
Net book value
Gross amount
Write-down
Net book value
Raw materials and manufacturing supplies 3,827 (554) 3,273 3,231 (484) 2,747
Work in progress 23,119 (1,476) 21,643 22,176 (1,911) 20,265
Finished goods and parts for resale 3,949 (555) 3,394 3,487 (612) 2,875
Advance payments to suppliers 3,631 (50) 3,581 3,916 (66) 3,850
Total 34,526 (2,635) 31,891 32,810 (3,073) 29,737
(1) Previous year figures are restated due to the application of IFRS 15.
Inventories of € 31,891 million (201 7 (restated): € 29,737 million)
increased by € +2,154 million. This is driven by Airbus
(€ +2,128 million) refl ecting an increase in work in progress
associated with the A320 programme ramp-up, including the
impact of late engine deliveries.
Write-downs for inventories are recorded when it becomes
probable that total estimated contract costs will exceed total
contract revenue. In 2018, write- downs of inventories in the
amount of € -883 million (2017 (restated) : € -1,108 million) are
recognised in cost of sales, whereas reversal of write-downs
amounts to € 264 million (2017 (restated): € 10 2 million). At
31 December 2018, € 20,6 26 million of work in progress and
€ 3,130 million of fi nished goods and parts for resale were carried
at net realisable value.
Inventories recognised as an expense during the period amount
to € 44,437 million (2017 (restated): € 39,828 million) .
In the year of implementation, the Company does not disclose
signifi cant changes in the contract assets and the contract
liabilities for the prior year. The high costs linked to its creation
would have not justifi ed the result in terms of additional useful
information to be provided.

47 Airbus / Financial Statements 2018
Notes to the IFRS Consolidated Financial Statements /
FINANCIAL STATEMENTS 2018
2.5 Operational Assets and Liabilities
2
Provisions for pensions decreased mainly due to contributions made into the various pension vehicles.
Other provisions are presented net of programme losses against inventories (see “— Note 21: Inventories”) and increased
due to the inclusion of liabilities related to acquired customer contracts linked to the acquisition of CSALP (see “— Note 6:
Acquisitions and Disposals”) and due to the A380 net charge recorded in 2018 (see “— Note 10: Revenue and Gross Margin”).
Movements in other provisions during the year were as follows:
(In € million)
Balance at 1 January
2018 Exchange
differences
Increase from
passage of time Additions
Reclassification/ Change in
consolidated group Used Released
Balance at 31 December
2018
Onerous contracts (1) 1,828 51 0 2,374 2,617 (1,328) (53) 5,489
Outstanding costs (1) 1,606 1 0 468 (81) (577) (93) 1,324
Aircraft financing risks (1) (2) 1 0 0 2 8 0 (5) 6
Obligation from services and maintenance agreements 492 0 8 67 194 (82) (28) 651
Warranties (1) 267 0 1 108 22 (57) (14) 327
Personnel-related provisions (3) 1,019 0 3 427 37 (452) (114) 920
Litigation and claims 288 0 0 116 244 (45) (16) 587
Asset retirement 158 0 (6) 2 0 0 (1) 153
Other risks and charges (1) 2,031 (2) 0 1,492 (603) (317) (242) 2,359
Total (1) 7,690 50 6 5,056 2,438 (2,858) (566) 11,816
(1) Previous year figures are restated due to the application of IFRS 15.
(2) See “— Note 25: Sales Financing Transactions”.
(3) See “— Note 28: Personnel-Related Provisions”.
Provisions for onerous contracts in 2018 mainly include the provisions related to the A380 and A400M programmes
(see “— Note 10: Revenue and Gross Margin” and “— Note 21: Inventories”). Reclassifi cation / Change in consolidated group
mainly relates to the liabilities associated to the CSALP acquisition (see “— Note 6: Acquisitions and Disposals”).
The majority of the addition to provisions for outstanding costs relates to Airbus Helicopters (€ 307 million) as well as to Airbus
Defence and Space (€ 110 million).
Provisions for litigations and claims include the arbitral award relating to the Republic of China (Taiwan). For more details,
see “— Note 36: Litigation and Claims”.
22. Provisions, Contingent Assets and Contingent Liabilities
Provisions — The determination of provisions, e.g. for onerous
contracts, warranty costs, restructuring measures and legal
proceedings is based on best available estimates.
In general, in the aerospace sector, the contractual and technical
parameters considered for provision calculations are complex.
Hence uncertainty exists with regard to the timing and amounts
of expenses to be taken into account.
The majority of other provisions are generally expected to result
in cash outfl ows during the next 1 to 12 years.
(In € million)
31 December
2018 2017
Provisions for pensions (2) 7,072 8,361
Other provisions (1) 11,816 7,690
Total (1) 18,888 16,051
thereof non-current portion (1) 11,571 9,779
thereof current portion (1) 7,317 6,272
(1) Previous year figures are restated due to the application of IFRS 15.
(2) See “— Note 29: Post-Employment Benefits”.

48 Airbus / Financial Statements 2018
Notes to the IFRS Consolidated Financial Statements / 2.5 Operational Assets and Liabilities
Personnel-related provisions include restructuring provisions and other personnel charges. For more details, see “— Note 28:
Personnel-Related Provisions”.
An H225 Super Puma helicopter was involved in an accident on 29 April 2016. Management is cooperating fully with the authorities
and have agreed a retrofi t plan for the implementation of corrective measures. An estimate of the related net future costs has
been prepared and is included in other provisions.
23. Other Financial Assets an d Other Financial Liabilities
Other Financial Assets
(In € million)
31 December
2018 2017
Positive fair values of derivative financial instruments (1) 1,031 2,901
Others 77 79
Total non-current other financial assets 1,108 2,980
Receivables from related companies 1,082 992
Positive fair values of derivative financial instruments (1) 286 663
Others 443 324
Total current other financial assets 1,811 1,979
Total 2,919 4,959
(1) See “— Note 35: Information about Financial Instruments”.
Other Financial Liabilities
(In € million)
31 December
2018 2017
Liabilities for derivative financial instruments (2) 1,132 1,127
European Governments’ refundable advances 4,233 5,537
Others (1) (2) 2,644 40
Total non-current other financial liabilities (1) 8,009 6,704
Liabilities for derivative financial instruments (2) 1,623 1,144
European Governments’ refundable advances (3) 344 364
Liabilities to related companies (1) 175 199
Others 320 343
Total current other financial liabilities (1) 2,462 2,050
Total (1) 10,471 8,754
thereof other financial liabilities due within 1 year (1) 2,125 2,041
(1) Previous year figures are restated due to the application of IFRS 15.
(2) See “— Note 35: Information about Financial Instruments”.
(3) Refundable advances from European Governments are provided to the Company to finance research and development activities for certain projects on a risk-sharing basis, i.e.
they are repaid to the European Governments subject to the success of the project.
Contingent assets and contingent liabilities — The Company
is exposed to technical and commercial contingent obligations
due to the nature of its businesses. To mitigate this exposure,
the Company has subscribed a Global Aviation Insurance
Programme (“GAP”). Information required under IAS 37
“Provisions, Contingent Assets and Contingent Liabilities” is
not disclosed if the Company concludes that disclosure can
be expected to prejudice seriously its position in a dispute with
other parties.
For other contingent liabilities, see “— Note 36: Litigation and
Claims” and “— Note 10: Revenue and Gross Margin” (mainly
A400M programme).
Other commitments include contractual guarantees
and performance bonds to certain customers as well as
commitments for future capital expenditures and amounts
which may be payable to commercial intermediaries if future
sales materialise.

49 Airbus / Financial Statements 2018
Notes to the IFRS Consolidated Financial Statements /
FINANCIAL STATEMENTS 2018
2.5 Operational Assets and Liabilities
2
The total net fair value of derivative financial instruments
deteriorated by € -2,731 million to € -1,438 million (2017:
€ 1,293 million) as a result of the strengthening of the US dollar
versus the euro associated with the mark to market valuation
of the hedge portfolio.
The European Governments’ refundable advances decreased
by € -1,324 million to € 4,577 million (2017: € 5,901 mil lion),
primarily related to the update on the A380 programme
(see “— Note 10: Revenue and Gross Margin”).
24. Other Assets and Othe r Liabilities
Other Assets
(In € million)
31 December
2018 2017
Cost to fulfil a contract (1) 777 868
Prepaid expenses (1) 33 15
Others (1) 78 92
Total non-current other assets (1) 888 975
Value added tax claims 3,255 1,892
Cost to fulfil a contract (1) 464 522
Prepaid expenses (1) 121 146
Others (1) 406 377
Total current other assets (1) 4,246 2,937
Total (1) 5,134 3,912
(1) Previous year figures are restated due to the application of IFRS 15.
Other Liabilities
(In € million)
31 December
2018 2017
Others (1) 460 298
Total non-current other liabilities (1) 460 298
Tax liabilities (excluding income tax) 2,706 1,397
Others 2,582 2,512
Total current other liabilities (1) 5,288 3,909
Total (1) 5,748 4,207
thereof other liabilities due within 1 year (1) 5,288 3,909
(1) Previous year figures are restated due to the application of IFRS 15.
50 Airbus / Financial Statements 2018
Notes to the IFRS Consolidated Financial Statements / 2.5 Operational Assets and Liabilities
25. Sales Financing Transactions
Sales financing — With a view to facilitating aircraft sales for
Airbus and Airbus Helicopters, the Company may enter into
either on-balance sheet or off-balance sheet sales financing
transactions.
On-balance sheet transactions where the Company is
lessor are classified as operating leases, finance leases and
loans, inventories and to a minor extent, equity investments:
(i) Operating leases – Aircraft leased out under operating leases
are included in property, plant and equipment at cost less
accumulated depreciation (see “— Note 18: Property, Plant
and Equipment”). Rental income from operating leases is
recorded as revenue on a straight-line basis over the term of
the lease.
(ii) Finance leases and loans – When, pursuant to a financing
transaction, substantially all the risks and rewards of ownership
of the financed aircraft reside with a third party, the transaction
is characterised as either a finance lease or a loan. In such
instances, revenue from the sale of the aircraft are recorded
upon delivery, while financial interest is recorded over time
as financial income. The outstanding balance of principal is
recorded on the statement of financial position (on-balance
sheet) in long-term financial assets, net of any accumulated
impairments.
(iii) Inventories – Second hand aircraft acquired as part of a
commercial buyback transaction, returned to Airbus after
a payment default or at the end of a lease agreement are
classified as inventories held for resale if there is no subsequent
lease agreement in force (see “— Note 21: Inventories”).
Off-balance sheet commitments — Financing commitments
are provided to the customer either as backstop commitments
before delivery, asset value guarantees at delivery, operating
head-lease commitments or counter guarantees:
(i) Backstop commitments are guarantees by Airbus, made
when a customer-order is placed, to provide financing to
the customer in the event that the customer fails to secure
sufficient funding when payment becomes due under the order.
Such commitments are not considered to be part of Gross
Customer Financing Exposure as (i) the financing is not in
place, (ii) commitments may be transferred in full or part to
third parties prior to delivery, (iii) past experience suggests it
is unlikely that all such proposed financings actually will be
implemented and, (iv) Airbus retains the asset until the aircraft
is delivered and does not incur an unusual risk in relation
thereto. In order to mitigate customer credit risks for Airbus,
such commitments typically contain financial conditions which
guaranteed parties must satisfy in order to benefit therefrom.
(ii) Asset value guarantees are guarantees whereby Airbus
guarantees a portion of the value of an aircraft at a specific
date after its delivery. Airbus considers the financial risks
associated with such guarantees to be acceptable, because
(i) the guarantee only covers a tranche of the estimated future
value of the aircraft, and its level is considered prudent in
comparison to the estimated future value of each aircraft, and
(ii) the exercise dates of outstanding asset value guarantees
are distributed through 2030.
As of 31 Decembe r 2018, the nominal value of asset value
guarantees considered as variable considerations under
IFRS 15 provided to benefi ciaries amounts to € 639 million
(2017: € 722 mil lion), excluding € 27 million (2017: € 30 million)
w here the risk is considered to be remote. The present
value of the risk inherent in asset value guarantees where a
settlement is being considered probable is fully provided for
and included in the total of contract liabilities for an amount
of € 511 million (2017 restated: € 582 millio n) (see “— Note 20:
Contract Assets, Contract Liabilities and Trade Receivables,
and Trade Liabilities”).
(iii) Operating head-lease commitments – Airbus has entered into
head-lease sub-lease transactions in which it acts as a lessee
under an operating head-lease and lessor under the sub-lease.
Airbus’ customer financing exposure to operating head-lease
commitments is determined as the present value of the future
head-lease payments. There was no net exposure for such
leases as of 31 December 2018 and 2017.
Exposure — In terms of risk mana gement, the Company
manages its gross exposure arising from its sales financing
activities (“Gross Customer Financing Exposure”) separately
for (i) customer’s credit risk and (ii) asset value risk.
Gross Customer Financing Exposure is the sum of (i) the
book value of operating leases before impairment, (ii) the
outstanding principal amount of finance leases or loans
due before impairment, (iii) the guaranteed amounts under
financial guarantees and the net present value of head-lease
commitments, (iv) the book value of second hand aircraft for
resale before impairment, and (v) the outstanding value of
any other investment in sales financing structured entities
before impairment. This Gross Customer Financing Exposure
may differ from the value of related assets on the Company’s
Statement of Financial Position and related off-balance
sheet contingent commitments, mainly because (i) assets
are recorded in compliance with IFRS, but may relate to
transactions that are financed on a limited recourse basis
and (ii) the carrying amount of the assets on the Consolidated
Statement of Financial Position may have been adjusted for
impairment losses.
Gross Customer Financing Exposure amounts to US$ 1.0 billion
(€ 0.9 billion) (2017: US$ 1.7 billion (€ 1.4 billion)).
Net exposure is the difference between Gross Customer
Financing Exposure and the collateral value. Collateral value
is assessed using a dynamic model based on the net present
value of expected future receivables, expected proceeds
from resale and potential cost of default. This valuation
model yields results that are typically lower than residual
value estimates by independent sources in order to allow for
what management believes is its conservative assessment of
market conditions and for repossession and transformation
costs. The net exposure is provided for by way of impairment
losses and other provisions.
Impairment losses and provisions — For the purpose of
measuring an impairment loss, each transaction is tested
individually. Impairment losses relating to aircraft under
operating lease and second hand aircraft for resale (included
in inventory) are recognised for any excess of the aircraft’s
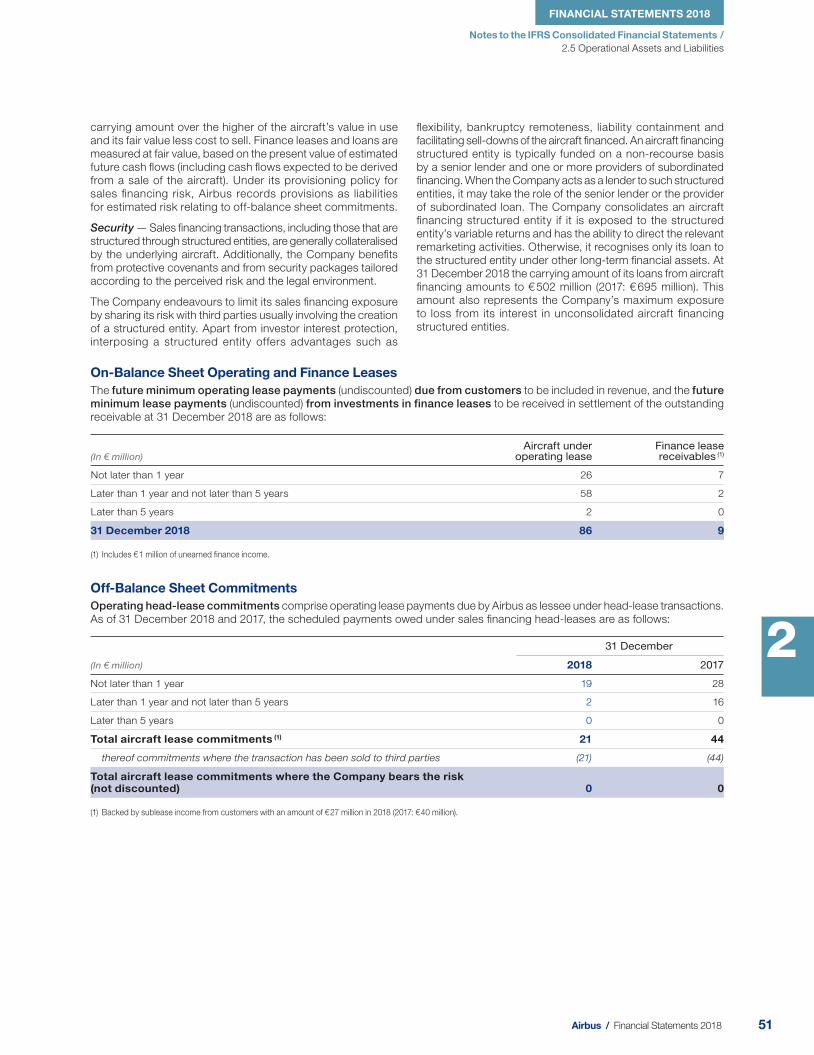
51 Airbus / Financial Statements 2018
Notes to the IFRS Consolidated Financial Statements /
FINANCIAL STATEMENTS 2018
2.5 Operational Assets and Liabilities
2
On-Balance Sheet Operating and Finance LeasesThe future minimum operating lease payments (undiscounted) due from customers to be included in revenue, and the future minimum lease payments (undiscounted) from investments in finance leases to be received in settlement of the outstanding
receivable at 31 December 2018 are as follows:
(In € million) Aircraft under
operating lease Finance lease receivables (1)
Not later than 1 year 26 7
Later than 1 year and not later than 5 years 58 2
Later than 5 years 2 0
31 December 2018 86 9
(1) Includes € 1 million of unearned finance income.
Off-Balance Sheet CommitmentsOperating head-lease commitments comprise operating lease payments due by Airbus as lessee under head-lease transactions.
As of 31 December 2018 and 2017, the scheduled payments owed under sales fi nancing head-leases are as follows:
(In € million)
31 December
2018 2017
Not later than 1 year 19 28
Later than 1 year and not later than 5 years 2 16
Later than 5 years 0 0
Total aircraft lease commitments (1) 21 44
thereof commitments where the transaction has been sold to third parties (21) (44)
Total aircraft lease commitments where the Company bears the risk(not discounted) 0 0
(1) Backed by sublease income from customers with an amount of € 27 million in 201 8 (201 7: € 40 million).
carrying amount over the higher of the aircraft’s value in use
and its fair value less cost to sell. Finance leases and loans are
measured at fair value, based on the present value of estimated
future cash fl ows (including cash fl ows expected to be derived
from a sale of the aircraft). Under its provisioning policy for
sales fi nancing risk, Airbus records provisions as liabilities
for estimated risk relating to off-balance sheet commitments.
Security — Sales fi nancing transactions, including those that are
structured through structured entities, are generally collateralised
by the underlying aircraft. Additionally, the Company benefi ts
from protective covenants and from security packages tailored
according to the perceived risk and the legal environment.
The Company endeavours to limit its sales fi nancing exposure
by sharing its risk with third parties usually involving the creation
of a structured entity. Apart from investor interest protection,
interposing a structured entity offers advantages such as
fl exibility, bankruptcy remoteness, liability containment and
facilitating sell-downs of the aircraft fi nanced. An aircraft fi nancing
structured entity is typically funded on a non-recourse basis
by a senior lender and one or more providers of subordinated
fi nancing. When the Company acts as a lender to such structured
entities, it may take the role of the senior lender or the provider
of subordinated loan. The Company consolidates an aircraft
fi nancing structured entity if it is exposed to the structured
entity’s variable returns and has the ability to direct the relevant
remarketing activities. Otherwise, it recognises only its loan to
the structured entity under other long-term fi nancial assets. At
31 December 2018 the carrying amount of its loans from air craft
fi nancing amounts to € 502 million (2017: € 695 million). This
amount also represents the Company’ s maximum exposure
to loss from its interest in unconsolidated aircraft fi nancing
structured entities.
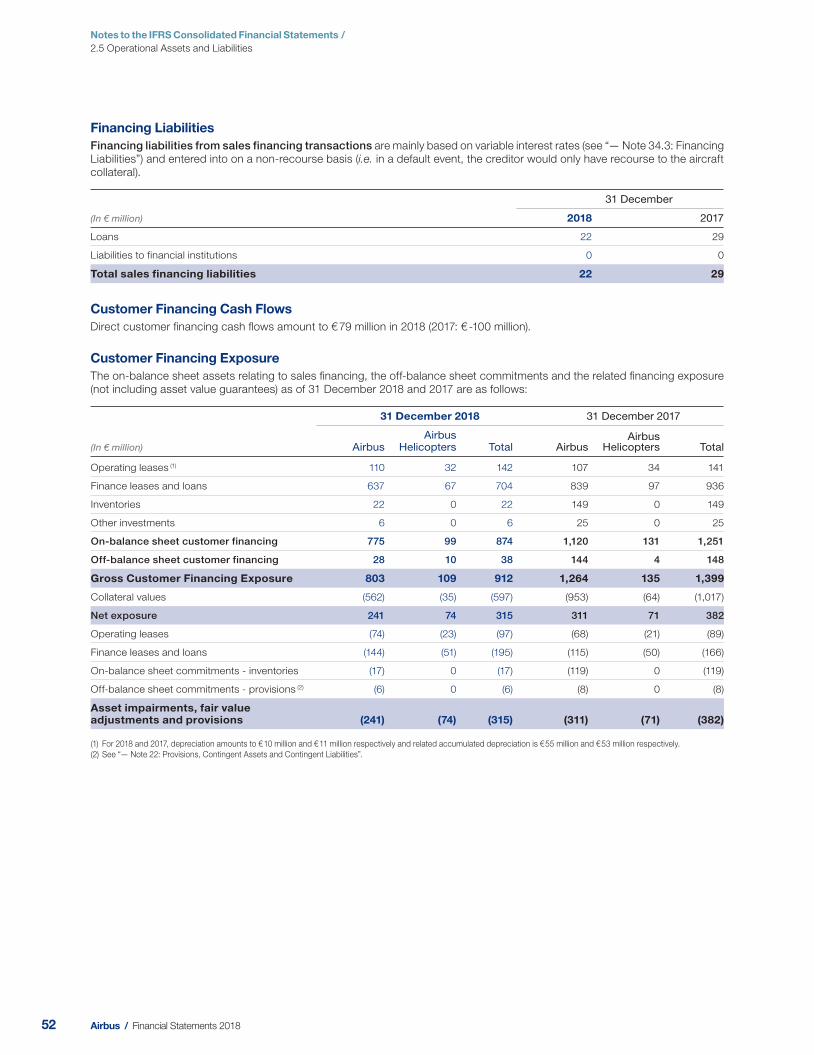
52 Airbus / Financial Statements 2018
Notes to the IFRS Consolidated Financial Statements / 2.5 Operational Assets and Liabilities
Financing LiabilitiesFinancing liabilities from sales financing transactions are mainly based on variable interest rates (see “— Note 34.3: Financing
Liabilities”) and entered into on a non-recourse basis (i.e. in a default event, the creditor would only have recourse to the aircraft
collateral).
(In € million)
31 December
2018 2017
Loans 22 29
Liabilities to financial institutions 0 0
Total sales financing liabilities 22 29
Customer Financing Cash FlowsDirect customer fi nancing cash fl ows amount to € 79 million in 201 8 (201 7: € -100 million).
Customer Financing ExposureThe on-balance sheet assets relating to sales fi nancing, the off-balance sheet commitments and the related fi nancing exposure
(not including asset value guarantees) as of 31 Dec ember 2018 and 2017 ar e as follows:
(In € million)
31 December 2018 31 December 2017
Airbus Airbus
Helicopters Total Airbus Airbus
Helicopters Total
Operating leases (1) 110 32 142 107 34 141
Finance leases and loans 637 67 704 839 97 936
Inventories 22 0 22 149 0 149
Other investments 6 0 6 25 0 25
On-balance sheet customer financing 775 99 874 1,120 131 1,251
Off-balance sheet customer financing 28 10 38 144 4 148
Gross Customer Financing Exposure 803 109 912 1,264 135 1,399
Collateral values (562) (35) (597) (953) (64) (1,017)
Net exposure 241 74 315 311 71 382
Operating leases (74) (23) (97) (68) (21) (89)
Finance leases and loans (144) (51) (195) (115) (50) (166)
On-balance sheet commitments - inventories (17) 0 (17) (119) 0 (119)
Off-balance sheet commitments - provisions (2) (6) 0 (6) (8) 0 (8)
Asset impairments, fair value adjustments and provisions (241) (74) (315) (311) (71) (382)
(1) For 2018 and 2017, depreciation amounts to € 10 million and € 11 million respectively and related accumulated depreciation is € 55 million and € 53 million respectively.
(2) See “— Note 22: Provisions, Contingent Assets and Contingent Liabilities”.
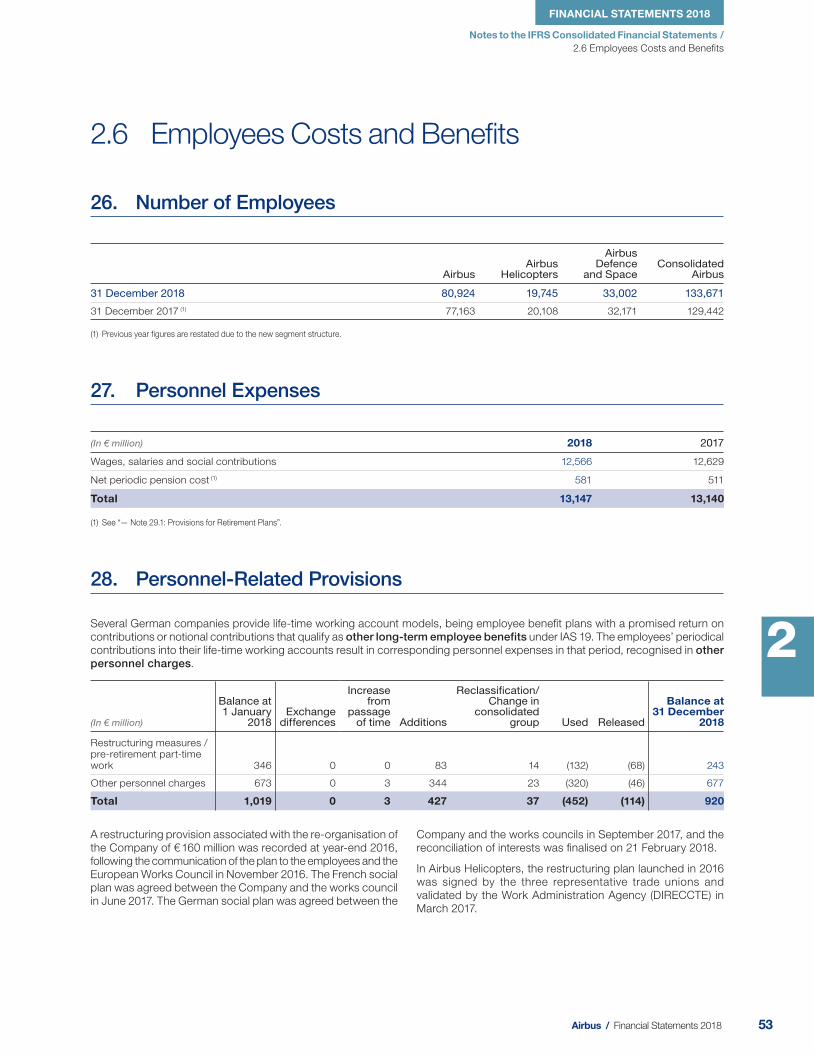
53 Airbus / Financial Statements 2018
Notes to the IFRS Consolidated Financial Statements /
FINANCIAL STATEMENTS 2018
2.6 Employees Costs and Benefi ts
2
2.6 Employees Costs and Benefi ts
26. Number of Employees
Airbus Airbus
Helicopters
Airbus Defence
and Space Consolidated
Airbus
31 December 2018 80,924 19,745 33,002 133,671
31 December 2017 (1) 77,163 20,108 32,171 129,442
(1) Previous year figures are restated due to the new segment structure.
A restructuring provision associated with the re-organisation of
the Company of € 160 million was recorded at year-end 2016,
following the communication of the plan to the employees and the
European Works Council in November 2016. The French social
plan was agreed between the Company and the works council
in June 2017. The German social plan was agreed between the
Company and the works councils in September 2017, and the
reconciliation of interests was fi nalised on 21 February 2018.
In Airbus Helicopters, the restructuring plan launched in 2016
was signed by the three representative trade unions and
validated by the Work Administration Agency (DIRECCTE) in
March 2017.
27. Personnel Expenses
(In € million) 2018 2017
Wages, salaries and social contributions 12,566 12,629
Net periodic pension cost (1) 581 511
Total 13,147 13,140
(1) See “— Note 29.1: Provisions for Retirement Plans”.
28. Personnel-Related Provisions
Several German companies provide life-time working account models, being employee benefi t plans with a promised return on
contributions or notional contributions that qualify as other long-term employee benefits under IAS 19. The employees’ periodical
contributions into their life-time working accounts result in corresponding personnel expenses in that period, recognised in other personnel charges.
(In € million)
Balance at 1 January
2018 Exchange
differences
Increase from
passage of time Additions
Reclassification/Change in
consolidated group Used Released
Balance at 31 December
2018
Restructuring measures / pre-retirement part-time work 346 0 0 83 14 (132) (68) 243
Other personnel charges 673 0 3 344 23 (320) (46) 677
Total 1,019 0 3 427 37 (452) (114) 920

54 Airbus / Financial Statements 2018
Notes to the IFRS Consolidated Financial Statements / 2.6 Employees Costs and Benefi ts
29. Post -Employment Benefi ts
(In € million)
31 December
2018 2017
Provisions for retirement plans 6,474 7,127
Provisions for deferred compensation 598 1,234
Retirement plans and similar obligations 7,072 8,361
29.1 Provisions for Retirement PlansWhen the Company employees retire, they receive indemnities
as stipulated in retirement agreements, in accordance with
regulations and practices of the countries in which it operates.
France — The French pension system is operated on a “pay
as you go” basis. Besides the basic pension from the French
social security system, each employee is entitled to receive a
complementary pension from defi ned contribution schemes
Association pour le régime de retraite complémentaire des
salariés (“ARRCO”) and Association générale des institutions de
retraite des cadres (“AGIRC”). Moreover, French law stipulates
that employees are paid retirement indemnities in the form of
lump sums on the basis of the length of service, which are
considered as defi ned obligations.
Germany — The Company has a pension plan (P3) for executive
and non-executive employees in place. Under this plan, the
employer provides contributions for the services rendered by
the employees, which are dependent on their salaries in the
respective service period. These contributions are converted
into components which become part of the accrued pension
liability at the end of the year. Total benefi ts are calculated as
a career average over the entire period of service. Certain
employees that are not covered by this plan receive retirement
indemnities based on salary earned in the last year or on
an average of the last three years of employment. For some
executive employees, benefi ts are dependent on the fi nal salary
of the respective individual at the date of retirement and the time
period served as an executive.
In 2018, Airbus introduced the new Airbus Pensions Plan (“APP”)
with security-linked benefi ts in Germany, which all new entrants
after 1 January 2018 will join. Accordingly, the existing pension
plan has been closed for new entrants. As of 1 January 2019
deferred compensation which is fi nanced by the employees is
offered exclusively in APP for all employees.
Parts of the pension obligation in Germany are funded by
assets invested in specifi c funding vehicles. Besides a relief
fund (“Unterstützungskasse”), the Company has implemented
a Contractual Trust Arrangement. The Contractual Trust
Arrangement structure is that of a bilateral trust arrangement.
Assets that are transferred to the relief fund and the Contractual
Trust Arrangement qualify as plan assets under IAS 19.
UK — The Company UK Pension Scheme (“the Scheme”) was
implemented by Airbus Defence and Space Ltd., Stevenage
(UK) as the principal employer. This plan comprises all eligible
employees of Airbus Defence and Space Ltd. as well as
all personnel, who were recruited by one of the Company
subsidiaries located in the UK and participating in the scheme.
The major part of the obligation is funded by scheme assets
due to contributions of the participating companies. The
Scheme is a registered pension scheme under the Finance
Act 2004. The trustee’s only formal funding objective is the
statutory funding objective under the Pensions Act part 6
2004, which is to have suffi cient and appropriate assets to
cover the Scheme’s obligations. Since 1 November 2013, this
plan is generally closed for joiners, who participate in a separate
defi ned contribution plan.
Moreover, the Company participates in the UK in several funded
trustee-administered pension plans for both executive and non-
executive employees with BAE Systems being the principal
employer. T he Company’s most signifi cant investments in terms
of employees participating in these BAE Systems UK pension
plans is Airbus Operations Ltd. Participating Airbus Operations
Ltd. employees have continued to remain members in the BAE
Systems UK pension plans due to the UK pension agreement
between the Company and BAE Systems and a change in the
UK pensions legislation enacted in April 2006.
For the most significant of these BAE Systems Pension
Schemes, the Main Scheme, BAE Systems, the Company and
the scheme Trustees agreed on a sectionalisation, which was
implemented on 1 April 2016. Although BAE Systems remains
the only principal employer of the Scheme, the Company has
obtained powers in relation to its section which are the same
as if it were the principal employer.
Based on the funding situation of the respective pension
schemes, the pension plan trustees determine the contribution
rates to be paid by the participating employers to adequately
fund the schemes. The different UK pension plans in which the
Company investments participate are currently underfunded.
Airbus Operations Ltd. (for its section of the Main Scheme)
and BAE Systems (for the other schemes) have agreed with
the trustees various measures designed to make good the
underfunding. These include (i) regular contribution payments
for active employees well above such which would prevail for
funded plans and (ii) extra employers’ contributions.
In the event that an employer who participates in the BAE
Systems pension schemes fails or cannot be compelled to
fulfi l its obligations as a participating employer, the remaining
participating employers are obliged to collectively take on
its obligations. The Company considers the likelihood of this
event as remote. However, for the Main Scheme the Company
considers that its obligation is in principle limited to that related
to its section.
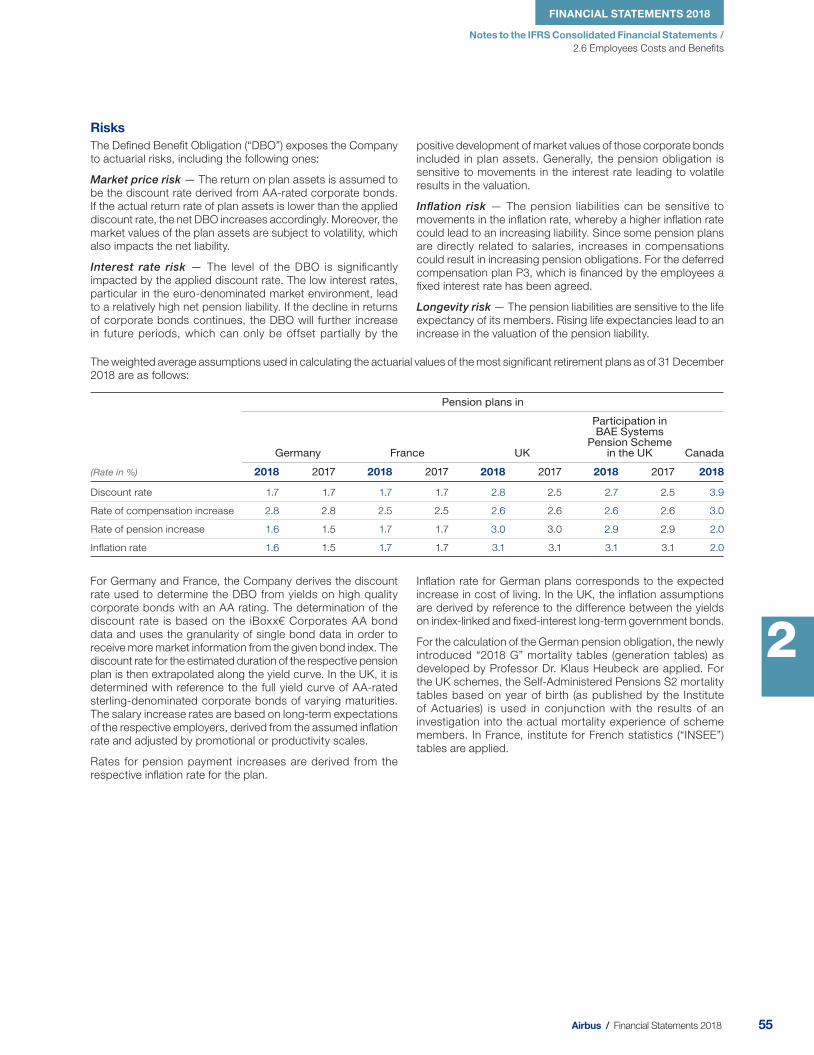
55 Airbus / Financial Statements 2018
Notes to the IFRS Consolidated Financial Statements /
FINANCIAL STATEMENTS 2018
2.6 Employees Costs and Benefi ts
2
RisksThe Defi ned Benefi t Obligation (“ DBO”) exposes the Company
to actuarial risks, including the following ones:
Market price risk — The return on plan assets is assumed to
be the discount rate derived from AA-rated corporate bonds.
If the actual return rate of plan assets is lower than the applied
discount rate, the net DBO increases accordingly. Moreover, the
market values of the plan assets are subject to volatility, which
also impacts the net liability.
Interest rate risk — The level of the DBO is signifi cantly
impacted by the applied discount rate. The low interest rates,
particular in the euro-denominated market environment, lead
to a relatively high net pension liability. If the decline in returns
of corporate bonds continues, the DBO will further increase
in future periods, which can only be offset partially by the
positive development of market values of those corporate bonds
included in plan assets. Generally, the pension obligation is
sensitive to movements in the interest rate leading to volatile
results in the valuation.
Infl ation risk — The pension liabilities can be sensitive to
movements in the infl ation rate, whereby a higher infl ation rate
could lead to an increasing liability. Since some pension plans
are directly related to salaries, increases in compensations
could result in increasing pension obligations. For the deferred
compensation plan P3, which is fi nanced by the employees a
fi xed interest rate has been agreed.
Longevity risk — The pension liabilities are sensitive to the life
expectancy of its members. Rising life expectancies lead to an
increase in the valuation of the pension liability.
The weighted average assumptions used in calculating the actuarial values of the most signifi cant retirement plans as of 31 December
201 8 are as follows:
(Rate in %)
Pension plans in
Germany France UK
Participation in BAE Systems
Pension Scheme in the UK Canada
2018 2017 2018 2017 2018 2017 2018 2017 2018
Discount rate 1.7 1.7 1.7 1.7 2.8 2.5 2.7 2.5 3.9
Rate of compensation increase 2.8 2.8 2.5 2.5 2.6 2.6 2.6 2.6 3.0
Rate of pension increase 1.6 1.5 1.7 1.7 3.0 3.0 2.9 2.9 2.0
Inflation rate 1.6 1.5 1.7 1.7 3.1 3.1 3.1 3.1 2.0
For Germany and France, the Company derives the discount
rate used to determine the DBO from yields on high quality
corporate bonds with an AA rating. The determination of the
discount rate is based on the iBoxx€ Corporates AA bond
data and uses the granularity of single bond data in order to
receive more market information from the given bond index. The
discount rate for the estimated duration of the respective pension
plan is then extrapolated along the yield curve. In the UK, it is
determined with reference to the full yield curve of AA-rated
sterling-denominated corporate bonds of varying maturities.
The salary increase rates are based on long-term expectations
of the respective employers, derived from the assumed infl ation
rate and adjusted by promotional or productivity scales.
Rates for pension payment increases are derived from the
respective infl ation rate for the plan.
Infl ation rate for German plans corresponds to the expected
increase in cost of living. In the UK, the infl ation assumptions
are derived by reference to the difference between the yields
on index-linked and fi xed-interest long-term government bonds.
For the calculation of the German pension obligation, the newly
introduced “2018 G” mortality tables (generation tables) as
developed by Professor Dr. Klaus Heubeck are applied. For
the UK schemes, the Self-Administered Pensions S2 mortality
tables based on year of birth (as published by the Institute
of Actuaries) is used in conjunction with the results of an
investigation into the actual mortality experience of scheme
members. In France, i nstitute for French s tatistics (“INSEE”)
tables are applied.
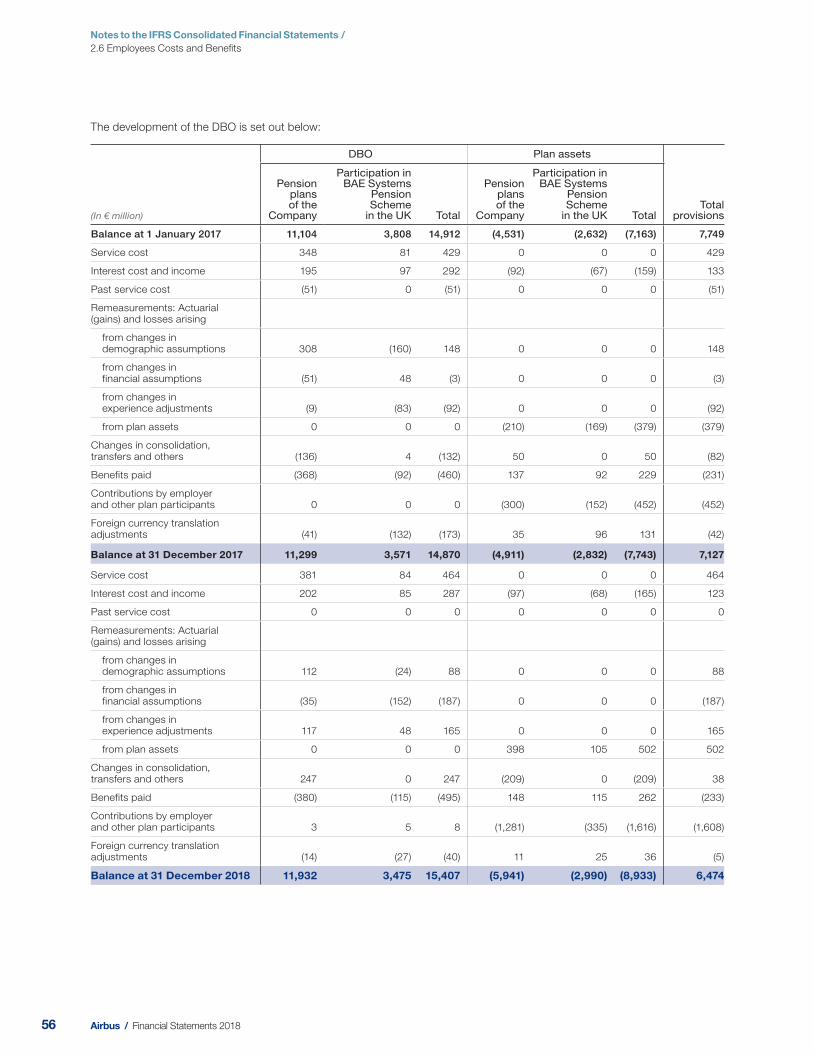
56 Airbus / Financial Statements 2018
Notes to the IFRS Consolidated Financial Statements / 2.6 Employees Costs and Benefi ts
The development of the DBO is set out below:
DBO Plan assets
(In € million)
Pension plans of the
Company
Participation in BAE Systems
Pension Scheme
in the UK Total
Pension plans of the
Company
Participation in BAE Systems
Pension Scheme
in the UK Total Total
provisions
Balance at 1 January 2017 11,104 3,808 14,912 (4,531) (2,632) (7,163) 7,749
Service cost 348 81 429 0 0 0 429
Interest cost and income 195 97 292 (92) (67) (159) 133
Past service cost (51) 0 (51) 0 0 0 (51)
Remeasurements: Actuarial (gains) and losses arising
from changes in demographic assumptions 308 (160) 148 0 0 0 148
from changes in financial assumptions (51) 48 (3) 0 0 0 (3)
from changes in experience adjustments (9) (83) (92) 0 0 0 (92)
from plan assets 0 0 0 (210) (169) (379) (379)
Changes in consolidation, transfers and others (136) 4 (132) 50 0 50 (82)
Benefits paid (368) (92) (460) 137 92 229 (231)
Contributions by employer and other plan participants 0 0 0 (300) (152) (452) (452)
Foreign currency translation adjustments (41) (132) (173) 35 96 131 (42)
Balance at 31 December 2017 11,299 3,571 14,870 (4,911) (2,832) (7,743) 7,127
Service cost 381 84 464 0 0 0 464
Interest cost and income 202 85 287 (97) (68) (165) 123
Past service cost 0 0 0 0 0 0 0
Remeasurements: Actuarial (gains) and losses arising
from changes in demographic assumptions 112 (24) 88 0 0 0 88
from changes in financial assumptions (35) (152) (187) 0 0 0 (187)
from changes in experience adjustments 117 48 165 0 0 0 165
from plan assets 0 0 0 398 105 502 502
Changes in consolidation, transfers and others 247 0 247 (209) 0 (209) 38
Benefits paid (380) (115) (495) 148 115 262 (233)
Contributions by employer and other plan participants 3 5 8 (1,281) (335) (1,616) (1,608)
Foreign currency translation adjustments (14) (27) (40) 11 25 36 (5)
Balance at 31 December 2018 11,932 3,475 15,407 (5,941) (2,990) (8,933) 6,474

57 Airbus / Financial Statements 2018
Notes to the IFRS Consolidated Financial Statements /
FINANCIAL STATEMENTS 2018
2.6 Employees Costs and Benefi ts
2
In 2018, contributions in the amount of € 1,278 million (201 7:
€ 300 million) are made into the pension plans of the Company,
mainly relating to the Contractual Trust Arrangement of
€ 1,159 million (2017: € 1 87 million), the Company UK scheme
for € 104 million (2017: € 77 mil lion).
Contributions of approximately € 500 million are expected to
be made in 2019.
The weighted av erage duration of the DBO for retirement plans
and deferred compensation is 16 years at 31 December 2018
(31 D ecember 2017: 17 y ears).
The split of the DBO for retirement plans and deferred compensation between active, deferred and pensioner members for the
most signifi cant plans is as follows:
Active Deferred Pensioner
Germany 49% 6% 45%
France 99% 0% 1%
UK 65% 14% 21%
Participation in BAE System Pension Scheme (Main Scheme) 58% 16% 26%
Canada 95% 1% 4%
The following table shows how the present value of the DBO of retirement plans and deferred compensation would have been
infl uenced by changes in the actuarial assumptions as set out for 31 December 2018:
Change in actuarial assumptions Impact on DBO
Change at 31 December
2018 2017
Present value of the obligation 17,037 16,232
Discount rate Increase by 0.5%-point (1,204) (1,228)
Decrease by 0.5%-point 1,338 1,359
Rate of compensation increase Increase by 0.25%-point 136 111
Decrease by 0.25%-point (130) (196)
Rate of pension increase Increase by 0.25%-point 316 283
Decrease by 0.25%-point (302) (356)
Life expectancy Increase by 1 year 428 369
Sensitivities are calculated based on the same method (present
value of the DBO calculated with the projected unit method)
as applied when calculating the post-employment benefit
obligations. The sensitivity analyses are based on a change of
one assumption while holding all other assumptions constant.
This is unlikely to occur in practice and changes of more than
one assumption may be correlated leading to different impacts
on the DBO than disclosed above. If the assumptions change
at a different level, the effect on the DBO is not necessarily in
a linear relation.
The funding of the plans is as follows:
(In € million)
31 December
2018 2017
DBO Plan assets DBO Plan assets
Unfunded pension plans 2,157 0 1,563 0
Funded pension plans (partial) 13,250 (8,933) 13,307 (7,743)
Total 15,407 (8,933) 14,870 (7,743)

58 Airbus / Financial Statements 2018
Notes to the IFRS Consolidated Financial Statements / 2.6 Employees Costs and Benefi ts
The fair value of the plan assets for retirement plans and deferred compensation can be allocated to the following classes:
(In € million)
2018 2017
Quoted prices
Unquoted prices Total
Quoted prices
Unquoted prices Total
Equity securities
Europe 1,061 0 1,061 1,157 3 1,160
Rest of the world 361 0 361 511 48 559
Emerging markets 359 0 359 281 0 281
Global 1,355 0 1,355 1,188 0 1,188
Bonds
Corporates 1,570 71 1,642 1,250 591 1,841
Governments 1,451 0 1,451 1,310 74 1,384
Pooled investments vehicles 491 0 491 16 280 296
Commodities 0 98 98 115 0 115
Hedge funds 0 269 269 332 196 528
Derivatives 0 207 207 0 (54) (54)
Property 0 494 494 92 284 376
Cash and money market funds 1,103 96 1,199 43 0 43
Others 0 976 976 216 (40) 176
Balance at 31 December 7,751 2,211 9,962 6,511 1,382 7,893
The majority of funded plans apply broadly an asset-liability
matching framework. The strategic asset allocation of the
plans takes into account the characteristics of the underlying
obligations. Investments are widely diversifi ed, such that the
failure of any single investment would not have a material impact
on the overall level of assets. A large portion of assets in 2018
consists of fi xed income instruments, equities, although the
Company also invests in property, commodities and hedge
funds. The Company reassesses the characteristics of the
pension obligations from time to time or as required by the
applicable regulation or governance framework. This typically
triggers a subsequent review of the strategic asset allocation .
The amount recorded as provision for retirement plans can be allocated to the signifi cant countries as follows:
(In € million)
Pension plans of the Company Participation in BAE Systems
Pension Scheme
in the UK Total Germany France UK Canada
DBO 8,660 1,756 1,205 311 3,475 15,407
Plan assets 4,646 23 1,083 189 2,992 8,933
Recognised at 31 December 2018 4,014 1,733 122 122 483 6,474
DBO 8,464 1,640 1,195 0 3,571 14,870
Plan assets 3,861 17 1,033 0 2,832 7,743
Recognised at31 December 2017 4,603 1,623 162 0 739 7,127
Employer’s contribution to state and private pension plans, mainly in Germany and France, are to be considered as defi ned
contribution plans. Contributions in 2018 amounted to € 991 million (201 7: € 677 million).

59 Airbus / Financial Statements 2018
Notes to the IFRS Consolidated Financial Statements /
FINANCIAL STATEMENTS 2018
2.6 Employees Costs and Benefi ts
2
29.2 Provisions for Deferred CompensationThis amount represents obligations that arise if employees elect to convert part of their remuneration or bonus into an equivalent
commitment for deferred compensation which is treated as a defi ned benefi t post-employment plan. The development for the
DBO and plan assets is as follows:
(In € million)
2018 2017
DBO Plan assets Total DBO Plan assets Total
Balance at 1 January 1,362 (150) 1,212 1,018 (128) 890
Service cost 118 0 118 135 0 135
Interest cost 23 0 23 17 0 17
Interest income 0 (6) (6) 0 (3) (3)
Remeasurement: Actuarial (gains) and losses arising
from changes in demographic assumptions (2) 0 (2) 174 0 174
from changes in financial assumptions 8 0 8 5 0 5
from changes in experience adjustments 33 0 33 34 0 34
from plan assets 0 44 44 0 (3) (3)
Changes in consolidation, transfers and others (20) 1 (19) (13) (1) (14)
Benefits paid (11) 0 (11) (8) 0 (8)
Contributions 119 (921) (802) 0 (15) (15)
Balance at 31 December 1,630 (1,032) 598 1,362 (150) 1,212
RECOGNISED AS
(In € million)
31 December
2018 2017
Provisions 598 1,234
Non-current and current other assets 0 22
Total 598 1,212
In 2018, new trust arrangements have been established
between the trust and the participating companies and stipulate
a minimum funding requirement for the portion of the obligation,
which is not protected by the pension guarantee association or
Pensions-Sicherungs Verein in case of an insolvency of Airbus
companies concerned. Some portions of the obligation must
be covered with securities in the same amount, while other
portions must be covered by 115%.
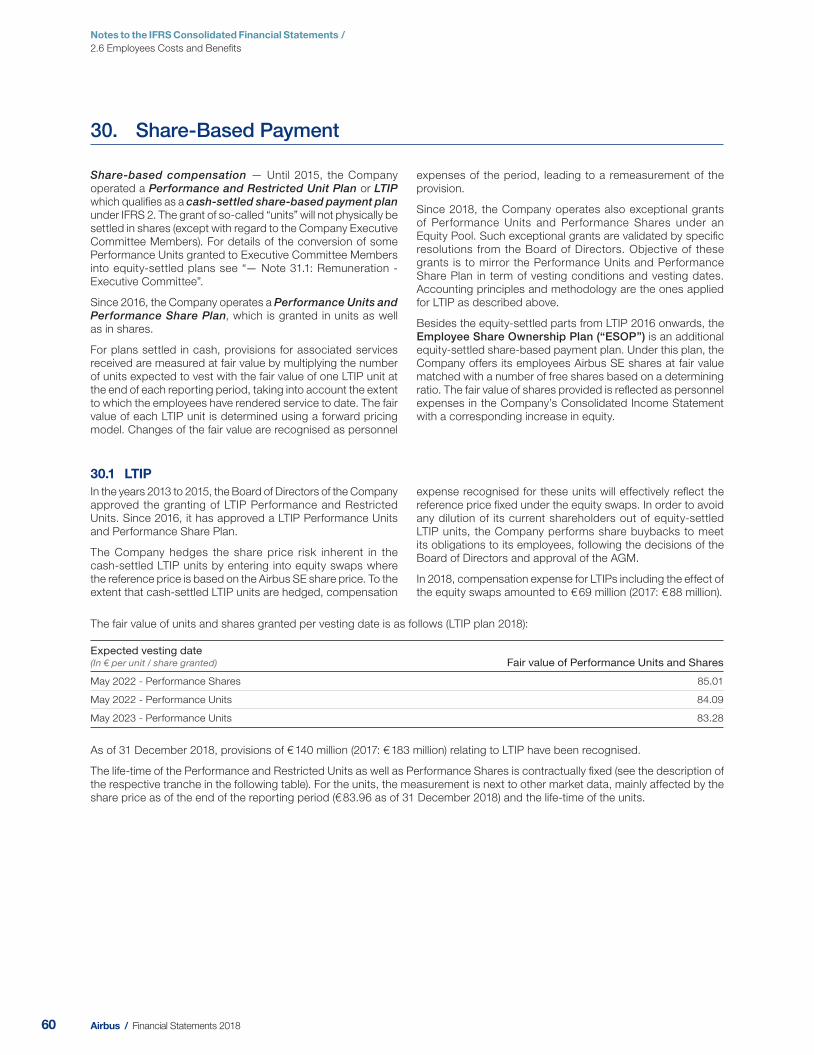
60 Airbus / Financial Statements 2018
Notes to the IFRS Consolidated Financial Statements / 2.6 Employees Costs and Benefi ts
30. Share-Based Payment
Share-based compensation — Until 2015, the Company
operated a Performance and Restricted Unit Plan or LTIP
which qualifi es as a cash-settled share-based payment plan
under IFRS 2. The grant of so-called “units” will not physically be
settled in shares (except with regard to the Company Executive
Committee Members). For details of the conversion of some
Performance Units granted to Executive Committee Members
into equity-settled plans see “— Note 31.1: Remuneration -
Executive Committee”.
Since 2016, the Company operates a Performance Units and Performance Share Plan, which is granted in units as well
as in shares.
For plans settled in cash, provisions for associated services
received are measured at fair value by multiplying the number
of units expected to vest with the fair value of one LTIP unit at
the end of each reporting period, taking into account the extent
to which the employees have rendered service to date. The fair
value of each LTIP unit is determined using a forward pricing
model. Changes of the fair value are recognised as personnel
expenses of the period, leading to a remeasurement of the
provision.
Since 2018, the Company operates also exceptional grants
of Performance Units and Performance Shares under an
Equity Pool. Such exceptional grants are validated by specifi c
resolutions from the Board of Directors. Objective of these
grants is to mirror the Performance Units and Performance
Share Plan in term of vesting conditions and vesting dates.
Accounting principles and methodology are the ones applied
for LTIP as described above.
Besides the equity-settled parts from LTIP 2016 onwards, the
Employee Share Ownership Plan (“ESOP”) is an additional
equity-settled share-based payment plan. Under this plan, the
Company offers its employees Airbus SE shares at fair value
matched with a number of free shares based on a determining
ratio. The fair value of shares provided is refl ected as personnel
expenses in the Company’s Consolidated Income Statement
with a corresponding increase in equity.
The fair value of units and shares granted per vesting date is as follows (LTIP plan 2018):
Expected vesting date (In € per unit / share granted) Fair value of Performance Units and Shares
May 2022 - Performance Shares 85.01
May 2022 - Performance Units 84.09
May 2023 - Performance Units 83.28
As of 31 December 2018, provisions of € 140 million (2017 : € 183 million) relating to LTIP have been recognised.
The life-time of the Performance and Restricted Units as well as Performance Shares is contractually fi xed (see the description of
the respective tranche in the following table). For the units, the measurement is next to other market data, mainly affected by the
share price as of the end of the reporting period (€ 83.96 as of 31 Decemb er 2018) and the life-time of the units.
30.1 LTIPIn the years 2013 to 2015, the Board of Directors of the Company
approved the granting of LTIP Performance and Restricted
Units. Since 2016, it has approved a LTIP Performance Units
and Performance Share Plan.
The Company hedges the share price risk inherent in the
cash- settled LTIP units by entering into equity swaps where
the reference price is based on the Airbus SE share price. To the
extent that cash-settled LTIP units are hedged, compensation
expense recognised for these units will effectively refl ect the
reference price fi xed under the equity swaps. In order to avoid
any dilution of its current shareholders out of equity-settled
LTIP units, the Company performs share buybacks to meet
its obligations to its employees, following the decisions of the
Board of Directors and approval of the AGM.
In 2018, compensation expense for LTIPs including the effect of
the equity swaps amounted to € 69 million (2017: € 88 million).

61 Airbus / Financial Statements 2018
Notes to the IFRS Consolidated Financial Statements /
FINANCIAL STATEMENTS 2018
2.6 Employees Costs and Benefi ts
2
The principal characteristics of the LTIPs as at 31 Decembe r 2018 are summarised below:
LTIP 2013 (5) LTIP 2014 (6) LTIP 2015 (7) LTIP 2016 LTIP 2017 LTIP 2018
Grant date (1)
17 December 2013
13 November 2014
29 October 2015
25 October 2016
30 October 2017
30 October 2018
Performance and Restricted Unit Plan Performance Plan
Units Performance Restricted Performance Restricted Performance Restricted Units Shares Units Shares Units Shares
Number of units granted (2) 1,245,052 359,060 1,114,962 291,420 926,398 240,972 615,792 621,198 421,638 425,702 278,376 281,181
Number of units outstanding (3) 0 0 424,260 134,198 656,406 231,396 592,391 594,561 411,841 415,905 278,376 281,181
Total number of eligible beneficiaries 1,709 1,621 1,564 1,671 1,601 1,626
Vesting conditions
The Performance and Restricted Units and Performance Shares will vest if the participant is still employed by a company of the Company at the respective vesting dates. Performance Units and Shares will vest upon achievement of mid-term business performance.
Vesting schedule is made up of two payments (four payments until LTIP 2013) over two years.
Share price per unit limited at vesting dates to (4) € 92.34 € 94.90 € 112.62 € 105.34 - € 147.62 - € 213.88 -
Vesting dates
25% each: in May 2017
in November 2017in May 2018
in November 2018
50% in June 2018 50% expectedin June 2019
50% each expected:
in June 2019 in July 2020
50% each expected:
in May 2020 in May 2021
100% expected
in May 2020
50% each expected:
in May 2021 in May 2022
100% expected
in May 2021
50% each expected:
in May 2022 in May 2023
100% expected
in May 2022
Number of vested units 855,686 333,415 399,540 138,527 2,606 0 0 0 0 0 0 0
(1) Date, when the vesting conditions were determined.
(2) Based on 100% target performance achievement. A minimum of 50% of Performance Units will vest; 100% in case of on-target performance achievement; up to a maximum of
150% in case of overachievement of performance criteria. In case of absolute negative results (cumulative EBIT of the Company) during the performance period, the Board of
Directors can decide to review the vesting of the Performance Units including the 50% portion which is not subject to performance conditions (additional vesting condition).
(3) Including shares granted through the Equity Pool, if applicable.
(4) Corresponds to 200% of the respective reference share price. Overall, the pay-out for Performance Units is limited to a total amount of 250% of the units originally granted,
each valued with the respective reference share price of € 46.17 (for LTIP 2013), € 47.45 (for LTIP 2014), € 56.31 (for LTIP 2015), € 52.67 (for LTIP 2016), € 73.81 (for LTIP 2017)
and € 106.94 (for LTIP 2018).
(5) Based on performance achievement of 75% for Performance Units under LTIP 2013.
(6) Based on performance achievement of 80% for Performance Units under LTIP 2014.
(7) Based on performance achievement of 75% for Performance Units under LTIP 2015.
30.2 ESOPIn 2018 and 2017, the Board of Directors approved a new ESOP
scheme. Eligible employees were able to purchase a fi xed
number of previously unissued shares at fair market value ( 2018:
5, 15, 30, 50 or 100 shares; 2 017: 5, 20, 30, 50 or 100 shares).
The Company matched each fi xed number of shares with a
number of the Airbus SE free shares based on a determined
ratio (201 8: 4, 7, 10, 13 and 25 free shares, respectively; 201 7:
4, 8, 10, 13 and 25 free shares, respectively). During a custody
period of at least one year or, provided the purchase took place
in the context of a mutual fund (regular savings plan), of fi ve
years, employees are restricted from selling the shares, but have
the right to receive all dividends paid. Employees who directly
purchased the Airbus SE shares have, in addition, the ability
to vote at the annual shareholder meetings. The subscription
price was equal to the closing price at the Paris stock exchange
on 14 February 2018 (2017: 21 February 2017) and amounted
to € 84.17 (2017: € 67.24). Investing through the mutual fund
led to a price which corresponds to the average price at the
Paris stock exchange during the 20 trading days immediately
preceding 14 February 2018 (2017: 21 Fe bruary 2017), resulting
in a price of € 88.65 (2017: € 64.44) . Airbus SE issued and sold
446,059 ordinary shares (2017: 411,710) wi th a nominal value of
€ 1.00 each. Compensation expense (excluding social security
contributions) of € 38 million (2017: € 28 million) wa s recognised
in connection with ESOP.
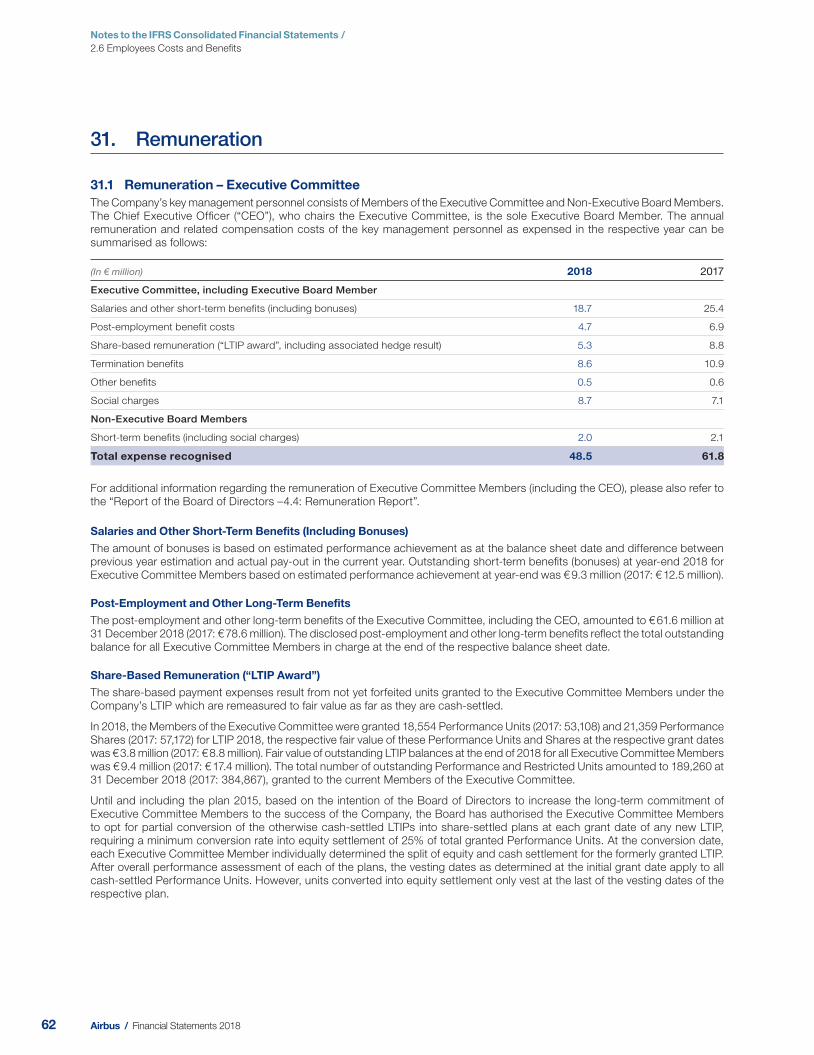
62 Airbus / Financial Statements 2018
Notes to the IFRS Consolidated Financial Statements / 2.6 Employees Costs and Benefi ts
31. Remuneration
31.1 Rem uneration – Executive CommitteeThe Company’s key management personnel consists of Members of the Executive Committee and Non-Executive Board Members.
The Chief Executive Offi cer (“CEO”), who chairs the Executive Committee, is the sole Executive Board Member. The annual
remuneration and related compensation costs of the key management personnel as expensed in the respective year can be
summarised as follows:
(In € million) 2018 2017
Executive Committee, including Executive Board Member
Salaries and other short-term benefits (including bonuses) 18.7 25.4
Post-employment benefit costs 4.7 6.9
Share-based remuneration (“LTIP award”, including associated hedge result) 5.3 8.8
Termination benefits 8.6 10.9
Other benefits 0.5 0.6
Social charges 8.7 7.1
Non-E xecutive B oard M embers
Short-term benefits (including social charges) 2.0 2.1
Total expense recognised 48.5 61.8
For additional information regarding the remuneration of Executive Committee Members (including the CEO), please also refer to
the “Report of the Board of Directors –4.4: Remuneration Report”.
Salaries and Other Short-Term Benefits (Including Bonuses)
The amount of bonuses is based on estimated performance achievement as at the balance sheet date and difference between
previous year estimation and actual pay-out in the current year. Outstanding short-term benefi ts (bonuses) at year-end 2018 for
Executive Committee Members based on estimated performance achievement at year-end was € 9.3 million (201 7: € 12.5 million).
Post-Employment and Other Long-Term Benefits
The post-employment and other long-term benefi ts of the Executive Committee, including the CEO, amounted to € 61.6 million at
31 Decemb er 2018 (2017: € 78 .6 million). The disclosed post-employment and other long-term benefi ts refl ect the total outstanding
balance for all Executive Committee Members in charge at the end of the respective balance sheet date.
Share-Based Remuneration (“LTIP Award”)
The share-based payment expenses result from not yet forfeited units granted to the Executive Committee Members under the
Company’s LTIP which are remeasured to fair value as far as they are cash-settled.
In 2018, the Mem bers of the Executive Committee were granted 18,554 Performance Units (2017: 53,108) and 21,359 Performance
Shares (2017: 57,172) for LTIP 2018, the res pective fair value of these Performance Units and Shares at the respective grant dates
was € 3.8 million (2017: € 8.8 mill ion). Fair value of outstanding LTIP balances at the end of 2018 for all Execut ive Committee Members
was € 9.4 million (2017: € 17.4 million). The total number of outstanding Performance and Restricted Units amounted to 189,260 at
31 December 2018 (2017: 3 84,867), granted to the current Members of the Executive Committee.
Until and including the plan 2015, based on the intention of the Board of Directors to increase the long-term commitment of
Executive Committee Members to the success of the Company, the Board has authorised the Executive Committee Members
to opt for partial conversion of the otherwise cash-settled LTIPs into share-settled plans at each grant date of any new LTIP,
requiring a minimum conversion rate into equity settlement of 25% of total granted Performance Units. At the conversion date,
each Executive Committee Member individually determined the split of equity and cash settlement for the formerly granted LTIP.
After overall performance assessment of each of the plans, the vesting dates as determined at the initial grant date apply to all
cash-settled Performance Units. H owever, units converted into equity settlement only vest at the last of the vesting dates of the
respective plan.
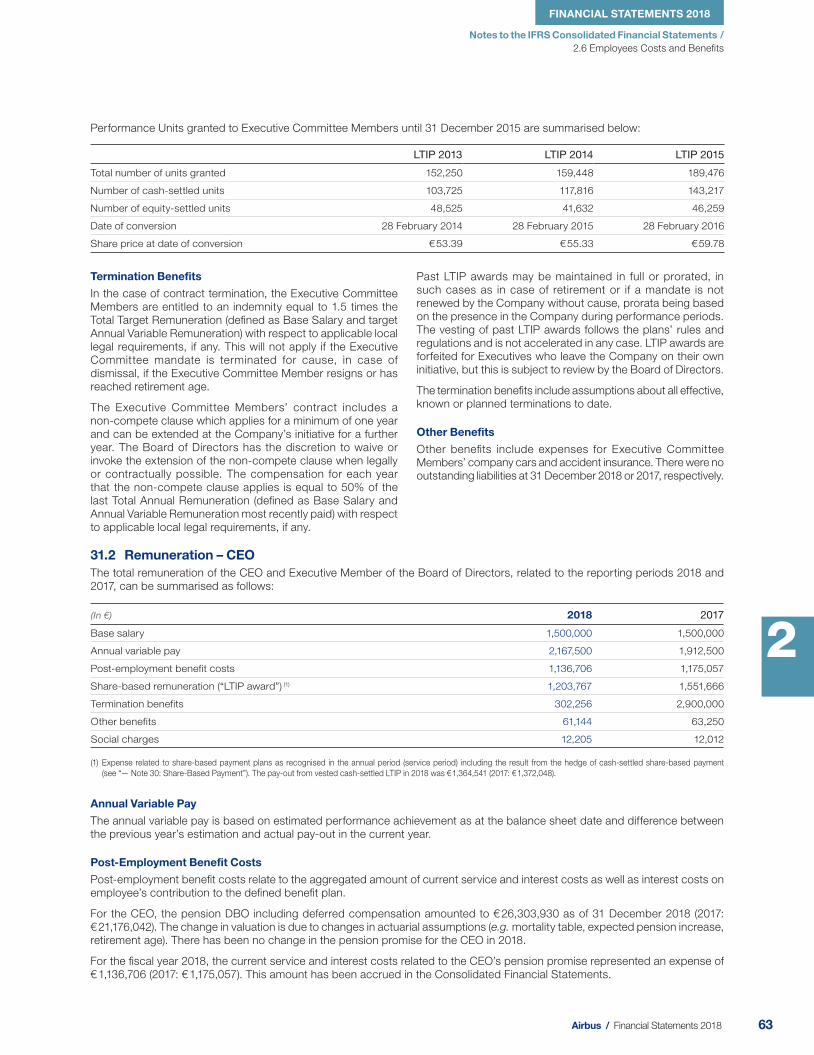
63 Airbus / Financial Statements 2018
Notes to the IFRS Consolidated Financial Statements /
FINANCIAL STATEMENTS 2018
2.6 Employees Costs and Benefi ts
2
Performance Units granted to Executive Committee Members until 31 December 2015 are summarised below:
LTIP 2013 LTIP 2014 LTIP 2015
Total number of units granted 152,250 159,448 189,476
Number of cash-settled units 103,725 117,816 143,217
Number of equity-settled units 48,525 41,632 46,259
Date of conversion 28 February 2014 28 February 2015 28 February 2016
Share price at date of conversion € 53.39 € 55.33 € 59.78
Termination Benefits
In the case of contract termination, the Executive Committee
Members are entitled to an indemnity equal to 1.5 times the
Total Target Remuneration (defi ned as Base Salary and target
Annual Variable Remuneration) with respect to applicable local
legal requirements, if any. This will not apply if the Executive
Committee mandate is terminated for cause, in case of
dismissal, if the Executive Committee Member resigns or has
reached retirement age.
The Executive Committee Members’ contract includes a
non- compete clause which applies for a minimum of one year
and can be extended at the Company’s initiative for a further
year. The Board of Directors has the discretion to waive or
invoke the extension of the non-compete clause when legally
or contractually possible. The compensation for each year
that the non-compete clause applies is equal to 50% of the
last Total Annual Remuneration (defi ned as Base Salary and
Annual Variable Remuneration most recently paid) with respect
to applicable local legal requirements, if any.
Past LTIP awards may be maintained in full or prorated, in
such cases as in case of retirement or if a mandate is not
renewed by the Company without cause, prorata being based
on the presence in the Company during performance periods.
The vesting of past LTIP awards follows the plans’ rules and
regulations and is not accelerated in any case. LTIP awards are
forfeited for Executives who leave the Company on their own
initiative, but this is subject to review by the Board of Directors.
The termination benefi ts include assumptions about all effective,
known or planned terminations to date.
Other Benefits
Other benefi ts include expenses for Executive Committee
Members’ company cars and accident insurance. There were no
outstanding liabilities at 31 December 2018 or 2 017, respectively.
31.2 Remuneration – CEOThe total remuneration of the CEO and Executive Member of the Board of Directors, related to the reporting periods 2 018 and
2 017, can be summarised as follows:
(In €) 2018 2017
Base salary 1,500,000 1,500,000
Annual variable pay 2,167,500 1,912,500
Post-employment benefit costs 1,136,706 1,175,057
Share-based remuneration (“LTIP award”) (1) 1,203,767 1,551,666
Termination benefits 302,256 2,900,000
Other benefits 61,144 63,250
Social charges 12,205 12,012
(1) Expense related to share-based payment plans as recognised in the annual period (service period) including the result from the hedge of cash-settled share-based payment
(see “— Note 30: Share-Based Payment”). The pay-out from vested cash-settled LTIP in 20 18 was € 1,364,541 (2017 : € 1,372,048).
Annual Variable Pay
The annual variable pay is based on estimated performance achievement as at the balance sheet date and difference between
the previous year’s estimation and actual pay-out in the current year.
Post-Employment Benefit Costs
Post-employment benefi t costs relate to the aggregated amount of current service and interest costs as well as interest costs on
employee’s contribution to the defi ned benefi t plan.
For the CEO, the pension DBO including deferred compensation amounted to € 26,303,930 as of 31 December 2018 (2017 :
€ 21,176,042). The change in valuation is due to changes in actuarial assumptions (e.g. mortality table, expected pension increase,
retirement age). There has been no change in the pension promise for the CEO in 2018.
For the fi scal year 2018, the current service and interest costs related to the CEO’s pension promise represented an expense of
€ 1,136,706 (2017: € 1, 175,057). This amount has been accrued in the Consolidated Financial Statements.

64 Airbus / Financial Statements 2018
Notes to the IFRS Consolidated Financial Statements / 2.6 Employees Costs and Benefi ts
Share-Based Remuneration
In 2018, due to the announcement of his departure, the CEO has not been granted with Performance Units nor Performance Shares.
The table below gives an overview of the interests of the CEO, under the various LTIPs of the Company:
Granted Date LTIP 2013 LTIP 2014 LTIP 2015 LTIP 2016 LTIP 2017
Performance Units and Shares 30,300 29,500 24,862 28,480 20,324
Revaluation 75% 80% 75% 100% 100%
Performance Units and Shares revalued 22,724 23,600 18,648 28,480 20,324
Vested in 2018
in cash 11,364 8,850 0 0 0
in shares 11,360 0 0 0 0
Outstanding 2018
in cash 0 8,850 13,986 14,240 10,162
in shares 0 5,900 4,662 14,240 10,162
Vesting schedule
Cash-settled units For vesting dates, see “— Note 30.1: LTIP”
Equity-settled units November 2018 June 2019 July 2020 May 2020 May 2021
Vesting of all Performance Units and Performance Shares granted to the CEO is subject to performance conditions.
The fair value of outstanding LTIP balances at the end of 2018 for the CEO was € 2,257,848 (20 17: € 2,732,125).
Termination Benefits
Termination benefi ts include non-compete indemnity estimated according to art. 74 et seq. of the German Commercial Code
(“BGB”) based on 2018 dat a.
For more details, see “— Note 31.1: Remuneration - Executive Committee”, section “Termination B enefi ts”.
Other Benefits
The CEO is entitled to accident insurance coverage and a company car. In 2018, the total amount expensed was € 61,144
(2017: € 63,250). The Company has not provided any loans to / advances to / guarantees on behalf of the CEO.
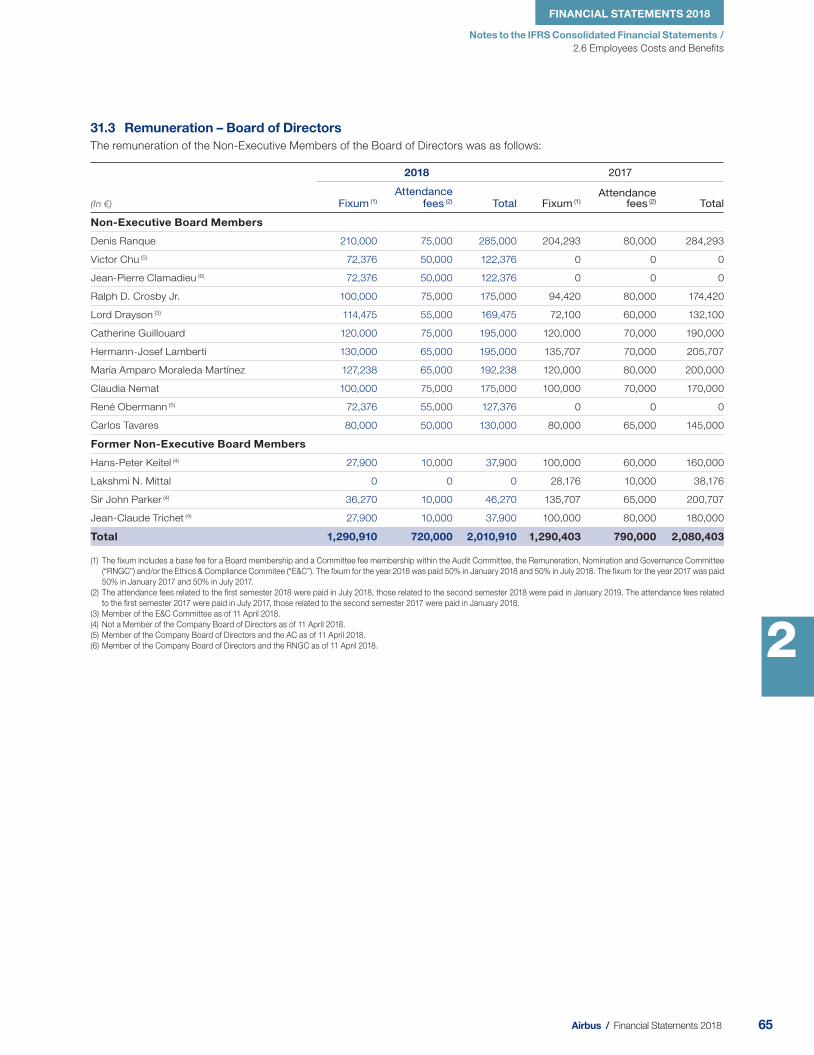
65 Airbus / Financial Statements 2018
Notes to the IFRS Consolidated Financial Statements /
FINANCIAL STATEMENTS 2018
2.6 Employees Costs and Benefi ts
2
31.3 Remuneration – Board of DirectorsThe remuneration of the Non-Executive Members of the Board of Directors was as follows:
(In €)
2018 2017
Fixum (1)
Attendance fees (2) Total Fixum (1)
Attendance fees (2) Total
Non-Executive Board Members
Denis Ranque 210,000 75,000 285,000 204,293 80,000 284,293
Victor Chu (5) 72,376 50,000 122,376 0 0 0
Jean-Pierre Clamadieu (6) 72,376 50,000 122,376 0 0 0
Ralph D. Crosby Jr. 100,000 75,000 175,000 94,420 80,000 174,420
Lord Drayson (3) 114,475 55,000 169,475 72,100 60,000 132,100
Catherine Guillouard 120,000 75,000 195,000 120,000 70,000 190,000
Hermann -Josef Lamberti 130,000 65,000 195,000 135,707 70,000 205,707
María Amparo Moraleda Martínez 127,238 65,000 192,238 120,000 80,000 200,000
Claudia Nemat 100,000 75,000 175,000 100,000 70,000 170,000
René Obermann (5) 72,376 55,000 127,376 0 0 0
Carlos Tavares 80,000 50,000 130,000 80,000 65,000 145,000
Former Non-Executive Board Members
Hans-Peter Keitel (4) 27,900 10,000 37,900 100,000 60,000 160,000
Lakshmi N. Mittal 0 0 0 28,176 10,000 38,176
Sir John Parker (4) 36,270 10,000 46,270 135,707 65,000 200,707
Jean-Claude Trichet (4) 27,900 10,000 37,900 100,000 80,000 180,000
Total 1,290,910 720,000 2,010,910 1,290,403 790,000 2,080,403
(1) The fixum includes a base fee for a Board membership and a Committee fee membership within the Audit Committee, the Remuneration, Nomination and Governance Committee
(“ RNGC” ) and/or the Ethics & Compliance Commitee (“ E&C” ) . The fixum for the year 2018 was paid 50% in January 2018 and 50% in July 2018. The fixum for the year 2017 was paid
50% in January 2017 and 50% in July 2017.
(2) The attendance fees related to the first semester 2018 were paid in July 2018, those related to the second semester 2018 were paid in January 2019. The attendance fees related
to the first semester 2017 were paid in July 2017, those related to the second semester 2017 were paid in January 2018.
(3) Member of the E&C Committee as of 11 April 2018.
(4) Not a Member of the Company Board of Directors as of 11 April 2018.
(5) Member of the Company Board of Directors and the AC as of 11 April 2018.
(6) Member of the Company Board of Directors and the RNGC as of 11 April 2018.

66 Airbus / Financial Statements 2018
Notes to the IFRS Consolidated Financial Statements / 2.7 Capital Structure and Financial Instruments
2.7 Capital Structure and Financial Instruments
32. Total Equity
32.1 Equity Attributable to Equity Owners of the ParentThe Company’s shares are exclusively ordinary shares with a par value of € 1.00. The following table shows the development of
the number of shares issued and fully paid:
(In number of shares) 2018 2017
Issued at 1 January 774,556,062 772,912,869
Issued for ESOP 1,811,819 1,643,193
Issued at 31 December 776,367,881 774,556,062
Treasury shares (636,924) (129,525)
Outstanding at 31 December 775,730,957 774,426,537
Holders of ordinary shares are entitled to dividends and to one
vote per share at general meetings of the Company.
Equity attributable to equity owners of the parent (including
purchased treasury shares) amounts to € 9,724 million (201 7
(restated): € 10,740 million) representing a decrease of
€ -1,016 million. This is due to a decrease in other comprehensive
income of € -2,982 million, principally related to the mark to
market revaluation of the hedge portfolio of € -2,249 million, a
change in actuarial gains and losses income of € -569 million and
a dividend payment of € -1,161 million (€ 1.50 per share), partly
compensated by a net income for the period of € 3,054 million.
Capital stock comprises the nominal amount of shares
outstanding. The addition to capital stock represents the
contribution for exercised options by employees of € 1,811,819
( 2017: € 1,643,193) in compli ance with the implemented
ESOPs.
Share premium mainly results from contributions in kind in
the course of the creation of the Company, cash contributions
from the Company’s initial public offering, capital increases
and reductions due to the issuance and cancellation of shares.
Retained earnings include mainly the profi t for the period and the
changes in other comprehensive income from remeasurements
of the defi ned benefi t pension plans net of tax which amounts
to € -569 million in 2018 (2017: € 151 million), and c ash di vidend
payments to Airbus SE shareholders.
On 11 April 2018, the Shareholders’ Gene ral Meeting decided
to distribute a gross amount of € 1.50 per share, which was
paid on 18 April 2018. For the fi scal year 2018, t he Company’s
Board of Directors propo ses a cash distribution payment of
€ 1.65 per share.
Treasury shares represent the amount paid or payable for own
shares held in treasury. During 2018, the number of treasury
stock held by the Company increased to 636,924 compared to
129,525 as of 31 December 2017. No shares were sold back to
t he market nor cancelled ( 2017: 0 shares).
On 11 April 2018, the Annual Ge neral Meeting (“AGM”) of
the Company authorised the Board of Directors, for a period
expiring at the AGM to be held in 2019, to issue shares and to
grant rights to subsc ribe for shares in the Company’s share
capital for the purpose of:
-ESOPs and share-related LTIPs, provided that such powers
shall be limited to an aggregate of 0.14% of the Company’s
authorised share capital (see “— Note 30: Share-Based
Payment”);
-funding the Company and its subsidiaries, provided that
such powers shall be limited to an aggregate of 0.3% of
the Company’s authorised share capital (see “— Note 34.3:
Financing Liabilities”).
For each operation, such powers shall not extend to issuing
shares or granting rights to subscribe for shares if there is no
preferential subscription right and for an aggregate issue price
in excess of € 500 million per share issuance.
Also on 11 April 2018, the AGM authorised the Board of
Directors for an 18 - month period to repurchase up to 10% of
the Company’s issued share capital at a price per share not
less than the nominal value and not more than the higher of
the price of the last independent trade and the highest current
independent bid on the trading venues of the regulated market
of the country in which the purchase is carried out.
Furthermore, the AGM authorised both the Board of Directors
and the CEO, with powers of substitution, to establish the exact
number of the relevant shares to be cancelled.
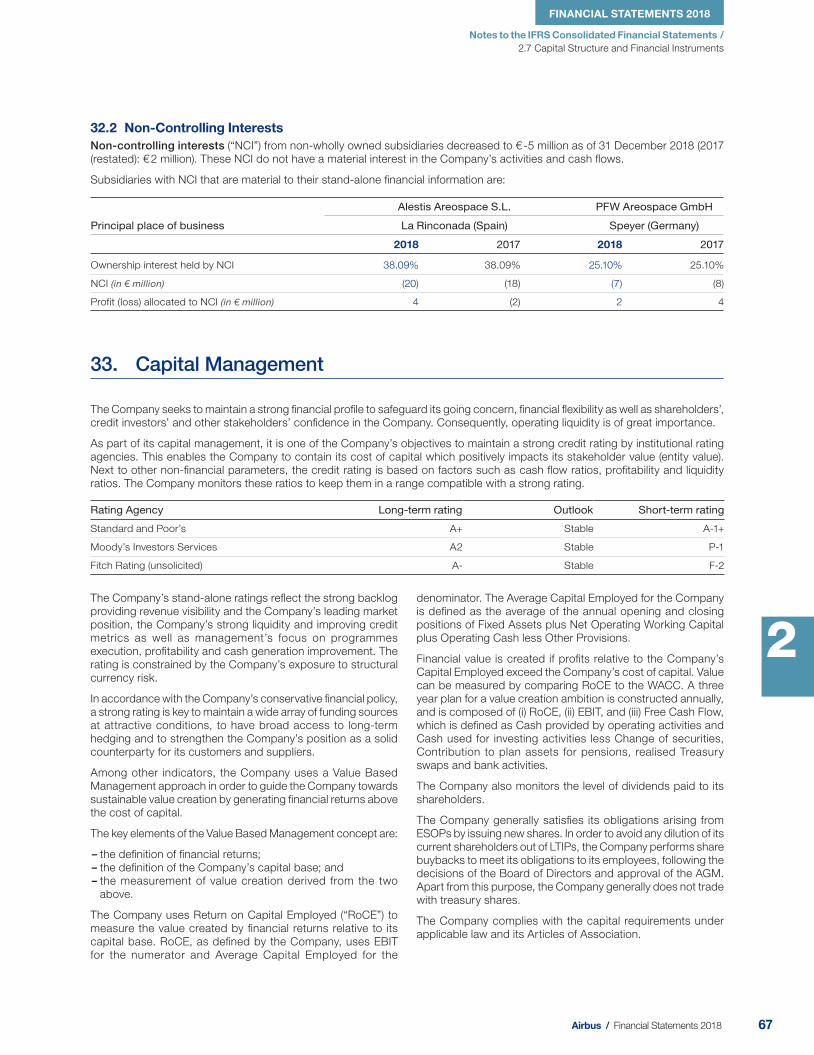
67 Airbus / Financial Statements 2018
Notes to the IFRS Consolidated Financial Statements /
FINANCIAL STATEMENTS 2018
2.7 Capital Structure and Financial Instruments
2
33. Capital Management
The Company seeks to maintain a strong fi nancial profi le to safeguard its going concern, fi nancial fl exibility as well as shareholders’,
credit investors’ and other stakeholders’ confi dence in the Company. Consequently, operating liquidity is of great importance.
As part of its capital management, it is one of the Company’s objectives to maintain a strong credit rating by institutional rating
agencies. This enables the Company to contain its cost of capital which positively impacts its stakeholder value (entity value).
Next to other non-fi nancial parameters, the credit rating is based on factors such as cash fl ow ratios, profi tability and liquidity
ratios. The Company monitors these ratios to keep them in a range compatible with a strong rating.
Rating Agency Long-term rating Outlook Short-term rating
Standard and Poor’s A+ Stable A-1+
Moody’s Investors Services A2 Stable P-1
Fitch Rating (unsolicited) A- Stable F-2
The Company’s stand-alone ratings refl ect the strong backlog
providing revenue visibility and the Company’s leading market
position, the Company’s strong liquidity and improving credit
metrics as well as management’s focus on programmes
execution, profi tability and cash generation improvement. The
rating is constrained by the Company’s exposure to structural
currency risk.
In accordance with the Company’s conservative fi nancial policy,
a strong rating is key to maintain a wide array of funding sources
at attractive conditions, to have broad access to long-term
hedging and to strengthen the Company’s position as a solid
counterparty for its customers and suppliers.
Among other indicators, the Company uses a Value Based
Management approach in order to guide the Company towards
sustainable value creation by generating fi nancial returns above
the cost of capital.
The key elements of the Value Based Management concept are:
-the defi nition of fi nancial returns;
-the defi nition of the Company’s capital base; and
-the measurement of value creation derived from the two
above.
The Company uses Return on Capital Employed (“RoCE”) to
measure the value created by fi nancial returns relative to its
capital base. RoCE, as defi ned by the Company, uses EBIT
for the numerator and Average Capital Employed for the
denominator. The Average Capital Employed for the Company
is defi ned as the average of the annual opening and closing
positions of Fixed Assets plus Net Operating Working Capital
plus Operating Cash less Other Provisions.
Financial value is created if profi ts relative to the Company’s
Capital Employed exceed the Company’s cost of capital. Value
can be measured by comparing RoCE to the WACC. A three
year plan for a value creation ambition is constructed annually,
and is composed of (i) RoCE, (ii) EBIT, and (iii) Free Cash Flow,
which is defi ned as Cash provided by operating activities and
Cash used for investing activities less Change of securities,
Contribution to plan assets for pensions, realised Treasury
swaps and bank activities.
The Company also monitors the level of dividends paid to its
shareholders.
The Company generally satisfi es its obligations arising from
ESOPs by issuing new shares. In order to avoid any dilution of its
current shareholders out of LTIPs, the Company performs share
buybacks to meet its obligations to its employees, following the
decisions of the Board of Directors and approval of the AGM.
Apart from this purpose, the Company generally does not trade
with treasury shares.
The Company complies with the capital requirements under
applicable law and its Articles of Association.
32.2 Non-Controlling InterestsNon-controlling interests (“NCI”) from non-wholly owned subsidiaries decreased to € -5 million as of 31 December 2018 (2017
(restated): € 2 million). These NCI do not have a ma terial interest in the Company’s activities and cash fl ows.
Subsidiaries with NCI that are material to their stand-alone fi nancial information are:
Principal place of business
Alestis Areospace S.L. PFW Areospace GmbH
La Rinconada (Spain) Speyer (Germany)
2018 2017 2018 2017
Ownership interest held by NCI 38.09% 38.09% 25.10% 25.10%
NCI (in € million) (20) (18) (7) (8)
Profit (loss) allocated to NCI (in € million) 4 (2) 2 4
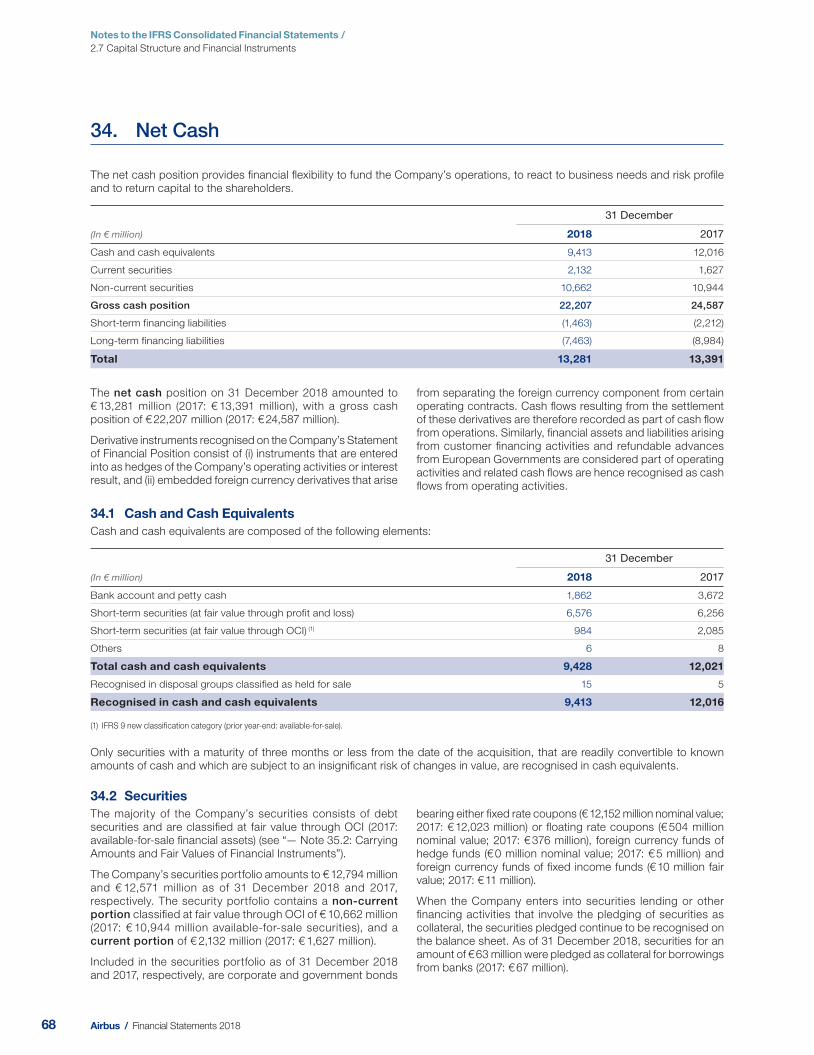
68 Airbus / Financial Statements 2018
Notes to the IFRS Consolidated Financial Statements / 2.7 Capital Structure and Financial Instruments
34. Net Cash
The net cash position provides fi nancial fl exibility to fund the Company’s operations, to react to business needs and risk profi le
and to return capital to the shareholders.
(In € million)
31 December
2018 2017
Cash and cash equivalents 9,413 12,016
Current securities 2,132 1,627
Non-current securities 10,662 10,944
Gross cash position 22,207 24,587
Short-term financing liabilities (1,463) (2,212)
Long-term financing liabilities (7,463) (8,984)
Total 13,281 13,391
The net cash position on 31 December 2018 amounted to
€ 13,281 million (2017 : € 13,391 million), with a gross cash
position of € 22,207 million (2017: € 24 ,587 million).
Derivative instruments recognised on the Company’s Statement
of Financial Position consist of (i) instruments that are entered
into as hedges of the Company’s operating activities or interest
result, and (ii) embedded foreign currency derivatives that arise
from separating the foreign currency component from certain
operating contracts. Cash fl ows resulting from the settlement
of these derivatives are therefore recorded as part of cash fl ow
from operations. Similarly, fi nancial assets and liabilities arising
from customer fi nancing activities and refundable advances
from European Governments are considered part of operating
activities and related cash fl ows are hence recognised as cash
fl ows from operating activities.
34.1 Cash and Cash EquivalentsCash and cash equivalents are composed of the following elements:
(In € million)
31 December
2018 2017
Bank account and petty cash 1,862 3,672
Short-term securities (at fair value through profit and loss) 6,576 6,256
Short-term securities (at fair value through OCI) (1) 984 2,085
Others 6 8
Total cash and cash equivalents 9,428 12,021
Recognised in disposal groups classified as held for sale 15 5
Recognised in cash and cash equivalents 9,413 12,016
(1) IFRS 9 new classification category (prior year-end: available-for-sale).
Only securities with a maturity of three months or less from the date of the acquisition, that are readily convertible to known
amounts of cash and which are subject to an insignifi cant risk of changes in value, are recognised in cash equivalents.
34.2 SecuritiesThe majority of the Company’s securities consists of debt
securities and are classifi ed at fair value through OCI (2017:
available-for-sale fi nancial assets) (see “— Note 35.2: Carrying
Amounts and Fair Values of Financial Instruments”).
The Company’ s securities portfolio amounts to € 12,794 million
and € 12,571 million as of 31 December 2018 and 2017,
respect ively. The security portfolio contains a non-current portion classifi ed at fair value through OCI of € 10,662 million
(2017: € 10,944 m illion available-for-sale securities), and a
current portion of € 2,132 million (2017: € 1,627 million) .
Included in the securities portfolio as of 31 December 2018
and 2017 , respectively, are co rporate and government bonds
bearing either fi xed rate coupons (€ 12,152 million nominal value;
2017: € 12,023 million) or fl oating rate coupons (€ 504 million
nominal value; 2017: € 376 million), foreign curre ncy funds of
hedge funds (€ 0 million nominal value; 2017: € 5 million) and
foreign currency f unds of fi xed income funds (€ 10 million fair
value; 2017: € 11 million).
When the Company enters in to securities lending or other
fi nancing activities that involve the pledging of securities as
collateral, the securities pledged continue to be recognised on
the balance sheet. As of 31 December 2018, securities for an
amount of € 63 million were pledged as collateral for borrowings
from banks (2017: € 67 million).

69 Airbus / Financial Statements 2018
Notes to the IFRS Consolidated Financial Statements /
FINANCIAL STATEMENTS 2018
2.7 Capital Structure and Financial Instruments
2
34.3 Financing LiabilitiesFinanc ing liabilities comprise obligations towards fi nancial
institutions, issued corporate bonds, deposits made by
customers of Airbus Bank, borrowings received from joint
ventures and other parties as well as fi nance lease liabilities.
Financing liabilities are recorded initially at the fair value of
the proceeds received, net of transaction costs incurred.
Subsequently, fi nancing liabilities are measured at amortised
cost, using the effective interest rate method with any difference
between proceeds (net of transaction costs) and redemption
amount being recognised in total fi nance income (cost) over the
period of the fi nancing liability.
Financing liabilities to fi nancial institutions may include liabilities
from securities lending transactions. In securities lending
transactions, the Company receives cash from its counterparty
and transfers the securities subject to the lending transaction
as collateral. The counterparty typically has the right to sell or
repledge the securities pledged. The amount of cash received
is recognised as a fi nancing liability. The securities pledged are
not derecognised, but remain on the Company’s Statement of
Financial Position.
(In € million) Not exceeding
1 year Over 1 year
up to 5 years More than
5 years Total
Bonds and commercial papers 0 2,386 4,273 6,659
Liabilities to financial institutions 86 150 117 353
Loans 70 203 26 299
Finance lease liabilities 23 146 161 330
Others (1) 1,284 1 0 1,285
31 December 2018 1,463 2,886 4,577 8,926
Bonds and commercial papers 512 1,524 5,027 7,063
Liabilities to financial institutions 290 1,397 325 2,012
Loans 144 200 185 529
Finance lease liabilities 17 139 186 342
Others (1) 1,249 1 0 1,250
31 December 2017 2,212 3,261 5,723 11,196
(1) Included in “others” are financing liabilities to joint ventures.
Long-term financing liabilities, mainly comprising bonds and
liabilities to fi nancial institutions, decreased by € -1,521 million
to € 7,463 million (2017: € 8,984 million), as a result of early
settlement of liabilities to fi nancial institutions with the European
Investment Bank (“EIB”).
Short-term financing liabilities decreased by € -749 million
to € 1,463 million (2017: € 2,212 mil lion). The decrease in short-
term fi nancing liabilities is mainly related to the settlement of a
Euro Medium Term Note (“EMTN”) bond in September 2018.
The Company has issued several euro-denominated bonds
under its EMTN programme and three stand-alone US dollar-
denominated bonds on the US institutional market under Rule
144A. It has also issued a euro-denominated convertible bond
and euro-denominated exchangeable bonds into Dassault
Aviation shares. Furthermore, the Company has long-term US
dollar-denominated loans outstanding with the Development
Bank of Japan (“DBJ”).
The Company can issue commercial paper under the so- called
“billet de trésorerie” programme at fl oating or fi xed interest
rates corresponding to the individual maturities ranging from
1 day to 12 months. The programme has been set up in 2003
with a maximum volume of € 2 billion, increased in 2013 to
a maximum volume of € 3 billion. As of 31 December 2018,
there were no outstanding amounts under this programme. The
Company established in April 2015 a US$ 2 billion commercial
paper programme which has been increased to US$ 3 billion in
April 2016. The commercial paper issuance activity was limited
in the course of the year 2018.
Financing liabilities include outstanding debt of € 25 million
(2017: € 46 million) relating to a loan Air bus received from
Air 2 US in 1999 by way of a reinvestment note amounting to
US$ 800 million, bearing a fi xed interest rate of 9.88%, and
other liabilities related to sales fi nancing (see “— Note 25: Sales
Financing Transactions”).

70 Airbus / Financial Statements 2018
Notes to the IFRS Consolidated Financial Statements / 2.7 Capital Structure and Financial Instruments
The terms and repayment schedules of these bonds and loans are as follows:
Principal amount
(In million)
Carrying amount (In € million)
Issuancedate
Coupon or interest
rate
Effective interest
rate Maturity
date Additional features
31 December
2018 2017
EMTN 15 years € 500 0 512 Sep 2003 5.50% 5.58% Sep 2018 Interest rate swapped into
3M Euribor +1.72%
US$ Bond 10 years US$ 1,000 848 818 Apr 2013 2.70% 2.73% Apr 2023 Interest rate swapped into
3M Libor +0.68%
EMTN 10 years € 1,000 1,038 1,031 Apr 2014 2.375% 2.394% Apr 2024 Interest rate swapped into
3M Euribor +1.40%
EMTN 15 years € 500 523 517 Oct 2014 2.125% 2.194% Oct 2029 Interest rate swapped into
3M Euribor +0.84%
Convertible bond7 years € 500 477 470 Jul 2015 0.00% 1.386% Jul 2022
Convertible into Airbus SE shares at € 99.54 per share
issued at 102%
EMTN 10 years € 600 594 584 May 2016 0.875% 0.951% May 2026 Interest rate swapped into
3M Euribor
EMTN 15 years € 900 865 851 May 2016 1.375% 1.49% May 2031 Interest rate swapped
into 3M Euribor
Exchangeable bonds5 years € 1,078 1,061 1,054 Jun 2016 0.00% 0.333% Jun 2021
Exchangeable into Dassault Aviation shares issued
at 103.75%
US$ Bond 10 years US$ 750 632 615 Apr 2017 3.15% 3.16% Apr 2027 Interest rate swapped into
3M Libor +0.87%
US$ Bond 30 years US$ 750 621 611 Apr 2017 3.95% 4.02% Apr 2047 Interest rate swapped into
3M Libor +1.61%
Bonds 6,659 7,063
DBJ 10 years US$ 300 87 250 Jan 2011
3M US-Libor
+1.15% Jan 2021 Interest rate swapped into
4.76% fixed
EIB 10 years US$ 721 0 343 Aug 2011
3M US-Libor +0.85% Aug 2021
Interest rate swapped into 3.2% fixed
EIB 7 years US$ 406 0 339 Feb 2013
3M US-Libor +0.93% Feb 2020
EIB 10 years US$ 627 0 516 Dec 2014 2.52% 2.52% Dec 2024 Interest rate swapped into
3M Libor +0.61%
EIB 10 years US$ 320 0 267 Dec 2015
6M US-Libor +0.559% Dec 2025
Others 266 297
Liabilities to financial institutions 353 2,012
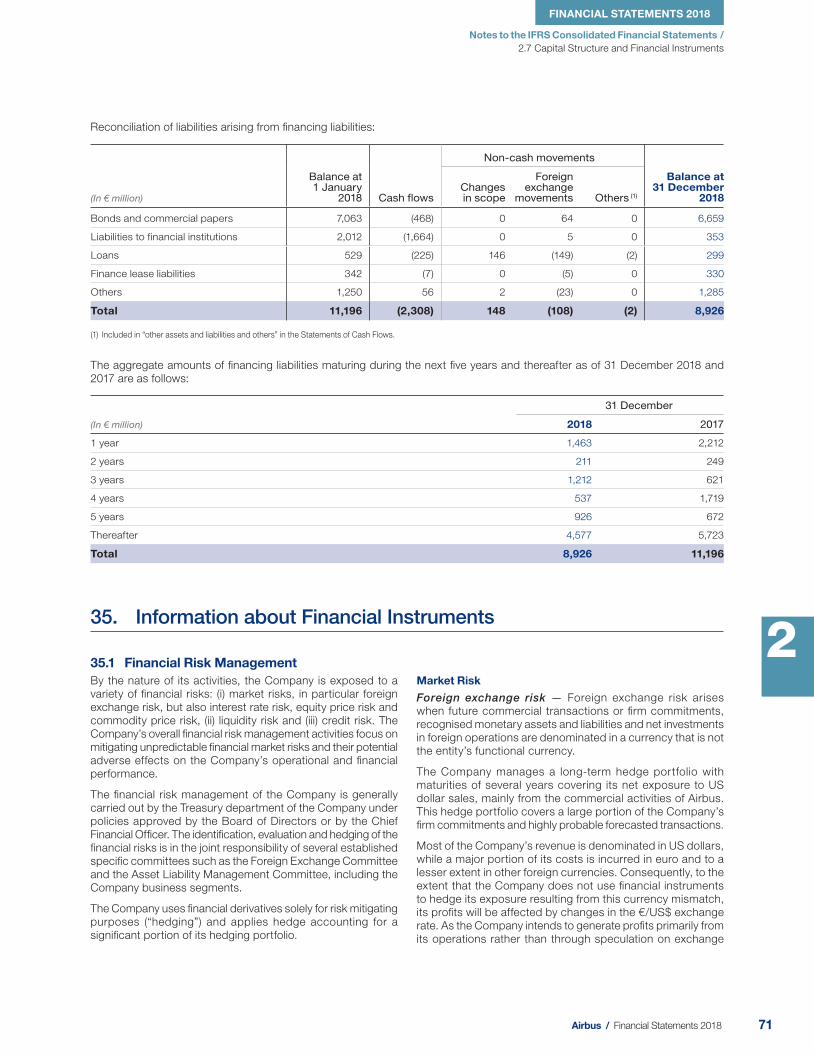
71 Airbus / Financial Statements 2018
Notes to the IFRS Consolidated Financial Statements /
FINANCIAL STATEMENTS 2018
2.7 Capital Structure and Financial Instruments
2
Reconciliation of liabilities arising from fi nancing liabilities:
(In € million)
Balance at 1 January
2018 Cash flows
Non-cash movements
Balance at 31 December
2018 Changes in scope
Foreign exchange
movements Others (1)
Bonds and commercial papers 7,063 (468) 0 64 0 6,659
Liabilities to financial institutions 2,012 (1,664) 0 5 0 353
Loans 529 (225) 146 (149) (2) 299
Finance lease liabilities 342 (7) 0 (5) 0 330
Others 1,250 56 2 (23) 0 1,285
Total 11,196 (2,308) 148 (108) (2) 8,926
(1) Included in “other assets and liabilities and others” in the Statements of Cash Flows.
The aggregate amounts of fi nancing liabilities maturing during the next fi ve years and thereafter as of 31 December 2018 and
2 017 are as follows:
(In € million)
31 December
2018 2017
1 year 1,463 2,212
2 years 211 249
3 years 1,212 621
4 years 537 1,719
5 years 926 672
Thereafter 4,577 5,723
Total 8,926 11,196
35. Information about Financial Instruments
35.1 Financial Risk ManagementBy the nature of its activities, the Company is exposed to a
variety of fi nancial risks: (i) market risks, in particular foreign
exchange risk, but also interest rate risk, equity price risk and
commodity price risk, (ii) liquidity risk and (iii) credit risk. The
Company’s overall fi nancial risk management activities focus on
mitigating unpredictable fi nancial market risks and their potential
adverse effects on the C ompany’s operational and fi nancial
performance.
The fi nancial risk management of the Company is generally
carried out by the Treasury department of the Company under
policies approved by the Board of Directors or by the Chief
Financial Offi cer. The identifi cation, evaluation and hedging of the
fi nancial risks is in the joint responsibility of several established
specifi c committees such as the Foreign Exchange Committee
and the Asset Liability Management Committee, including the
Company business segments .
The Company uses fi nancial derivatives solely for risk mitigating
purposes (“hedging”) and applies hedge accounting for a
signifi cant portion of its hedging portfolio.
Market Risk
Foreign exchange risk — Foreign exchange risk arises
when future commercial transactions or fi rm commitments,
recognised monetary assets and liabilities and net investments
in foreign operations are denominated in a currency that is not
the entity’s functional currency.
The Company manages a long-term hedge portfolio with
maturities of several years covering its net exposure to US
dollar sales, mainly from the commercial activities of Airbus.
This hedge portfolio covers a large portion of the Company’s
fi rm commitments and highly probable forecasted transactions.
Most of the Company’s revenue is denominated in US dollars,
while a major portion of its costs is incurred in euro and to a
lesser extent in other foreign currencies. Consequently, to the
extent that the Company does not use fi nancial instruments
to hedge its exposure resulting from this currency mismatch,
its profi ts will be affected by changes in the €/US$ exchange
rate. As the Company intends to generate profi ts primarily from
its operations rather than through speculation on exchange
72 Airbus / Financial Statements 2018
Notes to the IFRS Consolidated Financial Statements / 2.7 Capital Structure and Financial Instruments
rate movements, it uses hedging strategies to manage and
minimise the impact of exchange rate fl uctuations on these
profi ts.
With respect to its commercial aircraft products, until 30 June
2018 the Company typically hedged fi rmly committed sales in
US dollar using a “fi rst fl ow approach”. Under that approach,
the foreign currency derivatives the Company entered into were
designated as a hedge of the fi rst US dollar infl ows received
from the customer at aircraft delivery in a given month. The
strategy implied that only a portion of the expected monthly
customer payments made at aircraft delivery were hedged.
For this reason, a reduction of monthly cash infl ows as a result
of postponements or order cancellations had no impact on
the effectiveness of the hedge as long as the actual gross US
dollar cash infl ows received at aircraft delivery in a particular
month exceeded the portion designated as being hedged in
that month. However, if the monthly US dollar cash infl ows
received at aircraft delivery were expected to be, or proved
to be, less than the notional amount of the hedges maturing
in that month, the excess portion of the hedge notional would
disqualify for hedge accounting and the related fair value
changes or settlement gains or losses would be recognised
in fi nancial result.
As of 30 June 2018, the Company adopted a new hedge
strategy to hedge its net exposure (US dollar revenue less
US dollar cost) resulting from commercial aircraft deliveries of
specifi c aircraft types. The strategy more closely aligns hedge
accounting with risk management activities, and is described
in “— Note 4: Change in Accounting Policies and Disclosures”.
Under the new strategy the foreign exchange derivatives
used as hedging instruments are designated as a hedge of
a portion of the cash flows received for each of a number
of deliveries of a specific aircraft type that are expected to
occur in a given month, and hence will allow the hedge result
to move along with the hedged deliveries in the event of a
shift in deliveries.
The Company also hedges its expected foreign currency
exposure arising from US dollar or pound sterling cash outfl ows
in the commercial aircraft business on a fi rst outfl ow basis,
though to a much lesser extent than US dollar cash infl ows.
In military aircraft and non-aircraft businesses, the Company
hedges infl ows and outfl ows in foreign currencies from fi rmly
committed or highly probable forecast sales and purchase
contracts. Here, foreign currency derivatives are typically
contracted in lower volumes; they may be accounted for using
a fi rst fl ow approach or are designated as hedges of specifi c
agreed milestone payments. The amount of the expected
fl ows to be hedged can cover up to 100% of the equivalent
of the net US dollar exposure at inception. The coverage ratio
considers the variability in the range of potential outcomes
taking into account macroeconomic movements affecting
spot rates and interest rates as well as the robustness of the
commercial cycle.
In situations where the payment dates for hedged firmly
committed cash fl ows are not fi xed and subject to potentially
signifi cant delays, the Company may use rollover strategies,
usually involving foreign exchange swaps.
For all foreign currency hedges of future cash fl ows which
qualify for hedge accounting under IFRS 9, the Company uses
the cash fl ow hedge model, which requires (i) recognising
the effective portion of the fair value changes of the hedging
derivatives in equity (within OCI) and (ii) recognising the effect
of the hedge in profi t or loss when the hedged cash fl ows
affect profi t or loss.
In addition, the Company hedges currency risk arising from
fi nancial assets or liabilities denominated in currencies other
than the euro, including foreign currency receivable and
payable accounts, as well as foreign currency denominated
funding transactions or securities. T he Company applies hedge
accounting if a mismatch in terms of profi t or loss recognition
of the hedging instrument and hedged item would otherwise
occur. Frequently, however, the currency-induced gains or
losses of the hedging instrument and the hedged item match
in terms of profi t or loss recognition (“natural hedge”), so no
hedge accounting is required. Sometimes such gains or losses
may end up in different sections of the income statement (such
as operating profi t for the hedged item and fi nancial result for
the hedging instrument). If so, the Company may choose to
present the gains or losses of both the hedging instrument
and the hedged item in the same income statement line item
if certain formal requirements are met.
As hedging instruments, the Company primarily uses foreign
currency forwards, foreign currency options and to a minor
extent non-derivative fi nancial instruments. A hedge ratio of
1:1 is applied by the Company.
The Company also has foreign currency derivative instruments
which are embedded in cer tain purchase contracts
denominated in a currency other than the functional currency
of any substantial party to the contract, principally in US
dollar and pound sterling. If such embedded derivatives are
required to be accounted for separately from the host purchase
contract, related gains or losses are generally recognised in
other fi nancial result. However, if the embedded derivatives
qualify for hedge accounting, the Company might choose to
designate them as a hedging instrument in a hedge of foreign
currency risk, in which case they are accounted for under the
cash fl ow hedge model as described above.
Interest rate risk — The Company uses an asset-liability
management approach with the objective to limit its interest
rate risk. It undertakes to match the risk profi le of its interest-
bearing assets with those of its interest-bearing liabilities. The
remaining net interest rate exposure is managed through several
types of interest rate derivatives, such as interest rate swaps
and interest rate futures contracts, in order to minimise risks
and fi nancial impacts.
The vast majority of related interest rate hedges qualify for
hedge accounting, and most of them are accounted for under
the fair value hedge model. As a result, both the fair value
changes of these derivatives and the portion of the hedged
items’ fair value change that is attributable to the hedged
interest rate risk are recognised in profi t and loss, where they
offset to the extent the hedge is effective.
A few interest rate swaps that have been entered into as
a hedge of certain of the Company variable rate debt (see
“— Note 34.3: Financing Liabilities”) are accounted for under the

73 Airbus / Financial Statements 2018
Notes to the IFRS Consolidated Financial Statements /
FINANCIAL STATEMENTS 2018
2.7 Capital Structure and Financial Instruments
2
cash fl ow hedge model. Related fair value gains are recognised
in OCI and reclassifi ed to profi t or loss when the hedged interest
payments affect profi t or loss.
The Company invests in fi nancial instruments such as overnight
deposits, certifi cates of deposits, commercial papers, other
money market instruments and short-term as well as medium-
term bonds. For its fi nancial instruments portfolio, the Company
has an Asset Liability Management Committee in place that
meets regularly and aims to limit the interest rate risk on a fair
value basis through a value-at-risk approach, from which results
a hedge ratio that is however not actively steered.
Commodity price risk — The Company is exposed to risk
relating to fl uctuations in the prices of commodities used in the
supply chain. It manages these risks in the procurement process
and to a certain extent uses derivative instruments in order to
mitigate the risks associated with the purchase of raw materials.
To the extent that the gains or losses of the derivative and those
of the hedged item or transaction do not match in terms of profi t
or loss, the Company applies cash fl ow hedge accounting to
the derivative instruments, with a hedge ratio of 1:1.
Equity price risk — The Company is to a small extent invested
in equity securities mainly for operational reasons. Its exposure
to equity price risk is hence limited. Furthermore, it is exposed
under its LTIP to the risk of the Company share price increases.
The Company limits these risks through the use of equity
derivatives that qualify for hedge accounting and have been
designated as hedging instruments in cash fl ow hedges, with
a hedge ratio of 1:1.
Sensitivities of market risks — The approach used to measure
and control market risk exposure of the Company’s fi nancial
instrument portfolio is, amongst other key indicators, the value-
at-risk model (“VaR”). The VaR of a portfolio is the estimated
potential loss that will not be exceeded over a specifi ed period
of time (holding period) from an adverse market movement with
a specifi ed confi dence level. The VaR used by the Company
is based upon a 95% confi dence level and assumes a fi ve-
day holding period. The VaR model used is mainly based on
the so- called “Monte-Carlo-Simulation” method. The model
generates a wide range of potential future scenarios for market
price movements by deriving the relevant statistical behaviour
of markets for the portfolio of market data from the previous
two years and observed interdependencies between different
markets and prices.
The Company’s VaR computation includes the Company’s
fi nancial debt, short-term and long-term investments, foreign
currency forwards, swaps and options, commodity contracts,
fi nance lease receivables and liabilities, foreign currency trade
liabilities and receivables and contract assets.
Although VaR is an important tool for measuring market risk,
the assumptions on which the model is based give rise to some
limitations, including the following:
-a fi ve -day holding period assumes that it is possible to hedge
or dispose of positions within that period. This is considered
to be a realistic assumption in almost all cases but may not be
the case in situations in which there is severe market illiquidity
for a prolonged period.
-a 95% confi dence level does not refl ect losses that may occur
beyond this level. Even within the model used there is a 5%
statistical probability that losses could exceed the calculated
VaR.
-the use of historical data as a basis for estimating the statistical
behaviour of the relevant markets and fi nally determining
the possible range of future outcomes out of this statistical
behaviour may not always cover all possible scenarios,
especially those of an exceptional nature.
The Company uses VaR amongst other key fi gures in order to
determine the riskiness of its fi nancial instrument portfolio and
in order to optimise the risk-return ratio of its fi nancial asset
portfolio. Further, its investment policy defi nes a VaR limit for the
total portfolio of cash, cash equivalents and securities. The total
VaR as well as the different risk-factor specifi c VaR fi gures of
this portfolio are measured and serve amongst other measures
as a basis for the decisions of the Company’s Asset Liability
Management Committee.
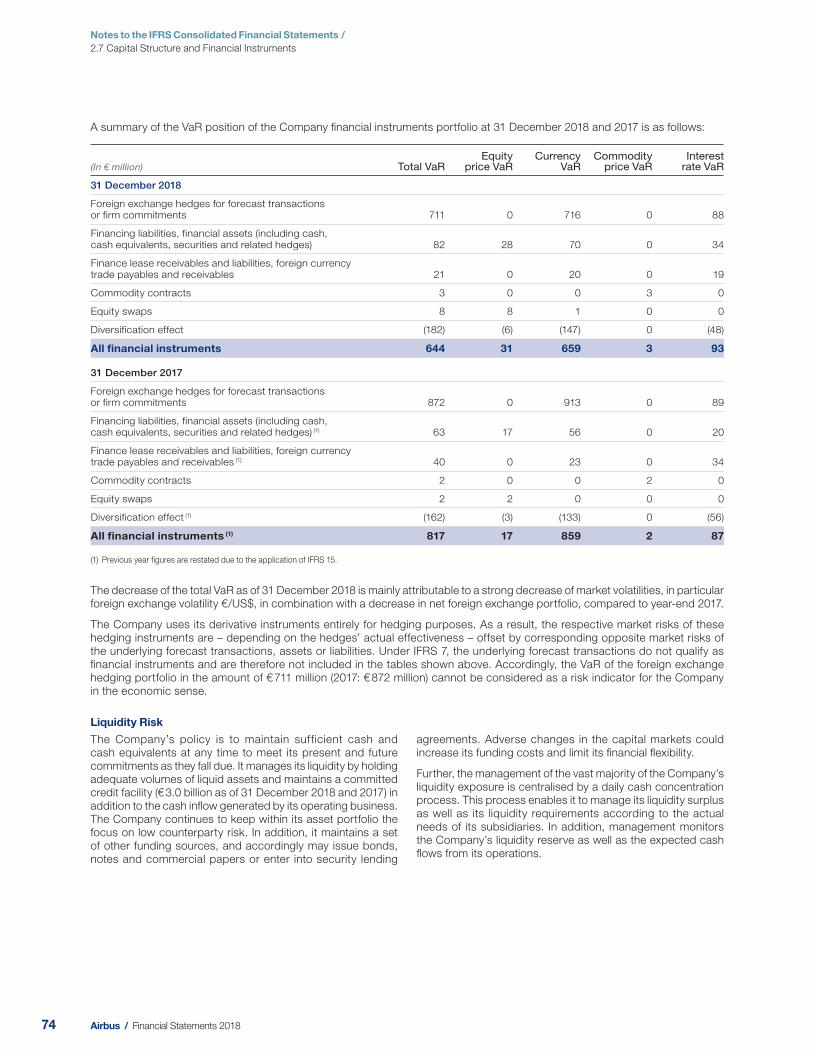
74 Airbus / Financial Statements 2018
Notes to the IFRS Consolidated Financial Statements / 2.7 Capital Structure and Financial Instruments
A summary of the VaR position of the Company fi nancial instruments portfolio at 31 December 201 8 and 2017 is as follo ws:
(In € million) Total VaR Equity
p rice VaR Currency
VaR Commodity
p rice VaR Interest
rate VaR
31 December 2018
Foreign exchange hedges for forecast transactions or firm commitments 711 0 716 0 88
Financing liabilities, financial assets (including cash, cash equivalents, securities and related hedges) 82 28 70 0 34
Finance lease receivables and liabilities, foreign currency trade payables and receivables 21 0 20 0 19
Commodity contracts 3 0 0 3 0
Equity swaps 8 8 1 0 0
Diversification effect (182) (6) (147) 0 (48)
All financial instruments 644 31 659 3 93
31 December 2017
Foreign exchange hedges for forecast transactions or firm commitments 872 0 913 0 89
Financing liabilities, financial assets (including cash,cash equivalents, securities and related hedges) (1) 63 17 56 0 20
Finance lease receivables and liabilities, foreign currency trade payables and receivables (1) 40 0 23 0 34
Commodity contracts 2 0 0 2 0
Equity swaps 2 2 0 0 0
Diversification effect (1) (162) (3) (133) 0 (56)
All financial instruments (1) 817 17 859 2 87
(1) Previous year figures are restated due to the application of IFRS 15.
The decrease of the total VaR as of 31 December 2018 is mainly attributable to a strong decrease of market volatilities, in particular
foreign exchange volatility €/US$, in combination with a decrease in net foreign exchange portfolio, compared to year-end 2017.
The Company uses its derivative instruments entirely for hedging purposes. As a result, the respective market risks of these
hedging instruments are – depending on the hedges’ actual effectiveness – offset by corresponding opposite market risks of
the underlying forecast transactions, assets or liabilities. Under IFRS 7, the underlying forecast transactions do not qualify as
fi nancial instruments and are therefore not included in the tables shown above. Accordingly, the VaR of the foreign exchange
hedging portfolio in the amount of € 711 million (2017: € 872 million) cannot be considered as a risk indicator for the Company
in the economic sense.
Liquidity Risk
The Company’s policy is to maintain sufficient cash and
cash equivalents at any time to meet its present and future
commitments as they fall due. It manages its liquidity by holding
adequate volumes of liquid assets and maintains a committed
credit facility (€ 3.0 billion as of 31 December 2018 and 2017) in
addition to the cash infl ow generated by its operating business.
The Company continues to keep within its asset portfolio the
focus on low counterparty risk. In addition, it maintains a set
of other funding sources, and accordingly may issue bonds,
notes and commercial papers or enter into security lending
agreements. Adverse changes in the capital markets could
increase its funding costs and limit its fi nancial fl exibility.
Further, the management of the vast majority of the Company’s
liquidity exposure is centralised by a daily cash concentration
process. This process enables it to manage its liquidity surplus
as well as its liquidity requirements according to the actual
needs of its subsidiaries. In addition, management monitors
the Company’s liquidity reserve as well as the expected cash
fl ows from its operations.

75 Airbus / Financial Statements 2018
Notes to the IFRS Consolidated Financial Statements /
FINANCIAL STATEMENTS 2018
2.7 Capital Structure and Financial Instruments
2
The contractual maturities of the Company’s fi nancial liabilities, based on undiscounted cash fl ows and including interest payments,
if applicable, are as follows:
(In € million) Carrying amount
Contractual cash flows < 1 year
1 year - 2 years
2 years - 3 years
3 years - 4 years
4 years - 5 years > 5 years
31 December 2018
Non-derivative financial liabilities (28,302) (29,843) (20,541) (429) (1,452) (726) (1,075) (5,620)
Derivative financial liabilities (2,755) (4,479) (1,806) (1,075) (868) (492) (157) (81)
Total (31,057) (34,322) (22,347) (1,504) (2,320) (1,218) (1,232) (5,701)
31 December 2017
Non-derivative financial liabilities (1) (25,185) (27,030) (16,280) (428) (812) (1,896) (829) (6,785)
Derivative financial liabilities (2,271) (3,063) (1,167) (835) (184) (3) (2) (872)
Total (1) (27,456) (30,093) (17,447) (1,263) (996) (1,899) (831) (7,657)
(1) Previous year figures are restated due to the application of IFRS 15.
Non-derivative fi nancial liabilities included in the table above comprise fi nancing liabilities and fi nance lease liabilities as presented
in the tables of “— Note 35.2: Carrying Amounts and Fair Values of Financial Instruments”. Due to their specifi c nature, namely
their risk-sharing features and uncertainty about the repayment dates, the European Governments’ refundable advances, which
amount to € - 4,577 million at 31 Dec ember 2018 (€ - 5,901 million at 31 Decembe r 2017) are not included.
Credit Risk
The Company is exposed to credit risk to the extent of non-
performance by either its customers (e.g. airlines) or its
counterparts with regard to fi nancial instruments or issuers of
fi nancial instruments for gross cash investments. However, it
has policies in place to avoid concentrations of credit risk and
to ensure that credit risk is limited.
As far as central treasury activities are concerned, credit risk
resulting from fi nancial instruments is managed by the Company.
In order to ensure suffi cient diversifi cation, a credit limit system
is used.
The Company monitors the performance of the individual
fi nancial instruments and the impact of market developments on
their performance and takes appropriate action on foreseeable
adverse development based on pre-defi ned procedures and
escalation levels.
Sales of products and services are made to customers after
having conducted appropriate internal credit risk assessment.
In order to support sales, primarily at Airbus and ATR, the
Company may agree to participate in customer fi nancing, on
a case-by-case basis either directly or through guarantees
provided to third parties. In determining the amount and terms
of the fi nancing transaction, t he Company takes into account
the airline’s credit rating and economic factors refl ecting the
relevant fi nancial market conditions, together with appropriate
assumptions as to the anticipated future value of the fi nanced
asset.
The booked amount of fi nancial assets represents the maximum
credit exposure. The credit quality of fi nancial assets can be
assessed by reference to external credit rating (if available) or
internal assessment of customers’ creditworthiness e.g. airlines
by way of internal risk pricing methods.
For further information relating to gross credit risk and impairment
see “— Note 35.7: Impairment Losses”
35.2 Carrying Amounts and Fair Values of Financial Instruments
Financial instruments — The Company’s fi nancial assets mainly
consist of cash, short to medium-term deposits and securities.
Its fi nancial liabilities include trade liabilities, obligations towards
fi nancial institutions, issued bonds and refundable advances
from European Governments . All purchases and sales of
fi nancial assets are recognised on the settlement date according
to market conventions.
From January 2018, the Company classifi es its fi nancial assets
in one of the following categories: (i) at fair value through OCI,
(ii) at fair value through profi t and loss and (iii) at amortised cost.
Classifi cation depends on the Company’s business model for
managing the fi nancial assets and the contractual terms of the
cash fl ows, as described in “— Note 4: Change in Accounting
Policies and Disclosures”.
Until 31 December 2017, the Company classifi ed its fi nancial
assets in the following three categories: (i) at fair value through
profi t and loss, (ii) loans and receivables and (iii) available-
for-sale fi nancial assets. Classifi cation was determined by
management at initial recognition and depended on the purpose
of acquisition.
Available-for-sale fi nancial assets — Financial assets classifi ed
as available-for-sale were accounted for at fair value. Changes
in their fair value other than impairment losses and foreign
exchange gains and losses on monetary items were recognised
directly within AOCI. Upon disposal of such fi nancial assets,
the cumulative gain or loss previously recognised in equity
was recorded as part of other income ( other expenses ) from
investments in the Consolidated Income Statement for the
period. Interest earned on the investment were presented as
interest income in the Consolidated Income Statement using the
effective interest method. Dividends earned on investment were
recognised as other income ( other expenses ) from investments
in the Consolidated Income Statement when the right to the
payment had been established.
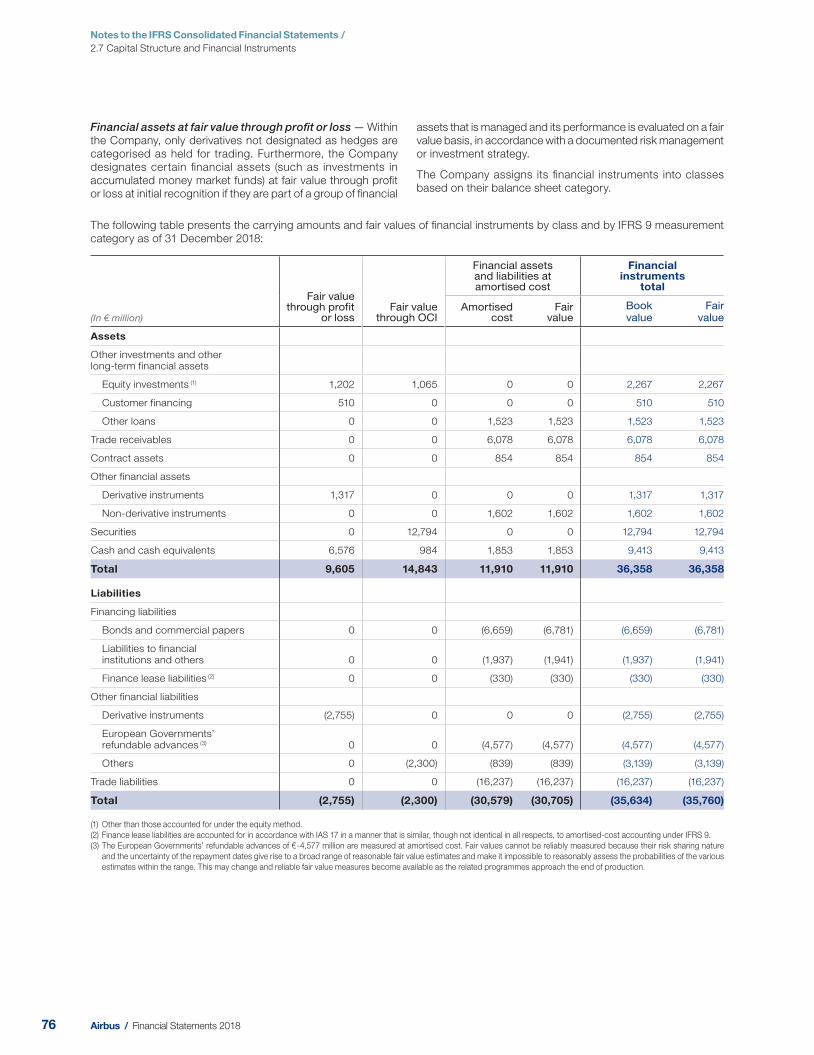
76 Airbus / Financial Statements 2018
Notes to the IFRS Consolidated Financial Statements / 2.7 Capital Structure and Financial Instruments
The following table presents the carrying amounts and fair values of fi nancial instruments by class and by IFRS 9 measurement
category as of 31 December 2 018:
(In € million)
Fair value through profit
or loss Fair value
through OCI
Financial assets and liabilities at amortised cost
Financial instruments
total
Amortised cost
Fair value
Book value
Fair value
Assets
Other investments and otherlong-term financial assets
Equity investments (1) 1,202 1,065 0 0 2,267 2,267
Customer financing 510 0 0 0 510 510
Other loans 0 0 1,523 1,523 1,523 1,523
Trade receivables 0 0 6,078 6,078 6,078 6,078
Contract assets 0 0 854 854 854 854
Other financial assets
Derivative instruments 1,317 0 0 0 1,317 1,317
Non-derivative instruments 0 0 1,602 1,602 1,602 1,602
Securities 0 12,794 0 0 12,794 12,794
Cash and cash equivalents 6,576 984 1,853 1,853 9,413 9,413
Total 9,605 14,843 11,910 11,910 36,358 36,358
Liabilities
Financing liabilities
Bonds and commercial papers 0 0 (6,659) (6,781) (6,659) (6,781)
Liabilities to financialinstitutions and others 0 0 (1,937) (1,941) (1,937) (1,941)
Finance lease liabilities (2) 0 0 (330) (330) (330) (330)
Other financial liabilities
Derivative instruments (2,755) 0 0 0 (2,755) (2,755)
European Governments’refundable advances (3) 0 0 (4,577) (4,577) (4,577) (4,577)
Others 0 (2,300) (839) (839) (3,139) (3,139)
Trade liabilities 0 0 (16,237) (16,237) (16,237) (16,237)
Total (2,755) (2,300) (30,579) (30,705) (35,634) (35,760)
(1) Other than those accounted for under the equity method.
(2) Finance lease liabilities are accounted for in accordance with IAS 17 in a manner that is similar, though not identical in all respects, to amortised-cost accounting under IFRS 9.
(3) The European Governments’ refundable advances of € - 4,577 million are measured at amortised cost. Fair values cannot be reliably measured because their risk sharing nature
and the uncertainty of the repayment dates give rise to a broad range of reasonable fair value estimates and make it impossible to reasonably assess the probabilities of the various
estimates within the range. This may change and reliable fair value measures become available as the related programmes approach the end of production.
Financial assets at fair value through profi t or loss — Within
the Company, only derivatives not designated as hedges are
categorised as held for trading. Furthermore, the Company
designates certain fi nancial assets (such as investments in
accumulated money market funds) at fair value through profi t
or loss at initial recognition if they are part of a group of fi nancial
assets that is managed and its performance is evaluated on a fair
value basis, in accordance with a documented risk management
or investment strategy.
The Company assigns its fi nancial instruments into classes
based on their balance sheet category.
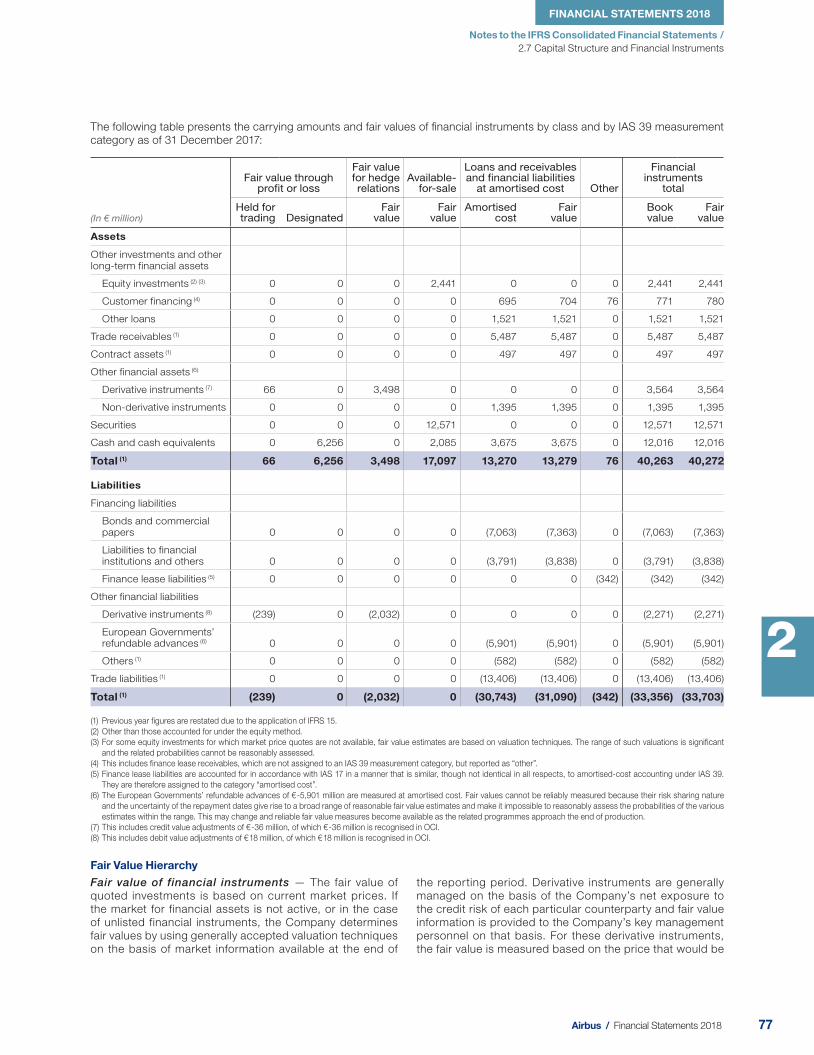
77 Airbus / Financial Statements 2018
Notes to the IFRS Consolidated Financial Statements /
FINANCIAL STATEMENTS 2018
2.7 Capital Structure and Financial Instruments
2
The following table presents the carrying amounts and fair values of fi nancial instruments by class and by IAS 39 measurement
category as of 3 1 December 2017:
(In € million)
Fair value through profit or loss
Fair value for hedge relations
Available-for-sale
Loans and receivables and financial liabilities
at amortised cost Other
Financial instruments
total
Held for trading Designated
Fair value
Fair value
Amortised cost
Fair value
Book value
Fair value
Assets
Other investments and other long-term financial assets
Equity investments (2) (3) 0 0 0 2,441 0 0 0 2,441 2,441
Customer financing (4) 0 0 0 0 695 704 76 771 780
Other loans 0 0 0 0 1,521 1,521 0 1,521 1,521
Trade receivables (1) 0 0 0 0 5,487 5,487 0 5,487 5,487
Contract assets (1) 0 0 0 0 497 497 0 497 497
Other financial assets (6)
Derivative instruments (7) 66 0 3,498 0 0 0 0 3,564 3,564
Non-derivative instruments 0 0 0 0 1,395 1,395 0 1,395 1,395
Securities 0 0 0 12,571 0 0 0 12,571 12,571
Cash and cash equivalents 0 6,256 0 2,085 3,675 3,675 0 12,016 12,016
Total (1) 66 6,256 3,498 17,097 13,270 13,279 76 40,263 40,272
Liabilities
Financing liabilities
Bonds and commercial papers 0 0 0 0 (7,063) (7,363) 0 (7,063) (7,363)
Liabilities to financial institutions and others 0 0 0 0 (3,791) (3,838) 0 (3,791) (3,838)
Finance lease liabilities (5) 0 0 0 0 0 0 (342) (342) (342)
Other financial liabilities
Derivative instruments (8) (239) 0 (2,032) 0 0 0 0 (2,271) (2,271)
European Governments’ refundable advances (6) 0 0 0 0 (5,901) (5,901) 0 (5,901) (5,901)
Others (1) 0 0 0 0 (582) (582) 0 (582) (582)
Trade liabilities (1) 0 0 0 0 (13,406) (13,406) 0 (13,406) (13,406)
Total (1) (239) 0 (2,032) 0 (30,743) (31,090) (342) (33,356) (33,703)
(1) Previous year figures are restated due to the application of IFRS 15.
(2) Other than those accounted for under the equity method.
(3) For some equity investments for which market price quotes are not available, fair value estimates are based on valuation techniques. The range of such valuations is significant
and the related probabilities cannot be reasonably assessed.
(4) This includes finance lease receivables, which are not assigned to an IAS 39 measurement category, but reported as “other”.
(5) Finance lease liabilities are accounted for in accordance with IAS 17 in a manner that is similar, though not identical in all respects, to amortised-cost accounting under IAS 39.
They are therefore assigned to the category “amortised cost”.
(6) The European Governments’ refundable advances of € - 5,901 million are measured at amortised cost. Fair values cannot be reliably measured because their risk sharing nature
and the uncertainty of the repayment dates give rise to a broad range of reasonable fair value estimates and make it impossible to reasonably assess the probabilities of the various
estimates within the range. This may change and reliable fair value measures become available as the related programmes approach the end of production.
(7) This includes credit value adjustments of € -36 million, of which € -36 million is recognised in OCI.
(8) This includes debit value adjustments of € 18 million, of which € 18 million is recognised in OCI.
Fair Value Hierarchy
Fair value of financial instruments — The fair value of
quoted investments is based on current market prices. If
the market for financial assets is not active, or in the case
of unlisted financial instruments, the Company determines
fair values by using generally accepted valuation techniques
on the basis of market information available at the end of
the reporting period. Derivative instruments are generally
managed on the basis of the Company’s net exposure to
the credit risk of each particular counterparty and fair value
information is provided to the Company’s key management
personnel on that basis. For these derivative instruments,
the fair value is measured based on the price that would be
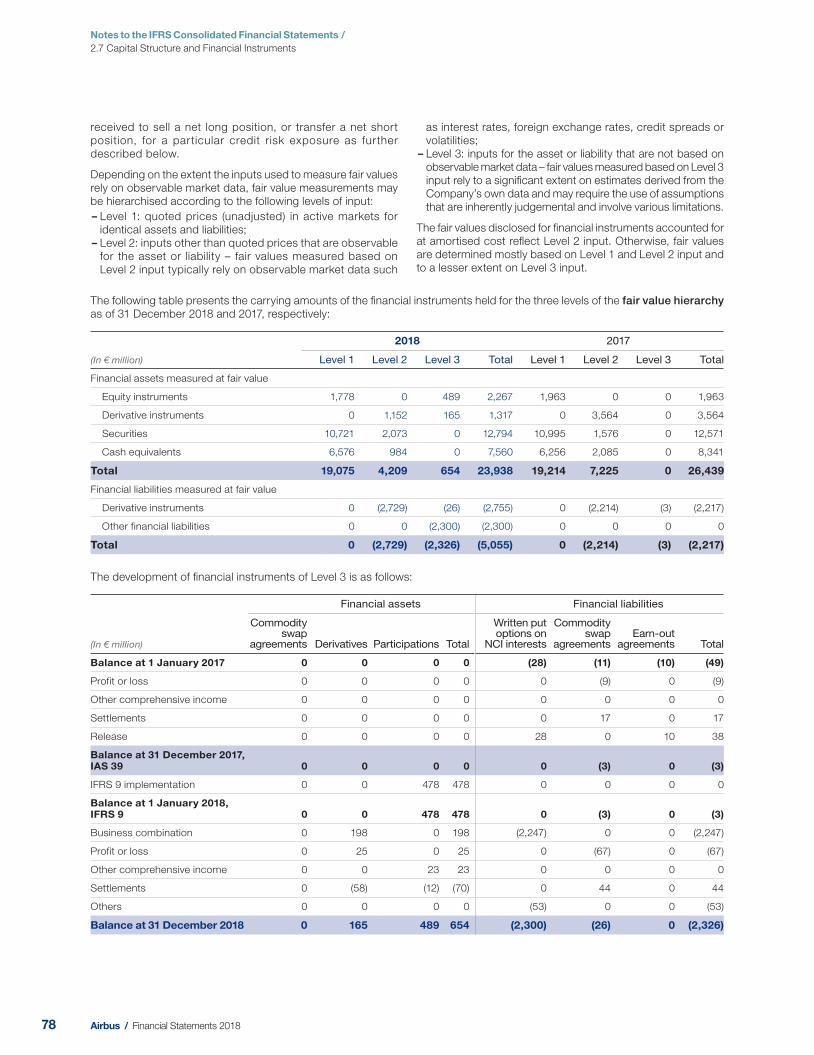
78 Airbus / Financial Statements 2018
Notes to the IFRS Consolidated Financial Statements / 2.7 Capital Structure and Financial Instruments
received to sell a net long position, or transfer a net short
position, for a particular credit risk exposure as further
described below.
Depending on the extent the inputs used to measure fair values
rely on observable market data, fair value measurements may
be hierarchised according to the following levels of input:
-Level 1: quoted prices (unadjusted) in active markets for
identical assets and liabilities;
-Level 2: inputs other than quoted prices that are observable
for the asset or liability – fair values measured based on
Level 2 input typically rely on observable market data such
as interest rates, foreign exchange rates, credit spreads or
volatilities;
-Level 3: inputs for the asset or liability that are not based on
observable market data – fair values measured based on Level 3
input rely to a signifi cant extent on estimates derived from the
Company’s own data and may require the use of assumptions
that are inherently judgemental and involve various limitations.
The fair values disclosed for fi nancial instruments accounted for
at amortised cost refl ect Level 2 input. Otherwise, fair values
are determined mostly based on Level 1 and Level 2 input and
to a lesser extent on Level 3 input.
The following table presents the carrying amounts of the fi nancial instruments held for the three levels of the fair value hierarchy
as of 31 December 2018 and 2017, respect ively:
(In € million)
2018 2017
Level 1 Level 2 Level 3 Total Level 1 Level 2 Level 3 Total
Financial assets measured at fair value
Equity instruments 1,778 0 489 2,267 1,963 0 0 1,963
Derivative instruments 0 1,152 165 1,317 0 3,564 0 3,564
Securities 10,721 2,073 0 12,794 10,995 1,576 0 12,571
Cash equivalents 6,576 984 0 7,560 6,256 2,085 0 8,341
Total 19,075 4,209 654 23,938 19,214 7,225 0 26,439
Financial liabilities measured at fair value
Derivative instruments 0 (2,729) (26) (2,755) 0 (2,214) (3) (2,217)
Other financial liabilities 0 0 (2,300) (2,300) 0 0 0 0
Total 0 (2,729) (2,326) (5,055) 0 (2,214) (3) (2,217)
The development of fi nancial instruments of Level 3 is as follows:
Financial assets Financial liabilities
(In € million)
Commodity swap
agreements Derivatives Participations Total
Written put options on
NCI interests
Commodity swap
agreements Earn-out
agreements Total
Balance at 1 January 2017 0 0 0 0 (28) (11) (10) (49)
Profit or loss 0 0 0 0 0 (9) 0 (9)
Other comprehensive income 0 0 0 0 0 0 0 0
Settlements 0 0 0 0 0 17 0 17
Release 0 0 0 0 28 0 10 38
Balance at 31 December 2017, IAS 39 0 0 0 0 0 (3) 0 (3)
IFRS 9 implementation 0 0 478 478 0 0 0 0
Balance at 1 January 2018, IFRS 9 0 0 478 478 0 (3) 0 (3)
Business combination 0 198 0 198 (2,247) 0 0 (2,247)
Profit or loss 0 25 0 25 0 (67) 0 (67)
Other comprehensive income 0 0 23 23 0 0 0 0
Settlements 0 (58) (12) (70) 0 44 0 44
Others 0 0 0 0 (53) 0 0 (53)
Balance at 31 December 2018 0 165 489 654 (2,300) (26) 0 (2,326)

79 Airbus / Financial Statements 2018
Notes to the IFRS Consolidated Financial Statements /
FINANCIAL STATEMENTS 2018
2.7 Capital Structure and Financial Instruments
2
The fi nancial liabilities measured at fair value that are classifi ed
as Level 3 consist mainly of the written put options on non-
controlling interests resulting from the acquisition of CSALP
(see “— Note 6: Acquisitions and Disposals”).
The Company has remeasured certain unlisted equity
investments as described in “— Note 4: Change in Accounting
Policies and Disclosures”. The fair value of some of these equity
investments have been determined using valuation methods
such as the net asset value technique.
For short-term commodity contracts, the notional amounts,
being the unobservable input, are set with reference to monthly
commodity volumes that management expects to purchase
based on planning forecasts. The fair values are otherwise
determined using observable market data including quoted
interest rates and pricing information obtained from recognised
vendors of market data.
Financial Assets Designated at Fair Value through Profit or Loss
The following types of fi nancial assets held at 31 De cember 2018 and 2017, respectively, are designated at fair value through
profi t or loss:
(In € million)
Nominal amount at initial recognition at
31 December 2018
Fair value at 31 December
2018
Nominal amount at initial recognition at 31 December 2017
Fair value at 31 December
2017
Designated at fair value through profit or loss at recognition:
Money market funds (accumulating) 5,415 5,416 6,256 6,256
Foreign currency funds of hedge funds 0 0 5 0
Foreign currency funds of fixed income funds 9 9 11 11
Total 5,424 5,425 6,272 6,267
The Company manages these assets and measures their performance on a fair value basis.
In addition, the Company invests in non-accumulating money market funds, which pay interest on a monthly basis. The fair value
of those funds corresponds to their nominal amount at initial recognition date amounting to € 1, 159 million (201 7: € 1,186 million).
Fair Value Measurement Method
The Company uses the following methods to measure fair
values:
Equity instruments — The fair values of listed equity instruments
refl ect quoted market prices. For non-listed equity investments
for which quoted market prices are not available, the Company
determines the fair values using valuation methods such as net
asset values or a comparable valuation technique.
Customer fi nancing assets and other loans — The carrying
amounts refl ected in the annual accounts are used as a proxy
for fair value.
Contract assets, trade receivables and other receivables —
The carrying amounts refl ected in the annual accounts are used
as reasonable estimates of fair value because of the relatively
short period between the receivables’ origination and their
maturity.
Securities — The fair values of securities refl ect their quoted
market price at the end of the reporting period.
Cash and cash equivalents — include cash in hand, cash in
banks, checks, fi xed deposits as well as commercial papers
and money market funds. The carrying amounts refl ected in the
annual accounts are used as reasonable estimates of fair value
because of the relatively short period between the origination
of the instrument and its maturity or due date. The fair value
of commercial papers is determined based on Level 2 input
by discounting future cash fl ows using appropriate interest
rates. The fair values of money market funds are determined
by reference to their quoted market price.
Derivatives — The fair values of derivative instruments refl ect
quoted market prices, where available, but in most cases are
determined using recognised valuation techniques such as
option-pricing models and discounted cash fl ow models. The
valuation is based on observable market data such as currency
rates, currency forward rates, interest rates and yield curves,
commodity forward prices as well as price and rate volatilities
obtained from recognised vendors of market data. Furthermore,
to the extent that these instruments are subject to master netting
arrangements and similar agreements and managed on the
basis of net credit exposure, their fair values refl ect credit and
debit value adjustments based on the net long or net short
position that the Company has with each counterparty. Except
for certain short-term commodity contracts discussed in the
Level 3 section above, derivative fair values are measured based
on Level 2 input.
Financing liabilities — The fair values disclosed for fi nancing
liabilities, other than those of issued bonds and commercial
papers, are determined based on Level 2 input by discounting
scheduled or expected cash fl ows using appropriate market
interest rates. The fair values disclosed for the issued EMTN
and US dollar bonds refl ect public price quotations that qualify
as Level 1 input. For issued commercial papers, the carrying
amounts refl ected in the annual accounts are used as reasonable
estimates of fair value because of the relatively short period
between the origination of these instruments and their maturity.
Trade liabilities and current other fi nancial liabilities — For
the same reason as trade receivables, carrying amounts are
used as reasonable fair value approximations for trade liabilities
and current other fi nancial liabilities.

80 Airbus / Financial Statements 2018
Notes to the IFRS Consolidated Financial Statements / 2.7 Capital Structure and Financial Instruments
The following interest rate curves are used in the determination of the fair value in respect of the derivative fi nancial instruments
as of 31 December 20 18 and 2017:
(Rate in %)
31 December
2018 2017 2018 2017 2018 2017
€ US$ £
6 months (0.30) (0.32) 2.95 1.91 1.05 0.87
1 year (0.19) (0.22) 3.10 2.18 1.29 0.90
5 years 0.14 0.25 2.60 2.24 1.31 1.03
10 years 0.76 0.81 2.73 2.39 1.44 1.27
35.3 Potential Effect of Set-Off Rights on Recognised Financial Assets and LiabilitiesThe Company reports all its fi nancial assets and fi nancial liabilities on a gross basis. With each derivative counterparty there are
master netting agreements in place providing for the immediate close-out of all outstanding derivative transactions and payment
of the net termination amount in the event a party to the agreement defaults or another defi ned termination event occurs.
Furthermore, securities lending transactions are accounted for as collateralised borrowings. As a result, the securities pledged
as collateral continue to be recognised on the balance sheet and the amount of cash received at the outset of the transaction is
separately recognised as a fi nancial liability. The following tables set out, on a counterparty specifi c basis, the potential effect of
master netting agreements and collateralised borrowings on the Company’s fi nancial position, separately for fi nancial assets and
fi nancial liabilities that were subject to such agreements as of 31 December 2018 and 2 017, respectively:
(In € million)
Gross amounts
recognised
Gross amounts
recognised set off in
the financial statements
Net amounts presented in the financial statements
Related amounts not set off in statement
of financial positions
Net amount Financial
instruments
Cash collateral received
31 December 2018
Financial asset 1,186 0 1,186 (872) 0 314
Financial liabilities 2,726 0 2,726 (872) 0 1,854
31 December 2017
Financial asset 3,564 0 3,564 (2,068) 44 1,540
Financial liabilities 2,271 0 2,271 (2,068) 0 203
35.4 Notional Amounts of Derivative Financial InstrumentsThe contract or notional amounts of derivative fi nancial instruments shown below do not necessarily represent amounts exchanged
by the parties and, thus, are not necessarily a measure for the exposure of the Company through its use of derivatives.
The notional amounts of foreign exchange derivative financial instruments are as follows, specifi ed by year of expected maturity:
(In € million)
Remaining period
1 year 2 years 3 years 4 years 5 years > 5 years Total
31 December 2018
Net forward sales contracts 20,843 18,496 13,540 6,173 1,098 71 60,221
Foreign exchange options 1,642 4,048 1,467 0 0 0 7,157
Foreign exchange swap contracts 0 2,473 0 0 0 0 2,473
31 December 2017
Net forward sales contracts 18,568 16,596 14,007 8,304 2,356 241 60,072
Foreign exchange options 0 3,160 3,865 1,401 0 0 8,426
Foreign exchange swap contracts (610) 0 0 0 0 0 (610)

81 Airbus / Financial Statements 2018
Notes to the IFRS Consolidated Financial Statements /
FINANCIAL STATEMENTS 2018
2.7 Capital Structure and Financial Instruments
2
The following table sets out the notional amount of foreign exchange hedges in place as of 31 December 2018 relating to the
commercial activities of Airbus, and the average euro converted rates applicable to corresponding EBIT.
(In US $ million) 2019 2020 2021 2022 2023+ Total
Total hedges 27,544 26,824 18,631 7,585 1,339 81,923
Forward rates
€/US$ 1.23 1.23 1.24 1.27 1.30 1.24
£/US$ 1.45 1.37 1.36 1.35 1.37 1.40
In 2018 new hedge contracts of US$ 19.0 billion (20 17: US$ 12.4 billion) were added at an average rate of 1.25 US$/€ (2017: 1.22
US$/€).
As of 31 Dece mber 2018, the total hedge portfolio with maturities up to 2024 amounts to US$ 81.9 billion (2017: US$ 88.7 billion)
and covers a major portion of the foreign exchange exposure expected over the period of the operative planning. The average
US$/€ hedge rate of the US$/€ hedge portfolio until 2024 amounts to 1.24 US$/€ (2017: 1.23 US$/€) and for the US$/£ hedge
portfolio until 2023 amounts to 1.40 US$/£ (2017: 1.43 US$/£).
The notional amounts of interest rate contracts are as follows:
(In € million)
Remaining period
1 year 2 years 3 years 4 years 5 years 6 years 7 years > 7 years Total
31 December 2018
Interest rate contracts 939 7 172 4 1,048 1,000 600 1,200 4,970
Interest rate future contracts 215 0 0 0 0 0 0 0 215
31 December 2017
Interest rate contracts 1,101 950 7 675 4 1,001 1,523 2,000 7,261
Interest rate future contracts 0 0 0 0 0 0 0 0 0
Please also refer to “— Note 34.3: Financing Liabilities”.
The notional amounts of commodity contracts are as follows:
(In € million)
Remaining period
1 year 2 years 3 years 4 years > 4 years Total
31 December 2018 36 19 14 10 3 81
31 December 2017 53 21 13 8 2 97
The notional amounts of equity swaps are as follows:
(In € million)
Remaining period
Total1 year 2 years 3 years 4 years > 4 years
31 December 2018 49 37 27 9 0 123
31 December 2017 52 49 19 0 0 120

82 Airbus / Financial Statements 2018
Notes to the IFRS Consolidated Financial Statements / 2.7 Capital Structure and Financial Instruments
35.5 Derivative Financial Instruments and Hedge Accounting DisclosureThe following table presents the reconciliation of AOCI, net of tax, resulting from cash fl ow hedge accounting as of 31 December
2018 under IFRS 9:
(In € million) Hedging reserve
Balance at 1 January 2018 (1) (776)
Changes in fair values 3,832
Foreign exchange contracts 3,825
Others 7
Amount reclassified to profit or loss (matured hedges) (800)
Foreign exchange contracts (799)
Others (1)
Amount classified to profit or loss (inefficiency) (4)
Foreign exchange contracts (4)
Others 0
Tax impact (779)
Balance at 31 December 2018 1,473
(1) Restated from IFRS 9, including the time value of options.
The following table presents the reconciliation of AO CI, net of tax, resulting from cash fl ow hedge accounting as of 31 December
2017 under IAS 39:
(In € million) Equity attributable to equity
owners of the parent NCI Total
Balance at 1 January 2017 (7,153) (41) (7,194)
Unrealised gains and losses from valuations, gross 8,143 2 8,145
Transferred to profit or loss for the period, gross 2,447 44 2,491
Changes in fair values of hedging instruments recorded in AOCI, gross 10,590 46 10,636
Changes in fair values of hedging instruments recorded in AOCI, tax (2,843) (11) (2,854)
Share of change in fair values of hedging instruments from investments accounted for under the equity method, net 10 0 10
Changes in fair values of hedging instruments recorded in AOCI, net 7,757 35 7,792
Balance at 31 December 2017 604 (6) 598
The following table presents the amounts relating to items designated as hedging instruments and hedge ineffectiveness
for cash-fl ow hedges as of 31 December 2018 under IFRS 9:
(In € million)
Carrying values OCI Hedge inefficiency
recorded in financial
result
Amounts reclassified from hedge
reserve to profit and loss Asset Liability
Changes in values of the hedging
instrument
Other changes in value of the
hedge reserve (1)
Foreign currency risk
Net forward sales contracts 868 (2,410) 2,749 807 (4) (791)
Foreign exchange options 21 (28) 9 252 0 0
Embedded Derivatives 0 (16) 6 0 0 (9)
Interest rate risk 0 (3) (5) 0 0 0
Commodity swap risk 10 (17) 4 0 0 (1)
Equity swap risk 19 (4) 9 0 0 0
Total 918 (2,478) 2,771 1,059 (4) (801)
(1) Including the time value of the options and the forward element accounted for as a cost of hedging similar to the time value of options as described in “— Note 4: Change in
Accounting Policies and Disclosures”.
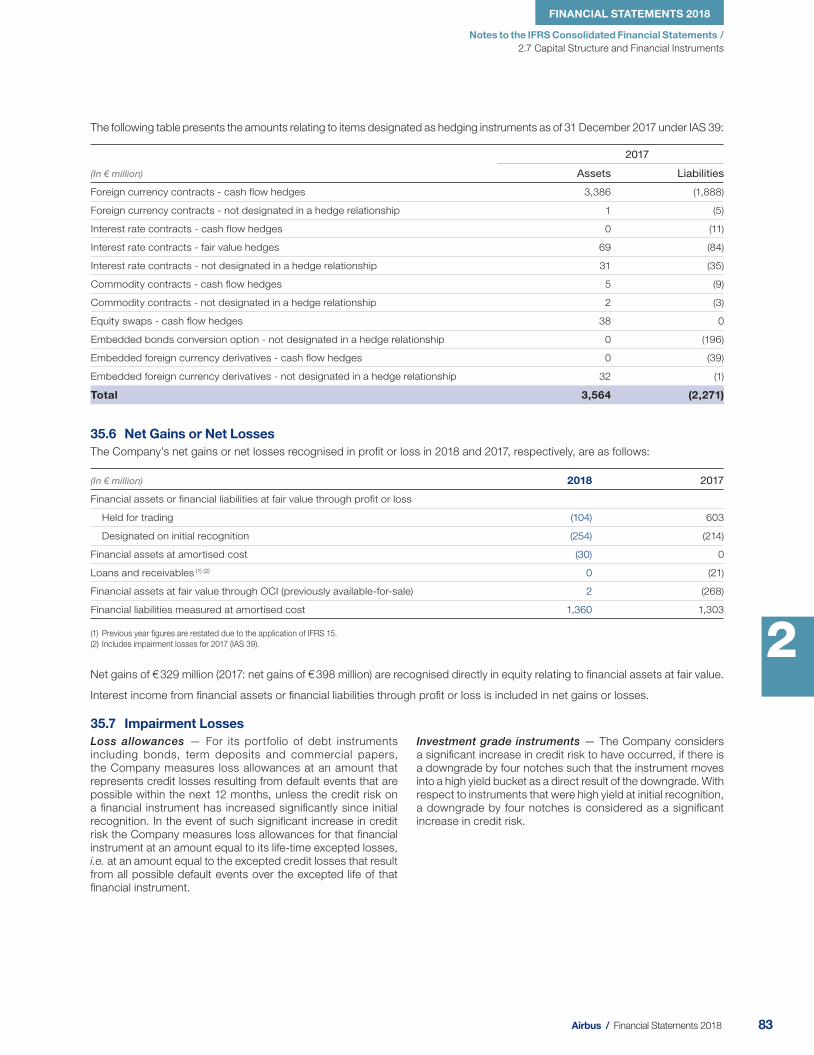
83 Airbus / Financial Statements 2018
Notes to the IFRS Consolidated Financial Statements /
FINANCIAL STATEMENTS 2018
2.7 Capital Structure and Financial Instruments
2
The following table presents the amounts relating to items designated as hedging instruments as of 31 December 2017 under IAS 39:
(In € million)
2017
Assets Liabilities
Foreign currency contracts - cash flow hedges 3,386 (1,888)
Foreign currency contracts - not designated in a hedge relationship 1 (5)
Interest rate contracts - cash flow hedges 0 (11)
Interest rate contracts - fair value hedges 69 (84)
Interest rate contracts - not designated in a hedge relationship 31 (35)
Commodity contracts - cash flow hedges 5 (9)
Commodity contracts - not designated in a hedge relationship 2 (3)
Equity swaps - cash flow hedges 38 0
Embedded bonds conversion option - not designated in a hedge relationship 0 (196)
Embedded foreign currency derivatives - cash flow hedges 0 (39)
Embedded foreign currency derivatives - not designated in a hedge relationship 32 (1)
Total 3,564 (2,271)
35.6 Net Gains or Net LossesThe Company’s net gains or net losses recognised in profi t or loss in 2 018 and 2 017, respectively, are as follows:
(In € million) 2018 2017
Financial assets or financial liabilities at fair value through profit or loss
Held for trading (104) 603
Designated on initial recognition (254) (214)
Financial assets at amortised cost (30) 0
Loans and receivables (1) (2) 0 (21)
Financial assets at fair value through OCI (previously available-for-sale) 2 (268)
Financial liabilities measured at amortised cost 1, 360 1,303
(1) Previous year figures are restated due to the application of IFRS 15.
(2) Includes impairment losses for 2017 (IAS 39).
Net gains of € 329 million (201 7: net gains of € 398 million) are recognised directly in equity relating to fi nancial assets at fair value.
Interest income from fi nancial assets or fi nancial liabilities through profi t or loss is included in net gains or losses.
35.7 Impairment LossesLoss a llowances — For its portfolio of debt instruments
including bonds, term deposits and commercial papers,
t he Company measures loss allowances at an amount that
represents credit losses resulting from default events that are
possible within the next 12 months, unless the credit risk on
a fi nancial instrument has increased signifi cantly since initial
recognition. In the event of such signifi cant increase in credit
risk the Company measures loss allowances for that fi nancial
instrument at an amount equal to its life-time excepted losses,
i.e. at an amount equal to the excepted credit losses that result
from all possible default events over the excepted life of that
fi nancial instrument.
Investment grade instruments — The Company considers
a signifi cant increase in credit risk to have occurred, if there is
a downgrade by four notches such that the instrument moves
into a high yield bucket as a direct result of the downgrade. With
respect to instruments that were high yield at initial recognition,
a downgrade by four notches is considered as a signifi cant
increase in credit risk.

84 Airbus / Financial Statements 2018
Notes to the IFRS Consolidated Financial Statements / 2.7 Capital Structure and Financial Instruments
(In € million) Stage 1
12- month ECL Stage 2
Life-time ECL Stage 3
Credit i mpaired ECL Total
At 1 January 2018 3.36 0 0 3.36
Change in financial assets 0.07 0.75 0 0.82
Change in risk parameters 0.06 0.38 0 0.44
At 31 December 2018 3.49 1.13 0 4.62
The following table breaks down the gross carrying amount of loans and receivables according to IFRS 9, separately showing
those that are impaired, renegotiated or past due:
(In € million)
Not past due
Renego-tiated/
not past due/not
impaired Impaired Past due
≤ 3 months
Past due > 3 and
≤ 6 months
Past due > 6 and
≤ 9 months
Past due > 9 and
≤ 12 months Past due
> 12 months Impairment
charge Total
31 December 2018
Trade receivables 4,647 179 229 317 300 98 84 400 (175) 6,079
Contract assets 856 0 0 0 0 0 0 0 0 856
Others 2,410 2 191 81 43 37 62 503 (204) 3,125
Total (1) 7,913 181 420 398 343 135 146 903 (379) 10,060
(1) Customer financing loans and finance leases are valued at fair value through profit and loss under IFRS 9. Hence, no impairment applies.
The following table breaks down the gross carrying amount of loans and receivables according to IAS 39, separately showing
those that are impaired, renegotiated or past due:
(In € million)
Not past due
Renegotiated/ not past due/ not impaired Impaired
Past due ≤ 3 months
Past due > 3 and
≤ 6 months
Past due > 6 and
≤ 9 months
Past due> 9 and
≤ 12 months Past due
> 12 months Total
31 December 2017
Customer financing 93 0 767 3 3 3 63 3 935
Trade receivables (1) 4,190 226 151 430 163 144 64 369 5,738
Contract assets (1) 497 0 0 0 0 0 0 0 497
Others 2,214 0 254 65 145 31 180 228 3,117
Total (1) 6,994 226 1,172 498 311 178 307 600 10,287
(1) Previous year figures are restated due to the application of IFRS 15.
The management believes that the unimpaired amounts that are past due are still collectible in full, based on historic payment
behaviour and analysis of customer credit risk, including underlying customers’ credit ratings if they are available.
The following impairment losses on fi nancial assets are recognised in profi t or loss in 20 18 and 20 17, respectively:
(In € million) 2018 2017
Other investments and other long-term financial assets
Equity instruments (1 ) 0 (64)
Customer financing 0 (10)
Other loans (32) (4)
Trade receivables (2 ) (40) (43)
Contract assets (2 ) 0 (3)
Total (2 ) (72) (124)
(1 ) Customer financing and equity instruments are now measured at fair value.
(2 ) Previous year figures are restated due to the application of IFRS 15.
85 Airbus / Financial Statements 2018
Notes to the IFRS Consolidated Financial Statements /
FINANCIAL STATEMENTS 2018
2.8 Other Notes
2
2.8 Other Notes
36. Litigation and Claims
Litigation and claims — Various legal actions, governmental
investigations, proceedings and other claims are pending or
may be instituted or asserted in the future against the Company.
Litigation is subject to many uncertainties, and the outcome
of individual matters is not predictable with certainty. The
Company believes that it has made adequate provisions to
cover current or contemplated litigation risks. It is reasonably
possible that the fi nal resolution of some of these matters
may require the Company to make expenditures, in excess of
established reserves, over an extended period of time and in
a range of amounts that cannot be reasonably estimated. The
term “reasonably possible” is used herein to mean that the
chance of a future transaction or event occurring is more than
remote but less than likely.
The Company is involved from time to time in various legal and
arbitration proceedings in the ordinary course of its business,
the most signifi cant of which are described below. Other than
as described below, the Company is not aware of any material
governmental, legal or arbitration proceedings (including any
such proceedings which are pending or threatened), during
a period covering at least the previous twelve months which
may have, or have had in the recent past signifi cant effects on
Airbus SE’s or the Company’s fi nancial position or profi tability.
If the Company concludes that the disclosures relative to
contingent liabilities can be expected to prejudice seriously its
position in a dispute with other parties, the Company limits its
disclosures to the nature of the dispute.
WTOAlthough the Company is not a party, the Company is supporting
the European Commission in litigation before the WTO. Following
its unilateral withdrawal from the 1992 EU-US Agreement
on Trade in Large Civil Aircraft, the US lodged a request on
6 October 2004 to initiate proceedings before the WTO. On
the same day, the EU launched a parallel WTO case against
the US in relation to its subsidies to Boeing. On 19 December
2014, the European Union requested WTO consultations on the
extension until the end of 2040 of subsidies originally granted
by the State of Washington to Boeing and other US aerospace
fi rms until 2024.
On 1 June 2011, the WTO adopted the Appellate Body’s fi nal
report in the case brought by the US assessing funding to
Airbus from European Governments. On 1 December 2011, the
EU informed the WTO that it had taken appropriate steps to
bring its measures fully into conformity with its WTO obligations,
and to comply with the WTO’s recommendations and rulings.
Because the US did not agree, the matter was referred to the
WTO for further review pursuant to WTO rules. A decision
was published in May 2018 in which the WTO clarifi ed that the
EU and the Company have achieved compliance in respect
of the majority of the subsidies at issue but considered that
some remaining obligations required minor adjustments, which
have since been addressed by the EU. Because the US did
not agree on the EU compliance efforts, the US requested
the resumption of Article 22.6 arbitration proceedings to
quantify the amount of countermeasures against the EU. In
September 2018, the US requested an annual amount of
countermeasures of US$ 11.2 billion. The Company considers
the US’ request unjustifi ed given the measures taken to comply
with the Appellate Body decision of May 2018. The Company
has worked with the European Commission and the Member
State governments to fully implement the WTO fi ndings in the
Appellate Body’s decision and asserts that the new measures
taken render the sanctions request moot.
On 23 March 2012, the WTO adopted the Appellate Body’s fi nal
report in the case brought by the EU assessing funding to Boeing
from the US. On 23 September 2012, the US informed the WTO
that it had taken appropriate steps to bring its measures fully
into conformity with its WTO obligations, and to comply with
the WTO’s recommendations and rulings. Because the EU did
not agree, the matter is now under WTO review pursuant to
WTO rules.
Exact timing of further steps in the WTO litigation process is
subject to further rulings and to negotiations between the US
and the EU. Unless a settlement, which is currently not under
discussion, is reached between the parties, the litigation is
expected to continue for several years.
GPTIn August 2012, the UK Serious Fraud Offi ce (“SFO”) announced
that it had opened a formal criminal investigation in relation to
GPT Special Project Management Ltd (“GPT”), a subsidiary
operating in Saudi Arabia that the Company acquired in
2007. The investigation relates to issues initially raised by a
whistleblower concerning contractual arrangements originating
prior to GPT’s acquisition and continuing thereafter. The
Company has engaged with the SFO throughout and continues
to actively cooperate with the investigation.
Eurofi ghter AustriaIn February 2017, the Austrian Federal Ministry of Defence raised
criminal allegations against Airbus Defence and Space GmbH
and Eurofi ghter Jagdfl ugzeug GmbH for wilful deception and
fraud in the context of the sale of the Eurofi ghter aircraft to
Austria and respective damage claims. After the Austrian Federal
Ministry of Defence raised its criminal allegations, the Austrian
public prosecutor opened an investigation against Airbus
Defence and Space GmbH, Eurofi ghter Jagdfl ugzeug GmbH
and former and current employees of the two entities. The
Company has fi led several submissions to the Vienna Public
Prosecutor in response to the allegations of deception in the
procurement of Eurofi ghter combat aircraft made by the Austrian
Defence Minister. The Company is cooperating fully with the
authorities.

86 Airbus / Financial Statements 2018
Notes to the IFRS Consolidated Financial Statements / 2.8 Other Notes
Investigation by the UK SFO and France’s PNF and Related Commercial LitigationIn the context of review and enhancement of its internal
compliance improvement programme, the Company discovered
misstatements and omissions relating to information provided
in respect of third party consultants in certain applications
for export credit financing for the Company’s customers.
In early 2016, the Company informed the UK, German and
French Export Credit Agencies (“ECAs”) of the irregularities it
had discovered. The Company made a similar disclosure to
the UK Serious Fraud Offi ce (“SFO”). In August 2016, the SFO
informed the Company that it had opened an investigation into
allegations of fraud, bribery and corruption in the civil aviation
business of Airbus relating to irregularities concerning third
party consultants (business partners). In March 2017, France’s
Parquet National Financier (“PNF”) informed the Company that
it had also opened a preliminary investigation into the same
subject and that the two authorities would act in coordination
going forward. The Company is cooperating fully with both
authorities including in respect of potential issues across the
Company’s business. As part of the Company’s engagement
with the US authorities, the latter have requested information
relating to conduct forming part of the SFO/PNF investigation
that could fall within US jurisdiction. The Company is cooperating
with the US authorities in close coordination with the SFO and
PNF. The investigations and any penalties potentially levied as a
result could have negative consequences for the Company. The
potential imposition of any monetary penalty (and the amount
thereof) or other sanction including tax liability arising from
the investigations will depend on the ultimate factual and legal
fi ndings of the investigation, and could have a material impact
on the fi nancial statements, business and operations of the
Company. However, at this stage it is too early to determine
the likelihood or extent of any such possible consequence.
Investigations of this nature could also result in (i) civil claims
or claims by shareholders against the Company (ii) adverse
consequences on the Company’s ability to obtain or continue
fi nancing for current or future projects (iii) limitations on the
eligibility of group companies for certain public sector contracts
and/or (iv) damage to the Company’s business or reputation via
negative publicity adversely affecting the Company’s prospects
in the commercial market place.
In light of these investigations, the Company enhanced certain
of its policies, procedures and practices, including ethics and
compliance and export control. The Company has revised
and implemented improved procedures, including those with
respect to its engagement of consultants and other third
parties, in particular in respect of sales support activities. The
Company believes that these enhancements to its controls
and practices will best position it for the future, particularly
in light of advancements in regulatory standards. Several
consultants and other third parties have initiated commercial
litigation and arbitration against the Company seeking relief. The
enhancement of its controls and practices has led to additional
commercial litigation and arbitration against the Company and
may lead to other civil law or criminal law consequences in
the future, which could have a material impact on the fi nancial
statements, however at this stage it is too early to determine
the likelihood or extent of any liability.
ECA FinancingThe Company and the ECAs reached agreement on a process
under which it is able to resume making applications for
ECA- backed fi nancing for its customers across the Company
on a case-by-case basis for a limited number of transactions.
Other InvestigationsThe Company is cooperating fully with the authorities in a
judicial investigation in France related to Kazakhstan. In this
spirit, the Company asked to be interviewed by the investigating
magistrates and has been granted the status of “assisted
witness” in the investigation.
The Company is cooperating with French judicial authorities
pursuant to a request for mutual legal assistance made by the
government of Tunisia in connection with historical aircraft sales.
Following a review of its US regulatory compliance procedures,
the Company discovered and subsequently informed relevant
US authorities of its fi ndings concerning certain inaccuracies
in fi lings made with the US Department of State pursuant to
Part 130 of the US International Traffi c in Arms Regulations
(“ITAR”) (a US export control regulation). The Company is
cooperating with the US authorities. The Company is unable
to reasonably estimate the time it may take to resolve the
matter or the amount or range of potential loss, penalty or other
government action, if any, that may be incurred in connection
with this matter.
Other DisputesIn May 2013, the Company was notified of a commercial
dispute following the decision taken by the Company to
cease a partnership for sales support activities in some local
markets abroad. The Company believes it has solid grounds
to legally object to the alleged breach of a commercial
agreement. However, the consequences of this dispute and
the outcome of the proceedings cannot be fully assessed at
this stage. The arbitration will not be completed until 2020 at
the earliest.
In the course of another commercial dispute, the Company
received a statement of claim by the Republic of China (Taiwan)
alleging liability for refunding part of the purchase price of a
large contract for the supply of missiles by subsidiary Matra
Défense S.A.S., which the customer claims it was not obliged
to pay. An arbitral award was rendered on 12 January 2018
with a principal amount of € 104 million plus interest and costs
against Matra Défense S.A.S. Post-award proceedings are
currently underway.

87 Airbus / Financial Statements 2018
Notes to the IFRS Consolidated Financial Statements /
FINANCIAL STATEMENTS 2018
2.8 Other Notes
2
37. Auditor Fees
With reference to Sect ion 2:382a (1) and (2) of the Netherlands Civil Code, the following fees for the fi nancial year 2018 have been
charged by EY to the Company , its subsidiaries and other consolidated entities:
(In € thousand) 2018 2017
Audit of the financial statements 12,098 9,238
Other audit engagements 244 810
Tax services 766 690
Other non-audit services 1,245 5,416
Total 14,353 16,154
Other audit fi rms have audit fees related to audit process, certifi cation and examination of individual and consolidated accounts
of € 6 million in 201 8 (201 7: € 5 million).
38. Events after the Reporting Date
The Company and its largest A380 operator signed a head of agreement on 11 February 2019 (see “— Note 10: Revenue and
Gross Margin”).
These Consolidated Financial Statements have been authorised for issuance by the Board of Directors on 13 February 2 019.
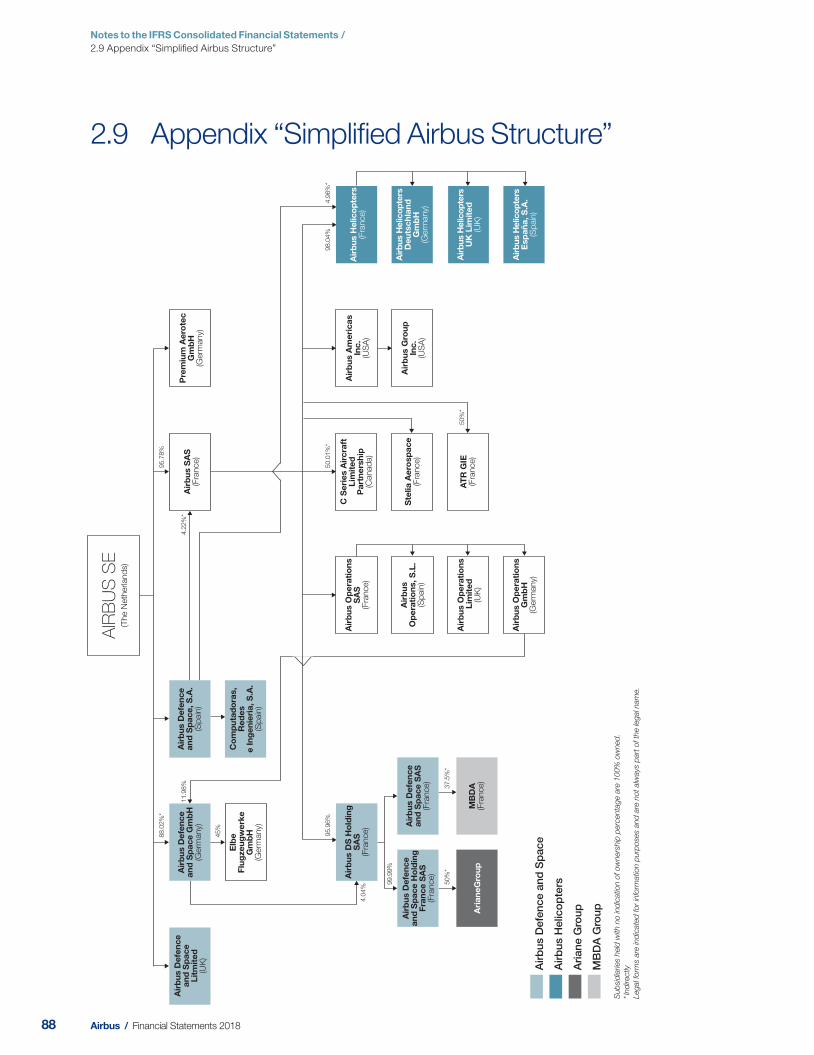
88 Airbus / Financial Statements 2018
Notes to the IFRS Consolidated Financial Statements / 2.9 Appendix “Simplifi ed Airbus Structure”
AIR
BU
S S
E(T
he N
eth
erland
s)
Air
bu
s D
efen
ce
and
Sp
ace
Gm
bH
(Germ
any)
Elb
eF
lug
zeu
gw
erke
Gm
bH
(Germ
any)
Pre
miu
m A
ero
tec
Gm
bH
(Germ
any)
Air
bu
s D
efen
cean
d S
pac
e L
itm
ited
(UK
)
Air
bu
s O
per
atio
ns
SA
S(F
rance)
Air
bu
s O
per
atio
ns
Lim
ited
(U
K)
Air
bu
s O
per
atio
ns
Gm
bH
(G
erm
any)
Air
bu
s O
per
atio
ns,
S.L
.(S
pain
)
Air
bu
s H
elic
op
ters
(Fra
nce)
Air
bu
s D
efen
ce
and
Sp
ace,
S.A
. (S
pain
)
Co
mp
uta
do
ras,
R
edes
e In
gen
ieri
a, S
.A.
(Sp
ain
)
Air
bus
Hel
icop
ters
Esp
aña,
S.A
. (S
pain
)
Air
bus
Hel
icop
ters
UK
Lim
ited
(U
K)
Air
bus
Hel
ico
pte
rsD
euts
chla
nd
G
mb
H
(Germ
any)
95.7
8%
95.9
6%
50.0
1%
*
50%
*
98.0
4%
4.9
6%
*
88.0
2%
*
45%
4.0
4%
4.2
2%
*11.9
8%
Air
bu
s A
mer
icas
Inc.
(US
A)
Air
bu
s G
rou
pIn
c.(U
SA
)
Air
bu
s S
AS
(F
rance)
Ste
lia A
ero
spac
e (F
rance)
C S
erie
s A
ircr
aft
Lim
ited
Par
tner
ship
(Canad
a)
AT
R G
IE(F
rance)
Air
bu
s D
S H
old
ing
S
AS
(Fra
nce)
MB
DA
(Fra
nce)
Air
bu
s D
efen
ce
and
Sp
ace
SA
S
(Fra
nce)
Air
bu
s D
efen
ce
and
Sp
ace
Ho
ldin
gF
ran
ce S
AS
(F
rance)
Ari
aneG
rou
p
50%
*
99.9
9%
37.5
%*
Air
bus
Def
ence
and
Sp
ace
Air
bus
Hel
ico
pte
rs
Ari
ane
Gro
up
MB
DA
Gro
up
Sub
sid
iaries h
eld
with n
o in
dic
ation o
f ow
ners
hip
perc
enta
ge a
re 1
00%
ow
ned
.
* In
directly
Legal f
orm
s a
re in
dic
ate
d for
info
rmation p
urp
oses a
nd
are
not alw
ays p
art
of th
e le
gal n
am
e.
2.9 Appendix “Simplifi ed Airbus Structure ”

89 Airbus / Financial Statements 2018
Notes to the IFRS Consolidated Financial Statements /
FINANCIAL STATEMENTS 2018
2

Chapter
90 Airbus / Financial Statements 2018
3
91 Airbus / Financial Statements 2018
IFRS Company Income Statementfor the years ended 31 December 2018 and 2017 92
IFRS Company Statement of Comprehensive Incomefor the years ended 31 December 2018 and 2017 92
IFRS Company Statement of Financial Positionat 31 December 2018 and 2017 93
IFRS Company Statement of Cash Flowsfor the years ended 31 December 2018 and 2017 94
IFRS Company Statement of Changes in Equityfor the years ended 31 December 2018 and 2017 95
3Airbus SEIFRS Company Financial Statements

92 Airbus / Financial Statements 2018
Airbus SE – IFRS Company Financial Statements /
IFRS Company Income Statementfor the years ended 31 December 2018 and 2017
(In € million) Note 2018 2017
Operating income 393 656
Operating expenses (270) (841)
Income from investments 46 614
Loss on disposal of investments 7 (369) 0
Total operating result 4 (200) 428
Interest income 233 211
Interest expense (195) (159)
Other financial result (33) (1)
Total financial result 5 5 51
Profit (loss) before income taxes (195) 479
Tax income (expense) 6 (32) 3
Profit (loss) for the period (227) 483
IFRS Company Statement of Comprehensive Incomefor the years ended 31 December 2018 and 2017
(In € million) 2018 2017
Profit (loss) for the period (227) 483
Other comprehensive income
Items that will be reclassified to profit or loss:
Net change in fair value of financial assets (1) (430) 101
Net change in fair value of cash flow hedges 1 5
Other comprehensive income, net of tax (429) 106
Total comprehensive income for the period (656) 589
(1) IFRS 9 new classification category (prior-year: change in fair value of available-for-sale financial assets).

93 Airbus / Financial Statements 2018
Airbus SE – IFRS Company Financial Statements /
FINANCIAL STATEMENTS 2018
3
IFRS Company Statement of Financial Positionat 31 December 2018 and 2017
(In € million) Note 2018 2017
Assets
Non-current assets
Investments in subsidiaries and associates 7 16,797 16,576
Long-term financial assets 8 1,468 3,040
Non-current other financial assets 8 1,882 3,898
Non-current other assets 1 5
Deferred tax assets 6 12 22
Non-current securities 12 10,473 10,812
30,633 34,353
Current assets
Trade receivables 165 31
Current other financial assets 8 2,152 1,938
Current accounts Airbus companies 8 8,013 9,581
Current other assets 85 124
Current securities 12 2,073 1,576
Cash and cash equivalents 12 7,886 11,038
20,374 24,288
Total assets 51,007 58,641
Equity and liabilities
Stockholders’ equity 11
Issued and paid up capital 777 775
Share premium 2,941 2,826
Retained earnings 6,636 6,903
Legal reserves 31 459
Treasury shares (51) (2)
Result of the year (227) 483
10,106 11,444
Non-current liabilities
Long-term financing liabilities 12 6,746 8,106
Non-current financial liabilities 8 2,015 4,055
8,761 12,161
Current liabilities
Short-term financing liabilities 12 0 660
Current accounts Airbus companies 8 30,175 32,127
Current financial liabilities 8 1,906 1,730
Current other liabilities 58 519
32,139 35,036
Total equity and liabilities 51,007 58,641

94 Airbus / Financial Statements 2018
Airbus SE – IFRS Company Financial Statements /
IFRS Company Statement of Cash Flowsfor the years ended 31 December 2018 and 2017
(In € million) Note 2018 2017
Profit for the period (Net income) (227) 483
Adjustments to reconcile profit for the period to cash provided by operating activities:
Interest income (233) (211)
Interest expense 195 159
Interest received 260 209
Interest paid (139) (209)
Income tax received 0 0
Depreciation and amortisation 0 0
Valuation adjustments 39 (345)
Tax (income) expense 44 (18)
Change in income tax assets, income tax liabilities and provisions for income tax (12) 12
Dividends received (45) 0
Change in current and non-current provisions 1 (31)
Change in other operating assets and liabilities: (553) 525
Trade receivables (134) 106
Trade liabilities (425) 406
Other assets and liabilities 6 13
Cash provided by (used for) operating activities (670) 575
Investments:
Acquisitions of subsidiaries, joint ventures, businesses and non-controlling interests 7 (270) (260)
Payments for long-term financial assets (532) (327)
Proceeds from disposals of associates, joint ventures, other investments and other long-term financial assets 0 0
Repayments of other long-term financial assets 1,935 164
Dividends received 45 0
Payments for investments in securities (1,874) (3,742)
Proceeds from disposals of securities 1,845 2,400
Cash provided by (used for) investing activities 1,149 (1,765)
Draw-down in financing liabilities 0 1,399
Repayment of financing liabilities (2,180) (88)
Change in current accounts Airbus companies (326) 3,118
Cash distribution to Airbus SE shareholders (1,161) (1,043)
Changes in capital 117 83
Share buyback (49) 1
Cash (used for) provided by financing activities (3,599) 3,470
Effect of foreign exchange rate changes on cash and cash equivalents (32) 0
Net (decrease) increase in cash and cash equivalents (3,152) 2,280
Cash and cash equivalents at beginning of period 11,038 8,758
Cash and cash equivalents at end of period 12 7,886 11,038
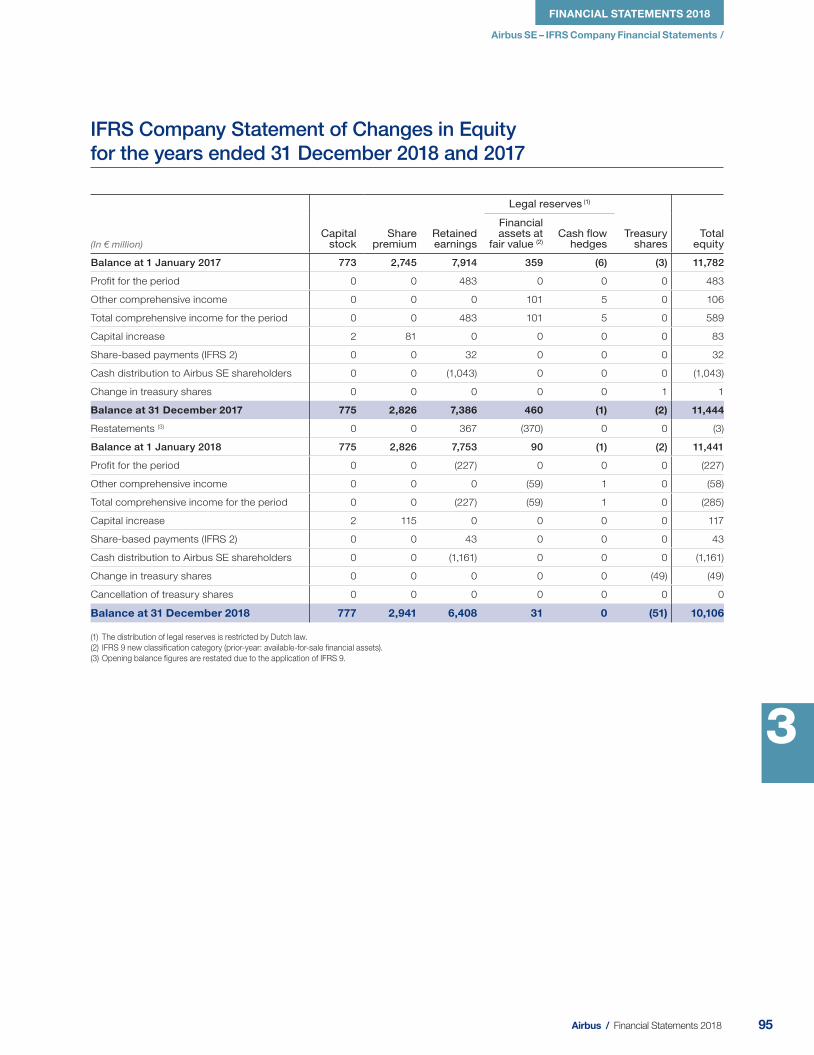
95 Airbus / Financial Statements 2018
Airbus SE – IFRS Company Financial Statements /
FINANCIAL STATEMENTS 2018
3
IFRS Company Statement of Changes in Equityfor the years ended 31 December 2018 and 2017
(In € million)Capital
stockShare
premiumRetained earnings
Legal reserves (1)
Treasury shares
Total equity
Financial assets at
fair value (2)Cash flow
hedges
Balance at 1 January 2017 773 2,745 7,914 359 (6) (3) 11,782
Profit for the period 0 0 483 0 0 0 483
Other comprehensive income 0 0 0 101 5 0 106
Total comprehensive income for the period 0 0 483 101 5 0 589
Capital increase 2 81 0 0 0 0 83
Share-based payments (IFRS 2) 0 0 32 0 0 0 32
Cash distribution to Airbus SE shareholders 0 0 (1,043) 0 0 0 (1,043)
Change in treasury shares 0 0 0 0 0 1 1
Balance at 31 December 2017 775 2,826 7,386 460 (1) (2) 11,444
Restatements (3) 0 0 367 (370) 0 0 (3)
Balance at 1 January 2018 775 2,826 7,753 90 (1) (2) 11,441
Profit for the period 0 0 (227) 0 0 0 (227)
Other comprehensive income 0 0 0 (59) 1 0 (58)
Total comprehensive income for the period 0 0 (227) (59) 1 0 (285)
Capital increase 2 115 0 0 0 0 117
Share-based payments (IFRS 2) 0 0 43 0 0 0 43
Cash distribution to Airbus SE shareholders 0 0 (1,161) 0 0 0 (1,161)
Change in treasury shares 0 0 0 0 0 (49) (49)
Cancellation of treasury shares 0 0 0 0 0 0 0
Balance at 31 December 2018 777 2,941 6,408 31 0 (51) 10,106
(1) The distribution of legal reserves is restricted by Dutch law.
(2) IFRS 9 new classification category (prior-year: available-for-sale financial assets).
(3) Opening balance figures are restated due to the application of IFRS 9.

Chapter
96 Airbus / Financial Statements 2018
4
97 Airbus / Financial Statements 2018
4
4.1 Basis of Presentation 99
4.2 Company Performance 102
4.3 Operational Assets and Liabilities 104
4.4 Employees 107
4.5 Capital Structure and Financial Instruments 107
Notes to the IFRS Company Financial Statements
98 Airbus / Financial Statements 2018
Notes to the IFRS Company Financial Statements /
4.1 Basis of Presentation 991. The Company 99
2. Signifi cant Accounting Policies 99
3. Related Party Transactions 101
4.2 Company Performance 1024. Total Operating Result 102
5. Total Financial Result 102
6. Income Tax 103
4.3 Operational Assets and Liabilities 1047. Investments in Subsidiaries, Associates
and Participations 104
8. Financial Assets and Liabilities 106
9. Commitments and Contingencies 107
4.4 Employees 10710. Number of Employees 107
4.5 Capital Structure and Financial Instruments 107
11. Total Equity 107
12. Cash, Securities and Financing Liabilities 109
13. Information about Financial Instruments 111
14. Audit Fees 117
15. Events after the Reporting Date 117
Contents
99 Airbus / Financial Statements 2018
Notes to the IFRS Company Financial Statements /
FINANCIAL STATEMENTS 2018
4
4.1 Basis of Presentation
1. The Company
The Company’s principal activity is acting as a holding and
management company for the subsidiaries of Airbus SE,
the “Company”, a listed company in the form of a European
Company (Societas Europaea), legally seated in Amsterdam
(current registered offi ce at Mendelweg 30, 2333 CS Leiden,
The Netherlands) and registered at the Chamber of Commerce
in The Hague under number 24288945. The Company has its
listings at the European Stock Exchanges in Paris, Frankfurt
am Main, Madrid, Barcelona, Valencia and Bilbao. The
IFRS Financial Statements were authorised for issue by the
Company’s Board of Directors on 13 February 2019. They are
prepared and reported in euro (“€”) and all values are rounded
to the nearest million appropriately.
2. Signifi cant Accounting Policies
Basis of preparation — The Company’s Financial Statements
are prepared in accordance with International Financial
Reporting Standards (“IFRS”), issued by the International
Accounting Standards Board (“IASB”) as endorsed by the
European Union (“EU”) and with Part 9 of Book 2 of the Dutch
Civil Code.
In the Company Financial Statements of Airbus SE, unless
otherwise disclosed, the same accounting principles have been
applied as set out in the Notes to the Consolidated Financial
Statements, except for the valuation of the investments as
presented under investments in subsidiaries and associates in
the Company Financial Statements. These policies have been
consistently applied to all years presented.
In the Company Financial Statements, the investments in
subsidiaries and associates are recorded at acquisition cost.
In the Company Statement of Income, dividend received from
investments is recorded as dividend income.
Due to this application, the Company equity and net result
are not equal to the consolidated equity and net result. A
reconciliation of the total shareholders’ equity and profi t for the
period is presented in Note 11 “Total Equity” to the Company
Financial Statements.
The Company Financial Statements have been prepared on a
historical cost basis, except the equity instruments, securities
and derivative instruments measured at fair value.
Regarding the application of new, revised or amended IFRS
standards issued and applying from 1 January 2018 and issued
but not yet applied please refer to Note 4 “Change in Accounting
Policies and Disclosure” of the Company’s Consolidated
Financial Statements. The implementation of IFRS 15 has had
no impact on the F inancial S tatements of the Company, and
consequently, the comparative fi gures are not restated. The
implementation of IFRS 9 has resulted in a decrease in the
opening equity 2018 of € -3 million due to expected credit loss
impairment on fi nancial assets.
In addition, no material changes is expected in the Company
Financial Statements of Airbus SE from the implementation of
the new standards not yet applied. Further information about
Share-Based Payments and Employee Stock Ownership
Plans (ESOP) is presented in Note 30 and information about
Remuneration is presented in Note 31 of the Consolidated
Financial Statements.
The information with regard to Capital Management is disclosed
in Note 33, further information about Litigation and Claims refers
to Note 36 and Events after the Reporting Date are disclosed in
Note 38 of the Company’s Consolidated Financial Statements.
Unless reference is made to the accounting policies described
in the Consolidated Financial Statements, the main accounting
policies applied in the preparation of these Company Financial
Statements are described in each accounting area. These
accounting policies have been consistently applied to all
fi nancial years presented, unless otherwise stated.

100 Airbus / Financial Statements 2018
Notes to the IFRS Company Financial Statements /
The following table shows the measurement categories of fi nancial instruments:
(In € million)
Measurement categories
according to IAS 39
Carrying amount according to IAS 39
at 31 December 2017
Measurement categories
according to IFRS 9
Carrying amount according to IFRS 9
at 1 January 2018
Assets
Other investments and other long-term financial assets
Equity investments Available-for-sale 1,193
Fair value through OCI 0
Fair value through profit
and loss1,193
Other loans Loans and receivables 3,234 Amortised cost 3,234
Trade receivables Loans and receivables 31 Amortised cost 31
Other financial assets
Derivative instrumentsFair value through
profit and loss5,640
Fair value through profit
and loss5,640
Current account Airbus companies Loans and receivables 9,581 Amortised cost 9,581
Securities Available-for-sale 12,388 Fair value through OCI 12,388
Cash and cash equivalents
Fair value through profit and loss
6,256Fair value through profit
and loss6,256
Available-for-sale 2,085
Fair value through OCI 900
Fair value through profit
and loss1,185
Loans and receivables 2,697 Amortised cost 2,697
Total 43,105 43,105
Liabilities
Financing liabilities
Bonds and commercial papers Amortised cost 2,751 Amortised cost 2,751
Liabilities to financial institutions and others
Amortised cost 1,715 Amortised cost 1,715
Internal loans payable Amortised cost 4,300 Amortised cost 4,300
Other financial liabilities
Derivative instrumentsFair value through
profit and loss5,784
Fair value through profit
and loss5,784
Current accounts Airbus companies Amortised cost 32,127 Amortised cost 32,127
Total 46,677 46,677
Use of Estimates and JudgementsThe preparation of the Company Financial Statements in
conformity with EU-IFRS requires the use of estimates and
assumptions. In preparing those fi nancial statements, the
management exercises its best judgement based upon its
experience and the circumstances prevailing at that time. The
estimates and assumptions are based on available information
and conditions at the end of the fi nancial period presented and
are reviewed on an ongoing basis. Actual results could differ
from these estimates.
Key accounting estimates and judgements affecting the
assessment and measurement of impairment are included
in Note 7 “Investments in Subsidiaries, Associates and
Participations” of the Company Financial Statements.
The details regarding the use of estimates and judgements are
described in Note 3 “Use of Estimates and Judgements” of the
Consolidated Financial Statements.

101 Airbus / Financial Statements 2018
Notes to the IFRS Company Financial Statements /
FINANCIAL STATEMENTS 2018
4
3. Related Party Transactions
Key Management PersonnelThe details regarding the compensation of key management
personnel are described in Note 8 “Related Party Transactions”
of the Consolidated Financial Statements.
Intercompany TransactionsA comprehensive exchange of internal services between the
subsidiaries of a multinational corporation like Airbus SE is
common practice. In its responsibility as holding company to
manage its subsidiaries and to assist the business activities
conducted by Airbus companies and its subsidiaries, Airbus SE
applies transfer prices for its business activities in conformity with
market levels and in accordance with national and international
tax requirements (arm’s length principle).
The following table discloses the related party intercompany transactions in 2018 and 2017:
(In € million)
Transactions with subsidiaries
2018
Transactions with associates
2018
Transactions with subsidiaries
2017
Transactions with associates
2017
Rendering of services, dividend income and interest income 501 61 772 28
Purchases of services, investment charge and interest expenses (256) (3) (728) (2)
Intercompany receivables due as of 31 December 9,791 95 12,729 87
Intercompany payables due as of 31 December (33,056) (965) (35,422) (1,005)
Hedge relationships receivable as of 31 December 3,793 0 5,640 0
Hedge relationships payable as of 31 December 3,921 0 5,784 0
For further information about granted guarantees to subsidiaries please refer to Note 9 “Commitments and Contingencies” of the
Company Financial Statements.

102 Airbus / Financial Statements 2018
Notes to the IFRS Company Financial Statements /
4.2 Company Performance
4. Total Operating Result
(In € million) 2018 2017
Operating income 393 656
Corporate services rendered to Airbus companies 393 656
Operating expenses (270) (841)
Service fees charged by Airbus companies (119) (698)
Administrative expenses (151) (143)
Income from investments 46 614
Dividends received from Airbus companies 46 13
Impairment reversal 0 601
Expense from investments (369) 0
Loss on disposal of investments (369) 0
Total operating result (200) 428
5. Total Financial Result
(In € million) 2018 2017
Interest result (1) 40 52
Interest income from securities (2) 111 92
Interest income 122 119
Interest expense (195) (159)
Other financial result (33) (1)
Option liability exchangeable bond 33 (19)
Change in fair value measurement of financial assets (3) (44) 0
Equity instruments 7 49
Interest rate hedging 4 (16)
Financing income (expense) (7) (8)
Foreign exchange translations (26) (6)
Total financial result 5 51
(1) In 2018, the total interest income amounts to € 233 million ( 2017: € 211 million) for financial assets which are not measured at fair value through profit or loss. For financial liabilities
which are not measured at fair value through profit or loss € -195 million ( 2017: € -159 million) are recognised as total interest expenses.
(2) IFRS 9 new classification category (prior-year: interest income from available-for-sale financial securities).
(3) New IFR9 classification (prior-year: financial asset at fair-value).
The Company is acting as a fi nancial market agent on behalf of its subsidiaries, therefore the fair value changes of derivatives
are reported on a net basis.

103 Airbus / Financial Statements 2018
Notes to the IFRS Company Financial Statements /
FINANCIAL STATEMENTS 2018
4
6. Income Tax
The Company is tax registered in the Netherlands. The Company
is heading a fi scal unity, which also includes Airbus Finance B.V.,
Airbus DS Holdings B.V. and Airbus Defence and Space
Netherlands B.V. and therefore the Company is severally and
jointly liable for income tax liabilities of the fi scal unity as a
whole.
Income taxes — The tax expense for the year comprises
deferred tax. Tax is recognised in the Income Statement, except
to the extent that it relates to items recognised directly in Other
Comprehensive Income.
The amount of income tax included in the Income Statement is
determined in accordance with the rules established by the tax
authorities in the Netherlands, based on which income taxes
are payable or recoverable.
Deferred tax assets and/or liabilities, arising from temporary
differences between the carrying amounts of assets and
liabilities and the tax base of assets and liabilities, are calculated
using the substantively enacted tax rates expected to apply
when they are realised or settled. Deferred tax assets are
recognised if it is probable that they will be realised.
The expense for income taxes is comprised of the following:
(In € million) 2018 2017
Current tax expense 0 0
Deferred tax income (expense) (32) 3
Total (32) 3
The following table shows reconciliation from the theoretical income tax expense using the Dutch corporate tax rate to the reported
tax (expense) income:
(In € million) 2018 2017
Profit before income taxes (195) 479
Corporate income tax rate 25% 25%
Expected expense for income taxes 42 (120)
Non-taxable income from investments (80) 153
Option liability exchangeable bond 7 (5)
Income from other companies within the fiscal unity (1) (3)
Impairment 12 (12)
Other (13) (10)
Reported tax income (expense) (32) 3
The fi rst tranche of tax loss carry forwards (€ 22 million) will expire by the end of 2026.
Deferred income taxes as of 31 December 2018 are related to the following assets and liabilities:
(In € million)
1 January 2018Other
movements
Movement through income
statement 31 December 2018
Deferred tax
assets
Deferred tax
liabilities OCI Others
Deferred tax benefit (expense)
Deferred tax
assets
Deferred tax
liabilities
Securities 0 (31) 22 0 0 0 (9)
Financial instruments 0 (9) 0 0 8 0 (1)
Net operating loss and tax loss carry forwards 62 0 0 0 (41) 21 0
Deferred tax assets (liabilities) before offsetting 62 (40) 22 0 (32) 21 (9)
Set-off (40) 40 0 0 0 (9) 9
Net deferred tax assets (liabilities) 22 0 22 0 0 12 0

104 Airbus / Financial Statements 2018
Notes to the IFRS Company Financial Statements /
Deferred income taxes as of 31 December 2017 are related to the following assets and liabilities:
(In € million)
1 January 2017Other
movements
Movement through income
statement 31 December 2017
Deferred tax
assets
Deferred tax
liabilities OCI Others
Deferred tax benefit (expense)
Deferred tax
assets
Deferred tax
liabilities
Securities 0 (43) 12 0 0 0 (31)
Financial instruments 0 (1) (2) 0 (6) 0 (9)
Net operating loss and tax loss carry forwards 53 0 0 0 10 62 0
Deferred tax assets (liabilities) before offsetting 53 (44) 10 0 3 62 (40)
Set-off (44) 44 0 0 0 (40) 40
Net deferred tax assets (liabilities) 9 0 10 0 3 22 0
Details of deferred taxes recognised cumulatively in equity are as follows:
(In € million) 2018 2017
Financial instrument at fair value through OCI (1) (9) (31)
Cash flow hedges 0 0
Total (9) (31)
(1) IFRS 9 new classification category (prior-year: available -for-sale investments).
4.3 Operational Assets and Liabilities
7. Investments in Subsidiaries, Associates and Participations
(In € million) Subsidiaries Associates Participations Total
Balance at 1 January 2017 14,435 21 1,089 15,545
Additions 261 0 0 261
Release Impairment 601 0 0 601
Share-based payments (IFRS 2) 32 0 0 32
Fair value changes through OCI 0 0 137 137
Other adjustments 33 0 (33) 0
Balance at 31 December 2017 15,362 21 1,193 16,576
Fair value changes through OCI 0 0 (368) (368)
Fair value changes through Profit or Loss 0 0 368 368
Balance at 1 January 2018 15,362 21 1,193 16,576
Additions 200 0 22 222
Release Impairment 0 0 0 0
Share-based payments (IFRS 2) 43 0 0 43
Fair value changes through Profit or Loss 0 0 (44) (44)
Balance at 31 December 2018 15,605 21 1,171 16,797
105 Airbus / Financial Statements 2018
Notes to the IFRS Company Financial Statements /
FINANCIAL STATEMENTS 2018
4
Investments in Subsidiaries, Associated Companies and ParticipationsInvestments in subsidiaries and associated companies are stated
at cost, less impairment. Dividend income from the Company’s
subsidiaries and associated companies is recognised when the
right to receive payment is established.
In 2018, the participations are stated at fair value with changes
in fair value recognised in Profi t and Loss.
For the purpose of impairment testing all consolidated
subsidiaries are allocated to Cash Generating Units (“CGU”) in
a way they are monitored for internal management purposes.
At each balance sheet date, the Company reviews whether
there is an indication that a CGU to which its investments in
subsidiaries and associated companies belong to are impaired.
An indication for impairment of the investments in subsidiaries
and associated companies may include, respectively,
management’s downward adjustment of the strategic plan or
a signifi cant decrease in the share price of a publicly listed
company. Further indications for impairment of its investments
may include other areas where observable data indicates that
there is a measurable decrease in the estimated future cash
fl ows. These determinations require signifi cant judgement. In
making this judgement, management evaluates, among other
factors, the fi nancial performance of and business outlook for
its investments, including factors such as industry and sector
performance, changes in technology and operational and
fi nancing cash fl ow.
If any indication for impairment exists, the recoverable amount
of the investments is estimated in order to determine the extent,
if any, of the impairment loss. An investment is impaired if the
recoverable amount is lower than the carrying value. The
recoverable amount is defi ned as the higher of an investment’s
fair value less costs to sell and its value in use.
The determination of the investment’s value in use is based
on calculations using pre-tax cash fl ow projections based on
fi nancial budgets approved by management covering a fi ve-year
period. Cash fl ows beyond the fi ve-year period are extrapolated
using estimated growth rates. The discounted cash fl ow method
is used to determine the recoverable amount of a CGU to which
its investments in subsidiaries and associated companies
belongs to. The discounted cash fl ow method is particularly
sensitive to the selected discount rates and estimates of future
cash fl ows by management. Key assumptions used to determine
the recoverable value of the CGU are the expected future labour
expenses, future interest rates, future exchange rates to convert
in euro the portion of future US dollar and pound sterling which
are not hedged and the estimated growth rate of terminal values.
If the recoverable amount of an investment is estimated to be less
than its carrying amount, the carrying amount of the investment
is reduced to its recoverable amount. Any impairment loss is
recognised immediately in the Income Statement.
Impairment losses recognised in prior periods shall be reversed
only if there has been a change in the estimates or external market
information used to determine the investment’s recoverable
amount since the last impairment loss was recognised.
The recoverable amount shall not exceed the carrying amount
that would have been determined had no impairment loss been
recognised in prior years.
The annual impairment test performed in 2018 led to no
impairment charge.
Change of Investments in SubsidiariesOn 6 February 2018, Airbus SE internally acquired 49.10% of
the shares in Aero Ré SA for a total amount of € 9 million. On
17 December 2018, Airbus SE made a capital contribution of
€ 25 million into Aero Ré SA.
On 26 July 2018, Airbus SE made a further capital contribution
of € 200 million into Airbus Bank GmbH.
On 26 September 2018, Airbus DS Holdings B.V. has been
merged into Airbus SE with retroactive refl ect on 1 January 2018.
The impact of this merge in the F inancial S tatements of Airbus SE
is a loss of € 369 million mainly due to the irrecoverability of IC
loan and current accounts. Airbus SE is the new stakeholder of
Airbus Defence and Space Netherland B.V. and Airbus Defence
and Space Limited, and increase is stake in Airbus SAS and
Airbus Defence and Space GmbH: impact of the merge in the
Investments € -69 million.
On 4 December 2018, Airbus SE contributed its 100% subsidiary
Airbus Helicopters Holding SAS to its subsidiary Airbus SAS for
a total amount of € 991 million. In return for this contribution,
Airbus SE received additional shares in Airbus SAS for an
equivalent amount.
During the year 2018, Airbus SE made further capital
contributions into Airbus Group Ventures Fund for a total amount
of € 35 million (2017: € 20 million).
On 27 January 2017, Airbus SE made a further capital
contribution of € 100 million into Airbus Group Bank GmbH.
On 16 November 2017, Airbus SE contributed its 100% subsidiary
Airbus Group Inc to its subsidiary Airbus SAS for a total amount
of € 605 million. In return for this contribution, Airbus SE received
additional shares in Airbus SAS for an equivalent amount. The
valuation of Airbus Group Inc made for the contribution show a
value of the company above the book value, allowing Airbus SE
to release the impairment made in 2014 for € 601 million.
On 19 December 2017, Airbus SE internally acquired 2.43%
of the shares in Airbus DS Holdings B.V. for a total amount of
€ 140.3 million.
During the year 2017, Airbus SE made further capital
contributions into Airbus Group Ventures Fund for a total amount
of € 20 million (2016: € 14 million).

106 Airbus / Financial Statements 2018
Notes to the IFRS Company Financial Statements /
INFORMATION ON PRINCIPAL INVESTMENTS OF THE COMPANY
2018 2017
Company Head office(in % ) (1)
100.00 50.90 Aero Ré S.A. Bertrange (Luxembourg)
74.29 50.10 Airbus Defence and Space GmbH Taufkirchen (Germany)
100.00 0.00 Airbus Defence and Space Limited Stevenage (UK)
100.00 0.00 Airbus Defence and Space Netherlands B.V. Leiden (Netherlands)
100.00 100.00 Airbus Defence and Space S.A. Madrid (Spain)
0.00 100.00 Airbus DS Holdings B.V. Leiden (Netherlands)
100.00 100.00 Airbus Bank GmbH Munich (Germany)
100.00 100.00 Airbus Finance B.V. Leiden (Netherlands)
100.00 100.00 Airbus Group Ltd. London (UK)
100.00 100.00 Airbus Group Proj B.V. Leiden (Netherlands)
99.00 99.00 Airbus Group Ventures Fund I, L.P. Mountain View, CA (USA)
0.00 100.00 Airbus Helicopters Holding S.A.S. Marignane (France)
95.78 90.26 Airbus S.A.S. Toulouse (France)
100.00 100.00 DADC Luft- und Raumfahrt Beteiligungs GmbH Taufkirchen (Germany)
9.89 9.93 Dassault Aviation S.A. Paris (France)
100.00 100.00 Premium Aerotec GmbH Augsburg (Germany)
(1) Percentages represent share held directly by Airbus SE.
8. Financial Assets and Liabilities
Financial assets and liabilities at 31 December 2018 and 2017 consist of the following:
(In € million) 2018 2017
Long-term financial assets 1,468 3,040
Long-term loans Airbus companies (1) 1,468 3,040
Long-term loans external 0 0
Non-current other financial assets 1,882 3,898
Positive fair values of derivative financial instruments 1,882 3,898
Current other financial assets 2,152 1,938
Positive fair values of derivative financial instruments 1,912 1,744
Current portion long-term loans Airbus companies 240 194
Current accounts Airbus companies (1) (22,162) (22,546)
Receivables from subsidiaries 8,013 9,581
Liabilities to subsidiaries (30,175) (32,127)
Non-current financial liabilities (2,015) (4,055)
Negative fair values of derivative financial instruments (2,015) (4,055)
Current financial liabilities (1,906) (1,730)
Negative fair values of derivative financial instruments (1,906) (1,730)
(1) The receivables from and liabilities to subsidiaries include mainly transactions in connection with the cash pooling in Airbus SE. Terms and conditions are in agreement with the
prevailing market environment.
107 Airbus / Financial Statements 2018
Notes to the IFRS Company Financial Statements /
FINANCIAL STATEMENTS 2018
4
9. Commitments and Contingencies
Off-Balance Sheet CommitmentsAirbus SE issued guarantees on behalf of Airbus companies
in the amount of € 5,898 million (2017: € 7,227 million). The
commitments of these companies to third parties mainly relate
to their operating business as described in Note 18 “Property,
Plant and Equipment”, Note 25 “Sales Financing Transactions”
and Note 35 “Information about Financial Instruments” of the
Consolidated Financial Statements. The expected credit loss
is considered to be non signifi cant.
On 8 December 2015, Airbus SE entered into a partnership
agreement to establish a corporate venture capital fund, dubbed
Airbus Group Ventures, as well as a technology and business
innovation center in Silicon Valley with a total commitment
amount of US$ 150 million. On 25 November 2015, a fi rst
investment of US$ 5 million has been made into this fund. During
the year 2018, Airbus SE made further capital contributions into
Airbus Group Ventures Fund for a total amount of US$ 42 million.
4.4 Employees
10. Number of Employees
The average number of the persons employed by the Company in 2018 was 2 (2017: 2). The employees are situated in the
Netherlands.
4.5 Capital Structure and Financial Instruments
11. Total Equity
Airbus SE’ s shares are ordinary shares with a par value of € 1.00. The following table shows the development of the number of
shares outstanding:
(In number of shares) 2018 2017
Issued as at 1 January 774,556,062 772,912,869
Issued for ESOP 1,811,819 1,643,193
Issued as at 31 December 776,367,881 774,556,062
Treasury shares as at 31 December (636,924) (129,525)
Outstanding as at 31 December 775,730,957 774,426,537
Authorised shares 3,000,000,000 3,000,000,000
Holders of ordinary shares are entitled to dividends and are entitled to one vote per share at general meetings of the Company.

108 Airbus / Financial Statements 2018
Notes to the IFRS Company Financial Statements /
Capital stock comprises the nominal amount of shares
outstanding. The addition to capital stock represents the
contribution for exercised options in compliance with the
implemented stock option plans and by employees of € 1, 811, 819
( 2017: € 1, 643, 193) under the Employee Stock Ownership Plans
(“ESOP”).
Share premium mainly results from contributions in kind in the
course of the creation of Airbus , cash contributions from the
Initial Public Offering, capital increases and reductions due to
the issuance and cancellation of shares.
Retained earnings include mainly the profi t of the period and
cash dividend payments to Airbus SE shareholders.
On 11 April 2018, the Shareholders’ General Meeting decided
to distribute a gross amount of € 1.50 per share, which was
paid on 18 April 2018. For the fi scal year 2018, the Company’s
Board of Directors proposed a cash distribution payment of
€ 1.65 per share.
Legal reserves includes:
-change from fi nancial assets at fair value (see Note 13.2
“Carrying Amounts and Fair Values of Financial Instruments”);
-change in fair value of derivatives designated as cash fl ow hedges (see Note 13.2 “Carrying Amounts and Fair Values
of Financial Instruments”).
According to Dutch law, the OCI is considered to be a Legal
Reserve and therefore distribution is restricted.
Treasury shares represent the amount paid or payable for own
shares held in treasury. During 2018, the number of treasury
stock held by the Company increase to 636,924 compared to
129,525 as of 31 December 2017. No shares were sold back to
the market nor cancelled in 2018 ( 2017: 0 shares).
Authorisations Granted by the Shareholders’ General Meeting of Airbus SE Held on 11 April 2018On 11 April 2018, the Annual General Meeting (“AGM”) of
the Company authorised the Board of Directors, for a period
expiring at the AGM to be held in 2019, to issue shares and to
grant rights to subscribe for shares in the Company’s share
capital for the purpose of:
-ESOPs and share-related LTIPs, provided that such powers
shall be limited to an aggregate of 0.3% of the Company’s
authorised share capital (see “— Note 30: Share-Based
Payment”);
-funding the Company and its subsidiaries, provided that
such powers shall be limited to an aggregate of 0.3% of
the Company’s authorised share capital (see “— Note 34.3:
Financing Liabilities”).
For each operation, such powers shall not extend to issuing
shares or granting rights to subscribe for shares if there is no
preferential subscription right and for an aggregate issue price
in excess of € 500 million per share issuance.
Also on 11 April 2018, the AGM authorised the Board of
Directors for an 18 months period to repurchase up to 10% of
the Company’s issued share capital at a price per share not
less than the nominal value and not more than the higher of
the price of the last independent trade and the highest current
independent bid on the trading venues of the regulated market
of the country in which the purchase is carried out.
Furthermore, the AGM authorised both the Board of Directors
and the CEO, with powers of substitution, to establish the exact
number of the relevant shares to be cancelled.
Reconciliation Consolidated to Company Equity and Net IncomeThe difference between the total shareholders’ equity according to the Consolidated Financial Statements and Company’s Financial
Statements as at 31 December 2018 and 2017 is as follows:
(In € million) 2018 2017 (1)
Consolidated equity 9,724 13,348
OCI - Restatement of investments from Consolidated to Company Financial Statements (103) (2,283)
Retained Earnings - Restatement of investments from Consolidated to Company Financial Statements (486) (436)
Retained Earnings - Valuation investments at historical cost 2,071 1,487
Retained Earnings - Impairment of financial assets (1,099) (672)
Company’s equity 10,106 11,444
(1) 2017 not restated of IFRS 15 impacts.
The difference between the net income according to the Consolidated Financial Statements and Company’s Financial Statements
for the year ended 31 December 2018 and 2017 is as follows:
(In € million) 2018 2017
Consolidated net income 3,054 2,873
Income from investments according to Consolidated Financial Statements (3,007) (3,014)
Income from investments according to Company Financial Statements 46 614
Loss on / Impairment of financial assets (369) 0
Other valuation differences 49 10
Company’s net income (Profit or loss for the period) (227) 483

109 Airbus / Financial Statements 2018
Notes to the IFRS Company Financial Statements /
FINANCIAL STATEMENTS 2018
4
Included in the securities portfolio as of 31 December 2018
and 2017, respectively, are corporate and government bonds
bearing either fi xed rate coupons (€ 12,067 million nominal value;
comparably in 2017: € 12,062 million) or fl oating rate coupons
(€ 479 million nominal value; comparably in 2017: € 321 million)
and foreign currency funds of hedge funds (€ 0 million nominal
value; 2017: € 5 million).
12. Cash, Securities and Financing Liabilities
12.1 Cash and Cash EquivalentsCash and cash equivalents are composed of the following elements:
(In € million)
31 December
2018 2017
Bank accounts 326 2,697
Short-term securities (at fair value through profit or loss) 6,576 6,256
Short-term securities (at fair value through OCI) (1) 984 2,085
Total cash and cash equivalents 7,886 11,038
(1) IFRS 9 new classification (prior-year: Short-term securities – available-for-sale).
Only securities with a maturity of three months or less from the date of the acquisition, that are readily convertible to known
amounts of cash and which are subject to an insignifi cant risk of changes in value are recognised in cash equivalents.
12.2 Securities
(In € million)
31 December
2018 2017
Current securities at fair value through OCI 2,073 1,576
Non-current securities at fair value through OCI 10,135 10,812
Non-current securities at fair value through profit or loss 338 0
Total securities 12,546 12,388
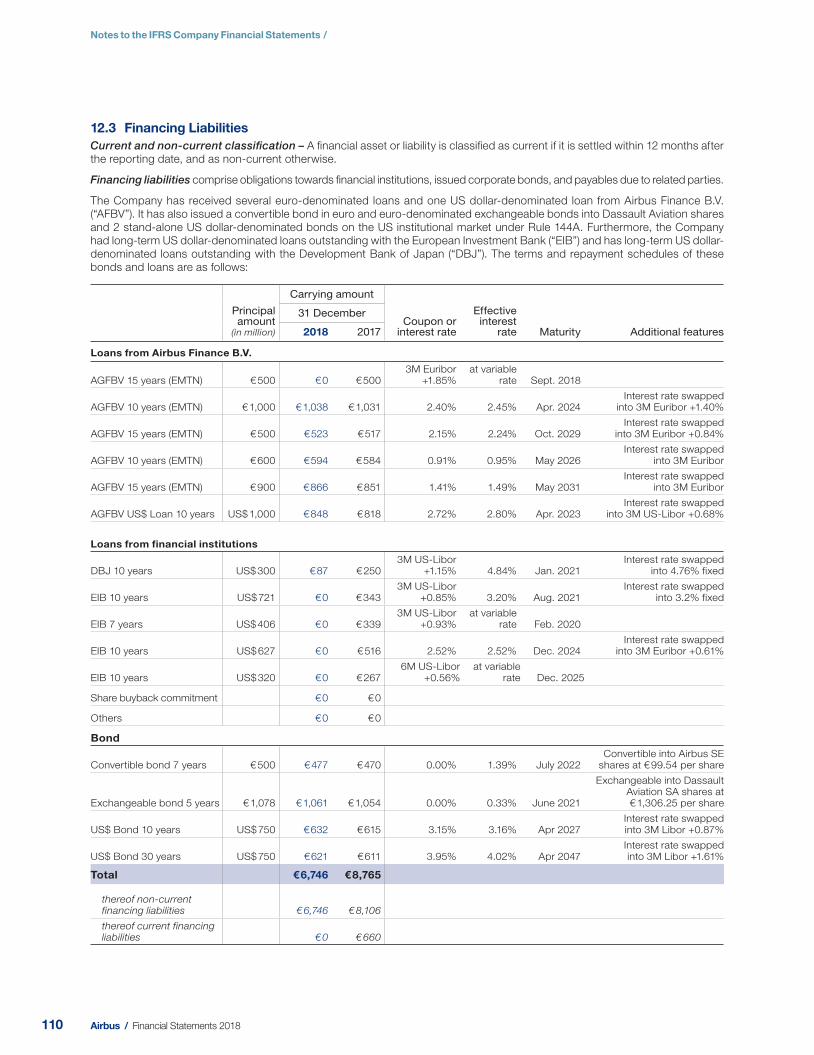
110 Airbus / Financial Statements 2018
Notes to the IFRS Company Financial Statements /
12.3 Financing LiabilitiesCurrent and non-current classifi cation – A fi nancial asset or liability is classifi ed as current if it is settled within 12 months after
the reporting date, and as non-current otherwise.
Financing liabilities comprise obligations towards fi nancial institutions, issued corporate bonds, and payables due to related parties.
The Company has received several euro-denominated loans and one US dollar-denominated loan from Airbus Finance B.V.
(“AFBV”). It has also issued a convertible bond in euro and euro-denominated exchangeable bonds into Dassault Aviation shares
and 2 stand-alone US dollar-denominated bonds on the US institutional market under Rule 144A. Furthermore, the Company
had long-term US dollar-denominated loans outstanding with the European Investment Bank (“EIB”) and has long-term US dollar-
denominated loans outstanding with the Development Bank of Japan (“DBJ”). The terms and repayment schedules of these
bonds and loans are as follows:
Principal amount
(in million)
Carrying amount
Coupon or interest rate
Effective interest
rate Maturity Additional features
31 December
2018 2017
Loans from Airbus Finance B.V.
AGFBV 15 years (EMTN) € 500 € 0 € 5003M Euribor
+1.85%at variable
rate Sept. 2018
AGFBV 10 years (EMTN) € 1,000 € 1,038 € 1,031 2.40% 2.45% Apr. 2024Interest rate swapped
into 3M Euribor +1.40%
AGFBV 15 years (EMTN) € 500 € 523 € 517 2.15% 2.24% Oct. 2029Interest rate swapped
into 3M Euribor +0.84%
AGFBV 10 years (EMTN) € 600 € 594 € 584 0.91% 0.95% May 2026Interest rate swapped
into 3M Euribor
AGFBV 15 years (EMTN) € 900 € 866 € 851 1.41% 1.49% May 2031Interest rate swapped
into 3M Euribor
AGFBV US$ Loan 10 years US$ 1,000 € 848 € 818 2.72% 2.80% Apr. 2023Interest rate swapped
into 3M US-Libor +0.68%
Loans from financial institutions
DBJ 10 years US$ 300 € 87 € 2503M US-Libor
+1.15% 4.84% Jan. 2021Interest rate swapped
into 4.76% fixed
EIB 10 years US$ 721 € 0 € 3433M US-Libor
+0.85% 3.20% Aug. 2021Interest rate swapped
into 3.2% fixed
EIB 7 years US$ 406 € 0 € 3393M US-Libor
+0.93%at variable
rate Feb. 2020
EIB 10 years US$ 627 € 0 € 516 2.52% 2.52% Dec. 2024Interest rate swapped
into 3M Euribor +0.61%
EIB 10 years US$ 320 € 0 € 2676M US-Libor
+0.56%at variable
rate Dec. 2025
Share buyback commitment € 0 € 0
Others € 0 € 0
Bond
Convertible bond 7 years € 500 € 477 € 470 0.00% 1.39% July 2022Convertible into Airbus SE
shares at € 99.54 per share
Exchangeable bond 5 years € 1,078 € 1,061 € 1,054 0.00% 0.33% June 2021
Exchangeable into Dassault Aviation SA shares at € 1,306.25 per share
US$ Bond 10 years US$ 750 € 632 € 615 3.15% 3.16% Apr 2027Interest rate swapped into 3M Libor +0.87%
US$ Bond 30 years US$ 750 € 621 € 611 3.95% 4.02% Apr 2047Interest rate swapped into 3M Libor +1.61%
Total € 6,746 € 8,765
thereof non-current financing liabilities € 6,746 € 8,106
thereof current financing liabilities € 0 € 660
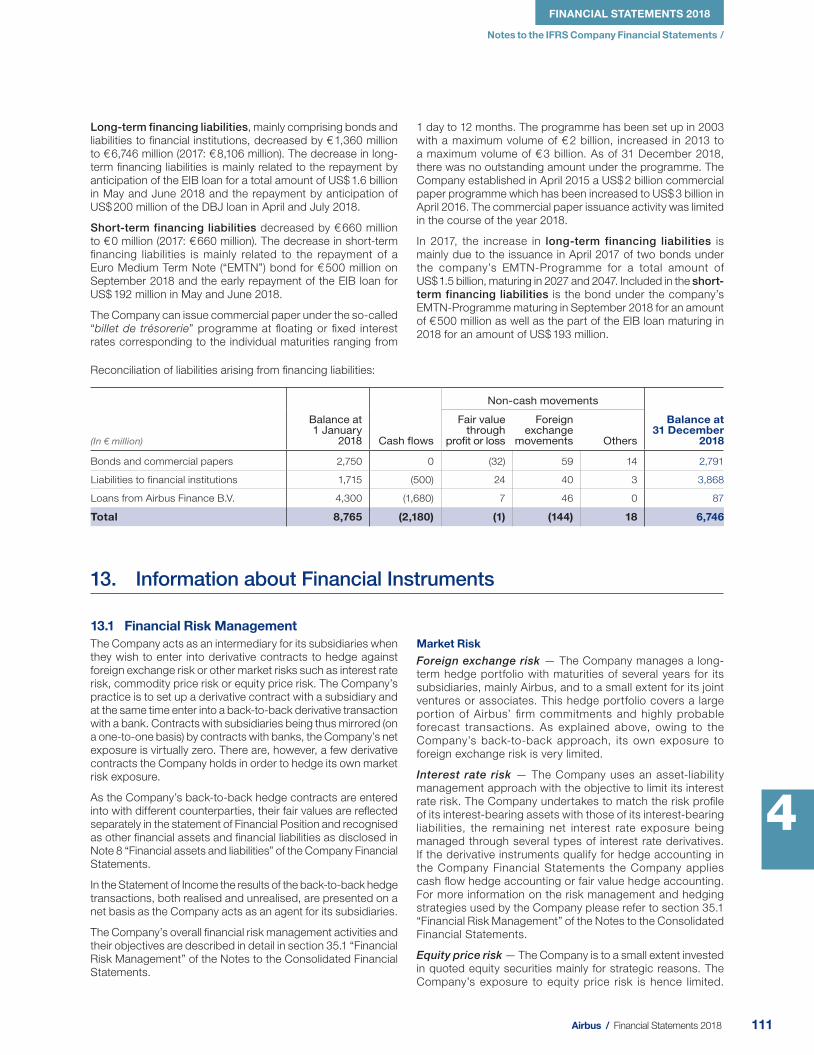
111 Airbus / Financial Statements 2018
Notes to the IFRS Company Financial Statements /
FINANCIAL STATEMENTS 2018
4
Long-term financing liabilities, mainly comprising bonds and
liabilities to fi nancial institutions, decreased by € 1,360 million
to € 6,746 million (2017: € 8,106 million). The decrease in long-
term fi nancing liabilities is mainly related to the repayment by
anticipation of the EIB loan for a total amount of US$ 1.6 billion
in May and June 2018 and the repayment by anticipation of
US$ 200 million of the DBJ loan in April and July 2018.
Short-term financing liabilities decreased by € 660 million
to € 0 million (2017: € 660 million). The decrease in short-term
fi nancing liabilities is mainly related to the repayment of a
Euro Medium Term Note (“EMTN”) bond for € 500 million on
September 2018 and the early repayment of the EIB loan for
US$ 192 million in May and June 2018.
The Company can issue commercial paper under the so-called
“billet de trésorerie” programme at fl oating or fi xed interest
rates corresponding to the individual maturities ranging from
1 day to 12 months. The programme has been set up in 2003
with a maximum volume of € 2 billion, increased in 2013 to
a maximum volume of € 3 billion. As of 31 December 2018,
there was no outstanding amount under the programme. The
Company established in April 2015 a US$ 2 billion commercial
paper programme which has been increased to US$ 3 billion in
April 2016. The commercial paper issuance activity was limited
in the course of the year 2018.
In 2017, the increase in long-term financing liabilities is
mainly due to the issuance in April 2017 of two bonds under
the company’s EMTN-Programme for a total amount of
US$ 1.5 billion, maturing in 2027 and 2047. Included in the short-term financing liabilities is the bond under the company’s
EMTN-Programme maturing in September 2018 for an amount
of € 500 million as well as the part of the EIB loan maturing in
2018 for an amount of US$ 193 million.
Reconciliation of liabilities arising from fi nancing liabilities:
(In € million)
Balance at 1 January
2018 Cash flows
Non-cash movements
Balance at 31 December
2018
Fair value through
profit or loss
Foreign exchange
movements Others
Bonds and commercial papers 2,750 0 (32) 59 14 2,791
Liabilities to financial institutions 1,715 (500) 24 40 3 3,868
Loans from Airbus Finance B.V. 4,300 (1,680) 7 46 0 87
Total 8,765 (2,180) (1) (144) 18 6,746
13.1 Financial Risk ManagementThe Company acts as an intermediary for its subsidiaries when
they wish to enter into derivative contracts to hedge against
foreign exchange risk or other market risks such as interest rate
risk, commodity price risk or equity price risk. The Company’s
practice is to set up a derivative contract with a subsidiary and
at the same time enter into a back-to-back derivative transaction
with a bank. Contracts with subsidiaries being thus mirrored (on
a one-to-one basis) by contracts with banks, the Company’s net
exposure is virtually zero. There are, however, a few derivative
contracts the Company holds in order to hedge its own market
risk exposure.
As the Company’s back-to-back hedge contracts are entered
into with different counterparties, their fair values are refl ected
separately in the statement of Financial Position and recognised
as other fi nancial assets and fi nancial liabilities as disclosed in
Note 8 “Financial assets and liabilities” of the Company Financial
Statements.
In the Statement of Income the results of the back-to-back hedge
transactions, both realised and unrealised, are presented on a
net basis as the Company acts as an agent for its subsidiaries.
The Company’s overall fi nancial risk management activities and
their objectives are described in detail in section 35.1 “Financial
Risk Management” of the Notes to the Consolidated Financial
Statements.
Market Risk
Foreign exchange risk — The Company manages a long-
term hedge portfolio with maturities of several years for its
subsidiaries, mainly Airbus, and to a small extent for its joint
ventures or associates. This hedge portfolio covers a large
portion of Airbus’ fi rm commitments and highly probable
forecast transactions. As explained above, owing to the
Company’s back-to-back approach, its own exposure to
foreign exchange risk is very limited.
Interest rate risk — The Company uses an asset-liability
management approach with the objective to limit its interest
rate risk. The Company undertakes to match the risk profi le
of its interest-bearing assets with those of its interest-bearing
liabilities, the remaining net interest rate exposure being
managed through several types of interest rate derivatives.
If the derivative instruments qualify for hedge accounting in
the Company Financial Statements the Company applies
cash fl ow hedge accounting or fair value hedge accounting.
For more information on the risk management and hedging
strategies used by the Company please refer to section 35.1
“Financial Risk Management” of the Notes to the Consolidated
Financial Statements.
Equity price risk — The Company is to a small extent invested
in quoted equity securities mainly for strategic reasons. The
Company’s exposure to equity price risk is hence limited.
13. Information about Financial Instruments
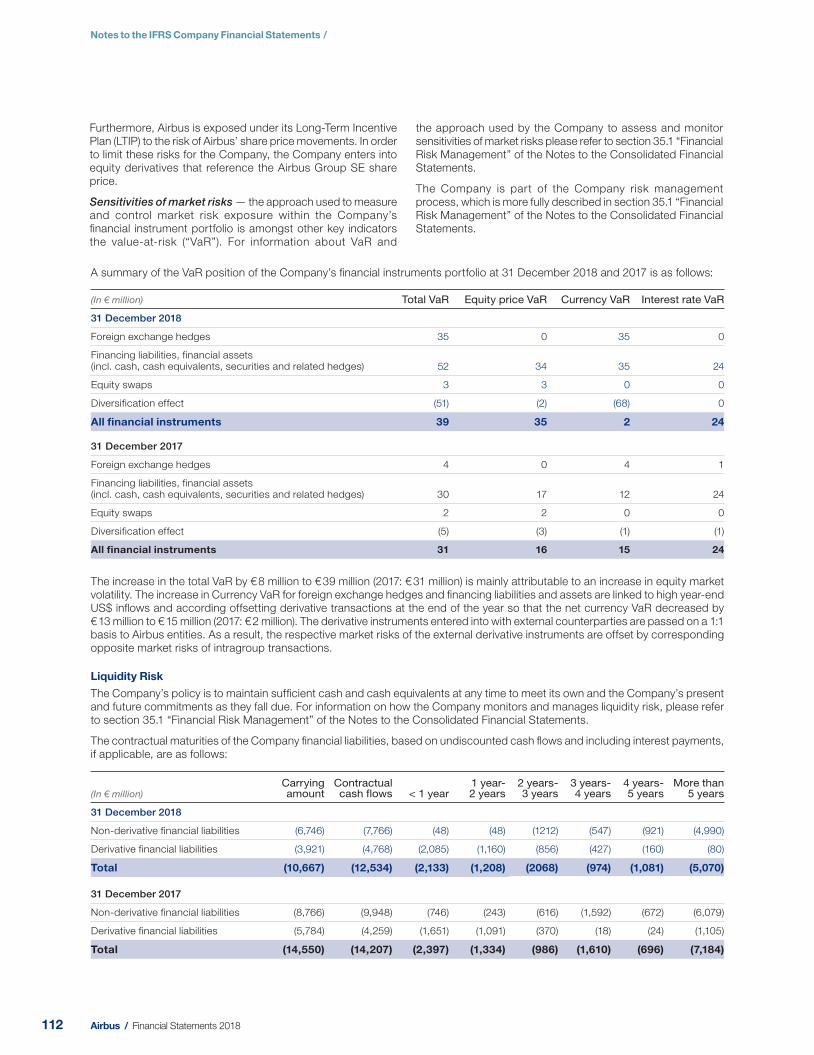
112 Airbus / Financial Statements 2018
Notes to the IFRS Company Financial Statements /
Furthermore, Airbus is exposed under its Long-Term Incentive
Plan (LTIP) to the risk of Airbus’ share price movements. In order
to limit these risks for the Company, the Company enters into
equity derivatives that reference the Airbus Group SE share
price.
Sensitivities of market risks — the approach used to measure
and control market risk exposure within the Company’s
fi nancial instrument portfolio is amongst other key indicators
the value-at-risk (“VaR”). For information about VaR and
the approach used by the Company to assess and monitor
sensitivities of market risks please refer to section 35.1 “Financial
Risk Management” of the Notes to the Consolidated Financial
Statements.
The Company is part of the Company risk management
process, which is more fully described in section 35.1 “Financial
Risk Management” of the Notes to the Consolidated Financial
Statements.
A summary of the VaR position of the Company’s fi nancial instruments portfolio at 31 December 2018 and 2017 is as follows:
(In € million) Total VaR Equity price VaR Currency VaR Interest rate VaR
31 December 2018
Foreign exchange hedges 35 0 35 0
Financing liabilities, financial assets (incl. cash, cash equivalents, securities and related hedges) 52 34 35 24
Equity swaps 3 3 0 0
Diversification effect (51) (2) (68) 0
All financial instruments 39 35 2 24
31 December 2017
Foreign exchange hedges 4 0 4 1
Financing liabilities, financial assets(incl. cash, cash equivalents, securities and related hedges) 30 17 12 24
Equity swaps 2 2 0 0
Diversification effect (5) (3) (1) (1)
All financial instruments 31 16 15 24
The increase in the total VaR by € 8 million to € 39 million (2017: € 31 million) is mainly attributable to an increase in equity market
volatility. The increase in Currency VaR for foreign exchange hedges and fi nancing liabilities and assets are linked to high year-end
US$ infl ows and according offsetting derivative transactions at the end of the year so that the net currency VaR decreased by
€ 13 million to € 15 million (2017: € 2 million). The derivative instruments entered into with external counterparties are passed on a 1:1
basis to Airbus entities. As a result, the respective market risks of the external derivative instruments are offset by corresponding
opposite market risks of intragroup transactions.
Liquidity Risk
The Company’s policy is to maintain suffi cient cash and cash equivalents at any time to meet its own and the Company’s present
and future commitments as they fall due. For information on how the Company monitors and manages liquidity risk, please refer
to section 35.1 “Financial Risk Management” of the Notes to the Consolidated Financial Statements.
The contractual maturities of the Company fi nancial liabilities, based on undiscounted cash fl ows and including interest payments,
if applicable, are as follows:
(In € million)Carrying amount
Contractual cash flows < 1 year
1 year-2 years
2 years-3 years
3 years-4 years
4 years-5 years
More than 5 years
31 December 2018
Non-derivative financial liabilities (6,746) (7,766) (48) (48) (1212) (547) (921) (4,990)
Derivative financial liabilities (3,921) (4,768) (2,085) (1,160) (856) (427) (160) (80)
Total (10,667) (12,534) (2,133) (1,208) (2068) (974) (1,081) (5,070)
31 December 2017
Non-derivative financial liabilities (8,766) (9,948) (746) (243) (616) (1,592) (672) (6,079)
Derivative financial liabilities (5,784) (4,259) (1,651) (1,091) (370) (18) (24) (1,105)
Total (14,550) (14,207) (2,397) (1,334) (986) (1,610) (696) (7,184)

113 Airbus / Financial Statements 2018
Notes to the IFRS Company Financial Statements /
FINANCIAL STATEMENTS 2018
4
Credit Risk
The Company is exposed to credit risk to the extent of non-
performance by its counterparts with regard to fi nancial instruments
or issuers of fi nancial instruments for gross cash investments.
However, it has policies in place to avoid concentrations of credit
risk and to ensure that credit risk is limited.
As far as central treasury activities are concerned, credit risk
resulting from fi nancial instruments is managed by the Company.
In order to ensure suffi cient diversifi cation, a credit limit system
is used.
The Company monitors the performance of the individual
fi nancial instruments and the impact of market developments on
their performance and takes appropriate action on foreseeable
adverse development based on pre-defi ned procedures and
escalation levels.
Sales of products and services are made to customers after
having conducted appropriate internal credit risk assessment.
The booked amount of fi nancial assets represents the maximum
credit exposure. The credit quality of fi nancial assets can be
assessed by reference to external credit rating (if available) or
internal assessment of customers’ creditworthiness by way of
internal risk pricing methods.
In 2018, the total receivables, neither past due nor impaired
amount to € 250 million ( 2017: € 176 million). On 1 January 2018,
the impact of the application of the expected credit loss on
the securities is € -3 million. In 2018, the total impact is non
signifi cant.
13.2 Carrying Amounts and Fair Values of Financial Instruments
Financial instruments – The Company’s fi nancial assets mainly
consist of cash, short to medium-term deposits and securities.
The Company’s fi nancial liabilities include intragroup liabilities,
obligations towards fi nancial institutions and issued bonds. The
Company has the same classifi cation and accounting policies
as the Company. Please refer to section 35.1 “Financial Risk
Management” of the Notes to the Consolidated Financial
Statements for more information.
From January 2018, the Company classifi es its fi nancial assets
in one of the following categories: (i) at fair value through OCI,
(ii) at fair value through profi t and loss and (iii) at amortised cost.
Classifi cation depends on the Company’s business model for
managing the fi nancial assets and the contractual terms of the
cash fl ows, as described in “— Note 4: Change in Accounting
Policies and Disclosures”.
Until 31 December 2017, the Company classifi ed its fi nancial
assets in the following three categories: (i) at fair value through
profi t and loss, (ii) loans and receivables and (iii) available-for-sale
fi nancial assets. Classifi cation was determined by management
at initial recognition and depended on the purpose of acquisition.
The Company assigns its fi nancial instruments (excluding its
at-cost investments, which are outside the scope of IAS 39
“Financial instruments: recognition and measurement”) into
classes based on their category in the statement of fi nancial
position.
The following table presents the carrying amounts and fair values of fi nancial instruments by class and by IFRS 9 measurement
category as of 31 December 2018:
(In € million)
Fair value through
profit or loss
Fair value through
OCI
Financial assets and liabilities at amortised cost
Financial instruments total
Amortised cost Fair value Book value Fair value
Assets
Other investments and long-term financial assets
Equity instruments 1,171 0 0 0 1,171 1,171
Loans 0 0 1,708 1,739 1,708 1,739
Trade receivables 0 0 165 165 165 165
Other financial assets
Derivative instruments 3,794 0 0 0 3,794 3,794
Current account Airbus companies 0 0 8,013 8,013 8,013 8,013
Securities 338 12,208 0 0 12,546 12,546
Cash and cash equivalents 6,576 984 326 326 7,886 7,887
Total 11,879 13,192 10,212 10,243 35,283 35,315
Liabilities
Financing liabilities
Issued bonds and commercial papers 0 0 2,813 2,832 2,813 2,832
Liabilities to banks and other financing liabilities 0 0 87 88 87 88
Internal loans payable 0 0 3,846 3,950 3,846 3,950
Other financial liabilities
Derivative instruments 3,921 0 0 0 3,921 3,921
Current accounts Airbus companies 0 0 30,175 30,175 30,175 30,175
Total 3,921 0 36,922 37,045 40,842 40,966

114 Airbus / Financial Statements 2018
Notes to the IFRS Company Financial Statements /
The following table presents the carrying amounts and fair values of fi nancial instruments by class and by IAS 39 measurement
category as of 3 1 December 2017:
(In € million)
Fair value through profit or loss
Fair value for hedge relations
Available-for-sale
Loans and receivables and
financial liabilitiesat amortised cost
Financial instruments total
Held for trading Designated
Fair value
Book value
Fair value
Amortised cost
Fair value
Book value
Fair value
Assets
Other investments and long-term financial assets
Equity instruments 0 0 0 1,193 1,193 0 0 1,193 1,193
Loans 0 0 0 0 0 3,234 3,856 3,234 3,856
Trade receivables 0 0 0 0 0 31 31 31 31
Other financial assets 0 0 0 0 0 0 0 0 0
Derivative instruments 5,586 0 54 0 0 0 0 5,640 5,640
Current account Airbus companies 0 0 0 0 0 9,581 9,581 9,581 9,581
Securities 0 0 0 12,388 12,388 0 0 12,388 12,388
Cash and cash equivalents 0 6,256 0 2,085 2,085 2,697 2,697 11,038 11,038
Total 5,586 6,256 54 15,666 15,666 15,543 16,165 43,105 43,727
Liabilities
Financing liabilities
Issued bonds and commercial papers 0 0 0 0 0 2,751 3,083 2,751 3,083
Liabilities to banks and other financing liabilities 0 0 0 0 0 1,715 3,081 1,715 3,081
Internal loans payable 0 0 0 0 0 4,300 4,298 4,300 4,298
Other financial liabilities
Derivative instruments 5,698 0 86 0 0 0 0 5,785 5,785
Current accounts Airbus companies 0 0 0 0 0 32,127 32,127 32,127 32,127
Total 5,698 0 86 0 0 40,893 42,590 46,679 48,375
Fair Value Hierarchy
For further details please refer to Note 35.2 “Carrying Amounts and Fair Values of Financial Instruments” in the Consolidated
Financial Statements.
The fair values disclosed for fi nancial instruments accounted for at amortised cost refl ect Level 2 input.
The following table presents the carrying amounts of the fi nancial instruments held at fair value across the three levels of the fair value hierarchy as of 31 December 2018 and 2017, respectively:
(In € million)
31 December 2018 31 December 2017
Level 1 Level 2 Total Level 1 Level 2 Total
Financial assets measured at fair value
Equity instruments 1,171 0 1,171 1,193 0 1,193
Derivative instruments 0 3,794 3,794 0 5,641 5,641
Securities 12,546 0 12,546 12,388 0 12,388
Cash equivalents 6,577 984 7,561 7,441 900 8,341
Total 20,294 4,778 25,072 21,022 6,542 27,564
Financial liabilities measured at fair value
Derivative instruments 0 3,921 3,921 0 5,785 5,785
Other liabilities 0 0 0 0 0 0
Total 0 3,921 3,921 0 5,785 5,785

115 Airbus / Financial Statements 2018
Notes to the IFRS Company Financial Statements /
FINANCIAL STATEMENTS 2018
4
Financial Assets Designated at Fair Value through Profit or Loss
The following types of fi nancial assets held at 31 December 2018 and 2017, respectively, are designated at fair value through
profi t or loss:
(In € million)
Nominal amount at initial recognition at
31 December 2018
Nominal amount at initial recognition at 31 December 2017
Designated at fair value through profit or loss at recognition:
Money market funds (accumulating) 6,577 7,441
Securities 338 0
Foreign currency funds of hedge funds 0 0
Total 6,915 7,441
The company manages these assets and measures their performance on a fair value basis.
In addition, the Company invests in non-accumulating money market funds, which pay interest on a monthly basis. The fair value
of those funds corresponds to their nominal amount at initial recognition date amounting to € 0 million (2017: € 1,185 million).
13.3 Potential Effect of Set-Off Rights on Recognised Financial Assets and LiabilitiesThe Company reports all its fi nancial assets and fi nancial liabilities on a gross basis. With each derivative counterparty there are
master netting agreements in place providing for the immediate close-out of all outstanding derivative transactions and payment
of the net termination amount in the event a party to the agreement defaults or another defi ned termination event occurs. The
following tables set out, on a counterparty specifi c basis, the potential effect of master netting agreements on the Company’s
fi nancial position, separately for fi nancial assets and fi nancial liabilities that were subject to such agreements as of 31 December
2018 and 2017, respectively:
(In € million)
Gross amounts
recognised
Gross amounts
recognised set off in
the financial statements
Net amounts presented in the financial statements
Related amounts not set off in the statement
of financial position
Net amountFinancial
instruments
Cash collateral received
31 December 2018
Financial assets 3,799 0 3,799 (879) 0 2,920
Financial liabilities 3,829 0 3,829 (879) 0 2,950
31 December 2017
Financial assets 2,643 0 2,643 (1,472) 44 1,215
Financial liabilities 1,486 0 1,486 (1,472) 0 14
13.4 Notional Amounts of Derivative Financial InstrumentsThe notional amount of interest rate contracts are as follows, specifi ed by year of expected maturity:
(In € million)
Remaining period
Total1 year 2 years 3 years 4 years 5 years 6 years 7 years > 7 years
31 December 2018
Interest rate contracts 0 0 0 0 1,048 1,000 600 1,200 3,848
Interest rate future contracts 215 0 0 0 0 0 0 0 215
31 December 2017
Interest rate contracts 0 0 0 343 0 1,001 1,523 2,000 4,867
Interest rate future contracts 0 0 0 0 0 0 0 0 0
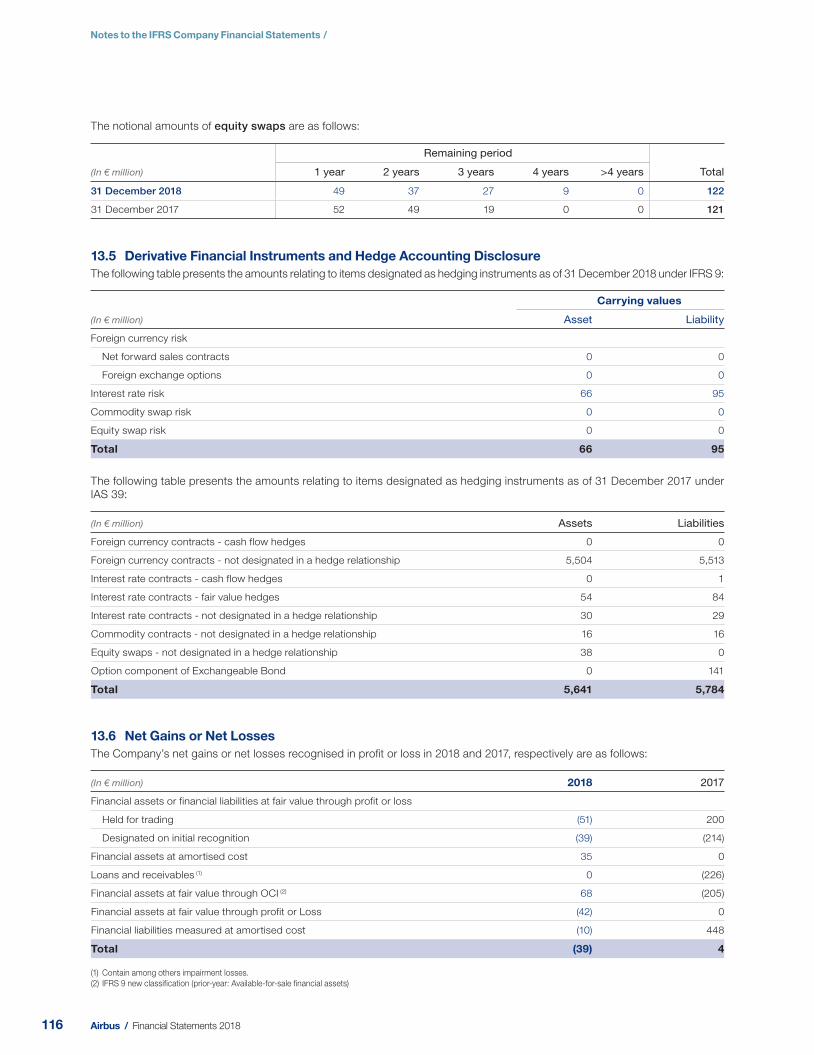
116 Airbus / Financial Statements 2018
Notes to the IFRS Company Financial Statements /
The notional amounts of equity swaps are as follows:
(In € million)
Remaining period
Total1 year 2 years 3 years 4 years > 4 years
31 December 2018 49 37 27 9 0 122
31 December 2017 52 49 19 0 0 121
13.5 Derivative Financial Instruments and Hedge Accounting DisclosureThe following table presents the amounts relating to items designated as hedging instruments as of 31 December 2018 under IFRS 9:
(In € million)
Carrying values
Asset Liability
Foreign currency risk
Net forward sales contracts 0 0
Foreign exchange options 0 0
Interest rate risk 66 95
Commodity swap risk 0 0
Equity swap risk 0 0
Total 66 95
The following table presents the amounts relating to items designated as hedging instruments as of 31 December 2017 under
IAS 39:
(In € million) Assets Liabilities
Foreign currency contracts - cash flow hedges 0 0
Foreign currency contracts - not designated in a hedge relationship 5,504 5,513
Interest rate contracts - cash flow hedges 0 1
Interest rate contracts - fair value hedges 54 84
Interest rate contracts - not designated in a hedge relationship 30 29
Commodity contracts - not designated in a hedge relationship 16 16
Equity swaps - not designated in a hedge relationship 38 0
Option component of Exchangeable Bond 0 141
Total 5,641 5,784
13.6 Net Gains or Net LossesThe Company’s net gains or net losses recognised in profi t or loss in 2018 and 2017, respectively are as follows:
(In € million) 2018 2017
Financial assets or financial liabilities at fair value through profit or loss
Held for trading (51) 200
Designated on initial recognition (39) (214)
Financial assets at amortised cost 35 0
Loans and receivables (1) 0 (226)
Financial assets at fair value through OCI (2) 68 (205)
Financial assets at fair value through profit or Loss (42) 0
Financial liabilities measured at amortised cost (10) 448
Total (39) 4
(1) Contain among others impairment losses.
(2) IFRS 9 new classification (prior-year: Available-for-sale financial assets)
117 Airbus / Financial Statements 2018
Notes to the IFRS Company Financial Statements /
FINANCIAL STATEMENTS 2018
4
14. Audit Fees
Fees related to professional services rendered by the Company’s auditor , Ernst & Young Accountants LLP, for the fi scal year 2018
were € 680 thousand ( 2017: € 685 thousand). These fees relate to audit services only.
15. Events after the Reporting Date
There are no signifi cant events after the reporting date.

Chapter
118 Airbus / Financial Statements 2018
5

119 Airbus / Financial Statements 2018
5Other Supplementary Information Including the Independent Auditor’s Report

120 Airbus / Financial Statements 2018
Other Supplementary Information Including the Independent Auditor’s Report /
Other Supplementary Information
1. Appropriation of Result
Articles 30 and 31 of the Articles of Association provide that the Board of Directors shall determine which part of the result shall
be attributed to the reserves. The General Meeting of Shareholders may dispose of a reserve only upon a proposal of the Board
of Directors and to the extent it is permitted by law and the Articles of Association. Dividends may only be paid after adoption of
the annual accounts from which it appears that the shareholders’ equity of the Company is more than the amount of the issued
and paid-in part of the capital increased by the reserves that must be maintained by law.
It will be proposed at the Annual General Meeting of Shareholders that the l oss for the period of € 227 million as shown in the
I ncome S tatement for the fi nancial year 2018 is to be added to retained earnings and that a payment of a gross amount of € 1.65
per share shall be made to the shareholders out of retained earnings.
2. Independent Auditor’s Report
To: the shareholders and Board of Directors of Airbus SE
Report on the Audit of the Financial Statements 2018 i ncluded in the Annual Report
Our Opinion
We have audited the fi nancial statements 2018 of Airbus SE (the Company), based in Amsterdam.
In our opinion the accompanying fi nancial statements give a true and fair view of the fi nancial position of Airbus SE as at 31 December
2018, and of its result and its cash fl ows for 2018 in accordance with International Financial Reporting Standards as adopted by
the European Union (EU-IFRS) and with Part 9 of Book 2 of the Dutch Civil Code.
The fi nancial statements comprise:
-the consolidated and Company statement of fi nancial position as at 31 December 2018;
-the following statements for 2018: the consolidated and Company income statement , the consolidated and Company Statements
of Comprehensive Income, changes in equity and cash fl ows;
-the notes comprising a summary of the signifi cant accounting policies and other explanatory information.
Basis for our Opinion
We conducted our audit in accordance with Dutch law, including the Dutch Standards on Auditing. Our responsibilities under
those standards are further described in the “Our responsibilities for the audit of the fi nancial statements” section of our report.
We are independent of Airbus SE in accordance with the EU Regulation on specifi c requirements regarding statutory audit of
public-interest entities, the Wet toezicht accountantsorganisaties (Wta, Audit fi rms supervision act), the Verordening inzake de
onafhankelijkheid van accountants bij assurance-opdrachten (ViO, Code of Ethics for Professional Accountants, a regulation with
respect to independence) and other relevant independence regulations in the Netherlands. Furthermore we have complied with
the Verordening gedrags- en beroepsregels accountants (VGBA, Dutch Code of Ethics).
We believe the audit evidence we have obtained is suffi cient and appropriate to provide a basis for our opinion.
121 Airbus / Financial Statements 2018
Other Supplementary Information Including the Independent Auditor’s Report /
FINANCIAL STATEMENTS 2018
5
Materiality
Materiality € 292 million (2017: € 213 million)
Benchmark applied 5 % of the EBIT Adjusted
Explanation We consider EBIT Adjusted as the most appropriate benchmark as it best aligns with the expectations of those charged with governance at Airbus and users of the Company’s financial statements.
We have also taken into account misstatements and/or possible misstatements that in our opinion are material for the users of
the fi nancial statements for qualitative reasons.
We agreed with the Audit Committee of the Board of Directors (“the Audit Committee”) that misstatements in excess of € 10 million
that are identifi ed during the audit, would be reported to them, as well as smaller misstatements that in our view must be reported
on qualitative grounds.
Scope of the Group Audit
Airbus SE is at the head of a group of entities. The fi nancial information of this group is included in the Consolidated Financial
Statements of Airbus SE.
We are responsible for directing, supervising and performing the group audit. In this context, we have determined the nature and
extent of the audit procedures to be carried out for the entities, based on their size and/or risk profi le.
We scope entities into the group audit where they are of signifi cant size, have signifi cant risks to the Company associated with them
or are considered for other reasons. This resulted in coverage of 88% of total consolidated revenue and 91% of total consolidated
assets. The remaining 12% of revenues, and 9% of total assets result from entities, none of which individually represents more
than 1% of revenues. For those entities, we performed, amongst others, analytical procedures to corroborate our assessment
that the fi nancial statements are free from material misstatements.
We executed an audit plan that includes participation in risk assessment and planning discussions, setting the direction of
the group audit work (including instructions to the divisional and entity auditors), reviewing and discussing the planned audit
approach, obtaining an understanding of the fi nancial reporting process and performing procedures on the group consolidation,
participating in the evaluation of key accounting topics, reviewing the fi nancial statements and participating in meetings with the
management of the Company and its divisions. In our audit instructions, we also included targeted audit procedures that address
the key programmes (A220, A350, A380, A400M) as well as the risk of non-compliance with laws and regulations. We involved
several EY specialists to assist the audit team, including specialists from our tax, actuarial, treasury and compliance departments.
The audit of the three Airbus divisions is performed jointly by EY network fi rms and non-EY audit fi rms. Meetings were held with
the divisional auditors and divisional management to discuss the fi ndings reported to the group audit team. We furthermore
executed fi le reviews at EY network teams and non-EY audit fi rms.
By performing the procedures mentioned above at group entities, together with additional procedures at group level, we have
been able to obtain suffi cient and appropriate audit evidence about the Company’s fi nancial information to provide an opinion
about the Consolidated Financial Statements.
Our Key Audit Matters
Key audit matters are those matters that, in our professional judgement, were of most signifi cance in our audit of the fi nancial
statements. We have communicated the key audit matters to the Audit Committee. The key audit matters are not a comprehensive
refl ection of all matters discussed.
These matters were addressed in the context of our audit of the fi nancial statements as a whole and in forming our opinion thereon,
and we do not provide a separate opinion on these matters.

122 Airbus / Financial Statements 2018
Other Supplementary Information Including the Independent Auditor’s Report /
Risk description Our audit response
Litigation and claims and risk of non-compliance with laws and regulations
A part of the Company’s business is characterised by competition for individual significant contracts with customers which are often directly or indirectly associated with governments. The process associated with these activities is susceptible to the risk of non-compliance with laws and regulations. In addition, the Company operates in a number of territories where the use of commercial intermediaries is normal practice. Certain entities of the group remain under investigation by various law enforcement agencies for amongst others alleged irregularities concerning third party consultants. Breaches of laws and regulations in these areas can lead to fines, penalties, criminal prosecution, commercial litigation and restrictions on future business.
Litigation and claims involve amounts that are potentially significant and the estimate of the amount to be provided as a liability, if any, is inherently subjective. The outcome of these matters may have a material effect on the Company’s result and its financial position.
Reference is made to the disclosures on Note 3 “Key estimates and judgements”, Note 22 “Provisions, contingent assets and contingent liabilities” and Note 36 “Litigations and claims” of the financial statements.
We evaluated and tested the Company’s policies, procedures and controls over the selection of intermediaries, contracting arrangements, ongoing management, payments and responses to suspected breaches of policy.
We evaluated the tone set by management and the Board of Directors and the Company’s approach to managing this risk.
We discussed with the Board of Directors, the Audit Committee, the Ethics and Compliance Committee as well as the Company’s internal and external legal advisors the areas of potential or suspected breaches of law, including the ongoing investigations. To corroborate the results of those enquiries with third parties we assessed related non-privileged documentation. We have inquired the management, the Audit Committee, the Ethics and Compliance Committee and the Board of Directors as to whether the Company is in compliance with laws and regulations relating to bribery and corruption.
We maintained a high level of vigilance to possible indications of significant non-compliance with laws and regulations relating to bribery and corruption whilst carrying out our other audit procedures.
We gained additional assurance by comparing management’s position to the assessment from external parties such as external lawyers in those cases where a high amount of judgement is involved.
We have assessed whether the disclosure in Note 36 to the financial statements of the Company’s exposure to the financial effects of potential or suspected breaches of law or regulation complies with the accounting standards.
We determined that the disclosures in the financial statements reflect the current status of the investigation by the UK SFO, France’s PNF and US DOJ as well as the review of business partner relationships in accordance with accounting standards.
Revenue recognition, including the application of IFRS 15
The Company adopted the new standard on 1 January 2018, using the full retrospective transition method and electing the practical expedients for completed contracts and contract modifications.
The allocation of the transaction price to and the identification of performance obligations in contracts are judgemental and could have a material effect on the Company’s result and its financial position. Furthermore, the amount of revenue and profit recognised in a year for over time contracts is dependent on the assessment of the stage of completion of performance obligations as well as estimated total revenues and estimated total cost.
The value of the backlog is disclosed in the notes.
Reference is made to the disclosures on Note 2 “Significant Accounting Policies”, Note 3 “Key estimates and judgements”, Note 9 “Segment Information” and Note 10 “Revenue and gross margin” of the financial statements.
Our audit procedures included, amongst others, assessing the appropriateness of the Company’s accounting policies related to IFRS 15 Revenue recognition, including the appropriate timing of revenue recognition method: over time or point in time. In addition we evaluated the design and implementation of internal controls for the sales process and tested individual sales transactions to assess proper identification of the performance obligations in the contracts, the completeness and valuation of the variable considerations constraints included in the transaction price and the reasonableness of the actual and estimated cost to complete included in the cost-to-cost method for contracts recognised over time.
Our procedures furthermore included cut-off testing for point in time contracts to assess whether revenue was recognised in the correct period.
The audit of the backlog end of 31 December 2018 included verifying the correct application of IFRS 15 and reconciling the backlog value presented in the disclosures with the underlying contract details and other supporting documentation.
We did not identify evidence of material misstatement in the revenue recognised in the year and we determined that the appropriate disclosures were made in the financial statements.

123 Airbus / Financial Statements 2018
Other Supplementary Information Including the Independent Auditor’s Report /
FINANCIAL STATEMENTS 2018
5
Risk description Our audit response
Estimations with respect to the contract margin for the accounting of onerous contracts and the assessment of the contract margin recognised for the significant over time contracts.
Significant estimates are made to assess the contract margin, based on estimated revenue and costs for the key programmes including progress of costs (PoC ) for over time contracts.
Provisions for onerous contracts such as for the A400M and A380 are recognised when it becomes probable that the present value of unavoidable costs of fulfilling the obligations under the contract exceeds the present value of economic benefits expected to be received under the contract.
The determination of these contract margins and provisions for onerous contracts is based on available best estimates and requires management’s significant judgement and assumptions associated with the technical development achievement and certification schedules, production plan (including assumptions on ramp up), performance guarantees as well as expected outcome from ongoing negotiations with customers.
Reference is made to the disclosure on Note 2 “Significant Accounting Policies”, Note 3 “Key estimates and judgements”, Note 10 “Revenues and gross margin” and Note 22 “Provisions, contingent assets and contingent liabilities” of the financial statements.
We evaluated the design and implementation of internal controls for accounting for onerous contracts and assessment of the contract margin. We also performed substantive procedures on individually significant programmes, including discussions with the programme team including the Head of Programme. Furthermore we evaluated management’s assumptions in the determination of amongst others the stage of completion of a project, estimates to complete for both revenue and costs and any provisions for onerous contracts. We focused on management’s assessment of key contract risks and opportunities to determine whether these are appropriately reflected in the cost to complete forecasts, paid specific attention to technical and market developments, including export opportunities, delivery plan and certification schedules.
We challenged management’s assumptions by discussing and reviewing correspondence with customers, considered the accuracy and consistency of similar estimates made in previous years and corroborated the assumptions with the latest contractual information. For over time contracts and performance obligations we performed detailed testing of cost incurred and audited the correct application of margin at completion.
Finally we determined that the appropriate disclosures were made in the financial statements.
Recoverability of assets related to significant programmes
Capitalised development costs, jigs and tools and inventories relate mainly to the key programmes, such as the A350, A400M, A380 and NH90.
Estimates of the future cash flows are necessary to determine if an impairment of assets has to be recognised. In addition to the risk of contract cancellations, significant costs or loss of revenue may be incurred in connection with remedial actions required to correct any performance issue detected. Owing to the inherent uncertainty involved in forecasting future costs and interpreting contractual and commercial positions in determining impairments and provisions, this is a key audit area. Updates to these provisions can have a significant impact on the Company’s result and financial position.
Reference is made to the disclosures on Note 2 “Significant Accounting Policies”, Note 21 “ Inventories” and Note 22 “ Provisions, contingent assets and contingent liabilities” of the financial statements.
We evaluated the design and implementation of internal controls for identifying and recording impairments and performed substantive audit procedures including inquiry of the programme controller and Head of Programmes and corroboration with other audit evidence.
We evaluated management’s assumptions in the determination of the forecasted revenue to be realised, cost to be incurred (including any contractual penalties) and the expected gross margin. Part of our evaluation was the assessment of the historical accuracy of the Company’s estimates in previous periods and included an analysis of contingencies and impact of known technical issues on cost forecasts and provisions.
In addition, with respect to the A380, we evaluated management’s estimate regarding the reimbursement of the programme specific RLI’s.
Finally we determined that the appropriate disclosures were made in the financial statements.
Derivative financial instruments (including IFRS 9)
The Company operates in a business environment that is exposed to currency and interest rate volatility. A significant portion of the Company’s revenue is dominated in US dollars, while a major part of its costs is incurred in Euro and, to a lesser extent, in Pounds Sterling. In response to these risks the Company uses financial instruments (mainly currency forwards) to mitigate the exposure to changes in market rates. There is a high inherent risk of error in the Company’s Consolidated Financial Statements, both in the valuation of the financial instruments and in the presentation and disclosure in the financial statements.
The magnitude of the Company’s hedge portfolio and potentially significant changes in the exchange rate of the US dollar versus the Euro could have a significant impact on the consolidated equity of the Company via the “mark to market” valuation of the hedge portfolio.
Reference is made to Note 35 “Information about financial instruments” of the financial statements.
For the audit of the financial instruments we used specialists who tested the controls around the Company’s central treasury system, independently calculated the valuation of the treasury portfolio and tested the application of the hedge accounting rules and the resulting accounting treatment. In this process we also assessed the delivery profile used as a basis to the hedge accounting effectiveness test.
We obtained counterparty confirmation of the outstanding financial instruments to verify the existence and ownership.
Based on a sample of derivative financial instruments we assessed that the valuation of the financial instruments is within a pre-defined tolerable variance threshold and no material exceptions were noted.
The results of our procedures relating to management’s accounting for derivative financial instruments (including IFRS 9) in the 2018 financial statements were satisfactory and we determined that the appropriate disclosures were made in the financial statements.
124 Airbus / Financial Statements 2018
Other Supplementary Information Including the Independent Auditor’s Report /
Risk description Our audit response
The acquisition of CSALP (judgements related to the PPA)
On 1 July 2018, the Company has taken control of the C Series programme of Bombardier by acquiring 50.01% percent Class A ownership units in the C Series Aircraft Limited Partnership (CSALP) entity. The entity is consolidated as of 1 July 2018.
Purchase price allocation (“PPA”) has been performed by the Company and resulted into €3,8 billion goodwill.
Given the significant judgement on key assumptions, such as future cash flows, expected synergies and discount rates, the PPA related to the CSALP transaction is considered to be a key audit matter.
Reference is made to Note 6.1 “Acquisitions” of the financial statements.
With respect to the accounting for the CSALP investment, we have, amongst others, read the purchase agreement, examined the accounting considerations, assessed the valuation of the put option on minority interests, the identification and valuation of the assets and liabilities, including any fair value adjustments, assessed and challenged significant valuation assumptions, such as the discount rates and expected synergies. We have included valuation specialists in our team to assist with the audit of the purchase price allocation.
We also obtained an audit report for CSALP from its EY auditor for the opening balance at the acquisition date and the results for the six months ended 31 December 2018. We provided detailed instructions to this auditor, covering the significant audit areas, including the relevant risks of material misstatements, and the information required to be reported by the auditor. In addition, we performed site visits to meet local management and the auditor, telephone conferences were held with the auditor and a file review was performed. During the site visits, telephone conferences and the file review, we challenged and reviewed the approach and the audit findings and observations reported to us.
We noted the assumptions relating to the PPA of CSALP fell within acceptable ranges and we determined that the appropriate disclosures were made in the financial statements.
Report on other Information i ncluded in the Annual ReportIn addition to the fi nancial statements and our auditor’s report thereon, the annual report contains other information that consists of:
-the Report of the Board of Directors (we refer to www.airbus.com for the board report) ;
-other information pursuant to Part 9 of Book 2 of the Dutch Civil Code.
Based on the following procedures performed, we conclude that the other information:
- is consistent with the fi nancial statements and does not contain material misstatements;
-contains the information as required by Part 9 of Book 2 of the Dutch Civil Code.
We have read the other information. Based on our knowledge and understanding obtained through our audit of the fi nancial
statements or otherwise, we have considered whether the other information contains material misstatements. By performing
these procedures, we comply with the requirements of Part 9 of Book 2 of the Dutch Civil Code and the Dutch Standard 720. The
scope of the procedures performed is substantially less than the scope of those performed in our audit of the fi nancial statements.
The Board is responsible for the preparation of the other information, including the Report of the Board of Directors in accordance
with Part 9 of Book 2 of the Dutch Civil Code and other information as required by Part 9 of Book 2 of the Dutch Civil Code.
Report on Other Legal and Regulatory Requirements
Engagement
We were appointed by the Annual General Meeting of Shareholders as auditor of Airbus SE on 28 April 2016, as of the audit for
the year 2016 and have operated as statutory auditor since that date.
No p rohibited Non-Audit Services
We have not provided prohibited non-audit services as referred to in Article 5(1) of the EU Regulation on specifi c requirements
regarding statutory audit of public-interest entities.
Description of Responsibilities for the Financial Statements
Responsibilities of the Board of Directors and Audit Committee for the Financial Statements
The Board of Directors is responsible for the preparation and fair presentation of the fi nancial statements in accordance with
EU-IFRS and Part 9 of Book 2 of the Dutch Civil Code. Furthermore, the Board of Directors is responsible for such internal
control as management determines is necessary to enable the preparation of the fi nancial statements that are free from material
misstatement, whether due to fraud or error.
125 Airbus / Financial Statements 2018
Other Supplementary Information Including the Independent Auditor’s Report /
FINANCIAL STATEMENTS 2018
5
As part of the preparation of the fi nancial statements, the Board of Directors is responsible for assessing the company’s ability
to continue as a going concern. Based on the fi nancial reporting frameworks mentioned, the Board of Directors should prepare
the fi nancial statements using the going concern basis of accounting unless the Board of Directors either intends to liquidate the
company or to cease operations, or has no realistic alternative but to do so. The Board of Directors should disclose events and
circumstances that may cast signifi cant doubt on the Company’ s ability to continue as a going concern in the fi nancial statements.
The Audit Committee is responsible for overseeing the Company’s fi nancial reporting process.
Our Responsibilities for the Audit of the Financial Statements
Our objective is to plan and perform the audit assignment in a manner that allows us to obtain suffi cient and appropriate audit
evidence for our opinion.
Our audit has been performed with a high, but not absolute, level of assurance, which means we may not detect all material
errors and fraud during our audit.
Misstatements can arise from fraud or error and are considered material if, individually or in the aggregate, they could reasonably
be expected to infl uence the economic decisions of users taken on the basis of these fi nancial statements. The materiality affects
the nature, timing and extent of our audit procedures and the evaluation of the effect of identifi ed misstatements on our opinion.
We have exercised professional judgement and have maintained professional scepticism throughout the audit, in accordance
with Dutch Standards on Auditing, ethical requirements and independence requirements. Our audit included amongst others:
-I dentifying and assessing the risks of material misstatement of the fi nancial statements, whether due to fraud or error, designing
and performing audit procedures responsive to those risks, and obtaining audit evidence that is suffi cient and appropriate to
provide a basis for our opinion. The risk of not detecting a material misstatement resulting from fraud is higher than for one resulting
from error, as fraud may involve collusion, forgery, intentional omissions, misrepresentations, or the override of internal control;
-O btaining an understanding of internal control relevant to the audit in order to design audit procedures that are appropriate in
the circumstances, but not for the purpose of expressing an opinion on the effectiveness of the C ompany’s internal control;
-E valuating the appropriateness of accounting policies used and the reasonableness of accounting estimates and related
disclosures made by management;
-C oncluding on the appropriateness of management’s use of the going concern basis of accounting, and based on the audit
evidence obtained, whether a material uncertainty exists related to events or conditions that may cast signifi cant doubt on the
Company’ s ability to continue as a going concern. If we conclude that a material uncertainty exists, we are required to draw
attention in our auditor’s report to the related disclosures in the fi nancial statements or, if such disclosures are inadequate, to
modify our opinion. Our conclusions are based on the audit evidence obtained up to the date of our auditor’s report. However,
future events or conditions may cause a company to cease to continue as a going concern;
-E valuating the overall presentation, structure and content of the fi nancial statements, including the disclosures;
-E valuating whether the fi nancial statements represent the underlying transactions and events in a manner that achieves fair
presentation.
Because we are ultimately responsible for the opinion, we are also responsible for directing, supervising and performing the
group audit. In this respect we have determined the nature and extent of the audit procedures to be carried out for group entities.
Decisive were the size and/or the risk profi le of the Company’s entities or operations. On this basis, we selected group entities for
which an audit or review had to be carried out on the complete set of fi nancial information or specifi c items.
We communicate with the Audit Committee regarding, amongst other matters, the planned scope and timing of the audit and
signifi cant audit fi ndings, including any signifi cant fi ndings in internal control that we identify during our audit. In this respect we also
submit an additional report to the Audit Committee in accordance with Article 11 of the EU Regulation on specifi c requirements
regarding statutory audit of public-interest entities. The information included in this additional report is consistent with our audit
opinion in this auditor’s report.
We provide the Audit Committee with a statement that we have complied with relevant ethical requirements regarding independence,
and to communicate with them all relationships and other matters that may reasonably be thought to bear on our independence,
and where applicable, related safeguards.
From the matters communicated with the Audit Committee, we determine the key audit matters: those matters that were of most
signifi cance in the audit of the fi nancial statements. We describe these matters in our auditor’s report unless law or regulation
precludes public disclosure about the matter or when, in extremely rare circumstances, not communicating the matter is in the
public interest.
Amsterdam, 13 February 2019
Ernst & Young Accountants LLP
signed by A.A. van Eimeren

Related Documents