6.1 Van Horne and Wachowicz, Fundamentals of Financial Management, 13th edition. © Pearson Education Limited 2009. Created by Gregory Kuhlemeyer. Chapter 6 Chapter 6 Financial Financial Statement Statement Analysis Analysis

Welcome message from author
This document is posted to help you gain knowledge. Please leave a comment to let me know what you think about it! Share it to your friends and learn new things together.
Transcript

6.1 Van Horne and Wachowicz, Fundamentals of Financial Management, 13th edition. © Pearson Education Limited 2009. Created by Gregory Kuhlemeyer.
Chapter 6Chapter 6Financial Statement Financial Statement
AnalysisAnalysis

6.2 Van Horne and Wachowicz, Fundamentals of Financial Management, 13th edition. © Pearson Education Limited 2009. Created by Gregory Kuhlemeyer.
After Studying Chapter 6, After Studying Chapter 6, you should be able to:you should be able to:
1. Understand the purpose of basic financial statements and their contents. 2. Understand what is meant by “convergence” in accounting standards.3. Explain why financial statement analysis is important to the firm and to
outside suppliers of capital. 4. Define, calculate, and categorize (according to liquidity, financial leverage,
coverage, activity, and profitability) the major financial ratios and understand what they can tell us about the firm.
5. Define, calculate, and discuss a firm’s operating cycle and cash cycle.6. Use ratios to analyze a firm's health and then recommend reasonable
alternative courses of action to improve the health of the firm. 7. Analyze a firm’s return on investment (i.e., “earning power”) and return on
equity using a DuPont approach. 8. Understand the limitations of financial ratio analysis. 9. Use trend analysis, common-size analysis, and index analysis to gain
additional insights into a firm's performance.

6.3 Van Horne and Wachowicz, Fundamentals of Financial Management, 13th edition. © Pearson Education Limited 2009. Created by Gregory Kuhlemeyer.
• Financial Statements• A Possible Framework for Analysis• Balance Sheet Ratios• Income Statement and Income/Balance
Sheet Ratios• Trend Analysis• Common-Size and Index Analysis
Financial Financial Statement AnalysisStatement Analysis
6.4 Van Horne and Wachowicz, Fundamentals of Financial Management, 13th edition. © Pearson Education Limited 2009. Created by Gregory Kuhlemeyer.
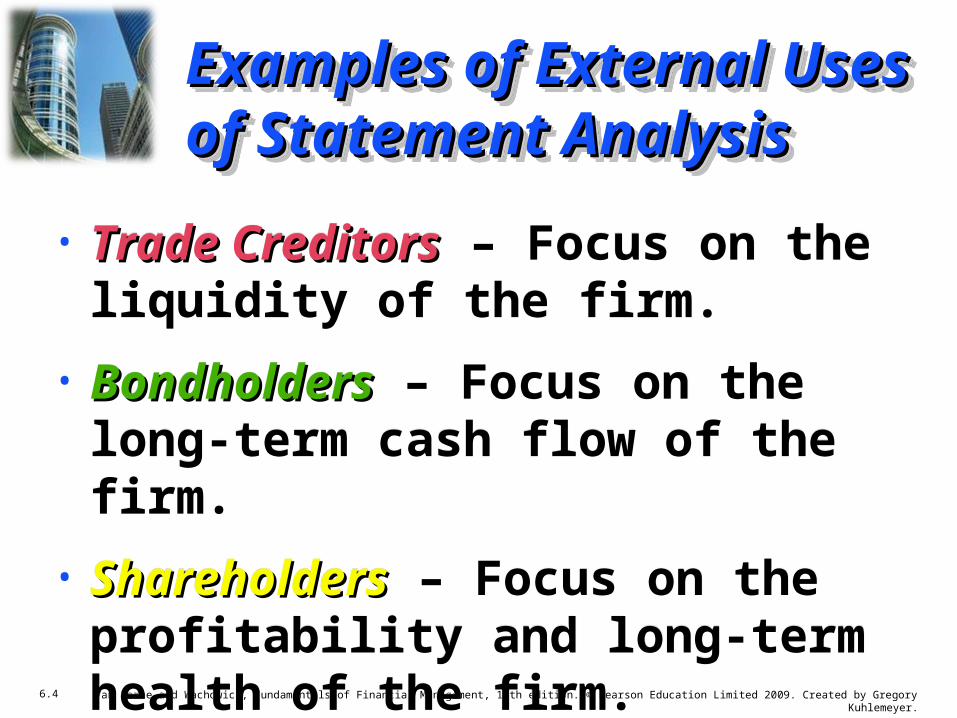
• Trade CreditorsTrade Creditors – Focus on the liquidity of the firm.
• BondholdersBondholders – Focus on the long-term cash flow of the firm.
• ShareholdersShareholders – Focus on the profitability and long-term health of the firm.
Examples of External Uses Examples of External Uses of Statement Analysisof Statement Analysis
6.5 Van Horne and Wachowicz, Fundamentals of Financial Management, 13th edition. © Pearson Education Limited 2009. Created by Gregory Kuhlemeyer.
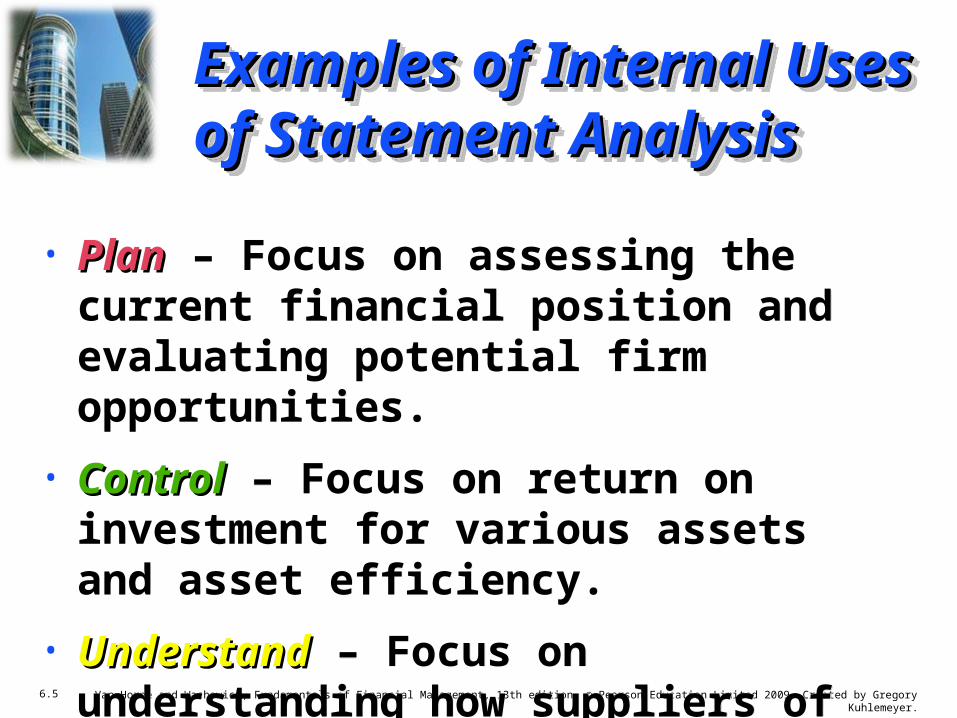
• PlanPlan – Focus on assessing the current financial position and evaluating potential firm opportunities.
• ControlControl – Focus on return on investment for various assets and asset efficiency.
• UnderstandUnderstand – Focus on understanding how suppliers of funds analyze the firm.
Examples of Internal Uses Examples of Internal Uses of Statement Analysisof Statement Analysis
6.6 Van Horne and Wachowicz, Fundamentals of Financial Management, 13th edition. © Pearson Education Limited 2009. Created by Gregory Kuhlemeyer.
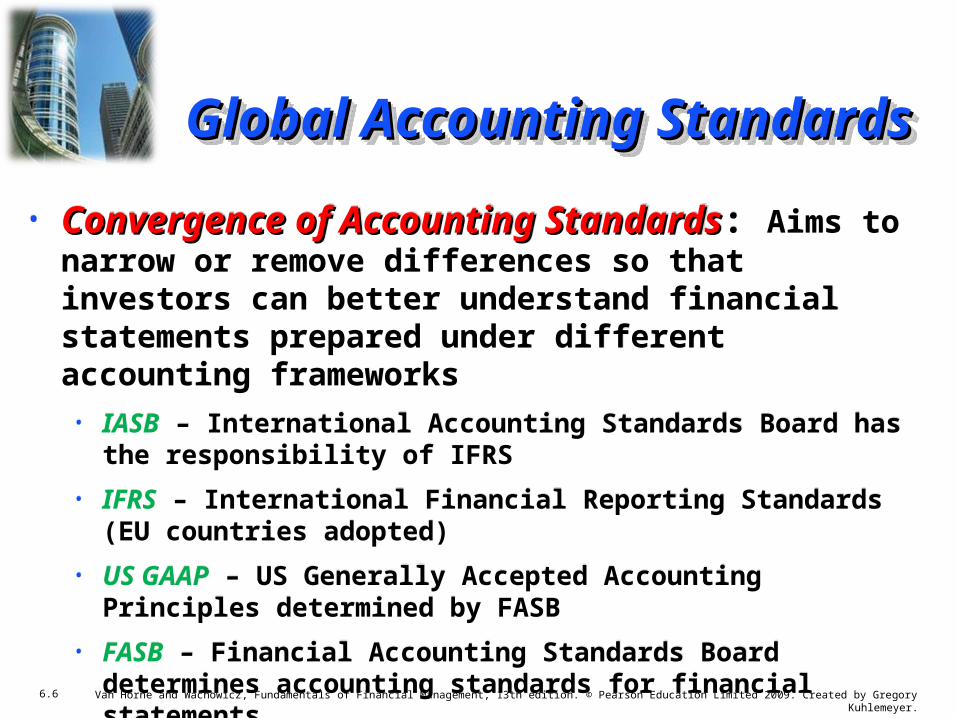
• Convergence of Accounting StandardsConvergence of Accounting Standards: Aims to narrow or remove differences so that investors can better understand financial statements prepared under different accounting frameworks
• IASB – International Accounting Standards Board has the responsibility of IFRS
• IFRS – International Financial Reporting Standards (EU countries adopted)
• US GAAP – US Generally Accepted Accounting Principles determined by FASB
• FASB – Financial Accounting Standards Board determines accounting standards for financial statements
Global Accounting StandardsGlobal Accounting Standards
6.7 Van Horne and Wachowicz, Fundamentals of Financial Management, 13th edition. © Pearson Education Limited 2009. Created by Gregory Kuhlemeyer.
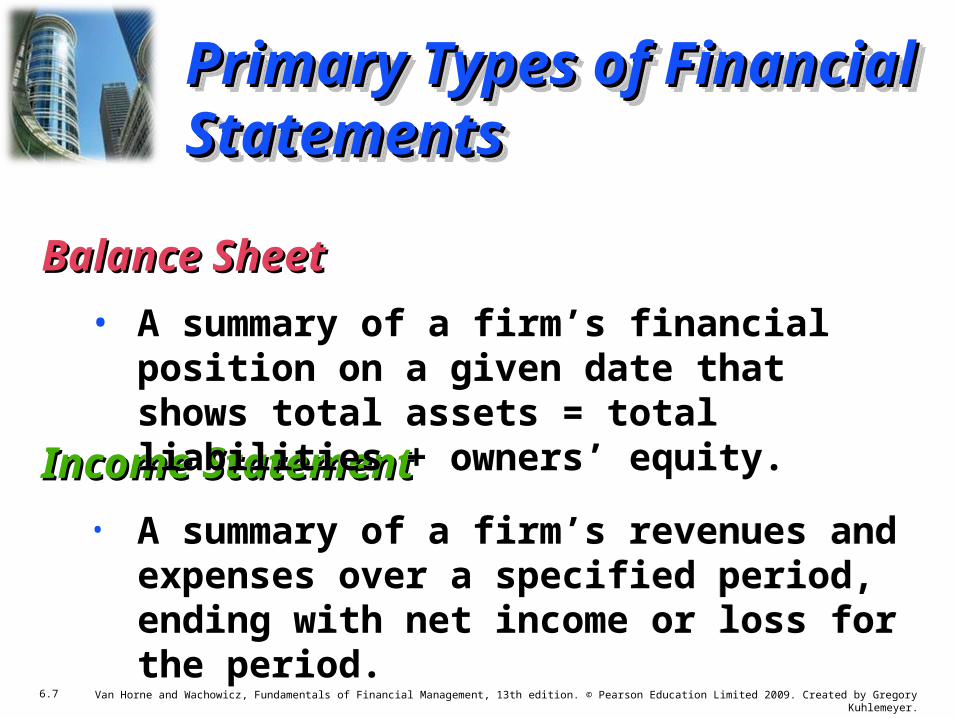
Income StatementIncome Statement• A summary of a firm’s revenues and
expenses over a specified period, ending with net income or loss for the period.
Balance SheetBalance Sheet• A summary of a firm’s financial position on
a given date that shows total assets = total liabilities + owners’ equity.
Primary Types of Primary Types of Financial StatementsFinancial Statements

6.8 Van Horne and Wachowicz, Fundamentals of Financial Management, 13th edition. © Pearson Education Limited 2009. Created by Gregory Kuhlemeyer.
a. How the firm stands on a specific date.
b. What BW owned.c. Amounts owed by
customers.d. Future expense items
already paid.e. Cash/likely convertible
to cash within 1 year.f. Original amount paid.g. Acc. deductions for
wear and tear.
Cash $ 90 Acct. Rec.cc 394 Inventories 696 Prepaid Exp dd 5 Accum Tax Prepay 10 Current AssetsCurrent Assetsee $1,195 $1,195 Fixed Assets (@Cost)ff 1030 Less: Acc. Depr. gg (329)
Net Fix. AssetsNet Fix. Assets $ 701 $ 701 Investment, LT 50 Other Assets, LT 223
Total AssetsTotal Assetsbb $2,169 $2,169
Basket Wonders Balance Sheet (thousands) Dec. 31, 2007Basket Wonders Balance Sheet (thousands) Dec. 31, 2007a
Basket Wonders’ Balance Basket Wonders’ Balance Sheet (Asset Side)Sheet (Asset Side)

6.9 Van Horne and Wachowicz, Fundamentals of Financial Management, 13th edition. © Pearson Education Limited 2009. Created by Gregory Kuhlemeyer.
a. Note, Assets = Liabilities + Equity.
b. What BW owed and ownership position.
c. Owed to suppliers for goods and services.
d. Unpaid wages, salaries, etc.
e. Debts payable < 1 year.f. Debts payable > 1 year.g. Original investment. h. Earnings reinvested.
Notes Payable $ 290 Acct. Payablecc 94 Accrued Taxes dd 16 Other Accrued Liab. dd 100 Current Liab.Current Liab. ee $ $ 500 500 Long-Term Debt ff
530 Shareholders’ Equity Com. Stock ($1 par) gg 200 Add Pd in Capital gg
729 Retained Earnings hh 210 Total Total EquityEquity $ $1,1391,139 Total Liab/EquityTotal Liab/Equitya,ba,b $2,169 $2,169
Basket Wonders Balance Sheet (thousands) Dec. 31, 2007Basket Wonders Balance Sheet (thousands) Dec. 31, 2007
Basket Wonders’ Balance Basket Wonders’ Balance Sheet (Liability Side)Sheet (Liability Side)
6.10 Van Horne and Wachowicz, Fundamentals of Financial Management, 13th edition. © Pearson Education Limited 2009. Created by Gregory Kuhlemeyer.
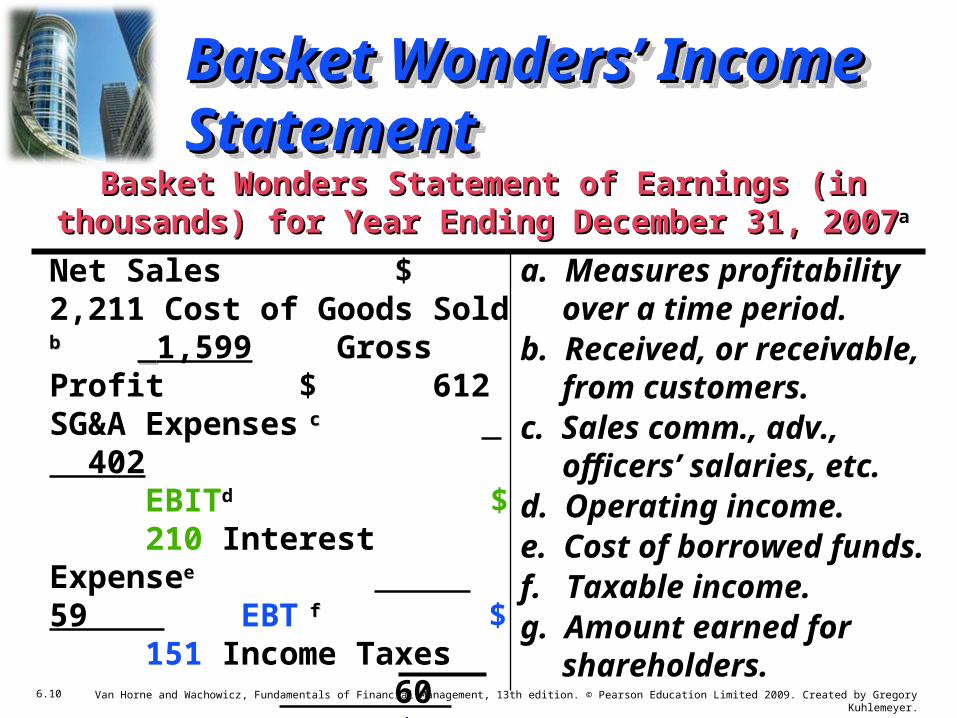
a. Measures profitability over a time period.
b. Received, or receivable, from customers.
c. Sales comm., adv., officers’ salaries, etc.
d. Operating income.e. Cost of borrowed funds.f. Taxable income.g. Amount earned for
shareholders.
Net Sales $ 2,211 Cost of Goods Sold bb 1,599
Gross Profit $ 612 SG&A Expenses c c 402 EBITd $ 210 Interest Expensee 59 EBT f f $ 151 Income Taxes 60 EATg $ 91 Cash Dividends 38 Increase in REIncrease in RE $ 53 $ 53
Basket Wonders Statement of Earnings (in thousands) Basket Wonders Statement of Earnings (in thousands) for Year Ending December 31, 2007for Year Ending December 31, 2007a
Basket Wonders’ Basket Wonders’ Income StatementIncome Statement
6.11 Van Horne and Wachowicz, Fundamentals of Financial Management, 13th edition. © Pearson Education Limited 2009. Created by Gregory Kuhlemeyer.
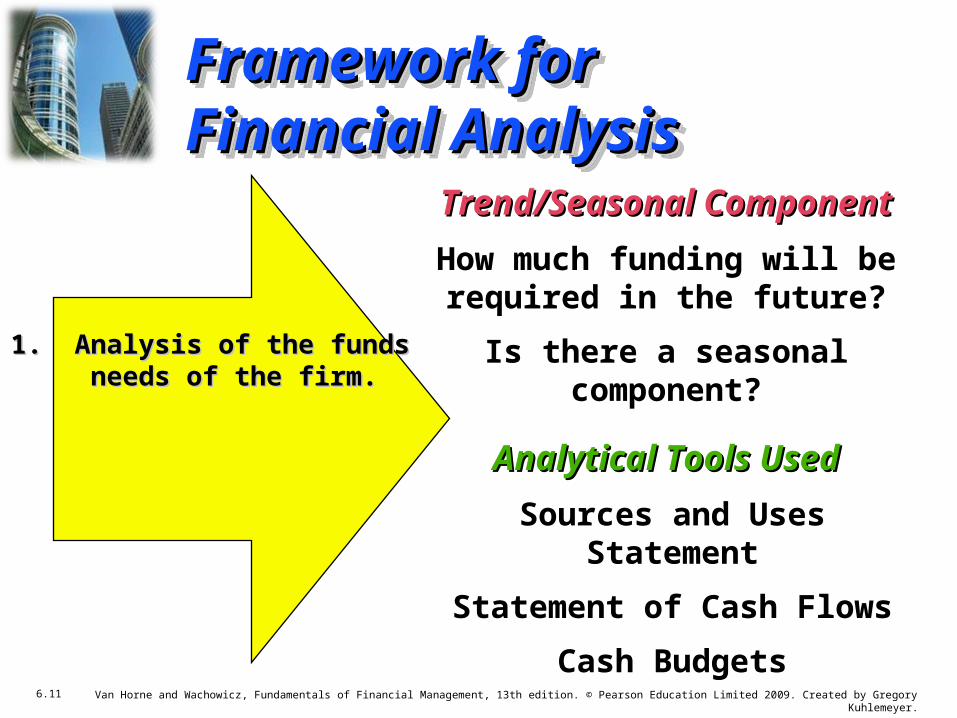
Analytical Tools UsedAnalytical Tools UsedSources and Uses Statement
Statement of Cash FlowsCash Budgets
1. Analysis of the funds1. Analysis of the funds needs of the firm.needs of the firm.
Trend/Seasonal ComponentTrend/Seasonal ComponentHow much funding will be
required in the future?Is there a seasonal
component?
Framework for Framework for Financial AnalysisFinancial Analysis
6.12 Van Horne and Wachowicz, Fundamentals of Financial Management, 13th edition. © Pearson Education Limited 2009. Created by Gregory Kuhlemeyer.
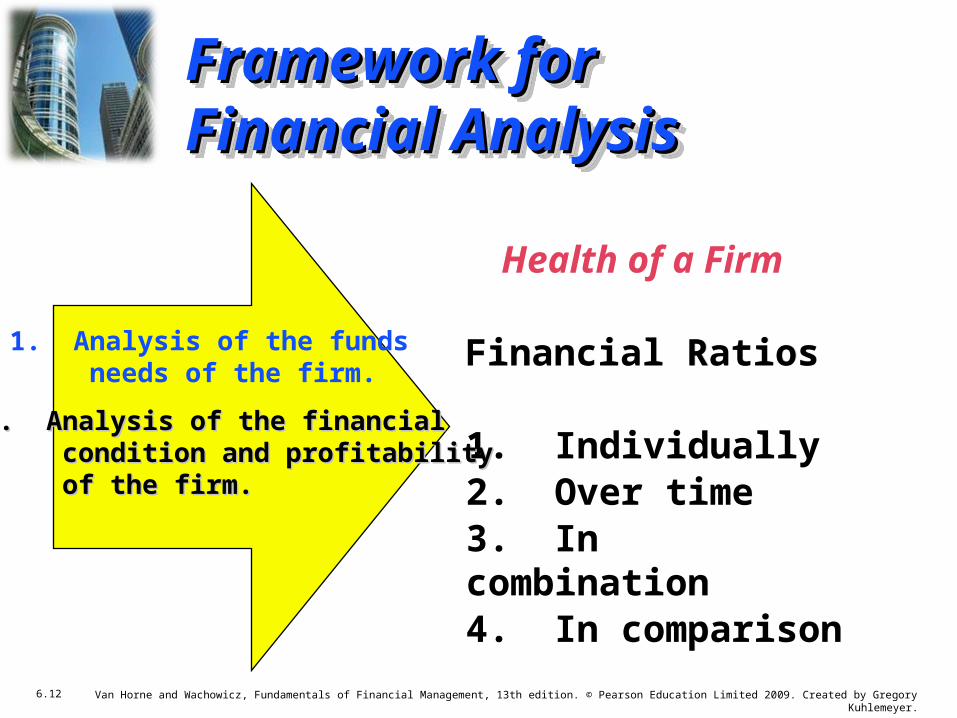
Health of a Firm
Financial Ratios
1. Individually2. Over time3. In combination4. In comparison
1. Analysis of the funds needs of the firm.
2. Analysis of the financial2. Analysis of the financial condition and profitabilitycondition and profitability of the firm.of the firm.
Framework for Framework for Financial AnalysisFinancial Analysis
6.13 Van Horne and Wachowicz, Fundamentals of Financial Management, 13th edition. © Pearson Education Limited 2009. Created by Gregory Kuhlemeyer.
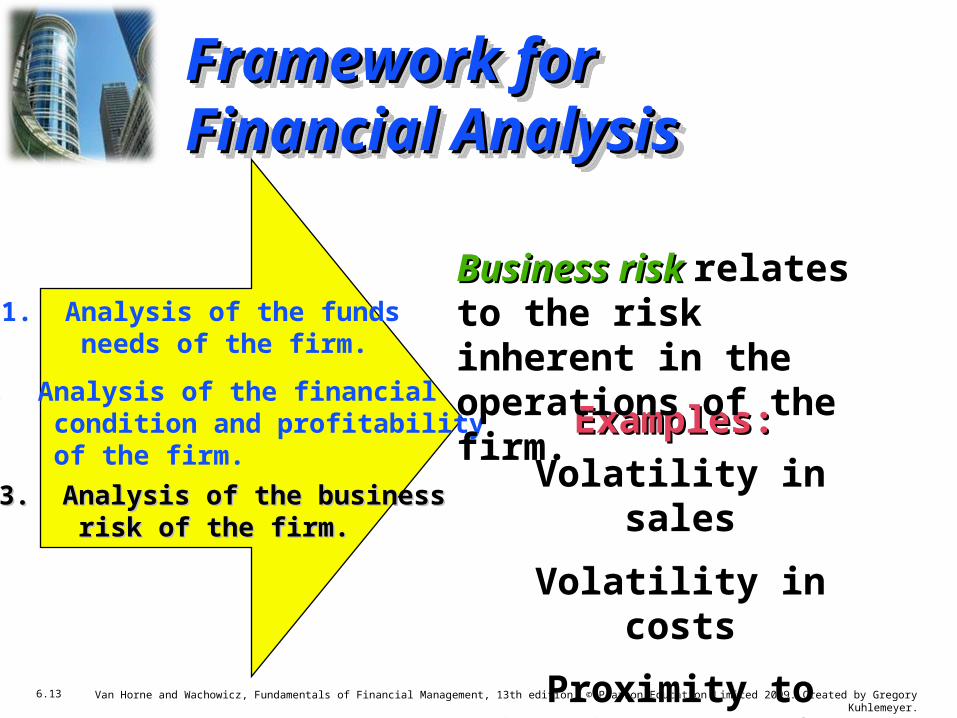
Examples:Examples:Volatility in salesVolatility in costs
Proximity to break-even point
1. Analysis of the funds needs of the firm.
2. Analysis of the financial condition and profitability of the firm.3. Analysis of the business3. Analysis of the business risk of the firm.risk of the firm.
Business risk Business risk relates to the risk inherent in the operations of the firm.
Framework for Framework for Financial AnalysisFinancial Analysis
6.14 Van Horne and Wachowicz, Fundamentals of Financial Management, 13th edition. © Pearson Education Limited 2009. Created by Gregory Kuhlemeyer.
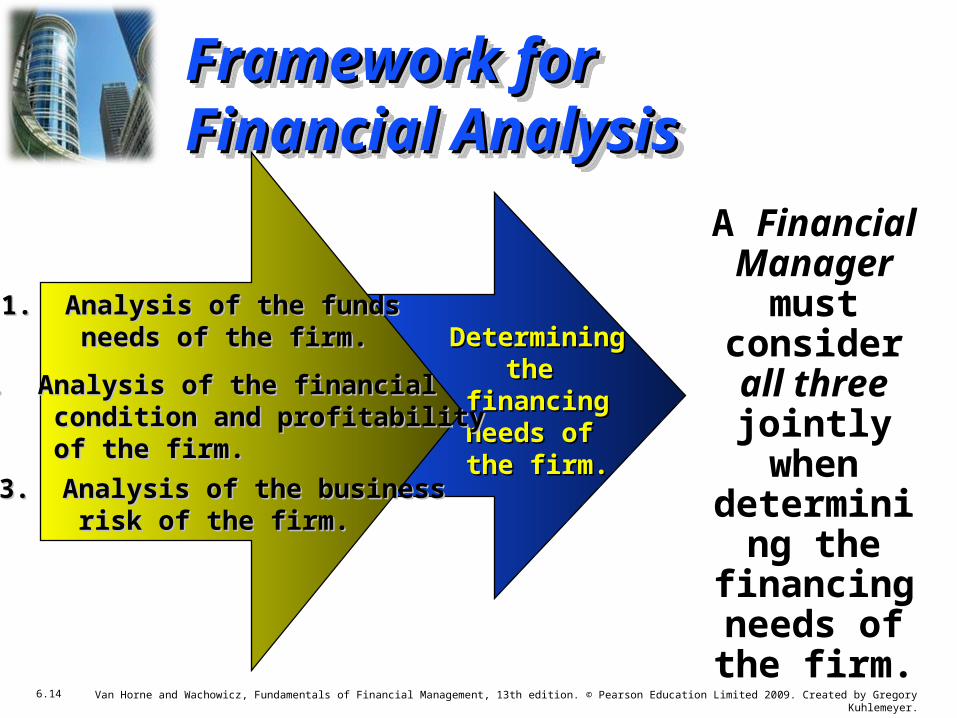
A Financial Manager
must consider all three jointly
when determining
the financing
needs of the firm.
DeterminingDeterminingthe the
financingfinancingneeds of needs of the firm.the firm.
1. Analysis of the funds1. Analysis of the funds needs of the firm.needs of the firm.
2. Analysis of the financial2. Analysis of the financial condition and profitabilitycondition and profitability of the firm.of the firm.3. Analysis of the business3. Analysis of the business risk of the firm.risk of the firm.
Framework for Framework for Financial AnalysisFinancial Analysis
6.15 Van Horne and Wachowicz, Fundamentals of Financial Management, 13th edition. © Pearson Education Limited 2009. Created by Gregory Kuhlemeyer.
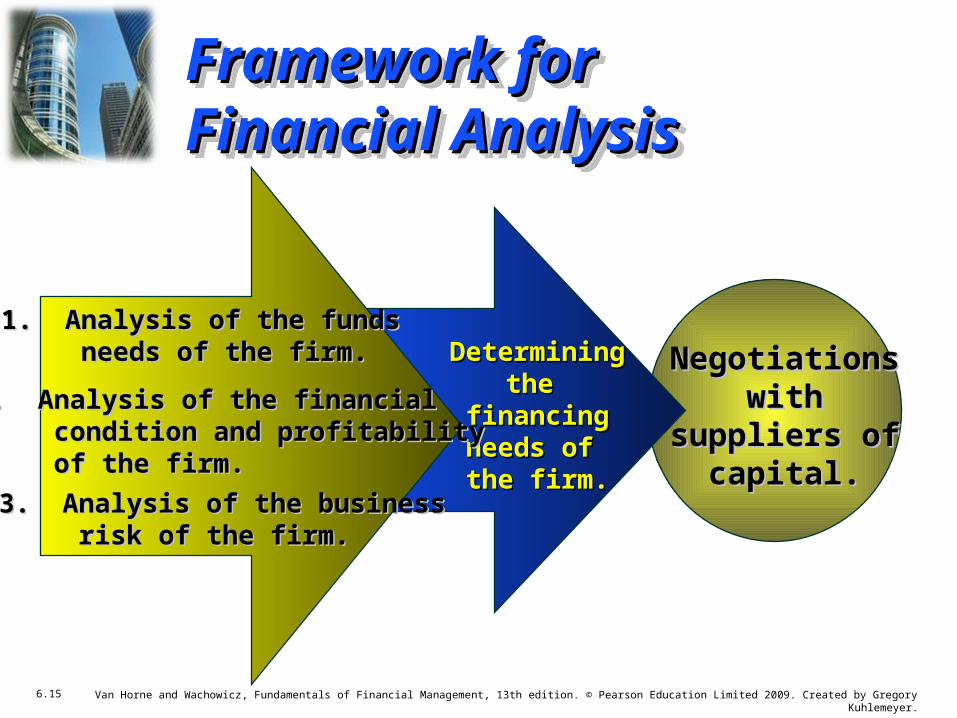
NegotiationsNegotiationswithwith
suppliers ofsuppliers ofcapital.capital.
DeterminingDeterminingthe the
financingfinancingneeds of needs of the firm.the firm.
1. Analysis of the funds1. Analysis of the funds needs of the firm.needs of the firm.
2. Analysis of the financial2. Analysis of the financial condition and profitabilitycondition and profitability of the firm.of the firm.3. Analysis of the business3. Analysis of the business risk of the firm.risk of the firm.
Framework for Framework for Financial AnalysisFinancial Analysis

6.16 Van Horne and Wachowicz, Fundamentals of Financial Management, 13th edition. © Pearson Education Limited 2009. Created by Gregory Kuhlemeyer.
Types of Types of ComparisonsComparisons
Internal Internal ComparisonsComparisons
External External ComparisonsComparisons
A Financial Ratio is an index that relates two accounting numbers and is
obtained by dividing one number by the
other.
Use of Financial RatiosUse of Financial Ratios
6.17 Van Horne and Wachowicz, Fundamentals of Financial Management, 13th edition. © Pearson Education Limited 2009. Created by Gregory Kuhlemeyer.
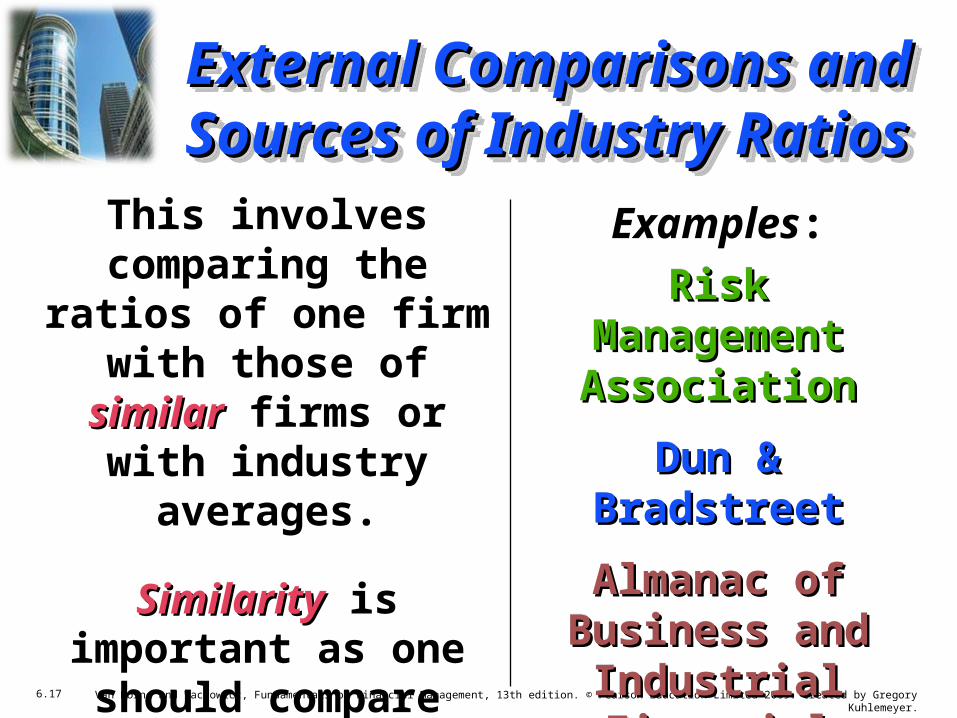
Examples:Risk Management Risk Management
AssociationAssociationDun & BradstreetDun & Bradstreet
Almanac of Almanac of Business and Business and
Industrial Industrial Financial RatiosFinancial Ratios
This involves comparing the ratios of one firm with those of similarsimilar firms or with
industry averages.
SimilaritySimilarity is important as one should
compare “apples to apples.”
External Comparisons and External Comparisons and Sources of Industry RatiosSources of Industry Ratios

6.18 Van Horne and Wachowicz, Fundamentals of Financial Management, 13th edition. © Pearson Education Limited 2009. Created by Gregory Kuhlemeyer.
CurrentCurrent
Current AssetsCurrent AssetsCurrent LiabilitiesCurrent Liabilities
For Basket Wonders December 31, 2007
Shows a firm’s ability to cover its current liabilities with its current
assets.
Balance Sheet Ratios
Liquidity Ratios
$1,195$1,195$500$500
= 2.392.39
Liquidity RatiosLiquidity Ratios

6.19 Van Horne and Wachowicz, Fundamentals of Financial Management, 13th edition. © Pearson Education Limited 2009. Created by Gregory Kuhlemeyer.
BW Industry2.39 2.152.26 2.091.91 2.01
Year200720062005
CurrentCurrent RatioRatio
Ratio is stronger than the industry average.
Liquidity Ratio Liquidity Ratio ComparisonsComparisons
6.20 Van Horne and Wachowicz, Fundamentals of Financial Management, 13th edition. © Pearson Education Limited 2009. Created by Gregory Kuhlemeyer.
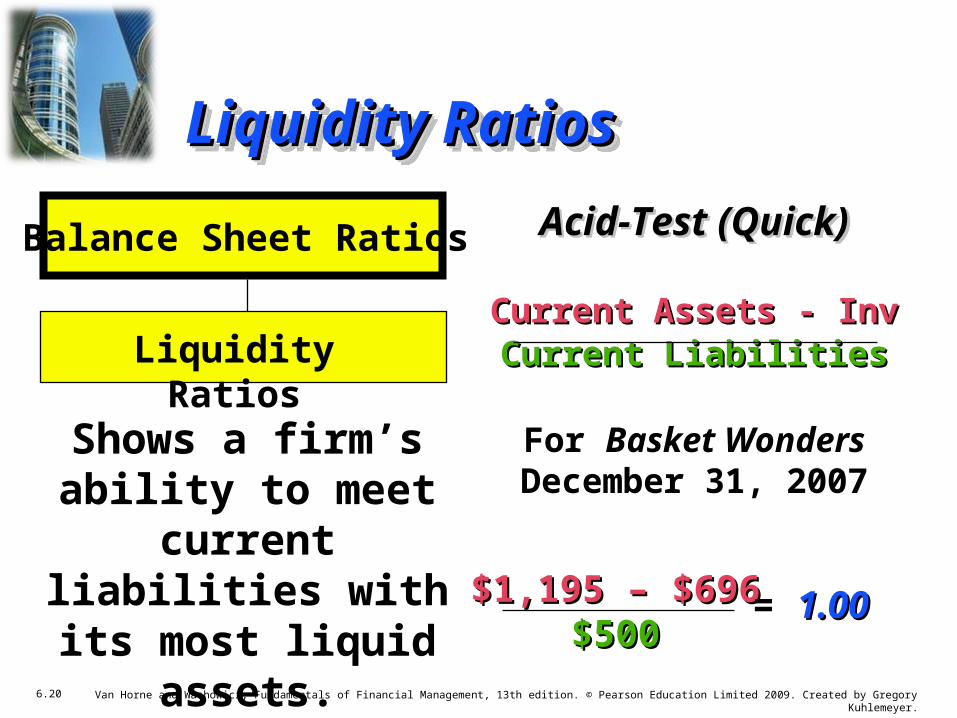
Acid-Test (Quick)Acid-Test (Quick)
Current Assets - InvCurrent Assets - InvCurrent LiabilitiesCurrent Liabilities
For Basket Wonders December 31, 2007
Shows a firm’s ability to meet
current liabilities with its most liquid
assets.
Balance Sheet Ratios
Liquidity Ratios
$1,195 – $696$1,195 – $696$500$500
= 1.001.00
Liquidity RatiosLiquidity Ratios

6.21 Van Horne and Wachowicz, Fundamentals of Financial Management, 13th edition. © Pearson Education Limited 2009. Created by Gregory Kuhlemeyer.
BW Industry1.00 1.251.04 1.231.11 1.25
Year200720062005
Acid-Test RatioAcid-Test Ratio
Ratio is weaker than the industry average.
Liquidity Ratio Liquidity Ratio ComparisonsComparisons

6.22 Van Horne and Wachowicz, Fundamentals of Financial Management, 13th edition. © Pearson Education Limited 2009. Created by Gregory Kuhlemeyer.
• Strong current ratio and weak acid-test ratio indicates a potential problem in the inventories account.
• Note that this industry has a relatively high level of inventories.
RatioRatio BWBW IndustryIndustryCurrent 2.39 2.15Acid-Test 1.00 1.25
Summary of the Liquidity Summary of the Liquidity Ratio ComparisonsRatio Comparisons
6.23 Van Horne and Wachowicz, Fundamentals of Financial Management, 13th edition. © Pearson Education Limited 2009. Created by Gregory Kuhlemeyer.
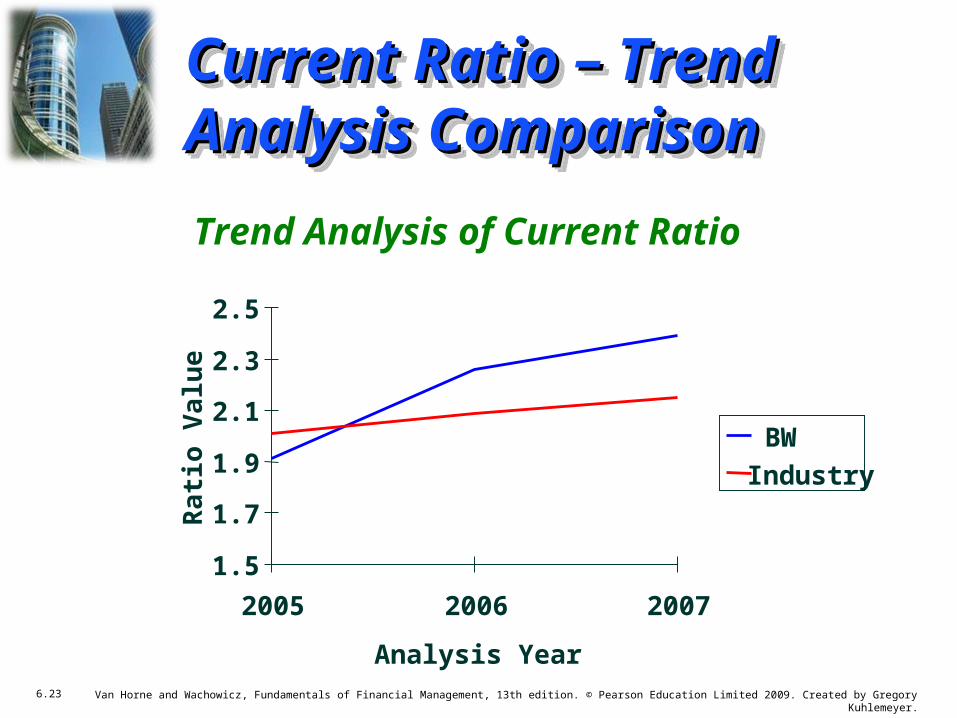
Trend Analysis of Current Ratio
1.5
1.7
1.9
2.1
2.3
2.5
2005 2006 2007
Analysis Year
Rat
io V
alue
BWIndustry
Current Ratio – Trend Current Ratio – Trend Analysis ComparisonAnalysis Comparison

6.24 Van Horne and Wachowicz, Fundamentals of Financial Management, 13th edition. © Pearson Education Limited 2009. Created by Gregory Kuhlemeyer.
Trend Analysis of Acid-Test Ratio
0.5
0.8
1.0
1.3
1.5
2005 2006 2007
Analysis Year
Rat
io V
alue
BWIndustry
Acid-Test Ratio – Trend Acid-Test Ratio – Trend Analysis ComparisonAnalysis Comparison

6.25 Van Horne and Wachowicz, Fundamentals of Financial Management, 13th edition. © Pearson Education Limited 2009. Created by Gregory Kuhlemeyer.
• The current ratio for the industryindustry has been rising slowly at the same time the acid-test ratio has been relatively stable.
• This indicates that inventoriesinventories are a significant problem for BWBW.
• The current ratio for BWBW has been rising at the same time the acid-test ratio has been declining.
Summary of the Liquidity Summary of the Liquidity Trend AnalysesTrend Analyses
6.26 Van Horne and Wachowicz, Fundamentals of Financial Management, 13th edition. © Pearson Education Limited 2009. Created by Gregory Kuhlemeyer.
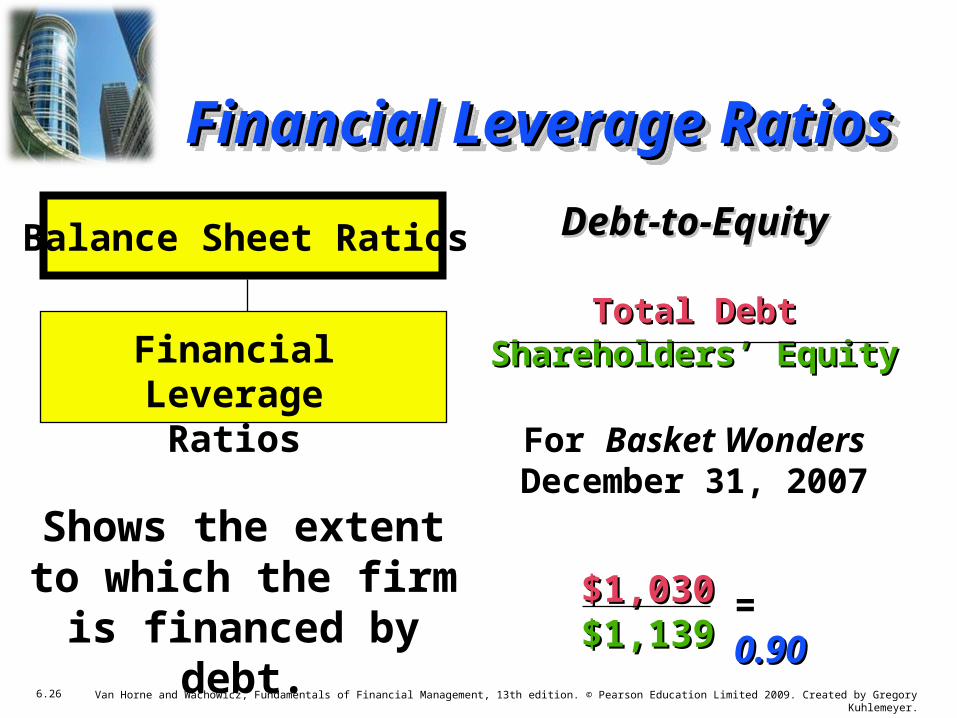
Debt-to-EquityDebt-to-Equity
Total DebtTotal DebtShareholders’ EquityShareholders’ Equity
For Basket Wonders December 31, 2007Shows the extent to
which the firm is financed by debt.
Balance Sheet Ratios
Financial LeverageRatios
$1,030$1,030$1,139$1,139
= 0.900.90
Financial Leverage RatiosFinancial Leverage Ratios
6.27 Van Horne and Wachowicz, Fundamentals of Financial Management, 13th edition. © Pearson Education Limited 2009. Created by Gregory Kuhlemeyer.
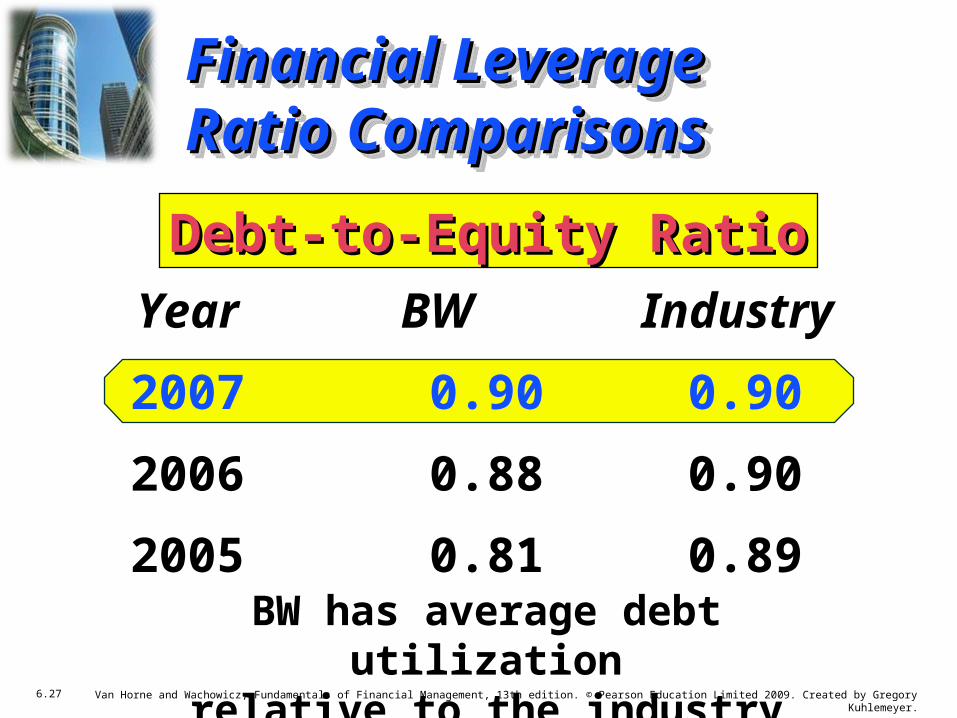
BW Industry 0.90 0.90 0.88 0.90 0.81 0.89
Year200720062005
Debt-to-Equity RatioDebt-to-Equity Ratio
BW has average debt utilizationrelative to the industry average.
Financial Leverage Financial Leverage Ratio ComparisonsRatio Comparisons
6.28 Van Horne and Wachowicz, Fundamentals of Financial Management, 13th edition. © Pearson Education Limited 2009. Created by Gregory Kuhlemeyer.
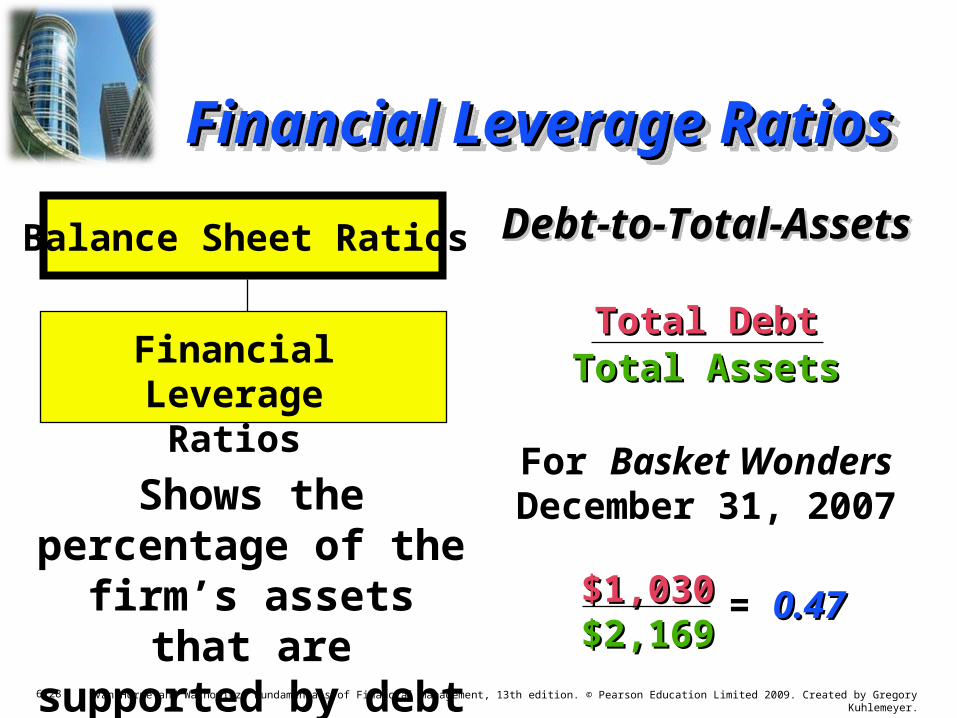
Debt-to-Total-AssetsDebt-to-Total-Assets
Total DebtTotal DebtTotal AssetsTotal Assets
For Basket Wonders December 31, 2007Shows the percentage
of the firm’s assets that are supported by
debt financing.
Balance Sheet Ratios
Financial LeverageRatios
$1,030$1,030$2,169$2,169
= 0.470.47
Financial Leverage RatiosFinancial Leverage Ratios
6.29 Van Horne and Wachowicz, Fundamentals of Financial Management, 13th edition. © Pearson Education Limited 2009. Created by Gregory Kuhlemeyer.
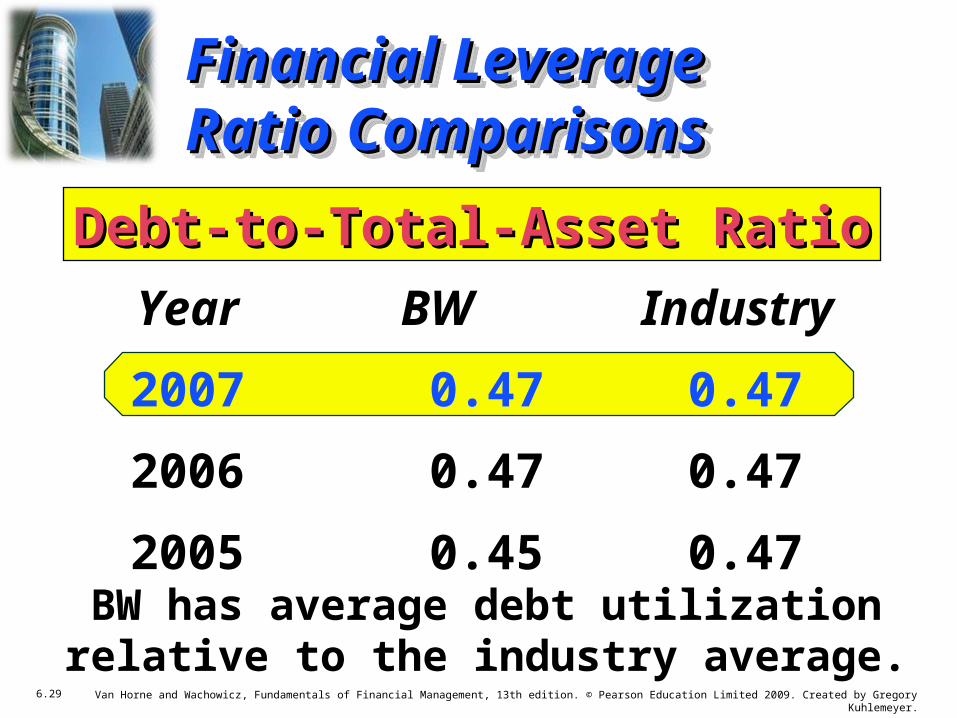
BW Industry 0.47 0.47 0.47 0.47 0.45 0.47
Year200720062005
Debt-to-Total-Asset RatioDebt-to-Total-Asset Ratio
BW has average debt utilizationrelative to the industry average.
Financial Leverage Financial Leverage Ratio ComparisonsRatio Comparisons
6.30 Van Horne and Wachowicz, Fundamentals of Financial Management, 13th edition. © Pearson Education Limited 2009. Created by Gregory Kuhlemeyer.
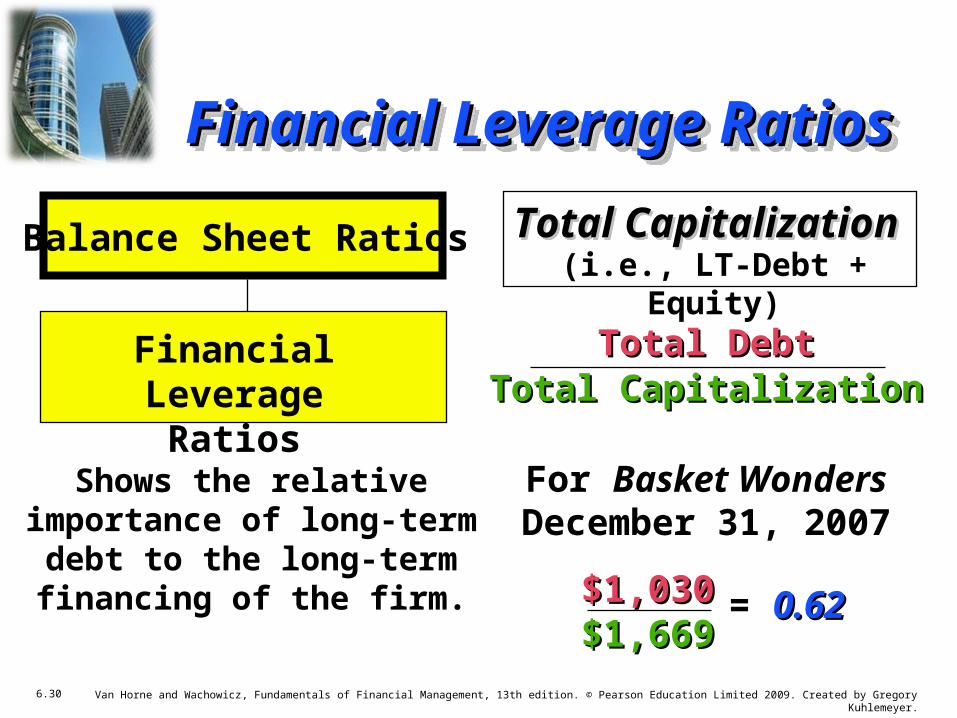
Total CapitalizationTotal Capitalization
Total DebtTotal DebtTotal CapitalizationTotal Capitalization
For Basket Wonders December 31, 2007
Shows the relative importance of long-term
debt to the long-term financing of the firm.
Balance Sheet Ratios
Financial LeverageRatios
$1,030$1,030$1,669$1,669
= 0.620.62
(i.e., LT-Debt + Equity)
Financial Leverage RatiosFinancial Leverage Ratios

6.31 Van Horne and Wachowicz, Fundamentals of Financial Management, 13th edition. © Pearson Education Limited 2009. Created by Gregory Kuhlemeyer.
BW Industry 0.62 0.60 0.62 0.61 0.67 0.62
Year200720062005
Total Capitalization RatioTotal Capitalization Ratio
BW has average long-term debt utilizationrelative to the industry average.
Financial Leverage Financial Leverage Ratio ComparisonsRatio Comparisons
6.32 Van Horne and Wachowicz, Fundamentals of Financial Management, 13th edition. © Pearson Education Limited 2009. Created by Gregory Kuhlemeyer.
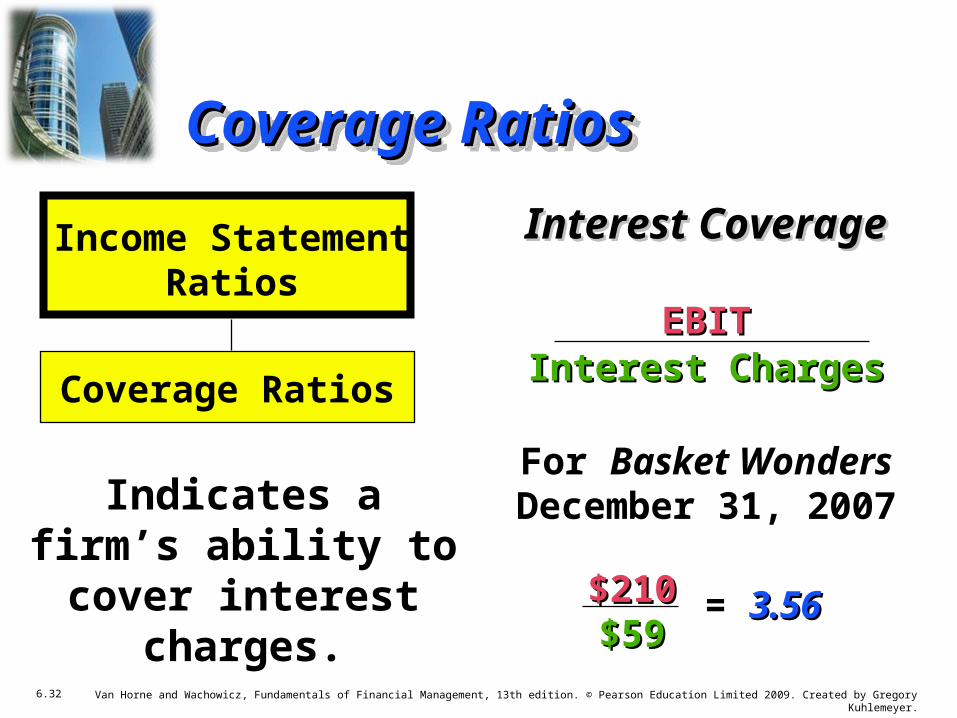
Interest CoverageInterest Coverage
EBITEBITInterest ChargesInterest Charges
For Basket Wonders December 31, 2007Indicates a firm’s
ability to cover interest charges.
Income StatementRatios
Coverage Ratios
$210$210$59$59
= 3.563.56
Coverage RatiosCoverage Ratios
6.33 Van Horne and Wachowicz, Fundamentals of Financial Management, 13th edition. © Pearson Education Limited 2009. Created by Gregory Kuhlemeyer.
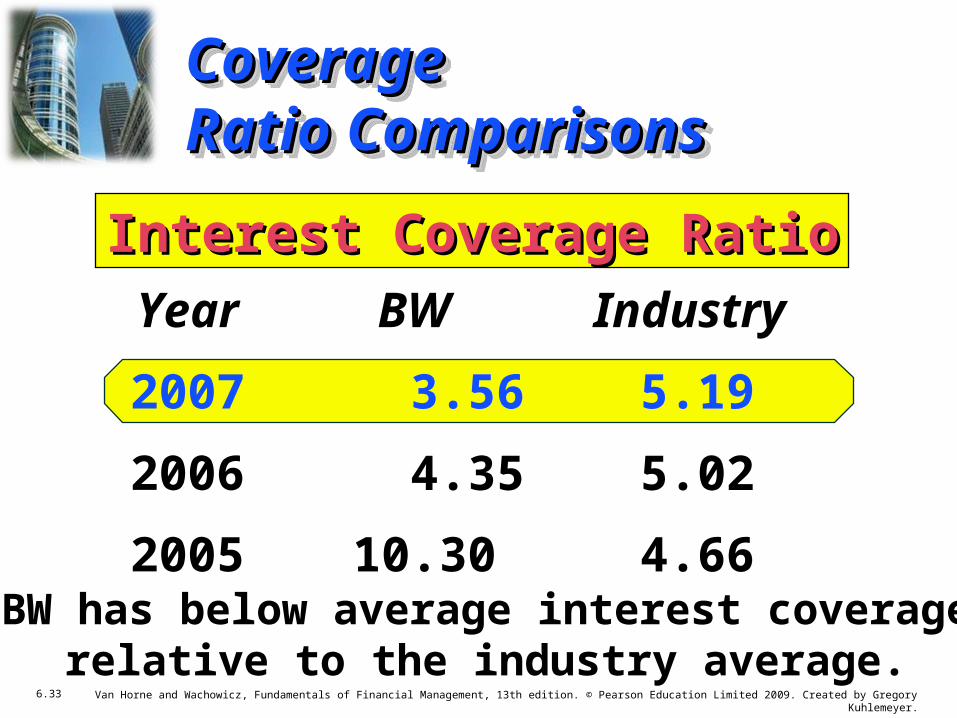
BW Industry 3.56 5.19 4.35 5.0210.30 4.66
Year200720062005
Interest Coverage RatioInterest Coverage Ratio
BW has below average interest coveragerelative to the industry average.
CoverageCoverageRatio ComparisonsRatio Comparisons
6.34 Van Horne and Wachowicz, Fundamentals of Financial Management, 13th edition. © Pearson Education Limited 2009. Created by Gregory Kuhlemeyer.
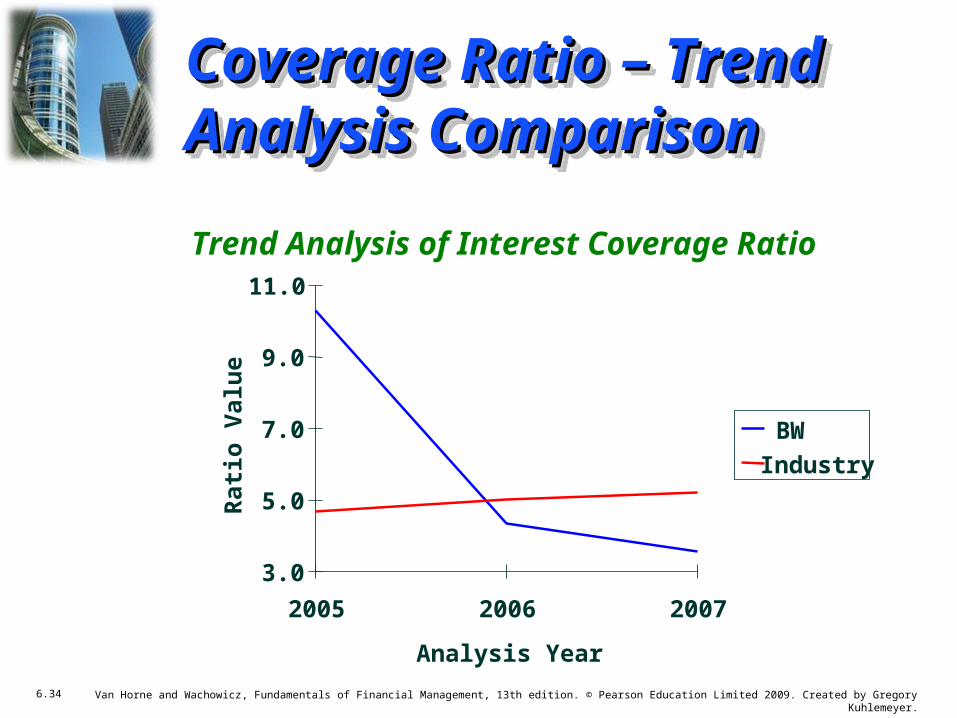
Trend Analysis of Interest Coverage Ratio
3.0
5.0
7.0
9.0
11.0
2005 2006 2007
Analysis Year
Rat
io V
alue
BWIndustry
Coverage Ratio – Trend Coverage Ratio – Trend Analysis ComparisonAnalysis Comparison

6.35 Van Horne and Wachowicz, Fundamentals of Financial Management, 13th edition. © Pearson Education Limited 2009. Created by Gregory Kuhlemeyer.
• This indicates that low earnings low earnings (EBIT) may be a potential problem for BWBW.
• Note, we know that debt levels debt levels are in line with the industryindustry averages.
• The interest coverage ratio for BWBW has been falling since 2005. It has been below industryindustry averages for the past two years.
Summary of the Coverage Summary of the Coverage Trend AnalysisTrend Analysis

6.36 Van Horne and Wachowicz, Fundamentals of Financial Management, 13th edition. © Pearson Education Limited 2009. Created by Gregory Kuhlemeyer.
Receivable TurnoverReceivable Turnover
Annual Net Credit SalesAnnual Net Credit SalesReceivablesReceivables
For Basket Wonders December 31, 2007Indicates quality of
receivables and how successful the firm is in
its collections.
Income Statement/Balance Sheet
Ratios
Activity Ratios
$2,211$2,211$394$394
= 5.615.61
(Assume all sales are credit sales.)
Activity RatiosActivity Ratios
6.37 Van Horne and Wachowicz, Fundamentals of Financial Management, 13th edition. © Pearson Education Limited 2009. Created by Gregory Kuhlemeyer.
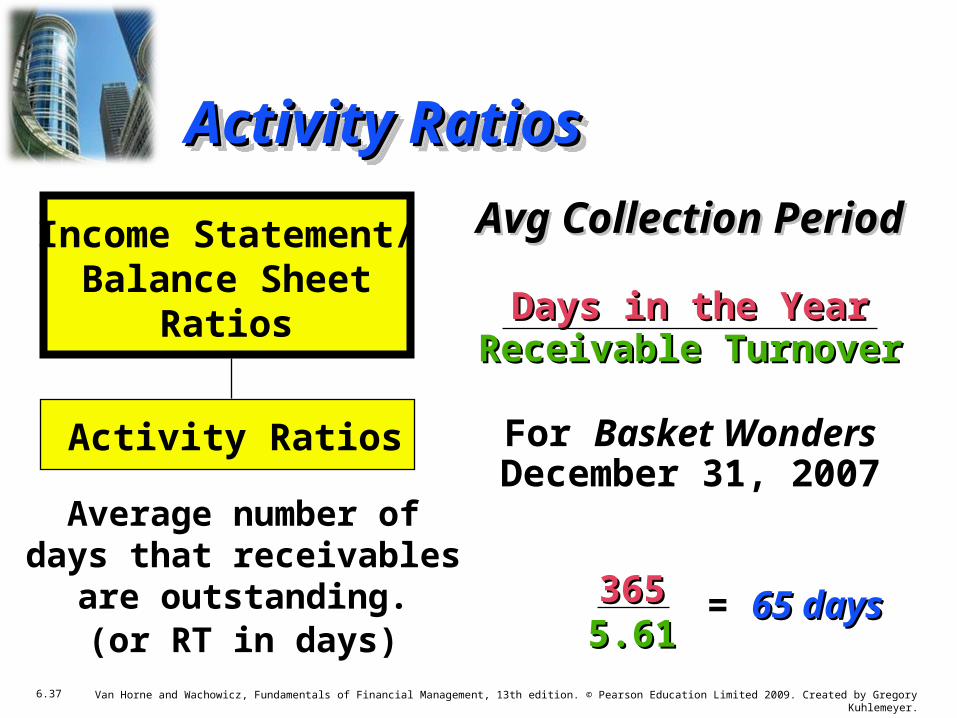
Avg Collection PeriodAvg Collection Period
Days in the YearDays in the YearReceivable TurnoverReceivable Turnover
For Basket Wonders December 31, 2007
Average number of days that receivables are
outstanding.(or RT in days)
Income Statement/Balance Sheet
Ratios
Activity Ratios
3653655.615.61
= 65 days65 days
Activity RatiosActivity Ratios
6.38 Van Horne and Wachowicz, Fundamentals of Financial Management, 13th edition. © Pearson Education Limited 2009. Created by Gregory Kuhlemeyer.
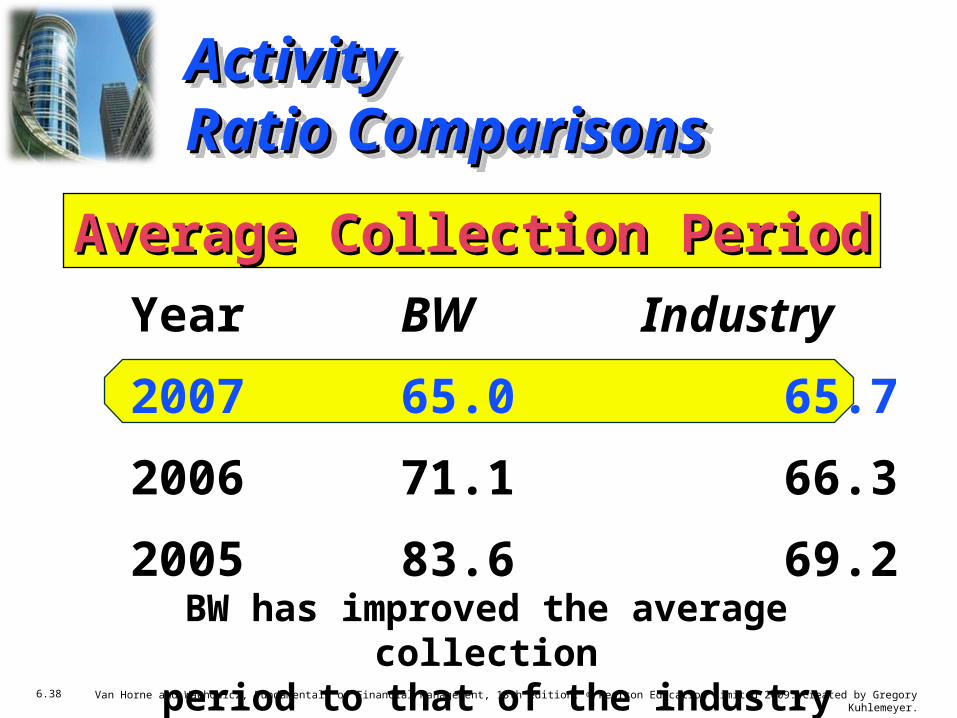
BW Industry65.0 65.771.1 66.383.6 69.2
Year200720062005
Average Collection PeriodAverage Collection Period
BW has improved the average collection period to that of the industry average.
ActivityActivityRatio ComparisonsRatio Comparisons

6.39 Van Horne and Wachowicz, Fundamentals of Financial Management, 13th edition. © Pearson Education Limited 2009. Created by Gregory Kuhlemeyer.
Payable Turnover (PT)Payable Turnover (PT)
Annual Credit PurchasesAnnual Credit PurchasesAccounts PayableAccounts Payable
For Basket Wonders December 31, 2007
Indicates the promptness of payment to suppliers by the firm.
Income Statement/Balance Sheet
Ratios
Activity Ratios
$1551$1551$94$94 = 16.516.5
(Assume annual credit purchases = $1,551.)
Activity RatiosActivity Ratios

6.40 Van Horne and Wachowicz, Fundamentals of Financial Management, 13th edition. © Pearson Education Limited 2009. Created by Gregory Kuhlemeyer.
PT in DaysPT in Days
Days in the YearDays in the YearPayable TurnoverPayable Turnover
For Basket Wonders December 31, 2007Average number of days
that payables are outstanding.
Income Statement/Balance Sheet
Ratios
Activity Ratios
36536516.516.5
= 22.1 days22.1 days
Activity RatiosActivity Ratios

6.41 Van Horne and Wachowicz, Fundamentals of Financial Management, 13th edition. © Pearson Education Limited 2009. Created by Gregory Kuhlemeyer.
BW Industry22.1 46.725.4 51.143.5 48.5
Year200720062005
Payable Turnover in DaysPayable Turnover in Days
BW has improved the PT in Days.Is this good?Is this good?
ActivityActivityRatio ComparisonsRatio Comparisons
6.42 Van Horne and Wachowicz, Fundamentals of Financial Management, 13th edition. © Pearson Education Limited 2009. Created by Gregory Kuhlemeyer.
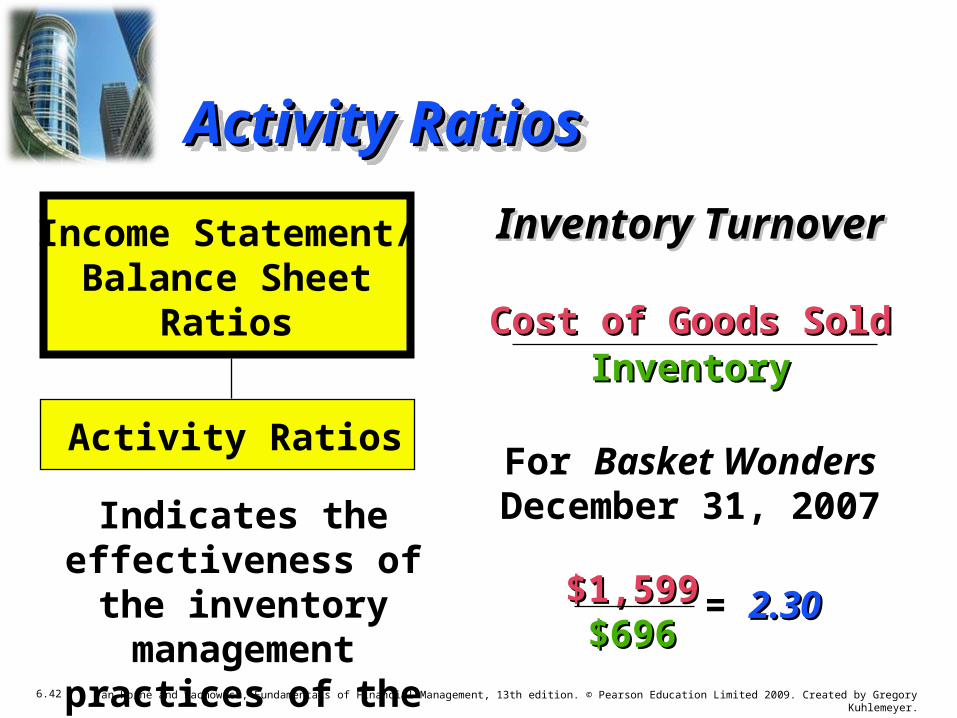
Inventory TurnoverInventory Turnover
Cost of Goods SoldCost of Goods SoldInventoryInventory
For Basket Wonders December 31, 2007Indicates the
effectiveness of the inventory management practices of the firm.
Income Statement/Balance Sheet
Ratios
Activity Ratios
$1,599$1,599$696$696
= 2.302.30
Activity RatiosActivity Ratios

6.43 Van Horne and Wachowicz, Fundamentals of Financial Management, 13th edition. © Pearson Education Limited 2009. Created by Gregory Kuhlemeyer.
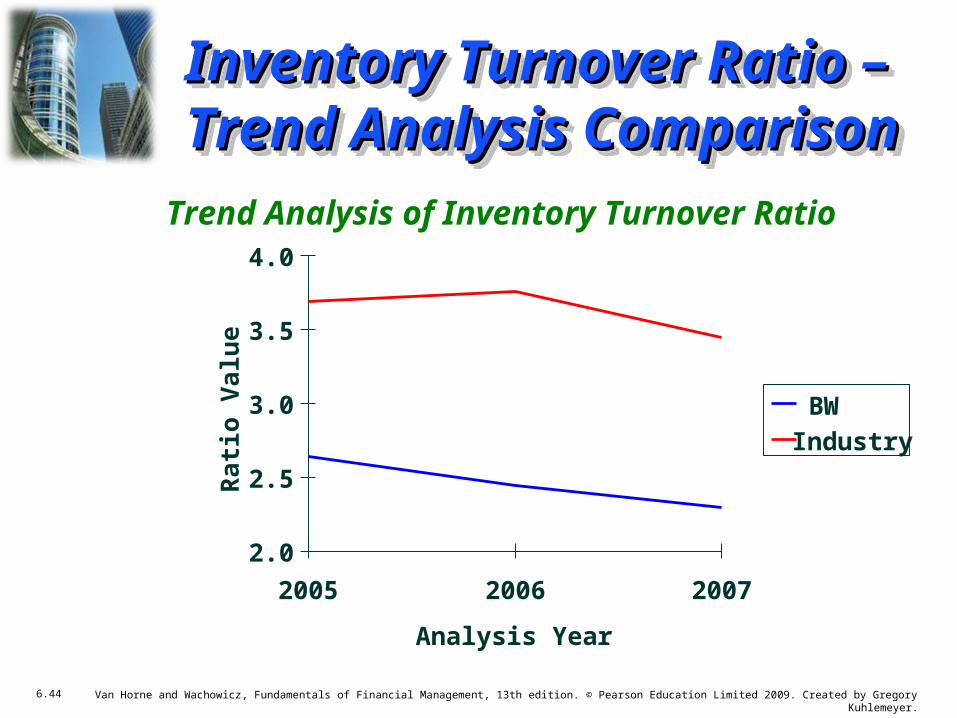
BW Industry2.30 3.452.44 3.762.64 3.69
Year200720062005
Inventory Turnover RatioInventory Turnover Ratio
BW has a very poor inventory turnover ratio.
ActivityActivityRatio ComparisonsRatio Comparisons
6.44 Van Horne and Wachowicz, Fundamentals of Financial Management, 13th edition. © Pearson Education Limited 2009. Created by Gregory Kuhlemeyer.
Trend Analysis of Inventory Turnover Ratio
2.0
2.5
3.0
3.5
4.0
2005 2006 2007
Analysis Year
Rat
io V
alue
BWIndustry
Inventory Turnover Ratio –Inventory Turnover Ratio –Trend Analysis ComparisonTrend Analysis Comparison

6.45 Van Horne and Wachowicz, Fundamentals of Financial Management, 13th edition. © Pearson Education Limited 2009. Created by Gregory Kuhlemeyer.
Total Asset TurnoverTotal Asset Turnover
Net SalesNet SalesTotal AssetsTotal Assets
For Basket Wonders December 31, 2007Indicates the overall
effectiveness of the firm in utilizing its assets to
generate sales.
Income Statement/Balance Sheet
Ratios
Activity Ratios
$2,211$2,211$2,169$2,169
= 1.021.02
Activity RatiosActivity Ratios

6.46 Van Horne and Wachowicz, Fundamentals of Financial Management, 13th edition. © Pearson Education Limited 2009. Created by Gregory Kuhlemeyer.
BW Industry1.02 1.171.03 1.141.01 1.13
Year200720062005
Total Asset Turnover RatioTotal Asset Turnover Ratio
BW has a weak total asset turnover ratio.Why is this ratio considered weak?Why is this ratio considered weak?
ActivityActivityRatio ComparisonsRatio Comparisons

6.47 Van Horne and Wachowicz, Fundamentals of Financial Management, 13th edition. © Pearson Education Limited 2009. Created by Gregory Kuhlemeyer.
Gross Profit MarginGross Profit Margin
Gross ProfitGross ProfitNet SalesNet Sales
For Basket Wonders December 31, 2007Indicates the efficiency
of operations and firm pricing policies.
Income Statement/Balance Sheet
Ratios
Profitability Ratios
$612$612$2,211$2,211
= 0.2770.277
Profitability RatiosProfitability Ratios

6.48 Van Horne and Wachowicz, Fundamentals of Financial Management, 13th edition. © Pearson Education Limited 2009. Created by Gregory Kuhlemeyer.
BW Industry27.7% 31.1%28.7 30.831.3 27.6
Year200720062005
Gross Profit MarginGross Profit Margin
BW has a weak Gross Profit Margin.
ProfitabilityProfitabilityRatio ComparisonsRatio Comparisons

6.49 Van Horne and Wachowicz, Fundamentals of Financial Management, 13th edition. © Pearson Education Limited 2009. Created by Gregory Kuhlemeyer.
Trend Analysis of Gross Profit Margin
25.0
27.5
30.0
32.5
35.0
2005 2006 2007
Analysis Year
Rat
io V
alue
(%)
BWIndustry
Gross Profit Margin –Gross Profit Margin –Trend Analysis ComparisonTrend Analysis Comparison
6.50 Van Horne and Wachowicz, Fundamentals of Financial Management, 13th edition. © Pearson Education Limited 2009. Created by Gregory Kuhlemeyer.
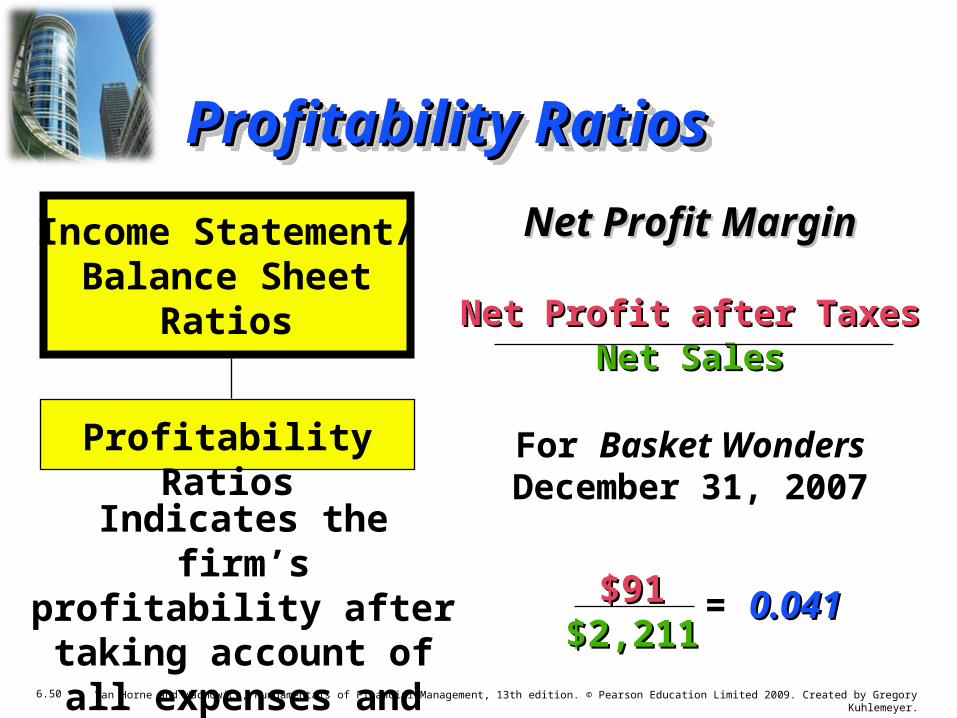
Net Profit MarginNet Profit Margin
Net Profit after TaxesNet Profit after TaxesNet SalesNet Sales
For Basket Wonders December 31, 2007Indicates the firm’s
profitability after taking account of all expenses
and income taxes.
Income Statement/Balance Sheet
Ratios
Profitability Ratios
$91$91$2,211$2,211
= 0.0410.041
Profitability RatiosProfitability Ratios
6.51 Van Horne and Wachowicz, Fundamentals of Financial Management, 13th edition. © Pearson Education Limited 2009. Created by Gregory Kuhlemeyer.
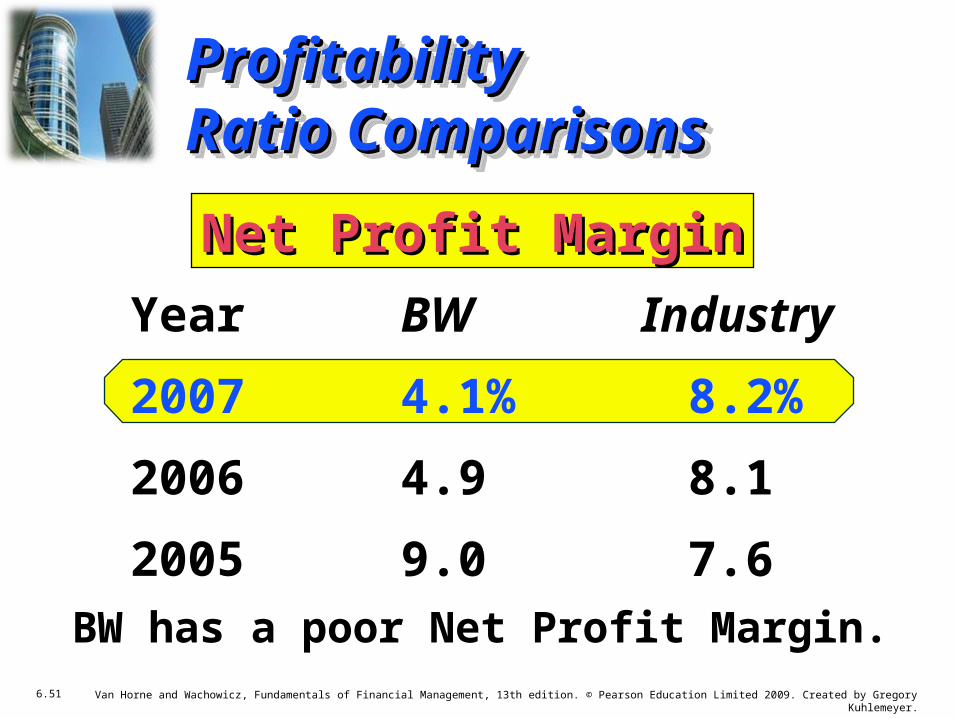
BW Industry4.1% 8.2%4.9 8.19.0 7.6
Year200720062005
Net Profit MarginNet Profit Margin
BW has a poor Net Profit Margin.
ProfitabilityProfitability Ratio ComparisonsRatio Comparisons

6.52 Van Horne and Wachowicz, Fundamentals of Financial Management, 13th edition. © Pearson Education Limited 2009. Created by Gregory Kuhlemeyer.
Trend Analysis of Net Profit Margin
4
5
6
7
8
9
10
2005 2006 2007
Analysis Year
Rat
io V
alue
(%)
BWIndustry
Net Profit Margin –Net Profit Margin –Trend Analysis ComparisonTrend Analysis Comparison

6.53 Van Horne and Wachowicz, Fundamentals of Financial Management, 13th edition. © Pearson Education Limited 2009. Created by Gregory Kuhlemeyer.
Return on InvestmentReturn on Investment
Net Profit after TaxesNet Profit after TaxesTotal AssetsTotal Assets
For Basket Wonders December 31, 2007Indicates the
profitability on the assets of the firm (after all expenses and taxes).
Income Statement/Balance Sheet
Ratios
Profitability Ratios
$91$91$2,160$2,160
= 0.0420.042
Profitability RatiosProfitability Ratios

6.54 Van Horne and Wachowicz, Fundamentals of Financial Management, 13th edition. © Pearson Education Limited 2009. Created by Gregory Kuhlemeyer.
BW Industry4.2% 9.6%5.0 9.19.1 10.8
Year200720062005
Return on InvestmentReturn on Investment
BW has a poor Return on Investment.
ProfitabilityProfitability Ratio ComparisonsRatio Comparisons

6.55 Van Horne and Wachowicz, Fundamentals of Financial Management, 13th edition. © Pearson Education Limited 2009. Created by Gregory Kuhlemeyer.
Trend Analysis of Return on Investment
4
6
8
10
12
2005 2006 2007
Analysis Year
Rat
io V
alue
(%)
BWIndustry
Return on Investment –Return on Investment –Trend Analysis ComparisonTrend Analysis Comparison
6.56 Van Horne and Wachowicz, Fundamentals of Financial Management, 13th edition. © Pearson Education Limited 2009. Created by Gregory Kuhlemeyer.
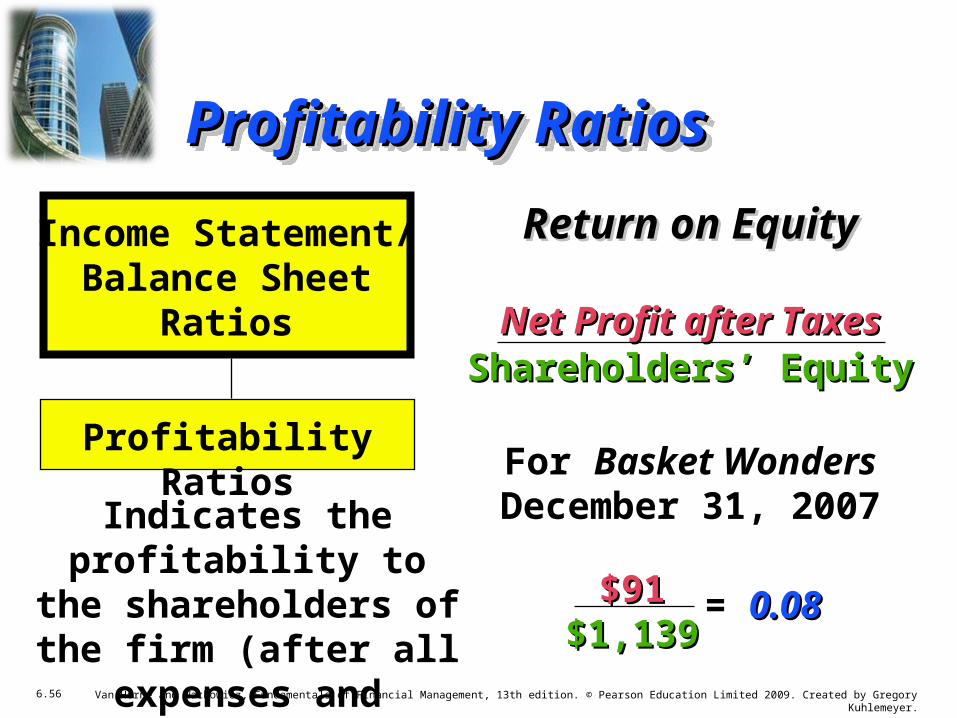
Return on EquityReturn on Equity
Net Profit after TaxesNet Profit after TaxesShareholders’ EquityShareholders’ Equity
For Basket Wonders December 31, 2007Indicates the profitability
to the shareholders of the firm (after all
expenses and taxes).
Income Statement/Balance Sheet
Ratios
Profitability Ratios
$91$91$1,139$1,139
= 0.080.08
Profitability RatiosProfitability Ratios
6.57 Van Horne and Wachowicz, Fundamentals of Financial Management, 13th edition. © Pearson Education Limited 2009. Created by Gregory Kuhlemeyer.
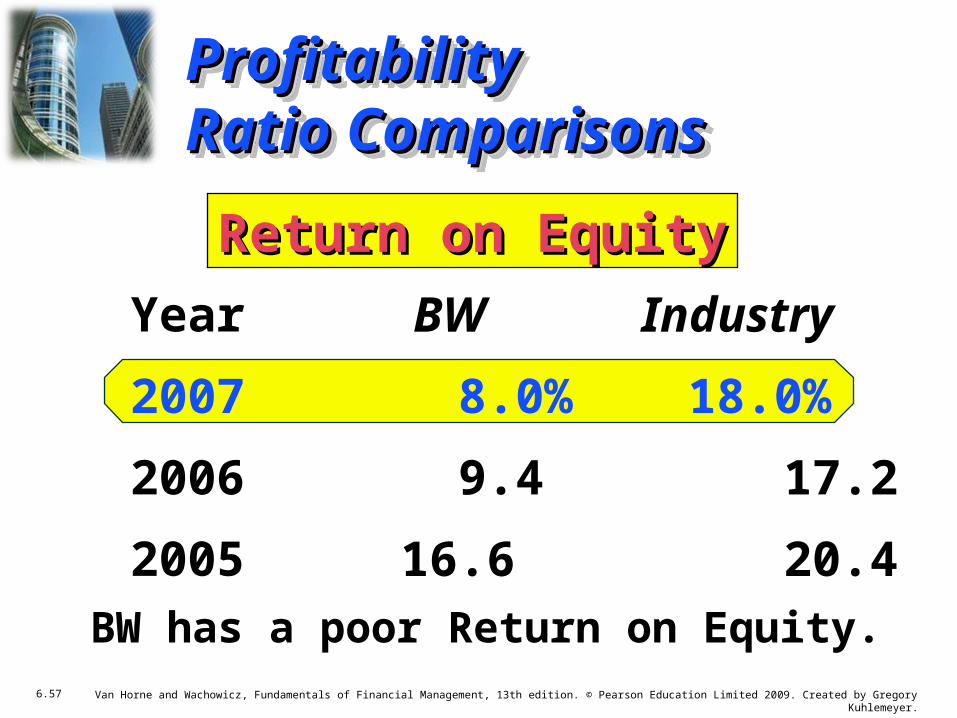
BW Industry 8.0% 18.0% 9.4 17.216.6 20.4
Year200720062005
Return on EquityReturn on Equity
BW has a poor Return on Equity.
ProfitabilityProfitability Ratio ComparisonsRatio Comparisons
6.58 Van Horne and Wachowicz, Fundamentals of Financial Management, 13th edition. © Pearson Education Limited 2009. Created by Gregory Kuhlemeyer.
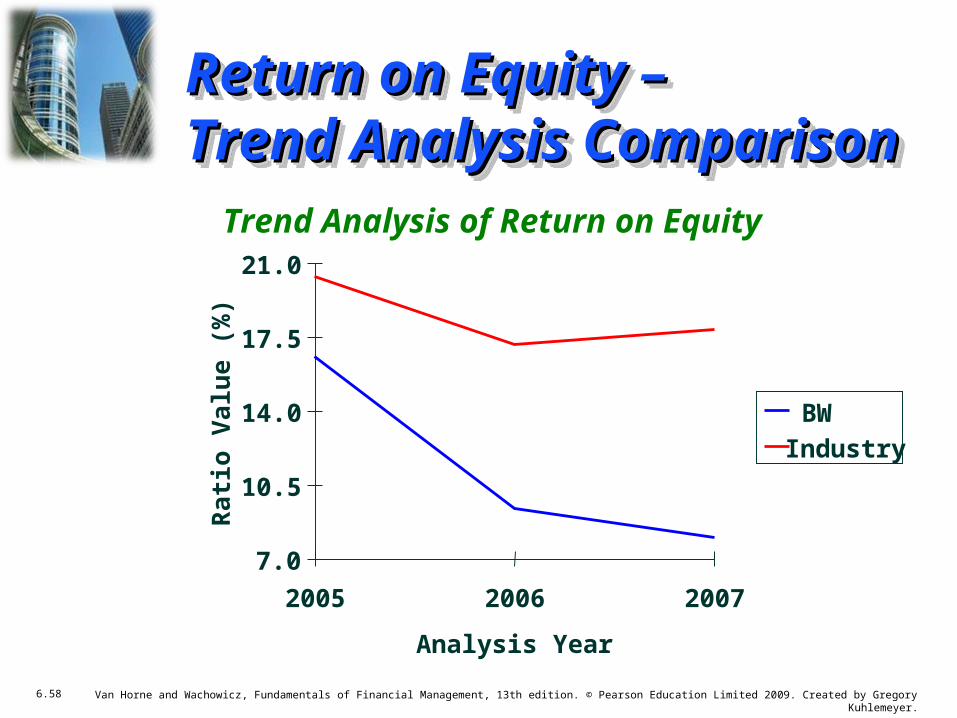
Trend Analysis of Return on Equity
7.0
10.5
14.0
17.5
21.0
2005 2006 2007
Analysis Year
Rat
io V
alue
(%)
BWIndustry
Return on Equity –Return on Equity –Trend Analysis ComparisonTrend Analysis Comparison

6.59 Van Horne and Wachowicz, Fundamentals of Financial Management, 13th edition. © Pearson Education Limited 2009. Created by Gregory Kuhlemeyer.
ROIROI2007 = 0.041 × 1.02 = 0.0420.042 or 4.2%4.2%
ROIROIIndustry = 0.082 × 1.17 = 0.0960.096 or 9.6%9.6%(Note: values are rounded)(Note: values are rounded)
ROI ROI = Net profit margin × Total asset turnover
Earning Power Earning Power = Sales profitability × Asset efficiency
Return on Investment and Return on Investment and the Du Pont Approachthe Du Pont Approach
6.60 Van Horne and Wachowicz, Fundamentals of Financial Management, 13th edition. © Pearson Education Limited 2009. Created by Gregory Kuhlemeyer.
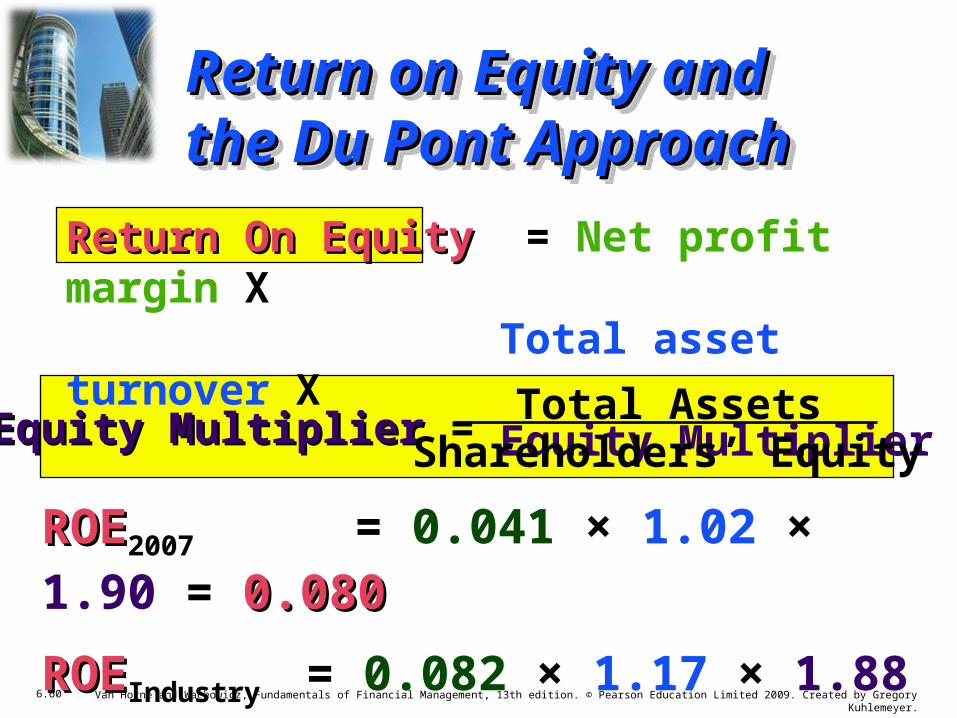
ROEROE2007 = 0.041 × 1.02 × 1.90 = 0.0800.080
ROEROEIndustry = 0.082 × 1.17 × 1.88 = 0.1800.180(Note: values are rounded)(Note: values are rounded)
Return On Equity Return On Equity = Net profit margin X Total asset turnover X
Equity Multiplier
Equity Multiplier Equity Multiplier = Total AssetsShareholders’ Equity
Return on Equity and Return on Equity and the Du Pont Approachthe Du Pont Approach

6.61 Van Horne and Wachowicz, Fundamentals of Financial Management, 13th edition. © Pearson Education Limited 2009. Created by Gregory Kuhlemeyer.
• The profitability ratios for BWBW have ALL been falling since 2005. Each has been below the industryindustry averages for the past three years.
• This indicates that COGSCOGS and administrative costsadministrative costs may both be too high and a potential problem for BWBW.
• Note, this result is consistent with the low interest coverage ratio.
Summary of the Profitability Summary of the Profitability Trend AnalysesTrend Analyses
6.62 Van Horne and Wachowicz, Fundamentals of Financial Management, 13th edition. © Pearson Education Limited 2009. Created by Gregory Kuhlemeyer.
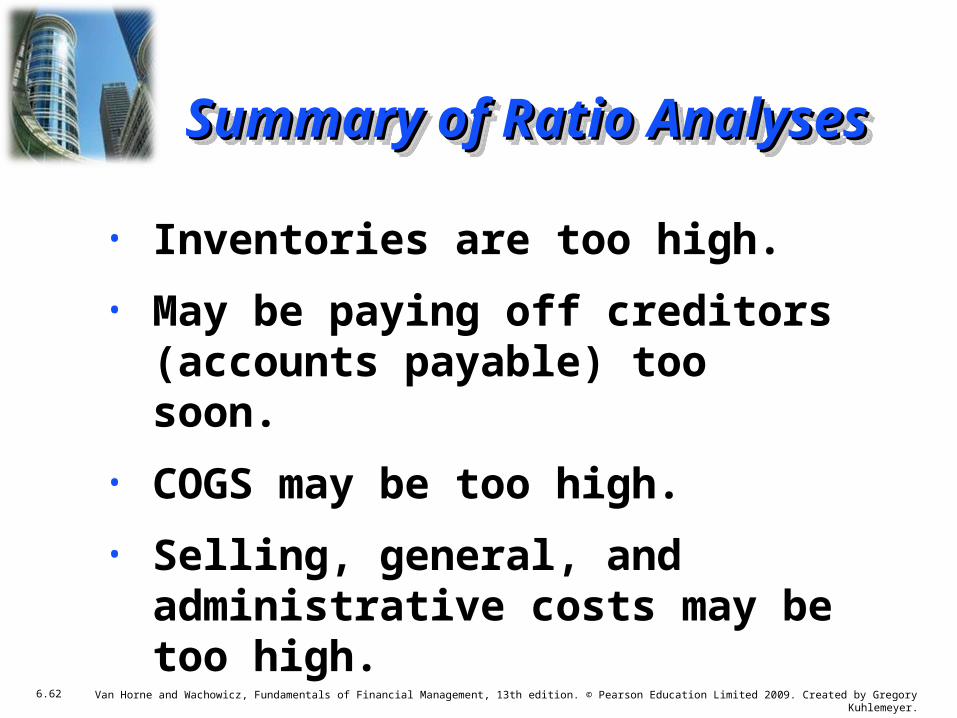
• Inventories are too high.• May be paying off creditors
(accounts payable) too soon.• COGS may be too high.• Selling, general, and
administrative costs may be too high.
Summary of Ratio AnalysesSummary of Ratio Analyses

6.63 Van Horne and Wachowicz, Fundamentals of Financial Management, 13th edition. © Pearson Education Limited 2009. Created by Gregory Kuhlemeyer.
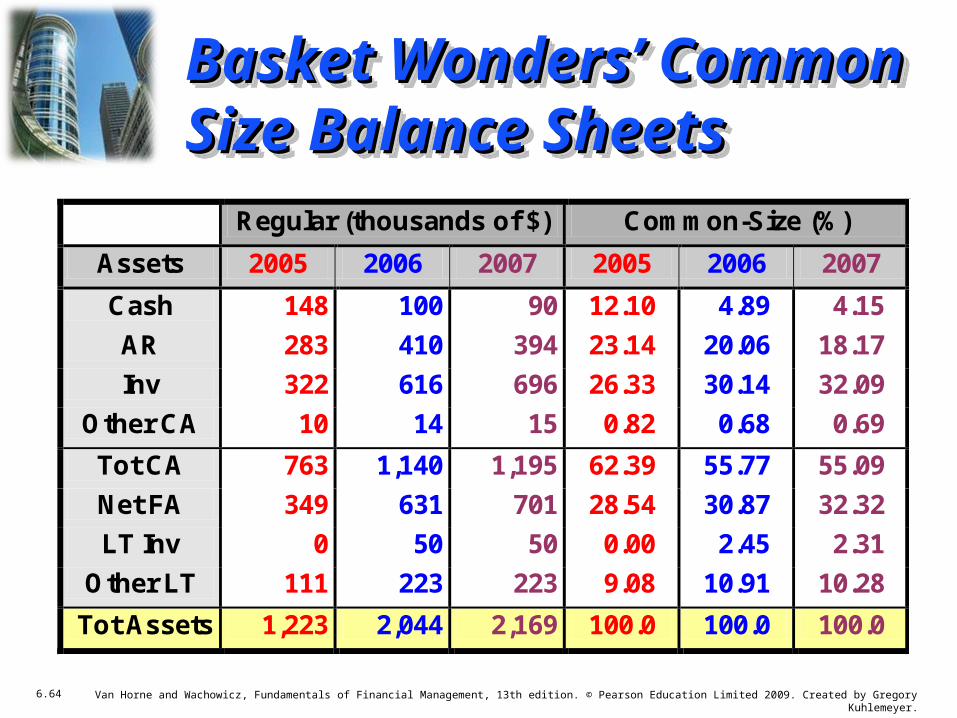
An analysis of percentage financial statements where all
balance sheet items are divided by total assets and all income statement items are divided by
net sales or revenues.
Common-Size AnalysisCommon-Size Analysis
6.64 Van Horne and Wachowicz, Fundamentals of Financial Management, 13th edition. © Pearson Education Limited 2009. Created by Gregory Kuhlemeyer.
Regular (thousands of $) Common-Size (%) Assets 2005 2006 2007 2005 2006 2007 Cash 148 100 90 12.10 4.89 4.15 AR 283 410 394 23.14 20.06 18.17 Inv 322 616 696 26.33 30.14 32.09
Other CA 10 14 15 0.82 0.68 0.69 Tot CA 763 1,140 1,195 62.39 55.77 55.09 Net FA 349 631 701 28.54 30.87 32.32 LT Inv 0 50 50 0.00 2.45 2.31
Other LT 111 223 223 9.08 10.91 10.28 Tot Assets 1,223 2,044 2,169 100.0 100.0 100.0
Basket Wonders’ Common Basket Wonders’ Common Size Balance SheetsSize Balance Sheets

6.65 Van Horne and Wachowicz, Fundamentals of Financial Management, 13th edition. © Pearson Education Limited 2009. Created by Gregory Kuhlemeyer.
Regular (thousands of $) Common-Size (%) Liab+Equity 2005 2006 2007 2005 2006 2007
Note Pay 290 295 290 23.71 14.43 13.37 Acct Pay 81 94 94 6.62 4.60 4.33 Accr Tax 13 16 16 1.06 0.78 0.74
Other Accr 15 100 100 1.23 4.89 4.61 Tot CL 399 505 500 32.62 24.71 23.05
LT Debt 150 453 530 12.26 22.16 24.44 Equity 674 1,086 1,139 55.11 53.13 52.51
Tot L+E 1,223 2,044 2,169 100.0 100.0 100.0
Basket Wonders’ Common- Basket Wonders’ Common- Size Balance SheetsSize Balance Sheets
6.66 Van Horne and Wachowicz, Fundamentals of Financial Management, 13th edition. © Pearson Education Limited 2009. Created by Gregory Kuhlemeyer.
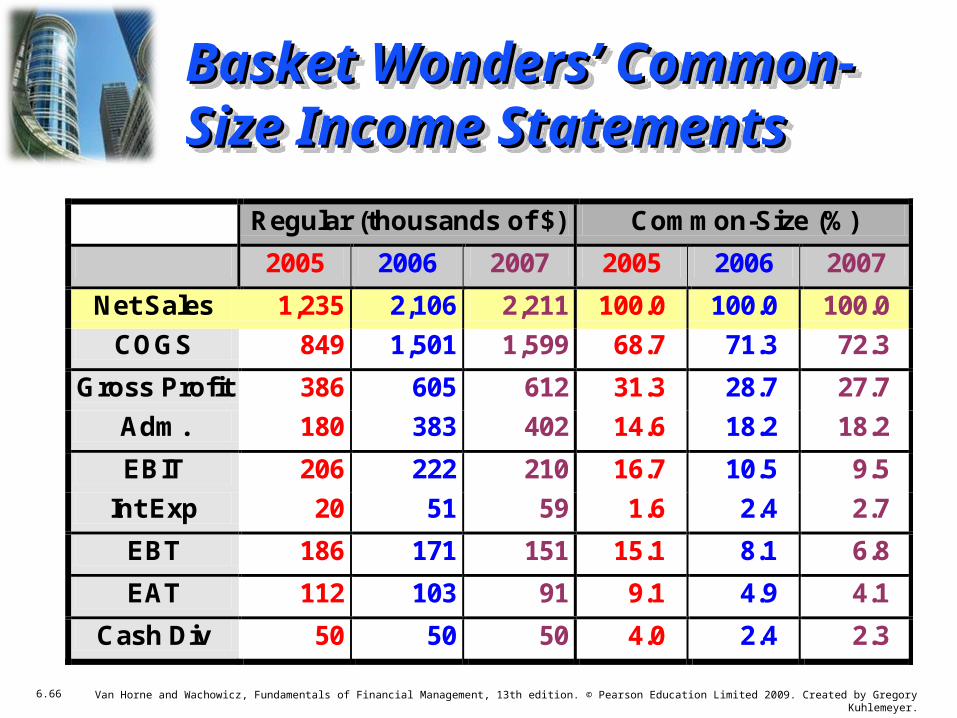
Regular (thousands of $) Common-Size (%) 2005 2006 2007 2005 2006 2007
Net Sales 1,235 2,106 2,211 100.0 100.0 100.0 COGS 849 1,501 1,599 68.7 71.3 72.3
Gross Profit 386 605 612 31.3 28.7 27.7 Adm. 180 383 402 14.6 18.2 18.2 EBIT 206 222 210 16.7 10.5 9.5
Int Exp 20 51 59 1.6 2.4 2.7 EBT 186 171 151 15.1 8.1 6.8 EAT 112 103 91 9.1 4.9 4.1
Cash Div 50 50 50 4.0 2.4 2.3
Basket Wonders’ Common- Basket Wonders’ Common- Size Income StatementsSize Income Statements

6.67 Van Horne and Wachowicz, Fundamentals of Financial Management, 13th edition. © Pearson Education Limited 2009. Created by Gregory Kuhlemeyer.
An analysis of percentage financial statements where all balance sheet or income statement figures for a
base year equal 100.0 (percent) and subsequent financial statement
items are expressed as percentages of their values in the base year.
Index AnalysesIndex Analyses
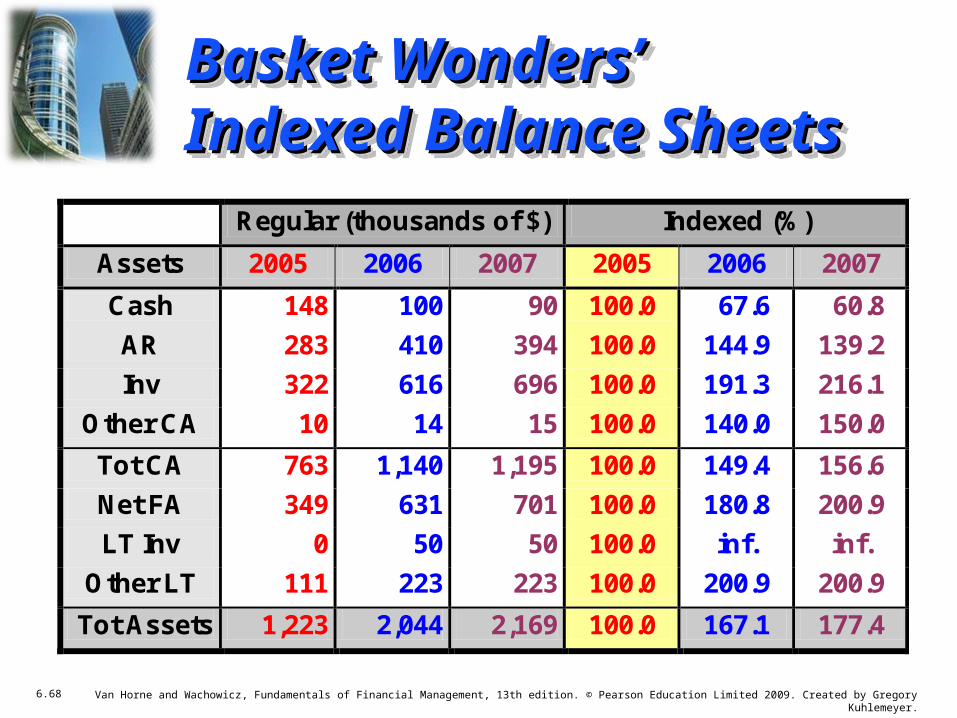
6.68 Van Horne and Wachowicz, Fundamentals of Financial Management, 13th edition. © Pearson Education Limited 2009. Created by Gregory Kuhlemeyer.
Regular (thousands of $) Indexed (%) Assets 2005 2006 2007 2005 2006 2007 Cash 148 100 90 100.0 67.6 60.8 AR 283 410 394 100.0 144.9 139.2 Inv 322 616 696 100.0 191.3 216.1
Other CA 10 14 15 100.0 140.0 150.0 Tot CA 763 1,140 1,195 100.0 149.4 156.6 Net FA 349 631 701 100.0 180.8 200.9 LT Inv 0 50 50 100.0 inf. inf.
Other LT 111 223 223 100.0 200.9 200.9 Tot Assets 1,223 2,044 2,169 100.0 167.1 177.4
Basket Wonders’ Basket Wonders’ Indexed Balance SheetsIndexed Balance Sheets

6.69 Van Horne and Wachowicz, Fundamentals of Financial Management, 13th edition. © Pearson Education Limited 2009. Created by Gregory Kuhlemeyer.
Regular (thousands of $) Indexed (%) Liab+Equity 2005 2006 2007 2005 2006 2007
Note Pay 290 295 290 100.0 101.7 100.0 Acct Pay 81 94 94 100.0 116.0 116.0 Accr Tax 13 16 16 100.0 123.1 123.1
Other Accr 15 100 100 100.0 666.7 666.7 Tot CL 399 505 500 100.0 126.6 125.3
LT Debt 150 453 530 100.0 302.0 353.3 Equity 674 1,086 1,139 100.0 161.1 169.0
Tot L+E 1,223 2,044 2,169 100.0 167.1 177.4
Basket Wonders’ Basket Wonders’ Indexed Balance SheetsIndexed Balance Sheets

6.70 Van Horne and Wachowicz, Fundamentals of Financial Management, 13th edition. © Pearson Education Limited 2009. Created by Gregory Kuhlemeyer.
Regular (thousands of $) Indexed (%) 2005 2006 2007 2005 2006 2007
Net Sales 1,235 2,106 2,211 100.0 170.5 179.0 COGS 849 1,501 1,599 100.0 176.8 188.3
Gross Profit 386 605 612 100.0 156.7 158.5 Adm. 180 383 402 100.0 212.8 223.3 EBIT 206 222 210 100.0 107.8 101.9
Int Exp 20 51 59 100.0 255.0 295.0 EBT 186 171 151 100.0 91.9 81.2 EAT 112 103 91 100.0 92.0 81.3
Cash Div 50 50 50 100.0 100.0 100.0
Basket Wonders’ Indexed Basket Wonders’ Indexed Income StatementsIncome Statements
Related Documents