Financial Stability Review APRIL 2018

Welcome message from author
This document is posted to help you gain knowledge. Please leave a comment to let me know what you think about it! Share it to your friends and learn new things together.
Transcript

Financial Stability Review
APR IL 2018

Contents
Overview 1
1. The Global Financial Environment 3 Box A: Low Interest Rates and Asset Price Risk 15
2. Household and Business Finances 19 Box B: Recent Trends in Personal Credit 29
3. The Australian Financial System 33 Box C: Interest Rate Risk in the Australian Financial System 45 Box D: The New Payments Platform and FastSettlement Service 49
4. Regulatory Developments 53 Box E: Reforms to the Basel III Capital Framework 62
Copyright and Disclaimer Notices 67
APR IL 2018
Financial Stability Review

The material in this Financial Stability Review was finalised on 12 April and uses data through to 11 April.
The Review is published semiannually and is available on the Reserve Bank’s website (www.rba.gov.au). The next Review is due for release on 12 October 2018. For copyright and disclaimer notices relating to data in the Review, see page 67 and the Bank’s website.
The graphs in this publication were generated using Mathematica.
Financial Stability Review enquiries:
Secretary’s DepartmentTel: +61 29551 8111Fax: +61 2 9551 8033Email: [email protected]
ISSN 1449-3896 (Print)ISSN 1449-5260 (Online)

F I N A N C I A L S TA B I L I T Y R E V I E W | A P R I L 2018 1
Overview
Global economic conditions have remained strong over the past six months, which has helped to further improve the health of the global banking system. However, a range of financial stability risks remain. Long-term government bond yields are still very low, despite generally increasing over the past year or so, which has continued to underpin elevated asset valuations and ‘search for yield’ activity. In addition, compensation for risk is low for many assets. Current asset pricing suggests that investors see little chance of adverse outcomes, and consequently a detrimental shock could lead to a disruptive and lasting correction in a broad range of markets. This could be triggered by a sharp rise in interest rates in the absence of stronger economic growth arising from, for instance, a jump in realised or expected inflation or a change in investors’ risk appetite.
In China, the authorities continue to make concerted efforts to address risks in the financial system, and a range of further steps were announced over the past six months. This is a positive development because of the importance of the Chinese economy to the Australian economy. However, risks remain elevated given the rapid growth and high level of corporate sector debt as well as the complex and opaque nature of some parts of the financial system. The improving economic outlook in Europe is strengthening bank profitability, but the stock of non-performing assets in some countries remains high. In parts of Europe and elsewhere, household debt and housing prices remain high after earlier rapid growth.
On the domestic front, concerns about riskier types of new housing borrowing have eased. The prudential measures implemented over recent years have led to a general strengthening in lending standards, and the regulatory limits on investor loans and interest-only lending have reduced the build-up of macro-financial concerns.
The high level of household indebtedness increases the risk of a rise in household financial stress amplifying a shock to the economy. Most aggregate indicators of financial stress remain low. Some banks have reported that payment arrears have increased for some borrowers transitioning to principal-and-interest repayments at the end of an interest-only period. This partly reflects borrowers taking some time to adjust, though for a small share of borrowers this has reflected difficulty in making the higher repayments. Overall, however, the regulatory measures and broader strengthening of lending standards have contributed to an improvement in the risk profile of new housing lending and the resilience of household balance sheets. They have also contributed to the recent moderation in housing market conditions.
Conditions in commercial property remain an area to watch. It appears that the large stock of apartments reaching completion in Brisbane and other capital cities is being absorbed with little disruption to housing markets, though there have been some reports of settlement failures and delays. Non-residential commercial property prices in Sydney and Melbourne have risen further, with yields falling, in part reflecting

R E S E R V E B A N K O F AU S T R A L I A2
ongoing ‘search for yield’ activity. In contrast, in the resource-intensive states conditions in office property markets remain challenging with elevated vacancy rates. More broadly, Australian-owned banks have slowed the growth in their commercial property exposures following a review by the Australian Prudential Regulation Authority (APRA) in 2016, though growth in lending by some foreign banks has remained strong. Lending by non-bank financial institutions to developers and households is growing strongly but remains a small share of total exposures. Conditions in the rest of the business sector continue to strengthen, with profits generally high and leverage contained, including for most firms in the mining-related sectors.
The resilience and overall financial performance of Australian banks has continued to improve. Profits in the second half of 2017 grew from an already high level, in part because of the increase in lending rates implemented by banks following the regulatory measures. Conditions in local and offshore long-term funding markets have also been generally favourable for banks, although there has been a recent rise in bank bill rates. Capital ratios have continued to rise and either already meet or are close to the ‘unquestionably strong’ targets announced by APRA last year and due to come into force in 2020. APRA recently released a discussion paper detailing proposed amendments to the capital framework to better align overall capital levels with the underlying risk of banks’ lending and other activities. This follows the finalisation of reforms to the international Basel III capital framework. With the design of key post-crisis reforms now largely completed, global bodies are increasingly focusing on monitoring the implementation, and evaluating the effectiveness and impact, of the financial reforms.
Conduct in the banking sector is the focus of several inquiries. Notably, the Royal Commission into Misconduct in the Banking, Superannuation and Financial Services Industry has commenced, the Productivity Commission investigation of competition in the financial system has issued a draft report, and the interim report by the Australian Competition and Consumer Commission on mortgage pricing has been published. Over time, these examinations should enhance accountability and strengthen risk culture in the financial sector. The International Monetary Fund has started work on its five-yearly Financial Sector Assessment Program review of Australia, which will focus on current financial vulnerabilities and the Australian framework for systemic risk oversight.
An important development in recent months was the launching of the New Payments Platform (NPP), which enables very fast payments on a 24/7 basis using a recipient’s email address, phone number or ABN. The NPP will increase the efficiency of the payments system and may support productivity more broadly. It also changes the nature of the risks in the Australian payments system, reducing the delay in receiving funds while increasing the importance of real-time monitoring to prevent financial fraud. Other financial market infrastructures have continued to function effectively. R

F I N A N C I A L S TA B I L I T Y R E V I E W | A P R I L 2018 3
The global economy has experienced widespread solid growth, which has reduced some financial stability risks but may with time promote others. Persistent very low interest rates and stable growth in recent years have led to high asset prices and low compensation for risk in a range of markets. This raises the possibility of a sharp correction in asset prices in response to an adverse shock. Investors have also taken on more risk in recent years, making them more susceptible to large losses if there were a generalised fall in asset prices. The falls in global equity prices in recent months have provided a timely reminder that asset prices can fall quickly, with price movements exacerbated by pro-cyclical investor behaviour.
Global debt levels are high and continue to rise. Low interest rates have encouraged households and corporations in a range of countries to increase debt, often from already elevated levels in the case of households. Government debt also remains high in many countries. The higher debt levels raise concerns about the resilience of a range of borrowers to any adverse shocks, particularly as global monetary policy accommodation starts to be unwound.
The Chinese financial system remains a focus. Addressing risks in the financial system has been a priority for the Chinese authorities with regulatory reforms backed by strong political support. Debt levels are high, especially in the corporate sector, and a sizeable share of debt has been provided through less regulated ‘shadow banking’ channels. This has exposed the financial system to considerable credit, liquidity and contagion risks.
1. The Global FinancialEnvironment
Major Advanced EconomiesAsset valuations in a range of advanced economy financial markets remain elevated. Over the past decade, long-term government bond yields, which underpin the valuation of most assets, have fallen contributing to higher prices for riskier assets (Graph 1.1). Despite some recent increases in bond yields, they remain low. Compensation for risk is also low; spreads on investment-grade and high-yield corporate bonds are at or near record lows despite an easing in non-price lending standards for wholesale corporate debt. There has been some pull-back in equity markets in recent months, initially in response to inflation concerns and more recently due to the direction of trade policy in the United States and developments in the technology sector. Equity valuations nonetheless remain high in the United States, but are less so in other countries.
Bond Yields and SpreadsMonthly averages
10-year governmentbond yields
20112004 2018-1.5
0.0
1.5
3.0
4.5
6.0
%
US
UK
Germany
Japan
Non-investment gradecorporate bond spreads*
20112004 20180
500
1 000
1 500
2 000
2 500
bps
US dollar
Euro
* Spreads to government bonds with equivalent maturitySource: Bloomberg
Graph 1.1
R E S E R V E B A N K O F AU S T R A L I A4
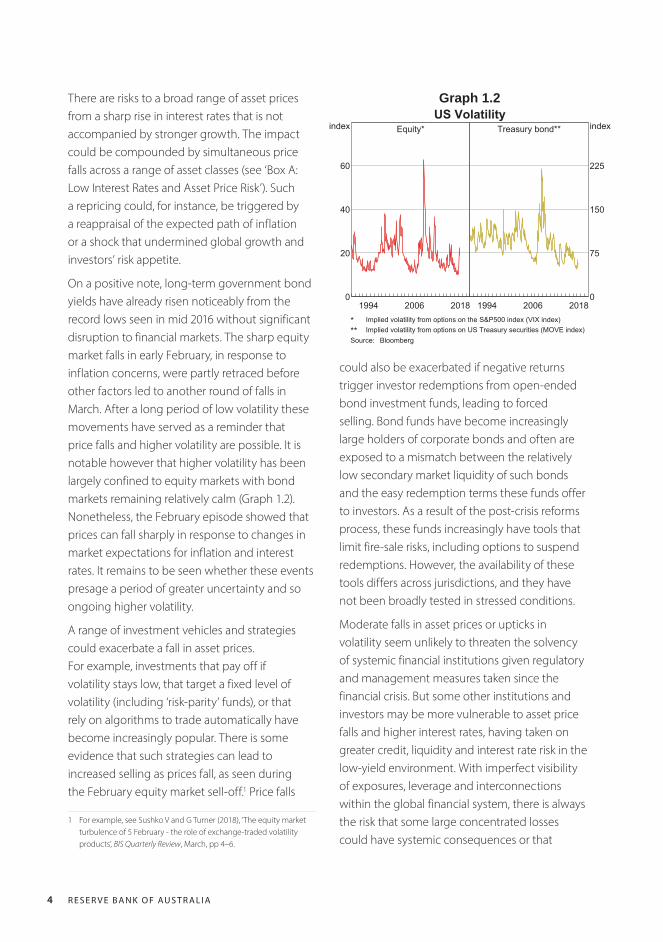
There are risks to a broad range of asset prices from a sharp rise in interest rates that is not accompanied by stronger growth. The impact could be compounded by simultaneous price falls across a range of asset classes (see ‘Box A: Low Interest Rates and Asset Price Risk’). Such a repricing could, for instance, be triggered by a reappraisal of the expected path of inflation or a shock that undermined global growth and investors’ risk appetite.
On a positive note, long-term government bond yields have already risen noticeably from the record lows seen in mid 2016 without significant disruption to financial markets. The sharp equity market falls in early February, in response to inflation concerns, were partly retraced before other factors led to another round of falls in March. After a long period of low volatility these movements have served as a reminder that price falls and higher volatility are possible. It is notable however that higher volatility has been largely confined to equity markets with bond markets remaining relatively calm (Graph 1.2). Nonetheless, the February episode showed that prices can fall sharply in response to changes in market expectations for inflation and interest rates. It remains to be seen whether these events presage a period of greater uncertainty and so ongoing higher volatility.
A range of investment vehicles and strategies could exacerbate a fall in asset prices. For example, investments that pay off if volatility stays low, that target a fixed level of volatility (including ‘risk-parity’ funds), or that rely on algorithms to trade automatically have become increasingly popular. There is some evidence that such strategies can lead to increased selling as prices fall, as seen during the February equity market sell-off.1 Price falls
1 For example, see Sushko V and G Turner (2018), ‘The equity market turbulence of 5 February - the role of exchange-traded volatility products’, BIS Quarterly Review, March, pp 4–6.
could also be exacerbated if negative returns trigger investor redemptions from open-ended bond investment funds, leading to forced selling. Bond funds have become increasingly large holders of corporate bonds and often are exposed to a mismatch between the relatively low secondary market liquidity of such bonds and the easy redemption terms these funds offer to investors. As a result of the post-crisis reforms process, these funds increasingly have tools that limit fire-sale risks, including options to suspend redemptions. However, the availability of these tools differs across jurisdictions, and they have not been broadly tested in stressed conditions.
Moderate falls in asset prices or upticks in volatility seem unlikely to threaten the solvency of systemic financial institutions given regulatory and management measures taken since the financial crisis. But some other institutions and investors may be more vulnerable to asset price falls and higher interest rates, having taken on greater credit, liquidity and interest rate risk in the low-yield environment. With imperfect visibility of exposures, leverage and interconnections within the global financial system, there is always the risk that some large concentrated losses could have systemic consequences or that
US VolatilityEquity*
20061994 20180
20
40
60
index Treasury bond**
20061994 20180
75
150
225
index
* Implied volatility from options on the S&P500 index (VIX index)** Implied volatility from options on US Treasury securities (MOVE index)Source: Bloomberg
Graph 1.2

F I N A N C I A L S TA B I L I T Y R E V I E W | A P R I L 2018 5
could see this slowdown develop into a more harmful correction.
Commercial property prices have also risen relatively quickly in major centres in the United States, Canada, New Zealand and Europe in recent years. As with other asset prices, declining long-term sovereign yields have been a factor. Accordingly, some leveraged investors and their creditors may be vulnerable to price falls given the highly cyclical nature of commercial property markets, particularly if long-term interest rates continue to rise from their current levels without increases in income. The recent interest rate increases may have already put some downward pressure on listed commercial real estate investment trust prices (Graph 1.4). In the United States, bank lending for commercial property has been growing relatively strongly, at an average annual rate of around 9 per cent over recent years. Regulators there have expressed concerns about lending standards and the high share of commercial property lending at particular institutions.
Conditions in advanced economy banking systems have generally continued to improve. Bank share prices have risen significantly over
uncertainty could cause market participants to cut counterparty credit lines.
Low interest rates in the post-crisis period have encouraged corporations in some countries to increase debt levels, which leaves them more vulnerable to negative shocks. In the United States, leverage in the listed non-financial sector is around historical highs. In part, this reflects strong growth of riskier ‘leveraged loans’ in recent years. At the same time, contractual protections for these creditors have weakened substantially.
As in Australia, low interest rates have also contributed to strong growth in household debt and housing prices in some small open advanced economies that did not have housing downturns in the financial crisis. In New Zealand (discussed below), Canada, Norway and Sweden, housing credit and price growth has exceeded that in incomes and rents over recent years, with some evidence of an increase in riskier lending.2 There is potential for a shock to the economy to be amplified by households and the housing market, as was the case in some economies in the financial crisis. Large housing price falls could see banks incur losses on recent and high-risk loans. Higher interest rates, falls in incomes and lower housing prices could also see highly indebted households substantially curtail their spending. Macroprudential policies have been implemented in these and other countries, stemming the growing risk in the balance sheets of banks and households, and these policies appear to have contributed to a slowing of credit and housing price growth (Graph 1.3). While these developments are welcome, there is always the risk of a mis-calibration of untried macroprudential tools, or of other shocks that
2 See RBA (2017), ‘Box A: Risks in International Housing Markets’, Financial Stability Review, October, pp 13–16.
M M M MJ J JS S SD D D2016 20172015 2018
0
5
10
15
%
0
5
10
15
%
Housing Price GrowthSelected advanced economies, year-ended
Australia
Sweden
Canada
Norway
NZ
Sources: BIS; Corelogic; RBA; REINZ
Graph 1.3

R E S E R V E B A N K O F AU S T R A L I A6
their regulatory minimums. The finalisation of Basel III regulatory capital requirements in December 2017 is estimated to have little effect on aggregate global minimum capital requirements, but the impact will vary by country and bank (see ‘Box E: Reforms to the Basel III Capital Framework’). Regulators in the United States continue to review post-crisis reforms. Proposals to date have mainly focused on easing the regulatory burden for small and medium-sized banks and easing requirements in areas where US regulations exceed international standards.
In the United States, in recent months spreads on short-term bank debt have spiked to their highest level since 2009 (Graph 1.6). Since the onset of the financial crisis, higher money market spreads have typically been an indicator of market stress or a perception that the near-term credit risk of banks had risen. However, the recent spike does not relate to major market stress or concerns about bank credit risk. Indeed, spreads on long-term bank funding and credit-default swaps (CDS) remain very narrow. Rather, increased spreads appear to be due to changes in the demand for and supply of money-market securities. In particular, issuance of US Treasury bills has increased significantly following the suspension
the past two years, but recent movements have been mixed (Graph 1.5). Profit expectations are being supported by stronger economic conditions – which should lead to increased credit demand – as well as higher interest rates and further improvements in asset performance. Lower corporate tax rates in the United States are also expected to boost the profits of banks operating there over the medium term, despite some negative short-term effects (reflecting a reduction in tax benefits from past losses). Banks’ regulatory capital ratios in the advanced economies also remain well above
2017201620152014 201880
100
120
140
index
80
100
120
140
index
Real Estate Investment Trust Prices*1 January 2014 = 100
US
Europe
UK
* Predominantly commercial REITsSources: Bloomberg; RBA
Banks’ Share-price-to-book-value RatiosQuarterly*
Advanced economy banks
20142010 20180
1
2
ratio
Australia
JapanEuro area
USUK
Canada
Euro area banks
2014 20180
1
2
ratio
France
Italy
Spain
Portugal Germany
* End of quarter; March and June 2018 observations use latestavailable data
Sources: Bloomberg; RBA
Graph 1.4
Graph 1.5Bank Funding Conditions
Interbank market spreads*
20142010 2018-50
0
50
100
150
bps
US
Five-year seniorCDS spreads
20142010 20180
100
200
300
400
bps
UK
* Three-month LIBOR-OIS spreadSources: Bloomberg; Thomson Reuters
Graph 1.6

F I N A N C I A L S TA B I L I T Y R E V I E W | A P R I L 2018 7
of the debt ceiling in February and because of seasonal factors associated with tax payments. Demand for Treasury bills has also seemingly declined as a few very large US corporations have reallocated their assets following US tax changes that encourage them to repatriate offshore dollars to the United States. Other tax changes have simultaneously encouraged foreign banks operating in the United States to borrow directly, rather than seek offshore funding from their parents. This rise in borrowing costs has spilled over to some other markets, including in the United Kingdom and Australia (for further details on developments in Australia, see ‘The Australian Financial System’ chapter).
In Europe, banks have continued to bolster their resilience, aided by the ongoing economic upswing. Profitability has generally been improving, which has enabled banks to increase their loss-absorbing capital buffers. Banks have continued to cut costs and adjust their business models. Non-performing loan (NPL) ratios have fallen further, partly due to some large banks selling NPL portfolios (Graph 1.7). European authorities have proposed that banks should provision for new NPLs more rapidly and to a greater extent, and reportedly may extend
Large Banks’ NPLsShare of loans
20132009 20170
2
4
6
8
%
AustraliaJapan
Germany
France
USUK
20132009 20170
10
20
30
40
%Greece
Portugal
Italy Spain
Ireland
Sources: APRA; Banks’ annual and interim reports; Bloomberg; FSA;RBA; S&P Global Market Intelligence
Graph 1.7
these plans to existing bad loans as part of a broader push to accelerate the cleanup of banks’ balance sheets.
Despite these improvements, banking systems in some European jurisdictions remain vulnerable to negative shocks. Stocks of NPLs are still high in several European banking sectors and, in some cases, are expected to remain high in coming years. NPL sales to date have been at prices significantly below those implied by provisioning levels. This means that banks’ effective capital buffers could be smaller than reported capital ratios suggest. Structural factors such as high cost bases, legacy loss-making exposures and excess capacity continue to constrain banks’ profitability, while restructuring costs also remain high for some banks. These factors will need to be resolved if banks are to raise long-term profitability and improve their ability to build up capital buffers.
Debt sustainability concerns remain for some highly indebted European sovereigns, although near-term risks have continued to recede over the past six months (Graph 1.8). Government bond spreads to German Bunds have narrowed
Sovereign Debt*Per cent to GDP
20091999 20190
50
100
150
%
Germany
FranceNetherlands
SwedenUK
20091999 20190
50
100
150
%
Greece
Italy
SpainPortugal
Ireland
* Debt-to-GDP ratios for 2018 and 2019 are European Commissionforecasts
Source: European Commission
Graph 1.8

R E S E R V E B A N K O F AU S T R A L I A8
stability in Europe. Negotiations to define the future relationship between the European Union (EU) and the United Kingdom are in progress, but there remains significant uncertainty about the nature of a final agreement or whether an agreement will even be reached. A disorderly Brexit process – such as the failure to reach a post-exit UK-EU trade deal, a significant delay in reaching an agreement or a late change in political course – could be disruptive for UK financial institutions that provide services to continental Europe, as well as EU firms that rely heavily on those services.
Increasing use of technology in the financial system, and the associated increase in linkages with and reliance on third parties, has heightened the risk to financial stability posed by cyber-attacks. Such attacks have the potential to affect the financial system through a variety of channels; for instance, through an interruption in the availability of core financial services or the corruption of trade or transaction records. Of particular concern is the possibility of an attack having knock-on effects to other parts of the financial system. Given the systemic risk posed by cyber-attacks, international regulatory bodies are increasing their focus on monitoring cybersecurity in the financial system, although information on the scale and nature of attacks remains incomplete (see the ‘Regulatory Developments’ chapter for further information).
New ZealandFinancial stress in New Zealand would affect the Australian banks due to the strong economic and financial links between the two countries. New Zealand’s four largest banks are each owned by one of the Australian major banks. In its latest Financial Stability Report the Reserve Bank of New Zealand (RBNZ) assessed that near-term financial stability risks had receded, but high debt levels in the household and dairy sectors
Euro Area 10-year Government Bond SpreadsTo German Bunds
20142010 20180
200
400
600
bps
France
Spain
Italy
20142010 20180
1 000
2 000
3 000
bps
Portugal
Greece
Sources: Bloomberg; RBA
Graph 1.9
further, reflecting stronger economic conditions and improving fiscal positions (Graph 1.9). However a sharp increase in yields – for instance due to a change in global risk sentiment or political developments – could increase concerns around the sustainability of some European countries’ debt. While actions by the European Central Bank could limit any rise in government bond yields, sizeable increases are still possible, which could pose risks to financial and macroeconomic stability given banks’ large holdings of European government bonds relative to their capital bases.
In Greece, the economy has continued to strengthen and near-term funding pressures on the government have receded despite the high debt stock. Greece’s sovereign credit rating was upgraded by two rating agencies and Greece has again raised funds in international bond markets. Its European creditors also agreed to disburse the latest round of bailout funding in March, but an agreement on debt restructuring may be important to Greece’s ability to fund itself after the bailout program ends in August.
The United Kingdom’s exit from the European Union (Brexit) could pose risks to financial

F I N A N C I A L S TA B I L I T Y R E V I E W | A P R I L 2018 9
New Zealand Dairy SectorDairy prices
4
8
NZ$/kg
4
8
NZ$/kg
Dairy prices**
Farmgate milk price*
Dairy sector NPL ratio
201420102006 20180
2
4
%
0
2
4
%
* Dashed line indicates latest Fonterra price forecast per kg of ‘milk solids’** Weighted average of whole milk powder, skim milk powder andbutter prices
Sources: Bloomberg; Fonterra; RBA; RBNZ; USDA
Graph 1.11
201620142012 2018-10
0
10
20
30
%
-10
0
10
20
30
%
New Zealand Housing Credit and PricesSix-month-ended annualised growth
Tax changes
Housing credit*
Aucklandprices*
Rest of NewZealand prices*
LVR policytightening**
LVRpolicy
easing
High-LVR speedlimit introduced
* To latest three months** Refers to tighter restrictions introduced in November 2015, mainlytargeting Auckland investors, which were subsequently tightenedfurther and extended to investors in the rest of New Zealand in October2016
Sources: RBNZ; REINZ
Graph 1.10
leave borrowers and banks vulnerable to adverse shocks.
In the housing market, the tightening of loan-to-valuation ratio (LVR) requirements in October 2016, a general tightening in lending standards, and higher mortgage interest rates (a flow-on from higher deposit rates) have slowed credit and housing price growth (Graph 1.10). These changes have also improved the quality of new lending, particularly to investors. This modest reduction in housing market vulnerabilities led the RBNZ to marginally ease the LVR restrictions from the beginning of 2018. Specifically, it raised the LVR threshold, above which a 5 per cent cap on the share of new investor loans applies, from 60 per cent to 65 per cent. It also increased the share of new owner-occupier loans that can have an LVR above 80 per cent, from 10 per cent to 15 per cent. The RBNZ is considering the case for developing a lending constraint based on debt serviceability as a macroprudential measure that could be used if financial stability risks intensify.
Risks from the dairy sector, which accounts for around 10 per cent of total bank lending in New Zealand, have eased given that dairy prices have been at somewhat higher levels over the past year or so (Graph 1.11). Growth in lending to the dairy sector has slowed and the proportion of banks’ dairy loans that is non-performing has declined slightly. However, the sector remains highly indebted, which leaves it vulnerable to falls in sometimes volatile dairy prices.
ChinaChinese policymakers continue to implement reforms to address financial stability risks, backed by strong political support. These actions have had some success in containing the build-up of risks and have the potential to curb risks over the longer term, but much will depend on how they are implemented and enforced. For now, the accumulated financial stability risks in China remain high.
Concerns about risks to the financial system in China reflect several inter-related factors. First, there has been a large build-up of debt over the past decade (Graph 1.12). The high leverage of the corporate sector, both private

R E S E R V E B A N K O F AU S T R A L I A1 0
banks’ proactive use of loan write-offs and NPL sales. To some extent NPL ratios may understate banks’ exposure to non-performing assets. For example, in some circumstances banks in China reportedly still have exposure to NPLs they have sold, for instance because the loans sit in an off-balance sheet vehicle financed by the bank. Also, some banks are reported to have used various other means to avoid recognising problem loans, including loan forbearance.
Over recent years authorities in China have worked to facilitate the restructuring of corporate debt and help banks to repair their balance sheets. This includes launching a debt-to-equity swap program, establishing firm-level creditor committees to manage debt workouts, and creating regional asset management companies to purchase NPLs.
Implicit guarantees of loans and other financial products in China are also likely to have resulted in weaker lending standards. Low credit spreads on debt securities issued by SOEs and local governments suggest that investors assume they are effectively guaranteed by the central government. Similarly, many investors in the wide range of asset management products (AMPs) sold by banks and non-bank financial institutions (NBFIs) reportedly believe they are implicitly guaranteed by the issuer – a belief in part based on recent experience where issuers have paid out distressed AMPs. Such guarantees can reduce the incentive for lenders to adhere to prudent lending standards. This increases the likelihood of poor quality loans, and thus the risk of repayment problems.
Third, a significant part of the run-up in corporate debt has been provided through less regulated and less transparent shadow banking channels (even though this debt is largely funded or otherwise facilitated by the banking sector). Shadow lending has improved firms’ access to
and public, makes firms less resilient to negative shocks. While the growth of debt has slowed over recent years, China’s non-financial corporate debt relative to GDP exceeds that of most advanced economies, and is several times higher than in economies with comparable per capita income levels.
Second, a range of factors have reduced lending standards and asset quality in China, raising credit risks further. The speed of the increase in debt suggests that some lending may have been of poor quality as has often been the case in rapid credit expansions in other countries. Despite noticeable improvements in aggregate profitability over the past year or so, excess capacity in parts of the industrial sector has resulted in some unprofitable companies that are highly leveraged and rely on loan forbearance to survive. Many of these are state-owned enterprises (SOEs). China’s local governments have also borrowed heavily in the post-crisis period to fund infrastructure projects, despite limited net revenue streams. While banks’ reported NPL ratios remain low, the flow of new NPLs is quite large, which is being offset by
201320092005 20170
50
100
150
200
250
%
0
50
100
150
200
250
%
China – Non-financial Sector DebtPer cent of nominal GDP
Total debt*
Bank credit
Shadow financing**
* Total debt is the sum of bank credit, shadow financing and bondfinancing (both corporate and public)** RBA estimate
Sources: CEIC Data; RBA; Wind Information
Graph 1.12

F I N A N C I A L S TA B I L I T Y R E V I E W | A P R I L 2018 1 1
Chinese authorities have avoided a sharp housing correction by using a range of policy tools to actively manage the housing cycle. However, household debt has been growing rapidly from a low level alongside strong growth in housing prices over recent years. Household indebtedness is low relative to advanced economies, but high relative to many emerging market economies. Housing loan-to-valuation ratios appear moderate, suggesting a buffer against any decline in housing prices. A downturn in the housing market could also adversely affect other sectors, such as highly leveraged property developers and local governments.
The Chinese authorities are well aware of these various risks and have continued to implement measures to address them. Senior officials have publicly expressed concerns about financial risks, including President Xi, indicating a strong political commitment to curtail risk. Several significant measures have been announced over the past year or so. Importantly, a cross-agency Financial Stability and Development Committee has been established under the State Council, to boost coordination between the main Chinese financial regulators and increase their authority. Further, the China Banking Regulatory Commission and the China Insurance Regulatory Commission are to be merged into a single regulatory agency, and some additional aspects of policy design will be transferred to the People’s Bank of China. Guidelines for unified regulation of AMPs – regardless of their type, issuer or main regulator – have also been announced, including rules on leverage, liquidity, disclosure and investment scope. Limits on interbank borrowing and lending, and restrictions on ‘entrusted loans’ (a key type of shadow lending), have also been introduced or announced. Scrutiny of the insurance sector has also increased. The regulator has recently taken control of Anbang Insurance, a very large
finance and enabled more lending to occur on market terms that account for risk. However, it also enables banks to circumvent regulation in various ways, adds to liquidity risk and increases and obscures interconnections in the financial system.3
Many smaller banks have increased their issuance of short-term wholesale debt over recent years, including interbank loans, to invest in NBFIs (Graph 1.13). The resulting opacity, interconnection and reliance on short-term funding can amplify and spread financial stress, because uncertainty about counterparties’ exposures can lead to a broad-based withdrawal of funding in a period of heightened uncertainty. However, given the ongoing heavy influence of the state in the financial system – notwithstanding significant reform over the past decade – contagion is unlikely to play out in the same way as in more market-based systems.
Vulnerabilities in the Chinese household sector continue to rise, although they appear less than those in the corporate sector. To date the
3 For a more complete discussion of these risks see Bowman J, M Hack and M Waring (2018), ‘Non-bank Financing in China’, RBA Bulletin, March. Available at <http://www.rba.gov.au/publications/bulletin/2018/mar/non-bank-financing-in-china.html>
Banks’ Claims on NBFIsValue
20132008 20180
10
20
30
CNYtr Share of banks’ assets
20132008 20180
5
10
15
%
Large banks
Smaller banks
Sources: CEIC Data; RBA
Graph 1.13

R E S E R V E B A N K O F AU S T R A L I A1 2
The Chinese banking system reports adequate levels of capital overall, although some small and medium-sized banks have relatively thin buffers over their minimum requirements (Graph 1.15). As noted above, reported capital may overstate the true position due to under-provisioning for NPLs. Aggregate profitability is quite strong, although it has declined in recent years, partly due to greater losses on lending. More recently, the slowing in shadow banking activity has started to weigh on smaller banks’ balance sheet growth and profitability, because they have been active in funding and facilitating this activity.
and acquisitive financial conglomerate that has grown rapidly, largely funded by strong issuance of non-traditional AMPs. Together these measures have resulted in a marked slowing in some types of shadow lending and AMP issuance (including banks’ ‘wealth management products’) (Graph 1.14).4
If sustained, calibrated appropriately and not circumvented, these regulatory measures should help to curb financial stability risks over the longer term. However, in the near term if applied too forcefully, measures to boost financial stability have the potential to cause a contraction in financial intermediation. This risk is mitigated somewhat by a favourable economic environment in which to pursue regulatory reform. But in future the authorities may face a difficult trade-off between restraining financial risks and supporting economic growth to achieve targets. Market and investor sentiment may also weaken significantly if currently assumed implicit guarantees were seen to no longer apply.
4 See Perry E and F Weltewitz (2015), ‘Wealth Management Products in China’, RBA Bulletin, June, pp 59–68.
20162015201420132012 20170
10
20
30
CNYtr
0
20
40
60
%
China – Wealth Management ProductsAssets under management
Year-ended growth(RHS)
Levels(LHS)
Sources: RBA; Wind Information
Graph 1.14
China’s Banking SystemReturn on equity
10
20
% CET1 capital ratio
5
10
%
Non-performing loansStock
20132009 20170
1
2
CNYtr Non-performing loansShare of loans
2013 20170
5
10
%
Incl. specialmention loans
Sources: CEIC Data; RBA; S&P Global Market Intelligence
Graph 1.15
The Chinese authorities retain a wide range of economic and financial policy tools to use in any financial disruption. The state retains a large role in both the corporate sector and the financial system which enables some policy actions that are more complex or not possible in other economic systems. The authorities have also proven to be willing and able to respond quickly to potential instability, as demonstrated by their intervention with Anbang Insurance. Nevertheless, given the risks, maintaining stability in a large, complex and opaque financial system will be challenging. And policies designed to minimise losses and maintain stability will often reinforce perceptions of implicit guarantees.

F I N A N C I A L S TA B I L I T Y R E V I E W | A P R I L 2018 1 3
risk sentiment and capital flight, particularly in an environment of rising interest rates in advanced economies, trade tensions and heightened geopolitical risk. This could reveal or exacerbate underlying weaknesses.
The increase in corporate sector indebtedness in EMEs remains an area of concern because higher leverage reduces firms’ resilience to adverse shocks. The speed of this rise since the financial crisis may also indicate there has been some lower quality lending. A shift in risk sentiment could expose some EMEs to currency depreciations which would inflate the value of any unhedged foreign currency borrowing and interest costs, while also reducing firms’ access to offshore funding. More generally, rising global interest rates, particularly in the US, will increase the cost of servicing unhedged foreign currency debt. These risks are somewhat mitigated by the large proportion of listed EME firms that have at least some foreign currency earnings, as well as the general decline in EME firms’ reliance on foreign currency borrowing.
Banking systems in most large EMEs have been fairly resilient in the face of earlier challenging economic conditions and deteriorating asset
If financial risks were to materialise in China, the negative effect on China’s economy could be substantial. Direct financial linkages between China and the rest of the world are generally still small, limiting the spill-overs through this channel. Rather, a financial disruption would likely be transmitted through China’s strong trade links, including to Australia, with possible second-round effects on a broad range of countries through weaker global growth. Weaker sentiment in global financial markets could also cause and transmit significant financial stress.
Other Emerging Market EconomiesRisks in other emerging market economies (EMEs) have eased further over the past six months. Economic growth is broadening and is expected to continue. Corporate debt-to-GDP ratios have stabilised or fallen in many economies following earlier strong growth (Graph 1.16). Capital inflows to EMEs have been relatively strong over the past two years as risk sentiment has remained positive, supporting asset prices and currencies (Graph 1.17). Nevertheless, some EMEs remain vulnerable to a change in global
Emerging Financial Markets
100
200
indexShare prices*
75
150
%Flows into equity funds***
20132008 20185
7
9
%Government bond yields**
20132008 2018-500
0
500
%
Flows into bond funds***
* 1 January 2005 = 100** Local-currency denominated*** Cumulative since end 2004; share of initial assets under managementSources: Bloomberg; EPFR Global; JP Morgan; Thomson Reuters
Graph 1.17
Total Credit to PrivateNon-financial Corporations
Per cent to GDP
Commodity-exportingeconomies
20122007 20170
20
40
60
%
Russia
Brazil
South Africa
Indonesia
Malaysia
Other economies
20122007 20170
20
40
60
%
Turkey
India
Mexico
Thailand
Sources: BIS; CEIC Data; RBA; Thomson Reuters
Graph 1.16

R E S E R V E B A N K O F AU S T R A L I A1 4
The potential for EME financial stress to spill over to advanced economies has risen over time due to their increased size and integration in the global economy. Along with stronger trade links, advanced economies’ financial links to EMEs, while relatively small, have grown, including through portfolio investments in EME corporate debt and equity (especially via mutual funds). Distress in EMEs could be transmitted through these links and by weighing on financial market sentiment. R
quality in recent years. The economic recovery should also support the financial health of EME banks in the period ahead. Nonetheless, bank performance varies widely within and across jurisdictions, with some banks having weak profitability and thin provisioning and capital buffers (Graph 1.18). In India and Russia, NPLs have continued to rise (Graph 1.19). Regulators there have implemented a number of measures to bolster resilience, including improving NPL recognition and resolution, corporate governance and supervision. Public money has been injected into multiple weak and failing large banks in both jurisdictions.
RangeMedian
-50 -25 0 25 %
Thailand
Turkey
Russia
Indonesia
India
Malaysia
Banks’ Return on Equity*As of December 2017
* Number of banks in sample differs across jurisdictionsSources: RBA; S&P Global Market Intelligence
Graph 1.18
Banking Sector NPLs*Share of loans
Commodity-exportingeconomies
20122007 20170
4
8
%
Russia
Brazil
Malaysia
South Africa
Indonesia
Other economies
20122007 20170
4
8
%
India
Turkey
Thailand
Mexico
* Definitions of non-performing loans can differ across jurisdictionsSources: CEIC Data; IMF; RBA
Graph 1.19
F I N A N C I A L S TA B I L I T Y R E V I E W | A P R I L 2018 15
Box A
Low Interest Rates and Asset Price Risk
Low global policy rates have boosted a broad range of asset prices and encouraged financial risk-taking. These responses are part of the normal mechanisms through which accommodative monetary policy stimulates the economy. However, the historically low level of interest rates and the protracted length of time they have been at those levels have led to particularly strong responses of asset prices. Metrics of many assets’ valuation, which are contingent on the low risk-free interest rates, are elevated relative to history. In addition, investor compensation for bearing many types of risk has fallen to record low levels, and some investors have significantly increased their risk profiles.
A sharp increase in long-term risk-free interest rates toward historically normal levels could result in widespread asset price falls if it is not accompanied by stronger growth. If the increase in interest rates is triggered by stronger growth expectations then higher expected income flows could hold up asset valuations despite higher discount rates. However, valuations for fixed income securities could fall sharply if interest rates rise substantially because of higher realised or expected inflation, while valuations for assets more broadly could fall if risk premia return to historically more normal levels.
While a host of regulatory and other changes have made the financial system and, in particular, banks more robust since the financial crisis, a large synchronised fall in asset prices could test this resilience. Despite some improvements in transparency, there is significant uncertainty about the ultimate exposure and response
of different types of investors to such asset price falls. Notably, there is little information on the extent of leverage, which would amplify losses, of non-prudentially regulated financial institutions.
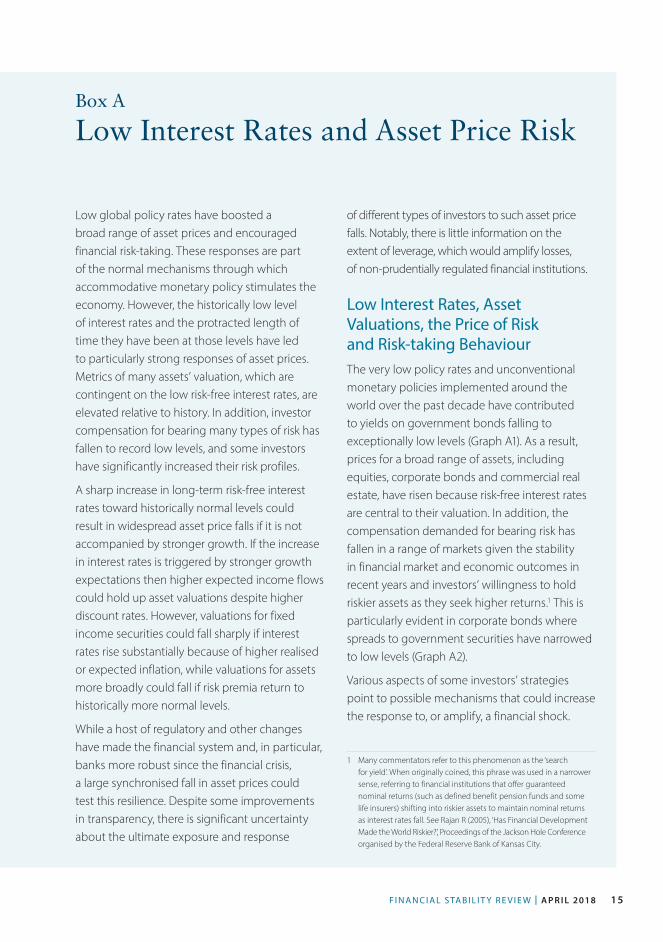
Low Interest Rates, Asset Valuations, the Price of Risk and Risk-taking BehaviourThe very low policy rates and unconventional monetary policies implemented around the world over the past decade have contributed to yields on government bonds falling to exceptionally low levels (Graph A1). As a result, prices for a broad range of assets, including equities, corporate bonds and commercial real estate, have risen because risk-free interest rates are central to their valuation. In addition, the compensation demanded for bearing risk has fallen in a range of markets given the stability in financial market and economic outcomes in recent years and investors’ willingness to hold riskier assets as they seek higher returns.1 This is particularly evident in corporate bonds where spreads to government securities have narrowed to low levels (Graph A2).
Various aspects of some investors’ strategies point to possible mechanisms that could increase the response to, or amplify, a financial shock.
1 Many commentators refer to this phenomenon as the ‘search for yield’. When originally coined, this phrase was used in a narrower sense, referring to financial institutions that offer guaranteed nominal returns (such as defined benefit pension funds and some life insurers) shifting into riskier assets to maintain nominal returns as interest rates fall. See Rajan R (2005), ‘Has Financial Development Made the World Riskier?’, Proceedings of the Jackson Hole Conference organised by the Federal Reserve Bank of Kansas City.

R E S E R V E B A N K O F AU S T R A L I A16
has not been tested in times of stress. This increases the risk that investors might be unable to meet their liquidity needs (except by selling at heavily discounted prices). For example, life insurers have increased their asset allocation towards illiquid assets such as commercial property, infrastructure financing and mortgage loans. Retail investors’ holdings of corporate bonds have also increased through the rapid growth of bond investment funds.
• Some investors have moved into lower-rated
assets, increasing their credit risk exposures.A notable example of this has been investors’willingness to hold BBB-rated bonds earninglow interest rates, which has made theirissuance attractive to corporates (Graph A3).2
At the same time, the covenants attachedto speculative-grade corporate loans inAsia, Europe and North America have beenloosening.3,4 With investors accepting bothlower credit quality and compressed spreads,they are receiving historically low compensation for taking on credit risk.
• Some investors have moved into relativelyilliquid assets or markets where liquidity
2 This shift can also be seen on the balance sheets of different investor types. For example, the share of US and European life insurers’ bond portfolios with a BBB or lower rating has risen over the past decade from one-quarter or less to at least one-third. See International Monetary Fund (2017), ‘Is Growth at Risk?’, Global Financial Stability Report, October.
3 See Moody’s (2018), ‘Covenant quality score for Asian high-yield bonds falls to weakest level on record’, 24 January; Moody’s (2017), ‘Speculative-grade non-financial corporates – EMEA: Covenant-lite returns with a vengeance, eroding investor protection’, 19 June; and Moody’s (2018), ‘North American loan covenant quality touches weakest level in third quarter as covenant erosion continues apace’, 18 January.
4 This is consistent with the sharp rise in US leveraged loans – which are typically to non-investment grade companies – that are classed as ‘covenant-lite’, at a time of strong growth in US leveraged loans more broadly.
Australia Japan GermanySwitzerland UK US-5
0
5
10
15
%
-5
0
5
10
15
%
Sovereign Bond YieldsSince January 1950, monthly
Interquartile range
Historical range
March 2018
Sources: Bloomberg; RBA
Corporate Bond Spreads*Since January 2000, monthly
Investment gradeInvestment grade
USD Euro GBP Yen0
1
2
3
ppt
Historical range
Non-investment gradeNon-investment grade
USD Euro GBP0
5
10
15
ppt
March 2018
Interquartile range
* To equivalent government bond, by currency of issuanceSource: ICE Data is used with permission; RBA
Graph A1 Graph A2
Corporate Bond IndicesShare of bonds rated BBB in investment grade indices
US dollar
2006 20180
20
40
60
%
Non-financial
Aggregate
Euro
2006 2018
Sterling
2006 20180
20
40
60
%
Source: ICE Data is used with permission
Graph A3

F I N A N C I A L S TA B I L I T Y R E V I E W | A P R I L 2018 17
margin debt balances relative to market capitalisation are above pre-crisis levels in the United States.5
Asset Price ResponseWhile banks should be more resilient to asset price falls given regulatory reforms, the factors outlined above suggest that this may not be the case for all other types of investors. Given the multitude of changes in institutional structures, investors’ asset holdings and market dynamics, it remains uncertain how different classes of investors will be affected by, and respond to, asset price falls. Notably, they could be tested by synchronised falls in asset prices. Frequently, prices of certain assets, in particular, sovereign bonds, move inversely with those of riskier assets. However, given high valuations for a broad range of assets are being underpinned by low risk-free interest rates (high sovereign bond prices), a rise in sovereign yields could result in synchronised asset price falls.
One recent example of such synchronised asset price falls triggered by rising risk-free rates
5 On increasing hedge fund leverage see: Board of Governors of the Federal Reserve (2018), ‘Monetary Policy Report’, 23 February. On the level of hedge fund leverage see: Office of Financial Research (2017), ‘Financial Stability Report’.
• Some investors have gone beyond theirtraditional risk mandates or areas of expertise.This increases the risk that investors mightfail to appropriately assess and price theirrisk. For example, in countries where interestrates are very low, such as Japan, some banksand insurers have expanded their activitiesin foreign jurisdictions where interest ratesand spreads are higher. Further, demand forcomplex, opaque and/or risky instruments,such as collateralised loan obligations andshort-volatility exchange-traded products,has been strong.
• Investors are holding bonds with longer
maturities. This provides a natural hedge forinvestors with long-dated liabilities (suchas pension funds and life insurers) but forother investors it increases their exposureto interest rate risk. The average duration ofoutstanding bonds has risen in many marketssince the early 2000s (Graph A4). While longertenor bonds reduce refinancing risk forborrowers, they make investors’ asset returnsmore sensitive to interest rate changes.Bond prices at all maturities have alsobecome more responsive to interest ratechanges due to the lower level of yields.
• Leverage remains prevalent in the financialsystem. While the global banking sectorhas significantly reduced its leverage sincethe financial crisis, leverage remains highfor some other institutions and may haveeven increased for some. However, there islittle transparency on this leverage, whichadds to uncertainty. Partial informationsuggests leverage could still be an importantamplification mechanism: there are somereports of increasing leverage amonghedge funds in the United States (includingthrough derivatives) which is at a high levelfor large funds (about 15 times), and equities
Bond Market DurationSovereigns
2006 20183
5
7
9
11
years
Australia
Japan
Canada
Europeansovereigns
2006 2018
France
Germany
Italy
Spain
Corporates
2006 20183
5
7
9
11
years
Euro
US
UK
Source: ICE Data is used with permission
Graph A4

R E S E R V E B A N K O F AU S T R A L I A18
occurred in mid 2013 after the US Federal Reserve unexpectedly announced a tapering of its bond-buying program (the ‘taper tantrum’). While this episode ultimately was relatively benign, it highlights that broad-based asset price falls can be triggered by a sudden rise in sovereign yields (Graph A5). More sustained or larger price falls could have a greater impact.
Alternatively, an adverse shock could prompt a sudden reassessment of the current very low levels of risk premia, leading to sharp price falls for a range of assets. This has been true of past episodes of sharply rising risk premia (Graph A6).6 While prices for sovereign bonds tend to rise in such episodes, the falls in prices for riskier assets have historically been quite large. R
6 This result is robust to the exclusion of the global financial crisis, although the average size of the price falls is smaller.
-30 -20 -10 0 10 %Japan
EuroUS
EMEuroUSD
EMEuroUSD
GermanyUS
Asset Total ReturnsFollowing the ‘taper tantrum’ of 2013*
10-year sovereign bonds
IG corporate bonds**
HY corporate bonds**
Equities ***
* From 22 May 2013 to 25 June 2013** IG = investment-grade, HY = high-yield, USD = US dollar-denominated,Euro = euro-denominated, EM = issued by emerging market firms*** US = S&P 500 index, Euro = Stoxx index, Japan = Nikkei 225 index
Sources: ICE Data is used with permission; RBA; Thomson Reuters
-30 -20 -10 0 10 %Japan
EuroUS
EMEuroUSD
EMEuroUSD
GermanyUS
Asset Total ReturnsFollowing rapid increases in US risk premia*
10-year sovereign bonds
IG corporate bonds**
HY corporate bonds**
Equities ***
* Defined as increases in the spread of US high-yield corporate bonds to USTreasuries of at least 200 basis points within a six-month period; averagessince 1 January 2000 for available data** IG = investment-grade, HY = high-yield, USD = US dollar-denominated,Euro = euro-denominated, EM = issued by emerging market firms*** US = S&P 500 index, Euro = Stoxx index, Japan = Nikkei 225 index
Sources: ICE Data is used with permission; RBA; Thomson Reuters
Graph A5
Graph A6

F I N A N C I A L S TA B I L I T Y R E V I E W | A P R I L 2018 1 9
2. Household and BusinessFinances
Macro-financial risks emanating from the household sector remain, given the high level of household debt and strong growth of riskier lending in previous years. However, the build-up of risks has abated somewhat of late, in part reflecting the Australian Prudential Regulation Authority’s (APRA’s) prudential measures in the residential mortgage market. Continuing a trend that has been evident for some time, standards for new lending to households have improved further, with a lower share of new loans having riskier characteristics, such as interest-only (IO) terms and/or high loan-to-valuation ratios (LVRs). Nationally, housing market conditions have eased, with prices notably falling in Sydney.
Overall, most indicators suggest that the incidence of household financial stress is not widespread, although some households could be tested were unemployment to increase. Existing housing loans, including those written under earlier weaker standards, continue to perform well given good economic conditions in most of the country. In addition, borrowers coming to the expiry of an IO payment period face a sizeable increase in their scheduled payments if they transition to principal and interest (P&I) payments. While most of these borrowers appear well placed to handle this change, liaison with banks suggests a small minority will face difficulty affording the higher scheduled payments.
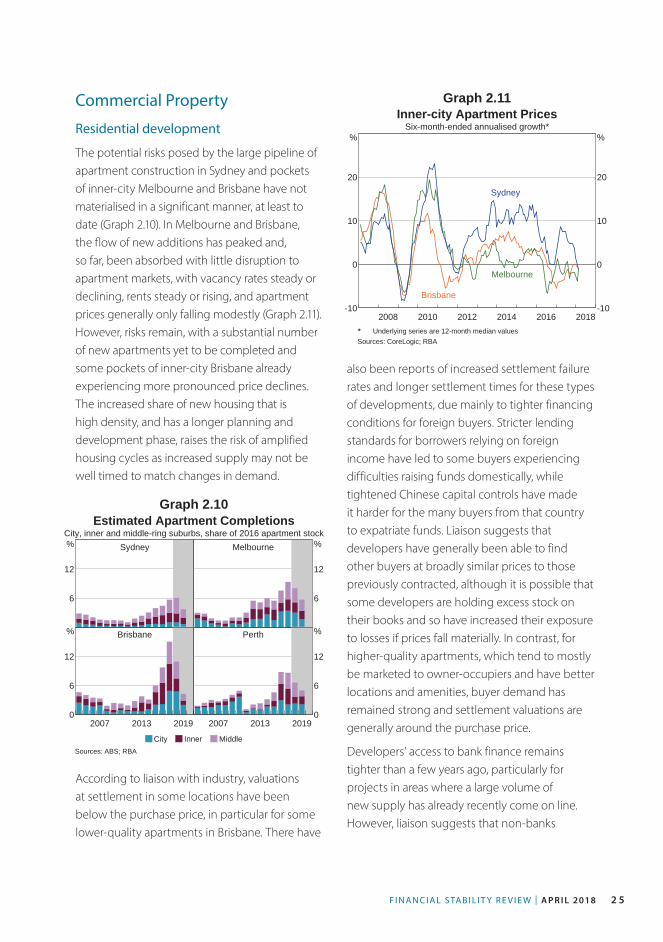
In apartment markets, the peak of the large pipeline of new additions in Melbourne and Brisbane looks to have passed, and to date has been absorbed without significant disruption.
Indeed vacancy rates are currently declining and falls in apartment prices have been modest in these cities. Settlement failures have been concentrated in lower-quality developments and there have been some reports of settlement delays, predominantly in Brisbane. Where settlement failure has occurred, developers appear to have largely been able to resell the apartment to another buyer, although some developers may be delaying selling apartments where there is weak demand. While the growth of the total housing stock does not appear excessive relative to overall population growth, ongoing strong growth of the apartment stock over the next year or so, especially in Brisbane, could yet weigh further on apartment market conditions there.
In non-residential commercial property markets, prices continue to increase strongly. This is particularly evident in the Sydney and Melbourne office property markets. Price growth has been underpinned by strong demand and some demolitions and conversions of existing office buildings to apartments, and it continues to exceed the rate of growth in rents, thereby further lowering yields. One risk is that, if global bond yields were to rise further, these low yields may not be sustainable as investors seek more attractive returns. In contrast to Sydney and Melbourne, conditions in the Perth and Brisbane office markets remain relatively weak.
In other parts of the business sector, conditions are generally favourable. Corporate profitability remains high and gearing low relative to the past. Business failure rates in the mining states
R E S E R V E B A N K O F AU S T R A L I A2 0
have stabilised after increasing, as the drag from mining investment has eased. The retail sector’s corporate insolvency rate also remains low, notwithstanding some recent high-profile failures amid a challenging competitive environment for some segments.
Household Sector
Household financial position
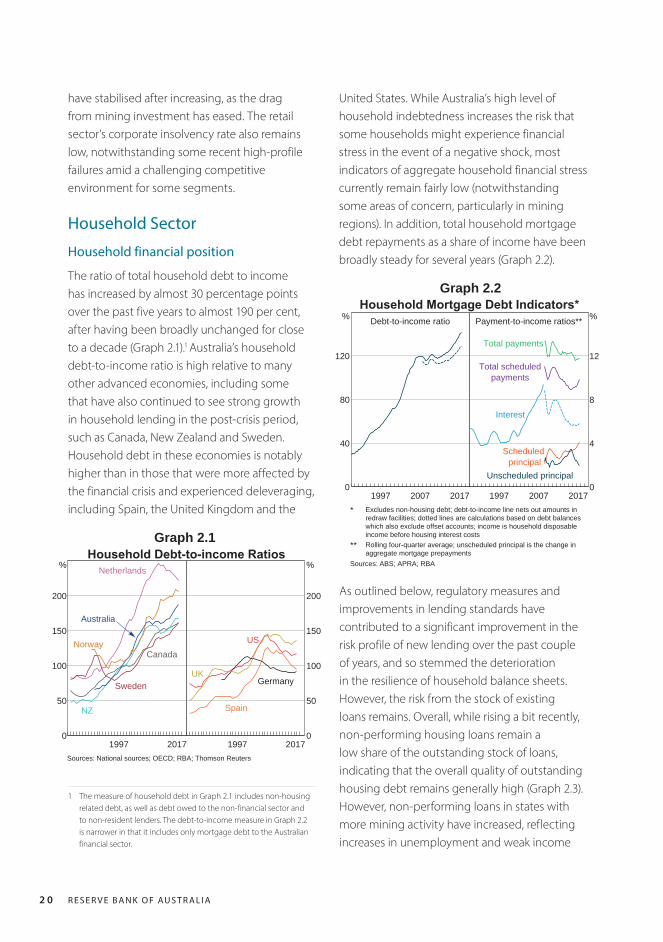
The ratio of total household debt to income has increased by almost 30 percentage points over the past five years to almost 190 per cent, after having been broadly unchanged for close to a decade (Graph 2.1).1 Australia’s household debt-to-income ratio is high relative to many other advanced economies, including some that have also continued to see strong growth in household lending in the post-crisis period, such as Canada, New Zealand and Sweden. Household debt in these economies is notably higher than in those that were more affected by the financial crisis and experienced deleveraging, including Spain, the United Kingdom and the
1 The measure of household debt in Graph 2.1 includes non-housing related debt, as well as debt owed to the non-financial sector and to non-resident lenders. The debt-to-income measure in Graph 2.2 is narrower in that it includes only mortgage debt to the Australian financial sector.
United States. While Australia’s high level of household indebtedness increases the risk that some households might experience financial stress in the event of a negative shock, most indicators of aggregate household financial stress currently remain fairly low (notwithstanding some areas of concern, particularly in mining regions). In addition, total household mortgage debt repayments as a share of income have been broadly steady for several years (Graph 2.2).
Graph 2.2Household Mortgage Debt Indicators*
Debt-to-income ratio
20071997 20170
40
80
120
% Payment-to-income ratios**
20071997 20170
4
8
12
%
Interest
Unscheduled principal
Scheduledprincipal
Total payments
Total scheduledpayments
* Excludes non-housing debt; debt-to-income line nets out amounts inredraw facilities; dotted lines are calculations based on debt balanceswhich also exclude offset accounts; income is household disposableincome before housing interest costs** Rolling four-quarter average; unscheduled principal is the change inaggregate mortgage prepayments
Sources: ABS; APRA; RBA
Graph 2.1Household Debt-to-income Ratios
1997 20170
50
100
150
200
%
Canada
NZ
Australia
Netherlands
Sweden
Norway
1997 20170
50
100
150
200
%
Spain
GermanyUK
US
Sources: National sources; OECD; RBA; Thomson Reuters
As outlined below, regulatory measures and improvements in lending standards have contributed to a significant improvement in the risk profile of new lending over the past couple of years, and so stemmed the deterioration in the resilience of household balance sheets. However, the risk from the stock of existing loans remains. Overall, while rising a bit recently, non-performing housing loans remain a low share of the outstanding stock of loans, indicating that the overall quality of outstanding housing debt remains generally high (Graph 2.3). However, non-performing loans in states with more mining activity have increased, reflecting increases in unemployment and weak income

F I N A N C I A L S TA B I L I T Y R E V I E W | A P R I L 2018 2 1
Graph 2.3
Graph 2.4
201320092005 20170.0
0.3
0.6
0.9
%
0.0
0.3
0.6
0.9
%
Banks’ Non-performing Housing Loans*Domestic books, share of housing loans
Impaired
Past-due
Total
* Past-due loans are 90+ days in arrears and well secured; impairedloans are in arrears or otherwise doubtful and not well secured
Sources: APRA; RBA
Incidence of Financial StressShare of households
With owner-occupiermortgage debt
20102004 20160
20
40
%
Experienced at leastone difficulty
Renting
20102004 20160
20
40
%
Expect difficulty raisingfunds in an emergency*
Experienced at leastthree difficulties
* $2 000 before 2009 and $3 000 from 2009 onwardsSources: HILDA Release 16.0; RBA
growth in these regions. In other states, the non-performing share of housing loans has been steady, indicating the potential risks associated with the quality of earlier lending have not materialised to date. Household net wealth also continues to rise, although the rate of increase has slowed more recently given the moderation in housing price growth.
Debt servicing ratios have increased, in part because of loan switching from IO to amortising products in response to the prudential measures in 2017. To date, households have partly accommodated these increases in payments by lowering their voluntary prepayments of principal and have been aided by the low interest rate environment. Consistent with this, comprehensive survey measures continue to suggest that, in aggregate, the incidence of household stress is relatively low by recent historical standards. Data from the Household Income and Labour Dynamics in Australia (HILDA) survey indicate that in 2016 fewer than 5 per cent of households had required mortgage payments greater than 50 per cent of their disposable income, with the majority of these households in the lowest income quintile.
The HILDA survey and the 2015/16 Household Expenditure Survey also indicate that the share of households experiencing financial stress has been the lowest since at least the early 2000s (Graph 2.4). While the overall level of stress among mortgaged households remains relatively low, there are some pockets of financial stress. In particular, the incidence of household financial stress is noticeably higher in Western Australia than in other parts of the country, with the rate of personal administrations rising further over 2017 and applications for property possessions increasing over recent years. Indeed, while there has been a rise in non-performing personal credit, this does not appear indicative of a broader deterioration in household finances (see ‘Box B: Recent Trends in Personal Credit’).
Prepayments enable households to build a financial buffer to cushion mortgage rate rises or income falls. Aggregate mortgage prepayments – balances in offset accounts and redraw facilities – are around 18 per cent of outstanding loan balances, or over 2½ years of scheduled repayments at current interest rates (Graph 2.5, left panel). These aggregates, however, mask substantial variation; about one-third
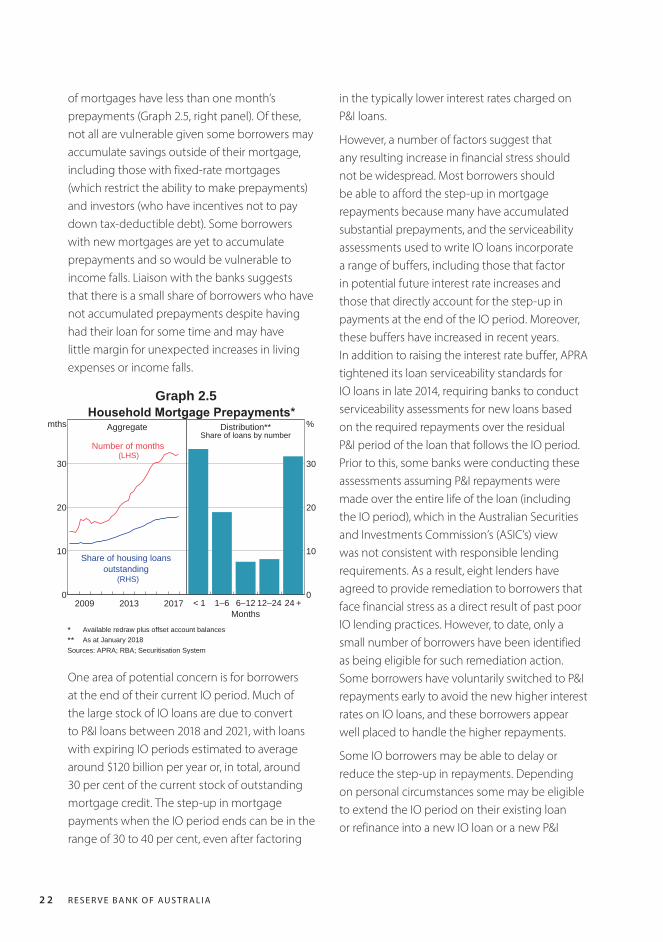
R E S E R V E B A N K O F AU S T R A L I A2 2
of mortgages have less than one month’s prepayments (Graph 2.5, right panel). Of these, not all are vulnerable given some borrowers may accumulate savings outside of their mortgage, including those with fixed-rate mortgages (which restrict the ability to make prepayments) and investors (who have incentives not to pay down tax-deductible debt). Some borrowers with new mortgages are yet to accumulate prepayments and so would be vulnerable to income falls. Liaison with the banks suggests that there is a small share of borrowers who have not accumulated prepayments despite having had their loan for some time and may have little margin for unexpected increases in living expenses or income falls.
in the typically lower interest rates charged on P&I loans.
However, a number of factors suggest that any resulting increase in financial stress should not be widespread. Most borrowers should be able to afford the step-up in mortgage repayments because many have accumulated substantial prepayments, and the serviceability assessments used to write IO loans incorporate a range of buffers, including those that factor in potential future interest rate increases and those that directly account for the step-up in payments at the end of the IO period. Moreover, these buffers have increased in recent years. In addition to raising the interest rate buffer, APRA tightened its loan serviceability standards for IO loans in late 2014, requiring banks to conduct serviceability assessments for new loans based on the required repayments over the residual P&I period of the loan that follows the IO period. Prior to this, some banks were conducting these assessments assuming P&I repayments were made over the entire life of the loan (including the IO period), which in the Australian Securities and Investments Commission’s (ASIC’s) view was not consistent with responsible lending requirements. As a result, eight lenders have agreed to provide remediation to borrowers that face financial stress as a direct result of past poor IO lending practices. However, to date, only a small number of borrowers have been identified as being eligible for such remediation action. Some borrowers have voluntarily switched to P&I repayments early to avoid the new higher interest rates on IO loans, and these borrowers appear well placed to handle the higher repayments.
Some IO borrowers may be able to delay or reduce the step-up in repayments. Depending on personal circumstances some may be eligible to extend the IO period on their existing loan or refinance into a new IO loan or a new P&I
Graph 2.5Household Mortgage Prepayments*
Aggregate
20132009 20170
10
20
30
mths
(LHS)
(RHS)
Share of housing loansoutstanding
Number of months
Distribution**Share of loans by number
< 1 1–6 6–12 12–24 24 +0
10
20
30
%
Months* Available redraw plus offset account balances** As at January 2018Sources: APRA; RBA; Securitisation System
One area of potential concern is for borrowers at the end of their current IO period. Much of the large stock of IO loans are due to convert to P&I loans between 2018 and 2021, with loans with expiring IO periods estimated to average around $120 billion per year or, in total, around 30 per cent of the current stock of outstanding mortgage credit. The step-up in mortgage payments when the IO period ends can be in the range of 30 to 40 per cent, even after factoring
F I N A N C I A L S TA B I L I T Y R E V I E W | A P R I L 2018 2 3
loan with a longer residual loan term. The share of borrowers who cannot afford higher P&I repayments and are not eligible to alleviate their situation by refinancing is thought to be small. In addition, borrowers who are in this situation as a result of past poor lending practices may be eligible for remediation from lenders. Most would be expected to have positive equity given substantial housing price growth in many parts of the country over recent years and hence would at least have the option to sell the property if they experienced financial stress from the increase in repayments. The most vulnerable borrowers would likely be owner-occupiers that still have a high LVR and who might find it more difficult to refinance or resolve their situation by selling the property.
Housing and mortgage markets
A key contributor to the abatement of new risks in mortgage and housing markets has been the regulatory measures to improve the quality of new lending. For several years, APRA has also taken a number of steps to improve lending standards by authorised deposit-taking institutions (ADIs), while ASIC has stepped up its monitoring and enforcement of lender compliance with responsible lending requirements. The types of lending that potentially posed the greatest risk to the macro-financial system have been specifically targeted since the end of 2014, including a 10 per cent benchmark for the growth of ADIs’ investor lending and a 30 per cent cap on the flow of their new IO loans.
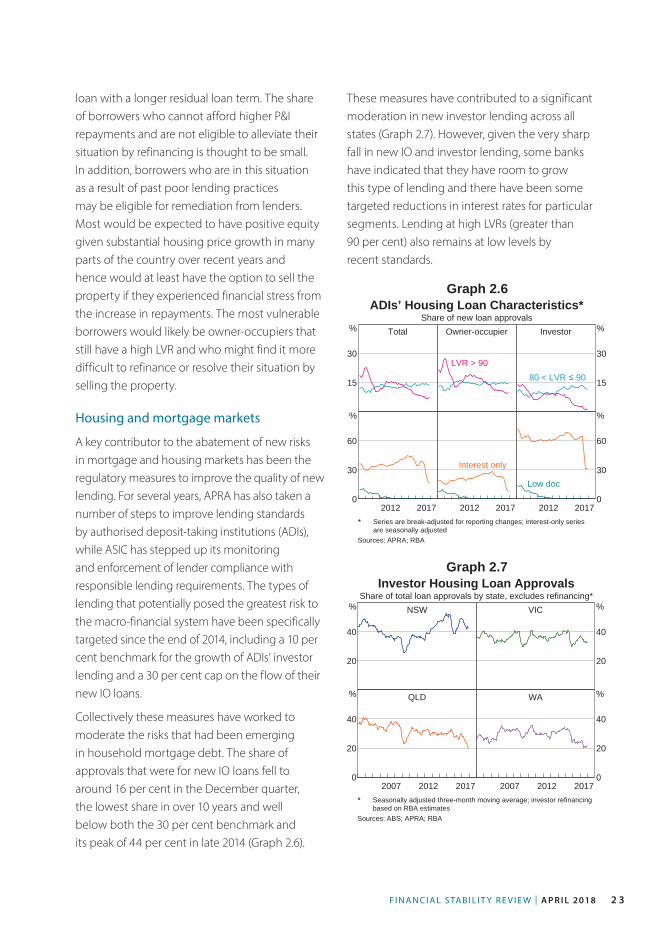
Collectively these measures have worked to moderate the risks that had been emerging in household mortgage debt. The share of approvals that were for new IO loans fell to around 16 per cent in the December quarter, the lowest share in over 10 years and well below both the 30 per cent benchmark and its peak of 44 per cent in late 2014 (Graph 2.6).
These measures have contributed to a significant moderation in new investor lending across all states (Graph 2.7). However, given the very sharp fall in new IO and investor lending, some banks have indicated that they have room to grow this type of lending and there have been some targeted reductions in interest rates for particular segments. Lending at high LVRs (greater than 90 per cent) also remains at low levels by recent standards.
Graph 2.6ADIs’ Housing Loan Characteristics*
Share of new loan approvalsTotal
15
30
% Owner-occupier
LVR > 90
Investor
15
30
%
80 < LVR ≤ 90
2012 20170
30
60
%
2012 2017
Interest only
2012 20170
30
60
%
Low doc
* Series are break-adjusted for reporting changes; interest-only seriesare seasonally adjusted
Sources: APRA; RBA
Graph 2.7Investor Housing Loan Approvals
Share of total loan approvals by state, excludes refinancing*NSW
20
40
% VIC
20
40
%
QLD
20122007 20170
20
40
% WA
20122007 20170
20
40
%
* Seasonally adjusted three-month moving average; investor refinancingbased on RBA estimates
Sources: ABS; APRA; RBA

R E S E R V E B A N K O F AU S T R A L I A2 4
Lenders have used interest rate differentials to alter the composition of their lending in order to comply with APRA’s expectations, in combination with some tightening of LVR restrictions. At present, new IO investment loans are priced at an average premium of around 85 basis points above new owner-occupier P&I loans. According to bank liaison, lenders are competing strongly for owner-occupier P&I borrowers that also have low LVRs, which has been reflected in lower interest rates for this group. There has also been a pick-up in lending to first home buyers as demand from investors has eased. The slowing in investor credit was initially partly offset by rising owner-occupier credit growth, although more recently this too has also slowed.
The easing in housing market conditions reflects a number of factors. In addition to APRA’s regulatory measures, earlier increases in interest rates for some types of loans, increased housing supply, and some reduction in demand from foreign buyers have contributed. However, a number of other factors have continued to support the market, including the ongoing low interest rate environment and population growth, particularly in Melbourne.
The easing has been most evident in Sydney, where housing prices have started to decline, although price growth has also slowed noticeably in Melbourne (Graph 2.8). In both cities, the decline in price growth has been more pronounced for detached houses and more expensive properties. This suggests that the regulatory measures, which have had more impact on investors (who tend to purchase apartments and less expensive properties), were not the only drivers of the slowing housing market conditions. In a further sign of easing conditions, auction clearance rates are well below their decade average in Sydney and have also been declining in Melbourne, although
auction volumes remain high. In Brisbane, apartment prices have been relatively stable following price falls in 2016 and 2017. Falls in rental income remain a risk for investors, particularly in Perth and inner-city areas of Brisbane. The housing market in Perth remains weak. While the pace of price and rent declines has slowed, the vacancy rate remains elevated (Graph 2.9).
Graph 2.8
Graph 2.9
Housing Price Growth by Dwelling TypeSix-month-ended annualised
Sydney
0
20
%
Apartments
Melbourne
0
20
%
Houses
Brisbane
20132008 2018-20
0
20
% Perth
20132008 2018-20
0
20
%
Sources: CoreLogic; RBA
Rental Vacancy RatesQuarterly, seasonally adjusted*
3
6
%
Sydney
3
6
%
Melbourne**
200719971987 20170
3
6
%
Brisbane
200719971987 20170
3
6
%
Perth
* 12-month moving average** Series break December quarter 2002Sources: RBA; REIA; REIVA
F I N A N C I A L S TA B I L I T Y R E V I E W | A P R I L 2018 2 5
Commercial Property
Residential development
The potential risks posed by the large pipeline of apartment construction in Sydney and pockets of inner-city Melbourne and Brisbane have not materialised in a significant manner, at least to date (Graph 2.10). In Melbourne and Brisbane, the flow of new additions has peaked and, so far, been absorbed with little disruption to apartment markets, with vacancy rates steady or declining, rents steady or rising, and apartment prices generally only falling modestly (Graph 2.11). However, risks remain, with a substantial number of new apartments yet to be completed and some pockets of inner-city Brisbane already experiencing more pronounced price declines. The increased share of new housing that is high density, and has a longer planning and development phase, raises the risk of amplified housing cycles as increased supply may not be well timed to match changes in demand.
Graph 2.10
Graph 2.11
Estimated Apartment CompletionsCity, inner and middle-ring suburbs, share of 2016 apartment stock
Sydney
6
12
% Melbourne
6
12
%
Brisbane
20132007 20190
6
12
% Perth
20132007 20190
6
12
%
City Inner MiddleSources: ABS; RBA
20162014201220102008 2018-10
0
10
20
%
-10
0
10
20
%
Inner-city Apartment PricesSix-month-ended annualised growth*
Sydney
Brisbane
Melbourne
* Underlying series are 12-month median valuesSources: CoreLogic; RBA
also been reports of increased settlement failure rates and longer settlement times for these types of developments, due mainly to tighter financing conditions for foreign buyers. Stricter lending standards for borrowers relying on foreign income have led to some buyers experiencing difficulties raising funds domestically, while tightened Chinese capital controls have made it harder for the many buyers from that country to expatriate funds. Liaison suggests that developers have generally been able to find other buyers at broadly similar prices to those previously contracted, although it is possible that some developers are holding excess stock on their books and so have increased their exposure to losses if prices fall materially. In contrast, for higher-quality apartments, which tend to mostly be marketed to owner-occupiers and have better locations and amenities, buyer demand has remained strong and settlement valuations are generally around the purchase price.
Developers’ access to bank finance remains tighter than a few years ago, particularly for projects in areas where a large volume of new supply has already recently come on line. However, liaison suggests that non-banks
According to liaison with industry, valuations at settlement in some locations have been below the purchase price, in particular for some lower-quality apartments in Brisbane. There have
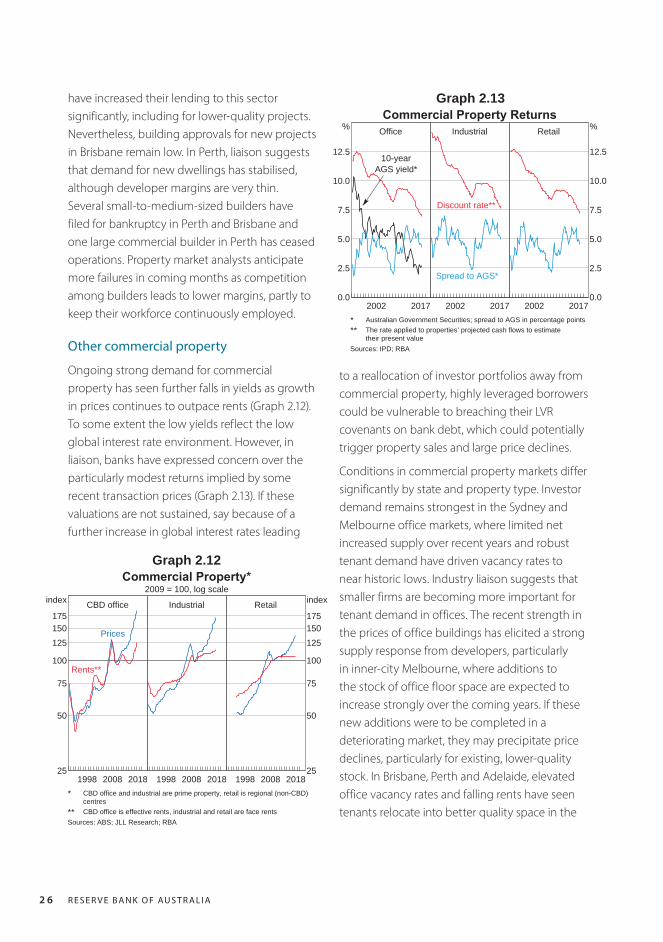
R E S E R V E B A N K O F AU S T R A L I A2 6
have increased their lending to this sector significantly, including for lower-quality projects. Nevertheless, building approvals for new projects in Brisbane remain low. In Perth, liaison suggests that demand for new dwellings has stabilised, although developer margins are very thin. Several small-to-medium-sized builders have filed for bankruptcy in Perth and Brisbane and one large commercial builder in Perth has ceased operations. Property market analysts anticipate more failures in coming months as competition among builders leads to lower margins, partly to keep their workforce continuously employed.
Other commercial property
Ongoing strong demand for commercial property has seen further falls in yields as growth in prices continues to outpace rents (Graph 2.12). To some extent the low yields reflect the low global interest rate environment. However, in liaison, banks have expressed concern over the particularly modest returns implied by some recent transaction prices (Graph 2.13). If these valuations are not sustained, say because of a further increase in global interest rates leading
to a reallocation of investor portfolios away from commercial property, highly leveraged borrowers could be vulnerable to breaching their LVR covenants on bank debt, which could potentially trigger property sales and large price declines.
Conditions in commercial property markets differ significantly by state and property type. Investor demand remains strongest in the Sydney and Melbourne office markets, where limited net increased supply over recent years and robust tenant demand have driven vacancy rates to near historic lows. Industry liaison suggests that smaller firms are becoming more important for tenant demand in offices. The recent strength in the prices of office buildings has elicited a strong supply response from developers, particularly in inner-city Melbourne, where additions to the stock of office floor space are expected to increase strongly over the coming years. If these new additions were to be completed in a deteriorating market, they may precipitate price declines, particularly for existing, lower-quality stock. In Brisbane, Perth and Adelaide, elevated office vacancy rates and falling rents have seen tenants relocate into better quality space in the
Graph 2.12
Graph 2.13
Commercial Property*2009 = 100, log scale
CBD office
20081998 201825
50
75
100
125150175
index
Prices
Rents**
Industrial
20081998 2018
Retail
20081998 201825
50
75
100
125150175
index
* CBD office and industrial are prime property, retail is regional (non-CBD)centres** CBD office is effective rents, industrial and retail are face rents
Sources: ABS; JLL Research; RBA
Commercial Property ReturnsOffice
2002 20170.0
2.5
5.0
7.5
10.0
12.5
%
10-yearAGS yield*
Industrial
2002 2017
Discount rate**
Spread to AGS*
Retail
2002 20170.0
2.5
5.0
7.5
10.0
12.5
%
* Australian Government Securities; spread to AGS in percentage points** The rate applied to properties’ projected cash flows to estimatetheir present value
Sources: IPD; RBA

F I N A N C I A L S TA B I L I T Y R E V I E W | A P R I L 2018 2 7
commercial business district (CBD). This continues to place pressure on second-grade and non-CBD markets, where the outlook remains weak (Graph 2.14).
Graph 2.14
Graph 2.15
CBD Office Vacancy RatesBy property grade*
Sydney
10
20
30
% Melbourne
10
20
30
%
Secondary grade
Brisbane
20081998 20180
10
20
30
%
Prime grade
Perth
20081998 20180
10
20
30
%
* Prime grade includes premium and A grade stock weighted by floorspace; secondary grade includes B grade, C grade and D grade stockweighted by floor space
Sources: Property Council of Australia; RBA
Commercial Property Exposures by SegmentConsolidated Australian operations
20112005 20170
20
40
60
$b
Office
Residential
Land development
20112005 20170
20
40
60
$b
Industrial
Other
Tourism & leisure
Retail
Sources: APRA; RBA
Conditions in retail property markets continue to be subdued. Rents have been flat amid headwinds to retailers’ margins that are associated with strong competition from online and new entrants. Banks have nevertheless continued to fund projects which increase the entertainment and hospitality services provided by existing shopping centres (to differentiate these retail offerings from online shopping) (Graph 2.15). At the same time, they view the outlook for some older and less well-located retail properties as weak due to lower tenant demand.
Australian-owned banks have tightened their lending criteria for commercial property following APRA’s thematic review of the industry in 2016 and they have slowed the growth in their exposures (Graph 2.16). Notably, their responses included a mix of lowering maximum LVRs, raising minimum interest coverage ratios
and capping the percentage of foreign presales in residential developments. Deal flow data show a reduction in average LVRs, particularly for residential development deals, over 2017. Australian-owned banks’ commercial property exposures are little changed over the past two years while the exposures of foreign banks, especially those headquartered in Asia, have continued to grow (Graph 2.16).
Graph 2.16Commercial Property Exposures
Consolidated Australian operations
20112005 20170
75
150
225
$b
All banks*
Major banks*
Non-major banks byownership
20112005 20170
15
30
45
$b
European
Australian
Otherforeign
Asian
* Excludes foreign exposuresSources: APRA; RBA

R E S E R V E B A N K O F AU S T R A L I A2 8
rising profits to reduce debt further, with the gearing ratio of resource-related corporations continuing to decline. However, the earnings of mining services companies have maintained their downward trend reflecting the focus on cost reductions by resource producers. In the mining states, business failure rates have stabilised, as the drag from declining mining investment has eased.
Despite an overall improvement in business conditions, the discretionary retail sector (including clothing, apparel and footwear and department stores) is facing challenges. These businesses are experiencing strong competition from online and international retailers and liaison indicates that retailers are investing in technology to increase efficiency. Although there have been some recent high-profile failures, the retail sector’s corporate insolvency rate remains low. R
Graph 2.17
Graph 2.18
Listed Corporations’ Distance-to-default*Debt-weighted, three-month moving average
Resource-related
20122006 20180
3
6
9
stddev
25thpercentile
Other
20122006 20180
3
6
9
stddev
Median
10thpercentile**
* Calculated up to 28 February 2018 using a sample of the largest 300corporations listed on the ASX by debt; excludes financial andforeign-domiciled corporations** Between 2008 and 2011, distance-to-default measures turned negativefor around 100 non-resource-related companies, implying a highprobability of default; of these, around one-third went on to default
Sources: Bloomberg; Morningstar; RBA
20102003199619891982 20170
10
20
30
%
0
10
20
30
%
Debt-servicing RatiosNon-financial businesses’ interest payments as a share of profits
All businesses*Listed corporations**
Unincorporated businesses*
(excl. resource-related)
* Gross interest paid on intermediated debt from financial institutionslocated in Australia** Net interest paid on all debt as a share of EBITDA; excludesforeign-domiciled corporations
Sources: ABS; APRA; Bloomberg; Morningstar; RBA
Other Business SectorsBusinesses’ finances generally remain in good shape, supported by the ongoing improvement in overall economic conditions and low interest rates. Aggregate earnings of listed corporations continued to rise across most industries over the second half of 2017. The gearing ratio of listed corporations remains below its historical average and a market-based measure of default risk indicates that listed companies remain in generally good financial health (Graph 2.17). The business sector is well placed to service its debt; businesses’ debt-servicing ratios declined over the second half of 2017, supported by a pick-up in profits (Graph 2.18).
Conditions in the resources sector have continued to improve. Earnings of resource-related corporations increased further over the second half of 2017, supported by higher commodity prices, increased exports and ongoing cost reductions. Many listed resource-related corporations have used their

F I N A N C I A L S TA B I L I T Y R E V I E W | A P R I L 2018 29
Box B
Recent Trends in Personal Credit
Personal credit accounts for a small share of household credit and a very small share of banks’ total domestic lending. Nonetheless, banks’ non-performing ratio on personal credit has been drifting upwards over recent years. This box examines the factors behind this trend. Overall, the recent rise in the ratio of non-performing personal loans does not appear to be indicative of a broader deterioration in household finances. Instead, the rise seems to mostly reflect cyclical effects of economic conditions in mining-exposed states, as well as structural changes in lending markets that resulted in a change in the composition of personal credit towards borrowers who have lower creditworthiness, on average. This is because mortgagors, who typically display greater creditworthiness, have been able to increasingly use housing-secured financing to fund consumer spending. The changes in the use of personal credit and in borrower type confound the usefulness of personal credit indicators as measures of overall household financial health.
Components of Personal Credit and Recent Trends in Non-performing LoansPersonal credit is borrowing by households that is not related to residential housing or for the purpose of funding unincorporated businesses. It can be divided into two broad categories: fixed-term loans and revolving credit facilities (Graph B1). Fixed-term loans are typically for an agreed loan size that is fully drawn down and
must be paid back within a pre-determined period. They are typically undertaken for the purchase of large consumer items such as cars and holidays. Revolving credit facilities usually have a credit limit that can be used when required with no fixed repayment schedule. This lending is split into credit card debt and other revolving credit.
After rising strongly in the years prior to the global financial crisis, personal credit balances from Australian banks have remained fairly stable for the past decade, at around $110 billion (Graph B1).1 This contrasts with the growth in mortgage lending, which has more than doubled during that period, so that the share of personal credit in Australian banks’ lending to the household sector has fallen, from 12 per cent in 2009 to just 6 per cent of late. Over two-fifths of
1 Around 75 per cent of total personal credit is provided by banks.
Term loans and leasing* Credit cards Other revolving credit
201320092005 20170
25
50
75
100
125
$b
0
25
50
75
100
125
$b
Personal Credit by ComponentBreak-adjusted, seasonally adjusted
* Leasing accounts for less than one per cent of personal creditSources: APRA; RBA
Graph B1

R E S E R V E B A N K O F AU S T R A L I A30
this debt represents fixed-term loans, two-fifths credit card debt and the remainder other revolving credit. Other revolving credit, which largely represents margin lending to purchase equities or other financial assets, has been declining gradually over time due to reduced risk appetite post the financial crisis and new responsible lending obligations in regard to margin lending that were introduced in 2010.2
While the level of personal credit has been flat in nominal terms for a decade, the share of non-performing loans within that aggregate has been drifting higher for over a decade (Graph B2).3 This trend is evident in data for both credit card debt and other personal debt. Moreover, while loan performance for housing credit improved for a few years shortly after the global financial crisis, the non-performing ratio for personal lending did not decline at this time.
2 Margin loans enable households to have a leveraged exposure to equity markets. For details see Wong A (2009), ‘Recent Developments in Margin Lending in Australia’, RBA Bulletin, December.
3 Non-performing loans comprise well-secured loans that are at least 90 days in arrears, as well as impaired loans, where the full repayment of interest and principal is doubtful and the loan is not well secured.
Factors Affecting Non-performing Personal CreditThere are a range of structural, cyclical, and reporting factors that appear to have contributed to the upwards drift in banks’ non-performing personal credit. Several structural changes in the lending market have likely led to a change in the composition of personal credit towards borrowers who have lower creditworthiness, on average. The availability and use of redraw facilities and offset accounts linked to residential mortgage loans has increased over time and the vast majority of mortgages have either redraw facilities attached to them, offset accounts or both.4 Indeed, balances in these accounts are now well over double the total stock of personal credit (Graph B3). Drawing down on offset and redraw accounts enables borrowers to fund large expenditures such as home renovations, car purchases, or even pay off credit card balances, without having to take out a personal loan. Banks have contributed to this switch in borrowing behaviour by widening the interest
4 Redraw facilities give the borrower the option of withdrawing accumulated mortgage prepayments and offset accounts act as an at-call deposit account, with funds in the account netted against the borrower’s outstanding mortgage balance for the purposes of calculating interest on the loan.
201320092005 20170.0
0.5
1.0
1.5
%
0.0
0.5
1.0
1.5
%
Banks’ Non-performing Household LoansShare of loans by type*
Other personal
Credit cards
Housing
* Seasonally adjusted, six-month moving averageSources: APRA; RBA
Graph B2
Mortgage Buffers and Personal CreditBreak-adjusted, seasonally adjusted
Mortgage buffers
20132009 201750
125
200
275
$b Personal credit
20132009 201750
125
200
275
$b
Sources: APRA; RBA
Graph B3

F I N A N C I A L S TA B I L I T Y R E V I E W | A P R I L 2018 31
rate differential between (secured) mortgages and (generally unsecured) personal credit, with a notable repricing in 2008 that reflected a reassessment of risk at the time of the global financial crisis (Graph B4). As a consequence, liaison with banks suggests that borrowers who seek fixed-term personal loans are increasingly a pool of renters, younger and/or lower-income borrowers, all of whom typically have a higher level of non-performing loans than homeowners.
The same structural change might account for the gradual rise in non-performing loans for credit card debt. Most cardholders are increasingly using credit cards for transactional purposes rather than for borrowing. The share of cardholders who always pay off their credit card balances in full each month has increased over the past decade (Graph B5). In line with this, the share of credit card debt accruing interest has declined from 72 per cent in 2007 to about 62 per cent currently. The growing habit of repaying it in full each month accounts for the stable stock of credit card debt, despite their increased use as a means of payment. Given mortgagors have the ability to use offset and redraw facilities to finance large consumer purchases, it is likely they account for much of the decrease in the use of credit cards as a means of financing purchases that are paid off over time. This suggests that it is younger and lower-income borrowers (who typically rent) who constitute a larger share of those using credit cards to fund purchases that are paid off gradually over time. Data from HILDA also suggest renters are more likely to pay interest on credit cards than owner-occupiers, consistent with owner-occupiers having access to other sources of debt, and tending to be older and having higher income.
201020132016
Never pays interest Pays interest0
20
40
60
%
0
20
40
60
%
Credit Card Repayment BehaviourShare of credit card holders
Source: RBA calculations based on data from Colmar Brunton, Ipsosand Roy Morgan Research
201320092005 20170
3
6
9
12
%
0
3
6
9
12
%
Spreads on Personal Credit ProductsTo variable housing interest rate
Credit cards**
Term loans*
* Unsecured variable rate** Standard credit card interest rateSource: RBA
Graph B4
Graph B5
Data from the Survey of Income and Housing indicate that the share of credit card and motor vehicle debt that is held by the lowest income quintile increased from 5 per cent in the 2003/04 survey to just under 10 per cent in 2015/16 and that the share held by renters increased from about one-quarter to around one-third. Over the same period, the share of the total number of loans held by renters as well as by lower-income households also increased. The structural change introduced into mortgage lending products can help explain both the lack of growth of personal credit over the past decade as well as the rising share of non-performing loans within that aggregate.

R E S E R V E B A N K O F AU S T R A L I A32
Nonetheless, there is some evidence that the rise in non-performing personal loans reflects a cyclical increase in financial stress of households in some parts of the country. In liaison with the RBA, banks have stated that the challenging economic conditions in Western Australia and parts of Queensland following the unwinding of the mining investment boom are contributing to the rise in non-performing personal loans. Households in these areas have experienced falls in income and property prices, as well as rising unemployment, thus making it harder for them to repay both their housing and personal loans. Accordingly, these areas have also seen a rise in personal administrations.5 The share of personal administrations in mining-exposed states relative to the total rose from around 30 per cent in 2009 to 40 per cent in 2017. Banks also report that there has been little change in non-performing ratios outside of these mining-related areas.
Lastly, part of the increase in banks’ non-performing loans reflects reporting changes, in particular related to the reporting of hardship accounts. Under consumer credit laws, banks (and other lenders) are obliged to consider variations in the credit contracts of borrowers who are experiencing temporary financial hardship. In 2012, APRA clarified how loans in hardship should be reported in order to improve consistency across lending institutions. This change has increased the reported level of non-performing loans, although the consequent increase was relatively small in aggregate and has been spread over several years as banks introduced the new reporting standard at different times. R
5 Personal administrations include bankruptcy, debt agreements and personal insolvency agreements.

F I N A N C I A L S TA B I L I T Y R E V I E W | A P R I L 2018 3 3
3. The Australian Financial System
The Australian financial system remains resilient and its ability to withstand adverse shocks continues to be strengthened. Banks’ capital ratios are well above current regulatory minimums, close to or above the Australian Prudential Regulation Authority’s (APRA’s) ‘unquestionably strong’ targets (which come into effect in 2020) and within the range identified as being sufficient to withstand most historical episodes of financial crisis globally. Banks’ profit growth picked up over the past year and profits are sufficient to enable them to further increase their capital. Asset quality is very good overall, though mortgage loan arrears remain elevated in mining-related regions.
In February, APRA proposed revisions to the capital framework for authorised deposit-taking institutions (ADIs). These proposals underpin APRA’s ‘unquestionably strong’ capital targets and incorporate modifications triggered by revisions to the international capital framework (known as ‘Basel III’). The proposed framework changes the capital needed for different portfolios without raising total capital requirements of the industry beyond those announced in mid 2017. In doing so, it aims to address the risks posed by the concentration of mortgages on banks’ balance sheets by raising the amount of capital that must be used to fund these loans relative to others. APRA also proposes to make capital more risk-sensitive, including for the overall mortgage book by raising risk weights on interest-only (IO) and investor loans.
A central challenge facing banks is to address issues stemming from their culture. There have been various instances of misconduct, which are now being examined by the Royal Commission into Misconduct in the Banking, Superannuation and Financial Services Industry. The adverse implications of cultural issues and poor processes are starting to materialise in the form of customer refunds, higher costs to comply with inquiries and the setting aside of provisions for potential misconduct penalties. This has contributed to investors applying a higher risk premium to bank shares of late. Regulators and the banking industry have been taking steps to improve risk culture and address its consequences.
Residential mortgage lending by non-ADIs has accelerated over the past year, though their share of outstanding residential mortgages remains small and banks’ exposures to the sector are limited. Their expansion has in part been in response to the increase in lending rates by ADIs for investor and IO loans, making non-ADI lenders more competitive for these loans. Favourable funding conditions in residential mortgage-backed security (RMBS) markets have also contributed.
The resilience of insurers has increased as profits have recovered and capital has been built up. General insurers’ profitability has improved to around historically normal levels as they addressed earlier declines in commercial premiums and mitigated the impact of higher natural disaster claims through reinsurance.

R E S E R V E B A N K O F AU S T R A L I A3 4
Life insurers’ profitability has stabilised and the sector has responded to ongoing structural issues by reducing risk through additional reinsurance and capital. There is yet to be a recovery in lenders’ mortgage insurers’ (LMI) profitability, given an ongoing decline in the volume of high loan-to-valuation (LVR) loans and rising claims in mining-related regions, but LMIs remain well capitalised. Risks to the superannuation sector are limited and financial market infrastructures have been working to increase their ability to withstand operational shocks.
Banks’ Domestic Asset PerformanceThe performance of Australian banks’ domestic assets continued to improve over the second half of 2017 (Graph 3.1). The share of non-performing assets declined, driven mostly by business loans while there was little change for housing loans.
Banks’ housing non-performing loans (NPLs) are higher than historically but remain low. These are mostly well secured, with the proportion of impaired loans remaining steady. Conditions
continue to vary across states with arrears in Western Australia higher than in the rest of Australia. In liaison with the Reserve Bank, banks indicated that they had become more optimistic about the outlook for Western Australia and do not expect a significant further deterioration in loan performance there. Some banks also noted an increase in arrears among some borrowers switching to principal & interest (P&I) loans at the expiry of the IO period of their loans. Partly, this was borrowers taking time to adjust to the higher required repayments (given they would then include principal) but most subsequently returned to meeting their payments in full. However, for a small share of borrowers higher arrears reflect difficulty making these higher repayments. Borrowers voluntarily switching before the IO period expiry – to take advantage of the lower interest rate on P&I loans – were meeting the higher repayments.
Personal lending remains a very small share of both total lending and household borrowing and so is currently not a risk to banks or the household sector in aggregate. The NPL rates of personal loans declined a little over the second half of 2017, although they remain high compared with their history. This recent improvement was driven by a decline in credit card NPLs. The share of other non-performing personal loans was steady over this period but remains close to its peak. The elevated share of non-performing personal loans mostly reflects the cyclical effects of economic conditions in mining-exposed states and structural changes as fewer older and higher-income borrowers take personal loans because they can typically more cheaply draw down on their accumulated excess mortgage payments. The latter has likely led to a change in the composition of personal credit towards borrowers who, on average, have lower creditworthiness (see `Box B: Recent Trends in Personal Credit’).
Graph 3.1Banks’ Non-performing Assets
Domestic books
Share of all loans
20122007 20170
1
2
3
4
%
Total
Share by type of loan*
20122007 20170
1
2
3
4
%
Personal
Housing
(4%)
Business**(35%)
(61%)
* Each category’s share of total domestic lending at December 2017 isshown in parentheses** Includes lending to financial businesses, bills, debt securities and othernon-household loans
Sources: APRA; RBA

F I N A N C I A L S TA B I L I T Y R E V I E W | A P R I L 2018 3 5
Credit ConditionsTotal credit growth eased over the past six months (Graph 3.2). Housing credit growth edged lower with a marked slowing in the growth of credit to investors. Housing investor credit growth has remained below the 10 per cent benchmark first announced by APRA in late 2014, with the more recent restriction on IO lending and changed sentiment contributing.
In the past, rapid expansion by foreign banks has exacerbated asset price and economic cycles by amplifying the credit supply cycle and prompting domestic banks to loosen lending criteria to retain market share. In the current upswing these risks appear to have been contained to date, due to the simultaneous tightening of lending standards in response to APRA’s onsite review of commercial property lending in 2016 and a broader pullback by Australian-owned banks. However, given the role that this type of lending has played in previous periods of financial stress, both in Australia and abroad, it is important to remain vigilant about these risks.
International ExposuresAustralian-owned banks have reduced their international lending as a share of total assets since 2015. The decline has been broad based across most countries and is expected to continue as ANZ completes the divestment of some Asian businesses this year. The notable exception over this time has been lending to New Zealand entities, mostly via the subsidiaries of the Australian-owned banks, which has increased faster than the banks’ total assets. This lending is concentrated in residential mortgages, where risks are elevated (as discussed in ‘The Global Financial Environment’ chapter). The rising concentration of Australian banks’ assets to both the New Zealand and Australian housing markets has seemingly reduced their diversification, given the historical correlation of these housing markets. However, this shift towards housing lending, which has historically generated higher risk-adjusted returns, has also supported their profits.
A longstanding feature of Australian banks is the scale of their offshore borrowing. Much of this offshore borrowing is in foreign currencies. Australian-located banks’ net foreign
Graph 3.2Credit Growth
Six-month-ended annualised
20132008 2018-10
0
10
20
%
Total
Household
BusinessHousing
20132008 2018-10
0
10
20
%
Investor
Owner-occupier
Sources: APRA; RBA
Business credit growth has eased in recent months, consistent with subdued merger and acquisition activity. The moderate growth in business credit over recent years has not materially constrained businesses’ investment as most is financed with internal funds rather than debt. The major banks have continued to grow their property exposures to the retail segment while paring back exposures to residential development. Business lending by foreign-owned banks operating in Australia has continued to increase at a faster pace than lending by Australian-owned banks, driven primarily by banks with Asian headquarters. Asian banks now supply 12 per cent of total business credit in Australia, compared with 6 per cent in 2012, with this growth driven particularly by infrastructure and commercial property lending.

R E S E R V E B A N K O F AU S T R A L I A3 6
currency liability position as at March 2017 was $238 billion, which was around 120 per cent of their total capital. However, the 2017 Survey of Foreign Currency Exposures showed that this position remains fully hedged by banks, suggesting they are resilient to the direct effects of a sudden depreciation of the Australian dollar.1 More generally, global investors have historically been less likely to purchase bank debt outside their own country in stress episodes. However, Australian banks have reduced their use of short-term funding over the past decade and also now borrow from a more diverse range of countries. Some other factors also reduce banks’ vulnerability to foreigners not rolling over funding. These include that past episodes of financial stress suggest the Australian dollar may well depreciate in this instance, which would both reduce the amount of foreign currency banks would need to raise and see them receiving collateral against their derivatives. Further, Australian banks largely use foreign currency borrowing to fund Australian dollar assets, meaning that if foreign funding were to retreat, alternative funding can be sourced domestically, including as a last resort from Reserve Bank open market operations.2
Liquidity and FundingAustralian banks also remain resilient to potential domestic liquidity shocks, with both their Liquidity Coverage Ratio (LCR) and Net Stable Funding Ratio (NSFR) well above the 100 per cent minimum requirements. The LCR measures banks’ buffers of liquid assets against short periods of liquidity stress. The NSFR, which came into effect in January 2018, is intended to complement the LCR by encouraging banks to fund less
1 See Berger-Thomson L and B Chapman (2017), ‘Foreign Currency Exposure and Hedging in Australia’, RBA Bulletin, December, pp 67–76.
2 See Debelle G (2011), ‘Bank Funding’, Address to the 24th Annual Finance & Treasury Association Congress, Sydney, 19 October.
liquid assets with more stable liabilities, such as long-term debt and retail deposits.
The composition of Australian banks’ funding has been stable over the past year. This comes after a lengthy period of considerable changes to their liability mix as banks sought to increase their resilience to liquidity shocks, and meet the requirements of the LCR and NSFR, by increasing the share of deposit and longer-term debt financing. Conditions for issuing long-term bonds remain favourable, with spreads currently around their lowest level since before the financial crisis and net issuance remaining sizeable (Graph 3.3; Graph 3.4). This, coupled with slower growth in assets, has enabled banks to reduce the rates they pay on deposit funding. As a result, overall funding costs for Australian banks declined over the past year.3 The value of bonds maturing in 2018 is somewhat less than in each of the past seven years, meaning banks are more resilient to any potential market volatility.
3 A detailed discussion of changes in banks’ funding costs can be found in McKinnon T (2018), RBA Bulletin, March. Available at <http://www.rba.gov.au/publications/bulletin/2018/mar/developments-in-banks-funding-costs-and-lending-rates.html>.
Graph 3.3Banks’ Debt Pricing
Spread to swap
Short term
20142010 20180
30
60
90
bps
Australia*US**
Long term***
20142010 20180
50
100
150
bps
* Three-month bank bill swap to three-month overnight indexed swap** Three-month LIBOR to swap*** Major banks’ three-to-five-year A$ bonds on a residual maturity basisto four-year interest rate swap
Sources: AFMA; Bloomberg; Tullett Prebon (Australia); UBS AG, AustraliaBranch

F I N A N C I A L S TA B I L I T Y R E V I E W | A P R I L 2018 3 7
Some banks have also been lengthening the duration of their recent bond issues to better manage future refinancing and take advantage of low long-term rates.
In contrast, spreads on short-term debt have recently spiked to their highest level since 2009. In the past, this has typically been an indicator of market stress or a perception that the near-term credit risk of banks had risen. However, in this instance it appears instead to be due to changes in the demand for and supply of US money market instruments, given that spreads on long-term funding remain very narrow (for further details, see ‘The Global Financial Environment’ chapter). The rise in US short-term bank spreads has spilled over into Australia as domestic banks, who typically fund a significant share of their Australian activities in US markets, have sought to shift some of their funding back to domestic debt markets. (The exposure of banks and other financial institutions to higher interest rates is discussed in ‘Box C: Interest Rate Risk in the Australian Financial System’.)
Capital and ProfitsHigher capital levels have increased the resilience of Australian banks to adverse shocks.
Capital ratios are well above current minimum requirements and for most ADIs are close to or above APRA’s ‘unquestionably strong’ capital targets that apply from 2020 (Graph 3.5). Banks have continued to accumulate capital over recent years and now have Tier 1 capital ratios that are more than 50 per cent higher than before the financial crisis (Graph 3.6). This rise has been underpinned by higher retained earnings and slower risk-weighted asset growth,
Graph 3.4
MaturitiesBuybacks
Net issuance*
2015201220092006 2018-150
-100
-50
0
50
100
$b
-150
-100
-50
0
50
100
$b
Banks’ Bond Issuance and MaturitiesA$ equivalent
* Dot represents year-to-dateSource: RBA
Graph 3.5CET1 Capital Ratios
Using current capital framework, December 2017
0
5
10
15
%
Major banks
‘Unquestionablystrong’
benchmark
Regulatoryrequirement*D-SIB add-on*Additional capital
Other ASX-listedADIs
0
5
10
15
%
Unlisted ADIs**
* Requirement includes capital conservation buffer; domesticsystemically important bank (D-SIB) add-on only applies to the majorbanks** Some unlisted ADIs have capital ratios above 20 per cent (not shown)
Sources: APRA; RBA
Graph 3.6
20122007200219971992 20170
4
8
12
%
0
4
8
12
%
Banks’ Capital Ratios*Consolidated global operations
Total
Tier 1
Tier 2
CET1
* Per cent of risk-weighted assets; break in March 2008 due to theintroduction of Basel II; break in March 2013 due to the introduction ofBasel III
Source: APRA

R E S E R V E B A N K O F AU S T R A L I A3 8
as Australian banks have pulled back from (capital-intensive) institutional lending. ANZ and CBA’s recently announced divestments of parts of their wealth and overseas portfolios should further increase their capital ratios in the coming year. On an internationally comparable basis, the major banks have Common Equity Tier 1 (CET1) capital ratios of around 16 per cent. This places them in the top quartile of similar banks internationally and within the range that research has found would have been sufficient to withstand the majority of historical bank crises.4
In February, APRA released proposed revisions to the capital framework for ADIs.5 These revisions underpin its ‘unquestionably strong’ capital targets that were announced in July 2017, which raise effective capital requirements by 150 basis points for ADIs using the internal ratings-based (IRB) approach to credit risk and by 50 basis points for ADIs using the standardised approach, all relative to the risk weights prevailing under the current framework. The proposed revisions also incorporate changes to the international Basel III standards that were finalised in December 2017 (see ‘Box E: Reforms to the Basel III Capital Framework’). APRA will consult on revised standards that incorporate all these changes.
The proposed framework changes the capital needed for different types of lending, under both the standardised and IRB approaches, without further raising the aggregate amount of capital required by the industry. One important aim in doing this was to address the risks posed by the concentration of mortgages on banks’ balance sheets, which have increased in recent years to now account for more than 60 per cent of total
4 An IMF study found a Tier 1 capital ratio of 15 to 23 per cent is appropriate for many advanced economies (see Dagher et al (2016), ‘Benefits and costs of bank capital’, IMF Staff Discussion Note SDN 16/04). Australian major banks’ Tier 1 capital ratios are about 2 percentage points higher than their CET1 ratios.
5 APRA (2018), ‘APRA Begins Consultation with ADIs on Revisions to Capital Framework’, Media Release 18.04, 14 February.
loans. APRA is proposing to raise the minimum amount of capital that must be used to back residential mortgages, relative to other loans. In addition, APRA proposes to make risk weights on mortgages more sensitive to risk. Risk weights would distinguish between P&I mortgages to owner-occupiers and all other mortgages (which would require more capital), and risk weights for ADIs using the standardised approach would also be more sensitive to the outstanding LVR. Other notable revisions to credit risk would include materially raising risk weights on credit cards for IRB banks, simplifying the capital treatment of small and medium enterprise exposures, and allowing greater variation in the risk weights applied to commercial property exposures.
APRA also proposes to introduce a minimum leverage ratio requirement of 4 per cent for banks using the IRB approach and 3 per cent for ADIs using the standardised approach, effective from July 2019. APRA intends that the leverage ratio, which is a non-risk-adjusted ratio of Tier 1 capital to total exposures, will only be a backstop to the risk-based capital requirements. While APRA has set its requirement for IRB banks higher than the 3 per cent requirement in the Basel III framework, IRB banks’ leverage ratios are already well above this new minimum (at 5 per cent or more). The overwhelming majority of other ADIs also already exceed their leverage ratio requirement.
Banks continue to generate sufficient aggregate profits to underpin their ability to further increase their capital. Profit growth picked up over the past year, after several years of no growth (Graph 3.7). The recent pick-up was due to a widening in net interest margins (NIMs) – as banks increased interest rates on IO and investor mortgages and funding costs declined – as well as a decline in the charge for bad and doubtful debts to historically low levels. Profit growth over the past year has supported an increase

F I N A N C I A L S TA B I L I T Y R E V I E W | A P R I L 2018 3 9
in banks’ return on equity (ROE), which remains high relative to international peers but below its historical average.
Despite the recent lift, analysts are cautious about the outlook for profit growth. The recent benefits to profit growth from a widening of the NIM and falling bad debt charges are expected to fade, especially if short-term wholesale spreads remain elevated. The financial impact of the multiple inquiries into the financial services sector remains a key uncertainty, including the Royal Commission into Misconduct in the Banking, Superannuation and Financial Services Industry, the Productivity Commission’s Inquiry into Competition in Australia‘s Financial System, and the Australian Competition and Consumer Commission’s Residential Mortgage Products Price Inquiry. There is the potential that these will result in banks having to set aside provisions and/or face penalties for past misconduct or perhaps (more notably) being constrained in the operation of parts of their businesses.
This uncertainty around banks’ future earnings has weighed on their share prices, which have underperformed global peers (although Australian banks still have higher price-to-book ratios). The decline in share prices has also seen banks’ forward earnings yields (a proxy for their
cost of equity capital) further diverge from that of the rest of the Australian market since mid 2017 (Graph 3.8). Banks’ current forward earnings yields remain a little above their pre-crisis average, despite a large decline in risk-free rates since then.
Graph 3.7Banks’ Profitability
Profits and return on shareholders’ equityProfits and return on shareholders’ equity
6
12
18
$b
6
12
18
%
(RHS)ROE
2014201120082005 20170
3
6
9
$b
1.6
1.8
2.0
2.2
%
NIM
Charges for bad and doubtful debts(LHS)
(RHS)
Sources: APRA; RBA
Graph 3.8
2015201220092006 20184
6
8
10
12
%
4
6
8
10
12
%Forward Earnings Yields
ASX 200
ASX 200 Banks
(excl. banks)
Sources: RBA; Thomson Reuters
Bank CultureOver the past few years there has been increasing regulatory focus on culture in financial institutions and the impact that culture might have on their operations. In Australia, there has been a significant number of examples of misconduct attributed to poor culture and some of the adverse implications of this are starting to materialise. In particular, CBA revealed increased compliance and regulatory costs relating to various inquiries. CBA also recorded a sizeable provision for potential civil penalties relating to the Australian Transaction Reports and Analysis Centre’s (AUSTRAC’s) proceedings against the bank. Australian banks are well capitalised, and available evidence indicates that the risks to banks’ overall resilience from misconduct appear limited. However, international experience has shown that poor culture can have significant adverse effects on banks, including on their financial performance.

R E S E R V E B A N K O F AU S T R A L I A4 0
Regulators and the banking industry have been making efforts to contain the issues stemming from deficiencies in a strong positive culture. APRA’s oversight in relation to banks’ risk culture and accountability has been strengthened after legislation was recently passed implementing the Banking Executive Accountability Regime (BEAR). The BEAR gives APRA strengthened powers to seek civil penalties and disqualify bank executives for not taking reasonable steps to protect the prudential standing or prudential reputation of their institution. The BEAR also places restrictions on bank executives’ variable pay arrangements to discourage excessive risk-taking. Complementing this, APRA recently reported on the extent to which performance-based remuneration structures encourage bank staff to behave in ways that support effective risk management and the long-term financial soundness of the organisation. In response to its findings, APRA suggested a number of ways in which banks can increase the sensitivity of performance pay to long-term risk management and some institutions have already begun to make appropriate changes. In 2017, APRA also commenced a cross-sector pilot program of risk culture reviews, which will further develop its practical knowledge and experience in evaluating risk culture as a driver and leading indicator of risk outcomes.
Shadow Banking ActivityThe tighter prudential framework for the regulated banking system over recent years may induce lending activities to migrate to less regulated, non-ADI lenders. In aggregate, this risk is low for now, as the so-called ‘shadow banking sector’ is still only 6 per cent of the financial system (around half the share it was in 2007). Contagion risks are also limited as banks’ exposures to the sector are only a few per cent of their financial assets.
Property lending is one area that warrants particular attention in light of the tightening of lending standards at prudentially regulated entities. Estimated growth in residential mortgage lending by non-ADI lenders picked up materially over the past year and is now significantly higher than for banks. However, non-ADI lenders still account for only around 4 per cent of outstanding residential mortgages, and their contribution to overall housing credit growth remains limited (Graph 3.9).
Graph 3.9
201320092005 20170
2
4
6
8
10
%
0
2
4
6
8
10
%
Estimated Non-ADI Share of Housing CreditYear-ended
Sources: APRA; RBA
Non-ADI lenders’ expansion in residential mortgage lending has been aided by developments in both mortgage and RMBS markets. In the mortgage market, ADIs have increased interest rates on investor and IO loans, enabling non-ADIs to price competitively to attract these loans. In addition, the cost of financing mortgages declined for non-ADIs over the past two years as spreads on non-bank RMBS – their main source of funding – have fallen(Graph 3.10). This supported non-bank RMBSissuance over 2017, which was higher than in anyother year since the financial crisis. Nonetheless,RMBS spreads remain significantly higher thanpre-crisis levels, meaning that the cost of fundingfor non-ADIs is still well above the cost of bank

F I N A N C I A L S TA B I L I T Y R E V I E W | A P R I L 2018 4 1
financing (deposits or senior unsecured bank debt). This continues to be a key constraint for non-ADIs to gain market share more rapidly than at present.
There are limited data on the scale of non-ADIs’ lending for property development, but the Bank’s liaison suggests that this has expanded quickly of late, particularly in Melbourne. Non-ADI development finance is reported to require lower levels of pre-sales and allow greater leverage. In recognition of these risks, investors are reported to demand higher premiums, which temper the direct risk to the financial stability of the banking system. In addition, when banks provide senior debt, there is a degree of regulatory oversight of the non-ADI mezzanine lending (which is still the most common form of development lending by non-banks).
Legislation recently passed will make it easier to monitor shadow banking activities by requiring larger non-ADI lenders to regularly disclose the scale of their financing activity to APRA. It also provides APRA with reserve powers to impose rules on non-ADIs if their activities are judged to pose a material risk to financial stability.
InsuranceThe resilience of the general insurance industry has strengthened a little over the past year. The industry remains well capitalised, with capital equivalent to 1.8 times APRA’s prescribed amount, and profits have continued to improve gradually despite subdued investment income due to the low interest rate environment (Graph 3.11). The lift in profits resulted from a stronger underwriting performance as insurers increased premiums to correct a long period of underpricing in commercial insurance lines. Reserve releases due to lower-than-expected inflation also contributed to underwriting profitability. While natural disaster payouts were again higher than expected for insurers, reinsurance cover has mitigated the impact on profits to some degree.
Graph 3.10Residential Mortgage-backed Securities
Non-bank RMBS issuance
2
4
6
8$b
2
4
6
8$b
Primary market pricing, monthly*
2015201220092006 20180
100
200
300
bps
0
100
200
300
bps
Non-conforming dealsNon-bank conforming deals
* Face-value weighted monthly average of the primary market spreadto bank bill swap rate for AAA rated notes
Source: RBA
Graph 3.11General Insurers’ Financial Ratios
AnnualisedContributions to return on equityContributions to return on equity
-15
0
15
30%
-15
0
15
30%
Claims ratio*
201320092005 201740
60
80
%
40
60
80
%
Return on equityInvestment income
Underwriting resultTax and other
* Ratio of net incurred claims to net premium; change in reportingbasis after June 2010
Source: APRA; RBA
The profits of LMIs remain under pressure, but the sector is well capitalised, at 1.6 times APRA’s prescribed amount. Profits continue to decline due to both a decrease in revenue, as banks reduce high-LVR mortgage lending which is generally insured, and an increase in claims

R E S E R V E B A N K O F AU S T R A L I A4 2
arising from Western Australia and Queensland. These headwinds seem likely to persist, given APRA’s efforts to ensure prudent lending standards are expected to continue to limit the flow of new high-LVR loans.
Life insurance profitability has stabilised as insurers have stemmed losses on individual disability insurance (commonly known as ‘income protection’) and investment returns have lifted (Graph 3.12). However, ROE remains low and structural issues persist, including historical underpricing, loose product definitions, overly generous product benefits and rising claims, especially for mental health. While insurers have taken some steps to address these issues, they will take time to resolve given the long-term nature of life insurance contracts. Given that, direct policy writers have responded by reducing risk, including through additional reinsurance and by increasing capital to 2.1 times APRA’s prescribed amount. A number of Australian financial institutions have also exited the life insurance industry (or are considering doing so) by selling to large foreign insurers.
SuperannuationThe superannuation sector is a large and growing part of Australia’s financial system. Total assets amount to $2.6 trillion, accounting for three-quarters of the assets in the managed fund sector (a higher share than in other advanced economies) and equivalent to around two-thirds of the size of the Australian banking system. Total superannuation assets grew by 10 per cent in 2017, slightly higher than the post-crisis average rate. Growth was supported by strong investment returns and higher member contributions, particularly in advance of changes to the concessional and non-concessional contributions caps that took effect on 1 July 2017 (Graph 3.13).
Graph 3.13Superannuation Funds’ Flows*
Net investment income Net contribution flows** Other
-75
0
75
$b
-75
0
75
$b
Net contributions
2014201120082005 20170
20
40
60
$b
0
20
40
60
$b
Total contributions
Benefit payments(incl. net transfers)
* APRA-regulated entities with more than four members** Total contributions received by funds plus net rollovers minus benefitpayments
Sources: APRA; RBA
Graph 3.12
2015201320112009 2017-5
0
5
10
15
20
%
-5
0
5
10
15
20
%
Contributions to Life Insurers’ ProfitabilityAnnualised
Individual death/TPD*Individual disabilityGroup policies
Non-participating investment-linkedOther**Return on equity
* TPD = total and permanent disability** Includes profit from other non-risk businessSources: APRA; RBA
The financial stability risks inherent in the superannuation industry are lower than for other parts of the financial system because debt funding accounts for a very small share of its total liabilities (particularly for APRA-regulated funds, which are not generally permitted to borrow). The longer-term focus of the industry, compared with other investors, also reduces financial stability risks. However, its large size
F I N A N C I A L S TA B I L I T Y R E V I E W | A P R I L 2018 4 3
means it could still amplify financial market shocks if superannuation fund managers change their asset allocations and/or members switch between investment choices rapidly, or if superannuation funds were to seek to boost returns by investing significantly more in leveraged assets (such as property development).
Financial Market InfrastructuresFinancial market infrastructures (FMIs) are institutions that facilitate the clearing, settlement or recording of payments, securities, derivatives or other financial transactions. Over recent years there has been considerable effort to strengthen the regulation and supervision of FMIs because of their central role in the financial system.
The key FMIs located in Australia are the Reserve Bank Information and Transfer System (RITS) – which banks and other approved institutions use to settle payment obligations on a real-time basis – and the Australian Securities Exchange (ASX) clearing and settlement (CS) facilities – which facilitate the clearing and settlement of trades in securities and derivatives. A major development for RITS in recent months has been the public launch of the New Payments Platform (NPP) for fast retail payments. The Fast Settlement Service (FSS), a new component of RITS, facilitates the settlement of NPP payments on a 24/7 basis. ‘Box D: The New Payments Platform and Fast Settlement Service’ provides detail on the NPP and FSS and their financial stability considerations.
The Reserve Bank has oversight responsibilities for the stability of FMIs operating in Australia. In carrying out its responsibilities, the Reserve Bank has regard to the strength of FMIs’ business continuity arrangements and the management of operational risks. For example, among other things, FMIs are required to operate a secondary site and be able to resume operations within
two hours following a disruption to critical information technology systems.
A key measure of the operational resiliency of an FMI is the proportion of normal operating hours during which the system is available. Both RITS and ASX set annual minimum availability targets; the target for RITS is 99.95 per cent of operating hours, while the targets for the ASX’s systems range from 99.8 to 99.95 per cent. RITS has exceeded its availability target over the past five years and in 2017 had only 15 minutes of downtime. All key ASX CS systems also met their availability targets in recent years, but there have been several material operational incidents across both ASX’s trading and CS facilities. In light of these and a trend of minor incidents, the Reserve Bank and Australian Securities and the Investments Commission (ASIC) encouraged the ASX to commission an external assessment of its operational risk management arrangements. The Reserve Bank and ASIC are reviewing the results of the report and will be assessing ASX’s response to the recommendations.
The ASX is planning to replace its core infrastructure for the cash equities market. This is an important project to ensure that the performance, resilience, security and functionality of ASX’s systems continue to meet the needs of its users. In early December, the ASX board announced that the replacement system will include distributed ledger technology. As this is new technology, the ASX has taken a cautious approach to develop and test a prototype of the platform, including considering the results of two external security assessments of the prototype platform and consultation with stakeholders. Consultation on the initial scope and implementation plan is expected to commence shortly.
Cyber security is a growing focus for FMIs. In 2017 the Reserve Bank completed its

R E S E R V E B A N K O F AU S T R A L I A4 4
assessment of RITS against international guidelines and is in the process of assessing the ASX. The assessment of RITS did not identify any significant issues, but the Reserve Bank continues to enhance its arrangements to enable RITS to recover from a cyber attack within a short timeframe. In addition, SWIFT, a key global provider of payments messaging infrastructure to the financial industry, is requiring its users to attest annually against a set of security controls it has developed. The Reserve Bank provided its attestation in December 2017. R

F I N A N C I A L S TA B I L I T Y R E V I E W | A P R I L 2018 45
Box C
Interest Rate Risk in the Australian Financial System
There is a risk that global interest rates will rise quickly to more historically normal levels, as flagged in ‘The Global Financial Environment’ chapter. This could lead to substantial losses for financial entities exposed to interest rate risk. Internationally, a number of central banks have been warning that financial institutions in their country are vulnerable to large losses if interest rates were to rise rapidly and significantly. Such warnings are based, in part, on a large body of empirical evidence that highlights the exposure of various financial institutions to changes in interest rates.1 This box looks at the exposure of Australian financial institutions to interest rate risk. It shows that, in aggregate, they appear to be exposed to relatively little interest rate risk, which is instead mostly borne by customers and policyholders. As a result, the main risk to Australian financial institutions from higher interest rates is through indirect channels, such as an increase in household and business loan impairments and/or reduced demand for financial services.
BanksFor banks, interest rate risk arises from the majority of their liabilities being short term (either deposits or short-term wholesale debt) while most of their assets are long term (loans). This maturity mismatch can cause banks’ margins
1 This literature finds that banks in the United States, United Kingdom, Switzerland and northern euro area countries all tend to experience capital losses in the short term after a rise in interest rates, but that banks in southern euro area countries are little affected. In contrast, life insurers in the United States and Germany benefit from rising interest rates, while life insurers in other countries, and general insurers worldwide, are unaffected.
to narrow following a rise in short-term interest rates, as the cost of their liabilities typically rises almost instantaneously but the return on their existing long-term assets remains constant. This effect may be compounded if the slope of the yield curve flattens (as is common when policy rates rise). In that instance, the spread banks earn when transforming short-term liabilities into long-term assets is reduced, so that even when long-term assets reprice, the increase in their interest rates may be less than on short-term liabilities.
Banks, including in Australia, engage in considerable maturity transformation. For the Australian banking system as a whole, the liabilities that are due to mature within one month exceed the assets (typically housing and business loans) that will mature within that time by over $1 trillion (Graph C1; bottom panel). However, it is the repricing maturity that matters for interest rate risk – that is, how quickly the interest rates of banks’ assets and liabilities can be adjusted in response to changing circumstances. Unlike in many other countries, Australian banks have more assets that can be repriced within one month than they do liabilities (Graph C1; top panel). This is primarily because around 80 per cent of Australian housing loans are priced using a variable interest rate that can move with short-term interest rates, and most Australian business loans are priced at a fixed premium to the 3-month bank bill swap rate. This is different from the structure in most other advanced countries, where, in particular, a large
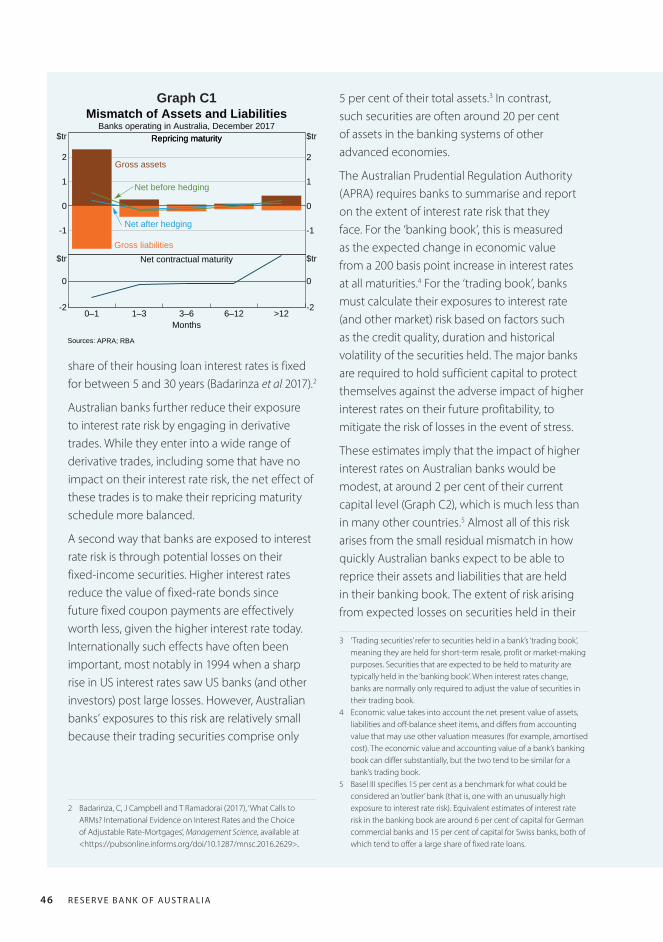
R E S E R V E B A N K O F AU S T R A L I A46
share of their housing loan interest rates is fixed for between 5 and 30 years (Badarinza et al 2017).2
Australian banks further reduce their exposure to interest rate risk by engaging in derivative trades. While they enter into a wide range of derivative trades, including some that have no impact on their interest rate risk, the net effect of these trades is to make their repricing maturity schedule more balanced.
A second way that banks are exposed to interest rate risk is through potential losses on their fixed-income securities. Higher interest rates reduce the value of fixed-rate bonds since future fixed coupon payments are effectively worth less, given the higher interest rate today. Internationally such effects have often been important, most notably in 1994 when a sharp rise in US interest rates saw US banks (and other investors) post large losses. However, Australian banks’ exposures to this risk are relatively small because their trading securities comprise only
2 Badarinza, C, J Campbell and T Ramadorai (2017), ‘What Calls to ARMs? International Evidence on Interest Rates and the Choice of Adjustable Rate-Mortgages’, Management Science, available at <https://pubsonline.informs.org/doi/10.1287/mnsc.2016.2629>.
Graph C1Mismatch of Assets and Liabilities
Banks operating in Australia, December 2017Repricing maturityRepricing maturity
-1
0
1
2
$tr
-1
0
1
2
$tr
Gross assets
Gross liabilities
Net before hedging
Net after hedging
Net contractual maturity
0–1 1–3 3–6 6–12 >12-2
0
$tr
-2
0
$tr
Months
Sources: APRA; RBA
5 per cent of their total assets.3 In contrast, such securities are often around 20 per cent of assets in the banking systems of other advanced economies.
The Australian Prudential Regulation Authority (APRA) requires banks to summarise and report on the extent of interest rate risk that they face. For the ‘banking book’, this is measured as the expected change in economic value from a 200 basis point increase in interest rates at all maturities.4 For the ‘trading book’, banks must calculate their exposures to interest rate (and other market) risk based on factors such as the credit quality, duration and historical volatility of the securities held. The major banks are required to hold sufficient capital to protect themselves against the adverse impact of higher interest rates on their future profitability, to mitigate the risk of losses in the event of stress.
These estimates imply that the impact of higher interest rates on Australian banks would be modest, at around 2 per cent of their current capital level (Graph C2), which is much less than in many other countries.5 Almost all of this risk arises from the small residual mismatch in how quickly Australian banks expect to be able to reprice their assets and liabilities that are held in their banking book. The extent of risk arising from expected losses on securities held in their
3 ‘Trading securities’ refer to securities held in a bank’s ‘trading book’, meaning they are held for short-term resale, profit or market-making purposes. Securities that are expected to be held to maturity are typically held in the ‘banking book’. When interest rates change, banks are normally only required to adjust the value of securities in their trading book.
4 Economic value takes into account the net present value of assets, liabilities and off-balance sheet items, and differs from accounting value that may use other valuation measures (for example, amortised cost). The economic value and accounting value of a bank’s banking book can differ substantially, but the two tend to be similar for a bank’s trading book.
5 Basel III specifies 15 per cent as a benchmark for what could be considered an ‘outlier’ bank (that is, one with an unusually high exposure to interest rate risk). Equivalent estimates of interest rate risk in the banking book are around 6 per cent of capital for German commercial banks and 15 per cent of capital for Swiss banks, both of which tend to offer a large share of fixed rate loans.

F I N A N C I A L S TA B I L I T Y R E V I E W | A P R I L 2018 47
that inflation will increase, rather than because of an increase in real (inflation-adjusted) interest rates. In this case, the increased discount rate will be offset by an assumption that the future value of insurance payouts will also be higher, given that insurance policies typically promise to make payments that are linked to future prices or wages.
The fall in the value of insurance sector assets in response to higher interest rates results from losses on bonds held by insurers, as described earlier. However, this risk may be passed onto policy holders, such as when a life insurance policy offers a variable payout that is linked to the return on underlying assets.
To determine the net impact of these various factors, APRA requires both general and life insurers to estimate and report on the loss of economic value that would arise if either real interest rates rose (by the equivalent of one-quarter of the current nominal risk-free interest rate) or if nominal interest rates increased (by 125 basis points) because of a rise in expected inflation. This is the insurance-equivalent concept of the estimates produced by the banking sector and shown in Graph C2.
Estimates show that the impact on capital of an increase in real interest rates is small, as insurers in Australia typically invest in assets that have similar duration to their liabilities (Graph C3). As a consequence, when interest rates rise, the decrease in the value of the liabilities of the insurance sector is offset by a similar-sized decrease in the value of their assets. A second reason for the relatively small effect is that more than half of the assets of Australian life insurers are investment linked, for which the policyholders receive a variable payout that is wholly determined by the returns on the insurers’ assets. In such circumstances, the interest rate (or investment) risk is borne directly by the policyholders.
trading book is small, reflecting the modest size of banks’ holdings.
InsuranceThe impact of higher interest rates on insurers is more complex as there are multiple effects, some of which work in opposing directions. In principle, higher interest rates reduce the value of both the assets and liabilities of the insurance sector, with the net impact on capital therefore determined by differences in the size and maturity (or duration) of each of these components.6
Higher interest rates typically reduce the net present value of insurers’ liabilities, as a higher discount rate is applied to future expected payments (using a benchmark rate, such as an equivalent-maturity sovereign bond). However, there are complications that can offset this discounting effect and leave the net present value of insurance sector liabilities little changed. For example, there may be no change in liabilities if interest rates rise because of an expectation
6 Duration is a measure of the sensitivity of price to interest rates; the price of assets with a short duration is less affected by movements in interest rates than the price of assets with a long duration.
Graph C2
Major banks** All banks-6
-4
-2
%
-6
-4
-2
%
Impact of Higher Interest Rates on Banks’ CapitalShare of capital level, December 2017
Tradingbook Banking
book*
* Shock of 200 basis point increase in interest rates** Based on internal modelling, including expected behavioural responsesof the bank and its customers
Sources: APRA; RBA

R E S E R V E B A N K O F AU S T R A L I A48
SuperannuationThe impact of higher interest rates on pension and superannuation funds also depends on the structure of the industry. Where a fund has promised fixed returns to members, its assets will fall in value due to losses on fixed-income securities, but its liabilities will also decline because of the higher discount rate. (Typically, the value of their liabilities will fall by more than the value of their assets because the former have a longer duration; see RBA (2015)).7 However, in Australia, the majority of superannuation and other managed funds are ‘defined contribution’ funds. In these funds, there is no guaranteed fixed return to members, who bear all the interest rate (or investment) risk. In this respect, Australia is quite different to many other advanced economies, where ‘defined benefit’ funds that promise a fixed rate of return to members (and hence retain all the price risk) still dominate the pension industry (Graph C4). R
7 RBA (2015), ‘Box A: The Effect of Low Yields on Life Insurers and Pension Funds’, Financial Stability Review, October, pp 16–18.
In contrast, an increase in nominal interest rates arising from an expectation of higher inflation can have a material impact on general insurers’ capital. This impact occurs because most general insurance policies promise to replace damaged goods or real assets and the future cost of that commitment is dependent on the future price level. A rise in nominal interest rates therefore has little effect on the value of general insurers’ liabilities (as the future cost of these rise by the same amount as the discount rate applied to them), but erodes the value of their fixed income assets. This is less of a problem for life insurers than general insurers because of life insurers’ high proportion of investment-linked business.
Graph C4
0 10 20 30 40 50 60 70 80 90 %
France
Italy
Australia
NZ
US
UK
Japan
Canada
Switzerland
Germany
Pension Fund Composition*Share of assets
Defined benefit or mixed Defined contribution
* Data is for 2015 with the exception of Australia (2017), Japan (2016), NZ(2014) and UK (2016)
Sources: APRA; OECD; RBA; Willis Towers Watson
Graph C3Impact on the Level of Insurers’ Capital
Share of capital level, December 2017
General insurers-6
-4
-2
%
Realinterest
rateshock*
Life insurers-6
-4
-2
%
Expectedinflation shock*
* Increase in real interest rate equivalent to a quarter of nominal interestrate and increase in inflation of 125 basis points
Sources: APRA; RBA

F I N A N C I A L S TA B I L I T Y R E V I E W | A P R I L 2018 49
Box D
The New Payments Platform and Fast Settlement Service
The New Payments Platform (NPP) is a fast payment system, enabling virtually instantaneous payments on a 24/7 basis. It also offers a simpler way of addressing payments, using the recipient’s email address, phone number or ABN rather than bank account details, and allows more information to be sent with the payment than in the legacy interbank electronic payment system. To facilitate these fast interbank payments through the NPP, the Reserve Bank built the Fast Settlement Service (FSS), a system that settles these payments between banks across accounts at the Reserve Bank in real time (that is, as they occur). The FSS is a new service of Australia’s existing interbank settlement system, the Reserve Bank Information and Transfer System (RITS).
The NPP was developed by its 13 founding members (12 authorised deposit-taking institutions and the Reserve Bank) in response to gaps in the provision of retail payments in Australia. The gaps, identified by the Payments System Board’s Strategic Review of Innovation in
the Payments System: Conclusions in 2012, included the inability to make real-time payments outside normal banking hours and limited capacity to carry information about the payment. The NPP was designed to support the operation of ‘overlay services’ that utilise the data-carrying and fast payments capability of the NPP to deliver innovative and competitive payment services and products.1 Together with current and future overlay services, the NPP has the potential to
1 The first overlay service, Osko, was developed by BPAY. It allows customers of participating financial institutions to make payments in under a minute through their financial institutions’ mobile or internet banking system.
improve the efficiency of the Australian payments system and increase productivity more broadly, including by better integrating payment services with other activities or business systems.
For the payments system as a whole, the NPP contributes to improved resilience by providing another means by which payments can be made. As well as being an alternative for other retail payment methods, the NPP can, if required, facilitate wholesale interbank payments. Given that the NPP is available to make payments at all times, both the NPP and FSS have been designed to meet high standards of resilience. The NPP and FSS also change the risk profile faced by participants in the Australian payments system, by reducing the likelihood of delays in receiving funds and increasing the importance of real-time behaviour monitoring in preventing financial crimes.
Resilience Features of the NPP and FSSThe NPP and FSS are completely new pieces of payments infrastructure (Figure D1). The NPP network, switching capability (enabled by payment gateways) and addressing service comprise an industry utility, NPP Australia Limited, owned by its shareholder participants. The addressing service enables customer accounts to be identified by an email address, phone number or ABN. The payment gateways are used by participating institutions to send messages with payment details and confirmation responses. The payment gateways also initiate settlement by sending a settlement request to the FSS.

R E S E R V E B A N K O F AU S T R A L I A50
The FSS is capable of settling payments between financial institutions in under one second, which enables payments through the NPP to be made available to recipients within a minute or less, rather than taking hours or days as previously. The FSS also settles payments 24 hours per day, 7 days per week (a significant extension from previous settlement operating hours of weekdays between 7.30 am and 10.00 pm). The Reserve Bank’s target for the availability of the FSS is 99.995 per cent, which equates to tolerating an average of two minutes of service downtime per month.
To achieve the high system availability and reliability, the FSS infrastructure and databases are duplicated across locations. The settlement service is able to be run independently from each location, and the active site is able to be switched to another location quickly. This set-up will allow for planned upgrades of hardware and software to occur with minimal downtime to the overall service, and will also help minimise
disruptions in a contingency event that affects the ability to operate from a particular site.
Support arrangements have been designed to align with a continuously operating system. In particular, Reserve Bank staff are available on a 24/7 basis to monitor the performance of the FSS system and provide help desk services to industry participants. Financial institutions are expected to manage their liquidity to allow for settlement of NPP payments on a 24/7 basis and monitor related reports. The Reserve Bank assists financial institutions with their liquidity management by providing automated system tools in RITS (including the FSS) and making liquidity available through its Standing Facilities (which enable eligible institutions to obtain funds from the Reserve Bank on pre-specified terms via intraday or open-dated repurchase agreements).2
2 For more information on the Standing Facilities see: <http://www.rba.gov.au/mkt-operations/dom-mkt-oper.html>.
NPP Addressing Service
Pay
men
t Gat
eway
Pay
men
t Gat
eway
Inst
itutio
n B
Inst
itutio
n A
PayeePayer
4. Settlementconfirmation
4. Settlementconfirmation
3. Settlement request
2. Payment instruction & confirmation
1. Account lookup
Figure D1: Infrastructure and Payment Processing
NPP Network
FSS
Payment Gateway
Source: RBA

F I N A N C I A L S TA B I L I T Y R E V I E W | A P R I L 2018 51
their liquidity management to meet payment obligations. Systems that settle payments on a gross basis intrinsically require greater liquidity than systems that settle on a net basis. However, it is not considered likely that participants in the payments system will need to hold significantly larger balances to facilitate their NPP payment obligations. The NPP is primarily a payment system for retail transactions, with individual transactions expected to be relatively low in value. Furthermore, wholesale interbank transactions have typically been settled individually and in real time in the past, so there will be a limited net impact on liquidity if some are made as NPP payments. Financial institutions also have access to funds through the Standing Facilities to help manage their liquidity and automated features have been built into RITS to help allocate liquidity as required between the settlement of NPP payments through the FSS or the settlement of other transactions in RITS.
Risks of fraud and misdirected payments are present in the NPP, as they are for any payments system, but real-time posting to customers’ accounts means there is no delay for the recipient of a fraudulent payment to access the proceeds. Of particular focus in the financial industry is the need to have effective fraud controls in place for their customers, which can include real-time monitoring of customer payment patterns. A factor that should help reduce the incidence of fraud is that NPP payments can currently only be initiated by the payer; the payee is not able to initiate payment. If a completed payment is disputed, the payer’s financial institution will have to contact the payee’s institution to try to prevent the withdrawal of funds. In addition, the ability to address payments to an email address, phone number or ABN (rather than to a BSB and account number) and the subsequent confirmation of the name of the payee prior to the payment being processed, should reduce the
Risk Implications of Fast PaymentsThe speed at which NPP transactions occur and the immediacy of funds availability alter the risk profile of retail payments.
In the past, the interbank obligations that arise in retail payment systems have been settled on a net-deferred basis in RITS. Banks accumulated the payments made by their customers and, at set times during the day, the net amount of these obligations were transferred between banks. In contrast, NPP payments will be settled individually in real time, which mitigates the credit risks associated with delays to the settlement of funds. This will reduce risks for financial institutions since, unlike net-deferred settlement, NPP payment obligations cannot build up during the day between NPP participants. Immediate settlement also means that financial institutions can make funds available to recipients in real time without taking on credit risk. The speed with which funds can be made available to recipients also reduces the credit and liquidity risks faced by consumers and businesses. For example, a business could wait up to a few days to receive funds in their bank account if a customer were to pay for goods and services by card, cheque or bank transfer, whereas they will receive the funds almost immediately when a customer pays through the NPP. Over time, it is expected that some retail payments will transition to the NPP, particularly from the Direct Entry (DE) system, which includes internet ‘pay anyone’ bank transfers. Since DE payments account for almost 90 per cent of the value of retail payments, the transition of some of these to the NPP should also generate a significant reduction in settlement risks across the payments system overall.
Although settlement risks are mitigated by the real-time settlement of NPP transactions, financial institutions will need to consider

R E S E R V E B A N K O F AU S T R A L I A52
chance of a misdirected payment. To help reduce the risk of being affected by fraud, members of the general public should continue to be alert to scams and safeguard their personal and financial information. R
F I N A N C I A L S TA B I L I T Y R E V I E W | A P R I L 2018 5 3
4. Regulatory Developments
The most notable regulatory development in the past half year was the finalisation of reforms to the Basel III capital framework by the Basel Committee on Banking Supervision (BCBS). These reforms are aimed at reducing unwarranted risk weight variability. Global bodies continued efforts to monitor and encourage implementation of reforms to the regulation of financial benchmarks, and to identify the financial stability implications of financial technology (‘fintech’). With the design of key post-crisis reforms largely completed, the Financial Stability Board (FSB) and the standard-setting bodies are increasingly focused on monitoring the implementation of the reforms and evaluating their effectiveness. Evaluations of the effects of reforms on financial intermediation and on incentives to centrally clear over-the-counter (OTC) derivatives are under way.
Domestically, efforts to improve the resilience and functioning of the financial system continue. Key legislation providing the Australian Prudential Regulation Authority (APRA) with expanded powers to manage the resolution of distressed financial institutions was passed by Parliament, as was legislation to help ensure robust and reliable financial benchmarks. Several reviews or inquiries into elements of the financial system are also under way, including the International Monetary Fund’s (IMF’s) Financial Sector Assessment Program (FSAP) review of Australia, the Productivity Commission’s inquiry into competition in Australia’s financial system and the Royal Commission into Misconduct in the Banking, Superannuation and Financial Services Industry. The Council of Financial Regulators
(CFR) has continued to closely monitor housing lending developments, while also considering the approach to additional loss-absorbing capacity for Australian banks, developments in shadow banking and financial disclosures during periods of financial stress.
International Regulatory Developments
Building resilient financial institutions
The members of the BCBS, including the Reserve Bank and APRA, agreed on a series of changes to the capital framework for banks (see ‘Box E: Reforms to the Basel III Capital Framework’). These changes are designed to ensure that the post-crisis Basel III reforms are effective in their original goal of enhancing bank resilience, as well as supporting confidence in the risk-weighted capital framework.
The finalisation of the capital reforms completes a significant program of post-crisis changes to the global regulatory framework for banks. The attention of the BCBS is now increasingly focused on monitoring the implementation of the regulatory reforms agreed to date, evaluating their effects and assessing emerging risks. This will form part of the broader ongoing work of the BCBS to strengthen the regulation and supervision of banks. In October, the BCBS published a progress report on the implementation of the Basel framework. It noted that the Basel III risk-based capital rules and the Liquidity Coverage Ratio (LCR) regulations are now in force in all BCBS member jurisdictions.

R E S E R V E B A N K O F AU S T R A L I A5 4
Further, it found that banks in these jurisdictions are compliant with the current minimum requirements. The BCBS also evaluates whether the reforms implemented at the jurisdictional level are consistent with the international framework through its Regulatory Consistency Assessment Programme (RCAP). In October, an RCAP assessment of Australia’s LCR rules provided the domestic framework with the highest possible grade, ‘compliant’.
In addition to Basel III, the BCBS has continued its policy development work on other aspects of the international regulatory framework for banks:
• In October, the BCBS published guidelineson the identification and management of‘step-in’ risk. The guidelines seek to mitigatethe risk that, in order to avoid reputationaldamage, banks ‘step in’ to supportunconsolidated but nonetheless relatedentities (such as ‘shadow banks’) whichcould transfer financial distress to the bank.The guidelines outline how banks shouldassess step-in risk and how supervisorsshould evaluate this assessment. For instance,the guidelines define the types of entitiesthat need to be assessed for potential step-inrisk and the responses that supervisors mayconsider taking when step-in risk is identified.The guidelines are to be implemented inBCBS member jurisdictions by 2020.
• In December, the BCBS published adiscussion paper on the regulatory treatmentof sovereign exposures. The paper identifiessources of sovereign risk in the bankingsystem and sets out some potential policyoptions. The existing regulatory frameworkallows for a zero risk weight to be assigned tosovereign exposures that are denominatedand funded in domestic currency. However,the paper notes that sovereign exposuresmay generate risks for banks through debt
restructuring or outright default, as well as through channels such as increased funding costs and liquidity requirements as a result of a reduction in the value of sovereign collateral.
• Given the increasing importance of stresstests of banks in supervisory and regulatoryframeworks, in December the BCBS proposeda new set of principles to act as a guideto sound stress testing practices for banksand supervisors. For example, the principlesstate that a bank’s stress testing frameworkshould be subject to challenge and regularreview. The new principles are expressed ata high level so that they do not conflict withdevelopments in stress testing practicesover time.
• In February, the BCBS released a consultationpaper on an updated ‘Pillar 3’ framework,which sets minimum regulatory disclosurerequirements for banks. The proposedchanges mainly involve disclosinginformation related to the Basel III capitalreforms discussed in Box E. For instance,under the proposed Pillar 3 framework, banksthat use internal models must disclose theirrisk-weighted assets (RWAs) as calculatedunder both the internal ratings-based(IRB) and standardised approaches. Thisrequirement means that informationused in calculating the new output floor –which requires the total value of IRB banks’ estimated RWAs to be no lower than 72.5per cent of the RWAs calculated using onlythe standardised approach – must now bepublicly disclosed.
• The BCBS began a consultation in March onrevisions to the market risk capital framework.One of the key revisions is to include changesto the measurement of the standardisedapproach to enhance its risk sensitivity.

F I N A N C I A L S TA B I L I T Y R E V I E W | A P R I L 2018 5 5
Also, the internal models approach has been further revised to enhance the requirements for the use of internal models. The revised framework will come into effect in 2022.
Shadow banking
As discussed in previous Reviews, the FSB and the International Organization of Securities Commissions (IOSCO) have worked since the crisis to improve the regulation and oversight of shadow banking, which refers to credit intermediation outside the regular banking system. Three publications by IOSCO in the past half year relate to this work.
In November, IOSCO published the findings from its recent peer reviews of the regulation of money market funds (MMFs), as part of its monitoring of the implementation of its 2012 recommendations for MMFs. IOSCO reviewed implementation of reforms in three areas: valuation practices; liquidity management; and MMFs that offer a stable net asset value (NAV) (the latter can be more vulnerable to redemption runs than MMFs that allow their price, and hence NAV, to vary). IOSCO found that, as it had recommended, MMFs in most jurisdictions now value securities held in their portfolios using the fair value approach (instead of using a method that does not necessarily reflect their market value). In contrast, progress in implementing liquidity management reforms was less advanced and uneven across jurisdictions. IOSCO concluded that further work is also needed to reinforce the resilience of funds in some of the jurisdictions that permit MMFs to offer a stable NAV.
IOSCO has also published its final recommendations for liquidity risk management by collective investment schemes (CIS) such as MMFs and managed funds. This follows earlier FSB recommendations to address the
liquidity mismatch in open-ended funds. IOSCO recommendations include that CIS should ensure that: their subscription and redemption arrangements are appropriate for their investment strategy and underlying assets; liquidity risk and the processes for managing it are disclosed to current and prospective investors; the liquidity of the assets held in the portfolio is assessed regularly; and ongoing liquidity assessments under various market conditions, which could include fund level stress testing, are conducted.
IOSCO also released a report on its peer review of national authorities’ progress in implementing its 2012 recommendations on aligning the incentives of investors and securitisers, for example, by ensuring that securitisers retain an exposure to the securities that they originate. Progress in implementing these recommendations remains mixed. While only around half the participating jurisdictions have final adoption measures in place, they are in force in the United States, which accounts for around three-quarters of the global securitisation market by size.
Risks and reforms beyond the post-crisis agenda
Regulators have continued work on enhancing the integrity of major interest rate benchmarks following past examples of manipulation. The FSB, in an October progress report, noted that administrators of interbank offered rates (IBORs) are making progress on implementing recommended reforms. These include increasing the extent to which benchmark rates are based on actual transactions and developing alternative benchmarks based on risk-free rates. In January, IOSCO published information for users of benchmarks to consider in selecting an appropriate benchmark. In particular, it focuses on the importance of contingency

R E S E R V E B A N K O F AU S T R A L I A5 6
planning for scenarios in which a benchmark is no longer available. For example, and as noted in the previous Review, the UK Financial Conduct Authority is putting measures in place to manage the risk of an unplanned cessation of the London IBOR (LIBOR). In April, the Federal Reserve Bank of New York began publishing three reference rates, including the Secured Overnight Financing Rate. The latter was recommended by a committee comprising public and private sector representatives as the alternative to US dollar LIBOR for use in certain new US dollar derivatives and other financial contracts. In Australia, legislation recently passed Parliament to reform the legal framework for the regulation of financial benchmarks, such as the bank bill swap rate (BBSW). The Australian Securities Exchange (the administrator of BBSW) has developed a new methodology that will measure BBSW directly from transactions. To support this, market participants have been expected to trade bank bills at outright yields since December. The new methodology is expected to commence soon. The Australian Securities and Investments Commission (ASIC) is in legal proceedings with two major Australian banks in relation to ‘unconscionable conduct and market manipulation’ in setting the BBSW. Similar legal proceedings by ASIC with two other major banks were concluded in November, with the Federal Court imposing penalties on the two banks and those banks also providing ASIC with enforceable undertakings.
The work on interest rate benchmarks is part of broader global and domestic efforts to address misconduct in the financial sector. The FSB will soon publish a toolkit for both firms and supervisors on how governance frameworks can be used to address misconduct risk. It will focus on ways to mitigate the cultural drivers of misconduct, strengthen individual responsibility and accountability, and address the problem of
employees who have engaged in misconduct moving to a new firm. In Australia, the legislation establishing the Banking Executive Accountability Regime (BEAR) passed Parliament on 7 February. The BEAR requires banks and their executives to meet certain expectations and enables banks and individuals to be held to account where they fail to meet those expectations. The BEAR will commence on 1 July 2018 for large authorised deposit-taking institutions (ADIs), and one year later for other ADIs. APRA also released the result of its review of remuneration practices at large financial institutions. APRA found that, although the institutions that were considered met the minimum requirements of the prudential standard, variable pay generally placed too little weighting on risk metrics and was not deferred for long enough (for more information on the remuneration review and the BEAR, see ‘The Australian Financial System’ chapter).
Global and national authorities have been monitoring a wide range of fintech developments. A key focus has been on identifying any nascent risks to financial stability while avoiding actions that could limit the efficiency, financial inclusion and other benefits that can arise from financial innovation. Several papers on fintech were published by international bodies over the past six months:
• In November, the FSB released a report onthe increased use of artificial intelligence(AI) and machine learning in financialservices. The report noted that, while theuse of AI and machine learning by firms andregulators may improve financial systemefficiency and regulatory compliance, itmay also result in new and unexpectedforms of interconnectedness and third-partydependencies within the financial sector.
• The International Association of InsuranceSupervisors (IAIS) issued a consultation

F I N A N C I A L S TA B I L I T Y R E V I E W | A P R I L 2018 5 7
paper in February on the use of digital technology in the provision of insurance to excluded or underserved markets. The paper discusses the implications for regulators and the proportionate application of the IAIS’s insurance core principles (ICPs) in these markets. The application of the ICPs requires that the nature, scale and complexity of regulatory measures not go beyond what is necessary to achieve the supervisory objectives of a jurisdiction. For example, relief from certain measures could be provided by a ‘regulatory sandbox’ – where start-ups and other firms can test certain products or services in a limited manner without being subject to the full regulatory framework.
• Also in February, the BCBS published areport on the implications of the growinguse of fintech for banks and supervisorsover the medium term. A common themeacross the various scenarios considered inthe report is that banks are likely to find itincreasingly difficult to maintain their currentoperating models. For regulators, the reportidentified an overarching need to maintainthe safety and stability of the banking systemwithout inhibiting beneficial financial sectorinnovation. Important considerations forbanks and regulators include the increasinguse of third-party service providers, whetherexisting regulatory frameworks remainrelevant to address the business models andactions of fintech firms, and the operational,cyber and compliance risks posed by fintech.
Domestically, ASIC continues to facilitate fintech start-ups to foster innovative financial products or services, including through the ongoing operation of its regulatory sandbox. Legislation has also been introduced into Parliament to facilitate an enhanced regulatory sandbox for fintech firms, which will allow more
businesses to test for a longer time a wider range of new financial and credit products and services without a licence. In January 2018, ASIC licensed the first crowd-sourced funding intermediaries, so that public companies can offer shares to investors via the online platforms of these intermediaries.
A related issue, cyber risk in the financial sector, has been another area of international focus. The FSB published a stocktake of publicly available regulations, guidance and supervisory practices in October, with the aim of identifying effective practices. The report notes that FSB member jurisdictions have been active in addressing cybersecurity, with all member jurisdictions having released regulations or guidance addressing cybersecurity for at least part of the financial sector. Domestically, in November, ASIC published a report that assesses the cyber preparedness, existing good practices and areas for improvement of firms active in Australia’s financial markets (such as stockbrokers, investment banks and credit rating agencies). ASIC will continue to assess the cyber resilience of regulated firms and measure their progress as they meet improvement targets.
In response to the growing threat of cyber attacks, in March APRA proposed its first prudential standard on information security. The new standard builds on APRA’s principle-based guidance released in 2010 and is to apply to all APRA-regulated entities. It aims to enhance the ability of entities to repel cyber attacks, or respond effectively in the event of a breach. Under the new standard, requirements for entities include: maintaining information security capability commensurate with the size and extent of threats to information assets (including for external service providers); having adequate information security controls in place to protect information assets and undertaking

R E S E R V E B A N K O F AU S T R A L I A5 8
systematic testing of these controls; and notifying APRA of material information security incidents. Following consultation, APRA intends to implement the new standard from 1 July 2019.
The FSB and standard-setting bodies have begun assessing whether the post-crisis reforms are meeting their intended objectives and whether there have been material unintended consequences; this is being guided by an evaluation framework finalised by the FSB last year. As part of the first study, which is evaluating the effects of the reforms on incentives to centrally clear OTC derivatives, in December the Committee on Payments and Market Infrastructures and IOSCO launched a series of qualitative surveys. A report is expected to be completed by the November 2018 G20 Summit in Argentina. The second assessment under the framework is examining the effects of the post-crisis reforms on financial intermediation, with an initial focus on infrastructure financing. To inform this assessment, in March the FSB launched a survey of firms and institutions seeking information on the trends and drivers of, and potential effects of regulatory reforms on, infrastructure financing. A report on infrastructure financing will be published by the G20 Summit.
Domestic Regulatory Developments
Council of Financial Regulators (CFR)
The CFR is a non-statutory body comprising Australia’s main regulatory agencies with financial stability responsibilities: the Australian Treasury, APRA, ASIC and the Reserve Bank, which also provides its secretariat. The CFR is chaired by the Reserve Bank Governor and meets at least quarterly. It engages with other regulatory bodies as appropriate to discuss issues of common interest. As per its charter, the CFR aims to
contribute to the efficiency and effectiveness of financial regulation and to promote stability of the Australian financial system. In particular, it acts as a forum for facilitating coordination among its member agencies to ensure threats to financial system stability are identified and addressed effectively.
The work of the CFR is facilitated through various working groups, largely consisting of representatives of the four CFR agencies, though other agencies participate in some groups (Figure 4.1). Key groups include the Financial Market Infrastructure (FMI) Steering Committee, which helps to coordinate monitoring and policy formulation in relation to FMIs and OTC derivatives markets regulation, and the Crisis Management Working Group, which seeks to establish policies and cross-agency processes for the effective management of distressed financial institutions. The Housing Market Risk Working Group has also been active in recent times, providing analysis of developments in the housing market and industry responses to the recent regulatory measures. Other working groups cover issues such as distributed ledger technology, competition and cyber security. Some groups are set up on a temporary basis to address specific topics (e.g. the FSAP Working Group), while others are ongoing. The working groups aid the work of the CFR by providing papers for discussion and developing recommendations where appropriate.
An important aspect of the ongoing work of the CFR agencies is the strengthening of the domestic framework for managing a financial crisis. The CFR has established a process for managing the resolution of a distressed financial institution to ensure a coordinated response. Much of the robustness of this process depends on APRA having effective crisis management powers to resolve its regulated institutions in an

F I N A N C I A L S TA B I L I T Y R E V I E W | A P R I L 2018 5 9
orderly manner. In February, Parliament passed legislation that will significantly enhance these powers, ensuring that APRA can effectively prepare for, and manage, a distressed bank or insurer, as well as affiliated group entities where relevant. The legislation clarifies APRA’s powers to set requirements for resolution planning for banks and insurers (e.g. by developing prudential standards for resolution and recovery planning, supported by formal powers to direct entities to address barriers to their orderly resolution, such as by changing their business, structure or organisation). In addition, the legislation includes the ability for APRA to:
• ensure the effective resolution of theAustralian branch of a foreign bank or insurer
• appoint a statutory manager to an expandedset of entities in certain circumstances,such as to the authorised non-operatingholding companies (NOHCs) of ADIs, generalinsurers and life insurers, and domesticallyincorporated subsidiaries of these NOHCs,ADIs and insurers
• freeze the rights of counterparties of afinancial group in specific circumstances, toallow sufficient time to effect a resolution.
Crisis Management WG
Financial Market Infrastructure Crisis Management WG
Over-the-counter Derivatives WG
Competition in Clearing and Settlement WG1
Figure 4.1: CFR Working Groups (WGs)
Council of Financial Regulators
FMI Steering Committee
Cyber Security WG
Housing Market Risk WG
1 Includes the ACCC but not APRA2 Includes AUSTRAC3 Includes the ACCC All groups include Australian Treasury, APRA, ASIC and the RBA unless otherwise notedSource: RBA
Climate Change WG
Competition in the Financial Sector WG3
Blockchain WG2
Crisis Communications WG
Financial Sector Assessment Program (FSAP) WG
Regulatory Perimeter WG

R E S E R V E B A N K O F AU S T R A L I A6 0
CFR agencies are currently working on the design of a similar legislative framework for FMIs, which will ensure that the relevant resolution agency (the Bank for clearing and settlement facilities, or ASIC for trade repositories) has the necessary powers to resolve a failing domestic FMI.
At its meetings in November 2017 and March 2018, the CFR discussed several other issues, as noted below.
• The CFR continued to closely monitor developments in the housing market and the effectiveness of the regulatory measures taken by APRA in 2014 and 2017 to reinforce sound residential mortgage lending practices. Discussions covered analysis of developments in housing markets and lending practices, trends and competition among different types of lenders, and the conditions under which some of the measures could be relaxed.
• APRA updated the CFR on its progress in developing a domestic loss-absorbing capacity framework, in response to the government-endorsed recommendation by the Financial System Inquiry. Although none of the Australian banks are global systemically important banks, which means they are not bound by the FSB’s total loss-absorbing capacity standard, the CFR has supported work by APRA to develop a domestic loss-absorbing capacity framework for Australian banks.
• Developments in shadow banking activity, both internationally and domestically, were assessed. Globally, the more problematic forms of shadow banking have declined substantially since the crisis. Domestically, non-ADI lending for housing has grown more quickly than ADI lending over the past year, but its share remains small (see ‘The Australian Financial System’ chapter).
Overall, it was concluded that domestic risks from shadow banking activity remain limited but continued close monitoring is warranted.
• The CFR continued a discussion of the complexities in the management of financial disclosures when an ADI is under stress.
• In November, the CFR established a Climate Change Working Group. The working group will consider and coordinate actions to address the financial risks of changing climate, and society’s response to such changes, for the Australian financial system.
• In March, the CFR endorsed the establishment of a working group to consider regulatory perimeter issues related to stored value payment systems.
CFR agencies continue to work with their New Zealand counterparts via the Trans-Tasman Council on Banking Supervision (TTBC) to further strengthen the cross-border crisis management framework. This includes follow-up work to the TTBC crisis simulation conducted in September last year, along with exploring options for early intervention to support the recovery of a financial institution before it becomes non-viable.
Other domestic regulatory developments
Over 2018, the IMF will conduct its third FSAP review of Australia. The FSAP is conducted every five years or so in jurisdictions with systemically important financial sectors. For this review, the IMF will focus on assessing financial sector vulnerabilities and the overall framework for systemic risk oversight. The FSAP will include an assessment of Australia’s banking regulatory framework and supervisory practices against the BCBS’s Core Principles for Effective Banking Supervision. It will also include reviews of the regulation of FMIs and the insurance sector, and crisis management arrangements. Following initial discussions in December on the scope

F I N A N C I A L S TA B I L I T Y R E V I E W | A P R I L 2018 6 1
of the review, the IMF FSAP team plans further meetings later in 2018 with CFR agencies, other government bodies, and private sector firms such as banks. A report with the key findings of the review is expected to be published in early 2019. The Bank and other CFR agencies are working closely with the IMF to ensure the FSAP is effective and efficient.
In February, the Productivity Commission released a draft report setting out the preliminary findings of its inquiry into competition in the Australian financial system. One focus of the draft report is the apparent inability of consumers to impose discipline on financial services providers, reflecting factors such as their level of financial literacy and engagement, the complexity of products, and the availability of information. The draft report makes a number of recommendations to address these issues, including: increasing the transparency of mortgage interest rates; imposing a legal duty on lender-owned mortgage aggregators and brokers to act in the best interests of the consumer; enhancing the information that mortgage brokers are required to provide to their clients; and implementing the open banking regime in a way that grants consumers full rights to access and use their digital data. The Bank welcomes and supports the Commission’s focus on these areas.
The Commission also makes observations about the impact of regulation on competition. It recommends that one regulator be tasked with formally assessing the effects on competition of planned regulatory interventions in the sector. The Bank provided its perspectives on these issues, and on the Commission’s recommendations related to retail payment systems, in a supplementary submission in March. The Commission’s final report will be handed to the government by 1 July.
The Royal Commission into Misconduct in the Banking, Superannuation and Financial Services Industry held its first round of hearings in March, focused on consumer lending practices. The next round of public hearings in April will focus on financial planning and wealth management. The Commission plans to hold further rounds periodically throughout the year, with their focus to be announced at a future date. The Commission may release an interim report before the end of September, and a final report is due to be submitted to the government by 1 February 2019. R

R E S E R V E B A N K O F AU S T R A L I A62
Box E
Reforms to the Basel III Capital Framework
In response to the global financial crisis, the international Basel Committee on Banking Supervision (BCBS) developed the Basel III capital and liquidity framework with the objective of improving the resilience of the banking system. A core element of the framework was to significantly increase the amount of capital held by banks. The Basel III capital framework was agreed to in 2010 with implementation by jurisdictions starting from 2013. In monitoring the implementation of Basel III, however, the BCBS found significant variation in the value of risk weights calculated by banks, even among those with similar business models and risk profiles. This variability across banks can affect their capital ratios significantly, potentially undermining the objective of the framework (Graph E1). So over recent years, the BCBS has considered ways to reduce unwarranted variability in risk weights, as well as to increase the simplicity, comparability and risk sensitivity of the Basel III capital framework. In December, the Group of Central Bank Governors and Heads of Supervision – the oversight body of the BCBS – endorsed apackage of reforms designed to achieve thesegoals. This box outlines the changes made tothe Basel III capital framework, their likely effects,and the agreed implementation timeline. TheAustralian Prudential Regulation Authority (APRA)has issued a consultation paper on modificationsto the domestic capital framework that takethese reforms to Basel III into account. However,Australian banks are unlikely to need to raiseadditional capital due to these changes as theyare already well capitalised.
Key Reforms to the Basel III Capital FrameworkThe BCBS agreed to several key changes to the following aspects of the Basel III capital framework.1
• The standardised approach for credit risk, which is the default method for calculatingrisk-weighted capital requirements. Therevisions to this aspect of Basel III mostlyfocus on enhancing the risk sensitivity of theframework. One of the main changes to thestandardised approach is the introductionof risk weights for commercial real estate,income-producing real estate and residentialreal estate exposures that increase with the
1 Note that some detailed elements of the framework are subject to national discretion.
Graph E1
European banksNorth American banksAsian or Australian banks
-3
-2
-1
0
1
2
ppt
-3
-2
-1
0
1
2
ppt
Impact of Unwarranted RiskWeight Variability on Capital Ratios*
By bank
* Percentage point deviation from a 10 per cent capital ratio due to thedifference between a bank’s RWAs as extrapolated from the BCBS’shypothetical portfolio exercise (in which banks were asked to calculatethe risk weights for a common set of exposures) and that bank’s RWAsas calculated using the median risk weights from that exercise.
Sources: BCBS; RBA
F I N A N C I A L S TA B I L I T Y R E V I E W | A P R I L 2018 63
loan-to-valuation ratio (LVR) of the loan.2 More granular risk weights for exposures to banks and corporations have also been introduced.
• The internal ratings-based (IRB) approaches for credit risk, under which banks calculatetheir own risk weights for determining RWAsusing internal models (rather than applyingthe risk weights set by the supervisor underthe standardised approach). The revisionsto Basel III impose additional constraints onthese models by, first, introducing minimumvalues for some inputs and, second, reducingthe number of inputs that can be estimatedby banks. To model risk weights, banksestimate the probability of default, loss givendefault (LGD) and exposure at default (EAD)for certain exposures. The reforms imposea minimum value for each of these inputsdepending on the nature of the exposure.For instance, banks will be required to use aminimum LGD of 5 per cent for residentialmortgage exposures. The reforms alsorequire banks to use supervisor-set estimatesof LGD and EAD to calculate risk weights forfinancial institutions, and large and mid-sizedcorporations (instead of estimating theseparameters using their internal models).The rationale for this change is that the LGDand EAD for these exposures are inherentlyunpredictable, which is likely to lead tosignificant variation in banks’ estimates. Thesechanges should accordingly increase thecomparability of the framework by reducingvariance in the risk weights generated bybanks’ models.
2 The LVR used for calculating the risk weight will decline over time as the loan is repaid. There is some supervisory discretion over how the value of the property can be adjusted, but generally it will be maintained at the value measured at origination unless an extraordinary, idiosyncratic event results in a permanent reduction in value.
• The ‘output floor’, which places a limit onthe benefit a bank derives from using itsinternal models for estimating regulatorycapital. It requires that, to calculate capitalrequirements, IRB banks use the higher oftotal RWAs calculated using their internalmodels or 72.5 per cent of total RWAscalculated using only the standardisedapproach. Banks will also be required todisclose their total RWAs based on thestandardised approach.
• The leverage ratio, which specifies aminimum level of capital to be held againsttotal (rather than risk-weighted) assets. Themain reform to this aspect of the frameworkis the introduction of a capital add-on, orbuffer, for global systemically importantbanks (G-SIBs). A similar buffer is currentlyapplied to G-SIBs under the risk-weightedcapital framework, so this reform restoresthe relative incentives provided by bothcapital constraints for G-SIBs. The bufferapplied to a G-SIB’s leverage ratio is 50 percent of the buffer applied to that G-SIB’s risk-weighted capital requirement.3 There are noAustralian G-SIBs.
• The operational risk framework, whichrequires banks to hold capital against therisk of losses resulting from events such asfraud, misconduct fines and cyber attacks.The operational risk framework has beensimplified, with the current modelledapproach and the three standardisedapproaches for operational risk beingreplaced with a single risk-sensitivestandardised approach. Under the newapproach, a bank’s operational risk capitalrequirement increases with its historicaloperational losses and income.
3 For example, a G-SIB subject to a two percentage point surcharge on its risk-weighted capital requirement would be subject to a one percentage point surcharge on its leverage ratio.

R E S E R V E B A N K O F AU S T R A L I A64
additional capital in order to meet the new requirements.5 Reforms to the output floor and the credit risk framework are expected to raise aggregate minimum capital requirements, but this is expected to be offset by lower capital requirements from revisions to the operational risk framework (Graph E3).
As with other BCBS policies, the detailed implementation of these reforms in individual countries may differ slightly from the framework described above in order to account for local circumstances. Domestically, APRA has stated that Australia is ‘well-equipped to accommodate the final Basel III framework’ and is currently consulting on the implementation of the reforms (for further detail see ‘The Australian Financial System’ chapter).6 As noted earlier, the implementation of the reforms in Australia is unlikely to require the Australian banks to raise
5 This estimate is for total capital. See EBA (2017), ‘Ad Hoc Cumulative Impact Assessment of the Basel Reform Package’, December, p. 5.
6 See APRA (2017), ‘APRA welcomes finalisation of Basel III bank capital framework’, December.
Effects of the ReformsAs discussed above, the primary objective of the recent reforms is to limit unwarranted risk weight variability within Basel III’s broader goal of enhancing bank resilience. While the effects of the changes on risk weight variability can only be fully assessed after implementation, the results of the BCBS’s pre-implementation quantitative assessment suggest that the distribution of average risk weights for large, internationally active banks will become more closely clustered around the mean (Graph E2).4
One objective of the BCBS has been to finalise the reforms without significantly increasing overall capital requirements. Accordingly, the reforms are projected to result in little change to aggregate minimum capital requirements, although for some banks capital requirements are likely to increase, while they will decrease for some others. For instance, the European Banking Authority (EBA) estimates that large European banks will need to accumulate €37 billion in
4 See BCBS (2017), ‘Basel III Monitoring Report: Results of the cumulative quantitative impact study’, December, pp. 19–21.
Graph E2
Graph E3
Current frameworkAfter reforms
<5
5–10
10–1
5
15–2
0
20–2
5
25–3
0
30–3
5
35–4
0
40–4
5
45–5
0
50–5
5
55–6
0
60–6
5
65–7
0 ≥700
10
20
%
0
10
20
%
Distribution of AverageRisk Weights under Basel III*
Share of banks in each bucket
* For total credit risk excluding sovereignsSources: BCBS; RBA
Cre
dit
risk
Out
put
floor
Ope
ratio
nal
risk
Leve
rage
ratio
(net
)*
Tota
l-4
-3
-2
-1
0
1
%
-4
-3
-2
-1
0
1
%
Change in Aggregate Minimum Tier 1 CapitalRequirements Due to the Basel III Reforms
By reform area
* A decrease is recorded if a bank’s minimum capital requirementchanges from being determined by the leverage ratio to beingdetermined by the risk-based framework in order to balance theaggregate change and total effect.
Sources: BCBS; RBA

F I N A N C I A L S TA B I L I T Y R E V I E W | A P R I L 2018 65
additional capital. APRA is not seeking to increase capital requirements beyond those announced in July 2017 as part of the ‘unquestionably strong’ benchmarks.
While the BCBS continues to refine some areas of the Basel III capital framework, the finalisation of the reforms largely marks the end of the main post-crisis rule-making effort by the BCBS. Its attention is now increasingly focused on monitoring the implementation of the reforms and assessing their effects.
ImplementationAccording to the international implementation timetable set by the BCBS, reforms to the standardised and IRB approaches for credit risk, the operational risk framework and the leverage ratio come into effect on 1 January 2022. Banks in BCBS member jurisdictions will have to meet the entire change in capital requirements arising from these reforms by this date. By contrast, the output floor will be phased in from 1 January 2022, starting at 50 per cent and increasing in stages until the final floor of 72.5 per cent is reached on 1 January 2027. However, individual jurisdictions have the discretion to implement the reforms at an accelerated pace.
During the implementation of the output floor, a ‘transitional cap’ may be applied at the discretion of the national supervisor. The transitional cap limits the overall increase in RWAs due to the implementation of the output floor to 25 per cent for an individual bank. This means that, during the phase-in period, a bank’s minimum capital requirement could be capped at 1.25 times the requirement calculated before the application of the floor. The cap must be removed once the output floor is fully implemented in 2027, at which point banks given relief under the cap must meet the entire increase in capital requirements. R

R E S E R V E B A N K O F AU S T R A L I A66 R E S E R V E B A N K O F AU S T R A L I A66

F I N A N C I A L S TA B I L I T Y R E V I E W | A P R I L 2018 6 7
Copyright and Disclaimer Notices
HILDAThe following Disclaimer applies to data obtained from the HILDA Survey and used in the chapter on ‘Households and Business Finances’ and reported in ‘Box B: Recent Trends in Personal Credit’ in this issue of the Review.
Disclaimer
This Review uses unit record data from the Household, Income and Labour Dynamics in Australia (HILDA) Survey. The unit record data from the HILDA Survey was obtained from the Australian Data Archive, which is hosted by The Australian National University. The HILDA Survey was initiated and is funded by the Australian Government Department of Social Services (DSS) and is managed by the Melbourne Institute of Applied Economic and Social Research (Melbourne Institute). The findings and views reported in this Review, however, are those of the author and should not be attributed to the Australian Government, DSS, the Melbourne Institute, the Australian Data Archive or The Australian National University and none of those entities bear any responsibility for the analysis or interpretation of the unit record data from the HILDA Survey contained in this Review.

R E S E R V E B A N K O F AU S T R A L I A6 8

Related Documents