Financial Stability Review 2004 Eurosystem

Welcome message from author
This document is posted to help you gain knowledge. Please leave a comment to let me know what you think about it! Share it to your friends and learn new things together.
Transcript
Financial StabilityReview 2004
Eurosystem

© National Bank of Belgium
All rights reserved. Reproduction of all or part of this brochure for educational and non-commercial purposes is permitted provided that the source is acknowledged.

3
CONTENTS
Contents
FOREWORD 5
EXECUTIVE SUMMARY 7
FINANCIAL STABILITY OVERVIEW 17
International fi nancial markets 17Financial position of the Belgian private sector 23Banking sector 35Insurance companies 52Financial infrastructures 62Statistical annex 67
THEMATIC ARTICLES 93
Corporate governance, regulation and supervision of banks 95Belgian SMEs and bank lending relationships 121The determinants of credit spreads 135Interest rate risk in the Belgian banking sector 157Impact of IAS 39 on asset and liability management and banks’ capital ratios 181
The Financial Stability Review is the fruit of a collective effort. The following persons have actively contributed to this issue of the Review :
P. Praet from the National Bank of Belgium and the Banking, Finance and Insurance Commission ; C. Buydens, J.-M. Delaval, J. Devriese, J. De Wit, P. Gourdin, V. Hendrichs, P. Lescrauwaet, K. Maes, N. Masschelein, J. Mitchell, G. Nguyen, Th. Schepens, Th. Timmermans and A. Van Landschoot from the National Bank of Belgium ; D. Guillaume and M. Lein from the Banking, Finance and Insurance Commission ; H. Degryse, M. Dewatripont and D. Heremans as external experts.

5
FOREWORDFOREWORD
One of the key implications of the globalisation of the fi nancial system is that market participants are reacting much more quickly than in the past to common sources of information. This increases the risk of occurrence of collective behaviour which, however justifi ed at an individual level, could create systemic problems once adopted simultaneously by a large number of institutions. In this new environment, there is a growing need to complement micro-prudential surveillance, focused on the resilience of individual fi nancial institutions, with macro-prudential analysis, which endeavours to detect more general developments liable to weaken global fi nancial stability.
In Belgium, the co-ordination and integration of those two specifi c approaches will be greatly facilitated by the recent institutional links created between the central bank and the supervisory authority. In the last twelve months, those institutions have become more closely interconnected. On the one hand, the Banking and Finance Commission and the Insurance Supervision Offi ce have been merged into the Banking, Finance and Insurance Commission (BFIC). On the other hand, a Financial Stability Committee has been established, bringing together members of the boards of the National Bank of Belgium and the BFIC in order to better organise functions of common interest such as the co-ordination of crisis management or the launching of a business continuity plan.
While contagion mechanisms within the fi nancial system may give the impression of unfolding very rapidly, they are often the fi nal stage in a process which has been gradually building up, sometimes for quite a long time. This sequence of events illustrates the importance, but also the diffi culty, of the preventive role of macro-prudential analysis. The general overview of fi nancial conditions presented in the fi rst part of this Financial Stability Review (FSR) addresses this issue. The major threats to the stability of the system seem to have been receding recently. However, it is precisely in this better, apparently more benign, environment that fi nancial institutions usually become less alert to risks. The best way to prevent the materialisation of risks is to closely monitor the system and to encourage market participants to implement effi cient risk management instruments and procedures.
All the same, risks are inherent in the activity of banks. A compromise has to be found between supervisory authorities’ concerns for fi nancial stability and shareholders’ objectives. Within each fi nancial institution, the appetite for risk may also differ between shareholders and managers. A good mechanism of checks and balances has to be established between supervision, regulation and corporate governance of banks. The frame in which this delicate exercise has to be conducted is described in a fi rst thematic article of this FSR.
The four other articles can be subdivided into two groups, devoted to two main categories of risks incurred by banks, i.e. credit risks and interest rate risks.
ForewordBy Guy Quaden, Governor

6
Traditionally, the bank lending relationship has been characterised, in Belgium, by a high degree of continuity. Most corporations rely on a very limited number of credit institutions as their source of external fi nance. By establishing those long-term stable relationships with their corporate clients and, in particular, with small and medium-sized enterprises (SMEs), Belgian banks are in a position to reduce the specifi c asymmetric information problems in credit relations with small fi rms. An article in this FSR tries to detect whether there have recently been some structural changes in the Belgian banks’ corporate loan market and, more specifi cally, which are the main variables that could determine the number of relationships initiated by SMEs.
At the same time, larger corporations are increasingly turning to market fi nancing as a potential substitute for bank loans. The issuance of corporate bonds and commercial paper is growing, while banks themselves may take advantage of those new markets to off-load part of their credit book through securitisation or the use of credit derivatives. As a consequence, fi nancial markets have access to new pricing indicators, as credit spreads are now available for a wider range of risks. However, even within a given category of credit rating, those spreads are not fi xed but may be subject to quite large fl uctuations. A third paper tries to measure empirically which are the main determinants of those variations.
Given the importance of the banks’ maturity transformation activity, it is a signifi cant point that interest rate risks are only very partially covered by capital requirements. In line with Basel I practices, Basel II will only impose formal constraints on interest rate risks originating from the trading book. Indeed, there are no internationally agreed formal capital requirements with respect to the interest rate risk in the banking book, partly because of the diffi culty of quantifying the embedded options in the deposit accounts which fi nance a substantial portion of the banks’ intermediation activities. This does not imply that those risks are not monitored. Supervisors have developed a number of off-site tools that are used as a detection device and which can, if necessary, trigger more detailed on-site inspections. This individual assessment, by national supervisors, of the interest rate risk profi le of each institution, will be part of the second pillar of Basel II. The problems faced in the measurement of interest rate risks and the instruments used by supervisory authorities are analysed in a fourth article.
Individual institutions themselves have adopted sophisticated interest rate risk management techniques through their asset and liability management (ALM) procedures. They resort, in particular, to various hedging mechanisms, be it for individual positions or at a more global level, with so-called macro-hedging. The procedures for the use and reporting of those instruments will be strongly affected by the new International Accounting Standards (IAS) accounting system, which will have to be implemented for all Belgian banks’ consolidated accounts. In particular, the IAS 39 standard will introduce new valuation rules, one purpose of which is to put derivative products on banks’ balance sheets. Although this standard is not yet completely fi nalised, major banks are already actively preparing for its implementation. The last article of this FSR illustrates, with the help of a concrete example, how a bank could smooth the impact of the new rules on the volatility of its results without modifying its ALM position.
Brussels, June 2004
7
EXECUTIVE SUMMARY
1. Overview
While the Overview Article mainly concentrates on recent developments in the fi nancial position of Belgian households and non-fi nancial corporations, and on the soundness of the Belgian credit institutions and insurance companies, the economic and fi nancial environment in which these economic agents operate is highly depend-ent on international developments. This applies to the real sector, as Belgium is very open to international trade and, so, quite sensitive to changes in the growth performance of its main trading partners. It is also true for the fi nancial sector as it is highly integrated into European (and global) money and capital markets.
In this perspective, international developments were quite supportive for the Belgian fi nancial system during the period under review (June 2003 - May 2004), as low interest rates and stronger global economic growth set the stage for fi rming equity prices and a further narrowing of risk premia on corporate and emerging market bonds. The overall rate of growth in Belgium remained neverthe-less quite weak and the buoyancy of fi nancial markets is increasingly tempered by changing expectations about the speed and magnitude of a return to a more neutral monetary policy. As a result, long-term interest rates and risk premia in certain markets have shown a tendency to increase again.
While one of the main potential stress scenarios for the global fi nancial system in the future could therefore con-sist in a signifi cant further upward adjustment in long-term interest rates – with potential repercussions on the prices of other fi nancial assets –, these adjustments are occurring in the context of a further strengthening and broadening of the global economic recovery. Provided that the process is correctly anticipated and managed by fi nancial markets and institutions, the expected transition
Executive Summary
towards less ample liquidity conditions in the period ahead therefore does not necessarily have to be disrup-tive for global fi nancial markets, although the associated risks should be monitored closely.
1.1 Financial position of Belgian households and non-fi nancial corporations
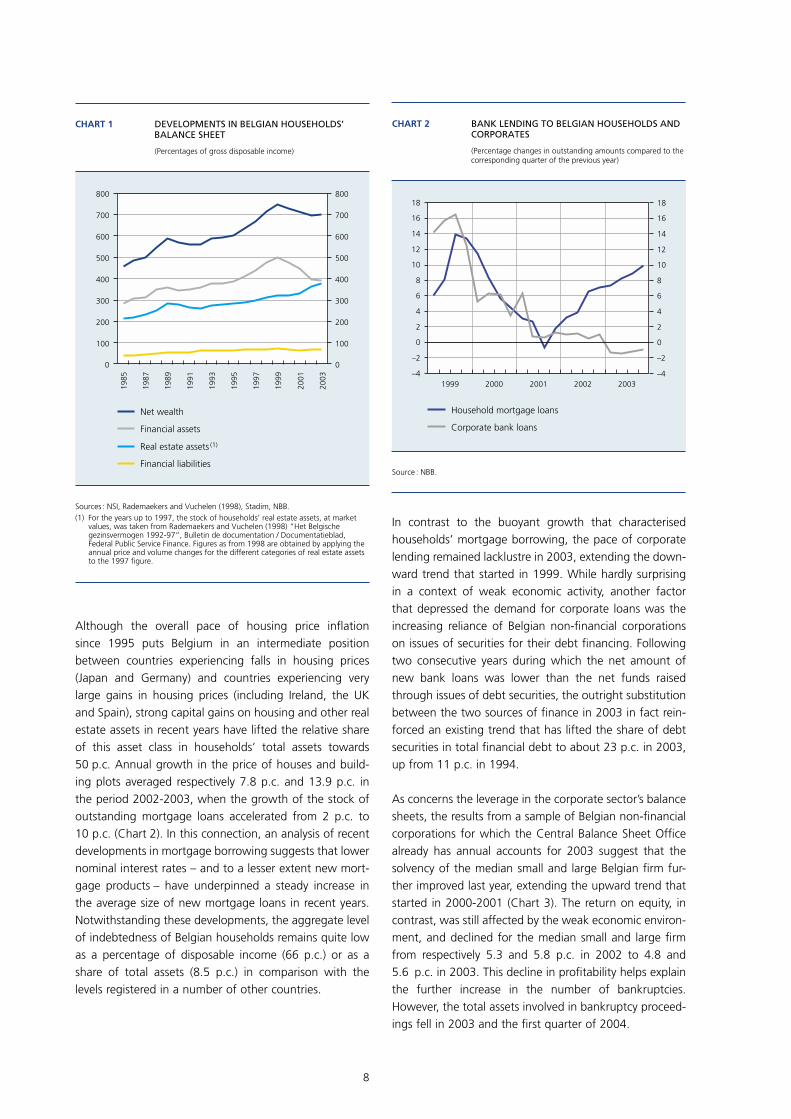
Notwithstanding a moderate rate of real GDP growth (1.1 p.c.), the balance sheet of Belgian households remained very strong in 2003, as their net wealth stabi-lised at about seven times their annual disposable income (Chart 1).
Following a signifi cant decline between 1999 and 2002 – as a result of substantial mark-downs in the market value of equity holdings –, households’ fi nancial assets stabilised last year at about four times disposable income, but some further major changes occurred in the composi-tion of this asset class. The share of outstanding claims on institutional investors, which include investments in life insurance products, mutual funds and pension funds, con-tinued to grow (to about 36 p.c.), on the back of strong net infl ows into mutual funds with capital protection and life insurance products with minimum guaranteed rates of return. The preference for low-risk assets, in combination with attractive yields offered by banks on (tax favourable) regulated savings accounts, also fostered further growth in bank deposits. Yet, as it was offset by a continuing structural decline in the outstanding amount of bank bonds (“kasbons” ; “bons de caisse”), the share of house-holds’ claims on banks remained broadly unchanged at 37 p.c. of their total fi nancial assets.
8
Although the overall pace of housing price infl ation since 1995 puts Belgium in an intermediate position between countries experiencing falls in housing prices (Japan and Germany) and countries experiencing very large gains in housing prices (including Ireland, the UK and Spain), strong capital gains on housing and other real estate assets in recent years have lifted the relative share of this asset class in households’ total assets towards 50 p.c. Annual growth in the price of houses and build-ing plots averaged respectively 7.8 p.c. and 13.9 p.c. in the period 2002-2003, when the growth of the stock of outstanding mortgage loans accelerated from 2 p.c. to 10 p.c. (Chart 2). In this connection, an analysis of recent developments in mortgage borrowing suggests that lower nominal interest rates – and to a lesser extent new mort-gage products – have underpinned a steady increase in the average size of new mortgage loans in recent years. Notwithstanding these developments, the aggregate level of indebtedness of Belgian households remains quite low as a percentage of disposable income (66 p.c.) or as a share of total assets (8.5 p.c.) in comparison with the levels registered in a number of other countries.
In contrast to the buoyant growth that characterised households’ mortgage borrowing, the pace of corporate lending remained lacklustre in 2003, extending the down-ward trend that started in 1999. While hardly surprising in a context of weak economic activity, another factor that depressed the demand for corporate loans was the increasing reliance of Belgian non-fi nancial corporations on issues of securities for their debt fi nancing. Following two consecutive years during which the net amount of new bank loans was lower than the net funds raised through issues of debt securities, the outright substitution between the two sources of fi nance in 2003 in fact rein-forced an existing trend that has lifted the share of debt securities in total fi nancial debt to about 23 p.c. in 2003, up from 11 p.c. in 1994.
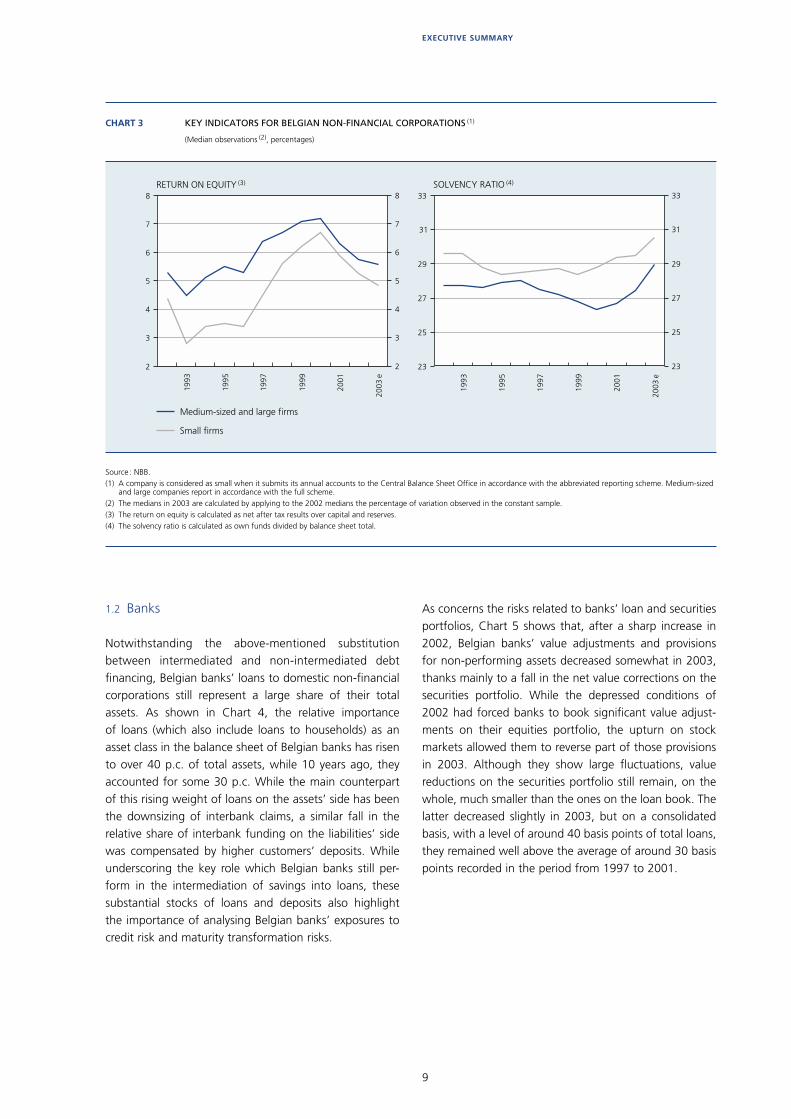
As concerns the leverage in the corporate sector’s balance sheets, the results from a sample of Belgian non-fi nancial corporations for which the Central Balance Sheet Offi ce already has annual accounts for 2003 suggest that the solvency of the median small and large Belgian fi rm fur-ther improved last year, extending the upward trend that started in 2000-2001 (Chart 3). The return on equity, in contrast, was still affected by the weak economic environ-ment, and declined for the median small and large fi rm from respectively 5.3 and 5.8 p.c. in 2002 to 4.8 and 5.6 p.c. in 2003. This decline in profi tability helps explain the further increase in the number of bankruptcies. However, the total assets involved in bankruptcy proceed-ings fell in 2003 and the fi rst quarter of 2004.
1985
1987
1989
1991
1993
1995
1997
1999
2001
2003
0
100
200
300
400
500
600
700
800
0
100
200
300
400
500
600
700
800
CHART 1 DEVELOPMENTS IN BELGIAN HOUSEHOLDS’ BALANCE SHEET
(Percentages of gross disposable income)
Sources : NSI, Rademaekers and Vuchelen (1998), Stadim, NBB.(1) For the years up to 1997, the stock of households’ real estate assets, at market
values, was taken from Rademaekers and Vuchelen (1998) “Het Belgische gezinsvermogen 1992-97”, Bulletin de documentation / Documentatieblad, Federal Public Service Finance. Figures as from 1998 are obtained by applying the annual price and volume changes for the different categories of real estate assets to the 1997 figure.
Net wealth
Financial assets
Real estate assets (1)
Financial liabilities
–4
–2
0
2
4
6
8
10
12
14
16
18
1999 2000 2001 2002 2003–4
–2
0
2
4
6
8
10
12
14
16
18
CHART 2 BANK LENDING TO BELGIAN HOUSEHOLDS AND CORPORATES
(Percentage changes in outstanding amounts compared to the corresponding quarter of the previous year)
Source : NBB.
Household mortgage loans
Corporate bank loans
9
EXECUTIVE SUMMARY
1.2 Banks
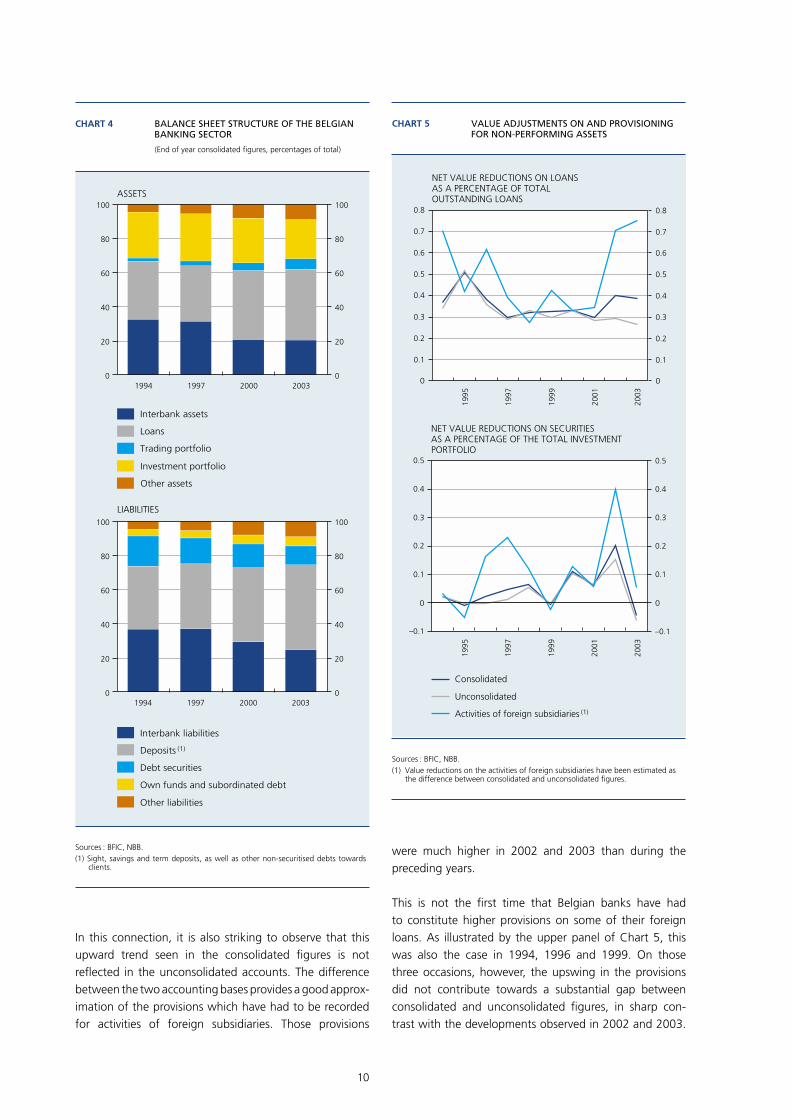
Notwithstanding the above-mentioned substitution between intermediated and non-intermediated debt fi nancing, Belgian banks’ loans to domestic non-fi nancial corporations still represent a large share of their total assets. As shown in Chart 4, the relative importance of loans (which also include loans to households) as an asset class in the balance sheet of Belgian banks has risen to over 40 p.c. of total assets, while 10 years ago, they accounted for some 30 p.c. While the main counterpart of this rising weight of loans on the assets’ side has been the downsizing of interbank claims, a similar fall in the relative share of interbank funding on the liabilities’ side was compensated by higher customers’ deposits. While underscoring the key role which Belgian banks still per-form in the intermediation of savings into loans, these substantial stocks of loans and deposits also highlight the importance of analysing Belgian banks’ exposures to credit risk and maturity transformation risks.
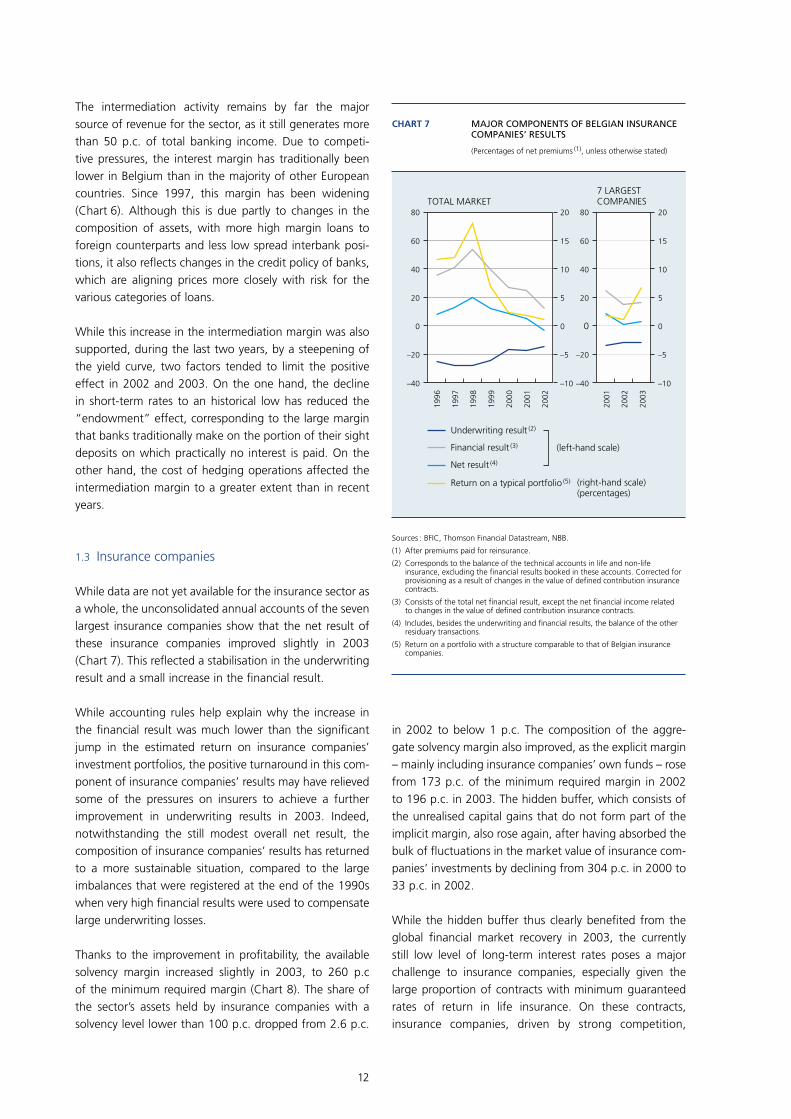
As concerns the risks related to banks’ loan and securities portfolios, Chart 5 shows that, after a sharp increase in 2002, Belgian banks’ value adjustments and provisions for non-performing assets decreased somewhat in 2003, thanks mainly to a fall in the net value corrections on the securities portfolio. While the depressed conditions of 2002 had forced banks to book signifi cant value adjust-ments on their equities portfolio, the upturn on stock markets allowed them to reverse part of those provisions in 2003. Although they show large fl uctuations, value reductions on the securities portfolio still remain, on the whole, much smaller than the ones on the loan book. The latter decreased slightly in 2003, but on a consolidated basis, with a level of around 40 basis points of total loans, they remained well above the average of around 30 basis points recorded in the period from 1997 to 2001.
2
3
4
5
6
7
8
2
3
4
5
6
7
8
23
25
27
29
31
33
23
25
27
29
31
3319
93
1995
1997
1999
2001
1993
1995
1997
1999
2001
CHART 3 KEY INDICATORS FOR BELGIAN NON-FINANCIAL CORPORATIONS (1)
(Median observations (2), percentages)
Source : NBB.(1) A company is considered as small when it submits its annual accounts to the Central Balance Sheet Office in accordance with the abbreviated reporting scheme. Medium-sized
and large companies report in accordance with the full scheme. (2) The medians in 2003 are calculated by applying to the 2002 medians the percentage of variation observed in the constant sample. (3) The return on equity is calculated as net after tax results over capital and reserves.(4) The solvency ratio is calculated as own funds divided by balance sheet total.
2003
e
2003
e
Small firms
Medium-sized and large firms
RETURN ON EQUITY (3) SOLVENCY RATIO (4)
10
In this connection, it is also striking to observe that this upward trend seen in the consolidated fi gures is not refl ected in the unconsolidated accounts. The difference between the two accounting bases provides a good approx-imation of the provisions which have had to be recorded for activities of foreign subsidiaries. Those provisions
1994 1997 2000 20030
20
40
60
80
100
0
20
40
60
80
100
1994 1997 2000 20030
20
40
60
80
100
0
20
40
60
80
100
CHART 4 BALANCE SHEET STRUCTURE OF THE BELGIAN BANKING SECTOR
(End of year consolidated figures, percentages of total)
Sources : BFIC, NBB.(1) Sight, savings and term deposits, as well as other non-securitised debts towards
clients.
ASSETS
LIABILITIES
Interbank assets
Loans
Trading portfolio
Investment portfolio
Other assets
Own funds and subordinated debt
Deposits (1)
Debt securities
Other liabilities
Interbank liabilities
1995
1997
1999
2001
2003
1995
1997
1999
2001
2003
0
0.8
0.7
0.6
0.5
0.4
0.3
0.2
0.1
0
0.8
0.7
0.6
0.5
0.4
0.3
0.2
0.1
0
0.5
0.4
0.3
0.2
0.1
–0.1
0
0.5
0.4
0.3
0.2
0.1
–0.1
Consolidated
Unconsolidated
Activities of foreign subsidiaries (1)
NET VALUE REDUCTIONS ON SECURITIESAS A PERCENTAGE OF THE TOTAL INVESTMENTPORTFOLIO
NET VALUE REDUCTIONS ON LOANSAS A PERCENTAGE OF TOTALOUTSTANDING LOANS
CHART 5 VALUE ADJUSTMENTS ON AND PROVISIONING FOR NON-PERFORMING ASSETS
Sources : BFIC, NBB.(1) Value reductions on the activities of foreign subsidiaries have been estimated as
the difference between consolidated and unconsolidated figures.
were much higher in 2002 and 2003 than during the preceding years.
This is not the fi rst time that Belgian banks have had to constitute higher provisions on some of their foreign loans. As illustrated by the upper panel of Chart 5, this was also the case in 1994, 1996 and 1999. On those three occasions, however, the upswing in the provisions did not contribute towards a substantial gap between consolidated and unconsolidated fi gures, in sharp con-trast with the developments observed in 2002 and 2003.

11
EXECUTIVE SUMMARY
This difference mostly refl ects a volume effect. The loan portfolio of Belgian banks’ subsidiaries abroad has risen signifi cantly in recent years, increasing the vulnerability of the Belgian banking system to developments in some foreign markets.
As shown in Table 1, the overall reduction in value correc-tions contributed in no small way to the improvement in Belgian banks’ profi tability. In fact it was the main factor contributing to the 15.3 p.c. increase in the net operating result in 2003. The gross operating result remained fl at, as the decline in operating costs (–1.8 p.c.) was compen-sated by a 1.2 p.c. decline in banking income. As a conse-quence, the recent upward trend in the cost-income ratio of Belgian banks has hardly been reversed. In 2003 this ratio levelled off at about 74 p.c., i.e. a much higher level than the minimum of 66 p.c. achieved in 1998.
While the cost reduction is partly the outcome of syner-gies achieved thanks to the various mergers that took place in previous years, Belgian banks are fi nding it dif-fi cult to enhance their income. Net non-interest income went down for the third consecutive year, mainly refl ect-ing a further decrease in fee generating business. And, notwithstanding a slight improvement towards the end of the year, full year results stemming from intermediation activities were fl at in 2003, refl ecting subdued corporate lending activity in a lacklustre economic environment.
TABLE 1 MAJOR COMPONENTS OF THE INCOME STATEMENT OF BELGIAN CREDIT INSTITUTIONS (1)
(Figures on a consolidated basis, percentage changes compared to the previous year)
Sources : BFIC, NBB.(1) In order to avoid the major impact, on the income statement, of the transfer of the participation in Dexia Banque Internationale de Luxembourg (BIL) from Dexia Bank
Belgium to Dexia Group, 2003 percentage changes have been calculated using published figures from Dexia Group instead of supervisory data on Dexia Bank Belgium.
2000 2001 2002 2003
Net interest income . . . . . . . . . . . . . . . . 3.0 4.6 3.2 0.0
Net non-interest income . . . . . . . . . . . . 28.5 –1.2 –11.7 –2.6
Banking income . . . . . . . . . . . . . . . . . 15.3 1.4 –4.6 –1.2
Staff costs . . . . . . . . . . . . . . . . . . . . . . . 11.7 6.7 –0.5 0.8
Other operating costs . . . . . . . . . . . . . . 24.9 2.3 –6.3 –4.1
Operating costs . . . . . . . . . . . . . . . . . . 19.0 4.1 –3.8 –1.8
Gross operating result . . . . . . . . . . . . 6.8 –5.6 –6.9 0.1
Value corrections . . . . . . . . . . . . . . . . . . –9.6 4.6 36.2 –31.3
Net operating result . . . . . . . . . . . . . . 12.3 –8.3 –20.2 15.3
Consolidated result, part of the group 50.6 –32.1 –15.2 14.3
1995
1997
1999
2001
2003
100
110
120
130
140
150
160 4.0
3.5
3.0
2.5
2.0
1.5
1.0
0.5
0
Intermediation margin
Intermediation margin exluding the results of hedging operations
(left-hand scale)
Average spread between long-term and short-term interest rates (percentage points) (right-hand scale)
CHART 6 INTERMEDIATION MARGIN OF BELGIAN BANKS (1)
(Consolidated figures ; basis points, unless otherwise stated)
Sources : BFIC, NBB.(1) The intermediation margin is calculated as the difference between the implicit
interest rate received and paid on interest-bearing assets and liabilities respectively.
12
The intermediation activity remains by far the major source of revenue for the sector, as it still generates more than 50 p.c. of total banking income. Due to competi-tive pressures, the interest margin has traditionally been lower in Belgium than in the majority of other European countries. Since 1997, this margin has been widening (Chart 6). Although this is due partly to changes in the composition of assets, with more high margin loans to foreign counterparts and less low spread interbank posi-tions, it also refl ects changes in the credit policy of banks, which are aligning prices more closely with risk for the various categories of loans.
While this increase in the intermediation margin was also supported, during the last two years, by a steepening of the yield curve, two factors tended to limit the positive effect in 2002 and 2003. On the one hand, the decline in short-term rates to an historical low has reduced the “endowment” effect, corresponding to the large margin that banks traditionally make on the portion of their sight deposits on which practically no interest is paid. On the other hand, the cost of hedging operations affected the intermediation margin to a greater extent than in recent years.
1.3 Insurance companies
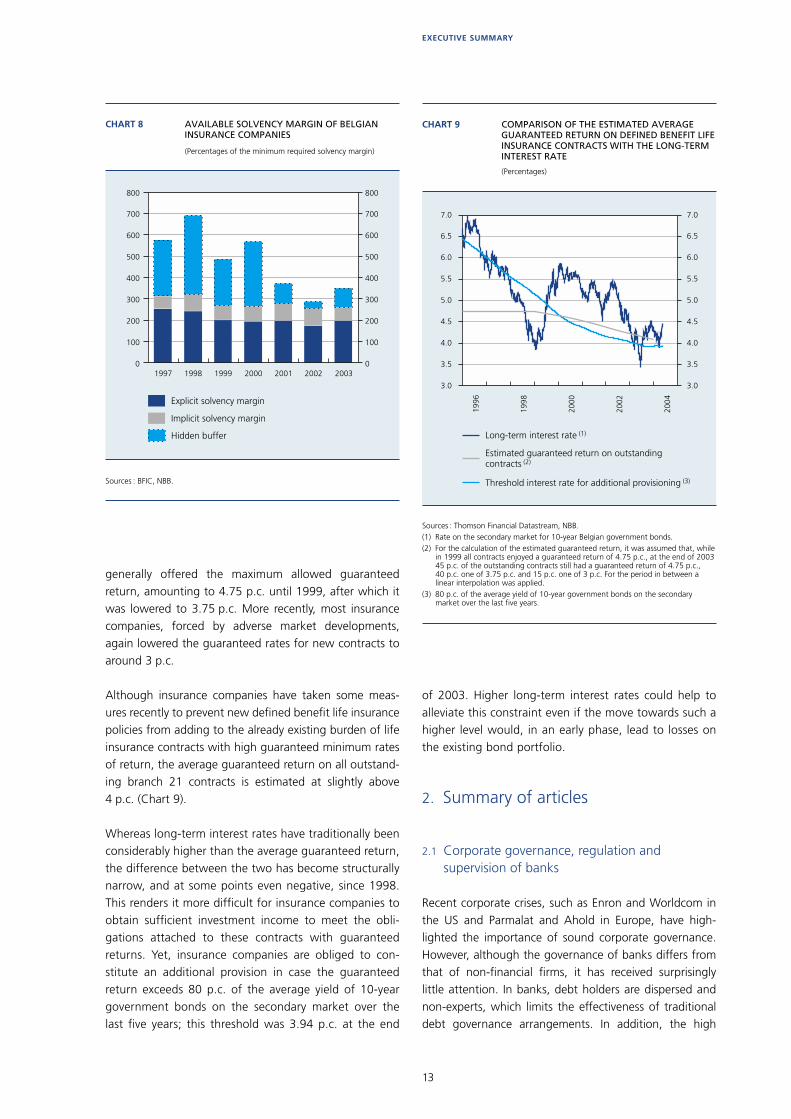
While data are not yet available for the insurance sector as a whole, the unconsolidated annual accounts of the seven largest insurance companies show that the net result of these insurance companies improved slightly in 2003 (Chart 7). This refl ected a stabilisation in the underwriting result and a small increase in the fi nancial result.
While accounting rules help explain why the increase in the fi nancial result was much lower than the signifi cant jump in the estimated return on insurance companies’ investment portfolios, the positive turnaround in this com-ponent of insurance companies’ results may have relieved some of the pressures on insurers to achieve a further improvement in underwriting results in 2003. Indeed, notwithstanding the still modest overall net result, the composition of insurance companies’ results has returned to a more sustainable situation, compared to the large imbalances that were registered at the end of the 1990s when very high fi nancial results were used to compensate large underwriting losses.
Thanks to the improvement in profi tability, the available solvency margin increased slightly in 2003, to 260 p.c of the minimum required margin (Chart 8). The share of the sector’s assets held by insurance companies with a solvency level lower than 100 p.c. dropped from 2.6 p.c.
in 2002 to below 1 p.c. The composition of the aggre-gate solvency margin also improved, as the explicit margin – mainly including insurance companies’ own funds – rose from 173 p.c. of the minimum required margin in 2002 to 196 p.c. in 2003. The hidden buffer, which consists of the unrealised capital gains that do not form part of the implicit margin, also rose again, after having absorbed the bulk of fl uctuations in the market value of insurance com-panies’ investments by declining from 304 p.c. in 2000 to 33 p.c. in 2002.
While the hidden buffer thus clearly benefi ted from the global fi nancial market recovery in 2003, the currently still low level of long-term interest rates poses a major challenge to insurance companies, especially given the large proportion of contracts with minimum guaranteed rates of return in life insurance. On these contracts, insurance companies, driven by strong competition,
1996
1997
1998
1999
2000
2001
2002
–40
–20
0
20
40
60
80
–10
–5
0
5
10
15
20
2001
2002
2003
–40
–20
0
20
40
60
80
–10
–5
0
5
10
15
20
CHART 7 MAJOR COMPONENTS OF BELGIAN INSURANCE COMPANIES’ RESULTS
(Percentages of net premiums (1), unless otherwise stated)
Sources : BFIC, Thomson Financial Datastream, NBB.
(1) After premiums paid for reinsurance.
(2) Corresponds to the balance of the technical accounts in life and non-life insurance, excluding the financial results booked in these accounts. Corrected for provisioning as a result of changes in the value of defined contribution insurance contracts.
(3) Consists of the total net financial result, except the net financial income related to changes in the value of defined contribution insurance contracts.
(4) Includes, besides the underwriting and financial results, the balance of the other residuary transactions.
(5) Return on a portfolio with a structure comparable to that of Belgian insurance companies.
TOTAL MARKET
Underwriting result (2)
Financial result (3)
Net result (4)
Return on a typical portfolio (5)
7 LARGESTCOMPANIES
(left-hand scale)
(right-hand scale)(percentages)
13
EXECUTIVE SUMMARY
generally offered the maximum allowed guaranteed return, amounting to 4.75 p.c. until 1999, after which it was lowered to 3.75 p.c. More recently, most insurance companies, forced by adverse market developments, again lowered the guaranteed rates for new contracts to around 3 p.c.
Although insurance companies have taken some meas-ures recently to prevent new defi ned benefi t life insurance policies from adding to the already existing burden of life insurance contracts with high guaranteed minimum rates of return, the average guaranteed return on all outstand-ing branch 21 contracts is estimated at slightly above 4 p.c. (Chart 9).
Whereas long-term interest rates have traditionally been considerably higher than the average guaranteed return, the difference between the two has become structurally narrow, and at some points even negative, since 1998. This renders it more diffi cult for insurance companies to obtain suffi cient investment income to meet the obli-gations attached to these contracts with guaranteed returns. Yet, insurance companies are obliged to con-stitute an additional provision in case the guaranteed return exceeds 80 p.c. of the average yield of 10-year government bonds on the secondary market over the last fi ve years; this threshold was 3.94 p.c. at the end
of 2003. Higher long-term interest rates could help to alleviate this constraint even if the move towards such a higher level would, in an early phase, lead to losses on the existing bond portfolio.
2. Summary of articles
2.1 Corporate governance, regulation and supervision of banks
Recent corporate crises, such as Enron and Worldcom in the US and Parmalat and Ahold in Europe, have high-lighted the importance of sound corporate governance. However, although the governance of banks differs from that of non-fi nancial fi rms, it has received surprisingly little attention. In banks, debt holders are dispersed and non-experts, which limits the effectiveness of traditional debt governance arrangements. In addition, the high
3.0
3.5
4.0
4.5
5.0
5.5
6.0
6.5
7.0
3.0
3.5
4.0
4.5
5.0
5.5
6.0
6.5
7.0
1996
1998
2000
2002
2004
CHART 9 COMPARISON OF THE ESTIMATED AVERAGE GUARANTEED RETURN ON DEFINED BENEFIT LIFE INSURANCE CONTRACTS WITH THE LONG-TERM INTEREST RATE
(Percentages)
Sources : Thomson Financial Datastream, NBB.(1) Rate on the secondary market for 10-year Belgian government bonds.(2) For the calculation of the estimated guaranteed return, it was assumed that, while
in 1999 all contracts enjoyed a guaranteed return of 4.75 p.c., at the end of 2003 45 p.c. of the outstanding contracts still had a guaranteed return of 4.75 p.c., 40 p.c. one of 3.75 p.c. and 15 p.c. one of 3 p.c. For the period in between a linear interpolation was applied.
(3) 80 p.c. of the average yield of 10-year government bonds on the secondary market over the last five years.
Estimated guaranteed return on outstandingcontracts (2)
Long-term interest rate (1)
Threshold interest rate for additional provisioning (3)
1997 1998 1999 2000 2001 2002 20030
100
200
300
400
500
600
700
800
0
100
200
300
400
500
600
700
800
CHART 8 AVAILABLE SOLVENCY MARGIN OF BELGIAN INSURANCE COMPANIES
(Percentages of the minimum required solvency margin)
Sources : BFIC, NBB.
Implicit solvency margin
Explicit solvency margin
Hidden buffer

14
proportion of debts in total liabilities, and the resulting high leverage, facilitate risk shifting by shareholders. Hence the need arises for a representative of depositors to ‘mimic’ the role taken by debt holders in non-fi nancial fi rms, and this role is typically performed by a regulatory and supervisory authority (RSA).
The article takes a banking stability perspective. Features of corporate governance, such as shareholder structures, management incentives and the structure of the board of directors are evaluated with respect to their impact on a bank’s risks. To the extent that managers may be more risk averse than shareholders, it may be in the interest of the RSA to put more power in the hands of management rather than of shareholders. However, another concern may be the stability of bank ownership when share own-ership is dispersed. In this case, it may be diffi cult to pres-sure shareholders to provide additional support to ailing banks in cases of under-capitalisation. These competing concerns raise some trade-offs between various share-holder structures and the relative power of managers vis-à-vis shareholders.
In Belgium, the agreements between the BFIC and banks’ main shareholders on the autonomy of bank manage-ment (Protocole d’autonomie de la fonction bancaire/Overeenkomst over de autonomie in de bankfunctie) aims to combine the presence of strong reference share-holders with independent bank management. Negotiated in 1959, the agreement was initially intended to prevent shareholders’ intervention in the credit policy of the bank, especially in industrial holding structures. Although past and current developments in the banking sector structure may hinder the application of the agreement, they also highlight the importance of the banking stability concerns underlying the agreement.
2.2 Belgian SMEs and bank lending relationships
In Belgium and in many other countries, banks are impor-tant providers of external fi nance to small and medium-size fi rms. When credit is widely available for these fi rms, they can be an engine of economic growth. This paper addresses questions related to the determinants of fi rms’ bank lending relationships and investigates these deter-minants empirically for small and medium-size Belgian fi rms.
Using data on fi rm-bank loan contracts from the Belgian credit register, the paper investigates a number of hypoth-eses that have been proposed and tested for other coun-tries. In a manner consistent with results obtained in other studies, it emerges that smaller and younger fi rms tend to
have fewer bank lending relationships. This observation provides support for the hypothesis that fi rms which are more “informationally-opaque” maintain fewer lending relationships. In contrast with results for other countries, Belgian fi rms with low profi tability and fi nancially dis-tressed fi rms are more likely to have a single bank lending relationship than multiple bank relationships. This result is in opposition to the hypothesis that low profi tability fi rms choose to have multiple bank lending relationships, in order to reduce the probability of having their fi nance cut off. The result suggests that, whereas low profi tability borrowers might like to have multiple bank lenders, banks may be unwilling to extend loans to such fi rms.
The analysis in this paper provides an illustration of the potential benefi ts that public credit registers can offer to banks and authorities alike. In addition to providing infor-mation to banks about the outstanding credit volumes of potential borrowers, such data also allow regulatory authorities to better understand the lending behaviour of banks and the role that bank fi nance plays for fi rms, including the degree of dependence of fi rms on a single bank lender.
2.3 The determinants of credit spreads
The understanding of the determinants of credit spreads is of major importance to fi nancial institutions, central banks, fi rms, and regulators for several reasons. First, the US and Euro corporate bond markets have grown signifi cantly in the past decade. The Euro market, which lags its US coun-terpart, has become broader and more liquid. Second, the market for credit derivatives and structured fi nance products has also experienced considerable growth over the last decade and is beginning to play an important role in fi nancial markets. Third, central bankers use credit spreads to assess (extract) default probabilities of fi rms and to judge the general functioning of markets. Finally, credit spreads are often used as a business cycle indicator.
The contributions of this paper are threefold. First, it presents a detailed empirical analysis of the determinants of credit spread changes for different types of Euro corpo-rate bonds between 1998 and 2002. Results indicate that factors suggested by structural credit risk models, such as the level and the slope of the default-free term structure, the stock price, and stock price volatility, signifi cantly affect credit spread changes of Euro corporate bonds. An important fi nding is that the sensitivities of credit spread changes depend to a great extent on the rating and the maturity of the bonds. Furthermore, liquidity risk is a major determinant of credit spread changes, especially those on lower rated bonds.
15
EXECUTIVE SUMMARY
Second, the sensitivities of credit spreads to fi nancial and macroeconomic variables are compared for US and European corporate bonds. Although these two markets differ signifi cantly in terms of size and liquidity, empirical results for the two regions are very similar. It emerges that credit spread changes depend more on bond characteris-tics, such as rating and maturity, than on the country or currency of issuance. Finally, a large component of the dynamics of US and European credit spreads remains unexplained by empirical studies. Several possible reasons for this lack of explanatory power have been put forward, such as liquidity risk, systematic shocks, and diversifi ca-tion risk.
The third contribution of this article is an analysis of diver-sifi cation risk by comparing simulated loss distributions of portfolios of bonds and/or stocks. The results reveal that the loss distribution of bond portfolios is more skewed to the left compared to equity portfolios. However, the skew-ness of the loss distribution of mixed portfolios (stocks and bonds) is very similar to that of equity portfolios. This result calls into question the importance of diversifi cation risk for large investors such as fi nancial institutions that have portfolios of bonds and stocks.
2.4 Interest rate risk in the Belgian banking sector
Banks typically fi nance their assets by means of liabilities with different maturity and repricing characteristics. This transformation activity of banks meets an important need in any economy, but potentially leads to the exposure of a bank’s net interest income and market value of equity to unexpected changes in interest rates. Ultimately, banks adopt this strategy because, by lending at a long rate and borrowing at a short rate, they expect to earn an extra return or risk premium which, though unstable through time, should be positive on average.
Estimates are presented for the interest rate risk exposure of the aggregate Belgian banking sector, from both a going concern and a liquidation viewpoint. On average, the ratio of net interest income to total income seems to have declined slowly over the last ten years, refl ecting a disintermediation trend. In line with evidence for other countries, it is found that statistical evidence concerning the effect of interest rate changes on Belgian net interest income is not clear-cut, possibly refl ecting the fact that net interest income covers far more than just the income generated by the maturity transformation role of banks. The impact of current accounting practices that allow banks to smooth their income by shifting securities from the trading book to the banking book at their discre-tion might also be important. In this respect, one of the
objectives of the proposed accounting regulation IAS 39 is to increase the transparency of banks’ risk taking.
Besides mainly money market positions taken in the course of their trading activities, Belgian banks incur a signifi cant exposure from their core function of attracting deposits to fi nance long term assets. To the extent that deposit balances are stable and have a behavioural dura-tion that exceeds their contractual duration, interest rate risks associated with those exposures may still be limited. However, in today’s low interest rate environment, depos-its may at least partially comprise funds transferred from a less buoyant stock market. As interest rates increase, these funds may move to more productive investments either in or outside of the bank, leaving the bank vulner-able to higher fi nancing costs or to losses from selling off long assets. In this respect, assumptions about the stable portion of deposits deserve careful review, so as not to understate the risk sensitivity of sight or savings deposits in specifi c interest rate scenarios.
In line with Basel I practices, Basel II will impose formal capital requirements to cover the interest rate risk in the trading book of the bank. However, no internationally-agreed formal capital requirements will be imposed with respect to the interest rate risk in the banking book, partly because the embedded options in deposit accounts are diffi cult to quantify. The national supervisor has a number of off-site tools in place that can serve as rough devices for detecting excessive interest rate risk exposure in the banking book of banks. More detailed on-site inspec-tions can be triggered to refi ne the interest rate expo-sure assessment and to impose, if needed, extra capital requirements.
2.5 Impact of IAS 39 on asset and liability management and banks’ capital ratios
The introduction of IAS 39 substantially modifi es the accounting framework within which credit institutions have to work, creating more volatility in equity and net income. One of the essential concerns expressed by the banking sector is that banks want to be able to limit the volatility of the accounting net income by continuing to manage the interest rate risk on the basis of the economic risk rather than the accounting impact of changes in interest rates.
This article endeavours to show by means of an exam-ple that, under the new IAS accounting rules, a credit institution can manage the volatility of its net income without modifying its asset and liability management or position, notably by using the “fair value option”. This option offers the banking sector a practical alternative to

16
hedge accounting, which cannot be applied because of the inability to meet the strict criteria imposed by IAS 39. Although there is justifi cation for limiting the use of this fair value option, as the International Accounting Standards Board (IASB) proposes, particularly to prevent abuse and to preserve a degree of comparability in the annual accounts, it is essential to ensure that the limitations imposed are not so restrictive as to make it impossible to use this method.
If credit institutions do not have the necessary tools to manage the accounting volatility of their net income, they may in fact be tempted to modify their asset and liability position, or to manage this position without the use of derivatives, merely in order to stabilise the accounting net income. This could have implications for
the economy, as the bank will accept more interest rate risk or, on the contrary, will reduce the duration of its assets by a cut in its long-term loans at fi xed rates or its investment in long-term securities.
The article also points out that, in the IAS environment, accounting equity is more volatile. Credit institutions will probably want to limit that volatility. The behaviour of the credit institutions will depend both on the reaction of their counterparties and of the market in general in the face of this volatility, and on the way in which IAS 39 is treated in the context of the capital regulations. Care must therefore be taken to defi ne rules on capital require-ments which do not encourage credit institutions to take ALM positions solely in order to manage the accounting value of their equity and their capital ratio.
17
FINANCIAL STABILITY OVERVIEW
Introduction
As in the fi rst two issues of the Financial Stability Review (FSR), the Overview article is devoted to an assessment of the fi nancial stability conditions in the Belgian fi nancial system. The structure of the Overview article has been slightly modifi ed however as compared to earlier issues. Where the scope in Chapter 4 was limited last year to the bancassurance groups, the analysis has now been broad-ened to the insurance sector in general. A new Chapter 5 discusses recent developments in fi nancial infrastructures, such as payment, clearing and settlement systems. The areas covered in the fi rst three chapters have remained unchanged, being respectively devoted to recent devel-opments in international fi nancial markets, the fi nancial position of the domestic private sector and the Belgian banking sector.
1. International fi nancial markets
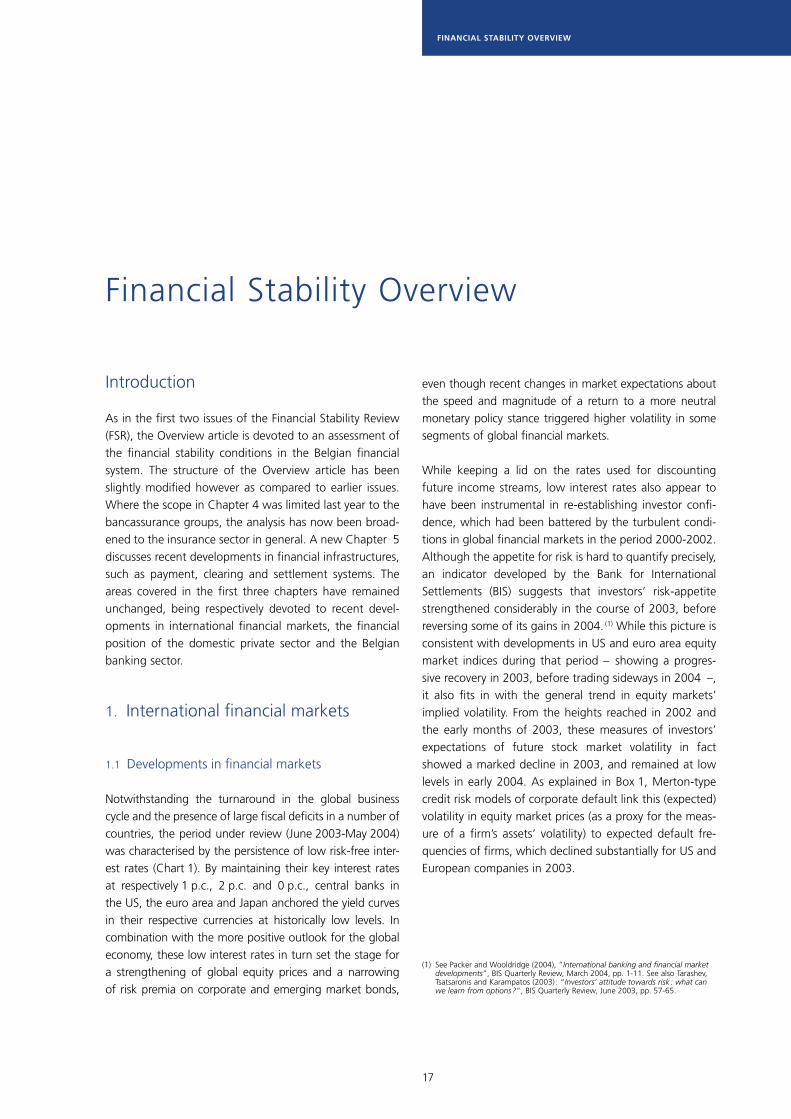
1.1 Developments in fi nancial markets
Notwithstanding the turnaround in the global business cycle and the presence of large fi scal defi cits in a number of countries, the period under review (June 2003-May 2004) was characterised by the persistence of low risk-free inter-est rates (Chart 1). By maintaining their key interest rates at respectively 1 p.c., 2 p.c. and 0 p.c., central banks in the US, the euro area and Japan anchored the yield curves in their respective currencies at historically low levels. In combination with the more positive outlook for the global economy, these low interest rates in turn set the stage for a strengthening of global equity prices and a narrowing of risk premia on corporate and emerging market bonds,
Financial Stability Overview
even though recent changes in market expectations about the speed and magnitude of a return to a more neutral monetary policy stance triggered higher volatility in some segments of global fi nancial markets.
While keeping a lid on the rates used for discounting future income streams, low interest rates also appear to have been instrumental in re-establishing investor confi -dence, which had been battered by the turbulent condi-tions in global fi nancial markets in the period 2000-2002. Although the appetite for risk is hard to quantify precisely, an indicator developed by the Bank for International Settlements (BIS) suggests that investors’ risk-appetite strengthened considerably in the course of 2003, before reversing some of its gains in 2004. (1) While this picture is consistent with developments in US and euro area equity market indices during that period – showing a progres-sive recovery in 2003, before trading sideways in 2004 –, it also fi ts in with the general trend in equity markets’ implied volatility. From the heights reached in 2002 and the early months of 2003, these measures of investors’ expectations of future stock market volatility in fact showed a marked decline in 2003, and remained at low levels in early 2004. As explained in Box 1, Merton-type credit risk models of corporate default link this (expected) volatility in equity market prices (as a proxy for the meas-ure of a fi rm’s assets’ volatility) to expected default fre-quencies of fi rms, which declined substantially for US and European companies in 2003.
(1) See Packer and Wooldridge (2004), ”International banking and fi nancial market developments”, BIS Quarterly Review, March 2004, pp. 1-11. See also Tarashev, Tsatsaronis and Karampatos (2003) : “Investors’ attitude towards risk : what can we learn from options ?”, BIS Quarterly Review, June 2003, pp. 57-65.
18
0
1
2
3
4
5
6
7
2000 2001 2002 2003 20040
1
2
3
4
5
6
7
3.0
3.5
4.0
4.5
5.0
5.5
6.0
6.5
7.0
0.0
0.5
1.0
1.5
2.0
2.5
3.0
3.5
4.0
2000 2001 2002 2003 2004
30
40
50
60
70
80
90
100
110
120
2000 2001 2002 2003 200430
40
50
60
70
80
90
100
110
120
0
10
20
30
40
50
60
70
2000 2001 2002 2003 20040
10
20
30
40
50
60
70
0.0
0.5
1.0
1.5
2.0
2.5
3.0
3.5
4.0
2000 2001 2002 2003 20040.0
0.5
1.0
1.5
2.0
2.5
3.0
3.5
4.0
3
4
5
6
7
8
9
10
11
2000 2001 2002 2003 20043
4
5
6
7
8
9
10
11
CHART 1 DEVELOPMENTS ON SOME KEY FINANCIAL MARKETS
Sources : Bloomberg, Chicago Board Options Exchange, Deutsche Börse, JP Morgan, Merrill Lynch, Thomson Financial Datastream.(1) Based on the volatility implied in S&P 500 and Dax options.(2) EMBI + emerging market bond index.
US
Euro area
Japan
KEY MONETARY POLICY RATES (Percentages)
GOVERNMENT BOND YIELDS(10-year maturity, percentages)
US
Euro area
Japan (right-hand scale)
(left-hand scale)
S&P 500
Euro Stoxx 50
Nikkei 225
STOCK MARKET INDICES(January 2000=100)
IMPLIED VOLATILITY (1)
(Percentages)
US high-yield bonds
Emerging market bonds (2)
CORPORATE BOND SPREADS(Vis-à-vis government bonds, percentages)
HIGH-YIELD BOND SPREADS(Vis-à-vis US Treasuries, percentages)
BBBA
US
Euro area
S&P 500
Dax
Average 1994-2003
19
FINANCIAL STABILITY OVERVIEW
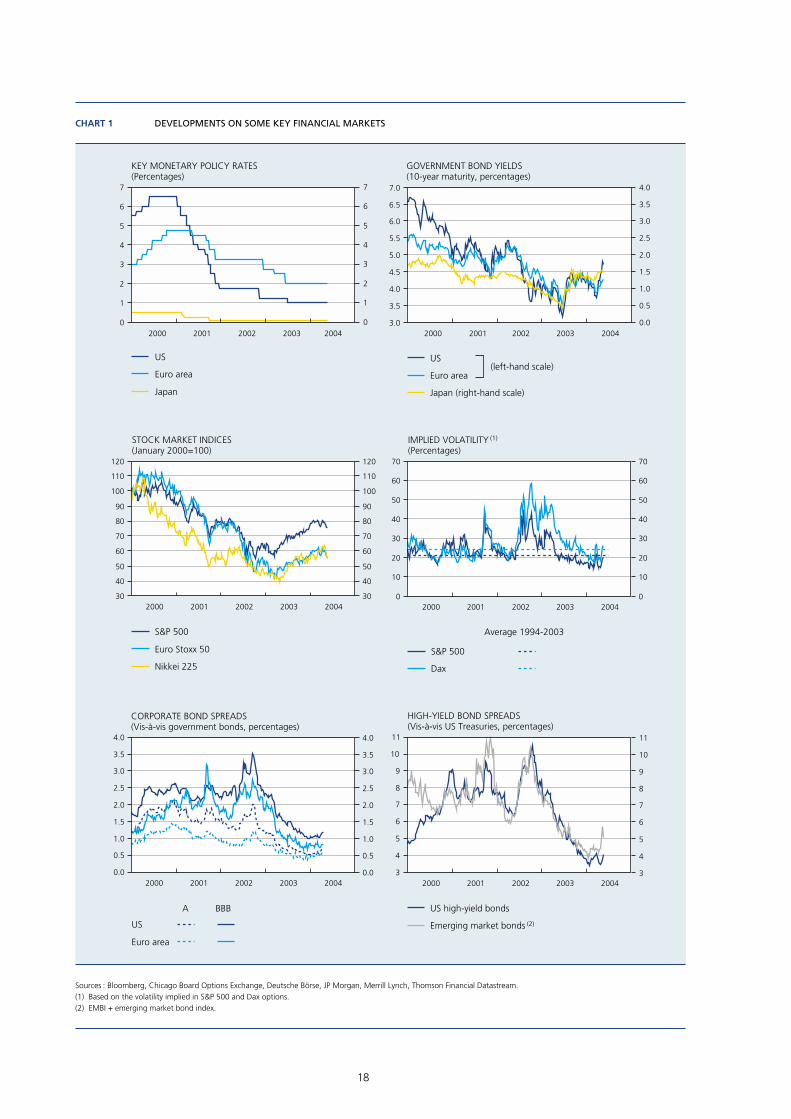
By providing ample liquidity, monetary policies stimulated risk-appetite, thereby supporting the process of corpo-rate balance sheet restructuring. Indeed, in the US, and to a lesser extent in Europe, non-fi nancial corporations seem to have used the rebound in equity prices and the presence of historically low borrowing costs mainly as an opportunity to redress some of the remaining fi nancial imbalances they had accumulated in the second half of the 1990s. Apart from focusing on restoring higher levels of internal funds, this process of balance sheet repair also involved continuously low investment in real and fi nan-cial assets and a refi nancing of outstanding debt, so as to lower borrowing costs and/or lengthen the average maturity of fi nancial liabilities.
The decline of risk premia on the corporate bond markets to levels last seen in the months preceding the Russian and LTCM crises of 1998 thus went hand in hand with improvements in underlying corporate credit quality. As shown in Chart 2, these improved fundamentals also led to a further decline in the global speculative corporate bond default rate from the peaks reached in 2001-2002, dropping from 6.1 p.c. in June 2003 to 4 p.c. in April 2004. In 2003, there was more-over a signifi cant turnaround in the net downgrade ratio of corporate bonds in the US and the EU, which fell from about 15 p.c. in June 2003 to below 6 p.c. in April 2004.
0
2
4
6
8
10
12
–5
0
5
10
15
20
1999
2001
2003
2005
CHART 2 INDICATORS OF CORPORATE CREDIT QUALITY
(Percentages)
Sources : Moody’s, Thomson Financial Datastream.(1) The global speculative bond default rate is an issuer-weighted, 12 month trailing
figure, measuring the number of corporate bond defaults as a percentage of the number of rated issuers. For this series, Moody’s makes a projection one year ahead, based on a proprietary model.
(2) The net downgrade ratio is defined as the difference between the number of downgrades and number of upgrades of corporate bond ratings, expressed as a percentage of the total number of rated issuers.
Global speculative bond default rate (left-hand scale) (1)
Net downgrade ratio US
Net downgrade ratio EU(right-hand scale) (2)
Box 1 – Intuition behind the Merton (1974) model
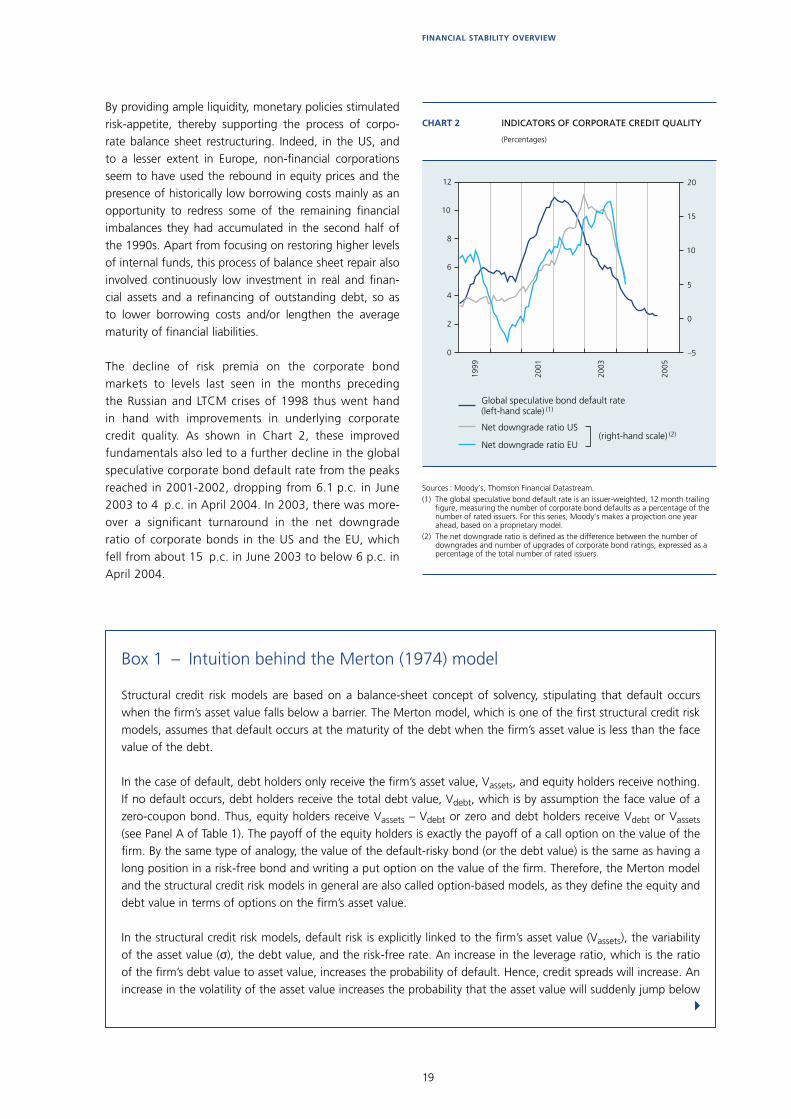
Structural credit risk models are based on a balance-sheet concept of solvency, stipulating that default occurs when the fi rm’s asset value falls below a barrier. The Merton model, which is one of the fi rst structural credit risk models, assumes that default occurs at the maturity of the debt when the fi rm’s asset value is less than the face value of the debt.
In the case of default, debt holders only receive the fi rm’s asset value, Vassets, and equity holders receive nothing. If no default occurs, debt holders receive the total debt value, Vdebt, which is by assumption the face value of a zero-coupon bond. Thus, equity holders receive Vassets – Vdebt or zero and debt holders receive Vdebt or Vassets (see Panel A of Table 1). The payoff of the equity holders is exactly the payoff of a call option on the value of the fi rm. By the same type of analogy, the value of the default-risky bond (or the debt value) is the same as having a long position in a risk-free bond and writing a put option on the value of the fi rm. Therefore, the Merton model and the structural credit risk models in general are also called option-based models, as they defi ne the equity and debt value in terms of options on the fi rm’s asset value.
In the structural credit risk models, default risk is explicitly linked to the fi rm’s asset value (Vassets), the variability of the asset value (σ), the debt value, and the risk-free rate. An increase in the leverage ratio, which is the ratio of the fi rm’s debt value to asset value, increases the probability of default. Hence, credit spreads will increase. An increase in the volatility of the asset value increases the probability that the asset value will suddenly jump below
!

20
As the creditworthiness of several sovereign emerging market borrowers also improved – with upgrades over the past year for countries such as Brazil, Turkey, Russia and Indonesia –, improving credit fundamentals thus seem to have justifi ed at least part of the substantial narrowing of spreads on corporate and emerging market bonds since the fall of 2002. However, the magnitude of the spread compression on high-yield bonds, and the recent correc-tion in spreads on emerging market bonds suggest that, next to changes in underlying credit risk determinants, other factors were at play as well. Changes in credit fundamentals seem indeed to only partially explain the dynamics of spreads in corporate or emerging market bonds. (2)
In this regard, price movements may also have refl ected to a certain extent an increase in speculative trading positions, such as carry trades, through which investors assume dura-tion and/or credit risk while fi nancing the investment with short-term loans in order to boost the total return of the transaction. As these carry trades were fostered by expec-tations that liquidity would remain ample for some period in the future, it is noteworthy that changing expectations about the future monetary policy stance in the US have recently put a damper on the buoyancy of fi nancial mar-kets, with spreads on emerging market bonds for example rebounding sharply.
the barrier (debt value), or that default occurs. Therefore, higher asset value volatility increases credit spreads. Within the setting of the Merton model, an increase in the risk-free rate reduces credit spreads. The expected growth of the fi rm’s asset value equals the risk-free interest rate. An increase in the interest rate implies an increase in the expected growth rate of the fi rm value. This will in turn lower the probability of default and the credit spread. Note that, in the long run, the relation between the risk-free rate and the credit spread might be reversed (see Article “The determinants of credit spreads” in this FSR). Panel B of Table 1 gives an overview of the variables (derived from the Merton model) that affect credit spreads.
In practice, the asset value and its volatility are available only on an infrequent basis. Therefore, empirical studies often use the equity value and its volatility. For the volatility measures, the two basic approaches are either to compute the implied volatility for current option prices in the market or to compute the realised volatility over the recent past.
TABLE 1 MAIN FEATURES OF THE MERTON MODEL
Panel A : Characteristics of the Merton model
No default Default
Definition . . . . . . . . . . . . Vassets ≥ Vdebt Vassets < Vdebt
Debt value . . . . . . . . . . . . Vdebt Vassets
Equity value . . . . . . . . . . . Vassets − Vdebt 0
Panel B : Determinants of credit spreads based on the Merton model
Symbol Relation with credit spreads
Asset value . . . . . . . . . . . Vassets –
Volatility of asset value . . σ +
Debt value . . . . . . . . . . . . Vdebt +
Risk-free rate . . . . . . . . . . r –
(2) See in this connection for example the article ”The determinants of credit spreads” in this FSR or Appendix I of Chapter II of the IMF Global Financial Stability Report (April 2004) : ”Determinants of the Rally in Emerging Market Debt – Liquidity and Fundamentals”.
21
FINANCIAL STABILITY OVERVIEW
However, as the transition to higher interest rates should happen in the context of a further strengthening and broadening of the global economic recovery, gradual upward adjustments in interest rates do not necessarily have to be disruptive for global fi nancial markets, on con-dition that the process is correctly anticipated by fi nancial markets. While global fi nancial markets do indeed appear to be priced for future increases in short-term interest rates, it is also comforting to note in this connection that they proved very resilient to instances of high volatility in global bond markets during the period under review, such as in the summer of 2003, when a perceived fading of the risk of defl ation in the US triggered a sharp jump in long-term government bond yields.
The experience of 1994 shows nevertheless that, when markets are ”priced for perfection” and a larger than expected change in short-term interest rates occurs – e.g. in the case of a negative supply-side shock or a disorderly correction of global current account imbalances –, the repercussions for global fi nancial markets can be consid-erable. In this perspective, one of the main potential stress scenarios for the global fi nancial system would consist in a signifi cant upward adjustment in long-term interest rates – potentially amplifi ed by the hedging of mortgage bond portfolios for changes in prepayment risk or an unwinding
of leveraged trading positions –, as it would probably be associated with downward pressures on prices of other fi nancial assets, such as equities and high-yield bonds.
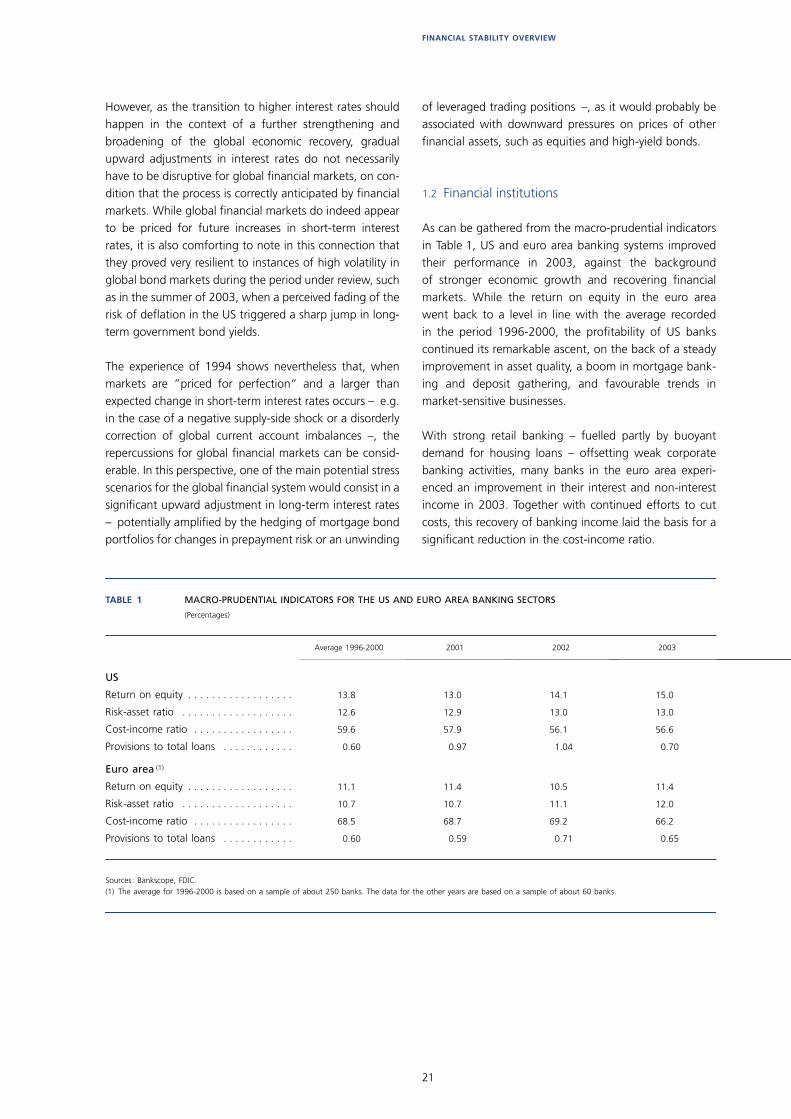
1.2 Financial institutions
As can be gathered from the macro-prudential indicators in Table 1, US and euro area banking systems improved their performance in 2003, against the background of stronger economic growth and recovering fi nancial markets. While the return on equity in the euro area went back to a level in line with the average recorded in the period 1996-2000, the profi tability of US banks continued its remarkable ascent, on the back of a steady improvement in asset quality, a boom in mortgage bank-ing and deposit gathering, and favourable trends in market-sensitive businesses.
With strong retail banking – fuelled partly by buoyant demand for housing loans – offsetting weak corporate banking activities, many banks in the euro area experi-enced an improvement in their interest and non-interest income in 2003. Together with continued efforts to cut costs, this recovery of banking income laid the basis for a signifi cant reduction in the cost-income ratio.
TABLE 1 MACRO-PRUDENTIAL INDICATORS FOR THE US AND EURO AREA BANKING SECTORS
(Percentages)
Sources : Bankscope, FDIC.(1) The average for 1996-2000 is based on a sample of about 250 banks. The data for the other years are based on a sample of about 60 banks.
Average 1996-2000 2001 2002 2003
US
Return on equity . . . . . . . . . . . . . . . . . . 13.8 13.0 14.1 15.0
Risk-asset ratio . . . . . . . . . . . . . . . . . . . 12.6 12.9 13.0 13.0
Cost-income ratio . . . . . . . . . . . . . . . . . 59.6 57.9 56.1 56.6
Provisions to total loans . . . . . . . . . . . . 0.60 0.97 1.04 0.70
Euro area (1)
Return on equity . . . . . . . . . . . . . . . . . . 11.1 11.4 10.5 11.4
Risk-asset ratio . . . . . . . . . . . . . . . . . . . 10.7 10.7 11.1 12.0
Cost-income ratio . . . . . . . . . . . . . . . . . 68.5 68.7 69.2 66.2
Provisions to total loans . . . . . . . . . . . . 0.60 0.59 0.71 0.65

22
Although European banks avoided a large share of the credit losses generated by the collapse of the technol-ogy and telecom bubble, as companies in these sectors generally fi nanced themselves through bonds and equity, high credit losses were one of the major reasons for the downturn in euro area banks’ profi tability in 2002. Firming economic activity and the absence of major corporate defaults (with the notable exception of Parmalat) allowed a reduction in these provisions for credit risk in 2003. In this regard, the growing share of mortgage loans in the total loan portfolio may also have contributed towards a reduction in the aggregate level of loan loss provisions, as the provisioning requirements for these loans are tradi-tionally much lower than for corporate loans.
When fi rms will step up their investments in real and fi nancial assets once again, and increase their demand for bank loans – in line with the acceleration of economic growth – it will be important for banks to adequately assess and price the new corporate credit risks they will assume in order to safeguard the asset quality of their corporate loan portfolio. Bad risks are in fact typically incurred in the upswing of the credit cycle, when optimis-tic expectations about the global economy or fi rm-specifi c prospects may lead to under-pricing of credit risk.
As commercial and/or residential real estate bubbles have in the past been the source of major banking sector problems, the very buoyant growth in housing prices and mortgage loans in a number of European countries also merits close monitoring. Mortgage lending-related risks may indeed become a more prominent concern, if housing markets were to cool down or a new slowdown in economic growth were to undermine the debt service capacity of highly indebted households. As concerns the latter, this might also be the case if higher short-term interest rates were to affect the creditworthiness of households with variable rate mortgages, a product which appears to have enjoyed strong demand recently in a number of euro area economies.
Next to credit risk, banks are also sensitive to changes in interest rates, due to the nature of their business. In this regard, while the major share of interest rate risk is taken in the banking book, market reports suggest that banks have also stepped up their risk-taking in their trading books, one reason being that declining volatility in a number of markets has allowed them to increase their volume of risk-taking for the same market risk capital requirement, as calculated according to VAR models. While this build-up of interest rate risk positions may expose the banks concerned to losses if unexpected interest rate shocks occur, euro area and US banks coped with the turbulence in global long-term interest rates in the summer of 2003 without major diffi culties. Moreover, as neither banking system has experienced an erosion of capital adequacy levels in recent years, a suffi cient buffer should be available to deal with unexpected developments.
Although higher interest rates are traditionally seen as more favourable to insurance companies than to banks – given the comparatively higher duration of the formers’ liabilities, relative to that of their assets –, the capacity of the European insurance sector to cope with new shocks in global fi nancial markets may have been reduced by the signifi cant losses this sector sustained on its equity and corporate bond investments in the period 2000-2002, when some of its core businesses were also suffering from underlying profi tability problems. The rebound in global equity prices has eased some of the most acute pressures in the insurance sector, however, and a number of companies have strengthened their capital base and have undertaken efforts to restore the technical underwriting results in life and non-life insur-ance activities. Yet, this adjustment process is somewhat less advanced in the life insurance sector, due to the ina-bility to quickly adjust the fi nancial terms of the policies, as these are generally of a long-term nature. Moreover, in a number of countries, the portfolio of life insurance policies consists of a large number of contracts with high guaranteed statutory or contractual minimum payouts (Germany, UK ; see also Chapter 4 for Belgium). For these companies, a return to a higher level of long-term interest rates would be particularly welcome, although the transition towards such a higher level of interest rates may expose the insurance sector to an erosion of unrealised capital gains (or to losses) on their bond portfolios.
23
FINANCIAL STABILITY OVERVIEW
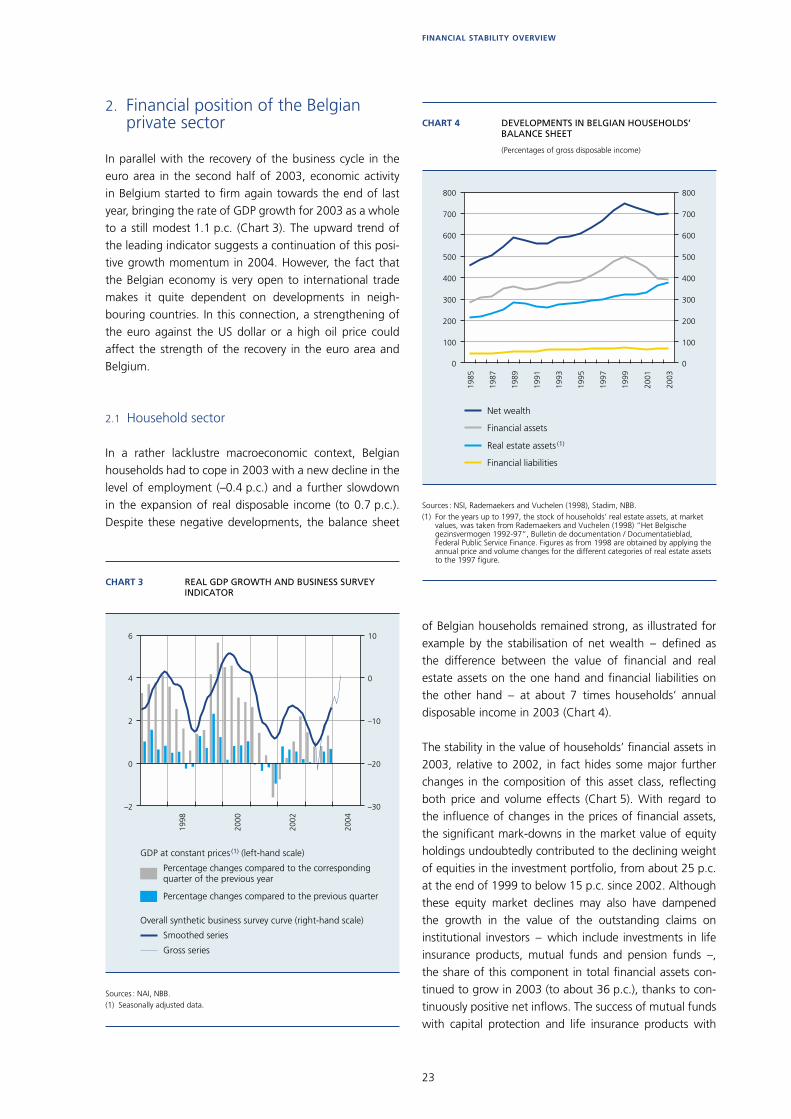
2. Financial position of the Belgian private sector
In parallel with the recovery of the business cycle in the euro area in the second half of 2003, economic activity in Belgium started to fi rm again towards the end of last year, bringing the rate of GDP growth for 2003 as a whole to a still modest 1.1 p.c. (Chart 3). The upward trend of the leading indicator suggests a continuation of this posi-tive growth momentum in 2004. However, the fact that the Belgian economy is very open to international trade makes it quite dependent on developments in neigh-bouring countries. In this connection, a strengthening of the euro against the US dollar or a high oil price could affect the strength of the recovery in the euro area and Belgium.
2.1 Household sector
In a rather lacklustre macroeconomic context, Belgian households had to cope in 2003 with a new decline in the level of employment (–0.4 p.c.) and a further slowdown in the expansion of real disposable income (to 0.7 p.c.). Despite these negative developments, the balance sheet
of Belgian households remained strong, as illustrated for example by the stabilisation of net wealth – defi ned as the difference between the value of fi nancial and real estate assets on the one hand and fi nancial liabilities on the other hand – at about 7 times households’ annual disposable income in 2003 (Chart 4).
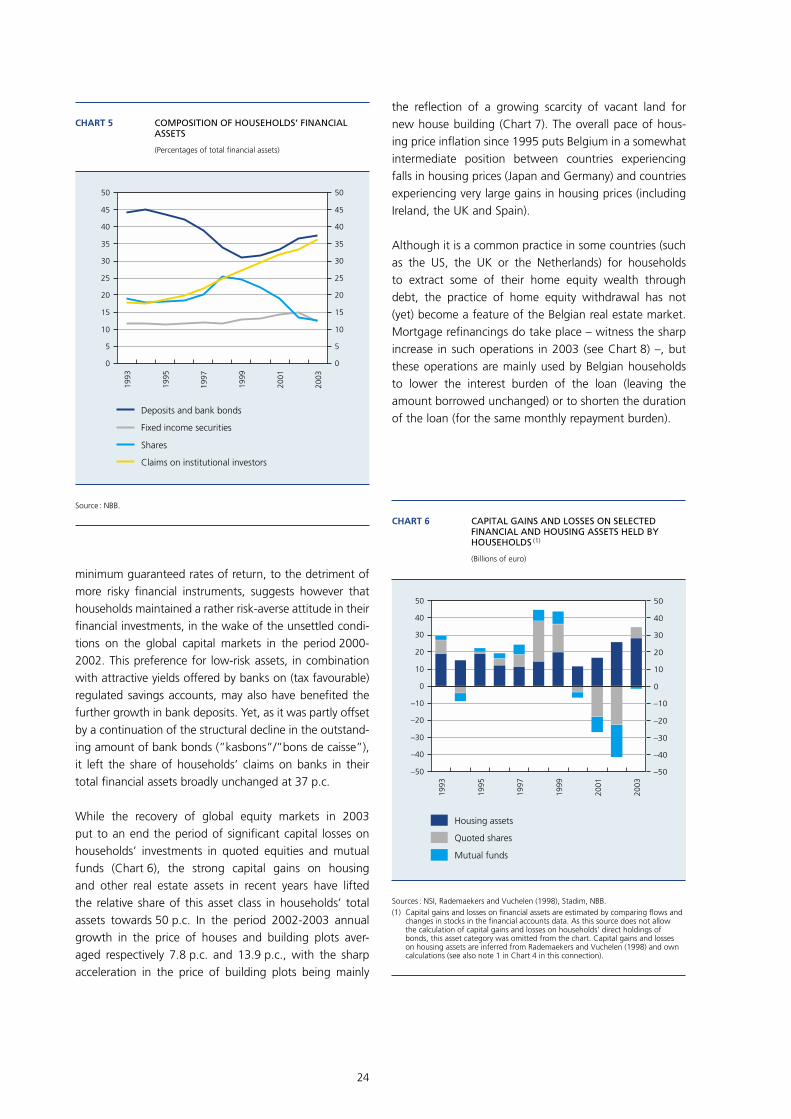
The stability in the value of households’ fi nancial assets in 2003, relative to 2002, in fact hides some major further changes in the composition of this asset class, refl ecting both price and volume effects (Chart 5). With regard to the infl uence of changes in the prices of fi nancial assets, the signifi cant mark-downs in the market value of equity holdings undoubtedly contributed to the declining weight of equities in the investment portfolio, from about 25 p.c. at the end of 1999 to below 15 p.c. since 2002. Although these equity market declines may also have dampened the growth in the value of the outstanding claims on institutional investors – which include investments in life insurance products, mutual funds and pension funds –, the share of this component in total fi nancial assets con-tinued to grow in 2003 (to about 36 p.c.), thanks to con-tinuously positive net infl ows. The success of mutual funds with capital protection and life insurance products with
–2
0
2
4
6
–30
–20
–10
0
10
1998
2000
2002
2004
CHART 3 REAL GDP GROWTH AND BUSINESS SURVEY INDICATOR
Sources : NAI, NBB.(1) Seasonally adjusted data.
GDP at constant prices (1) (left-hand scale)
Smoothed series
Gross series
Percentage changes compared to the previous quarter
Percentage changes compared to the corresponding quarter of the previous year
Overall synthetic business survey curve (right-hand scale)
1985
1987
1989
1991
1993
1995
1997
1999
2001
2003
0
100
200
300
400
500
600
700
800
0
100
200
300
400
500
600
700
800
CHART 4 DEVELOPMENTS IN BELGIAN HOUSEHOLDS’ BALANCE SHEET
(Percentages of gross disposable income)
Sources : NSI, Rademaekers and Vuchelen (1998), Stadim, NBB.(1) For the years up to 1997, the stock of households’ real estate assets, at market
values, was taken from Rademaekers and Vuchelen (1998) “Het Belgische gezinsvermogen 1992-97”, Bulletin de documentation / Documentatieblad, Federal Public Service Finance. Figures as from 1998 are obtained by applying the annual price and volume changes for the different categories of real estate assets to the 1997 figure.
Net wealth
Financial assets
Real estate assets (1)
Financial liabilities
24
minimum guaranteed rates of return, to the detriment of more risky fi nancial instruments, suggests however that households maintained a rather risk-averse attitude in their fi nancial investments, in the wake of the unsettled condi-tions on the global capital markets in the period 2000-2002. This preference for low-risk assets, in combination with attractive yields offered by banks on (tax favourable) regulated savings accounts, may also have benefi ted the further growth in bank deposits. Yet, as it was partly offset by a continuation of the structural decline in the outstand-ing amount of bank bonds (”kasbons”/”bons de caisse”), it left the share of households’ claims on banks in their total fi nancial assets broadly unchanged at 37 p.c.
While the recovery of global equity markets in 2003 put to an end the period of signifi cant capital losses on households’ investments in quoted equities and mutual funds (Chart 6), the strong capital gains on housing and other real estate assets in recent years have lifted the relative share of this asset class in households’ total assets towards 50 p.c. In the period 2002-2003 annual growth in the price of houses and building plots aver-aged respectively 7.8 p.c. and 13.9 p.c., with the sharp acceleration in the price of building plots being mainly
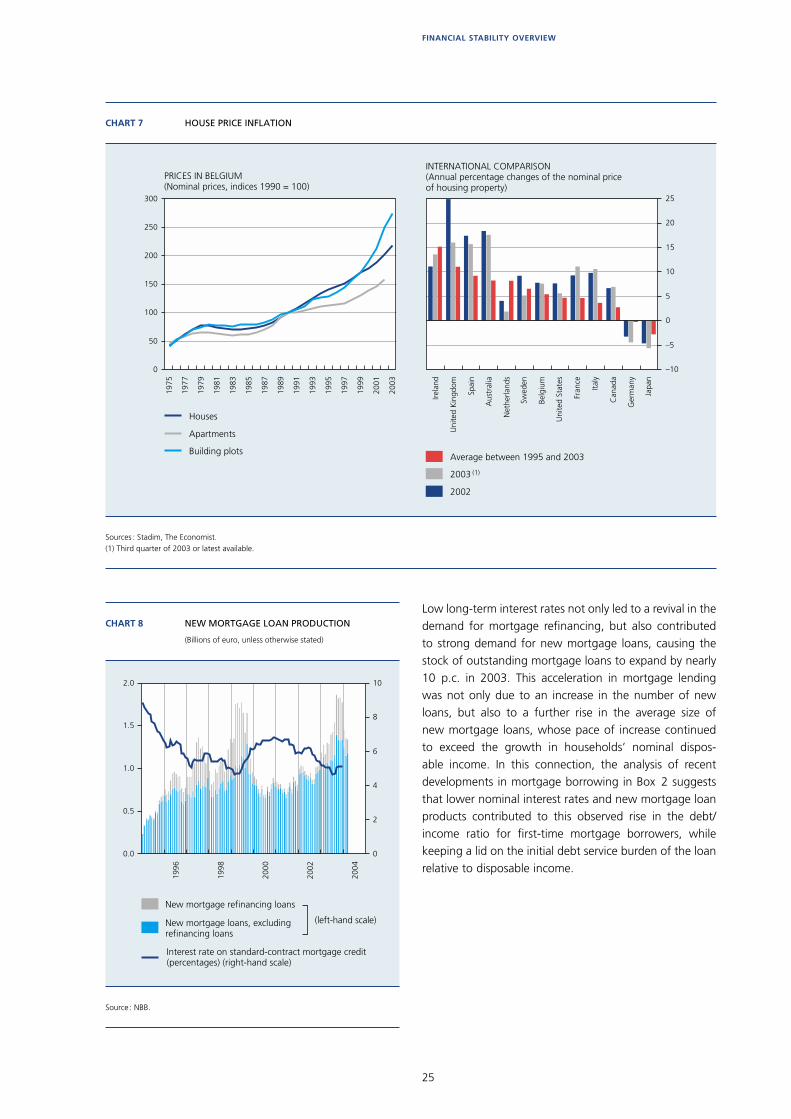
the refl ection of a growing scarcity of vacant land for new house building (Chart 7). The overall pace of hous-ing price infl ation since 1995 puts Belgium in a somewhat intermediate position between countries experiencing falls in housing prices (Japan and Germany) and countries experiencing very large gains in housing prices (including Ireland, the UK and Spain).
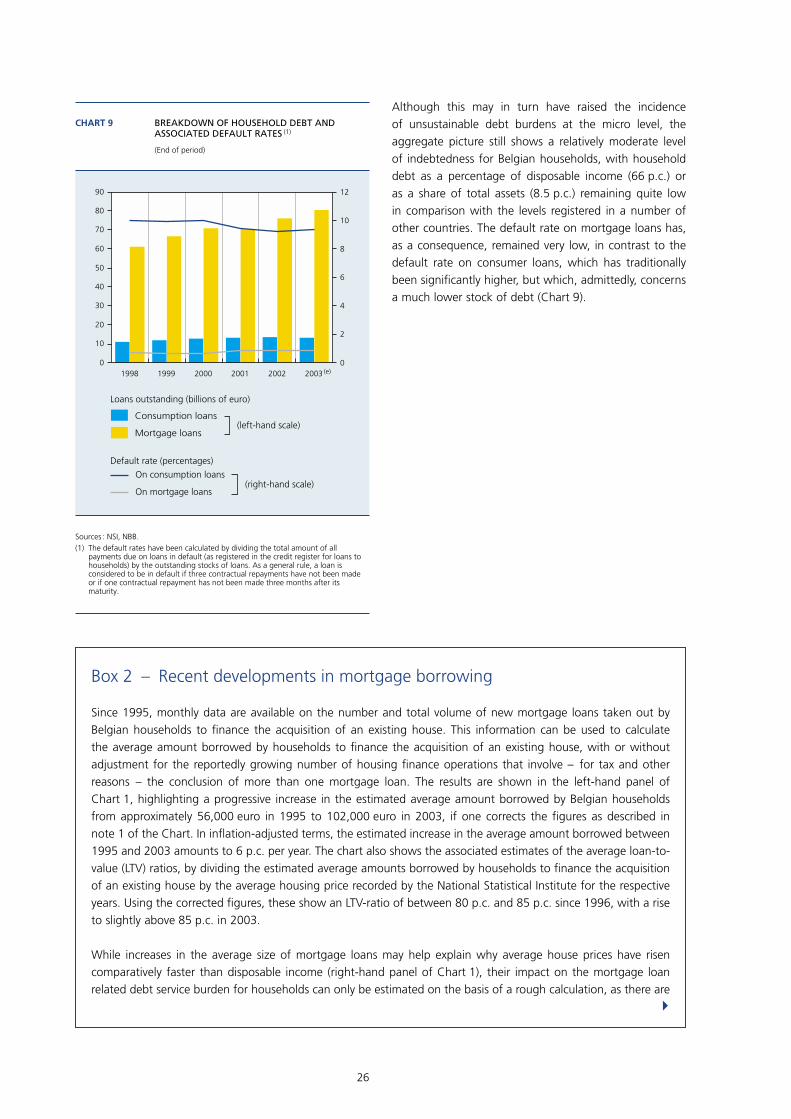
Although it is a common practice in some countries (such as the US, the UK or the Netherlands) for households to extract some of their home equity wealth through debt, the practice of home equity withdrawal has not (yet) become a feature of the Belgian real estate market. Mortgage refi nancings do take place – witness the sharp increase in such operations in 2003 (see Chart 8) –, but these operations are mainly used by Belgian households to lower the interest burden of the loan (leaving the amount borrowed unchanged) or to shorten the duration of the loan (for the same monthly repayment burden).
1993
1995
1997
1999
2001
2003
0
5
10
15
20
25
30
35
40
45
50
0
5
10
15
20
25
30
35
40
45
50
CHART 5 COMPOSITION OF HOUSEHOLDS’ FINANCIAL ASSETS
(Percentages of total financial assets)
Source : NBB.
Deposits and bank bonds
Fixed income securities
Shares
Claims on institutional investors
1993
1995
1997
1999
2001
2003
–50
–40
–30
–20
–10
0
10
20
30
40
50
–50
–40
–30
–20
–10
0
10
20
30
40
50
CHART 6 CAPITAL GAINS AND LOSSES ON SELECTED FINANCIAL AND HOUSING ASSETS HELD BY HOUSEHOLDS (1)
(Billions of euro)
Sources : NSI, Rademaekers and Vuchelen (1998), Stadim, NBB.(1) Capital gains and losses on financial assets are estimated by comparing flows and
changes in stocks in the financial accounts data. As this source does not allow the calculation of capital gains and losses on households’ direct holdings of bonds, this asset category was omitted from the chart. Capital gains and losses on housing assets are inferred from Rademaekers and Vuchelen (1998) and own calculations (see also note 1 in Chart 4 in this connection).
Housing assets
Quoted shares
Mutual funds
25
FINANCIAL STABILITY OVERVIEW
Low long-term interest rates not only led to a revival in the demand for mortgage refi nancing, but also contributed to strong demand for new mortgage loans, causing the stock of outstanding mortgage loans to expand by nearly 10 p.c. in 2003. This acceleration in mortgage lending was not only due to an increase in the number of new loans, but also to a further rise in the average size of new mortgage loans, whose pace of increase continued to exceed the growth in households’ nominal dispos-able income. In this connection, the analysis of recent developments in mortgage borrowing in Box 2 suggests that lower nominal interest rates and new mortgage loan products contributed to this observed rise in the debt/income ratio for fi rst-time mortgage borrowers, while keeping a lid on the initial debt service burden of the loan relative to disposable income.
1975
1977
1979
1981
1983
1985
1987
1989
1991
1993
1995
1997
1999
2001
2003
0
50
100
150
200
250
300
–10
–5
0
5
10
15
20
25
CHART 7 HOUSE PRICE INFLATION
Sources : Stadim, The Economist.(1) Third quarter of 2003 or latest available.
Houses
Apartments
Building plots
Irela
nd
Uni
ted
Kin
gdom
Spai
n
Aus
tral
ia
Net
herla
nds
Swed
en
Belg
ium
Uni
ted
Stat
es
Fran
ce
Italy
Can
ada
Ger
man
y
Japa
n
Average between 1995 and 2003
2003 (1)
2002
PRICES IN BELGIUM(Nominal prices, indices 1990 = 100)
INTERNATIONAL COMPARISON(Annual percentage changes of the nominal priceof housing property)
0.0
0.5
1.0
1.5
2.0
0
2
4
6
8
10
1996
1998
2000
2002
2004
CHART 8 NEW MORTGAGE LOAN PRODUCTION
(Billions of euro, unless otherwise stated)
Source : NBB.
New mortgage refinancing loans
New mortgage loans, excludingrefinancing loans
(left-hand scale)
Interest rate on standard-contract mortgage credit(percentages) (right-hand scale)
26
Although this may in turn have raised the incidence of unsustainable debt burdens at the micro level, the aggregate picture still shows a relatively moderate level of indebtedness for Belgian households, with household debt as a percentage of disposable income (66 p.c.) or as a share of total assets (8.5 p.c.) remaining quite low in comparison with the levels registered in a number of other countries. The default rate on mortgage loans has, as a consequence, remained very low, in contrast to the default rate on consumer loans, which has traditionally been signifi cantly higher, but which, admittedly, concerns a much lower stock of debt (Chart 9).
1998 1999 2000 2001 20020
10
20
30
40
50
60
70
80
90
0
2
4
6
8
10
12
CHART 9 BREAKDOWN OF HOUSEHOLD DEBT AND ASSOCIATED DEFAULT RATES (1)
(End of period)
Sources : NSI, NBB.(1) The default rates have been calculated by dividing the total amount of all
payments due on loans in default (as registered in the credit register for loans to households) by the outstanding stocks of loans. As a general rule, a loan is considered to be in default if three contractual repayments have not been made or if one contractual repayment has not been made three months after its maturity.
2003 (e)
(left-hand scale)
(right-hand scale)
Consumption loans
Mortgage loans
On consumption loans
On mortgage loans
Default rate (percentages)
Loans outstanding (billions of euro)
Box 2 – Recent developments in mortgage borrowing
Since 1995, monthly data are available on the number and total volume of new mortgage loans taken out by Belgian households to fi nance the acquisition of an existing house. This information can be used to calculate the average amount borrowed by households to fi nance the acquisition of an existing house, with or without adjustment for the reportedly growing number of housing fi nance operations that involve – for tax and other reasons – the conclusion of more than one mortgage loan. The results are shown in the left-hand panel of Chart 1, highlighting a progressive increase in the estimated average amount borrowed by Belgian households from approximately 56,000 euro in 1995 to 102,000 euro in 2003, if one corrects the fi gures as described in note 1 of the Chart. In infl ation-adjusted terms, the estimated increase in the average amount borrowed between 1995 and 2003 amounts to 6 p.c. per year. The chart also shows the associated estimates of the average loan-to-value (LTV) ratios, by dividing the estimated average amounts borrowed by households to fi nance the acquisition of an existing house by the average housing price recorded by the National Statistical Institute for the respective years. Using the corrected fi gures, these show an LTV-ratio of between 80 p.c. and 85 p.c. since 1996, with a rise to slightly above 85 p.c. in 2003.
While increases in the average size of mortgage loans may help explain why average house prices have risen comparatively faster than disposable income (right-hand panel of Chart 1), their impact on the mortgage loan related debt service burden for households can only be estimated on the basis of a rough calculation, as there are
!
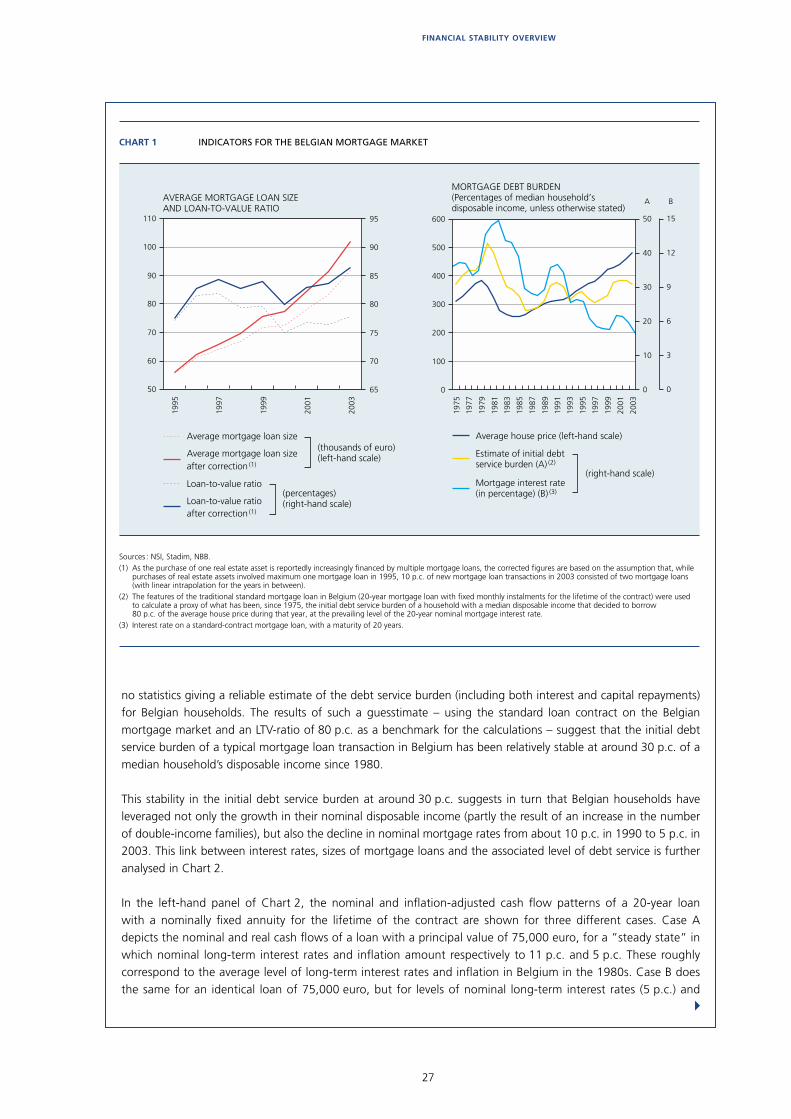
27
FINANCIAL STABILITY OVERVIEW
no statistics giving a reliable estimate of the debt service burden (including both interest and capital repayments) for Belgian households. The results of such a guesstimate – using the standard loan contract on the Belgian mortgage market and an LTV-ratio of 80 p.c. as a benchmark for the calculations – suggest that the initial debt service burden of a typical mortgage loan transaction in Belgium has been relatively stable at around 30 p.c. of a median household’s disposable income since 1980.
This stability in the initial debt service burden at around 30 p.c. suggests in turn that Belgian households have leveraged not only the growth in their nominal disposable income (partly the result of an increase in the number of double-income families), but also the decline in nominal mortgage rates from about 10 p.c. in 1990 to 5 p.c. in 2003. This link between interest rates, sizes of mortgage loans and the associated level of debt service is further analysed in Chart 2.
In the left-hand panel of Chart 2, the nominal and infl ation-adjusted cash fl ow patterns of a 20-year loan with a nominally fi xed annuity for the lifetime of the contract are shown for three different cases. Case A depicts the nominal and real cash fl ows of a loan with a principal value of 75,000 euro, for a ”steady state” in which nominal long-term interest rates and infl ation amount respectively to 11 p.c. and 5 p.c. These roughly correspond to the average level of long-term interest rates and infl ation in Belgium in the 1980s. Case B does the same for an identical loan of 75,000 euro, but for levels of nominal long-term interest rates (5 p.c.) and
1975
1977
1979
1981
1983
1985
1987
1989
1991
1993
1995
1997
1999
2001
2003
0
100
200
300
400
500
600
0
10
20
30
40
50
0
3
6
9
12
15
A
1995
1997
1999
2001
2003
50
60
70
80
90
100
110
65
70
75
80
85
90
95
B
CHART 1 INDICATORS FOR THE BELGIAN MORTGAGE MARKET
Sources : NSI, Stadim, NBB.(1) As the purchase of one real estate asset is reportedly increasingly financed by multiple mortgage loans, the corrected figures are based on the assumption that, while
purchases of real estate assets involved maximum one mortgage loan in 1995, 10 p.c. of new mortgage loan transactions in 2003 consisted of two mortgage loans (with linear intrapolation for the years in between).
(2) The features of the traditional standard mortgage loan in Belgium (20-year mortgage loan with fixed monthly instalments for the lifetime of the contract) were used to calculate a proxy of what has been, since 1975, the initial debt service burden of a household with a median disposable income that decided to borrow 80 p.c. of the average house price during that year, at the prevailing level of the 20-year nominal mortgage interest rate.
(3) Interest rate on a standard-contract mortgage loan, with a maturity of 20 years.
Loan-to-value ratioafter correction
(1)
Average house price (left-hand scale)
Mortgage interest rate(in percentage) (B)
(3)
(right-hand scale)
(thousands of euro)(left-hand scale)
AVERAGE MORTGAGE LOAN SIZE AND LOAN-TO-VALUE RATIO
Loan-to-value ratio(percentages)(right-hand scale)
MORTGAGE DEBT BURDEN(Percentages of median household’s disposable income, unless otherwise stated)
Average mortgage loan size
Average mortgage loan sizeafter correction
(1)
Estimate of initial debtservice burden (A)
(2)
!
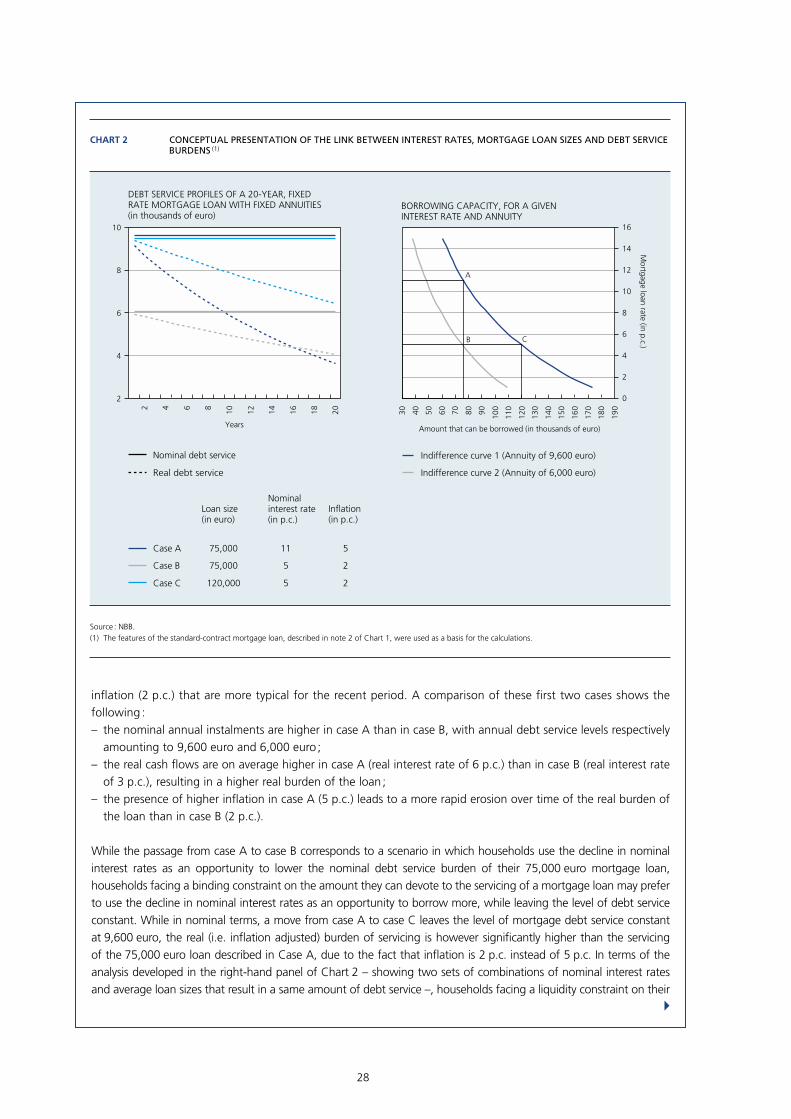
28
infl ation (2 p.c.) that are more typical for the recent period. A comparison of these fi rst two cases shows the following :– the nominal annual instalments are higher in case A than in case B, with annual debt service levels respectively
amounting to 9,600 euro and 6,000 euro ;– the real cash fl ows are on average higher in case A (real interest rate of 6 p.c.) than in case B (real interest rate
of 3 p.c.), resulting in a higher real burden of the loan ;– the presence of higher infl ation in case A (5 p.c.) leads to a more rapid erosion over time of the real burden of
the loan than in case B (2 p.c.).
While the passage from case A to case B corresponds to a scenario in which households use the decline in nominal interest rates as an opportunity to lower the nominal debt service burden of their 75,000 euro mortgage loan, households facing a binding constraint on the amount they can devote to the servicing of a mortgage loan may prefer to use the decline in nominal interest rates as an opportunity to borrow more, while leaving the level of debt service constant. While in nominal terms, a move from case A to case C leaves the level of mortgage debt service constant at 9,600 euro, the real (i.e. infl ation adjusted) burden of servicing is however signifi cantly higher than the servicing of the 75,000 euro loan described in Case A, due to the fact that infl ation is 2 p.c. instead of 5 p.c. In terms of the analysis developed in the right-hand panel of Chart 2 – showing two sets of combinations of nominal interest rates and average loan sizes that result in a same amount of debt service –, households facing a liquidity constraint on their
2 4 6 8 10 12 14 16 18 20
2
4
6
8
10
0
2
4
6
8
10
12
14
16
30 40 50 60 70 80 90 100
110
120
130
140
150
160
170
180
190
A
B C
CHART 2 CONCEPTUAL PRESENTATION OF THE LINK BETWEEN INTEREST RATES, MORTGAGE LOAN SIZES AND DEBT SERVICE BURDENS (1)
Source : NBB.(1) The features of the standard-contract mortgage loan, described in note 2 of Chart 1, were used as a basis for the calculations.
Years
Mortgage loan rate (in p.c.)
DEBT SERVICE PROFILES OF A 20-YEAR, FIXEDRATE MORTGAGE LOAN WITH FIXED ANNUITIES(in thousands of euro)
BORROWING CAPACITY, FOR A GIVENINTEREST RATE AND ANNUITY
Amount that can be borrowed (in thousands of euro)
Indifference curve 1 (Annuity of 9,600 euro)
Indifference curve 2 (Annuity of 6,000 euro)Real debt service
Nominal debt service
Case A
Case B
Case C
75,000
75,000
120,000
Loan size(in euro)
11
5
5
Nominalinterest rate (in p.c.)
5
2
2
Inflation(in p.c.)
!

29
FINANCIAL STABILITY OVERVIEW
2.2 Corporate sector
Mirroring developments in the euro area and the US, there was a marked contrast in 2003 between the buoy-ant growth of households’ mortgage borrowing and the moderate pace of corporate lending. As a matter of fact, the stock of corporate bank loans dropped by 1 p.c. in 2003, extending the negative trend that started in 1999, when corporate lending growth peaked at more than 15 p.c. (Chart 10). Such a sharp contrast in the dynam-ics of bank loans to households and corporates is rather unusual, albeit not unprecedented.
While subdued growth in corporate bank loans is hardly surprising in a context of weak economic activity, another factor that depressed the demand for corpo-rate loans in Belgium (as in many other countries) was the decline in Belgian non-fi nancial corporations’ net external fi nancing requirements (see Chart 11). This in turn resulted from the substantial fall in corporations’ net investment in fi nancial assets, which fell to 2.4 p.c. of GDP in 2003, after having peaked at 14 p.c. of GDP in 2000.
borrowing are thus more likely to move from point A to point C than from point A to point B in response to a decline in nominal mortgage loan rates. In the case of our numerical example, by moving from A to C, households fully leverage the drop in interest rates from 11 p.c. to 5 p.c. to raise the amount borrowed from 75,000 euro to 120,000 euro.
When considering the three cases described above, the actual mortgage borrowing behaviour of Belgian households – characterised by rising mortgage loan sizes and stable initial debt service levels, in a context of falling mortgage rates – appears to fi t well case C, where household borrowing is constrained by a limit on nominal debt service levels (in the fi rst year of the loan). While underscoring the importance of the decline in nominal mortgage rates in driving up the average size of new mortgage loans in Belgium, the existence of such a – self-imposed or not – ”liquidity constraint” on mortgage borrowing also suggests that other factors may have played a role in this regard, such as the marketing of mortgage loans with longer maturities (25 or 30 years) or the growing success of mortgage loan contracts with variable rates, which – in times of a normal yield curve – carry lower interest rate costs than their fi xed rate equivalents. The popularity of mortgage loans with variable rates has indeed increased markedly in recent years, thanks to the low level of short-term interest rates and the introduction of an “accordion clause” in a number of those contracts, whereby variations in the reference rate during the term of the contract lead to changes, within certain limits, in the duration rather than in the repayment burden of the loan.
One should be careful, however, about using the main fi ndings of the above conceptual discussion to draw inferences about the real mortgage debt service burden of Belgian households. First, the analysis disregards the role of growth in real disposable income. Second, while the presence of low infl ation and a higher debt/income ratio would suggest that households currently face a higher real mortgage debt service burden than in the past, the ”steady state” presentations used in the charts above are based on the assumption of a constant rate of infl ation during 20 years, while the actual pattern of infl ation over the past 20 years has, for example, been characterised by a process of disinfl ation. To the extent that this disinfl ation was not correctly anticipated by households, the ex post real mortgage debt service burden of a 20-year mortgage loan concluded in 1984, for example, may therefore have turned out to be higher than expected initially, unless these households used the possibility of mortgage refi nancing – which typically carries a fi nancial penalty of 3 months’ interest in Belgium – to lower their debt service burden when nominal mortgage rates declined.
–4
–2
0
2
4
6
8
10
12
14
16
18
1999 2000 2001 2002 2003–4
–2
0
2
4
6
8
10
12
14
16
18
CHART 10 BANK LENDING TO BELGIAN HOUSEHOLDS AND CORPORATES
(Percentage changes in outstanding amounts compared to the corresponding quarter of the previous year)
Source : NBB.
Household mortgage loans
Corporate bank loans

30
Although the fi nancing gap, which measures the differ-ence between corporations’ capital spending and internal funding, increased as a result of a further slowdown in profi tability, the total net external fi nancing requirements of Belgian non-fi nancial corporations declined from 17 p.c. of GDP in 2000 to 5 p.c. of GDP in 2003. Net issues of unquoted equity slowed to their lowest level since 1996, while issues of quoted equity showed no signs of revival. As concerns the latter, the large initial public offering of Belgacom in March 2004 did not involve a new issuance of own funds either, as it consisted in the sale of existing shares to the general public.
Following two consecutive years during which the net amount of new bank loans was lower than the net amount of funds raised through issues of debt securities, the outright substitution between the two sources of external fi nance in 2003 reinforced an exist-ing trend that has lifted the share of debt securities in total fi nancial debt to about 23 p.c. in 2003, up from 11 p.c. in 1994. As it is mainly large fi rms that have access to market fi nancing as a potential substitute for bank loans, the revealed preference of corporations for
non- intermediated debt fi nancing may also help explain the contrasting trends in the data of the Central Credit Register, where bank loans outstanding to large and medium-sized fi rms dropped and the amount of credit taken up by small fi rms showed a slight increase (see Chart 12 and Chapter 3 where this topic is further dis-cussed in the context of banks’ credit risk).
As indicated in Chart 13, one of the reasons that may have fostered large corporations’ shift towards fi nanc-ing through debt securities, to the detriment of bank loans, is the comparatively faster decline in corporate borrowing costs on the capital market, relative to bank loan rates. Indeed, as the yield on a 7-year BBB-rated corporate bond dropped to its lowest level in more than 4 years in the course of 2003, Belgian banks’ headline rate for an investment credit remained at a higher level, and even showed a tendency to increase towards the end of the year.
1995
1997
1999
2001
2003
–5
0
5
10
15
20
25
–5
0
5
10
15
20
25
1995
1997
1999
2001
2003
–5
0
5
10
15
20
25
–5
0
5
10
15
20
25
CHART 11 NON-FINANCIAL CORPORATIONS’ NET EXTERNAL FINANCING
(Percentages of GDP)
Sources : NAI, NBB.(1) The net external financing requirement is the sum of the financing gap and non-financial corporations’ net investment in financial assets.(2) The financing gap is defined as the difference between non-financial corporations’ capital spending and internal funding.(3) This item covers, in particular, loans received from associated companies located abroad.
Net investment in financial assets
Financing gap (2)
SOURCES OF NET EXTERNAL FINANCING REQUIREMENTS
(1)
Debt securities
Bank loans
Quoted Shares
Unquoted Shares
Other (3)
BREAKDOWN OF NET EXTERNAL FUNDING FLOWS
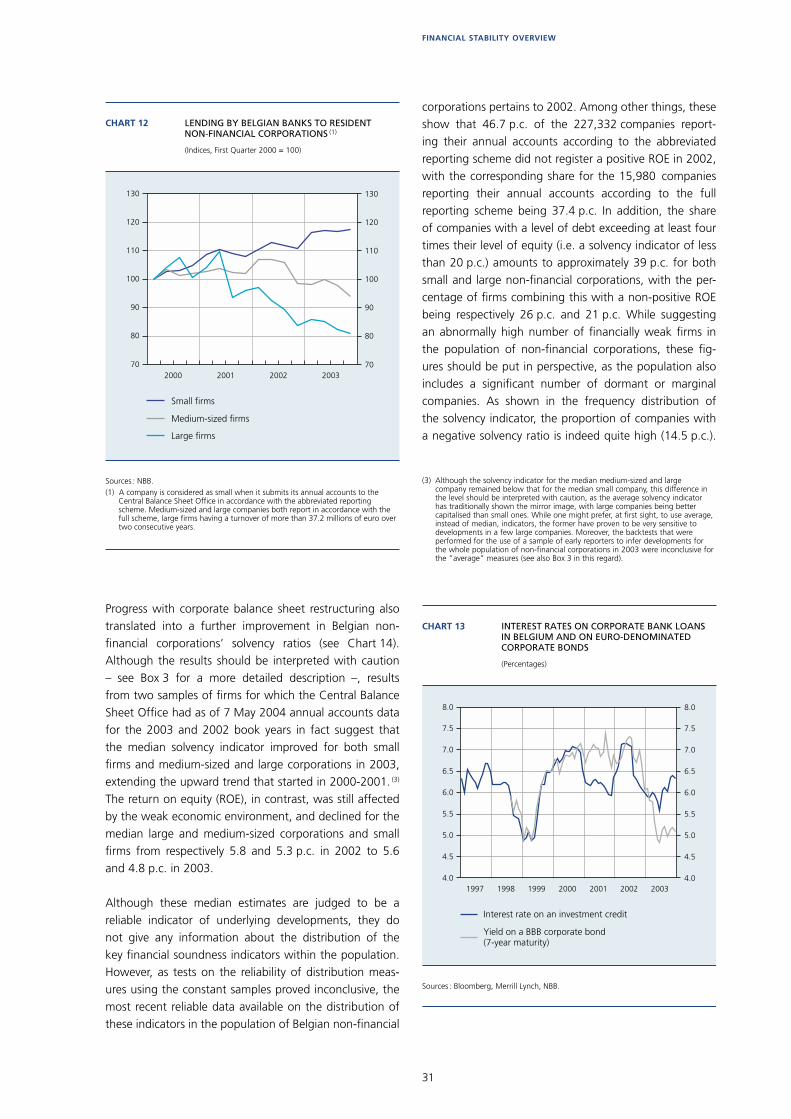
31
FINANCIAL STABILITY OVERVIEW
Progress with corporate balance sheet restructuring also translated into a further improvement in Belgian non-fi nancial corporations’ solvency ratios (see Chart 14). Although the results should be interpreted with caution – see Box 3 for a more detailed description –, results from two samples of fi rms for which the Central Balance Sheet Offi ce had as of 7 May 2004 annual accounts data for the 2003 and 2002 book years in fact suggest that the median solvency indicator improved for both small fi rms and medium-sized and large corporations in 2003, extending the upward trend that started in 2000-2001. (3) The return on equity (ROE), in contrast, was still affected by the weak economic environment, and declined for the median large and medium-sized corporations and small fi rms from respectively 5.8 and 5.3 p.c. in 2002 to 5.6 and 4.8 p.c. in 2003.
Although these median estimates are judged to be a reliable indicator of underlying developments, they do not give any information about the distribution of the key fi nancial soundness indicators within the population. However, as tests on the reliability of distribution meas-ures using the constant samples proved inconclusive, the most recent reliable data available on the distribution of these indicators in the population of Belgian non-fi nancial
corporations pertains to 2002. Among other things, these show that 46.7 p.c. of the 227,332 companies report-ing their annual accounts according to the abbreviated reporting scheme did not register a positive ROE in 2002, with the corresponding share for the 15,980 companies reporting their annual accounts according to the full reporting scheme being 37.4 p.c. In addition, the share of companies with a level of debt exceeding at least four times their level of equity (i.e. a solvency indicator of less than 20 p.c.) amounts to approximately 39 p.c. for both small and large non-fi nancial corporations, with the per-centage of fi rms combining this with a non-positive ROE being respectively 26 p.c. and 21 p.c. While suggesting an abnormally high number of fi nancially weak fi rms in the population of non-fi nancial corporations, these fi g-ures should be put in perspective, as the population also includes a signifi cant number of dormant or marginal companies. As shown in the frequency distribution of the solvency indicator, the proportion of companies with a negative solvency ratio is indeed quite high (14.5 p.c.).
70
80
90
100
110
120
130
2000 2001 2002 200370
80
90
100
110
120
130
CHART 12 LENDING BY BELGIAN BANKS TO RESIDENT NON-FINANCIAL CORPORATIONS (1)
(Indices, First Quarter 2000 = 100)
Sources : NBB.(1) A company is considered as small when it submits its annual accounts to the
Central Balance Sheet Office in accordance with the abbreviated reporting scheme. Medium-sized and large companies both report in accordance with the full scheme, large firms having a turnover of more than 37.2 millions of euro over two consecutive years.
Small firms
Medium-sized firms
Large firms
4.0
4.5
5.0
5.5
6.0
6.5
7.0
7.5
8.0
1997 1998 1999 2000 2001 2002 20034.0
4.5
5.0
5.5
6.0
6.5
7.0
7.5
8.0
CHART 13 INTEREST RATES ON CORPORATE BANK LOANS IN BELGIUM AND ON EURO-DENOMINATED CORPORATE BONDS
(Percentages)
Sources : Bloomberg, Merrill Lynch, NBB.
Interest rate on an investment credit
Yield on a BBB corporate bond(7-year maturity)
(3) Although the solvency indicator for the median medium-sized and large company remained below that for the median small company, this difference in the level should be interpreted with caution, as the average solvency indicator has traditionally shown the mirror image, with large companies being better capitalised than small ones. While one might prefer, at fi rst sight, to use average, instead of median, indicators, the former have proven to be very sensitive to developments in a few large companies. Moreover, the backtests that were performed for the use of a sample of early reporters to infer developments for the whole population of non-fi nancial corporations in 2003 were inconclusive for the ”average” measures (see also Box 3 in this regard).
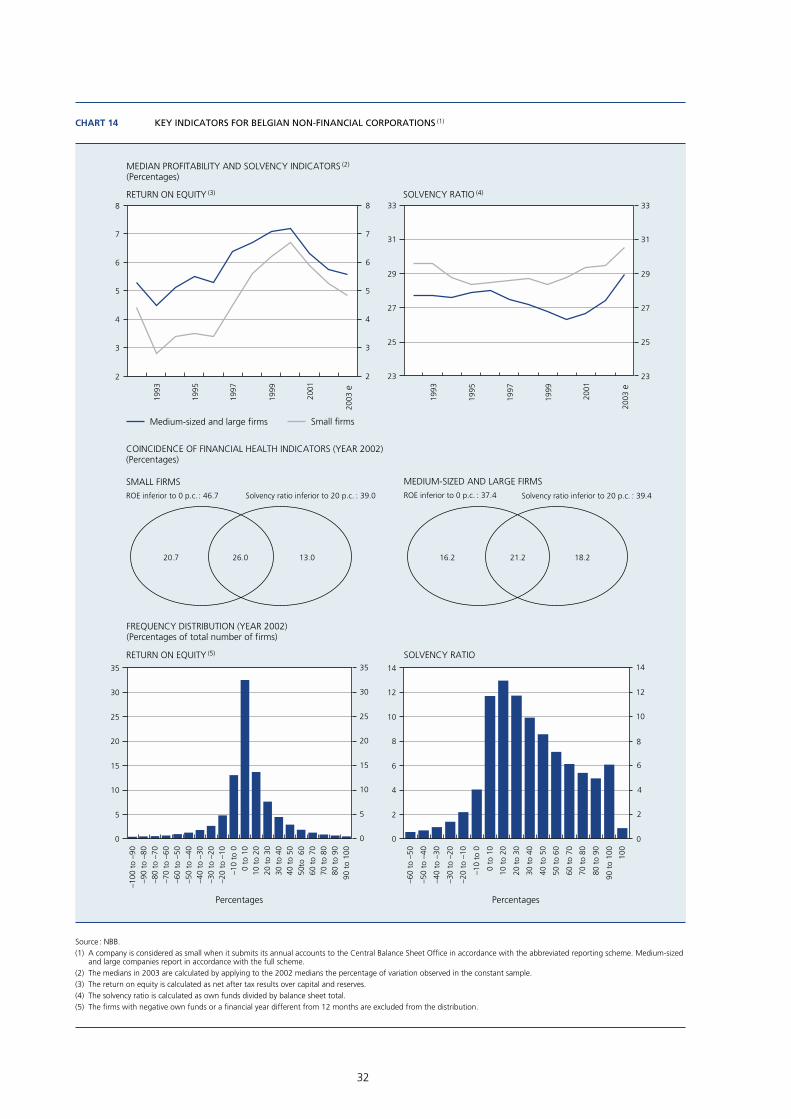
32
2
3
4
5
6
7
8
2
3
4
5
6
7
8
23
25
27
29
31
33
23
25
27
29
31
33
20.7 26.0 13.0 16.2 21.2 18.2
0
5
10
15
20
25
30
35
0
5
10
15
20
25
30
35
0
2
4
6
8
10
12
14
0
2
4
6
8
10
12
14
CHART 14 KEY INDICATORS FOR BELGIAN NON-FINANCIAL CORPORATIONS (1)
Source : NBB.(1) A company is considered as small when it submits its annual accounts to the Central Balance Sheet Office in accordance with the abbreviated reporting scheme. Medium-sized
and large companies report in accordance with the full scheme.(2) The medians in 2003 are calculated by applying to the 2002 medians the percentage of variation observed in the constant sample.(3) The return on equity is calculated as net after tax results over capital and reserves.(4) The solvency ratio is calculated as own funds divided by balance sheet total.(5) The firms with negative own funds or a financial year different from 12 months are excluded from the distribution.
1993
1995
1997
1999
2001
2003
e
1993
1995
1997
1999
2001
2003
e
–100
to
–90
–90
to –
80–8
0 to
–70
–70
to –
60–6
0 to
–50
–50
to –
40–4
0 to
–30
–30
to –
20–2
0 to
–10
–10
to 0
0 to
10
10 t
o 20
20 t
o 30
30 t
o 40
40 t
o 50
50to
60
60 t
o 70
70 t
o 80
80 t
o 90
90 t
o 10
0
–60
to –
50
–50
to –
40
–40
to –
30
–30
to –
20
–20
to –
10
–10
to 0
0 to
10
10 t
o 20
20 t
o 30
30 t
o 40
40 t
o 50
50 t
o 60
60 t
o 70
70 t
o 80
80 t
o 90
90 t
o 10
0
100
Small firmsMedium-sized and large firms
SMALL FIRMSROE inferior to 0 p.c. : 46.7 Solvency ratio inferior to 20 p.c. : 39.0 ROE inferior to 0 p.c. : 37.4 Solvency ratio inferior to 20 p.c. : 39.4
RETURN ON EQUITY (3) SOLVENCY RATIO (4)
MEDIAN PROFITABILITY AND SOLVENCY INDICATORS (2)
(Percentages)
COINCIDENCE OF FINANCIAL HEALTH INDICATORS (YEAR 2002)(Percentages)
MEDIUM-SIZED AND LARGE FIRMS
FREQUENCY DISTRIBUTION (YEAR 2002)(Percentages of total number of firms)
RETURN ON EQUITY (5)
Percentages Percentages
SOLVENCY RATIO
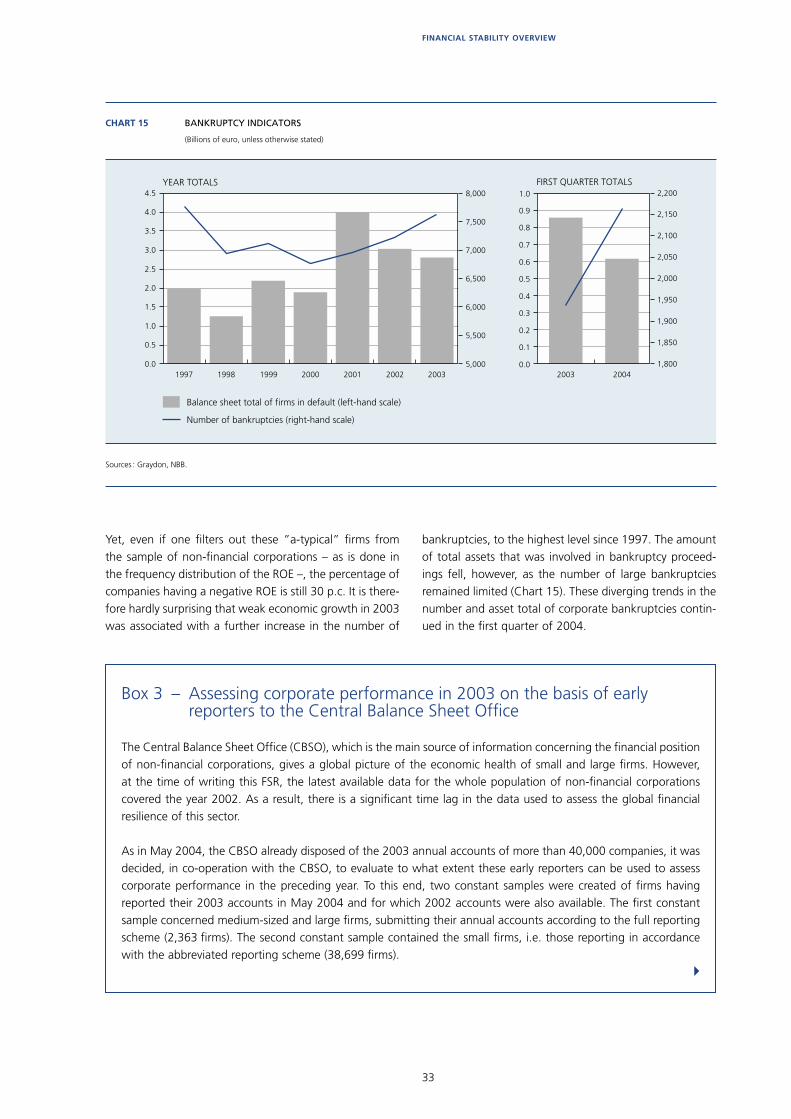
33
FINANCIAL STABILITY OVERVIEW
Yet, even if one fi lters out these ”a-typical” fi rms from the sample of non-fi nancial corporations – as is done in the frequency distribution of the ROE –, the percentage of companies having a negative ROE is still 30 p.c. It is there-fore hardly surprising that weak economic growth in 2003 was associated with a further increase in the number of
bankruptcies, to the highest level since 1997. The amount of total assets that was involved in bankruptcy proceed-ings fell, however, as the number of large bankruptcies remained limited (Chart 15). These diverging trends in the number and asset total of corporate bankruptcies contin-ued in the fi rst quarter of 2004.
1997 1998 1999 2000 2001 2002 20030.0
0.5
1.0
1.5
2.0
2.5
3.0
3.5
4.0
4.5
5,000
5,500
6,000
6,500
7,000
7,500
8,000
2003 20040.0
0.1
0.2
0.3
0.4
0.5
0.6
0.7
0.8
0.9
1.0
1,800
1,850
1,900
1,950
2,000
2,050
2,100
2,150
2,200
CHART 15 BANKRUPTCY INDICATORS
(Billions of euro, unless otherwise stated)
Sources : Graydon, NBB.
YEAR TOTALS FIRST QUARTER TOTALS
Balance sheet total of firms in default (left-hand scale)
Number of bankruptcies (right-hand scale)
Box 3 – Assessing corporate performance in 2003 on the basis of early reporters to the Central Balance Sheet Offi ce
The Central Balance Sheet Offi ce (CBSO), which is the main source of information concerning the fi nancial position of non-fi nancial corporations, gives a global picture of the economic health of small and large fi rms. However, at the time of writing this FSR, the latest available data for the whole population of non-fi nancial corporations covered the year 2002. As a result, there is a signifi cant time lag in the data used to assess the global fi nancial resilience of this sector.
As in May 2004, the CBSO already disposed of the 2003 annual accounts of more than 40,000 companies, it was decided, in co-operation with the CBSO, to evaluate to what extent these early reporters can be used to assess corporate performance in the preceding year. To this end, two constant samples were created of fi rms having reported their 2003 accounts in May 2004 and for which 2002 accounts were also available. The fi rst constant sample concerned medium-sized and large fi rms, submitting their annual accounts according to the full reporting scheme (2,363 fi rms). The second constant sample contained the small fi rms, i.e. those reporting in accordance with the abbreviated reporting scheme (38,699 fi rms).
!

34
To evaluate the reliability of such constant samples in providing estimates of the return on equity and the solvency ratio in the whole populations of, respectively, the medium-sized and large fi rms and the small fi rms, backtests were done for similar constant samples for the period 1998-2002, by comparing different moments for the constant samples with those of the population. While the calculated moments were the median, the quartiles, the average, the standard deviation, the skewness and the kurtosis, the backtests showed that only the median indicator gives a good estimate in terms of direction and variation percentage of corresponding developments in the population (see Chart 1 for a comparison of the median return on equity and solvency ratios, for the samples and the populations). Yet, the median indicator of the sample tends to be systematically higher than the corresponding fi gure for the population, which might be explained by the fact that, ceteris paribus, healthier fi rms tend to report earlier, creating an upward bias in the constant samples.
However, in this connection, it must also be noted that the majority of fi rms which had already reported their accounts in May have a book year that does not correspond to a full calendar year. In the case of the samples of early reporters available in May 2004, the majority of fi rms had closed their 2002 book year before December 2002 (see Chart 2, which compares, for the last year for which full data are available, the distribution of fi rms according to the closing date of their annual accounts in the constant samples and in the whole population). This confi rms that the fi nancial ratios of fi rms in the samples are probably more the refl ection of the business conditions prevailing at the juncture of the two preceding years.
1998 1999 2000 2001 20024
5
6
7
8
9
4
5
6
7
8
9
1998 1999 2000 2001 200223
25
27
29
31
33
23
25
27
29
31
33
CHART 1 COMPARISON OF MEDIAN RETURN ON EQUITY AND SOLVENCY RATIOS IN THE POPULATION AND THE SAMPLES OF EARLY REPORTERS
(Percentages)
Source : NBB.
RETURN ON EQUITY SOLVENCY RATIO
Population Sample
Medium-sized and large firms
Small firms
!
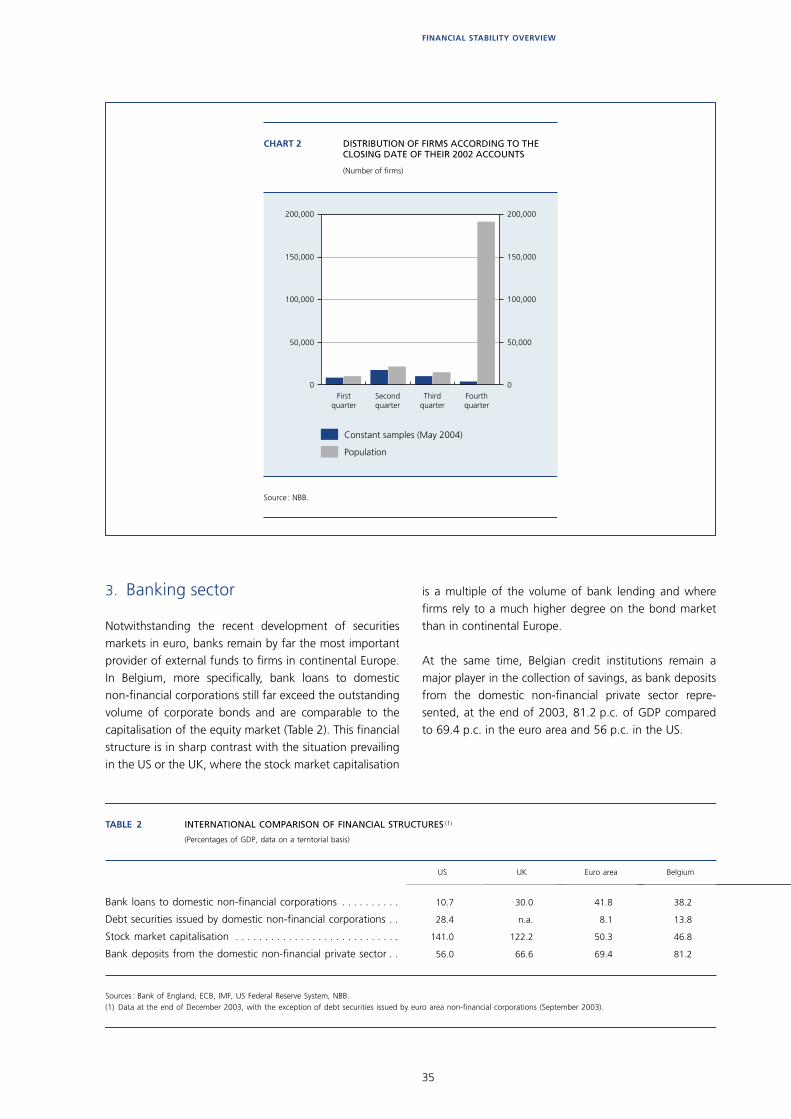
35
FINANCIAL STABILITY OVERVIEW
0
50,000
100,000
150,000
200,000
0
50,000
100,000
150,000
200,000
CHART 2 DISTRIBUTION OF FIRMS ACCORDING TO THE CLOSING DATE OF THEIR 2002 ACCOUNTS
(Number of firms)
Source : NBB.
Constant samples (May 2004)
Population
Firstquarter
Secondquarter
Thirdquarter
Fourthquarter
3. Banking sector
Notwithstanding the recent development of securities markets in euro, banks remain by far the most important provider of external funds to fi rms in continental Europe. In Belgium, more specifi cally, bank loans to domestic non-fi nancial corporations still far exceed the outstanding volume of corporate bonds and are comparable to the capitalisation of the equity market (Table 2). This fi nancial structure is in sharp contrast with the situation prevailing in the US or the UK, where the stock market capitalisation
is a multiple of the volume of bank lending and where fi rms rely to a much higher degree on the bond market than in continental Europe.
At the same time, Belgian credit institutions remain a major player in the collection of savings, as bank deposits from the domestic non-fi nancial private sector repre-sented, at the end of 2003, 81.2 p.c. of GDP compared to 69.4 p.c. in the euro area and 56 p.c. in the US.
TABLE 2 INTERNATIONAL COMPARISON OF FINANCIAL STRUCTURES (1)
(Percentages of GDP, data on a territorial basis)
Sources : Bank of England, ECB, IMF, US Federal Reserve System, NBB.(1) Data at the end of December 2003, with the exception of debt securities issued by euro area non-financial corporations (September 2003).
US UK Euro area Belgium
Bank loans to domestic non-financial corporations . . . . . . . . . . 10.7 30.0 41.8 38.2
Debt securities issued by domestic non-financial corporations . . 28.4 n.a. 8.1 13.8
Stock market capitalisation . . . . . . . . . . . . . . . . . . . . . . . . . . . . 141.0 122.2 50.3 46.8
Bank deposits from the domestic non-financial private sector . . 56.0 66.6 69.4 81.2
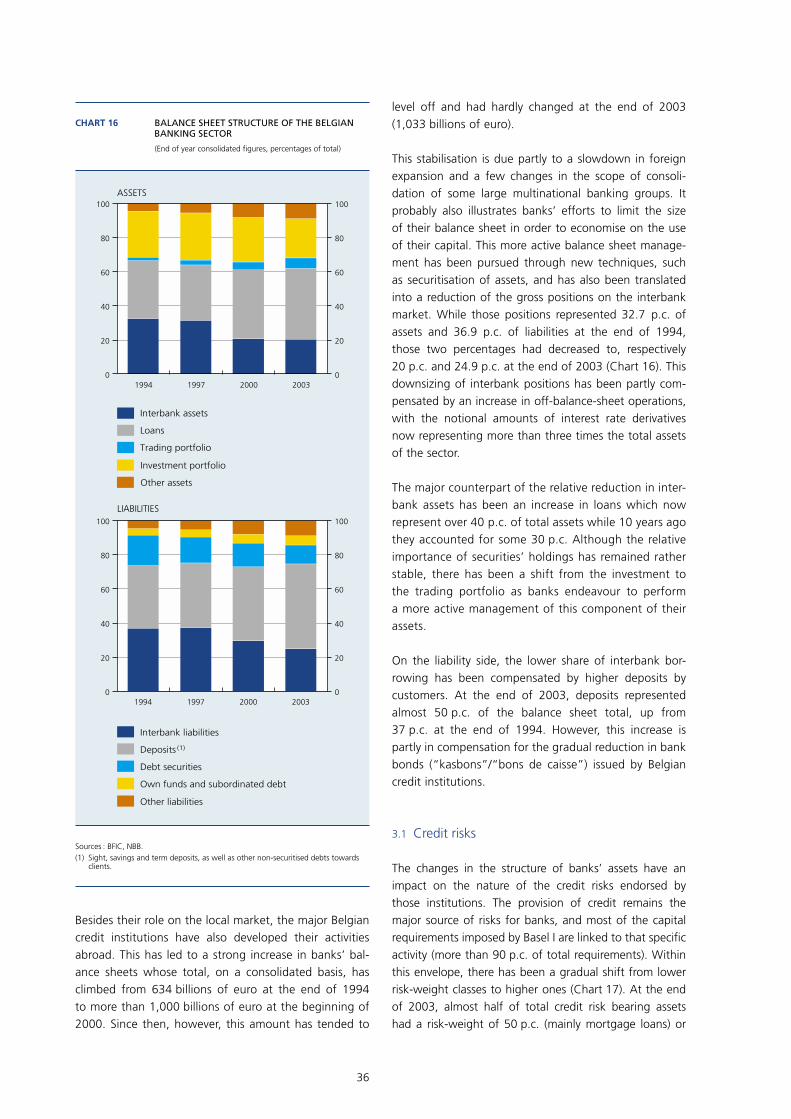
36
Besides their role on the local market, the major Belgian credit institutions have also developed their activities abroad. This has led to a strong increase in banks’ bal-ance sheets whose total, on a consolidated basis, has climbed from 634 billions of euro at the end of 1994 to more than 1,000 billions of euro at the beginning of 2000. Since then, however, this amount has tended to
level off and had hardly changed at the end of 2003 (1,033 billions of euro).
This stabilisation is due partly to a slowdown in foreign expansion and a few changes in the scope of consoli-dation of some large multinational banking groups. It probably also illustrates banks’ efforts to limit the size of their balance sheet in order to economise on the use of their capital. This more active balance sheet manage-ment has been pursued through new techniques, such as securitisation of assets, and has also been translated into a reduction of the gross positions on the interbank market. While those positions represented 32.7 p.c. of assets and 36.9 p.c. of liabilities at the end of 1994, those two percentages had decreased to, respectively 20 p.c. and 24.9 p.c. at the end of 2003 (Chart 16). This downsizing of interbank positions has been partly com-pensated by an increase in off-balance-sheet operations, with the notional amounts of interest rate derivatives now representing more than three times the total assets of the sector.
The major counterpart of the relative reduction in inter-bank assets has been an increase in loans which now represent over 40 p.c. of total assets while 10 years ago they accounted for some 30 p.c. Although the relative importance of securities’ holdings has remained rather stable, there has been a shift from the investment to the trading portfolio as banks endeavour to perform a more active management of this component of their assets.
On the liability side, the lower share of interbank bor-rowing has been compensated by higher deposits by customers. At the end of 2003, deposits represented almost 50 p.c. of the balance sheet total, up from 37 p.c. at the end of 1994. However, this increase is partly in compensation for the gradual reduction in bank bonds (“kasbons”/“bons de caisse”) issued by Belgian credit institutions.
3.1 Credit risks
The changes in the structure of banks’ assets have an impact on the nature of the credit risks endorsed by those institutions. The provision of credit remains the major source of risks for banks, and most of the capital requirements imposed by Basel I are linked to that specifi c activity (more than 90 p.c. of total requirements). Within this envelope, there has been a gradual shift from lower risk-weight classes to higher ones (Chart 17). At the end of 2003, almost half of total credit risk bearing assets had a risk-weight of 50 p.c. (mainly mortgage loans) or
1994 1997 2000 20030
20
40
60
80
100
0
20
40
60
80
100
1994 1997 2000 20030
20
40
60
80
100
0
20
40
60
80
100
CHART 16 BALANCE SHEET STRUCTURE OF THE BELGIAN BANKING SECTOR
(End of year consolidated figures, percentages of total)
Sources : BFIC, NBB.(1) Sight, savings and term deposits, as well as other non-securitised debts towards
clients.
ASSETS
LIABILITIES
Interbank assets
Loans
Trading portfolio
Investment portfolio
Other assets
Own funds and subordinated debt
Deposits (1)
Debt securities
Other liabilities
Interbank liabilities

37
FINANCIAL STABILITY OVERVIEW
100 p.c. (mainly other claims to the private sector), while they represented only a third of total assets at the end of 1997. This has been compensated by a strong decrease in the relative share of assets with a 20 p.c. risk-weight, which mainly include interbank positions. Finally, the still high proportion of Belgian and other euro area govern-ment bonds in banks’ balance sheets explains why more than 30 p.c. of total assets do not carry any capital requirement (0 p.c. risk-weight).
This distinction between a few risk-weight categories remains very crude and the treatment of credit risks will be much refi ned in the new Basel II capital accord, in which more sophisticated credit risk management tech-niques will form the basis for allocating capital require-ments to the various categories of assets.
Although most of Belgian banks’ credit risk bearing assets are located in western European countries, the exposure to other parts of the world represents more than three times the sector’s total regulatory own funds (Chart 18). The lion’s share is taken by the US. The exposure to that country increased further in 2003 notwithstanding the depreciation of the US dollar ; the majority of those claims are on the non-bank private sector.
The major changes in Belgian banks’ international expo-sures in 2003 have concerned Japan and the emerging economies. In Japan, Belgian banks, which had sharply reduced their exposure in 2002, have been rebuilding their positions in the context of a gradual improvement of the economic situation in this country. In emerging markets, the Belgian credit institutions have reduced their claims on Latin America in the aftermath of the fi nancial crisis in Argentina and Brazil, while slightly increasing their exposure to Asia.
While the two above-mentioned developments are related to cyclical factors, the further increase in posi-tions in Central and Eastern Europe is of a more structural nature. In recent years, a large Belgian bank, KBC, has progressively acquired a strong position in some of the countries which have recently joined the EU. This second market has been built in stages (Chart 19). In 1999 and 2000, KBC acquired the Czech bank CSOB through a pri-vatisation process. At the same time, an exposure to the Slovak market was built up through a subsidiary of CSOB. The entry into the Hungarian and Polish banking markets was mainly achieved during 2000 and 2001. In 2003, however, the exposure to the Polish market decreased, following substantial write-offs on the loan book and a depreciation of the Polish Zloty.
1997 2000 20030
20
40
60
80
100
0
20
40
60
80
100
50 p.c. risk-weight
100 p.c. risk-weight
0 p.c. risk-weight
20 p.c. risk-weight (1)
CHART 17 WEIGHTING OF ASSETS FOR CREDIT RISK REQUIREMENTS
(End of year consolidated figures, percentages of total credit risk bearing assets)
Sources : BFIC, NBB.
(1) Also including the non-substantial portion of assets which have a 4 p.c. or 10 p.c. risk-weight.
0 20 40 60 80 100 120 140 160 180
2002
2003
2001
United States
Japan
Offshore centres
Central andEastern Europe
Emergingeconomies
CHART 18 BELGIAN BANKS’ FOREIGN EXPOSURES (1) (2)
(End of year consolidated figures, expressed as percentages of regulatory own funds (3))
Source : NBB.(1) Excluding western European countries.(2) Total of loans and securities holdings after risk transfers via guarantees.(3) Regulatory own funds as defined for the calculation of the risk asset ratio.
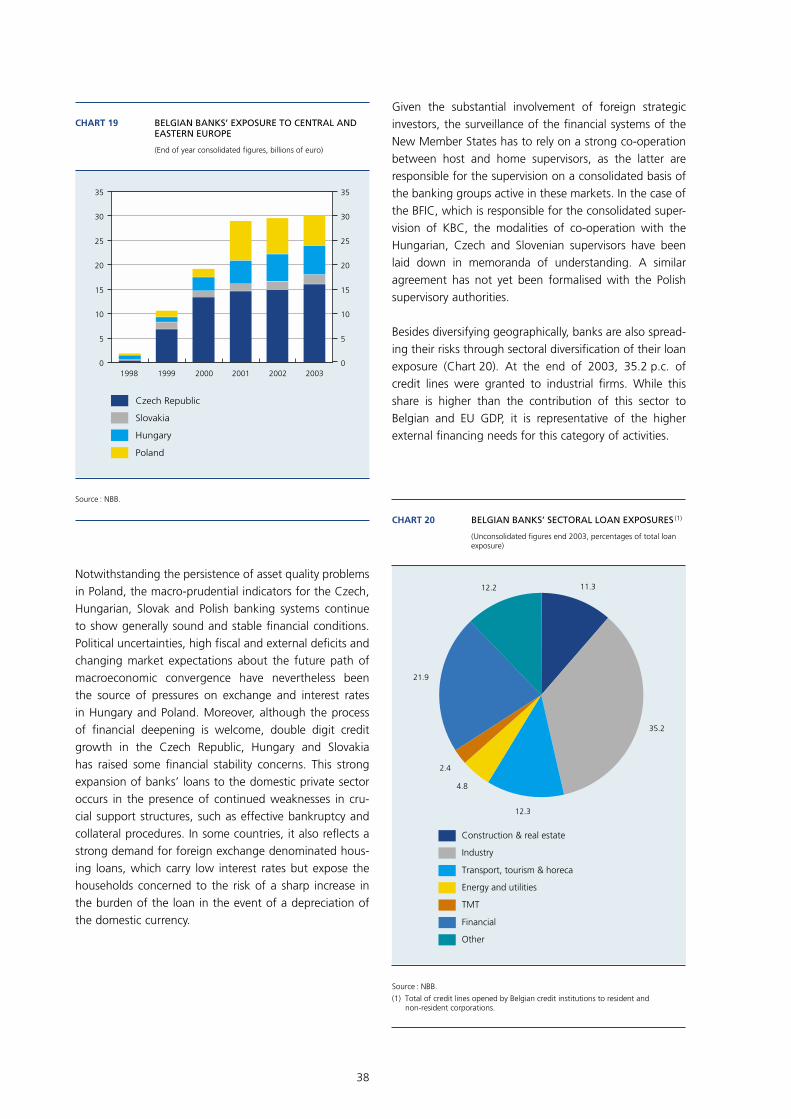
38
Notwithstanding the persistence of asset quality problems in Poland, the macro-prudential indicators for the Czech, Hungarian, Slovak and Polish banking systems continue to show generally sound and stable fi nancial conditions. Political uncertainties, high fi scal and external defi cits and changing market expectations about the future path of macroeconomic convergence have nevertheless been the source of pressures on exchange and interest rates in Hungary and Poland. Moreover, although the process of fi nancial deepening is welcome, double digit credit growth in the Czech Republic, Hungary and Slovakia has raised some fi nancial stability concerns. This strong expansion of banks’ loans to the domestic private sector occurs in the presence of continued weaknesses in cru-cial support structures, such as effective bankruptcy and collateral procedures. In some countries, it also refl ects a strong demand for foreign exchange denominated hous-ing loans, which carry low interest rates but expose the households concerned to the risk of a sharp increase in the burden of the loan in the event of a depreciation of the domestic currency.
Given the substantial involvement of foreign strategic investors, the surveillance of the fi nancial systems of the New Member States has to rely on a strong co-operation between host and home supervisors, as the latter are responsible for the supervision on a consolidated basis of the banking groups active in these markets. In the case of the BFIC, which is responsible for the consolidated super-vision of KBC, the modalities of co-operation with the Hungarian, Czech and Slovenian supervisors have been laid down in memoranda of understanding. A similar agreement has not yet been formalised with the Polish supervisory authorities.
Besides diversifying geographically, banks are also spread-ing their risks through sectoral diversifi cation of their loan exposure (Chart 20). At the end of 2003, 35.2 p.c. of credit lines were granted to industrial fi rms. While this share is higher than the contribution of this sector to Belgian and EU GDP, it is representative of the higher external fi nancing needs for this category of activities.
1998 1999 2000 2001 2002 20030
5
10
15
20
25
30
35
0
5
10
15
20
25
30
35
Slovakia
Poland
Czech Republic
Hungary
CHART 19 BELGIAN BANKS’ EXPOSURE TO CENTRAL AND EASTERN EUROPE
(End of year consolidated figures, billions of euro)
Source : NBB.
12.2 11.3
21.9
2.4
35.2
4.8
12.3
Construction & real estate
Industry
Transport, tourism & horeca
Energy and utilities
TMT
Financial
Other
CHART 20 BELGIAN BANKS’ SECTORAL LOAN EXPOSURES (1)
(Unconsolidated figures end 2003, percentages of total loan exposure)
Source : NBB.
(1) Total of credit lines opened by Belgian credit institutions to resident and non-resident corporations.
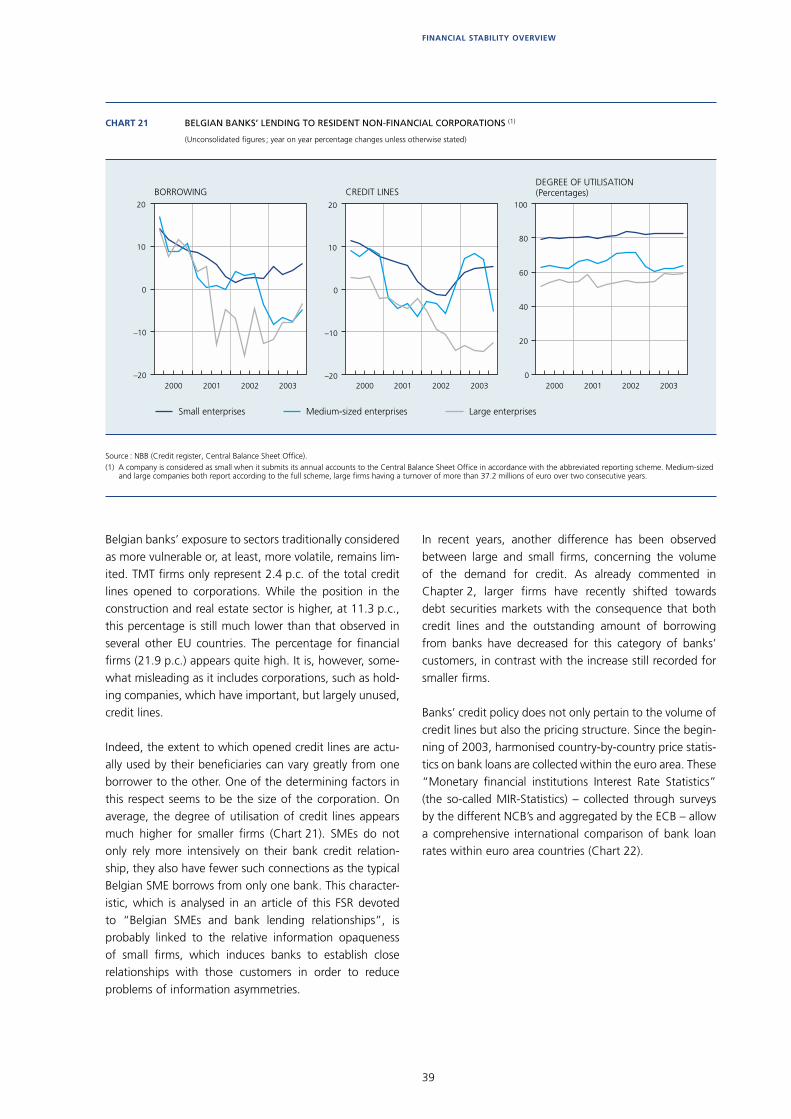
39
FINANCIAL STABILITY OVERVIEW
Belgian banks’ exposure to sectors traditionally considered as more vulnerable or, at least, more volatile, remains lim-ited. TMT fi rms only represent 2.4 p.c. of the total credit lines opened to corporations. While the position in the construction and real estate sector is higher, at 11.3 p.c., this percentage is still much lower than that observed in several other EU countries. The percentage for fi nancial fi rms (21.9 p.c.) appears quite high. It is, however, some-what misleading as it includes corporations, such as hold-ing companies, which have important, but largely unused, credit lines.
Indeed, the extent to which opened credit lines are actu-ally used by their benefi ciaries can vary greatly from one borrower to the other. One of the determining factors in this respect seems to be the size of the corporation. On average, the degree of utilisation of credit lines appears much higher for smaller fi rms (Chart 21). SMEs do not only rely more intensively on their bank credit relation-ship, they also have fewer such connections as the typical Belgian SME borrows from only one bank. This character-istic, which is analysed in an article of this FSR devoted to “Belgian SMEs and bank lending relationships”, is probably linked to the relative information opaqueness of small fi rms, which induces banks to establish close relationships with those customers in order to reduce problems of information asymmetries.
In recent years, another difference has been observed between large and small fi rms, concerning the volume of the demand for credit. As already commented in Chapter 2, larger fi rms have recently shifted towards debt securities markets with the consequence that both credit lines and the outstanding amount of borrowing from banks have decreased for this category of banks’ customers, in contrast with the increase still recorded for smaller fi rms.
Banks’ credit policy does not only pertain to the volume of credit lines but also the pricing structure. Since the begin-ning of 2003, harmonised country-by-country price statis-tics on bank loans are collected within the euro area. These “Monetary fi nancial institutions Interest Rate Statistics” (the so-called MIR-Statistics) – collected through surveys by the different NCB’s and aggregated by the ECB – allow a comprehensive international comparison of bank loan rates within euro area countries (Chart 22).
–20
–10
0
10
20
2000 2001 2002 2003–20
–10
0
10
20
2000 2001 2002 20030
20
40
60
80
100
2000 2001 2002 2003
Small enterprises Medium-sized enterprises Large enterprises
DEGREE OF UTILISATION (Percentages)BORROWING CREDIT LINES
CHART 21 BELGIAN BANKS’ LENDING TO RESIDENT NON-FINANCIAL CORPORATIONS (1)
(Unconsolidated figures ; year on year percentage changes unless otherwise stated)
Source : NBB (Credit register, Central Balance Sheet Office).(1) A company is considered as small when it submits its annual accounts to the Central Balance Sheet Office in accordance with the abbreviated reporting scheme. Medium-sized
and large companies both report according to the full scheme, large firms having a turnover of more than 37.2 millions of euro over two consecutive years.
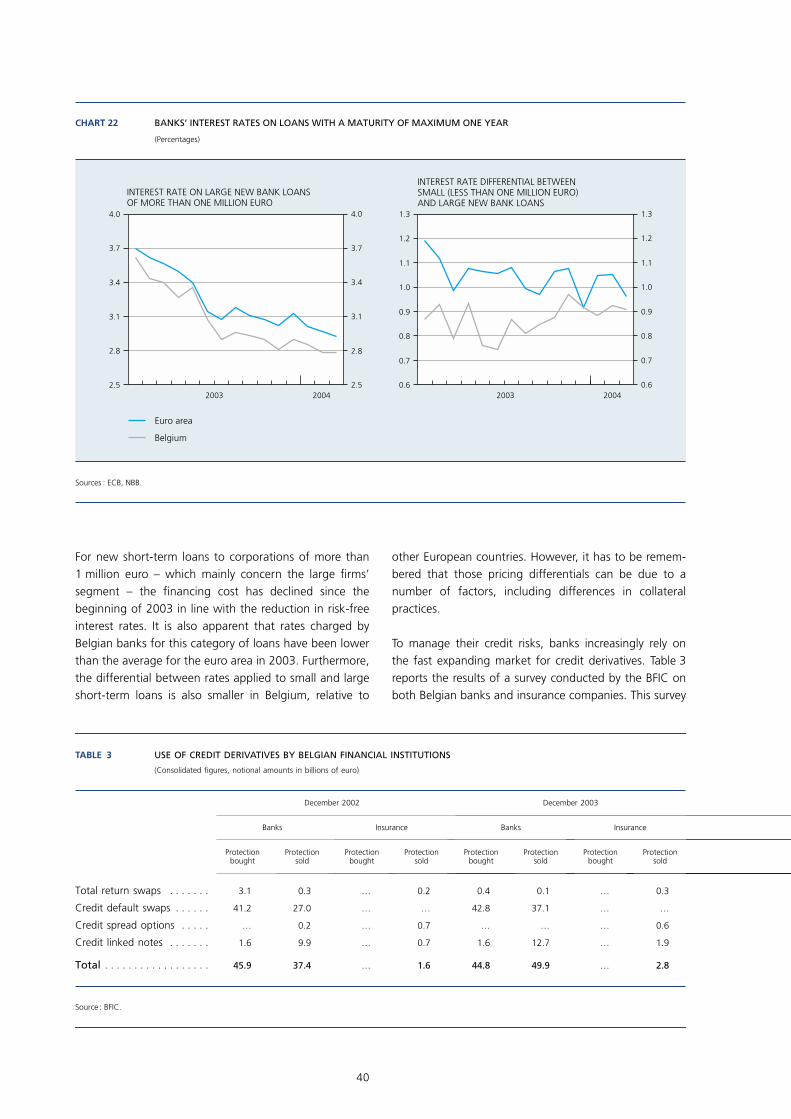
40
For new short-term loans to corporations of more than 1 million euro – which mainly concern the large fi rms’ segment – the fi nancing cost has declined since the beginning of 2003 in line with the reduction in risk-free interest rates. It is also apparent that rates charged by Belgian banks for this category of loans have been lower than the average for the euro area in 2003. Furthermore, the differential between rates applied to small and large short-term loans is also smaller in Belgium, relative to
other European countries. However, it has to be remem-bered that those pricing differentials can be due to a number of factors, including differences in collateral practices.
To manage their credit risks, banks increasingly rely on the fast expanding market for credit derivatives. Table 3 reports the results of a survey conducted by the BFIC on both Belgian banks and insurance companies. This survey
TABLE 3 USE OF CREDIT DERIVATIVES BY BELGIAN FINANCIAL INSTITUTIONS
(Consolidated figures, notional amounts in billions of euro)
Source : BFIC.
December 2002 December 2003
Banks Insurance Banks Insurance
Protectionbought
Protectionsold
Protectionbought
Protectionsold
Protectionbought
Protectionsold
Protectionbought
Protectionsold
Total return swaps . . . . . . . 3.1 0.3 … 0.2 0.4 0.1 … 0.3
Credit default swaps . . . . . . 41.2 27.0 … … 42.8 37.1 … …
Credit spread options . . . . . … 0.2 … 0.7 … … … 0.6
Credit linked notes . . . . . . . 1.6 9.9 … 0.7 1.6 12.7 … 1.9
Total . . . . . . . . . . . . . . . . . . 45.9 37.4 … 1.6 44.8 49.9 … 2.8
2003 2004 2003 2004
4.0
3.7
3.4
3.1
2.8
2.5
4.0
3.7
3.4
3.1
2.8
2.5
1.3
1.2
1.1
1.0
0.9
0.8
0.7
0.6
1.3
1.2
1.1
1.0
0.9
0.8
0.7
0.6
CHART 22 BANKS’ INTEREST RATES ON LOANS WITH A MATURITY OF MAXIMUM ONE YEAR
(Percentages)
Sources : ECB, NBB.
Euro area
Belgium
INTEREST RATE ON LARGE NEW BANK LOANSOF MORE THAN ONE MILLION EURO
INTEREST RATE DIFFERENTIAL BETWEENSMALL (LESS THAN ONE MILLION EURO)AND LARGE NEW BANK LOANS
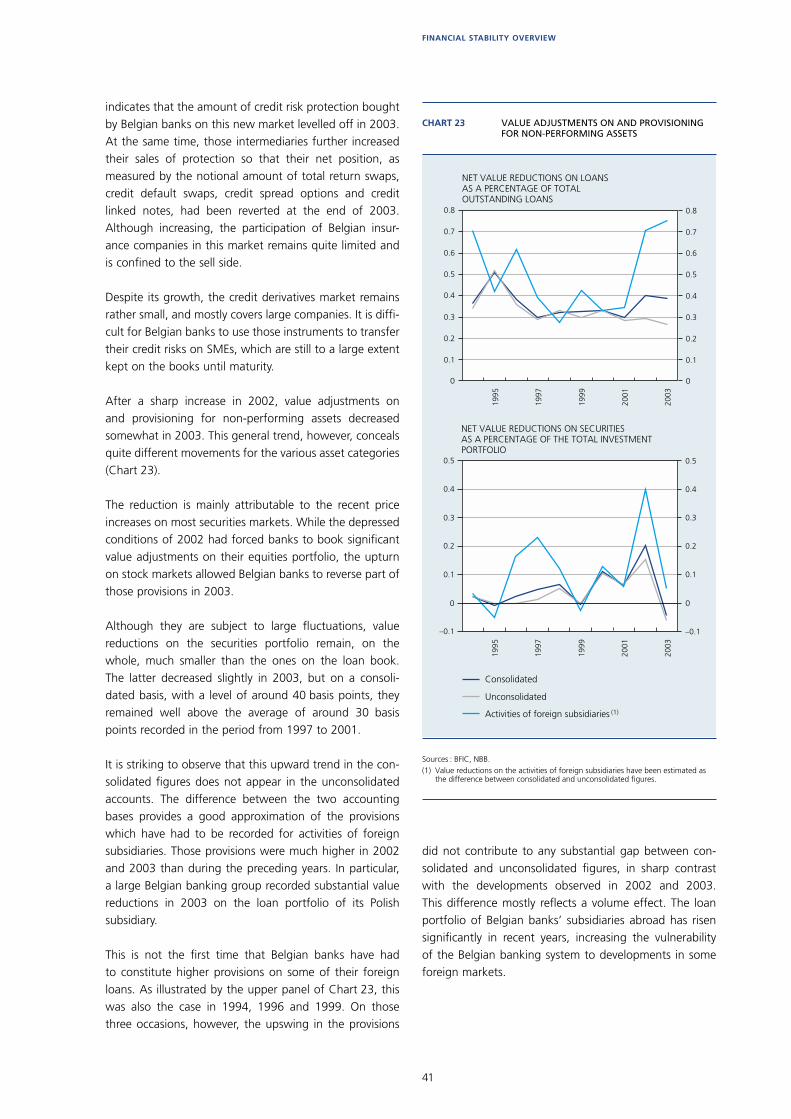
41
FINANCIAL STABILITY OVERVIEW
indicates that the amount of credit risk protection bought by Belgian banks on this new market levelled off in 2003. At the same time, those intermediaries further increased their sales of protection so that their net position, as measured by the notional amount of total return swaps, credit default swaps, credit spread options and credit linked notes, had been reverted at the end of 2003. Although increasing, the participation of Belgian insur-ance companies in this market remains quite limited and is confi ned to the sell side.
Despite its growth, the credit derivatives market remains rather small, and mostly covers large companies. It is diffi -cult for Belgian banks to use those instruments to transfer their credit risks on SMEs, which are still to a large extent kept on the books until maturity.
After a sharp increase in 2002, value adjustments on and provisioning for non-performing assets decreased somewhat in 2003. This general trend, however, conceals quite different movements for the various asset categories (Chart 23).
The reduction is mainly attributable to the recent price increases on most securities markets. While the depressed conditions of 2002 had forced banks to book signifi cant value adjustments on their equities portfolio, the upturn on stock markets allowed Belgian banks to reverse part of those provisions in 2003.
Although they are subject to large fl uctuations, value reductions on the securities portfolio remain, on the whole, much smaller than the ones on the loan book. The latter decreased slightly in 2003, but on a consoli-dated basis, with a level of around 40 basis points, they remained well above the average of around 30 basis points recorded in the period from 1997 to 2001.
It is striking to observe that this upward trend in the con-solidated fi gures does not appear in the unconsolidated accounts. The difference between the two accounting bases provides a good approximation of the provisions which have had to be recorded for activities of foreign subsidiaries. Those provisions were much higher in 2002 and 2003 than during the preceding years. In particular, a large Belgian banking group recorded substantial value reductions in 2003 on the loan portfolio of its Polish subsidiary.
This is not the fi rst time that Belgian banks have had to constitute higher provisions on some of their foreign loans. As illustrated by the upper panel of Chart 23, this was also the case in 1994, 1996 and 1999. On those three occasions, however, the upswing in the provisions
did not contribute to any substantial gap between con-solidated and unconsolidated fi gures, in sharp contrast with the developments observed in 2002 and 2003. This difference mostly refl ects a volume effect. The loan portfolio of Belgian banks’ subsidiaries abroad has risen signifi cantly in recent years, increasing the vulnerability of the Belgian banking system to developments in some foreign markets.
1995
1997
1999
2001
2003
1995
1997
1999
2001
2003
0
0.8
0.7
0.6
0.5
0.4
0.3
0.2
0.1
0
0.8
0.7
0.6
0.5
0.4
0.3
0.2
0.1
0
0.5
0.4
0.3
0.2
0.1
–0.1
0
0.5
0.4
0.3
0.2
0.1
–0.1
Consolidated
Unconsolidated
Activities of foreign subsidiaries (1)
NET VALUE REDUCTIONS ON SECURITIESAS A PERCENTAGE OF THE TOTAL INVESTMENTPORTFOLIO
NET VALUE REDUCTIONS ON LOANSAS A PERCENTAGE OF TOTALOUTSTANDING LOANS
CHART 23 VALUE ADJUSTMENTS ON AND PROVISIONING FOR NON-PERFORMING ASSETS
Sources : BFIC, NBB.(1) Value reductions on the activities of foreign subsidiaries have been estimated as
the difference between consolidated and unconsolidated figures.
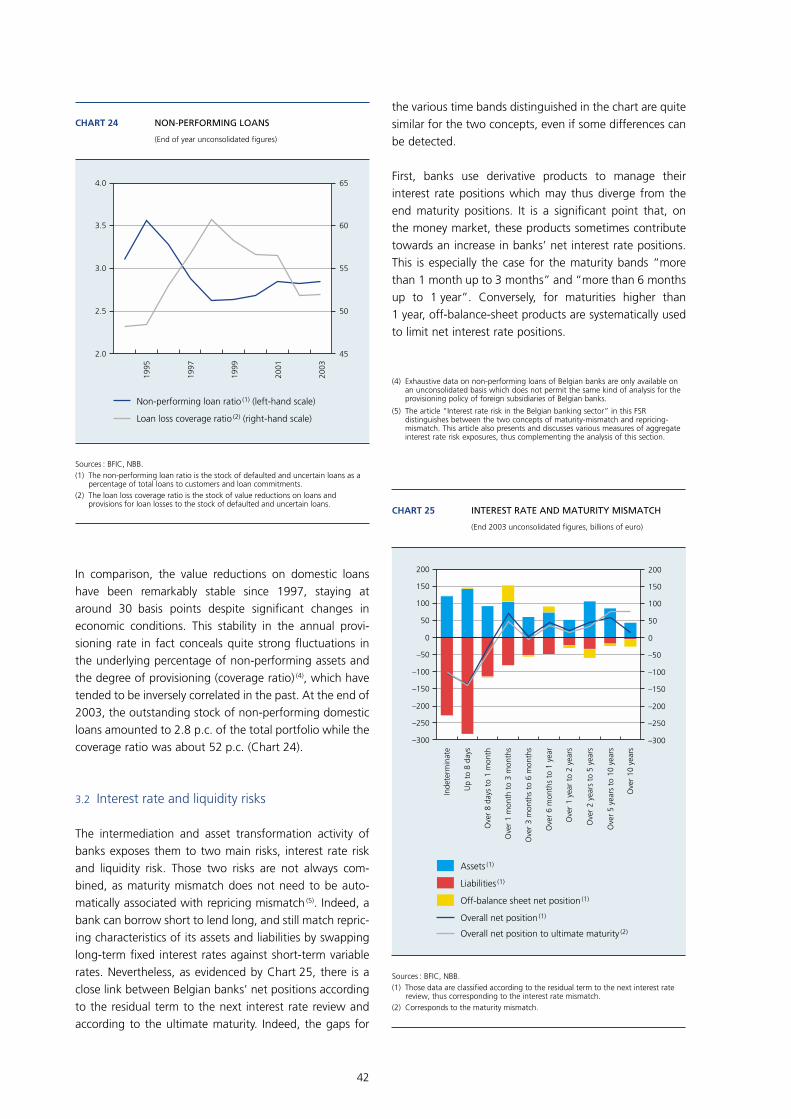
42
In comparison, the value reductions on domestic loans have been remarkably stable since 1997, staying at around 30 basis points despite signifi cant changes in economic conditions. This stability in the annual provi-sioning rate in fact conceals quite strong fl uctuations in the underlying percentage of non-performing assets and the degree of provisioning (coverage ratio) (4), which have tended to be inversely correlated in the past. At the end of 2003, the outstanding stock of non-performing domestic loans amounted to 2.8 p.c. of the total portfolio while the coverage ratio was about 52 p.c. (Chart 24).
3.2 Interest rate and liquidity risks
The intermediation and asset transformation activity of banks exposes them to two main risks, interest rate risk and liquidity risk. Those two risks are not always com-bined, as maturity mismatch does not need to be auto-matically associated with repricing mismatch (5). Indeed, a bank can borrow short to lend long, and still match repric-ing characteristics of its assets and liabilities by swapping long-term fi xed interest rates against short-term variable rates. Nevertheless, as evidenced by Chart 25, there is a close link between Belgian banks’ net positions according to the residual term to the next interest rate review and according to the ultimate maturity. Indeed, the gaps for
1995
1997
1999
2001
2003
45
50
55
60
654.0
3.5
3.0
2.5
2.0
Non-performing loan ratio (1) (left-hand scale)
Loan loss coverage ratio (2) (right-hand scale)
CHART 24 NON-PERFORMING LOANS
(End of year unconsolidated figures)
Sources : BFIC, NBB.(1) The non-performing loan ratio is the stock of defaulted and uncertain loans as a
percentage of total loans to customers and loan commitments.(2) The loan loss coverage ratio is the stock of value reductions on loans and
provisions for loan losses to the stock of defaulted and uncertain loans.
(4) Exhaustive data on non-performing loans of Belgian banks are only available on an unconsolidated basis which does not permit the same kind of analysis for the provisioning policy of foreign subsidiaries of Belgian banks.
(5) The article “Interest rate risk in the Belgian banking sector” in this FSR distinguishes between the two concepts of maturity-mismatch and repricing-mismatch. This article also presents and discusses various measures of aggregate interest rate risk exposures, thus complementing the analysis of this section.
the various time bands distinguished in the chart are quite similar for the two concepts, even if some differences can be detected.
First, banks use derivative products to manage their interest rate positions which may thus diverge from the end maturity positions. It is a signifi cant point that, on the money market, these products sometimes contribute towards an increase in banks’ net interest rate positions. This is especially the case for the maturity bands “more than 1 month up to 3 months” and “more than 6 months up to 1 year”. Conversely, for maturities higher than 1 year, off-balance-sheet products are systematically used to limit net interest rate positions.
–300
–250
–200
–150
–100
–50
0
50
100
150
200
–300
–250
–200
–150
–100
–50
0
50
100
150
200
CHART 25 INTEREST RATE AND MATURITY MISMATCH
(End 2003 unconsolidated figures, billions of euro)
Inde
term
inat
e
Up
to 8
day
s
Ove
r 8
days
to
1 m
onth
Ove
r 1
mon
th t
o 3
mon
ths
Ove
r 3
mon
ths
to 6
mon
ths
Ove
r 6
mon
ths
to 1
yea
r
Ove
r 1
year
to
2 ye
ars
Ove
r 2
year
s to
5 y
ears
Ove
r 5
year
s to
10
year
s
Ove
r 10
yea
rs
Assets (1)
Liabilities (1)
Off-balance sheet net position (1)
Overall net position (1)
Overall net position to ultimate maturity (2)
Sources : BFIC, NBB.(1) Those data are classified according to the residual term to the next interest rate
review, thus corresponding to the interest rate mismatch.(2) Corresponds to the maturity mismatch.

43
FINANCIAL STABILITY OVERVIEW
Second, for the longest time horizon (more than 10 years and, to a lesser extent, 5 to 10 years), banks can reduce their repricing mismatch by resorting to contracts with intermediate interest rate revisions. Such an option is increasingly used on the Belgian mortgage markets where contracts with rate revisions every 1, 5 or 10 years are increasingly replacing the classic formula of 20 year fi xed interest rate loans.
However, an analysis of the relation between the interest rate and the liquidity positions must go beyond a mere comparison of the two gap structures. Indeed, a large proportion of Belgian banks’ long-term assets (e.g. the portfolio of government bonds) can be mobilised quickly on very liquid markets. On the other hand, short-term liabilities, such as sight and savings deposits, can to some extent be treated as long-term resources.
Banks take those characteristics into account in their asset and liability management (ALM). Indeed, if we try to synthesise the maturity position to the next interest rate review in some key time bands, we can detect a kind of two tier structure in the maturity transformation role of Belgian banks (Chart 26).
On the money market (two inner maturity bands of Chart 26), during the period 1993 to 2003, banks have, on average, been net borrowers for maturities up to 1 month excluding sight deposits in order to fi nance assets with a maturity of over 1 month to 1 year. While those two inner bands probably refl ect, to a large extent, the trading activi-ties of banks, the two outer bands are more closely associ-ated with the core business activity of attracting deposits to fi nance long-term assets. Indeed, if we add on to the sight deposits the net liabilities with an indeterminate maturity (which mainly correspond to banks’ savings deposits), we observe that this double source of funds is used to fi nance net asset positions on the capital market (more than one year).
The average maturity positions illustrated in Chart 26 did not remain constant through time. Chart 27 shows the developments for the four maturity bands since 1993. While net liabilities with a maturity of up to 1 month (with the exclusion of sight deposits) have represented a rather stable proportion of about 10 p.c. of total bank balance sheets, sight deposits and net liabilities with indeterminate maturities (including savings deposits) have increased, in relative terms, from less than 10 p.c. of total bank balance
–20 –15 –10 –5 10 15 200 5
CHART 26 KEY TRANSFORMATION ACTIVITIES OF THE BELGIAN BANKING SECTOR (1)
(Unconsolidated figures, net position in percentages of total assets, average of quarterly data between end 1993 and end 2003)
Indeterminate
Sight deposits
Up to 8 days minus sight deposits
8 days to 1 month
1 to 3 months
3 to 6 months
6 to 12 months
1 to 2 years
2 to 5 years
5 to 10 years
Over 10 years
NET ASSETS
NET LIABILITIESUp to 1 month – sight deposits
Indeterminate + sight deposits
Over 1 year
1 month to 1 year
Sources : BFIC, NBB.(1) Data according to the residual term to the next interest rate review date, thus corresponding to the interest rate mismatch. They include off-balance sheet net positions.
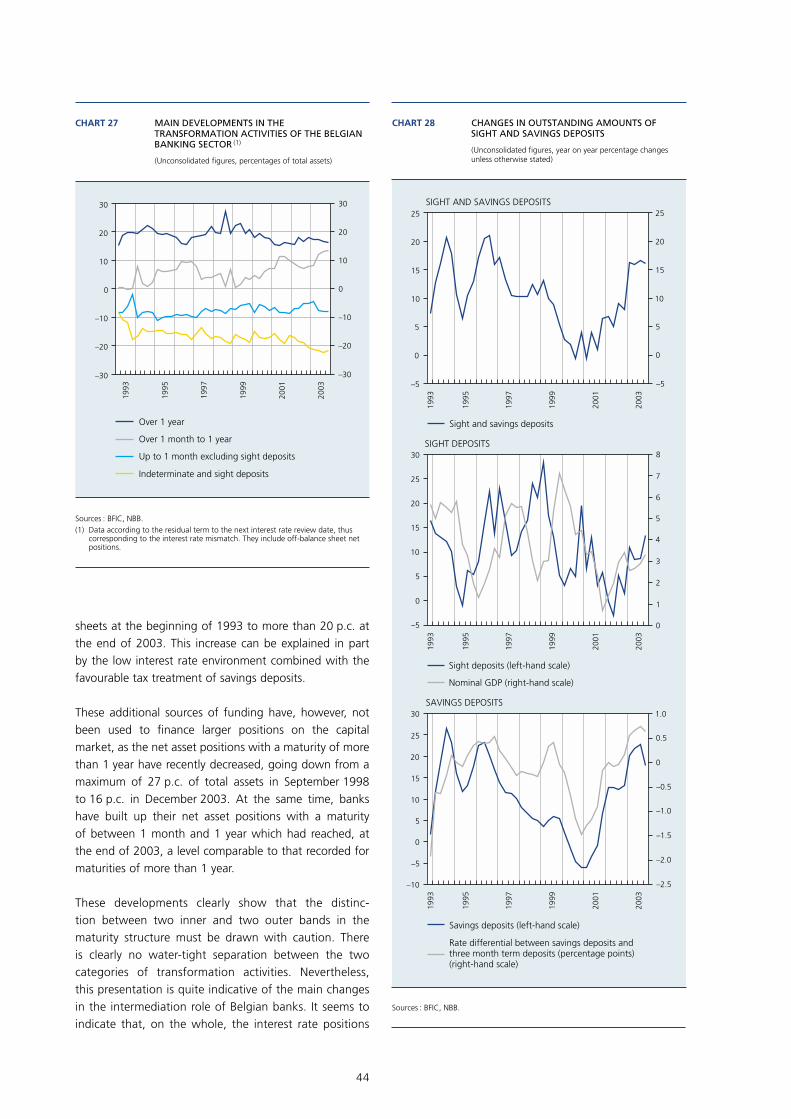
44
sheets at the beginning of 1993 to more than 20 p.c. at the end of 2003. This increase can be explained in part by the low interest rate environment combined with the favourable tax treatment of savings deposits.
These additional sources of funding have, however, not been used to fi nance larger positions on the capital market, as the net asset positions with a maturity of more than 1 year have recently decreased, going down from a maximum of 27 p.c. of total assets in September 1998 to 16 p.c. in December 2003. At the same time, banks have built up their net asset positions with a maturity of between 1 month and 1 year which had reached, at the end of 2003, a level comparable to that recorded for maturities of more than 1 year.
These developments clearly show that the distinc-tion between two inner and two outer bands in the maturity structure must be drawn with caution. There is clearly no water-tight separation between the two categories of transformation activities. Nevertheless, this presentation is quite indicative of the main changes in the intermediation role of Belgian banks. It seems to indicate that, on the whole, the interest rate positions
–30
–20
–10
0
10
20
30
1993
1995
1997
1999
2001
2003
–30
–20
–10
0
10
20
30
CHART 27 MAIN DEVELOPMENTS IN THE TRANSFORMATION ACTIVITIES OF THE BELGIAN BANKING SECTOR (1)
(Unconsolidated figures, percentages of total assets)
Sources : BFIC, NBB.(1) Data according to the residual term to the next interest rate review date, thus
corresponding to the interest rate mismatch. They include off-balance sheet net positions.
Over 1 year
Over 1 month to 1 year
Up to 1 month excluding sight deposits
Indeterminate and sight deposits
–5
0
5
10
15
20
25
–5
0
5
10
15
20
25
1993
1995
1997
1999
2001
2003
–5
0
5
10
15
20
25
30
0
1
2
3
4
5
6
7
8
1993
1995
1997
1999
2001
2003
–10
–5
0
5
10
15
20
25
30
1993
1995
1997
1999
2001
2003
1.0
0.5
–0.5
–1.0
–1.5
–2.0
–2.5
0
CHART 28 CHANGES IN OUTSTANDING AMOUNTS OF SIGHT AND SAVINGS DEPOSITS
(Unconsolidated figures, year on year percentage changes unless otherwise stated)
Sources : BFIC, NBB.
Sight and savings deposits
Sight deposits (left-hand scale)
Nominal GDP (right-hand scale)
SIGHT DEPOSITS
Rate differential between savings deposits and three month term deposits (percentage points)(right-hand scale)
Savings deposits (left-hand scale)
SAVINGS DEPOSITS
SIGHT AND SAVINGS DEPOSITS
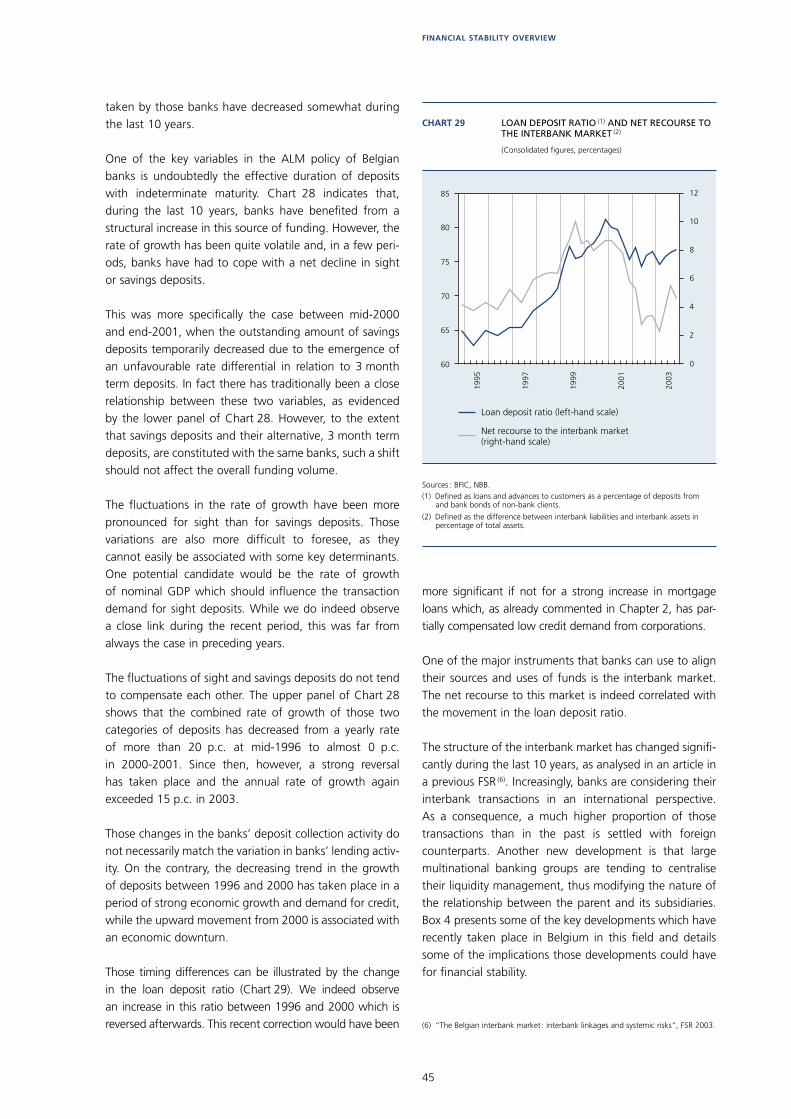
45
FINANCIAL STABILITY OVERVIEW
taken by those banks have decreased somewhat during the last 10 years.
One of the key variables in the ALM policy of Belgian banks is undoubtedly the effective duration of deposits with indeterminate maturity. Chart 28 indicates that, during the last 10 years, banks have benefi ted from a structural increase in this source of funding. However, the rate of growth has been quite volatile and, in a few peri-ods, banks have had to cope with a net decline in sight or savings deposits.
This was more specifi cally the case between mid-2000 and end-2001, when the outstanding amount of savings deposits temporarily decreased due to the emergence of an unfavourable rate differential in relation to 3 month term deposits. In fact there has traditionally been a close relationship between these two variables, as evidenced by the lower panel of Chart 28. However, to the extent that savings deposits and their alternative, 3 month term deposits, are constituted with the same banks, such a shift should not affect the overall funding volume.
The fl uctuations in the rate of growth have been more pronounced for sight than for savings deposits. Those variations are also more diffi cult to foresee, as they cannot easily be associated with some key determinants. One potential candidate would be the rate of growth of nominal GDP which should infl uence the transaction demand for sight deposits. While we do indeed observe a close link during the recent period, this was far from always the case in preceding years.
The fl uctuations of sight and savings deposits do not tend to compensate each other. The upper panel of Chart 28 shows that the combined rate of growth of those two categories of deposits has decreased from a yearly rate of more than 20 p.c. at mid-1996 to almost 0 p.c. in 2000-2001. Since then, however, a strong reversal has taken place and the annual rate of growth again exceeded 15 p.c. in 2003.
Those changes in the banks’ deposit collection activity do not necessarily match the variation in banks’ lending activ-ity. On the contrary, the decreasing trend in the growth of deposits between 1996 and 2000 has taken place in a period of strong economic growth and demand for credit, while the upward movement from 2000 is associated with an economic downturn.
Those timing differences can be illustrated by the change in the loan deposit ratio (Chart 29). We indeed observe an increase in this ratio between 1996 and 2000 which is reversed afterwards. This recent correction would have been
more signifi cant if not for a strong increase in mortgage loans which, as already commented in Chapter 2, has par-tially compensated low credit demand from corporations.
One of the major instruments that banks can use to align their sources and uses of funds is the interbank market. The net recourse to this market is indeed correlated with the movement in the loan deposit ratio.
The structure of the interbank market has changed signifi -cantly during the last 10 years, as analysed in an article in a previous FSR (6). Increasingly, banks are considering their interbank transactions in an international perspective. As a consequence, a much higher proportion of those transactions than in the past is settled with foreign counterparts. Another new development is that large multinational banking groups are tending to centralise their liquidity management, thus modifying the nature of the relationship between the parent and its subsidiaries. Box 4 presents some of the key developments which have recently taken place in Belgium in this fi eld and details some of the implications those developments could have for fi nancial stability.
60
65
70
75
80
85
0
2
4
6
8
10
12
1995
1997
1999
2001
2003
Loan deposit ratio (left-hand scale)
Net recourse to the interbank market(right-hand scale)
CHART 29 LOAN DEPOSIT RATIO (1) AND NET RECOURSE TO THE INTERBANK MARKET (2)
(Consolidated figures, percentages)
Sources : BFIC, NBB.(1) Defined as loans and advances to customers as a percentage of deposits from
and bank bonds of non-bank clients.
(2) Defined as the difference between interbank liabilities and interbank assets in percentage of total assets.
(6) “The Belgian interbank market : interbank linkages and systemic risks”, FSR 2003.

46
Box 4 – Supervision of liquidity in complex banking structures
According to the European directive relating to the supervision of credit institutions, the home supervisor is responsible for the surveillance of all activities and risks of the foreign branches of a banking group, with the exception of liquidity which is controlled by the host authority, although in co-operation with the home supervisor. This segregation of responsibility has been introduced at a time when most branches in the EU were relatively small and in general not of systemic importance. However, when branches become systemically important in the host market, there can be some concern over the ability of the authorities to assume their responsibilities as regards the fi nancial stability in their respective countries.
One example relates to the Nordea group’s intention to transform its group structure (actually a holding company with subsidiaries) into a home bank in Sweden with branches in other Nordic countries. As these branches will account for a large share of the host market (40 p.c. of Finnish, 25 p.c. of Danish and 15 p.c. of Norwegian banking assets) they are undoubtedly systemic for these countries. Problems somewhere in the group will probably have an immediate impact on the bank as a whole and, consequently, on the fi nancial stability of these different markets.
Potential problems are not limited to the implementation of a branch structure. They could also develop when parent banks provide formal or economic support for the liquidity of systemically important subsidiaries in other countries, as this implies a transfer of risk to the parent bank. This could be the case, for instance, if the liquidity management of those subsidiaries is fully integrated with that of the head offi ce. Such structures have also been put in place by Belgian banks.
For example, one Belgian bank, with two foreign banking subsidiaries both systemically important on their local markets, has restructured the organisation of its professional activities. While trading rooms have been kept in those two subsidiaries, it has been decided that the administration and accounting of all transactions with professional counterparties would be centralised at the parent bank. The subsidiaries have been given a mandate to conclude deals in the name and for the account of the parent bank which is the only legal counterparty. As a consequence, the latter bears the credit and market risks related to transactions initiated by the trading rooms of its subsidiaries. Moreover, these subsidiaries no longer have a direct access to the professional market and their liquidity positions depend largely on the support of the parent bank, which has granted a formal liquidity line to one of those subsidiaries.
Another case relates to a fi nancial holding company, with a banking subsidiary which is systemic for the Belgian fi nancial market. This holding company has issued a guarantee letter covering all commitments of two other banking subsidiaries abroad. As a result of that formal guarantee, all risks taken by these two subsidiaries are supported by the holding company (and indirectly by the group’s other main banking subsidiaries). If those subsidiaries are confronted with a solvency or liquidity crisis, the holding company will be legally obliged to support them.
Those structures do not only raise issues about the correct allocation of responsibilities between home and host country supervisors. They may also increase the risk of contagion in cases of liquidity or solvency crises. Therefore, there is a need for the host supervisor and central bank to co-operate more closely with the home supervisor and central bank, and to clearly defi ne the role of each authority in cases of liquidity or solvency crises, in order to enable these authorities to assume their responsibilities as regards fi nancial stability in their respective countries.
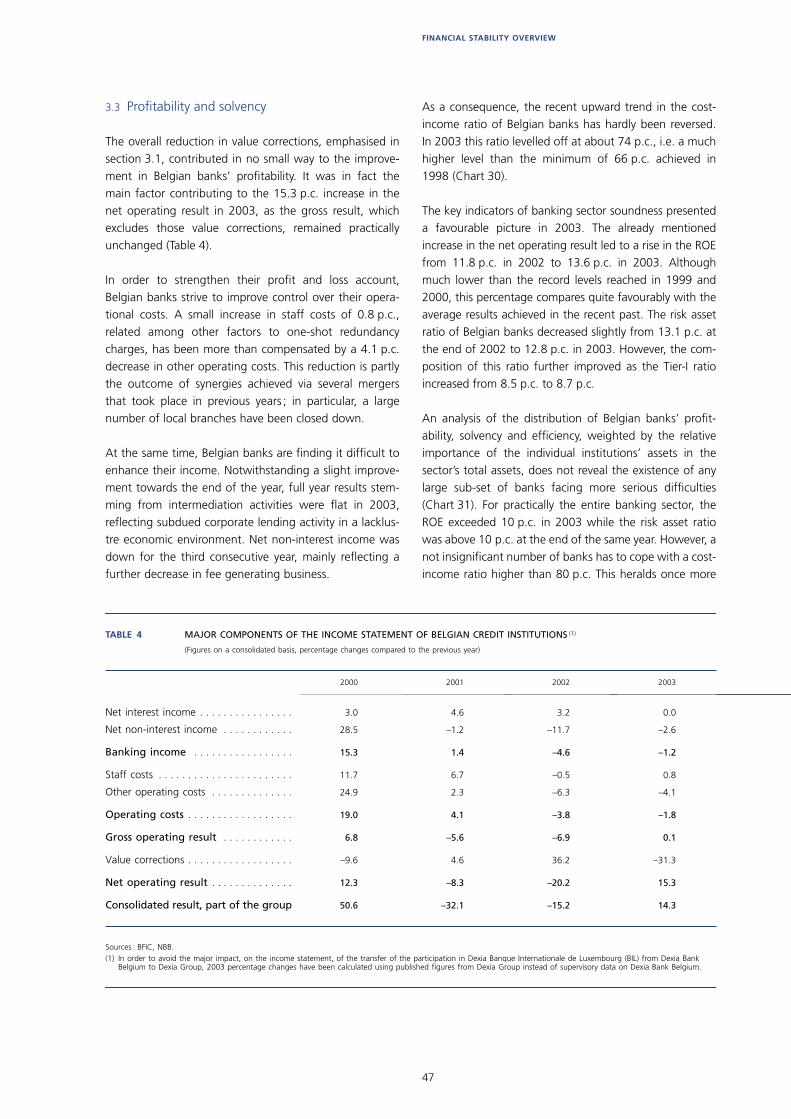
47
FINANCIAL STABILITY OVERVIEW
3.3 Profi tability and solvency
The overall reduction in value corrections, emphasised in section 3.1, contributed in no small way to the improve-ment in Belgian banks’ profi tability. It was in fact the main factor contributing to the 15.3 p.c. increase in the net operating result in 2003, as the gross result, which excludes those value corrections, remained practically unchanged (Table 4).
In order to strengthen their profi t and loss account, Belgian banks strive to improve control over their opera-tional costs. A small increase in staff costs of 0.8 p.c., related among other factors to one-shot redundancy charges, has been more than compensated by a 4.1 p.c. decrease in other operating costs. This reduction is partly the outcome of synergies achieved via several mergers that took place in previous years ; in particular, a large number of local branches have been closed down.
At the same time, Belgian banks are fi nding it diffi cult to enhance their income. Notwithstanding a slight improve-ment towards the end of the year, full year results stem-ming from intermediation activities were fl at in 2003, refl ecting subdued corporate lending activity in a lacklus-tre economic environment. Net non-interest income was down for the third consecutive year, mainly refl ecting a further decrease in fee generating business.
As a consequence, the recent upward trend in the cost-income ratio of Belgian banks has hardly been reversed. In 2003 this ratio levelled off at about 74 p.c., i.e. a much higher level than the minimum of 66 p.c. achieved in 1998 (Chart 30).
The key indicators of banking sector soundness presented a favourable picture in 2003. The already mentioned increase in the net operating result led to a rise in the ROE from 11.8 p.c. in 2002 to 13.6 p.c. in 2003. Although much lower than the record levels reached in 1999 and 2000, this percentage compares quite favourably with the average results achieved in the recent past. The risk asset ratio of Belgian banks decreased slightly from 13.1 p.c. at the end of 2002 to 12.8 p.c. in 2003. However, the com-position of this ratio further improved as the Tier-I ratio increased from 8.5 p.c. to 8.7 p.c.
An analysis of the distribution of Belgian banks’ profi t-ability, solvency and effi ciency, weighted by the relative importance of the individual institutions’ assets in the sector’s total assets, does not reveal the existence of any large sub-set of banks facing more serious diffi culties (Chart 31). For practically the entire banking sector, the ROE exceeded 10 p.c. in 2003 while the risk asset ratio was above 10 p.c. at the end of the same year. However, a not insignifi cant number of banks has to cope with a cost-income ratio higher than 80 p.c. This heralds once more
TABLE 4 MAJOR COMPONENTS OF THE INCOME STATEMENT OF BELGIAN CREDIT INSTITUTIONS (1)
(Figures on a consolidated basis, percentage changes compared to the previous year)
Sources : BFIC, NBB.(1) In order to avoid the major impact, on the income statement, of the transfer of the participation in Dexia Banque Internationale de Luxembourg (BIL) from Dexia Bank
Belgium to Dexia Group, 2003 percentage changes have been calculated using published figures from Dexia Group instead of supervisory data on Dexia Bank Belgium.
2000 2001 2002 2003
Net interest income . . . . . . . . . . . . . . . . 3.0 4.6 3.2 0.0
Net non-interest income . . . . . . . . . . . . 28.5 –1.2 –11.7 –2.6
Banking income . . . . . . . . . . . . . . . . . 15.3 1.4 –4.6 –1.2
Staff costs . . . . . . . . . . . . . . . . . . . . . . . 11.7 6.7 –0.5 0.8
Other operating costs . . . . . . . . . . . . . . 24.9 2.3 –6.3 –4.1
Operating costs . . . . . . . . . . . . . . . . . . 19.0 4.1 –3.8 –1.8
Gross operating result . . . . . . . . . . . . 6.8 –5.6 –6.9 0.1
Value corrections . . . . . . . . . . . . . . . . . . –9.6 4.6 36.2 –31.3
Net operating result . . . . . . . . . . . . . . 12.3 –8.3 –20.2 15.3
Consolidated result, part of the group 50.6 –32.1 –15.2 14.3
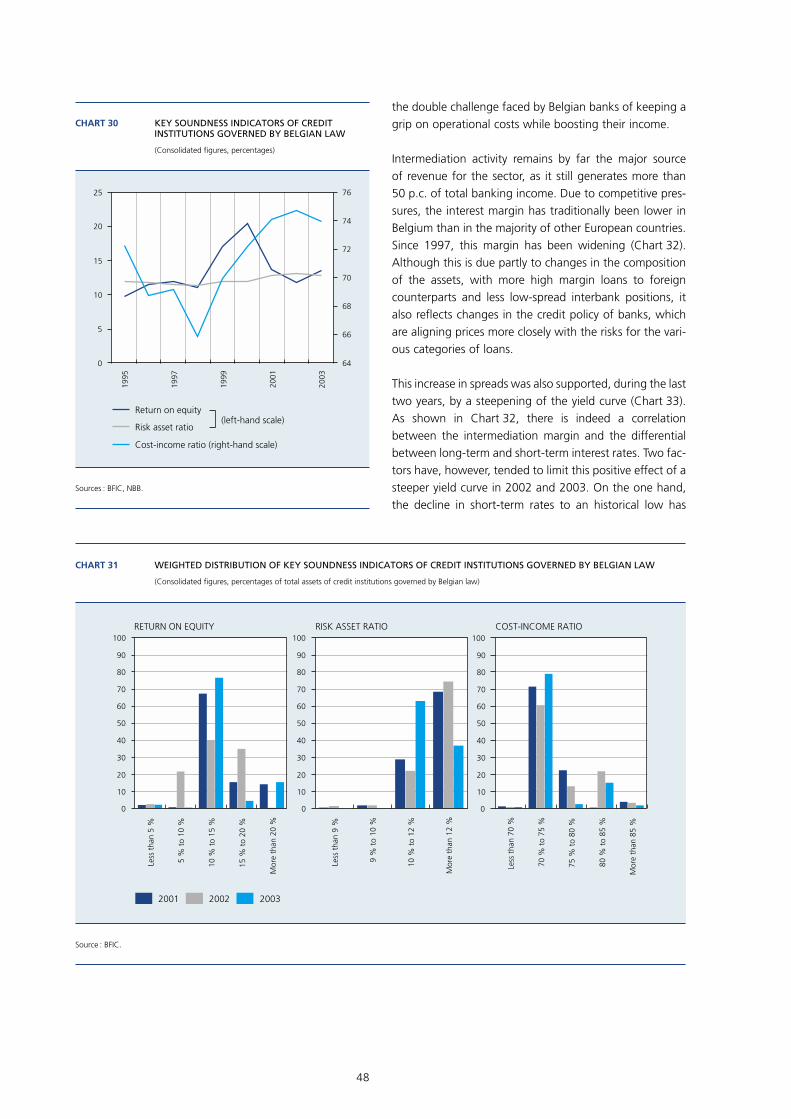
48
the double challenge faced by Belgian banks of keeping a grip on operational costs while boosting their income.
Intermediation activity remains by far the major source of revenue for the sector, as it still generates more than 50 p.c. of total banking income. Due to competitive pres-sures, the interest margin has traditionally been lower in Belgium than in the majority of other European countries. Since 1997, this margin has been widening (Chart 32). Although this is due partly to changes in the composition of the assets, with more high margin loans to foreign counterparts and less low-spread interbank positions, it also refl ects changes in the credit policy of banks, which are aligning prices more closely with the risks for the vari-ous categories of loans.
This increase in spreads was also supported, during the last two years, by a steepening of the yield curve (Chart 33). As shown in Chart 32, there is indeed a correlation between the intermediation margin and the differential between long-term and short-term interest rates. Two fac-tors have, however, tended to limit this positive effect of a steeper yield curve in 2002 and 2003. On the one hand, the decline in short-term rates to an historical low has
1995
1997
1999
2001
2003
0
5
10
15
20
25
64
66
68
70
72
74
76
CHART 30 KEY SOUNDNESS INDICATORS OF CREDIT INSTITUTIONS GOVERNED BY BELGIAN LAW
(Consolidated figures, percentages)
Sources : BFIC, NBB.
Return on equity
Risk asset ratio
Cost-income ratio (right-hand scale)
(left-hand scale)
0
10
20
30
40
50
60
70
80
90
100
0
10
20
30
40
50
60
70
80
90
100
0
10
20
30
40
50
60
70
80
90
100
2001 2002 2003
CHART 31 WEIGHTED DISTRIBUTION OF KEY SOUNDNESS INDICATORS OF CREDIT INSTITUTIONS GOVERNED BY BELGIAN LAW
(Consolidated figures, percentages of total assets of credit institutions governed by Belgian law)
Source : BFIC.
Less
tha
n 70
%
70 %
to
75 %
75 %
to
80 %
80 %
to
85 %
Mor
e th
an 8
5 %
Less
tha
n 9
%
9 %
to
10 %
10 %
to
12 %
Mor
e th
an 1
2 %
RETURN ON EQUITY RISK ASSET RATIO COST-INCOME RATIO
Less
tha
n 5
%
5 %
to
10 %
10 %
to
15 %
15 %
to
20 %
Mor
e th
an 2
0 %
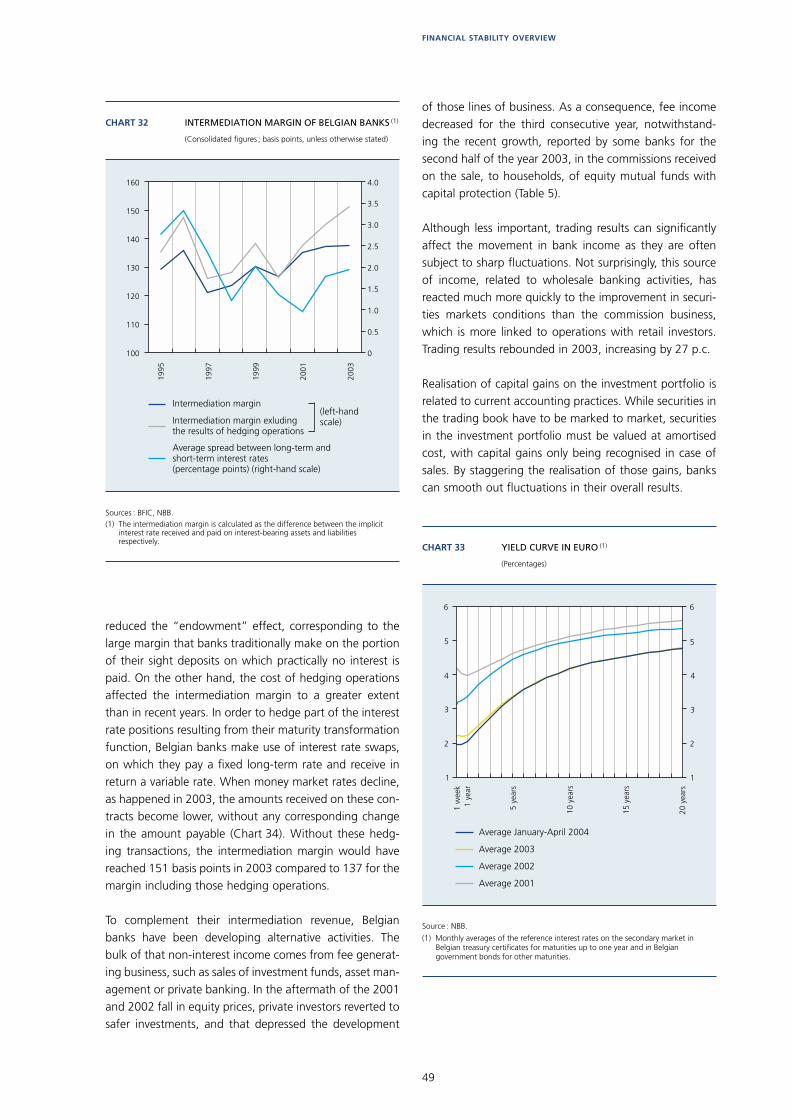
49
FINANCIAL STABILITY OVERVIEW
1995
1997
1999
2001
2003
100
110
120
130
140
150
160 4.0
3.5
3.0
2.5
2.0
1.5
1.0
0.5
0
Intermediation margin
Intermediation margin exluding the results of hedging operations
(left-hand scale)
Average spread between long-term and short-term interest rates (percentage points) (right-hand scale)
CHART 32 INTERMEDIATION MARGIN OF BELGIAN BANKS (1)
(Consolidated figures ; basis points, unless otherwise stated)
Sources : BFIC, NBB.(1) The intermediation margin is calculated as the difference between the implicit
interest rate received and paid on interest-bearing assets and liabilities respectively.
1
2
3
4
5
6
1
2
3
4
5
6
1 w
eek
1 ye
ar
5 ye
ars
10 y
ears
15 y
ears
20 y
ears
Average January-April 2004
Average 2003
Average 2002
Average 2001
CHART 33 YIELD CURVE IN EURO (1)
(Percentages)
Source : NBB.
(1) Monthly averages of the reference interest rates on the secondary market in Belgian treasury certificates for maturities up to one year and in Belgian government bonds for other maturities.
reduced the “endowment” effect, corresponding to the large margin that banks traditionally make on the portion of their sight deposits on which practically no interest is paid. On the other hand, the cost of hedging operations affected the intermediation margin to a greater extent than in recent years. In order to hedge part of the interest rate positions resulting from their maturity transformation function, Belgian banks make use of interest rate swaps, on which they pay a fi xed long-term rate and receive in return a variable rate. When money market rates decline, as happened in 2003, the amounts received on these con-tracts become lower, without any corresponding change in the amount payable (Chart 34). Without these hedg-ing transactions, the intermediation margin would have reached 151 basis points in 2003 compared to 137 for the margin including those hedging operations.
To complement their intermediation revenue, Belgian banks have been developing alternative activities. The bulk of that non-interest income comes from fee generat-ing business, such as sales of investment funds, asset man-agement or private banking. In the aftermath of the 2001 and 2002 fall in equity prices, private investors reverted to safer investments, and that depressed the development
of those lines of business. As a consequence, fee income decreased for the third consecutive year, notwithstand-ing the recent growth, reported by some banks for the second half of the year 2003, in the commissions received on the sale, to households, of equity mutual funds with capital protection (Table 5).
Although less important, trading results can signifi cantly affect the movement in bank income as they are often subject to sharp fl uctuations. Not surprisingly, this source of income, related to wholesale banking activities, has reacted much more quickly to the improvement in securi-ties markets conditions than the commission business, which is more linked to operations with retail investors. Trading results rebounded in 2003, increasing by 27 p.c.
Realisation of capital gains on the investment portfolio is related to current accounting practices. While securities in the trading book have to be marked to market, securities in the investment portfolio must be valued at amortised cost, with capital gains only being recognised in case of sales. By staggering the realisation of those gains, banks can smooth out fl uctuations in their overall results.
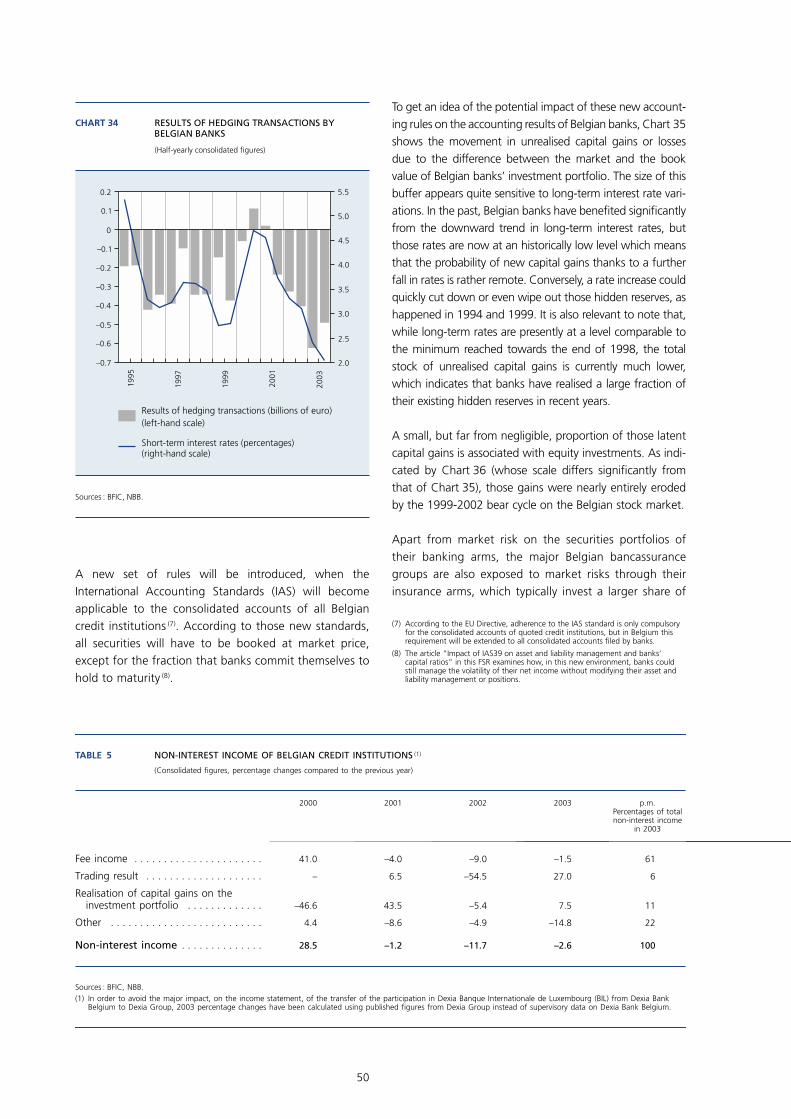
50
A new set of rules will be introduced, when the International Accounting Standards (IAS) will become applicable to the consolidated accounts of all Belgian credit institutions (7). According to those new standards, all securities will have to be booked at market price, except for the fraction that banks commit themselves to hold to maturity (8).
1995
1997
1999
2001
2003
0
0.2
0.1
–0.1
–0.2
–0.3
–0.4
–0.5
–0.6
–0.7
5.5
5.0
4.5
4.0
3.5
3.0
2.5
2.0
Results of hedging transactions (billions of euro)(left-hand scale)
Short-term interest rates (percentages)(right-hand scale)
CHART 34 RESULTS OF HEDGING TRANSACTIONS BY BELGIAN BANKS
(Half-yearly consolidated figures)
Sources : BFIC, NBB.
TABLE 5 NON-INTEREST INCOME OF BELGIAN CREDIT INSTITUTIONS (1)
(Consolidated figures, percentage changes compared to the previous year)
Sources : BFIC, NBB.(1) In order to avoid the major impact, on the income statement, of the transfer of the participation in Dexia Banque Internationale de Luxembourg (BIL) from Dexia Bank
Belgium to Dexia Group, 2003 percentage changes have been calculated using published figures from Dexia Group instead of supervisory data on Dexia Bank Belgium.
2000 2001 2002 2003 p.m.Percentages of total non-interest income
in 2003
Fee income . . . . . . . . . . . . . . . . . . . . . . 41.0 –4.0 –9.0 –1.5 61
Trading result . . . . . . . . . . . . . . . . . . . . – 6.5 –54.5 27.0 6
Realisation of capital gains on the investment portfolio . . . . . . . . . . . . . –46.6 43.5 –5.4 7.5 11
Other . . . . . . . . . . . . . . . . . . . . . . . . . . 4.4 –8.6 –4.9 –14.8 22
Non-interest income . . . . . . . . . . . . . . 28.5 –1.2 –11.7 –2.6 100
(7) According to the EU Directive, adherence to the IAS standard is only compulsory for the consolidated accounts of quoted credit institutions, but in Belgium this requirement will be extended to all consolidated accounts fi led by banks.
(8) The article “Impact of IAS39 on asset and liability management and banks’ capital ratios” in this FSR examines how, in this new environment, banks could still manage the volatility of their net income without modifying their asset and liability management or positions.
To get an idea of the potential impact of these new account-ing rules on the accounting results of Belgian banks, Chart 35 shows the movement in unrealised capital gains or losses due to the difference between the market and the book value of Belgian banks’ investment portfolio. The size of this buffer appears quite sensitive to long-term interest rate vari-ations. In the past, Belgian banks have benefi ted signifi cantly from the downward trend in long-term interest rates, but those rates are now at an historically low level which means that the probability of new capital gains thanks to a further fall in rates is rather remote. Conversely, a rate increase could quickly cut down or even wipe out those hidden reserves, as happened in 1994 and 1999. It is also relevant to note that, while long-term rates are presently at a level comparable to the minimum reached towards the end of 1998, the total stock of unrealised capital gains is currently much lower, which indicates that banks have realised a large fraction of their existing hidden reserves in recent years.
A small, but far from negligible, proportion of those latent capital gains is associated with equity investments. As indi-cated by Chart 36 (whose scale differs signifi cantly from that of Chart 35), those gains were nearly entirely eroded by the 1999-2002 bear cycle on the Belgian stock market.
Apart from market risk on the securities portfolios of their banking arms, the major Belgian bancassurance groups are also exposed to market risks through their insurance arms, which typically invest a larger share of
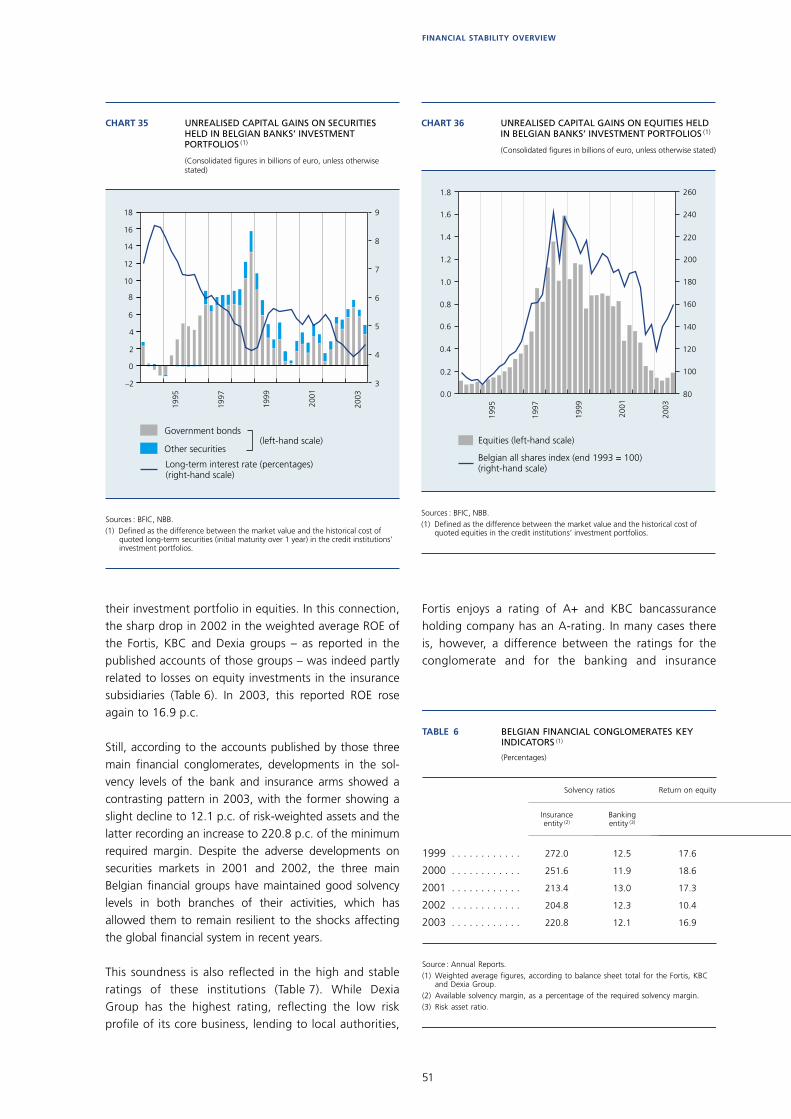
51
FINANCIAL STABILITY OVERVIEW
their investment portfolio in equities. In this connection, the sharp drop in 2002 in the weighted average ROE of the Fortis, KBC and Dexia groups – as reported in the published accounts of those groups – was indeed partly related to losses on equity investments in the insurance subsidiaries (Table 6). In 2003, this reported ROE rose again to 16.9 p.c.
Still, according to the accounts published by those three main fi nancial conglomerates, developments in the sol-vency levels of the bank and insurance arms showed a contrasting pattern in 2003, with the former showing a slight decline to 12.1 p.c. of risk-weighted assets and the latter recording an increase to 220.8 p.c. of the minimum required margin. Despite the adverse developments on securities markets in 2001 and 2002, the three main Belgian fi nancial groups have maintained good solvency levels in both branches of their activities, which has allowed them to remain resilient to the shocks affecting the global fi nancial system in recent years.
This soundness is also refl ected in the high and stable ratings of these institutions (Table 7). While Dexia Group has the highest rating, refl ecting the low risk profi le of its core business, lending to local authorities,
Fortis enjoys a rating of A+ and KBC bancassurance holding company has an A-rating. In many cases there is, however, a difference between the ratings for the conglomerate and for the banking and insurance
–2
0
2
4
6
8
10
12
14
16
18
3
4
5
6
7
8
9
1995
1997
1999
2001
2003
CHART 35 UNREALISED CAPITAL GAINS ON SECURITIES HELD IN BELGIAN BANKS’ INVESTMENT PORTFOLIOS (1)
(Consolidated figures in billions of euro, unless otherwise stated)
Sources : BFIC, NBB.(1) Defined as the difference between the market value and the historical cost of
quoted long-term securities (initial maturity over 1 year) in the credit institutions’ investment portfolios.
Government bonds
Other securities(left-hand scale)
Long-term interest rate (percentages) (right-hand scale)
80
100
120
140
160
180
200
220
240
260
1995
1997
1999
2001
2003
1.8
1.6
1.4
1.2
1.0
0.8
0.6
0.4
0.2
0.0
CHART 36 UNREALISED CAPITAL GAINS ON EQUITIES HELD IN BELGIAN BANKS’ INVESTMENT PORTFOLIOS (1)
(Consolidated figures in billions of euro, unless otherwise stated)
Sources : BFIC, NBB.(1) Defined as the difference between the market value and the historical cost of
quoted equities in the credit institutions’ investment portfolios.
Equities (left-hand scale)
Belgian all shares index (end 1993 = 100) (right-hand scale)
TABLE 6 BELGIAN FINANCIAL CONGLOMERATES KEY INDICATORS (1)
(Percentages)
Source : Annual Reports.(1) Weighted average figures, according to balance sheet total for the Fortis, KBC
and Dexia Group.(2) Available solvency margin, as a percentage of the required solvency margin.(3) Risk asset ratio.
Solvency ratios Return on equity
Insuranceentity (2)
Bankingentity (3)
1999 . . . . . . . . . . . . 272.0 12.5 17.6
2000 . . . . . . . . . . . . 251.6 11.9 18.6
2001 . . . . . . . . . . . . 213.4 13.0 17.3
2002 . . . . . . . . . . . . 204.8 12.3 10.4
2003 . . . . . . . . . . . . 220.8 12.1 16.9

52
4. Insurance companies
While fi nancial stability analyses have traditionally focused on credit institutions, not least because of their central role in the payment system, problems in insurance companies can also have systemic implications. Indeed, as insurance compa-nies are one of the major players on fi nancial markets, dif-fi culties in this sector have the potential to infl uence market conditions and signifi cantly affect other market participants. This channel of contagion adds up to existing links between insurance companies and banks, which is a particularly rel-evant issue in the case of Belgium, where the major fi nancial groups, and a number of others, are combining banking and insurance activities. The insurance arms of these bancassur-ance groups are typically active in both life and non-life insurance, and thus belong to the group of mixed insurance companies that dominate the Belgian insurance market in terms of total assets, notwithstanding their relatively limited number in comparison with that of companies specialising either in life or in non-life insurance (Chart 37) (10).
(9) FitchRatings : Criteria Report “Bancassurance rating criteria” August 2002.
(10) It may be recalled in this connection that since 1975, newly incorporated insurance companies are no longer allowed to combine life and non-life activities, while mixed insurance companies that existed at that time were allowed to continue to pursue both activities.
CHART 37 STRUCTURE OF THE BELGIAN INSURANCE MARKET BY INSURANCE COMPANIES’ SPECIALISATION
(Percentages ; data at the end of 2003)
Sources : BFIC, NBB.
SHARE IN THE SECTOR’S TOTAL ASSETS
16.4 p.c.
67.2 p.c.
16.4 p.c.
Life insurance Non-life insurance Life and non-life insurance
10.7 p.c.
11.5 p.c.
77.8 p.c.
SHARE IN THE NUMBER OF COMPANIES
TABLE 7 BELGIAN FINANCIAL CONGLOMERATES’ RATINGS
Sources : FitchRatings, Moody’s, Standard & Poors.
Moody’s S&P Fitch
Dexia Group . . . . . . . . . . . . . . . Aa2 AA AA+
Dexia bank . . . . . . . . . . . . . . Aa2 AA AA+
KBC Holding company . . . . . . . – A A+
KBC Bank . . . . . . . . . . . . . . . Aa3 A AA–
KBC Insurance . . . . . . . . . . . . – A+ AA
Fortis Group . . . . . . . . . . . . . . . A1 A+ A+
Fortis Bank . . . . . . . . . . . . . . . Aa3 AA– AA–
Fortis Insurance . . . . . . . . . . . – – –
subsidiaries, the former generally having a lower rating than the banking and insurance daughter companies. Rating agencies tend to rate the ultimate holding company one notch below the operating subsidiary to refl ect the fact that, in liquidation, the former is usually not supported (9).
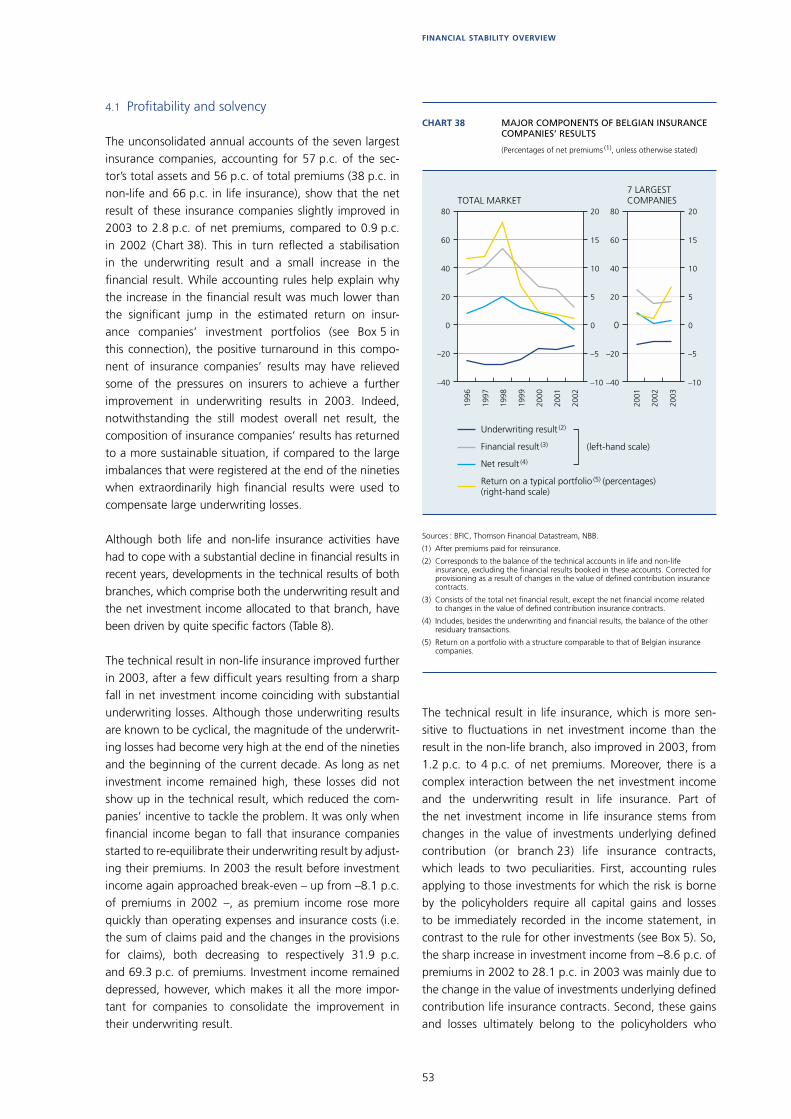
53
FINANCIAL STABILITY OVERVIEW
4.1 Profi tability and solvency
The unconsolidated annual accounts of the seven largest insurance companies, accounting for 57 p.c. of the sec-tor’s total assets and 56 p.c. of total premiums (38 p.c. in non-life and 66 p.c. in life insurance), show that the net result of these insurance companies slightly improved in 2003 to 2.8 p.c. of net premiums, compared to 0.9 p.c. in 2002 (Chart 38). This in turn refl ected a stabilisation in the underwriting result and a small increase in the fi nancial result. While accounting rules help explain why the increase in the fi nancial result was much lower than the signifi cant jump in the estimated return on insur-ance companies’ investment portfolios (see Box 5 in this connection), the positive turnaround in this compo-nent of insurance companies’ results may have relieved some of the pressures on insurers to achieve a further improvement in underwriting results in 2003. Indeed, notwithstanding the still modest overall net result, the composition of insurance companies’ results has returned to a more sustainable situation, if compared to the large imbalances that were registered at the end of the nineties when extraordinarily high fi nancial results were used to compensate large underwriting losses.
Although both life and non-life insurance activities have had to cope with a substantial decline in fi nancial results in recent years, developments in the technical results of both branches, which comprise both the underwriting result and the net investment income allocated to that branch, have been driven by quite specifi c factors (Table 8).
The technical result in non-life insurance improved further in 2003, after a few diffi cult years resulting from a sharp fall in net investment income coinciding with substantial underwriting losses. Although those underwriting results are known to be cyclical, the magnitude of the underwrit-ing losses had become very high at the end of the nineties and the beginning of the current decade. As long as net investment income remained high, these losses did not show up in the technical result, which reduced the com-panies’ incentive to tackle the problem. It was only when fi nancial income began to fall that insurance companies started to re-equilibrate their underwriting result by adjust-ing their premiums. In 2003 the result before investment income again approached break-even – up from –8.1 p.c. of premiums in 2002 –, as premium income rose more quickly than operating expenses and insurance costs (i.e. the sum of claims paid and the changes in the provisions for claims), both decreasing to respectively 31.9 p.c. and 69.3 p.c. of premiums. Investment income remained depressed, however, which makes it all the more impor-tant for companies to consolidate the improvement in their underwriting result.
The technical result in life insurance, which is more sen-sitive to fl uctuations in net investment income than the result in the non-life branch, also improved in 2003, from 1.2 p.c. to 4 p.c. of net premiums. Moreover, there is a complex interaction between the net investment income and the underwriting result in life insurance. Part of the net investment income in life insurance stems from changes in the value of investments underlying defi ned contribution (or branch 23) life insurance contracts, which leads to two peculiarities. First, accounting rules applying to those investments for which the risk is borne by the policyholders require all capital gains and losses to be immediately recorded in the income statement, in contrast to the rule for other investments (see Box 5). So, the sharp increase in investment income from –8.6 p.c. of premiums in 2002 to 28.1 p.c. in 2003 was mainly due to the change in the value of investments underlying defi ned contribution life insurance contracts. Second, these gains and losses ultimately belong to the policyholders who
1996
1997
1998
1999
2000
2001
2002
–40
–20
0
20
40
60
80
–10
–5
0
5
10
15
20
2001
2002
2003
–40
–20
0
20
40
60
80
–10
–5
0
5
10
15
20
CHART 38 MAJOR COMPONENTS OF BELGIAN INSURANCE COMPANIES’ RESULTS
(Percentages of net premiums (1), unless otherwise stated)
Sources : BFIC, Thomson Financial Datastream, NBB.
(1) After premiums paid for reinsurance.
(2) Corresponds to the balance of the technical accounts in life and non-life insurance, excluding the financial results booked in these accounts. Corrected for provisioning as a result of changes in the value of defined contribution insurance contracts.
(3) Consists of the total net financial result, except the net financial income related to changes in the value of defined contribution insurance contracts.
(4) Includes, besides the underwriting and financial results, the balance of the other residuary transactions.
(5) Return on a portfolio with a structure comparable to that of Belgian insurance companies.
TOTAL MARKET
Underwriting result (2)
Financial result (3)
Net result (4)
Return on a typical portfolio (5) (percentages)
(right-hand scale)
7 LARGESTCOMPANIES
(left-hand scale)
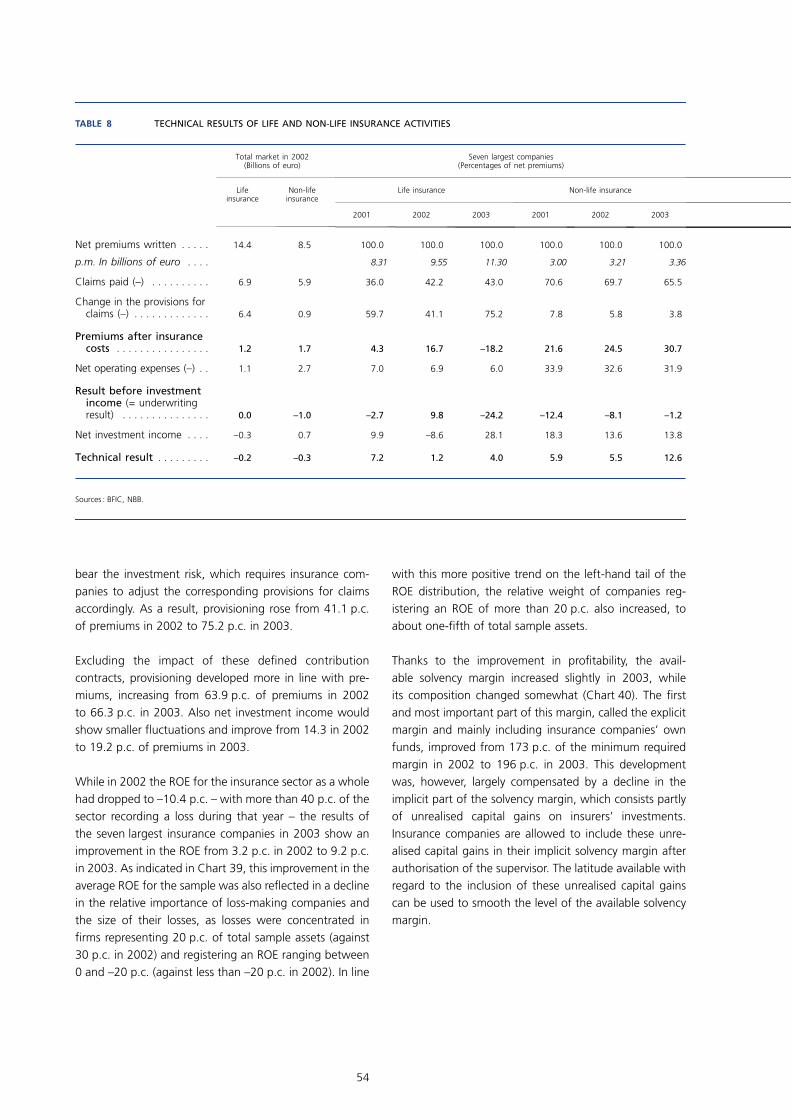
54
bear the investment risk, which requires insurance com-panies to adjust the corresponding provisions for claims accordingly. As a result, provisioning rose from 41.1 p.c. of premiums in 2002 to 75.2 p.c. in 2003.
Excluding the impact of these defi ned contribution contracts, provisioning developed more in line with pre-miums, increasing from 63.9 p.c. of premiums in 2002 to 66.3 p.c. in 2003. Also net investment income would show smaller fl uctuations and improve from 14.3 in 2002 to 19.2 p.c. of premiums in 2003.
While in 2002 the ROE for the insurance sector as a whole had dropped to –10.4 p.c. – with more than 40 p.c. of the sector recording a loss during that year – the results of the seven largest insurance companies in 2003 show an improvement in the ROE from 3.2 p.c. in 2002 to 9.2 p.c. in 2003. As indicated in Chart 39, this improvement in the average ROE for the sample was also refl ected in a decline in the relative importance of loss-making companies and the size of their losses, as losses were concentrated in fi rms representing 20 p.c. of total sample assets (against 30 p.c. in 2002) and registering an ROE ranging between 0 and –20 p.c. (against less than –20 p.c. in 2002). In line
with this more positive trend on the left-hand tail of the ROE distribution, the relative weight of companies reg-istering an ROE of more than 20 p.c. also increased, to about one-fi fth of total sample assets.
Thanks to the improvement in profi tability, the avail-able solvency margin increased slightly in 2003, while its composition changed somewhat (Chart 40). The fi rst and most important part of this margin, called the explicit margin and mainly including insurance companies’ own funds, improved from 173 p.c. of the minimum required margin in 2002 to 196 p.c. in 2003. This development was, however, largely compensated by a decline in the implicit part of the solvency margin, which consists partly of unrealised capital gains on insurers’ investments. Insurance companies are allowed to include these unre-alised capital gains in their implicit solvency margin after authorisation of the supervisor. The latitude available with regard to the inclusion of these unrealised capital gains can be used to smooth the level of the available solvency margin.
TABLE 8 TECHNICAL RESULTS OF LIFE AND NON-LIFE INSURANCE ACTIVITIES
Sources : BFIC, NBB.
Total market in 2002 (Billions of euro)
Seven largest companies (Percentages of net premiums)
Lifeinsurance
Non-lifeinsurance
Life insurance Non-life insurance
2001 2002 2003 2001 2002 2003
Net premiums written . . . . . 14.4 8.5 100.0 100.0 100.0 100.0 100.0 100.0
p.m. In billions of euro . . . . 8.31 9.55 11.30 3.00 3.21 3.36
Claims paid (–) . . . . . . . . . . 6.9 5.9 36.0 42.2 43.0 70.6 69.7 65.5
Change in the provisions for claims (–) . . . . . . . . . . . . . 6.4 0.9 59.7 41.1 75.2 7.8 5.8 3.8
Premiums after insurance costs . . . . . . . . . . . . . . . . 1.2 1.7 4.3 16.7 –18.2 21.6 24.5 30.7
Net operating expenses (–) . . 1.1 2.7 7.0 6.9 6.0 33.9 32.6 31.9
Result before investment income (= underwriting result) . . . . . . . . . . . . . . . 0.0 –1.0 –2.7 9.8 –24.2 –12.4 –8.1 –1.2
Net investment income . . . . –0.3 0.7 9.9 –8.6 28.1 18.3 13.6 13.8
Technical result . . . . . . . . . –0.2 –0.3 7.2 1.2 4.0 5.9 5.5 12.6
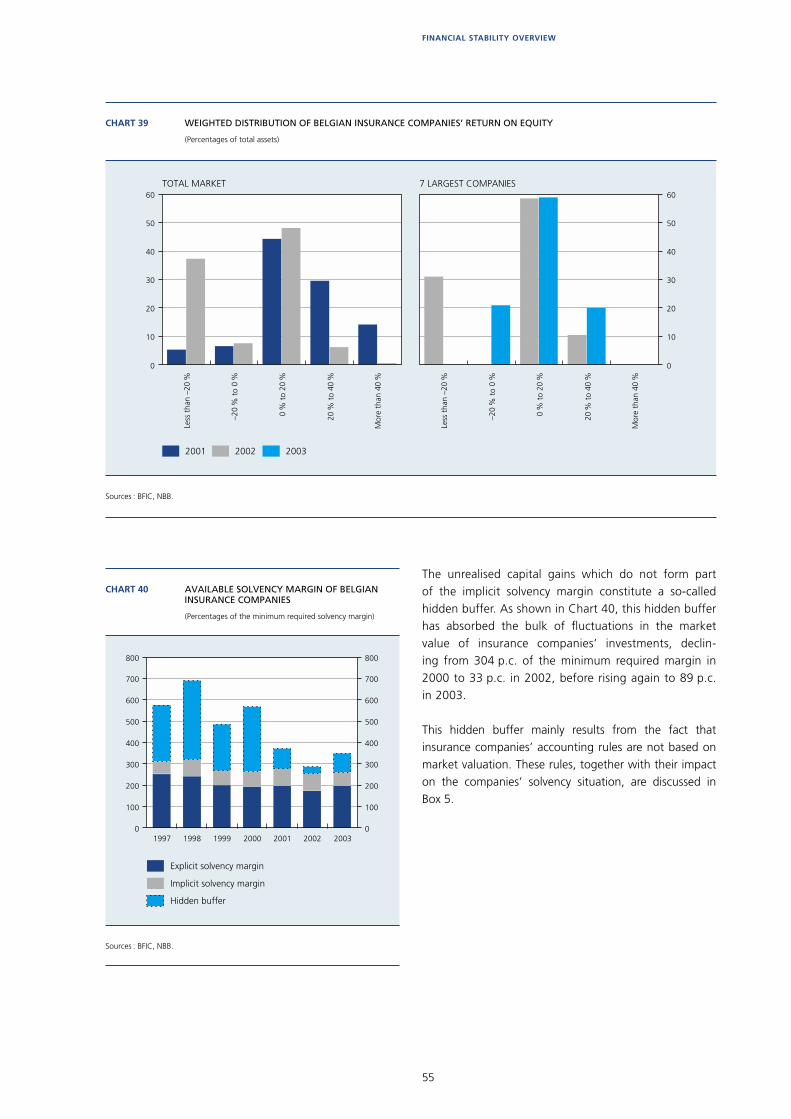
55
FINANCIAL STABILITY OVERVIEW
0
10
20
30
40
50
60
0
10
20
30
40
50
60
2002 20032001
CHART 39 WEIGHTED DISTRIBUTION OF BELGIAN INSURANCE COMPANIES’ RETURN ON EQUITY
(Percentages of total assets)
Sources : BFIC, NBB.
Less
tha
n –2
0 %
–20
% t
o 0
%
0 %
to
20 %
20 %
to
40 %
Mor
e th
an 4
0 %
TOTAL MARKET
Less
tha
n –2
0 %
–20
% t
o 0
%
0 %
to
20 %
20 %
to
40 %
Mor
e th
an 4
0 %
7 LARGEST COMPANIES
1997 1998 1999 2000 2001 2002 20030
100
200
300
400
500
600
700
800
0
100
200
300
400
500
600
700
800
CHART 40 AVAILABLE SOLVENCY MARGIN OF BELGIAN INSURANCE COMPANIES
(Percentages of the minimum required solvency margin)
Sources : BFIC, NBB.
Implicit solvency margin
Explicit solvency margin
Hidden buffer
The unrealised capital gains which do not form part of the implicit solvency margin constitute a so-called hidden buffer. As shown in Chart 40, this hidden buffer has absorbed the bulk of fl uctuations in the market value of insurance companies’ investments, declin-ing from 304 p.c. of the minimum required margin in 2000 to 33 p.c. in 2002, before rising again to 89 p.c. in 2003.
This hidden buffer mainly results from the fact that insurance companies’ accounting rules are not based on market valuation. These rules, together with their impact on the companies’ solvency situation, are discussed in Box 5.

56
Box 5 – Rules for the valuation of insurance companies’ investments (1)
At 87 p.c. of total assets, investments constitute by far the most important component of insurance companies’ assets. They are to a large extent the counterpart of the provisions insurance companies have on the liabilities’ side of their balance sheets, as these companies invest the premiums collected in order to be able to pay out claims the amount and/or timing of which are uncertain. In addition to this, investments are also the counterpart of insurance companies’ own funds.
On the balance sheet, these investments are recorded at their acquisition cost, corrected, under certain conditions, for unrealised capital losses or gains. However, the method of accounting differs for capital losses and gains on the one hand and for bonds and equities on the other hand.
While the recording of unrealised capital losses leads to a cost in the profi t and loss account, the recording of unrealised capital gains does not infl uence the result, as these are added immediately to the revaluation reserve, which is part of the company’s own funds. If market developments call for a reversal of the recorded unrealised gains or losses, the opposite entries have to be made (i.e. the recording of a revenue in case of the reversal of capital losses and deduction of the amount from the revaluation reserve in case of the reversal of capital gains).
Moreover, the conditions for the recording of unrealised capital gains and losses differ according to the type of asset. In the case of equities, insurance companies are obliged to book unrealised capital losses if these are judged to be durable, while they are allowed to book gains under the same condition. The defi nition of “durable” is left to the discretion of the company, which may lead to differences in valuation from one company to another. The rules have to be applied consistently over time, however.
In the case of fi xed income securities and receivables, unrealised capital losses only have to be recorded if they are related to credit risk (i.e. in the case of uncertainty surrounding full repayment). Capital losses as a result of interest rate increases are not recorded, except in the case of perpetuities and bonds serving as liquidity support, which constitute only a small share of the overall bond portfolio. Unrealised capital gains are never recorded.
The left-hand panel of Chart 1 summarises the differences between the market and the book value per main type of investment in p.c. of the book value. Although the latter is generally lower than the market value, the equity portfolio was overvalued in insurance companies’ accounts in 2002. Such a negative difference between the market and the book value has to be recorded either at realisation or if judged to be durable.
While the negative gap on the equity portfolio was a signifi cant percentage of the book value of this type of assets, in absolute values (–2.3 billions of euro) it was still smaller than the surplus value on the bond portfolio (3.9 billions of euro). Yet, as to the latter, the limited positive difference in terms of percentage of the value of the bond portfolio can be wiped out by even a modest swing in interest rates.
While in 1998, around 70 p.c. of the companies, weighted by the relative size of their assets, recorded a positive difference of more than 15 p.c. between the market and book value of their investments, in 2002 no company recorded such a large difference, while more than 10 p.c. of the market had to cope with a negative gap (right-hand panel of Chart 1). 60 p.c. of the market registered a small positive difference of between 0 and 5 p.c.
The valuation rules discussed above also have an impact on the level and composition of insurance companies’ reported solvency margin. While unrealised capital gains and losses recorded on the balance sheet feed into the explicit margin via the retained earnings (in the case of capital losses) or via the revaluation reserve (in the case of
(1) The rules described in this box apply to all investments of which the risks are borne by the insurance company. These exclude investments linked to defi ned contribution contracts, which are booked at market prices, with changes in the market value immediately recorded in insurance companies’ profi t and loss account and balance sheet.
!
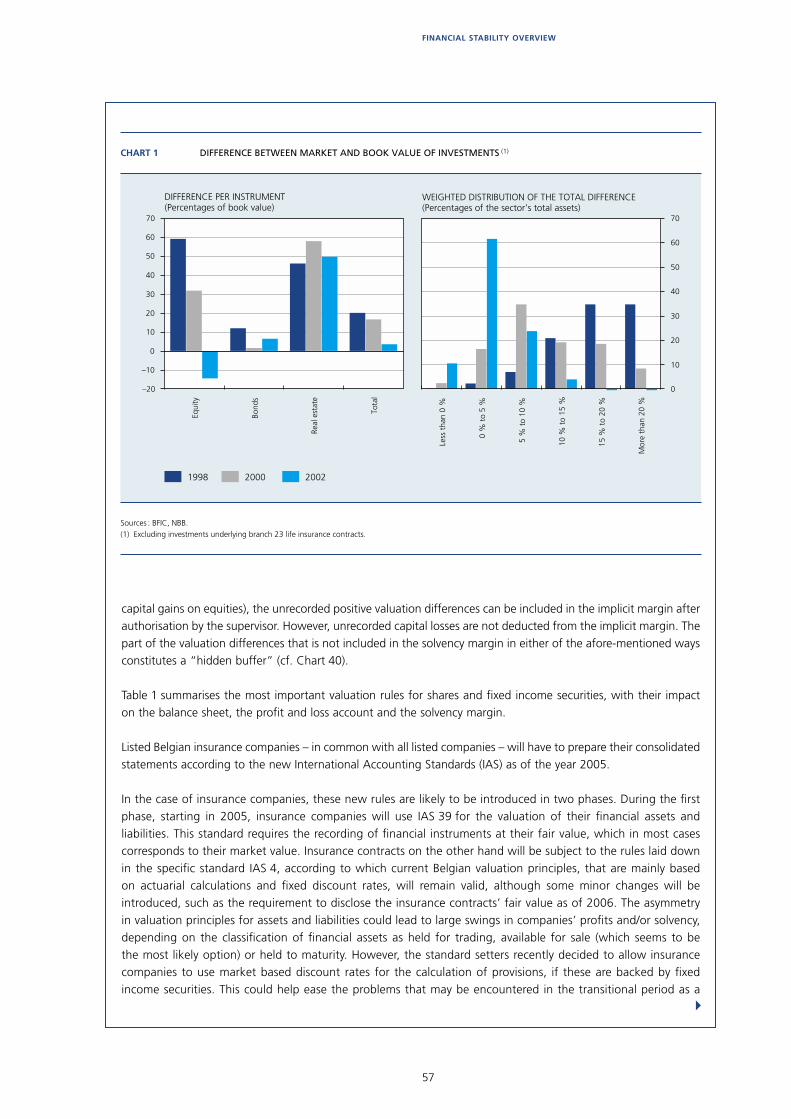
57
FINANCIAL STABILITY OVERVIEW
capital gains on equities), the unrecorded positive valuation differences can be included in the implicit margin after authorisation by the supervisor. However, unrecorded capital losses are not deducted from the implicit margin. The part of the valuation differences that is not included in the solvency margin in either of the afore-mentioned ways constitutes a “hidden buffer” (cf. Chart 40).
Table 1 summarises the most important valuation rules for shares and fi xed income securities, with their impact on the balance sheet, the profi t and loss account and the solvency margin.
Listed Belgian insurance companies – in common with all listed companies – will have to prepare their consolidated statements according to the new International Accounting Standards (IAS) as of the year 2005.
In the case of insurance companies, these new rules are likely to be introduced in two phases. During the fi rst phase, starting in 2005, insurance companies will use IAS 39 for the valuation of their fi nancial assets and liabilities. This standard requires the recording of fi nancial instruments at their fair value, which in most cases corresponds to their market value. Insurance contracts on the other hand will be subject to the rules laid down in the specifi c standard IAS 4, according to which current Belgian valuation principles, that are mainly based on actuarial calculations and fi xed discount rates, will remain valid, although some minor changes will be introduced, such as the requirement to disclose the insurance contracts’ fair value as of 2006. The asymmetry in valuation principles for assets and liabilities could lead to large swings in companies’ profi ts and/or solvency, depending on the classifi cation of fi nancial assets as held for trading, available for sale (which seems to be the most likely option) or held to maturity. However, the standard setters recently decided to allow insurance companies to use market based discount rates for the calculation of provisions, if these are backed by fi xed income securities. This could help ease the problems that may be encountered in the transitional period as a
–20
–10
0
10
20
30
40
50
60
70
1998 2000 2002
0
10
20
30
40
50
60
70
CHART 1 DIFFERENCE BETWEEN MARKET AND BOOK VALUE OF INVESTMENTS (1)
Sources : BFIC, NBB.(1) Excluding investments underlying branch 23 life insurance contracts.
Equi
ty
Bond
s
Real
est
ate
Tota
l
Less
tha
n 0
%
0 %
to
5 %
5 %
to
10 %
10 %
to
15 %
15 %
to
20 %
Mor
e th
an 2
0 %
DIFFERENCE PER INSTRUMENT(Percentages of book value)
WEIGHTED DISTRIBUTION OF THE TOTAL DIFFERENCE(Percentages of the sector’s total assets)
!
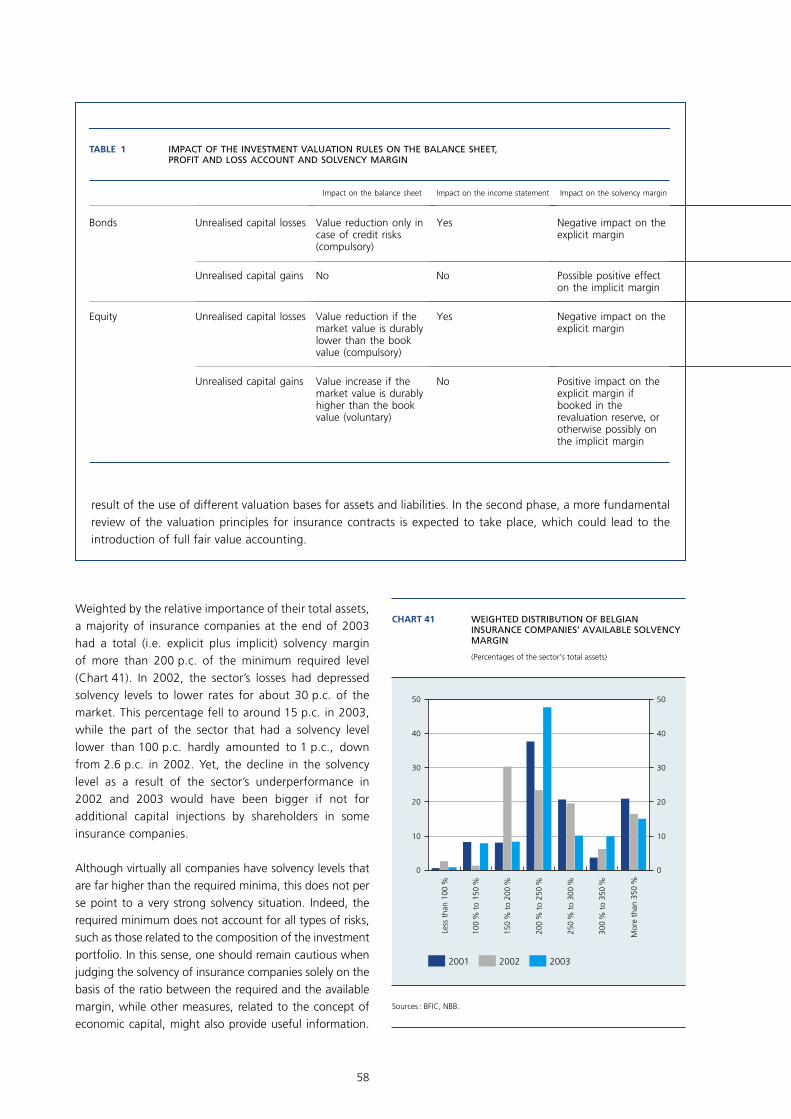
58
Weighted by the relative importance of their total assets, a majority of insurance companies at the end of 2003 had a total (i.e. explicit plus implicit) solvency margin of more than 200 p.c. of the minimum required level (Chart 41). In 2002, the sector’s losses had depressed solvency levels to lower rates for about 30 p.c. of the market. This percentage fell to around 15 p.c. in 2003, while the part of the sector that had a solvency level lower than 100 p.c. hardly amounted to 1 p.c., down from 2.6 p.c. in 2002. Yet, the decline in the solvency level as a result of the sector’s underperformance in 2002 and 2003 would have been bigger if not for additional capital injections by shareholders in some insurance companies.
Although virtually all companies have solvency levels that are far higher than the required minima, this does not per se point to a very strong solvency situation. Indeed, the required minimum does not account for all types of risks, such as those related to the composition of the investment portfolio. In this sense, one should remain cautious when judging the solvency of insurance companies solely on the basis of the ratio between the required and the available margin, while other measures, related to the concept of economic capital, might also provide useful information.
result of the use of different valuation bases for assets and liabilities. In the second phase, a more fundamental review of the valuation principles for insurance contracts is expected to take place, which could lead to the introduction of full fair value accounting.
0
10
20
30
40
50
0
10
20
30
40
50
2001 2002 2003
CHART 41 WEIGHTED DISTRIBUTION OF BELGIAN INSURANCE COMPANIES’ AVAILABLE SOLVENCY MARGIN
(Percentages of the sector’s total assets)
Sources : BFIC, NBB.
Less
tha
n 10
0 %
100
% t
o 15
0 %
150
% t
o 20
0 %
200
% t
o 25
0 %
250
% t
o 30
0 %
300
% t
o 35
0 %
Mor
e th
an 3
50 %
TABLE 1 IMPACT OF THE INVESTMENT VALUATION RULES ON THE BALANCE SHEET, PROFIT AND LOSS ACCOUNT AND SOLVENCY MARGIN
Impact on the balance sheet Impact on the income statement Impact on the solvency margin
Bonds Unrealised capital losses Value reduction only in case of credit risks (compulsory)
Yes Negative impact on the explicit margin
Unrealised capital gains No No Possible positive effect on the implicit margin
Equity Unrealised capital losses Value reduction if the market value is durably lower than the book value (compulsory)
Yes Negative impact on the explicit margin
Unrealised capital gains Value increase if the market value is durably higher than the book value (voluntary)
No Positive impact on the explicit margin if booked in the revaluation reserve, or otherwise possibly on the implicit margin
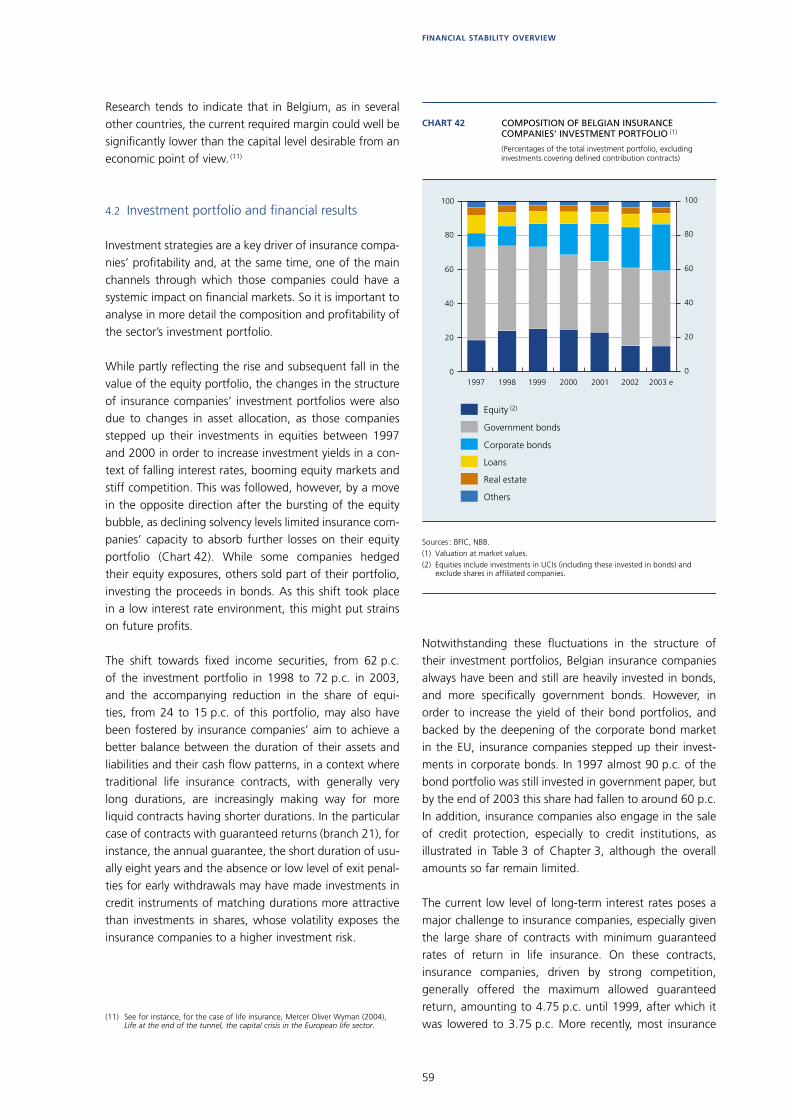
59
FINANCIAL STABILITY OVERVIEW
Research tends to indicate that in Belgium, as in several other countries, the current required margin could well be signifi cantly lower than the capital level desirable from an economic point of view. (11)
4.2 Investment portfolio and fi nancial results
Investment strategies are a key driver of insurance compa-nies’ profi tability and, at the same time, one of the main channels through which those companies could have a systemic impact on fi nancial markets. So it is important to analyse in more detail the composition and profi tability of the sector’s investment portfolio.
While partly refl ecting the rise and subsequent fall in the value of the equity portfolio, the changes in the structure of insurance companies’ investment portfolios were also due to changes in asset allocation, as those companies stepped up their investments in equities between 1997 and 2000 in order to increase investment yields in a con-text of falling interest rates, booming equity markets and stiff competition. This was followed, however, by a move in the opposite direction after the bursting of the equity bubble, as declining solvency levels limited insurance com-panies’ capacity to absorb further losses on their equity portfolio (Chart 42). While some companies hedged their equity exposures, others sold part of their portfolio, investing the proceeds in bonds. As this shift took place in a low interest rate environment, this might put strains on future profi ts.
The shift towards fi xed income securities, from 62 p.c. of the investment portfolio in 1998 to 72 p.c. in 2003, and the accompanying reduction in the share of equi-ties, from 24 to 15 p.c. of this portfolio, may also have been fostered by insurance companies’ aim to achieve a better balance between the duration of their assets and liabilities and their cash fl ow patterns, in a context where traditional life insurance contracts, with generally very long durations, are increasingly making way for more liquid contracts having shorter durations. In the particular case of contracts with guaranteed returns (branch 21), for instance, the annual guarantee, the short duration of usu-ally eight years and the absence or low level of exit penal-ties for early withdrawals may have made investments in credit instruments of matching durations more attractive than investments in shares, whose volatility exposes the insurance companies to a higher investment risk.
(11) See for instance, for the case of life insurance, Mercer Oliver Wyman (2004), Life at the end of the tunnel, the capital crisis in the European life sector.
1997 1998 1999 2000 2001 2002 2003 e 0
20
40
60
80
100
0
20
40
60
80
100
CHART 42 COMPOSITION OF BELGIAN INSURANCE COMPANIES’ INVESTMENT PORTFOLIO (1)
(Percentages of the total investment portfolio, excluding investments covering defined contribution contracts)
Sources : BFIC, NBB.(1) Valuation at market values.(2) Equities include investments in UCIs (including these invested in bonds) and
exclude shares in affiliated companies.
Others
Loans
Corporate bonds
Government bonds
Real estate
Equity (2)
Notwithstanding these fl uctuations in the structure of their investment portfolios, Belgian insurance companies always have been and still are heavily invested in bonds, and more specifi cally government bonds. However, in order to increase the yield of their bond portfolios, and backed by the deepening of the corporate bond market in the EU, insurance companies stepped up their invest-ments in corporate bonds. In 1997 almost 90 p.c. of the bond portfolio was still invested in government paper, but by the end of 2003 this share had fallen to around 60 p.c. In addition, insurance companies also engage in the sale of credit protection, especially to credit institutions, as illustrated in Table 3 of Chapter 3, although the overall amounts so far remain limited.
The current low level of long-term interest rates poses a major challenge to insurance companies, especially given the large share of contracts with minimum guaranteed rates of return in life insurance. On these contracts, insurance companies, driven by strong competition, generally offered the maximum allowed guaranteed return, amounting to 4.75 p.c. until 1999, after which it was lowered to 3.75 p.c. More recently, most insurance
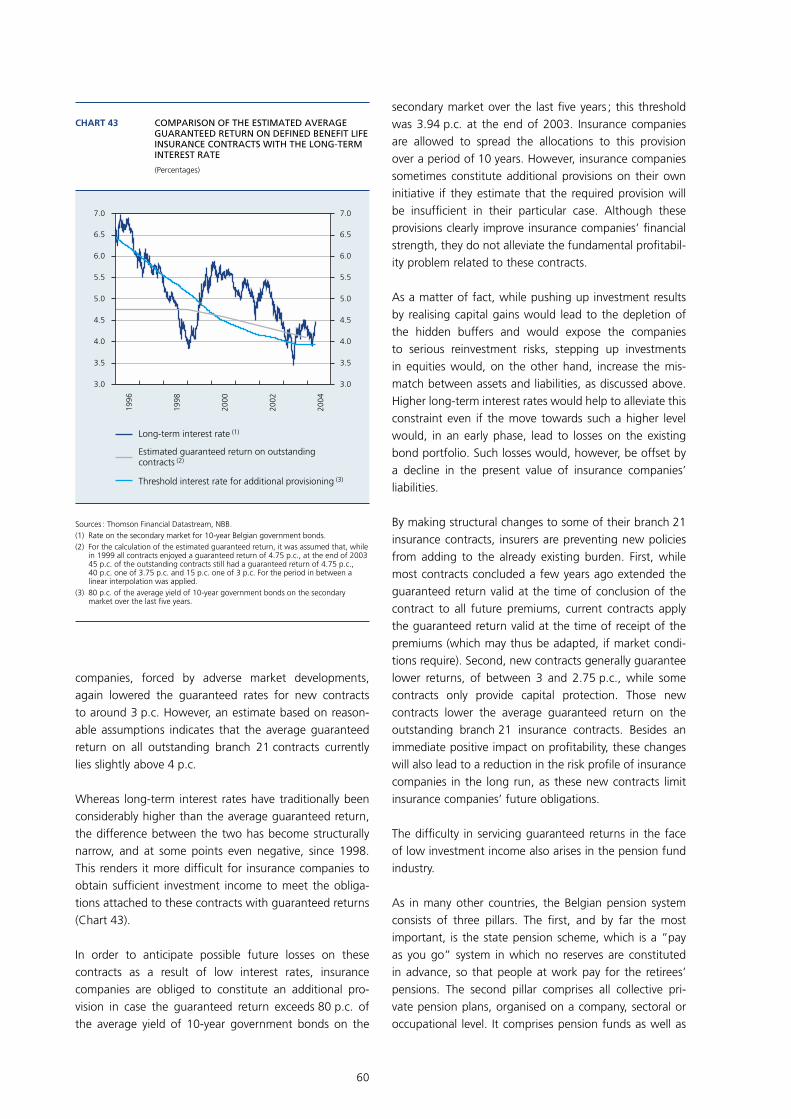
60
companies, forced by adverse market developments, again lowered the guaranteed rates for new contracts to around 3 p.c. However, an estimate based on reason-able assumptions indicates that the average guaranteed return on all outstanding branch 21 contracts currently lies slightly above 4 p.c.
Whereas long-term interest rates have traditionally been considerably higher than the average guaranteed return, the difference between the two has become structurally narrow, and at some points even negative, since 1998. This renders it more diffi cult for insurance companies to obtain suffi cient investment income to meet the obliga-tions attached to these contracts with guaranteed returns (Chart 43).
In order to anticipate possible future losses on these contracts as a result of low interest rates, insurance companies are obliged to constitute an additional pro-vision in case the guaranteed return exceeds 80 p.c. of the average yield of 10-year government bonds on the
secondary market over the last fi ve years ; this threshold was 3.94 p.c. at the end of 2003. Insurance companies are allowed to spread the allocations to this provision over a period of 10 years. However, insurance companies sometimes constitute additional provisions on their own initiative if they estimate that the required provision will be insuffi cient in their particular case. Although these provisions clearly improve insurance companies’ fi nancial strength, they do not alleviate the fundamental profi tabil-ity problem related to these contracts.
As a matter of fact, while pushing up investment results by realising capital gains would lead to the depletion of the hidden buffers and would expose the companies to serious reinvestment risks, stepping up investments in equities would, on the other hand, increase the mis-match between assets and liabilities, as discussed above. Higher long-term interest rates would help to alleviate this constraint even if the move towards such a higher level would, in an early phase, lead to losses on the existing bond portfolio. Such losses would, however, be offset by a decline in the present value of insurance companies’ liabilities.
By making structural changes to some of their branch 21 insurance contracts, insurers are preventing new policies from adding to the already existing burden. First, while most contracts concluded a few years ago extended the guaranteed return valid at the time of conclusion of the contract to all future premiums, current contracts apply the guaranteed return valid at the time of receipt of the premiums (which may thus be adapted, if market condi-tions require). Second, new contracts generally guarantee lower returns, of between 3 and 2.75 p.c., while some contracts only provide capital protection. Those new contracts lower the average guaranteed return on the outstanding branch 21 insurance contracts. Besides an immediate positive impact on profi tability, these changes will also lead to a reduction in the risk profi le of insurance companies in the long run, as these new contracts limit insurance companies’ future obligations.
The diffi culty in servicing guaranteed returns in the face of low investment income also arises in the pension fund industry.
As in many other countries, the Belgian pension system consists of three pillars. The fi rst, and by far the most important, is the state pension scheme, which is a “pay as you go” system in which no reserves are constituted in advance, so that people at work pay for the retirees’ pensions. The second pillar comprises all collective pri-vate pension plans, organised on a company, sectoral or occupational level. It comprises pension funds as well as
3.0
3.5
4.0
4.5
5.0
5.5
6.0
6.5
7.0
3.0
3.5
4.0
4.5
5.0
5.5
6.0
6.5
7.0
1996
1998
2000
2002
2004
CHART 43 COMPARISON OF THE ESTIMATED AVERAGE GUARANTEED RETURN ON DEFINED BENEFIT LIFE INSURANCE CONTRACTS WITH THE LONG-TERM INTEREST RATE
(Percentages)
Sources : Thomson Financial Datastream, NBB.(1) Rate on the secondary market for 10-year Belgian government bonds.(2) For the calculation of the estimated guaranteed return, it was assumed that, while
in 1999 all contracts enjoyed a guaranteed return of 4.75 p.c., at the end of 2003 45 p.c. of the outstanding contracts still had a guaranteed return of 4.75 p.c., 40 p.c. one of 3.75 p.c. and 15 p.c. one of 3 p.c. For the period in between a linear interpolation was applied.
(3) 80 p.c. of the average yield of 10-year government bonds on the secondary market over the last five years.
Estimated guaranteed return on outstandingcontracts (2)
Long-term interest rate (1)
Threshold interest rate for additional provisioning (3)
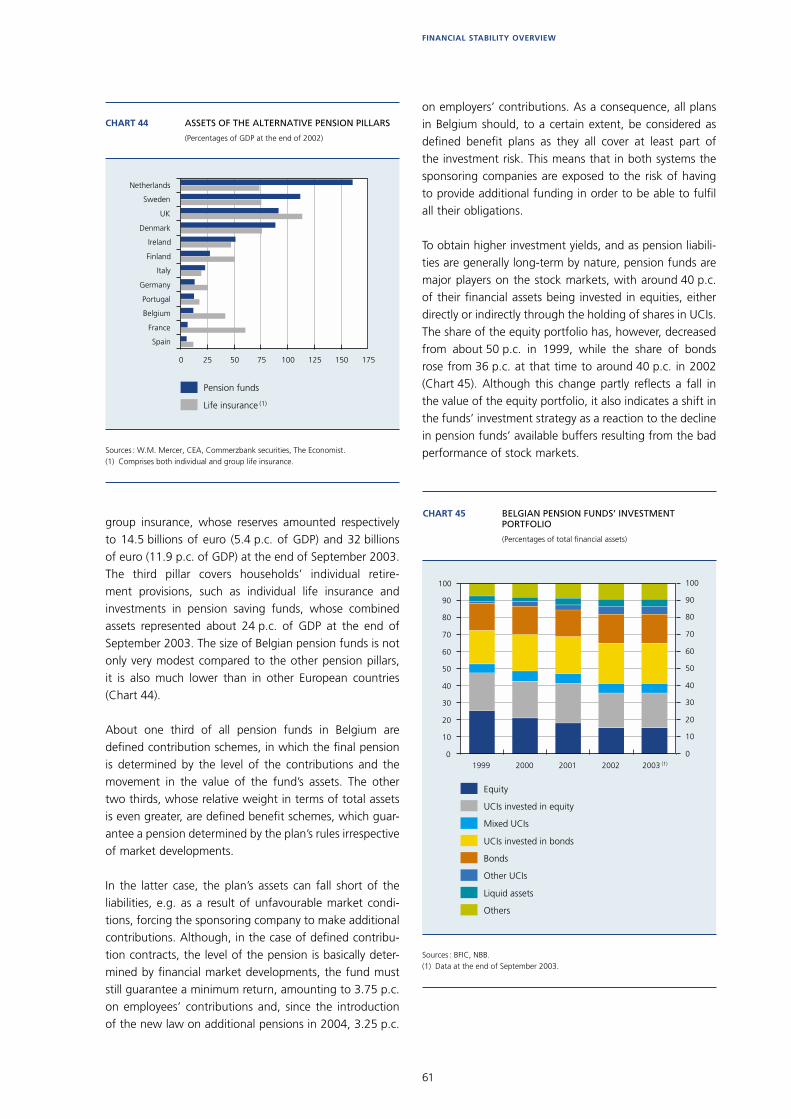
61
FINANCIAL STABILITY OVERVIEW
group insurance, whose reserves amounted respectively to 14.5 billions of euro (5.4 p.c. of GDP) and 32 billions of euro (11.9 p.c. of GDP) at the end of September 2003. The third pillar covers households’ individual retire-ment provisions, such as individual life insurance and investments in pension saving funds, whose combined assets represented about 24 p.c. of GDP at the end of September 2003. The size of Belgian pension funds is not only very modest compared to the other pension pillars, it is also much lower than in other European countries (Chart 44).
About one third of all pension funds in Belgium are defi ned contribution schemes, in which the fi nal pension is determined by the level of the contributions and the movement in the value of the fund’s assets. The other two thirds, whose relative weight in terms of total assets is even greater, are defi ned benefi t schemes, which guar-antee a pension determined by the plan’s rules irrespective of market developments.
In the latter case, the plan’s assets can fall short of the liabilities, e.g. as a result of unfavourable market condi-tions, forcing the sponsoring company to make additional contributions. Although, in the case of defi ned contribu-tion contracts, the level of the pension is basically deter-mined by fi nancial market developments, the fund must still guarantee a minimum return, amounting to 3.75 p.c. on employees’ contributions and, since the introduction of the new law on additional pensions in 2004, 3.25 p.c.
on employers’ contributions. As a consequence, all plans in Belgium should, to a certain extent, be considered as defi ned benefi t plans as they all cover at least part of the investment risk. This means that in both systems the sponsoring companies are exposed to the risk of having to provide additional funding in order to be able to fulfi l all their obligations.
To obtain higher investment yields, and as pension liabili-ties are generally long-term by nature, pension funds are major players on the stock markets, with around 40 p.c. of their fi nancial assets being invested in equities, either directly or indirectly through the holding of shares in UCIs. The share of the equity portfolio has, however, decreased from about 50 p.c. in 1999, while the share of bonds rose from 36 p.c. at that time to around 40 p.c. in 2002 (Chart 45). Although this change partly refl ects a fall in the value of the equity portfolio, it also indicates a shift in the funds’ investment strategy as a reaction to the decline in pension funds’ available buffers resulting from the bad performance of stock markets.
0 25 50 75 100 125 150 175
CHART 44 ASSETS OF THE ALTERNATIVE PENSION PILLARS
(Percentages of GDP at the end of 2002)
Sources : W.M. Mercer, CEA, Commerzbank securities, The Economist.(1) Comprises both individual and group life insurance.
Netherlands
Sweden
UK
Denmark
Ireland
Finland
Italy
Germany
Portugal
Belgium
France
Spain
Pension funds
Life insurance (1)
1999 2000 2001 2002 2003 (1)
0
10
20
30
40
50
60
70
80
90
100
0
10
20
30
40
50
60
70
80
90
100
CHART 45 BELGIAN PENSION FUNDS’ INVESTMENT PORTFOLIO
(Percentages of total financial assets)
Sources : BFIC, NBB.(1) Data at the end of September 2003.
Others
Other UCIs
Bonds
UCIs invested in bonds
Mixed UCIs
UCIs invested in equity
Equity
Liquid assets
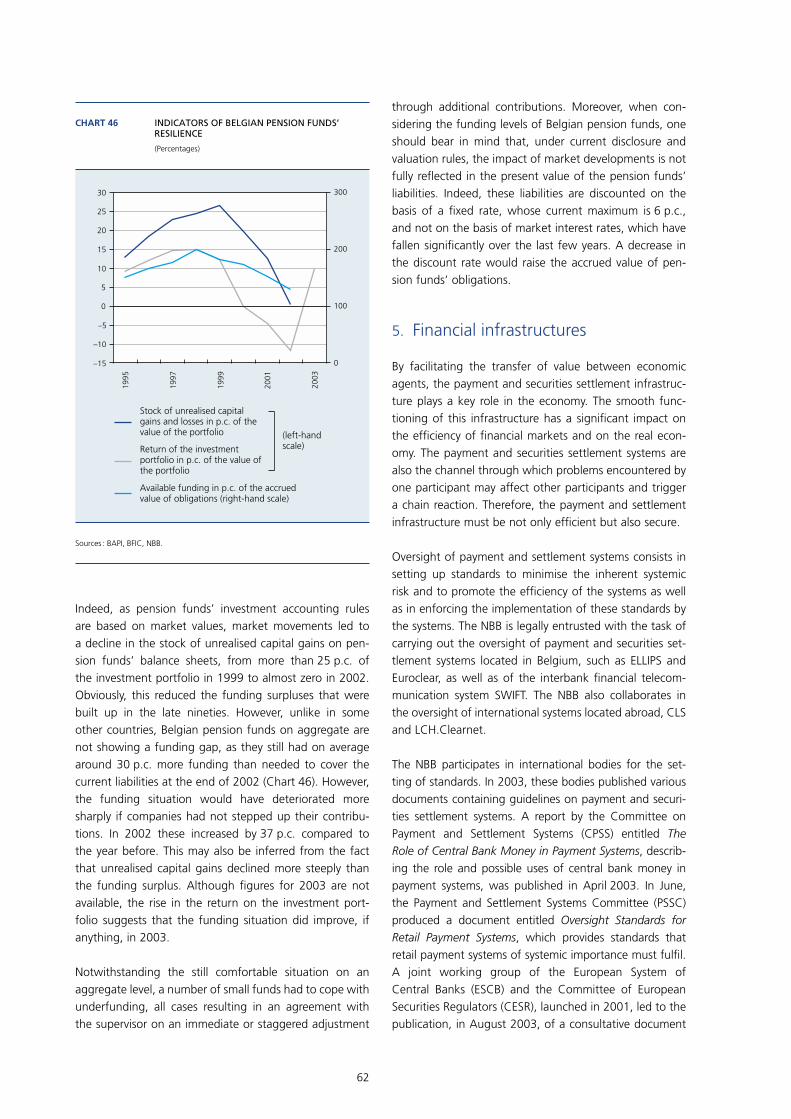
62
Indeed, as pension funds’ investment accounting rules are based on market values, market movements led to a decline in the stock of unrealised capital gains on pen-sion funds’ balance sheets, from more than 25 p.c. of the investment portfolio in 1999 to almost zero in 2002. Obviously, this reduced the funding surpluses that were built up in the late nineties. However, unlike in some other countries, Belgian pension funds on aggregate are not showing a funding gap, as they still had on average around 30 p.c. more funding than needed to cover the current liabilities at the end of 2002 (Chart 46). However, the funding situation would have deteriorated more sharply if companies had not stepped up their contribu-tions. In 2002 these increased by 37 p.c. compared to the year before. This may also be inferred from the fact that unrealised capital gains declined more steeply than the funding surplus. Although fi gures for 2003 are not available, the rise in the return on the investment port-folio suggests that the funding situation did improve, if anything, in 2003.
Notwithstanding the still comfortable situation on an aggregate level, a number of small funds had to cope with underfunding, all cases resulting in an agreement with the supervisor on an immediate or staggered adjustment
through additional contributions. Moreover, when con-sidering the funding levels of Belgian pension funds, one should bear in mind that, under current disclosure and valuation rules, the impact of market developments is not fully refl ected in the present value of the pension funds’ liabilities. Indeed, these liabilities are discounted on the basis of a fi xed rate, whose current maximum is 6 p.c., and not on the basis of market interest rates, which have fallen signifi cantly over the last few years. A decrease in the discount rate would raise the accrued value of pen-sion funds’ obligations.
5. Financial infrastructures
By facilitating the transfer of value between economic agents, the payment and securities settlement infrastruc-ture plays a key role in the economy. The smooth func-tioning of this infrastructure has a signifi cant impact on the effi ciency of fi nancial markets and on the real econ-omy. The payment and securities settlement systems are also the channel through which problems encountered by one participant may affect other participants and trigger a chain reaction. Therefore, the payment and settlement infrastructure must be not only effi cient but also secure.
Oversight of payment and settlement systems consists in setting up standards to minimise the inherent systemic risk and to promote the effi ciency of the systems as well as in enforcing the implementation of these standards by the systems. The NBB is legally entrusted with the task of carrying out the oversight of payment and securities set-tlement systems located in Belgium, such as ELLIPS and Euroclear, as well as of the interbank fi nancial telecom-munication system SWIFT. The NBB also collaborates in the oversight of international systems located abroad, CLS and LCH.Clearnet.
The NBB participates in international bodies for the set-ting of standards. In 2003, these bodies published various documents containing guidelines on payment and securi-ties settlement systems. A report by the Committee on Payment and Settlement Systems (CPSS) entitled The Role of Central Bank Money in Payment Systems, describ-ing the role and possible uses of central bank money in payment systems, was published in April 2003. In June, the Payment and Settlement Systems Committee (PSSC) produced a document entitled Oversight Standards for Retail Payment Systems, which provides standards that retail payment systems of systemic importance must fulfi l. A joint working group of the European System of Central Banks (ESCB) and the Committee of European Securities Regulators (CESR), launched in 2001, led to the publication, in August 2003, of a consultative document
1995
1997
1999
2001
2003
–15
–10
–5
0
5
10
15
20
25
30
0
100
200
300
CHART 46 INDICATORS OF BELGIAN PENSION FUNDS’ RESILIENCE
(Percentages)
Sources : BAPI, BFIC, NBB.
Available funding in p.c. of the accrued value of obligations (right-hand scale)
Stock of unrealised capital gains and losses in p.c. of the value of the portfolio (left-hand
scale)Return of the investment portfolio in p.c. of the value of the portfolio
63
FINANCIAL STABILITY OVERVIEW
entitled Standards for Securities Clearing and Settlement Systems in the European Union. This document trans-poses the CPSS-IOSCO Recommendations for Securities Settlement Systems (12) for the European Union.
In Belgium, three payment infrastructures are mainly active in the domestic market (Table 9) : ELLIPS (the Belgian large-value payment system and access point for TARGET), CEC (the Belgian small-value payment system) and Banksys. The fi rst two are operated by the NBB, the third by the private sector. Payment infrastructures with a more pronounced international character and relevant for the Belgian market are MasterCard Europe and CLS Bank.
In line with the decisions made at the level of the ESCB, both ELLIPS and the CEC have been subjected to an over-sight assessment : ELLIPS against the G10 “Core Principles for Systemically Important Payment Systems” and CEC against the Eurosystem’s “Oversight Standards for Retail Payment Systems”.
Three securities settlement systems (SSS) are established in Belgium : the CIK (13), the NBB SSS and the Euroclear System. As shown by the data on outstanding deposits and turnover presented in Tables 10 and 11, these sys-tems are very different in size.
CIK and NBB SSS are the two components of the Belgian domestic securities settlement infrastructure. CIK, a sub-sidiary of Euronext, is the Central Securities Depository (CSD) for securities issued by private entities, mostly equi-ties and equity related instruments. It also operates two settlement systems, one that settles the Euronext Brussels on-exchange cash market transactions for which the Paris based clearing house LCH. Clearnet SA intervenes as a central counterparty, and one that settles over-the- counter transactions. The bad performance of the stock market has had a clear impact on the activity of CIK, as the reduction in the number of transactions on Euronext Brussels has led, over the past two years, to a sharp decrease in the value of outstanding deposits (–36.5 p.c.) as well as in the turnover (–24 p.c.) of CIK. The NBB SSS, the settlement system operated by the NBB, is the Belgian CSD for fi xed income securities, in particular those issued by the Belgian State. Unlike CIK, NBB SSS saw both its deposits of securities and its turnover increase (respec-tively by 5 p.c. and by 29 p.c.) between 2001 and 2003.
A major international infrastructure is also established in Belgium, the Euroclear System. It is an International Central Securities Depository (ICSD) operated by Euroclear Bank, a Belgian credit institution. It settles trades in euro, US Dollar, Pound Sterling, Yen and 27 other curren-cies between more than 1,600 participants from about 80 countries. The core activity of the Euroclear System remains in the segment of international debt securities (e.g. eurobonds) which accounted for 67 p.c. of the 5,244 billions of euro of securities deposits held in the system at the end of 2003. To offer its participants the opportunity to access a large number of domestic secu-rities markets, the Euroclear System has put in place a network of 31 links with local securities infrastructures and custodians. Deposits in such domestic bonds, which represent about 28 p.c. of the total securities deposits,
(12) CPSS-IOSCO (2001) “Recommendations for Securities Settlement Systems“.
(13) Caisse Interprofessionnelle de Dépôts et de Virements de Titres S.A./ Interprofessionele Effecten Deposito- en Girokas N.V. (Inter-professional Securities Depository organisation)
TABLE 9 VALUE OF TRANSACTIONS
(Billions of euro)
Sources : Banksys, NBB.
2001 2002 2003
CEC . . . . . . . . . . . . . 508 431 552
ELLIPS . . . . . . . . . . . 24,500 22,824 23,780
Banksys . . . . . . . . . . 32 36 47
TABLE 10 OUTSTANDING DEPOSITS IN THE DOMESTIC CSDS AND ICSD LOCATED IN BELGIUM
(Billions of euro, as of December 31)
Sources : CIK, Euroclear Bank, NBB.(1) Include Eurobonds, Euro Commercial Paper (ECP), Certificates of Deposit, Brady
bonds and some SEC registered securities
2001 2002 2003
CIK . . . . . . . . . . . . . . . . . . . . . . 189 127 120
NBB SSS . . . . . . . . . . . . . . . . . . 279 291 293
Euroclear . . . . . . . . . . . . . . . . . . 4,405 4,778 5,244
Of which :
International Bonds (1) . . . . . 3,110 3,276 3,509
Domestic bonds . . . . . . . . . 1,054 1,291 1,445
Equities . . . . . . . . . . . . . . . 80 81 96
Other securities . . . . . . . . . 161 130 194

64
have signifi cantly increased over the past few years and their share in the turnover of the Euroclear System was close to 65 p.c. in 2003.
Since 2001, Euroclear Bank has merged with various domes-tic systems in Europe : Sicovam (now Euroclear France), the French CSD ; Necigef (now Euroclear Nederland), the Dutch CSD and CRESTCo, the CSD of UK and Irish equi-ties. Euroclear Bank also intends to acquire the settlement activities of the CIK in the near future. Euroclear plans to implement a “New Business Model” by consolidating the processing platforms of these various entities into one “Single Settlement Engine” and by creating a common infrastructure for the group.
In this framework, Euroclear also reassessed the corporate structure of the group and decided to reshape it in a way that should better fi t this new model while addressing systemic risk, transparency and intra-group competi-tion issues. The planned structure is to consist of a new company, to be called Euroclear S.A./N.V., incorporated in Belgium, of which Euroclear Bank and the CSDs of the Euroclear Group would become sister subsidiaries
(Chart 47). Euroclear S.A./N.V. would own and operate the common platform and provide other shared group services including IT infrastructure. Participants in the vari-ous subsidiaries would continue to access them directly (as at present) and not through Euroclear S.A./N.V. The current user governance and ownership of the group would also remain unchanged. Euroclear expects the new structure, which is now being reviewed by the relevant regulators, to be in place by the end of 2004.
In line with the acquisitions of domestic CSDs, Euroclear has reinforced its role in the equities markets by conclu-ding a privileged partnership agreement with Euronext N.V. for the settlement of transactions concluded on the Euronext trading platforms (Chart 48). In the framework of this agreement, Euronext N.V. has acquired 3 p.c. of the capital of Euroclear plc., the parent company of Euroclear Bank, while Euroclear Bank has taken a stake of 20 p.c. in LCH.Clearnet SA (14), a French credit institution acting as central counterparty and clearing institution for the transactions concluded on Euronext markets.
CIK, NBB SSS and Euroclear are overseen by the NBB. They are in the process of being assessed against the CPSS-IOSCO “Recommendations for Securities Settlement Systems”. The NBB is also involved in the joint oversight of LCH.Clearnet along with the French, Dutch and Portuguese authorities.
Following the integration of foreign CSDs in Euroclear and the partnership agreement with Euronext, the NBB has set up an international co-operation framework with the foreign regulators in charge of the oversight of these entities. This co-operation is based on the conclusion of Memoranda of Understanding (MoUs), which set out the
TABLE 11 TURNOVER OF THE DOMESTIC CSDS AND ICSD LOCATED IN BELGIUM
(Billions of euro)
Sources : CIK, Euroclear Bank, NBB.
2001 2002 2003
CIK . . . . . . . . . . . . . 147 139 112
NBB SSS . . . . . . . . . 2,939 3,063 3,788
Euroclear . . . . . . . . . 86,900 103,500 118,100
(14) Euroclear Bank’s stake in Clearnet was converted into a 9.8 p.c. stake in the LCH.Clearnet Group after the merger with LCH in December 2003.
CHART 47 STRUCTURE OF THE EUROCLEAR GROUP
Euroclear plc.
EuroclearBank
EuroclearInvestment
CRESTCo EuroclearFrance
EuroclearNetherlands
Euroclear plc.
EuroclearS.A./N.V.
EuroclearInvestment
CRESTCo EuroclearBank
EuroclearFrance
EuroclearNetherlands
Current structure Planned structure
65
FINANCIAL STABILITY OVERVIEW
terms of the co-operation and acknowledge the role of the NBB as lead overseer of Euroclear. Prudential super-visors and securities regulators are also parties to these agreements. The new structure that Euroclear will put in place creates the need to reshape this co-operation framework in order to take better account of the common functions and infrastructure centralised in Euroclear SA. The authorities are now in the process of elaborating this new framework.
While not a payment or settlement system, SWIFT plays a key role in the fi nancial infrastructure by offering facilities for highly secure exchange of fi nancial and related mes-sages between its users. A growing number of systemi-cally important payment systems have become dependent on SWIFT, which also provides the message transmission for bilateral correspondent banking activity. There has been formal oversight of SWIFT since 1998, based on a special arrangement agreed by the central banks of the G-10 countries. Under this agreement, the NBB acts as lead overseer of SWIFT, with the support of other G-10 central banks.
In the fourth quarter of 2003, the organisation of the oversight of SWIFT was reviewed and a new framework has been agreed in January 2004. The implementation of the revised oversight arrangements is ongoing : it includes a revision of the protocol concluded between the NBB and SWIFT, and the conclusion of MoUs between the NBB and the central banks co-operating in the oversight of this institution. The protocol with SWIFT contains practical arrangements for the organisation of the oversight, while the MoUs between central banks clarify their respective roles in the co-operative oversight of SWIFT. The terms of
reference of the various groups involved with the over-sight of SWIFT have also been reviewed.
In 2003, SWIFT messaging traffi c continued to grow : for the fi rst time, more than 2 billion messages were sent over the network in one year, with a peak day of 9.7 million messages. SWIFT returned 25 millions of euro in rebates to its users (on revenues before rebates of 577 millions of euro) and announced a signifi cant price reduction. By the end of 2003, 25 p.c. of traffi c had migrated from the old network infrastructure (based on a network technology that is rapidly becoming obsolete) to the new internet protocol-based infrastructure. All traffi c should have migrated by the end of 2004. Overseers are closely monitoring this huge migration project.
To strengthen business continuity at the level of the Belgian fi nancial sector as a whole, a “National Initiative for Business Continuity Planning in the Financial Sector” was launched. This group is chaired by the NBB. The members are experts from the NBB, the BFIC and the Federal Public Service Finance. In the initial stage, the mandate of this group contains three components : to identify the critical actors and functions in terms of business continuity and business recovery, to inquire about the measures already taken and to fi nd out about the expectations of the actors regarding the measures which could be taken by the authorities or by others. In a second stage, the group will evaluate any defi ciencies at sector level and, if appropriate, make proposals for remedying them.
CHART 48 VALUE CHAIN FOR ON–EXCHANGE TRADES IN EURONEXT
Settlement
Clearing
TradingBRUSSELS
EuronextBrussels
LIFFE
LONDON
London StockExchange
LCH.Clearnet SA LCH.Clearnet Ltd
EuroclearBank
CRESTCo
Euronext Group LCH.Clearnet Group Euroclear Group
EuroclearNetherlands
LISBON
EuronextLisbon
AMSTERDAM
EuronextAmsterdam
PARIS
EuronextParis
CIK EuroclearBank
NBBSSS
EuroclearFrance
EuroclearBank
Interbolsa

67
FINANCIAL STABILITY OVERVIEWSTATISTICAL ANNEX
Statistical annex

69
FINANCIAL STABILITY OVERVIEWSTATISTICAL ANNEX
List of tables
Tables relating to credit institutions
1 Number of Belgian credit institutions 712 Breakdown of credit institutions governed by Belgian law according to their
shareholders’ structure 723 Key fi gures for the Belgian banking sector 734 Main balance-sheet items of Belgian credit institutions 745 Belgian credit institutions’ liabilities towards domestic customers 756 Belgian credit institutions’ loans and advances to customers 767 Structure of the securities portfolio of Belgian credit institutions 778 Breakdown of off-balance-sheet forward operations of Belgian credit institutions 789 Own funds components of credit institutions governed by Belgian law 7910 Components of the income statement of Belgian credit institutions 80
Tables relating to insurance companies
11 Number of Belgian insurance companies 8112 Main components of Belgian insurance companies’ assets 8213 Main components of Belgian insurance companies’ liabilities 8314 Components of the income statement of Belgian insurance companies 8415 Level and composition of Belgian insurance companies’ available solvency margin 8516 Composition of Belgian insurance companies’ covering assets for all types of
activities 86
Tables relating to investment services and securities market
17 Key fi gures of stockbroking fi rms 8718 Key fi gures of portfolio management companies 8819 Gross public issues of securities in Belgium 8920 Belgian undertakings for collective investment 9021 Foreign undertakings for collective investment distributed in Belgium 9122 Breakdown of undertakings for collective investment distributed in Belgium
according to investment strategy 92

71
FINANCIAL STABILITY OVERVIEWSTATISTICAL ANNEX
TAB
LE1
NU
MB
ER O
F B
ELG
IAN
CR
EDIT
IN
STIT
UTI
ON
S
Sour
ce: B
FIC
.
1997
1998
1999
2000
2001
2002
2003
Cre
dit
inst
itutio
ns g
over
ned
by B
elgi
an l
aw w
ith B
elgi
an m
ajor
ity s
hare
hold
ing
. . .
. .
6354
4845
3836
34
Cre
dit
inst
itutio
ns g
over
ned
by B
elgi
an l
aw w
ith f
orei
gn m
ajor
ity s
hare
hold
ing
. . .
. .
3127
2727
2929
27
–EU
Mem
ber
Stat
es .
. . .
. . .
. . .
. . .
. . .
. . .
. . .
. . .
. . .
. . .
. . .
. . .
. . .
. . .
. . .
. . .
1617
2121
2221
21
–ot
her
Stat
es .
. . .
. . .
. . .
. . .
. . .
. . .
. . .
. . .
. . .
. . .
. . .
. . .
. . .
. . .
. . .
. . .
. . .
. .
1510
66
78
6
Belg
ian
bran
ches
of
fore
ign
cred
it in
stitu
tions
. .
. . .
. . .
. . .
. . .
. . .
. . .
. . .
. . .
. . .
. .
4039
4447
4646
48
–EU
Mem
ber
Stat
es .
. . .
. . .
. . .
. . .
. . .
. . .
. . .
. . .
. . .
. . .
. . .
. . .
. . .
. . .
. . .
. . .
2525
3034
3536
38
–ot
her
Stat
es .
. . .
. . .
. . .
. . .
. . .
. . .
. . .
. . .
. . .
. . .
. . .
. . .
. . .
. . .
. . .
. . .
. . .
. .
1514
1413
1110
10
Tota
l .
. . .
. . .
. . .
. . .
. . .
. . .
. . .
. . .
. . .
. . .
. . .
. . .
. . .
. . .
. . .
. . .
. . .
. . .
. . .
. . .
.13
412
011
911
911
311
110
9

72
TAB
LE2
BR
EAK
DO
WN
OF
CR
EDIT
IN
STIT
UTI
ON
S G
OV
ERN
ED B
Y B
ELG
IAN
LA
W A
CC
OR
DIN
G T
O T
HEI
R S
HA
REH
OLD
ERS’
STR
UC
TUR
E
Sour
ce: B
FIC
.(1
)O
f w
hich
2 a
re o
wne
d by
a F
renc
h ba
nk.
1997
1998
1999
2000
2001
2002
2003
Larg
e cr
edit
inst
itutio
ns (
incl
udin
g th
eir
subs
idia
ries)
. .
. . .
. . .
. . .
. . .
. . .
. . .
. . .
. . .
2118
1715
1412
11
Belg
ian
finan
cial
gro
ups
. . .
. . .
. . .
. . .
. . .
. . .
. . .
. . .
. . .
. . .
. . .
. . .
. . .
. . .
. . .
. . .
46
57
55
3
Fina
ncia
l gr
oups
fro
m o
ther
EU
Sta
tes
. . .
. . .
. . .
. . .
. . .
. . .
. . .
. . .
. . .
. . .
. . .
. . .
.16
1821
1918
1918
Fina
ncia
l gr
oups
fro
m t
hird
cou
ntrie
s . .
. . .
. . .
. . .
. . .
. . .
. . .
. . .
. . .
. . .
. . .
. . .
. . .
148
56
75
6
Belg
ian
or f
orei
gn n
on-f
inan
cial
gro
ups
. . .
. . .
. . .
. . .
. . .
. . .
. . .
. . .
. . .
. . .
. . .
. . .
84
33
34
2
Fam
ily s
truc
ture
. .
. . .
. . .
. . .
. . .
. . .
. . .
. . .
. . .
. . .
. . .
. . .
. . .
. . .
. . .
. . .
. . .
. . .
.12
1413
108
910
Prof
essi
onal
cre
dit
asso
ciat
ions
. .
. . .
. . .
. . .
. . .
. . .
. . .
. . .
. . .
. . .
. . .
. . .
. . .
. . .
. .12
119
99
(1)
9(1
)9
(1)
Publ
ic a
utho
ritie
s .
. . .
. . .
. . .
. . .
. . .
. . .
. . .
. . .
. . .
. . .
. . .
. . .
. . .
. . .
. . .
. . .
. . .
.2
22
11
11
Con
sort
ium
str
uctu
re
. . .
. . .
. . .
. . .
. . .
. . .
. . .
. . .
. . .
. . .
. . .
. . .
. . .
. . .
. . .
. . .
. .–
––
22
11
Lim
ited
part
ners
hips
. .
. . .
. . .
. . .
. . .
. . .
. . .
. . .
. . .
. . .
. . .
. . .
. . .
. . .
. . .
. . .
. . .
.3
––
––
––
Co-
oper
ativ
e co
mpa
nies
. .
. . .
. . .
. . .
. . .
. . .
. . .
. . .
. . .
. . .
. . .
. . .
. . .
. . .
. . .
. . .
.2
––
––
––
Tota
l .
. . .
. . .
. . .
. . .
. . .
. . .
. . .
. . .
. . .
. . .
. . .
. . .
. . .
. . .
. . .
. . .
. . .
. . .
. . .
. . .
.94
8175
7267
6561

73
FINANCIAL STABILITY OVERVIEWSTATISTICAL ANNEX
TAB
LE3
KEY
FIG
UR
ES F
OR
TH
E B
ELG
IAN
BA
NK
ING
SEC
TOR
(1)
(Dat
a on
a c
onso
lidat
ed b
asis
)
Sour
ce: B
FIC
.(1
)C
redi
t in
stitu
tions
gov
erne
d by
Bel
gian
law
and
bra
nche
s of
for
eign
cre
dit
inst
itutio
ns.
(2)
Onl
y fo
r cr
edit
inst
itutio
ns g
over
ned
by B
elgi
an l
aw.
1997
1998
1999
2000
2001
2002
2003
A.L
arg
e b
anki
ng
gro
up
s
Bala
nce
shee
t to
tal
(bill
ions
of
euro
) .
. . .
. . .
. . .
. . .
. . .
. . .
. . .
. . .
. . .
. . .
. . .
633.
469
9.1
797.
984
0.6
940.
790
7.5
913.
2
Cus
tom
ers’
hol
ding
s (b
illio
ns o
f eu
ro)
. . .
. . .
. . .
. . .
. . .
. . .
. . .
. . .
. . .
. . .
. . .
341.
638
0.5
415.
244
0.5
477.
046
5.4
453.
9
Loan
s an
d ad
vanc
es t
o cu
stom
ers
(bill
ions
of
euro
) . .
. . .
. . .
. . .
. . .
. . .
. . .
. . .
226.
626
7.4
306.
735
2.4
374.
838
1.2
384.
9
Off
-bal
ance
-she
et f
orw
ard
oper
atio
ns (
billi
ons
of e
uro)
. .
. . .
. . .
. . .
. . .
. . .
. . .
1,75
1.7
1,87
0.9
2,37
7.3
2,45
1.7
3,11
3.6
3,63
9.3
4,48
4.4
Ass
ets
and
depo
sits
in
trus
t (b
illio
ns o
f eu
ro)
. . .
. . .
. . .
. . .
. . .
. . .
. . .
. . .
. . .
.40
6.3
586.
264
7.7
927.
696
1.7
932.
773
9.0
Risk
ass
et r
atio
(p.
c.)
. . .
. . .
. . .
. . .
. . .
. . .
. . .
. . .
. . .
. . .
. . .
. . .
. . .
. . .
. . .
.11
.311
.111
.811
.712
.712
.812
.4
Net
aft
er t
ax r
esul
ts (
billi
ons
of e
uro)
. .
. . .
. . .
. . .
. . .
. . .
. . .
. . .
. . .
. . .
. . .
. .1.
92.
03.
24.
73.
42.
93.
6
Retu
rn o
n av
erag
e as
sets
(p.
c.)
. . .
. . .
. . .
. . .
. . .
. . .
. . .
. . .
. . .
. . .
. . .
. . .
. . .
0.3
0.3
0.5
0.6
0.4
0.4
0.4
Retu
rn o
n av
erag
e eq
uity
(p.
c.)
. . .
. . .
. . .
. . .
. . .
. . .
. . .
. . .
. . .
. . .
. . .
. . .
. .
13.5
11.7
18.7
22.7
15.0
12.6
14.2
Cos
t-in
com
e ra
tio (
p.c.
) .
. . .
. . .
. . .
. . .
. . .
. . .
. . .
. . .
. . .
. . .
. . .
. . .
. . .
. . .
.68
.164
.569
.371
.572
.973
.272
.8
Ave
rage
yie
ld o
n as
sets
(p.
c.)
. . .
. . .
. . .
. . .
. . .
. . .
. . .
. . .
. . .
. . .
. . .
. . .
. . .
.5.
85.
65.
75.
95.
85.
04.
0
Ave
rage
cos
t of
fun
ding
(p.
c.)
. . .
. . .
. . .
. . .
. . .
. . .
. . .
. . .
. . .
. . .
. . .
. . .
. . .
4.5
4.3
4.3
4.7
4.5
3.5
2.6
Inte
rest
mar
gin
(p.c
.) .
. . .
. . .
. . .
. . .
. . .
. . .
. . .
. . .
. . .
. . .
. . .
. . .
. . .
. . .
. . .
1.3
1.3
1.4
1.3
1.4
1.5
1.4
B.
Tota
l o
f B
elg
ian
cre
dit
in
stit
uti
on
s
Bala
nce
shee
t to
tal
(bill
ions
of
euro
) .
. . .
. . .
. . .
. . .
. . .
. . .
. . .
. . .
. . .
. . .
. . .
813.
785
4.6
926.
797
1.3
1,06
3.7
1,02
4.6
1,03
3.0
Cus
tom
ers’
hol
ding
s (b
illio
ns o
f eu
ro)
. . .
. . .
. . .
. . .
. . .
. . .
. . .
. . .
. . .
. . .
. . .
403.
144
4.2
477.
450
4.2
545.
053
5.3
531.
9
Loan
s an
d ad
vanc
es t
o cu
stom
ers
(bill
ions
of
euro
) . .
. . .
. . .
. . .
. . .
. . .
. . .
. . .
265.
430
3.8
342.
939
2.7
416.
342
1.3
428.
8
Off
-bal
ance
-she
et f
orw
ard
oper
atio
ns (
billi
ons
of e
uro)
. .
. . .
. . .
. . .
. . .
. . .
. . .
2,10
7.2
2,11
6.3
2,50
7.2
2,61
1.5
3,23
7.5
4,29
7.7
4,62
5.7
Ass
ets
and
depo
sits
in
trus
t (b
illio
ns o
f eu
ro)
. . .
. . .
. . .
. . .
. . .
. . .
. . .
. . .
. . .
.2,
715.
83,
063.
34,
197.
25,
429.
79,
478.
012
,020
.312
,881
.5
Risk
ass
et r
atio
(p.
c.)(
2) .
. . .
. . .
. . .
. . .
. . .
. . .
. . .
. . .
. . .
. . .
. . .
. . .
. . .
. . .
. .
11.5
11.3
11.9
11.9
12.9
13.1
12.8
Net
aft
er t
ax r
esul
ts (
billi
ons
of e
uro)
. .
. . .
. . .
. . .
. . .
. . .
. . .
. . .
. . .
. . .
. . .
. .2.
12.
63.
75.
53.
83.
24.
0
Retu
rn o
n av
erag
e as
sets
(p.
c.)
. . .
. . .
. . .
. . .
. . .
. . .
. . .
. . .
. . .
. . .
. . .
. . .
. . .
0.3
0.3
0.4
0.6
0.4
0.4
0.4
Retu
rn o
n av
erag
e eq
uity
(p.
c.)(
2) .
. . .
. . .
. . .
. . .
. . .
. . .
. . .
. . .
. . .
. . .
. . .
. . .
12.0
11.0
17.1
20.4
13.7
11.8
13.6
Cos
t-in
com
e ra
tio (
p.c.
) .
. . .
. . .
. . .
. . .
. . .
. . .
. . .
. . .
. . .
. . .
. . .
. . .
. . .
. . .
.69
.265
.869
.972
.274
.174
.773
.9
Ave
rage
yie
ld o
n as
sets
(p.
c.)
. . .
. . .
. . .
. . .
. . .
. . .
. . .
. . .
. . .
. . .
. . .
. . .
. . .
.5.
75.
65.
65.
95.
84.
94.
0
Ave
rage
cos
t of
fun
ding
(p.
c.)
. . .
. . .
. . .
. . .
. . .
. . .
. . .
. . .
. . .
. . .
. . .
. . .
. . .
4.5
4.4
4.2
4.6
4.4
3.4
2.6
Inte
rest
mar
gin
(p.c
.) .
. . .
. . .
. . .
. . .
. . .
. . .
. . .
. . .
. . .
. . .
. . .
. . .
. . .
. . .
. . .
1.2
1.3
1.4
1.3
1.4
1.5
1.4

74
TAB
LE4
MA
IN B
ALA
NC
E-SH
EET
ITEM
S O
F B
ELG
IAN
CR
EDIT
IN
STIT
UTI
ON
S(1
)
(Dat
a on
a c
onso
lidat
ed b
asis
, bi
llion
s of
eur
o)
Sour
ce: B
FIC
.(1
)C
redi
t in
stitu
tions
gov
erne
d by
Bel
gian
law
and
bra
nche
s of
for
eign
cre
dit
inst
itutio
ns.
1997
1998
1999
2000
2001
2002
2003
Ass
ets
Inte
rban
k as
sets
. .
. . .
. . .
. . .
. . .
. . .
. . .
. . .
. . .
. . .
. . .
. . .
. . .
. . .
. . .
. . .
. . .
. .
253.
223
2.6
222.
519
8.4
219.
921
4.8
206.
1
Loan
s an
d ad
vanc
es t
o cu
stom
ers
. . .
. . .
. . .
. . .
. . .
. . .
. . .
. . .
. . .
. . .
. . .
. . .
. . .
265.
430
3.8
342.
939
2.7
416.
342
1.3
428.
8
Secu
ritie
s an
d ot
her
nego
tiabl
e in
stru
men
ts
. . .
. . .
. . .
. . .
. . .
. . .
. . .
. . .
. . .
. . .
.24
8.8
264.
629
4.9
296.
531
6.9
291.
630
1.0
Fixe
d as
sets
. .
. . .
. . .
. . .
. . .
. . .
. . .
. . .
. . .
. . .
. . .
. . .
. . .
. . .
. . .
. . .
. . .
. . .
. . .
10.5
12.0
14.1
15.8
18.8
18.2
17.5
Oth
er
. . .
. . .
. . .
. . .
. . .
. . .
. . .
. . .
. . .
. . .
. . .
. . .
. . .
. . .
. . .
. . .
. . .
. . .
. . .
. . .
35.8
41.7
52.4
68.0
91.8
78.6
79.7
Liab
iliti
es
Inte
rban
k lia
bilit
ies
. . .
. . .
. . .
. . .
. . .
. . .
. . .
. . .
. . .
. . .
. . .
. . .
. . .
. . .
. . .
. . .
. .
303.
128
9.6
304.
928
6.8
284.
825
4.9
257.
3
Cus
tom
ers’
hol
ding
s . .
. . .
. . .
. . .
. . .
. . .
. . .
. . .
. . .
. . .
. . .
. . .
. . .
. . .
. . .
. . .
. .
403.
144
4.2
477.
450
4.2
545.
053
5.3
531.
9
–de
posi
ts
. . .
. . .
. . .
. . .
. . .
. . .
. . .
. . .
. . .
. . .
. . .
. . .
. . .
. . .
. . .
. . .
. . .
. . .
.27
9.7
327.
135
0.7
369.
041
1.8
406.
641
6.7
–ba
nk b
onds
and
oth
er d
ebt
secu
ritie
s . .
. . .
. . .
. . .
. . .
. . .
. . .
. . .
. . .
. . .
. . .
123.
411
7.1
126.
713
5.3
133.
212
8.8
115.
2
Subo
rdin
ated
deb
ts .
. . .
. . .
. . .
. . .
. . .
. . .
. . .
. . .
. . .
. . .
. . .
. . .
. . .
. . .
. . .
. . .
.14
.816
.820
.424
.027
.525
.823
.9
Ow
n fu
nds
. . .
. . .
. . .
. . .
. . .
. . .
. . .
. . .
. . .
. . .
. . .
. . .
. . .
. . .
. . .
. . .
. . .
. . .
. .
19.8
22.7
23.1
26.9
28.9
30.5
32.2
Oth
er
. . .
. . .
. . .
. . .
. . .
. . .
. . .
. . .
. . .
. . .
. . .
. . .
. . .
. . .
. . .
. . .
. . .
. . .
. . .
. . .
73.0
81.4
100.
912
9.4
177.
517
8.0
187.
7
Bal
ance
sh
eet
tota
l .
. . .
. . .
. . .
. . .
. . .
. . .
. . .
. . .
. . .
. . .
. . .
. . .
. . .
. . .
. . .
. . .
.81
3.7
854.
692
6.7
971.
31,
063.
71,
024.
61,
033.
0
75
FINANCIAL STABILITY OVERVIEWSTATISTICAL ANNEX
TAB
LE5
BEL
GIA
N C
RED
IT I
NST
ITU
TIO
NS’
LIA
BIL
ITIE
S TO
WA
RD
S D
OM
ESTI
C C
UST
OM
ERS
(1)
(Dat
a on
a c
onso
lidat
ed b
asis
, bi
llion
s of
eur
o)
Sour
ce: B
FIC
.(1
)C
redi
t in
stitu
tions
gov
erne
d by
Bel
gian
law
and
bra
nche
s of
for
eign
cre
dit
inst
itutio
ns.
(2)
Oth
er c
usto
mer
s’ h
oldi
ngs
incl
ude
inte
r al
ia d
ebt
secu
ritie
s an
d ce
rtifi
cate
s of
dep
osit,
spe
cial
acc
ount
s, d
epos
its r
elat
ed t
o m
ortg
age
loan
s an
d th
e de
posi
t pr
otec
tion
sche
me.
1997
1998
1999
2000
2001
2002
2003
Liab
iliti
es w
ith
an
ori
gin
al m
atu
rity
of
mo
re t
han
on
e ye
ar
Term
dep
osits
. .
. . .
. . .
. . .
. . .
. . .
. . .
. . .
. . .
. . .
. . .
. . .
. . .
. . .
. . .
. . .
. . .
. . .
.9.
59.
510
.310
.511
.210
.511
.4
Bank
bon
ds .
. . .
. . .
. . .
. . .
. . .
. . .
. . .
. . .
. . .
. . .
. . .
. . .
. . .
. . .
. . .
. . .
. . .
. . .
.72
.965
.460
.057
.553
.051
.944
.3
Oth
er c
usto
mer
s’ h
oldi
ngs(
2) .
. . .
. . .
. . .
. . .
. . .
. . .
. . .
. . .
. . .
. . .
. . .
. . .
. . .
. . .
7.7
8.8
8.7
5.6
5.2
4.8
6.4
Sub-
tota
l . .
. . .
. . .
. . .
. . .
. . .
. . .
. . .
. . .
. . .
. . .
. . .
. . .
. . .
. . .
. . .
. . .
. . .
. . .
. .
90.1
83.6
79.0
73.5
69.4
67.3
62.1
Liab
iliti
es w
ith
an
ori
gin
al m
atu
rity
of
up
to
on
e ye
ar
Savi
ng d
epos
its .
. . .
. . .
. . .
. . .
. . .
. . .
. . .
. . .
. . .
. . .
. . .
. . .
. . .
. . .
. . .
. . .
. . .
.89
.093
.798
.492
.598
.511
0.5
129.
0
Sigh
t de
posi
ts
. . .
. . .
. . .
. . .
. . .
. . .
. . .
. . .
. . .
. . .
. . .
. . .
. . .
. . .
. . .
. . .
. . .
. . .
40.2
48.0
52.9
57.0
60.1
61.9
68.0
Dep
osits
with
a t
erm
of u
p to
one
mon
th
. . .
. . .
. . .
. . .
. . .
. . .
. . .
. . .
. . .
. . .
. . .
. . .
. . .
. . .
. . .
. .20
.620
.620
.118
.221
.922
.519
.8
of m
ore
than
one
mon
th u
p to
one
yea
r .
. . .
. . .
. . .
. . .
. . .
. . .
. . .
. . .
. . .
. . .
21.9
24.8
28.8
30.4
33.3
29.8
28.1
Bank
bon
ds w
ith a
ter
m o
f on
e ye
ar
. . .
. . .
. . .
. . .
. . .
. . .
. . .
. . .
. . .
. . .
. . .
. . .
2.1
1.6
1.5
1.5
1.9
1.0
0.7
Oth
er c
usto
mer
s’ h
oldi
ngs(
2) .
. . .
. . .
. . .
. . .
. . .
. . .
. . .
. . .
. . .
. . .
. . .
. . .
. . .
. . .
5.2
5.6
8.2
10.6
7.8
8.1
9.7
Sub-
tota
l . .
. . .
. . .
. . .
. . .
. . .
. . .
. . .
. . .
. . .
. . .
. . .
. . .
. . .
. . .
. . .
. . .
. . .
. . .
. .
179.
019
4.2
209.
921
0.3
223.
623
3.9
255.
3
Tota
l lia
bili
ties
co
llect
ed i
n B
elg
ium
. .
. . .
. . .
. . .
. . .
. . .
. . .
. . .
. . .
. . .
. . .
. . .
.26
9.1
277.
928
8.8
283.
829
3.0
301.
231
7.4
76
TAB
LE6
BEL
GIA
N C
RED
IT I
NST
ITU
TIO
NS’
LO
AN
S A
ND
AD
VA
NC
ES T
O C
UST
OM
ERS
(1)
(Dat
a on
a c
onso
lidat
ed b
asis
, bi
llion
s of
eur
o)
Sour
ce: B
FIC
.(1
)C
redi
t in
stitu
tions
gov
erne
d by
Bel
gian
law
and
bra
nche
s of
for
eign
cre
dit
inst
itutio
ns.
(2)
Aft
er d
educ
tion
of d
epos
its r
elat
ed t
o m
ortg
age
loan
s.
1997
1998
1999
2000
2001
2002
2003
Inst
allm
ent
loan
s . .
. . .
. . .
. . .
. . .
. . .
. . .
. . .
. . .
. . .
. . .
. . .
. . .
. . .
. . .
. . .
. . .
. . .
.9.
912
.013
.413
.713
.914
.313
.5
Mor
tgag
e lo
ans(
2) .
. . .
. . .
. . .
. . .
. . .
. . .
. . .
. . .
. . .
. . .
. . .
. . .
. . .
. . .
. . .
. . .
. . .
.52
.063
.174
.479
.585
.093
.611
7.4
Term
loa
ns
. . .
. . .
. . .
. . .
. . .
. . .
. . .
. . .
. . .
. . .
. . .
. . .
. . .
. . .
. . .
. . .
. . .
. . .
. . .
.14
7.3
162.
718
2.4
209.
723
3.0
242.
223
0.1
Cur
rent
acc
ount
adv
ance
s .
. . .
. . .
. . .
. . .
. . .
. . .
. . .
. . .
. . .
. . .
. . .
. . .
. . .
. . .
. . .
23.4
32.4
35.7
40.6
36.4
34.0
29.6
Trad
e bi
lls a
nd a
ccep
tanc
e cr
edits
. .
. . .
. . .
. . .
. . .
. . .
. . .
. . .
. . .
. . .
. . .
. . .
. . .
. .
27.8
27.8
29.2
38.2
34.5
26.5
24.8
Oth
er
. . .
. . .
. . .
. . .
. . .
. . .
. . .
. . .
. . .
. . .
. . .
. . .
. . .
. . .
. . .
. . .
. . .
. . .
. . .
. . .
. .4.
85.
87.
911
.013
.510
.713
.4
Tota
l .
. . .
. . .
. . .
. . .
. . .
. . .
. . .
. . .
. . .
. . .
. . .
. . .
. . .
. . .
. . .
. . .
. . .
. . .
. . .
. . .
.26
5.4
303.
834
2.9
392.
741
6.3
421.
342
8.8
of
wh
ich
on
Bel
giu
m
. . .
. . .
. . .
. . .
. . .
. . .
. . .
. . .
. . .
. . .
. . .
. . .
. . .
. . .
. . .
. .18
4.1
192.
620
9.1
218.
022
0.5
219.
322
4.3
of
wh
ich
on
fo
reig
n c
ou
ntr
ies
. . .
. . .
. . .
. . .
. . .
. . .
. . .
. . .
. . .
. . .
. . .
. . .
. . .
81.2
111.
213
3.7
174.
719
5.8
201.
920
4.5
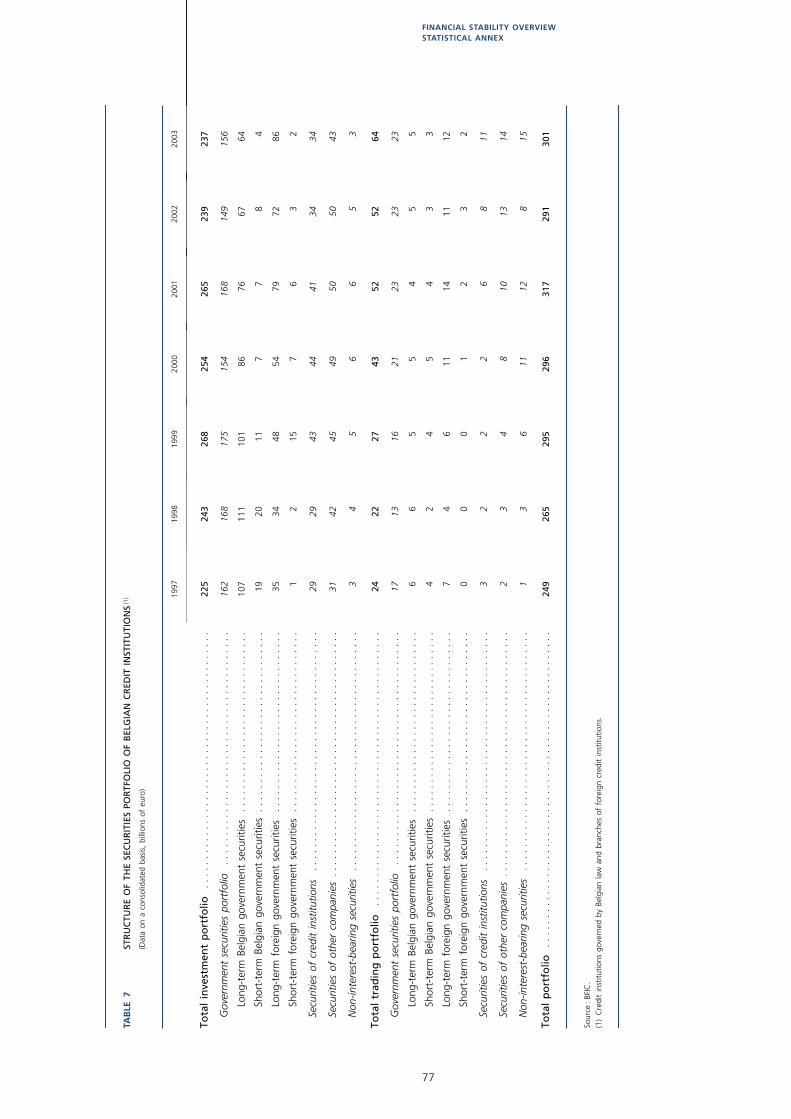
77
FINANCIAL STABILITY OVERVIEWSTATISTICAL ANNEX
TAB
LE7
STR
UC
TUR
E O
F TH
E SE
CU
RIT
IES
POR
TFO
LIO
OF
BEL
GIA
N C
RED
IT I
NST
ITU
TIO
NS
(1)
(Dat
a on
a c
onso
lidat
ed b
asis
, bi
llion
s of
eur
o)
Sour
ce: B
FIC
.(1
)C
redi
t in
stitu
tions
gov
erne
d by
Bel
gian
law
and
bra
nche
s of
for
eign
cre
dit
inst
itutio
ns.
1997
1998
1999
2000
2001
2002
2003
Tota
l in
vest
men
t p
ort
folio
. .
. . .
. . .
. . .
. . .
. . .
. . .
. . .
. . .
. . .
. . .
. . .
. . .
. . .
. . .
225
243
268
254
265
239
237
Gov
ernm
ent
secu
ritie
s po
rtfo
lio
. . .
. . .
. . .
. . .
. . .
. . .
. . .
. . .
. . .
. . .
. . .
. . .
. . .
.16
216
817
515
416
814
915
6
Long
-ter
m B
elgi
an g
over
nmen
t se
curit
ies
. . .
. . .
. . .
. . .
. . .
. . .
. . .
. . .
. . .
. . .
.10
711
110
186
7667
64
Shor
t-te
rm B
elgi
an g
over
nmen
t se
curit
ies
. . .
. . .
. . .
. . .
. . .
. . .
. . .
. . .
. . .
. . .
.19
2011
77
84
Long
-ter
m f
orei
gn g
over
nmen
t se
curit
ies
. . .
. . .
. . .
. . .
. . .
. . .
. . .
. . .
. . .
. . .
.35
3448
5479
7286
Shor
t-te
rm f
orei
gn g
over
nmen
t se
curit
ies
. . .
. . .
. . .
. . .
. . .
. . .
. . .
. . .
. . .
. . .
.1
215
76
32
Secu
ritie
s of
cre
dit
inst
itutio
ns
. . .
. . .
. . .
. . .
. . .
. . .
. . .
. . .
. . .
. . .
. . .
. . .
. . .
. .29
2943
4441
3434
Secu
ritie
s of
oth
er c
ompa
nies
. .
. . .
. . .
. . .
. . .
. . .
. . .
. . .
. . .
. . .
. . .
. . .
. . .
. . .
.31
4245
4950
5043
Non
-inte
rest
-bea
ring
secu
ritie
s .
. . .
. . .
. . .
. . .
. . .
. . .
. . .
. . .
. . .
. . .
. . .
. . .
. . .
.3
45
66
53
Tota
l tr
adin
g p
ort
folio
. .
. . .
. . .
. . .
. . .
. . .
. . .
. . .
. . .
. . .
. . .
. . .
. . .
. . .
. . .
. . .
2422
2743
5252
64
Gov
ernm
ent
secu
ritie
s po
rtfo
lio
. . .
. . .
. . .
. . .
. . .
. . .
. . .
. . .
. . .
. . .
. . .
. . .
. . .
.17
1316
2123
2323
Long
-ter
m B
elgi
an g
over
nmen
t se
curit
ies
. . .
. . .
. . .
. . .
. . .
. . .
. . .
. . .
. . .
. . .
.6
65
54
55
Shor
t-te
rm B
elgi
an g
over
nmen
t se
curit
ies
. . .
. . .
. . .
. . .
. . .
. . .
. . .
. . .
. . .
. . .
.4
24
54
33
Long
-ter
m f
orei
gn g
over
nmen
t se
curit
ies
. . .
. . .
. . .
. . .
. . .
. . .
. . .
. . .
. . .
. . .
.7
46
1114
1112
Shor
t-te
rm f
orei
gn g
over
nmen
t se
curit
ies
. . .
. . .
. . .
. . .
. . .
. . .
. . .
. . .
. . .
. . .
.0
00
12
32
Secu
ritie
s of
cre
dit
inst
itutio
ns
. . .
. . .
. . .
. . .
. . .
. . .
. . .
. . .
. . .
. . .
. . .
. . .
. . .
. .3
22
26
811
Secu
ritie
s of
oth
er c
ompa
nies
. .
. . .
. . .
. . .
. . .
. . .
. . .
. . .
. . .
. . .
. . .
. . .
. . .
. . .
.2
34
810
1314
Non
-inte
rest
-bea
ring
secu
ritie
s .
. . .
. . .
. . .
. . .
. . .
. . .
. . .
. . .
. . .
. . .
. . .
. . .
. . .
.1
36
1112
815
Tota
l p
ort
folio
. .
. . .
. . .
. . .
. . .
. . .
. . .
. . .
. . .
. . .
. . .
. . .
. . .
. . .
. . .
. . .
. . .
. . .
.24
926
529
529
631
729
130
1

78
TAB
LE8
BR
EAK
DO
WN
OF
OFF
-BA
LAN
CE-
SHEE
T FO
RW
AR
D O
PER
ATI
ON
S O
F B
ELG
IAN
CR
EDIT
IN
STIT
UTI
ON
S(1
)
(Dat
a on
a c
onso
lidat
ed b
asis
, bi
llion
s of
eur
o)
Sour
ce: B
FIC
.(1
)C
redi
t in
stitu
tions
gov
erne
d by
Bel
gian
law
and
bra
nche
s of
for
eign
cre
dit
inst
itutio
ns.
1997
1998
1999
2000
2001
2002
2003
Fore
ign
exc
han
ge
Forw
ard
exch
ange
ope
ratio
ns .
. . .
. . .
. . .
. . .
. . .
. . .
. . .
. . .
. . .
. . .
. . .
. . .
. . .
. .
598
536
328
268
266
297
311
Cur
renc
y fu
ture
s . .
. . .
. . .
. . .
. . .
. . .
. . .
. . .
. . .
. . .
. . .
. . .
. . .
. . .
. . .
. . .
. . .
. .
01
11
10
0
Forw
ard
exch
ange
rat
e co
ntra
cts
. . .
. . .
. . .
. . .
. . .
. . .
. . .
. . .
. . .
. . .
. . .
. . .
. . .
112
00
36
9
Inte
rest
and
cur
renc
y sw
aps
. . .
. . .
. . .
. . .
. . .
. . .
. . .
. . .
. . .
. . .
. . .
. . .
. . .
. . .
.48
4647
5157
6158
Cur
renc
y op
tions
. .
. . .
. . .
. . .
. . .
. . .
. . .
. . .
. . .
. . .
. . .
. . .
. . .
. . .
. . .
. . .
. . .
. .35
3126
3841
6991
Sub-
tota
l . .
. . .
. . .
. . .
. . .
. . .
. . .
. . .
. . .
. . .
. . .
. . .
. . .
. . .
. . .
. . .
. . .
. . .
. . .
. .
682
626
402
358
368
432
468
Inte
rest
rat
es
Inte
rest
rat
e co
ntra
cts
. . .
. . .
. . .
. . .
. . .
. . .
. . .
. . .
. . .
. . .
. . .
. . .
. . .
. . .
. . .
. . .
290
170
230
134
131
268
194
Inte
rest
rat
e fu
ture
s .
. . .
. . .
. . .
. . .
. . .
. . .
. . .
. . .
. . .
. . .
. . .
. . .
. . .
. . .
. . .
. . .
7771
7652
7486
82
Dep
osit
cont
ract
s .
. . .
. . .
. . .
. . .
. . .
. . .
. . .
. . .
. . .
. . .
. . .
. . .
. . .
. . .
. . .
. . .
. .10
52
35
15
Inte
rest
rat
e sw
aps
. . .
. . .
. . .
. . .
. . .
. . .
. . .
. . .
. . .
. . .
. . .
. . .
. . .
. . .
. . .
. . .
. .
951
1,01
01,
525
1,50
71,
880
2,52
82,
742
Inte
rest
rat
e op
tions
. .
. . .
. . .
. . .
. . .
. . .
. . .
. . .
. . .
. . .
. . .
. . .
. . .
. . .
. . .
. . .
. .
6512
017
437
555
074
388
9
Sub-
tota
l . .
. . .
. . .
. . .
. . .
. . .
. . .
. . .
. . .
. . .
. . .
. . .
. . .
. . .
. . .
. . .
. . .
. . .
. . .
. .
1,39
31,
376
2,00
62,
071
2,64
03,
627
3,91
2
Oth
ers
Oth
er f
orw
ard
cont
ract
s, f
utur
es a
nd s
wap
s . .
. . .
. . .
. . .
. . .
. . .
. . .
. . .
. . .
. . .
. .
1055
2525
2923
22
Oth
er o
ptio
ns
. . .
. . .
. . .
. . .
. . .
. . .
. . .
. . .
. . .
. . .
. . .
. . .
. . .
. . .
. . .
. . .
. . .
. . .
2260
7315
720
021
522
3
Sub-
tota
l . .
. . .
. . .
. . .
. . .
. . .
. . .
. . .
. . .
. . .
. . .
. . .
. . .
. . .
. . .
. . .
. . .
. . .
. . .
. .
3111
498
181
229
238
245
Tota
l .
. . .
. . .
. . .
. . .
. . .
. . .
. . .
. . .
. . .
. . .
. . .
. . .
. . .
. . .
. . .
. . .
. . .
. . .
. . .
. . .
.2,
107
2,11
62,
507
2,61
13,
237
4,29
74,
625
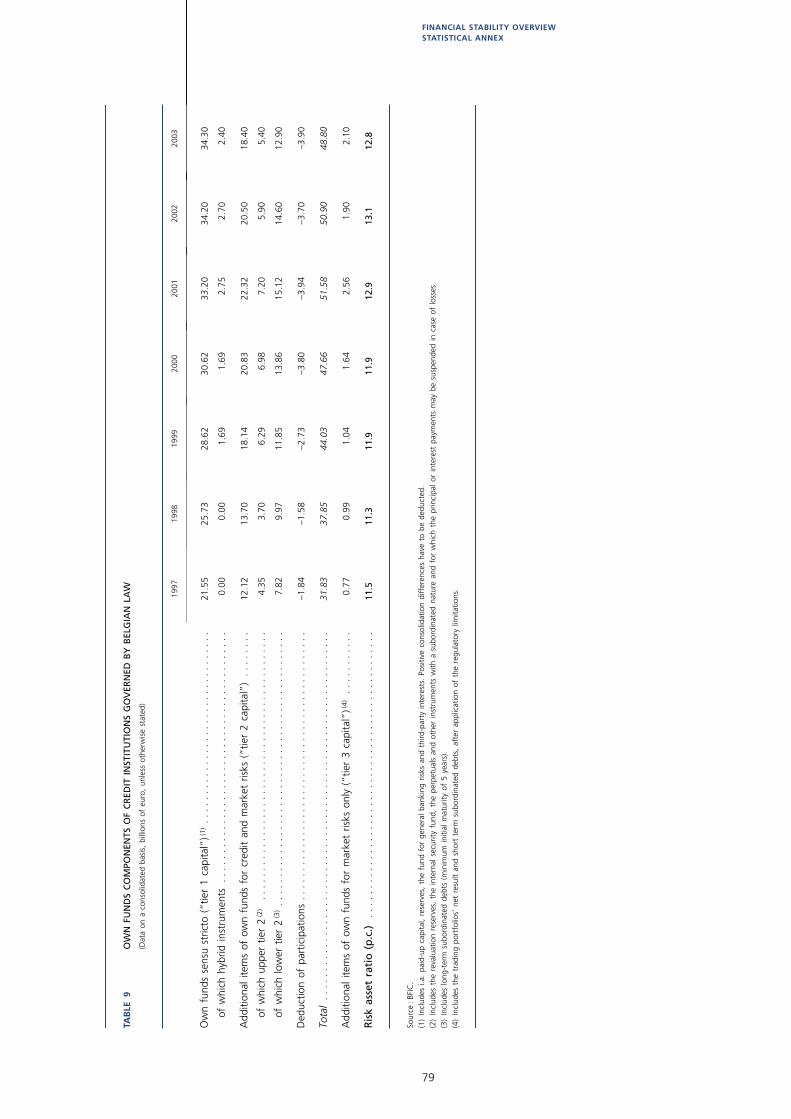
79
FINANCIAL STABILITY OVERVIEWSTATISTICAL ANNEX
TAB
LE9
OW
N F
UN
DS
CO
MPO
NEN
TS O
F C
RED
IT I
NST
ITU
TIO
NS
GO
VER
NED
BY
BEL
GIA
N L
AW
(Dat
a on
a c
onso
lidat
ed b
asis
, bi
llion
s of
eur
o, u
nles
s ot
herw
ise
stat
ed)
Sour
ce: B
FIC
.(1
)In
clud
es i
.a.
paid
-up
capi
tal,
rese
rves
, th
e fu
nd f
or g
ener
al b
anki
ng r
isks
and
thi
rd-p
arty
int
eres
ts.
Posi
tive
cons
olid
atio
n di
ffer
ence
s ha
ve t
o be
ded
ucte
d.(2
)In
clud
es t
he r
eval
uatio
n re
serv
es,
the
inte
rnal
sec
urity
fun
d, t
he p
erpe
tual
s an
d ot
her
inst
rum
ents
with
a s
ubor
dina
ted
natu
re a
nd f
or w
hich
the
prin
cipa
l or
int
eres
t pa
ymen
ts m
ay b
e su
spen
ded
in c
ase
of l
osse
s.(3
)In
clud
es l
ong-
term
sub
ordi
nate
d de
bts
(min
imum
ini
tial
mat
urity
of
5 ye
ars)
.(4
)In
clud
es t
he t
radi
ng p
ortf
olio
s’ n
et r
esul
t an
d sh
ort
term
sub
ordi
nate
d de
bts,
aft
er a
pplic
atio
n of
the
reg
ulat
ory
limita
tions
.
1997
1998
1999
2000
2001
2002
2003
Ow
n fu
nds
sens
u st
ricto
(“t
ier
1 ca
pita
l”)(
1) .
. . .
. . .
. . .
. . .
. . .
. . .
. . .
. . .
. . .
. . .
. .
21.5
525
.73
28.6
230
.62
33.2
034
.20
34.3
0
of w
hich
hyb
rid i
nstr
umen
ts .
. . .
. . .
. . .
. . .
. . .
. . .
. . .
. . .
. . .
. . .
. . .
. . .
. . .
. . .
0.00
0.00
1.69
1.69
2.75
2.70
2.40
Add
ition
al i
tem
s of
ow
n fu
nds
for
cred
it an
d m
arke
t ris
ks (
“tie
r 2
capi
tal”
) . .
. . .
. . .
12.1
213
.70
18.1
420
.83
22.3
220
.50
18.4
0
of w
hich
upp
er t
ier
2(2
) .
. . .
. . .
. . .
. . .
. . .
. . .
. . .
. . .
. . .
. . .
. . .
. . .
. . .
. . .
. . .
4.35
3.70
6.29
6.98
7.20
5.90
5.40
of w
hich
low
er t
ier
2(3
) . .
. . .
. . .
. . .
. . .
. . .
. . .
. . .
. . .
. . .
. . .
. . .
. . .
. . .
. . .
. . .
7.82
9.97
11.8
513
.86
15.1
214
.60
12.9
0
Ded
uctio
n of
par
ticip
atio
ns .
. . .
. . .
. . .
. . .
. . .
. . .
. . .
. . .
. . .
. . .
. . .
. . .
. . .
. . .
. . .
–1.8
4–1
.58
–2.7
3–3
.80
–3.9
4–3
.70
–3.9
0
Tota
l . .
. . .
. . .
. . .
. . .
. . .
. . .
. . .
. . .
. . .
. . .
. . .
. . .
. . .
. . .
. . .
. . .
. . .
. . .
. . .
. . .
.31
.83
37.8
544
.03
47.6
651
.58
50.9
048
.80
Add
ition
al i
tem
s of
ow
n fu
nds
for
mar
ket
risks
onl
y (“
tier
3 ca
pita
l”)(
4)
. . .
. . .
. . .
. .0.
770.
991.
041.
642.
561.
902.
10
Ris
k as
set
rati
o (
p.c
.)
. . .
. . .
. . .
. . .
. . .
. . .
. . .
. . .
. . .
. . .
. . .
. . .
. . .
. . .
. . .
. . .
.11
.511
.311
.911
.912
.913
.112
.8

80
TAB
LE10
CO
MPO
NEN
TS O
F TH
E IN
CO
ME
STA
TEM
ENT
OF
BEL
GIA
N C
RED
IT I
NST
ITU
TIO
NS
(1)
(Dat
a on
a c
onso
lidat
ed b
asis
, bi
llion
s of
eur
o)
Sour
ce: B
FIC
.(1
)C
redi
t in
stitu
tions
gov
erne
d by
Bel
gian
law
and
bra
nche
s of
for
eign
cre
dit
inst
itutio
ns.
(2)
Inco
me
from
equ
ities
and
oth
er v
aria
ble-
inte
rest
sec
uriti
es,
inco
me
from
fin
anci
al f
ixed
ass
ets,
res
ult
on t
he r
ealis
atio
n of
sec
uriti
es a
nd i
nves
tmen
t in
stru
men
ts a
nd n
et p
rofit
s or
los
ses
on t
radi
ng a
nd f
orei
gn-e
xcha
nge
oper
atio
ns.
(3)
Fee
inco
me
and
othe
r op
erat
ing
inco
me.
(4)
Incl
udin
g de
prec
iatio
n/am
ortis
atio
n on
int
angi
ble
and
tang
ible
fix
ed a
sset
s.(5
)G
roup
sha
re.
1997
1998
1999
2000
2001
2002
2003
Net
int
eres
t in
com
e .
. . .
. . .
. . .
. . .
. . .
. . .
. . .
. . .
. . .
. . .
. . .
. . .
. . .
. . .
. . .
. . .
. .9.
6110
.31
11.4
011
.73
12.2
612
.67
12.1
7
Inve
stm
ent
inco
me
othe
r th
an n
et i
nter
est
inco
me
(2)
. . .
. . .
. . .
. . .
. . .
. . .
. . .
. . .
. .2.
433.
502.
973.
303.
522.
732.
44
Oth
er i
ncom
e(3
) .
. . .
. . .
. . .
. . .
. . .
. . .
. . .
. . .
. . .
. . .
. . .
. . .
. . .
. . .
. . .
. . .
. . .
. .4.
355.
587.
7310
.44
10.0
19.
198.
23
Bank
ing
inco
me
. . .
. . .
. . .
. . .
. . .
. . .
. . .
. . .
. . .
. . .
. . .
. . .
. . .
. . .
. . .
. . .
. . .
. . .
16.3
819
.39
22.1
025
.47
25.7
924
.59
22.8
4
Ope
ratin
g ex
pens
es (
–)(4
) .
. . .
. . .
. . .
. . .
. . .
. . .
. . .
. . .
. . .
. . .
. . .
. . .
. . .
. . .
. . .
.11
.33
12.7
615
.46
18.3
819
.09
18.3
616
.89
(of
whi
ch p
erso
nnel
exp
ense
s)
. . .
. . .
. . .
. . .
. . .
. . .
. . .
. . .
. . .
. . .
. . .
. . .
. . .
. . .
.(5
.57)
(5.9
5)(6
.88)
(7.6
8)(8
.17)
(8.1
3)(7
.68)
Gro
ss o
pera
ting
resu
lts .
. . .
. . .
. . .
. . .
. . .
. . .
. . .
. . .
. . .
. . .
. . .
. . .
. . .
. . .
. . .
. . .
5.05
6.63
6.64
7.09
6.70
6.24
5.95
Val
ue a
djus
tmen
ts (
–) .
. . .
. . .
. . .
. . .
. . .
. . .
. . .
. . .
. . .
. . .
. . .
. . .
. . .
. . .
. . .
. . .
.2.
112.
291.
671.
511.
572.
171.
49
Exce
ptio
nal
resu
lts
. . .
. . .
. . .
. . .
. . .
. . .
. . .
. . .
. . .
. . .
. . .
. . .
. . .
. . .
. . .
. . .
. . .
.0.
45–0
.18
0.06
1.97
0.15
0.54
0.49
Inco
me
taxe
s an
d tr
ansf
ers
(–)
. . .
. . .
. . .
. . .
. . .
. . .
. . .
. . .
. . .
. . .
. . .
. . .
. . .
. . .
.1.
241.
431.
241.
981.
471.
071.
12
Port
ion
of t
he r
esul
t of
und
erta
king
s in
clud
ed i
n th
e co
nsol
idat
ed a
ccou
nts
acco
rdin
g to
the
equ
ity m
etho
d .
. . .
. . .
. . .
. . .
. . .
. . .
. . .
. . .
. . .
. . .
. . .
. . .
. . .
. . .
. . .
. .0.
110.
050.
190.
380.
340.
010.
32
Third
-par
ty i
nter
est
in t
he r
esul
t of
con
solid
ated
sub
sidi
arie
s (–
) .
. . .
. . .
. . .
. . .
. . .
.0.
150.
220.
300.
400.
380.
350.
16
Co
nso
lidat
ed r
esu
lts(
5)
. . .
. . .
. . .
. . .
. . .
. . .
. . .
. . .
. . .
. . .
. . .
. . .
. . .
. . .
. . .
. . .
2.11
2.56
3.68
5.55
3.77
3.19
3.98

81
FINANCIAL STABILITY OVERVIEWSTATISTICAL ANNEX
TAB
LE11
NU
MB
ER O
F B
ELG
IAN
IN
SUR
AN
CE
CO
MPA
NIE
S
Sour
ce: B
FIC
.(1
)C
ompa
nies
with
the
ir re
gist
ered
off
ice
in B
elgi
um c
ompr
ise
the
Belg
ian
subs
idia
ries
of f
orei
gn c
ompa
nies
.(2
)Be
lgia
n br
anch
es o
f co
mpa
nies
with
the
ir re
gist
ered
off
ice
in a
noth
er E
.E.A
. co
untr
y.(3
)Be
lgia
n br
anch
es o
f co
mpa
nies
with
the
ir re
gist
ered
off
ice
outs
ide
the
E.E.
A.
(4)
Prov
isio
n of
ins
uran
ce s
ervi
ces
with
out
an e
stab
lishm
ent
in B
elgi
um.
(5)
Incl
udin
g th
e Be
lgia
n br
anch
es o
f fo
reig
n in
sura
nce
com
pani
es.
1997
1998
1999
2000
2001
2002
2003
A.B
y th
e lo
cati
on
of
thei
r re
gis
tere
d o
ffic
e
Belg
ium
(1)
. . .
. . .
. . .
. . .
. . .
. . .
. . .
. . .
. . .
. . .
. . .
. . .
. . .
. . .
. . .
. . .
. . .
. . .
. . .
. .15
315
013
713
012
512
311
8
Euro
pean
Eco
nom
ic A
rea
(2)
. . .
. . .
. . .
. . .
. . .
. . .
. . .
. . .
. . .
. . .
. . .
. . .
. . .
. . .
. . .
8177
7973
7173
66
Rest
of
the
wor
ld(3
) .
. . .
. . .
. . .
. . .
. . .
. . .
. . .
. . .
. . .
. . .
. . .
. . .
. . .
. . .
. . .
. . .
. .8
76
66
65
Tota
l .
. . .
. . .
. . .
. . .
. . .
. . .
. . .
. . .
. . .
. . .
. . .
. . .
. . .
. . .
. . .
. . .
. . .
. . .
. . .
. . .
.24
223
422
220
920
220
218
9
Free
ser
vice
pro
visi
on(4
) .
. . .
. . .
. . .
. . .
. . .
. . .
. . .
. . .
. . .
. . .
. . .
. . .
. . .
. . .
. . .
. .47
052
555
658
961
362
967
0
B.
By
spec
ialis
atio
n(5
)
Life
ins
uran
ce
. . .
. . .
. . .
. . .
. . .
. . .
. . .
. . .
. . .
. . .
. . .
. . .
. . .
. . .
. . .
. . .
. . .
. . .
. .36
3431
2928
3031
Non
-life
ins
uran
ce .
. . .
. . .
. . .
. . .
. . .
. . .
. . .
. . .
. . .
. . .
. . .
. . .
. . .
. . .
. . .
. . .
. . .
.16
516
015
414
514
014
012
7
Life
and
non
-life
ins
uran
ce .
. . .
. . .
. . .
. . .
. . .
. . .
. . .
. . .
. . .
. . .
. . .
. . .
. . .
. . .
. . .
4140
3735
3432
31
Tota
l .
. . .
. . .
. . .
. . .
. . .
. . .
. . .
. . .
. . .
. . .
. . .
. . .
. . .
. . .
. . .
. . .
. . .
. . .
. . .
. . .
.24
223
422
220
920
220
218
9

82
TAB
LE12
MA
IN C
OM
PON
ENTS
OF
BEL
GIA
N I
NSU
RA
NC
E C
OM
PAN
IES’
ASS
ETS
(1)
(Dat
a on
a c
ompa
ny b
asis
, bi
llion
s of
eur
o)
Sour
ce: B
FIC
.(1
)In
sura
nce
com
pani
es s
uper
vise
d by
the
BFI
C.
(2)
Incl
udin
g sh
ares
in
UC
Is.
1997
1998
1999
2000
2001
2002
Inve
stm
ents
. .
. . .
. . .
. . .
. . .
. . .
. . .
. . .
. . .
. . .
. . .
. . .
. . .
. . .
. . .
. . .
. . .
. . .
. . .
. .65
.275
.086
.094
.910
3.8
110.
3
All
activ
ities
with
the
exc
eptio
n of
bra
nch
23 .
. . .
. . .
. . .
. . .
. . .
. . .
. . .
. . .
. . .
. .
64.0
71.8
77.5
81.7
87.3
94.6
Shar
es(2
) .
. . .
. . .
. . .
. . .
. . .
. . .
. . .
. . .
. . .
. . .
. . .
. . .
. . .
. . .
. . .
. . .
. . .
. . .
.8.
411
.813
.915
.718
.115
.8
Deb
t se
curit
ies
. . .
. . .
. . .
. . .
. . .
. . .
. . .
. . .
. . .
. . .
. . .
. . .
. . .
. . .
. . .
. . .
. . .
.38
.243
.148
.851
.153
.658
.9
Land
and
bui
ldin
gs
. . .
. . .
. . .
. . .
. . .
. . .
. . .
. . .
. . .
. . .
. . .
. . .
. . .
. . .
. . .
. . .
2.3
2.3
2.0
1.9
2.0
2.4
Mor
tgag
e lo
ans
. . .
. . .
. . .
. . .
. . .
. . .
. . .
. . .
. . .
. . .
. . .
. . .
. . .
. . .
. . .
. . .
. . .
5.5
5.3
5.0
5.0
5.3
5.9
Inve
stm
ents
in
affil
iate
d un
dert
akin
gs .
. . .
. . .
. . .
. . .
. . .
. . .
. . .
. . .
. . .
. . .
. . .
6.1
6.5
4.8
4.9
5.1
7.4
Oth
ers
. . .
. . .
. . .
. . .
. . .
. . .
. . .
. . .
. . .
. . .
. . .
. . .
. . .
. . .
. . .
. . .
. . .
. . .
. . .
.3.
52.
82.
93.
13.
24.
2
Bran
ch 2
3 . .
. . .
. . .
. . .
. . .
. . .
. . .
. . .
. . .
. . .
. . .
. . .
. . .
. . .
. . .
. . .
. . .
. . .
. . .
.1.
23.
28.
513
.216
.415
.8
Shar
es(2
) .
. . .
. . .
. . .
. . .
. . .
. . .
. . .
. . .
. . .
. . .
. . .
. . .
. . .
. . .
. . .
. . .
. . .
. . .
.0.
72.
37.
511
.914
.513
.1
Deb
t se
curit
ies
. . .
. . .
. . .
. . .
. . .
. . .
. . .
. . .
. . .
. . .
. . .
. . .
. . .
. . .
. . .
. . .
. . .
.0.
40.
60.
61.
01.
52.
1
Oth
ers
. . .
. . .
. . .
. . .
. . .
. . .
. . .
. . .
. . .
. . .
. . .
. . .
. . .
. . .
. . .
. . .
. . .
. . .
. . .
.0.
10.
30.
40.
30.
40.
6
Rein
sure
d pa
rt o
f te
chni
cal
prov
isio
ns
. . .
. . .
. . .
. . .
. . .
. . .
. . .
. . .
. . .
. . .
. . .
. . .
.4.
04.
14.
54.
85.
66.
0
Cla
ims
and
othe
r as
sets
. .
. . .
. . .
. . .
. . .
. . .
. . .
. . .
. . .
. . .
. . .
. . .
. . .
. . .
. . .
. . .
.7.
07.
58.
38.
69.
09.
8
Tota
l .
. . .
. . .
. . .
. . .
. . .
. . .
. . .
. . .
. . .
. . .
. . .
. . .
. . .
. . .
. . .
. . .
. . .
. . .
. . .
. . .
.76
.286
.698
.810
8.3
118.
412
6.1

83
FINANCIAL STABILITY OVERVIEWSTATISTICAL ANNEX
TAB
LE13
MA
IN C
OM
PON
ENTS
OF
BEL
GIA
N I
NSU
RA
NC
E C
OM
PAN
IES’
LIA
BIL
ITIE
S(1
)
(Dat
a on
a c
ompa
ny b
asis
, bi
llion
s of
eur
o)
Sour
ce: B
FIC
.(1
)In
sura
nce
com
pani
es s
uper
vise
d by
the
BFI
C.
1997
1998
1999
2000
2001
2002
Ow
n fu
nds
. . .
. . .
. . .
. . .
. . .
. . .
. . .
. . .
. . .
. . .
. . .
. . .
. . .
. . .
. . .
. . .
. . .
. . .
. . .
.8.
08.
57.
58.
18.
67.
9
Tech
nica
l pr
ovis
ions
. .
. . .
. . .
. . .
. . .
. . .
. . .
. . .
. . .
. . .
. . .
. . .
. . .
. . .
. . .
. . .
. . .
.61
.369
.181
.589
.999
.410
7.8
Life
ins
uran
ce (
with
the
exc
eptio
n of
bra
nch
23)
. . .
. . .
. . .
. . .
. . .
. . .
. . .
. . .
.39
.544
.750
.352
.557
.064
.8
Bran
ch 2
3 .
. . .
. . .
. . .
. . .
. . .
. . .
. . .
. . .
. . .
. . .
. . .
. . .
. . .
. . .
. . .
. . .
. . .
. . .
1.2
3.2
8.5
13.2
16.6
16.0
Non
-life
ins
uran
ce
. . .
. . .
. . .
. . .
. . .
. . .
. . .
. . .
. . .
. . .
. . .
. . .
. . .
. . .
. . .
. . .
.16
.817
.418
.720
.121
.422
.4
Oth
ers
. . .
. . .
. . .
. . .
. . .
. . .
. . .
. . .
. . .
. . .
. . .
. . .
. . .
. . .
. . .
. . .
. . .
. . .
. . .
.3.
93.
83.
94.
14.
44.
6
Rein
sura
nce
com
pani
es’
depo
sits
. .
. . .
. . .
. . .
. . .
. . .
. . .
. . .
. . .
. . .
. . .
. . .
. . .
. . .
2.0
2.1
2.0
2.0
2.3
2.3
Cre
dito
rs’
clai
ms
. . .
. . .
. . .
. . .
. . .
. . .
. . .
. . .
. . .
. . .
. . .
. . .
. . .
. . .
. . .
. . .
. . .
. . .
4.0
5.7
6.3
6.9
6.7
6.9
Oth
er l
iabi
litie
s .
. . .
. . .
. . .
. . .
. . .
. . .
. . .
. . .
. . .
. . .
. . .
. . .
. . .
. . .
. . .
. . .
. . .
. . .
0.8
1.2
1.5
1.4
1.3
1.2
Tota
l .
. . .
. . .
. . .
. . .
. . .
. . .
. . .
. . .
. . .
. . .
. . .
. . .
. . .
. . .
. . .
. . .
. . .
. . .
. . .
. . .
.76
.286
.698
.810
8.3
118.
412
6.1

84
TAB
LE14
CO
MPO
NEN
TS O
F TH
E IN
CO
ME
STA
TEM
ENT
OF
BEL
GIA
N I
NSU
RA
NC
E C
OM
PAN
IES
(1)
(Dat
a on
a c
ompa
ny b
asis
, bi
llion
s of
eur
o, u
nles
s ot
herw
ise
stat
ed)
Sour
ce: B
FIC
.(1
)In
sura
nce
com
pani
es s
uper
vise
d by
the
BFI
C.
1997
1998
1999
2000
2001
2002
A.T
ech
nic
al a
cco
un
t in
lif
e in
sura
nce
Net
pre
miu
ms
writ
ten
. . .
. . .
. . .
. . .
. . .
. . .
. . .
. . .
. . .
. . .
. . .
. . .
. . .
. . .
. . .
6.2
8.2
10.0
12.8
13.1
14.4
Cla
ims
paid
(–)
. .
. . .
. . .
. . .
. . .
. . .
. . .
. . .
. . .
. . .
. . .
. . .
. . .
. . .
. . .
. . .
. . .
.3.
43.
84.
34.
85.
46.
9
Cha
nge
in t
he p
rovi
sion
s fo
r cl
aim
s (–
) .
. . .
. . .
. . .
. . .
. . .
. . .
. . .
. . .
. . .
. . .
.4.
57.
28.
39.
17.
86.
4
Prem
ium
s af
ter
insu
ran
ce c
ost
s .
. . .
. . .
. . .
. . .
. . .
. . .
. . .
. . .
. . .
. . .
. . .
. .–1
.7–2
.8–2
.7–1
.1–0
.11.
2
Net
ope
ratin
g ex
pens
es (
–) .
. . .
. . .
. . .
. . .
. . .
. . .
. . .
. . .
. . .
. . .
. . .
. . .
. . .
. .
0.8
0.9
1.0
1.0
1.1
1.1
Res
ult
bef
ore
in
vest
men
t in
com
e .
. . .
. . .
. . .
. . .
. . .
. . .
. . .
. . .
. . .
. . .
. . .
–2.5
–3.6
–3.7
–2.2
–1.2
0.0
Net
inv
estm
ent
inco
me
. . .
. . .
. . .
. . .
. . .
. . .
. . .
. . .
. . .
. . .
. . .
. . .
. . .
. . .
. . .
3.1
4.7
4.8
3.2
2.0
–0.3
Tech
nic
al r
esu
lt l
ife
insu
ran
ce
. . .
. . .
. . .
. . .
. . .
. . .
. . .
. . .
. . .
. . .
. . .
. . .
.0.
71.
11.
21.
00.
8–0
.2
B.
Tech
nic
al a
cco
un
t in
no
n-l
ife
insu
ran
ce
Net
pre
miu
ms
writ
ten
. . .
. . .
. . .
. . .
. . .
. . .
. . .
. . .
. . .
. . .
. . .
. . .
. . .
. . .
. . .
6.5
6.7
7.0
7.3
7.8
8.5
Cla
ims
paid
(–)
. .
. . .
. . .
. . .
. . .
. . .
. . .
. . .
. . .
. . .
. . .
. . .
. . .
. . .
. . .
. . .
. . .
.4.
44.
65.
05.
35.
85.
9
Cha
nge
in t
he p
rovi
sion
s fo
r cl
aim
s (–
) .
. . .
. . .
. . .
. . .
. . .
. . .
. . .
. . .
. . .
. . .
.1.
00.
70.
70.
60.
90.
9
Prem
ium
s af
ter
insu
ran
ce c
ost
s .
. . .
. . .
. . .
. . .
. . .
. . .
. . .
. . .
. . .
. . .
. . .
. .1.
11.
41.
31.
41.
21.
7
Net
ope
ratin
g ex
pens
es (
–) .
. . .
. . .
. . .
. . .
. . .
. . .
. . .
. . .
. . .
. . .
. . .
. . .
. . .
. .
2.2
2.3
2.4
2.3
2.5
2.7
Res
ult
bef
ore
in
vest
men
t in
com
e .
. . .
. . .
. . .
. . .
. . .
. . .
. . .
. . .
. . .
. . .
. . .
–1.1
–0.9
–1.1
–0.9
–1.4
–1.0
Net
inv
estm
ent
inco
me
. . .
. . .
. . .
. . .
. . .
. . .
. . .
. . .
. . .
. . .
. . .
. . .
. . .
. . .
. . .
1.6
1.7
1.9
1.5
1.4
0.7
Tech
nic
al r
esu
lt n
on
-lif
e in
sura
nce
.
. . .
. . .
. . .
. . .
. . .
. . .
. . .
. . .
. . .
. . .
. .0.
50.
90.
80.
60.
0–0
.3
C.
No
n-t
ech
nic
al a
cco
un
t
Tota
l te
chni
cal
resu
lt lif
e an
d no
n-lif
e in
sura
nce
. . .
. . .
. . .
. . .
. . .
. . .
. . .
. . .
.1.
22.
02.
01.
60.
8–0
.5
Resi
dual
net
inv
estm
ent
inco
me
. . .
. . .
. . .
. . .
. . .
. . .
. . .
. . .
. . .
. . .
. . .
. . .
. .0.
61.
80.
60.
50.
60.
1
Oth
er a
nd e
xcep
tiona
l re
sults
and
tax
es .
. . .
. . .
. . .
. . .
. . .
. . .
. . .
. . .
. . .
. . .
.–0
.1–0
.9–0
.5–0
.3–0
.4–0
.4
Net
res
ult
. .
. . .
. . .
. . .
. . .
. . .
. . .
. . .
. . .
. . .
. . .
. . .
. . .
. . .
. . .
. . .
. . .
. . .
.1.
62.
92.
01.
71.
0–0
.8
p.m
.Ret
urn
on e
quity
(in
p.c
.) . .
. . .
. . .
. . .
. . .
. . .
. . .
. . .
. . .
. . .
. . .
. . .
. . .
.20
.134
.226
.921
.512
.1–1
0.4

85
FINANCIAL STABILITY OVERVIEWSTATISTICAL ANNEX
TAB
LE15
LEV
EL A
ND
CO
MPO
SITI
ON
OF
BEL
GIA
N I
NSU
RA
NC
E C
OM
PAN
IES’
AV
AIL
AB
LE S
OLV
ENC
Y M
AR
GIN
(1)
(Dat
a on
a c
ompa
ny b
asis
, m
illio
ns o
f eu
ro,
unle
ss o
ther
wis
e st
ated
)
Sour
ce: B
FIC
.(1
)In
sura
nce
com
pani
es s
uper
vise
d by
the
BFI
C.
1997
1998
1999
2000
2001
2002
2003
Expl
icit
mar
gin
. . .
. . .
. . .
. . .
. . .
. . .
. . .
. . .
. . .
. . .
. . .
. . .
. . .
. . .
. . .
. . .
. . .
. . .
.7,
983
8,36
17,
717
7,95
38,
555
8,23
810
,143
p.c.
of
requ
ired
mar
gin
. . .
. . .
. . .
. . .
. . .
. . .
. . .
. . .
. . .
. . .
. . .
. . .
. . .
. . .
. . .
. . .
252
242
200
194
197
173
196
Impl
icit
mar
gin
. . .
. . .
. . .
. . .
. . .
. . .
. . .
. . .
. . .
. . .
. . .
. . .
. . .
. . .
. . .
. . .
. . .
. . .
.1,
900
2,66
42,
585
2,89
43,
454
3,85
33,
302
Shar
e in
fut
ure
prof
its (
life
insu
ranc
e) .
. . .
. . .
. . .
. . .
. . .
. . .
. . .
. . .
. . .
. . .
. . .
. .
969
933
1,42
31,
667
1,96
81,
855
1,40
8
Unr
ealis
ed c
apita
l ga
ins
. . .
. . .
. . .
. . .
. . .
. . .
. . .
. . .
. . .
. . .
. . .
. . .
. . .
. . .
. . .
. .93
11,
731
1,16
21,
227
1,48
61,
998
1,89
4
p.c.
of
requ
ired
mar
gin
. . .
. . .
. . .
. . .
. . .
. . .
. . .
. . .
. . .
. . .
. . .
. . .
. . .
. . .
. . .
. . .
6077
6771
7981
64
Tota
l m
argi
n . .
. . .
. . .
. . .
. . .
. . .
. . .
. . .
. . .
. . .
. . .
. . .
. . .
. . .
. . .
. . .
. . .
. . .
. . .
.9,
884
11,0
2510
,302
10,8
4712
,008
12,0
9113
,445
p.c.
of
requ
ired
mar
gin
. . .
. . .
. . .
. . .
. . .
. . .
. . .
. . .
. . .
. . .
. . .
. . .
. . .
. . .
. . .
. . .
312
319
267
265
276
254
260

86
TAB
LE16
CO
MPO
SITI
ON
OF
BEL
GIA
N I
NSU
RA
NC
E C
OM
PAN
IES’
CO
VER
ING
ASS
ETS
FOR
ALL
TY
PES
OF
AC
TIV
ITIE
S(1
)(2)
(Dat
a on
a c
ompa
ny b
asis
, pe
rcen
tage
s of
tot
al c
over
ing
asse
ts u
nles
s ot
herw
ise
stat
ed)
Sour
ce: B
FIC
.(1
)A
sset
s al
loca
ted
to a
spe
cific
insu
ranc
e ac
tivity
as
a co
ver
for
the
prov
isio
ns r
esul
ting
from
tha
t ac
tivity
. C
over
ing
asse
ts a
re v
alue
d at
“af
fect
atio
n va
lue”
, w
hich
cor
resp
onds
to
the
mar
ket
valu
e fo
r m
ost
asse
ts,
but
is r
elat
ed t
o th
e hi
stor
ical
cos
t fo
r bo
nds
emitt
ed
by g
over
nmen
t bo
dies
.(2
)In
sura
nce
com
pani
es s
uper
vise
d by
the
BFI
C.
1997
1998
1999
2000
2001
2002
2003
Bond
s . .
. . .
. . .
. . .
. . .
. . .
. . .
. . .
. . .
. . .
. . .
. . .
. . .
. . .
. . .
. . .
. . .
. . .
. . .
. . .
. . .
53.4
52.5
49.9
48.4
48.1
50.0
52.8
Equi
ty
. . .
. . .
. . .
. . .
. . .
. . .
. . .
. . .
. . .
. . .
. . .
. . .
. . .
. . .
. . .
. . .
. . .
. . .
. . .
. . .
. .20
.725
.027
.325
.824
.114
.612
.7
Real
est
ate
. . .
. . .
. . .
. . .
. . .
. . .
. . .
. . .
. . .
. . .
. . .
. . .
. . .
. . .
. . .
. . .
. . .
. . .
. . .
.4.
94.
33.
33.
02.
83.
12.
8
Loan
s .
. . .
. . .
. . .
. . .
. . .
. . .
. . .
. . .
. . .
. . .
. . .
. . .
. . .
. . .
. . .
. . .
. . .
. . .
. . .
. . .
.8.
87.
15.
75.
65.
65.
64.
7
UC
Is
. . .
. . .
. . .
. . .
. . .
. . .
. . .
. . .
. . .
. . .
. . .
. . .
. . .
. . .
. . .
. . .
. . .
. . .
. . .
. . .
. . .
1.1
1.5
4.5
8.0
10.2
15.6
15.6
Oth
ers
. . .
. . .
. . .
. . .
. . .
. . .
. . .
. . .
. . .
. . .
. . .
. . .
. . .
. . .
. . .
. . .
. . .
. . .
. . .
. . .
.11
.19.
79.
39.
29.
311
.111
.3
Tota
l (b
illio
ns o
f eu
ro)
. . .
. . .
. . .
. . .
. . .
. . .
. . .
. . .
. . .
. . .
. . .
. . .
. . .
. . .
. . .
. . .
.61
.070
.083
.787
.998
.011
0.5
127.
6
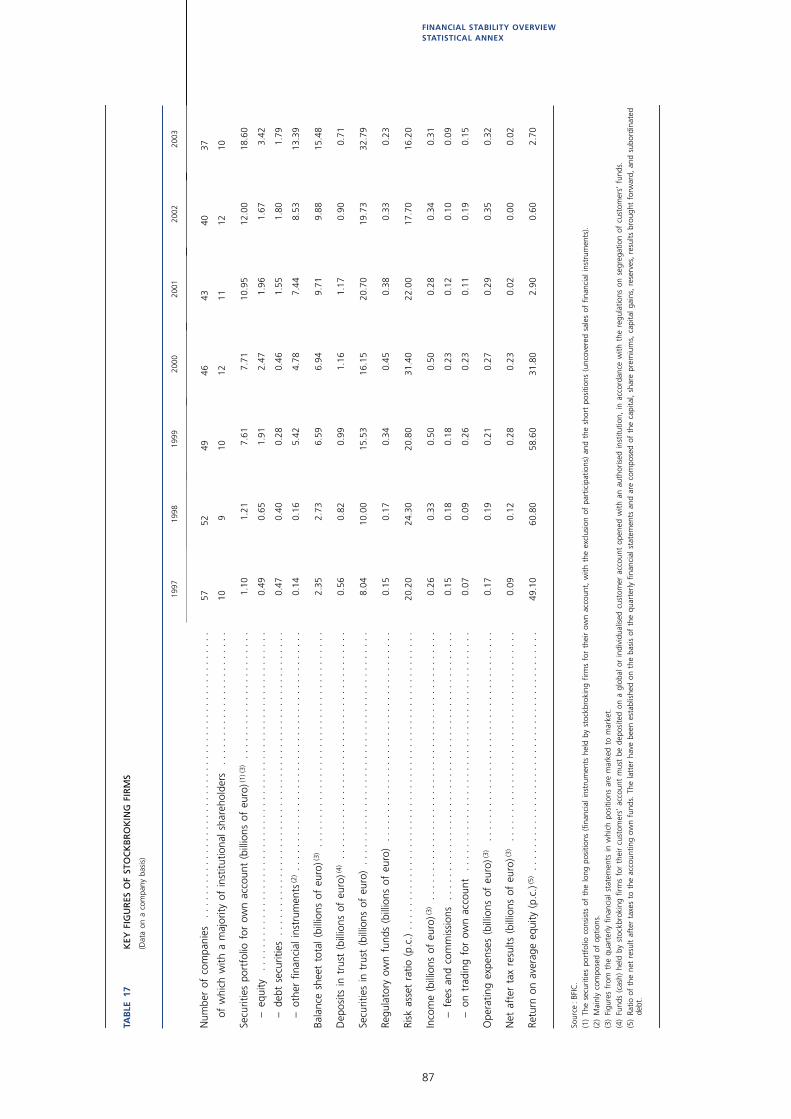
87
FINANCIAL STABILITY OVERVIEWSTATISTICAL ANNEX
TAB
LE17
KEY
FIG
UR
ES O
F ST
OC
KB
RO
KIN
G F
IRM
S
(Dat
a on
a c
ompa
ny b
asis
)
Sour
ce: B
FIC
.(1
)Th
e se
curit
ies
port
folio
con
sist
s of
the
lon
g po
sitio
ns (
finan
cial
ins
trum
ents
hel
d by
sto
ckbr
okin
g fir
ms
for
thei
r ow
n ac
coun
t, w
ith t
he e
xclu
sion
of
part
icip
atio
ns)
and
the
shor
t po
sitio
ns (
unco
vere
d sa
les
of f
inan
cial
ins
trum
ents
).(2
)M
ainl
y co
mpo
sed
of o
ptio
ns.
(3)
Figu
res
from
the
qua
rter
ly f
inan
cial
sta
tem
ents
in
whi
ch p
ositi
ons
are
mar
ked
to m
arke
t.(4
)Fu
nds
(cas
h) h
eld
by s
tock
brok
ing
firm
s fo
r th
eir
cust
omer
s’ a
ccou
nt m
ust
be d
epos
ited
on a
glo
bal
or i
ndiv
idua
lised
cus
tom
er a
ccou
nt o
pene
d w
ith a
n au
thor
ised
ins
titut
ion,
in
acco
rdan
ce w
ith t
he r
egul
atio
ns o
n se
greg
atio
n of
cus
tom
ers’
fun
ds.
(5)
Ratio
of
the
net
resu
lt af
ter
taxe
s to
the
acc
ount
ing
own
fund
s. T
he la
tter
hav
e be
en e
stab
lishe
d on
the
bas
is o
f th
e qu
arte
rly f
inan
cial
sta
tem
ents
and
are
com
pose
d of
the
cap
ital,
shar
e pr
emiu
ms,
cap
ital g
ains
, re
serv
es,
resu
lts b
roug
ht f
orw
ard,
and
sub
ordi
nate
d de
bt.
1997
1998
1999
2000
2001
2002
2003
Num
ber
of c
ompa
nies
. .
. . .
. . .
. . .
. . .
. . .
. . .
. . .
. . .
. . .
. . .
. . .
. . .
. . .
. . .
. . .
. .
5752
4946
4340
37
of w
hich
with
a m
ajor
ity o
f in
stitu
tiona
l sh
areh
olde
rs
. . .
. . .
. . .
. . .
. . .
. . .
. . .
. .10
910
1211
1210
Secu
ritie
s po
rtfo
lio f
or o
wn
acco
unt
(bill
ions
of
euro
)(1)
(3)
. . .
. . .
. . .
. . .
. . .
. . .
. . .
.1.
101.
217.
617.
7110
.95
12.0
018
.60
–eq
uity
. .
. . .
. . .
. . .
. . .
. . .
. . .
. . .
. . .
. . .
. . .
. . .
. . .
. . .
. . .
. . .
. . .
. . .
. . .
. .
0.49
0.65
1.91
2.47
1.96
1.67
3.42
–de
bt s
ecur
ities
. .
. . .
. . .
. . .
. . .
. . .
. . .
. . .
. . .
. . .
. . .
. . .
. . .
. . .
. . .
. . .
. . .
. .0.
470.
400.
280.
461.
551.
801.
79
–ot
her
finan
cial
ins
trum
ents
(2)
. . .
. . .
. . .
. . .
. . .
. . .
. . .
. . .
. . .
. . .
. . .
. . .
. . .
. .0.
140.
165.
424.
787.
448.
5313
.39
Bala
nce
shee
t to
tal
(bill
ions
of
euro
)(3) .
. . .
. . .
. . .
. . .
. . .
. . .
. . .
. . .
. . .
. . .
. . .
. . .
2.35
2.73
6.59
6.94
9.71
9.88
15.4
8
Dep
osits
in
trus
t (b
illio
ns o
f eu
ro)(
4)
. . .
. . .
. . .
. . .
. . .
. . .
. . .
. . .
. . .
. . .
. . .
. . .
. . .
0.56
0.82
0.99
1.16
1.17
0.90
0.71
Secu
ritie
s in
tru
st (
billi
ons
of e
uro)
. .
. . .
. . .
. . .
. . .
. . .
. . .
. . .
. . .
. . .
. . .
. . .
. . .
. .8.
0410
.00
15.5
316
.15
20.7
019
.73
32.7
9
Regu
lato
ry o
wn
fund
s (b
illio
ns o
f eu
ro)
. . .
. . .
. . .
. . .
. . .
. . .
. . .
. . .
. . .
. . .
. . .
. . .
0.15
0.17
0.34
0.45
0.38
0.33
0.23
Risk
ass
et r
atio
(p.
c.)
. . .
. . .
. . .
. . .
. . .
. . .
. . .
. . .
. . .
. . .
. . .
. . .
. . .
. . .
. . .
. . .
. . .
20.2
024
.30
20.8
031
.40
22.0
017
.70
16.2
0
Inco
me
(bill
ions
of
euro
)(3)
. . .
. . .
. . .
. . .
. . .
. . .
. . .
. . .
. . .
. . .
. . .
. . .
. . .
. . .
. . .
.0.
260.
330.
500.
500.
280.
340.
31
–fe
es a
nd c
omm
issi
ons
. . .
. . .
. . .
. . .
. . .
. . .
. . .
. . .
. . .
. . .
. . .
. . .
. . .
. . .
. . .
.0.
150.
180.
180.
230.
120.
100.
09
–on
tra
ding
for
ow
n ac
coun
t .
. . .
. . .
. . .
. . .
. . .
. . .
. . .
. . .
. . .
. . .
. . .
. . .
. . .
.0.
070.
090.
260.
230.
110.
190.
15
Ope
ratin
g ex
pens
es (
billi
ons
of e
uro)
(3)
. . .
. . .
. . .
. . .
. . .
. . .
. . .
. . .
. . .
. . .
. . .
. . .
0.17
0.19
0.21
0.27
0.29
0.35
0.32
Net
aft
er t
ax r
esul
ts (
billi
ons
of e
uro)
(3)
. . .
. . .
. . .
. . .
. . .
. . .
. . .
. . .
. . .
. . .
. . .
. . .
0.09
0.12
0.28
0.23
0.02
0.00
0.02
Retu
rn o
n av
erag
e eq
uity
(p.
c.)(
5) .
. . .
. . .
. . .
. . .
. . .
. . .
. . .
. . .
. . .
. . .
. . .
. . .
. . .
.49
.10
60.8
058
.60
31.8
02.
900.
602.
70

88
TAB
LE18
KEY
FIG
UR
ES O
F PO
RTF
OLI
O M
AN
AG
EMEN
T C
OM
PAN
IES
(Dat
a on
a c
ompa
ny b
asis
)
Sour
ce: B
FIC
.
1997
1998
1999
2000
2001
2002
2003
Num
ber
of c
ompa
nies
. .
. . .
. . .
. . .
. . .
. . .
. . .
. . .
. . .
. . .
. . .
. . .
. . .
. . .
. . .
. . .
. .
1623
2731
3433
30
of w
hich
with
a m
ajor
ity o
f in
stitu
tiona
l sh
areh
olde
rs
. . .
. . .
. . .
. . .
. . .
. . .
. . .
. .3
810
1317
1615
Ass
ets
unde
r m
anag
emen
t (b
illio
ns o
f eu
ro)
. . .
. . .
. . .
. . .
. . .
. . .
. . .
. . .
. . .
. . .
. .
15.6
458
.36
99.6
417
4.09
144.
1913
5.63
183.
27
Bala
nce
shee
t to
tal
(bill
ions
of
euro
) .
. . .
. . .
. . .
. . .
. . .
. . .
. . .
. . .
. . .
. . .
. . .
. . .
.0.
020.
080.
370.
660.
670.
771.
08
Ow
n fu
nds
(bill
ions
of
euro
) . .
. . .
. . .
. . .
. . .
. . .
. . .
. . .
. . .
. . .
. . .
. . .
. . .
. . .
. . .
.0.
010.
030.
250.
400.
420.
430.
65
Inco
me
(bill
ions
of
euro
) . .
. . .
. . .
. . .
. . .
. . .
. . .
. . .
. . .
. . .
. . .
. . .
. . .
. . .
. . .
. . .
.0.
010.
070.
200.
500.
550.
580.
77
Ope
ratin
g ex
pens
es (
billi
ons
of e
uro)
. .
. . .
. . .
. . .
. . .
. . .
. . .
. . .
. . .
. . .
. . .
. . .
. . .
0.01
0.04
0.11
0.33
0.37
0.27
0.48
Net
aft
er t
ax r
esul
ts (
billi
ons
of e
uro)
. .
. . .
. . .
. . .
. . .
. . .
. . .
. . .
. . .
. . .
. . .
. . .
. . .
0.00
0.02
0.05
0.12
0.13
0.22
0.21
Retu
rn o
n av
erag
e eq
uity
(p.
c.)
. . .
. . .
. . .
. . .
. . .
. . .
. . .
. . .
. . .
. . .
. . .
. . .
. . .
. . .
38.9
079
.10
21.5
030
.00
31.5
050
.20
32.9
0
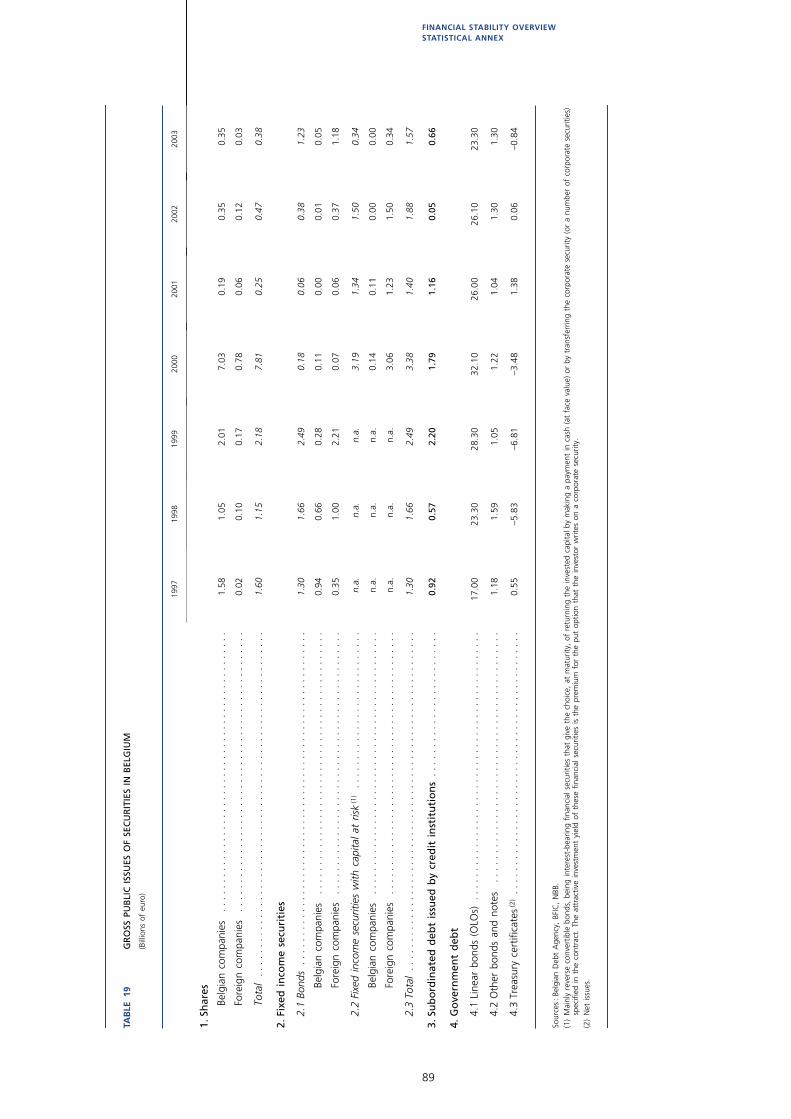
89
FINANCIAL STABILITY OVERVIEWSTATISTICAL ANNEX
TAB
LE19
GR
OSS
PU
BLI
C I
SSU
ES O
F SE
CU
RIT
IES
IN B
ELG
IUM
(Bill
ions
of
euro
)
Sour
ces:
Bel
gian
Deb
t A
genc
y, B
FIC
, N
BB.
(1)
Mai
nly
reve
rse
conv
ertib
le b
onds
, be
ing
inte
rest
-bea
ring
finan
cial
sec
uriti
es t
hat
give
the
cho
ice,
at
mat
urity
, of
ret
urni
ng t
he in
vest
ed c
apita
l by
mak
ing
a pa
ymen
t in
cas
h (a
t fa
ce v
alue
) or
by
tran
sfer
ring
the
corp
orat
e se
curit
y (o
r a
num
ber
of c
orpo
rate
sec
uriti
es)
spec
ified
in
the
cont
ract
. Th
e at
trac
tive
inve
stm
ent
yiel
d of
the
se f
inan
cial
sec
uriti
es i
s th
e pr
emiu
m f
or t
he p
ut o
ptio
n th
at t
he i
nves
tor
writ
es o
n a
corp
orat
e se
curit
y.(2
)N
et i
ssue
s.
1997
1998
1999
2000
2001
2002
2003
1.Sh
ares
Belg
ian
com
pani
es
. . .
. . .
. . .
. . .
. . .
. . .
. . .
. . .
. . .
. . .
. . .
. . .
. . .
. . .
. . .
. . .
1.58
1.05
2.01
7.03
0.19
0.35
0.35
Fore
ign
com
pani
es
. . .
. . .
. . .
. . .
. . .
. . .
. . .
. . .
. . .
. . .
. . .
. . .
. . .
. . .
. . .
. . .
0.02
0.10
0.17
0.78
0.06
0.12
0.03
Tota
l . .
. . .
. . .
. . .
. . .
. . .
. . .
. . .
. . .
. . .
. . .
. . .
. . .
. . .
. . .
. . .
. . .
. . .
. . .
. . .
1.60
1.15
2.18
7.81
0.25
0.47
0.38
2.Fi
xed
in
com
e se
curi
ties
2.1
Bond
s . .
. . .
. . .
. . .
. . .
. . .
. . .
. . .
. . .
. . .
. . .
. . .
. . .
. . .
. . .
. . .
. . .
. . .
. . .
.1.
301.
662.
490.
180.
060.
381.
23
Belg
ian
com
pani
es
. . .
. . .
. . .
. . .
. . .
. . .
. . .
. . .
. . .
. . .
. . .
. . .
. . .
. . .
. . .
0.94
0.66
0.28
0.11
0.00
0.01
0.05
Fore
ign
com
pani
es
. . .
. . .
. . .
. . .
. . .
. . .
. . .
. . .
. . .
. . .
. . .
. . .
. . .
. . .
. . .
0.35
1.00
2.21
0.07
0.06
0.37
1.18
2.2
Fixe
d in
com
e se
curit
ies
with
cap
ital a
t ris
k(1
) .
. . .
. . .
. . .
. . .
. . .
. . .
. . .
. . .
. .n.
a.n.
a.n.
a.3.
191.
341.
500.
34
Belg
ian
com
pani
es
. . .
. . .
. . .
. . .
. . .
. . .
. . .
. . .
. . .
. . .
. . .
. . .
. . .
. . .
. . .
n.a.
n.a.
n.a.
0.14
0.11
0.00
0.00
Fore
ign
com
pani
es
. . .
. . .
. . .
. . .
. . .
. . .
. . .
. . .
. . .
. . .
. . .
. . .
. . .
. . .
. . .
n.a.
n.a.
n.a.
3.06
1.23
1.50
0.34
2.3
Tota
l . .
. . .
. . .
. . .
. . .
. . .
. . .
. . .
. . .
. . .
. . .
. . .
. . .
. . .
. . .
. . .
. . .
. . .
. . .
. .
1.30
1.66
2.49
3.38
1.40
1.88
1.57
3.Su
bo
rdin
ated
deb
t is
sued
by
cred
it i
nst
itu
tio
ns
. . .
. . .
. . .
. . .
. . .
. . .
. . .
. . .
.0.
920.
572.
201.
791.
160.
050.
66
4.G
ove
rnm
ent
deb
t
4.1
Line
ar b
onds
(O
LOs)
. .
. . .
. . .
. . .
. . .
. . .
. . .
. . .
. . .
. . .
. . .
. . .
. . .
. . .
. . .
. .17
.00
23.3
028
.30
32.1
026
.00
26.1
023
.30
4.2
Oth
er b
onds
and
not
es
. . .
. . .
. . .
. . .
. . .
. . .
. . .
. . .
. . .
. . .
. . .
. . .
. . .
. . .
.1.
181.
591.
051.
221.
041.
301.
30
4.3
Trea
sury
cer
tific
ates
(2)
. . .
. . .
. . .
. . .
. . .
. . .
. . .
. . .
. . .
. . .
. . .
. . .
. . .
. . .
. . .
0.55
–5.8
3–6
.81
–3.4
81.
380.
06–0
.84
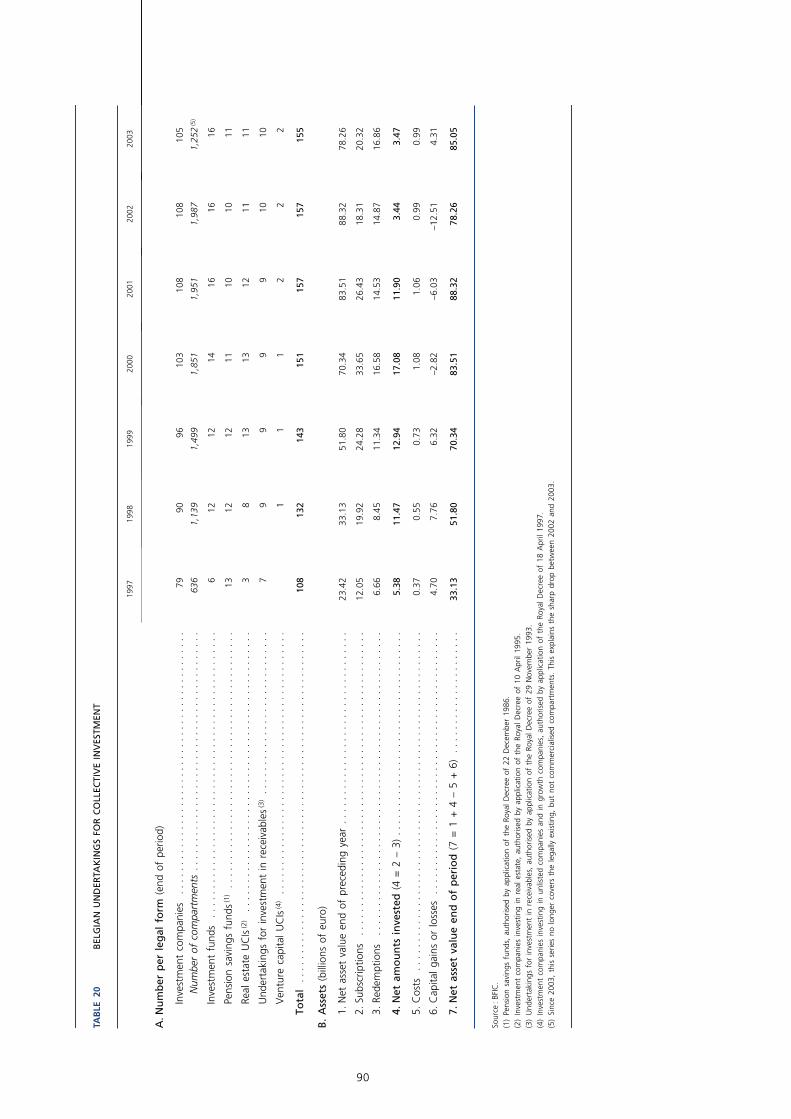
90
TAB
LE20
BEL
GIA
N U
ND
ERTA
KIN
GS
FOR
CO
LLEC
TIV
E IN
VES
TMEN
T
Sour
ce: B
FIC
.(1
)Pe
nsio
n sa
ving
s fu
nds,
aut
horis
ed b
y ap
plic
atio
n of
the
Roy
al D
ecre
e of
22
Dec
embe
r 19
86.
(2)
Inve
stm
ent
com
pani
es i
nves
ting
in r
eal
esta
te,
auth
oris
ed b
y ap
plic
atio
n of
the
Roy
al D
ecre
e of
10
Apr
il 19
95.
(3)
Und
erta
king
s fo
r in
vest
men
t in
rec
eiva
bles
, au
thor
ised
by
appl
icat
ion
of t
he R
oyal
Dec
ree
of 2
9 N
ovem
ber
1993
.(4
)In
vest
men
t co
mpa
nies
inv
estin
g in
unl
iste
d co
mpa
nies
and
in
grow
th c
ompa
nies
, au
thor
ised
by
appl
icat
ion
of t
he R
oyal
Dec
ree
of 1
8 A
pril
1997
.(5
)Si
nce
2003
, th
is s
erie
s no
lon
ger
cove
rs t
he l
egal
ly e
xist
ing,
but
not
com
mer
cial
ised
com
part
men
ts.
This
exp
lain
s th
e sh
arp
drop
bet
wee
n 20
02 a
nd 2
003.
1997
1998
1999
2000
2001
2002
2003
A.N
um
ber
per
leg
al f
orm
(en
d of
per
iod)
Inve
stm
ent
com
pani
es
. . .
. . .
. . .
. . .
. . .
. . .
. . .
. . .
. . .
. . .
. . .
. . .
. . .
. . .
. . .
7990
9610
310
810
810
5
Num
ber
of c
ompa
rtm
ents
. .
. . .
. . .
. . .
. . .
. . .
. . .
. . .
. . .
. . .
. . .
. . .
. . .
. . .
636
1,13
91,
499
1,85
11,
951
1,98
71,
252
(5)
Inve
stm
ent
fund
s .
. . .
. . .
. . .
. . .
. . .
. . .
. . .
. . .
. . .
. . .
. . .
. . .
. . .
. . .
. . .
. . .
612
1214
1616
16
Pens
ion
savi
ngs
fund
s(1)
. . .
. . .
. . .
. . .
. . .
. . .
. . .
. . .
. . .
. . .
. . .
. . .
. . .
. . .
. .13
1212
1110
1011
Real
est
ate
UC
Is(2
) .
. . .
. . .
. . .
. . .
. . .
. . .
. . .
. . .
. . .
. . .
. . .
. . .
. . .
. . .
. . .
. .3
813
1312
1111
Und
erta
king
s fo
r in
vest
men
t in
rec
eiva
bles
(3)
. . .
. . .
. . .
. . .
. . .
. . .
. . .
. . .
. . .
.7
99
99
1010
Ven
ture
cap
ital
UC
Is(4
) . .
. . .
. . .
. . .
. . .
. . .
. . .
. . .
. . .
. . .
. . .
. . .
. . .
. . .
. . .
.1
11
22
2
Tota
l .
. . .
. . .
. . .
. . .
. . .
. . .
. . .
. . .
. . .
. . .
. . .
. . .
. . .
. . .
. . .
. . .
. . .
. . .
. . .
. .10
813
214
315
115
715
715
5
B.
Ass
ets
(bill
ions
of
euro
)
1.N
et a
sset
val
ue e
nd o
f pr
eced
ing
year
. .
. . .
. . .
. . .
. . .
. . .
. . .
. . .
. . .
. . .
. . .
.23
.42
33.1
351
.80
70.3
483
.51
88.3
278
.26
2.Su
bscr
iptio
ns
. . .
. . .
. . .
. . .
. . .
. . .
. . .
. . .
. . .
. . .
. . .
. . .
. . .
. . .
. . .
. . .
. . .
.12
.05
19.9
224
.28
33.6
526
.43
18.3
120
.32
3.Re
dem
ptio
ns
. . .
. . .
. . .
. . .
. . .
. . .
. . .
. . .
. . .
. . .
. . .
. . .
. . .
. . .
. . .
. . .
. . .
.6.
668.
4511
.34
16.5
814
.53
14.8
716
.86
4.N
et a
mo
un
ts i
nve
sted
(4
= 2
– 3
) . .
. . .
. . .
. . .
. . .
. . .
. . .
. . .
. . .
. . .
. . .
. . .
5.38
11.4
712
.94
17.0
811
.90
3.44
3.47
5.C
osts
. .
. . .
. . .
. . .
. . .
. . .
. . .
. . .
. . .
. . .
. . .
. . .
. . .
. . .
. . .
. . .
. . .
. . .
. . .
. .
0.37
0.55
0.73
1.08
1.06
0.99
0.99
6.C
apita
l ga
ins
or l
osse
s . .
. . .
. . .
. . .
. . .
. . .
. . .
. . .
. . .
. . .
. . .
. . .
. . .
. . .
. . .
.4.
707.
766.
32–2
.82
–6.0
3–1
2.51
4.31
7.N
et a
sset
val
ue
end
of
per
iod
(7
= 1
+ 4
– 5
+ 6
) . .
. . .
. . .
. . .
. . .
. . .
. . .
.33
.13
51.8
070
.34
83.5
188
.32
78.2
685
.05

91
FINANCIAL STABILITY OVERVIEWSTATISTICAL ANNEX
TAB
LE21
FOR
EIG
N U
ND
ERTA
KIN
GS
FOR
CO
LLEC
TIV
E IN
VES
TMEN
T D
ISTR
IBU
TED
IN
BEL
GIU
M
Sour
ce: B
FIC
.
1997
1998
1999
2000
2001
2002
2003
A.N
um
ber
of
un
der
taki
ng
s (e
nd o
f pe
riod)
per
leg
al f
orm
Inve
stm
ent
com
pani
es
. . .
. . .
. . .
. . .
. . .
. . .
. . .
. . .
. . .
. . .
. . .
. . .
. . .
. . .
. . .
165
177
178
188
198
194
197
Num
ber
of c
ompa
rtm
ents
. .
. . .
. . .
. . .
. . .
. . .
. . .
. . .
. . .
. . .
. . .
. . .
. . .
. . .
1,25
41,
487
1,72
11,
901
2,02
92,
036
2,06
7
Inve
stm
ent
fund
s .
. . .
. . .
. . .
. . .
. . .
. . .
. . .
. . .
. . .
. . .
. . .
. . .
. . .
. . .
. . .
. . .
6773
7976
7670
70
Tota
l .
. . .
. . .
. . .
. . .
. . .
. . .
. . .
. . .
. . .
. . .
. . .
. . .
. . .
. . .
. . .
. . .
. . .
. . .
. . .
232
250
257
264
274
264
267
per
cat
ego
ry
Und
erta
king
s w
ith U
CIT
-pas
spor
t . .
. . .
. . .
. . .
. . .
. . .
. . .
. . .
. . .
. . .
. . .
. . .
. .
188
206
219
227
239
230
218
Num
ber
of c
ompa
rtm
ents
. .
. . .
. . .
. . .
. . .
. . .
. . .
. . .
. . .
. . .
. . .
. . .
. . .
. . .
1,03
61,
282
1,53
01,
732
1,88
01,
891
1,92
5
Und
erta
king
s w
ithou
t U
CIT
-pas
spor
t .
. . .
. . .
. . .
. . .
. . .
. . .
. . .
. . .
. . .
. . .
. . .
4444
3837
3534
49
Num
ber
of c
ompa
rtm
ents
. .
. . .
. . .
. . .
. . .
. . .
. . .
. . .
. . .
. . .
. . .
. . .
. . .
. . .
218
205
191
169
149
145
142
Tota
l .
. . .
. . .
. . .
. . .
. . .
. . .
. . .
. . .
. . .
. . .
. . .
. . .
. . .
. . .
. . .
. . .
. . .
. . .
. . .
232
250
257
264
274
264
267
B.
Net
am
ou
nts
in
vest
ed (
billi
ons
of e
uro)
Sub
scri
pti
on
s in
Bel
giu
m
Inve
stm
ent
com
pani
es
. . .
. . .
. . .
. . .
. . .
. . .
. . .
. . .
. . .
. . .
. . .
. . .
. . .
. . .
. . .
9.05
10.6
912
.95
14.4
69.
8812
.08
12.1
4
Inve
stm
ent
fund
s .
. . .
. . .
. . .
. . .
. . .
. . .
. . .
. . .
. . .
. . .
. . .
. . .
. . .
. . .
. . .
. . .
0.16
0.11
0.19
0.12
0.05
0.32
0.03
Tota
l .
. . .
. . .
. . .
. . .
. . .
. . .
. . .
. . .
. . .
. . .
. . .
. . .
. . .
. . .
. . .
. . .
. . .
. . .
. . .
9.21
10.8
013
.14
14.5
79.
9212
.39
12.1
7
Red
emp
tio
ns
in B
elg
ium
Inve
stm
ent
com
pani
es
. . .
. . .
. . .
. . .
. . .
. . .
. . .
. . .
. . .
. . .
. . .
. . .
. . .
. . .
. . .
7.25
9.15
9.66
15.3
410
.70
11.4
111
.89
Inve
stm
ent
fund
s .
. . .
. . .
. . .
. . .
. . .
. . .
. . .
. . .
. . .
. . .
. . .
. . .
. . .
. . .
. . .
. . .
0.12
0.09
0.11
0.11
0.04
0.17
0.05
Tota
l .
. . .
. . .
. . .
. . .
. . .
. . .
. . .
. . .
. . .
. . .
. . .
. . .
. . .
. . .
. . .
. . .
. . .
. . .
. . .
7.37
9.24
9.78
15.4
510
.73
11.5
811
.94
Net
am
ou
nts
in
vest
ed i
n B
elg
ium
Inve
stm
ent
com
pani
es
. . .
. . .
. . .
. . .
. . .
. . .
. . .
. . .
. . .
. . .
. . .
. . .
. . .
. . .
. . .
1.81
1.54
3.29
–0.8
8–0
.82
0.67
0.26
Inve
stm
ent
fund
s .
. . .
. . .
. . .
. . .
. . .
. . .
. . .
. . .
. . .
. . .
. . .
. . .
. . .
. . .
. . .
. . .
0.04
0.02
0.07
0.01
0.01
0.14
–0.0
2
Tota
l .
. . .
. . .
. . .
. . .
. . .
. . .
. . .
. . .
. . .
. . .
. . .
. . .
. . .
. . .
. . .
. . .
. . .
. . .
. . .
1.85
1.56
3.36
–0.8
8–0
.81
0.81
0.24

92
TAB
LE22
BR
EAK
DO
WN
OF
UN
DER
TAK
ING
S FO
R C
OLL
ECTI
VE
INV
ESTM
ENT
DIS
TRIB
UTE
D I
N B
ELG
IUM
AC
CO
RD
ING
TO
IN
VES
TMEN
T ST
RA
TEG
Y
(Bill
ions
of
euro
)
Sour
ce: B
EAM
A.
1997
1998
1999
2000
2001
2002
2003
Bond
s . .
. . .
. . .
. . .
. . .
. . .
. . .
. . .
. . .
. . .
. . .
. . .
. . .
. . .
. . .
. . .
. . .
. . .
. . .
. . .
. . .
27.5
030
.63
30.2
529
.88
32.8
331
.22
31.7
3
Med
ium
ter
m i
nves
tmen
ts
. . .
. . .
. . .
. . .
. . .
. . .
. . .
. . .
. . .
. . .
. . .
. . .
. . .
. . .
. . .
.1.
831.
411.
341.
041.
441.
751.
89
Mon
etar
y in
vest
men
ts
. . .
. . .
. . .
. . .
. . .
. . .
. . .
. . .
. . .
. . .
. . .
. . .
. . .
. . .
. . .
. . .
.6.
154.
864.
563.
805.
036.
295.
71
Equi
ty
. . .
. . .
. . .
. . .
. . .
. . .
. . .
. . .
. . .
. . .
. . .
. . .
. . .
. . .
. . .
. . .
. . .
. . .
. . .
. . .
. .10
.44
18.5
531
.98
40.2
637
.36
24.7
126
.72
Inde
x w
ith c
apita
l pr
otec
tion
. . .
. . .
. . .
. . .
. . .
. . .
. . .
. . .
. . .
. . .
. . .
. . .
. . .
. . .
. .
9.95
19.7
727
.01
27.6
329
.20
31.7
735
.90
Mix
ed
. . .
. . .
. . .
. . .
. . .
. . .
. . .
. . .
. . .
. . .
. . .
. . .
. . .
. . .
. . .
. . .
. . .
. . .
. . .
. . .
. .7.
3312
.30
17.7
624
.65
27.0
021
.95
22.8
5
Pens
ion
savi
ngs
fund
s . .
. . .
. . .
. . .
. . .
. . .
. . .
. . .
. . .
. . .
. . .
. . .
. . .
. . .
. . .
. . .
. . .
5.81
7.98
7.95
7.68
7.41
6.40
7.42
Real
est
ate
. . .
. . .
. . .
. . .
. . .
. . .
. . .
. . .
. . .
. . .
. . .
. . .
. . .
. . .
. . .
. . .
. . .
. . .
. . .
.1.
172.
353.
143.
053.
273.
393.
85
Ven
ture
cap
ital
. . .
. . .
. . .
. . .
. . .
. . .
. . .
. . .
. . .
. . .
. . .
. . .
. . .
. . .
. . .
. . .
. . .
. . .
.0.
000.
060.
050.
130.
130.
070.
08
Mis
cella
neou
s . .
. . .
. . .
. . .
. . .
. . .
. . .
. . .
. . .
. . .
. . .
. . .
. . .
. . .
. . .
. . .
. . .
. . .
. . .
0.01
0.03
0.04
0.10
0.03
0.02
0.02
Tota
l .
. . .
. . .
. . .
. . .
. . .
. . .
. . .
. . .
. . .
. . .
. . .
. . .
. . .
. . .
. . .
. . .
. . .
. . .
. . .
. . .
.70
.19
97.9
412
4.08
138.
2214
3.70
127.
5713
6.17

93
THEMATIC ARTICLES
Thematic Articles
95
CORPORATE GOVERNANCE, REGULATION AND SUPERVISION OF BANKS
1. Introduction
Ever since fi rms grew large and became funded by a vari-ety of investors, they have had to deal with the separation of ownership and control and the associated agency prob-lems. Various corporate governance arrangements try to limit these problems as effi ciently as possible. Recently, corporate crises such as Enron and Worldcom in the US and Parmalat in Italy moved the corporate governance debate to the forefront of public policy on both sides of the Atlantic. (1)
Most of the corporate governance debate has empha-sised the governance of non-fi nancial corporations, while little attention has been paid to the corporate governance of banks. Yet, corporate governance of banks differs from that of non-fi nancial fi rms. In banks, debt holders are dis-persed and non-experts, which limits the effectiveness of debt governance arrangements traditional in non-fi nan-cial fi rms. In addition, the high proportion of debts in the total liabilities, and the resulting high leverage, facilitate risk shifting by shareholders. Hence there is a need for a representative of depositors to “mimic” the role taken by debt holders in non-fi nancial fi rms. Typically, this role will be performed by a regulatory and supervisory authority (hereafter called the “RSA”).
The stance taken in this paper goes beyond the usual effi -ciency concern that underpins the corporate governance debate. Instead, we take a banking stability perspective. In particular, we stress that managers may be more risk averse than shareholders. Hence, it may be in the interest of the RSA to put more power in the hands of management vis-à-vis the shareholders. This is in contrast to traditional corporate governance recommendations for non-fi nancial
Corporate governance, regulation and supervision of banks
fi rms. In some countries, managerial control is legally pos-sible through structures such as trusts. However, in others it is associated with dispersed shareholder structures. Here, however, another concern may be the stability of share-holders when share ownership is dispersed. In this case, it may be diffi cult to oblige shareholders to bail-in (2) ailing banks in the event of under-capitalisation. This raises some trade-offs between various shareholder structures and the relative power of managers vis-à-vis shareholders. In par-ticular, shareholder structure, management incentives and the structure of the board of directors are evaluated with respect to their impact on a bank’s risk.
The Belgian supervisory model tries to balance the respec-tive power of shareholders and management by introducing the agreement on the autonomy of bank management. (3)
This agreement tries to combine the presence of strong ref-erence shareholders with independent bank management. Initially, in 1959, it was meant to avoid shareholders’ inter-vention in the credit policy of the bank (the risk of this kind of intervention was especially present in banks owned by an industrial holding company). The agreement was revised in 1992 to take account of a changing banking environ-ment. However, the banking sector is still evolving. Capital markets and fi nancial regulation are becoming more and more internationally oriented, and so are shareholders. The presence of industrial holding companies in the Belgian banking landscape is tending to decrease. On the other hand, we observe an increase in fi nancial conglomerates.
(1) See Shleifer and Vishny (1997) and Becht et al. (2004) for surveys of the academic literature on corporate governance.
(2) We refer to a bail-in as a situation in which shareholders have to provide additional capital to the bank in case of problems and to a bail-out as a situation in which the bank is recapitalised by an external party (e.g. the state, the regulators, etc.)
(3) Protocole d’autonomie de la fonction bancaire / Overeenkomst over de autonomie in de bankfunctie.
Johan Devriese, Mathias Dewatripont, Dirk Heremans and Grégory Nguyen
96
In parallel with these evolutions, banks have also modifi ed their governance structures over time. These modifi cations are to be seen as a response to pressures brought by the market to adapt to international standards and best prac-tices. These observations raise several interesting questions. Is there still a need for an autonomy agreement ? Is the agreement still optimal in the light of the recent develop-ments in the banking landscape ? Does it overlap with or contradict EU and national law ? Is it still manageable in a changing environment where foreign shareholders pre-dominate ? These questions are very complex, as corporate governance mechanisms result from a subtle equilibrium. The goal of this paper is to present a framework which allows for the conceptualisation of these issues. Therefore, the paper will provide an answer to some of these ques-tions although others will remain unresolved.
The paper is structured as follows. Section 2 presents the theory on corporate governance in banking. Departing from the general framework for non-fi nancial organisa-tions, it discusses why agency confl icts in banks are dif-ferent and what the implications are for fi nancial regula-tion. Section 3 analyses how the appropriate corporate governance structure can help to solve these agency confl icts. Shareholder structure, management incentives and the structure of the board of directors are evaluated with respect to their impact on a bank’s risk. In addition, several boxes in Section 3 present evidence on the gov-ernance of Belgian banks at the end of 2003.(4) Section 4 discusses and analyses the agreement on the autonomy of bank management in the light of Sections 2 and 3. Section 5 concludes.
2. Corporate governance and banking : theory
2.1 Corporate governance in general
The general “corporate fi nance” problem facing busi-ness undertakings is the one of raising fi nance effi ciently. This means raising fi nance in a way that limits the agency problems arising from the separation between owner-ship and control. This separation, stressed originally by Berle and Means (1932), leads to classical problems identifi ed for example in Jensen and Meckling (1976). For instance, when outside fi nance is needed, manage-ment efforts partly serve to repay outside investors. Thus, managers earn less than the full return on their effort, so that their incentive to exert effort is low. In a competitive capital market, managers end up bearing the cost of this distorted effort. Therefore, it is in both parties’ interest to set up governance mechanisms that limit agency distortions.
Governance mechanisms are associated with the different liabilities issued by the fi rm. They can be thought of as bundles of income rights as well as rights of control over the fi rm. In the real world, two standard liabilities are prevalent, with a variety of specifi c features in both cases : debt and equity. Debt implies a payment that is concave in the profi t of the fi rm, and control of the fi rm is only given to debt holders in the case of lack of repayment (i.e. in “bad times”). The presence of debt leads to the possibility of excessive risk taking if management favours the inter-est of shareholders. Indeed, equity implies a payment that is convex in the profi t of the fi rm; equity benefi ts from formal control (in the case of voting equity) unless debt is not repaid. This is explained in more detail in Box 1.
(4) Bank governance is constantly evolving and some banks have announced their intention to change their governance structure. Therefore, as the evidence that is presented refl ects the situation at the end of 2003, it may no longer be accurate at the time of publication.
Box 1 – Risk Shifting
Figure 1.1 presents the pay-off of shareholders and debt holders under different outcomes of cash fl ow (CF) for a leveraged fi rm. There are two states of the world, i.e. b (bad, or bankruptcy) and g (good, or continuity), each with probability 0.5. As long as CF < CF* (bad state), there is not enough cash fl ow to repay all debt obligations D, hence the fi rm goes bankrupt and debt holders are in control. They receive CF. Shareholders receive nothing. From the moment CF ≥ CF* (good state), the fi rm can repay its debt. Debt holders receive D, shareholders receive CF-D.
Now suppose the manager of the fi rm is also the owner or acts in the owner’s interest and has to choose between two projects, 1 and 2. The CF of each project depends on the state of the world and equals qi
j (i = 1,2 and j = b, g). Both projects have the same Net Present Value (NPV), i.e. 0.5q1
g + 0.5q1b = 0.5q2
g + 0.5q2b. However, q1
g < q2g and
q1b > q2
b. This means that q1g – q1
b < q2g – q2
b , implying that project 2 is riskier than project 1. Now look at the !
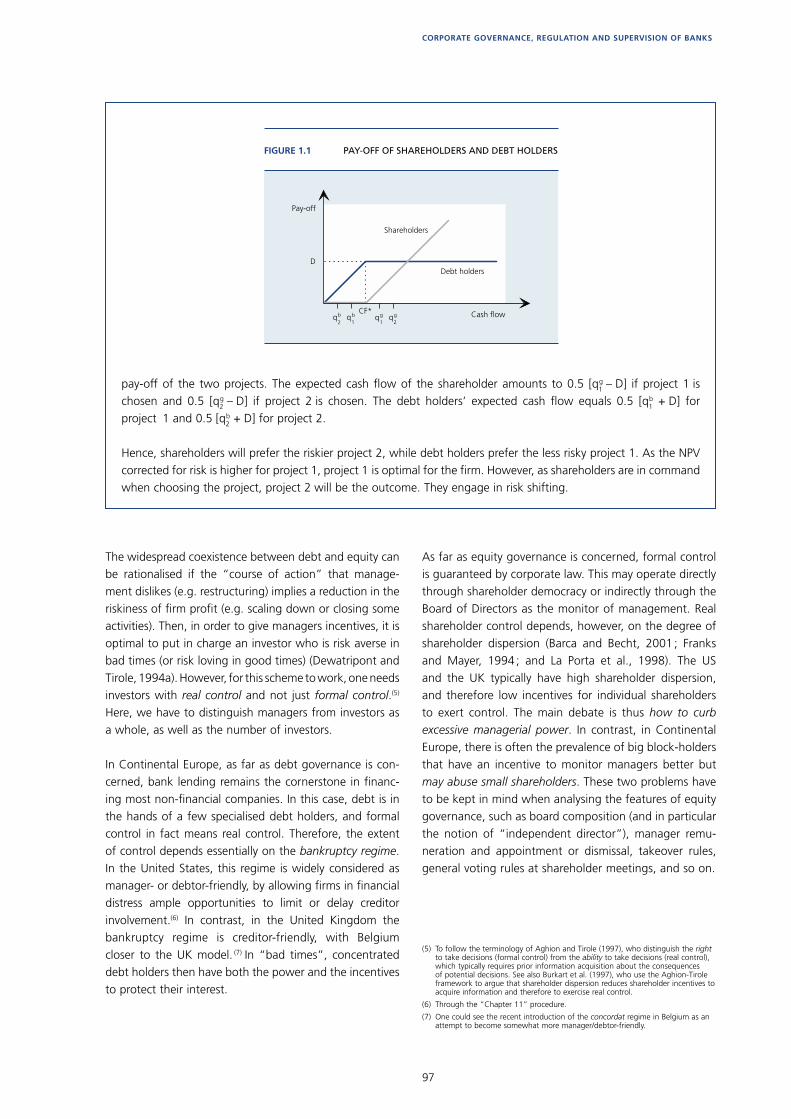
97
CORPORATE GOVERNANCE, REGULATION AND SUPERVISION OF BANKS
The widespread coexistence between debt and equity can be rationalised if the “course of action” that manage-ment dislikes (e.g. restructuring) implies a reduction in the riskiness of fi rm profi t (e.g. scaling down or closing some activities). Then, in order to give managers incentives, it is optimal to put in charge an investor who is risk averse in bad times (or risk loving in good times) (Dewatripont and Tirole, 1994a). However, for this scheme to work, one needs investors with real control and not just formal control.(5) Here, we have to distinguish managers from investors as a whole, as well as the number of investors.
In Continental Europe, as far as debt governance is con-cerned, bank lending remains the cornerstone in fi nanc-ing most non-fi nancial companies. In this case, debt is in the hands of a few specialised debt holders, and formal control in fact means real control. Therefore, the extent of control depends essentially on the bankruptcy regime. In the United States, this regime is widely considered as manager- or debtor-friendly, by allowing fi rms in fi nancial distress ample opportunities to limit or delay creditor involvement.(6) In contrast, in the United Kingdom the bankruptcy regime is creditor-friendly, with Belgium closer to the UK model. (7) In “bad times”, concentrated debt holders then have both the power and the incentives to protect their interest.
As far as equity governance is concerned, formal control is guaranteed by corporate law. This may operate directly through shareholder democracy or indirectly through the Board of Directors as the monitor of management. Real shareholder control depends, however, on the degree of shareholder dispersion (Barca and Becht, 2001 ; Franks and Mayer, 1994 ; and La Porta et al., 1998). The US and the UK typically have high shareholder dispersion, and therefore low incentives for individual shareholders to exert control. The main debate is thus how to curb excessive managerial power. In contrast, in Continental Europe, there is often the prevalence of big block-holders that have an incentive to monitor managers better but may abuse small shareholders. These two problems have to be kept in mind when analysing the features of equity governance, such as board composition (and in particular the notion of “independent director”), manager remu-neration and appointment or dismissal, takeover rules, general voting rules at shareholder meetings, and so on.
pay-off of the two projects. The expected cash fl ow of the shareholder amounts to 0.5 [q1g – D] if project 1 is
chosen and 0.5 [q2g – D] if project 2 is chosen. The debt holders’ expected cash fl ow equals 0.5 [q1
b + D] for project 1 and 0.5 [q2
b + D] for project 2.
Hence, shareholders will prefer the riskier project 2, while debt holders prefer the less risky project 1. As the NPV corrected for risk is higher for project 1, project 1 is optimal for the fi rm. However, as shareholders are in command when choosing the project, project 2 will be the outcome. They engage in risk shifting.
FIGURE 1.1 PAY-OFF OF SHAREHOLDERS AND DEBT HOLDERS
Pay-off
Shareholders
Debt holders
Cash flow
D
q2b qb
CF*1 1 2
g gq q
(5) To follow the terminology of Aghion and Tirole (1997), who distinguish the right to take decisions (formal control) from the ability to take decisions (real control), which typically requires prior information acquisition about the consequences of potential decisions. See also Burkart et al. (1997), who use the Aghion-Tirole framework to argue that shareholder dispersion reduces shareholder incentives to acquire information and therefore to exercise real control.
(6) Through the “Chapter 11” procedure.
(7) One could see the recent introduction of the concordat regime in Belgium as an attempt to become somewhat more manager/debtor-friendly.
98
2.2 Corporate governance and banking (8)
What is special about banks that justifi es they are regu-lated differently from other fi rms ? First, “systemic risk” in case of failure is often invoked to justify regulation. Note that the same argument may hold in other strate-gic industries or in cases where failure of a big fi rm has important repercussions on an entire region because of cascade effects on suppliers, creditors and even small and medium-sized fi rms that do a substantial share of their business with the laid-off employees of the failing fi rm. Strategic industries (such as the electricity sector, for instance) are often regulated as well. Yet this is not necessarily the case for big fi rms whose failure could cause cascade effects. Therefore, systemic risk per se does not fully separate banks from these big fi rms. One could, however, argue that the nature of fi nancial systems makes the occurrence of contagion effects more likely and the macro-economic consequences more widespread (for instance, interbank linkages and payment systems are natural channels for contagion).
A second element concerns the high leverage of banks. A higher percentage of debt used in the capital struc-ture implies a higher possibility of risk shifting and debt overhang.
A third key specifi city of fi nancial institutions concerns their governance, because of the nature of its claim hol-ders. In non-fi nancial companies, debt holders are often banks themselves, which have the necessary expertise and play an important role in disciplining management in the case of fi nancial distress, e.g. in order to avoid “gambling for resurrection”. By contrast, fi nancial insti-tutions have liabilities held by dispersed non-experts, namely depositors. In such cases, there is a need for a debt holder representative, which is a fundamen-tal role for the RSA. (9) The same is true for insurance companies or pension funds, two sets of institutions whose regulation shares many similarities with banking regulation (see Dewatripont and Tirole, 1994b). Exiting, however, is easier for depositors than for policy holders. Therefore, we can expect that depositors exert discipline by voting with their feet, while insurance policy holders have an incentive to control ex-ante.
The need for a strong depositor representative is espe-cially great the more the credit institution is allowed to take risks. Such risks are prevalent in banking since, beyond their essential role in payment systems, another banking function is to provide liquidity for individu-als, through demand deposits. Avoiding systemic risk through self-fulfi lling panics has required at least partial deposit insurance, which further reduces depositors’
incentives to become expert in assessing the risks taken by their bank and creates moral hazard. This increases the need for regulation limiting the ability of shareholders to “play with the money of the deposit insurance fund”.
There are several ways in which the RSA acts as debt holder representative.
First, by imposing several sets of constraints on fi nancial institutions, which serve to ensure their solvency and to avoid systemic externalities. (i) Regulation of market structure may limit competition and hence increase char-ter value and improve stability. (ii) Prudential regulation sets limits on the structure of fi nancial institutions’ liabili-ties, in the form of “capital requirements” and limits on the riskiness of their asset portfolio. (iii) Additional “good practice” requirements aim at improving the governance of the fi nancial institution. The paper mainly focuses on this last element. Second, ex-post, by threatening a “get-tough-policy” when these are not respected, with the RSA taking control and possibly closing or selling the fi nancial institution. This broadly mimics the role of debt as a contingent control arrangement in non-fi nancial fi rms, where control over the fi rm switches to creditors in bad times.
3. Bank Governance structures : implications for risk management and stability
Financial regulators increasingly acknowledge the impor-tance of corporate governance. While Basel I determines capital requirements by defi ning capital weights for differ-ent categories of assets, Basel II allows some use of internal risk modelling techniques. This signals a partial move from a “regulatory” to a more “supervisory” approach by the RSA. (10) In turn, the RSA needs to rely more on the supervi-sion of the procedures having an impact on these internal models. The organisation of these procedures relies heavily on the specifi cs of the corporate governance of banks.
The need to focus on the corporate governance of banks is also partly the result of the gradual elimination of activ-ity restrictions, limiting the scope of banking activities. While the 1930’s had seen the widespread introduction
(8) For details, see Dewatripont and Tirole (1994b) and Heremans (2000).
(9) While these regulators are civil servants, “private representatives” would be possible, in the same way that dispersed shareholders have representatives through the Board of Directors.
(10) A regulatory approach focuses primarily on the assessment of the quality of the bank’s balance sheet at a point in time, and then determines whether the bank complies with capital requirements and restrictions on asset holdings. A supervisory approach focuses more on the soundness of the bank’s management practices with regard to controlling risk (Mishkin, 2000).
99
CORPORATE GOVERNANCE, REGULATION AND SUPERVISION OF BANKS
of activity restrictions as a way to limit the possibility of contagion in the banking sector, many of these have been lifted since the 1970’s and the subsequent deregulation. In Belgium this has resulted in a banking landscape where most banking activities are conducted as part of “bancas-surance” conglomerates. The complex nature of poten-tial spill-overs between business lines then calls for the supervision of internal risk procedures as a complement to more “standard” banking regulation and also suggests strengthened co-operation between RSA in banking and insurance industries.
The problem facing the RSA can be summarised as fol-lows : while modern banking regulation of the Basel I type is the natural counterpart to the debt-and-equity governance of non-fi nancial fi rms, it is not foolproof in a world of deregulated banks and accounting lags. Limitations on the effectiveness of regulation imply that excessive risk taking by banks remains a real problem. Hence, the goal of banking supervision is to complement regulations to further limit excessive risk taking. The supervision of banks’ corporate governance structures can be analysed in this light. This implies that particular emphasis should be placed on the risk attitudes of the parties exerting real control over banking decisions and how these attitudes and relative powers can be infl u-enced (through fi nancial incentives, through “bail-in”obligations, etc.).
We now turn to the impact of corporate governance structures, such as ownership structure, board compo-sition and management incentives, on risk taking and stability of the banking sector. In doing this, we follow Berle and Means (1932), Jensen and Meckling (1976), Aghion and Bolton (1992) or Hart (1995a, b). They view organisational decisions as being determined by the power and the incentives of the different parties involved. Corporate governance structures infl uence these incentives and powers. Beyond this, we should remember that, in banks, apart from managers and shareholders, the party potentially in control is the debt holder representative, the RSA, rather than debt hold-ers themselves. Moreover, another difference in relation to the stance taken in the literature on non-banking organisations is that we do not discuss the organisa-tion of corporate governance structures from the point of view of profi t maximisation. Rather, we perform the analysis from the RSA’s point of view, that is, the enhancement of fi nancial stability. This being said, we shall draw both from the literature of non-fi nancial fi rms and from the (much smaller) literature devoted to banking organisations.
3.1 Risk attitudes and the control of corporations
As stressed in Section 2, in non-fi nancial corporations, formal control lies with risk-loving shareholders in good times and with risk-averse debt holders in bad times. In the banking context, due to the high leverage and dis-persed debt holders, there is a concern that shareholders may face greater risk taking incentives than sharehold-ers of non-fi nancial fi rms. Indeed, in the absence of regulatory intervention, given the high leverage and the dispersion of debt holders, shareholders benefi t from a higher potential for risk-shifting and gambling for resurrection.
But what about managers, when they enjoy real control ? One could argue that, in a typical fi rm, managers would be intrinsically more risk averse than shareholders, for two reasons. First, they stand to lose invested specifi c human capital and, in some cases, invested wealth if the bank goes bankrupt. A second reason concerns the possibility of diversifying. Managers tie up all their human capital in the fi rm, so their degree of diversifi cation is limited. Hence, they care about the total risk of the fi rm, i.e. systematic and idiosyncratic risk. Diversifi ed shareholders on the other hand only care about systematic risk. Therefore, they could intuitively tolerate more risk than managers would be willing to accept.
The above argument implicitly assumes the absence of an RSA and the existence of a fi xed compensation scheme for managers. Things can change when managers start receiving performance-based pay. With regard to the cash fl ow effect, managers face a trade-off between future cash fl ows generated by specifi c human capital invested in the fi rm and additional cash fl ows generated by increased performance resulting from increased risk taking. When linked to share prices, managerial incentives become more aligned with those of shareholders, even though the above considerations imply that the manager may remain more risk averse than shareholders. Things can, however, be different when managers are paid with stock-options, whose value can be very sensitive to the volatility of the underlying stock. In fact, above a certain threshold of option-based pay, managers may receive more incentives to take risks than shareholders. This is especially the case when options have a high exercise value and are out of the money.
From the RSA’s point of view, one can thus say that, except for very high-powered incentive schemes, mana-gerial control should reduce excessive risk taking. This may no longer be true when option-based pay is very signifi cant. This type of remuneration is more likely the more diversifi ed shareholders are, because diversifi cation
100
increases their tolerance to risk. Banking stability concerns therefore provide an argument for :– favouring managerial control over shareholder control
when managerial pay is not too sensitive to share prices ;
– limiting option-based managerial compensation. (11)
In practice, several studies have found that regulatory frameworks infl uence the impact of both (i) managerial ownership and (ii) pay-performance scheme on risk taking and performance in banks.
Saunders, Strock and Travlos (1990) use a sample of 38 US bank holding companies over 1978-1985, a period of rel-ative deregulation. They fi nd that banks whose managers hold a relatively large portion of the shares exhibit a signif-icantly higher risk taking behaviour. Anderson and Fraser (2000) use a panel of 150 US banks covering the period 1987-1994. They fi nd that total and fi rm-specifi c risk are positively related to managerial ownership between 1987 and 1989. On the other hand, they also fi nd that, after regulatory changes in 1989 and 1991 (which were designed to reduce risk taking and led to higher franchise values), bank risk was negatively related to managerial shareholdings (i.e. over 1992-1994). Systematic risk was unrelated to ownership in both periods. Lee (2002) uses a sample of 65 bank holding companies over the period 1987-1996 and fi nds that risk taking in banks where managers hold a large proportion of shares is more pronounced for banks with a relatively low probability of failure. This is in line with the diversifi cation argument.
Houston and James (1995) use a sample of 134 banks covering the period 1980-1990. They fi nd that, compared to CEOs in other industries, bank CEOs receive in abso-lute value less cash compensation (although their cash compensation is more sensitive to fi rm performance), are less likely to participate in a stock option plan, hold fewer stock options and receive a smaller percentage of their total compensation in the form of options and stock. They fi nd no evidence that the total pay-performance sensitivity is higher in banking and no signifi cant relation between the reliance on equity-based compensation and bank risk. They conclude that shareholders do not use CEO equity-based compensation to promote risk taking, but cannot rule out alternative mechanisms (e.g. cash-based compen-sation) as incentives for managers to increase risk taking. They attribute this to the fact that banks are regulated.
John and Qian (2003) use a sample of 123 banks over 1992-2000 and fi nd that the pay-performance sensitiv-ity of bank management seems to be lower than in other industries. They fi nd that an increase of $ 1000 in shareholder value triggers an increase of $ 4.7 in the fi rm-related wealth of bank CEOs vs. $ 17.5 for non-bank CEOs (i.e. a statistically signifi cant difference of $ 12.8). They attribute this result to the fact that the banking industry has high debt ratios and is regulated.
3.2 Equity governance
The real power of shareholders depends very much on its degree of dispersion. As long ago as 1932, Berle and Means called attention to the prevalence of widely held corporations in the US, in which ownership was dispersed among small shareholders, and real control was concen-trated in the hands of managers. As stressed by Barca and Becht (2001), Franks and Mayer (1994) or La Porta et al. (1998), publicly-traded fi rms in Continental Europe are pre-dominantly controlled by “block-holders”. This shifts the corporate governance debate away from a shareholder-manager confl ict, as controlling shareholders face strong incentives to monitor managers and maximise profi ts when they retain substantial cash-fl ow rights in addition to con-trol. A new concern arises however : the risk of expropria-tion of minority shareholders by block-holders.
As far as banking stability is concerned, the structure of ownership also matters for its impact on the riskiness of the bank. When shareholders acquire real control by holding substantial voting rights, it is easier for them to push man-agers to engage in risk shifting (Harm, 2002, Caprio and Levine, 2002) and increases the potential to extract private benefi ts (Bebchuk, 1999). However, in the case of fi nancial distress, a bail-in may be easier to organise when there is a well-identifi ed block-holder, which may in turn induce him to take less risk (Bolton and von Thadden, 1998 and Hagelin, 2003). As already stressed, shareholder dispersion thus has a potentially ambiguous effect on banking stability (see also Saunders, Strock and Travlos, 1990).
In the case of dispersed ownership, individual sharehold-ers have little incentive to monitor managers and would rather free-ride on others. This means real control for managers who, except in the case of very high-powered incentive schemes, have less of an incentive to engage in excessive risk taking. However, dispersed ownership may also lead to potentially unstable ownership (i.e. sharehold-ers voting with their feet when trouble is under way, or unfi t shareholders gaining control over the bank by acquir-ing shares on the market). This may frustrate banking stability objectives.
(11) In practice, in a competitive managerial market, it may be diffi cult to limit option-based compensation. If the decrease in the option-based remuneration is not compensated by an increase in the cash remuneration, there is a risk that banks would no longer be able to attract good managers. On the other hand, if this decrease is compensated by higher fi xed remuneration, banks may attract managers who would prefer higher fi xed remuneration and lower variable compensation, i.e. risk averse managers.
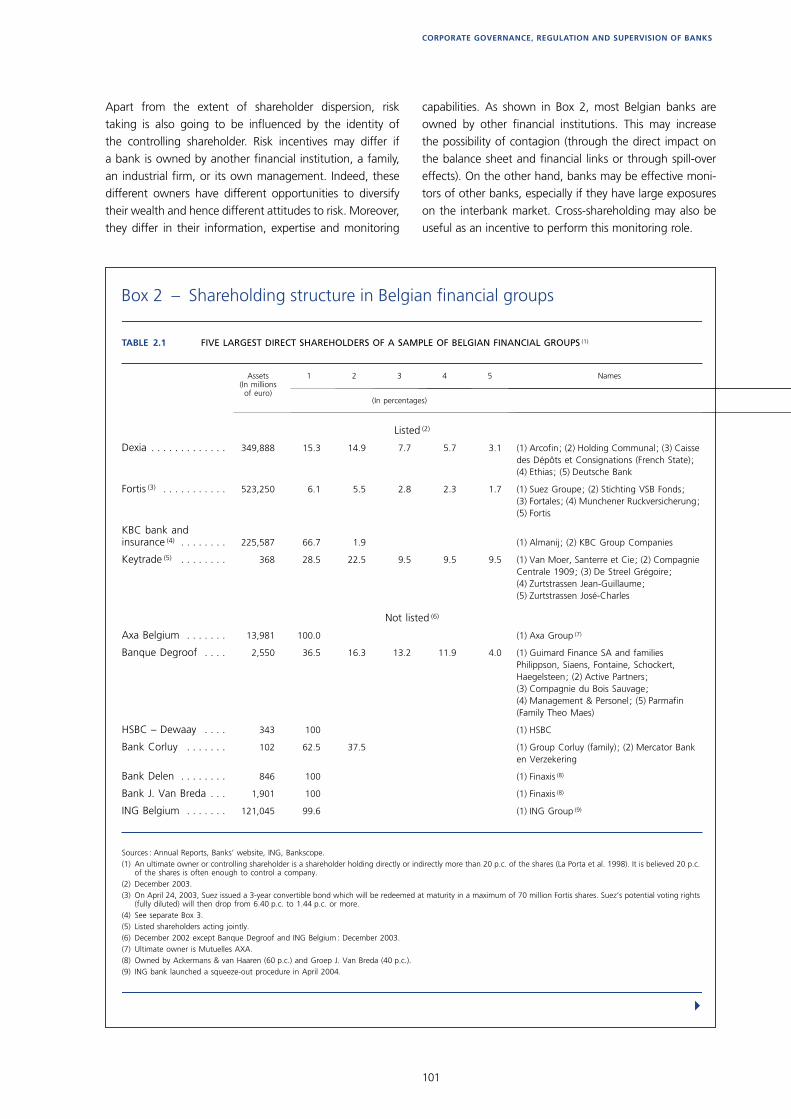
101
CORPORATE GOVERNANCE, REGULATION AND SUPERVISION OF BANKS
Apart from the extent of shareholder dispersion, risk taking is also going to be infl uenced by the identity of the controlling shareholder. Risk incentives may differ if a bank is owned by another fi nancial institution, a family, an industrial fi rm, or its own management. Indeed, these different owners have different opportunities to diversify their wealth and hence different attitudes to risk. Moreover, they differ in their information, expertise and monitoring
capabilities. As shown in Box 2, most Belgian banks are owned by other fi nancial institutions. This may increase the possibility of contagion (through the direct impact on the balance sheet and fi nancial links or through spill-over effects). On the other hand, banks may be effective moni-tors of other banks, especially if they have large exposures on the interbank market. Cross-shareholding may also be useful as an incentive to perform this monitoring role.
Box 2 – Shareholding structure in Belgian fi nancial groups
TABLE 2.1 FIVE LARGEST DIRECT SHAREHOLDERS OF A SAMPLE OF BELGIAN FINANCIAL GROUPS (1)
Sources : Annual Reports, Banks’ website, ING, Bankscope.(1) An ultimate owner or controlling shareholder is a shareholder holding directly or indirectly more than 20 p.c. of the shares (La Porta et al. 1998). It is believed 20 p.c.
of the shares is often enough to control a company.(2) December 2003.(3) On April 24, 2003, Suez issued a 3-year convertible bond which will be redeemed at maturity in a maximum of 70 million Fortis shares. Suez’s potential voting rights
(fully diluted) will then drop from 6.40 p.c. to 1.44 p.c. or more.(4) See separate Box 3.(5) Listed shareholders acting jointly.(6) December 2002 except Banque Degroof and ING Belgium : December 2003.(7) Ultimate owner is Mutuelles AXA.(8) Owned by Ackermans & van Haaren (60 p.c.) and Groep J. Van Breda (40 p.c.).(9) ING bank launched a squeeze-out procedure in April 2004.
Assets(In millions
of euro)
1 2 3 4 5 Names
(In percentages)
Listed (2)
Dexia . . . . . . . . . . . . . 349,888 15.3 14.9 7.7 5.7 3.1 (1) Arcofin; (2) Holding Communal; (3) Caisse des Dépôts et Consignations (French State); (4) Ethias; (5) Deutsche Bank
Fortis (3) . . . . . . . . . . . 523,250 6.1 5.5 2.8 2.3 1.7 (1) Suez Groupe; (2) Stichting VSB Fonds; (3) Fortales; (4) Munchener Ruckversicherung; (5) Fortis
KBC bank and insurance (4) . . . . . . . . 225,587 66.7 1.9 (1) Almanij; (2) KBC Group Companies
Keytrade (5) . . . . . . . . 368 28.5 22.5 9.5 9.5 9.5 (1) Van Moer, Santerre et Cie; (2) Compagnie Centrale 1909; (3) De Streel Grégoire; (4) Zurtstrassen Jean-Guillaume; (5) Zurtstrassen José-Charles
Not listed (6)
Axa Belgium . . . . . . . 13,981 100.0 (1) Axa Group (7)
Banque Degroof . . . . 2,550 36.5 16.3 13.2 11.9 4.0 (1) Guimard Finance SA and families Philippson, Siaens, Fontaine, Schockert, Haegelsteen; (2) Active Partners; (3) Compagnie du Bois Sauvage; (4) Management & Personel; (5) Parmafin (Family Theo Maes)
HSBC – Dewaay . . . . 343 100 (1) HSBC
Bank Corluy . . . . . . . 102 62.5 37.5 (1) Group Corluy (family); (2) Mercator Bank en Verzekering
Bank Delen . . . . . . . . 846 100 (1) Finaxis (8)
Bank J. Van Breda . . . 1,901 100 (1) Finaxis (8)
ING Belgium . . . . . . . 121,045 99.6 (1) ING Group (9)
!
102
Shareholders exert power through their voting rights. In some environments, voting rights are directly proportional to cash-fl ow rights, so that it is enough to look at owner-ship concentration to have an idea of formal control rights of shareholders. In other environments, there is widespread use of technologies that give shareholders voting rights in excess of their cash-fl ow rights. Box 3 explains these mech-anisms in detail. In most cases, these mechanisms are used to increase the power of the large shareholder, who may fi nd such a strategy attractive when wealth constrained and only willing to invest if in control. As controlling sharehold-ers value a voting premium as a form of private benefi t, they will not sell their shares to small shareholders. This is
because small shareholders do not value these private ben-efi ts and hence will not be willing to pay for these voting rights (Grossman and Hart, 1998). These mechanisms may therefore lead to stable control.
Recently, however, there have been many debates about whether these mechanisms are a sign of bad corpo-rate governance. (12) This is because control rights that
The shareholding structures of the various Belgian banking groups differ widely (Table 2.1). The shareholding structure of Fortis, the largest Belgian fi nancial group, is dispersed. However, Fortis has two reference shareholders : Suez Group and VSB Fonds. They both hold around 6 p.c. of the shares. KBC has a more concentrated ownership. The main shareholder of KBC is Cera Holding (through its participating interest in Almanij). As explained in Box 3, the shareholding is more or less similar to a pyramid. The shareholding structure of Dexia is relatively concentrated, as two shareholders each have more than 14 p.c. of the shares and 2 others both have more than 5 p.c. of the shares. Finally, ING Belgium is a subsidiary of ING group, a Dutch company. The smaller banks that are presented tend to have concentrated ownership.
Note also that although some large fi nancial groups are listed, individual banking entities are not (the only exception being Keytrade). The fact that the banking activity is not listed has an impact on market discipline. Indeed, direct market discipline on bank entities through share price cannot be exercised, even though banks are generally monitored by rating agencies.
Table 2.2 presents a breakdown of banks by the identity of their direct main shareholder. We observe that a large number (39 p.c.) of Belgian banks are owned by foreign shareholders, generally foreign fi nancial institutions, yet they only represent 18 p.c. of the total assets of Belgian banks. Note that if we add to this the 20 p.c. owned by Belgian fi nancial institutions, we fi nd that 59 p.c. of Belgian banks are owned by another fi nancial institution, accounting for 39 p.c. of the total assets of Belgian banks.
(12) In its effort to draft a “takeover directive”, the European Commission proposed to ban multiple voting rights. In Belgium, dual voting rights within one class of shares are not allowed and one-share-one-vote is the rule (art 541 corporate law). The OECD principles on corporate governance (2004) do not go that far, only stipulating that such arrangements should be disclosed. From a banking stability point of view, note that some of these arrangements may have some benefi ts when they lead to stable ownership structures.
TABLE 2.2 OWNERS OF BELGIAN BANKS
(December 2003)
Sources : CBFA, Bankscope, Schema A and own calculations.(1) Other includes : (i) public authorities, (ii) consortium structure, (iii) Belgian or foreign non-financial groups.
Major shareholder categories Number of banks Percentage of banks Percentage of total assets
Foreign financial group . . . . . . . . . . . . . . . . . . . . . . . . . . . . . . . 24 39.3 17.7
Belgian financial group . . . . . . . . . . . . . . . . . . . . . . . . . . . . . . . 12 19.7 21.4
Listed banks with no shareholder owning more than 50 p.c. . . 2 3.3 56.6
Family structure . . . . . . . . . . . . . . . . . . . . . . . . . . . . . . . . . . . . . 10 16.4 2.5
Professional credit associations . . . . . . . . . . . . . . . . . . . . . . . . . 9 14.8 0.4
Other (1) . . . . . . . . . . . . . . . . . . . . . . . . . . . . . . . . . . . . . . . . . . . 4 6.6 1.4
Total . . . . . . . . . . . . . . . . . . . . . . . . . . . . . . . . . . . . . . . . . . . . . 61 100.0 100.0

103
CORPORATE GOVERNANCE, REGULATION AND SUPERVISION OF BANKS
Box 3 – Technologies separating cash-fl ow rights from voting rights
The trust offi ceOne mechanism, frequently used in the Netherlands to separate cash-fl ow rights from voting rights is the trust offi ce (“administratiekantoor”). A trust offi ce holds the original shares of the company and issues “depository certifi cates”. Certifi cate holders, in addition to receiving dividends, retain the right to attend and speak at shareholders’ meetings, but they generally have no voting rights. Instead, the votes are cast by the trust offi ce. Depending on its exact implementation, it may also serve as a mechanism to give real control to managers rather than shareholders. Trust offi ces very often represent large shareholders (if not all).
Often, trust offi ces serve as anti-take-over defences. As the supervisory board appoints the board members of the trust offi ce and as the shareholders cannot exert their voting rights, it becomes impossible to take control of the fi rm through a hostile take-over. This mechanism also limits shareholder power and ensures managerial autonomy. On the other hand, the trust offi ce has a lot of power and if it actually acts in the interest of (a subgroup of) shareholders, these are very well represented, whether they attend the shareholder meeting or not. This is in contrast with fi rms where uncast votes are handed over to the management.
When looking at the Netherlands, it seems that trust offi ces have been effective in protecting banks from foreign hostile take-overs without preventing company growth. These days however, the trend, at least in banking, is to gradually eliminate this Dutch peculiarity and to give more power to shareholders. (1)
Preference sharesPreference shares constitute another widely used device. Unlike the trust offi ce, preference shares do not increase the power of management, but affect the balance of power among shareholders. Preference shares may have several special features regarding dividend, seniority and voting rights. For example, the preference shares used by ABN-Amro give a right to a fi xed guaranteed dividend of 5.5 p.c. of the face value, are senior to ordinary shares (but junior to debt) upon liquidation, and carry multiple voting rights. Hence, with respect to their pay-off, preference shares resemble subordinated debt. They differ solely in their attached voting rights and their indeterminate maturity. Hence, the use of dual-class shares is a way to endow some shareholders with incentives that are more debt-like.
ABN Amro uses preference shares accounting for 2.7 p.c. of the market value of the equity of the bank but with 47 p.c. of its voting rights. More than 80 p.c. of these preference shares are held by only 6 shareholders. This means that, together with the ordinary shares owned by these shareholders, 46 p.c. of the voting rights are in the hands of a group owning only 17 p.c. of the market value of the equity of the bank. Hence, ABN Amro has a
(1) ABN Amro announced its intention to dissolve its trust offi ce (Stichting Administratiekantoor ABN AMRO Holding). The board of directors of ING proposed that the holders of depositary receipts obtain a voting proxy for the full number of their depositary receipts, whether it is “peacetime” or not. This means that Trust Offi ce ING Shares will only exercise a vote at its own discretion for those depositary receipts the holders of which are not represented at the Annual General Meeting and who have not given any voting instruction to the Trust Offi ce ING Shares. Yet, the second trust offi ce of ING, Trust Offi ce ING Continuity retains its call option which gives the trust offi ce the right to acquire cumulative preference shares. Fortis also has this kind of trust offi ce (Stichting Continuïteit Fortis) which has been granted an option to acquire a number of Fortis preference shares. These two trust offi ces should be considered as anti-take-over devices. In order to prevent a hostile take-over, the trust is only given an option to buy cumulative preference shares in case of “wartime”. This so-called “poison pill” does not limit the power of shareholders in “peacetime”.
signifi cantly exceed cash-fl ow rights may distort incentives to the disadvantage of small investors. Bebchuk et al. (1999) show that this may cause considerable agency costs. Neither proxy contests nor hostile take-overs are possible, limiting the discipline of the external market and raising moral hazard concerns.
This analysis demonstrates that there is no clear answer to the question whether the RSA should favour dispersed or concentrated bank ownership. To some extent, there is an underlying trade-off between stable ownership and managerial autonomy, a trade-off that, as section 4 will show, the RSA in Belgium has tried to balance by intro-ducing a special supervisory agreement.
!
104
dispersed ownership, with concentrated voting rights. (2) The fi gures are presented in Table 3.1, which details the major shareholders’ investment and the attached voting rights.
Until now however, ABN Amro has combined these preference shares with a trust offi ce which made management quite independent of these shareholders. In its 2002 annual report, ABN Amro announced its intention to change on this front, as with the trust offi ce. The bank is planning to purchase all outstanding preference shares. This is because pressure from current corporate governance practice for non-fi nancial fi rms discourages the use of dual class shares as it limits transparency. This measure will be accompanied by the dissolution of the trust offi ce. From an RSA point of view, however, these dual class shares may in some cases be favoured, especially if they lead to stable shareholders with incentives that are closer to those of debt holders.
Pyramid structurePyramid structures represent an alternative to dual-class shares that also increases block-holder power without changing income rights. In a pyramid of two companies, consider a controlling shareholder holding a controlling stake (s1) in a holding company that, in turn holds a controlling stake (s2) in an operating company. Assume one-share-one-vote and assume fi rst that it takes si > 0.5 (i = 1,2) to exert control over the assets. Then, the fraction of cash-fl ow rights required to gain formal control is only s1s2 > 0.25. With a cascade of n fi rms, control only requires a fraction of the cash-fl ow rights :
∏=
=n
iis
1
α .
where α is equal to the cash-fl ow rights held by the controlling shareholder
si represents the fraction of shares of fi rm i held by the controlling shareholder.
(2) However, it should be noted that in normal circumstances (i.e. peace time), as one ordinary share requires a signifi cantly larger investment than one preference share, holders of depositary receipts for preference shares have the opportunity to acquire voting rights in the meeting of shareholders by proxy only, in proportion to the economic value of a preference share against that of an ordinary share. In addition, the trust offi ce of ABN AMRO holding will exercise the voting rights in respect of preference shares for which no proxies have been issued.
TABLE 3.1 CAPITAL STRUCTURE OF ABN AMRO
(Market value on December 31, 2003)
Source : ABN Amro Annual Report 2003.
Ordinary shares Preference shares Total
Percentage of shares Percentage of market value
Percentage of voting rights
Aegon . . . . . . . . . . . . . . . . . . . . . . . . . . . . 0.4 13.5 0.7 6.5
Fortis . . . . . . . . . . . . . . . . . . . . . . . . . . . . . 0.5 15.7 0.9 7.7
Delta loyd . . . . . . . . . . . . . . . . . . . . . . . . . 0.7 9.9 1.0 5.0
ING . . . . . . . . . . . . . . . . . . . . . . . . . . . . . . 8.3 17.6 8.6 12.7
Rabobank . . . . . . . . . . . . . . . . . . . . . . . . . 0.1 10.6 0.4 5.0
Zonnewijzer . . . . . . . . . . . . . . . . . . . . . . . . 0.0 14.2 0.4 6.7
Capital Group International, Inc. . . . . . . . . 5.2 0.0 5.1 2.8
Total . . . . . . . . . . . . . . . . . . . . . . . . . . . . . 15.2 81.6 17.0 46.3
Other shareholders . . . . . . . . . . . . . . . . . . 84.8 18.4 83.0 53.7
!
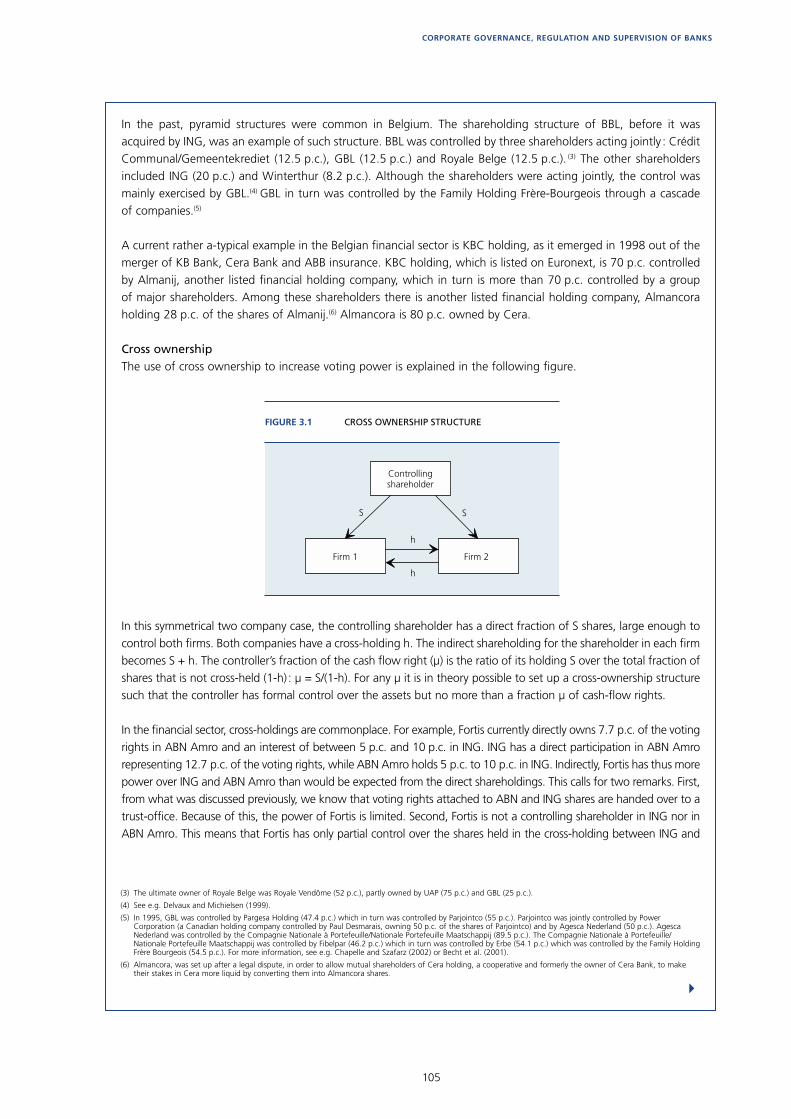
105
CORPORATE GOVERNANCE, REGULATION AND SUPERVISION OF BANKS
In the past, pyramid structures were common in Belgium. The shareholding structure of BBL, before it was acquired by ING, was an example of such structure. BBL was controlled by three shareholders acting jointly : Crédit Communal/Gemeentekrediet (12.5 p.c.), GBL (12.5 p.c.) and Royale Belge (12.5 p.c.). (3) The other shareholders included ING (20 p.c.) and Winterthur (8.2 p.c.). Although the shareholders were acting jointly, the control was mainly exercised by GBL.(4) GBL in turn was controlled by the Family Holding Frère-Bourgeois through a cascade of companies.(5)
A current rather a-typical example in the Belgian fi nancial sector is KBC holding, as it emerged in 1998 out of the merger of KB Bank, Cera Bank and ABB insurance. KBC holding, which is listed on Euronext, is 70 p.c. controlled by Almanij, another listed fi nancial holding company, which in turn is more than 70 p.c. controlled by a group of major shareholders. Among these shareholders there is another listed fi nancial holding company, Almancora holding 28 p.c. of the shares of Almanij.(6) Almancora is 80 p.c. owned by Cera.
Cross ownershipThe use of cross ownership to increase voting power is explained in the following fi gure.
In this symmetrical two company case, the controlling shareholder has a direct fraction of S shares, large enough to control both fi rms. Both companies have a cross-holding h. The indirect shareholding for the shareholder in each fi rm becomes S + h. The controller’s fraction of the cash fl ow right (µ) is the ratio of its holding S over the total fraction of shares that is not cross-held (1-h) : µ = S/(1-h). For any µ it is in theory possible to set up a cross-ownership structure such that the controller has formal control over the assets but no more than a fraction µ of cash-fl ow rights.
In the fi nancial sector, cross-holdings are commonplace. For example, Fortis currently directly owns 7.7 p.c. of the voting rights in ABN Amro and an interest of between 5 p.c. and 10 p.c. in ING. ING has a direct participation in ABN Amro representing 12.7 p.c. of the voting rights, while ABN Amro holds 5 p.c. to 10 p.c. in ING. Indirectly, Fortis has thus more power over ING and ABN Amro than would be expected from the direct shareholdings. This calls for two remarks. First, from what was discussed previously, we know that voting rights attached to ABN and ING shares are handed over to a trust-offi ce. Because of this, the power of Fortis is limited. Second, Fortis is not a controlling shareholder in ING nor in ABN Amro. This means that Fortis has only partial control over the shares held in the cross-holding between ING and
FIGURE 3.1 CROSS OWNERSHIP STRUCTURE
Controllingshareholder
Firm 1 Firm 2
S
h
h
S
(3) The ultimate owner of Royale Belge was Royale Vendôme (52 p.c.), partly owned by UAP (75 p.c.) and GBL (25 p.c.).
(4) See e.g. Delvaux and Michielsen (1999).
(5) In 1995, GBL was controlled by Pargesa Holding (47.4 p.c.) which in turn was controlled by Parjointco (55 p.c.). Parjointco was jointly controlled by Power Corporation (a Canadian holding company controlled by Paul Desmarais, owning 50 p.c. of the shares of Parjointco) and by Agesca Nederland (50 p.c.). Agesca Nederland was controlled by the Compagnie Nationale à Portefeuille/Nationale Portefeuille Maatschappij (89.5 p.c.). The Compagnie Nationale à Portefeuille/Nationale Portefeuille Maatschappij was controlled by Fibelpar (46.2 p.c.) which in turn was controlled by Erbe (54.1 p.c.) which was controlled by the Family Holding Frère Bourgeois (54.5 p.c.). For more information, see e.g. Chapelle and Szafarz (2002) or Becht et al. (2001).
(6) Almancora, was set up after a legal dispute, in order to allow mutual shareholders of Cera holding, a cooperative and formerly the owner of Cera Bank, to make their stakes in Cera more liquid by converting them into Almancora shares.
!
106
3.3 Structure of the board of directors
Voting rights in the general meeting of shareholders are not the sole source of power. Infl uence in the board is important too. Of course, voting rights and infl uence in the board are related. However, the power of the board over the fi rm’s decisions may differ, depending on the board structure, i.e. the number of independent, execu-tive and non-executive members, shareholder representa-tives, appointment procedures, committees, nomination period, etc. Box 4 presents some evidence on the current functioning of boards of directors in Belgium.
The monitoring function of the board is especially important for banks, where monitoring by depositors is non-existent. The complexity of operations impedes monitoring by those sparce, uninsured creditors, and banking regulation often makes take-overs (and thus market discipline) more diffi cult. In addition, one can also argue that the role of the board is different from its role in non-banking organisations. Normally, the board acts in the interest of the shareholders. Besides the fact that this is a legal obligation, this can also be justifi ed by the fact that shareholders are the only stakeholders that can cred-ibly contract with the other stakeholders, as they have the strongest incentives at the margin (Easterbrook and Fischel, 1983). In banks, however, shareholders cannot credibly commit to an implicit contract with debt hold-ers. As the latter are not represented, shareholders will not internalise the interests of debt holders. (Macey and O’Hara, 2003). A solution may be to give bank boards of directors fi duciary duties not only towards shareholders
but also towards debt holders. Hence, bank boards should comprise more independent members and fewer repre-sentatives of the shareholders. Bank directors should also receive less equity-based compensation. The latter idea is confi rmed by Becher, Campbell and Frye (2003). They compare a sample of 700 observations from 81 US banks with 13147 observations from non-banks over the period 1992-1999. They fi nd that, on average, bank directors’ remuneration consists of 18.72 p.c. equity-based pay compared to 31 p.c. for non-bank directors. This differ-ence declines over the sample period.
Gillette et al. (2003) show that having a majority of independ-ent board members (outsiders) is not enough to guarantee effi cient board performance. What also matters is the way in which board members consult each other. They simulate the functioning of a board of directors comprising insiders and outsiders in laboratory experiments with human subjects. Their experiments provide support for the hypothesis that boards dominated by outsiders tend to produce the out-come which maximises fi rm value. In addition, allowing for communication between outsiders (whatever the commu-nication protocol used), favours the adoption of the socially effi cient outcome. Hence, in order to foster effi ciency (13), coordination between outsiders should be enhanced. This implies that boards where the outside members can consult one another in private will be more effi cient. This is an argu-ment in favour of a two-tier board structure.
ABN Amro. Hence, there may be other reasons for these cross-holdings, e.g. strategic, fi nancial (in a bankinsurance model, cross ownership can also result from the investment portfolio of the insurance company. In that case, investments are not made for control purposes but may serve a strategic purpose), historical or cross-monitoring reasons. Yet the last reason could also present some drawbacks. Indeed, if a bank acquires a signifi cant participating interest in a competitor, and a seat on its board of directors in order to monitor that fi rm, this creates potential confl icts of interests which may in the end considerably weaken the role of the board and undermine its supervisory function.
(13) Effi ciency refers to the fact that decisions of the board pursue fi rm value maximisation
Box 4 – Board structure of Belgian banks
Board compositionTable 4.1 presents the structure of the board of directors of several Belgian banks. A breakdown is made between executive and non-executive members. Among the non-executive members, we distinguish between independent and non-independent directors. This distinction is based on information provided in annual reports and is thus based on a self-assessment of each board of directors.
!
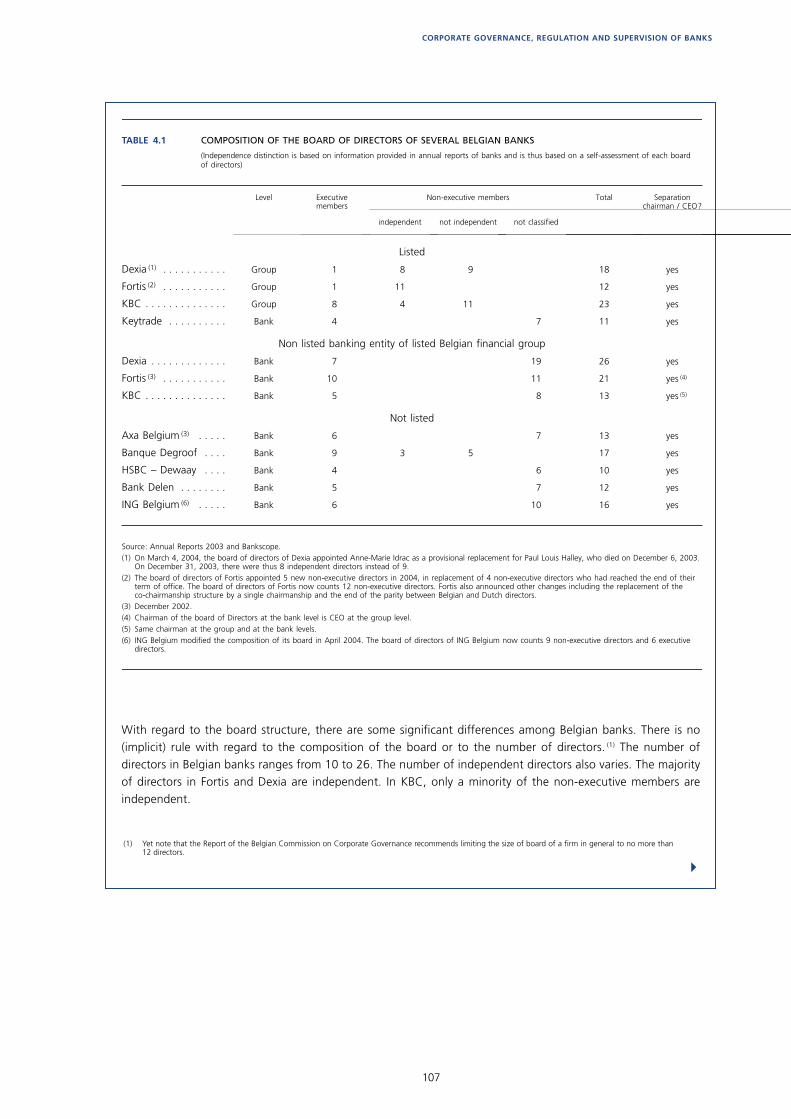
107
CORPORATE GOVERNANCE, REGULATION AND SUPERVISION OF BANKS
With regard to the board structure, there are some signifi cant differences among Belgian banks. There is no (implicit) rule with regard to the composition of the board or to the number of directors. (1) The number of directors in Belgian banks ranges from 10 to 26. The number of independent directors also varies. The majority of directors in Fortis and Dexia are independent. In KBC, only a minority of the non-executive members are independent.
TABLE 4.1 COMPOSITION OF THE BOARD OF DIRECTORS OF SEVERAL BELGIAN BANKS
(Independence distinction is based on information provided in annual reports of banks and is thus based on a self-assessment of each board of directors)
Source: Annual Reports 2003 and Bankscope.(1) On March 4, 2004, the board of directors of Dexia appointed Anne-Marie Idrac as a provisional replacement for Paul Louis Halley, who died on December 6, 2003.
On December 31, 2003, there were thus 8 independent directors instead of 9.(2) The board of directors of Fortis appointed 5 new non-executive directors in 2004, in replacement of 4 non-executive directors who had reached the end of their
term of office. The board of directors of Fortis now counts 12 non-executive directors. Fortis also announced other changes including the replacement of the co-chairmanship structure by a single chairmanship and the end of the parity between Belgian and Dutch directors.
(3) December 2002.(4) Chairman of the board of Directors at the bank level is CEO at the group level.(5) Same chairman at the group and at the bank levels.(6) ING Belgium modified the composition of its board in April 2004. The board of directors of ING Belgium now counts 9 non-executive directors and 6 executive
directors.
Level Executivemembers
Non-executive members Total Separationchairman / CEO?
independent not independent not classified
Listed
Dexia (1) . . . . . . . . . . . Group 1 8 9 18 yes
Fortis (2) . . . . . . . . . . . Group 1 11 12 yes
KBC . . . . . . . . . . . . . . Group 8 4 11 23 yes
Keytrade . . . . . . . . . . Bank 4 7 11 yes
Non listed banking entity of listed Belgian financial group
Dexia . . . . . . . . . . . . . Bank 7 19 26 yes
Fortis (3) . . . . . . . . . . . Bank 10 11 21 yes (4)
KBC . . . . . . . . . . . . . . Bank 5 8 13 yes (5)
Not listed
Axa Belgium (3) . . . . . Bank 6 7 13 yes
Banque Degroof . . . . Bank 9 3 5 17 yes
HSBC – Dewaay . . . . Bank 4 6 10 yes
Bank Delen . . . . . . . . Bank 5 7 12 yes
ING Belgium (6) . . . . . Bank 6 10 16 yes
(1) Yet note that the Report of the Belgian Commission on Corporate Governance recommends limiting the size of board of a fi rm in general to no more than 12 directors.
!

108
The three large Belgian banks use a different defi nition of independence, although they all comply with the new legislative act of August 2002. Therefore, the fi gures in Table 4.1 are not totally comparable. KBC relies only on the defi nition of independence given in the Corporate Law. The board of directors of Fortis uses its own defi nition of independence. For instance, Fortis’ defi nition of independence does not take account of a maximum term of offi ce. Banque Degroof used the recommendations of Euronext Brussels. (2) Finally, Dexia uses criteria that are even more stricter than those of the Bouton White Paper (3) and the Belgian Corporate Governance Law. This illustrates how diffi cult it is to defi ne independence. (4)
TABLE 4.2 COMPOSITION OF COMMITTEES OF KBC, DEXIA AND FORTIS (GROUP LEVEL)
Source : Annual Report 2003.
Committees Fortis Dexia KBC
Audit Composition : 6 independent board members. Meetings in 2003:5.
Composition : 4 board members (two of whom are independent). Meetings in 2003:4.
Composition : 9 non executive board members (3 of whom are independent). Meetings in 2003:6.
Appointment / Nomination
1 appointment and compensation committee consisting of 7 board members, including 6 independent board members and the CEO. Meetings in 2003:3.
Composition : 6 board members (comprising the Chairman, the CEO and 2 independent directors). Meetings in 2003:4.
The Agenda committee acts as an appointment committee.
Remuneration / Compensation
Composition : 3 non-executive directors (the Chairman and 2 independent directors). Meetings in 2003:2.
Composition : 3 non-executive directors (including 1 independent director and 2 representatives of the principal shareholder). The committee meets on an ad hoc basis.
Strategy NA Composition : 6 board members (comprising the Chairman, the CEO and 2 independent directors). Meetings in 2003:1.
NA
Agenda NA NA Composition : 6 members (including the Chaiman of the board, the President and Vice-President of the executive committee and 3 non-executive directors). The committee meets prior to each Board meeting.
Risk and Capital Composition : 5 board members (of whom the CEO). Meetings in 2003:3.
NA NA
!
(2) Belgian Commission on Corporate Governance (1998), Report.
(3) MEDEF, “Pour un meilleur gouvernement des entreprises cotées : rapport du groupe de travail présidé par Daniel Bouton, président de la Société Générale”, September 2002.
(4) Criteria for independence refer to directors with no ties with shareholders or managers. The latter criterion tend to be emphasised in the Anglo-saxon corporate governance model relying upon dispersed shareholder, the former is more relevant for the Continental corporate governance model with concentrated ownership. Although there is no single defi nition of independence, it is at least possible to identify some dependence criteria. The list of criteria given here is based on the Dutch Corporate Governance Code (Corporate Governance Committee, “The Dutch Corporate Governance Code : principles of good corporate governance and best practices provisions”, December 2003. This report is also known as the Tabaksblat report) and on the Bouton White Paper. They combine both criteria from the Anglo-Saxon and the Continental model. A director may not be considered as independent if one of the following criteria applies to him, his wife, or child or relative up to the second degree :
109
CORPORATE GOVERNANCE, REGULATION AND SUPERVISION OF BANKS
4. A special supervisory instrument : The agreement on the autonomy of bank management
The fact that the agency confl ict in banks differs from the agency confl ict in non-fi nancial fi rms creates a need for an RSA. The exercise of the RSA function is facilitated by sound corporate governance structures in banks. Therefore, the RSA may try to govern the relationships between sharehold-ers, directors and managers. The Belgian supervisory model makes use of an original instrument to govern these relation-ships : the Agreement on the autonomy of bank manage-ment. To the best of our knowledge, this instrument is rather specifi c to Belgium. First, the instrument itself is original, in the Belgian tradition of developing rules and regulations by way of soft law. Supervisory intervention served mainly as a substitute for formal regulation and formed a body of infor-mal company law aimed at policing the conduct of major companies (see e.g. Wymeersch, 1994). Second, the content of the agreement is not necessarily included in the legislative framework of neighbouring countries. (14)
Although the stated purpose of the autonomy agreement is to guarantee the stability and the continuity of the banking function, the historical background lends itself to a more limited interpretation (for an historical overview of the agreement on the autonomy of bank management, see Appendix 1). Indeed, the agreement on the autonomy of bank management has its roots in the desire to avoid confl icts of interests within group structures (in mixed banks or in industrial holding companies). As structural regulation failed to fully solve confl icts of interests in credit policy, the CB (15) started to negotiate agreements with bank shareholders to ensure the independence of bank management in credit policy. As such, it focused on credit risk and did not target the general problem
At the bank level, managers seem to have an important say in the board. This is because the Agreement on the autonomy of bank management stipulates that members of the managing board must be chosen from among the members of the board of directors. (5) Executives, however, may not be in the majority. In addition, the total number of board members seems to be quite large. This might raise diffi culties in board decision-making, as there may be moral hazard in teams. Therefore, it is important to establish subcommittees. This is addressed in the next paragraph.
Board organisationThe board of directors may delegate some of its responsibilities to committees made up of a limited number of directors. Table 4.2 summarises committees created by Dexia, KBC and Fortis. There is no universal defi nition of the scope of competencies of each of these committees. The prerogatives of the committee and its members are determined at the board level.
All the banks represented in the table make use of several specifi c committees. It seems that there are large differences in board structure between banks. An audit committee and a remuneration committee are nowadays commonplace in a lot of fi rms across many industries. Yet, their composition varies widely. For instance, the audit committee of Dexia contains 4 members but 9 members in the KBC case. The existence of a strategy committee or a risk and capital committee is maybe less frequent. Codes of best practices recommend that the board of directors establish rules that defi ne the roles and responsibilities of each of these committees. With regard to the composition of the audit committee, the Bouton White Paper recommends that, if such a committee exists, it should comprise at least two-thirds independent members and no current or former managers. In addition, members of the committee should be fi nance or accounting experts. The audit committee should supervise the internal control, the internal and external audits, and check compliance with their recommendations.
The Bouton report defi nes the optimal composition of the remuneration committee. The committee should comprise a majority of independent members and no executive directors. The remuneration committee should make proposals with regard to the remuneration package of directors, members of the managing board and high level employees of the fi rm. A crucial element of this package is the importance of the variable element (cf. supra).
(14) One should, however, note that the Italian legislation contains a provision pointing out that the Bank of Italy may request a sort of “declaration of independence” from the participants in the capital of a new bank in the occasion of its setting up (see also Lombardo, 1993).
(15) The Commission for Banking (CB), the Belgian RSA, was set up in 1935. In 1990, it was renamed the Commission for Banking and Finance (CBF). In 2003, the CBF merged with the OCA/CDV, the agency in charge of the control of insurance companies, to form the Commission for Banking, Finance and Insurance (CBFA). The text thus uses the abbreviations CB, CBF and CBFA, depending on the period it is referring to.
(5) Note that the agreement applies at the bank level and not at the group level. Therefore, we see that banks such as Fortis or Dexia only have one executive member on the group board while the whole managing committee is represented at the bank level.
110
of banking risk. To this end, the agreement establishes a clear distinction between the managing board of a bank and its board of directors. In addition, it tries to reinforce the independence of a bank’s management and to protect it from any external infl uence. (16) The goal of this section is to present this special and unique feature of the Belgian supervisory model, i.e. the agreement on the autonomy of bank management. (17) This subsection fi rst retraces the tradition of autonomy agreements in Belgium. Subsequently, it investigates the future for a (revised) autonomy agreement.
4.1 The Belgian autonomy agreement
The current agreement rests on two pillars. Its fi rst pillar is based on a clear distinction between management and supervision :– The managing board is in sole charge of the banking
function and should pursue the interests of the bank to the fullest. The managing board manages the credit institution according to the general policy defi ned at the board of directors’ level. The managing board is composed of members of the board of directors and constitutes a collegial body.
– Supervision of the management is the prerogative of the board of directors. The latter also defi nes the gen-eral policy of the bank and has the power to appoint and dismiss members of the managing board. The scope of the general policy includes planning, budgets, important structural reforms, and relationships between the bank and its shareholders.
The second pillar of the agreement specifi es the rights and duties of signifi cant shareholders. (18) First, the agreement clearly states that, despite their specifi c role, signifi cant shareholders have the right to expect a normal return on their investment. In addition, they are actively represented in the board of directors and subsequently play a role in the defi nition of the general policy and the supervision of the bank. Signifi cant shareholders, however, may not use their infl uence to interfere with the business management. They also undertake to support the credit institution, to guaran-tee its stability and to ensure the autonomy of its manage-ment. They agree to inform the managing board, the board of directors and the CBFA prior to any changes in the size of their participating interest. The CBFA may recommend suspending the disposal operation for a period of three months if this operation threatens the stability of the bank or the independence of its management or if shares are transferred to an unsuitable shareholder.(19) Table 1 provides a summary of the content of the agreement. The informa-tion presented in Table 1 is based on a standard agreement on the autonomy of bank management. However, the
agreement provides that any party may request a modifi ca-tion of the agreement, although the modifi cation needs to be accepted by all the other parties (including the CBFA) and by the shareholders meeting.
Each bank ratifi es voluntarily the agreement after negotia-tions with the CBFA. One of the incentives that the bank-ing industry may fi nd to ratify the agreement is to avoid the development of a formal one-size-fi ts-all legislation containing the provisions of the agreement.(20)
The agreement is essentially a compromise that tries to combine the advantages of a stable shareholder structure with the advantages of autonomous man-agement. Section 3 showed that there is typically a trade-off between the existence of a reference share-holder and managerial autonomy. The agreement thus tries to impose management autonomy in every share-holder structure by limiting the intervention of share-holders in the management of the bank. It ensures the autonomy of the banking function by the introduction of a structure similar to a two-tier board of directors. Instead of structurally breaking up the group, it intro-duces a governance solution reminiscent of Chinese walls. In addition, through its second pillar, the agree-ment tries to ensure stability of ownership by placing restrictions on the disposal of shares. Indirectly, restric-tions on the sale of shares also constitute recognition that concentrated ownership provides more stability and hence better protection for parties that have contractual relationships, such as depositors. The agreement thus implies an uneasy compromise, as signifi cant share-holders have to give up control and at the same time accept additional responsibilities, such as supporting
(16) This, however, also results in a great need for internal and external control, as the monitoring function of shareholders is weakened. Banks are therefore subject to a cascade of control. This cascade of control is often symbolised by four concentric circles. The inner circle represents the internal control, the second circle, the internal audit, the third circle the external audit and the outer circle the CBFA. Note that the role of the external auditor and the nature of the auditor’s contact with the supervisory authority are rather special in Belgium. The external auditor function in fact combines a private mandate (defi ned in the corporate law – this mandate relates to the protection of shareholders) and a public mandate (co-operation with the CBFA – this mission relates to the protection of debt holders). The co-operation with the supervisory authority not only encompasses a signalling function (i.e. the auditor reports directly to the CBFA any decisions, facts or developments that could signifi cantly infl uence the position of the credit institution or that are in confl ict with corporate law, with the articles of association or the banking law) but also a supervisory function based on compliance forms. The auditor must thus perform a number of additional tests for a supervisory purpose.
(17) A similar agreement, the agreement on the autonomy of insurance management, also exists for the insurance industry. This instrument resulted from negotiations between the CDV-OCA and insurance companies.
(18) Note that there is no formal defi nition of a signifi cant shareholder. The agreement specifi es that “insofar as the voting rights attached to a participating interest may have a de facto infl uence on [general] shareholders’ meetings, such a participating interest will imply an institutional role for the shareholders concerned, a role which, considering the powers they have, imposes corresponding duties to support the credit institution’s stability, development and autonomy”.
(19) However, the agreement does not defi ne “unsuitable shareholders”.
(20) Yet, although the banking industry as a whole has an interest in the approval of agreements, this is not the case for each of the signifi cant shareholders of individual banks of the system. Therefore, it opens the door to free-riding types of behaviour, in which some banks might decide to refuse to negotiate the agreement.

111
CORPORATE GOVERNANCE, REGULATION AND SUPERVISION OF BANKS
TABLE 1 CONTENT OF THE AGREEMENT ON THE AUTONOMY OF BANK MANAGEMENT
Managing Board Board of Directors Shareholders
Role The managing board is responsible for the business management of the credit institution. This management is to be carried out without external interference in the context of the general policy laid down by the board of directors.
The board of directors confers on the managing board powers to take decisions and represent the bank with regard to its staff, its customers, other credit institutions, other economic and social entities and the authorities. The CBFA is to be consulted with regard to the scope of powers delegated to the managing board.
The managing board will constitute a collective body with collective responsibility.
The board of directors defines the general policy (on its own initiative or following a proposal by the managing board). The general policy includes the definition of the bank’s strategic direction, the approval of plans and budgets, significant structural changes and restructuring, and the definition of relationships between the credit institution and its shareholders.
The board of directors exercises effective supervision over the management and the business. To this end, the managing board and the external auditor regularly report to the board of directors. In addition, the board has a right of investigation. The board may call upon the assistance of an audit committee consisting of directors who are not members of the managing board.
The chairman of the board of directors will ensure that powers are correctly distributed between the board of directors and the managing board.
Significant shareholders undertake to support the credit institution, to guarantee its stability, to ensure the autonomy of its management and to create the conditions necessary for ensuring sound, objective and prudent management of the bank. They accept that the bank is not merely an instrument for serving their own interest, but also has other interests which must be taken into account in banking.
They undertake not to vote during the general meeting for the removal from office or the non-renewal of the director’s mandate of a member of the managing board or of the chairman of the board of directors without having sought the opinion of the board of directors and the managing board and the approval of the CBFA.
They play an active role within the board of directors in defining the general policy, supervising its activities and management, and appointing the members of the management committee.
They communicate the size of their participating interest each year to the CBFA and the board of directors.
Composition Members of the managing board must be under 65 and must have the required professional integrity and experience.
The managing board is composed of members of the board of directors. After consultation of its board, the chairman of the managing board must advise the chairman of the board of directors of the candidates proposed for nomination as chairman and as members of the managing board. If the chairman of the board of directors approves the proposal, he submits it to the board of directors. Otherwise he makes a counter-proposal to the chairman of the managing board. If the managing board disagrees, both chairmen try to reach a consensus on a single candidate. Otherwise, each chairman submits his proposal to the board of directors. The approval of the CBFA is required before any proposal to the board of directors.
The board of directors may decide whether to revoke or not to renew the mandate of a member of the managing board only after obtaining the opinion of the managing board and of the CBFA.
The board of directors ensures that shareholders’ interests are adequately represented and includes the members of the management board. The board may have a majority of representatives from those shareholders who have signed the agreement.
Members of the managing board may not form a majority on the board of directors.
Independent directors may also be appointed as directors in order to diversify the composition of the board.
The credit institution ensures that the number of directors is limited.
The chairman of the board of directors is appointed by the board of directors from among those directors who are not members of the managing board. The CBFA is to be consulted beforehand on the appointment and departure of the chairman of the board of directors. The appointment and removal from office of the chairman of the board of directors is subject to the prior approval of the CBFA.
In order to protect the credit institution’s autonomy, arrangements are to be made to prevent an unsuitable shareholder from acquiring a significant participating interest in the credit institution. Any change which would directly or indirectly result in a significant increase or decrease in the relative size of the participating interest of a significant shareholder is subject to the opinion of the board of directors and the managing board of the credit institution and to prior consultation with the CBFA. If such change would be likely to affect the stability or the autonomy of the institution, the CBFA may recommend implementation to be suspended for a maximum of three months. This recommendation may be made public.
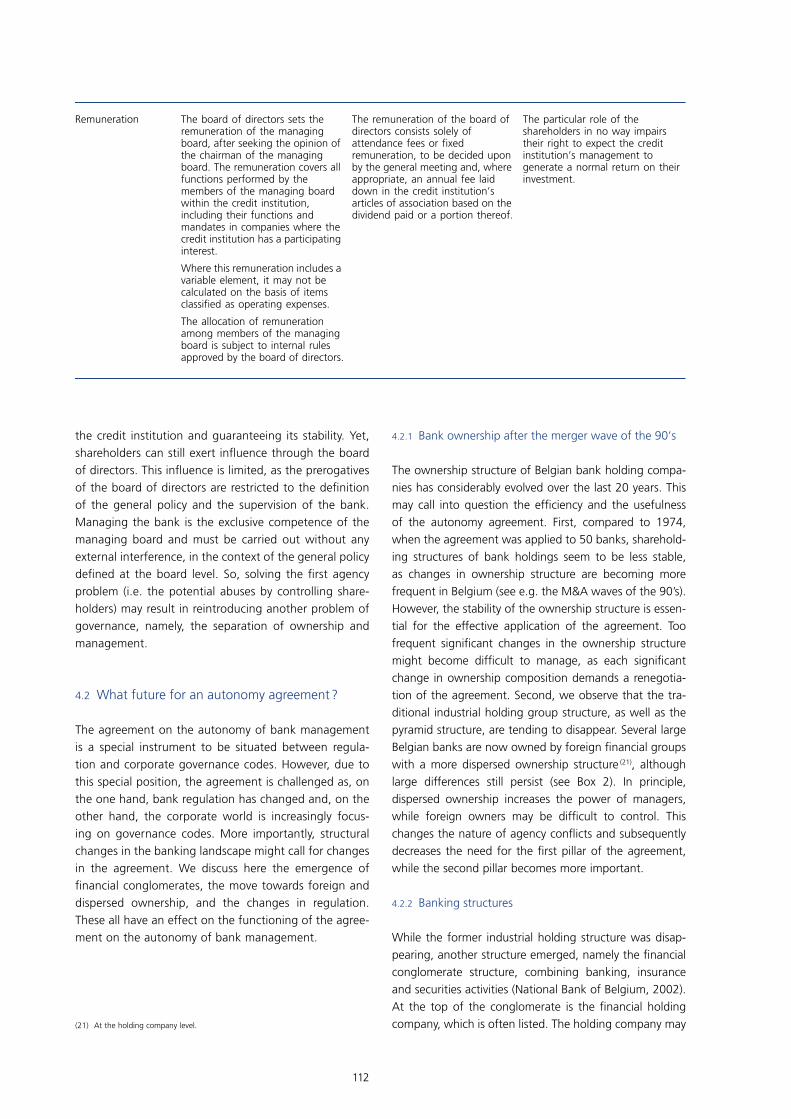
112
the credit institution and guaranteeing its stability. Yet, shareholders can still exert infl uence through the board of directors. This infl uence is limited, as the prerogatives of the board of directors are restricted to the defi nition of the general policy and the supervision of the bank. Managing the bank is the exclusive competence of the managing board and must be carried out without any external interference, in the context of the general policy defi ned at the board level. So, solving the fi rst agency problem (i.e. the potential abuses by controlling share-holders) may result in reintroducing another problem of governance, namely, the separation of ownership and management.
4.2 What future for an autonomy agreement ?
The agreement on the autonomy of bank management is a special instrument to be situated between regula-tion and corporate governance codes. However, due to this special position, the agreement is challenged as, on the one hand, bank regulation has changed and, on the other hand, the corporate world is increasingly focus-ing on governance codes. More importantly, structural changes in the banking landscape might call for changes in the agreement. We discuss here the emergence of fi nancial conglomerates, the move towards foreign and dispersed ownership, and the changes in regulation. These all have an effect on the functioning of the agree-ment on the autonomy of bank management.
4.2.1 Bank ownership after the merger wave of the 90‘s
The ownership structure of Belgian bank holding compa-nies has considerably evolved over the last 20 years. This may call into question the effi ciency and the usefulness of the autonomy agreement. First, compared to 1974, when the agreement was applied to 50 banks, sharehold-ing structures of bank holdings seem to be less stable, as changes in ownership structure are becoming more frequent in Belgium (see e.g. the M&A waves of the 90’s). However, the stability of the ownership structure is essen-tial for the effective application of the agreement. Too frequent signifi cant changes in the ownership structure might become diffi cult to manage, as each signifi cant change in ownership composition demands a renegotia-tion of the agreement. Second, we observe that the tra-ditional industrial holding group structure, as well as the pyramid structure, are tending to disappear. Several large Belgian banks are now owned by foreign fi nancial groups with a more dispersed ownership structure (21), although large differences still persist (see Box 2). In principle, dispersed ownership increases the power of managers, while foreign owners may be diffi cult to control. This changes the nature of agency confl icts and subsequently decreases the need for the fi rst pillar of the agreement, while the second pillar becomes more important.
4.2.2 Banking structures
While the former industrial holding structure was disap-pearing, another structure emerged, namely the fi nancial conglomerate structure, combining banking, insurance and securities activities (National Bank of Belgium, 2002). At the top of the conglomerate is the fi nancial holding company, which is often listed. The holding company may
Remuneration The board of directors sets the remuneration of the managing board, after seeking the opinion of the chairman of the managing board. The remuneration covers all functions performed by the members of the managing board within the credit institution, including their functions and mandates in companies where the credit institution has a participating interest.
Where this remuneration includes a variable element, it may not be calculated on the basis of items classified as operating expenses.
The allocation of remuneration among members of the managing board is subject to internal rules approved by the board of directors.
The remuneration of the board of directors consists solely of attendance fees or fixed remuneration, to be decided upon by the general meeting and, where appropriate, an annual fee laid down in the credit institution’s articles of association based on the dividend paid or a portion thereof.
The particular role of the shareholders in no way impairs their right to expect the credit institution’s management to generate a normal return on their investment.
(21) At the holding company level.
113
CORPORATE GOVERNANCE, REGULATION AND SUPERVISION OF BANKS
have a banking statute, but this is not necessarily the case. Each sector of activity is placed under a subsidiary. The subsidiaries are not listed, but are owned by the holding company. Hence, the bank has a concentrated ownership, while the holding company may have a dispersed owner-ship (see Box 2).
The introduction of this structure changes the nature of the confl ict of interests. The main sources of confl icts of interests in these structures are no longer the relation-ships between majority and minority shareholders but the contagion between several sectors of activity and the consequences for the claimholders of the institution. Indeed, risks taken in one sector of activity (e.g. insurance) can infl uence another sector of activity (e.g. banking), and vice-versa. This may lead to the cross-subsidisation of one category of claimholders (e.g. insurance policy holders) by another category (e.g. bank depositors). Hence, although the conglomerate structure may improve risk manage-ment and effi ciency, it reintroduces the risk of contagion between the different sectors of activity. In this context, it also changes the problem of the RSA. In particular, it raises the question of what would happen if the fi nancial conglomerate comprised a weak insurance activity and a strong bank, and how would it be possible to protect bank debt holders in that situation. Increased transpar-ency of the structure of the conglomerate and of the fl ows between sectors of activity is in any case needed. In addition, particular attention should be paid to general risk policy, as the risk of contagion depends on how the general risk policy (and not only the credit risk policy) is conducted.
Risk policy may be defi ned at the level of the sector of activity. This is especially the case when the subsidiar-ies operate at arm’s length in relation to the holding company. In that case, each business line defi nes and manages its own risk plan. Consequently, the risk of the conglomerate is the combination of the separate risk plans of the sectors of activity. Yet, there is a tendency to defi ne and manage risk at the group level in order to benefi t from synergies and diversifi cation effects. (22) How does the autonomy agreement cope with this trend ? Currently, two separate agreements are concluded at the bank level and at the insurance company level, ensuring that the management of both the bank and the insurance company are independent (from each other and from their direct and indirect shareholders). Therefore, risk management remains the competence of the managing board of the bank or insurance company, whereas the board of directors may only defi ne the general risk policy and supervise risk management. However, when the risk policy is defi ned at the group level, one might question the actual level of autonomy of the bank/insurance
management. (23) On the other hand, is the autonomy of bank / insurance management desirable or is it better to allow risk management at the holding company level ? It is also interesting to note that the agreement does not impose restrictions on the management of the holding company, whereas a lot of decisions are made at the hold-ing company level. This may create the need for a special agreement at the holding company level. It must also be noted that the present regulation imposes separate regu-lations on the different sectors of activity.(24)
4.2.3 Legislative developments
Some rules of the autonomy agreement are now covered by several legislative acts. At the Belgian level, one can cite, for instance, the Banking Law of 22 March 1993, the law of 3 May 2002 implemented by the Royal Decree of 19 July 2002 concerning the exercise of external functions by direc-tors and managers of credit institutions (25) and the Law of 2 August 2002 on corporate governance ; at the European level, the new European Company Statutes regulation, and the European Directive on Financial Conglomerates. (26) Following these new developments, one could ask whether some elements of the agreement are not redundant, or worse, incompatible with current regulations. (27)
With regard to the fi rst pillar of the agreement, article 26 of the banking law authorises (but does not oblige) the board of directors to delegate some of its competences to a managing board constituted by directors. However, if such delegation occurs, the defi nition of the general policy of the bank must remain the responsibility of the board of directors. The corporate governance law adds that, if a managing board is constituted, the supervi-sion of this managing board is the task of the board of
(22) E.g. traditionally, the duration of a bank’s assets is longer than the duration of its liabilities. The reverse is traditionally true for insurance companies. The interest rate risk of the insurance business is then negatively related to the interest rate risk of the bank business. See also National Bank of Belgium (2002).
(23) A similar problem arises in the relationships between a daughter company and its parent company when both are subject to the agreement on bank management autonomy, and raises the issue of consolidated prudential control. Indeed, the fact that the management of a daughter is autonomous does not exempt it from adhering to the strategy of its parent as regards risk control and management or internal audit. Conversely, the agreement on the autonomy of bank management may not be used by the bank parent company to gain exemption from any kind of control or responsibility.
(24) There has recently been some tendency towards convergence in the regulation of banks and insurance activities, although it is limited to regulatory techniques for capital requirements. This requires the co-ordinated supervision of banks and insurance companies. The move from CBF-OCA / CDV to CBFA can be seen in this light.
(25) To guarantee the separation of the managing and supervisory functions, non-executive directors may not hold executive functions in companies in which the bank has an interest.
(26) Directive 2002 / 87/ EC of the European Parliament and of the Council on the supplementary supervision of credit institutions, insurance undertakings and investment fi rms in a fi nancial conglomerate.
(27) For instance, this is particularly true with regard to sanctions and arbitration. The legislation generally punishes an infringement by a sanction, while for the same infringement the agreement will favour consultation and arbitration (this is of course due to the characteristics of this instrument).
114
directors. (28) Note here that, very clearly, the agreement on the autonomy of bank management sets up a stricter organisation and division of powers. In addition, arti-cles 18 and 19 of the banking law stipulate that direc-tors and members of the managing board must have the required professional integrity and experience, although the law does not establish any ex ante control by the CBFA. The Royal Decree of July 2002 also stipulates some incompatibilities in the exercise of external functions by the director or the manager of a bank.
With regard to the second pillar of the agreement, articles 17 and 24 of the banking law stipulate that the identity of shareholders owning more than 5 p.c. of the shares must be communicated to the CBFA in order to obtain a bank licence. Afterwards, communication is mandatory if the shareholding structure is modifi ed. The CBFA has the right to refuse the licence if the CBFA judges that shareholders do not present enough guarantees with regard to the sound and prudent conduct of the bank. The law is even stricter than the autonomy agreement. For instance, the CBFA has the right to oppose the acqui-sition of shares by a shareholder that would threaten the sound and prudent conduct of the bank. The CBFA can also suspend the shareholder’s voting rights and force this shareholder to dispose of his shares.
Although some elements of the agreement are redun-dant given the current legislation, the agreement still remains relevant. In particular, the agreement defi nes very precisely the separation between the supervisory function of the board of directors and the management tasks of the managing board. It also details the scope of intervention of the board of directors and the managing board. In addition, appointment and dismissal procedures are established so as to offer more guarantees for the independence of management. Moreover, a remuneration philosophy is defi ned, limiting the variable elements that can be taken into account in the remuneration.
There is also still the problem of fi nancial conglomerates. The Financial Conglomerates Directives recommends co-ordination and additional supervisory review with respect to capital adequacy, risk concentration at the level of the fi nancial holding company, internal control and risk management procedures and intra-group transactions. Indeed, article 8 of the Financial Conglomerates Directive stipulates that signifi cant intra-group transactions (i.e. transactions that exceed at least 5 p.c. of the total amount of capital adequacy requirements at the level of the conglomerate) are subject to supervisory review. In addition, article 9 introduces adequate procedures to guarantee that the risk surveillance systems are integrated and that the systems are compatible so as to allow the
risks at the level of the fi nancial conglomerate to be measured, monitored and managed. However, one might wonder whether it suffi ciently addresses the potential problem of internal confl icts of interest and of potential contagion between the sectors of activity. In Belgium, in particular, a new type of banking agreement could prob-ably address more thoroughly the problems of transpar-ency in risk accounting and effi cient capital allocation among the sectors of activity in order to avoid excessive cross-subsidisation. (29)
4.2.4 Best practices in corporate governance
Corporate governance codes have become very fashionable in recent years. (30) These codes generally aim at establishing goals, guidelines and best practices for the effective govern-ance of listed fi rms, and are thus not specifi c to banks. Yet, they may cover some aspects of corporate governance rel-evant for fi nancial stability. In particular, some of these codes identify best practices linked to some issues dealt with by the autonomy agreement. First, these codes very often cover best practices with regard to the role of the managing board, the (disclosure of the) remuneration of the managing board, potential confl icts of interest, etc. In addition, current codes also address the functioning, the composition and the remu-neration of boards of directors and of some of its sub-com-mittees. Among the other issues addressed by these codes, the most frequent recommendations relate to shareholders, fi nancial reporting and the internal and external audit func-tion. While there is clearly some overlap between such codes and the agreement, this overlap is only partial, and codes do not necessarily make the agreement superfl uous. Yet, it would be possible to envisage framing recommendations relating to bank stability within a revised agreement.
(28) Under the European Company Statute, defi ned by the Council in 2001 (Council Regulation No 2157/01 of 8 October 2001 on the Statute for a European Company), a company may have either a two-tier system with a supervisory board and a management board, or a one-tier system with an administrative board that manages the company. In the two-tier system, the management board (the members of the management board are appointed by the supervisory board) is responsible for managing the company. In the two-tier system, no person may be at the same time a member of both the management board and the supervisory board of the same company. The agreement seems thus to favour a hybrid (one and a half-tier ?) system where the members of the management board are members of the supervisory board. This raises the question whether the agreement should adopt a stricter defi nition or continue to promote hybrid structures (especially as some banks might want to adopt the European Company Statute).
(29) Internal discipline can be reinforced by the introduction of internal cost of capital allocation schemes, as they complement the weak external market discipline of conglomerates (Boot, 2000).
(30) See e.g. the Bouton White Paper in France, the Code on Corporate Governance of the Financial Reporting Council in the U.K., the Tabaksblat Report in the Netherlands or the OECD Corporat governance principles. In Belgium, the Corporate Governance Committee, established in January 2004 and chaired by Maurice Lippens, was set up at the initiative of the CBFA, the Federation of Belgian Enterprises and Euronext Brussels. The Committee has published a draft code on June 18, 2004. The Committee will publish the fi nal version of the code on December 9, 2004, after a public consultation.
115
CORPORATE GOVERNANCE, REGULATION AND SUPERVISION OF BANKS
5. Conclusion
This paper has reviewed the corporate governance of banks and its implications for supervision. Banks are special, as banks’ debt holders are dispersed non-experts, and this impairs the proper exercise of debt governance. In addition, banks are subject to potential risk shifting by shareholders. Therefore, bank depositors are in need of a representative. This role is generally endorsed by a regula-tory and supervisory authority (RSA).
When managerial pay is not too sensitive to share prices, managerial control should reduce excessive risk taking. Under these conditions, the RSA may favour managerial control (requiring management autonomy). In addition, the RSA may fi nd it advantageous to promote concen-trated ownership, because of the potential to bail-in and the higher stability of ownership that is associated with concentration. In practice, however, managerial control and ownership concentration are diffi cult to combine.
The Belgian supervisory model is based on an instrument – the agreement on the autonomy of bank management – that tries to reconcile concentrated ownership with man-agement autonomy. The initial goal of the agreement was to avoid confl icts of interest within group structures. It aimed at limiting the abuse of the banking function by holding companies to promote their own fi nancial interests. Gradually, it also became an instrument to pro-mote banking stability.
The agreement was last revised in 1992. In the meantime, changes have occurred in the fi nancial and legal environ-ment. On the legislative front, new developments have taken place in terms of both company law and banking law. Moreover, corporate governance codes have been introduced. While these initiatives overlap with some of the main ideas of the agreement, they are not a perfect substitute for its insistence on managerial autonomy or its desire to promote shareholder stability.
More challenging are the market developments that have led to a new banking landscape in Belgium, with increased foreign ownership, less stable shareholding structures and the rise of fi nancial conglomerates that now control the main banks in Belgium. The confl icts of interests that were at the heart of the initial agreement, namely the granting of loans to troubled industrial share-holders of banks, are now largely irrelevant. On the other hand, banking stability concerns are possibly more impor-tant than ever, for two reasons. First, because the reduced stability of ownership makes potential bail-in (the second pillar of the agreement) problematic. And second, and more importantly, because the conglomerate structure of banking and insurance groups increases the potential confl icts between a centralised risk management at the holding level and the autonomy of bank management. Therefore, governance structures implemented by banks should remain a key issue in supervision.

116
References
Admati, A. and P. Pfl eiderer (1994), “Large Shareholder Activism, Risk Sharing and Financial Market Equilibrium”, Journal of Political Economy, 102, 1097-1130.
Anderson, R. and D. Fraser (2000), “Corporate Control, Bank Risk Taking, and the Health of the Banking Industry”, Journal of Banking and Finance, 24, 1383-1398.
Aghion, P. and P. Bolton (1992), “An Incomplete Contracts Approach to Financial Contracting”, Review of Economic Studies, 59, 473-494.
Aghion, P. and J. Tirole (1997), “Formal and Real Authority in Organizations”, Journal of Political Economy, 105, 1-29.
Barca, F. and M. Becht (2001), “The Control of Corporate Europe”, Oxford, Oxford University Press.
Barth, J., G. Caprio and R. Levine, (2001), “The Regulation and Supervision of Banks Around the World”, World Bank, WP No. 2588.
Bebchuk, L. (1999), “A Rent-Protection Theory of Corporate Ownership and Control”, NBER WP No. 7203.
Bebchuk, L., R. Kraakman and G. Triantis (1999), “Stock Pyramids, Cross-Ownership, and Dual Class Equity : The Creation and Agency Costs of Separating Control From Cash Flow Rights”, NBER WP No. 6951.
Becher, D., T. Campbell and M. Frye (2003), “Incentive Compensation for Bank Directors : The Impact of Deregulation”, Forthcoming, Journal of Business.
Becht, M., P. Bolton and A. Roell (2004), “Corporate Governance and Control”, ECGI WP, forthcoming in G. Constantinides, M. Harris and R. Stulz, “Handbook of the Economics of Finance”, North Holland.
Becht, M., A. Chapelle and L. Renneboog (2001), “Shareholding Cascades : the Separation of Ownership and Control in Belgium”, in Barca, F. and M. Becht (2001), “The Control of Corporate Europe”, Oxford, Oxford University Press.
Berle, A. and G. Means (1932), “The Modern Corporation and Private Property”, New York, Mac Millan.
Bolton, P. and E. von Thadden (1998), “Blocks, Liquidity and Corporate Control”, Journal of Finance, 53, 1-25.
Boot, A. W. (2000), “Market Discipline and Incentive Problems in Conglomerate Firms with Application to Banking”, Journal of Financial Intermediation, 9, 240-273.
Burkart, M., D. Gromb and F. Panunzi (1997), “Large Shareholders, Monitoring and the Value of the Firm”, Quarterly Journal of Economics, 112, 693-728.
Buyst, E. (2002), “Corporate Governance and the Belgian Banking Sector, 1934-2000”, in Lorenz-Wende, A, Proceedings EBHA 2002, University of Helsinki, 1-14.
Caprio, G. and R. Levine (2002), “Corporate Governance of Banks : Concepts and International Observations”, Global Corporate Governance Forum Research Network Meeting, April, 27.
Chapelle, A. and A. Szafarz (2002), “Ownership and Control : Dissecting the Pyramid”, CEB, WP No. 03/002.
de Mûelenaere, P. (1992), “L’Autonomie de la Fonction Bancaire”, Revue de la Banque, 10/1992, 545-552.
Delvaux, B. and S. Michielsen (1999), “Le Bal des Empires. Les Dessous du Capitalisme Belge”, Édition Racine.

117
CORPORATE GOVERNANCE, REGULATION AND SUPERVISION OF BANKS
Demstez, K. and K. Lehn (1985), “The Structure of Corporate Ownership : Causes and Consequences”, Journal of Political Economy, 93, 1155-1177.
Dewatripont, M. and J. Tirole (1994a), “A Theory of Debt and Equity : Diversity of Securities and Manager-Shareholder Congruence”, The Quarterly Journal of Economics, 109, 1027-1054.
Dewatripont, M. and J. Tirole (1994b), “The Prudential Regulation of Banks”, Cambridge, MA, MIT Press, 1994.
Diamond, D. and P. Dybvig (1983), “Bank Runs, Deposit Insurance and Liquidity”, Journal of Political Economy, 91, 401-419.
Easterbrook, F. and D. Fischel (1983), “Voting in Corporate Law”, Journal of Law and Economics, 26, 395-427.
Franks, J. and C. Mayer (1994), “The Ownership and Control of German Corporations”, Mimeo, London Business School.
Gillette, A., T. Noe and M. Rebello (2003), “Corporate Board Composition, Protocols and Voting Behavior : Experimental Evidence”, Journal of Finance, 58, 1997-2032.
Grossman, S. and O. Hart (1998), “One Share-One Vote and the Market for Corporate Control”, Journal of Financial Economics, 20, 175-202
Hagelin, N., M. Holmen and B. Pramborg (2003), “Dual shares and risk management”, Mimeo, Uppsala University.
Harm, C. (2002), “Bank Management Between Shareholders and Regulators”, SUERF Studies, No. 21.
Harris, M. and A. Raviv (1988), “Corporate Governance, Voting Rights and Majority Rules” Journal of Financial Economics, 20, 203-235.
Hart, O. (1995a), “Corporate Governance : Some Theory and Implications”, Economic Journal, 105, 678-689.
Hart, O. (1995b), “Firms, Contracts and Financial Structure”, Oxford, Oxford University Press.
Heremans, D. (2000), “Regulation of Banking and Financial Markets”, Encyclopedia of Law and Economics, Edward Elgar Publishers, Cheltenham.
Houston, J. and C. James (1995), “CEO Compensation and Bank Risk : Is Compensation in Banking Structured to Promote Risk Taking ?”, Journal of Monetary Economics 36, 405-431.
Jensen, M and N. Meckling (1976), “Theory of the Firm : Managerial Behavior, Agency Costs and Ownership Structure”, Journal of Financial Economics, 3, 305-360.
John, K. and Y. Qian (2003), “Incentive Features in CEO Compensation in the Banking Industry”, FRBNY Economic Policy Review, April, 109-121.
La Porta, R., F. Lopez-De-Silanes, A. Shleifer and R. Vishny (1998), “Law and Finance”, Journal of Political Economy, 106, 1113-1155.
Lebrun, J. (1979), “La Protection de l’Epargne Publique et la Commission Bancaire”, Bruylant.
Lee, S. W. (2002), “Insider Ownership and Risk-Taking Behaviour at Bank Holding Companies”, Journal of Business Finance and Accounting, 29, 989-1005.

118
Lombardo, G. (1993), “L’Autonomia Gestionale Nei Gruppi Creditizi e Finanziari”, Rivista Internazionale di Scienze Economiche e Commerciali, 40, 355-377.
Macey, J. and M. O’Hara (2003), “The Corporate Governance of Banks”, FRBNY Economic Policy Review, April, 91-107.
Milgrom, P. and J. Roberts (1992), “Economics, Organization and Management”, Englewood Cliff : Prentice Hall.
Mishkin, F. (2000), “Prudential Supervision : What is Important and What are the Issues”, NBER WP No. 7926.
National Bank of Belgium (2002), “Financial Conglomerates”, Financial Stability Review, 61-79.
Philippe, D. and R. Wtterwulghe (1978), “Le Protocole Bancaire, Un Code de Comportement”, Refl ets et Perspectives de la Vie Économique, XVII, 347-358.
Saunders, A. E. Strock and N. Travlos (1990), “Ownership Structure, Deregulation and Bank Risk Taking”, Journal of Finance, Vol. 45, No. 2, 643-654.
Shleifer, A. and R. Vishny (1997), “A Survey of Corporate Governance”, Journal of Finance, 52, 737-784.
Shleifer, A. and R. Vishny (1986), “Large Shareholders and Corporate Control”, Journal of Political Economy, 461-88.
Tossens, J.-F. (1994), “Le Protocole sur l’Autonomie de la Fonction Bancaire”, in “La Nouvelle Législation Bancaire belge”, Mys & Breesch eds., Gent, 53-59.
Wymeersch, E. (1994), “Comparative Corporate Governance”, in “Aspects of Corporate Governance”, Isaksson M. and R. Skog eds., Juristforlaget, 83-116.
119
CORPORATE GOVERNANCE, REGULATION AND SUPERVISION OF BANKS
Appendix 1 – Historical perspective on the agreement on the autonomy of bank management in Belgium :
In Belgium, banking autonomy concerns were fi rst raised early in the thirties during the mixed banks crisis. The mixed banks were shareholders of fi rms that they fi nanced with the deposits they had raised. However, as they had been hit by the crisis that had started in 1929, these fi rms suddenly needed refi nancing. At that time, mixed banks faced a clear confl ict of interests. Indeed, they had to fi nd a balance between the interests of their depositors and the interests of the companies they owned. The mixed banks decided to provide assistance to the ailing fi rms they owned. As depositors subsequently started to withdraw their deposits, the liquidity of mixed banks became a serious concern. Therefore, mixed banks were banned by a Royal Decree in 1934. The existing mixed banks were divided into holding companies and pure deposit banks.
This split, however, did not entirely solve the potential confl ict of interests, as holding companies continued to exert their infl uence on the banks they were holding. Indeed, the holding companies were not only major shareholders of the new banks, but in many cases, boards of the two entities met together. In addition, in some cases, the holding company continued to intervene in lending decisions and sometimes was even informed of the bank’s results before the board of directors of the bank. Therefore, the newly established CB drew attention to the autonomy of bank management on several occasions (see e.g. Annual Report 1936 and 1937).
In this context, the CB tried to negotiate with the Société Générale de Belgique (then shareholder of the Banque de la Société Générale de Belgique) and with Brufi na (then shareholder of the Banque de Bruxelles), two holding companies, in order to decrease their participating interest in the credit institution they owned so as to limit it to 10 p.c. of the capital of the bank. In exchange for the forced disposal, the holding companies demanded exemption from taxation on the capital gains resulting from the sale. As this demand was rejected by the Ministry of Finance, the agreement was never applied.
The CB then approached the problem in a radically different way. Instead of trying to force holding companies to reduce their stake, in 1959 the Commission negotiated agreements with the holding companies in order to institutionalise their stakes in the bank. In other words, banks were no longer allowed to sell their stake without fi rst consulting the CB. In addition, the agreement comprised three other clauses. First the chairman of the bank was no longer allowed to hold a position in the holding company and had to guarantee the independence of the bank. Second, individual members of the management committee no longer reported to the board of directors but to the managing board. This provision was supplemented by the introduction of the concept of the collective responsibility of the managing board. Third, the agreement revised the composition of the board of directors and included mandatory independent members.
In 1969, Brufi na breached the agreement and sold a substantial share of its participating interest in the Banque de Bruxelles to Algemene Bank Nederland without informing the CB. This caused major political debates and fears of potential foreign control over Belgian banks. After lengthy discussions, the government agreed that the CB had to negotiate a new, stricter agreement that would apply in general to a large number of banks. In 1974, the agreement was extended to about 50 banks. The standard agreement was based on the two following pillars. First, the agreement implicitly set up a dual (two-tier) board system (the members of the managing board were chosen from among the members of the board of directors) in order to guarantee the independence of the management board. The managing board, in charge of the management of the bank, carried collegiate responsibility and its members were on equal footing. The board of directors was in charge of the defi nition of the general policy of the bank and of its supervision. With regard to its composition, neither the managers nor the representatives of signifi cant shareholders were allowed to represent a majority of the directors. Second, the agreement recognised a quasi-institutional role for signifi cant shareholders, which implied limitations on the transfer of ownership, in order to avoid the transmission of shares to an undesirable shareholder.
The content of the standard agreement was revised in 1992 for several reasons. First, a new regulatory context had emerged. The fi rst (1977) and second (1988) Banking Co-ordination Directives incorporated some elements of the 1974 agreement such as the collegiality of the management board, the control of the status of shareholders, and the defi nition of sound and prudent policies. The Directives also gave formal legal power to the CB. Another change in the regulatory context was brought about by Basel I (1988), which obliged shareholders to strengthen the capital base if the regulatory

120
capital fell below a certain threshold. Second, certain developments in the banking sector highlighted the need for some revisions of the agreement. The increasing presence of foreign shareholders, as well as some limitations on the effective role played by the board of directors, forced the CBF to amend the 1974 agreement. Indeed, some shareholders were concerned about the fact that, in practice, the board of directors of most banks limited the scope of its intervention to a supervisory function. This problem threatened the stability of the shareholding structure as some shareholders would have incentives to dispose of their shares, since they were unable to effectively exert their responsibilities.
Although the spirit of the agreement remained unchanged, the agreement was therefore amended in 1992. The role of the board of directors and of its chairman was explicitly spelt out. The board of directors was in charge of the defi nition of the strategy, the plans and budgets, the structural reforms, and the defi nition of the relationship with the shareholders. In addition, the role of its chairman was to ensure the proper allocation of powers. The composition of the board of directors also changed, as limitations with regard to majority were abolished so that representatives of shareholders were allowed to cast a majority of the votes, increasing the power of major shareholders. The procedure for appointing the members of the managing board was also redefi ned and appointment required the approval of the CBF. With regard to major shareholders, their role and obligations remained unchanged, although their power increased.
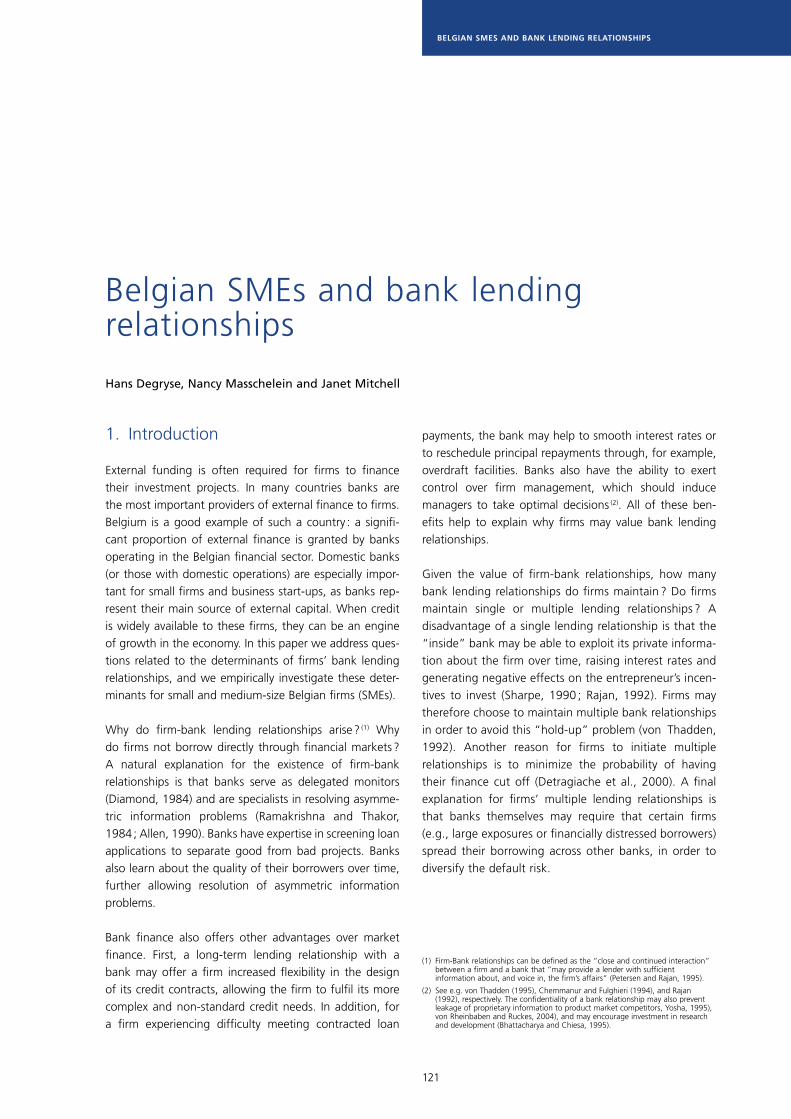
121
BELGIAN SMES AND BANK LENDING RELATIONSHIPS
Belgian SMEs and bank lending relationships
1. Introduction
External funding is often required for fi rms to fi nance their investment projects. In many countries banks are the most important providers of external fi nance to fi rms. Belgium is a good example of such a country : a signifi -cant proportion of external fi nance is granted by banks operating in the Belgian fi nancial sector. Domestic banks (or those with domestic operations) are especially impor-tant for small fi rms and business start-ups, as banks rep-resent their main source of external capital. When credit is widely available to these fi rms, they can be an engine of growth in the economy. In this paper we address ques-tions related to the determinants of fi rms’ bank lending relationships, and we empirically investigate these deter-minants for small and medium-size Belgian fi rms (SMEs).
Why do fi rm-bank lending relationships arise ? (1) Why do fi rms not borrow directly through fi nancial markets ? A natural explanation for the existence of fi rm-bank relationships is that banks serve as delegated monitors (Diamond, 1984) and are specialists in resolving asymme-tric information problems (Ramakrishna and Thakor, 1984 ; Allen, 1990). Banks have expertise in screening loan applications to separate good from bad projects. Banks also learn about the quality of their borrowers over time, further allowing resolution of asymmetric information problems.
Bank fi nance also offers other advantages over market fi nance. First, a long-term lending relationship with a bank may offer a fi rm increased fl exibility in the design of its credit contracts, allowing the fi rm to fulfi l its more complex and non-standard credit needs. In addition, for a fi rm experiencing diffi culty meeting contracted loan
payments, the bank may help to smooth interest rates or to reschedule principal repayments through, for example, overdraft facilities. Banks also have the ability to exert control over fi rm management, which should induce managers to take optimal decisions (2). All of these ben-efi ts help to explain why fi rms may value bank lending relationships.
Given the value of fi rm-bank relationships, how many bank lending relationships do fi rms maintain ? Do fi rms maintain single or multiple lending relationships ? A disadvantage of a single lending relationship is that the “inside” bank may be able to exploit its private informa-tion about the fi rm over time, raising interest rates and generating negative effects on the entrepreneur’s incen-tives to invest (Sharpe, 1990 ; Rajan, 1992). Firms may therefore choose to maintain multiple bank relationships in order to avoid this “hold-up” problem (von Thadden, 1992). Another reason for fi rms to initiate multiple relationships is to minimize the probability of having their fi nance cut off (Detragiache et al., 2000). A fi nal explanation for fi rms’ multiple lending relationships is that banks themselves may require that certain fi rms (e.g., large exposures or fi nancially distressed borrowers) spread their borrowing across other banks, in order to diversify the default risk.
(1) Firm-Bank relationships can be defi ned as the “close and continued interaction” between a fi rm and a bank that “may provide a lender with suffi cient information about, and voice in, the fi rm’s affairs” (Petersen and Rajan, 1995).
(2) See e.g. von Thadden (1995), Chemmanur and Fulghieri (1994), and Rajan (1992), respectively. The confi dentiality of a bank relationship may also prevent leakage of proprietary information to product market competitors, Yosha, 1995), von Rheinbaben and Ruckes, 2004), and may encourage investment in research and development (Bhattacharya and Chiesa, 1995).
Hans Degryse, Nancy Masschelein and Janet Mitchell

122
Financial intermediation theory and industrial organiza-tion theory suggest that the availability and cost of credit hinge on the structure of the banking market, and on the ways in which fi rms and banks interact with each other.(3) Changes in the structure of the banking sector which affect the availability and cost of bank credit can then ulti-mately shape economic growth and employment.(4) Thus, research on the effects of the structure of banking mar-kets on bank fi nance has important policy implications.
In this paper we address the following questions. How many bank relationships do Belgian small and medium-size fi rms typically maintain ? Which types of fi rms have multiple relationships ? How does this compare with other countries ? In Belgium, as in many other countries, banking sector concentration has increased over the last decade, in part due to a wave of bank mergers. The increase in concentration and its possible infl uence on competition in banking markets have potential implications for bank-fi rm lending relationships. Although we do not directly address the question of the impact of bank mergers on fi rm-bank lending relationships, we document structural changes in the Belgian banking sector, as well as changes over time in the number of lending relationships maintained by Belgian fi rms with banks operating in Belgium.(5)
The paper is organized as follows. In Section 2 we exam-ine the structure of the Belgian banking sector and the number of bank lending relationships maintained by Belgian fi rms. In Section 3 we identify hypotheses that have been tested in the literature regarding the deter-minants of the number of fi rms’ bank lending relation-ships. In Section 4 we test these hypotheses for small and medium-size Belgian fi rms. We conclude in Section 5.
2. Banking sector structure and the number of bank lending relationships
2.1 Data sources
Our investigation of fi rm-bank lending relationships draws on three sources of data :– Data from the credit register, which contains informa-
tion on loans to Belgian fi rms granted by banks opera-ting in Belgium. Our data cover the period 1997-2002 and contain both authorised and utilised volumes by type of loan by bank. The banks represented in the data include all foreign and domestic banks operating in Belgium which either authorised or had outstanding loans during the period to non-fi nancial fi rms. Loans to Belgian fi rms that were extended by foreign banks or branches outside of Belgium are not included in the
data set. Also, the credit register contains no data on interest rates or collateral.
– Firm balance sheets. These data come from fi rms’ annual balance sheet fi lings during the period 1994-2002. Small and medium-size fi rms in Belgium are allowed to fi le a short balance sheet form, which is less complete than the long form required for large fi rms. Hence, certain data such as sales and number of employees (for which reporting is voluntary on the short form) are not available for all fi rms.
– Bank balance sheets. These contain annual balance sheet data, which banks are required to report under the Supervisory Reporting Scheme (Schema A). These data are available from 1992-2003.
Belgium is one of several countries to maintain a public credit register. The general purpose of these credit reg-isters is aptly described by Miller (2003) : “most public credit registers are operated by the central bank or bank supervisor, and the fi nancial institutions they supervise are compelled to participate by means of a law or regula-tion… This information is used in part of the supervision process as well as distributed back to the fi nancial institu-tions who provided the data.” (p. 37) This description also applies to the Belgian credit register. Banks granting loans to fi rms receive information back about their own clients and may also obtain information on new loan applicants. This information allows banks to determine the total amount of outstanding bank credit that fi rms already have and the number of other banks from whom fi rms are currently borrowing.
Our analysis of data from the credit register offers an illus-tration of the potential benefi ts that public credit registers can offer to authorities as well as banks. Such data allow regulatory authorities to better understand the lending behavior of banks and the role that bank fi nance plays for fi rms, including the degree to which fi rms might depend on a single bank lender. Relationship banking is an impor-tant feature of “bank-oriented” fi nancial systems. For example, one of the often cited advantages of these sys-tems, as compared with market-oriented systems, is that relationship banking permits early (out-of-bankruptcy)
(3) For fi nancial intermediation theory, see e.g. Broecker (1990), Dell’Ariccia (2001), Petersen and Rajan (1995) or Cao and Shi (2001). The different theories presented by these papers, however, generate ambiguous predictions about the effect of bank market structure on access to external fi nance. For an overview of industrial organization theories relating to the banking market, see Tirole (1988) or Freixas and Rochet (1997).
(4) Two types of empirical approaches to investigate these issues can be distinguished. Empirical work using micro-data has looked at the impact of bank competition on fi rm creation (see e.g. Bonaccorsi di Pati and Dell’Ariccia, 2003, or Black and Strahan, 2002). Other work uses cross-country data to investigate the impact of bank competition on access to fi nance (see e.g. Beck, Demirgüç-Kunt and Maksimovic, 2003).
(5) In a companion working paper (Degryse, Masschelein, and Mitchell, 2004) we take up the question of the effects of bank mergers in Belgium on fi rms’ bank lending relationships.
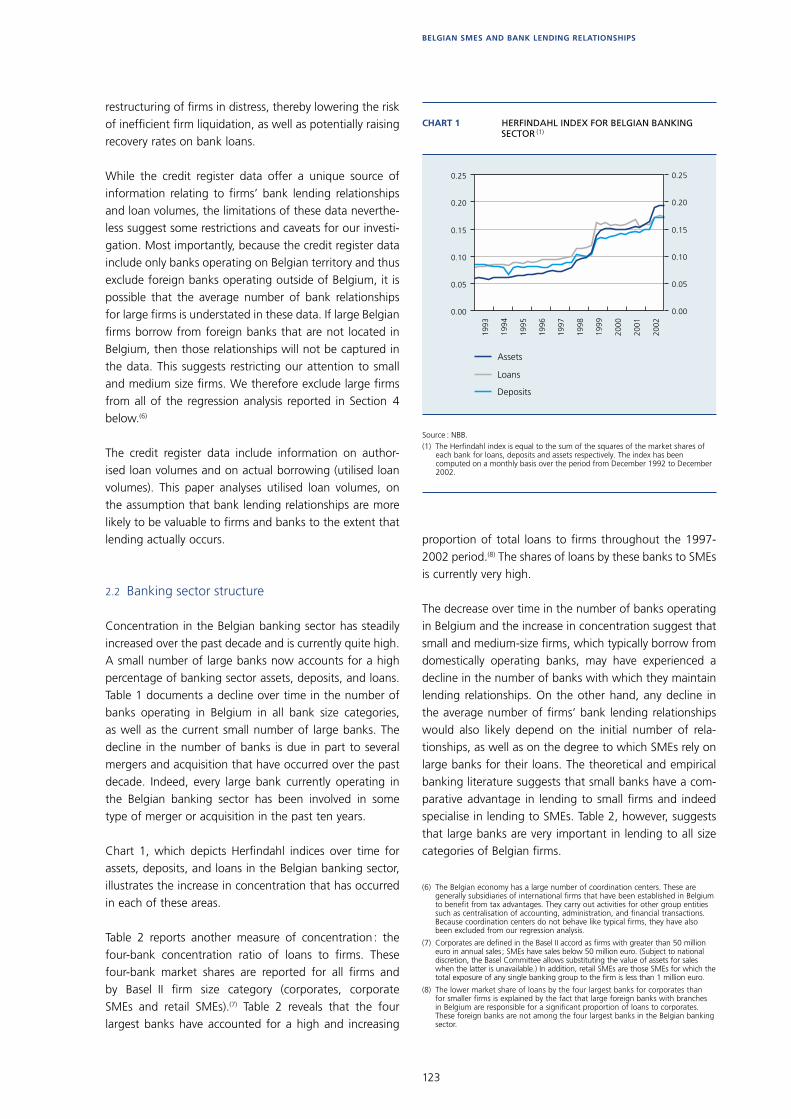
123
BELGIAN SMES AND BANK LENDING RELATIONSHIPS
restructuring of fi rms in distress, thereby lowering the risk of ineffi cient fi rm liquidation, as well as potentially raising recovery rates on bank loans.
While the credit register data offer a unique source of information relating to fi rms’ bank lending relationships and loan volumes, the limitations of these data neverthe-less suggest some restrictions and caveats for our investi-gation. Most importantly, because the credit register data include only banks operating on Belgian territory and thus exclude foreign banks operating outside of Belgium, it is possible that the average number of bank relationships for large fi rms is understated in these data. If large Belgian fi rms borrow from foreign banks that are not located in Belgium, then those relationships will not be captured in the data. This suggests restricting our attention to small and medium size fi rms. We therefore exclude large fi rms from all of the regression analysis reported in Section 4 below.(6)
The credit register data include information on author-ised loan volumes and on actual borrowing (utilised loan volumes). This paper analyses utilised loan volumes, on the assumption that bank lending relationships are more likely to be valuable to fi rms and banks to the extent that lending actually occurs.
2.2 Banking sector structure
Concentration in the Belgian banking sector has steadily increased over the past decade and is currently quite high. A small number of large banks now accounts for a high percentage of banking sector assets, deposits, and loans. Table 1 documents a decline over time in the number of banks operating in Belgium in all bank size categories, as well as the current small number of large banks. The decline in the number of banks is due in part to several mergers and acquisition that have occurred over the past decade. Indeed, every large bank currently operating in the Belgian banking sector has been involved in some type of merger or acquisition in the past ten years.
Chart 1, which depicts Herfi ndahl indices over time for assets, deposits, and loans in the Belgian banking sector, illustrates the increase in concentration that has occurred in each of these areas.
Table 2 reports another measure of concentration : the four-bank concentration ratio of loans to fi rms. These four-bank market shares are reported for all fi rms and by Basel II fi rm size category (corporates, corporate SMEs and retail SMEs).(7) Table 2 reveals that the four largest banks have accounted for a high and increasing
proportion of total loans to fi rms throughout the 1997-2002 period.(8) The shares of loans by these banks to SMEs is currently very high.
The decrease over time in the number of banks operating in Belgium and the increase in concentration suggest that small and medium-size fi rms, which typically borrow from domestically operating banks, may have experienced a decline in the number of banks with which they maintain lending relationships. On the other hand, any decline in the average number of fi rms’ bank lending relationships would also likely depend on the initial number of rela-tionships, as well as on the degree to which SMEs rely on large banks for their loans. The theoretical and empirical banking literature suggests that small banks have a com-parative advantage in lending to small fi rms and indeed specialise in lending to SMEs. Table 2, however, suggests that large banks are very important in lending to all size categories of Belgian fi rms.
1993
1994
1995
1996
1997
1998
1999
2000
2001
2002
0.25
0.20
0.15
0.10
0.05
0.00
0.25
0.20
0.15
0.10
0.05
0.00
CHART 1 HERFINDAHL INDEX FOR BELGIAN BANKING SECTOR (1)
Source : NBB.(1) The Herfindahl index is equal to the sum of the squares of the market shares of
each bank for loans, deposits and assets respectively. The index has been computed on a monthly basis over the period from December 1992 to December 2002.
Loans
Deposits
Assets
(6) The Belgian economy has a large number of coordination centers. These are generally subsidiaries of international fi rms that have been established in Belgium to benefi t from tax advantages. They carry out activities for other group entities such as centralisation of accounting, administration, and fi nancial transactions. Because coordination centers do not behave like typical fi rms, they have also been excluded from our regression analysis.
(7) Corporates are defi ned in the Basel II accord as fi rms with greater than 50 million euro in annual sales ; SMEs have sales below 50 million euro. (Subject to national discretion, the Basel Committee allows substituting the value of assets for sales when the latter is unavailable.) In addition, retail SMEs are those SMEs for which the total exposure of any single banking group to the fi rm is less than 1 million euro.
(8) The lower market share of loans by the four largest banks for corporates than for smaller fi rms is explained by the fact that large foreign banks with branches in Belgium are responsible for a signifi cant proportion of loans to corporates. These foreign banks are not among the four largest banks in the Belgian banking sector.
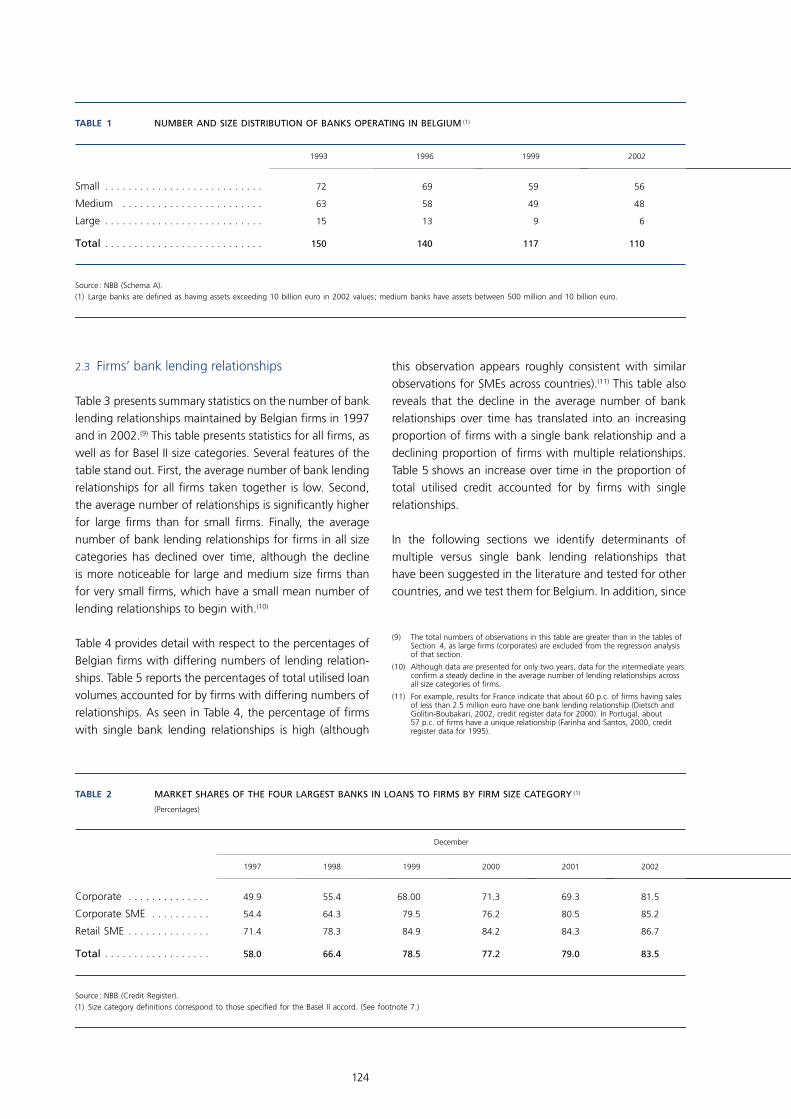
124
2.3 Firms’ bank lending relationships
Table 3 presents summary statistics on the number of bank lending relationships maintained by Belgian fi rms in 1997 and in 2002.(9) This table presents statistics for all fi rms, as well as for Basel II size categories. Several features of the table stand out. First, the average number of bank lending relationships for all fi rms taken together is low. Second, the average number of relationships is signifi cantly higher for large fi rms than for small fi rms. Finally, the average number of bank lending relationships for fi rms in all size categories has declined over time, although the decline is more noticeable for large and medium size fi rms than for very small fi rms, which have a small mean number of lending relationships to begin with.(10)
Table 4 provides detail with respect to the percentages of Belgian fi rms with differing numbers of lending relation-ships. Table 5 reports the percentages of total utilised loan volumes accounted for by fi rms with differing numbers of relationships. As seen in Table 4, the percentage of fi rms with single bank lending relationships is high (although
this observation appears roughly consistent with similar observations for SMEs across countries).(11) This table also reveals that the decline in the average number of bank relationships over time has translated into an increasing proportion of fi rms with a single bank relationship and a declining proportion of fi rms with multiple relationships. Table 5 shows an increase over time in the proportion of total utilised credit accounted for by fi rms with single relationships.
In the following sections we identify determinants of multiple versus single bank lending relationships that have been suggested in the literature and tested for other countries, and we test them for Belgium. In addition, since
(9) The total numbers of observations in this table are greater than in the tables of Section 4, as large fi rms (corporates) are excluded from the regression analysis of that section.
(10) Although data are presented for only two years, data for the intermediate years confi rm a steady decline in the average number of lending relationships across all size categories of fi rms.
(11) For example, results for France indicate that about 60 p.c. of fi rms having sales of less than 2.5 million euro have one bank lending relationship (Dietsch and Golitin-Boubakari, 2002, credit register data for 2000). In Portugal, about 57 p.c. of fi rms have a unique relationship (Farinha and Santos, 2000, credit register data for 1995).
TABLE 1 NUMBER AND SIZE DISTRIBUTION OF BANKS OPERATING IN BELGIUM (1)
Source : NBB (Schema A).(1) Large banks are defined as having assets exceeding 10 billion euro in 2002 values; medium banks have assets between 500 million and 10 billion euro.
1993 1996 1999 2002
Small . . . . . . . . . . . . . . . . . . . . . . . . . . . 72 69 59 56
Medium . . . . . . . . . . . . . . . . . . . . . . . . 63 58 49 48
Large . . . . . . . . . . . . . . . . . . . . . . . . . . . 15 13 9 6
Total . . . . . . . . . . . . . . . . . . . . . . . . . . . 150 140 117 110
TABLE 2 MARKET SHARES OF THE FOUR LARGEST BANKS IN LOANS TO FIRMS BY FIRM SIZE CATEGORY (1)
(Percentages)
Source : NBB (Credit Register).(1) Size category definitions correspond to those specified for the Basel II accord. (See footnote 7.)
December
1997 1998 1999 2000 2001 2002
Corporate . . . . . . . . . . . . . . 49.9 55.4 68.00 71.3 69.3 81.5
Corporate SME . . . . . . . . . . 54.4 64.3 79.5 76.2 80.5 85.2
Retail SME . . . . . . . . . . . . . . 71.4 78.3 84.9 84.2 84.3 86.7
Total . . . . . . . . . . . . . . . . . . 58.0 66.4 78.5 77.2 79.0 83.5

125
BELGIAN SMES AND BANK LENDING RELATIONSHIPS
we observe a decline of the number of bank lending rela-tionships over time in Belgium, we investigate whether the impact of these determinants has remained stable over time. If changes in fi rm characteristics or changes in the determinants of the number of bank lending relation-ships cannot explain the decline in the number of lending relationships, we may suspect that structural changes in the banking sector are at play.
3. Determinants of the number of fi rm-bank relationships
The question of whether fi rms will maintain single or mul-tiple bank lending relationships has been a subject of both theoretical and empirical interest in the fi nancial economics literature. In this section we identify some hypotheses that have been proposed and tested for other countries. Table 6 provides a selective summary of the empirical results obtained for other countries in relation to these hypotheses.
TABLE 3 NUMBERS OF FIRMS AND NUMBERS OF BANK RELATIONSHIPS BY BASEL II SIZE CATEGORY
(December)
Source : NBB (Credit Register).
Number Mean Median Min. Max. Std. dev.
1997
Total . . . . . . . . . . . . . . . . . . 100,432 1.30 1 1 16 0.70
Corporate . . . . . . . . . . . . . . 904 3.31 3 1 15 2.44
Corporate SME . . . . . . . . . . 5,397 2.02 2 1 16 1.29
Retail SME . . . . . . . . . . . . . . 94,131 1.24 1 1 7 0.54
2002
Total . . . . . . . . . . . . . . . . . . 124,483 1.22 1 1 13 0.54
Corporate . . . . . . . . . . . . . . 1,070 2.41 2 1 13 1.55
Corporate SME . . . . . . . . . . 5,904 1.73 1 1 8 0.95
Retail SME . . . . . . . . . . . . . . 117,509 1.18 1 1 6 0.46
TABLE 4 PERCENTAGES OF FIRMS BY NUMBER OF RELATIONSHIPS
(December of each year)
Source : NBB.
Numbers of relationships Percentages of Debtors
1997 1998 1999 2000 2001 2002
1 . . . . . . . . . . . . . . . . . . . . . 78.4 78.4 79.4 80.4 81.8 82.5
2 . . . . . . . . . . . . . . . . . . . . . 16.3 15.7 15.3 15.2 14.5 14.1
3 . . . . . . . . . . . . . . . . . . . . . 3.7 3.5 3.2 3.2 2.9 2.7
4 . . . . . . . . . . . . . . . . . . . . . 1.1 0.9 0.7 0.7 0.6 0.5
5 . . . . . . . . . . . . . . . . . . . . . 0.3 0.3 0.2 0.2 0.2 0.1
More than 5 . . . . . . . . . . . . 0.3 0.2 0.1 0.1 0.1 0.0

126
HYPOTHESIS 1 :
“INFORMATIONALLY OPAQUE” FIRMS (YOUNGER AND SMALLER
FIRMS) MAINTAIN FEWER RELATIONSHIPS.
When costly information asymmetries exist between inves-tors and project insiders, a single bank may arise as the optimal mechanism for channelling loans from investors to fi rms (Diamond, 1984). Indeed, such delegated moni-toring avoids both duplication of monitoring and free riding of some investors on the monitoring efforts of others, and results in cheaper fi nancing for the fi rm.
Information asymmetries are most important for infor-mationally opaque fi rms. One category of fi rms that are informationally opaque is young fi rms, due to the fact that banks do not have much information about these fi rms, and little information is likely to be publicly available (see Petersen and Rajan, 1995 and Farinha and Santos, 2002). Another proxy for informational opacity is fi rm size. Smaller fi rms are considered to be more opaque, as these fi rms often have less strict reporting requirements and as fewer analysts are likely to follow the fi rms (see Detragiache et al., 2000). In addition, small fi rms may have only a small amount of collateral to pledge, or a bank lender may require all available assets as collateral for a loan, which would limit the option for such fi rms to initiate multiple lending relationships (see e.g. Degryse and Van Cayseele, 2000 or Machauer and Weber, 1998).
HYPOTHESIS 2 :
FIRMS WITH A HIGH PROBABILITY OF FINANCING DENIED
(LESS PROFITABLE OR FINANCIALLY DISTRESSED FIRMS AND
FIRMS WITH DISTRESSED OR ILLIQUID BANKS) WILL CHOOSE
TO HAVE MULTIPLE RELATIONSHIPS.
Less profi table fi rms may initiate multiple bank relationships in order to increase the likelihood that at least one bank will obtain a positive signal about the fi rm’s quality and continue granting fi nance. Along different lines, Detragiache et al. (2000) argue that fi rms may be vulnerable to a liquidity shock experienced by their bank. Firms may need to discon-tinue their investment projects if they are unable to obtain additional fi nancing because the lender has encountered liquidity problems. In order to reduce this “liquidity risk” fi rms may have the incentive to initiate multiple bank relationships, as the likelihood that all informed banks would be hit by a liquidity shock is lower than the likeli-hood that a single bank lender would be hit.(12)
HYPOTHESIS 3 :
BANKS MAY REQUIRE CERTAIN FIRMS (VERY LARGE OR LESS
PROFITABLE FIRMS) TO HAVE MULTIPLE RELATIONSHIPS.
One reason that fi rms have multiple bank relationships may be the desire by banks themselves to diversify risk (bank-diversifi cation hypothesis). This may happen for two reasons. First, risk-diversifi cation objectives give banks incentives to share the risk of lower quality fi rms with other banks (Harhoff and Körting, 1998 : Farinha and Santos, 2000). A bank may accomplish this through limiting its
(12) Although we cite this argument for the sake of completeness, we do not believe that the risk of bank liquidity shocks plays a signifi cant role in determining the number of bank lending relationships for Belgian fi rms. Banks in Belgium have historically held large stocks of liquid assets, due to their substantial portfolios of government bonds. Thus, we do not include bank characteristics in the regressions reported in Section 4.
TABLE 5 PERCENTAGES OF TOTAL EXPOSURES ACCOUNTED FOR BY FIRMS WITH DIFFERING NUMBERS OF RELATIONSHIPS
(December of each year)
Source : NBB.
Numbers of relationships Percentages of Exposures
1997 1998 1999 2000 2001 2002
1 . . . . . . . . . . . . . . . . . . . . . 38.1 38.4 39.5 39.6 43.4 44.5
2 . . . . . . . . . . . . . . . . . . . . . 19.8 19.8 22.7 21.9 22.6 24.1
3 . . . . . . . . . . . . . . . . . . . . . 11.7 11.4 11.5 13.8 12.7 11.1
4 . . . . . . . . . . . . . . . . . . . . . 8.4 9.6 9.1 9.3 7.0 7.0
5 . . . . . . . . . . . . . . . . . . . . . 5.7 4.7 4.0 3.5 3.8 5.1
More than 5 . . . . . . . . . . . . 16.3 16.2 13.4 12.0 10.6 8.2
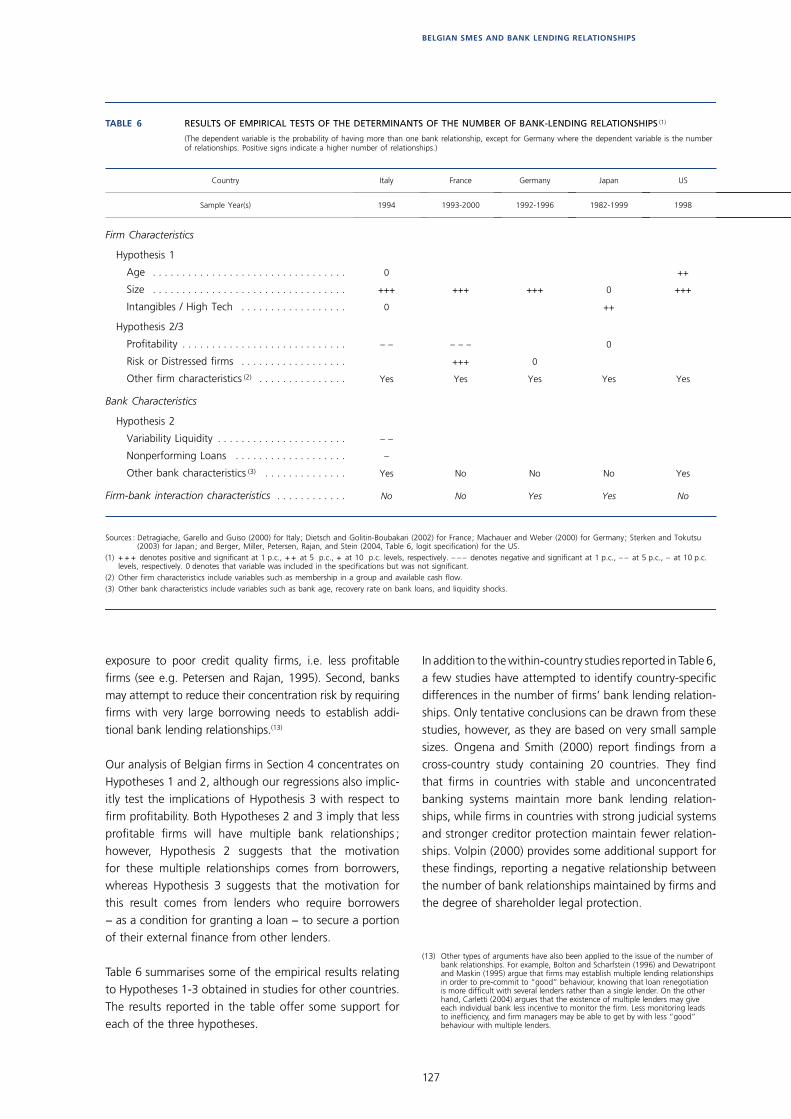
127
BELGIAN SMES AND BANK LENDING RELATIONSHIPS
exposure to poor credit quality fi rms, i.e. less profi table fi rms (see e.g. Petersen and Rajan, 1995). Second, banks may attempt to reduce their concentration risk by requiring fi rms with very large borrowing needs to establish addi-tional bank lending relationships.(13)
Our analysis of Belgian fi rms in Section 4 concentrates on Hypotheses 1 and 2, although our regressions also implic-itly test the implications of Hypothesis 3 with respect to fi rm profi tability. Both Hypotheses 2 and 3 imply that less profi table fi rms will have multiple bank relationships ; however, Hypothesis 2 suggests that the motivation for these multiple relationships comes from borrowers, whereas Hypothesis 3 suggests that the motivation for this result comes from lenders who require borrowers − as a condition for granting a loan − to secure a portion of their external fi nance from other lenders.
Table 6 summarises some of the empirical results relating to Hypotheses 1-3 obtained in studies for other countries. The results reported in the table offer some support for each of the three hypotheses.
In addition to the within-country studies reported in Table 6, a few studies have attempted to identify country-specifi c differences in the number of fi rms’ bank lending relation-ships. Only tentative conclusions can be drawn from these studies, however, as they are based on very small sample sizes. Ongena and Smith (2000) report fi ndings from a cross-country study containing 20 countries. They fi nd that fi rms in countries with stable and unconcentrated banking systems maintain more bank lending relation-ships, while fi rms in countries with strong judicial systems and stronger creditor protection maintain fewer relation-ships. Volpin (2000) provides some additional support for these fi ndings, reporting a negative relationship between the number of bank relationships maintained by fi rms and the degree of shareholder legal protection.
(13) Other types of arguments have also been applied to the issue of the number of bank relationships. For example, Bolton and Scharfstein (1996) and Dewatripont and Maskin (1995) argue that fi rms may establish multiple lending relationships in order to pre-commit to “good” behaviour, knowing that loan renegotiation is more diffi cult with several lenders rather than a single lender. On the other hand, Carletti (2004) argues that the existence of multiple lenders may give each individual bank less incentive to monitor the fi rm. Less monitoring leads to ineffi ciency, and fi rm managers may be able to get by with less “good” behaviour with multiple lenders.
TABLE 6 RESULTS OF EMPIRICAL TESTS OF THE DETERMINANTS OF THE NUMBER OF BANK-LENDING RELATIONSHIPS (1)
(The dependent variable is the probability of having more than one bank relationship, except for Germany where the dependent variable is the number of relationships. Positive signs indicate a higher number of relationships.)
Sources : Detragiache, Garello and Guiso (2000) for Italy; Dietsch and Golitin-Boubakari (2002) for France; Machauer and Weber (2000) for Germany; Sterken and Tokutsu (2003) for Japan; and Berger, Miller, Petersen, Rajan, and Stein (2004, Table 6, logit specification) for the US.
(1) + + + denotes positive and significant at 1 p.c., + + at 5 p.c., + at 10 p.c. levels, respectively. – – – denotes negative and significant at 1 p.c., – – at 5 p.c., – at 10 p.c. levels, respectively. 0 denotes that variable was included in the specifications but was not significant.
(2) Other firm characteristics include variables such as membership in a group and available cash flow.(3) Other bank characteristics include variables such as bank age, recovery rate on bank loans, and liquidity shocks.
Country Italy France Germany Japan US
Sample Year(s) 1994 1993-2000 1992-1996 1982-1999 1998
Firm Characteristics
Hypothesis 1
Age . . . . . . . . . . . . . . . . . . . . . . . . . . . . . . . . . 0 ++
Size . . . . . . . . . . . . . . . . . . . . . . . . . . . . . . . . . +++ +++ +++ 0 +++
Intangibles / High Tech . . . . . . . . . . . . . . . . . . 0 ++
Hypothesis 2/3
Profitability . . . . . . . . . . . . . . . . . . . . . . . . . . . . – – – – – 0
Risk or Distressed firms . . . . . . . . . . . . . . . . . . +++ 0
Other firm characteristics (2) . . . . . . . . . . . . . . . Yes Yes Yes Yes Yes
Bank Characteristics
Hypothesis 2
Variability Liquidity . . . . . . . . . . . . . . . . . . . . . . – –
Nonperforming Loans . . . . . . . . . . . . . . . . . . . –
Other bank characteristics (3) . . . . . . . . . . . . . . Yes No No No Yes
Firm-bank interaction characteristics . . . . . . . . . . . . No No Yes Yes No
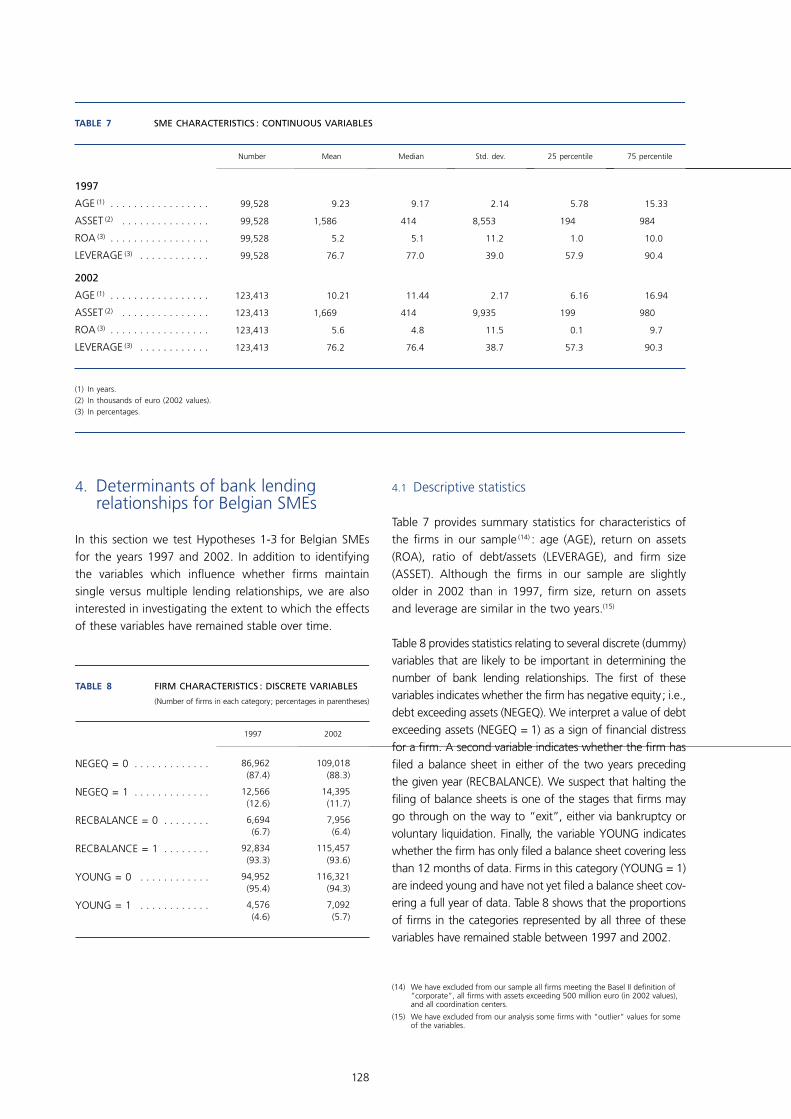
128
4. Determinants of bank lending relationships for Belgian SMEs
In this section we test Hypotheses 1-3 for Belgian SMEs for the years 1997 and 2002. In addition to identifying the variables which infl uence whether fi rms maintain single versus multiple lending relationships, we are also interested in investigating the extent to which the effects of these variables have remained stable over time.
4.1 Descriptive statistics
Table 7 provides summary statistics for characteristics of the fi rms in our sample (14) : age (AGE), return on assets (ROA), ratio of debt/assets (LEVERAGE), and fi rm size (ASSET). Although the fi rms in our sample are slightly older in 2002 than in 1997, fi rm size, return on assets and leverage are similar in the two years.(15)
Table 8 provides statistics relating to several discrete (dummy) variables that are likely to be important in determining the number of bank lending relationships. The fi rst of these variables indicates whether the fi rm has negative equity ; i.e., debt exceeding assets (NEGEQ). We interpret a value of debt exceeding assets (NEGEQ = 1) as a sign of fi nancial distress for a fi rm. A second variable indicates whether the fi rm has fi led a balance sheet in either of the two years preceding the given year (RECBALANCE). We suspect that halting the fi ling of balance sheets is one of the stages that fi rms may go through on the way to “exit”, either via bankruptcy or voluntary liquidation. Finally, the variable YOUNG indicates whether the fi rm has only fi led a balance sheet covering less than 12 months of data. Firms in this category (YOUNG = 1) are indeed young and have not yet fi led a balance sheet cov-ering a full year of data. Table 8 shows that the proportions of fi rms in the categories represented by all three of these variables have remained stable between 1997 and 2002.
(14) We have excluded from our sample all fi rms meeting the Basel II defi nition of “corporate”, all fi rms with assets exceeding 500 million euro (in 2002 values), and all coordination centers.
(15) We have excluded from our analysis some fi rms with “outlier” values for some of the variables.
TABLE 7 SME CHARACTERISTICS : CONTINUOUS VARIABLES
(1) In years.(2) In thousands of euro (2002 values).(3) In percentages.
Number Mean Median Std. dev. 25 percentile 75 percentile
1997
AGE (1) . . . . . . . . . . . . . . . . . 99,528 9.23 9.17 2.14 5.78 15.33
ASSET (2) . . . . . . . . . . . . . . . 99,528 1,586 414 8,553 194 984
ROA (3) . . . . . . . . . . . . . . . . . 99,528 5.2 5.1 11.2 1.0 10.0
LEVERAGE (3) . . . . . . . . . . . . 99,528 76.7 77.0 39.0 57.9 90.4
2002
AGE (1) . . . . . . . . . . . . . . . . . 123,413 10.21 11.44 2.17 6.16 16.94
ASSET (2) . . . . . . . . . . . . . . . 123,413 1,669 414 9,935 199 980
ROA (3) . . . . . . . . . . . . . . . . . 123,413 5.6 4.8 11.5 0.1 9.7
LEVERAGE (3) . . . . . . . . . . . . 123,413 76.2 76.4 38.7 57.3 90.3
TABLE 8 FIRM CHARACTERISTICS : DISCRETE VARIABLES
(Number of firms in each category; percentages in parentheses)
1997 2002
NEGEQ = 0 . . . . . . . . . . . . . 86,962(87.4)
109,018(88.3)
NEGEQ = 1 . . . . . . . . . . . . . 12,566(12.6)
14,395(11.7)
RECBALANCE = 0 . . . . . . . . 6,694(6.7)
7,956(6.4)
RECBALANCE = 1 . . . . . . . . 92,834(93.3)
115,457(93.6)
YOUNG = 0 . . . . . . . . . . . . 94,952(95.4)
116,321(94.3)
YOUNG = 1 . . . . . . . . . . . . 4,576(4.6)
7,092(5.7)
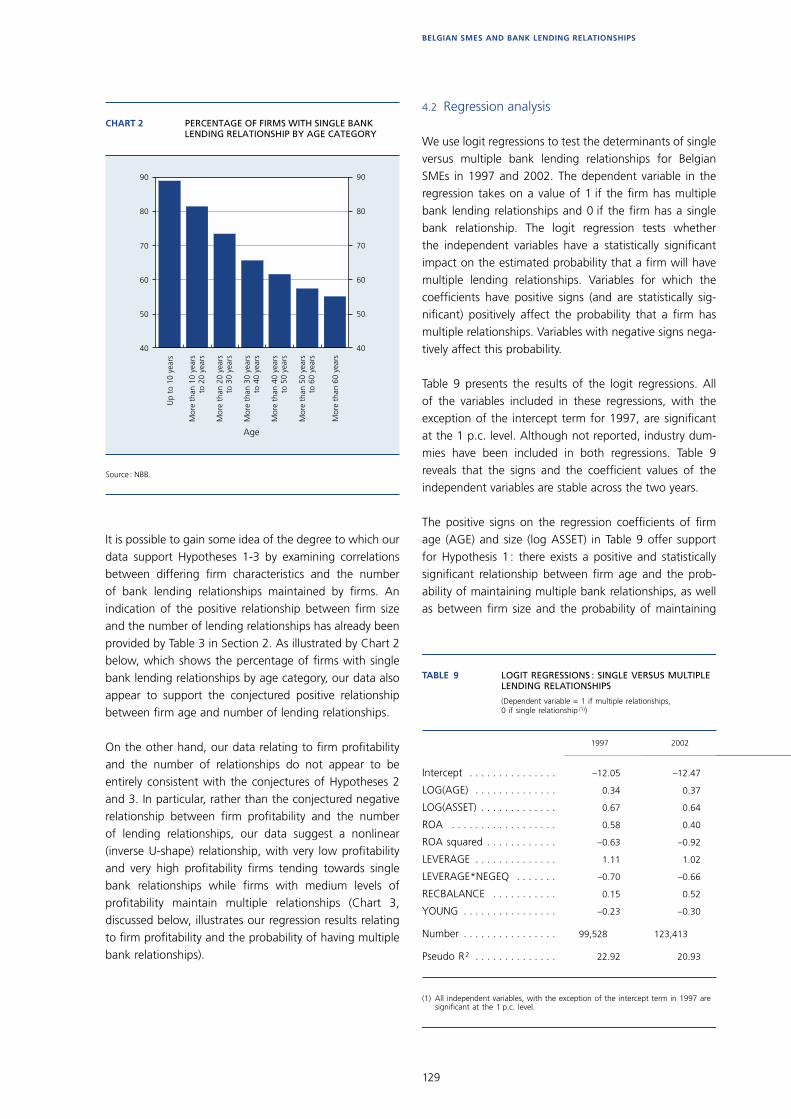
129
BELGIAN SMES AND BANK LENDING RELATIONSHIPS
It is possible to gain some idea of the degree to which our data support Hypotheses 1-3 by examining correlations between differing fi rm characteristics and the number of bank lending relationships maintained by fi rms. An indication of the positive relationship between fi rm size and the number of lending relationships has already been provided by Table 3 in Section 2. As illustrated by Chart 2 below, which shows the percentage of fi rms with single bank lending relationships by age category, our data also appear to support the conjectured positive relationship between fi rm age and number of lending relationships.
On the other hand, our data relating to fi rm profi tability and the number of relationships do not appear to be entirely consistent with the conjectures of Hypotheses 2 and 3. In particular, rather than the conjectured negative relationship between fi rm profi tability and the number of lending relationships, our data suggest a nonlinear (inverse U-shape) relationship, with very low profi tability and very high profi tability fi rms tending towards single bank relationships while fi rms with medium levels of profi tability maintain multiple relationships (Chart 3, discussed below, illustrates our regression results relating to fi rm profi tability and the probability of having multiple bank relationships).
40
50
60
70
80
90
40
50
60
70
80
90
CHART 2 PERCENTAGE OF FIRMS WITH SINGLE BANK LENDING RELATIONSHIP BY AGE CATEGORY
Up
to 1
0 ye
ars
Mor
e th
an 1
0 ye
ars
to 2
0 ye
ars
Mor
e th
an 2
0 ye
ars
to 3
0 ye
ars
Mor
e th
an 3
0 ye
ars
to 4
0 ye
ars
Mor
e th
an 4
0 ye
ars
to 5
0 ye
ars
Mor
e th
an 5
0 ye
ars
to 6
0 ye
ars
Mor
e th
an 6
0 ye
ars
Age
Source : NBB.
4.2 Regression analysis
We use logit regressions to test the determinants of single versus multiple bank lending relationships for Belgian SMEs in 1997 and 2002. The dependent variable in the regression takes on a value of 1 if the fi rm has multiple bank lending relationships and 0 if the fi rm has a single bank relationship. The logit regression tests whether the independent variables have a statistically signifi cant impact on the estimated probability that a fi rm will have multiple lending relationships. Variables for which the coeffi cients have positive signs (and are statistically sig-nifi cant) positively affect the probability that a fi rm has multiple relationships. Variables with negative signs nega-tively affect this probability.
Table 9 presents the results of the logit regressions. All of the variables included in these regressions, with the exception of the intercept term for 1997, are signifi cant at the 1 p.c. level. Although not reported, industry dum-mies have been included in both regressions. Table 9 reveals that the signs and the coeffi cient values of the independent variables are stable across the two years.
The positive signs on the regression coeffi cients of fi rm age (AGE) and size (log ASSET) in Table 9 offer support for Hypothesis 1 : there exists a positive and statistically signifi cant relationship between fi rm age and the prob-ability of maintaining multiple bank relationships, as well as between fi rm size and the probability of maintaining
TABLE 9 LOGIT REGRESSIONS : SINGLE VERSUS MULTIPLE LENDING RELATIONSHIPS
(Dependent variable = 1 if multiple relationships, 0 if single relationship (1))
(1) All independent variables, with the exception of the intercept term in 1997 are significant at the 1 p.c. level.
1997 2002
Intercept . . . . . . . . . . . . . . . –12.05 –12.47
LOG(AGE) . . . . . . . . . . . . . . 0.34 0.37
LOG(ASSET) . . . . . . . . . . . . . 0.67 0.64
ROA . . . . . . . . . . . . . . . . . . 0.58 0.40
ROA squared . . . . . . . . . . . . –0.63 –0.92
LEVERAGE . . . . . . . . . . . . . . 1.11 1.02
LEVERAGE*NEGEQ . . . . . . . –0.70 –0.66
RECBALANCE . . . . . . . . . . . 0.15 0.52
YOUNG . . . . . . . . . . . . . . . . –0.23 –0.30
Number . . . . . . . . . . . . . . . . 99,528 123,413
Pseudo R2 . . . . . . . . . . . . . . 22.92 20.93

130
multiple relationships. In addition, controlling for AGE (and other variables), young fi rms with balance sheets covering less than 12 months (YOUNG) are less likely to have multiple relationships than are fi rms that have fi led a full-year balance sheet.
While the coeffi cients on these variables are statistically signifi cant, it is also necessary to check for economic signifi cance. We do this by calculating the marginal prob-abilities of having multiple lending relationships associated with different values of the independent variables. The marginal probabilities are obtained by substituting the regression coeffi cients into the log function and varying the values of the independent variables of interest. The marginal probabilities calculated in this way for the vari-able AGE suggest that the effect of fi rm age alone is not very important. For the 2002 regression, an increase in fi rm age from its mean value of 9 years to the 75th per-centile value of 15 years, holding all other variables at their mean values, would cause the probability of having multiple relationships to rise by less than 0.5 p.c. above the sample average of 17 p.c. On the other hand, young fi rms with balance sheets covering less than 12 months of data (YOUNG) are very unlikely to have multiple relationships. The estimated change in probability of multiple relation-ships for fi rms with YOUNG = 1 relative to fi rms with YOUNG = 0 is –4.2 p.c.
As expected, fi rm size appears to be economically sig-nifi cant in determining whether fi rms have multiple lend-ing relationships. An increase in fi rm size from its mean to its 75th percentile value would cause the estimated
(16) Although very high profi tability fi rms also have a slightly lower probability of having multiple relationships than do some fi rms with lower profi tability, this effect is not as strong as that for very low profi tability fi rms.
probability of having multiple relationships to increase from 17 p.c. to 23 p.c.
The regressions also confi rm a divergence of our results from the conjectures of Hypotheses 2 and 3 regard-ing the relationship between fi rm profi tability and the number of bank lending relationships (ROA and ROA squared). Chart 3 illustrates the estimated probabilities of multiple lending relationships for different values of ROA (probabilities are calculated using the sum of the coeffi cients ROA + ROA squared). This chart shows that low profi tability or loss-making fi rms are less likely to have multiple relationships than are more profi table fi rms.(16) This suggests that although low profi tability fi rms may wish to have multiple lending relationships (Hypothesis 2), new lenders may simply be unwilling to extend loans to these fi rms. As profi tability increases from low levels, the likelihood of having multiple rela-tionships rises.
The positive coeffi cient on LEVERAGE in each of the regressions reported in Table 9 indicates that fi rms with greater leverage have a higher probability of having multiple relationships than those with lower leverage. However, the negative sign on the interaction term LEVERAGE*NEGEQ suggests that increases in leverage for very highly leveraged fi rms lower the probability of multi-ple relationships. Indeed, for the 2002 regression the aver-age estimated change in probability of multiple relation-ships for fi rms with debt greater than assets (NEGEQ = 1) is –9.3 p.c. This result provides additional evidence in sup-port of the idea that fi nancially distressed fi rms are less likely to have multiple lending relationships.
A fi nal result which also offers indirect evidence concern-ing the potential diffi culty for fi nancially distressed fi rms to maintain multiple lending relationships is the positive regression coeffi cient on the variable RECBALANCE. This coeffi cient indicates that fi rms which have fi led a balance sheet in either of the two years preceding the year of observation are more likely to have multiple relationships than are fi rms that have not fi led a recent balance sheet. The estimated decrease in the probability of multiple rela-tionships for fi rms that have not fi led a recent balance sheet (RECBALANCE = 0) relative to those which have fi led a balance sheet is 7.2 p.c.
In summary, some of our fi ndings for Belgian SMEs are in line with the hypotheses tested in the literature ; however, some results differ. Consistent with the literature, we fi nd that younger and smaller fi rms tend to have fewer lending
13
14
15
16
17
18
–30 –20 –1013
14
15
16
17
18
0 10 20 30 40 50
CHART 3 ESTIMATED PROBABILITY OF HAVING MULTIPLE LENDING RELATIONSHIPS FOR DIFFERING VALUES OF ROA (1)
Source : NBB.(1) Return on Asset values in the chart range from the 1st to the 99th percentiles of
firms in the sample. The probabilities for ROA are computed using the coefficients of ROA + ROA squared and holding all other independent variables at their mean values.
ROA
P (m
ultip
le r
elat
ions
hips
)
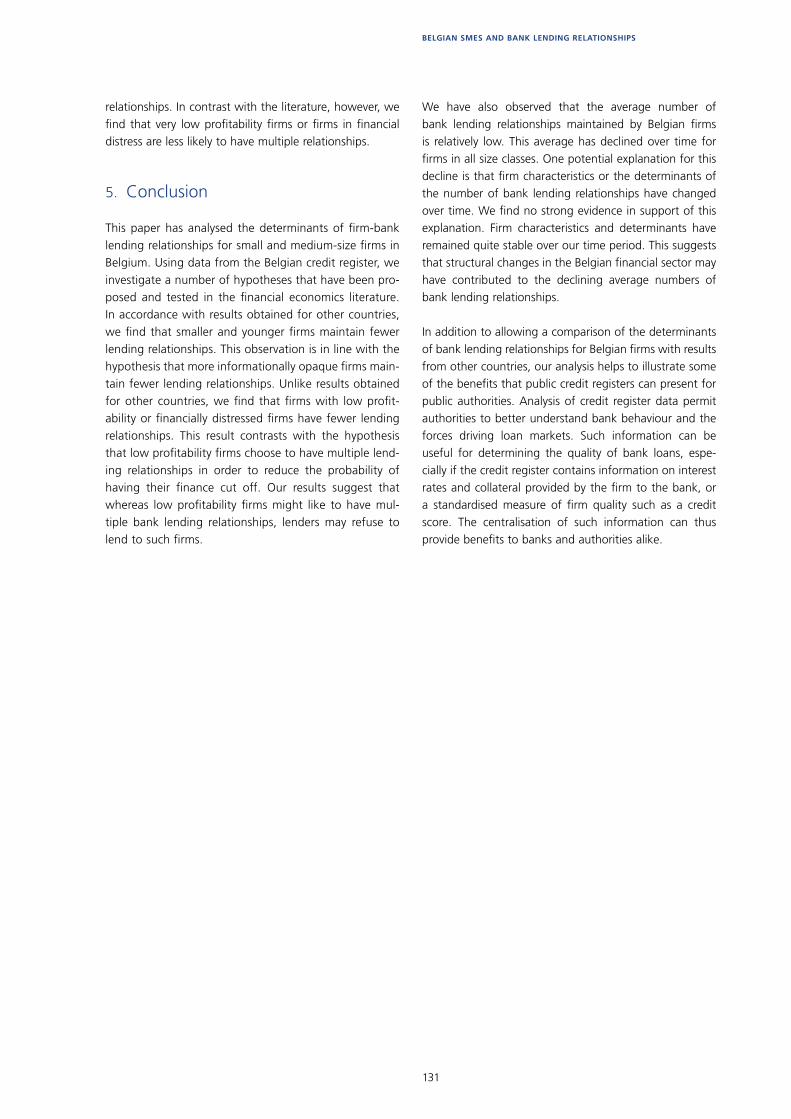
131
BELGIAN SMES AND BANK LENDING RELATIONSHIPS
relationships. In contrast with the literature, however, we fi nd that very low profi tability fi rms or fi rms in fi nancial distress are less likely to have multiple relationships.
5. Conclusion
This paper has analysed the determinants of fi rm-bank lending relationships for small and medium-size fi rms in Belgium. Using data from the Belgian credit register, we investigate a number of hypotheses that have been pro-posed and tested in the fi nancial economics literature. In accordance with results obtained for other countries, we fi nd that smaller and younger fi rms maintain fewer lending relationships. This observation is in line with the hypothesis that more informationally opaque fi rms main-tain fewer lending relationships. Unlike results obtained for other countries, we fi nd that fi rms with low profi t-ability or fi nancially distressed fi rms have fewer lending relationships. This result contrasts with the hypothesis that low profi tability fi rms choose to have multiple lend-ing relationships in order to reduce the probability of having their fi nance cut off. Our results suggest that whereas low profi tability fi rms might like to have mul-tiple bank lending relationships, lenders may refuse to lend to such fi rms.
We have also observed that the average number of bank lending relationships maintained by Belgian fi rms is relatively low. This average has declined over time for fi rms in all size classes. One potential explanation for this decline is that fi rm characteristics or the determinants of the number of bank lending relationships have changed over time. We fi nd no strong evidence in support of this explanation. Firm characteristics and determinants have remained quite stable over our time period. This suggests that structural changes in the Belgian fi nancial sector may have contributed to the declining average numbers of bank lending relationships.
In addition to allowing a comparison of the determinants of bank lending relationships for Belgian fi rms with results from other countries, our analysis helps to illustrate some of the benefi ts that public credit registers can present for public authorities. Analysis of credit register data permit authorities to better understand bank behaviour and the forces driving loan markets. Such information can be useful for determining the quality of bank loans, espe-cially if the credit register contains information on interest rates and collateral provided by the fi rm to the bank, or a standardised measure of fi rm quality such as a credit score. The centralisation of such information can thus provide benefi ts to banks and authorities alike.

132
References
Allen, F. (1990), “The Market for Information and the Origin of Financial Intermediation”, Journal of Financial Intermediation, 1, pp. 3-30.
Beck, T., Demirgüç-Kunt and Maksimovic (2004), “Bank Competition and Access to Finance”, mimeo.
Berger, A., N. Miller, M. Petersen, R. Rajan and J. Stein (2004), “Does Function Follow Organizational Form ? Evidence From the Lending Practices of Large and Small Banks”, mimeo, Northwestern University.
Bhattacharya, S. and G. Chiesa, (1995), “Proprietary Information, Financial Intermediation, and Research Incentives”, Journal of Financial Intermediation, 4, pp. 328-357.
Black, S. and P. Strahan (2002), “Entrepreneurship and Bank Credit Availability”, Journal of Finance 57, 2807-2834.
Bolton, P. and D. Scharfstein (1996), “Optimal Debt Structure and the Number of Creditors”, Journal of Political Economy, 104, pp.1-25.
Bonacorssi di Patti, E. and G. Dell’Ariccia (2003), “Bank Competition and Firm Creation”, Journal of Money, Credit and Banking, forthcoming.
Broecker, T. (1990), “Credit-Worthiness Tests and Interbank Competition”, Econometrica, 58, pp. 429-452.
Cao, M. and S. Shi (2001), “Screening, Bidding and Loan Market Tightness”, European Finance Review, 5, pp. 21-61.
Carletti, E. (2004), “The Structure of Bank Relationships, Endogenous Monitoring, and Loan Rates”, Journal of Financial Intermediation, 13, pp. 58-86.
Chemmanur, T.J. and P. Fulghieri (1994), “Reputation, Renegotiation and the Choice between Bank Loans and Publicly Traded Debt”, Review of Financial Studies, 7, pp. 475-506.
Degryse, H. and P. Van Cayseele (2000), Relationship Lending within a Bank-based System : Evidence from European Small Business Data, Journal of Financial Intermediation, 9, pp. 90-109.
Degryse, H., N. Masschelein and J. Mitchell, “SMEs and Bank Lending Relationships : the Impact of Mergers”, NBB Working Paper, No. 46.
Dell’Ariccia, G. (2001), “Asymmetric Information and the Market Structure of the Banking Industry”, European Economic Review, 45, pp. 1957-1980.
Detragiache, E., P. Garella and L. Guiso (2000), “Multiple versus Single Banking Relationships : Theory and Evidence” Journal of Finance, 55, pp. 1133-1161.
Dewatripont, M. and E.S. Maskin (1995), “Credit Effi ciency in Centralized and Decentralized Economies” Review of Economic Studies, 62, pp. 541-555.
Diamond, D. (1984), “Financial Intermediation and Delegated Monitoring”, Review of Economic Studies, 51, pp. 393-414.
Dietsch, M. and V. Golitin-Boubakari (2002), “L’évolution des Relations Banques-Entreprises dans les Années 1990”, Bulletin de la Commission Bancaire, no. 27, pp. 74-107.
Farinha, L.A. and J. Santos (2002), “Switching from Single to Multiple Bank Lending Relationships : Determinants and Implications, Journal of Financial Intermediation, 11, pp. 124-151.

133
BELGIAN SMES AND BANK LENDING RELATIONSHIPS
Freixas, X. and J.-C. Rochet (1998), Microeconomics in Banking, MIT press.
Harhoff, D. and T. Körting (1998), “Lending Relationships in Germany : Empirical Results from Survey Data”, CEPR Working Paper, No. 1917.
Machauer, A. and M. Weber (1998), “Number of Bank Relationships : An Indicator of Competition, Borrower Quality, or Just Size ?”, Center for Financial Studies working paper 2000/06.
Miller, M. (2003), Credit Reporting Systems and the International Economy, MIT Press.
Ongena, S. and D.C. Smith (2000), “What determines the Number of Bank Relationships ? Cross-Country Evidence”, Journal of Financial Intermediation, 61, 449-475.
Petersen, M.A. and R.G. Rajan (1995), “The Effect of Credit Market Competition on Lending Relationships”, Quarterly Journal of Economics, 110, pp. 406-443.
Rajan, R.G. (1992), “Insiders and Outsiders : the Choice between Informed and Arm’s-length Debt”, Journal of Finance, 47, pp. 1367-1400.
Sharpe, S.A. (1990), “Asymmetric Information, Bank Lending and Implicit Contracts : a Stylized Model of Customer Relationships”, Journal of Finance, 45, pp. 1069-1087.
Sterken, E. and I. Tokutsu (2003), “What are the Determinants of the Number of Bank Relations of Japanese fi rms ?”, mimeo, University of Groningen.
Tirole, J. (1998), The Theory of Industrial Organization, MIT press.
Volpin, P. (2000), “Ownership Structure, Banks, and Private Benefi ts of Control”, mimeo, London Business School.
Ramakrishnan, R. and A. Thakor (1984), “Information Reliability and a Theory of Financial Intermation”, The Review of Economic Studies, 51, pp. 415-432.
von Rheinbaben, J. and M. Ruckes (2004), “The number and the closeness of bank relationships”, Journal of Banking and Finance, 28, pp. 1597-1615.
von Thadden, E.L. (1992), “The Commitment of Finance, Duplicated Monitoring and the Investment Horizon, Working Paper in Financial Markets, 27.
von Thadden, E.L. (1995), “Long-term Contracts, Short-term Investment, and Monitoring”, Review of Economic Studies, 62, pp. 557-575.
Yosha, O. (1995), “Information Disclosure Costs and the Choice of Financing Source”, Journal of Financial Intermediation, 4, pp. 3-20.
135
THE DETERMINANTS OF CREDIT SPREADS
The Determinants of Credit Spreads
1. Introduction
While many studies concentrate on theoretical models for the pricing of corporate bonds and credit risk, there has been much less empirical testing of these models. Yet, there are several reasons for investigating the determi-nants and behaviour of credit spreads. First, both the US and Euro corporate bond markets have grown rapidly in recent years. The Euro market, which lags its US coun-terpart, has become broader and more liquid, and the number and the market value of Euro corporate bonds have more than doubled over the last fi ve years.
These developments have potentially affected fi nancial stability. The growth of the corporate bond markets has signifi cantly infl uenced the composition of portfolios held by fi nancial institutions, industrial fi rms, trusts, and private investors. It is likely that the portfolios of these investors have become more (geographically) diversifi ed. Investors can also construct portfolios that better fi t their needs and expectations of return and risk, which will improve the allocation of capital. On the other hand, the increased reliance by corporates and households on fi nancial market instruments such as corporate bonds has also increased the dependence of these investors and borrowers on fi nancial market prices.
A second reason for studying the determinants of credit spreads is that the credit derivatives market, including structured fi nance products such as collateralized debt obligations (CDO) and asset-backed securities (ABS), has experienced considerable growth over the last two decades and is expected to grow strongly in the coming years. Some structured products such as collateralized bond obligations (CBO) are backed by a large pool of corporate bonds. This implies that the cash fl ows (coupon and principal) of the underlying bonds determine the
profi tability of these structured products ; therefore, the creditworthiness of corporate bonds is important for the analysis of these products.
Finally, central bankers use credit spreads to assess (extract) default probabilities of fi rms and to assess the general functioning of fi nancial markets (credit rationing and sectoral versus macroeconomic effects). In addition, the credit spread is often used as a business cycle indica-tor. Having a better understanding of credit spreads will help central bankers to extract more precise information from bond prices/spreads.
The contributions of this article are threefold. First, we present an empirical analysis of the determinants of credit spread changes on Euro corporate bonds between 1998 and 2002. This is one of the fi rst analyses of the determi-nants for different types of Euro corporate bonds based on rating and maturity. In choosing the determinants, we are led by the structural credit risk models pioneered by Black and Scholes (1973) and Merton (1974). Our results show that factors suggested by the structural credit risk models, such as the level and the slope of the default-free term structure, the stock price, and the stock price vola-tility signifi cantly affect credit spreads on Euro corporate bonds. An important result is that the sensitivities of credit spreads strongly depend on the rating and the maturity of the bonds. Furthermore, liquidity risk is an important determinant of credit spreads, especially those on lower rated bonds. Second, we compare the sensitivities of credit spreads on US and European corporate bonds to fi nancial and macro-economic variables. A review of the existing literature on US and European credit spreads shows that no more than 45 p.c. of the dynamics of credit spreads can be explained. Furthermore, although the US and the European corporate bond markets differ signifi cantly in terms of market value and number of bonds, empirical
Astrid Van Landschoot
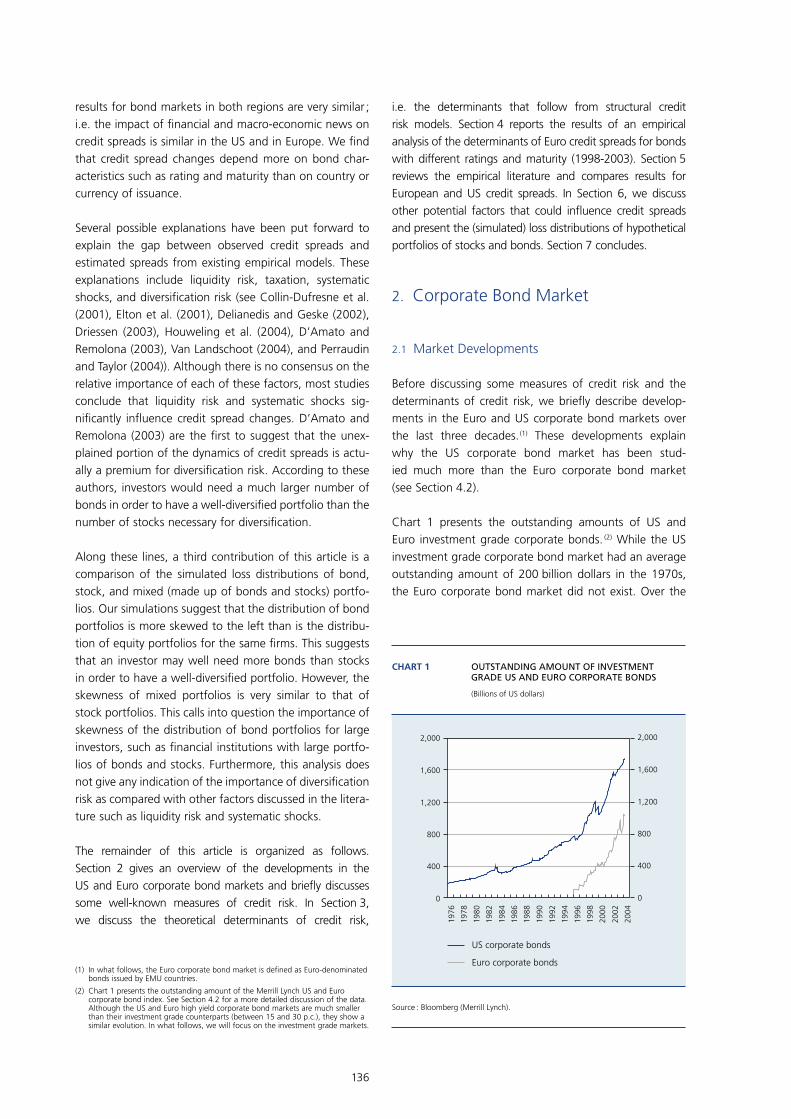
136
results for bond markets in both regions are very similar ; i.e. the impact of fi nancial and macro-economic news on credit spreads is similar in the US and in Europe. We fi nd that credit spread changes depend more on bond char-acteristics such as rating and maturity than on country or currency of issuance.
Several possible explanations have been put forward to explain the gap between observed credit spreads and estimated spreads from existing empirical models. These explanations include liquidity risk, taxation, systematic shocks, and diversifi cation risk (see Collin-Dufresne et al. (2001), Elton et al. (2001), Delianedis and Geske (2002), Driessen (2003), Houweling et al. (2004), D’Amato and Remolona (2003), Van Landschoot (2004), and Perraudin and Taylor (2004)). Although there is no consensus on the relative importance of each of these factors, most studies conclude that liquidity risk and systematic shocks sig-nifi cantly infl uence credit spread changes. D’Amato and Remolona (2003) are the fi rst to suggest that the unex-plained portion of the dynamics of credit spreads is actu-ally a premium for diversifi cation risk. According to these authors, investors would need a much larger number of bonds in order to have a well-diversifi ed portfolio than the number of stocks necessary for diversifi cation.
Along these lines, a third contribution of this article is a comparison of the simulated loss distributions of bond, stock, and mixed (made up of bonds and stocks) portfo-lios. Our simulations suggest that the distribution of bond portfolios is more skewed to the left than is the distribu-tion of equity portfolios for the same fi rms. This suggests that an investor may well need more bonds than stocks in order to have a well-diversifi ed portfolio. However, the skewness of mixed portfolios is very similar to that of stock portfolios. This calls into question the importance of skewness of the distribution of bond portfolios for large investors, such as fi nancial institutions with large portfo-lios of bonds and stocks. Furthermore, this analysis does not give any indication of the importance of diversifi cation risk as compared with other factors discussed in the litera-ture such as liquidity risk and systematic shocks.
The remainder of this article is organized as follows. Section 2 gives an overview of the developments in the US and Euro corporate bond markets and briefl y discusses some well-known measures of credit risk. In Section 3, we discuss the theoretical determinants of credit risk,
i.e. the determinants that follow from structural credit risk models. Section 4 reports the results of an empirical analysis of the determinants of Euro credit spreads for bonds with different ratings and maturity (1998-2003). Section 5 reviews the empirical literature and compares results for European and US credit spreads. In Section 6, we discuss other potential factors that could infl uence credit spreads and present the (simulated) loss distributions of hypothetical portfolios of stocks and bonds. Section 7 concludes.
2. Corporate Bond Market
2.1 Market Developments
Before discussing some measures of credit risk and the determinants of credit risk, we briefl y describe develop-ments in the Euro and US corporate bond markets over the last three decades. (1) These developments explain why the US corporate bond market has been stud-ied much more than the Euro corporate bond market (see Section 4.2).
Chart 1 presents the outstanding amounts of US and Euro investment grade corporate bonds. (2) While the US investment grade corporate bond market had an average outstanding amount of 200 billion dollars in the 1970s, the Euro corporate bond market did not exist. Over the
(1) In what follows, the Euro corporate bond market is defi ned as Euro-denominated bonds issued by EMU countries.
(2) Chart 1 presents the outstanding amount of the Merrill Lynch US and Euro corporate bond index. See Section 4.2 for a more detailed discussion of the data. Although the US and Euro high yield corporate bond markets are much smaller than their investment grade counterparts (between 15 and 30 p.c.), they show a similar evolution. In what follows, we will focus on the investment grade markets.
0
400
800
1,200
1,600
2,000
1976
1978
1980
1982
1984
1986
1988
1990
1992
1994
1996
1998
2000
2002
2004
0
400
800
1,200
1,600
2,000
CHART 1 OUTSTANDING AMOUNT OF INVESTMENT GRADE US AND EURO CORPORATE BONDS
(Billions of US dollars)
Source : Bloomberg (Merrill Lynch).
US corporate bonds
Euro corporate bonds
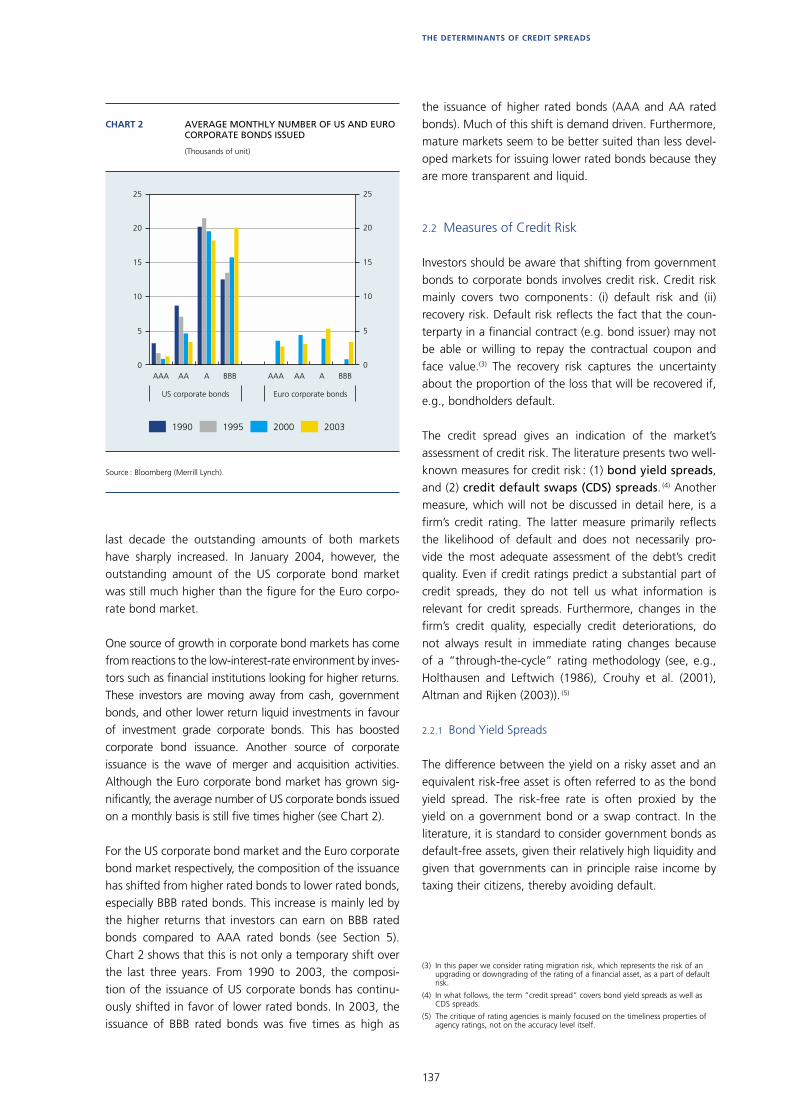
137
THE DETERMINANTS OF CREDIT SPREADS
last decade the outstanding amounts of both markets have sharply increased. In January 2004, however, the outstanding amount of the US corporate bond market was still much higher than the fi gure for the Euro corpo-rate bond market.
One source of growth in corporate bond markets has come from reactions to the low-interest-rate environment by inves-tors such as fi nancial institutions looking for higher returns. These investors are moving away from cash, government bonds, and other lower return liquid investments in favour of investment grade corporate bonds. This has boosted corporate bond issuance. Another source of corporate issuance is the wave of merger and acquisition activities. Although the Euro corporate bond market has grown sig-nifi cantly, the average number of US corporate bonds issued on a monthly basis is still fi ve times higher (see Chart 2).
For the US corporate bond market and the Euro corporate bond market respectively, the composition of the issuance has shifted from higher rated bonds to lower rated bonds, especially BBB rated bonds. This increase is mainly led by the higher returns that investors can earn on BBB rated bonds compared to AAA rated bonds (see Section 5). Chart 2 shows that this is not only a temporary shift over the last three years. From 1990 to 2003, the composi-tion of the issuance of US corporate bonds has continu-ously shifted in favor of lower rated bonds. In 2003, the issuance of BBB rated bonds was fi ve times as high as
the issuance of higher rated bonds (AAA and AA rated bonds). Much of this shift is demand driven. Furthermore, mature markets seem to be better suited than less devel-oped markets for issuing lower rated bonds because they are more transparent and liquid.
2.2 Measures of Credit Risk
Investors should be aware that shifting from government bonds to corporate bonds involves credit risk. Credit risk mainly covers two components : (i) default risk and (ii) recovery risk. Default risk refl ects the fact that the coun-terparty in a fi nancial contract (e.g. bond issuer) may not be able or willing to repay the contractual coupon and face value.(3) The recovery risk captures the uncertainty about the proportion of the loss that will be recovered if, e.g., bondholders default.
The credit spread gives an indication of the market’s assessment of credit risk. The literature presents two well-known measures for credit risk : (1) bond yield spreads, and (2) credit default swaps (CDS) spreads. (4) Another measure, which will not be discussed in detail here, is a fi rm’s credit rating. The latter measure primarily refl ects the likelihood of default and does not necessarily pro-vide the most adequate assessment of the debt’s credit quality. Even if credit ratings predict a substantial part of credit spreads, they do not tell us what information is relevant for credit spreads. Furthermore, changes in the fi rm’s credit quality, especially credit deteriorations, do not always result in immediate rating changes because of a “through-the-cycle” rating methodology (see, e.g., Holthausen and Leftwich (1986), Crouhy et al. (2001), Altman and Rijken (2003)). (5)
2.2.1 Bond Yield Spreads
The difference between the yield on a risky asset and an equivalent risk-free asset is often referred to as the bond yield spread. The risk-free rate is often proxied by the yield on a government bond or a swap contract. In the literature, it is standard to consider government bonds as default-free assets, given their relatively high liquidity and given that governments can in principle raise income by taxing their citizens, thereby avoiding default.
(3) In this paper we consider rating migration risk, which represents the risk of an upgrading or downgrading of the rating of a fi nancial asset, as a part of default risk.
(4) In what follows, the term “credit spread” covers bond yield spreads as well as CDS spreads.
(5) The critique of rating agencies is mainly focused on the timeliness properties of agency ratings, not on the accuracy level itself.
0
5
10
15
20
25
0
5
10
15
20
25
1990 1995 2000 2003
CHART 2 AVERAGE MONTHLY NUMBER OF US AND EURO CORPORATE BONDS ISSUED
(Thousands of unit)
Source : Bloomberg (Merrill Lynch).
AAA AA A BBB AAA AA A BBB
US corporate bonds Euro corporate bonds
138
The bond yield spread compensates the investor for the expected default losses on the risky bond. No investor would be willing to buy a risky corporate bond, if he could buy a risk-free bond at the same price, ceteris paribus. Corporate bonds will trade at a lower price ceteris paribus and, hence, at a higher yield, since there is the risk of losing (part of) the invested funds. The spread also consists of a risk premium to reward the risk-averse investor for the risk of possibly higher than expected losses. As an illustration, consider the following example. Suppose that we have a risk-free bond with a price of 100 and a risky bond with exactly the same characteristics, except that it has a default probability of 10 p.c. A risk-neutral investor will pay 100 for the risk-free bond and 90 for the risky bond. A risk-averse investor will pay 100 for the risk-free bond but only less than 90 for the risky bond. The stronger the risk-aversion of an investor, the lower the price he is willing to pay (or the higher the premium) for the risky bond.
Finally, it is very likely that the spread between default-risky and default-free yields also includes a premium for other factors such as liquidity risk, differences in tax treatments between government and corporate bonds, contingent contract specifi cations (e.g. call features) and systematics shocks.
2.2.2 Credit Default Swap (CDS) Spread
CDS is the most used credit derivative and can be viewed as default insurance on loans or bonds. The buyer of a CDS makes periodic payments to the seller of the CDS and in return obtains the right to sell to the CDS seller a bond issued by the reference entity (company or sovereign) for its face value if default or another credit event occurs. Using CDS data to mesure spreads has two major advantages (see Hull et al. (2002) and Cossin et al. (2002)). First, CDS spread data provided by a broker consist of fi rm bid and offer quotes from dealers. Once a quote has been made, the dealer is committed to trad-ing a minimum principal (usually 10 million dollars) at the quoted price. However, bond yield data available to researchers usually consist of indications from dealers. So, there is no commitment from the dealer to trade at the specifi ed price. Second, since CDS spreads are already credit spreads, there is no default-free benchmark needed to calculate the spreads. The main disadvantages of CDSs are their lack of liquidity and the absence of a (liquid) secondary market.
2.2.3 Relationship between CDS Spread and Bond Yield Spread
In theory, bond yield spreads should be closely related to CDS spreads. This is because of an arbitrage relation-ship that exists between credit default swap spreads and credit spreads for a given reference entity (see Duffi e (1999), O’Kane and McAdie (2001), and Hull et al. (2002)). Suppose that an investor buys a T-year par bond with yield to maturity y issued by the reference entity. The investor can eliminate most of the default risk associated with the bond by buying a CDS at a spread (or rate) of y
CDS. By arbitrage, y - y
CDS should approxi-
mately equal the risk-free rate, rf. For y - y
CDS < r
f. short-
ing a risky bond, writing protection in the CDS market, and buying a risk-free bond would be profi table. Thus, this suggests that the credit spread should be equal to the CDS spread. The results of the empirical studies on the relationship between CDS spreads and bond yield depend on the choice of the default-free benchmark (see, e.g., Blanco et al. (2003), Longstaff et al. (2003) and Houweling and Vorst (2005)). Studies that use the swap rate as the default-free benchmark fi nd bond yield spreads to be quite close to CDS spreads (Blanco et al. (2003)). Derivatives traders tend to work with the LIBOR zero curve (also called swap zero curve) as the benchmark because the LIBOR or swap rates closely correspond to the cost of capital of fi nancial institu-tions. However, studies that use the Treasury rate as the default-free benchmark fi nd signifi cant differences.
3. Determinants of Credit Spreads
3.1 Theoretical Framework
Credit risk models generally boil down to one of two distinct approaches : structural, contingent-claim or fi rm-value models and reduced-form models. The structural models, initiated by Black and Scholes (1973) and Merton (1974), relate credit events to the fi rm’s value and capital structure. Default occurs if the value of the fi rm falls below a barrier. In these models, credit events are endogenous. In contrast, the reduced-form models specify the credit event as an exogenous, unpredictable, statistical event, governed by some hazard-rate process. Although the latter category of models is used more often in pric-ing derivatives for reasons of mathematical tractability, structural credit risk models yield more insight into the determinants of credit spreads. Since the Merton model (see Box 1 : Merton model) is one of the fi rst structural credit risk models, the literature often refers to it as the representative of the structural models. (6)
(6) The Merton model has been extended in several ways by relaxing some restrictive assumptions such as a deterministic risk-free term structure, zero-coupon debt as the only source of debt, and frictionless markets. However, the main conclusions are not altered by these extensions.

139
THE DETERMINANTS OF CREDIT SPREADS
Box 1 – Merton model
In the structural models, default occurs when the fi rm’s asset value, VT, falls below a specifi ed critical value at
maturity T. In the Merton model (1974), the critical value is given by the face value of the fi rm’s zerobond debt, L, which is by assumption the only source of debt. In case of default, debt holders receive the amount V
T. The
value of a default-risky zero-coupon bond at time T can be written as
Eq 1
The value of a default-risky zero-coupon bond equals the difference of the value of a default-free zero-coupon bond with face value L and the value of European put option written on the fi rm’s asset value, with strike price L and exercise date T.(1) The payoff, L - V
T, is often called the put-to-default.
In the Merton model, the dynamics of the asset value of the fi rm can be described as
Eq 2
where r is the instantaneous expected rate of return, the variance of the return Vσ the underlying assets, and Zt a standard Wiener process.(2)
Since the sum of the fi rm’s debt value and equity value equals VT, the equity value at time T equals
Eq 3
The stockholders receive the difference between VT and L in the case of no default and zero in the case of default.
The fi rm’s equity value can thus be seen as the value of a call option on the fi rm’s assets. Issuing debt is similar to selling the fi rm’s asset value to the bondholders while the stockholders keep a call option to buy back the assets. Using the put-call parity, this is equivalent to saying that the stockholders own the fi rm’s asset value and buy a put option from the bondholders.
Merton (1974) derived a closed-form solution for the price/yield of a defaultable zero-coupon bond by combining equation (1) with the Black and Scholes formula for a European put option. The credit spread on a defaultable bond with maturity T, CR(t,T) is calculated as the difference between the yield on a defaultable zero-coupon bond with maturity T, Yd(t, T) and the yield on risk-free zero-coupon bond with maturity T, Y(t, T)
Eq 4
with
and
)V–L(0,max – L)V (L,min D TTT ==
!
(1) The bondholder has written a put option from the equity holders, agreeing to accept the assets in settlement of the payment if the value of the fi rm falls below the face value of the debt.
(2) A Wiener process Z has the following properties : (1) Z has uncorrelated and unpredictable increments, (2) Z has zero mean and variance t, and (3) the process Z is continuous.
,tVt
t dZrdtV
dV σ+=
TTTTT CL)–V(0,max L),(Vmin –VE ===
,))(ln–T)Y(t,–T)(t,T)CR(t, 21
1
tT
hN) N(– h(lY
–td
−+==
,)(
)(5.0ln 2
2,1tT
tTlh
V
Vt
−−±−
=σ
σ
.exp),( )(
t
tTr
tt V
L
V
TtLBl
−−
==

140
The Merton model, which is discussed in more detail in the Box, and the structural credit risk models in general, provide a framework which identifi es some important determinants of credit spreads, which include the risk-free interest rate, the asset value, and asset volatility. These variables are discussed in more detail below. In addition, we also discuss the slope of the default-free term structure, as this variable is implied by the structural models because it is closely related to the risk-free interest rate. Finally, we discuss two additional variables that do not come from the existing structural credit risk models but which are often mentioned in the literature on credit spreads : liquidity risk and taxation.
3.2 Factors Implied by Structural Credit Risk Models
3.2.1 Default-free Interest Rate
According to the structural credit risk models, we expect a negative relation between the (instantaneous) nominal risk-free rate and the credit spread. (7) The drift of the risk-neutral process of the value of the assets (see equation (2)), which is the expected growth of the fi rm’s value, equals the risk-free interest rate. An increase in the inter-est rate implies an increase in the expected growth rate of the fi rm value. This will in turn lower the probability of default and the credit spread. Structural credit risk models show that for fi rms with moderate and high (low) debt levels, the effect of an interest rate change decreases (increases) with the term to maturity. However, the inter-est rate effect always remains stronger for fi rms with higher debt levels. Since fi rms with a higher debt level often have a lower rating, we expect that the interest rate effect is stronger for lower rated fi rms.
Furthermore, lower interest rates are usually associated with a weakening economy and higher credit spreads. In the long run, however, low interest rates might stimulate investment and thus economic growth. This reasoning would lead, in contrast to what was said above, to a posi-tive relation between the risk-free rate and credit spreads. Box 2 discusses which relation arises empirically.
3.2.2 Slope of Default-free Term Structure
The interpretation of the effect of the slope of the default-free term structure on credit spreads is similar to that of the effect of the default-free rate. The expecta-tions hypothesis of the term structure implies that the spread between the long-term and the short-term rate, which is often called the slope, is an optimal predictor of future changes in short-term rates over the life of the long-term bond. As such, an increase in the slope implies an increase in the expected short-term interest rates. As in the case of the motivation for the risk-free interest rate above, an increase in the slope is expected to lower the price of the put option and reduce a fi rm’s default risk. Furthermore, the slope of the term structure is often related to future business cycle conditions. A decrease in the slope is considered to be an indication of a weaken-ing economy. Estrella and Hardouvelis (1991) and Estrella and Mishkin (1995, 1998) conclude that the yield curve is a good predictor of future economic activity and the probability of recession. A positively sloped yield curve is associated with improving economic activity, which might in turn increase a fi rm’s growth rate and reduce its default probability. Therefore, we also expect a negative depend-ence between changes in the slope of the default-free term structure and credit spread changes.
3.2.3 Asset Price
Equation (4) includes the leverage ratio or the pseudo debt-to-assets ratio, namely l. (8) Firms with a low lever-age ratio, where the asset value can easily cover the debt value, are unlikely to default. An increase in the leverage ratio increases the value of the put option and thus the credit spread. An increase in the fi rm’s asset value, V, (for a given debt value) reduces the leverage ratio and the value of the put option. Therefore, we expect a nega-tive relation between the fi rm’s asset value and the credit spread. The effect of an asset price change is stronger for
N denotes the cumulative probability distribution function of a standard normal. Lt = LB(t, T) is the present value
of the promised claim (the face value) at the maturity of the bond and B (t, T) presents the value of a unit default-free zero-coupon bond. l is the leverage ratio, r the continuously compounded risk-free rate and Vσ the volatility of the fi rm’s asset value. For simplicity, we assume that the payout or dividend ratio equals zero.
Equation (4) shows that the credit spread is a function of the risk-free interest rate, the fi rm’s asset value, and the volatility of the fi rm’s asset value. These factors will be discussed in more detail in Section 3.2.
(7) The risk-free rate that is referred to in the structural credit risk models is the nominal rate. In the remainder, we drop “nominal”.
(8) Structural credit risk models often refer to the distance-to-default ratio, which is (1/l) (with l the leverage ratio).
141
THE DETERMINANTS OF CREDIT SPREADS
bonds with a short to medium term to maturity and for fi rms with a high leverage ratio.
Structural models typically assume that the assets of the fi rm are tradable securities. In practice, however, the asset value has to be deduced from the balance sheet and is updated only on an infrequent basis. Therefore, the value of the assets is usually replaced by the equity value/returns for publicly traded companies. Studies that consider port-folios of bonds try to mimic the average stock return of the issuing fi rms by including the value (return) of a stock index that is related to the portfolio. For a portfolio of, e.g., Euro bonds issued by the fi nancial sector, the aver-age asset value is often proxied by the return of a Euro fi nancial index.
3.2.4 Asset Volatility
Equation (4) shows that credit spreads are affected by the volatility of the fi rm’s asset value. High asset volatility cor-responds with a high probability that the fi rm’s asset value will fall below the value of its debt. In that case, it is more likely that the put option will be exercised and thus, credit spreads will be higher. The effect of a volatility increase is larger for bonds with a high leverage ratio compared to bonds whose debt value is far below the asset value. Furthermore, the effect decreases with the time to matu-rity for bonds with a high leverage ratio. For bonds with a low leverage ratio, the effect fi rst increases slightly and then remains constant.
Since the asset value, and thus asset volatility, is only updated on an infrequent basis, asset volatility is often replaced by equity volatility. As with asset volatility, an increase in equity volatility increases the probability that the put option will be exercised and therefore credit spreads will increase. Studies that analyse portfolios of bonds often use the volatility of a stock index that is related to the portfolio.
3.3 Other Factors
3.3.1 Liquidity Risk
Option models typically used in the structural approach assume perfect and complete markets where trading takes place continuously. These assumptions imply no differences in liquidity between bonds. However, in practice markets are not perfectly liquid, and liquidity may be an important determinant of credit spreads. Indeed, Collin-Dufresne et al. (2001), Elton et al. (2001), Houweling et al. (2004), and Perraudin and Taylor (2004) fi nd evidence that liquidity signifi cantly infl uences credit
spreads. Investors require a premium for investing in less liquid assets. If liquidity risk were similar for government and corporate bonds, the liquidity premium should be cancelled out when taking the difference between the two yields. However, since government bond markets are larger and more liquid than corporate bond markets, an investor may expect an additional premium for lower liquidity in corporate bond markets. Hence, we expect a positive relationship between liquidity risk and credit spreads. Measures that are often used as proxies for liquidity risk are the bid-ask spread, trading volume, age, and bond issue size.
3.3.2 Taxation Differences
If taxation differences exist between corporate and gov-ernment bonds or corporate bonds and swap contracts, bond yield spreads are likely to refl ect these differences. It is well known that US municipal bonds have had a negative credit spread for the last 50 years, despite their lower liquidity and higher default risk in comparison with government bonds. The reason is that municipal bond interest payments are exempt from US federal income taxes. Even though part of the level of credit spreads might refl ect the tax effect, it is very unlikely that the tax effect has a signifi cant impact on changes in credit spreads given the rigid nature of taxation rates.
4. Detailed Empirical Analysis of Euro Credit Spreads
4.1 Introduction
This study, which is based on a Van Landschoot (2004), analyses the determinants of credit spread changes for different types of Euro corporate bonds between 1998 and 2002. More specifi cally, we investigate the relation-ship between credit spread changes and fi nancial and economic factors for bonds with different maturities and investment grade rating categories. The main question is whether credit spread changes on bonds with differ-ent characteristics (rating and/or maturity) are differently affected by the various determinants of credit spreads. To our knowledge, this is the fi rst paper on credit spreads that tests these differences for a wide range of maturities and rating categories with a data set of individual Euro corporate bonds.
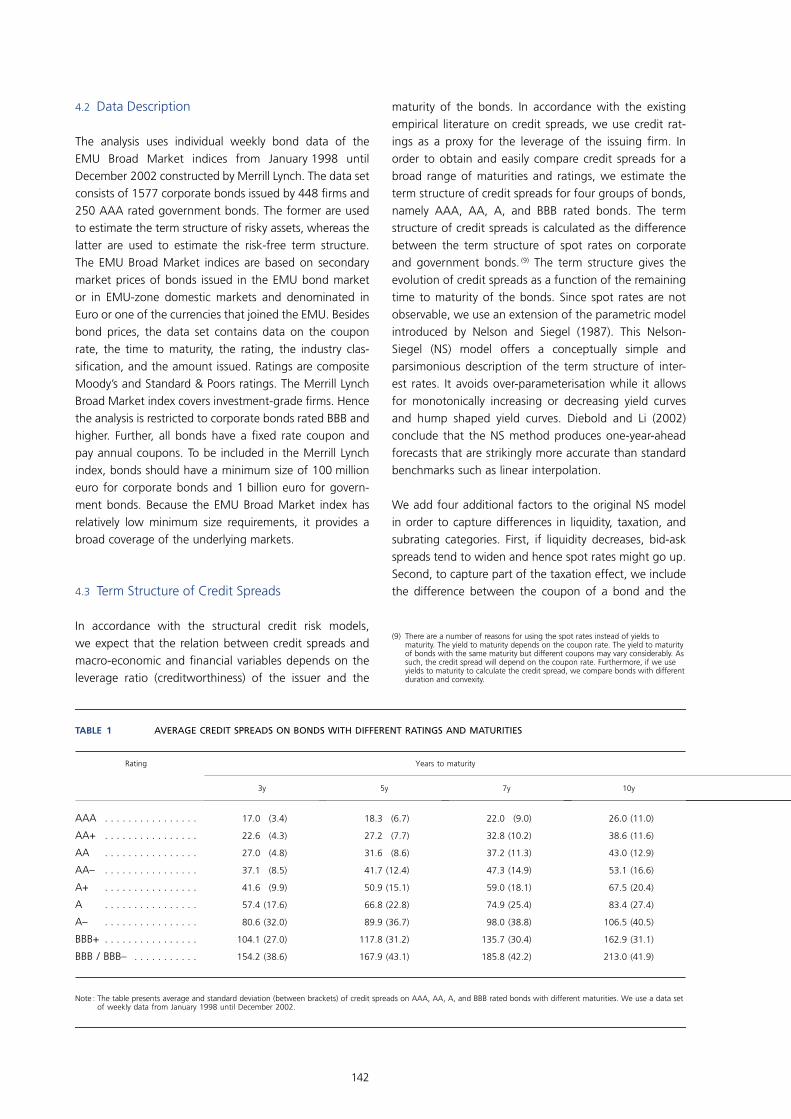
142
4.2 Data Description
The analysis uses individual weekly bond data of the EMU Broad Market indices from January 1998 until December 2002 constructed by Merrill Lynch. The data set consists of 1577 corporate bonds issued by 448 fi rms and 250 AAA rated government bonds. The former are used to estimate the term structure of risky assets, whereas the latter are used to estimate the risk-free term structure. The EMU Broad Market indices are based on secondary market prices of bonds issued in the EMU bond market or in EMU-zone domestic markets and denominated in Euro or one of the currencies that joined the EMU. Besides bond prices, the data set contains data on the coupon rate, the time to maturity, the rating, the industry clas-sifi cation, and the amount issued. Ratings are composite Moody’s and Standard & Poors ratings. The Merrill Lynch Broad Market index covers investment-grade fi rms. Hence the analysis is restricted to corporate bonds rated BBB and higher. Further, all bonds have a fi xed rate coupon and pay annual coupons. To be included in the Merrill Lynch index, bonds should have a minimum size of 100 million euro for corporate bonds and 1 billion euro for govern-ment bonds. Because the EMU Broad Market index has relatively low minimum size requirements, it provides a broad coverage of the underlying markets.
4.3 Term Structure of Credit Spreads
In accordance with the structural credit risk models, we expect that the relation between credit spreads and macro-economic and fi nancial variables depends on the leverage ratio (creditworthiness) of the issuer and the
maturity of the bonds. In accordance with the existing empirical literature on credit spreads, we use credit rat-ings as a proxy for the leverage of the issuing fi rm. In order to obtain and easily compare credit spreads for a broad range of maturities and ratings, we estimate the term structure of credit spreads for four groups of bonds, namely AAA, AA, A, and BBB rated bonds. The term structure of credit spreads is calculated as the difference between the term structure of spot rates on corporate and government bonds. (9) The term structure gives the evolution of credit spreads as a function of the remaining time to maturity of the bonds. Since spot rates are not observable, we use an extension of the parametric model introduced by Nelson and Siegel (1987). This Nelson-Siegel (NS) model offers a conceptually simple and parsimonious description of the term structure of inter-est rates. It avoids over-parameterisation while it allows for monotonically increasing or decreasing yield curves and hump shaped yield curves. Diebold and Li (2002) conclude that the NS method produces one-year-ahead forecasts that are strikingly more accurate than standard benchmarks such as linear interpolation.
We add four additional factors to the original NS model in order to capture differences in liquidity, taxation, and subrating categories. First, if liquidity decreases, bid-ask spreads tend to widen and hence spot rates might go up. Second, to capture part of the taxation effect, we include the difference between the coupon of a bond and the
(9) There are a number of reasons for using the spot rates instead of yields to maturity. The yield to maturity depends on the coupon rate. The yield to maturity of bonds with the same maturity but different coupons may vary considerably. As such, the credit spread will depend on the coupon rate. Furthermore, if we use yields to maturity to calculate the credit spread, we compare bonds with different duration and convexity.
TABLE 1 AVERAGE CREDIT SPREADS ON BONDS WITH DIFFERENT RATINGS AND MATURITIES
Note : The table presents average and standard deviation (between brackets) of credit spreads on AAA, AA, A, and BBB rated bonds with different maturities. We use a data set of weekly data from January 1998 until December 2002.
Rating Years to maturity
3y 5y 7y 10y
AAA . . . . . . . . . . . . . . . . 17.0 (3.4) 18.3 (6.7) 22.0 (9.0) 26.0 (11.0)
AA+ . . . . . . . . . . . . . . . . 22.6 (4.3) 27.2 (7.7) 32.8 (10.2) 38.6 (11.6)
AA . . . . . . . . . . . . . . . . 27.0 (4.8) 31.6 (8.6) 37.2 (11.3) 43.0 (12.9)
AA– . . . . . . . . . . . . . . . . 37.1 (8.5) 41.7 (12.4) 47.3 (14.9) 53.1 (16.6)
A+ . . . . . . . . . . . . . . . . 41.6 (9.9) 50.9 (15.1) 59.0 (18.1) 67.5 (20.4)
A . . . . . . . . . . . . . . . . 57.4 (17.6) 66.8 (22.8) 74.9 (25.4) 83.4 (27.4)
A– . . . . . . . . . . . . . . . . 80.6 (32.0) 89.9 (36.7) 98.0 (38.8) 106.5 (40.5)
BBB+ . . . . . . . . . . . . . . . . 104.1 (27.0) 117.8 (31.2) 135.7 (30.4) 162.9 (31.1)
BBB / BBB– . . . . . . . . . . . 154.2 (38.6) 167.9 (43.1) 185.8 (42.2) 213.0 (41.9)
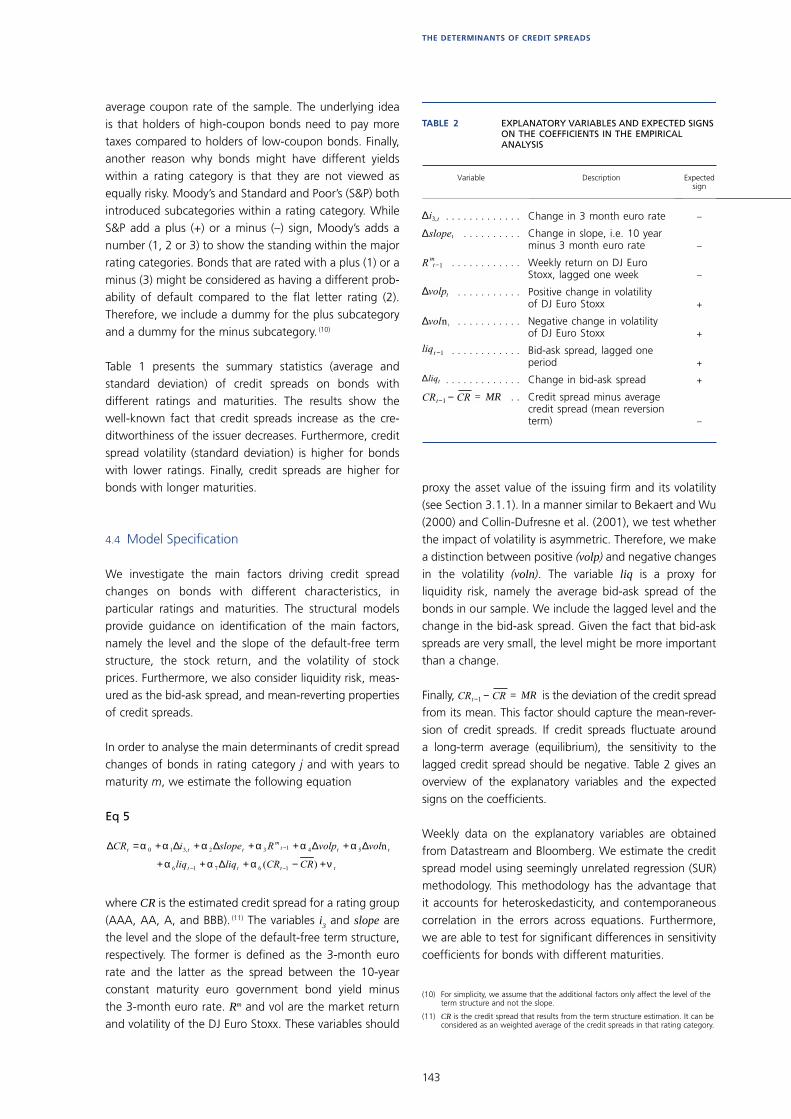
143
THE DETERMINANTS OF CREDIT SPREADS
average coupon rate of the sample. The underlying idea is that holders of high-coupon bonds need to pay more taxes compared to holders of low-coupon bonds. Finally, another reason why bonds might have different yields within a rating category is that they are not viewed as equally risky. Moody’s and Standard and Poor’s (S&P) both introduced subcategories within a rating category. While S&P add a plus (+) or a minus (–) sign, Moody’s adds a number (1, 2 or 3) to show the standing within the major rating categories. Bonds that are rated with a plus (1) or a minus (3) might be considered as having a different prob-ability of default compared to the fl at letter rating (2). Therefore, we include a dummy for the plus subcategory and a dummy for the minus subcategory. (10)
Table 1 presents the summary statistics (average and standard deviation) of credit spreads on bonds with different ratings and maturities. The results show the well-known fact that credit spreads increase as the cre-ditworthiness of the issuer decreases. Furthermore, credit spread volatility (standard deviation) is higher for bonds with lower ratings. Finally, credit spreads are higher for bonds with longer maturities.
4.4 Model Specifi cation
We investigate the main factors driving credit spread changes on bonds with different characteristics, in particular ratings and maturities. The structural models provide guidance on identifi cation of the main factors, namely the level and the slope of the default-free term structure, the stock return, and the volatility of stock prices. Furthermore, we also consider liquidity risk, meas-ured as the bid-ask spread, and mean-reverting properties of credit spreads.
In order to analyse the main determinants of credit spread changes of bonds in rating category j and with years to maturity m, we estimate the following equation
Eq 5
tttt
tttm
ttt
CRCRliqliq
volvolpRslopeiCR
νααα
αααααα
+−+∆++
∆+∆++∆+∆+=∆
−−
−
)(
n
16716
54132,310
where CR is the estimated credit spread for a rating group (AAA, AA, A, and BBB). (11) The variables i
3 and slope are
the level and the slope of the default-free term structure, respectively. The former is defi ned as the 3-month euro rate and the latter as the spread between the 10-year constant maturity euro government bond yield minus the 3-month euro rate. Rm and vol are the market return and volatility of the DJ Euro Stoxx. These variables should
proxy the asset value of the issuing fi rm and its volatility (see Section 3.1.1). In a manner similar to Bekaert and Wu (2000) and Collin-Dufresne et al. (2001), we test whether the impact of volatility is asymmetric. Therefore, we make a distinction between positive (volp) and negative changes in the volatility (voln). The variable liq is a proxy for liquidity risk, namely the average bid-ask spread of the bonds in our sample. We include the lagged level and the change in the bid-ask spread. Given the fact that bid-ask spreads are very small, the level might be more important than a change.
Finally, CRCRt −−1 = MR is the deviation of the credit spread from its mean. This factor should capture the mean-rever-sion of credit spreads. If credit spreads fl uctuate around a long-term average (equilibrium), the sensitivity to the lagged credit spread should be negative. Table 2 gives an overview of the explanatory variables and the expected signs on the coeffi cients.
Weekly data on the explanatory variables are obtained from Datastream and Bloomberg. We estimate the credit spread model using seemingly unrelated regression (SUR) methodology. This methodology has the advantage that it accounts for heteroskedasticity, and contemporaneous correlation in the errors across equations. Furthermore, we are able to test for signifi cant differences in sensitivity coeffi cients for bonds with different maturities.
(10) For simplicity, we assume that the additional factors only affect the level of the term structure and not the slope.
(11) CR is the credit spread that results from the term structure estimation. It can be considered as an weighted average of the credit spreads in that rating category.
TABLE 2 EXPLANATORY VARIABLES AND EXPECTED SIGNS ON THE COEFFICIENTS IN THE EMPIRICAL ANALYSIS
Variable Description Expectedsign
. . . . . . . . . . . . . Change in 3 month euro rate –
. . . . . . . . . . Change in slope, i.e. 10 year minus 3 month euro rate –
. . . . . . . . . . . . Weekly return on DJ Euro Stoxx, lagged one week –
. . . . . . . . . . . Positive change in volatility of DJ Euro Stoxx +
. . . . . . . . . . . Negative change in volatility of DJ Euro Stoxx +
. . . . . . . . . . . . Bid-ask spread, lagged one period +
. . . . . . . . . . . . . Change in bid-ask spread +
. . Credit spread minus average credit spread (mean reversion term) –
ti ,3∆
tslope∆
1−tmR
tvolp∆
tvoln∆
1−tliq
tliq∆
CRCRt −−1 = MR

144
4.5 Empirical Results
Panels A, B, C, and D of Table 3 present the estimation results for bonds with different rating categories (AAA, AA, A, and BBB) and different maturities (3, 5, 7, and 10 years to maturity). The sensitivities of credit spreads on bonds with similar rating, e.g. AA, but different subrating, e.g. AA+, AA, and AA–, are very similar. Therefore, we focus on different ratings and not subratings. We perform Wald tests to analyse whether bonds with different matu-rities and/or ratings react in signifi cantly different ways to changes in fi nancial and macro-economic variables.(12)
The results show that changes in the level and the slope of the default-free term structure are two important deter-minants of credit spread changes. Consistent with the fi ndings of Longstaff and Schwartz (1995), Duffee (1998), and Collin-Dufresne (2001) for the US and for Boss and Scheicher (2002) and Leake (2003) for Europe, we fi nd a negative relation between changes in the level and the slope of the default-free term structure and credit spread changes. For AAA and AA bonds, the null hypothesis that the sensitivities in credit spread changes are similar for different maturities is rejected for both the level and the slope. The effects fi rst increase with the time to maturity and then decrease. However, for A and BBB rated bonds the effects do not signifi cantly depend on the maturity. Furthermore, the level effect is stronger for bonds with a lower rating or high leverage ratios. This is in accordance with the implications of structural credit risk models (see Section 3.1.1). However, the slope effect is very similar for AAA, AA, and A rated bonds. For BBB rated bonds, the slope effect is substantially larger. If we compare the level effect on credit spreads of, e.g., AAA and BBB rated bonds with 7 years to maturity, we fi nd that a 100 basis point increase in the 3-month risk-free rate causes a 5.6 basis point decrease in the AAA credit spread and a 32.4 basis point decrease in the BBB credit spread.
The return and the implied volatility of DJ Euro Stoxx sig-nifi cantly infl uence credit spread changes. According to the structural credit risk models, the effects of the return and volatility should be larger for bonds with a higher leverage. The results indeed indicate that the sensitivity coeffi cients are higher for BBB rated bonds compared to AAA rated bonds. A 100 basis point increase of the weekly market return reduces the credit spread on AAA and BBB rated bonds with 7 years to maturity by 0.08 and 0.7 basis points respectively. The return effect is relatively weak compared to the effect of the level and the slope of the default-free term structure. For AA, A, and BBB
rated bonds, we fi nd that positive changes in the volatility signifi cantly infl uence credit spread changes whereas negative changes do not. This is in accordance with the hypothesis that the effect of the volatility is asymmetric. For AAA, the results are less clear. Furthermore, Wald tests show that the effect of the return and the volatility do not depend on the maturity of the bonds. This can not be explained by the theoretical models that predict a stronger effect for bonds with a shorter maturity.
For AAA, AA, and A rated bonds, we fi nd that the bid-ask spread signifi cantly infl uences credit spread changes. However, changes in the bid-ask spread do not have a signifi cant infl uence. This shows that the credit spread changes are more affected by the bid-ask spread itself than a change in the bid-ask spread. For BBB rated bonds, the level as well as the changes in the bid-ask spread sig-nifi cantly affect credit spread changes. In general, the effect of the bid-ask spread becomes stronger for bonds with a lower rating. An increase of 100 basis points in the bid-ask spread increases the credit spread on AAA (BBB) rated corporate bonds with 7 years to maturity by 23 (164) basis points. For AAA and AA rated bonds, the effect of the bid-ask spread becomes stronger for bonds with longer maturities. For higher rating categories, liquidity changes do not signifi cantly affect credit spread changes. This might be due to the fact that these bonds are more liquid than BBB rated bonds and are not imme-diately affected by a change.
Finally, our results indicate that credit spreads are mean reverting. This means that if credit spreads are high, the changes are smaller or even negative such that the credit spread converges to its long-run average.
The factors suggested by the structural credit risk models explain between 10 p.c. and 39 p.c. of the evolution of credit spread changes, depending on the rating category and the maturity of the bond. The economic and fi nancial variables included in our model (see Equation 5) have the highest explanatory power for BBB rated bonds. Furthermore, our model explains most of the variation of credit spreads on bonds with medium maturities. The adjusted R2 is on average 19 p.c. for bonds with 3 and 10 years to maturity and 24 p.c. for bonds with 5 and 7 years to maturity. Our results indicate that bonds with different ratings and maturities behave differently.
(12) The results of the Wald test and a more detailed discussion of the results can be found in Van Landschoot (2004).
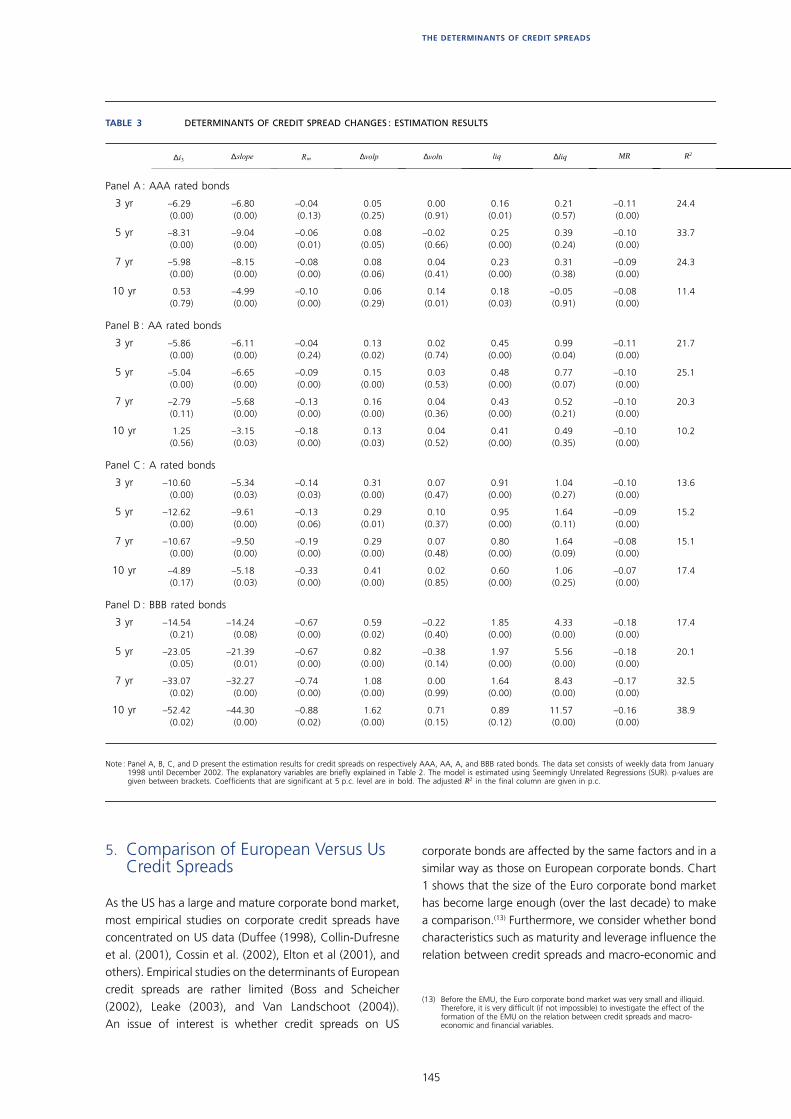
145
THE DETERMINANTS OF CREDIT SPREADS
TABLE 3 DETERMINANTS OF CREDIT SPREAD CHANGES : ESTIMATION RESULTS
Note : Panel A, B, C, and D present the estimation results for credit spreads on respectively AAA, AA, A, and BBB rated bonds. The data set consists of weekly data from January 1998 until December 2002. The explanatory variables are briefly explained in Table 2. The model is estimated using Seemingly Unrelated Regressions (SUR). p-values are given between brackets. Coefficients that are significant at 5 p.c. level are in bold. The adjusted in the final column are given in p.c.
Panel A : AAA rated bonds
3 yr –6.29 –6.80 –0.04 0.05 0.00 0.16 0.21 –0.11 24.4(0.00) (0.00) (0.13) (0.25) (0.91) (0.01) (0.57) (0.00)
5 yr –8.31 –9.04 –0.06 0.08 –0.02 0.25 0.39 –0.10 33.7(0.00) (0.00) (0.01) (0.05) (0.66) (0.00) (0.24) (0.00)
7 yr –5.98 –8.15 –0.08 0.08 0.04 0.23 0.31 –0.09 24.3(0.00) (0.00) (0.00) (0.06) (0.41) (0.00) (0.38) (0.00)
10 yr 0.53 –4.99 –0.10 0.06 0.14 0.18 –0.05 –0.08 11.4(0.79) (0.00) (0.00) (0.29) (0.01) (0.03) (0.91) (0.00)
Panel B : AA rated bonds
3 yr –5.86 –6.11 –0.04 0.13 0.02 0.45 0.99 –0.11 21.7(0.00) (0.00) (0.24) (0.02) (0.74) (0.00) (0.04) (0.00)
5 yr –5.04 –6.65 –0.09 0.15 0.03 0.48 0.77 –0.10 25.1(0.00) (0.00) (0.00) (0.00) (0.53) (0.00) (0.07) (0.00)
7 yr –2.79 –5.68 –0.13 0.16 0.04 0.43 0.52 –0.10 20.3(0.11) (0.00) (0.00) (0.00) (0.36) (0.00) (0.21) (0.00)
10 yr 1.25 –3.15 –0.18 0.13 0.04 0.41 0.49 –0.10 10.2(0.56) (0.03) (0.00) (0.03) (0.52) (0.00) (0.35) (0.00)
Panel C : A rated bonds
3 yr –10.60 –5.34 –0.14 0.31 0.07 0.91 1.04 –0.10 13.6(0.00) (0.03) (0.03) (0.00) (0.47) (0.00) (0.27) (0.00)
5 yr –12.62 –9.61 –0.13 0.29 0.10 0.95 1.64 –0.09 15.2(0.00) (0.00) (0.06) (0.01) (0.37) (0.00) (0.11) (0.00)
7 yr –10.67 –9.50 –0.19 0.29 0.07 0.80 1.64 –0.08 15.1(0.00) (0.00) (0.00) (0.00) (0.48) (0.00) (0.09) (0.00)
10 yr –4.89 –5.18 –0.33 0.41 0.02 0.60 1.06 –0.07 17.4(0.17) (0.03) (0.00) (0.00) (0.85) (0.00) (0.25) (0.00)
Panel D : BBB rated bonds
3 yr –14.54 –14.24 –0.67 0.59 –0.22 1.85 4.33 –0.18 17.4(0.21) (0.08) (0.00) (0.02) (0.40) (0.00) (0.00) (0.00)
5 yr –23.05 –21.39 –0.67 0.82 –0.38 1.97 5.56 –0.18 20.1(0.05) (0.01) (0.00) (0.00) (0.14) (0.00) (0.00) (0.00)
7 yr –33.07 –32.27 –0.74 1.08 0.00 1.64 8.43 –0.17 32.5(0.02) (0.00) (0.00) (0.00) (0.99) (0.00) (0.00) (0.00)
10 yr –52.42 –44.30 –0.88 1.62 0.71 0.89 11.57 –0.16 38.9(0.02) (0.00) (0.02) (0.00) (0.15) (0.12) (0.00) (0.00)
3i∆ slope∆ mR ∆volp ∆voln liq ∆liq MR R2
R2
5. Comparison of European Versus Us Credit Spreads
As the US has a large and mature corporate bond market, most empirical studies on corporate credit spreads have concentrated on US data (Duffee (1998), Collin-Dufresne et al. (2001), Cossin et al. (2002), Elton et al (2001), and others). Empirical studies on the determinants of European credit spreads are rather limited (Boss and Scheicher (2002), Leake (2003), and Van Landschoot (2004)). An issue of interest is whether credit spreads on US
corporate bonds are affected by the same factors and in a similar way as those on European corporate bonds. Chart 1 shows that the size of the Euro corporate bond market has become large enough (over the last decade) to make a comparison.(13) Furthermore, we consider whether bond characteristics such as maturity and leverage infl uence the relation between credit spreads and macro-economic and
(13) Before the EMU, the Euro corporate bond market was very small and illiquid. Therefore, it is very diffi cult (if not impossible) to investigate the effect of the formation of the EMU on the relation between credit spreads and macro-economic and fi nancial variables.
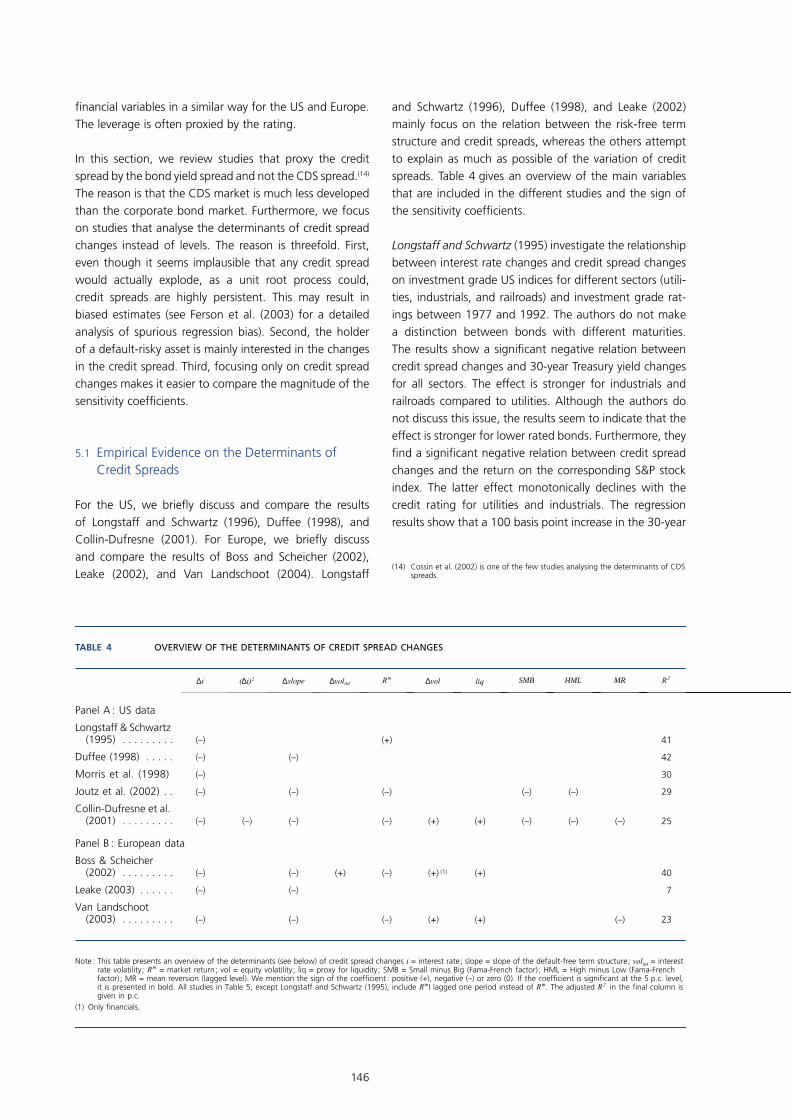
146
fi nancial variables in a similar way for the US and Europe. The leverage is often proxied by the rating.
In this section, we review studies that proxy the credit spread by the bond yield spread and not the CDS spread.(14)
The reason is that the CDS market is much less developed than the corporate bond market. Furthermore, we focus on studies that analyse the determinants of credit spread changes instead of levels. The reason is threefold. First, even though it seems implausible that any credit spread would actually explode, as a unit root process could, credit spreads are highly persistent. This may result in biased estimates (see Ferson et al. (2003) for a detailed analysis of spurious regression bias). Second, the holder of a default-risky asset is mainly interested in the changes in the credit spread. Third, focusing only on credit spread changes makes it easier to compare the magnitude of the sensitivity coeffi cients.
5.1 Empirical Evidence on the Determinants of Credit Spreads
For the US, we briefl y discuss and compare the results of Longstaff and Schwartz (1996), Duffee (1998), and Collin-Dufresne (2001). For Europe, we briefl y discuss and compare the results of Boss and Scheicher (2002), Leake (2002), and Van Landschoot (2004). Longstaff
and Schwartz (1996), Duffee (1998), and Leake (2002) mainly focus on the relation between the risk-free term structure and credit spreads, whereas the others attempt to explain as much as possible of the variation of credit spreads. Table 4 gives an overview of the main variables that are included in the different studies and the sign of the sensitivity coeffi cients.
Longstaff and Schwartz (1995) investigate the relationship between interest rate changes and credit spread changes on investment grade US indices for different sectors (utili-ties, industrials, and railroads) and investment grade rat-ings between 1977 and 1992. The authors do not make a distinction between bonds with different maturities. The results show a signifi cant negative relation between credit spread changes and 30-year Treasury yield changes for all sectors. The effect is stronger for industrials and railroads compared to utilities. Although the authors do not discuss this issue, the results seem to indicate that the effect is stronger for lower rated bonds. Furthermore, they fi nd a signifi cant negative relation between credit spread changes and the return on the corresponding S&P stock index. The latter effect monotonically declines with the credit rating for utilities and industrials. The regression results show that a 100 basis point increase in the 30-year
(14) Cossin et al. (2002) is one of the few studies analysing the determinants of CDS spreads.
TABLE 4 OVERVIEW OF THE DETERMINANTS OF CREDIT SPREAD CHANGES
Note : This table presents an overview of the determinants (see below) of credit spread changes i = interest rate; slope = slope of the default-free term structure; volint = interest rate volatility; = market return; vol = equity volatility; liq = proxy for liquidity; SMB = Small minus Big (Fama-French factor); HML = High minus Low (Fama-French factor); MR = mean reversion (lagged level). We mention the sign of the coefficient : positive (+), negative (–) or zero (0). If the coefficient is significant at the 5 p.c. level, it is presented in bold. All studies in Table 5, except Longstaff and Schwartz (1995), include I lagged one period instead of . The adjusted in the final column is given in p.c.
(1) Only financials.
Panel A : US data
Longstaff & Schwartz (1995) . . . . . . . . . (–) (+) 41
Duffee (1998) . . . . . (–) (–) 42
Morris et al. (1998) (–) 30
Joutz et al. (2002) . . (–) (–) (–) (–) (–) 29
Collin-Dufresne et al. (2001) . . . . . . . . . (–) (–) (–) (–) (+) (+) (–) (–) (–) 25
Panel B : European data
Boss & Scheicher (2002) . . . . . . . . . (–) (–) (+) (–) (+) (1) (+) 40
Leake (2003) . . . . . . (–) (–) 7
Van Landschoot (2003) . . . . . . . . . (–) (–) (–) (+) (+) (–) 23
i∆ (∆i)2 slope∆ ∆volintmR ∆vol liq SMB HML MR 2R
mR
mR mR 2R
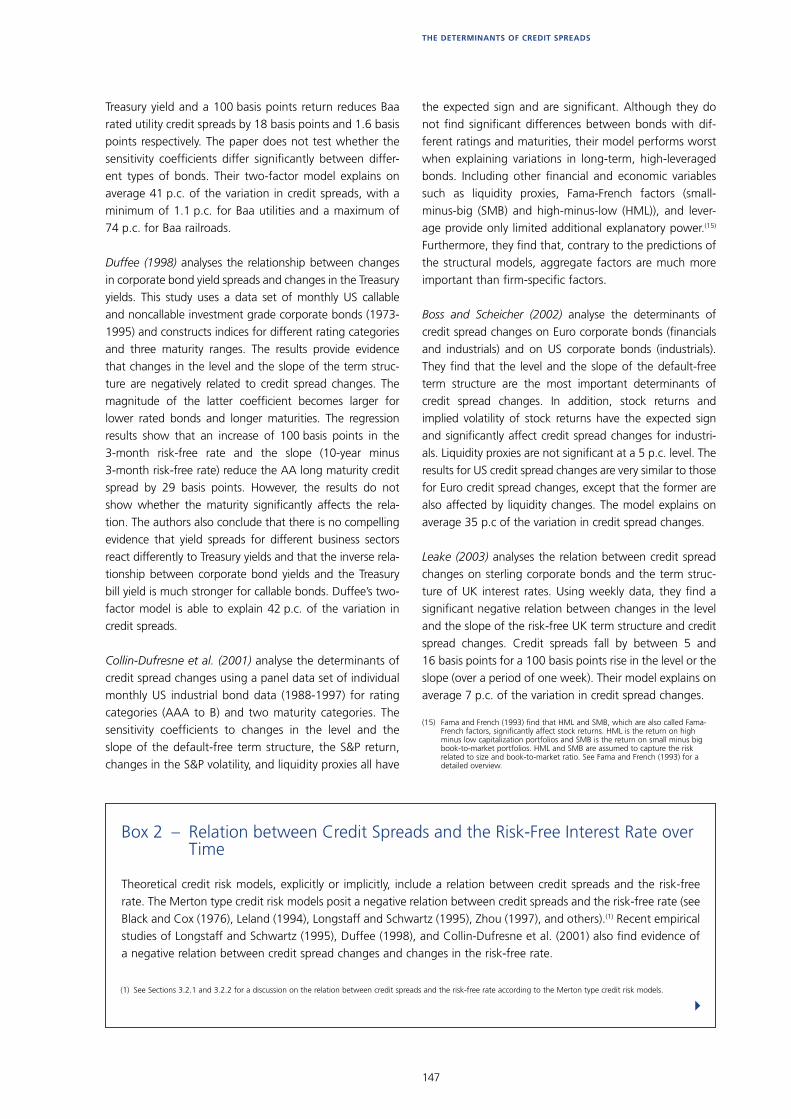
147
THE DETERMINANTS OF CREDIT SPREADS
Treasury yield and a 100 basis points return reduces Baa rated utility credit spreads by 18 basis points and 1.6 basis points respectively. The paper does not test whether the sensitivity coeffi cients differ signifi cantly between differ-ent types of bonds. Their two-factor model explains on average 41 p.c. of the variation in credit spreads, with a minimum of 1.1 p.c. for Baa utilities and a maximum of 74 p.c. for Baa railroads.
Duffee (1998) analyses the relationship between changes in corporate bond yield spreads and changes in the Treasury yields. This study uses a data set of monthly US callable and noncallable investment grade corporate bonds (1973-1995) and constructs indices for different rating categories and three maturity ranges. The results provide evidence that changes in the level and the slope of the term struc-ture are negatively related to credit spread changes. The magnitude of the latter coeffi cient becomes larger for lower rated bonds and longer maturities. The regression results show that an increase of 100 basis points in the 3-month risk-free rate and the slope (10-year minus 3-month risk-free rate) reduce the AA long maturity credit spread by 29 basis points. However, the results do not show whether the maturity signifi cantly affects the rela-tion. The authors also conclude that there is no compelling evidence that yield spreads for different business sectors react differently to Treasury yields and that the inverse rela-tionship between corporate bond yields and the Treasury bill yield is much stronger for callable bonds. Duffee’s two-factor model is able to explain 42 p.c. of the variation in credit spreads.
Collin-Dufresne et al. (2001) analyse the determinants of credit spread changes using a panel data set of individual monthly US industrial bond data (1988-1997) for rating categories (AAA to B) and two maturity categories. The sensitivity coeffi cients to changes in the level and the slope of the default-free term structure, the S&P return, changes in the S&P volatility, and liquidity proxies all have
the expected sign and are signifi cant. Although they do not fi nd signifi cant differences between bonds with dif-ferent ratings and maturities, their model performs worst when explaining variations in long-term, high-leveraged bonds. Including other fi nancial and economic variables such as liquidity proxies, Fama-French factors (small-minus-big (SMB) and high-minus-low (HML)), and lever-age provide only limited additional explanatory power.(15) Furthermore, they fi nd that, contrary to the predictions of the structural models, aggregate factors are much more important than fi rm-specifi c factors.
Boss and Scheicher (2002) analyse the determinants of credit spread changes on Euro corporate bonds (fi nancials and industrials) and on US corporate bonds (industrials). They fi nd that the level and the slope of the default-free term structure are the most important determinants of credit spread changes. In addition, stock returns and implied volatility of stock returns have the expected sign and signifi cantly affect credit spread changes for industri-als. Liquidity proxies are not signifi cant at a 5 p.c. level. The results for US credit spread changes are very similar to those for Euro credit spread changes, except that the former are also affected by liquidity changes. The model explains on average 35 p.c of the variation in credit spread changes.
Leake (2003) analyses the relation between credit spread changes on sterling corporate bonds and the term struc-ture of UK interest rates. Using weekly data, they fi nd a signifi cant negative relation between changes in the level and the slope of the risk-free UK term structure and credit spread changes. Credit spreads fall by between 5 and 16 basis points for a 100 basis points rise in the level or the slope (over a period of one week). Their model explains on average 7 p.c. of the variation in credit spread changes.
Box 2 – Relation between Credit Spreads and the Risk-Free Interest Rate over Time
Theoretical credit risk models, explicitly or implicitly, include a relation between credit spreads and the risk-free rate. The Merton type credit risk models posit a negative relation between credit spreads and the risk-free rate (see Black and Cox (1976), Leland (1994), Longstaff and Schwartz (1995), Zhou (1997), and others).(1) Recent empirical studies of Longstaff and Schwartz (1995), Duffee (1998), and Collin-Dufresne et al. (2001) also fi nd evidence of a negative relation between credit spread changes and changes in the risk-free rate.
(15) Fama and French (1993) fi nd that HML and SMB, which are also called Fama-French factors, signifi cantly affect stock returns. HML is the return on high minus low capitalization portfolios and SMB is the return on small minus big book-to-market portfolios. HML and SMB are assumed to capture the risk related to size and book-to-market ratio. See Fama and French (1993) for a detailed overview.
!(1) See Sections 3.2.1 and 3.2.2 for a discussion on the relation between credit spreads and the risk-free rate according to the Merton type credit risk models.
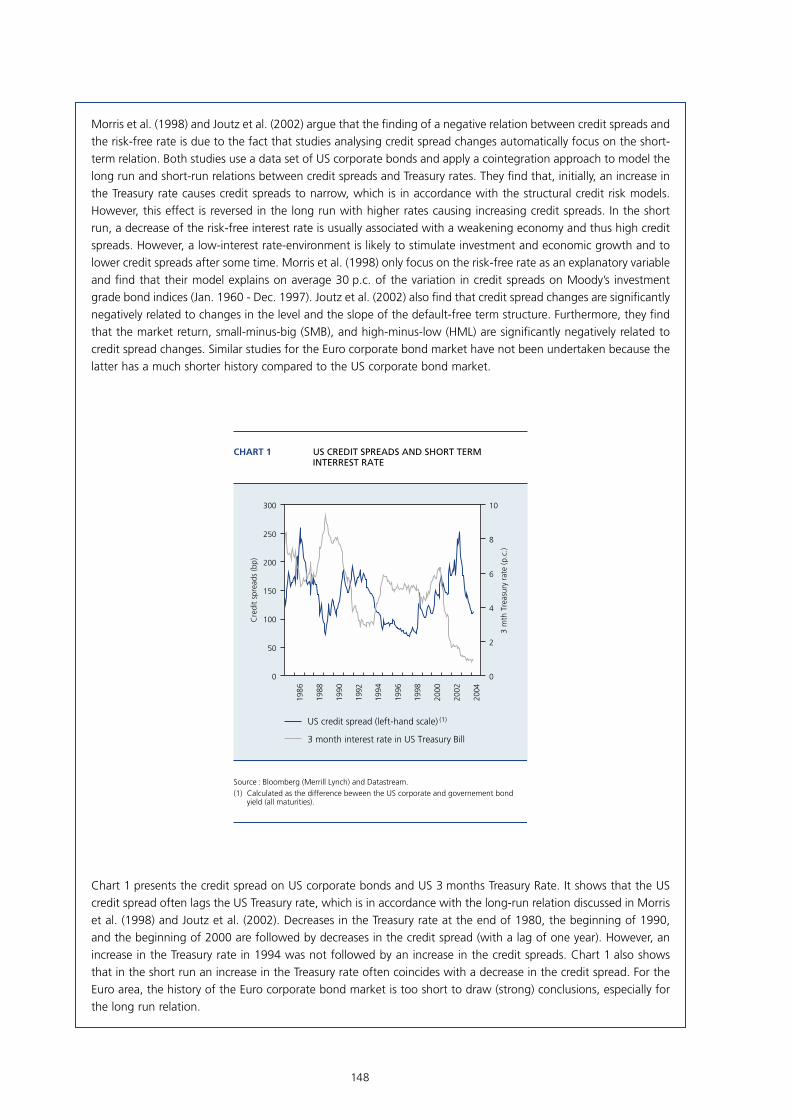
148
Morris et al. (1998) and Joutz et al. (2002) argue that the fi nding of a negative relation between credit spreads and the risk-free rate is due to the fact that studies analysing credit spread changes automatically focus on the short-term relation. Both studies use a data set of US corporate bonds and apply a cointegration approach to model the long run and short-run relations between credit spreads and Treasury rates. They fi nd that, initially, an increase in the Treasury rate causes credit spreads to narrow, which is in accordance with the structural credit risk models. However, this effect is reversed in the long run with higher rates causing increasing credit spreads. In the short run, a decrease of the risk-free interest rate is usually associated with a weakening economy and thus high credit spreads. However, a low-interest rate-environment is likely to stimulate investment and economic growth and to lower credit spreads after some time. Morris et al. (1998) only focus on the risk-free rate as an explanatory variable and fi nd that their model explains on average 30 p.c. of the variation in credit spreads on Moody’s investment grade bond indices (Jan. 1960 - Dec. 1997). Joutz et al. (2002) also fi nd that credit spread changes are signifi cantly negatively related to changes in the level and the slope of the default-free term structure. Furthermore, they fi nd that the market return, small-minus-big (SMB), and high-minus-low (HML) are signifi cantly negatively related to credit spread changes. Similar studies for the Euro corporate bond market have not been undertaken because the latter has a much shorter history compared to the US corporate bond market.
Chart 1 presents the credit spread on US corporate bonds and US 3 months Treasury Rate. It shows that the US credit spread often lags the US Treasury rate, which is in accordance with the long-run relation discussed in Morris et al. (1998) and Joutz et al. (2002). Decreases in the Treasury rate at the end of 1980, the beginning of 1990, and the beginning of 2000 are followed by decreases in the credit spread (with a lag of one year). However, an increase in the Treasury rate in 1994 was not followed by an increase in the credit spreads. Chart 1 also shows that in the short run an increase in the Treasury rate often coincides with a decrease in the credit spread. For the Euro area, the history of the Euro corporate bond market is too short to draw (strong) conclusions, especially for the long run relation.
198
6
1988
1990
1992
1994
1996
1998
2000
2002
2004
0
50
100
150
200
250
300
0
2
4
6
8
10
CHART 1 US CREDIT SPREADS AND SHORT TERM INTERREST RATE
Source : Bloomberg (Merrill Lynch) and Datastream.(1) Calculated as the difference beween the US corporate and governement bond
yield (all maturities).
US credit spread (left-hand scale) (1)
3 month interest rate in US Treasury Bill
Cre
dit
spre
ads
(bp)
3 m
th T
reas
ury
rate
(p.c
.)
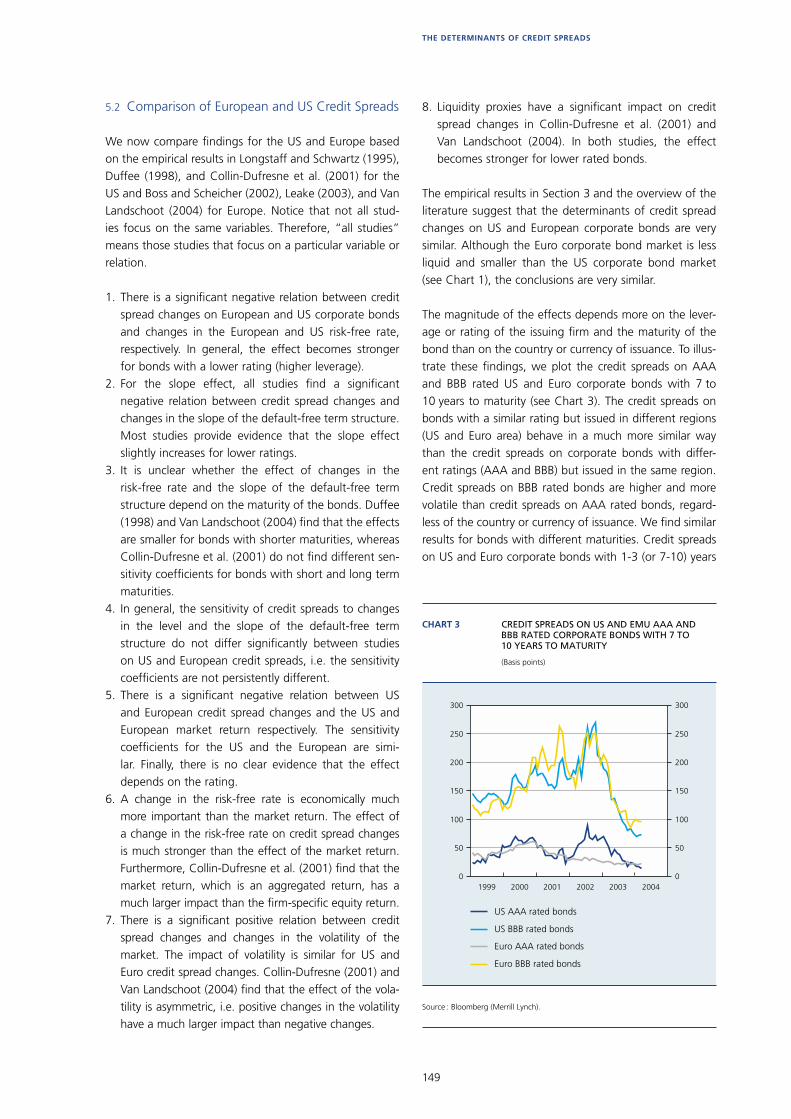
149
THE DETERMINANTS OF CREDIT SPREADS
5.2 Comparison of European and US Credit Spreads
We now compare fi ndings for the US and Europe based on the empirical results in Longstaff and Schwartz (1995), Duffee (1998), and Collin-Dufresne et al. (2001) for the US and Boss and Scheicher (2002), Leake (2003), and Van Landschoot (2004) for Europe. Notice that not all stud-ies focus on the same variables. Therefore, “all studies” means those studies that focus on a particular variable or relation.
1. There is a signifi cant negative relation between credit spread changes on European and US corporate bonds and changes in the European and US risk-free rate, respectively. In general, the effect becomes stronger for bonds with a lower rating (higher leverage).
2. For the slope effect, all studies fi nd a signifi cant negative relation between credit spread changes and changes in the slope of the default-free term structure. Most studies provide evidence that the slope effect slightly increases for lower ratings.
3. It is unclear whether the effect of changes in the risk-free rate and the slope of the default-free term structure depend on the maturity of the bonds. Duffee (1998) and Van Landschoot (2004) fi nd that the effects are smaller for bonds with shorter maturities, whereas Collin-Dufresne et al. (2001) do not fi nd different sen-sitivity coeffi cients for bonds with short and long term maturities.
4. In general, the sensitivity of credit spreads to changes in the level and the slope of the default-free term structure do not differ signifi cantly between studies on US and European credit spreads, i.e. the sensitivity coeffi cients are not persistently different.
5. There is a signifi cant negative relation between US and European credit spread changes and the US and European market return respectively. The sensitivity coeffi cients for the US and the European are simi-lar. Finally, there is no clear evidence that the effect depends on the rating.
6. A change in the risk-free rate is economically much more important than the market return. The effect of a change in the risk-free rate on credit spread changes is much stronger than the effect of the market return. Furthermore, Collin-Dufresne et al. (2001) fi nd that the market return, which is an aggregated return, has a much larger impact than the fi rm-specifi c equity return.
7. There is a signifi cant positive relation between credit spread changes and changes in the volatility of the market. The impact of volatility is similar for US and Euro credit spread changes. Collin-Dufresne (2001) and Van Landschoot (2004) fi nd that the effect of the vola-tility is asymmetric, i.e. positive changes in the volatility have a much larger impact than negative changes.
8. Liquidity proxies have a signifi cant impact on credit spread changes in Collin-Dufresne et al. (2001) and Van Landschoot (2004). In both studies, the effect becomes stronger for lower rated bonds.
The empirical results in Section 3 and the overview of the literature suggest that the determinants of credit spread changes on US and European corporate bonds are very similar. Although the Euro corporate bond market is less liquid and smaller than the US corporate bond market (see Chart 1), the conclusions are very similar.
The magnitude of the effects depends more on the lever-age or rating of the issuing fi rm and the maturity of the bond than on the country or currency of issuance. To illus-trate these fi ndings, we plot the credit spreads on AAA and BBB rated US and Euro corporate bonds with 7 to 10 years to maturity (see Chart 3). The credit spreads on bonds with a similar rating but issued in different regions (US and Euro area) behave in a much more similar way than the credit spreads on corporate bonds with differ-ent ratings (AAA and BBB) but issued in the same region. Credit spreads on BBB rated bonds are higher and more volatile than credit spreads on AAA rated bonds, regard-less of the country or currency of issuance. We fi nd similar results for bonds with different maturities. Credit spreads on US and Euro corporate bonds with 1-3 (or 7-10) years
0
50
100
150
200
250
300
1999 2000 2001 2002 2003 20040
50
100
150
200
250
300
CHART 3 CREDIT SPREADS ON US AND EMU AAA AND BBB RATED CORPORATE BONDS WITH 7 TO 10 YEARS TO MATURITY
(Basis points)
Source : Bloomberg (Merrill Lynch).
US AAA rated bonds
US BBB rated bonds
Euro AAA rated bonds
Euro BBB rated bonds

150
to maturity behave much more similarly than do credit spreads on Euro (US) corporate bonds with 1-3 and 7-10 years to maturity.
The creation of a Euro corporate bond market has improved (reduced) the diversifi cation (concentration) of credit risk (by defi nition) because investors have the opportunity to invest in more regions. However, one should not exagger-ate this effect. Credit spreads and thus market prices of US and Euro corporate bonds behave in very similar ways. Although we do not perform a detailed analysis of credit risk diversifi cation, Chart 3 seems to indicate that investors should diversify their portfolio by investing in bonds with different ratings and/or maturities.
Empirical studies for both regions are unable to explain more than 45 p.c. of the variation of credit spread changes. This suggests that we still have limited knowl-edge about the determinants of credit spread changes. Interestingly, it does not appear as if the residual com-ponent of the credit spread changes, i.e. the component that remains unexplained by credit risk models, can be considered as idiosyncratic risk. Along these lines, Collin-Dufresne et al. (2001) perform a factor analysis and fi nd that the residual component is mainly driven by one sys-tematic component. We expect that a similar result would be obtained if such an exercise were to be undertaken for Europe.
6. Additional Factors to Explain Credit Spreads
6.1 Components of Credit Spreads
As suggested above, a question that is still unresolved in the literature is why a large part of the dynam-ics of credit spreads remains unexplained. In order to address this question, several studies (Elton et al. (2001), Delianedis and Geske (2002), Driessen (2003), D’Amato and Remolona (2003), and Perraudin and Taylor (2004)) attempt to decompose the credit spread into several fac-tors such as expected loss, tax effect, liquidity risk, and a risk premium. The risk premium is often defi ned as an additional premium for risk-averse investors. (16)
Elton et al. (2001) decompose the credit spread into three components, namely expected loss, tax effect, and a risk premium. They fi nd that the taxation difference between corporate and government bonds have a larger impact on credit spreads than expected loss. Furthermore, they conclude that the part of credit spreads that is not accounted for by taxes and expected default (85 p.c.),
can be explained as a reward for bearing systematic risk. Driessen (2003) decompose the credit spread into four components, namely expected loss, tax effect, liquidity, and a risk premium. The author describes the risk premium as a premium for the risk associated with changes in credit spreads (if no default occurs) and the risk of the default event. The latter is associated with the jump in prices in case of a default event (default jump risk). (17) The empirical results seem to imply that the default jump risk is not fully diversifi able. Expected loss explains only between 3.5 to 34.7 percent of the credit spreads. Furthermore, the importance of taxes, the risk premium, and the liquidity premium depend on the rating and maturity of the bond. Perraudin and Taylor (2004) fi nd that liquidity signifi cantly infl uences credit spreads. Making a distinction between low and high liquid bonds according to various liquidity proxies results in spread differences of 10 to 28 basis points for AAA to A grade bonds.
D’Amato and Remolona (2003) argue that credit spreads are largely a compensation for the diffi culty of diversify-ing credit risk (diversifi cation risk). They argue that the assumption that investors can diversify away unexpected losses (which are any losses different from the mean) of default risk by holding a large enough portfolio does not hold in practice. The nature of default risk is such that the distribution of returns on corporate bonds is highly nega-tively skewed, i.e. the distribution has a long left tail.
As an illustration of skewness, consider the following example. Suppose that we have a portfolio of assets with an average return of 5 p.c. and a standard deviation of 2 p.c. If the distribution of the portfolio returns is strongly negatively skewed, investors have a higher probability of earning returns that are far below the average return of 5 p.c. (extreme losses) than earning returns much above 5 p.c. Investors want to be compensated for this risk unless it can be diversifi ed away. D’Amato and Remolona (2003) conclude that skewness in returns is a critical factor that stands in the way of diversifi cation.
Another factor that may also explain the poor results of previous empirical analyses of credit spreads is recovery risk. The expected loss on a bond depends on the prob-ability of default and the loss given default (or recovery rate). It is very likely that bonds with a high recovery rate will have lower credit spreads. However, individual data on recovery rates are not readily available. Therefore, most empirical studies assume a constant recovery rate, which is similar across assets.
(16) Note that there is no unique defi nition of “the risk premium”. Different studies often have different defi nitions.
(17) Elton et al. (2001) only consider the risk associated with changes in credit spreads.

151
THE DETERMINANTS OF CREDIT SPREADS
6.1 Distribution of Stock and Bond Portfolios
Empirical studies show that credit risk loss distributions have thick tails, i.e. are skewed. However, the prominence of these properties seems to depend on the composition of the specifi c portfolio under consideration (see Lucas et al. 2001). D’Amato and Remolona (2003) argue that the distributions of bond and stock portfolios are signifi cantly different ; bond returns are much more negatively skewed to the left. D’Amato and Remolona (2003) illustrate the diffi culty of diversifying credit risk by presenting the loss distribution of two hypothetical bond portfolios.
Similar to D’Amato and Remolona (2003), we perform simulations to obtain the loss distributions of hypothetical portfolios. However, we simulate the loss distributions of bond and stock portfolios in a Merton framework. The aim is to analyse how the loss distribution depends on the composition of the portfolios, the size of the port-folios, the assumptions about the leverage of the fi rms, the correlation of the assets in the portfolios, and the risk-free rate.
6.1.1 Simulation Exercise : Assumptions
Suppose that we have three portfolios, one of 100 p.c. bonds (bond portfolio), one of 100 p.c. stocks (stock portfolio), one of 50 p.c. bonds and 50 p.c. stocks (mixed portfolio). To analyse whether the size of the portfolio infl uences the results, we consider portfolios with 50, 100, and 300 assets. We assume that each fi rm’s asset value equals 100 at the start (t = 0). In order to evaluate the value of the portfolio after one period, say one year (t = 1), we need to make assumptions on how the asset
value of the fi rms evolve. We assume that the average growth rate of the asset value equals 5 p.c., the asset volatility equals 3 p.c., and that the value can make jumps (see jump-diffusion process, i.e. a process that allows for sudden jumps in the asset value).(18) At time t = 1, we need to evaluate whether a fi rm has defaulted or not. In accord-ance with the Merton model, we assume that a fi rm has defaulted when the value of the assets falls below the value of the debt. We assume that a fi rm’s balance sheet consists of 50 p.c. debt at time t = 1. This implies that a fi rm defaults if its asset value is smaller than 50 after one year. If default occurs, bondholders will recover the ‘residual’ asset value. So, the recovery rate is not fi xed but depends on the asset value in the case of default. Stockholders lose everything in the case of default. We allow for a correlation of 0.1 between the asset value of the fi rms issuing bonds and/or stocks. The risk-free inter-est rate equals 4 p.c.
6.1.2 Simulation Exercise : Results
Table 5 shows the summary statistics of the simulated loss distribution of 9 portfolios : 3 stock portfolios (50, 100, and 300 stocks), 3 bond portfolios (50, 100, and 300 bonds), and 3 mixed portfolios (50, 100, and 300 assets). If we compare the loss distribution of the 100 p.c. bond portfolios and the 100 p.c. stock portfolios, we fi nd that the average loss and the standard deviation of the stock portfolios are much larger compared to the bond portfolios. This is in accordance with our expectations,
TABLE 5 SUMMARY STATISTICS OF SIMULATED LOSS DISTRIBUTION
(Mean and standard deviation are given in percentages)
Source : Own calculations based on 10,000 simulations.
Mean Standard deviation Skewness Kurtosis
50 stocks . . . . . . . . . . . . . . . . . . . . . . . . . . . . . . . . . . . . . . . . . . 2.34 2.26 1.04 4.19
50 bonds . . . . . . . . . . . . . . . . . . . . . . . . . . . . . . . . . . . . . . . . . 0.37 0.46 1.69 6.69
25 stocks & 25 bonds . . . . . . . . . . . . . . . . . . . . . . . . . . . . . . . . 1.35 1.32 1.07 4.29
100 stocks . . . . . . . . . . . . . . . . . . . . . . . . . . . . . . . . . . . . . . . . . 2.33 1.72 0.95 4.26
100 bonds . . . . . . . . . . . . . . . . . . . . . . . . . . . . . . . . . . . . . . . . 0.37 0.35 1.37 5.64
50 stocks & 50 bonds . . . . . . . . . . . . . . . . . . . . . . . . . . . . . . . . 1.35 1.00 0.98 4.41
300 stocks . . . . . . . . . . . . . . . . . . . . . . . . . . . . . . . . . . . . . . . . . 2.34 1.18 0.82 4.06
300 bonds . . . . . . . . . . . . . . . . . . . . . . . . . . . . . . . . . . . . . . . . 0.37 0.22 0.98 4.35
150 stocks & 150 bonds . . . . . . . . . . . . . . . . . . . . . . . . . . . . . . 1.36 0.69 0.83 4.08
(18) In the extreme case of no default, the loss distribution will be a fl at line with a probability of one having zero loss. In order to have an “interesting” case study with some defaults, we allow for negative jumps in the asset value. There will be more defaults if we allow for larger negative jumps in the asset value.
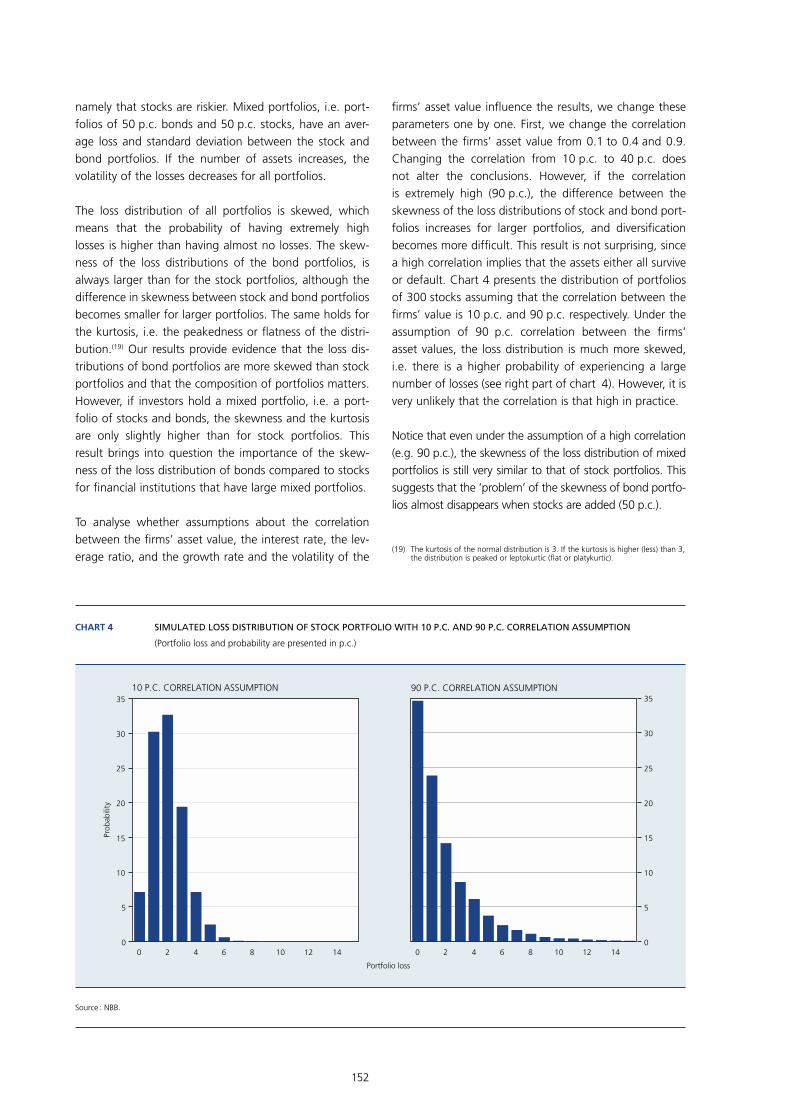
152
namely that stocks are riskier. Mixed portfolios, i.e. port-folios of 50 p.c. bonds and 50 p.c. stocks, have an aver-age loss and standard deviation between the stock and bond portfolios. If the number of assets increases, the volatility of the losses decreases for all portfolios.
The loss distribution of all portfolios is skewed, which means that the probability of having extremely high losses is higher than having almost no losses. The skew-ness of the loss distributions of the bond portfolios, is always larger than for the stock portfolios, although the difference in skewness between stock and bond portfolios becomes smaller for larger portfolios. The same holds for the kurtosis, i.e. the peakedness or fl atness of the distri-bution.(19) Our results provide evidence that the loss dis-tributions of bond portfolios are more skewed than stock portfolios and that the composition of portfolios matters. However, if investors hold a mixed portfolio, i.e. a port-folio of stocks and bonds, the skewness and the kurtosis are only slightly higher than for stock portfolios. This result brings into question the importance of the skew-ness of the loss distribution of bonds compared to stocks for fi nancial institutions that have large mixed portfolios.
To analyse whether assumptions about the correlation between the fi rms’ asset value, the interest rate, the lev-erage ratio, and the growth rate and the volatility of the
fi rms’ asset value infl uence the results, we change these parameters one by one. First, we change the correlation between the fi rms’ asset value from 0.1 to 0.4 and 0.9. Changing the correlation from 10 p.c. to 40 p.c. does not alter the conclusions. However, if the correlation is extremely high (90 p.c.), the difference between the skewness of the loss distributions of stock and bond port-folios increases for larger portfolios, and diversifi cation becomes more diffi cult. This result is not surprising, since a high correlation implies that the assets either all survive or default. Chart 4 presents the distribution of portfolios of 300 stocks assuming that the correlation between the fi rms’ value is 10 p.c. and 90 p.c. respectively. Under the assumption of 90 p.c. correlation between the fi rms’ asset values, the loss distribution is much more skewed, i.e. there is a higher probability of experiencing a large number of losses (see right part of chart 4). However, it is very unlikely that the correlation is that high in practice.
Notice that even under the assumption of a high correlation (e.g. 90 p.c.), the skewness of the loss distribution of mixed portfolios is still very similar to that of stock portfolios. This suggests that the ‘problem’ of the skewness of bond portfo-lios almost disappears when stocks are added (50 p.c.).
(19) The kurtosis of the normal distribution is 3. If the kurtosis is higher (less) than 3, the distribution is peaked or leptokurtic (fl at or platykurtic).
0 2 4 6 8 10 12 140
5
10
15
20
25
30
35
0 2 4 6 8 10 12 140
5
10
15
20
25
30
35
CHART 4 SIMULATED LOSS DISTRIBUTION OF STOCK PORTFOLIO WITH 10 P.C. AND 90 P.C. CORRELATION ASSUMPTION
(Portfolio loss and probability are presented in p.c.)
Source : NBB.
Prob
abili
ty
Portfolio loss
90 P.C. CORRELATION ASSUMPTION10 P.C. CORRELATION ASSUMPTION
153
THE DETERMINANTS OF CREDIT SPREADS
In order to evaluate the effect of the leverage of the fi rm on our results, we change the composition of the asset value : 70 p.c. debt – 30 p.c. equity and 30 p.c. debt – 70 p.c. equity. Simulations with these new values, however, do not yield qualitatively different results. Furthermore, we fi nd that changing the risk-free rate, the growth rate of the asset value, and the volatility of the asset value infl uences the results somewhat but does not alter the conclusions.
The main conclusions of the simulation exercise are :– The skewness of the loss distribution of stock and bond
portfolios is lower for larger portfolios (300 assets). This suggests that stockholders as well as bondholders can benefi t from having larger portfolios.
– The skewness of the loss distribution of bond portfo-lios is higher than for stock portfolios. However, the difference signifi cantly decreases for larger portfolios (300 assets) and with a low to moderate level of cor-relation between fi rm values (less than 40 p.c.).
– The skewness of the loss distribution of mixed port-folios is only slightly higher than for stock portfolios. Indeed, for large portfolios (300 assets), the skewness of the loss distributions is very similar. Thus, one may question the importance of skewness for institutional investors.
– Although we fi nd that pure bond portfolios are more highly skewed than pure stock portfolios, this analysis does not indicate how important skewness is for credit spreads relative to other factors such as liquidity risk and the systematic shocks.
7. Conclusions
The main focus of this article has been the analysis of the determinants of corporate bond spreads in US and Europe. Structural credit risk models, introduced by Black and Scholes (1973) and Merton (1974), are used to derive determinants of credit spreads such as the risk-free inter-est rate, the asset value, and asset volatility. Our analysis of Euro corporate bonds (1998-2002), yields results in support of those reported in previous studies. We fi nd a negative relation between changes in the level and the slope of the risk-free term structure and credit spread changes. In addition, we fi nd that high return and a decrease in the volatility of the DJ Euro Stoxx reduces credit spread changes. We also fi nd that credit spread changes signifi cantly increase with liquidity risk. A gen-eral conclusion, however, that can be drawn from most empirical studies is that an important portion of the vari-ation in credit spreads remains unexplained.
Our empirical analysis also indicates that the rela-tion between credit spread changes and fi nancial and ma croeconomic variables depends on the rating and the maturity of the bonds. Credit spreads on bonds with lower ratings and longer maturities are often more strongly affected by macroeconomic changes than spreads on bonds with higher ratings and shorter maturities.
A comparison of results of empirical studies of US and European credit spreads reveals that the same factors are important for both regions. Even though the US corporate bond market is broader and more liquid, the results for European credit spreads are comparable with those for the US. Examination of the dynamics of credit spreads on different types of corporate bonds, however, suggests that this result should not be surprising. The effect of fi nancial and macro-economic variables on credit spreads appears to depend more on the rating and maturity of the bonds than on the country or currency of issuance. Credit spreads on US and European rated bonds with the same rating exhibit a similar pattern, whereas credit spreads on European corporate bonds with different ratings behave differently.
Empirical studies to date have succeeded in explaining only a small portion of the variation in credit spreads. Several possible explanations for this lack of explana-tory power have been put forward, such as liquidity risk, taxation differences, and a risk premium for systematic shocks. Most empirical studies fi nd that liquidity risk and systematic shocks signifi cantly affect credit spreads. Another explanation has been proposed by D’Amato and Remolona (2003), who suggest that diversifi cation risk, i.e. the risk of unexpected losses from default that are present in bond portfolios and cannot be diversifi ed, might explain a substantial portion of credit spread changes. Our simulation analysis has shown that the skewness of the loss distributions of pure bond portfolios is indeed higher than for pure stock portfolios. However, the skewness of mixed portfolios (50 p.c. bonds and 50 p.c. stocks) is very similar to that of pure stock portfolios. This result calls into question the importance of the skewness of pure bond portfolios for explaining credit spread changes. Although these simulations suggest answers to some questions regarding the loss distributions of bond and stock port-folios, it remains an open question as to how important diversifi cation risk is relative to other factors in explaining credit spread changes.

154
References
Altman, E.I. and H.A. Rijken (2003), “How rating achieve rating stability”, Stern School of Business, New York University.
Black, F. and J.C. Cox (1976), “Valuing corporate securities : Some effects of bond indenture provisions”, Journal of Finance 31, pp. 351-367.
Black, F. and M. Scholes (1973), “The pricing of options and corporate liabilities, Journal of Political Economy 81, pp. 637-654.
Blanco, R.S., S. Brennan, and I.W. Marsh (2003), “An empirical analysis of the dynamic relationship between investment grade bonds and credit default swaps”, Bank of England Working Paper.
Boss, M. and M. Scheicher (2002), “The determinants of credit spread changes in the Euro area”, BIS Paper No. 12 – Market functioning and central bank policy.
Collin-Dufresne, P., R.S. Goldstein, and J.S. Martin (2001), “The determinants of credit spread changes”, Journal of Finance 56 (6), pp. 2177-2207.
Cossin, D., T. Hricko, D. Aunon-Nerin, and Z. Huang (2002), “Exploring the determinants of credit risk in credit default swap transaction data”, Working Paper.
Crouhy M., Galai D., and R. Mark (2001), “Prototype risk rating system”. Journal of Banking and Finance 25, pp. 47-95.
D’Amato, J. and E.M. Remolona (2003), “The credit spread puzzle”, BIS Quarterly Review, December.
Delianedis, G. and R. Geske (2001), “The components of corporate credit spreads : default, recovery, tax, jumps, liquidity, and market factors”, University of California at Los Angeles, Anderson Graduate School of Management 11025.
Diebold, F.X. and C. Li (2002), “Forecasting the term structure of government bond yields”, PIER Working Paper.
Driessen, J. (2004), “Is default event risk priced in corporate bonds ?”, Review of Financial Studies (forthcoming).
Duffee, G.R. (1998), “The relation between treasury yields and corporate bond yield spreads”, Journal of Finance 53 (6), pp. 2225-2241.
Duffi e, D. (1999), “Credit swap valuation”, Financial Analyst Journal 51, pp. 527-551.
Elton, E.J., M.J. Gruber, D. Agrawal and Christopher Mann (2001), “Explaining the rate spread on corporate bonds”, Journal of Finance 56 (1), pp. 247-277.
Fama, E. and K. French (1994), “Size and Book-to-Market factors in earnings and returns”, Journal of Finance 50 (1).
Ferson, W.E., S. Sarkissian, and T.T. Simin (2003), “Spurious regressions in fi nancial economics ?”, Journal of Finance 58 (4), pp. 1393-1413.
Houweling, P., A. Mentink, and T. Vorst (2004), “Comparing possible proxies of corporate bond liquidity”, Journal of Banking and Finance, forthcoming.
Houweling, P. and T. Vorst (2005), “Pricing default swaps : Empirical evidence”, Journal of Internation Money and Finance, forthcoming.

155
THE DETERMINANTS OF CREDIT SPREADS
Holthausen, R.W. and R.W. Leftwich (1986), “The effect of bond rating changes on common stock prices”, Journal of Financial Economics 17, pp 57-89.
Hull, J., M. Predescu-Vascari, and A. White (2002), “The relationship between credit default swap spreads, bond yields, and credit rating announcements”, University of Toronto Working Paper.
Joutz, F., S. Mansi, and W. F. Maxwell (2002), “Determinants of corporate credit spreads”, Working Paper.
Leak, J. (2003), “Credit spreads on sterling corporate bonds and the term structure of UK interest rates, Bank of England Working Paper 202.
Leland, H.E. (1994), “Corporate debt value, bond covenants, and optimal capital structure”, Journal of Finance 49, pp. 1213-1252.
Longstaff, F.A. and E.S. Schwartz (1995), “A simple approach to valuing risky fi xed and fl oating rate debt”, Journal of Finance 50 (3), pp. 789-819.
Longstaff, F.A., S. Mithal, and E. Neis (2003), “The credit-default swap market : Is credit protection prices correctly ?”, Working Paper.
Lucas, A., P. Klaassen, P. Spreij, S. Straetmans (2001), “An analytic approach to credit risk of large corporate bond and loan portfolios”, Journal of Banking and Finance 25, pp. 1635-1664.
Merton, R. (1974), “On the pricing of corporate debt : the risk structure of interest rates”, Journal of Finance 29, pp. 449-470.
Morris, C., R. Neal, and D. Rolph (1998), “Credit spreads and interest rates : a cointegration approach”, FRB of Kansas City Working Paper.
O’Kane, D. and R. McAdie (2001), “Explaining the basis : cash versus default swaps”, Lehman Brothers Structured Credit Research.
Perraudin, W.R.M. and A.P. Taylor (2004), “Liquidity and bond market spreads”, Working Paper.
Van Landschoot, A. (2004), “The term structure of credit spreads on Euro corporate bonds”, National Bank of Belgium Working Paper (forthcoming).
Zhou, C. (1997), “Default correlation : An analytical result”, Finance and Economics Discussion Series 1997-27, Board of Governors of the Federal Reserve System.

157
INTEREST RATE RISK IN THE BELGIAN BANKING SECTOR
Konstantijn Maes
1. Introduction
Interest rate risk refers to the exposure of a bank’s net interest income and the market value of its equity to unexpected changes in interest rates (1). The exposure results from differences in the price sensitivities of assets and liabilities to unexpected interest rate changes, caused by maturity, duration, and repricing mismatches and the presence of embedded options in the balance sheet (2).
There are three factors motivating the supervisory authorities’ current interest in measuring and assessing the interest rate risk in the banking sector. First and foremost, supervisors want to ascertain whether or not banks have suffi cient capital in place to cover the inter-est rate risk incurred in their trading activity and asset and liability management. In this respect, it needs to be stressed that while the Basel I and II Accords represent milestones in supervisory policy by introducing mini-mum capital requirements for different categories of risk, they do not automatically impose an explicit capital charge tied to the interest rate risk in a bank’s banking book. Instead, within the framework of Pillar II of Basel II, supervisors are asked to identify and monitor banks that run excessive banking book interest rate risk (so-called “outliers”). Supervisors can then impose a hedge on these banks or ask them to hold additional capital.
A second motivating factor follows from the continuing importance of interest rate risk in banks’ balance sheets, despite the current low level and volatility of European interest rates and the trend towards disintermediation. Indeed, although fee income has become increasingly important, net interest income still accounts for more
Interest Rate Risk in the Belgian Banking Sector
than half of total bank income. Moreover, given that Belgian banks fi nance a considerable proportion of their assets with sight and savings deposits, the effect of changes in market rates on the spread between deposit and market rates and on deposits withdraw-als will potentially have a large impact on the ultimate interest rate risk exposure. Also, the risk of even small upward changes in long-term interest rates on the hold-ing returns of bonds in the securities portfolio of banks must be acknowledged. Bond prices are potentially very sensitive to small policy changes that affect the short end of the yield curve. Campbell (1995) describes how initially modest Fed policy moves in 1994 triggered sharp increases in long bond yields that eventually culminated in a global bond market crisis.
Third, in the autumn of 2004 the European Commission is expected to endorse International Financial Reporting Standard 39 Financial Instruments : Recognition and Measurement. The standard aims at increasing trans-parency about a bank’s risk-taking by imposing a stricter and more complete recording of its assets and liabilities. For example, the standard does not allow underperforming bonds to be shifted from the trading book (where they are marked-to-market) to the bank-ing book (where they are booked at historical cost) to
(1) Within the scope of this paper, interest rate changes are assumed to originate from the risk-free non-callable zero coupon bond yield curve and not from changes in credit risk. The reader is referred to the paper “The Determinants of Credit Spreads” in this Financial Stability Review for evidence about the link between changes in risk-free interest rates and credit spreads.
(2) The embedded options materialize mainly in the form of sight and savings deposits withdrawals on the liability side and early loan repayments at the asset side of the balance sheet, conditional on a specifi c interest rate scenario. This paper will focus attention to the former. The reader is referred to Uyemura and van Deventer (1994) for US empirical evidence and references on the latter.
158
avoid a drop in bank net income. As such, the standard is expected to lead to increased volatility of Belgian bank income and capital. (3)
The paper is organised as follows. Section 2 focuses on the economic rationale behind the existence of intermediaries that expose themselves to interest rate risk by fi nancing long-term assets with short-term liabilities and deposits. A bank that assumes a maturity mismatch does not necessar-ily assume a repricing mismatch. So, ultimately, we should explain why banks do not transform long (fi xed) interest rates into short (variable) rates at small cost using inter-est rate swaps, since this would effectively eliminate the risk exposure that follows from the maturity mismatch. Section 3 quantifi es and discusses popular measures of aggregate interest rate risk exposure in the Belgian banking system, refl ecting a going concern as well as a market or liquidation view of the banking system. The two views are actually complementary in constructing a complete, true and fair view of interest rate risk exposure. We use repricing tables and gap reports to gain further insight into the total interest rate risk exposure of the Belgian banking system. Given that the treatment of deposits accounts turns out to be of paramount importance in a true and fair assess-ment of the interest rate risk exposure of Belgian banks, we also review the literature on deposit account modeling. Section 4 briefl y describes the supervisory framework of the Basel II Accord for measuring, monitoring, and control-ling the interest rate risk of banks. Section 5 concludes and summarises the main messages.
2. The economics behind interest rate risk exposures
2.1 Why maturity-mismatching banks exist
Individuals are typically risk averse and this characteristic is refl ected in their preferences. Those with an excess of funds typically have a preference to lend short, while those with a shortage of funds have a preference to borrow long. Still, in the presence of perfect fi nancial markets (Arrow and Debreu (1954)), there would be no need for maturity-mismatching intermediating banks, since savers and borrowers would execute their transactions directly in fi nancial markets with suffi ciently rewarded and willing counterparties (see also Modigliani and Miller (1958)). So, the true raisons d’être of banks are market imperfections such as information asymmetries, transaction costs, tax distortions and market incompleteness. (4)
Given the existence of market imperfections, there is a role for banks in bringing risk-averse savers and borrowers together. However, banks create a mismatch between the maturity of their assets and liabilities by issuing demand-able and other short-term debt and granting long-term loans. Among many others Diamond (1984) and Gorton and Pennacchi (1990) try to understand the exact circum-stances under which each of these two separate activities might require the existence of an intermediary, as opposed to being implemented directly through arm’s-length fi nan-cial markets. Although this literature yields many insights, only a few papers address the more fundamental question of why it would make economic sense for a single institu-tion to carry out both functions under the same roof. Real synergies have to exist between the two activities, since if there exist none, there would be no rationale for the exist-ence of loan making and deposit taking banks.
Kashyap et al. (2002) show that, indeed, so long as markets are imperfect, synergies exist between deposit-taking and loan-making activities. They argue that banks offer credit lines or loan commitments to their borrowers, such that the latter hold the option to draw down the loan on demand over a specifi ed period of time. Once the decision to extend a credit has been made, the borrower can show up at any time and withdraw funds, just as with a demand deposit. In that sense, banks provide their customers with liquidity on both the liability and asset side to accommodate their unpredictable needs, extending the original Diamond and Dybvig (1983) argument (5). Now, given that fi nancial markets are imperfect, a bank cannot accommodate liquidity shocks instantaneously by raising new external fi nance, so that a buffer stock of liquid assets needs to be held. Holding this buffer is costly for several reasons : opportunity costs, tax distortions, increased agency costs, etc. So, if demand withdrawals and loan draw downs are not perfectly correlated, a real synergy arises and a bank would be able to hold a smaller total liquid asset stock than two separate institutions would have to hold jointly.
(3) The recent amendments to IAS 39 (IASB (2004)) seem to leave scope to reduce income volatility by applying the restricted fair value option. While hedge accounting imposes stringent documentation demands and is therefore unlikely to be used by Belgian banks, the restricted fair value option can be used as a short-cut alternative to hedge accounting to reduce income volatility. See the article “Impact of IAS 39 on asset and liability management and banks’ capital ratios” in this Financial Stability Review. The interested reader is referred to ECB (2004) for a general discussion and impact study of more fair valuation of fi nancial instruments.
(4) An important “market imperfection” in the Belgian legal environment is the favourable tax treatment of savings deposits (“gereglementeerde spaardeposito’s /dépôts d’épargne réglementés”). The interest proceeds from savings deposits are currently tax-exempt insofar they do not exceed 3,040 euro per household, leading to their importance in the fi nancing portfolio of a bank (see also Section 3.2).
(5) The classic motivation (Diamond and Dybvig, 1983) for banks to offer deposits derives from the existence of random liquidity shocks faced by depositors and the need for depositors to be insured against these liquidity shocks. The law of large numbers implies that aggregating over these idiosyncratic liquidity shocks leads to exploitable diversifi cation benefi ts.
159
INTEREST RATE RISK IN THE BELGIAN BANKING SECTOR
Other arguments have also been raised. Dermine (2003) lists several synergies between loan making and deposit taking that lead to real cost reductions. For example, there could be joint operating expenses in delivering deposits and loans, or the terms of mortgage loans could simply require the opening of deposit accounts. Diamond and Rajan (2001) argue instead that banks commit themselves to bearing withdrawal risk by issuing demandable deposits. Hence, the bank will be committed to do the utmost to col-lect from borrowers to repay depositors. If not, a run might be precipitated and the bank would fail. Similarly, Calomiris and Kahn (1991) argue that deposits may discipline bank-ers and hence, by submitting themselves to demandable deposits, bankers may attain a lower cost of capital. Finally, Mester et al. (2001) argue that deposits may help banks in monitoring borrowers, thereby becoming superior lenders.
2.2 Why repricing-mismatching banks exist
The previous section argues that risk aversion, market imperfections, and real synergies in banks’ balance sheets may justify the existence of maturity-mismatching banks. However, banks can run maturity or duration mismatches yet still match the repricing characteristics of their assets and liabilities, and vice versa. For example, when a bank makes price-sensitive (fi xed rate) long-term loans and fi nances them by less price-sensitive (variable rate) liabilities, it can always opt to swap the long-term fi xed interest rates on the loans into short-term variable interest rates at small cost. So, we need to go one step further and understand why banks expose themselves to a repricing mismatch.
The existence of a positive average yield spread, being the difference between yields on long and short bonds, is not a suffi cient reason for banks to lend at a long rate and borrow at a short rate, i.e. expose themselves to a repric-ing mismatch. Indeed, the short-term yield cannot simply be compared with the long-term yield to infer something about their relative returns (i.e. the ex post excess return). The short-term yield is an expected return over a short horizon or holding period, while the long-term yield is the expected return over a long horizon or holding period. If the two need to be compared, either the long-term yield has to be compared with the average yield of rolling over short-term bond yields over the life of the long bond, or the short yield has to be compared with the uncertain short-term holding return of the long bond. Both fair com-parisons imply that expectations about interest rate dyna-mics and rewards for being exposed to interest rate risk – expected excess returns or risk premia – need to be taken into account. Given that both components are unobserved, we need a model to separate yields into expectations about interest rate dynamics and risk premia. (6)
2.2.1 Expectations about interest rate dynamics
The most simple no-arbitrage theory (7) is the pure expec-tations theory, where the assumption is made that bonds of different maturities are perfect substitutes. Hence short and long-term bonds are expected to earn the same return over the same holding period. Rolling over subsequent short-term bonds should earn the same return as buying and holding a long-term bond, which implies that the long-term yield is an average of current and future expected short-term yields over the life of the long-term bond. So if a positive yield spread is observed, this does not imply that long bond returns are expected to be higher than returns on short bonds (over any hori-zon). Instead, the theory predicts in that case that over the long horizon, short-term bond yields are expected to increase so that both short-term and long-term bonds are expected to earn the same amount over the horizon of the long bond. Alternatively, the theory predicts that over the short horizon the long rate tends to rise (8), such that the generated capital losses fully offset the initial yield advantage and expected returns are again identical.
If the pure expectations theory holds true, a yield spread will not lead to an increase in the market value of a bank’s equity, irrespective of the size of the yield spread and the duration mismatch between assets and liabilities. This is explained by the fact that the short yield on the liability is expected to increase over the life of the long asset so that the present value of net interest income exactly equals zero. If interest rates increase by less than what is expected by market participants as refl ected in current for-ward rates, then this is actually positive for the asset sensi-tive bank and the market value of its equity will increase. Duration is only (approximately) a correct measure for price sensitivity of equity when the implicit assumption that the yield curve is fl at holds true. (9) Conversely, if the yield curve cannot reasonably be assumed to be fl at, then the forward rate curve is the relevant benchmark for assessing the impact of an increase in the yield curve on the market value of equity (see Box 1 for a simple numeri-cal illustration).
(6) Alternatively, we need models to separate forward rates into future yields and risk premia. Given the one-to-one relationship between zero coupon bond yields and forward rates, we choose not to discuss the latter in this paper.
(7) A thorough review of the class of affi ne no-arbitrage term structure models is outside the scope of this article (see Dai and Singleton (2000) and Maes (2004)).
(8) Notice the somewhat counterintuitive implication of the pure expectations theory, namely that if the yield spread is unusually large, long yields are expected to increase and not decrease over the short run (and vice versa). The paradox is solved once one acknowledges that short rates are also expected to increase, at a faster pace than long rates according to the theory. So, yield spreads will still tend to become smaller, when they are unusually large.
(9) Notice that in that theoretical case, the forward rate curve is identical to the yield curve and, hence, the market does not expect interest rates to increase or decrease in the future. As a result, any change in interest is by defi nition unexpected.

160
Box 1 – The forward rate curve as the benchmark for assuming a repricing mismatch
This Box aims to illustrate that a positive yield spread always involves risk. Assume that the zero coupon bond (ZCB) yield curve today looks as in Table 1.
Imagine that a bank considers fi nancing a 5-year government coupon bond (face value 100, priced at par, ZCB yield curve as in Table 1, hence with yield and coupon rate equal to 5.768 p.c.) with a 1-year revolving time deposit (2 p.c.). The two yields 5.77 p.c. and 2 p.c. cannot be compared as such, given that the 5-year coupon bond yield is the average annual return over a holding period of 5 years, while the 1-year yield is the annual return over a holding period of 1 year. A comparison needs to be made on the same footing (i.e. holding period). Either we compare the 2 p.c. yield on the 1-year time deposit with the unknown 1-year holding return of the 5-year bond (given that its price might change), or we compare the 5.77 p.c. 5-year yield with the return of rolling over consecutive 1-year time deposits, where we need to acknowledge that the 1-year yields (returns) are uncertain between years 2 and 5.
However, uncertainty about future interest rates can always be eliminated by locking in future 1-year fi nancing costs today, using the implied 1-year forward rates derived from the ZCB yields. If future 1-year interest rates are locked in or future interest rates are exactly equal to the implied forward rates, which is referred to as scenario 1 in Table 2, then the initial 3.77 p.c. margin will turn negative in later years since locked-in fi nancing costs can be seen to increase from 2.0 p.c. to 10.1 p.c.. The net present value of net interest income over the next fi ve years is exactly equal to zero, so the market value of equity is not affected.
Interest rate changes that are in line with current forward rates do not affect the market value of a bank’s equity, irrespective of any maturity mismatch. Only unexpected changes in interest rates will affect the market value of a bank’s equity. If future fi nancing costs are not locked in and if actual future interest rates are above what is implied by the forward rates, for example scenario 2, we fi nd that market value of equity suffers from this unexpected increase in interest rates. However, if future interest rates increase but to a lesser extent than predicted by the forward rates, for example scenario 3, the market value of equity actually increases, despite the increasing short-term interest rates.
!
TABLE 1 ASSUMED ZERO COUPON BOND YIELD CURVE AND IMPLIED 1-YEAR FORWARD RATES
(Percentages per annum)
(1) Implied 1-year forward rates can be derived from the ZCB yields. E.g., the forward rate that one can lock in today between 3 and 4 years in the future can be derived as 6.03 p.c. = ((1.04)3 / (1.03)2) – 1.
Time to maturity / Time ZCB yields Implied 1-year forward rates (1)
1 . . . . . . . . . . . . . . . . . . . 2.00 2.00
2 . . . . . . . . . . . . . . . . . . . 3.00 4.01
3 . . . . . . . . . . . . . . . . . . . 4.00 6.03
4 . . . . . . . . . . . . . . . . . . . 5.00 8.06
5 . . . . . . . . . . . . . . . . . . . 6.00 10.10

161
INTEREST RATE RISK IN THE BELGIAN BANKING SECTOR
2.2.2 Risk premia
It has been argued above that expectations that deviate from the market’s interest rate expectations may motivate a bank to assume a repricing mismatch. However, in reality, no bank is able to systematically outguess market expecta-tions. Hence, taking positions based on interest rate expec-tations will not lead to systematic increases (or decreases) in market value of equity and an alternative explanation is needed for the existence of repricing mismatching banks.
The existence of a risk premium or expected excess return turns out to be the main driver for assuming a repricing mismatch. The return that a long bond holder expects to receive over a short bond return (i.e. the risk premium) makes it potentially worthwhile to assume a mismatch. When risk premia are zero, a bank will be indifferent with regard to holding short or long assets and liabilities.
The liquidity premium theory builds on the pure expecta-tions theory, but relaxes the assumption that bonds of dif-ferent maturities are perfect substitutes. Indeed, risk-averse investors might very well prefer to hold short-term bonds because of their higher liquidity, driving up their price and driving down the yields at the short end. Put differently, investors may require a non-zero risk premium to hold the less liquid long-term bonds. In sum, while the pure expec-tations theory assumes risk premia to be zero, the liquidity premium theory relaxes this assumption and allows them to be maturity-dependent (but constant over time).
In the case of non-zero risk premia, yield spreads contain predictions of both (short- and long-term) yield changes and risk premia, and we need to disentangle yield spreads into both unobserved components. If either of the above two term structure theories holds in reality, that is if risk premia are zero or constant over time, then yield spreads are optimal predictors of future movements in yields. More specifi cally, both theories have implications for short-term changes in long yields and long-term changes in short yields. These predictions can be tested using simple regres-sion analysis. In post-war US data (Fama (1984), Fama and Bliss (1987), Campbell and Shiller (1991), Campbell, et al. (1997)), short yields tend to increase when yield spreads are high – in line with the theoretical predictions –, but long yields tend to fall when yield spreads are high -counter to the theoretical predictions. So, to the extent that the yield spread forecasts short-term changes in the long rate, it does so in the wrong direction, amplifying the return differential between short and long bonds, instead of bridging it. Similar evidence for Belgian long-term interest rate dynamics is presented in Box 2.(10)
In sum, the regression evidence in the literature and in Box 2 suggests that neither the pure expectations nor the liquidity premium theory, although intuitively appeal-ing, describes actual yield curve dynamics. With respect
TABLE 2 SCENARIOS FOR FUTURE 1-YEAR INTEREST RATES AND THEIR IMPACT ON NET INTEREST INCOME
(1) NIIt is computed as follows : (5.77 p.c.–1yr interest rate at t) * 100.(2) The effect on market value of equity is computed as the sum of net present values of net interest income over the next 5 years (discounting by the zero coupon
bond yields in Chart 1). For example, the effect on market value of equity for scenario 1 is computed as : 3.77 / (1.02)1 + 1.76 / (1.03)2 + (–0.26) / (1.04)3 + (–2.29) / (1.05)4 + (–4.33) / (1.06)5 = 0.
Year Financing cost dynamics Net interest income (NII) (1)
Scenario 1
Future short rates locked in or as expected
Scenario 2
Future short rates unexpectedly higher
Scenario 3
Future short rates unexpectedly lower
Scenario 1
Future short rates locked in or as expected
Scenario 2
Future short rates unexpectedly higher
Scenario 3
Future short rates unexpectedly lower
1 2.00 p.c. 2.00 p.c. 2.00 p.c. 3.77 3.77 3.77
2 4.01 p.c. 5.01 p.c. (+1 p.c.) 3.01 p.c. (–1 p.c.) 1.76 0.76 2.76
3 6.03 p.c. 7.03 p.c. (+1 p.c.) 5.03 p.c. (–1 p.c.) –0.26 –1.26 0.74
4 8.06 p.c. 9.06 p.c. (+1 p.c.) 7.06 p.c. (–1 p.c.) –2.29 –3.29 –1.29
5 10.10 p.c. 11.10 p.c. (+1 p.c.) 9.10 p.c. (–1 p.c.) –4.33 –5.33 –3.33
Effect on market value of equity (NPV of sum of NII) nihil –3.40 3.40
(10) No evidence is presented for the alternative test of long-term changes in Belgian short-term yields. Results for this alternative test are in line with the theoretical predictions (with respect to the sign of the coeffi cient) and are available on request.
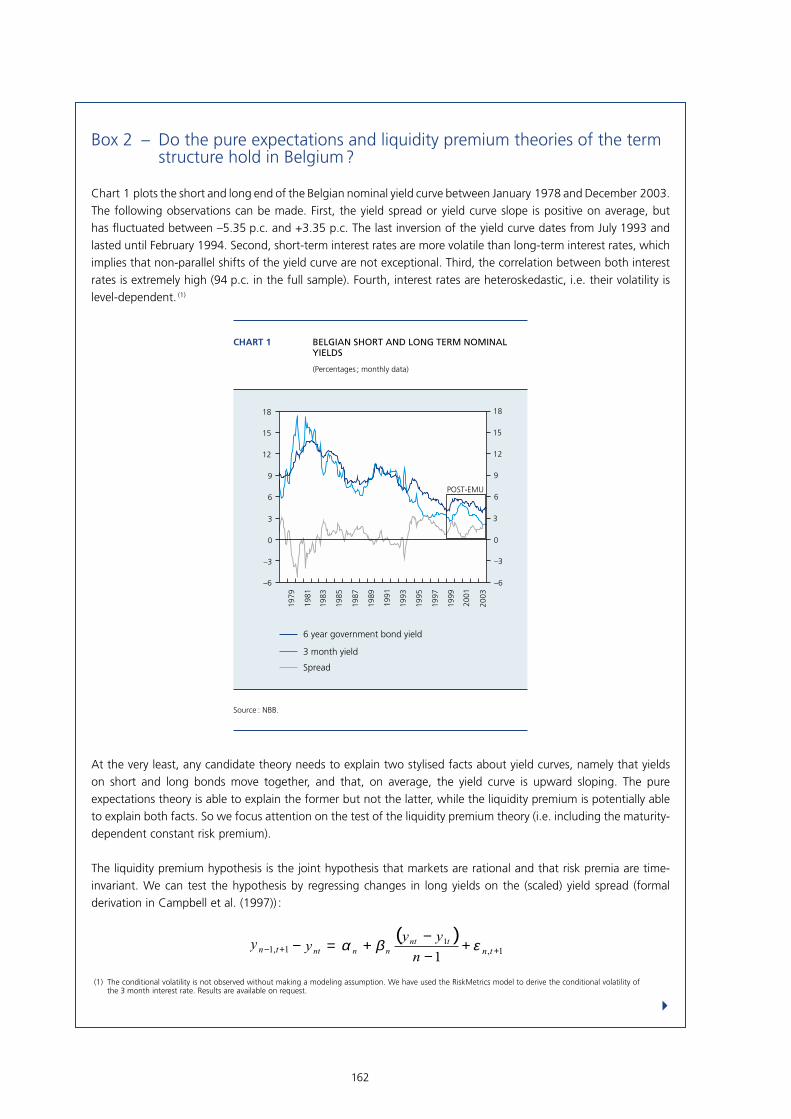
162
Box 2 – Do the pure expectations and liquidity premium theories of the term structure hold in Belgium ?
Chart 1 plots the short and long end of the Belgian nominal yield curve between January 1978 and December 2003. The following observations can be made. First, the yield spread or yield curve slope is positive on average, but has fl uctuated between –5.35 p.c. and +3.35 p.c. The last inversion of the yield curve dates from July 1993 and lasted until February 1994. Second, short-term interest rates are more volatile than long-term interest rates, which implies that non-parallel shifts of the yield curve are not exceptional. Third, the correlation between both interest rates is extremely high (94 p.c. in the full sample). Fourth, interest rates are heteroskedastic, i.e. their volatility is level-dependent. (1)
At the very least, any candidate theory needs to explain two stylised facts about yield curves, namely that yields on short and long bonds move together, and that, on average, the yield curve is upward sloping. The pure expectations theory is able to explain the former but not the latter, while the liquidity premium is potentially able to explain both facts. So we focus attention on the test of the liquidity premium theory (i.e. including the maturity-dependent constant risk premium).
The liquidity premium hypothesis is the joint hypothesis that markets are rational and that risk premia are time-invariant. We can test the hypothesis by regressing changes in long yields on the (scaled) yield spread (formal derivation in Campbell et al. (1997)) :
( )1,
11,1
1 ++− +−−
+=− tntnt
nnnttnn
yyyy εβα
(1) The conditional volatility is not observed without making a modeling assumption. We have used the RiskMetrics model to derive the conditional volatility of the 3 month interest rate. Results are available on request.
–6
–3
0
3
6
9
12
15
18
1979
1981
1983
1985
1987
1989
1991
1993
1995
1997
1999
2001
2003
–6
–3
0
3
6
9
12
15
18
CHART 1 BELGIAN SHORT AND LONG TERM NOMINAL YIELDS
(Percentages ; monthly data)
Source : NBB.
3 month yield
6 year government bond yield
Spread
POST-EMU
!
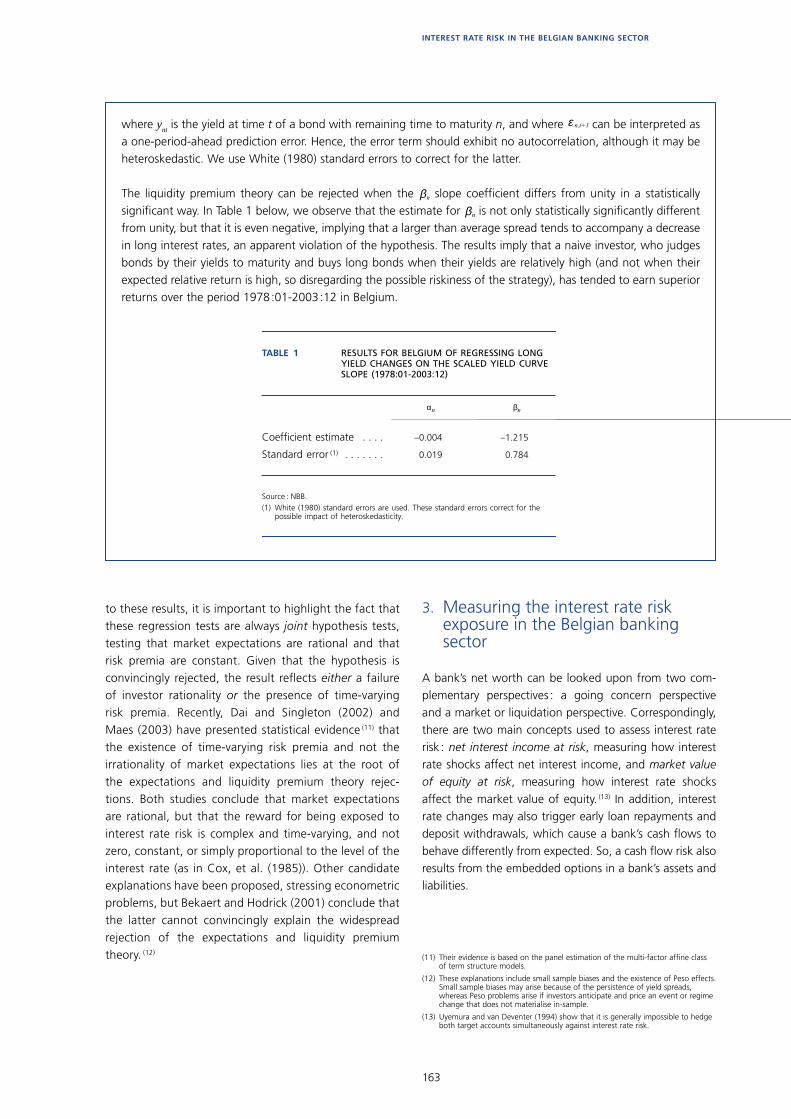
163
INTEREST RATE RISK IN THE BELGIAN BANKING SECTOR
where ynt is the yield at time t of a bond with remaining time to maturity n, and where n,t+1ε can be interpreted as
a one-period-ahead prediction error. Hence, the error term should exhibit no autocorrelation, although it may be heteroskedastic. We use White (1980) standard errors to correct for the latter.
The liquidity premium theory can be rejected when the nβ slope coeffi cient differs from unity in a statistically signifi cant way. In Table 1 below, we observe that the estimate for nβ is not only statistically signifi cantly different from unity, but that it is even negative, implying that a larger than average spread tends to accompany a decrease in long interest rates, an apparent violation of the hypothesis. The results imply that a naive investor, who judges bonds by their yields to maturity and buys long bonds when their yields are relatively high (and not when their expected relative return is high, so disregarding the possible riskiness of the strategy), has tended to earn superior returns over the period 1978 :01-2003 :12 in Belgium.
to these results, it is important to highlight the fact that these regression tests are always joint hypothesis tests, testing that market expectations are rational and that risk premia are constant. Given that the hypothesis is convincingly rejected, the result refl ects either a failure of investor rationality or the presence of time-varying risk premia. Recently, Dai and Singleton (2002) and Maes (2003) have presented statistical evidence (11) that the existence of time-varying risk premia and not the irrationality of market expectations lies at the root of the expectations and liquidity premium theory rejec-tions. Both studies conclude that market expectations are rational, but that the reward for being exposed to interest rate risk is complex and time-varying, and not zero, constant, or simply proportional to the level of the interest rate (as in Cox, et al. (1985)). Other candidate explanations have been proposed, stressing econometric problems, but Bekaert and Hodrick (2001) conclude that the latter cannot convincingly explain the widespread rejection of the expectations and liquidity premium theory. (12)
3. Measuring the interest rate risk exposure in the Belgian banking sector
A bank’s net worth can be looked upon from two com-plementary perspectives : a going concern perspective and a market or liquidation perspective. Correspondingly, there are two main concepts used to assess interest rate risk : net interest income at risk, measuring how interest rate shocks affect net interest income, and market value of equity at risk, measuring how interest rate shocks affect the market value of equity. (13) In addition, interest rate changes may also trigger early loan repayments and deposit withdrawals, which cause a bank’s cash fl ows to behave differently from expected. So, a cash fl ow risk also results from the embedded options in a bank’s assets and liabilities.
(11) Their evidence is based on the panel estimation of the multi-factor affi ne class of term structure models.
(12) These explanations include small sample biases and the existence of Peso effects. Small sample biases may arise because of the persistence of yield spreads, whereas Peso problems arise if investors anticipate and price an event or regime change that does not materialise in-sample.
(13) Uyemura and van Deventer (1994) show that it is generally impossible to hedge both target accounts simultaneously against interest rate risk.
TABLE 1 RESULTS FOR BELGIUM OF REGRESSING LONG YIELD CHANGES ON THE SCALED YIELD CURVE SLOPE (1978:01-2003:12)
Source : NBB.(1) White (1980) standard errors are used. These standard errors correct for the
possible impact of heteroskedasticity.
αn βn
Coefficient estimate . . . . –0.004 –1.215
Standard error (1) . . . . . . . 0.019 0.784
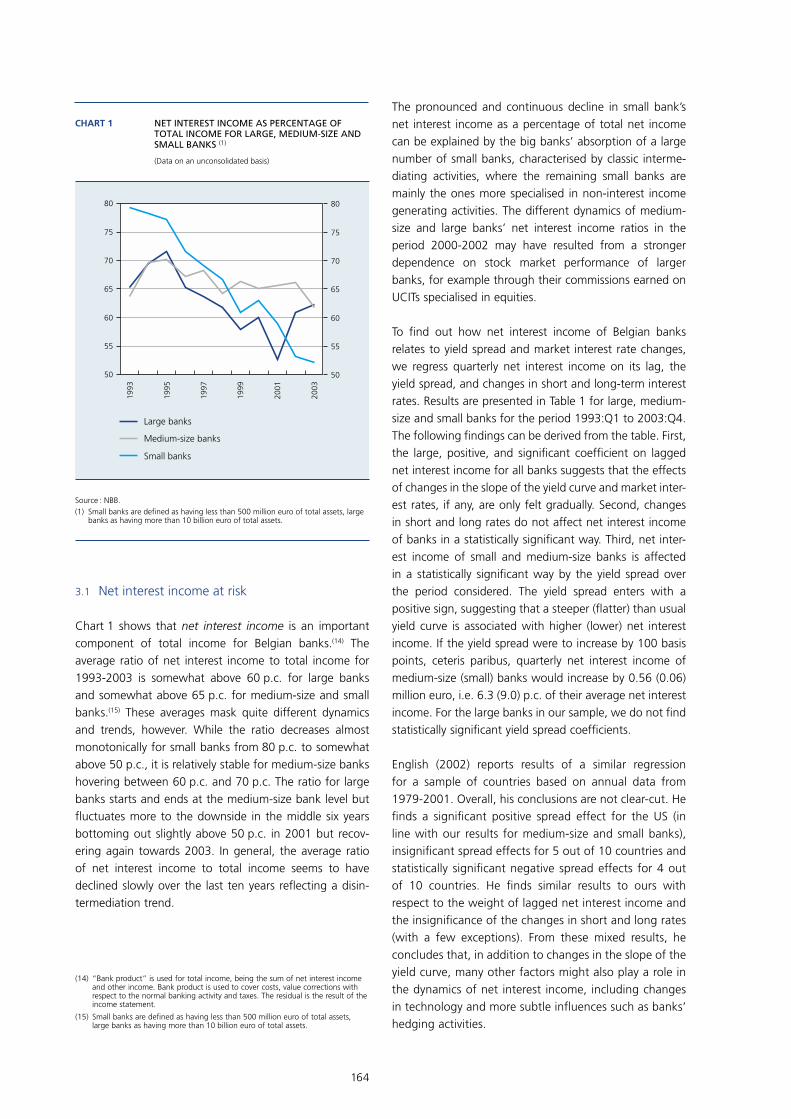
164
3.1 Net interest income at risk
Chart 1 shows that net interest income is an important component of total income for Belgian banks.(14) The average ratio of net interest income to total income for 1993-2003 is somewhat above 60 p.c. for large banks and somewhat above 65 p.c. for medium-size and small banks.(15) These averages mask quite different dynamics and trends, however. While the ratio decreases almost monotonically for small banks from 80 p.c. to somewhat above 50 p.c., it is relatively stable for medium-size banks hovering between 60 p.c. and 70 p.c. The ratio for large banks starts and ends at the medium-size bank level but fl uctuates more to the downside in the middle six years bottoming out slightly above 50 p.c. in 2001 but recov-ering again towards 2003. In general, the average ratio of net interest income to total income seems to have declined slowly over the last ten years refl ecting a disin-termediation trend.
1993
1995
1997
1999
2001
2003
50
55
60
65
70
75
80
50
55
60
65
70
75
80
CHART 1 NET INTEREST INCOME AS PERCENTAGE OF TOTAL INCOME FOR LARGE, MEDIUM-SIZE AND SMALL BANKS (1)
(Data on an unconsolidated basis)
Source : NBB.(1) Small banks are defined as having less than 500 million euro of total assets, large
banks as having more than 10 billion euro of total assets.
Large banks
Medium-size banks
Small banks
The pronounced and continuous decline in small bank’s net interest income as a percentage of total net income can be explained by the big banks’ absorption of a large number of small banks, characterised by classic interme-diating activities, where the remaining small banks are mainly the ones more specialised in non-interest income generating activities. The different dynamics of medium-size and large banks’ net interest income ratios in the period 2000-2002 may have resulted from a stronger dependence on stock market performance of larger banks, for example through their commissions earned on UCITs specialised in equities.
To fi nd out how net interest income of Belgian banks relates to yield spread and market interest rate changes, we regress quarterly net interest income on its lag, the yield spread, and changes in short and long-term interest rates. Results are presented in Table 1 for large, medium-size and small banks for the period 1993:Q1 to 2003:Q4. The following fi ndings can be derived from the table. First, the large, positive, and signifi cant coeffi cient on lagged net interest income for all banks suggests that the effects of changes in the slope of the yield curve and market inter-est rates, if any, are only felt gradually. Second, changes in short and long rates do not affect net interest income of banks in a statistically signifi cant way. Third, net inter-est income of small and medium-size banks is affected in a statistically signifi cant way by the yield spread over the period considered. The yield spread enters with a positive sign, suggesting that a steeper (fl atter) than usual yield curve is associated with higher (lower) net interest income. If the yield spread were to increase by 100 basis points, ceteris paribus, quarterly net interest income of medium-size (small) banks would increase by 0.56 (0.06) million euro, i.e. 6.3 (9.0) p.c. of their average net interest income. For the large banks in our sample, we do not fi nd statistically signifi cant yield spread coeffi cients.
English (2002) reports results of a similar regression for a sample of countries based on annual data from 1979-2001. Overall, his conclusions are not clear-cut. He fi nds a signifi cant positive spread effect for the US (in line with our results for medium-size and small banks), insignifi cant spread effects for 5 out of 10 countries and statistically signifi cant negative spread effects for 4 out of 10 countries. He fi nds similar results to ours with respect to the weight of lagged net interest income and the insignifi cance of the changes in short and long rates (with a few exceptions). From these mixed results, he concludes that, in addition to changes in the slope of the yield curve, many other factors might also play a role in the dynamics of net interest income, including changes in technology and more subtle infl uences such as banks’ hedging activities.
(14) “Bank product” is used for total income, being the sum of net interest income and other income. Bank product is used to cover costs, value corrections with respect to the normal banking activity and taxes. The residual is the result of the income statement.
(15) Small banks are defi ned as having less than 500 million euro of total assets, large banks as having more than 10 billion euro of total assets.
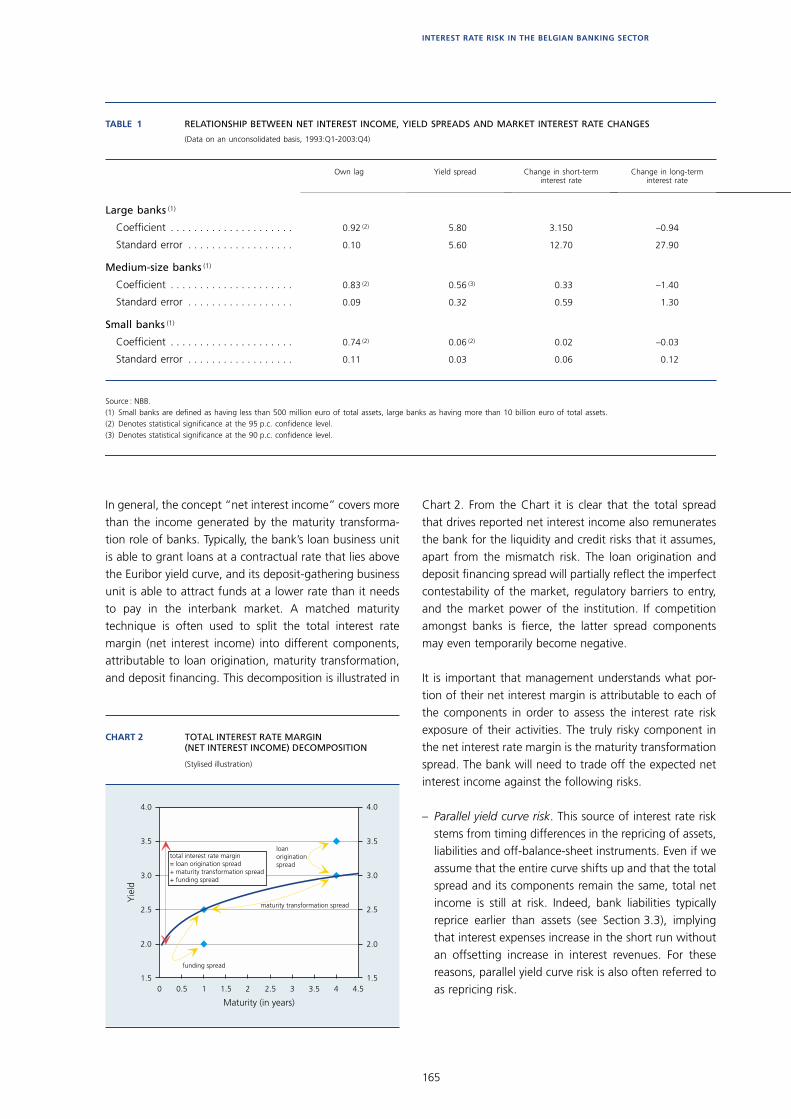
165
INTEREST RATE RISK IN THE BELGIAN BANKING SECTOR
In general, the concept “net interest income” covers more than the income generated by the maturity transforma-tion role of banks. Typically, the bank’s loan business unit is able to grant loans at a contractual rate that lies above the Euribor yield curve, and its deposit-gathering business unit is able to attract funds at a lower rate than it needs to pay in the interbank market. A matched maturity technique is often used to split the total interest rate margin (net interest income) into different components, attributable to loan origination, maturity transformation, and deposit fi nancing. This decomposition is illustrated in
Chart 2. From the Chart it is clear that the total spread that drives reported net interest income also remunerates the bank for the liquidity and credit risks that it assumes, apart from the mismatch risk. The loan origination and deposit fi nancing spread will partially refl ect the imperfect contestability of the market, regulatory barriers to entry, and the market power of the institution. If competition amongst banks is fi erce, the latter spread components may even temporarily become negative.
It is important that management understands what por-tion of their net interest margin is attributable to each of the components in order to assess the interest rate risk exposure of their activities. The truly risky component in the net interest rate margin is the maturity transformation spread. The bank will need to trade off the expected net interest income against the following risks.
– Parallel yield curve risk. This source of interest rate risk stems from timing differences in the repricing of assets, liabilities and off-balance-sheet instruments. Even if we assume that the entire curve shifts up and that the total spread and its components remain the same, total net income is still at risk. Indeed, bank liabilities typically reprice earlier than assets (see Section 3.3), implying that interest expenses increase in the short run without an offsetting increase in interest revenues. For these reasons, parallel yield curve risk is also often referred to as repricing risk.0.1 10 2 40.5 1.5 2.5 3 4.5
4.0
3.5
3.0
2.5
2.0
1.5
4.0
3.5
3.0
2.5
2.0
1.53.5
CHART 2 TOTAL INTEREST RATE MARGIN (NET INTEREST INCOME) DECOMPOSITION
(Stylised illustration)
maturity transformation spread
total interest rate margin= loan origination spread+ maturity transformation spread+ funding spread
funding spread
loanoriginationspread
Maturity (in years)
Yie
ldTABLE 1 RELATIONSHIP BETWEEN NET INTEREST INCOME, YIELD SPREADS AND MARKET INTEREST RATE CHANGES
(Data on an unconsolidated basis, 1993:Q1-2003:Q4)
Source : NBB.(1) Small banks are defined as having less than 500 million euro of total assets, large banks as having more than 10 billion euro of total assets.(2) Denotes statistical significance at the 95 p.c. confidence level.(3) Denotes statistical significance at the 90 p.c. confidence level.
Own lag Yield spread Change in short-term interest rate
Change in long-term interest rate
Large banks (1)
Coefficient . . . . . . . . . . . . . . . . . . . . . 0.92 (2) 5.80 3.150 –0.94
Standard error . . . . . . . . . . . . . . . . . . 0.10 5.60 12.70 27.90
Medium-size banks (1)
Coefficient . . . . . . . . . . . . . . . . . . . . . 0.83 (2) 0.56 (3) 0.33 –1.40
Standard error . . . . . . . . . . . . . . . . . . 0.09 0.32 0.59 1.30
Small banks (1)
Coefficient . . . . . . . . . . . . . . . . . . . . . 0.74 (2) 0.06 (2) 0.02 –0.03
Standard error . . . . . . . . . . . . . . . . . . 0.11 0.03 0.06 0.12

166
– Non-parallel yield curve risk. A second source of risk originates from the yield curve changing shape, i.e. inverting, fl attening, steepening, etc. Short-term inter-est rates are more volatile than long-term interest rates, which implies that non-parallel shifts of the yield curve are not exceptional. Part of the mismatch spread com-ponent may disappear or the spread may even become negative. Ceteris paribus, a fl attening of the yield curve is worse for net interest income than a parallel upward shift.
– Basis risk. A third source of interest rate risk originates from imperfect correlation between paid and received interest rate changes on different instruments with otherwise similar repricing or maturity characteristics. Basically, this source of risk originates from the fact that the loan spread and funding spread in Chart 2 are not perfectly correlated with changes in their corresponding market (Euribor) interest rates.
– Embedded option risk. Finally, assets, liabilities, and off-balance-sheet positions often incorporate implicit or explicit options that can lead to behavioural maturi-ties that signifi cantly differ from their contractual ones. The embedded options are generally exercised to the advantage of the holder, i.e. to the detriment of the bank. Instruments with embedded options include bonds with call or put provisions, mortgage loans that allow borrowers to repay the balance early for refi nanc-ing reasons, and sight and savings deposits that allow depositors to withdraw funds at any time.
3.2 Market value of equity at risk
Although the focus on net interest income is impor-tant, it is incomplete. The market value of all fi xed rate instruments is immediately affected when interest rates change. Whether or not these changes manifest them-selves immediately in earnings depends on accounting rules. While unrealised losses can temporarily be buried in historical cost accounting, they will eventually surface, usually in the form of earnings that underperform the market. The market or liquidation value perspective evaluates the interest rate risk to a bank’s net worth from all interest rate sensitive portfolios across the full maturity spectrum of the bank. Regulators fi nd the market per-spective very useful, since decreases in the market value of equity can be a leading indicator of future earnings and solvency problems. It can also help in identifying risk exposures that are not evident in an analysis of short-term earnings. See OCC (1989) for a stylised example of the latter.
However, the market value approach also raises a number of relevance and reliability problems. For exam-ple, swings in the market value of an instrument that is truly intended to be held to maturity are irrelevant and could potentially generate misleading intermedi-ary reported income changes, given that the price will be pulled back to par at maturity. Moreover, obtaining a reliable measurement is sometimes diffi cult when markets are illiquid, thin, or non-existent, or where complex embedded options are included. In those cases, discretionary modelling assumptions need to be made, possibly with an important valuation impact. Finally, the market approach by defi nition does not allow us to identify the timing of the accounting recognition of the decline in earnings.(16)
TABLE 2 AGGREGATE BALANCE SHEET STRUCTURE OF THE BELGIAN BANKING SECTOR
(Data on an unconsolidated basis, December 2003, percentages of total assets, i.e. 880 billion euro, 1993-2003 annual average growth rates in percentage between brackets)
Source : NBB.(1) Other deposits consist out of bank bonds (kasbons, bons de caisse) and
certificates of deposit.
ASSETS
Interbank loan portfolio . . . . . 26 (+2.6)
Client loan portfolio . . . . . . . . . 36 (+5.3)
Mortgage loans . . . . . . . . . . . . 8
Other loans . . . . . . . . . . . . . . . 28
Securities portfolio . . . . . . . . . . 28 (+4.1)
Banking book . . . . . . . . . . . . . . 22
Trading book . . . . . . . . . . . . . . 6
Other . . . . . . . . . . . . . . . . . . . . . 10 (+13.4)
Total . . . . . . . . . . . . . . . . . . . . . . 100 (+4.7)
LIABILITIES
Interbank borrowing . . . . . . . . 32 (+2.3)
Deposits . . . . . . . . . . . . . . . . . . . 47 (+4.2)
Sight deposits . . . . . . . . . . . . . 10 (+10.5)
Savings deposits . . . . . . . . . . . . 15 (+10.7)
Term deposits . . . . . . . . . . . . . 14 (+2.6)
Other deposits (1) . . . . . . . . . . . 8 (–3.3)
Own equity and subordinated debt . . . . . . . . . . . . . . . . . . . . 6 (+9.6)
Other . . . . . . . . . . . . . . . . . . . . . 15 (+15.0)
Total . . . . . . . . . . . . . . . . . . . . . . 100 (+4.7)
(16) These various issues are currently raised in the debate on fair value accounting (see ECB, 2004). The article “Impact of IAS 39 on asset and liability management and banks’ capital ratios” in this Financial Stability Review tries to look ahead by assessing the likely implications of the new fi nancial reporting standards on a stylised balance sheet.
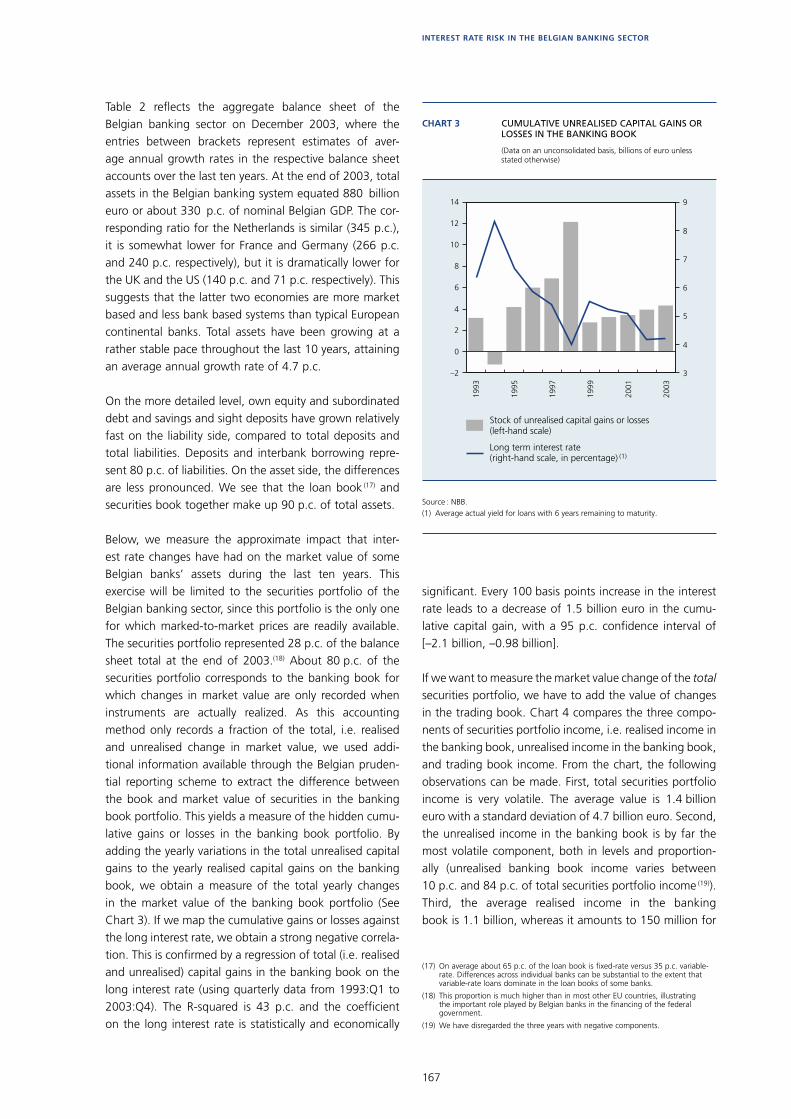
167
INTEREST RATE RISK IN THE BELGIAN BANKING SECTOR
Table 2 refl ects the aggregate balance sheet of the Belgian banking sector on December 2003, where the entries between brackets represent estimates of aver-age annual growth rates in the respective balance sheet accounts over the last ten years. At the end of 2003, total assets in the Belgian banking system equated 880 billion euro or about 330 p.c. of nominal Belgian GDP. The cor-responding ratio for the Netherlands is similar (345 p.c.), it is somewhat lower for France and Germany (266 p.c. and 240 p.c. respectively), but it is dramatically lower for the UK and the US (140 p.c. and 71 p.c. respectively). This suggests that the latter two economies are more market based and less bank based systems than typical European continental banks. Total assets have been growing at a rather stable pace throughout the last 10 years, attaining an average annual growth rate of 4.7 p.c.
On the more detailed level, own equity and subordinated debt and savings and sight deposits have grown relatively fast on the liability side, compared to total deposits and total liabilities. Deposits and interbank borrowing repre-sent 80 p.c. of liabilities. On the asset side, the differences are less pronounced. We see that the loan book (17) and securities book together make up 90 p.c. of total assets.
Below, we measure the approximate impact that inter-est rate changes have had on the market value of some Belgian banks’ assets during the last ten years. This exercise will be limited to the securities portfolio of the Belgian banking sector, since this portfolio is the only one for which marked-to-market prices are readily available. The securities portfolio represented 28 p.c. of the balance sheet total at the end of 2003.(18) About 80 p.c. of the securities portfolio corresponds to the banking book for which changes in market value are only recorded when instruments are actually realized. As this accounting method only records a fraction of the total, i.e. realised and unrealised change in market value, we used addi-tional information available through the Belgian pruden-tial reporting scheme to extract the difference between the book and market value of securities in the banking book portfolio. This yields a measure of the hidden cumu-lative gains or losses in the banking book portfolio. By adding the yearly variations in the total unrealised capital gains to the yearly realised capital gains on the banking book, we obtain a measure of the total yearly changes in the market value of the banking book portfolio (See Chart 3). If we map the cumulative gains or losses against the long interest rate, we obtain a strong negative correla-tion. This is confi rmed by a regression of total (i.e. realised and unrealised) capital gains in the banking book on the long interest rate (using quarterly data from 1993:Q1 to 2003:Q4). The R-squared is 43 p.c. and the coeffi cient on the long interest rate is statistically and economically
signifi cant. Every 100 basis points increase in the interest rate leads to a decrease of 1.5 billion euro in the cumu-lative capital gain, with a 95 p.c. confi dence interval of [–2.1 billion, –0.98 billion].
If we want to measure the market value change of the total securities portfolio, we have to add the value of changes in the trading book. Chart 4 compares the three compo-nents of securities portfolio income, i.e. realised income in the banking book, unrealised income in the banking book, and trading book income. From the chart, the following observations can be made. First, total securities portfolio income is very volatile. The average value is 1.4 billion euro with a standard deviation of 4.7 billion euro. Second, the unrealised income in the banking book is by far the most volatile component, both in levels and proportion-ally (unrealised banking book income varies between 10 p.c. and 84 p.c. of total securities portfolio income (19)). Third, the average realised income in the banking book is 1.1 billion, whereas it amounts to 150 million for
1993
1995
1997
1999
2001
2003
–2
0
2
4
6
8
10
12
14
3
4
5
6
7
8
9
CHART 3 CUMULATIVE UNREALISED CAPITAL GAINS OR LOSSES IN THE BANKING BOOK
(Data on an unconsolidated basis, billions of euro unless stated otherwise)
Source : NBB.(1) Average actual yield for loans with 6 years remaining to maturity.
Stock of unrealised capital gains or losses (left-hand scale)
Long term interest rate(right-hand scale, in percentage) (1)
(17) On average about 65 p.c. of the loan book is fi xed-rate versus 35 p.c. variable-rate. Differences across individual banks can be substantial to the extent that variable-rate loans dominate in the loan books of some banks.
(18) This proportion is much higher than in most other EU countries, illustrating the important role played by Belgian banks in the fi nancing of the federal government.
(19) We have disregarded the three years with negative components.
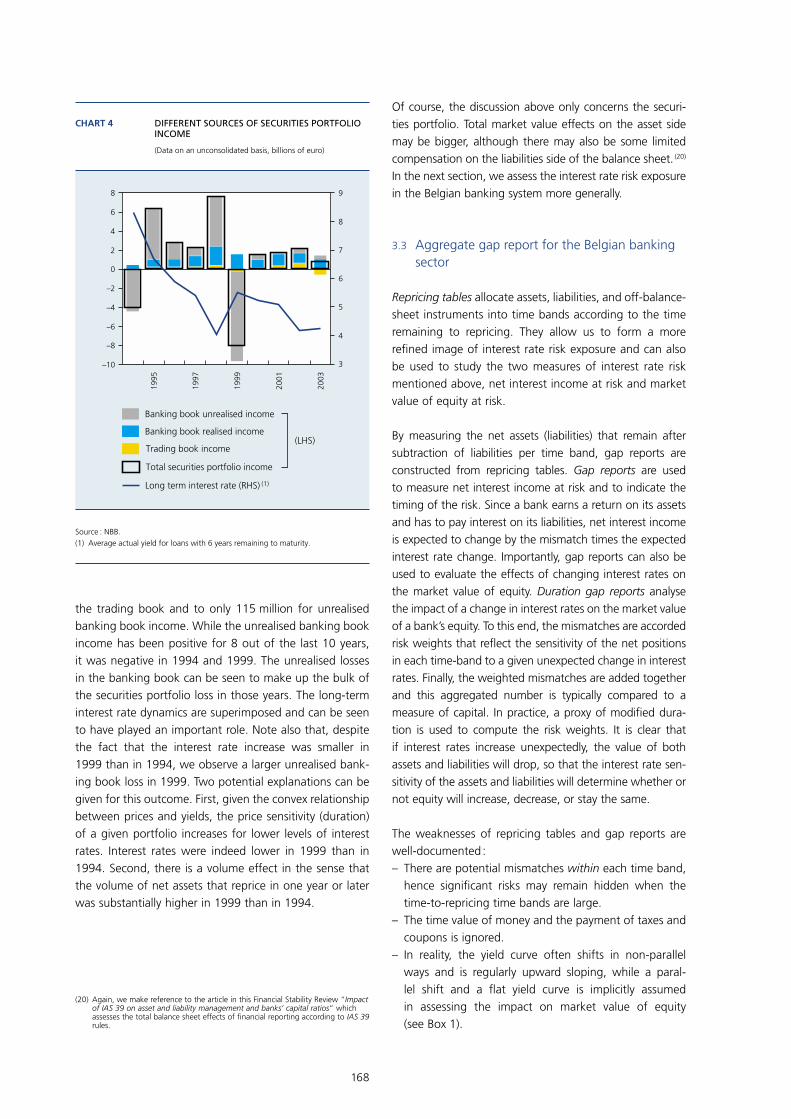
168
the trading book and to only 115 million for unrealised banking book income. While the unrealised banking book income has been positive for 8 out of the last 10 years, it was negative in 1994 and 1999. The unrealised losses in the banking book can be seen to make up the bulk of the securities portfolio loss in those years. The long-term interest rate dynamics are superimposed and can be seen to have played an important role. Note also that, despite the fact that the interest rate increase was smaller in 1999 than in 1994, we observe a larger unrealised bank-ing book loss in 1999. Two potential explanations can be given for this outcome. First, given the convex relationship between prices and yields, the price sensitivity (duration) of a given portfolio increases for lower levels of interest rates. Interest rates were indeed lower in 1999 than in 1994. Second, there is a volume effect in the sense that the volume of net assets that reprice in one year or later was substantially higher in 1999 than in 1994.
Of course, the discussion above only concerns the securi-ties portfolio. Total market value effects on the asset side may be bigger, although there may also be some limited compensation on the liabilities side of the balance sheet. (20) In the next section, we assess the interest rate risk exposure in the Belgian banking system more generally.
3.3 Aggregate gap report for the Belgian banking sector
Repricing tables allocate assets, liabilities, and off-balance-sheet instruments into time bands according to the time remaining to repricing. They allow us to form a more refi ned image of interest rate risk exposure and can also be used to study the two measures of interest rate risk mentioned above, net interest income at risk and market value of equity at risk.
By measuring the net assets (liabilities) that remain after subtraction of liabilities per time band, gap reports are constructed from repricing tables. Gap reports are used to measure net interest income at risk and to indicate the timing of the risk. Since a bank earns a return on its assets and has to pay interest on its liabilities, net interest income is expected to change by the mismatch times the expected interest rate change. Importantly, gap reports can also be used to evaluate the effects of changing interest rates on the market value of equity. Duration gap reports analyse the impact of a change in interest rates on the market value of a bank’s equity. To this end, the mismatches are accorded risk weights that refl ect the sensitivity of the net positions in each time-band to a given unexpected change in interest rates. Finally, the weighted mismatches are added together and this aggregated number is typically compared to a measure of capital. In practice, a proxy of modifi ed dura-tion is used to compute the risk weights. It is clear that if interest rates increase unexpectedly, the value of both assets and liabilities will drop, so that the interest rate sen-sitivity of the assets and liabilities will determine whether or not equity will increase, decrease, or stay the same.
The weaknesses of repricing tables and gap reports are well-documented :– There are potential mismatches within each time band,
hence signifi cant risks may remain hidden when the time-to-repricing time bands are large.
– The time value of money and the payment of taxes and coupons is ignored.
– In reality, the yield curve often shifts in non-parallel ways and is regularly upward sloping, while a paral-lel shift and a fl at yield curve is implicitly assumed in assessing the impact on market value of equity (see Box 1).
(20) Again, we make reference to the article in this Financial Stability Review “Impact of IAS 39 on asset and liability management and banks’ capital ratios” which assesses the total balance sheet effects of fi nancial reporting according to IAS 39 rules.
1995
1997
1999
2001
2003
–10
–8
–6
–4
–2
0
2
4
6
8
3
4
5
6
7
8
9
CHART 4 DIFFERENT SOURCES OF SECURITIES PORTFOLIO INCOME
(Data on an unconsolidated basis, billions of euro)
Source : NBB.(1) Average actual yield for loans with 6 years remaining to maturity.
Banking book unrealised income
Banking book realised income
Trading book income
Total securities portfolio income
Long term interest rate (RHS) (1)
(LHS)

169
INTEREST RATE RISK IN THE BELGIAN BANKING SECTOR
– The risks from embedded options (early loan repayments and deposit withdrawals) are typically not captured.
– Basis risk is not taken into account.– The underlying assumption is that no new business is
generated and that all maturing assets and liabilities are reinvested in the same time-band.
Clearly, each of the above points potentially biases the interest rate risk measurement. Despite these weaknesses, however, gap reports remain a consistent and simple means by which banks and supervisors can assess pos-sible mismatches within banks’ balance sheets. Moreover, it is possible to accommodate some of the above weak-nesses, for example by constructing different gap reports each corresponding to a specifi c interest rate dynamics scenario. Associated assumptions can then be made about the repricing characteristics of assets, liabilities, and off-balance-sheet instruments and about early loan repay-ments and deposit withdrawals. (21)
Chart 5 refl ects the aggregate repricing table for the entire Belgian banking system at the end of December 2003. (22) Ten time-to-repricing time bands (hereafter, time bands) can be distinguished from top to bottom. At the long end (top of Chart 5) the “over 10 years” time band records all
assets, liabilities, and off-balance-sheet instruments that reprice more than 10 years in the future. At the short end there is the “up to 8 days” time band recording all assets, liabilities, and off-balance-sheet instruments that reprice within 8 days. Sight deposits are by default classifi ed in the shortest time band liabilities (91 billion euro in total, i.e. 32 p.c. of “up to 8 days” liabilities).
Apart from these nine specifi c time bands, there is an important “indeterminate” time band (bottom of Chart 5), containing all assets and liabilities that cannot readily be classifi ed in any of the nine specifi c time bands. The bulk of the indeterminate liabilities is made up of sav-ings deposits (134 billion euro, i.e. about 60 p.c. of total indeterminate liabilities), accrued charges and deferred income (23 p.c.), and own capital (14 p.c.), while deferred charges and accrued income (52 billion euro, i.e. 43 p.c. of total indeterminate assets), advances in overdrafts (15 p.c.), and fi xed assets (25 p.c.) account for the bulk of the indeterminate assets. The size of the indeterminate time band is certainly not negligible, being the second largest on the liabilities side (after the “up to 8 days” time band), the third largest on the asset size, and the second largest in terms of gap (after the “up to 8 days” time band).
The structure of liabilities and assets across the time band spectrum suggests that Belgian banks fund a net amount of long assets with a net amount of short and “indeter-minate” liabilities. Although off-balance-sheet instru-ments (interest rate swaps, forward rate agreements, interest options) have grown by an annual average rate of 16.5 p.c. over the last ten years, Chart 5 makes clear that their net positions do not fundamentally change the asymmetry in the balance sheet. While a part of the inter-est rate risk exposure can be seen to be hedged by means of net off-balance-sheet instruments, there remains a substantial mismatch between the repricing character-istics of banks’ assets and liabilities. Net off-balance-sheet positions are used to decrease (hedge) the existing on-balance mismatches for time bands “one to two years” and longer, while their use typically increases the existing on-balance mismatches below one year (notably the “6 to 12 months” and “1 to 3 months” time bands).
0 50 100 150 200 250 300
CHART 5 AGGREGATE REPRICING TABLE OF THE BELGIAN BANKING SECTOR (DECEMBER 2003)
(Data at the end of december 2003 on an unconsolidated basis, billions of euro)
Source : NBB.
5 to 10 years
2 to 5 years
1 to 2 years
6 to 12 months
3 to 6 months
1 to 3 months
8 days to 1 month
Over 10 years
Up to 8 days
Indeterminate
Billions of euro
Repr
icin
g tim
e ba
nd
Sight deposits
Savings deposits
Assets
Net off-balance-sheet positions
Liabilities
(21) For example, a capped adjustable rate mortgage with annual repricing could be considered to be fi xed rate in a strongly rising interest rate environment and a one-year repricing asset in a declining rate environment.
(22) Downloaded from the Belgian prudential reporting scheme. The following data limitations should be mentioned. First, these data are not gathered at the consolidated bank account level, but only on a solo basis. Second, the data cannot distinguish between trading, banking and loan books. Given that trading book positions and mismatches can be rather quickly reversed (unwound), the observed mismatch will be sensitive to overestimation bias. However, in Table 2 we documented the fact that the size of the trading book positions is relatively small compared to the balance sheet total, hence the bias is likely to be small as well.
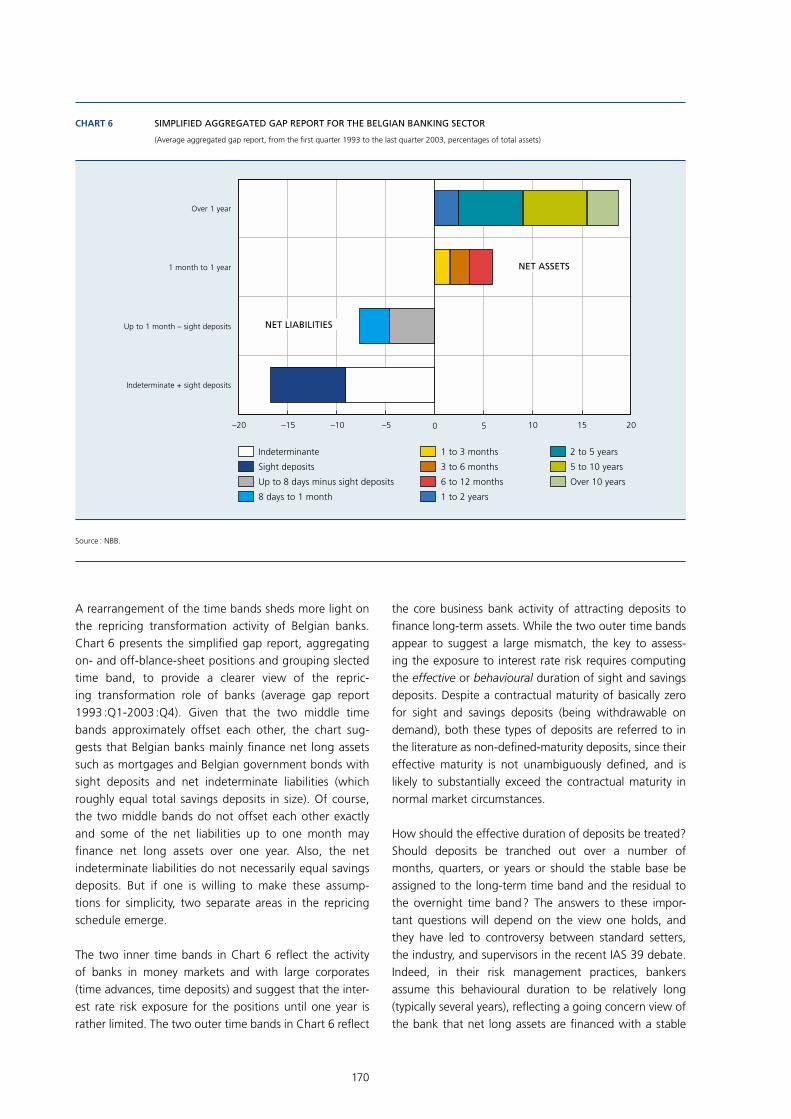
170
A rearrangement of the time bands sheds more light on the repricing transformation activity of Belgian banks. Chart 6 presents the simplifi ed gap report, aggregating on- and off-blance-sheet positions and grouping slected time band, to provide a clearer view of the repric-ing transformation role of banks (average gap report 1993 :Q1-2003 :Q4). Given that the two middle time bands approximately offset each other, the chart sug-gests that Belgian banks mainly fi nance net long assets such as mortgages and Belgian government bonds with sight deposits and net indeterminate liabilities (which roughly equal total savings deposits in size). Of course, the two middle bands do not offset each other exactly and some of the net liabilities up to one month may fi nance net long assets over one year. Also, the net indeterminate liabilities do not necessarily equal savings deposits. But if one is willing to make these assump-tions for simplicity, two separate areas in the repricing schedule emerge.
The two inner time bands in Chart 6 refl ect the activity of banks in money markets and with large corporates (time advances, time deposits) and suggest that the inter-est rate risk exposure for the positions until one year is rather limited. The two outer time bands in Chart 6 refl ect
the core business bank activity of attracting deposits to fi nance long-term assets. While the two outer time bands appear to suggest a large mismatch, the key to assess-ing the exposure to interest rate risk requires computing the effective or behavioural duration of sight and savings deposits. Despite a contractual maturity of basically zero for sight and savings deposits (being withdrawable on demand), both these types of deposits are referred to in the literature as non-defi ned-maturity deposits, since their effective maturity is not unambiguously defi ned, and is likely to substantially exceed the contractual maturity in normal market circumstances.
How should the effective duration of deposits be treated? Should deposits be tranched out over a number of months, quarters, or years or should the stable base be assigned to the long-term time band and the residual to the overnight time band ? The answers to these impor-tant questions will depend on the view one holds, and they have led to controversy between standard setters, the industry, and supervisors in the recent IAS 39 debate. Indeed, in their risk management practices, bankers assume this behavioural duration to be relatively long (typically several years), refl ecting a going concern view of the bank that net long assets are fi nanced with a stable
–20 –15 –10 –5 10 15 200 5
CHART 6 SIMPLIFIED AGGREGATED GAP REPORT FOR THE BELGIAN BANKING SECTOR
(Average aggregated gap report, from the first quarter 1993 to the last quarter 2003, percentages of total assets)
Indeterminante
Sight deposits
Up to 8 days minus sight deposits
8 days to 1 month
1 to 3 months
3 to 6 months
6 to 12 months
1 to 2 years
2 to 5 years
5 to 10 years
Over 10 years
NET ASSETS
NET LIABILITIESUp to 1 month – sight deposits
Indeterminate + sight deposits
Over 1 year
1 month to 1 year
Source : NBB.

171
INTEREST RATE RISK IN THE BELGIAN BANKING SECTOR
base of core interest rate insensitive deposits (23). Instead, some standard setters argue that the behavioural duration is substantially smaller in certain interest rate scenarios and that it lies closer to the contractual duration of sight and savings deposits. In the extreme, standard setters consider all balances to be overnight and very rate sensi-tive, refl ecting a liquidation view of the bank. Prudential supervisors fall mostly in between these two extreme viewpoints. For example, they argue that in today’s low interest rate environments deposits partially refl ect funds sheltered from a less buoyant stock market. As interest rates increase, these funds will move to more produc-tive investments, either in or outside of the bank. This suggests that the assumptions about the stable portion of deposits should be carefully reviewed and attention should be paid so that the risk sensitivity of deposits is not understated.
In the end, the allocation of instruments with an undeter-mined time to maturity to a specifi c time band remains an art as well as a science.
3.4 Deposit accounts and their embedded options
Deposit accounts constitute an important portion of the funding sources of a bank (see Table 2 above). Hence, both their volume and pricing potentially has a large impact on the interest rate risk exposure of a bank. While a deposit account looks like a fairly simple fi nancial instru-ment, embedded options are attached that render their modelling and valuation complex.(24)
First, the depositor holds the option to withdraw all or part of the balance in the account at par. This withdrawal option poses a signifi cant risk for any bank, given that it is generally exercised to the advantage of the holder, i.e. to the detriment of the bank. For example, when interest rate increases make depositors withdraw some of their funds to invest them at higher returns (and in the case where these withdrawals exceed reserves), a bank may need to sell off some of the long assets at a considerable loss or replace the cheap deposit fi nancing with more costly alternatives. Of course, when a bank expects higher savings deposits withdrawals in the future due to higher interest rates, it can defend itself by buying put options or caps on the banking book portfolio securities. While the annual growth rate of savings deposits over the last ten years has been a sound 10.7 p.c. on average (exceeding the 4.7 p.c. annual average growth rate of total Belgian liabilities by far), the total amount of savings deposits between December 1999 and December 2000 did decrease by 5.9 billion euro, i.e. –5.9 p.c. of total savings deposits at that time.
Second, banks hold the option to set the interest rate that they pay to savings deposits holders, i.e. the deposit rate. They change this deposit rate at their own discre-tion, its movements being largely driven by competition and internal cost factors.(25) Stylised facts about deposit rates include the following (Van den Spiegel (1993) and O’Brien (2000)) :– Below-market rates are typically paid even after
accounting for non-interest costs net of fees.– Deposit rates exhibit substantial stickiness.– Deposit rate adjustments tend to be asymmetric, dis-
playing rigidity when market rates are increasing (so that rate spreads become larger), and fl exibility when market rates are decreasing (so that rate spreads become smaller).
Deposited funds below a certain threshold are risk-free, given the existing Belgian deposit insurance scheme.(26) Yet, they pay rates that are typically lower than the corresponding risk-free rates. The market value of a fi nancial instrument that pays less than the rate on a comparable-risk investment will refl ect this arbitrage opportunity. Normally, such arbitrage opportunities are quickly eliminated by competition as other banks enter this lucrative market and start to bid up the price. However, the market for deposit accounts is not an active one like that for other liabilities such as bonds or equity, and substantial market power exists in retail deposit markets (Hutchison and Pennacchi (1996), Ausubel (1991) and Van den Spiegel (1993)). There are also regulatory barriers to entry, since one cannot simply start issuing deposits to arbitrage away the profi t (Jarrow and van Deventer (1998)). The spread between what a bank might receive from investing the deposited funds at the risk-free rate and what a bank has to pay to the deposit holders (the deposit rate and the servicing cost) is called an eco-nomic rent in the literature (see Jarrow and van Deventer (1998)). As a result of the existence of economic rents, the market value of deposit account balances typically lies below par (Selvaggio (1996)). In other words, each
(23) The banks argue that the dispersion of savers reduces the likelihood of a sudden withdrawal in the absence of a systemic crisis, and argue that deposit insurance and emergency liquidity assistance allow to avoid such a systemic crisis. This article does not deal with the liquidity risk exposure of banks, but focuses only on the interest rate risk exposure.
(24) Moreover, deposit accounts also offer important payment services to their holder which are equally diffi cult to price.
(25) Note that the maximum retail deposit rate in Belgium has been regulated and legally capped at 4 p.c. from 1986 onwards. This cap concerns the base rate only, and not the growth premium (that is paid on every new amount left on an account during a well-defi ned period) nor the loyalty or fi delity premium (that is paid to each deposit left on an account during a specifi ed period). These premia are also capped at 2 p.c. Note that the deposit rate on sight deposits balances is currently very low, 0.5 p.c., and typically remains unchanged, irrespective of market rate dynamics.
(26) In Belgium, deposit balances enjoy a state guarantee up to a specifi c coverage limit per customer of 20,000 euro, which is applied to the sum of a depositor’s accounts at a failed bank (but no longer to each account separately). For a historical review of deposit insurance in Belgium and in Europe, see Garcia and Prast (2004).
172
Box 3 – Deposit account modeling
In this Box, we briefl y review the literature on deposit account modeling. With respect to the setting of deposit rates, two modeling approaches are used. It is either assumed that the bank is able to reset the deposit rate each period to maximise the present value of the balances (as in Hutchinson and Pennacchi (1996)), or that it resets the deposit rate periodically to obtain a target margin (as in Selvaggio (1996)). Van den Spiegel (1993) presents anecdotical evidence that deposit rate setting was used by Belgian banks to stabilise the global interest rate margin of the bank, so as to safeguard their important economic role as maturity transformers. Competition amongst banks shifted to providing services to the customers, which in turn led to the phenomenon of overbanking.
With respect to the modeling of deposit balance dynamics and their sensitivity to interest rate changes, there are roughly two methodologies available in the public domain. In the option-adjusted spread approach (Selvaggio (1996), OTS (2001) and Goosse et al. (1999)) expected cash fl ows are discounted using a discount rate that refl ects their riskiness, due to the option risk. The main concern is to estimate the appropriate spread, referred to as the option-adjusted spread (OAS), which is added to the riskfree rate such that the present value of expected cash fl ows calculated over many different interest rate paths equals the observed market value. The market value of the deposit account is its face value minus the discounted present value of its economic rents. Typically the discount rate is assumed to be LIBOR plus the option-adjusted spread.
The idea in the contingent claim or arbitrage-free valuation approach (see Hutchison and Pennacchi (1996), Jarrow and van Deventer (1998), Janosi et al. (1999), O’Brien (2000), and Dermine (2003)) is to discount at the risk-free rate, but after adjusting the expected cash fl ows by subtracting a risk premium. Put differently, certainty-equivalent cash fl ows are discounted at the risk-free rate. The embedded options are modeled explicitly using option-pricing techniques. Future deposit account balances are a function of the path of future interest rates. The present value is calculated for a stream of cash fl ows over different interest rate paths, taking into account how the cash fl ows will vary as interest rates change. This is usually accomplished using a Monte Carlo simulation.
!
euro of generated deposits creates shareholder value for the bank.(27)
To assess the behavior and cash fl ows of fi nancial instru-ments with embedded options in different interest rate environments, relatively more complicated approaches need to be applied to a more detailed breakdown of fi nancial instruments. Box 3 provides a brief literature review. Embedded options complicate considerably the assessment of the interest rate risk exposure of the deposit-taking institution as a whole.(28) They also raise signifi cant challenges for those needing to supervise the risk in banks’ balance sheets. In fact, the complexity of measuring the impact of embedded options in deposit accounts was one factor in the decision not to adopt formal capital requirements for bank’s non-trading posi-tions (Fed (1995)). The general supervisory approach to the measurement of interest rate risk is discussed in Section 4, to which we now turn.
4. Supervision of interest rate risk and the Basel II Accord
Ultimately, it is up to the capital owners of the bank to decide how much interest rate risk exposure they would like to assume. The responsibility of the supervisory authorities is to protect depositors and debt holders against excessive risk-taking by the bank. This section describes the general supervisory framework for measuring and monitoring inter-est rate risk exposures of banks.
(27) The present value of all future economic rents is non-zero. Indeed, banks typically pay premia when acquiring core deposits from other banks. A US study in Bank Mergers & Acquisitions (March 1995 issue) shows evidence of 49 core deposit transactions completed between February 4 and March 3 1995, and reports that the average premium paid was 10.17 p.c. of deposit balances (ranging from a low of 0.3 p.c. to a high of 27.1 p.c.).
(28) Within the framework of this article, we have chosen not to discuss other important balance sheet items with embedded options, such as bonds with call or put provisions and mortgage loans that allow borrowers to repay the balance early, with or without penalty. Mortgage early repayments occur for both economic and demographic reasons. Economic reasons may include interest rates decreasing suffi ciently for refi nancing to become profi table and demographic reasons may include home-owners moving to another region, divorcing, trading-up to a bigger house, or dying. In the US, the rate of demographic early repayments hovers around a constant percentage (about 6 p.c. per year), while the rate of economic early repayments can be substantially larger, up to 50 p.c. per annum when interest rates drop by 500 basis points or more (Uyemura and van Deventer, 1994).
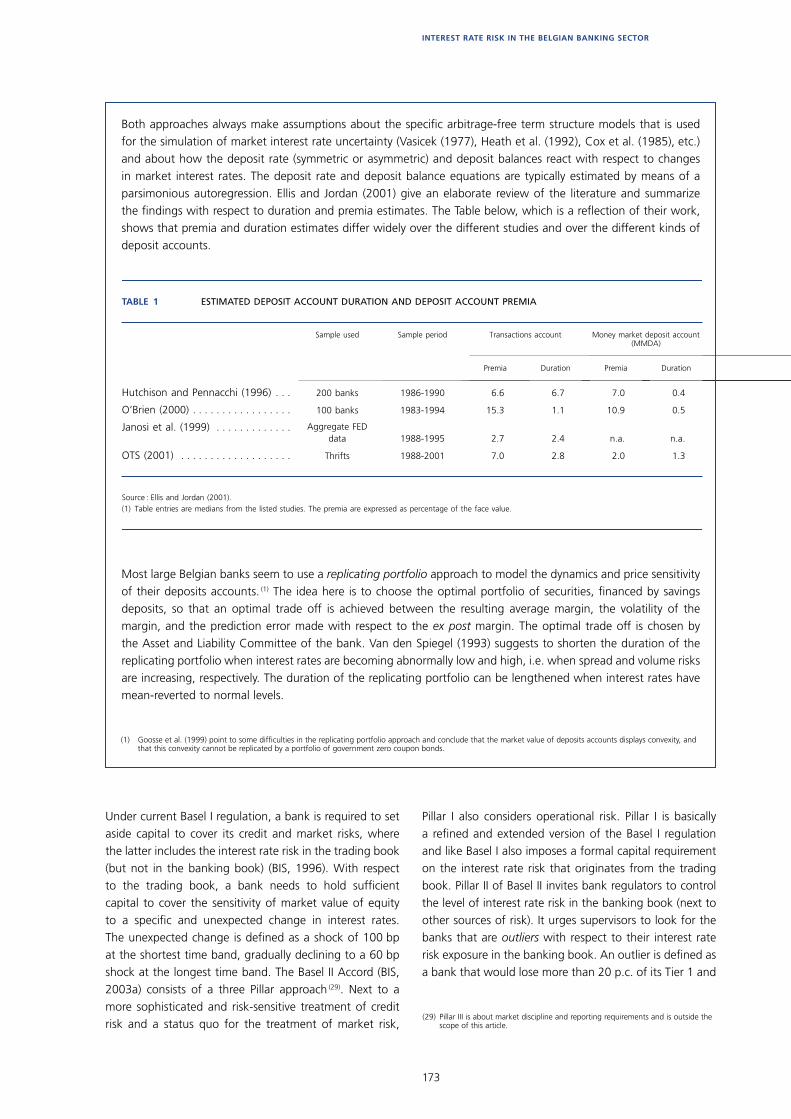
173
INTEREST RATE RISK IN THE BELGIAN BANKING SECTOR
TABLE 1 ESTIMATED DEPOSIT ACCOUNT DURATION AND DEPOSIT ACCOUNT PREMIA
Source : Ellis and Jordan (2001).(1) Table entries are medians from the listed studies. The premia are expressed as percentage of the face value.
Sample used Sample period Transactions account Money market deposit account (MMDA)
Premia Duration Premia Duration
Hutchison and Pennacchi (1996) . . . 200 banks 1986-1990 6.6 6.7 7.0 0.4
O’Brien (2000) . . . . . . . . . . . . . . . . . 100 banks 1983-1994 15.3 1.1 10.9 0.5
Janosi et al. (1999) . . . . . . . . . . . . . Aggregate FED data 1988-1995 2.7 2.4 n.a. n.a.
OTS (2001) . . . . . . . . . . . . . . . . . . . Thrifts 1988-2001 7.0 2.8 2.0 1.3
Both approaches always make assumptions about the specifi c arbitrage-free term structure models that is used for the simulation of market interest rate uncertainty (Vasicek (1977), Heath et al. (1992), Cox et al. (1985), etc.) and about how the deposit rate (symmetric or asymmetric) and deposit balances react with respect to changes in market interest rates. The deposit rate and deposit balance equations are typically estimated by means of a parsimonious autoregression. Ellis and Jordan (2001) give an elaborate review of the literature and summarize the fi ndings with respect to duration and premia estimates. The Table below, which is a refl ection of their work, shows that premia and duration estimates differ widely over the different studies and over the different kinds of deposit accounts.
Most large Belgian banks seem to use a replicating portfolio approach to model the dynamics and price sensitivity of their deposits accounts. (1) The idea here is to choose the optimal portfolio of securities, fi nanced by savings deposits, so that an optimal trade off is achieved between the resulting average margin, the volatility of the margin, and the prediction error made with respect to the ex post margin. The optimal trade off is chosen by the Asset and Liability Committee of the bank. Van den Spiegel (1993) suggests to shorten the duration of the replicating portfolio when interest rates are becoming abnormally low and high, i.e. when spread and volume risks are increasing, respectively. The duration of the replicating portfolio can be lengthened when interest rates have mean-reverted to normal levels.
(1) Goosse et al. (1999) point to some diffi culties in the replicating portfolio approach and conclude that the market value of deposits accounts displays convexity, and that this convexity cannot be replicated by a portfolio of government zero coupon bonds.
Under current Basel I regulation, a bank is required to set aside capital to cover its credit and market risks, where the latter includes the interest rate risk in the trading book (but not in the banking book) (BIS, 1996). With respect to the trading book, a bank needs to hold suffi cient capital to cover the sensitivity of market value of equity to a specifi c and unexpected change in interest rates. The unexpected change is defi ned as a shock of 100 bp at the shortest time band, gradually declining to a 60 bp shock at the longest time band. The Basel II Accord (BIS, 2003a) consists of a three Pillar approach (29). Next to a more sophisticated and risk-sensitive treatment of credit risk and a status quo for the treatment of market risk,
Pillar I also considers operational risk. Pillar I is basically a refi ned and extended version of the Basel I regulation and like Basel I also imposes a formal capital requirement on the interest rate risk that originates from the trading book. Pillar II of Basel II invites bank regulators to control the level of interest rate risk in the banking book (next to other sources of risk). It urges supervisors to look for the banks that are outliers with respect to their interest rate risk exposure in the banking book. An outlier is defi ned as a bank that would lose more than 20 p.c. of its Tier 1 and
(29) Pillar III is about market discipline and reporting requirements and is outside the scope of this article.
174
Box 4 – Principles to be used by supervisors in evaluating the interest rate risk management of banks
The principles below represent a selection of the 15 principles that have been issued by the Basel Committee on Banking supervision (BCBS, 2003b) in order to help supervisors in their assessment of the adequacy and the effectiveness of a bank’s interest rate risk management, in assessing the banking book interest rate risk exposure, and in developing an adequate supervisory response to that risk.
Risk measurement, monitoring and control functions– It is essential that banks have interest rate risk measurement systems that capture all material sources of interest rate
risk and that assess the effect of interest rate changes in ways that are consistent with the scope of their activities. The assumptions underlying the system should be clearly understood by risk managers and bank management.
– Banks must establish and enforce operating limits and other practices that maintain exposures within levels consistent with their internal policies.
Tier 2 capital due to a specifi c stress scenario (200 basis point shift of the fl at yield curve or an equivalent sce-nario). Basel II does not impose specifi c rules about the behavioural assumptions that underlie the above test. Specifi cally, it does not impose detailed rules on how to treat deposit accounts. National supervisors will have the discretion to require additional capital or a reduction in the risk profi le by imposing a hedge (for example, impose the purchase of a cap) on outlier banks that run excessive banking book interest rate risk.
The Belgian supervisory authority, i.e. the Banking, Finance, and Insurance Commission (BFIC), employs a threefold approach to the supervision of interest rate risk in the bank-ing book. First, the BFIC computes interest rate risk ratios on a quarterly frequency and based on gap reports of indi-vidual banks on a solo basis, where the ratios compare the sum of weighted net mismatches over all time band against measures of capital and earnings. The weights applied to the gaps or mismatches are proxies for the modifi ed dura-tion of the different net asset and liability portfolios. Banks with ratios that exceed certain thresholds are defi ned as outliers. The resulting ratios are used as detection devices only and not as thresholds that automatically trigger extra capital requirements. The supervisor is well aware of the possible drawbacks and of the potential risks that might remain concealed when using repricing tables and gap reports. However, gap reports remain simple tools that may be used to assess possible mismatches within banks’ bal-ance sheets. The main advantage of the existing approach is its consistent comparison across banks. Second, outliers trigger on-site inspections to check more accurately with the bank’s own data whether or not the bank is exposed to excessive interest rate risk in the banking or trading book. Possibly further prudential measures can be and have
been taken, following constructive dialogue between the BFIC and the bank under consideration. The BFIC asks the concerned banks to compute the duration of their assets and liabilities using detailed product information about cash fl ows and time of maturity. In addition, they provide the banks with specifi c assumptions and parameters, amongst others with respect to the assumed interest rate change and the duration of savings deposits (30). For those banks where a specifi c duration gap threshold is exceeded between assets and liabilities, a specifi c extra capital charge is required by the BFIC. Third, the BFIC also regularly assesses the adequacy and effectiveness of a bank’s interest rate risk management and the quality of risk measurement, monitoring and control functions, based on general princi-ples issued by the Basel Committee of Banking Supervision (BIS, 2003b), of which a selection is reproduced in Box 4.
5. Concluding remarks
Banks fi nance their assets by means of liabilities with dif-ferent maturity, duration, and repricing characteristics. This transformation activity of banks meets an important need in any economy, but potentially leads to the expo-sure of a bank’s net interest income and market value of equity to unexpected changes in interest rates. Ultimately, banks do so because they expect to earn an extra return or risk premium from lending at a long rate and borrow-ing at a short rate (yield spreads are incomplete measures of excess returns and neglect the riskiness behind mis-matching strategies). Moreover, because no bank is able
!
(30) The BFIC asks banks to assign the savings deposits to the “6 to 12 month” time band. For its own interest rate risk assessment, the BFIC in fact considers several assumptions about the risk weights, the distribution of savings deposits across the repricing schedule, and the assumed interest rate shock, where it takes care to remain consistent over all institutions in each scenario.
175
INTEREST RATE RISK IN THE BELGIAN BANKING SECTOR
to systematically outguess market expectations, it is risk premia and not interest rate expectations that should drive the maturity and repricing mismatches of banks. However risk premia are not stable through time, but fl uctuate widely in ways that cannot easily be linked to variables such as the level of current interest rates and economy-wide variables. While the statistical properties of risk premia can be captured by modern state-of-the-art term structure models, an economic explanation is still lacking and stands as a challenge for fi nance researchers.
This paper has presented estimates for the interest rate risk exposure of the aggregate Belgian banking sector, both from a liquidation perspective and going concern perspective. The average ratio of net interest income to total income seems to have declined slowly over the last ten years refl ecting disintermediation, although important differences between large, medium-size, and small banks can be distinguished in the dynamics and level of this ratio. In line with results for other countries, this paper fi nds that the statistical evidence about the interest rate determinants of changes in Belgian net interest income is not clear-cut, possibly refl ecting the fact that net interest income captures a lot more than what is generated by the maturity transformation role of banks. The impact of
current accounting practices that allow banks to smooth their income through shifting securities from the trading book to the banking book at their discretion might also be important. In this respect, one of the objectives pur-sued by IAS 39 is to increase the transparency of banks’ risk-taking.
The repricing gap report of the aggregate banking sector allows us to identify the main interest rate risk exposure of Belgian banks. The inner time bands refl ect the activ-ity of banks in the money market and with large corpora-tions and suggest a rather limited interest rate risk expo-sure, notwithstanding the fact that off-balance-sheet instruments typically increase the existing mismatch in this part of the repricing schedule. The outer time bands of the gap report refl ect the core activity of Belgian banks of taking sight and savings deposits to fi nance long term assets. The interest rate risk exposure is sizeable, despite the fact that off-balance-sheet instruments typi-cally reduce the level of the individual on-balance-sheet mismatch in this range of the repricing schedule. To the extent that deposit balances have a behavioural dura-tion that signifi cantly exceeds their contractual duration, interest rate risk exposure may still be limited. However, in today’s low interest rate environment, deposits at
– Banks should measure their vulnerability to loss under stressful market conditions – including the breakdown of key assumptions – and consider those results when establishing and reviewing their policies and limits for interest rate risk.
– Banks must have adequate information systems for measuring, monitoring, controlling and reporting interest rate exposures. Reports must be provided on a timely basis to the bank’s board of directors, senior management and where appropriate, individual business line managers.
Information for supervisory authorities– Supervisory authorities should obtain from banks suffi cient and timely information with which to evaluate
their level of interest rate risk. This information should take appropriate account of the range of maturities and currencies in each bank’s portfolio, including off-balance-sheet items, as well as other relevant factors, such as the distinction between trading and non-trading activities.
Capital adequacy– Banks must hold capital commensurate with the level of interest rate risk they undertake.
Supervisory treatment of interest rate risk in the banking book– Supervisory authorities must assess whether the internal measurement systems of banks adequately capture the
interest rate risk in their banking book. If a bank’s internal measurement system does not, banks must bring the system to the required standard. To facilitate supervisors’ monitoring of interest rate risk exposures across institutions, banks must provide the results of their internal measurement systems, expressed in terms of the threat to economic value, using a standardised interest rate shock.
– If supervisors determine that a bank is not holding capital commensurate with the level of interest rate risk in the banking book, they should consider remedial action, requiring the bank either to reduce its risk, to hold a specifi c additional amount of capital, or a combination of both.

176
least partially refl ect funds sheltered from a less buoy-ant stock market. As interest rates increase, these funds may move to more productive investments either in or outside of the bank, leaving the bank exposed to higher fi nancing costs. In this respect, assumptions about the stable portion of deposits deserve careful review, so as not to understate the risk sensitivity of savings deposits in specifi c interest rate scenarios.
177
INTEREST RATE RISK IN THE BELGIAN BANKING SECTOR
References
Arrow, K., and G. Debreu (1954), “Existence of an Equilibrium for a Competitive Economy”, Econometrica, 22, pp. 265-290.
Ausubel, L. (1991), “The Failure of Competition in the Credit Card Market”, American Economic Review, 81, 1, pp. 50-81.
Bekaert, G. and R. Hodrick (2001), “Expectations Hypothesis Tests”, Journal of Finance, 56, pp. 1357-1397.
BIS (1996), “Amendment to the Capital Accord to Incorporate Market Risk”, Basel Committee on Banking Supervision, Bank for International Settlements, www.bis.org.
BIS (2003a), “The New Basel Capital Accord”, Basel Committee on Banking Supervision, Bank for International Settlements, www.bis.org.
BIS (2003b), “Principles for the Management and Supervision of Interest Rate Risk”, Basel Committee on Banking Supervision, Bank for International Settlements, September, www.bis.org.
Campbell, J. and R. Shiller (1991), “Yield Spreads and Interest Rate Movements : A Bird’s Eye View”, Review of Economic Studies, 58, pp. 495-514.
Calomiris, C. and C. Kahn (1991), “The Role of Demandable Debt in Structuring Optimal Banking Arrangements”, American Economic Review, 81, pp. 497-513.
Campbell, J., A. Lo, and C. MacKinlay (1997), The Econometrics of Financial Markets, Princeton University Press.
Cox, J., J. Ingersoll, and S. Ross (1985), “A Theory of the Term Structure of Interest Rates”, Econometrica, 53, 2, pp. 385-406.
Dai, Q. and K. Singleton (2000), “Specifi cation Analysis of Affi ne Term Structure Models”, Journal of Finance, 55, 5, 1943-1978.
Dai, Q. and K. Singleton (2002), “Expectations Puzzles, Time-Varying Risk Premia, and Dynamic Models of the Term Structure”, Journal of Financial Economics, 63, 3.
Dermine, J. (2003), “ALM in Banking”, Working Paper, INSEAD.
Diamond, D. (1984), “Financial Intermediation and Delegated Monitoring”, Review of Economic Studies, 51, pp. 393-414.
Diamond, D. and P. Dybvig (1983), “Bank Runs, Deposit Insurance, and Liquidity”, Journal of Political Economy, 91, pp. 401-419.
Diamond, D. and R. Rajan (2001), “Liquidity Risk, Liquidity Creation and Financial Fragility : A Theory of Banking”, Journal of Political Economy, 109, pp. 287-327.
ECB (2004), “Fair Value Accounting and Financial Stability”, April, Occasional Paper, No. 13.
English, W. B. (2002), “Interest Rate Risk and Bank Net Interest Margins”, BIS Quarterly Review, December, pp. 67-82.
Fama, E. (1984), “The Information in the Term Structure”, Journal of Financial Economics, 13, 4, pp. 509-528.

178
Fama, E. and R. Bliss (1987), “The Information in Long-Maturity Forward Rates”, American Economic Review, 77, 4, pp. 680-692.
Federal Reserve (1995), “Risk-based Capital Standards : Interest Rate Risk”, R-0802.
Garcia, G. and H. Prast (2004), “Depositor and Investor Protection in the EU and the Netherlands : A Brief History”, De Nederlandsche Bank.
Goosse, P., P. Grégoire, I. Platten (1999), “Interest Rate Risk in Non-Maturity Banking Products : Implied Options in Savings Accounts”, mimeo, Université de Namur.
Gorton, G. and G. Pennacchi (1992), “Financial Intermediaries and Liquidity Creation”, Journal of Finance, 45, pp. 49-71.
Heath, D., R. Jarrow and A. Morton (1992), “Bond Pricing and the Term Structure of Interest Rates : A New Methodology for Contingent Claim Valuation”, Econometrica, 60, pp. 77-106.
Hutchison, D.E., and G.G. Pennacchi (1996), “Measuring Rents and Interest Rate Risk in Imperfect Financial Markets : The Case of Retail Bank Deposits”, Journal of Financial and Quantitative Analysis, 31, 3, pp. 399-417.
IASB (2004), “Amendments to IAS 39 Financial Instruments : Recognition and Measurement”, Exposure Draft International Accounting Standards Board, April 21, www.iasb.org.
Janosi, T., R. Jarrow, and F. Zullo (1999), “An Empirical Analysis of the Jarrow-van Deventer Model for Valuing Non-Maturity Deposits”, Journal of Derivatives, 7, pp. 8-31.
Jarrow, R. and D. van Deventer (1998), “The Arbitrage-Free Valuation and Hedging of Demand Deposits and Credit Card Loans”, Journal of Banking and Finance, 22, pp. 249-272.
Kashyap, A., R. Rajan, and J. Stein (2002), “Banks as Liquidity Providers : An Explanation for the Coexistence of Lending and Deposit-Taking”, Journal of Finance, 57, 1, pp. 33-73.
Maes, K. (2003), “Modeling the Term Structure of Interest Rates Across Countries”, Ph.D. Dissertation Series No.172, Faculty of Applied Economics and Economics, Catholic University of Leuven.
Maes, K. (2004), “Modeling the Term Structure of Interest Rates : Where Do We Stand?”, National Bank of Belgium, Working Paper No. 42, Research Series.
Mester, L., L. Nakamura, and M. Renault (2001), “Checking Accounts and Bank Monitoring”, FRB of Philadelphia, working paper No. 01-3
Miller, M. and Modigliani, F. (1958), “The Cost of Capital, Corporation Finance, and the Theory of Investment”, American Economic Review, 48, pp. 261-297.
O’Brien, J.M. (2000), “Estimating the Value and Interest Rate Risk of Interest-Bearing Transactions Deposits”, working paper, Board of Governors of the Federal Reserve.
OCC (1989), “An Overview of Interest Rate Risk”, Offi ce of the Comptroller of the Currency, Staff Paper, December.
OTS (2001), “The OTS Net Portfolio Value Model”, Offi ce of Thrift Supervision, mimeo.
Selvaggio, R. (1996), “Using the OAS Methodology to Value and Hedge Commercial Bank Retail Demand Deposit Premiums”, Handbook of Asset/Liability Management, F. Fabozzi and A. Knoishi, eds., pp. 363-373.

179
INTEREST RATE RISK IN THE BELGIAN BANKING SECTOR
Uyemura, D. and D. van Deventer (1994), “Financial Risk Management in Banking : The Theory and Application of Asset and Liability Management”, Bankers and Probus Publishing Companies, Chicago Illinois, Cambridge England.
Van den Spiegel, F. (1993), “De Problematiek van de Spaardeposito’s in België in het Kader van de EMU en de Deregulering : het Asset Liability Management”, De Spaarbanken, april, 9, pp. 47-86.
Vasicek, O. (1977), “An Equilibrium Characterization of the Term Structure”, Journal of Financial Economics, 5, pp. 177-188.
White, H. (1980), “A Heteroskedasticity-consistent Covariance Matrix Estimator and a Direct Test for Heteroskedasticity”, Econometrica, 48, pp. 817-838.
181
IMPACT OF IAS 39 ON ASSET AND LIABILITY MANAGEMENT AND BANKS’ CAPITAL RATIOS
David Guillaume
1. Introduction
By 2005, credit institutions presenting consolidated accounts will most probably have to apply International Accounting Standards (IAS), and more particularly IAS 39 on the recognition and measurement of fi nancial instru-ments. (1) The introduction of IAS 39 substantially modifi es the accounting framework within which credit institutions have to work. The standard requires fair value account-ing for all forward transactions in interest rates (hereafter “derivatives”) and for a considerable proportion of the interest-bearing assets, and even liabilities. These fi nancial instruments are often recorded “at amortised cost” under the Belgian accounting rules. IAS 39 will therefore imply higher volatility in reported net income (profi t and loss account) and equity of credit institutions.
The likely increase in the volatility of reported net income and equity is generating much discussion among credit institutions. (2) The latter argue that this volatility is not necessarily representative of their interest rate risk, so that it could mislead annual accounts users. One of the essential concerns expressed by the banking sector is that banks want to be able to limit the volatility of the reported net income by continuing to manage their interest rate risk (hereafter referred to as their “ALM” position) on the basis of the economic risk, rather than according to the accounting impact of changes in inter-est rates. Indeed, the objective of interest rate risk man-agement, or ALM, should be to manage the volatility of the market value of equity and of the future interest rate margin of a credit institution. (3)
Impact of IAS 39 on asset and liability management and banks’ capital ratios
Another point of concern for the sector is the volatility of the accounting equity caused by IAS 39 and the way in which it will affect the regulatory capital ratios. Regulators have yet to decide on which basis to set minimum capital requirements, hence the impact on the regulatory capital ratios will depend on the policies to be adopted by the regulators on this matter.
This article does not intend to list the arguments for or against the new IAS standards. Rather, its objective is to demonstrate how a credit institution may manage the volatility of its reported net income without changing its asset and liability management (ALM) and what the impli-cations of IAS 39 may be for banks’ capital ratios.
The remainder of the paper is organised as follows. Section 2 is devoted to a description of the main implica-tions of IAS 39. Section 3 illustrates the impact of IAS 39 on ALM. Section 4 discusses the impact of IAS 39 on the calculation of regulatory capital. Section 5 presents the main conclusions.
(1) In case IAS 39 is not adopted at the European level, Belgian credit institutions will still be allowed to apply it on a voluntary basis. However, it seems very likely that the EU endorsement process will be fi nalised in time. The formal steps and timetable of the EC endorsement process are explained in ECB (2004a).
(2) See Chisnall (2000) and Joint Working Group of Banking Associations on Financial Instruments (1999) for the arguments that have been raised by the industry against more fair value accounting in banks’ fi nancial reporting.
(3) This article focuses on market value of equity at risk and not on net interest income at risk. For a more conceptual discussion of these concepts and Belgian banking sector evidence, see the article ”Interest Rate Risk in the Belgian Banking Sector” in this Financial Stability Review.
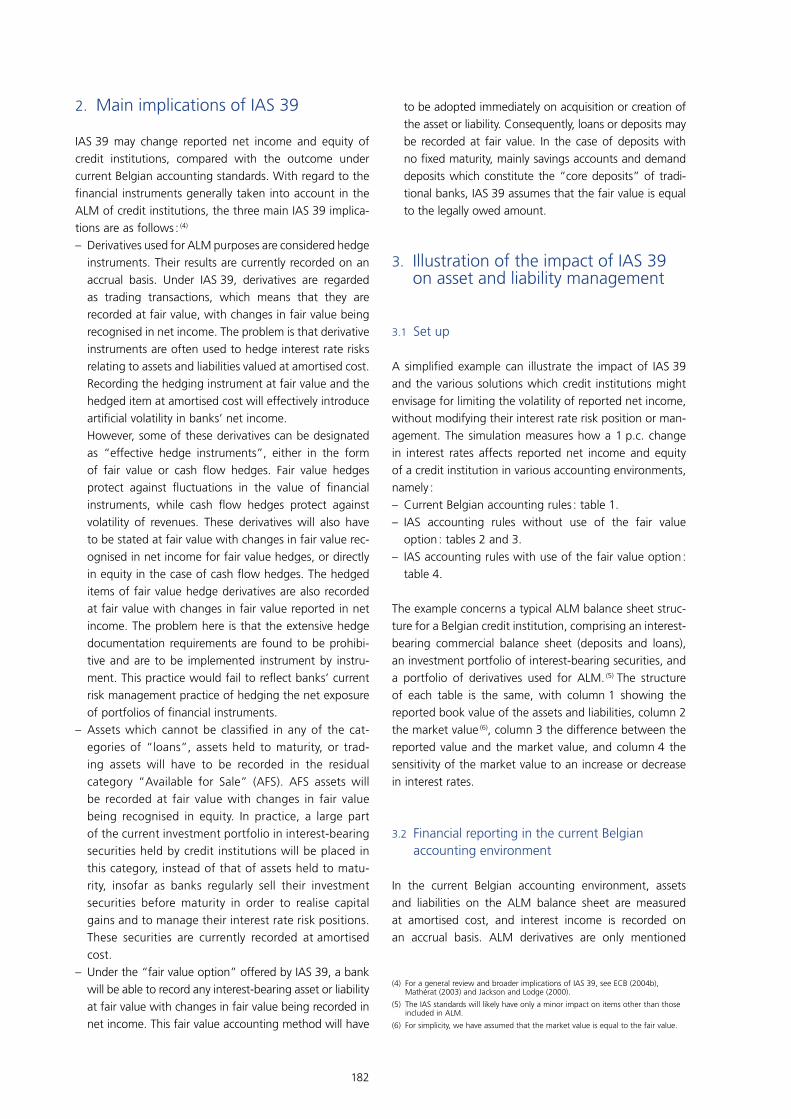
182
2. Main implications of IAS 39
IAS 39 may change reported net income and equity of credit institutions, compared with the outcome under current Belgian accounting standards. With regard to the fi nancial instruments generally taken into account in the ALM of credit institutions, the three main IAS 39 implica-tions are as follows : (4)
– Derivatives used for ALM purposes are considered hedge instruments. Their results are currently recorded on an accrual basis. Under IAS 39, derivatives are regarded as trading transactions, which means that they are recorded at fair value, with changes in fair value being recognised in net income. The problem is that derivative instruments are often used to hedge interest rate risks relating to assets and liabilities valued at amortised cost. Recording the hedging instrument at fair value and the hedged item at amortised cost will effectively introduce artifi cial volatility in banks’ net income.
However, some of these derivatives can be designated as “effective hedge instruments”, either in the form of fair value or cash fl ow hedges. Fair value hedges protect against fl uctuations in the value of fi nancial instruments, while cash fl ow hedges protect against volatility of revenues. These derivatives will also have to be stated at fair value with changes in fair value rec-ognised in net income for fair value hedges, or directly in equity in the case of cash fl ow hedges. The hedged items of fair value hedge derivatives are also recorded at fair value with changes in fair value reported in net income. The problem here is that the extensive hedge documentation requirements are found to be prohibi-tive and are to be implemented instrument by instru-ment. This practice would fail to refl ect banks’ current risk management practice of hedging the net exposure of portfolios of fi nancial instruments.
– Assets which cannot be classifi ed in any of the cat-egories of “loans”, assets held to maturity, or trad-ing assets will have to be recorded in the residual category “Available for Sale” (AFS). AFS assets will be recorded at fair value with changes in fair value being recognised in equity. In practice, a large part of the current investment portfolio in interest-bearing securities held by credit institutions will be placed in this category, instead of that of assets held to matu-rity, insofar as banks regularly sell their investment securities before maturity in order to realise capital gains and to manage their interest rate risk positions. These securities are currently recorded at amortised cost.
– Under the “fair value option” offered by IAS 39, a bank will be able to record any interest-bearing asset or liability at fair value with changes in fair value being recorded in net income. This fair value accounting method will have
to be adopted immediately on acquisition or creation of the asset or liability. Consequently, loans or deposits may be recorded at fair value. In the case of deposits with no fi xed maturity, mainly savings accounts and demand deposits which constitute the “core deposits” of tradi-tional banks, IAS 39 assumes that the fair value is equal to the legally owed amount.
3. Illustration of the impact of IAS 39 on asset and liability management
3.1 Set up
A simplifi ed example can illustrate the impact of IAS 39 and the various solutions which credit institutions might envisage for limiting the volatility of reported net income, without modifying their interest rate risk position or man-agement. The simulation measures how a 1 p.c. change in interest rates affects reported net income and equity of a credit institution in various accounting environments, namely :– Current Belgian accounting rules : table 1.– IAS accounting rules without use of the fair value
option : tables 2 and 3.– IAS accounting rules with use of the fair value option :
table 4.
The example concerns a typical ALM balance sheet struc-ture for a Belgian credit institution, comprising an interest-bearing commercial balance sheet (deposits and loans), an investment portfolio of interest-bearing securities, and a portfolio of derivatives used for ALM. (5) The structure of each table is the same, with column 1 showing the reported book value of the assets and liabilities, column 2 the market value (6), column 3 the difference between the reported value and the market value, and column 4 the sensitivity of the market value to an increase or decrease in interest rates.
3.2 Financial reporting in the current Belgian accounting environment
In the current Belgian accounting environment, assets and liabilities on the ALM balance sheet are measured at amortised cost, and interest income is recorded on an accrual basis. ALM derivatives are only mentioned
(4) For a general review and broader implications of IAS 39, see ECB (2004b), Mathérat (2003) and Jackson and Lodge (2000).
(5) The IAS standards will likely have only a minor impact on items other than those included in ALM.
(6) For simplicity, we have assumed that the market value is equal to the fair value.
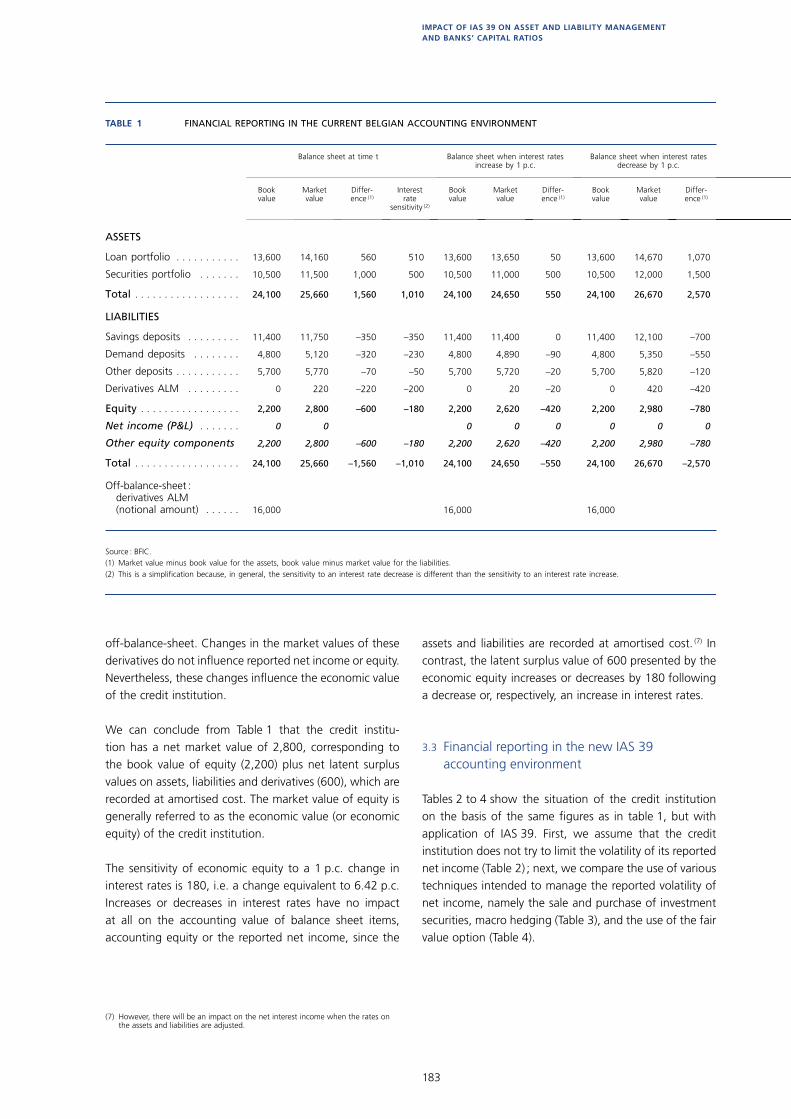
183
IMPACT OF IAS 39 ON ASSET AND LIABILITY MANAGEMENT AND BANKS’ CAPITAL RATIOS
off-balance-sheet. Changes in the market values of these derivatives do not infl uence reported net income or equity. Nevertheless, these changes infl uence the economic value of the credit institution.
We can conclude from Table 1 that the credit institu-tion has a net market value of 2,800, corresponding to the book value of equity (2,200) plus net latent surplus values on assets, liabilities and derivatives (600), which are recorded at amortised cost. The market value of equity is generally referred to as the economic value (or economic equity) of the credit institution.
The sensitivity of economic equity to a 1 p.c. change in interest rates is 180, i.e. a change equivalent to 6.42 p.c. Increases or decreases in interest rates have no impact at all on the accounting value of balance sheet items, accounting equity or the reported net income, since the
assets and liabilities are recorded at amortised cost. (7) In contrast, the latent surplus value of 600 presented by the economic equity increases or decreases by 180 following a decrease or, respectively, an increase in interest rates.
3.3 Financial reporting in the new IAS 39 accounting environment
Tables 2 to 4 show the situation of the credit institution on the basis of the same fi gures as in table 1, but with application of IAS 39. First, we assume that the credit institution does not try to limit the volatility of its reported net income (Table 2) ; next, we compare the use of various techniques intended to manage the reported volatility of net income, namely the sale and purchase of investment securities, macro hedging (Table 3), and the use of the fair value option (Table 4).
(7) However, there will be an impact on the net interest income when the rates on the assets and liabilities are adjusted.
TABLE 1 FINANCIAL REPORTING IN THE CURRENT BELGIAN ACCOUNTING ENVIRONMENT
Source : BFIC.(1) Market value minus book value for the assets, book value minus market value for the liabilities.(2) This is a simplification because, in general, the sensitivity to an interest rate decrease is different than the sensitivity to an interest rate increase.
Balance sheet at time t Balance sheet when interest rates increase by 1 p.c.
Balance sheet when interest rates decrease by 1 p.c.
Bookvalue
Marketvalue
Differ-ence (1)
Interestrate
sensitivity (2)
Bookvalue
Marketvalue
Differ-ence (1)
Bookvalue
Marketvalue
Differ-ence (1)
ASSETS
Loan portfolio . . . . . . . . . . . 13,600 14,160 560 510 13,600 13,650 50 13,600 14,670 1,070
Securities portfolio . . . . . . . 10,500 11,500 1,000 500 10,500 11,000 500 10,500 12,000 1,500
Total . . . . . . . . . . . . . . . . . . 24,100 25,660 1,560 1,010 24,100 24,650 550 24,100 26,670 2,570
LIABILITIES
Savings deposits . . . . . . . . . 11,400 11,750 –350 –350 11,400 11,400 0 11,400 12,100 –700
Demand deposits . . . . . . . . 4,800 5,120 –320 –230 4,800 4,890 –90 4,800 5,350 –550
Other deposits . . . . . . . . . . . 5,700 5,770 –70 –50 5,700 5,720 –20 5,700 5,820 –120
Derivatives ALM . . . . . . . . . 0 220 –220 –200 0 20 –20 0 420 –420
Equity . . . . . . . . . . . . . . . . . 2,200 2,800 –600 –180 2,200 2,620 –420 2,200 2,980 –780
Net income (P&L) . . . . . . . 0 0 0 0 0 0 0 0
Other equity components 2,200 2,800 –600 –180 2,200 2,620 –420 2,200 2,980 –780
Total . . . . . . . . . . . . . . . . . . 24,100 25,660 –1,560 –1,010 24,100 24,650 –550 24,100 26,670 –2,570
Off-balance-sheet : derivatives ALM (notional amount) . . . . . . 16,000 16,000 16,000
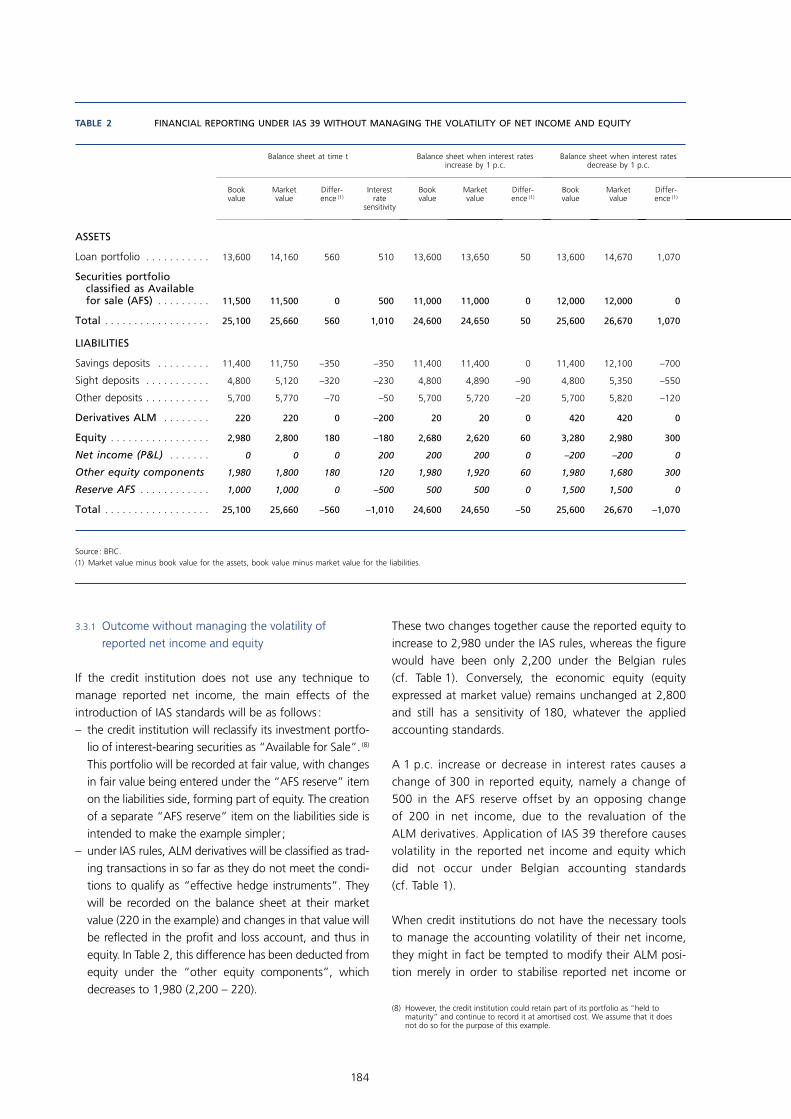
184
3.3.1 Outcome without managing the volatility of reported net income and equity
If the credit institution does not use any technique to manage reported net income, the main effects of the introduction of IAS standards will be as follows :– the credit institution will reclassify its investment portfo-
lio of interest-bearing securities as “Available for Sale”. (8) This portfolio will be recorded at fair value, with changes in fair value being entered under the “AFS reserve” item on the liabilities side, forming part of equity. The creation of a separate “AFS reserve” item on the liabilities side is intended to make the example simpler ;
– under IAS rules, ALM derivatives will be classifi ed as trad-ing transactions in so far as they do not meet the condi-tions to qualify as “effective hedge instruments”. They will be recorded on the balance sheet at their market value (220 in the example) and changes in that value will be refl ected in the profi t and loss account, and thus in equity. In Table 2, this difference has been deducted from equity under the “other equity components”, which decreases to 1,980 (2,200 – 220).
These two changes together cause the reported equity to increase to 2,980 under the IAS rules, whereas the fi gure would have been only 2,200 under the Belgian rules (cf. Table 1). Conversely, the economic equity (equity expressed at market value) remains unchanged at 2,800 and still has a sensitivity of 180, whatever the applied accounting standards.
A 1 p.c. increase or decrease in interest rates causes a change of 300 in reported equity, namely a change of 500 in the AFS reserve offset by an opposing change of 200 in net income, due to the revaluation of the ALM derivatives. Application of IAS 39 therefore causes volatility in the reported net income and equity which did not occur under Belgian accounting standards (cf. Table 1).
When credit institutions do not have the necessary tools to manage the accounting volatility of their net income, they might in fact be tempted to modify their ALM posi-tion merely in order to stabilise reported net income or
(8) However, the credit institution could retain part of its portfolio as ”held to maturity” and continue to record it at amortised cost. We assume that it does not do so for the purpose of this example.
TABLE 2 FINANCIAL REPORTING UNDER IAS 39 WITHOUT MANAGING THE VOLATILITY OF NET INCOME AND EQUITY
Source : BFIC.(1) Market value minus book value for the assets, book value minus market value for the liabilities.
Balance sheet at time t Balance sheet when interest rates increase by 1 p.c.
Balance sheet when interest rates decrease by 1 p.c.
Bookvalue
Marketvalue
Differ-ence (1)
Interestrate
sensitivity
Bookvalue
Marketvalue
Differ-ence (1)
Bookvalue
Marketvalue
Differ-ence (1)
ASSETS
Loan portfolio . . . . . . . . . . . 13,600 14,160 560 510 13,600 13,650 50 13,600 14,670 1,070
Securities portfolio classified as Available for sale (AFS) . . . . . . . . . 11,500 11,500 0 500 11,000 11,000 0 12,000 12,000 0
Total . . . . . . . . . . . . . . . . . . 25,100 25,660 560 1,010 24,600 24,650 50 25,600 26,670 1,070
LIABILITIES
Savings deposits . . . . . . . . . 11,400 11,750 –350 –350 11,400 11,400 0 11,400 12,100 –700
Sight deposits . . . . . . . . . . . 4,800 5,120 –320 –230 4,800 4,890 –90 4,800 5,350 –550
Other deposits . . . . . . . . . . . 5,700 5,770 –70 –50 5,700 5,720 –20 5,700 5,820 –120
Derivatives ALM . . . . . . . . 220 220 0 –200 20 20 0 420 420 0
Equity . . . . . . . . . . . . . . . . . 2,980 2,800 180 –180 2,680 2,620 60 3,280 2,980 300
Net income (P&L) . . . . . . . 0 0 0 200 200 200 0 –200 –200 0
Other equity components 1,980 1,800 180 120 1,980 1,920 60 1,980 1,680 300
Reserve AFS . . . . . . . . . . . . 1,000 1,000 0 –500 500 500 0 1,500 1,500 0
Total . . . . . . . . . . . . . . . . . . 25,100 25,660 –560 –1,010 24,600 24,650 –50 25,600 26,670 –1,070

185
IMPACT OF IAS 39 ON ASSET AND LIABILITY MANAGEMENT AND BANKS’ CAPITAL RATIOS
to manage their ALM position without the use of deriva-tives. (9)
If credit institutions wish to avoid the volatility in reported net income without modifying their interest rate risk, they can use three methods, in particular the purchase and sale of investment securities, macro hedging, and the fair value option.
3.3.2 Outcome with the purchase and sale of investment securities
In the event of a 1 p.c. decrease in the interest rate, the credit institution can sell securities exhibiting a surplus value of 200 (recorded under “AFS reserve”). This will lead to a transfer of 200 from the AFS reserve to net income under realised capital gains, which will offset the negative net income of 200 due to revalua-tion of the ALM derivatives. This transaction will have no impact on the reported and market value of equity, since it merely involves a shift from the AFS reserve to net income. (10) If the credit institution does not wish to modify its ALM position, all it needs to do is to buy back securities having the same interest rate sensitivity as the securities sold.
Credit institutions already engage in transactions of this type, buying and selling securities to manage their ALM position and their net income. This is therefore a routine practice which will probably be accentuated by the intro-duction of IAS 39. However, such transactions cannot be effected unless the institutions have highly liquid securi-ties exhibiting the necessary capital gains or losses. This should encourage the institutions to retain a portfolio of securities which can be readily realised. Moreover, sales and purchases of securities, only undertaken to compen-sate the effect of the revaluation of ALM derivates, are not justifi ed economically and may have a negative input on banks’ future margin income.
3.3.3 Outcome with macro hedging
Under IAS 39, the credit institution can identify deriva-tives used specifi cally to hedge the effects of interest rate changes on the fair value of individual assets or liabilities, or a group of assets or liabilities with similar risk charac-teristics. The change in the fair value of the items hedged resulting from a change in interest rates is then recorded in net income symmetrically with the change of fair value of the derivatives designated as “effective hedges”.
Table 3 gives the example of the same institution conclud-ing transactions in derivatives to hedge part of the interest rate risk on its AFS investment portfolio at a sensitivity of 200. To maintain a constant rate of sensitivity for its economic equity, this institution can do simultane-ous transactions in derivatives in the opposite direction (”derivatives position taking” in table 3) with the same sensitivity of 200.
If interest rates change, the change in the value of the derivatives as a whole (i.e. –200 +200 –200 = –200) will be offset in the reported net income by an identical change – but in the opposite direction – in the value of the hedged security portfolio, namely 200. There will therefore be no net change in the reported net income.
In practice, in the IAS environment, this method is more diffi cult to apply than the technique of buying and selling securities. The rules on hedge accounting, par-ticularly the obligations to document the transactions, to prove the effectiveness of the hedge and to maintain it at all times, are in fact very strict. In view of the oper-ating constraints imposed by the IAS, it will probably be very diffi cult for credit institutions to use fair value hedge accounting to manage the volatility of reported net income.
3.3.4 Outcome with the use of the fair value option
The “fair value option” enables the credit institution to record any interest-bearing asset or liability at fair value, with changes in that fair value refl ected in net income. Thus, a credit institution could choose to record certain assets and liabilities at fair value to offset the result relat-ing to the revaluation at fair value of the derivatives used for ALM purposes.
To illustrate this possibility, table 4 presents a situation where part of the loans, part of the securities portfolio and part of the deposits are recorded at fair value with change of fair value in net income. The impact of this reclassifi cation, i.e. the recording of asset and liability items at fair value instead of “at amortised cost”, is +10, or +70 for loans and –60 for deposits. This impact is refl ected in equity, which amounts to 2,990 instead
(9) For example, in the table 2 scenario, the credit institution could have refrained from hedging its interest rate risk by effecting transactions in derivatives. That would have eliminated the volatility in the accounting result of 200, but would also have increased the volatility of the economic equity by 200 (i.e. the economic equity would have a volatility of +380 in the case of a 1 p.c. decrease in interest rates). To limit the volatility of economic equity, so the interest rate risk, the bank will probably try to change its balance sheet structure in order to reduce the duration of its assets, for example in limiting the granting of long term credit with fi xed interest rate.
(10) In the event of a 1 p.c. increase in interest rates, the institution would have to sell securities showing a loss.
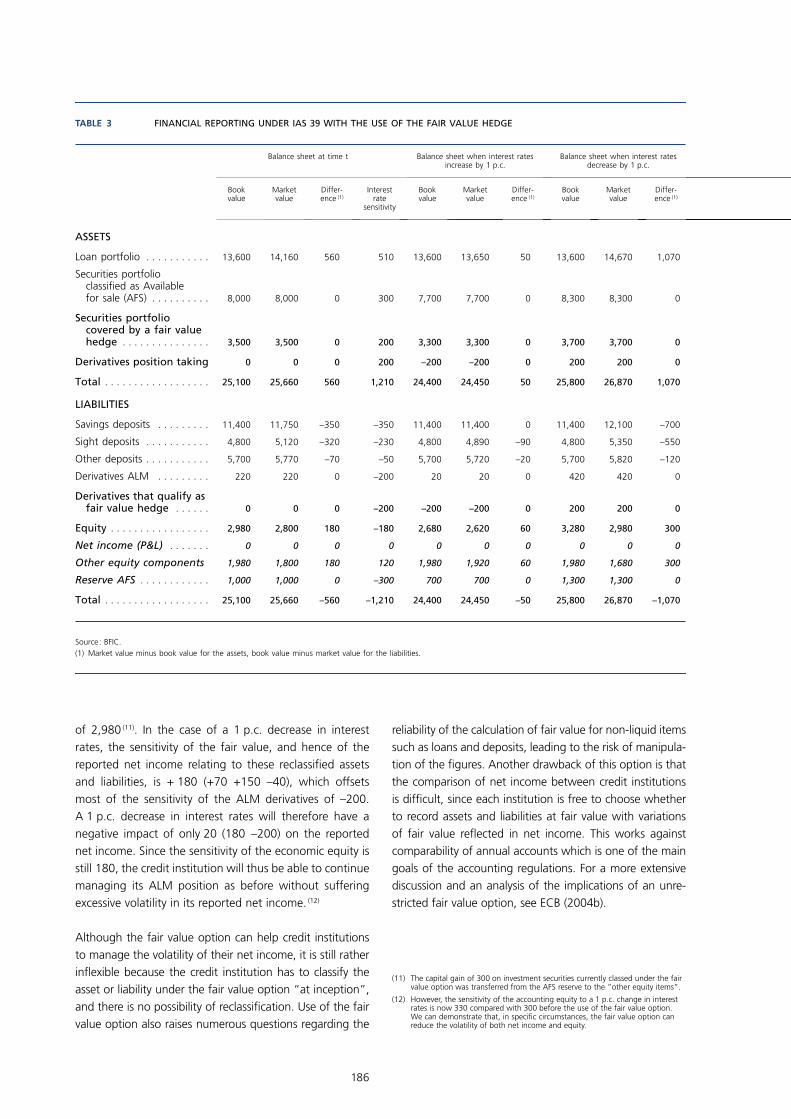
186
of 2,980 (11). In the case of a 1 p.c. decrease in interest rates, the sensitivity of the fair value, and hence of the reported net income relating to these reclassifi ed assets and liabilities, is + 180 (+70 +150 –40), which offsets most of the sensitivity of the ALM derivatives of –200. A 1 p.c. decrease in interest rates will therefore have a negative impact of only 20 (180 –200) on the reported net income. Since the sensitivity of the economic equity is still 180, the credit institution will thus be able to continue managing its ALM position as before without suffering excessive volatility in its reported net income. (12)
Although the fair value option can help credit institutions to manage the volatility of their net income, it is still rather infl exible because the credit institution has to classify the asset or liability under the fair value option “at inception”, and there is no possibility of reclassifi cation. Use of the fair value option also raises numerous questions regarding the
reliability of the calculation of fair value for non-liquid items such as loans and deposits, leading to the risk of manipula-tion of the fi gures. Another drawback of this option is that the comparison of net income between credit institutions is diffi cult, since each institution is free to choose whether to record assets and liabilities at fair value with variations of fair value refl ected in net income. This works against comparability of annual accounts which is one of the main goals of the accounting regulations. For a more extensive discussion and an analysis of the implications of an unre-stricted fair value option, see ECB (2004b).
(11) The capital gain of 300 on investment securities currently classed under the fair value option was transferred from the AFS reserve to the ”other equity items”.
(12) However, the sensitivity of the accounting equity to a 1 p.c. change in interest rates is now 330 compared with 300 before the use of the fair value option. We can demonstrate that, in specifi c circumstances, the fair value option can reduce the volatility of both net income and equity.
TABLE 3 FINANCIAL REPORTING UNDER IAS 39 WITH THE USE OF THE FAIR VALUE HEDGE
Source : BFIC.(1) Market value minus book value for the assets, book value minus market value for the liabilities.
Balance sheet at time t Balance sheet when interest rates increase by 1 p.c.
Balance sheet when interest rates decrease by 1 p.c.
Bookvalue
Marketvalue
Differ-ence (1)
Interestrate
sensitivity
Bookvalue
Marketvalue
Differ-ence (1)
Bookvalue
Marketvalue
Differ-ence (1)
ASSETS
Loan portfolio . . . . . . . . . . . 13,600 14,160 560 510 13,600 13,650 50 13,600 14,670 1,070
Securities portfolio classified as Available for sale (AFS) . . . . . . . . . . 8,000 8,000 0 300 7,700 7,700 0 8,300 8,300 0
Securities portfolio covered by a fair value hedge . . . . . . . . . . . . . . . 3,500 3,500 0 200 3,300 3,300 0 3,700 3,700 0
Derivatives position taking 0 0 0 200 –200 –200 0 200 200 0
Total . . . . . . . . . . . . . . . . . . 25,100 25,660 560 1,210 24,400 24,450 50 25,800 26,870 1,070
LIABILITIES
Savings deposits . . . . . . . . . 11,400 11,750 –350 –350 11,400 11,400 0 11,400 12,100 –700
Sight deposits . . . . . . . . . . . 4,800 5,120 –320 –230 4,800 4,890 –90 4,800 5,350 –550
Other deposits . . . . . . . . . . . 5,700 5,770 –70 –50 5,700 5,720 –20 5,700 5,820 –120
Derivatives ALM . . . . . . . . . 220 220 0 –200 20 20 0 420 420 0
Derivatives that qualify as fair value hedge . . . . . . 0 0 0 –200 –200 –200 0 200 200 0
Equity . . . . . . . . . . . . . . . . . 2,980 2,800 180 –180 2,680 2,620 60 3,280 2,980 300
Net income (P&L) . . . . . . . 0 0 0 0 0 0 0 0 0 0
Other equity components 1,980 1,800 180 120 1,980 1,920 60 1,980 1,680 300
Reserve AFS . . . . . . . . . . . . 1,000 1,000 0 –300 700 700 0 1,300 1,300 0
Total . . . . . . . . . . . . . . . . . . 25,100 25,660 –560 –1,210 24,400 24,450 –50 25,800 26,870 –1,070
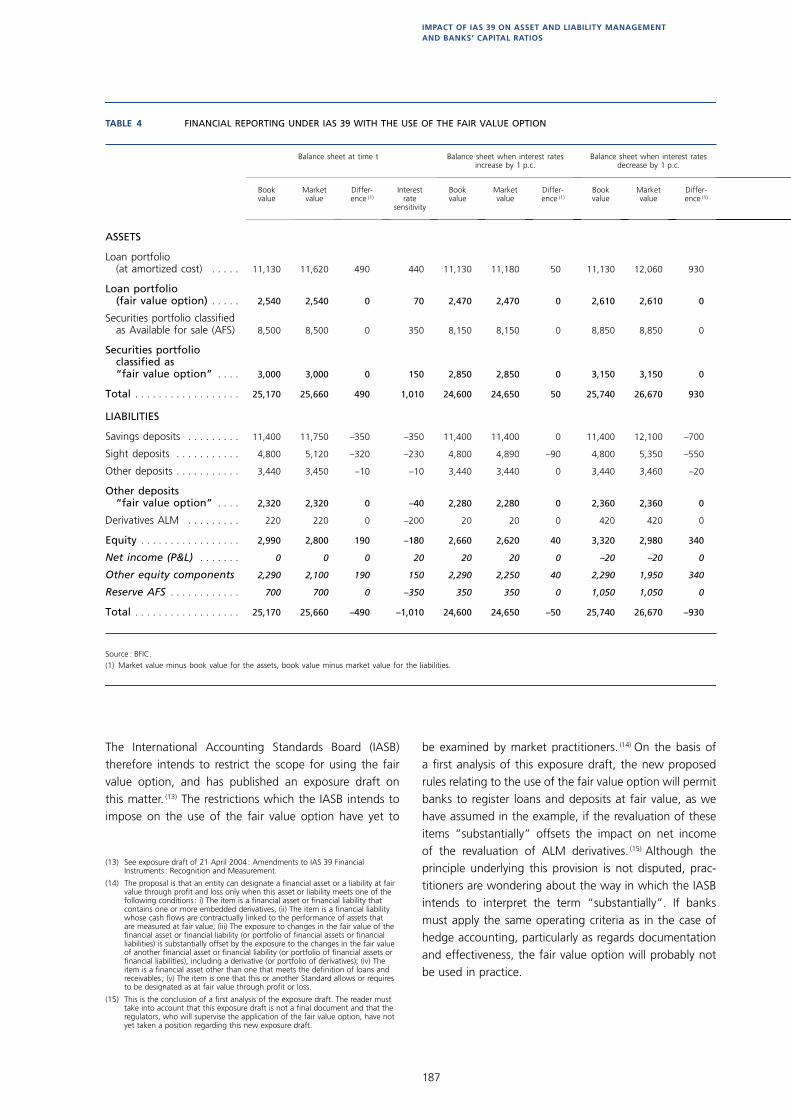
187
IMPACT OF IAS 39 ON ASSET AND LIABILITY MANAGEMENT AND BANKS’ CAPITAL RATIOS
The International Accounting Standards Board (IASB) therefore intends to restrict the scope for using the fair value option, and has published an exposure draft on this matter. (13) The restrictions which the IASB intends to impose on the use of the fair value option have yet to
be examined by market practitioners. (14) On the basis of a fi rst analysis of this exposure draft, the new proposed rules relating to the use of the fair value option will permit banks to register loans and deposits at fair value, as we have assumed in the example, if the revaluation of these items “substantially” offsets the impact on net income of the revaluation of ALM derivatives. (15) Although the principle underlying this provision is not disputed, prac-titioners are wondering about the way in which the IASB intends to interpret the term “substantially”. If banks must apply the same operating criteria as in the case of hedge accounting, particularly as regards documentation and effectiveness, the fair value option will probably not be used in practice.
(13) See exposure draft of 21 April 2004 : Amendments to IAS 39 Financial Instruments : Recognition and Measurement.
(14) The proposal is that an entity can designate a fi nancial asset or a liability at fair value through profi t and loss only when this asset or liability meets one of the following conditions : i) The item is a fi nancial asset or fi nancial liability that contains one or more embedded derivatives, (ii) The item is a fi nancial liability whose cash fl ows are contractually linked to the performance of assets that are measured at fair value, (iii) The exposure to changes in the fair value of the fi nancial asset or fi nancial liability (or portfolio of fi nancial assets or fi nancial liabilities) is substantially offset by the exposure to the changes in the fair value of another fi nancial asset or fi nancial liability (or portfolio of fi nancial assets or fi nancial liabilities), including a derivative (or portfolio of derivatives); (iv) The item is a fi nancial asset other than one that meets the defi nition of loans and receivables ; (v) The item is one that this or another Standard allows or requires to be designated as at fair value through profi t or loss.
(15) This is the conclusion of a fi rst analysis of the exposure draft. The reader must take into account that this exposure draft is not a fi nal document and that the regulators, who will supervise the application of the fair value option, have not yet taken a position regarding this new exposure draft.
TABLE 4 FINANCIAL REPORTING UNDER IAS 39 WITH THE USE OF THE FAIR VALUE OPTION
Source : BFIC.(1) Market value minus book value for the assets, book value minus market value for the liabilities.
Balance sheet at time t Balance sheet when interest rates increase by 1 p.c.
Balance sheet when interest rates decrease by 1 p.c.
Bookvalue
Marketvalue
Differ-ence (1)
Interestrate
sensitivity
Bookvalue
Marketvalue
Differ-ence (1)
Bookvalue
Marketvalue
Differ-ence (1)
ASSETS
Loan portfolio (at amortized cost) . . . . . 11,130 11,620 490 440 11,130 11,180 50 11,130 12,060 930
Loan portfolio (fair value option) . . . . . 2,540 2,540 0 70 2,470 2,470 0 2,610 2,610 0
Securities portfolio classified as Available for sale (AFS) 8,500 8,500 0 350 8,150 8,150 0 8,850 8,850 0
Securities portfolio classified as “fair value option” . . . . 3,000 3,000 0 150 2,850 2,850 0 3,150 3,150 0
Total . . . . . . . . . . . . . . . . . . 25,170 25,660 490 1,010 24,600 24,650 50 25,740 26,670 930
LIABILITIES
Savings deposits . . . . . . . . . 11,400 11,750 –350 –350 11,400 11,400 0 11,400 12,100 –700
Sight deposits . . . . . . . . . . . 4,800 5,120 –320 –230 4,800 4,890 –90 4,800 5,350 –550
Other deposits . . . . . . . . . . . 3,440 3,450 –10 –10 3,440 3,440 0 3,440 3,460 –20
Other deposits “fair value option” . . . . 2,320 2,320 0 –40 2,280 2,280 0 2,360 2,360 0
Derivatives ALM . . . . . . . . . 220 220 0 –200 20 20 0 420 420 0
Equity . . . . . . . . . . . . . . . . . 2,990 2,800 190 –180 2,660 2,620 40 3,320 2,980 340
Net income (P&L) . . . . . . . 0 0 0 20 20 20 0 –20 –20 0
Other equity components 2,290 2,100 190 150 2,290 2,250 40 2,290 1,950 340
Reserve AFS . . . . . . . . . . . . 700 700 0 –350 350 350 0 1,050 1,050 0
Total . . . . . . . . . . . . . . . . . . 25,170 25,660 –490 –1,010 24,600 24,650 –50 25,740 26,670 –930
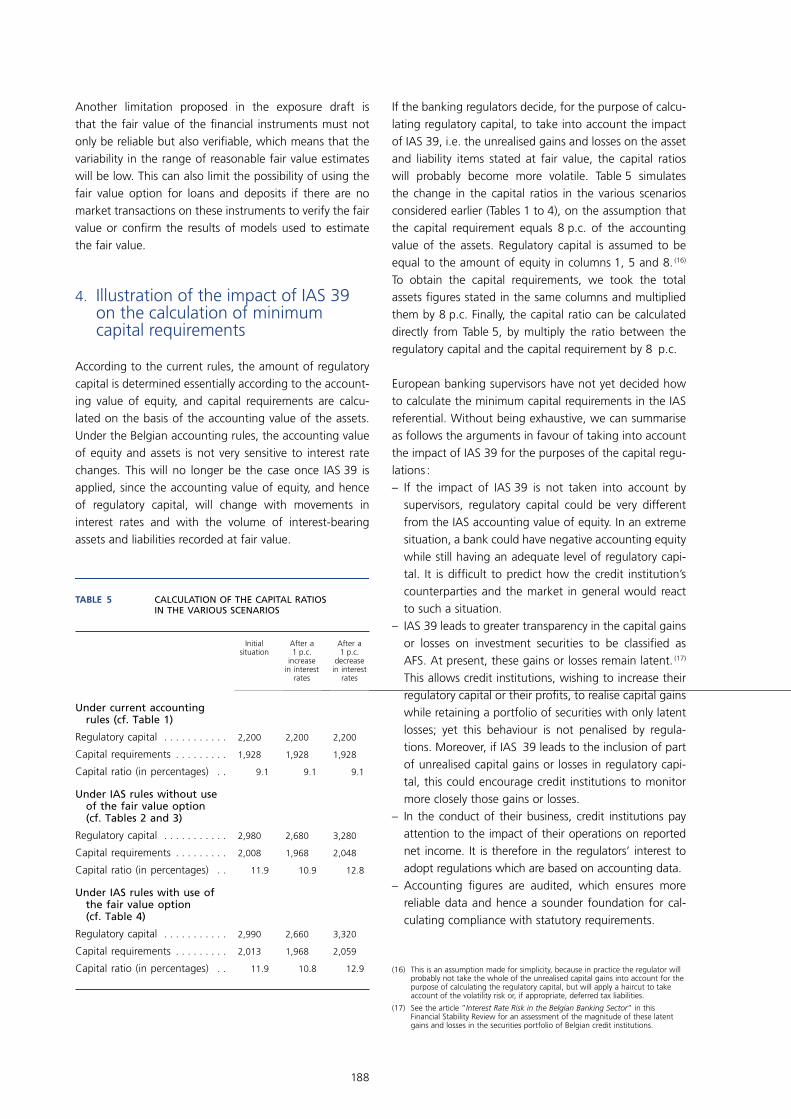
188
Another limitation proposed in the exposure draft is that the fair value of the fi nancial instruments must not only be reliable but also verifi able, which means that the variability in the range of reasonable fair value estimates will be low. This can also limit the possibility of using the fair value option for loans and deposits if there are no market transactions on these instruments to verify the fair value or confi rm the results of models used to estimate the fair value.
4. Illustration of the impact of IAS 39 on the calculation of minimum capital requirements
According to the current rules, the amount of regulatory capital is determined essentially according to the account-ing value of equity, and capital requirements are calcu-lated on the basis of the accounting value of the assets. Under the Belgian accounting rules, the accounting value of equity and assets is not very sensitive to interest rate changes. This will no longer be the case once IAS 39 is applied, since the accounting value of equity, and hence of regulatory capital, will change with movements in interest rates and with the volume of interest-bearing assets and liabilities recorded at fair value.
If the banking regulators decide, for the purpose of calcu-lating regulatory capital, to take into account the impact of IAS 39, i.e. the unrealised gains and losses on the asset and liability items stated at fair value, the capital ratios will probably become more volatile. Table 5 simulates the change in the capital ratios in the various scenarios considered earlier (Tables 1 to 4), on the assumption that the capital requirement equals 8 p.c. of the accounting value of the assets. Regulatory capital is assumed to be equal to the amount of equity in columns 1, 5 and 8. (16)
To obtain the capital requirements, we took the total assets fi gures stated in the same columns and multiplied them by 8 p.c. Finally, the capital ratio can be calculated directly from Table 5, by multiply the ratio between the regulatory capital and the capital requirement by 8 p.c.
European banking supervisors have not yet decided how to calculate the minimum capital requirements in the IAS referential. Without being exhaustive, we can summarise as follows the arguments in favour of taking into account the impact of IAS 39 for the purposes of the capital regu-lations :– If the impact of IAS 39 is not taken into account by
supervisors, regulatory capital could be very different from the IAS accounting value of equity. In an extreme situation, a bank could have negative accounting equity while still having an adequate level of regulatory capi-tal. It is diffi cult to predict how the credit institution’s counterparties and the market in general would react to such a situation.
– IAS 39 leads to greater transparency in the capital gains or losses on investment securities to be classifi ed as AFS. At present, these gains or losses remain latent. (17)
This allows credit institutions, wishing to increase their regulatory capital or their profi ts, to realise capital gains while retaining a portfolio of securities with only latent losses; yet this behaviour is not penalised by regula-tions. Moreover, if IAS 39 leads to the inclusion of part of unrealised capital gains or losses in regulatory capi-tal, this could encourage credit institutions to monitor more closely those gains or losses.
– In the conduct of their business, credit institutions pay attention to the impact of their operations on reported net income. It is therefore in the regulators’ interest to adopt regulations which are based on accounting data.
– Accounting fi gures are audited, which ensures more reliable data and hence a sounder foundation for cal-culating compliance with statutory requirements.
(16) This is an assumption made for simplicity, because in practice the regulator will probably not take the whole of the unrealised capital gains into account for the purpose of calculating the regulatory capital, but will apply a haircut to take account of the volatility risk or, if appropriate, deferred tax liabilities.
(17) See the article ”Interest Rate Risk in the Belgian Banking Sector” in this Financial Stability Review for an assessment of the magnitude of these latent gains and losses in the securities portfolio of Belgian credit institutions.
TABLE 5 CALCULATION OF THE CAPITAL RATIOS IN THE VARIOUS SCENARIOS
Initialsituation
After a 1 p.c.
increasein interest
rates
After a 1 p.c.
decreasein interest
rates
Under current accounting rules (cf. Table 1)
Regulatory capital . . . . . . . . . . . 2,200 2,200 2,200
Capital requirements . . . . . . . . . 1,928 1,928 1,928
Capital ratio (in percentages) . . 9.1 9.1 9.1
Under IAS rules without use of the fair value option (cf. Tables 2 and 3)
Regulatory capital . . . . . . . . . . . 2,980 2,680 3,280
Capital requirements . . . . . . . . . 2,008 1,968 2,048
Capital ratio (in percentages) . . 11.9 10.9 12.8
Under IAS rules with use of the fair value option (cf. Table 4)
Regulatory capital . . . . . . . . . . . 2,990 2,660 3,320
Capital requirements . . . . . . . . . 2,013 1,968 2,059
Capital ratio (in percentages) . . 11.9 10.8 12.9

189
IMPACT OF IAS 39 ON ASSET AND LIABILITY MANAGEMENT AND BANKS’ CAPITAL RATIOS
However, to determine the arrangements for integrating IAS 39 into the method of calculation of capital ratios, the supervisor will have to take into account certain risks or constraints :– The volatility of the solvency ratio could have an impact
on lending in general. A reduction in this ratio will in fact restrict the bank’s scope for lending, whereas the reduction might be due merely to a temporary change in interest rates.
– The inclusion of all accounting losses and gains associ-ated with the change in the fair value of interest-bear-ing assets and liabilities on the banking book could encourage credit institutions to take interest rate risk positions which are not economically justifi ed, merely in order to maintain the level of their capital ratio. Thus, in the scenario of Table 2, the credit institution could archieve a reduction of 300 in the sensitivity of the accounting equity to a change in interest rates by concluding new transactions in derivatives or chang-ing the interest rate sensitivity of its securities portfo-lio. The sensitivity of accounting equity to interest rate changes would then become zero, but the sensitivity of economic equity would move in the opposite direc-tion, from +180 to –120 for a 1 p.c. decrease in inter-est rates.
– If the bank wants to keep its ALM position unchanged, it could violate the capital regulation and, conse-quently, be required to raise equities or subordinated debts to compensate for losses related to changes in the fair value of interest bearing derivatives and assets in the banking book. This increase in banks’ cost of capital will only be motivated by the regulatory treat-ment of revaluation losses of a temporary nature.
5. Conclusions
This article endeavours to show by means of examples that, under the new IAS accounting rules, a credit institu-tion can manage the volatility of its net income without modifying its ALM position. However, asset and liability management will be much more diffi cult than in the cur-rent situation (Belgian accounting standards). Moreover, owing to certain restriction on applying the IAS rules, credit institutions will not be able, in practice, to avoid all volatility in their reported net income, but will have to content themselves with trying to limit the volatility.
The “fair value option” offers a practical way of manag-ing the volatility of net income, in addition to buying and selling investment securities classifi ed as AFS assets. This option is useful for the banking sector because it offers a practical alternative to the fair value hedge and macro hedge accounting options which can not be applied by banks because of their inability to meet the strict criteria imposed by the IAS 39. Although there is justifi cation for limiting the use of this option, as the IASB and ECB propose, particularly to prevent abuse and to preserve a degree of comparability in the annual accounts, it would be essential to ensure that the limitations imposed are not so restrictive as to make it impossible to use this method, given that fair value hedge accounting is not likely to be used by banks.
When credit institutions do not have the necessary tools to manage the accounting volatility of their net income, they may in fact be tempted to modify their ALM posi-tion merely in order to stabilise reported net income or to manage their ALM position without the use of deriva-tives. In this case, banks would have to manage their ALM position by using traditional assets as bonds or credits, for example, through a limitation of their long term credits with fi xed rates or their investment in long term securities in order to reduce the duration of their assets. This would certainly have an impact on their profi tability but also on the economy as a whole.
The article also points out that, in the IAS environment, accounting equity will be more volatile, and credit institutions will probably want to limit that volatility. Their behaviour will depend both on the reaction of their counterparties and of the market in general to this volatility, and on the treatment of IAS 39 in the context of capital regulations. Care must therefore be taken to defi ne rules on capital requirements which do not increase the cost of capital of the banking sector or encourage credit institutions to take ALM positions solely in order to manage the accounting value of their equity and their capital ratios.

190
References
Chisnall, P. (2000), ”Fair Value Accounting : An Industry View”, Financial Stability Review, Bank of England, pp. 146-153.
ECB (2004a), ”The Impact of Fair Value Accounting on the European Banking Sector – A Financial Stability Perspective”, ECB Monthly Bulletin, February.
ECB (2004b), ”Fair Value Accounting and Financial Stability”, ECB, Occasional Paper No. 13, April.
Jackson, P. and D. Lodge (2000), ”Fair Value Accounting, capital standards, expected loss provisioning, and fi nancial stability”, Bank of England, Financial Stability Review, June.
Mathérat, S. (2003), ”International Accounting Standardisation and Financial Stability”, Financial Stability Review, Banque de France, June, pp. 132-153.

Publisher
J. HILGERSDirector
National Bank of Belgium
boulevard de Berlaimont 14 – BE-1000 Brussels
Contacts for the Review
Ph. QUINTINHead of the Communication service
Tel. +32 2 221 22 41 – Fax +32 2 221 30 91
Th. TIMMERMANSHead of the International Co-operation and
Financial Stability Department
Tel. +32 2 221 44 71 – Fax +32 2 221 31 04
© Illustrations : fotostockdirect – goodshoot gettyimages – digitalvision gettyimages – photodisc National Bank of Belgium
Lay out : NBB PrepressCover : NBB Multimedia
Published in June 2004
Related Documents