17 FINANCIAL SECTION CONTENTS Five-Year Summary of Selected Financial Data ................................ 18 Management’s Discussion and Analysis ........................................... 19 Consolidated Statements of Operations ........................................... 21 Consolidated Balance Sheets ............................................................ 22 Consolidated Statements of Shareholders’ Equity ............................ 24 Consolidated Statements of Cash Flows (1999) ............................... 25 Consolidated Statements of Cash Flows (2000) ............................... 26 Notes to Consolidated Financial Statements .................................... 27 Report of Independent Public Accountants ...................................... 32 “CASH FLOW, ROE AND ROA ARE KEY MANAGEMENT BENCHMARKS. ” 17

Welcome message from author
This document is posted to help you gain knowledge. Please leave a comment to let me know what you think about it! Share it to your friends and learn new things together.
Transcript

17
FINANCIAL SECTION
CONTENTS
Five-Year Summary of Selected Financial Data ................................ 18
Management’s Discussion and Analysis ........................................... 19
Consolidated Statements of Operations ........................................... 21
Consolidated Balance Sheets ............................................................ 22
Consolidated Statements of Shareholders’ Equity ............................ 24
Consolidated Statements of Cash Flows (1999) ............................... 25
Consolidated Statements of Cash Flows (2000) ............................... 26
Notes to Consolidated Financial Statements .................................... 27
Report of Independent Public Accountants ...................................... 32
“CASH FLOW,ROE AND ROA ARE
KEY MANAGEMENTBENCHMARKS.”
17

18
Five-Year Summary of Selected Financial Data
For the years ended March 31 Millions of yen
(CONSOLIDATED) 1996 1997 1998 1999 2000
Operations:
Net sales ¥172,183 ¥190,316 ¥190,482 ¥169,960 ¥165,323
Cost of sales and SGA expenses 167,180 183,729 185,483 170,560 160,630
Operating income (loss) 5,003 6,587 4,999 (600) 4,693
Other income (expenses) (2,328) (2,943) (2,269) (1,550) (304)
Income (loss) before income taxes 2,675 3,644 2,730 (2,150) 4,389
Income taxes and others 828 2,074 1,827 568 2,246
Net income (loss) 1,630 1,161 903 (2,718) 2,143
Financial Position:
Current assets 90,936 112,657 99,590 90,374 87,651
Noncurrent assets 110,870 93,964 91,766 87,786 84,519
Total assets 201,806 206,621 191,356 178,160 172,170
Current liabilities 91,057 129,624 87,307 74,008 61,176
Long-term liabilities 47,831 12,616 39,009 42,361 47,207
Minority interests 2,902 3,310 3,690 3,787 3,905
Shareholders’ equity 60,016 61,071 61,350 58,004 59,882
Total liabilities and shareholders’ equity 201,806 206,621 191,356 178,160 172,170
Number of employees — — — — 3,661
OKAMURA CORPORATION

19
Management’s Discussion and Analysis
Operating PerformanceFor the fiscal year ended March 31, 2000, Okamura Corporation recorded consolidated net sales of ¥165,323million, a year-on-year decline of 2.7%, reflecting weak domestic capital investment and consumer spending.
Net sales declined 1.8% in the mainstay furniture segment to ¥106,424 million, owing to stagnant office buildingconstruction nationwide, reformed construction material operations and a withdrawal from the system kitchenbusiness. By region, sales increased in the Tokyo area but declined elsewhere. Demand was supported by officerelocations and renovations related to IT investment, especially among financial institutions, foreign companiesand the data communications sector.
Net sales decreased 4.7% in the store displays, industrial racks and shelving segment to ¥56,053 million. Weaksales to major supermarket chains resulting from restrained network investment, especially for large shoppingcenters, were offset by brisk expansion by drug stores, electronics retailers and home improvement centers.However, declines in warehousing and other system equipment led to lower sales for the segment.
Net sales were down 3.4% in the hydraulic transmissions segment to ¥2,329 million. In the others segment, netsales rose 21.1% to ¥517 million.
Okamura established an executive committee to raise profitability at the beginning of the fiscal year and tookCompany-wide measures to raise efficiency, including the withdrawal from its unprofitable system kitchen busi-ness and the streamlining of its construction materials business. The Company also reformed its manufacturingprocess and introduced supply chain management (SCM) at major plants. Consequently, cost of sales declined7.2% and the gross profit margin improved 3.3 percentage points. Gross profit increased 9.2% to ¥50,991 million.
Cost-cutting measures succeeded in reducing selling, general and administrative (SG&A) expenses 2.1% to¥46,298 million, reflecting lower personnel costs amid a freeze on new hiring and a review of office leasing andother expenses. Operating income rebounded sharply to ¥4,693 million, compared with an operating loss of ¥600million in the previous fiscal year.
Other expenses, net, declined ¥1,246 million to ¥304 million. This included a gain on sale of property, plant andequipment of ¥2,479 million, reflecting the sale of idle land. Interest expense declined slightly, to ¥1,137 million, asthe Company issued ¥3 billion in Euroyen bonds in May 1999 and repaid short-term borrowings, reflecting afinancial policy of achieving a balance between direct and indirect financing, and short- and long-term debt. Othernet expenses included a provision to the reserve for retirement benefits of ¥1,399 million and the establishment ofa reserve for the retirement benefits of directors and corporate auditors of ¥408 million, reflecting prior-periodservice costs related to a change in accounting for pension liabilities.
Consequently, income before income taxes was ¥4,389 million, compared with a loss before income taxes of¥2,150 million in the previous fiscal year, and net income was ¥2,143 million, compared with a net loss of ¥2,718million.
“ALTHOUGH NET SALES DECLINED, GREATEREFFICIENCY AND COST-CUTTING MEASURES
SUPPORTED A SUBSTANTIAL RECOVERY INPROFITABILITY.”

20
0
20,000
40,000
60,000
80,000
0
2,000
4,000
6,000
8,000
10,000
12,000
INTEREST-BEARING DEBT(Millions of yen)
CAPITAL EXPENDITURES / DEPRECIATION AND AMORTIZATION(Millions of yen)
72,921 56,425 57,318 49,093
6,180 2,658 2,6909,268
6,063 6,043 5,4255,606
Capital ExpendituresDepreciation and Amortization
’97 ’98 ’99 ’00
’97 ’98 ’99 ’00
’97 ’98 ’99 ’00
0
60,000
120,000
180,000
240,000
TOTAL ASSETS / SHAREHOLDERS’ EQUITY(Millions of yen)
Total Assets Shareholders’ Equity
61,350 58,004 59,88261,071
172,170191,356206,621 178,160
Cash Flows and Financial PositionTotal assets declined 3.5% to ¥172,170 million following a Company-wide review of assets and a focus on cash flows. Total current assetsdeclined, as efforts to shorten the collection period resulted in a reduc-tion in trade receivables of ¥5,246 million to ¥47,048 million, and theintroduction of SCM cut inventories at end of year by ¥1,872 million to¥13,796 million. Property, plant and equipment, less accumulateddepreciation, declined ¥3,758 million to ¥54,712 million amid restrainedcapital investment.
Total current liabilities declined ¥12,832 million to ¥61,176 million,including the effects of a decline in trade payables owing to SCM andefforts to cut materials and outsourcing costs.
Interest-bearing debt declined ¥8,225 million to ¥49,093 million.Net cash provided by operating activities was ¥12,407 million, reflect-
ing growth in operating income and depreciation, improved receivablemanagement and streamlined inventories.
Net cash provided by investing activities was ¥183 million as result ofthe sale of idle real estate and investment securities.
Net cash used in financing activities was ¥8,626 million, as theCompany used strong cash flow from operations to reduce interest-bearing debt.
In aggregate, cash and cash equivalents at end of year increased¥3,953 million to ¥21,931 million.

21
Thousands ofU.S. dollars
Millions of yen (Note 1 (1))
1999 2000 2000
Net sales (Note 9) ¥169,960 ¥165,323 $1,557,447
Cost of sales 123,284 114,332 1,077,080
Gross profit 46,676 50,991 480,367
Selling, general and administrative expenses 47,276 46,298 436,156
Operating income (loss) (Note 9) (600) 4,693 44,211
Other income (expenses):
Interest and dividend income 269 281 2,647
Interest expense (1,140) (1,137) (10,711)
Loss on devaluation of investment securities (1,356) (660) (6,218)
Gain on sale of property, plant and equipment 293 2,479 23,354
Loss on disposal of property, plant and equipment (267) (423) (3,985)
Gain on sale of marketable securities and investment securities 77 39 367
Equity in earnings (loss) of affiliated companies (43) 61 575
Other, net 617 (944) (8,893)
(1,550) (304) (2,864)
Income (Loss) before income taxes (2,150) 4,389 41,347
Income taxes (Note 8)
Current 444 2,047 19,284
Deferred — 73 688
Income (Loss) before minority interests (2,594) 2,269 21,375
Minority interests in net income of consolidated subsidiaries (124) (126) (1,187)
Net income (loss) ¥ (2,718) ¥ 2,143 $ 20,188
U.S. dollarsYen (Note 1 (1))
1999 2000 2000
Amounts per share of common stock:
Net income (loss) ¥ (21.78) ¥ 17.17 $ 0.16
Cash dividends applicable to the year 5.00 3.00 0.03
See accompanying notes.
OKAMURA CORPORATION
Consolidated Statements of OperationsYears Ended March 31, 1999 and 2000

22
OKAMURA CORPORATION
Consolidated Balance SheetsMarch 31, 1999 and 2000
Thousands ofU.S. dollars
Millions of yen (Note 1 (1))
ASSETS 1999 2000 2000
Current assets:
Cash ¥ 19,629 ¥ 23,808 $ 224,286
Marketable securities (Note 7) 745 694 6,538
Trade receivables:
Notes 12,330 8,047 75,808
Accounts 40,517 39,354 370,739
Allowance for doubtful accounts (517) (317) (2,986)
Inventories (Note 3) 15,668 13,796 129,967
Deferred income taxes (Note 8) — 789 7,433
Other current assets 2,002 1,480 13,943
Total current assets 90,374 87,651 825,728
Property, plant and equipment (Note 4)
Land 20,375 21,128 199,039
Buildings 48,270 47,741 449,750
Machinery and equipment 55,027 53,781 506,651
Construction in progress 556 20 188
124,228 122,670 1,155,628
Less accumulated depreciation 65,758 67,958 640,207
58,470 54,712 515,421
Investments and other assets:
Investments in unconsolidated subsidiaries and affiliated companies 1,069 1,128 10,627
Investment securities (Note 7) 18,856 17,907 168,695
Deferred income taxes (Note 8) — 1,566 14,753
Other non-current assets 9,391 9,206 86,726
29,316 29,807 280,801
¥178,160 ¥172,170 $1,621,950
See accompanying notes.

23
Thousands ofU.S. dollars
Millions of yen (Note 1 (1))
LIABILITIES AND SHAREHOLDERS’ EQUITY 1999 2000 2000
Current liabilities:
Short-term bank loans and long-term debt
due within one year (Note 4) ¥ 25,675 ¥ 17,015 $ 160,292
Trade payables:
Notes 27,384 20,379 191,983
Accounts 16,164 17,341 163,363
Income taxes payable (Note 8) 288 1,884 17,748
Other current liabilities 4,497 4,557 42,930
Total current liabilities 74,008 61,176 576,316
Long-term debt (Note 4) 31,643 32,078 302,195
Retirement benefits 9,047 11,155 105,087
Deferred income taxes (Note 8) — 2,299 21,658
Other long-term liabilities 1,671 1,675 15,780
Minority interests 3,787 3,905 36,788
Shareholders’ equity (Note 5):
Common stock, par value ¥50 per share
Authorized—200,000,000 shares
Issued—124,791,530 shares 18,670 18,670 175,883
Additional paid-in capital 16,760 16,760 157,890
Retained earnings 22,574 24,454 230,372
Treasury stock, at cost (0) (2) (19)
58,004 59,882 564,126
¥178,160 ¥172,170 $1,621,950
.

24
Thousandsof shares Millions of yen
Shares ofcommon Common Additional Retained
stock stock paid-in capital earnings
Balance at March 31, 1998 124,792 ¥ 18,670 ¥ 16,760 ¥ 25,920Net loss — — — (2,718)Cash dividends paid (¥5.00 per share) — — — (624)Decrease due to change in consolidated subsidiaries — — — (4)
Balance at March 31, 1999 124,792 18,670 16,760 22,574Cumulative effect of adopting deferred income tax accounting — — — 111Net income — — — 2,143Cash dividends paid (¥3.00 per share) — — — (374)
Balance at March 31, 2000 124,792 ¥ 18,670 ¥ 16,760 ¥ 24,454
Thousands of U.S. dollars (Note 1 (1))
Common Additional Retainedstock paid-in capital earnings
Balance at March 31, 1999 $175,883 $157,890 $212,661Cumulative effect of adopting deferred income tax accounting — — 1,046Net income — — 20,188Cash dividends paid ($0.03 per share) — — (3,523)
Balance at March 31, 2000 $175,883 $157,890 $230,372
See accompanying notes.
OKAMURA CORPORATION
Consolidated Statements of Shareholders’ EquityYears Ended March 31, 1999 and 2000

25
OKAMURA CORPORATION
Consolidated Statements of Cash FlowsYear Ended March 31, 1999
Millionsof yen
1999
Cash flows from operating activities:
Net loss ¥ (2,718)
Adjustments to reconcile net income to net cash provided by operating activities:
Depreciation and amortization 6,043
Loss on devaluation of investment securities 1,356
Gain on sale of marketable securities and investment securities (77)
Gain on sale of property, plant and equipment (293)
Loss on disposal of property, plant and equipment 267
Decrease in notes and accounts receivable—trade 5,773
Decrease in inventories 3,473
Decrease in notes and accounts payable—trade (9,059)
Decrease in income taxes payable (570)
Decrease in retirement benefits (218)
Increase in minority interests 97
Other (291)
Net cash provided by operating activities 3,783
Cash flows from investing activities:
Payments for purchase of property, plant and equipment (3,705)
Proceeds from sale of property, plant and equipment 1,186
Payments for purchase of investment securities and marketable securities (2,989)
Proceeds from sale of investment securities and marketable securities 2,947
Other (425)
Net cash used in investing activities (2,986)
Cash flows from financing activities:
Proceeds from long-term debt 6,304
Payments of long-term debt (184)
Decrease in short-term bank loans (5,227)
Cash dividends paid (624)
Net cash provided by financing activities 269
Net increase in cash 1,066
Cash at beginning of year 18,563
Cash at end of year ¥19,629
Supplemental disclosures of cash flow information
Cash paid during the year for:
Interest ¥ 1,068
Income taxes 1,074
See accompanying notes.

26
Thousands ofU.S. dollars
Millions of yen (Note 1 (1))
2000 2000
Cash flows from operating activities:
Income before income taxes ¥ 4,389 $ 41,347
Adjustments to reconcile net income to net cash provided by operating activities:
Depreciation and amortization 5,425 51,107
Loss on devaluation of investment securities 660 6,218
Gain on sale of investment securities (39) (367)
Gain on sale of property, plant and equipment (2,479) (23,354)
Loss on disposal of property, plant and equipment 423 3,985
Interest and dividends income (282) (2,657)
Interest expenses 1,137 10,711
Decrease in notes and accounts receivable—trade 5,446 51,305
Decrease in inventories 1,872 17,635
Decrease in notes and accounts payable—trade (5,829) (54,913)
Increase in retirement benefits 2,108 19,859
Other 801 7,546
Subtotal 13,632 128,422
Interest and dividends received 283 2,666
Interest expenses paid (1,079) (10,165)
Income taxes paid (429) (4,041)
Net cash provided by operating activities 12,407 116,882
Cash flows from investing activities:
Payments for purchase of property, plant and equipment (1,851) (17,438)
Proceeds from sale of property, plant and equipment 2,629 24,767
Payments for purchase of investment securities and marketable securities (398) (3,749)
Proceeds from sale of investment securities and marketable securities 847 7,979
Other (1,044) (9,835)
Net cash provided by investing activities 183 1,724
Cash flows from financing activities:
Proceeds from long-term debt 3,000 28,262
Payments of long-term debt (2,525) (23,787)
Decrease in short-term bank loans (8,700) (81,959)
Cash dividends paid (399) (3,759)
Other (2) (19)
Net cash used in financing activities (8,626) (81,262)
Effect of exchange rate changes on cash and cash equivalents (11) (104)
Net increase in cash and cash equivalents 3,953 37,240
Cash and cash equivalents at beginning of year 17,978 169,364
Cash and cash equivalents at end of year ¥21,931 $206,604
See accompanying notes.
OKAMURA CORPORATION
Consolidated Statements of Cash FlowsYear Ended March 31, 2000

27
OKAMURA CORPORATION
Notes to Consolidated Financial StatementsMarch 31, 1999 and 2000
1. SUMMARY OF SIGNIFICANT ACCOUNTING POLICIES(1) Basis of presenting financial statements
OKAMURA CORPORATION (the “Company”), a Japanese
corporation, and its consolidated domestic subsidiaries
maintain their accounts and records in conformity with ac-
counting principles and practices generally accepted in
Japan, which are different from the accounting and disclo-
sure requirements of International Accounting Standards.
The accounts of overseas consolidated subsidiaries are
based on their accounting records maintained in conformity
with generally accepted accounting principles and practices
prevailing in the respective countries of domicile.
The accompanying consolidated financial statements have
been translated from the consolidated financial statements
that are prepared for Japanese domestic purposes in accor-
dance with the provisions of the Securities and Exchange
Law of Japan and filed with the Ministry of Finance (“MOF”)
of Japan.
In preparing the accompanying consolidated financial
statements, certain reclassifications have been made in the
consolidated financial statements issued domestically in or-
der to present them in a form which is more familiar to read-
ers outside Japan. The consolidated statement of cash flows
for 1999 has been prepared for the purpose of inclusion in
the consolidated financial statements although such state-
ments were not customarily prepared in Japan and not re-
quired to be filed with MOF prior to 2000. Also, the
consolidated statements of shareholders’ equity have been
prepared even though such statements were not customarily
prepared in Japan and not required to be filed with the MOF.
The financial statements are stated in Japanese yen. The
translations of the Japanese yen amounts into U.S. dollars
are included solely for the convenience of the reader, using
the prevailing exchange rate at March 31, 2000, which was
¥106.15 to U.S.$1.00. The convenience translations should
not be construed as representations that the Japanese yen
amounts have been, could have been, or could in the future
be, converted into U.S. dollars at this or any other rate of ex-
change.
(2) Consolidated statements of cash flows
In preparing the consolidated statement of cash flows for
2000, cash on hand, readily available deposits and short-
term highly liquid investments with maturities of not exceed-
ing three months at the time of purchase are considered to
be cash and cash equivalents. The consolidated statement
of cash flows for 1999 used cash instead of cash and cash
equivalents.
The Company prepared the 2000 consolidated cash flow
statement as required by and in accordance with the “Stan-
dards for Preparation of Consolidated Cash Flow State-
ments, etc.” effective from the year ended March 31, 2000.
The 1999 consolidated cash flow statement, which was vol-
untarily prepared for the purpose of inclusion in the consoli-
dated financial statements in a form familiar to readers
outside Japan, has not been restated. Significant differences
in the consolidated cash flow statements for 2000 and 1999
include the use of pretax income in 2000 instead of net in-
come in 1999, additional disclosure in cash flows from oper-
ating activities in 2000 of interest expense, income tax
expense, interest and dividend income and interest and divi-
dends received.
(3) Basis of consolidation and accounting for
investments in affiliated companies
The consolidated financial statements comprise the ac-
counts of the Company and its nine significant subsidiaries
in 1999 and 2000. All significant intercompany accounts and
transactions have been eliminated in the consolidation. Ef-
fective for the year ended March 31, 2000, all companies are
required to consolidate all significant investees which are
controlled through substantial ownership of majority voting
rights or existence of certain conditions. Previously, only
majority-owned companies were consolidated. There was no
effect of applying this rule to the Company’s consolidated
financial statement.
The investments in affiliated companies are stated at their
underlying equity value. Effective for the year ended March
31, 2000, all companies are required to account for invest-
ments in affiliated companies (all 20% to 50% owned and
certain others 15% to 20% owned) by the equity method.
Previously, only investments in companies (20% to 50%
owned) whose financial, operational or business policies were
significantly influenced by the Company were required to be
accounted for by the equity method. There was no effect of
applying this rule to the Company’s consolidated financial
statement. The excess of the cost over the underlying net as-
sets of investments in consolidated subsidiaries and affiliated

28
companies is amortized over a five-year period with the ex-
ception of minor differences which are charged or credited to
income in the period of acquisition.
(4) Translation of foreign currencies
Short-term receivables and payables denominated in foreign
currencies are translated into Japanese yen at the current
exchange rate at the balance sheet date. Long-term receiv-
ables and payables denominated in foreign currencies are
translated at historical exchange rates except for those
hedged by forward exchange contracts. The bonds in for-
eign currencies are translated into Japanese yen at the con-
tracted forward exchange rate.
The exchange differences in translating long-term
payables at the historical rates and the contracted forward
rates are recognized as income over the period from the
date of forward exchange contract to the maturity date.
Financial statements of foreign operations are translated
into Japanese yen at the current exchange rate at the bal-
ance sheet date. The resulting translation adjustments are
reflected in the consolidated balance sheets as a part of
“other non-current assets.”
The financial statements of foreign subsidiaries are trans-
lated into yen on the basis of the year-end rates except that
retained earnings are translated at historical rates.
(5) Marketable securities and investment securities
Both marketable and investment securities that have quoted
market prices are stated at the lower of moving average cost
or quoted market price. Other securities are stated at cost
based on the moving average method adjusted for any sub-
stantial and non-recoverable decline in value.
(6) Inventories
Inventories are stated at cost, which is determined by the
moving average method.
(7) Depreciation and amortization
Depreciation of property, plant and equipment is computed
by the declining balance method at rates based on the use-
ful lives prescribed by the Japanese tax regulations, except
that the straight-line method is applied to buildings acquired
after March 31, 1998.
Amortization of intangible assets and long-term prepaid
expenses are computed by the straight-line method over pe-
riods prescribed by the Japanese Corporation Tax Law.
(8) Deferred charges
Research and development expenses including basic re-
search and fundamental development costs, which are for
the improvement of existing products or development of
new products, are charged to income when paid. Bond issue
expense is charged to income when bonds are issued.
(9) Bonuses
Bonuses to employees, which are paid semi-annually, are
accrued based upon management’s estimate of the amount
thereof. Bonuses to directors and corporate auditors, which
are subject to approval at the shareholders’ meeting, are ac-
counted for as an appropriation of retained earnings.
(10) Retirement benefits
Retirement benefits covering all employees are provided
through two arrangements: an unfunded lump-sum benefit
plan and a non-contributory funded pension plan. Upon re-
tirement or termination of employment, employees are gen-
erally entitled to lump-sum or annuity payments based on
their current rate of pay, length of service and cause of ter-
mination. The liability for retirement benefits is stated at full
amount which would be required to be paid if all eligible em-
ployees voluntarily retired as of the balance sheet date less
the estimated amount of the trusted pension assets.
Annual contributions for the funded pension plan, which
consist of normal cost and amortization of the prior service
costs over approximately 15 years, are charged to income
when paid.
Retirement benefits to directors and corporate auditors,
which are subject to approval at the shareholders’ meeting,
are charged to income when paid.
The Company and major consolidated subsidiaries also
provided for retirement allowances for directors and corpo-
rate auditors determined based on their internal rules at the
estimated amount to be paid if all directors and corporate
auditors retired at the balance sheet date.
(11) Income taxes
The Company provided income taxes at the amounts cur-
rently payable for the year ended March 31, 1999. Effective
April 1, 1999, the Company adopted a new accounting stan-
dard, which recognizes tax effects of temporary differences
between the financial statement carrying amounts and the
tax basis of assets and liabilities. Under the new accounting
standard, the provision for income taxes is computed based

29
on the pretax income included in the consolidated statement of
income. The asset and liability approach is used to recog-
nize deferred tax assets and liabilities for the expected future
tax consequences of temporary differences.
The amount of deferred income taxes attributable to the
net tax effects of the temporary differences at April 1, 1999
is reflected as an adjustment of ¥111 million ($1,046 thou-
sand) to the retained earnings brought forward from the pre-
vious year. Prior years’ financial statements have not been
restated.
The effect for the year ended March 31, 2000 was to de-
crease net income by ¥73 million ($688 thousand) and to in-
crease retained earnings by ¥32 million ($301 thousand).
(12) Amounts per share of common stock
Net income (loss) per share is computed based upon the
weighted average number of shares of common stock out-
standing during each year, exclusive of treasury shares.
The diluted net income per share of common stock is not
presented, since the Company has not issued any securities
with dilutive effect, such as bonds with warrants and con-
vertible bonds in 1999 and 2000.
Cash dividends per share represent the actual amount de-
clared as applicable to the respective years.
(13) Accounting for certain lease transactions
Finance leases which do not transfer the ownership of the
leased assets to the lessee are accounted for in the same
manner as operating leases.
(14) Reclassifications
Certain reclassifications have been made in the 1999 finan-
cial statements to conform to the presentation for 2000.
These changes had no impact on previously reported results
of operations or shareholders’ equity.
2. ACCOUNTING CHANGES(1) In the year ended March 31, 2000, the Company and
consolidated subsidiaries changed the method of account-
ing for retirement benefits for directors and corporate audi-
tors from cash basis to accrual basis to reflect periodic
income and expenses more appropriately.
As a result of this change, income before income taxes for
the year ended March 31, 2000 decreased by ¥451 million
($4,249 thousand).
(2) Effective April 1, 1999, the Company and consolidated
subsidiaries changed the accounting policy for freight in-
curred for transporting finished products from one factory to
another and included such freight in cost of sales. Previ-
ously, they were included in selling, general and administra-
tive expenses. The change was made in order to more
appropriately match revenue and costs in light of the fact
that the Company and consolidated subsidiaries increased
division of manufacturing processes among factories and
this increased the ratio of freight incurred between factories
to the cost of finished products. As a result of the change,
gross profit decreased by ¥1,700 million ($16,015 thousand)
and income before income taxes increased by ¥120 million
($1,130 thousand) in the year ended March 31, 2000 com-
pared with those using the previous method.
3. INVENTORIESInventories at March 31, 1999 and 2000 consisted of the
following:
Thousands ofMillions of yen U.S. dollars
1999 2000 2000
Finished products ¥12,357 ¥11,013 $103,749Work-in-process 2,715 1,207 11,371Raw materials and supplies 596 1,576 14,847
¥15,668 ¥13,796 $129,967
4. SHORT-TERM BANK LOANS AND LONG-TERM DEBTShort-term bank loans are represented by short-term notes,
principally of 90 days’ maturity, bearing interest at a
weighted average year-end rate of 1.24% and 0.9% at
March 31, 1999 and 2000, respectively.
Long-term debt at March 31, 1999 and 2000 consisted of
the following:
Thousands ofMillions of yen U.S. dollars
1999 2000 2000
Long-term bank loans principally 1.57%–4.60%, due through 2005 ¥15,144 ¥12,619 $118,8793.0% unsecured bonds due 2003 3,000 3,000 28,2622.79% unsecured bonds due 2002 2,000 2,000 18,8412.80% unsecured bonds due 2004 4,000 4,000 37,6832.67% Euro yen bonds due 2002 5,000 5,000 47,1032.14% Euro yen bonds due 2002 — 3,000 28,262Floating rate U.S. dollars guaranteed bonds due 2002 5,024 5,024 47,329
34,168 34,643 326,359Less amount due within one year 2,525 2,565 24,164
¥31,643 ¥32,078 $302,195
30
The parent company utilizes currency swap and interest
rate swap agreements, in order to hedge foreign currency
risks arising from U.S. dollar bonds and to fix floating inter-
est rates thereon. The derivative transactions are solely
made with highly rated financial institutions, and therefore,
the parent company considers there are no credit risks.
Property, plant and equipment at cost less accumulated
depreciation of ¥21,597 million ($203,457 thousand) was
pledged as collateral for short-term bank loans and long-
term debt at March 31, 2000.
The aggregate annual maturities of long-term debt at
March 31, 2000 are as follows:
Thousands ofYear ending March 31, Millions of yen U.S. dollars
2001 ¥ 2,565 $ 24,1642002 12,494 117,7012003 11,565 108,9452004 4,019 37,8662005 4,000 37,683
¥34,643 $326,359
5. SHAREHOLDERS’ EQUITYUnder the Japanese Commercial Code, the Company is re-
quired to appropriate as a legal reserve a portion of retained
earnings equal to at least 10% of cash dividends and bo-
nuses to directors and corporate auditors for each period
until the reserve equals 25% of the amount of common
stock. This reserve is not available for dividends, but may be
used to reduce a deficit by resolution of a shareholders’
meeting or may be capitalized by resolution of the Board of
Directors.
The maximum amount that the Company can distribute as
dividends is calculated based on the non-consolidated fi-
nancial statements of the Company in accordance with the
Japanese Commercial Code.
6. INFORMATION FOR CERTAIN LEASESLease payments under finance leases, which are accounted
for in the same manner as operating leases for the years
ended March 31, 1999 and 2000, were ¥541 million and
¥602 million ($5,671 thousand), respectively. Future lease
payments as of March 31, 2000 exclusive of interest under
such leases were ¥1,612 million ($15,186 thousand), includ-
ing ¥595 million ($5,605 thousand) due within one year.
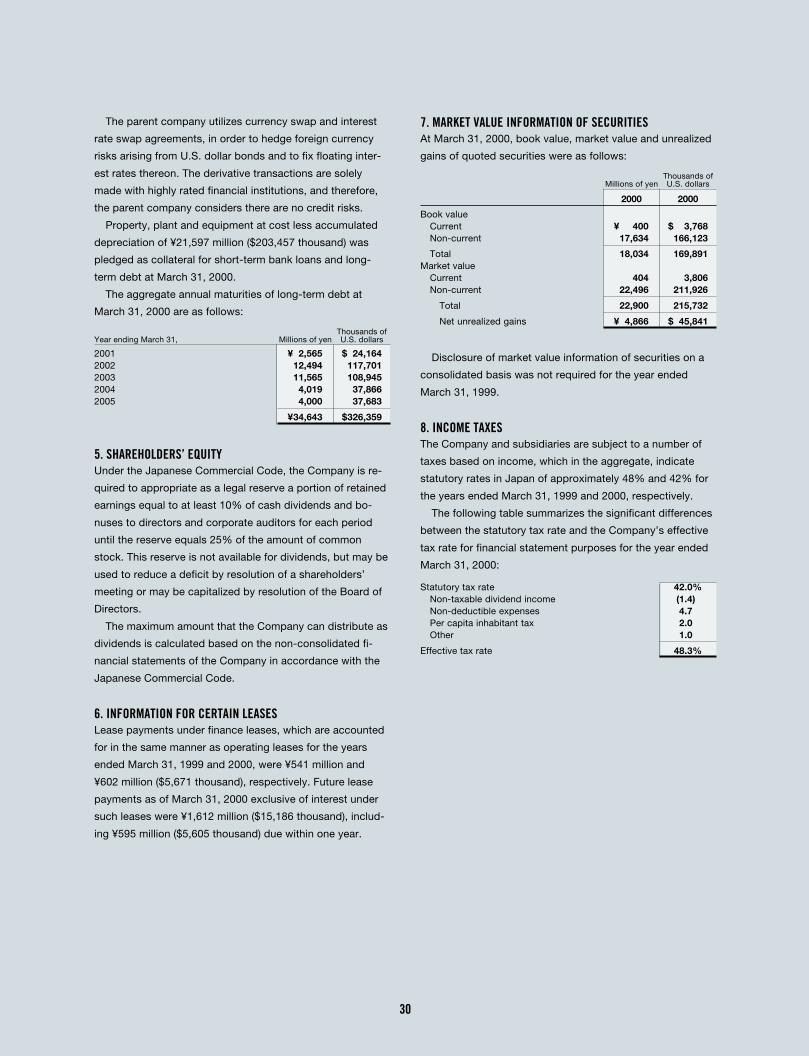
7. MARKET VALUE INFORMATION OF SECURITIESAt March 31, 2000, book value, market value and unrealized
gains of quoted securities were as follows:
Thousands ofMillions of yen U.S. dollars
2000 2000
Book valueCurrent ¥ 400 $ 3,768Non-current 17,634 166,123
Total 18,034 169,891Market value
Current 404 3,806Non-current 22,496 211,926
Total 22,900 215,732
Net unrealized gains ¥ 4,866 $ 45,841
Disclosure of market value information of securities on a
consolidated basis was not required for the year ended
March 31, 1999.
8. INCOME TAXESThe Company and subsidiaries are subject to a number of
taxes based on income, which in the aggregate, indicate
statutory rates in Japan of approximately 48% and 42% for
the years ended March 31, 1999 and 2000, respectively.
The following table summarizes the significant differences
between the statutory tax rate and the Company’s effective
tax rate for financial statement purposes for the year ended
March 31, 2000:
Statutory tax rate 42.0%Non-taxable dividend income (1.4)Non-deductible expenses 4.7Per capita inhabitant tax 2.0Other 1.0
Effective tax rate 48.3%

31
Significant components of the Company’s and subsidiar-
ies’ deferred income taxes as of March 31, 2000 are as fol-
lows:
Thousands ofMillions of yen U.S. dollars
2000 2000
Deferred income taxes (current assets):Excess bonuses accrued ¥ 338 $ 3,184Enterprise taxes 160 1,507Valuation loss of finished products 96 905Other 195 1,837
Net deferred income taxes (current assets) ¥ 789 $ 7,433
Deferred income taxes (long-term liabilities):Reserve for deferred income taxes ¥(4,438) $(41,809)
Total deferred tax liabilities (4,438) (41,809)Amount offset against deferred tax assets 2,139 20,151
Net deferred income taxes (long-term liabilities) ¥(2,299) $(21,658)
Deferred income taxes (non-current assets):Retirement benefits ¥ 2,571 $ 24,221Unrealized gross profits from sales of property, plant and equipment 769 7,244Excess bad debt expenses 205 1,931Other 160 1,508
Total deferred income taxes (non-current assets) 3,705 34,904Amount offset against deferred tax liabilities 2,139 20,151
Net deferred income taxes (non-current assets) ¥ 1,566 $ 14,753
9. SEGMENT INFORMATIONThe Company and its consolidated subsidiaries operate
mainly in manufacturing and sale of furniture, store displays,
industrial racks and shelving, hydraulic transmissions and
others. Operations in the other business segment include the
real estate business.
Thousands ofMillions of yen U.S. dollars
1999 2000 2000
Sales:Furniture ¥108,328 ¥106,424 $1,002,581Store displays, industrial racks and shelving 58,793 56,053 528,055Hydraulic transmissions 2,412 2,329 21,941Others 427 517 4,870
Consolidated ¥169,960 ¥165,323 $1,557,447
Operating expenses:Furniture ¥109,819 ¥103,689 $ 976,816Store displays, industrial racks and shelving 57,744 53,934 508,093Hydraulic transmissions 2,519 2,268 21,366Others 249 487 4,587
170,331 160,378 1,510,862Corporate 229 252 2,374
Consolidated ¥170,560 ¥160,630 $1,513,236
Thousands ofMillions of yen U.S. dollars
1999 2000 2000
Operating income (loss):Furniture ¥ (1,491) ¥ 2,735 $ 25,765Store displays, industrial racks and shelving 1,049 2,119 19,962Hydraulic transmissions (107) 61 575Others 178 30 283
(371) 4,945 46,585Elimination (229) (252) (2,374)
Consolidated ¥ (600) ¥ 4,693 $ 44,211
Identifiable assets:Furniture ¥ 96,220 ¥ 84,576 $ 796,759Store displays, industrial racks and shelving 43,470 39,402 371,192Hydraulic transmissions 2,714 1,677 15,798Others 139 188 1,771
142,543 125,843 1,185,520Corporate assets 35,617 46,327 436,430
Consolidated ¥178,160 ¥172,170 $1,621,950
Depreciation:Furniture ¥4,014 ¥3,877 $36,524Store displays, industrial racks and shelving 1,888 1,431 13,481Hydraulic transmissions 141 117 1,102Others 0 0 0
Consolidated ¥6,043 ¥5,425 $51,107
Capital expenditures:Furniture ¥1,236 ¥1,043 $ 9,826Store displays, industrial racks and shelving 774 471 4,437Hydraulic transmissions 200 27 254Others — — —
2,210 1,541 14,517Corporate 448 1,149 10,824
Consolidated ¥2,658 ¥2,690 $25,341
Geographic segment information was not shown since ag-
gregate sales of overseas consolidated subsidiaries were
less than 10% of the consolidated net sales for the years
ended March 31, 1999 and 2000 and assets of overseas
consolidated subsidiaries were less than 10% of the consoli-
dated assets at March 31, 1999 and 2000.
Overseas sales was not shown, since overseas sales were
less than 10% of the Company’s consolidated net sales for
the years ended March 31, 1999 and 2000.
10. SUBSEQUENT EVENTAt the annual general meeting held on June 29, 2000, the
Company’s shareholders approved the appropriations of re-
tained earnings at March 31, 2000 as follows:
Thousands ofMillions of yen U.S. dollars
Cash dividends, ¥1.50 ($0.014) per share ¥187 $1,762

32
To the Shareholders and the Board of Directorsof OKAMURA CORPORATION:
We have audited the accompanying consolidatedbalance sheets of OKAMURA CORPORATION (aJapanese corporation) and subsidiaries as ofMarch 31, 1999 and 2000, and the related con-solidated statements of operations, shareholders’equity and cash flows for the years then ended,all expressed in Japanese yen. Our audits weremade in accordance with generally accepted au-diting standards in Japan and, accordingly, in-cluded such tests of the accounting records andsuch other auditing procedures as we considerednecessary in the circumstances.
In our opinion, the consolidated financial state-ments referred to above present fairly the con-solidated financial position of OKAMURACORPORATION and subsidiaries as of March 31,1999 and 2000, and the consolidated results oftheir operations and their cash flows for the yearsthen ended in conformity with accounting prin-ciples generally accepted in Japan applied on aconsistent basis during the periods, except asnoted in the following paragraph.
As explained in Notes 1 (3) and 1 (11), in the yearended March 31, 2000, OKAMURA CORPORA-TION and subsidiaries prospectively adoptednew Japanese accounting standards for consoli-dation and equity method accounting and incometaxes. Also, OKAMURA CORPORATION and sub-sidiaries changed the methods of accounting forretirement benefits and freight, effective April 1,1999, as referred to in Note 2, with which weconcur.
Also, in our opinion, the U.S. dollar amounts inthe accompanying consolidated financial state-ments have been translated from Japanese yenon the basis set forth in Note 1 (1).
Yokohama, JapanJune 29, 2000
Statement on Accounting Principles and Auditing Standards
OKAMURA CORPORATION
Report of Independent Public Accountants
This statement is to remind users that accountingprinciples and auditing standards and their appli-cation in practice may vary among nations andtherefore could affect, possibly materially, the re-ported financial position and results of opera-tions. The accompanying consolidated financialstatements are prepared based on accountingprinciples generally accepted in Japan, and the
auditing standards and their application in prac-tice are those generally accepted in Japan. Ac-cordingly, the accompanying consolidatedfinancial statements and the auditors’ report pre-sented above are for users familiar with Japaneseaccounting principles, auditing standards andtheir application in practice.

CORPORATE DATA
33
Executive Office
Tenri Bldg., 1-4-1, Kitasaiwai, Nishi-ku,Yokohama 220-0004, JapanTelephone: (045) 319-3401Facsimile: (045) 319-3515http://www.okamura.co.jp/
Registered Head Office
2-7-18, Kitasaiwai, Nishi-ku, Yokohama 220-0004,Japan
Tokyo Office
Kokusai Shin-Akasaka Bldg. West6-1-20, Akasaka, Minato-ku, Tokyo 107-0052, JapanTelephone: (03) 5561-4085Facsimile: (03) 5561-4086
Establishment
1945
Number of Shares of Common Stock
Authorized: 200,000,000Issued: 124,791,530
Stock Exchange Listing
Tokyo, Osaka
Paid-in Capital
¥18,670 million
Number of Shareholders
7,994
Number of Employees
2,781 (As of March 31, 2000)
Significant Subsidiaries
Kansai Okamura Manufacturing Co., Ltd.NS Okamura CorporationOkamura Logistics CorporationOkamura Estate CorporationOkamura International (Singapore) Pte Ltd.Okamura Business Support CorporationFM Solution CorporationDIA Steel Furniture CorporationOkamura Support and Service CorporationHILL INTERNATIONAL INC.
Principal Affiliates
JT Okamura CorporationSiam Okamura Steel Co., Ltd.Siam Okamura International Co., Ltd.Asahi Sofu CorporationSEIWA BUSINESS Corporation
(As of June 29, 2000)
INTERNATIONAL COLLABORATION
Technical Tie-ups
L.A. Darling Company, U.S.A. - Store display fixtures
Ermanco Inc., U.S.A. - XenoROL conveyors
Haworth Inc., U.S.A. - Panel Systems
Howe Furniture Corp., U.S.A. - Tables
Hüppe Form Raumtrennsystems GmbH, Germany - Ferro-Wall (sliding partitions)
Jayson Concepts Inc.,U.S.A. - Vertique Storage System
Martela Oy, Finland - Seating
O.C.S., Sweden - Overhead conveyor system
Pro-cord S.p.A. (Piretti), Italy - Seating
Tyler Refrigeration Corp., U.S.A. - Refrigerated showcases
wiesner hager Möbel GmbH, Austria - Public seating
Technology Exports
Siam Steel International Public Co.,Ltd., Thailand - Office storage units, low partitions
U-BIX Corporaiton, the Philippines - N-8 low partitions
Sales Tie-ups
Arrben snc., Italy - Seating
Gruppo Industriale Busnelli s.p.a., Italy - Seating
Ateliers Reunis Caddie S.A., France - Caddie shopping trolley
CIL International Ltd., England - Store display systems
Comforto Systems S.A., Germany - Seating
DESTRO S.P.A., Italy - Theater seating
Fora Form, Norway - System tables
Fisher Hamilton Scientific Inc., U.S.A. - Laboratory furniture
JEKA industriële efficiency bv, the Netherlands - Picking systems
A/S Modulex, Denmark - Sign systems
Newell International, U.S.A. - Computer accessories
Plastics Research Corp., U.S.A. - Power Shelf display furnishings
SMED International Inc., Canada - Kyo office furniture
Sebel Furniture Ltd., Australia - Public furniture
WOGG A.G., Switzerland - Folding tables
Axmann Fördertechnik GmbH, Germany - Cross belt sorter

Printed on 100% recycled paper
YZC122-0N1 P.AI 2000-11
Printed in Japan
OKAMURA CORPORATIONTenri Bldg., 1-4-1, Kitasaiwai, Nishi-ku, Yokohama 220-0004, JapanTelephone: (045) 319-3401 Facsimile: (045) 319-3515http://www.okamura.co.jp/
Related Documents