Financial Section Consolidated Financial Statements...................... 56 Notes ...................................................................... 62 Report of Independent Auditors ......................... 83 55 Mizuho Securities Annual Report 2011

Welcome message from author
This document is posted to help you gain knowledge. Please leave a comment to let me know what you think about it! Share it to your friends and learn new things together.
Transcript

Financial Section
Consolidated Financial Statements...................... 56
Notes ...................................................................... 62
Report of Independent Auditors ......................... 83
55Mizuho Securities Annual Report 2011
Consolidated Financial Statements
Thousands of Millions of yen U.S. dollars
2011 2010 2011
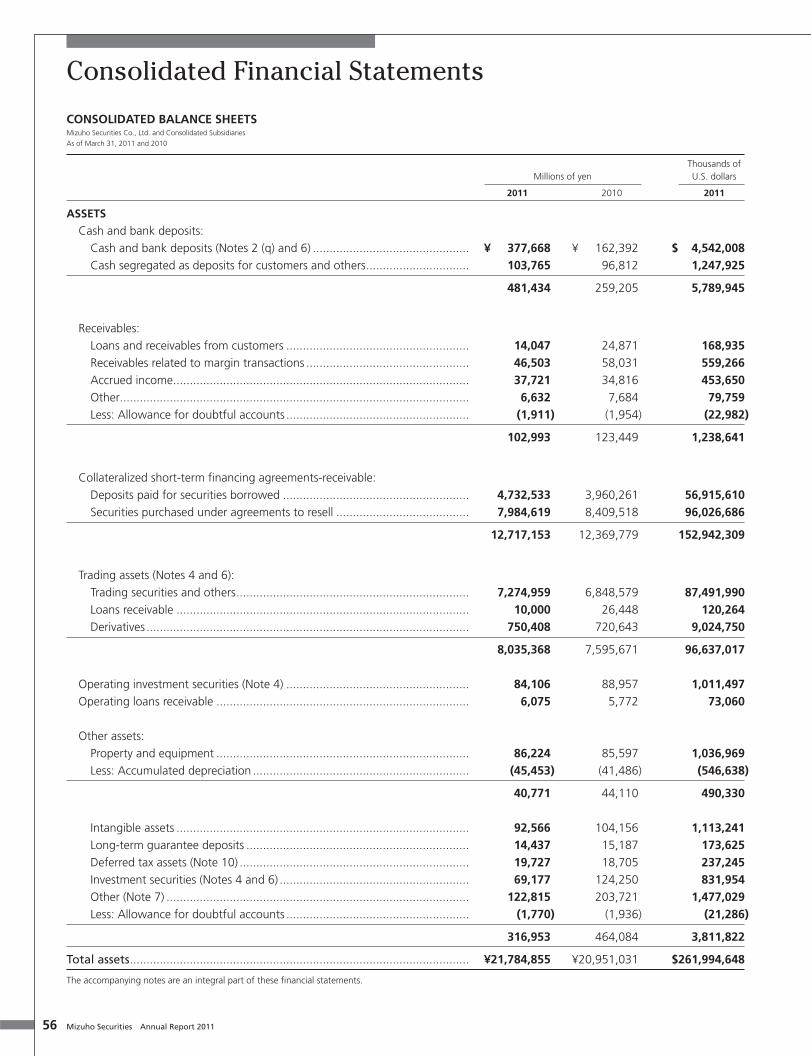
ASSETS
Cash and bank deposits: Cash and bank deposits (Notes 2 (q) and 6) ............................................... ¥ 377,668 ¥ 162,392 $ 4,542,008 Cash segregated as deposits for customers and others ............................... 103,765 96,812 1,247,925
481,434 259,205 5,789,945
Receivables: Loans and receivables from customers ....................................................... 14,047 24,871 168,935 Receivables related to margin transactions ................................................. 46,503 58,031 559,266 Accrued income ......................................................................................... 37,721 34,816 453,650 Other ......................................................................................................... 6,632 7,684 79,759 Less: Allowance for doubtful accounts ....................................................... (1,911) (1,954) (22,982)
102,993 123,449 1,238,641
Collateralized short-term fi nancing agreements-receivable: Deposits paid for securities borrowed ........................................................ 4,732,533 3,960,261 56,915,610 Securities purchased under agreements to resell ........................................ 7,984,619 8,409,518 96,026,686
12,717,153 12,369,779 152,942,309
Trading assets (Notes 4 and 6): Trading securities and others ...................................................................... 7,274,959 6,848,579 87,491,990 Loans receivable ........................................................................................ 10,000 26,448 120,264 Derivatives ................................................................................................. 750,408 720,643 9,024,750
8,035,368 7,595,671 96,637,017
Operating investment securities (Note 4) ....................................................... 84,106 88,957 1,011,497 Operating loans receivable ............................................................................ 6,075 5,772 73,060
Other assets: Property and equipment ............................................................................ 86,224 85,597 1,036,969 Less: Accumulated depreciation ................................................................. (45,453) (41,486) (546,638)
40,771 44,110 490,330
Intangible assets ........................................................................................ 92,566 104,156 1,113,241 Long-term guarantee deposits ................................................................... 14,437 15,187 173,625 Deferred tax assets (Note 10) ..................................................................... 19,727 18,705 237,245 Investment securities (Notes 4 and 6) ......................................................... 69,177 124,250 831,954 Other (Note 7) ........................................................................................... 122,815 203,721 1,477,029 Less: Allowance for doubtful accounts ....................................................... (1,770) (1,936) (21,286)
316,953 464,084 3,811,822
Total assets ...................................................................................................... ¥21,784,855 ¥20,951,031 $261,994,648
The accompanying notes are an integral part of these fi nancial statements.
CONSOLIDATED BALANCE SHEETSMizuho Securities Co., Ltd. and Consolidated Subsidiaries
As of March 31, 2011 and 2010
56 Mizuho Securities Annual Report 2011
Thousands of Millions of yen U.S. dollars
2011 2010 2011
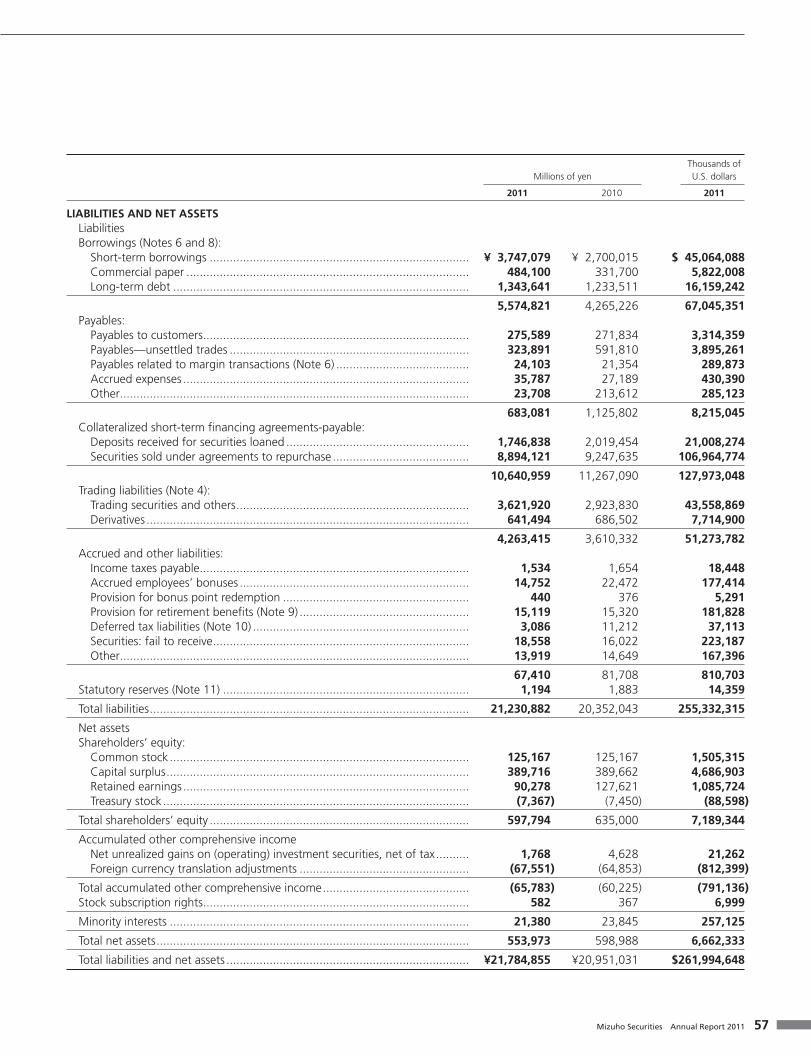
LIABILITIES AND NET ASSETS Liabilities Borrowings (Notes 6 and 8): Short-term borrowings .............................................................................. ¥ 3,747,079 ¥ 2,700,015 $ 45,064,088 Commercial paper ..................................................................................... 484,100 331,700 5,822,008 Long-term debt ......................................................................................... 1,343,641 1,233,511 16,159,242
5,574,821 4,265,226 67,045,351 Payables: Payables to customers ................................................................................ 275,589 271,834 3,314,359 Payables—unsettled trades ........................................................................ 323,891 591,810 3,895,261 Payables related to margin transactions (Note 6) ........................................ 24,103 21,354 289,873 Accrued expenses ...................................................................................... 35,787 27,189 430,390 Other ......................................................................................................... 23,708 213,612 285,123
683,081 1,125,802 8,215,045 Collateralized short-term fi nancing agreements-payable: Deposits received for securities loaned ....................................................... 1,746,838 2,019,454 21,008,274 Securities sold under agreements to repurchase ......................................... 8,894,121 9,247,635 106,964,774
10,640,959 11,267,090 127,973,048 Trading liabilities (Note 4): Trading securities and others ...................................................................... 3,621,920 2,923,830 43,558,869 Derivatives ................................................................................................. 641,494 686,502 7,714,900
4,263,415 3,610,332 51,273,782 Accrued and other liabilities: Income taxes payable ................................................................................. 1,534 1,654 18,448 Accrued employees’ bonuses ..................................................................... 14,752 22,472 177,414 Provision for bonus point redemption ........................................................ 440 376 5,291 Provision for retirement benefi ts (Note 9) ................................................... 15,119 15,320 181,828 Deferred tax liabilities (Note 10) ................................................................. 3,086 11,212 37,113 Securities: fail to receive ............................................................................. 18,558 16,022 223,187 Other ......................................................................................................... 13,919 14,649 167,396
67,410 81,708 810,703 Statutory reserves (Note 11) .......................................................................... 1,194 1,883 14,359
Total liabilities ................................................................................................ 21,230,882 20,352,043 255,332,315
Net assets Shareholders’ equity: Common stock .......................................................................................... 125,167 125,167 1,505,315 Capital surplus ........................................................................................... 389,716 389,662 4,686,903 Retained earnings ...................................................................................... 90,278 127,621 1,085,724 Treasury stock ............................................................................................ (7,367) (7,450) (88,598)
Total shareholders’ equity .............................................................................. 597,794 635,000 7,189,344
Accumulated other comprehensive income Net unrealized gains on (operating) investment securities, net of tax .......... 1,768 4,628 21,262 Foreign currency translation adjustments ................................................... (67,551) (64,853) (812,399)
Total accumulated other comprehensive income ............................................ (65,783) (60,225) (791,136) Stock subscription rights ................................................................................ 582 367 6,999
Minority interests .......................................................................................... 21,380 23,845 257,125
Total net assets .............................................................................................. 553,973 598,988 6,662,333
Total liabilities and net assets ......................................................................... ¥21,784,855 ¥20,951,031 $261,994,648
57Mizuho Securities Annual Report 2011
Thousands of Millions of yen U.S. dollars
2011 2010 2011
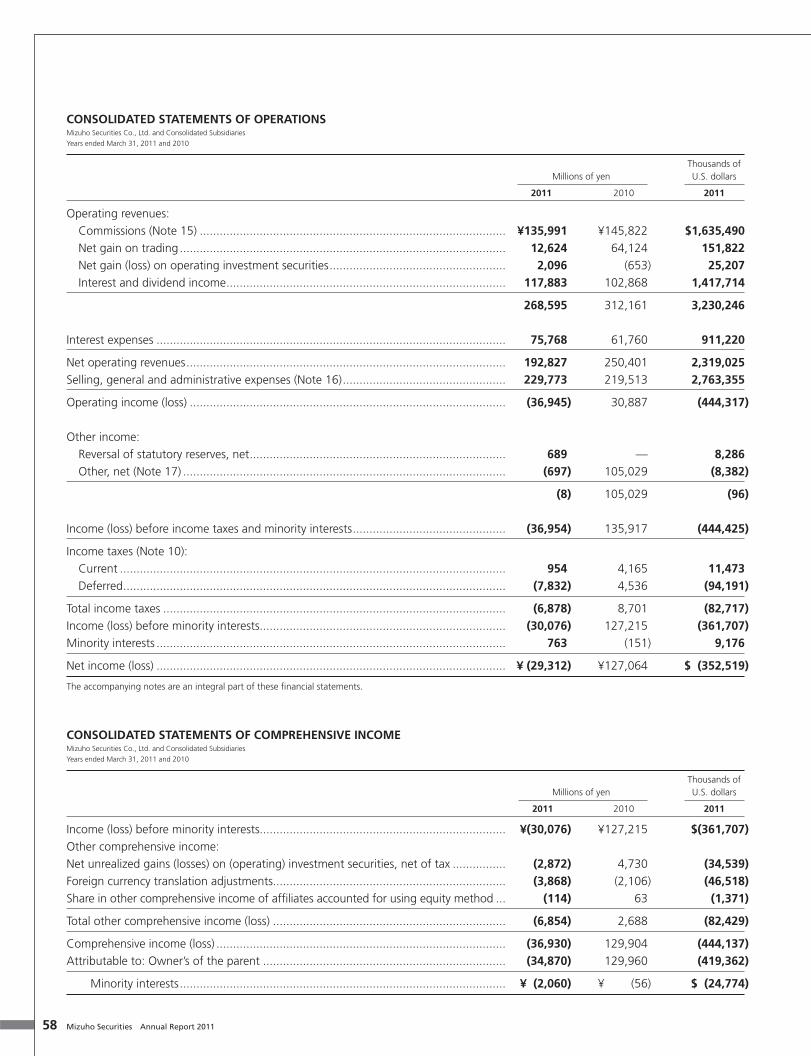
Operating revenues: Commissions (Note 15) ............................................................................................ ¥135,991 ¥145,822 $1,635,490 Net gain on trading .................................................................................................. 12,624 64,124 151,822 Net gain (loss) on operating investment securities ..................................................... 2,096 (653) 25,207 Interest and dividend income .................................................................................... 117,883 102,868 1,417,714
268,595 312,161 3,230,246
Interest expenses ......................................................................................................... 75,768 61,760 911,220
Net operating revenues ................................................................................................ 192,827 250,401 2,319,025Selling, general and administrative expenses (Note 16) ................................................. 229,773 219,513 2,763,355
Operating income (loss) ............................................................................................... (36,945) 30,887 (444,317)
Other income: Reversal of statutory reserves, net ............................................................................. 689 — 8,286 Other, net (Note 17) ................................................................................................. (697) 105,029 (8,382)
(8) 105,029 (96)
Income (loss) before income taxes and minority interests .............................................. (36,954) 135,917 (444,425)
Income taxes (Note 10): Current .................................................................................................................... 954 4,165 11,473 Deferred ................................................................................................................... (7,832) 4,536 (94,191)
Total income taxes ....................................................................................................... (6,878) 8,701 (82,717)Income (loss) before minority interests.......................................................................... (30,076) 127,215 (361,707)Minority interests ......................................................................................................... 763 (151) 9,176
Net income (loss) ......................................................................................................... ¥ (29,312) ¥127,064 $ (352,519)
The accompanying notes are an integral part of these fi nancial statements.
Thousands of Millions of yen U.S. dollars
2011 2010 2011
Income (loss) before minority interests.......................................................................... ¥(30,076) ¥127,215 $(361,707)Other comprehensive income:Net unrealized gains (losses) on (operating) investment securities, net of tax ................ (2,872) 4,730 (34,539)Foreign currency translation adjustments...................................................................... (3,868) (2,106) (46,518)Share in other comprehensive income of affi liates accounted for using equity method ... (114) 63 (1,371)
Total other comprehensive income (loss) ...................................................................... (6,854) 2,688 (82,429)
Comprehensive income (loss) ....................................................................................... (36,930) 129,904 (444,137)Attributable to: Owner’s of the parent ......................................................................... (34,870) 129,960 (419,362)
Minority interests .................................................................................................. ¥ (2,060) ¥ (56) $ (24,774)
CONSOLIDATED STATEMENTS OF OPERATIONSMizuho Securities Co., Ltd. and Consolidated Subsidiaries
Years ended March 31, 2011 and 2010
CONSOLIDATED STATEMENTS OF COMPREHENSIVE INCOMEMizuho Securities Co., Ltd. and Consolidated Subsidiaries
Years ended March 31, 2011 and 2010
58 Mizuho Securities Annual Report 2011
Consolidated Financial Statements
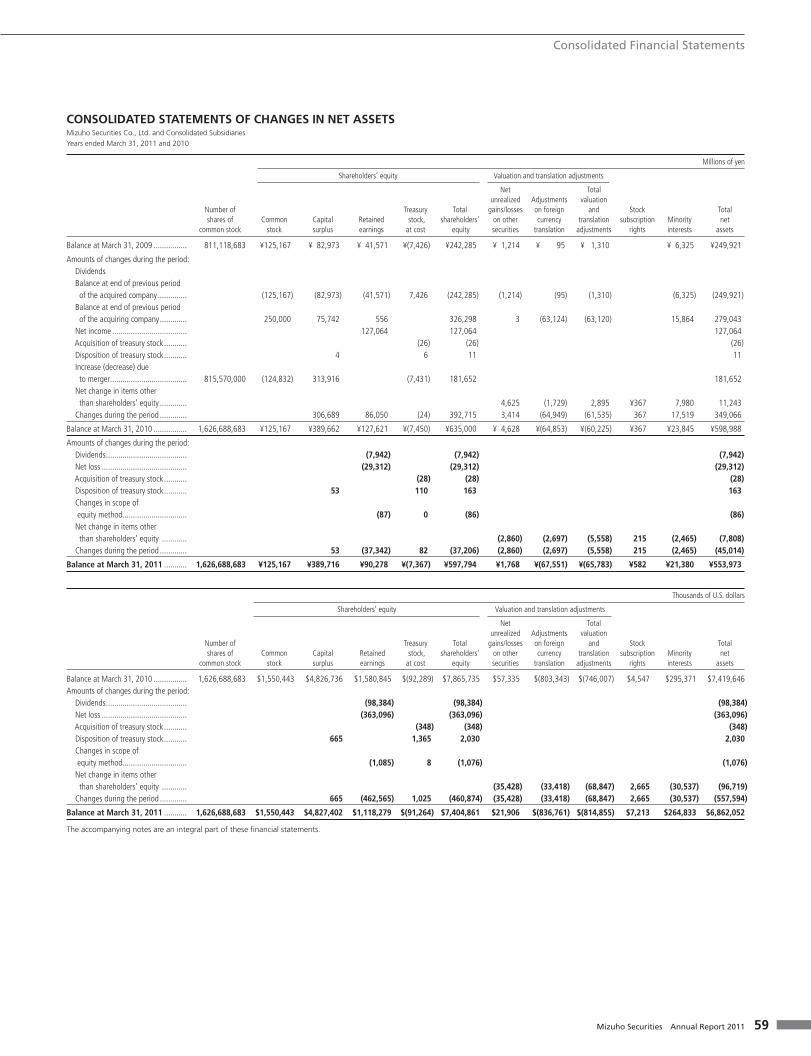
Millions of yen
Shareholders’ equity Valuation and translation adjustments
Net Total unrealized Adjustments valuation Number of Treasury Total gains/losses on foreign and Stock Total shares of Common Capital Retained stock, shareholders’ on other currency translation subscription Minority net common stock stock surplus earnings at cost equity securities translation adjustments rights interests assets
Balance at March 31, 2009 ................ 811,118,683 ¥125,167 ¥ 82,973 ¥ 41,571 ¥(7,426) ¥242,285 ¥ 1,214 ¥ 95 ¥ 1,310 ¥ 6,325 ¥249,921
Amounts of changes during the period: Dividends Balance at end of previous period of the acquired company .............. (125,167) (82,973) (41,571) 7,426 (242,285) (1,214) (95) (1,310) (6,325) (249,921) Balance at end of previous period of the acquiring company ............. 250,000 75,742 556 326,298 3 (63,124) (63,120) 15,864 279,043 Net income .................................... 127,064 127,064 127,064 Acquisition of treasury stock ........... (26) (26) (26) Disposition of treasury stock ........... 4 6 11 11 Increase (decrease) due to merger ..................................... 815,570,000 (124,832) 313,916 (7,431) 181,652 181,652 Net change in items other than shareholders’ equity ............. 4,625 (1,729) 2,895 ¥367 7,980 11,243 Changes during the period ............. 306,689 86,050 (24) 392,715 3,414 (64,949) (61,535) 367 17,519 349,066
Balance at March 31, 2010 ................ 1,626,688,683 ¥125,167 ¥389,662 ¥127,621 ¥(7,450) ¥635,000 ¥ 4,628 ¥(64,853) ¥(60,225) ¥367 ¥23,845 ¥598,988
Amounts of changes during the period: Dividends ....................................... (7,942) (7,942) (7,942) Net loss ......................................... (29,312) (29,312) (29,312) Acquisition of treasury stock ........... (28) (28) (28) Disposition of treasury stock ........... 53 110 163 163 Changes in scope of equity method ............................... (87) 0 (86) (86) Net change in items other than shareholders’ equity ............ (2,860) (2,697) (5,558) 215 (2,465) (7,808) Changes during the period ............. 53 (37,342) 82 (37,206) (2,860) (2,697) (5,558) 215 (2,465) (45,014)
Balance at March 31, 2011 ........... 1,626,688,683 ¥125,167 ¥389,716 ¥90,278 ¥(7,367) ¥597,794 ¥1,768 ¥(67,551) ¥(65,783) ¥582 ¥21,380 ¥553,973
Thousands of U.S. dollars
Shareholders’ equity Valuation and translation adjustments
Net Total unrealized Adjustments valuation Number of Treasury Total gains/losses on foreign and Stock Total shares of Common Capital Retained stock, shareholders’ on other currency translation subscription Minority net common stock stock surplus earnings at cost equity securities translation adjustments rights interests assets
Balance at March 31, 2010 ................ 1,626,688,683 $1,550,443 $4,826,736 $1,580,845 $(92,289) $7,865,735 $57,335 $(803,343) $(746,007) $4,547 $295,371 $7,419,646 Amounts of changes during the period: Dividends ....................................... (98,384) (98,384) (98,384) Net loss ......................................... (363,096) (363,096) (363,096) Acquisition of treasury stock ........... (348) (348) (348) Disposition of treasury stock ........... 665 1,365 2,030 2,030 Changes in scope of equity method ............................... (1,085) 8 (1,076) (1,076) Net change in items other than shareholders’ equity ............ (35,428) (33,418) (68,847) 2,665 (30,537) (96,719) Changes during the period ............. 665 (462,565) 1,025 (460,874) (35,428) (33,418) (68,847) 2,665 (30,537) (557,594)
Balance at March 31, 2011 ........... 1,626,688,683 $1,550,443 $4,827,402 $1,118,279 $(91,264) $7,404,861 $21,906 $(836,761) $(814,855) $7,213 $264,833 $6,862,052
The accompanying notes are an integral part of these fi nancial statements.
CONSOLIDATED STATEMENTS OF CHANGES IN NET ASSETSMizuho Securities Co., Ltd. and Consolidated Subsidiaries
Years ended March 31, 2011 and 2010
59Mizuho Securities Annual Report 2011
Thousands of Millions of yen U.S. dollars
2011 2010 2011
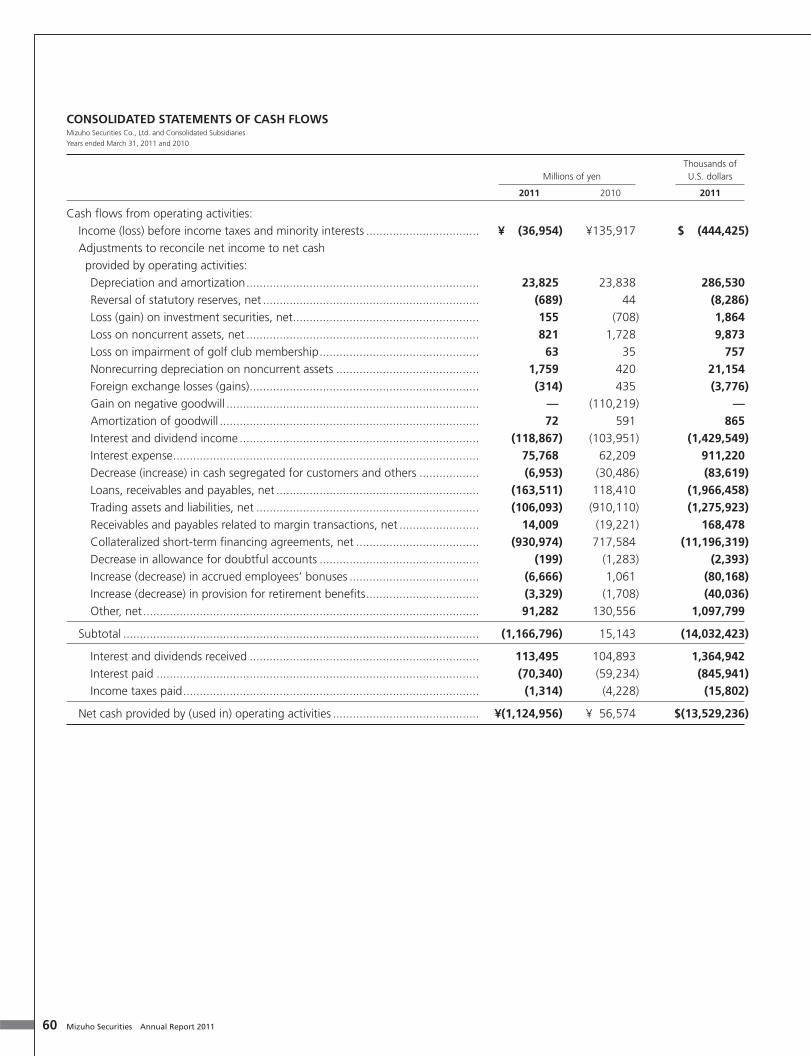
Cash fl ows from operating activities: Income (loss) before income taxes and minority interests .................................. ¥ (36,954) ¥135,917 $ (444,425) Adjustments to reconcile net income to net cash provided by operating activities: Depreciation and amortization ...................................................................... 23,825 23,838 286,530 Reversal of statutory reserves, net ................................................................. (689) 44 (8,286) Loss (gain) on investment securities, net ........................................................ 155 (708) 1,864 Loss on noncurrent assets, net ...................................................................... 821 1,728 9,873 Loss on impairment of golf club membership ................................................ 63 35 757 Nonrecurring depreciation on noncurrent assets ........................................... 1,759 420 21,154 Foreign exchange losses (gains) ..................................................................... (314) 435 (3,776) Gain on negative goodwill ............................................................................ — (110,219) — Amortization of goodwill .............................................................................. 72 591 865 Interest and dividend income ........................................................................ (118,867) (103,951) (1,429,549) Interest expense ............................................................................................ 75,768 62,209 911,220 Decrease (increase) in cash segregated for customers and others .................. (6,953) (30,486) (83,619) Loans, receivables and payables, net ............................................................. (163,511) 118,410 (1,966,458) Trading assets and liabilities, net ................................................................... (106,093) (910,110) (1,275,923) Receivables and payables related to margin transactions, net ........................ 14,009 (19,221) 168,478 Collateralized short-term fi nancing agreements, net ..................................... (930,974) 717,584 (11,196,319) Decrease in allowance for doubtful accounts ................................................ (199) (1,283) (2,393) Increase (decrease) in accrued employees’ bonuses ....................................... (6,666) 1,061 (80,168) Increase (decrease) in provision for retirement benefi ts .................................. (3,329) (1,708) (40,036) Other, net ..................................................................................................... 91,282 130,556 1,097,799
Subtotal ........................................................................................................... (1,166,796) 15,143 (14,032,423)
Interest and dividends received ..................................................................... 113,495 104,893 1,364,942 Interest paid ................................................................................................. (70,340) (59,234) (845,941) Income taxes paid ......................................................................................... (1,314) (4,228) (15,802)
Net cash provided by (used in) operating activities ............................................ ¥(1,124,956) ¥ 56,574 $(13,529,236)
CONSOLIDATED STATEMENTS OF CASH FLOWSMizuho Securities Co., Ltd. and Consolidated Subsidiaries
Years ended March 31, 2011 and 2010
60 Mizuho Securities Annual Report 2011

Consolidated Financial Statements
Thousands of Millions of yen U.S. dollars
2011 2010 2011
Cash fl ows from investing activities: Payments for time deposits ............................................................................... ¥ (8,912) ¥ (9,655) $ (107,179) Proceeds from withdrawal of time deposits ...................................................... 9,421 5,952 113,301 Payments for purchases of investment securities ............................................... (5,330) (13,521) (64,101) Proceeds from sales and redemptions of investment securities .......................... 13,028 8,693 156,680 Payments for purchases of property and equipment ......................................... (2,517) (6,718) (30,270) Proceeds from sales of property and equipment ............................................... 1 128 12 Payments for purchases of intangible assets ..................................................... (9,296) (7,610) (111,797) Payments for long-term loans receivable ........................................................... — (8,749) — Collection of long-term loans receivable ........................................................... 4,709 1,557 56,632 Decrease (increase) in short-term loans receivable ............................................. 3,095 (1,504) 37,221 Proceeds from collection of long-term guarantee deposits ................................ 1,290 3,560 15,514 Payments for long-term guarantee deposits ...................................................... (585) (2,094) (7,035) Other, net ........................................................................................................ (608) (361) (7,312)
Net cash provided by (used in) investing activities ............................................. 4,296 (30,323) 51,665
Cash fl ows from fi nancing activities: Increase (decrease) in short-term borrowings .................................................... 1,053,216 (133,439) 12,666,458 Increase (decrease) in commercial paper ........................................................... 152,400 34,100 1,832,832 Increase in long-term debt ................................................................................ 294,110 249,462 3,537,101 Decrease in long-term debt .............................................................................. (186,588) (218,889) (2,243,992) Acquisition of treasury stock ............................................................................. (28) (26) (336) Proceeds from reissuance of treasury stock ....................................................... 6 6 72 Payment of cash dividends ............................................................................... (7,963) (2,318) (95,766) Proceeds from stock issuance to minority interests ............................................ — 540 — Payment of cash dividends to minority interests ................................................ (150) (175) (1,803) Repayment of lease obligations ........................................................................ (1,021) (1,434) (12,279)
Net cash provided by (used in) fi nancing activities ............................................. 1,303,981 (72,176) 15,682,273
Effect of exchange rate changes on cash and cash equivalents ............................. (8,150) 1,376 (98,015)
Net increase (decrease) in cash and cash equivalents ............................................ 175,171 (44,549) 2,106,686
Cash and cash equivalents at beginning of period ................................................ 195,206 171,890 2,347,636
Beginning balance of cash and cash equivalents: Acquired company .................... — (171,890) —
Beginning balance of cash and cash equivalents: Acquiring company ................... — 89,560 —
Increase in cash and cash equivalents due to merger ............................................ — 150,195 —
Decrease in cash and cash equivalents related to changes in scope of consolidation ................................................................................... (136) — (1,635)
Cash and cash equivalents at end of year ............................................................. ¥ 370,241 ¥195,206 $ 4,452,687
The accompanying notes are an integral part of these fi nancial statements.
(Continued)
61Mizuho Securities Annual Report 2011
1. BASIS OF PRESENTING FINANCIAL STATEMENTSThe accompanying consolidated fi nancial statements of Mizuho Securities Co., Ltd.
(the “Company”) and its consolidated subsidiaries (collectively, the “Companies”)
are prepared in accordance with the provisions set forth in the Financial Instruments
and Exchange Act, and in conformity with accounting principles and practices gen-
erally accepted in Japan, which are different in certain respects from the application
and disclosure requirements of International Financial Reporting Standards.
In preparing the consolidated fi nancial statements, certain reclassifi cations and
rearrangements have been made to the fi nancial statements issued in Japan in
order to present these statements in a form which is more familiar to readers of
these statements outside Japan. The consolidated fi nancial statements are not
intended to present the consolidated fi nancial positions, results of operations and
cash fl ows in accordance with accounting principles and practices generally accept-
ed in countries and jurisdictions other than Japan.
As permitted by regulations under the Financial Instruments and Exchange Act,
amounts of less than one million yen have been omitted. As a result, the totals
shown in the accompanying consolidated fi nancial statements (both in yen and in
U.S. dollars) do not necessarily agree with the sums of the individual amounts.
On May 7, 2009, Shinko Securities Co., Ltd. merged with the former Mizuho
Securities Co., Ltd. and changed its name to Mizuho Securities Co., Ltd. As the
merger with the former Mizuho Securities Co., Ltd. is accounted for as a reverse
acquisition, the consolidated operating results for the previous fi scal year were pre-
pared by combining the consolidated operating results of the former Mizuho
Securities for the period from April 1, 2009 through May 6, 2009 with the consoli-
dated operating results of the Company for the period from May 7, 2009 through
March 31, 2010.
The translation of yen amounts into U.S. dollars is included solely for the conve-
nience of the reader, using the exchange rate prevailing at March 31, 2011, which
was ¥83.15 to US$1. The translation should not be construed as a representation
that the yen amounts have been, could have been or could in the future be con-
verted into U.S. dollars at this or any other rate of exchange.
Certain amounts in the 2010 fi nancial statements and notes have been reclassi-
fi ed to conform to the 2011 presentation.
2. SUMMARY OF SIGNIFICANT ACCOUNTING POLICIES(a) Principles of consolidation
Subsidiaries:
The consolidated fi nancial statements include the accounts of the Company and all
companies which are controlled by the Company through substantial ownership of
more than 50% of the voting rights or through ownership of a high percentage of
the voting rights and the existence of certain conditions evidencing control by the
Company of the decision-making body of such companies.
1) Consolidated subsidiaries: 30 entities
During the fi scal year 2010, the number of consolidated subsidiaries decreased by
7, all of which were excluded from consolidation mainly due to merger and liquida-
tion, while the number of consolidated subsidiaries increased by 1, which was
newly established. As a result, the number of consolidated subsidiaries was 30 at
March 31, 2011.
Subsidiaries newly consolidated: 1 entity
Mizuho Securities India Private Limited
Excluded from the scope of consolidation: 7 entities
Shinko Securities (Europe) Limited
Shinko Securities (H.K.) Limited
Industrial Decisions, Inc.
Tokyo Valuation Research Co., Ltd.
Mizuho Securities Investment Services Co., Ltd.
Other 2 entities
Affi liates:
Affi liates are, in general, the companies other than subsidiaries in which the
Company 1) holds, directly and/or indirectly, 20% or more of the voting shares; 2)
holds, directly and/or indirectly, 15% or more of the voting shares and also is able
to infl uence the decision-making body through sharing personnel, provision of
fi nance and technology, and other relationships; or 3) holds more than 20% of the
voting shares together with those entities that would vote or agree to vote with
the Company due to their close relationship with the Company through sharing
personnel, the provision of fi nance and technology and other relationships and,
at the same time, is able to infl uence the decision-making body to a material
degree, unless evidence exists which shows that the Company does not have such
infl uence.
2) Affi liates accounted for using the equity method: 11 entities
During the fi scal year 2010, the number of affi liates increased by 1, which became
an affi liate through a reduction of the share holding ratio due to a private place-
ment of equity, while the number of affi liates decreased by 1, which became non-
affi liates due to a stock transfer. As a result, 11 affi liates were accounted for using
the equity method at March 31, 2011.
Major affi liates accounted for using the equity method
Mizuho Alternative Investments, LLC
Industrial Decisions, Inc.
Neostella Capital Co., Ltd.
Energy & Environment Investment, Inc.
Mobile Internet Capital Inc.
Japan Industrial Partners, Inc.
Eiwa Securities Co., Ltd.
The Neostella Capital No. 1 Investment Business Limited Partnership
Newly applied:
Industrial Decisions, Inc.
Excluded from the scope of application:
Mitoyo Securities Co., Ltd.
3) Fiscal year-end of consolidated subsidiaries
The fi scal year-ends of consolidated subsidiaries are as follows:
End of March: 21 subsidiaries
End of December: 9 subsidiaries
The above 9 consolidated subsidiaries with the different fi scal year end from the
consolidated balance sheet date are consolidated on the basis of their respective
year-end. Appropriate adjustments are made for material transactions during the
period from their respective year-end to the consolidated balance sheet date includ-
ing elimination of the inter-company accounts on consolidation, if necessary.
(b) Foreign currency translation
Transactions denominated in foreign currencies are recorded at the current
exchange rate on the transaction date. Subsequently, assets and liabilities denomi-
nated in foreign currencies are translated into Japanese yen using fi scal year-end
exchange rates, with the translation gains and losses recognized through the state-
ment of operations for the period. The fi nancial statements of overseas consolidat-
ed subsidiaries and affi liates are translated into Japanese yen using fi scal year-end
exchange rates. Foreign currency translation gains and losses related to the fi nan-
cial statements of those overseas entities are credited or charged directly to foreign
currency translation adjustments and minority interests, components of total net
assets of the balance sheet.
(c) Recognition of income
The mark-to-market method is applied for the valuation of trading assets and liabil-
ities. Securities transactions, gains or losses on securities transactions and deriva-
tives transactions included in trading assets and liabilities, and brokerage
commissions are recorded on a trade date basis. Expenses incidental to securities
transactions are also recognized on a trade date basis. Underwriting and distribu-
tion commissions are recorded on the date the terms of underwriting are fi xed or
on the date of distribution or offering.
Notes
62 Mizuho Securities Annual Report 2011
(d) Financial instruments
1) Derivatives
All derivatives are stated at fair value, with changes in fair value included in net
income (loss) for the period in which they arise, except for those designated as
“hedging instruments” (see 3) Hedging transactions, below).
2) Securities
Securities held by the Companies are classifi ed into three categories:
a) Trading securities, which are held for the purpose of generating profi ts on short-
term differences in prices, are stated at fair value, with changes in fair value includ-
ed in net income (loss) for the period in which they arise. Additionally, securities
held in trust for trading purposes are accounted for in the same manner as trading
securities.
b) Held-to-maturity debt securities, which the Companies intend to hold to maturi-
ty, are stated at cost after accounting for premium or discount on acquisition,
which are amortized or accreted over the period to maturity.
c) Other securities for which market quotations are available are stated at fair value.
Net unrealized gains or losses on these securities are reported as a separate item in
net assets on a net-of-tax basis. Cost of securities sold is calculated using moving
average method.
Other securities for which it is extremely diffi cult to determine the fair value are
stated at cost using moving average method, except as stated in the paragraph
below.
With regard to contributions to investment business limited partnerships and
similar partnerships
(according to Article 2, Paragraph 2 of the Financial Instruments and Exchange
Act, such contributions are regarded as negotiable securities), the Company mainly
uses, as the book value, the value of its share of partnership assets as designated
on the partnership’s most recent statement of accounts that the Company is able
to obtain as of the day - stipulated in the partnership agreement - on which the
latest statement of accounts is reported. With regard to profi t and loss incurred
from the operations of the partnership, etc., the Company records the portion of
its share.
3) Hedging transactions
Gains or losses resulting from forward foreign exchange transactions entered into
in order to hedge the exchange risk of foreign currency denominated equity invest-
ments in subsidiaries are recognized in foreign currency translation adjustments in
net assets to the extent these transactions qualify for hedge accounting.
Borrowings in foreign currency undertaken in order to hedge the risk of fl uctua-
tions in the exchange rate on foreign currency denominated operating investment
securities are accounted for under fair value hedge accounting. For interest rate
swap contracts that are used as hedges for the interest rate risk of borrowings, the
net amount to be paid or received under the contract is added to or deducted from
the interest on the borrowings subject to the hedge.
In order to avoid foreign currency risk and interest rate risk, hedging transactions
are implemented under the internal regulations. Assessment of the hedge effec-
tiveness for forward foreign exchange transactions and borrowings in foreign cur-
rencies is omitted because hedging instruments and hedged items are denominated
in the same currencies. In addition, assessment of hedge effectiveness for interest
rate swap transactions is omitted if the swaps are accounted for by the exceptional
accrual method.
(e) Depreciation of property and equipment (except for leased assets)
Depreciation is generally computed by the declining-balance method based on the
estimated useful lives of assets. Buildings acquired on or after April 1, 1998 are
depreciated using the straight-line method.
The useful lives of property and equipment are as follows:
Buildings: 2-50 years
Equipment: 2-20 years
(f) Intangible fi xed assets and long-term prepaid expenses
The cost of computer software developed or obtained for internal use is capitalized
and amortized mainly using the straight-line method over its estimated useful life
(within 5 years). Software costs are classifi ed as intangible assets in other assets.
(g) Deferred assets
Bond issuance costs are expensed as incurred.
(h) Gensaki transactions
The settlement amounts, including accrued interests, are accounted for as securi-
ties sold under agreements to repurchase or securities purchased under agreements
to resell with no valuation gain or loss recognized. Realized gains or losses on
Gensaki trading, equivalent to the differences between start-date unit prices and
end-date unit prices, are included in interest and dividends income or interest
expenses, respectively, in the accompanying consolidated statements of operations.
(i) Lease transactions
Depreciation expense arising from leased assets under fi nance lease transactions
that do not transfer ownership is calculated using the declining-balance method,
based on the assumption that the useful life equals the lease term, and the residual
value is zero.
(j) Allowance for doubtful accounts
Allowance for doubtful accounts is provided on the basis of historical loss experi-
ence for receivables. For certain receivables, for which collection is doubtful, a spe-
cifi c allowance equivalent to the amount of expected loss is established.
(k) Bonuses
Accrued employees’ bonuses and accrued directors’ bonuses are provided at the
estimated amounts that the Companies will pay employees and directors after the
fi scal year-end, based on their services for the current period.
(l) Provision for retirement benefi ts
Employees of the Companies are generally entitled to certain lump-sum payments
or pension payments upon retirement or termination of employment, mainly based
on the current rates of pay and the length of service.
Retirement benefi t plans that the Company and its domestic subsidiaries provide
are defi ned benefi t plans (regulation-type plans, fund-type plans and qualifi ed
retirement pension plans), pension fund plans, defi ned contribution plans, retire-
ment lump-sum plans.
Provision for retirement benefi ts, which is provided for the payment of employ-
ees’ retirement benefi ts, represents the estimated present value of projected bene-
fi t obligations in excess of the fair value of the plan assets, considering adjustments
for unrecognized prior year service costs and unrecognized actuarial differences at
the end of the fi scal year. Prior year service costs are charged to expenses at one
time or amortized using the straight-line method over a predetermined number of
years (10 years), which is within the average remaining employment period when
they are recognized. Actuarial differences are charged to expenses from the follow-
ing fi scal year using the straight-line method over the predetermined number of
years (10 years), which is within the average remaining service years of the employ-
ees when incurred.
Provision for directors and executive offi cers are provided and included in provi-
sion for retirement benefi ts at the amount that would be required if all directors
and executive offi cers retired at the balance sheet date.
Certain domestic subsidiaries apply the simplifi ed method in calculating the pro-
vision for retirement benefi ts, which assumes all employees voluntarily terminate
their employment at the end of the year.
63Mizuho Securities Annual Report 2011

(m) Provision for bonus point redemption
The total amount of estimated future obligations, as of the end of the fi scal year,
arising from future redemption of bonus point issued under the Mizuho Point
Service Program is provided in provision for bonus point redemption. To prepare for
the cost associated with use of the Mizuho Point Service in the future, the expected
amount to be used is calculated for this period based on the usage rate.
(n) Income taxes
Income taxes of the Company and its domestic subsidiaries consist of corporate
income taxes, local inhabitants’ taxes and enterprise taxes. The Companies adopted
deferred tax accounting. Deferred income taxes are determined using the asset and
liability approach, whereby deferred tax assets and liabilities are recognized in
respect of temporary differences between the tax bases of assets and liabilities and
those as reported in the fi nancial statements. A valuation allowance is made if it is
expected that some portion or the entire deferred tax assets will not be realized.
(o) Net income per share
Net income per share shown for each period in the accompanying consolidated
statements of operations is based on the weighted average number of shares of
common stock outstanding during the respective periods.
(p) Consumption taxes
The Company and its domestic consolidated subsidiaries are subject to Japanese
consumption taxes. Japanese consumption taxes are excluded from transaction
amounts.
(q) Cash and cash equivalents
Cash and cash equivalents in the consolidated statements of cash fl ows consists of
cash on hand, bank deposits that can be withdrawn on demand and short-term
investments with an original maturity of three months or less and which carry a
minor risk of fl uctuations in value.
Cash and cash equivalents at March 31, 2011 and 2010 consist of:
Thousands of Millions of yen U.S. dollars
2011 2010 2011
Cash and bank deposits ................................. ¥377,668 ¥162,392 $4,542,008
Time deposits with original maturity over three months ....................................... (7,426) (8,635) (89,308)
MMF .............................................................. — 41,449 —
Cash and cash equivalents ............................. ¥370,241 ¥195,206 $4,452,687
(r) Goodwill
Goodwill arising from acquisitions is charged to expense in the year it is recog-
nized.
3. CHANGES IN ACCOUNTING POLICIES(1) Accounting Standard for Equity Method of Accounting for Investments
Effective the year ended March 31, 2011, the Company adopted “Accounting
Standard for Equity Method of Accounting for Investments” (Accounting Standards
Board of Japan (“ASBJ”) Statement No. 16, March 10, 2008) and “Practical
Solution on Unifi cation of Accounting Policies Applied to Associates Accounted for
Using the Equity Method” (ASBJ PITF No. 24, March 10, 2008). There is no impact
of adopting these accounting standards to the consolidated fi nancial statements.
(2) Accounting Standard for Asset Retirement Obligations
Effective the year ended March 31, 2011, the Company has adopted the
“Accounting Standard for Asset Retirement Obligations” (ASBJ Statement No. 18,
March 31, 2008) and “Guidance on Accounting Standard for Asset Retirement
Obligations” (ASBJ Guidance No. 21, March 31, 2008). The change has no material
effects on operating loss and loss before income taxes and minority interests in the
consolidated fi nancial statements.
4. FINANCIAL INSTRUMENTS(1) Trading assets and trading liabilities
Trading assets and trading liabilities are recorded at fair value with unrealized gains
and losses recognized as net gain and loss on trading in the consolidated state-
ments of operations. Sales of securities, which the Companies do not currently
own and will, therefore, be obligated to purchase at future dates (“short sales”),
are included in trading liabilities. Purchases and sales of fi nancial instruments for
trading purposes are recognized on their respective trade dates. Unrealized gains
and losses arising from over-the-counter (“OTC”) fi nancial instruments are pre-
sented in the accompanying consolidated balance sheets on a gross basis and are
included in trading assets and trading liabilities, respectively.
The fair values of the trading positions are generally based on market prices. If
market prices are not available, fair value is determined based on other relevant
factors, including dealer price quotations and price quotations for similar instru-
ments, or pricing models.
Valuation models incorporate current market and contractual prices for the
underlying fi nancial instruments as well as time value, yield curve, volatility, market
liquidity and other statistical adjustments relevant to similar instruments.
(a) Trading assets and trading liabilities as of March 31, 2011 and 2010 consist of
the following:
Thousands of Millions of yen U.S. dollars
2011 2010 2011
Trading assets: Equities and warrants ......................... ¥ 503,599 ¥ 242,662 $ 6,056,512 Bonds ................................................. 6,624,323 6,298,389 79,667,143 Commercial paper and certifi cates of deposit ......................................... 53,994 150,608 649,356 Benefi ciary certifi cates of investment trusts .............................. 8,083 19,358 97,209 Derivatives .......................................... 750,408 720,643 9,024,750 Other* ............................................... 94,957 164,008 1,141,996
¥8,035,368 ¥7,595,671 $96,637,017
Trading liabilities: Equities and warrants ......................... ¥ 36,232 ¥ 56,317 $ 435,742 Bonds ................................................. 3,585,639 2,867,492 43,122,537 Benefi ciary certifi cates of investment trusts .............................. 48 20 577 Derivatives .......................................... 641,494 686,502 7,714,900
¥4,263,415 ¥3,610,332 $51,273,782
Unrealized gain (loss) included in the consolidated statements of operations
amounted to ¥(38,388) million ($461,671 thousand) and ¥(7,372) million as of
March 31, 2011 and 2010, respectively.
* Loans receivable is included in “Other”.
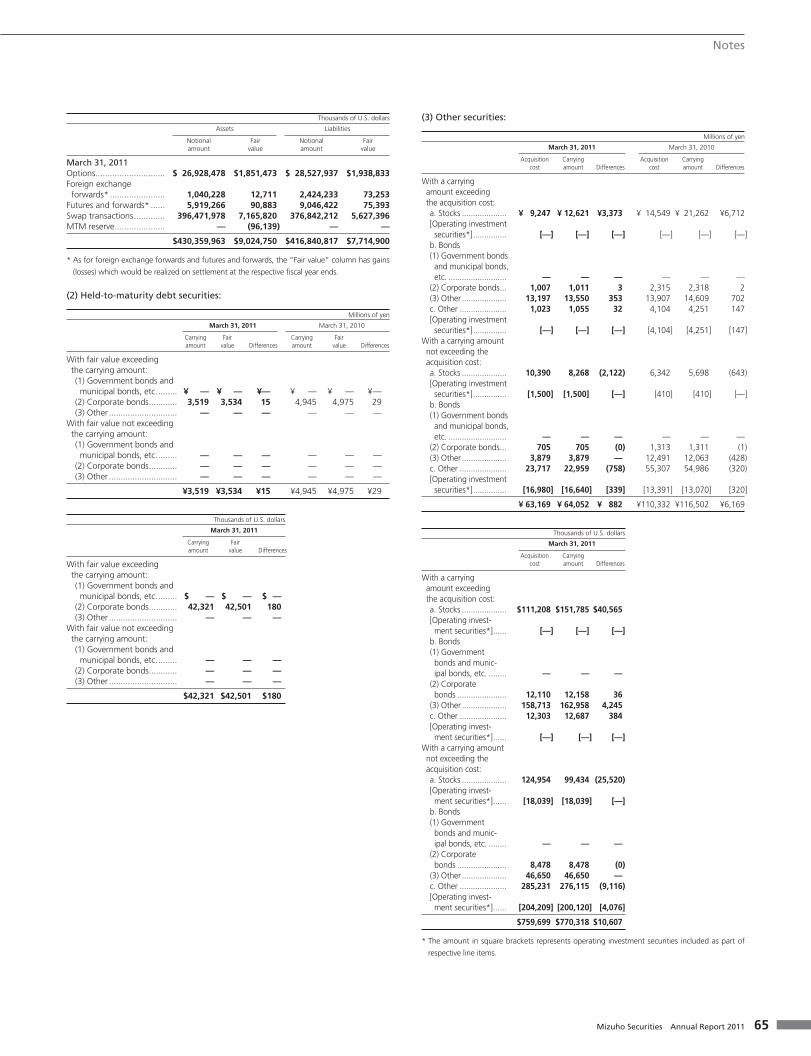
(b) Notional amounts and fair value of derivatives as of March 31, 2011 and 2010:
Millions of yen
Assets Liabilities
Notional Fair Notional Fair amount value amount value
March 31, 2011Options ....................................... ¥ 2,239,103 ¥153,950 ¥ 2,372,098 ¥161,214Foreign exchange forwards* ....... 86,495 1,057 201,575 6,091Futures and forwards* ................ 492,187 7,557 752,210 6,269Swap transactions ....................... 32,966,645 595,838 31,334,430 467,918MTM reserve ............................... — (7,994) — —
¥35,784,431 ¥750,408 ¥34,660,314 ¥641,494
March 31, 2010Options ....................................... ¥ 2,353,468 ¥148,131 ¥ 2,460,238 ¥177,808Foreign exchange forwards* ....... 91,359 757 248,547 6,364Futures and forwards* ................ 440,431 3,099 379,158 4,459Swap transactions ....................... 20,769,335 577,882 20,127,658 497,868MTM reserve ............................... — (9,227) — —
¥23,654,595 ¥720,643 ¥23,215,602 ¥686,502
64 Mizuho Securities Annual Report 2011
Notes
Thousands of U.S. dollars
Assets Liabilities
Notional Fair Notional Fair amount value amount value
March 31, 2011Options ............................. $ 26,928,478 $1,851,473 $ 28,527,937 $1,938,833Foreign exchange forwards* ....................... 1,040,228 12,711 2,424,233 73,253Futures and forwards* ...... 5,919,266 90,883 9,046,422 75,393Swap transactions ............. 396,471,978 7,165,820 376,842,212 5,627,396MTM reserve ..................... — (96,139) — —
$430,359,963 $9,024,750 $416,840,817 $7,714,900
* As for foreign exchange forwards and futures and forwards, the “Fair value” column has gains
(losses) which would be realized on settlement at the respective fi scal year ends.
(2) Held-to-maturity debt securities:
Millions of yen
March 31, 2011 March 31, 2010
Carrying Fair Carrying Fair amount value Differences amount value Differences
With fair value exceeding the carrying amount: (1) Government bonds and municipal bonds, etc. ........ ¥ — ¥ — ¥— ¥ — ¥ — ¥— (2) Corporate bonds ............ 3,519 3,534 15 4,945 4,975 29 (3) Other ............................. — — — — — —With fair value not exceeding the carrying amount: (1) Government bonds and municipal bonds, etc. ........ — — — — — — (2) Corporate bonds ............ — — — — — — (3) Other ............................. — — — — — —
¥3,519 ¥3,534 ¥15 ¥4,945 ¥4,975 ¥29
Thousands of U.S. dollars
March 31, 2011
Carrying Fair amount value Differences
With fair value exceeding the carrying amount: (1) Government bonds and municipal bonds, etc. ........ $ — $ — $ — (2) Corporate bonds ............ 42,321 42,501 180 (3) Other ............................. — — —With fair value not exceeding the carrying amount: (1) Government bonds and municipal bonds, etc. ........ — — — (2) Corporate bonds ............ — — — (3) Other ............................. — — —
$42,321 $42,501 $180
(3) Other securities:
Millions of yen
March 31, 2011 March 31, 2010
Acquisition Carrying Acquisition Carrying cost amount Differences cost amount Differences
With a carrying amount exceeding the acquisition cost: a. Stocks .................... ¥ 9,247 ¥ 12,621 ¥3,373 ¥ 14,549 ¥ 21,262 ¥6,712 [Operating investment securities*] ............... [—] [—] [—] [—] [—] [—] b. Bonds (1) Government bonds and municipal bonds, etc. .......................... — — — — — — (2) Corporate bonds ... 1,007 1,011 3 2,315 2,318 2 (3) Other .................... 13,197 13,550 353 13,907 14,609 702 c. Other ..................... 1,023 1,055 32 4,104 4,251 147 [Operating investment securities*] ............... [—] [—] [—] [4,104] [4,251] [147]With a carrying amount not exceeding the acquisition cost: a. Stocks .................... 10,390 8,268 (2,122) 6,342 5,698 (643) [Operating investment securities*] ............... [1,500] [1,500] [—] [410] [410] [—] b. Bonds (1) Government bonds and municipal bonds, etc. .......................... — — — — — — (2) Corporate bonds ... 705 705 (0) 1,313 1,311 (1) (3) Other .................... 3,879 3,879 — 12,491 12,063 (428) c. Other ..................... 23,717 22,959 (758) 55,307 54,986 (320) [Operating investment securities*] ............... [16,980] [16,640] [339] [13,391] [13,070] [320]
¥ 63,169 ¥ 64,052 ¥ 882 ¥110,332 ¥116,502 ¥6,169
Thousands of U.S. dollars
March 31, 2011
Acquisition Carrying cost amount Differences
With a carrying amount exceeding the acquisition cost: a. Stocks .................... $111,208 $151,785 $40,565 [Operating invest- ment securities*] ...... [—] [—] [—] b. Bonds (1) Government bonds and munic- ipal bonds, etc. ........ — — — (2) Corporate bonds ...................... 12,110 12,158 36 (3) Other .................... 158,713 162,958 4,245 c. Other ..................... 12,303 12,687 384 [Operating invest- ment securities*] ...... [—] [—] [—]With a carrying amount not exceeding the acquisition cost: a. Stocks .................... 124,954 99,434 (25,520) [Operating invest- ment securities*] ...... [18,039] [18,039] [—] b. Bonds (1) Government bonds and munic- ipal bonds, etc. ........ — — — (2) Corporate bonds ...................... 8,478 8,478 (0) (3) Other .................... 46,650 46,650 — c. Other ..................... 285,231 276,115 (9,116) [Operating invest- ment securities*] ...... [204,209] [200,120] [4,076]
$759,699 $770,318 $10,607
* The amount in square brackets represents operating investment securities included as part of
respective line items.
65Mizuho Securities Annual Report 2011
Impairment losses on stocks classifi ed as other securities with fair value were recognized in the
amount of ¥71 million ($853 thousand) and ¥132 million for the years ended March 31, 2011
and 2010, respectively. Impairment losses on other classifi ed as other securities with fair value
were recognized in the amount of ¥17 million ($204 thousand) for the year ended March 31,
2011.
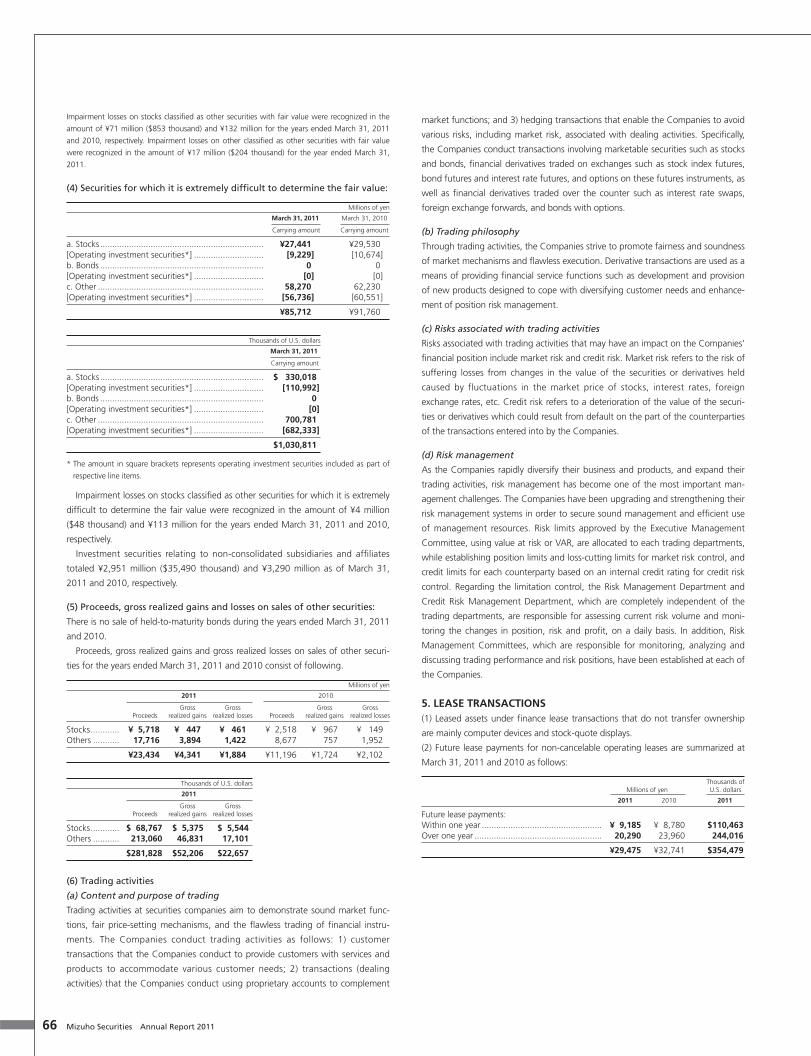
(4) Securities for which it is extremely diffi cult to determine the fair value:
Millions of yen
March 31, 2011 March 31, 2010
Carrying amount Carrying amount
a. Stocks .................................................................... ¥27,441 ¥29,530[Operating investment securities*] ............................. [9,229] [10,674]b. Bonds .................................................................... 0 0[Operating investment securities*] ............................. [0] [0]c. Other ..................................................................... 58,270 62,230[Operating investment securities*] ............................. [56,736] [60,551]
¥85,712 ¥91,760
Thousands of U.S. dollars
March 31, 2011
Carrying amount
a. Stocks .................................................................... $ 330,018[Operating investment securities*] ............................. [110,992]b. Bonds .................................................................... 0[Operating investment securities*] ............................. [0]c. Other ..................................................................... 700,781[Operating investment securities*] ............................. [682,333]
$1,030,811
* The amount in square brackets represents operating investment securities included as part of
respective line items.
Impairment losses on stocks classifi ed as other securities for which it is extremely
diffi cult to determine the fair value were recognized in the amount of ¥4 million
($48 thousand) and ¥113 million for the years ended March 31, 2011 and 2010,
respectively.
Investment securities relating to non-consolidated subsidiaries and affi liates
totaled ¥2,951 million ($35,490 thousand) and ¥3,290 million as of March 31,
2011 and 2010, respectively.
(5) Proceeds, gross realized gains and losses on sales of other securities:
There is no sale of held-to-maturity bonds during the years ended March 31, 2011
and 2010.
Proceeds, gross realized gains and gross realized losses on sales of other securi-
ties for the years ended March 31, 2011 and 2010 consist of following.
Millions of yen
2011 2010
Gross Gross Gross Gross Proceeds realized gains realized losses Proceeds realized gains realized losses
Stocks ............ ¥ 5,718 ¥ 447 ¥ 461 ¥ 2,518 ¥ 967 ¥ 149Others ........... 17,716 3,894 1,422 8,677 757 1,952
¥23,434 ¥4,341 ¥1,884 ¥11,196 ¥1,724 ¥2,102
Thousands of U.S. dollars
2011
Gross Gross Proceeds realized gains realized losses
Stocks ............ $ 68,767 $ 5,375 $ 5,544Others ........... 213,060 46,831 17,101
$281,828 $52,206 $22,657
(6) Trading activities
(a) Content and purpose of trading
Trading activities at securities companies aim to demonstrate sound market func-
tions, fair price-setting mechanisms, and the fl awless trading of fi nancial instru-
ments. The Companies conduct trading activities as follows: 1) customer
transactions that the Companies conduct to provide customers with services and
products to accommodate various customer needs; 2) transactions (dealing
activities) that the Companies conduct using proprietary accounts to complement
market functions; and 3) hedging transactions that enable the Companies to avoid
various risks, including market risk, associated with dealing activities. Specifi cally,
the Companies conduct transactions involving marketable securities such as stocks
and bonds, fi nancial derivatives traded on exchanges such as stock index futures,
bond futures and interest rate futures, and options on these futures instruments, as
well as fi nancial derivatives traded over the counter such as interest rate swaps,
foreign exchange forwards, and bonds with options.
(b) Trading philosophy
Through trading activities, the Companies strive to promote fairness and soundness
of market mechanisms and fl awless execution. Derivative transactions are used as a
means of providing fi nancial service functions such as development and provision
of new products designed to cope with diversifying customer needs and enhance-
ment of position risk management.
(c) Risks associated with trading activities
Risks associated with trading activities that may have an impact on the Companies’
fi nancial position include market risk and credit risk. Market risk refers to the risk of
suffering losses from changes in the value of the securities or derivatives held
caused by fluctuations in the market price of stocks, interest rates, foreign
exchange rates, etc. Credit risk refers to a deterioration of the value of the securi-
ties or derivatives which could result from default on the part of the counterparties
of the transactions entered into by the Companies.
(d) Risk management
As the Companies rapidly diversify their business and products, and expand their
trading activities, risk management has become one of the most important man-
agement challenges. The Companies have been upgrading and strengthening their
risk management systems in order to secure sound management and effi cient use
of management resources. Risk limits approved by the Executive Management
Committee, using value at risk or VAR, are allocated to each trading departments,
while establishing position limits and loss-cutting limits for market risk control, and
credit limits for each counterparty based on an internal credit rating for credit risk
control. Regarding the limitation control, the Risk Management Department and
Credit Risk Management Department, which are completely independent of the
trading departments, are responsible for assessing current risk volume and moni-
toring the changes in position, risk and profi t, on a daily basis. In addition, Risk
Management Committees, which are responsible for monitoring, analyzing and
discussing trading performance and risk positions, have been established at each of
the Companies.
5. LEASE TRANSACTIONS(1) Leased assets under fi nance lease transactions that do not transfer ownership
are mainly computer devices and stock-quote displays.
(2) Future lease payments for non-cancelable operating leases are summarized at
March 31, 2011 and 2010 as follows:
Thousands of Millions of yen U.S. dollars
2011 2010 2011
Future lease payments:Within one year .................................................. ¥ 9,185 ¥ 8,780 $110,463Over one year ..................................................... 20,290 23,960 244,016
¥29,475 ¥32,741 $354,479
66 Mizuho Securities Annual Report 2011

Notes
6. ASSETS PLEDGED AS COLLATERAL AND FAIR VALUE OF SECURITIES PLEDGED AND RECEIVED AS COLLATERALAssets pledged as collateral for borrowings as of March 31, 2011 are summarized
as follows:
Millions of yen
For borrowings For short-term on margin borrowings transactions
Liabilities collateralized by the respective pledged assets ................................................................ ¥3,320,622 ¥10,246 Pledged assets: Bank deposits ............................................................ 130 — Trading assets ............................................................ 2,680,319 — Equipment ................................................................. 126 — Investment securities .................................................. — 13,976
¥2,680,576 ¥13,976
Thousands of U.S. dollars
For borrowings For short-term on margin borrowings transactions
Liabilities collateralized by the respective pledged assets ............................................................... $39,935,321 $123,223 Pledged assets: Bank deposits ........................................................... 1,563 — Trading assets ........................................................... 32,234,744 — Equipment ................................................................ 1,515 — Investment securities ................................................. — 168,081
$32,237,835 $168,081
As of March 31, 2011, besides those shown in the above table, shares received
as collateral from customers for margin transactions in the amount of ¥110 million
($1,322 thousand) and borrowed securities of ¥800,842 million ($9,631,292 thou-
sand) were pledged as collateral for short-term borrowings. In addition, bank
deposits of ¥1,300 million ($15,634 thousand), trading assets of ¥174,614 million
($2,099,987 thousand), securities of ¥457 million ($5,496 thousand), investment
securities of ¥3,082 million ($37,065 thousand) and securities borrowed of
¥19,031 million ($228,875 thousand) were placed with futures exchanges in lieu
of margin money.
Fair value of securities pledged as collateral, etc., excluding those in the above
table as of March 31, 2011 is as follows:
Thousands of Millions of yen U.S. dollars
2011 2011
Securities loaned for margin transactions ...................... ¥ 13,083 $ 157,342Securities pledged for borrowing on margin transactions .................................................... 10,954 131,737Securities loaned for collateralized fi nancing agreements ................................................. 1,751,763 21,067,504Securities sold under agreements to repurchase ............ 9,460,813 113,780,072
Fair value of securities received as collateral, etc., as of March 31, 2011 is as fol-
lows:
Thousands of Millions of yen U.S. dollars
2011 2011
Securities received from customers for loans under margin transactions .......................................... ¥ 22,470 $ 270,234Securities borrowed under margin transactions ............. 20,988 252,411Securities borrowed under fi nancing agreements .......... 5,331,038 64,113,505Securities purchased under agreements to resell ............ 8,583,064 103,223,860Securities pledged by customers as collateral mainly for margin transactions ............................................... 40,974 492,772Other securities pledged ............................................... 96,514 1,160,721
Assets pledged as collateral for borrowings as of March 31, 2010 are summa-
rized as follows:
Millions of yen
For short-term For borrowings on borrowings margin transactions
Liabilities collateralized by the respective pledged assets ........................................................... ¥2,259,685 ¥11,716 Pledged assets: Bank deposits ....................................................... 130 — Trading assets ....................................................... 1,756,938 — Equipment ............................................................ 224 — Investment securities ............................................. 4,946 13,146
¥1,762,240 ¥13,146
As of March 31, 2010, besides those shown in the above table, shares received
as collateral from customers for margin transactions in the amount of ¥3,018 mil-
lion and borrowed securities of ¥618,796 million were pledged as collateral for
short-term borrowings. In addition, bank deposits of ¥1,448 million, trading assets
of ¥406,370 million, investment securities of ¥6,183 million and securities bor-
rowed of ¥4,376 million were placed with futures exchanges in lieu of margin
money.
Fair value of securities pledged as collateral, etc., excluding those in the above
table as of March 31, 2010 is as follows:
Millions of yen
2010
Securities loaned for margin transactions ............................................... ¥ 9,378Securities pledged for borrowing on margin transactions ....................... 12,737Securities loaned for collateralized fi nancing agreements ....................... 2,054,775Securities sold under agreements to repurchase ..................................... 10,267,824
Fair value of securities received as collateral, etc., as of March 31, 2010 is as
follows:
Millions of yen
2010
Securities received from customers for loans under margin transactions ... ¥ 28,516Securities borrowed under margin transactions ........................................ 28,051Securities borrowed under fi nancing agreements ..................................... 4,552,434Securities purchased under agreements to resell ....................................... 9,486,202Securities pledged by customers as collateral mainly for margin transactions ............................................................................... 43,703Other securities pledged .......................................................................... 100,007
7. OTHER ASSETSOther included in other assets as of March 31, 2011 and 2010 consisted of the fol-
lowing:
Thousands of Millions of yen U.S. dollars
2011 2010 2011
Short-term deposits ..................................... ¥ 92,722 ¥172,328 $1,115,117Securities: fail to deliver ............................... 10,249 14,477 123,259Others ......................................................... 19,843 16,916 238,641
¥122,815 ¥203,721 $1,477,029
67Mizuho Securities Annual Report 2011

8. SHORT-TERM BORROWINGS AND LONG-TERM DEBTShort-term borrowings and long-term debt at March 31, 2011 and 2010 consist of
the following:
Thousands of Millions of yen U.S. dollars
2011 Average rate 2010 2011
Short-term borrowings ......... ¥3,747,079 0.13% ¥2,700,015 $45,064,088Long-term borrowings, payable within one year ..... 119,042 1.40% 66,069 1,431,653Long-term borrowings, maturity greater than one year ............................ 621,361 1.09% 578,563 7,472,7721.5% unsecured bonds and notes due March 7, 2011 ................... — 1.50% 19,907 —2.73% unsecured bonds and notes due June 21, 2018* .................. 12,837 2.73% 12,809 154,383Straight bonds and notes due April 2011 through February 2041 ................... 409,612 0.00~25.00% 350,017 4,926,181Straight bonds and notes due April 2011 through October 2038 .................... 180,788 0.00~10.00% 206,151 2,174,239Commercial paper ............... 484,100 0.13% 331,700 5,822,008
¥5,574,821 ¥4,265,234 $67,045,351
* Interest rate: 6-Month Euro Yen Libor plus 2.50% after June 22, 2013
Maturities of long-term debt after one year but within fi ve years at March 31,
2011 are as follows:
Thousands of Millions of yen U.S. dollars
Year ending March 31,2012.............................................................................. ¥ 168,212 $ 2,022,9942013.............................................................................. 276,371 3,323,7642014.............................................................................. 142,058 1,708,4542015.............................................................................. 145,376 1,748,3582016.............................................................................. 217,785 2,619,1822017.............................................................................. 394,662 4,746,386
¥1,344,466 $16,169,164
Subordinated debt, as defi ned by the Cabinet Offi ce Ordinance Concerning
Financial Instruments Business (Cabinet Offi ce Ordinance No. 52 Art. 176), was
included in long-term debt in the amount of ¥308,300 million ($3,707,757 thou-
sand) and ¥323,300 million as of March 31, 2011 and 2010, respectively.
9. PROVISION FOR RETIREMENT BENEFITSThe following table sets forth the projected benefi t obligations, plan assets and
funded status of the Companies as of March 31, 2011 and 2010:
Thousands of Millions of yen U.S. dollars
2011 2010 2011
Projected benefi t obligation at end of year ......... ¥(60,236) ¥(58,243) $(724,425)Fair value of plan assets at end of year ............... 50,372 46,724 605,796Unrecognized actuarial differences ..................... (200) (1,901) (2,405)Prepaid pension cost .......................................... (4,502) (1,344) (54,143)
Provision for retirement benefi ts recognized in the consolidated balance sheets ................... ¥(14,566) ¥(14,765) $(175,177)
Severance and pension costs of the Companies include the following compo-
nents for the years ended March 31, 2011 and 2010:
Thousands of Millions of yen U.S. dollars
2011 2010 2011
Service cost .............................................................. ¥3,195 ¥3,351 $38,424Interest cost ............................................................. 1,383 1,252 16,632 Expected return on plan assets ................................. (1,112) (1,043) (13,373)Amortization of actuarial differences ........................ (119) 859 (1,431)
Net periodic pension cost ......................................... 3,346 4,419 40,240Contributions to the defi ned contribution pension plan .......................................................... 1,392 1,293 16,740
¥4,739 ¥5,712 $56,993
Certain domestic subsidiaries apply the simplifi ed method in calculating the pro-
vision for retirement benefi ts, and the related severance and pension costs are
included in service cost.
Assumptions used in determining pension costs and pension benefi t obligations
for the years ended March 31, 2011 and 2010 were as follows:
2011 2010
Basis for allocation of expected pension benefi ts ........... Straight-line basis Straight-line basisDiscount rate .................. Mainly 2.5% Mainly 2.5%Expected rate of return on plan assets ............... Mainly 2.0%~5.6% Mainly 2.5%~5.7%Amortization period for actuarial differences ...... 10 years; straight-line basis 10 years; straight-line basisAmortization period for prior year service cost .... — —
In addition, directors’ retirement benefi ts of ¥553 million ($6,650 thousand) and
¥555 million were included in provision for retirement benefi ts in the accompany-
ing consolidated balance sheets as of March 31, 2011 and 2010, respectively.
Severance and pension costs recorded in the consolidated statements of operations
for the years ended March 31, 2011 and 2010 were ¥168 million ($2,020 thou-
sand) and ¥429 million, respectively.
10. INCOME TAXESSignifi cant components of deferred tax assets and liabilities at March 31, 2011 and
2010 are as follows:
Thousands of Millions of yen U.S. dollars
2011 2010 2011
Deferred tax assets: Statutory reserves ......................................... ¥ 486 ¥ 766 $ 5,844 Accrued employees’ bonuses ........................ 2,836 3,345 34,107 Provision for retirement benefi ts ................... 7,682 8,008 92,387 Allowance for doubtful accounts .................. 972 1,047 11,689 Unrealized loss on investments ..................... 8,049 184,772 96,800 Depreciation ................................................. 1,355 1,067 16,295 Losses incurred related to stock trading error ... 16,577 16,577 199,362 Tax loss carry forwards .................................. 102,074 98,704 1,227,588 Other ........................................................... 5,043 2,944 60,649
Gross deferred tax assets .............................. 145,077 317,234 1,744,762 Valuation allowance ..................................... (91,595) (272,782) (1,101,563)
Total deferred tax assets ............................... 53,482 44,451 643,199
Deferred tax liabilities: Net unrealized gain on (operating) investments securities, net of tax .................... 631 2,451 7,588 Customer related assets .................................... 26,693 28,790 321,022 Accrual of dividends to be paid ......................... 2,350 1,622 28,262 Other ................................................................ 7,166 4,095 86,181
Total deferred tax liabilities ................................ 36,841 36,959 443,066
Net deferred tax assets (liabilities) ..................... ¥ 16,640 ¥ 7,492 $ 200,120
A reconciliation of the statutory tax rate to the effective tax rate for the year
ended March 31, 2011 is not presented as a loss before income taxes and minority
interests was recorded.
As of March 31, 2010, reconciliation of the statutory tax rate to the effective tax
rate is as follows:
For the year ended March 31, 2010
Statutory tax rate ............................................................................................ 40.69%Increase (decrease) in taxes resulting from: Non-deductible items such as entertainment expenses ................................ 0.28% Dividends-received deduction ...................................................................... (0.47%) Deductable amortization of negative goodwill ............................................. (33.00%) Inhabitants tax (per capita levy) ................................................................... 0.09% Decrease in valuation allowance .................................................................. (0.72%) Other .......................................................................................................... (0.47%)
Effective tax rate ............................................................................................. 6.40%
68 Mizuho Securities Annual Report 2011
Notes
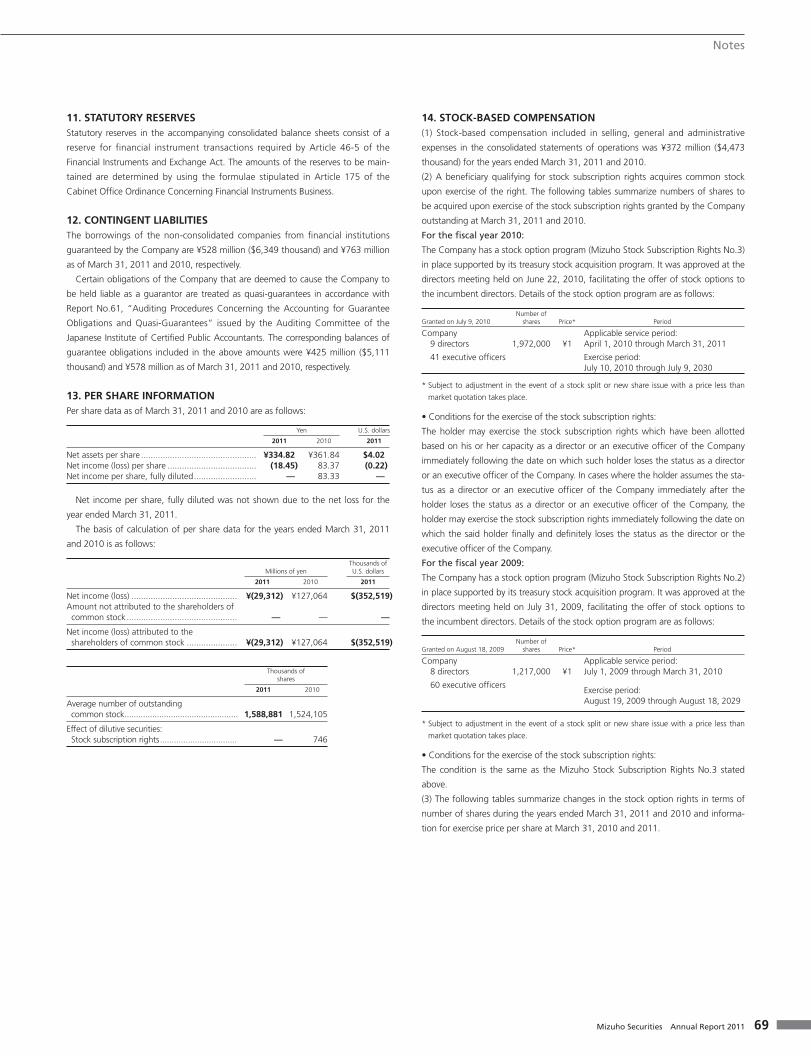
11. STATUTORY RESERVESStatutory reserves in the accompanying consolidated balance sheets consist of a
reserve for financial instrument transactions required by Article 46-5 of the
Financial Instruments and Exchange Act. The amounts of the reserves to be main-
tained are determined by using the formulae stipulated in Article 175 of the
Cabinet Offi ce Ordinance Concerning Financial Instruments Business.
12. CONTINGENT LIABILITIESThe borrowings of the non-consolidated companies from fi nancial institutions
guaranteed by the Company are ¥528 million ($6,349 thousand) and ¥763 million
as of March 31, 2011 and 2010, respectively.
Certain obligations of the Company that are deemed to cause the Company to
be held liable as a guarantor are treated as quasi-guarantees in accordance with
Report No.61, “Auditing Procedures Concerning the Accounting for Guarantee
Obligations and Quasi-Guarantees” issued by the Auditing Committee of the
Japanese Institute of Certifi ed Public Accountants. The corresponding balances of
guarantee obligations included in the above amounts were ¥425 million ($5,111
thousand) and ¥578 million as of March 31, 2011 and 2010, respectively.
13. PER SHARE INFORMATIONPer share data as of March 31, 2011 and 2010 are as follows:
Yen U.S. dollars
2011 2010 2011
Net assets per share ................................................ ¥334.82 ¥361.84 $4.02Net income (loss) per share ..................................... (18.45) 83.37 (0.22)Net income per share, fully diluted .......................... — 83.33 —
Net income per share, fully diluted was not shown due to the net loss for the
year ended March 31, 2011.
The basis of calculation of per share data for the years ended March 31, 2011
and 2010 is as follows:
Thousands of Millions of yen U.S. dollars
2011 2010 2011
Net income (loss) ............................................ ¥(29,312) ¥127,064 $(352,519)Amount not attributed to the shareholders of common stock .............................................. — — —
Net income (loss) attributed to the shareholders of common stock ..................... ¥(29,312) ¥127,064 $(352,519)
Thousands of shares
2011 2010
Average number of outstanding common stock ................................................. 1,588,881 1,524,105
Effect of dilutive securities: Stock subscription rights ................................. — 746
14. STOCK-BASED COMPENSATION(1) Stock-based compensation included in selling, general and administrative
expenses in the consolidated statements of operations was ¥372 million ($4,473
thousand) for the years ended March 31, 2011 and 2010.
(2) A benefi ciary qualifying for stock subscription rights acquires common stock
upon exercise of the right. The following tables summarize numbers of shares to
be acquired upon exercise of the stock subscription rights granted by the Company
outstanding at March 31, 2011 and 2010.
For the fi scal year 2010:
The Company has a stock option program (Mizuho Stock Subscription Rights No.3)
in place supported by its treasury stock acquisition program. It was approved at the
directors meeting held on June 22, 2010, facilitating the offer of stock options to
the incumbent directors. Details of the stock option program are as follows:
Granted on July 9, 2010Number of
shares Price* Period
Company 9 directors 1,972,000 ¥1
Applicable service period:April 1, 2010 through March 31, 2011
41 executive offi cers Exercise period:July 10, 2010 through July 9, 2030
* Subject to adjustment in the event of a stock split or new share issue with a price less than
market quotation takes place.
• Conditions for the exercise of the stock subscription rights:
The holder may exercise the stock subscription rights which have been allotted
based on his or her capacity as a director or an executive offi cer of the Company
immediately following the date on which such holder loses the status as a director
or an executive offi cer of the Company. In cases where the holder assumes the sta-
tus as a director or an executive offi cer of the Company immediately after the
holder loses the status as a director or an executive offi cer of the Company, the
holder may exercise the stock subscription rights immediately following the date on
which the said holder fi nally and defi nitely loses the status as the director or the
executive offi cer of the Company.
For the fi scal year 2009:
The Company has a stock option program (Mizuho Stock Subscription Rights No.2)
in place supported by its treasury stock acquisition program. It was approved at the
directors meeting held on July 31, 2009, facilitating the offer of stock options to
the incumbent directors. Details of the stock option program are as follows:
Granted on August 18, 2009Number of
shares Price* Period
Company 8 directors 1,217,000 ¥1
Applicable service period:July 1, 2009 through March 31, 2010
60 executive offi cersExercise period:August 19, 2009 through August 18, 2029
* Subject to adjustment in the event of a stock split or new share issue with a price less than
market quotation takes place.
• Conditions for the exercise of the stock subscription rights:
The condition is the same as the Mizuho Stock Subscription Rights No.3 stated
above.
(3) The following tables summarize changes in the stock option rights in terms of
number of shares during the years ended March 31, 2011 and 2010 and informa-
tion for exercise price per share at March 31, 2010 and 2011.
69Mizuho Securities Annual Report 2011
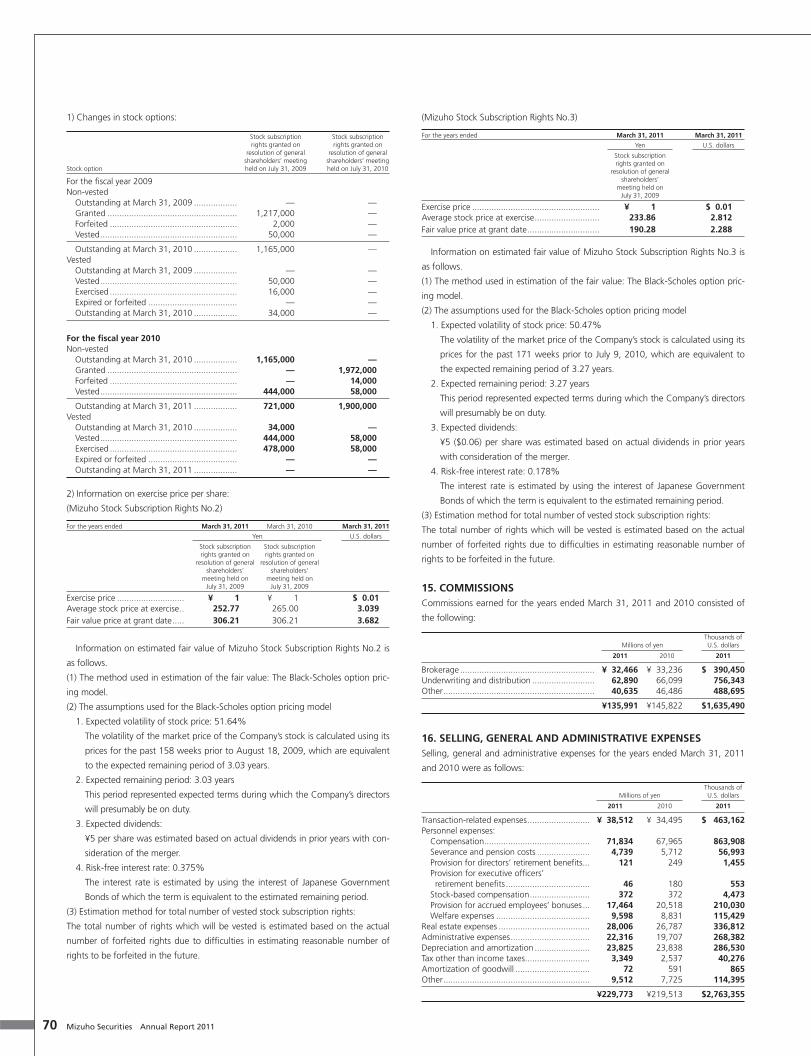
1) Changes in stock options:
Stock subscription Stock subscription rights granted on rights granted on resolution of general resolution of general shareholders’ meeting shareholders’ meetingStock option held on July 31, 2009 held on July 31, 2010
For the fi scal year 2009Non-vested Outstanding at March 31, 2009 .................. — — Granted ...................................................... 1,217,000 — Forfeited ..................................................... 2,000 — Vested ......................................................... 50,000 —
Outstanding at March 31, 2010 .................. 1,165,000 —Vested Outstanding at March 31, 2009 .................. — — Vested ......................................................... 50,000 — Exercised ..................................................... 16,000 — Expired or forfeited ..................................... — — Outstanding at March 31, 2010 .................. 34,000 —
For the fi scal year 2010Non-vested Outstanding at March 31, 2010 .................. 1,165,000 — Granted ...................................................... — 1,972,000 Forfeited ..................................................... — 14,000 Vested ......................................................... 444,000 58,000
Outstanding at March 31, 2011 .................. 721,000 1,900,000Vested Outstanding at March 31, 2010 .................. 34,000 — Vested ......................................................... 444,000 58,000 Exercised ..................................................... 478,000 58,000 Expired or forfeited ..................................... — — Outstanding at March 31, 2011 .................. — —
2) Information on exercise price per share:
(Mizuho Stock Subscription Rights No.2)
For the years ended March 31, 2011 March 31, 2010 March 31, 2011
Yen U.S. dollars
Stock subscription rights granted on
resolution of general shareholders’
meeting held on July 31, 2009
Stock subscription rights granted on
resolution of general shareholders’
meeting held on July 31, 2009
Exercise price ............................ ¥ 1 ¥ 1 $ 0.01Average stock price at exercise .. 252.77 265.00 3.039Fair value price at grant date ..... 306.21 306.21 3.682
Information on estimated fair value of Mizuho Stock Subscription Rights No.2 is
as follows.
(1) The method used in estimation of the fair value: The Black-Scholes option pric-
ing model.
(2) The assumptions used for the Black-Scholes option pricing model
1. Expected volatility of stock price: 51.64%
The volatility of the market price of the Company’s stock is calculated using its
prices for the past 158 weeks prior to August 18, 2009, which are equivalent
to the expected remaining period of 3.03 years.
2. Expected remaining period: 3.03 years
This period represented expected terms during which the Company’s directors
will presumably be on duty.
3. Expected dividends:
¥5 per share was estimated based on actual dividends in prior years with con-
sideration of the merger.
4. Risk-free interest rate: 0.375%
The interest rate is estimated by using the interest of Japanese Government
Bonds of which the term is equivalent to the estimated remaining period.
(3) Estimation method for total number of vested stock subscription rights:
The total number of rights which will be vested is estimated based on the actual
number of forfeited rights due to diffi culties in estimating reasonable number of
rights to be forfeited in the future.
(Mizuho Stock Subscription Rights No.3)
For the years ended March 31, 2011 March 31, 2011
Yen U.S. dollars
Stock subscription rights granted on
resolution of general shareholders’
meeting held on July 31, 2009
Exercise price ..................................................... ¥ 1 $ 0.01Average stock price at exercise ........................... 233.86 2.812Fair value price at grant date .............................. 190.28 2.288
Information on estimated fair value of Mizuho Stock Subscription Rights No.3 is
as follows.
(1) The method used in estimation of the fair value: The Black-Scholes option pric-
ing model.
(2) The assumptions used for the Black-Scholes option pricing model
1. Expected volatility of stock price: 50.47%
The volatility of the market price of the Company’s stock is calculated using its
prices for the past 171 weeks prior to July 9, 2010, which are equivalent to
the expected remaining period of 3.27 years.
2. Expected remaining period: 3.27 years
This period represented expected terms during which the Company’s directors
will presumably be on duty.
3. Expected dividends:
¥5 ($0.06) per share was estimated based on actual dividends in prior years
with consideration of the merger.
4. Risk-free interest rate: 0.178%
The interest rate is estimated by using the interest of Japanese Government
Bonds of which the term is equivalent to the estimated remaining period.
(3) Estimation method for total number of vested stock subscription rights:
The total number of rights which will be vested is estimated based on the actual
number of forfeited rights due to diffi culties in estimating reasonable number of
rights to be forfeited in the future.
15. COMMISSIONSCommissions earned for the years ended March 31, 2011 and 2010 consisted of
the following:
Thousands of Millions of yen U.S. dollars
2011 2010 2011
Brokerage ........................................................ ¥ 32,466 ¥ 33,236 $ 390,450Underwriting and distribution .......................... 62,890 66,099 756,343Other ............................................................... 40,635 46,486 488,695
¥135,991 ¥145,822 $1,635,490
16. SELLING, GENERAL AND ADMINISTRATIVE EXPENSESSelling, general and administrative expenses for the years ended March 31, 2011
and 2010 were as follows:
Thousands of Millions of yen U.S. dollars
2011 2010 2011
Transaction-related expenses .......................... ¥ 38,512 ¥ 34,495 $ 463,162Personnel expenses: Compensation ............................................ 71,834 67,965 863,908 Severance and pension costs ...................... 4,739 5,712 56,993 Provision for directors’ retirement benefi ts ... 121 249 1,455 Provision for executive offi cers’ retirement benefi ts ................................... 46 180 553 Stock-based compensation ......................... 372 372 4,473 Provision for accrued employees’ bonuses ... 17,464 20,518 210,030 Welfare expenses ....................................... 9,598 8,831 115,429Real estate expenses ...................................... 28,006 26,787 336,812Administrative expenses ................................. 22,316 19,707 268,382Depreciation and amortization ....................... 23,825 23,838 286,530Tax other than income taxes ........................... 3,349 2,537 40,276Amortization of goodwill ............................... 72 591 865Other ............................................................. 9,512 7,725 114,395
¥229,773 ¥219,513 $2,763,355
70 Mizuho Securities Annual Report 2011

Notes
Real estate expenses described above consisted of expenses for tools and furni-
ture of ¥11,053 million ($132,928 thousand) and ¥9,432 million and expenses for
real estate of ¥16,952 million ($203,872 thousand) and ¥17,355 million for the
years ended March 31, 2011 and 2010, respectively.
The breakdown of transaction-related expenses was as follows:
Thousands of Millions of yen U.S. dollars
2011 2010 2011
Commission fees ................................................... ¥17,899 ¥15,993 $215,261 Membership fees on exchanges ............................ 1,391 1,320 16,728Transportation and communication expenses ........ 12,830 11,867 154,299Traveling expenses ................................................ 3,636 2,961 43,728Advertising expenses ............................................. 1,626 1,489 19,555Provision for allowance for bonus points redemption .............................................. 239 1 2,874Entertainment expenses ........................................ 888 861 10,679
¥38,512 ¥34,495 $463,162
17. OTHER INCOME, OTHER, NETThe breakdown of other income, other net for the years ended March 31, 2011
and 2010 is as follows:
Thousands of Millions of yen U.S. dollars
2011 2010 2011
Gain (loss) on sale of investment securities, net ... ¥ (61) ¥ 954 $ (733)Loss on impairment of investment securities ....... (93) (246) (1,118)Loss on disposal of noncurrent assets ................. (821) (1,735) (9,873)Gain (loss) on sale of noncurrent assets ............. — 8 —Equity in earnings (losses) of affi liates................. 73 (293) 877Loss on impairment of golf club memberships .... (63) (35) (757)Nonrecurring depreciation on noncurrent assets ............................................. (1,759) (420) (21,154)Gain on negative goodwill ................................. — 110,219 —Merger expenses ................................................ — (5,892) —Rental revenue ................................................... 864 954 10,390Rental expense ................................................... (602) (701) (7,239)Foreign exchange gains (losses) .......................... 520 (540) 6,253Dividend income ................................................ 630 749 7,576Other, net .......................................................... 1,305 2,009 15,694
¥ (8) ¥105,029 $ (96)
Merger expenses for the year ended March 31, 2010 mainly comprised advertis-
ing expenses of ¥1,329 million, expenses on real estate of ¥1,497 million and
expenses on IT-related services for the merger of ¥2,286 million.
The breakdown of loss on disposal of noncurrent assets is as follows:
Thousands of Millions of yen U.S. dollars
2011 2010 2011
Buildings ..................................................................... ¥211 ¥1,175 $2,537Equipment .................................................................. 70 415 841Software ..................................................................... 349 — 4,197Other .......................................................................... 190 145 2,285
¥821 ¥1,735 $9,873
The breakdown of gain or loss on sale of noncurrent assets is as follows:
Thousands of Millions of yen U.S. dollars
2011 2010 2011
Gain on sale of buildings .................................................. ¥— ¥8 $—Other ............................................................................... — 0
¥— ¥8 $—
Impairment losses on noncurrent assets were not recorded for the years ended
March 31, 2011 and 2010.
18. SEGMENT INFORMATIONFiscal 2010 (From April 1, 2010 to March 31, 2011)
(1) General information regarding reportable segments
The Companies report their operations in four segments: the Global Investment
Banking Division, the Global Markets & Products Division, the Corporate Investment
Services & Retail Business Division, and the Overseas Subsidiaries. These segments
are components of the Company for which discrete fi nancial information is avail-
able and whose operating results are regularly reviewed by the Company’s board of
directors to make decisions about resources to be allocated to the segments and
assess performance.
• The Global Investment Banking Division provides underwriting, M&A, securitiza-
tion, and other advisory services to institutional clients.
• The Global Markets & Products Division serves institutional clients through sales
and trading of equities, bonds, and other market instruments and provides ser-
vices related to asset management.
• The Corporate Investment Services & Retail Business Division markets equities,
bonds, investment trusts, and other instruments to clients, primarily individuals,
mid-tier small and medium-sized companies and provides services related to
fi nancing and business succession to institutional clients.
• The Overseas Subsidiaries provide services related to securities outside of Japan.
71Mizuho Securities Annual Report 2011

(2) Information regarding reportable segment income and loss
The reportable segment information for the years ended March 31, 2011 and 2010 is shown below:
Millions of yen
March 31, 2011
Global Investment Banking Division
Global Markets & Products Division
Corporate Investment Services & Retail Business Division
Overseas Subsidiaries Other Consolidated
Net operating revenues External customers ................................................................................................. ¥32,718 ¥56,756 ¥74,770 ¥22,992 ¥ 5,588 ¥192,827 Inter-segment or transfer ........................................................................................ — — — 10,297 (10,297) —
Total .......................................................................................................................... 32,718 56,756 74,770 33,290 (4,708) 192,827Income (loss) before income taxes and minority interests ............................................ 3,298 7,890 (6,143) (28,121) (13,877) (36,954)
Other items Depreciation and amortization ............................................................................... 453 4,583 7,243 1,224 10,321 23,825 Amortization of goodwill ........................................................................................ — — — — 72 72 Extraordinary gain .................................................................................................. — — — 67 1,265 1,333 Extraordinary loss ................................................................................................... 56 890 21 1,136 2,461 4,567 (including nonrecurring depreciation on noncurrent assets) .................................... (—) (628) (—) (—) (1,131) (1,759) (including litigation-related loss) ............................................................................. (—) (—) (—) (1,094) (—) (1,094)
Thousands of U.S. dollars
March 31, 2011
Global Investment Banking Division
Global Markets & Products Division
Corporate Investment Services & Retail Business Division
Overseas Subsidiaries Other Consolidated
Net operating revenues External customers ................................................................................................. $393,481 $682,573 $899,218 $276,512 $ 67,203 $2,319,025 Inter-segment or transfer ........................................................................................ — — — 123,836 (123,836) —
Total .......................................................................................................................... 393,481 682,573 899,218 400,360 (56,620) 2,319,025Income (loss) before income taxes and minority interests ............................................ 39,663 94,888 (73,878) (338,196) (166,891) (444,425)
Other items Depreciation and amortization ............................................................................... 5,447 55,117 87,107 14,720 124,125 286,530 Amortization of goodwill ........................................................................................ — — — — 865 865 Extraordinary gain .................................................................................................. — — — 805 15,213 16,031 Extraordinary loss ................................................................................................... 673 10,703 252 13,662 29,597 54,924 (including nonrecurring depreciation on noncurrent assets) .................................... (—) (7,552) (—) (—) (13,601) (21,154) (including litigation-related loss) ............................................................................. (—) (—) (—) (13,156) (—) (13,156)
Millions of yen
March 31, 2010
Global Investment Banking Division
Global Markets & Products Division
Corporate Investment Services & Retail Business Division
Overseas Subsidiaries Other Consolidated
Net operating revenues External customers ................................................................................................. ¥45,552 ¥69,891 ¥85,420 ¥61,206 ¥ (11,669) ¥250,401 Inter-segment or transfer ........................................................................................ — — — 8,200 (8,200) —
Total .......................................................................................................................... 45,552 69,891 85,420 69,406 (19,869) 250,401Income (loss) before income taxes and minority interests ............................................ 11,302 22,217 4,852 12,248 85,296 135,917
Other items Depreciation and amortization ............................................................................... 484 3,370 5,539 1,426 13,018 23,838 Amortization of goodwill ........................................................................................ — — — — 591 591 Extraordinary gain .................................................................................................. 0 — 14 836 110,385 111,236 (including gain on negative goodwill) ..................................................................... (—) (—) (—) (—) (110,219) (110,219) Extraordinary loss ................................................................................................... 205 34 97 103 7,952 8,392 (including losses on disposal of noncurrent assets) .................................................. (205) (34) (97) (103) (1,296) (1,735) (including merger expenses) ................................................................................... (—) (—) (—) (—) (5,892) (5,892)
Notes: 1. “Other” includes operating segments not included in the reportable segments and head offi ce expenses.
2. Information on segment assets is omitted from this disclosure because the Company does not allocate assets to the reportable segments.
3. Inter-segment is based on prevailing market quotations.
(3) Differences between the total amounts of reportable segments and
the amounts on the consolidated fi nancial statements, and major break-
down of the differences
Thousands of Millions of yen U.S. dollars
2011 2010 2011
(Net operating revenues)Net operating revenues per reportable segment information ........................................... ¥197,536 ¥270,270 $2,375,658 Inter-segment or transfer ................................... (10,297) (8,200) (123,836) Interest expenses ............................................... (3,242) (5,670) (38,989) Net operating revenues of former Shinko Securities Co. Ltd. for the term ended on May 6, 2009 ............................................. — (7,310) — Other ................................................................ 8,830 1,311 106,193
Consolidated ........................................................ ¥192,827 ¥250,401 $2,319,025
Thousands of Millions of yen U.S. dollars
2011 2010 2011
(Income before income taxes and minority interests)Income before income taxes and minority interests per reportable segment information ...... ¥(23,076) ¥ 50,621 $(277,522) Head offi ce expenses ......................................... (10,137) (15,751) (121,912) Gain on negative goodwill ................................. — 110,219 — Amortization of goodwill ................................... (72) (591) (865) Other ................................................................ (3,667) (8,580) (44,101)
Consolidated ........................................................ ¥(36,954) ¥135,917 $(444,425)
Note: “Head offi ce expenses” mainly comprises selling, general and administrative expenses,
etc., not attributable to the reportable segments.
72 Mizuho Securities Annual Report 2011
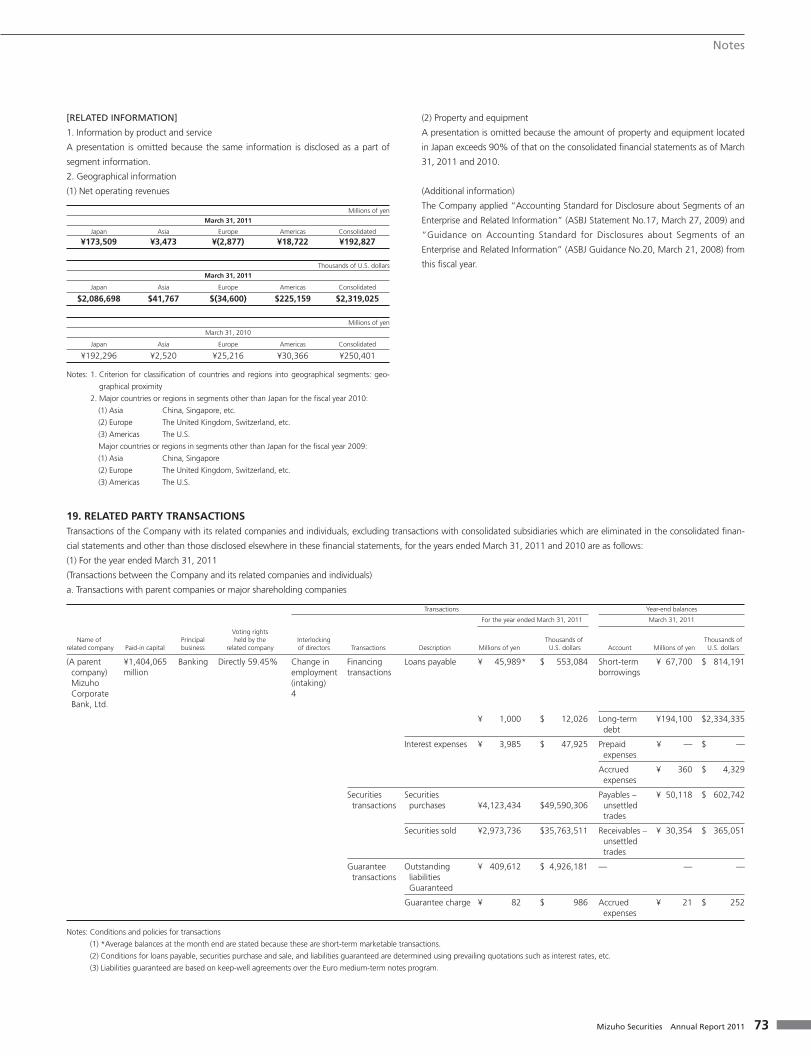
Notes
19. RELATED PARTY TRANSACTIONSTransactions of the Company with its related companies and individuals, excluding transactions with consolidated subsidiaries which are eliminated in the consolidated fi nan-
cial statements and other than those disclosed elsewhere in these fi nancial statements, for the years ended March 31, 2011 and 2010 are as follows:
(1) For the year ended March 31, 2011
(Transactions between the Company and its related companies and individuals)
a. Transactions with parent companies or major shareholding companies
Transactions Year-end balances
For the year ended March 31, 2011 March 31, 2011
Voting rights Name of Principal held by the Interlocking Thousands of Thousands of related company Paid-in capital business related company of directors Transactions Description Millions of yen U.S. dollars Account Millions of yen U.S. dollars
(A parent ¥1,404,065 Banking Directly 59.45% Change in Financing Loans payable ¥ 45,989* $ 553,084 Short-term ¥ 67,700 $ 814,191 company) million employment transactions borrowings Mizuho (intaking) Corporate 4 Bank, Ltd.
¥ 1,000 $ 12,026 Long-term ¥194,100 $2,334,335 debt
Interest expenses ¥ 3,985 $ 47,925 Prepaid ¥ — $ — expenses
Accrued ¥ 360 $ 4,329 expenses
Securities Securities Payables – ¥ 50,118 $ 602,742 transactions purchases ¥4,123,434 $49,590,306 unsettled trades
Securities sold ¥2,973,736 $35,763,511 Receivables – ¥ 30,354 $ 365,051 unsettled trades
Guarantee Outstanding ¥ 409,612 $ 4,926,181 — — — transactions liabilities Guaranteed
Guarantee charge ¥ 82 $ 986 Accrued ¥ 21 $ 252 expenses
Notes: Conditions and policies for transactions
(1) *Average balances at the month end are stated because these are short-term marketable transactions.
(2) Conditions for loans payable, securities purchase and sale, and liabilities guaranteed are determined using prevailing quotations such as interest rates, etc.
(3) Liabilities guaranteed are based on keep-well agreements over the Euro medium-term notes program.
[RELATED INFORMATION]
1. Information by product and service
A presentation is omitted because the same information is disclosed as a part of
segment information.
2. Geographical information
(1) Net operating revenues
Millions of yen
March 31, 2011
Japan Asia Europe Americas Consolidated
¥173,509 ¥3,473 ¥(2,877) ¥18,722 ¥192,827
Thousands of U.S. dollars
March 31, 2011
Japan Asia Europe Americas Consolidated
$2,086,698 $41,767 $(34,600) $225,159 $2,319,025
Millions of yen
March 31, 2010
Japan Asia Europe Americas Consolidated
¥192,296 ¥2,520 ¥25,216 ¥30,366 ¥250,401
Notes: 1. Criterion for classifi cation of countries and regions into geographical segments: geo-
graphical proximity
2. Major countries or regions in segments other than Japan for the fi scal year 2010:
(1) Asia China, Singapore, etc.
(2) Europe The United Kingdom, Switzerland, etc.
(3) Americas The U.S.
Major countries or regions in segments other than Japan for the fi scal year 2009:
(1) Asia China, Singapore
(2) Europe The United Kingdom, Switzerland, etc.
(3) Americas The U.S.
(2) Property and equipment
A presentation is omitted because the amount of property and equipment located
in Japan exceeds 90% of that on the consolidated fi nancial statements as of March
31, 2011 and 2010.
(Additional information)
The Company applied “Accounting Standard for Disclosure about Segments of an
Enterprise and Related Information” (ASBJ Statement No.17, March 27, 2009) and
“Guidance on Accounting Standard for Disclosures about Segments of an
Enterprise and Related Information” (ASBJ Guidance No.20, March 21, 2008) from
this fi scal year.
73Mizuho Securities Annual Report 2011

b. Transactions with companies that have the same parent companies and subsidiaries of the Company’s other affi liated companies
Transactions Year-end balances
For the year ended March 31, 2011 March 31, 2011
Voting rights Name of Principal held by the Interlocking Thousands of Thousands of related company Paid-in capital business related company of directors Transactions Description Millions of yen U.S. dollars Account Millions of yen U.S. dollars
(A company ¥700,000 Banking Directly 0% None Securities Securities ¥4,405,835 $52,986,590 Payables– ¥ — $ — that has the million transactions purchases unsettled same parent trades company) Mizuho Bank, Ltd.
Securities sold ¥5,243,721 $63,063,391 Receivables– ¥29,989 $360,661 unsettled trades
Transactions Year-end balances
For the year ended March 31, 2011 March 31, 2011
Voting rights Name of Principal held by the Interlocking Thousands of Thousands of related company Paid-in capital business related company of directors Transactions Description Millions of yen U.S. dollars Account Millions of yen U.S. dollars
(A company ¥80,288 Financial Directly 0% None Securities Securities ¥ 1,048 $ 12,603 Payables– ¥ — $ — that has the million services transactions purchases unsettled same parent trades company) Mizuho Investors Securities Co., Ltd.
Securities sold ¥724,841 $8,717,269 Receivables– ¥285 $3,427 unsettled trades
Note: Conditions for securities purchase and sale are determined using prevailing quotations such as interest rates, etc.
(Transactions between consolidated subsidiaries and the Company’s related companies and individuals)
Transactions Year-end balances
For the year ended March 31, 2011 March 31, 2011
Voting rights Name of Principal held by the Interlocking Thousands of Thousands of related company Paid-in capital business related company of directors Transactions Description Millions of yen U.S. dollars Account Millions of yen U.S. dollars
(A parent ¥1,404,065 Banking Directly 59.45% Change in Securities Securities ¥1,024,608* $12,322,405 Securities ¥699,244 $8,409,428 company) million employment transactions borrowing purchased Mizuho (intaking) under Corporate 4 agreements Bank, Ltd. to resell
Securities ¥ 231,721* $ 2,786,782 Securities ¥ 61,242 $ 736,524 lending sold under agreements to repurchase
Revenue from ¥ 4,443 $ 53,433 Accrued ¥ 99 $ 1,190 securities income borrowing transactions
Expenses from ¥ 708 $ 8,514 Accrued ¥ 1 $ 12 securities expenses lending transactions
Notes: Conditions and policies for transactions, etc.
(1) *Average balances at the month end are stated because these are short-term marketable transactions.
(2) Conditions for bond repurchase agreements are determined using prevailing quotations such as interest rate, etc.
(Information on parent companies)
• Mizuho Financial Group, Inc.: Listed on the Tokyo Stock Exchange, Osaka Securities Exchange, and New York Stock Exchange. American Depository Receipts (ADRs) are listed
on the New York Stock Exchange.
• Mizuho Corporate Bank, Ltd. (Unlisted)
74 Mizuho Securities Annual Report 2011

Notes
(2) For the year ended March 31, 2010
(Transactions between the Company and its related companies and individuals)
a. Transactions with parent companies or major shareholding companies
Transactions Year-end balances
For the year ended March 31, 2010 March 31, 2010
Voting rights Name of Principal held by the Interlocking related company Paid-in capital business related company of directors Transactions Description Millions of yen Account Millions of yen
(A parent ¥1,404,065 Banking Directly 59.48% Change in Financing Loans payable ¥ 20,323* Short-term borrowings ¥ 29,777 company) million employment transactions Mizuho (intaking) Corporate 3 Bank, Ltd. Indirectly 0.00%
Long-term debt ¥260,800
Interest expenses ¥ 4,441 Prepaid expenses ¥ —
Accrued expenses ¥ 448
Securities Securities ¥2,856,871 Payables–unsettled ¥301,184 transactions purchases trades
Securities sold ¥2,395,254 Receivables–unsettled ¥ 97,702 trades
Guarantee Outstanding ¥ 350,017 — ¥ — transactions liabilities Guaranteed
Guarantee charge ¥ 49 Accrued expenses ¥ 16
Notes: Conditions and policies for transactions
(1) *Average balances at the month end are stated because these are short-term marketable transactions.
(2) Conditions for loans payable, securities purchase and sale, and liabilities guaranteed are determined using prevailing quotations such as interest rates, etc.
(3) Liabilities guaranteed are based on keep-well agreements over the Euro medium-term notes program.
b. Transactions with companies that have the same parent companies and subsidiaries of the Company’s other affi liated companies
Transactions Year-end balances
For the year ended March 31, 2010 March 31, 2010
Voting rights Name of Principal held by the Interlocking related company Paid-in capital business related company of directors Transactions Description Millions of yen Account Millions of yen
(A company ¥700,000 Banking Directly 0% None Securities Securities purchases ¥5,205,681 Payables–unsettled ¥ — that has the million transactions trades same parent company) Mizuho Bank, Ltd.
Securities sold ¥6,342,350 Receivables–unsettled ¥13,785 trades
Transactions Year-end balances
For the year ended March 31, 2010 March 31, 2010
Voting rights Name of Principal held by the Interlocking related company Paid-in capital business related company of directors Transactions Description Millions of yen Account Millions of yen
(A company ¥3,005 Financial Directly 0% None Securities Underwriting of ¥ 237,000 — ¥— that has the million services transactions Securities same parent transactions company) Mizuho Capital Investment (JPY) 5 Limited
Underwriting ¥ 1,437 — ¥— commission
Note: Conditions for securities purchase and sale are determined using prevailing quotations such as interest rate, etc.
75Mizuho Securities Annual Report 2011

(Transactions between consolidated subsidiaries and the Company’s related companies and individuals)
Transactions Year-end balances
For the year ended March 31, 2010 March 31, 2010
Voting rights Name of Principal held by the Interlocking related company Paid-in capital business related company of directors Transactions Description Millions of yen Account Millions of yen
(A parent ¥1,404,065 Banking Directly 59.48% Change in Securities Securities borrowing ¥1,810,300* Securities purchased ¥1,607,196 company) million employment transactions under agreements Mizuho (intaking) to resell Corporate 3 Bank, Ltd.
Indirectly 0.00% Securities lending ¥ 450,324* Securities sold ¥ 655,346 under agreements to repurchase
Revenue from ¥ 8,409 Accrued income ¥ 64 securities borrowing transactions
Expenses from ¥ 1,400 Accrued expenses ¥ 1 securities lending transactions
Notes: Conditions and policies for transactions
(1) *Average balances at the month end are stated because these are short-term marketable transactions.
(2) Conditions for bond repurchase agreements are determined using prevailing quotations such as interest rate, etc.
(Information on parent companies)
• Mizuho Financial Group, Inc.: Listed on the Tokyo Stock Exchange, Osaka Securities Exchange, and New York Stock Exchange. American Depository Receipts (ADRs) are listed
on the New York Stock Exchange.
• Mizuho Corporate Bank, Ltd. (Unlisted)
20. CHANGES IN NET ASSETSBelow is supplementary information on changes in net assets for the year ended March 31, 2011.
(1) Number of shares outstanding
As of March 31, 2010 Increase Decrease As of March 31, 2011
Number of shares issuedCommon stock
(thousands)1,626,688
(thousands)—
(thousands)—
(thousands)1,626,688
Total 1,626,688 — — 1,626,688
(2) Treasury stock
As of March 31, 2010 Increase Decrease As of March 31, 2011
Treasury stockCommon stock
(thousands)38,190
(thousands)127*1
(thousands)569*2
(thousands)37,749
Total 38,190 127 569 37,749
*1 The increase in the number of common stock held in treasury stock of 127 thousand shares is mainly due to the purchases of odd-lot shares.
*2 The decrease in the number of common stock held in treasury stock of 569 thousand shares consists of 28 thousand shares due to a request to purchase odd-lot shares and 536 thousand shares due to
the exercise of stock subscription rights.
(3) Stock subscription rights
Stock subscription rights granted under stock option program at March 31, 2011 amounted to ¥582 million ($6,999 thousand), all of which was attributable to the Company.
(4) Dividends
(a) Dividends paid during the year ended March 31, 2011
Date of resolution Class of shares Total amount of dividends Dividends per share Record date Effective date of payment
At the shareholders’ meeting on June 22, 2010
Common stock¥7,942 million
($95,514 thousand)¥5
($0.06)March 31, 2010 June 23, 2010
Note: Dividends per share included ordinary dividend of ¥3 ($0.03) and commemorative dividend ¥2 ($0.02).
(b) Dividends resolved during the fi scal year to be paid in the next fi scal year
Not applicable
Below is supplementary information on changes in net assets for the year ended March 31, 2010.
The Company merged with the former Mizuho Securities Co., Ltd. on May 7, 2009. Because the merger is accounted for as a reverse acquisition under the Accounting
Standards for Business Combinations, the beginning balance of consolidated shareholders’ equity at April 1, 2009, is that of the former Mizuho Securities Co., Ltd.
Consequently, the ending balance at March 31, 2009 does not correspond to the beginning balance at April 1, 2009. The following is to make an explanation of some line
items in the consolidated statements of changes in net assets:
76 Mizuho Securities Annual Report 2011

Notes
(1) Acquired company’s beginning balance is the Company’s (consolidated) ending balance for the previous fi scal year.
(2) Balance of the acquiring company at March 31, 2009 represents the consolidated ending balance of the former Mizuho Securities Co., Ltd. for the previous fi scal year.
(3) Increase due to merger resulted from the application of the acquisition method to the business combination between the Company (acquired company) and the former
Mizuho Securities (acquiring company).
(4) ¥2,318 million of dividends paid from retained earnings was included in Increase (decrease) due to merger under Retained earnings since the Company’s dividend record
date was March 31, 2009 (effective June 26, 2009).
(1) Number of shares outstanding
As of March 31, 2009 Increase Decrease As of March 31, 2010
Number of shares issuedCommon stock
(thousands)6,685*1
(thousands)1,620,003*2
(thousands)—
(thousands)1,626,688
Total 6,685 1,620,003 — 1,626,688
*1 As the merger was accounted for as a reverse acquisition, the number of shares at the end of the previous fi scal year is that of the former Mizuho Securities Co., Ltd.
*2 The increase in the number of shares outstanding (common stock) of 1,620,003 thousand shares was due to the merger.
(2) Treasury stock
As of March 31, 2009 Increase Decrease As of March 31, 2010
Treasury stockCommon stock
(thousands)—*1
(thousands)38,226*2
(thousands)35*3
(thousands)38,190
Total — 38,226 35 38,190
*1 As the merger was accounted for as a reverse acquisition, the number of shares at the end of the previous fi scal year is that of the former Mizuho Securities Co., Ltd.
*2 The increase in the number of common stock held in treasury stock of 38,226 thousand shares mainly consists of 38,135 thousand shares due to the merger and 90 thousand shares due to the pur-
chases of odd-lot shares.
*3 The decrease in the number of common stock held in treasury stock of 35 thousand shares consists of 5 thousand shares due to a request to purchase odd-lot shares and 30 thousand shares due to the
exercise of stock subscription rights.
(3) Stock subscription rights
Stock subscription rights granted under the stock option program at March 31, 2010 amounted to ¥367 million, all of which was attributable to the Company.
(4) Dividends
(a) Dividends paid during the year ended March 31, 2010
Date of resolution Class of shares Total amount of dividends Dividends per share Record date Effective date of payment
At the shareholders’ meeting on June 25, 2009
Common stock ¥2,318 million ¥3 March 31, 2009 June 26, 2009
(b) Dividends resolved during the fi scal year to be paid in the next fi scal year
Date of resolution Class of shares Total amount of dividends Source of dividend Dividends per share* Record date Effective date of payment
At the shareholders’ meeting on June 22, 2010
Common stock ¥7,942 million Retained earnings ¥5 March 31, 2010 June 23, 2010
* Dividends per share included ordinary dividend of ¥3 and commemorative dividend of ¥2.
21. FAIR VALUE OF FINANCIAL INSTRUMENTS(1) Difference between carrying amount and fair value
The carrying amounts of cash and bank deposits, collateralized short-term fi nanc-
ing agreements, payables-unsettled trades, deposits received, guarantee deposits
received, commercial paper and corporate bonds due within one year approximate
fair value because of their short-term maturities, and so do those of trading assets,
operating investment securities, trading liabilities and derivatives because they are
valued using prevailing market quotations. The carrying amount and estimated fair
value of the other fi nancial instruments as of March 31, 2011 and 2010 are sum-
marized as follows:
For the year ended March 31, 2011
Millions of yen
Carrying amount Fair value Difference
Securities ............................................... ¥ 10,681 ¥ 10,687 ¥ 5Investment securities .............................. 38,749 38,759 10Short-term borrowings ........................... 3,866,122 3,866,582 460Bonds and notes due over one year ....... 554,068 548,248 (5,820)Long-term borrowings ........................... 621,361 620,237 (1,123)
Thousands of U.S. dollars
Carrying amount Fair value Difference
Securities .............................................. $ 128,454 $ 128,526 $ 60Investment securities ............................. 466,013 466,133 120Short-term borrowings .......................... 46,495,754 46,501,286 5,532Bonds and notes due over one year ...... 6,663,475 6,593,481 (69,993)Long-term borrowings .......................... 7,472,772 7,459,254 (13,505)
For the year ended March 31, 2010
Millions of yen
Carrying amount Fair value Difference
Securities ............................................... ¥ 47,469 ¥ 47,473 ¥ 4Investment securities .............................. 56,245 56,271 25Short-term borrowings ........................... 2,766,084 2,766,131 47Bonds and notes due over one year ....... 508,122 497,120 (11,001)Long-term borrowings ........................... 578,563 579,105 541
Notes:
Methods for determining estimated fair value of fi nancial instruments.
a. Securities and investment securities
The fair value of securities held for trading purposes is based on quoted market prices.
The fair value of investments in partnerships is derived from our equity in the partnerships with
assets fair valued using market prices when available.
The fair value of investment trusts is based on net asset value.
77Mizuho Securities Annual Report 2011

(2) Derivatives
The following table shows the notional amounts, fair value and unrealized gain (loss) on derivatives that are entered into for non-trading purposes.
The fair value and unrealized gain (loss) on derivatives are determined based on market prices, discounted cash fl ows, option pricing models and others.
a. Derivative instruments not qualifying for hedge accounting
March 31, 2011
Millions of yen Thousands of U.S. dollars
Notional amounts Fair value Unrealized gain (loss) Notional amounts Fair value Unrealized gain (loss)
Options ................................................................ ¥ — ¥— ¥— $ — $ — $ —Foreign exchange forwards .................................. (1,321) (4) (4) (15,886) (48) (48)Futures and forwards ........................................... (55) 1 1 (661) 12 12
Total .................................................................... ¥(1,377) ¥(3) ¥(3) $(16,560) $(36) $(36)
March 31, 2010
Millions of yen
Notional amounts Fair value Unrealized gain (loss)
Options ................................................................ ¥ — ¥ — ¥ —Foreign exchange forwards .................................. (4,195) (42) (42)Futures and forwards ........................................... 202 2 2
Total .................................................................... ¥(3,993) ¥(40) ¥(40)
Note: Claims and obligations arising from derivatives are stated in a net amount. Figures in parentheses represent net liability amounts.
b. Derivative instruments qualifying for hedge accounting
March 31, 2011
Millions of yen Thousands of U.S. dollars
Notional amounts Fair value Unrealized gain (loss) Notional amounts Fair value Unrealized gain (loss)
Options .............................................................. ¥ — ¥ — ¥ — $ — $ — $ —Foreign exchange forwards ................................ (67,348) (1,002) (1,002) (809,957) (12,050) (12,050)Futures and forwards ......................................... — — — — — —
Total .................................................................. ¥(67,348) ¥(1,002) ¥(1,002) $(809,957) $(12,050) $(12,050)
March 31, 2010
Millions of yen
Notional amounts Fair value Unrealized gain (loss)
Options ................................................................ ¥ — ¥ — ¥ —Foreign exchange forwards .................................. (36,262) (1,302) (1,302)Futures and forwards ........................................... — — —
Total .................................................................... ¥(36,262) ¥(1,302) ¥(1,302)
Notes: 1. Claims and obligations arising from derivatives are stated in a net amount. Figures in parentheses represent net liability amounts.
2. The fair value of the interest rate swaps qualifying for exceptional accrual method is included in the above fair value of related long-term borrowings.
(3) Expected collections of monetary assets and securities with maturities at March 31, 2011 are as follows:
Millions of yen
Other securities with maturities
Corporate bonds Corporate bonds Other bonds Others with Cash and deposits held-to-maturities with maturities with maturities maturities Total
Year ending March 31,2011........................................................................... ¥377,449 ¥2,000 ¥1,200 ¥ 4,042 ¥10,268 ¥394,9602012 to 2015 ............................................................. 1,500 500 10,206 38,332 50,5382016 to 2020 ............................................................. 2,536 15,451 17,9882021 and thereafter .................................................... 2,283 2,283
Thousands of U.S. dollars
Other securities with maturities
Corporate bonds Corporate bonds Other bonds Others with Cash and deposits held-to-maturities with maturities with maturities maturities Total
Year ending March 31,2011........................................................................... $4,539,374 $24,052 $14,431 $ 48,610 $123,487 $4,749,9692012 to 2015 ............................................................. 18,039 6,013 122,742 460,998 607,7932016 to 2020 ............................................................. 30,499 185,820 216,3312021 and thereafter .................................................... 27,456 27,456
Also please refer to Note 4 FINANCIAL INSTRUMENTS for further information on fair value of
trading securities, securities and investment securities.
b. Short-term borrowings and long-term borrowings
The fair value of short-term borrowings and long-term borrowings is determined as the total of
principal and interest discounted by interest rates refl ecting the remaining maturities and credit
risk.
The fair value of the interest rate swaps qualifying for the exceptional accrual method is
included in the above fair value of related long-term borrowings.
c. Bonds and notes due over one year
The fair value of bonds and notes is based on either quoted market prices when available or the
total of principal and interest discounted by interest rates refl ecting the remaining maturities and
credit risk.
d. Derivatives
Please refer to the following section.
78 Mizuho Securities Annual Report 2011
Notes
(4) Financial instruments and risk management
a. Basic policy for fi nancial instruments
The Companies provide various fi nancial services to a wide range of customers,
from individuals to institutional investors, fi nance companies, and public corpora-
tions both in and outside of Japan. The Companies are very active in supporting
capital markets as responsible securities companies. They carry out their trading
transaction businesses and strategic investments on their own accounts to contrib-
ute to the performance of sound market functions and fair price formation, and to
facilitate the smooth distribution of fi nancial instruments. Towards this end, the
Company is committed to achieving a more stable and effective fundraising struc-
ture by appropriately combining borrowings from fi nancial institutions, MTNs, CPs,
call money, transactions under repurchase and resale agreements, repo trading,
and other transactions.
b. Financial instruments and related risks
The Companies are engaged in trading transactions dealing in various fi nancial
instruments (including derivatives). As such, they are exposed to risks arising from
the fl uctuations of stock prices, interest rates and foreign exchange rates. The
Companies underwrite shares and bonds, and therefore, they are exposed to risk
arising from price fl uctuations when securities remain unsubscribed in the course
of offering them for sale. The Companies have certain investments in limited liabili-
ty investment partnerships and investments related to their venture capital busi-
ness. Impairment or losses of such investments may occur in conjunction with
defaults of investee companies. Investment securities, such as shares held for long-
term periods, are exposed to risk of stock price declines. In connection with making
bank borrowings to raise working capital for trading activities including derivatives,
the Companies are exposed to liquidity risk and market risk arising from fl uctua-
tions in interest rates.
c. Risk management structures for fi nancial instruments
The Companies have a shared comprehensive risk management structure under
the Mizuho Financial Group as a whole with the objectives of responding properly
to changes in the operating environment, including modifi cations in laws and regu-
lations, strengthening internal controls, and greater emphasis on risk management
within the corporate environment.
Firstly, the Companies’ basic stance regarding risk management and the com-
mon framework for management of various types of risk are set forth in the Basic
Policy for Comprehensive Risk Management, which was approved by a resolution
of the Board of Directors of the Company following deliberation by the Executive
Management Committee. Appropriate risk management is conducted based on
this Basic Policy and separate basic management policies have been determined for
each type of risk.
Then, throughout all internal organizational units responsible for risk manage-
ment, the management of risk is conducted in a manner that is appropriate to the
content of business operations as well as the scale and type of risk involved. At the
same time, the Company has formed the Risk Management Committee (chaired by
a Director and Deputy President in charge of risk management, with the Head of
the Global Risk Management Group as deputy chair) as a committee at which
important matters pertaining to risk management are examined and consulted
upon, and the Committee conducts comprehensive risk management.
Risk monitoring systems and other aspects of risk management are as follows:
The Global Risk Management Group’s Risk Management Department and Credit
Management Department, which are both independent from front-offi ce func-
tions, are responsible for market risk and credit risk. Their activities include gauging
the magnitude of risk and monitoring activities in the Company’s operations,
including overseas offi ces. At the same time, they conduct analysis of risks from a
variety of different perspectives. Especially in the case of credit and market risk
associated with securitization products that are relatively complex and are generally
traded in limited volumes in secondary markets, risk management measures are
executed by the Risk Management Department and the Credit Management
Department. With respect to funding liquidity risk, the Risk Management
Department and the Treasury Department sustain a controlling posture regarding
operational management and administration while collaboratively conducting daily
monitoring operations with the goal of governing and maintaining a proper bal-
ance between sources and uses of funds.
The Company has also put into place frameworks that support management
decision making on the development and creation of business opportunities from
the viewpoint of controlling risks through the allocation of risk capital to each
internal business group with the objective of securing an allocation of manage-
ment resources that is appropriate to the risks involved in their business activities.
A separate set of guidelines—the “Mizuho Securities Group Risk Control
Guiding Principles”—has been established for overseas offi ces in order to ensure
comprehensive risk management in accordance with this basic risk management
policy and framework throughout the Companies as a whole and these are thor-
oughly applied.
(1) Credit risk management
(Issuer and counterparty risk)
The Companies defi ne credit risk as their exposure to the risk of losses that may be
incurred: (a) when the issuer of a security or other fi nancial instrument that they
hold, or a transactions counterparty with which they have a lending or borrowing
relationship becomes unable to meet its obligations as a result of bankruptcy or
other circumstances, or (b) when the possibility of such non-performance of obliga-
tions increases, resulting in a loss of the value of the assets.
To manage the risk associated with issuers of securities and other instruments
held in the Companies’ trading accounts, an upper limit is set on holdings of
instruments issued by a single issuer based on the amount of expected losses that
may arise in a “credit event,” such as a reduction in the credit rating of, or the
default of, the issuer. The holding volume is monitored on a daily basis to control
and prevent the excessive concentration of risk exposure in certain issuers. In
addition, those issuers for which the judgment is made to treat with caution from
a credit risk perspective are subject to a “credit watch” and managed on an indi-
vidual basis.
Risk related to transaction partners arises when claims (involving the cost of repli-
cating the transaction) occur as a result of fl uctuations in the price of assets
involved in transactions and when the credit standing of the counterparty deterio-
rates. Therefore, credit limits are established based on the creditworthiness of the
counterparty, and the amount corresponding to credit exposure to each counter-
party is calculated on a daily basis. Risk is managed by confi rming compliance with
established credit limits and other means.
In determining the creditworthiness of counterparties, internal credit ratings are
assigned based on quantitative and qualitative analyses, and these ratings are
reviewed periodically.
The size of credit risk arising from issuer risk and counterparty risk for the port-
folio is measured on a daily basis using statistical methods. Based on these
results, reports, including at overseas offi ces, are made to the management on a
periodic basis.
Moreover, the Company and its subsidiaries perform the principal activities relat-
ed to the investment business using the capital of the Group by making invest-
ments through their own accounts in assets such as private equity funds, real
estate-backed fi nancial products, the stocks of unlisted companies, etc. for which
the invested principal is not guaranteed.
To manage the risk associated with these investments, the Investment
Examination Committee, chaired by a Director and Deputy President appointed by
the President, and the Investment Risk Assessment Sub-committee consisting of
personnel engaged in actual business are responsible for thoroughly examining the
existence of risk and monitoring risk after implementation of investments, principal
members of which are from the Credit Management Department that functions as
the offi ce of the activities. In addition, they control the size of loss in case of real-
ization of the risk by establishing the upper limit of investment for the principal as
a whole and for each investment category, and report the results of monitoring
periodically to the management.
79Mizuho Securities Annual Report 2011

(2) Market risk management
The Companies defi ne market risk as the risk of losses they may incur due to the
impact of fl uctuations of interest rates, stock prices, and foreign exchange rates on
the values of the securities they hold and the derivative transactions in which they
are counterparties. In addition, when managing market risk, the Companies
include the risk of losses incurred in the event that it becomes impossible to exe-
cute transactions in the market because of market turmoil as well as losses arising
from transactions forced to be made at prices signifi cantly less favorable than usual
(market liquidity risk).
To manage market risk, the Companies allocate a specifi ed amount of risk capital
to units engaged in market trading, including overseas offi ces, and set an upper
limit on exposure based on allocated capital as well as loss-cutting limits. These
position limits are monitored on a daily basis. The volume of market risk is mea-
sured using the value-at-risk (VAR) method, and sensitivities to various market fac-
tors and other risk indicators are measured and monitored on a daily basis. In
addition, they work to fully comprehend risk conditions during “event risk” (result-
ing from extreme market fl uctuations and other developments that cannot be fully
captured through the VAR approach) and sudden declines in prices resulting from
lower market liquidity through the use of periodic stress tests.
With regard to its VAR model, the Company has received approval from the
Japanese Financial Services Agency to adopt the internal management model
method, and this model is employed in the calculation of the capital adequacy
ratio.
The qualitative information about market risk is as follows:
i. Trading business
The table below shows the status of market risk by measuring VAR for the
Companies trading businesses for the year ended March 31, 2011.
VAR in trading business
Fiscal 2010(From April 1, 2010 to March 31, 2011)
Billions of yen Thousands of U.S. dollars
At end of period .................................................. ¥3.1 $37,282Maximum ............................................................ 3.7 44,497Minimum ............................................................. 1.9 22,850Average ............................................................... 2.6 31,268
For some securities held by overseas subsidiaries whose market liquidity declined,
the Company has carried out risk management based on the maximum loss
expected when any stress event similar to the Lehman Shock occurs instead of the
VAR method. Such maximum loss expected determined for the purpose of risk
management for the fi rst half of the year ending March 31, 2012 is ¥11.7 billion
($140,709 thousand).
[Defi nition of trading business]
(1) Trading conducted for the purpose of resale on a short-term basis;
(2) Trading conducted for the purpose of benefi ting from changes of fair values or
differences among markets;
(3) Trading having the features of (1) and (2) above; and
(4) Trading conducted for trading agency businesses among customers or through
market making
[Measurement of VAR of trading business]
Linear risk: Variance co-variance model (one-year observation period)
Non-linear risk: Historical simulation model (two-year observation period)
VAR: Simple aggregation of linear risk and non-linear risk
Quantitative criteria: 1) Confi dence interval: one-sided 99%; 2) Holding period:
one day
ii. Strategic equity holding
For strategic equity holdings, the Company has developed an outstanding holding
reduction plan and striven to curtail the outstanding balances and manage market
risk based on risk indicators. The risk indicator (sensitivity to a 1 percentage point
change in the TOPIX index) for such shares held as of March 31, 2011 is the market
value of ¥0.2 billion ($2,405 thousand).
iii. Non-trading business
The Company holds some fi nancial instruments with fair value in non-trading busi-
nesses. As these instruments are exposed to price fl uctuation risk, the Company
manages non-trading business risk by setting a position line for the non-trading
business and mitigates this type of risk by allocating risk capital in proportion to the
risk characteristics.
iv. Risk management through the VAR method
VAR represents maximum possible loss to be incurred for a portfolio held for a cer-
tain period (holding period) and a certain probability (confi dence interval) arising
from the movements of a market. Functionally speaking, VAR is a market risk mea-
surement approach based on the statistical assumptions. Therefore, the following
should be noted in using VAR.
– Values of VAR vary according to the holding period and confi dence interval set,
and the methods for measuring the holding period and confi dence interval;
– VAR estimated based on the historical experiences of markets may not always
derive actual maximum losses;
– VAR represents maximum loss when the Company continues to hold the portfo-
lio for the predetermined period. If liquidity is insuffi cient because of market tur-
moil or other events, the inability to sell a portfolio or hedge a transaction may
result in a loss in excess of the VAR; and
– Potential loss is not identifi ed if the probability of a loss is above a predetermined
confi dence interval.
With respect to the variance co-variance model used for measuring VAR by the
Company, it is assumed that market fl uctuations take place according to a normal
distribution. As such, in any circumstances where extreme market fl uctuations
beyond the assumption are likely, it may be possible that the risk is undervalued.
The assumption is that interest rate and stock price increases generally take place
at the same time. The risk may also be undervalued whenever this normal correla-
tion fails.
The Companies periodically verify the effectiveness of the measurement of mar-
ket risk by VAR by applying back testing procedures where VAR is compared with
gains and losses. The Companies also carry out stress tests periodically based on
various stress scenarios to identify any risk not grasped by VAR.
(3) Securitization product risk management
The Companies defi ne securitized product risk as the risk of deterioration in their
fi nancial position due to losses they may incur owing to a decline in the asset prices
of the securitization products they hold. In addition, securitization product risk also
includes the legal, reputational, and other risks that may be incurred as a result of
failing to provide appropriate disclosure regarding securitized products sold by the
Company to investors.
To manage securitization product risk, the Company calls on a number of units
responsible for risk management to conduct screenings from a variety of different
perspectives of individual securitization products originated by the Company or by
other parties, to assess the risk to its portfolio and ensure investment protection.
In addition, the Company monitors the market value of such products on a daily
basis to substantially improve the precision of methods for assessing the market
value of its holdings of securitization products, and, at the same time, to establish
an upper limit on the holding of such securities.
(4) Funding liquidity risk management
Funding liquidity risk is the risk of losses arising from funding diffi culties due to
deterioration in fi nancial position that makes it diffi cult for the Company to raise
the necessary funds or forces it to raise funds at signifi cantly higher interest rates
than usual.
The Company monitors its cash-in and cash-out positions, including at overseas
offi ces, on a daily, quantitative basis, and sets limits on the level of fund-raising by
80 Mizuho Securities Annual Report 2011

Notes
source. In addition, restrictions are imposed at various levels and reports on liquidity
management are presented to top management on a periodic basis.
In addition to the above structural restrictions, the Company has also established
a set of guidelines aimed at understanding its cash-in and cash-out positions in
advance, and monitoring its liquidity positions on a daily basis.
d. Supplementary explanations of matters related to the fair value of fi nancial
instruments
Fair values of fi nancial instruments include values based on market prices and
values deemed as market prices obtained by the reasonable estimate when fi nan-
cial instruments have no market prices. Because certain fl uctuation and other fac-
tors are incorporated in calculating these values, they may differ when different
assumptions are adopted. Meanwhile, for any notional amount relating to deriva-
tive transaction, the value itself does not represent the market risk related to the
derivatives.
22. SUBSEQUENT EVENTSMizuho Financial Group, Inc. (“MHFG”), Mizuho Corporate Bank, Ltd. (“MHCB”),
and Mizuho Securities Co., Ltd. (“MHSC”) determined, at their respective meeting
of the board of directors held on April 28, 2011, to make MHSC a wholly-owned
subsidiary through a share exchange. The share exchange agreement was signed
by the parties on the same day.
Before the effective date of the share exchange, the common stock of MHSC
will be delisted from the Tokyo Stock Exchange, the Osaka Securities Exchange,
and the Nagoya Stock Exchange on August 29, 2011 (with the fi nal trading day
scheduled to be August 26, 2011).
(1) Name of company subject to share exchange; nature of business; effec-
tive date, legal framework and main purpose of the share exchange
1) Company to be made
wholly owned subsid-
iary via share exchange
Mizuho Securities
Financial Instruments Business
September 1, 2011 (planned)
In accordance with Article 767 of Japan’s Companies
Act, the share exchange will be conducted between
MHCB, which will become a wholly-owing parent,
and MHSC, which will become a wholly-owned sub-
sidiary of MHCB.
MHFG announced the Transformation Program as the
Medium-term Management Policy of Mizuho in May
2010, in order to respond promptly and appropriately
to the new business environment that surrounds
fi nancial institutions, including changes in economic
and social structures and revisions of international
fi nancial supervision and regulations after the global
fi nancial crisis. Mizuho has conducted a fundamen-
tal review of the management challenges it faces,
and the entire group is now implementing measures
to achieve sustainable growth through initiatives for
further enhancement of three areas, “profi tability,”
“fi nancial base” and “front-line business capabili-
ties,” while pursuing the group’s “customer first
policy”.
The transaction turning MHSC into a wholly
owned-subsidiary is intended to further enhance the
“group collective capabilities” by integrating group-
wide business operations, optimizing management
resources, such as workforces and branch networks,
and accelerating the implementation of the
2) Business
3) Effective date of share
exchange
4) Legal framework
5) Main purpose of share
exchange
Transformation Program. Specifi cally, the transaction
aims to (i) ensure a prompt decision-making process
and flexibility of strategies and establish a group
management structure that can respond with greater
flexibility to the changes in the external business
environment and challenges of the group as a whole
as well as of each group company, (ii) further
enhance Mizuho’s comprehensive fi nancial services
capabilities, which are Mizuho’s strengths, and rein-
force group collaboration that provides seamless full-
line services that include banking, trust and securities
functions, and (iii) pursue improvement of group
management efficiency by thoroughly promoting
the consolidation of operations and the cost struc-
ture reforms.
(2) Share exchange ratio, calculation method, number of shares to be
delivered
1) Share exchange ratio
Company
MHFG(holding company and sole parent company of MHCB)
MHSC(comwpany becoming a
wholly-owned subsidiary)
Share exchange ratio breakdown 1 1.48
2) Calculation method
MHFG, MHCB, and MHSC have determined on the above share exchange ratio at
their respective meetings of the board of directors held on April 28, 2011. The ratio
takes into consideration the results of analyses of the share exchange ratio provid-
ed by Merrill Lynch Japan Securities Co., Ltd., and JP Morgan Securities Japan Co.,
Ltd., and is the result of negotiations and consultations among the parties that
considered the fi nancial conditions, earnings trends, and share price trends of
MHFG and MHSC. Due consideration was also given to the interests of sharehold-
ers of MHFG and MHSC.
3) Number of shares to be transferred
Common shares of MHFG: 958,035,295 shares (subject to change)
23. BUSINESS COMBINATIONOn May 7, 2009, the Company merged with the former Mizuho Securities Co.,
Ltd., following Basic Merger Agreement signed on April 28, 2008 and Merger
Agreement signed on March 4, 2009. As a member of the Mizuho Financial
Group, the Company determined that it is necessary to leverage the Company’s
strength as a securities arm of a banking institution, to become more competitive
in a market where there is now greater uncertainty, to improve its service provid-
ing-capabilities to its clients and furthermore to reestablish its business to enable it
to offer competitive cutting-edge fi nancial services on a global basis.
1. Outline of the merger
a. Acquired company: The Company
b. Business type: Financial Instruments Business
c. Date of the business combination: May 7, 2009
d. Legal form of the business combination:
The Company is the surviving entity, and the former Mizuho Securities Co., Ltd.
is the dissolving entity.
e. Name of the company after the business combination: Mizuho Securities Co.,
Ltd.
f. Merger ratio: Common stock 1: 122
g. Calculation method of merger ratio:
In calculating the merger ratio, the Company and the former Mizuho Securities
Co., Ltd. appointed third-party appraisers respectively for the sake of fairness.
Both parties concluded the above merger ratio is appropriate, considering the
valuations of respective appraisers, fi nancial condition and asset situation of
each party, and other factors in a comprehensive manner.
81Mizuho Securities Annual Report 2011

h. Number of new shares issued: Common stock: 815,570,000 shares
i. Grounds of determination of the acquiring company:
As Mizuho Corporate Bank, Ltd., a shareholder of the former Mizuho Securities
Co., Ltd. which was the legal dissolving entity, holds over half of the new compa-
ny’s voting rights as a result of the Merger, the former Mizuho Securities Co.,
Ltd., was considered to be the acquiring company and the Company was the
acquired company under the Accounting Standards for Business Combinations.
2. Period of the acquired company’s result included in the consolidated
fi nancial statements
From May 7, 2009 to March 31, 2010
3. Acquisition cost and its breakdown of the acquired company
Consideration for acquisition:
Common stock of the former Mizuho Securities Co., Ltd ¥181,658 million
Expenses directly attributable to the combination:
Advisory fees and others ¥118 million
Total Acquisition cost: ¥181,777 million
4. Negative goodwill
a. Amount of negative goodwill recognized: ¥110,219 million
b. Cause:
The fair value of the Company’s net assets at the time of merger exceeded the
acquisition cost, and the difference was recognized as negative goodwill in the
consolidated fi nancial statements.
c. Accounting method:
Recorded as income for the fi scal year in which the negative goodwill is recognized,
with early adoption of “Accounting Standard for Business Combinations” (ASBJ
Statement No. 21, December 26, 2008).
5. Amount allocated to intangible fi xed assets other than goodwill, break-
down by major type, and weighted-average amortization period in total
and by major type
a. Amount allocated to intangible fi xed assets: ¥73,949 million
b. Breakdown by major type:
Customer-Related Assets: ¥73,949 million
c. Weighted-average amortization period in total and by major type:
Customer related assets 16 years
6. Approximate impact on consolidated statement of operations for the
year assuming the business combination had completed at the beginning
of the year. (Unaudited)
Operating revenues ¥8,670 million
Operating loss ¥966 million
Ordinary loss ¥174 million
Loss before income taxes ¥172 million
Net loss ¥465 million
Net loss per share ¥0.29
The above approximate fi gures represent consolidated results for the period from
the beginning of the year to the business combination date because it was deemed
to be a reverse acquisition and as such it should not be construed to represent con-
solidated results assuming the business combination had completed at the begin-
ning of the year.
Notes
OTHER INFORMATION (UNAUDITED)The following schedule presents a summary of quarterly consolidated operating
results for the year ended March 31, 2011.
Millions of yen
Quarter ended Quarter ended Quarter ended Quarter ended June 30, September 30, December 31, March 31, 2010 2010 2010 2011
Revenues ............................. ¥71,165 ¥91,978 ¥62,758 ¥42,694Income (loss) before income taxes and minority interests ............... 1,278 9,816 (9,518) (38,530)
Net income (loss) ................. 470 5,926 (6,829) (28,880)
Net income (loss) per share (¥) ...................... 0.30 3.73 (4.30) (18.18)
Thousands of U.S. dollars
Quarter ended Quarter ended Quarter ended Quarter ended June 30, September 30, December 31, March 31, 2010 2010 2010 2011
Revenues ............................. $855,862 $1,106,169 $754,756 $513,457Income (loss) before income taxes and minority interests ............... 15,369 118,051 (114,467) (463,379)
Net income (loss) ................. 5,652 71,268 (82,128) (347,324)
Net income (loss) per share ($) ...................... 0.003 0.044 (0.051) (0.218)
82 Mizuho Securities Annual Report 2011
Report of Independent Auditors
83Mizuho Securities Annual Report 2011
Related Documents