―― Driving Value Creation ―― Financial Results for FY Ended March 2020 and Review of Medium-term Management Plan May 1, 2020 Mitsui & Co., Ltd. A Cautionary Note on Forward-Looking Statements: This material contains statements (including figures) regarding Mitsui & Co., Ltd. (“Mitsui”)’s corporate strategies, objectives, and views of future developments that are forward-looking in nature and are not simply reiterations of historical facts. These statements are presented to inform stakeholders of the views of Mitsui’s management but should not be relied on solely in making investment and other decisions. You should be aware that a number of known or unknown risks, uncertainties and other factors could lead to outcomes that differ materially from those presented in such forward-looking statements. These risks, uncertainties and other factors referred to above include, but are not limited to, those contained in Mitsui’s latest Annual Securities Report and Quarterly Securities Report, and Mitsui undertakes no obligation to publicly update or revise any forward-looking statements.

Welcome message from author
This document is posted to help you gain knowledge. Please leave a comment to let me know what you think about it! Share it to your friends and learn new things together.
Transcript

―― Driving Value Creation ――Financial Results for FY Ended
March 2020 and Review of Medium-term Management Plan
May 1, 2020Mitsui & Co., Ltd.
A Cautionary Note on Forward-Looking Statements: This material contains statements (including figures) regarding Mitsui & Co., Ltd. (“Mitsui”)’s corporate strategies, objectives, and views of future developments that are forward-looking in nature and are not simply reiterations of historical facts. These statements are presented to inform stakeholders of the views of Mitsui’s management but should not be relied on solely in making investment and other decisions. You should be aware that a number of known or unknown risks, uncertainties and other factors could lead to outcomes that differ materially from those presented in such forward-looking statements. These risks, uncertainties and other factors referred to above include, but are not limited to, those contained in Mitsui’s latest Annual Securities Report and Quarterly Securities Report, and Mitsui undertakes no obligation to publicly update or revise any forward-looking statements.

COPYRIGHT © MITSUI & CO., LTD. ALL RIGHTS RESERVED.
1
Contents
Financial Results for FY Ended March 2020and Review of Medium-term Management Plan
Operating Results for FY Ended March 2020
Segment Data
1
2
4
Supplementary Information3

COPYRIGHT © MITSUI & CO., LTD. ALL RIGHTS RESERVED.
2
Financial Results for FY Ended March 2020and Review of Medium-term Management Plan1

COPYRIGHT © MITSUI & CO., LTD. ALL RIGHTS RESERVED.
3
FY Mar/2019 FY Mar/2020 ChangeFY Mar/2020
Forecast(Announced Feb 2020)
Profit for the year (PAT) 414.2 391.5 -22.7 450.0Core Operating Cash Flow*1 570.5 621.9 +51.4 600.0Free Cash Flow*2 -126.8 450.9 +577.7 -ROE 10.1% 9.7% -0.4% -
Summary of Operating Results
*1. Cash flow from operating activities (FY Mar/2020: ¥526.4bn) minus cash flow from changes in working capital (FY Mar/2020: -¥95.5bn)*2. Free cash flow excludes the effects of changes in working capital and time deposits
From FY Mar/2019, cash flows of some lease transactions, which had previously been recorded as changes in working capital, are recorded asinvestment cash flow. Free cash flow excludes the effects of this treatment (cash in: ¥17.5bn, cash out: ¥35.5bn)
Planning annual dividend of ¥80 per share, including interim dividend of ¥40 (in line with previous forecast)Announced ¥50bn of share buybacks in Q4, total shareholder returns for the fiscal year were approx. ¥200bn
Core operating cash flow increased due in part to contribution from Australian iron ore operations.Maintained strength in cash generation
Profit for the year was below forecast mainly due to impairment of oil & gas development assets inQ4
The effects of COVID-19 and decline in oil price are expected to extend further into FY Mar/2021onwards
FY Mar/2020
(Unit: ¥billion)

COPYRIGHT © MITSUI & CO., LTD. ALL RIGHTS RESERVED.
Profit for the year Core Operating Cash FlowFY Mar/2020
ResultPrevious
Forecasts* Progress FY Mar/2020 Result
Previous Forecasts* Progress
Resources & Energy 243.0 285.0 85% 465.8 445.0 105%
Machinery & Infrastructure 87.5 95.0 92% 95.2 95.0 100%
Chemicals 22.3 20.0 112% 38.3 40.0 96%
Core Areas Total 352.8 400.0 88% 599.3 580.0 103%
Company Total 391.5 450.0 87% 621.9 600.0 104%
4
(Unit: ¥billion)
Key Initiatives
Core areas
*Announced February 2020
Resources & Energy: Core operating cash flow exceeded forecast due mainly to strong performance inAustralian iron ore operations, profit for the year was below forecast due to impairment of oil & gasdevelopment assets
Machinery & Infrastructure: Below forecasts due to impairments of assets in Q4 Chemicals: Achieved previous forecasts, in spite of continued low commodity prices
Build robust profit base and thoroughly strengthen existing businesses

COPYRIGHT © MITSUI & CO., LTD. ALL RIGHTS RESERVED.
*1. Cash flow from operating activities minus cash flow from changes in working capital*2. Includes ¥50bn increase in operating cash flow associated with the adoption of IFRS 16 “Leases”*3. Includes share buyback of approx. ¥60bn*4. Free cash flow excludes the effects of changes in working capital and time deposits
From FY Mar/2019, cash flows of some lease transactions, which had previously been recorded as working capital, are recorded as investment cash flow and have been excluded from the table above
Medium-term Management Plan 3-year
cumulative forecast(Announced Feb 2020)
FY18/3-19/3 total
(a)
FY20/3 result
(b)
Medium-term Management Plan 3-year
cumulative result(a) + (b)
Cash-In
Core Operating Cash Flow*1・・・① 1,840.0*2 1,240.0 620.0*2 1,860.0*2
Asset Recycling・・・② 750.0 530.0 250.0 780.0
Cash-Out
Investment and Loans・・・③ -2,000.0 -1,490.0 -420.0 -1,910.0
Of which, core areas(includes overlaps with growth areas)
- -870.0(-170.0)
-285.0(-20.0)
-1,155.0(-190.0)
Of which, growth areas(included overlaps with core areas)
- -670.0(-170.0)
-90.0(-20.0)
-760.0(-190.0)
Of which, Others - -120.0 -65.0 -185.0
Shareholder Returns(incl. additional returns)・・・④ -500.0 -310.0 -200.0*3 -510.0
Free cash flow*4 after shareholder returns・・・①+②+③+④ 90.0*2 -30.0 250.0*2 220.0*2
Firm cash generation permitted a balanced allocation between growth investment and shareholder returns Achieved a positive free cash flow after shareholder returns for the three-year cumulative period
(Unit: ¥billion)
Cash flow focused management; Strengthen financial baseKey Initiatives
Result of cash flow allocation (Medium-term Management Plan 3-year cumulative)
5

COPYRIGHT © MITSUI & CO., LTD. ALL RIGHTS RESERVED.
7.7
4.1
0.3 3.8
4.9
2.8
0.2
7.9
4.3
4.6
2.84.0
Cash flow focused management; Strengthen financial baseKey Initiatives
*1. Figures in brackets are “net interest-bearing debt”*2. In these presentation materials, “Shareholders’ equity” means
total equity attributable to owners of the parent*3. From FY Mar/2020, interest-bearing debt is calculated by excluding
lease liability from short-term debt and long-term debt. The figureat the end of the FY Mar/2019 period has been restated
*4. Net interest-bearing debt is interest-bearing debt*3 minus cash andcash equivalents, and time deposits
Interest-bearing debt*3 ¥4.6tn (down ¥7.8bn)Net interest-bearing debt*4 ¥3.5tn (down ¥105.3bn)
Shareholder equity*2 ¥3.8tn (down ¥445.5bn)・ Profit for the year:・ Foreign currency translation adjustments:・ Financial assets measured at FVTOCI:・ Dividend payments:・ Share buyback: ・ Other:
+¥391.5bn-¥301.6bn-¥349.0bn-¥139.1bn-¥57.9bn
+¥10.6bn
(3.6)(3.5)
Balance sheet
Mar/2020Mar/2019
(Unit: ¥trillion)
Current assets
Non-current assets
Other liabilities
Long- and short-term
debt*1
Shareholder equity*2
total
Non-controlling interestsTotal assets 11.9Shareholder equity 4.3Net DER 0.84x*3
Total assets 11.8Shareholder equity 3.8Net DER 0.91x*3
Non-controlling interests
Current assets
Non-current assets
Other liabilities
Long- and short-term
debt*1
Shareholder equity*2
total
Main balances/changes from March 2019
6

COPYRIGHT © MITSUI & CO., LTD. ALL RIGHTS RESERVED.
Profit for the year Core operating cash flow ROE
¥391.5bn(FY Mar/2020)
¥621.9bn(FY Mar/2020)
9.7%(FY Mar/2020)
¥440.0bn(May 2017 announcement)
¥630.0bn(May 2017 announcement)
10%(May 2017 announcement)
7
Medium-term Management Plan Review Summary of Quantitative Results Achieved core operating cash flow and ROE in line with target levels due to steady progress in cash
generation and improvements in capital efficiency Target level for profit for the year was not met due to impairment losses incurred in FY Mar/2020,
primarily in the energy segment, and the profit levels in non-resources area not meeting target for themedium-term management plan

COPYRIGHT © MITSUI & CO., LTD. ALL RIGHTS RESERVED.
47.3
-6.2
68.2 51.3
32.7
34.2
5.222.3
66.889.6
78.4 87.5
176.0
306.2 262.9 243.0
-16.7-5.3
-5 -12.6
391.5414.2
Non-resourceareas117.6
Non-resourceareas151.8
Non-resourceareas161.1
8
418.5
While profit generation in non-resource areas was steadily enhanced by means of strengthening the earningbase, realizing return from investments through proactive asset recycling and portfolio optimization, it wasbelow the level targeted in the medium-term management plan (¥200.0bn)
Non-resourceareas146.8
306.1(Unit: ¥billion)
●Resources & Energy●Machinery &
Infrastructure●Chemicals●Other business areas●Headquarters &
eliminations
FY Mar/2017(results)*
Medium-term Management Plan
FY Mar/2018(results)*
FY Mar/2019(results)
FY Mar/2020(results)
Profit for the YearQuantitative Results
*Before reflecting modifications associatedwith structural reorganization in April 20198

COPYRIGHT © MITSUI & CO., LTD. ALL RIGHTS RESERVED.
7.3 17.0 14.5-25.9
23.1 24.4 50.4 48.553.8 50.2 31.0 38.374.4
158.874.0 95.2
336.2
416.1
400.6465.8
621.9
570.5
666.5
Non-resourceareas233.4
Non-resourceareas155.4
Non-resourceareas182.0
While cash generation was enhanced, particularly in the Resources & Energy, cash generation in non-resource areas was below the level targeted in the medium-term management plan (¥230.0bn)
494.8
Non-resourceareas151.3
Core Operating Cash FlowQuantitative Results
(Unit: ¥billion)
●Resources & Energy●Machinery &
Infrastructure●Chemicals●Other business areas●Headquarters &
eliminations
FY Mar/2017(results)*
Medium-term Management Plan
FY Mar/2018(results)*
FY Mar/2019(results)
FY Mar/2020(results)
*Before reflecting modifications associatedwith structural reorganization in April 20199

COPYRIGHT © MITSUI & CO., LTD. ALL RIGHTS RESERVED.
97.5122.5
140.0 140.0
47.5
50.0
494.8
666.5
58.0
Mar/2017¥55
Mar/2018 Mar/2019
● Core operating CF
Annual dividend per share
Minimum total dividend amount
¥100bn/year
(Unit: ¥billion)
■ Share buyback■ Dividend
172.5
Total shareholder returns as a percentage of core operating cash flow*
(Total shareholder returns as a percentage of profit for the year**)
29%(47%)
*Amount of shareholder returns ÷ core operating cash flow** Amount of shareholder returns ÷ profit for the year
145.0
¥70
26%(41%)
Mar/2020¥80
24%(34%)
140.0
570.5
¥80 (forecast)
31%(forecast)(50%)(forecast)
198.0
Forecast annual dividend of ¥80 per share (unchanged from previous forecast) Shareholder returns for the medium-term management plan period of approximately ¥510 billion with
total shareholder returns as a percentage of core operating cash flow at approximately 27%
621.9
Shareholder Returns
10

COPYRIGHT © MITSUI & CO., LTD. ALL RIGHTS RESERVED.
11
Operating Results for FY Ended March 20202

COPYRIGHT © MITSUI & CO., LTD. ALL RIGHTS RESERVED.
-0.5 -12.622.0 14.6
36.3 32.0
9.94.7
5.222.3
78.4 87.5
95.7 59.7
167.2183.3
Main factors(YoY change)
■Mineral & Metal Resources ¥183.3bn (+¥16.1bn)• Increase in sales price and volume at Australian iron ore operations• Decrease in profits of Australian coal mining operations due to decline
in sales prices and increased costs• Impairment loss for Mozambique coal and infrastructure projects■Energy ¥59.7bn (-¥36.0bn)• Decline in oil and gas prices and impairment of oil and gas
development assets■Machinery & Infrastructure ¥87.5bn (+¥9.1bn)• Sale of interest in C2C, contribution from gas distribution and
automotive businesses• Impairment loss for overseas rail project and offshore support vessel
business■Chemicals ¥22.3bn (+¥17.1bn)• Absence of loss at U.S. terminal business company• Profits decreased at businesses due to economic slowdown and weak
trading performance■Iron & Steel Products ¥4.7bn (-¥5.2bn)• Profits decreased at businesses due to economic slowdown and weak
trading performance• Absence of gain on sale of land by affiliated company included in FY
Mar/2019■Lifestyle ¥32.0bn (-¥4.3bn)• Decrease in corporate income taxes due to partial sale of investment
in Recruit Holdings• Sale of interest in Columbia Asia• Impairment loss on fixed assets at XINGU• Absence of profit on reversal of provisions associated with withdrawal
from Multigrain business included in FY Mar/2019• Absence of gain on deemed sale of IHH included in FY Mar/2019■Innovation & Corporate Development ¥14.6bn (-¥7.4bn)• FVTPL valuation loss■Others -¥12.6bn (-¥12.1bn)• Expenses, interest, taxes, etc. not allocated to business segments
YoY segment comparisonProfit for the Year (PAT)
12
Mar/2020
Profit: ¥391.5bn, down ¥22.7bn
414.2 391.5(Unit: ¥billion)
Mar/2019

COPYRIGHT © MITSUI & CO., LTD. ALL RIGHTS RESERVED.
14.5-25.9
19.8 8.624.7
37.3
5.9 2.631.0 38.3
74.0 95.2
219.1 221.0
181.5
244.8
YoY segment comparisonCore Operating Cash Flow
13
570.5
Core operating cash flow: ¥621.9bn, up ¥51.4bn
621.9Main factors
(YoY change)■Mineral & Metal Resources ¥244.8bn (+¥63.3bn)• Increase in sales prices at Australian iron ore operations• Decrease in profits of Australian coal mining operations due to
decline in sales prices and increased costs• Absence of dividend/interest on equity from Vale received
■Energy ¥221.0bn (+¥1.9bn)
■Machinery & Infrastructure ¥95.2bn (+¥21.2bn)• Receipt of project development fees and change in lease
accounting standards
■Chemicals ¥38.3bn (+¥7.3bn)• Absence of loss at U.S. terminal business company• Profits decreased at businesses due to economic slowdown
and weak trading performance
■Iron & Steel Products ¥2.6bn (-¥3.3bn)• Profits decreased at businesses due to economic slowdown
and weak trading performance
■Lifestyle ¥37.3bn (+¥12.6bn)• Change in lease accounting standards
■Innovation & Corporate Development ¥8.6bn (-¥11.2bn)• FVTPL valuation loss
■Others -¥25.9bn (-¥40.4bn)• Corporate pension contributions
20/319/3
(Unit: ¥billion)

COPYRIGHT © MITSUI & CO., LTD. ALL RIGHTS RESERVED.
14
(Unit: ¥billion)
Mar/2019 Mar/2020
Asset recycling
Commodity prices/Forex
Resource-relatedcosts/volume
Base profit
Valuation gain/lossspecial factors
414.2391.5-31.0 approx.
-2.0+46.0
+16.0-52.0
YoY factor comparisonProfit for the Year
<Positive factors>・METS・Gas distribution business・IHH
・Automotive business in Canada・Innovation & Corporate Development
<Negative factors>・FVTPLAbsence of factors fromprevious yearCurrent period
・Chemicals・Food/Retail・Iron & Steel products・Adjustments in corporate
・FPSO
・CostsMin. & MetalIron oreCoalCopper, other
Energy
・VolumeMin. & MetalIron oreCoalCopper, other
Energy
-10.0-7.0-3.0-4.00.0
-3.0
+8.0+10.0+8.0+2.0
0.0-2.0
・Min. & MetalIron oreCoalCopper, other
・Oil, gas
Forex(Yen vs.Functional currency -19.0)(Functional currency vs.Revenue currencies +25.0)
+31.0+53.0-19.0-3.0
-21.0
+6.0
・Absence of factors fromprevious year
・Total current periodSale of interest inColumbia AsiaPartial sale ofInvestment inRecruit HoldingsSogo MedicalC2C/real estate in Singapore
Resource-relatedcosts/volume
Commodityprices/ForexBase profit Valuation gain/loss
special factorsAsset recycling
・Absence of factors fromprevious year
・Total current periodMozambique coal/infrastructureEagle FordGEDTempa RossaXinguAccountableOverseas rail projectKaikiasMEPMOZ
+23.0-75.0
-22.1-18.0-13.8-12.5-9.3-6.4-3.7-3.2
+13.2Etc.
-20.0+66.0
+13.0
+12.5+8.7
Etc.
+6.4+4.8+3.0
-15.0
-8.0-7.0
-15.0-7.0-6.0-6.0
-5.4Forex breakdown
・Min. & Metal Resources :・Energy :・Other :
Yen vs. Functional Currency
Functional Currency vs. Revenue Currencies
+5.0+4.0-3.0
-19.0 +24.0+3.0 +1.0-3.0 0.0
COPYRIGHT © MITSUI & CO., LTD. ALL RIGHTS RESERVED.
15
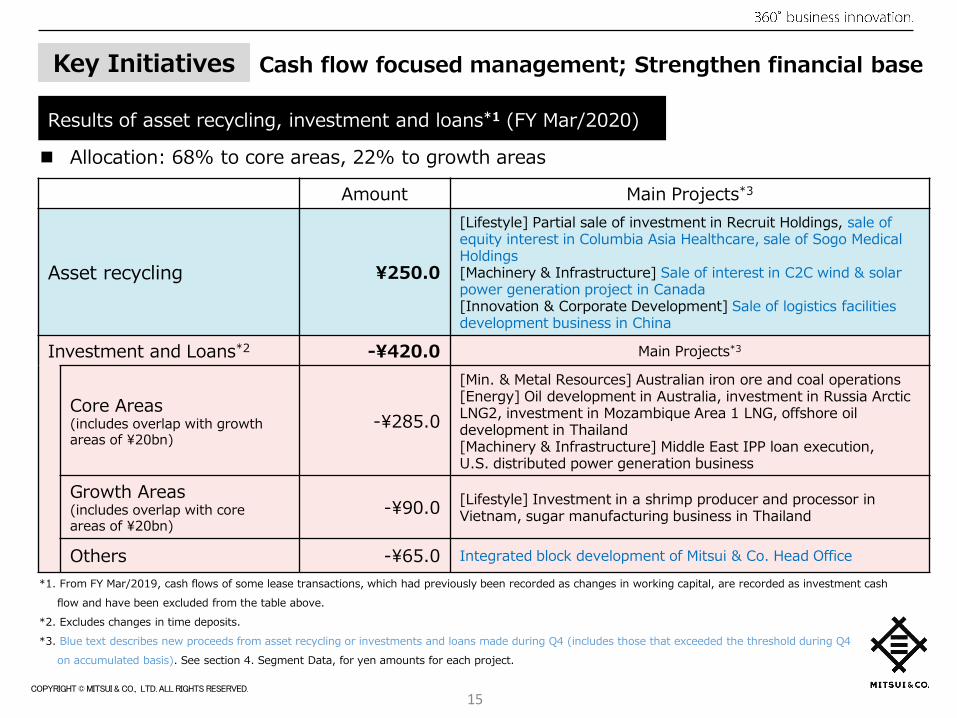
Allocation: 68% to core areas, 22% to growth areas
Results of asset recycling, investment and loans*1 (FY Mar/2020)
*1. From FY Mar/2019, cash flows of some lease transactions, which had previously been recorded as changes in working capital, are recorded as investment cashflow and have been excluded from the table above.
*2. Excludes changes in time deposits.*3. Blue text describes new proceeds from asset recycling or investments and loans made during Q4 (includes those that exceeded the threshold during Q4
on accumulated basis). See section 4. Segment Data, for yen amounts for each project.
Amount Main Projects*3
Asset recycling ¥250.0
[Lifestyle] Partial sale of investment in Recruit Holdings, sale of equity interest in Columbia Asia Healthcare, sale of Sogo Medical Holdings [Machinery & Infrastructure] Sale of interest in C2C wind & solar power generation project in Canada[Innovation & Corporate Development] Sale of logistics facilities development business in China
Investment and Loans*2 -¥420.0 Main Projects*3
Core Areas(includes overlap with growth areas of ¥20bn)
-¥285.0
[Min. & Metal Resources] Australian iron ore and coal operations [Energy] Oil development in Australia, investment in Russia Arctic LNG2, investment in Mozambique Area 1 LNG, offshore oil development in Thailand[Machinery & Infrastructure] Middle East IPP loan execution, U.S. distributed power generation business
Growth Areas(includes overlap with core areas of ¥20bn)
-¥90.0 [Lifestyle] Investment in a shrimp producer and processor in Vietnam, sugar manufacturing business in Thailand
Others -¥65.0 Integrated block development of Mitsui & Co. Head Office
Cash flow focused management; Strengthen financial baseKey Initiatives
COPYRIGHT © MITSUI & CO., LTD. ALL RIGHTS RESERVED.
Supplementary Information3
16

COPYRIGHT © MITSUI & CO., LTD. ALL RIGHTS RESERVED.
FY Mar/2019 FY Mar/2020
Q1 Q2 Q3 Q4 Total Q1 Q2 Q3 Q4 Total
Iron ore (Mt) 14.8 15.3 15.8 13.8 59.7 14.1 14.4 15.1 14.2 57.8
Australian iron ore 10.3 10.0 10.0 8.2 38.5 10.0 10.8 10.3 9.8 40.9
Vale*1 4.5 5.3 5.8 5.6 21.2 4.1 3.6 4.8 4.4 16.9
Coal*2(Mt) 3.1 3.5 3.7 3.5 13.8 3.3 3.4 3.6 3.3 13.6
MCH 2.1 2.1 2.1 2.0 8.3 2.1 2.1 2.1 2.0 8.3
BMC*1 0.5 0.6 0.5 0.5 2.1 0.5 0.6 0.5 0.4 2.0
Australian coking coal 2.0 2.0 2.0 1.9 7.9 2.4 2.3 2.3 2.1 9.1Australian thermal coal 0.6 0.7 0.6 0.6 2.5 0.2 0.4 0.3 0.3 1.2
Moatize*1 0.3 0.4 0.5 0.4 1.6 0.3 0.3 0.3 0.3 1.2
Copper*1, 2(Kt) 36.5 35.8 38.3 42.4 153.0 36.3 38.0 40.0*3 39.3 153.6
Mineral & Metal Resources: Production & main businessesProduction
*1. Vale, BMC, Moatize and copper are results for: Q1 Jan-Mar; Q2 Apr-June; Q3 Jul-Sep; Q4 Oct-Dec *2. Includes Vale production (5% for FY Mar/2018 Q1 and earlier, 5.5% for Q2 and after, 5.6% for FY Mar/2019 Q4 and after)*3. Revised in May 2020 (Q3:39.6→40.0)
Product Name*1 Location FY Mar/2020equity production Main partner Equity ratio*4 Revenue
recognition
Iron ore Robe River Australia 21.5 million tons Rio Tinto 33.00% Consolidated (partially accounted for by dividend)
Iron ore Mt. Newman / Yandi / Goldsworthy / Jimblebar Australia 19.4 million tons BHP 7.00% Consolidated (partially accounted for by dividend)
Iron ore Vale Brazil 16.9 million tons*2 Vale 5.59% Dividend
Coal South Walker Creek / Poitrel Australia 2.0 million tons*2 BHP 20.00% Equity method
Coal Kestrel Australia 1.4 million tons*2 EMR / Adaro 20.00% Consolidated
Coal Moranbah North / Grosvenor*5 / Capcoal / Dawson Australia 6.9 million tons Anglo American Various Consolidated
Coal Moatize / Nacala Mozambique 1.2 million tons*2 Vale Moatize: approx. 15%Nacala: approx. 50%
Moatize: DividendNacala: Equity Method
Copper Collahuasi Chile 62.4 thousand tons*2 Anglo AmericanGlencore 11.03% Equity method
Copper Anglo American Sur Chile 37.0 thousand tons*2 Anglo AmericanCodelco 9.50% Equity method
Copper Caserones Chile 33.0 thousand tons*2 JX Nippon Mining & MetalsMitsui Mining & Smelting 22.63% Other
Nickel Coral Bay Philippines 3.5 thousand tons*3 Sumitomo Metal Mining 18.00% Equity method
Nickel Taganito Philippines 4.7 thousand tons*3 Sumitomo Metal Mining 15.00% Dividend
*1 Includes JV names, company names, and project names *2 Jan-Dec 2019 results *3 Production capacity base *4 As of end of March 2020 *5 Not included in production volume as due to be acquired in FY Mar/2021
Main businesses
17

COPYRIGHT © MITSUI & CO., LTD. ALL RIGHTS RESERVED.
71.2 67.3 78 93 100 84
172.6 185.0 181 173 180
137ガス原油
243.8 252.3 259 266 280
(announced May 2020)
3.0 2.9 2.8
7.46.6 6.0
ガス原油
10.49.5
(announced Oct 2019)
221 8.8
Production*1*2 Reserves*1*3(KBoE/day) (100m barrels)
Gas
Crude Oil
GasCrude Oil
Mar/2018Result
Mar/2019Result
Mar/2020(Est. Result)
Mar/2021(Est.)
Mar/2022(Est.)
Mar/2017Result
Mar/2018Result
Mar/2019Result
*1. Oil equivalentMitsui’s equity share of interests of consolidated subsidiaries, affiliates, and non-consolidated interests
*2. Mitsui’s share of sales is applied to certain projects
*3. According to Mitsui’s assessment standards
Mar/2023(Est.)
18
Energy: Crude oil & gas – Equity share of production & reserves

COPYRIGHT © MITSUI & CO., LTD. ALL RIGHTS RESERVED.
Product Project name Shareholder composition/Interest holders*= operator, Blue text= Mitsui participating entity
LNG: Production capacityE&P: Production (FY Mar/2019 Result)*FY Mar 2020 result updatescheduled in Q1
Accounting Period
Revenue recognition
LNG Abu Dhabi *ADNOC (70%), Mitsui (15%), BP (10%), Total (5%) LNG:5.60 million tons/year NA Dividend income
LNG Qatargas1 *QP (65%), Total (10%), EM (10%), MILNED (7.5%), Marubeni (7.5%) LNG:9.60 million tons/year Mar. Dividend income
LNG Qatargas3 *QP (68.5%), Conoco Phillips (30%), Mitsui (1.5%) LNG:7.80 million tons/year Mar. Dividend income
LNG Oman *MOG(51%), Shell(30%), Mitsui (2.77%), others LNG:7.10 million tons/year NA Dividend income
LNG Equatorial Guinea *Marathon (60%), Sonagas (25%), Mitsui (8.5%), Marubeni (6.5%) LNG:3.70 million tons/year NA Dividend income
LNG SakhalinⅡ *Gazprom (50%+1 share), Shell (27.5%-1 share), Mitsui (12.5%), Mitsubishi Corp (10%) LNG:9.60 million tons/year Dec. Dividend income
LNG North West Shelf(NWS) *Woodside, MIMI [Mitsui/Mitsubishi Corp=50:50], Shell, BP, BHP, Chevron (16.7% each)
LNG:16.90 million tons/yearLPG:0.46 million tons/yearCrude oil/condensate:97thousand BD
Dec. Equity method profit
LNG Tangguh*BP(40.2%), KI Berau[Mitsubishi Corp/INPEX=56:44](16.3%), KG Berau[JOGMEC/Mitsui/Mitsubishi Corp/INPEX/JX=49.2:20.1:16.5:14.2](8.6%), KGWiriagar[Mitsui](1.4%), others
LNG:7.60 million tons/yearCrude oil/condensate: 6thousand B/D
Dec.Equity method profit/Gross profit
LNG Cameron *Sempra (50.2%), Mitsui, Total, [Mitsubishi Corp/NYK] (16.6% each) LNG:12.00 million tons/year Dec. Equity method profit
E&P MOECO/Thai offshore *Chevron, *PTTEP, MOECO (17.2%) Gas/crude oil/condensate:452 thousand B/D Mar.
Gross profit/Equity method profit/Dividend income
E&P MOEX North America/Kaikias *Shell (80%), MOEX NA (20%) NA Dec. Gross profit
E&P MEPME/Block9 *Occidental (50%), OOCEP (45%), MEPME (5%) NA Dec. Gross profit
E&P MEPME/Block27 *Occidental (65%), MEPME (35%) NA Dec. Gross profit
E&P MEPME/Block3&4 *CCED (50%), Tethys (30%), MEPME (20%) NA Dec. Gross profit
E&P MEPUK/Alba *Chevron (23.4%), MEPUK (13.3%), others Crude oil: 12 thousand B/D Dec. Gross profit
E&P MEPAU/Greater Enfield *Woodside (60%), MEPAU (40%) NA Dec. Gross profit
E&P MEPAU/Kipper *EM (32.5%), BHP (32.5%), MEPAU (35%) NA Dec. Gross profit
E&P MEPAU&AWE/Casino, Henry, Netherby *Cooper (50%), AWE (25%), MEPAU (25%) Gas/condensate: 9 thousand
B/D Dec. Gross profit
E&P MEPAU/Meridian *WestSide (51%), MEPAU (49%) Gas: 6 thousand B/D Dec. Gross profit
E&P MEPTX/Eagle Ford *Sanchez (25%), Blackstone (25%), KNOC (25%), Venado (12.5%), MEPTX (12.5%) Gas/condensate/NGL: 130 thousand B/D Dec. Gross profit
E&P MEPUSA/Marcellus *Chesapeake (32.5%), ALTA (32.5%), Equinor (15.5%), MEPUSA (12%), others Gas: 343 thousand B/D Dec. Gross profit
19
Energy: Main businesses (producing assets only)

COPYRIGHT © MITSUI & CO., LTD. ALL RIGHTS RESERVED.
Gas68%
Coal18%
Renewable Energy14%
Net generation capacity (Mitsui’s share): 11.1GW(Gross generation capacity: 40GW)
40%
32%
28%Americas
Asia, AustraliaBy
Region
Europe, Middle East Africa
Merchant/Contracted
Contracted96%
Merchant4%
As of end of March 2020
By Energy Source
20
Machinery & Infrastructure: Power generation portfolio

COPYRIGHT © MITSUI & CO., LTD. ALL RIGHTS RESERVED.
Segment Data4
21

COPYRIGHT © MITSUI & CO., LTD. ALL RIGHTS RESERVED.
-53.7 -56.5
56.36.7
181.5244.8
22
Main investments and recyclingFY Mar/2020: (OUT)Australian iron ore business -34.0
Australian coal business -18.4
FY Mar/2019Full year
FY Mar/2020 Full year
ChangeFY Mar/2020
Full year forecast
Contributing factors
Profit for the year 167.2 183.3 +16.1 170.0
Gross profit 175.6 226.0 +50.4 ↑Australian iron ore (increase in sales price)↓Australian coal mining (decrease in sales price)
Profit (Loss) from equity investments 59.3 59.2 -0.1 ↑Australian iron ore (increase in sales price)
↓Impairment loss for Mozambique coal and infrastructure projects
Dividend income 20.9 25.2 +4.3 ↑Australian iron ore (increase in dividend)
Selling, general and administrative expenses -32.3 -41.6 -9.3 ↓Impairment loss for Mozambique coal and infrastructure projects
Others -56.3 -85.5 -29.2 ↓Australian iron ore (increase in corporate tax burden)
Core operating cash flow 181.5 244.8 +63.3 220.0
Total assets 2,222.9 1,921.9 -301.0
Company name FY Mar/2019
FY Mar/2020 Change
Consolidated
Iron ore mining operations in Australia*1 106.7 171.5 +64.8
Coal mining operations in Australia*1 48.5 27.4 -21.1
Equity-method
Coal and rail & port infrastructure business in Mozambique 4.1 -20.6 -24.7
Oriente Copper Netherlands -2.7 -5.7 -3.0
Mitsui Bussan Copper Investment -2.3 -0.9 +1.4
Japan Collahuasi Resources 9.1 8.9 -0.2
Inner Mongolia Erdos Electric Power & Metallurgical 5.1 5.9 +0.8
Exceeded PAT and COCF forecast mainly due to increase in sales price of iron ore
*1. A portion of profit/loss was accounted for by the equity method
Mineral & Metal Resources
Cash flow
Results
Results of main affiliated companies (Mitsui share)■Core operating CF■Investment CF(IN)■Investment CF(OUT)
FY Mar/2019 FY Mar/2020
(Unit: billion yen)
COPYRIGHT © MITSUI & CO., LTD. ALL RIGHTS RESERVED.
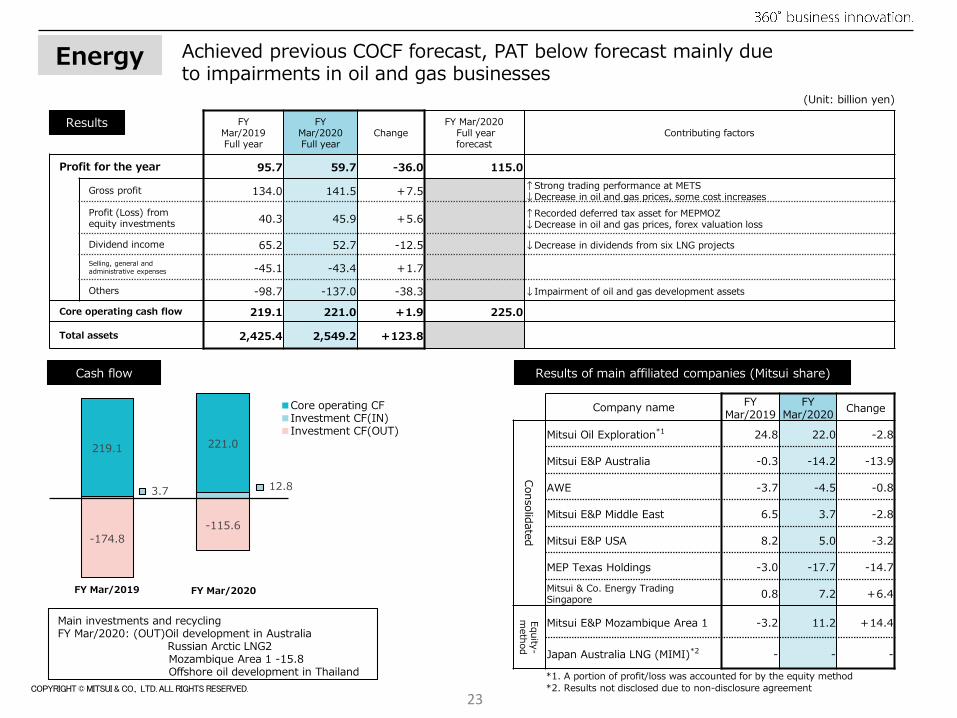
FY Mar/2019Full year
FY Mar/2020 Full year
ChangeFY Mar/2020
Full year forecast
Contributing factors
Profit for the year 95.7 59.7 -36.0 115.0
Gross profit 134.0 141.5 +7.5 ↑Strong trading performance at METS↓Decrease in oil and gas prices, some cost increases
Profit (Loss) from equity investments 40.3 45.9 +5.6 ↑Recorded deferred tax asset for MEPMOZ
↓Decrease in oil and gas prices, forex valuation loss
Dividend income 65.2 52.7 -12.5 ↓Decrease in dividends from six LNG projects
Selling, general and administrative expenses -45.1 -43.4 +1.7
Others -98.7 -137.0 -38.3 ↓Impairment of oil and gas development assets
Core operating cash flow 219.1 221.0 +1.9 225.0
Total assets 2,425.4 2,549.2 +123.8
-174.8-115.6
3.7 12.8
219.1 221.0
23
Main investments and recyclingFY Mar/2020: (OUT)Oil development in Australia
Russian Arctic LNG2Mozambique Area 1 -15.8Offshore oil development in Thailand
Company name FY Mar/2019
FY Mar/2020 Change
ConsolidatedMitsui Oil Exploration*1 24.8 22.0 -2.8
Mitsui E&P Australia -0.3 -14.2 -13.9
AWE -3.7 -4.5 -0.8
Mitsui E&P Middle East 6.5 3.7 -2.8
Mitsui E&P USA 8.2 5.0 -3.2
MEP Texas Holdings -3.0 -17.7 -14.7
Mitsui & Co. Energy Trading Singapore 0.8 7.2 +6.4
Equity-m
ethod
Mitsui E&P Mozambique Area 1 -3.2 11.2 +14.4
Japan Australia LNG (MIMI)*2 - - -
Achieved previous COCF forecast, PAT below forecast mainly due to impairments in oil and gas businesses
*1. A portion of profit/loss was accounted for by the equity method*2. Results not disclosed due to non-disclosure agreement
Cash flow
Results
Results of main affiliated companies (Mitsui share)
■Core operating CF■Investment CF(IN)■Investment CF(OUT)
(Unit: billion yen)
Energy
FY Mar/2019 FY Mar/2020

COPYRIGHT © MITSUI & CO., LTD. ALL RIGHTS RESERVED.
FY Mar/2019Full year
FY Mar/2020 Full year
ChangeFY Mar/2020
Full year forecast
Contributing factors
Profit for the year 78.4 87.5 +9.1 95.0
Gross profit 130.7 1,34.2 +3.5 ↑Increase in motorcycle and car financing business at Bussan Auto Finance
Profit (Loss) from equity investments 87.5 87.7 +0.2 ↑Absence of losses at overseas rail project included in FY Mar/2019
↓Profit decline at FPSO/FSO leasing businesses
Dividend income 5.8 5.1 -0.7Selling, general and administrative expenses -123.4 -134.4 -11.0 ↓Increase in depreciation expenses at Bussan Auto Finance in Indonesia
Others -22.2 -5.1 +17.1 ↑Profit on sale of power generation business in North America
Core operating cash flow 74.0 95.2 +21.2 95.0 ↑Project development fees
Total assets 2,450.6 2,377.1 -73.5
-238.1
-122.4
81.1 73.4
74.0 95.2
24
Main investments and recyclingFY Mar/2020:(IN) Sale of interest in C2C wind & solar
power generation project in Canada +16.8(OUT)Middle East IPP loan execution -17.8
U.S. distributed power business -17.7
Company name FY Mar/2019
FY Mar/2020 Change
ConsolidatedMitsui & Co. Plant Systems 2.6 3.6 +1.0
Rolling stock leasing businesses*1 3.3 2.8 -0.5Construction & industrial machinery businesses*1 7.1 6.0 -1.1
Equity-method
IPP businesses 26.7 27.6 +0.9
FPSO/FSO leasing businesses 9.3 3.9 -5.4
Gas distribution companies 6.5 11.3 +4.8
Penske Automotive Group 8.2 7.7 -0.5
Truck leasing and rental businesses 7.1 9.0 +1.9
Asian motor vehicle businesses 7.2 7.2 0.0
VLI 2.7 -1.0 -3.7
Achieved COCF forecast, PAT below forecast due to impairment losses at overseas rail project and offshore support vessels
*1. A portion of profit/loss was accounted for by the equity method
Cash flow
Results
Results of main affiliated companies (Mitsui share)
■Core operating CF■Investment CF(IN)■Investment CF(OUT)
(Unit: billion yen)
Machinery & Infrastructure
FY Mar/2019 FY Mar/2020

COPYRIGHT © MITSUI & CO., LTD. ALL RIGHTS RESERVED.
FY Mar/2019Full year
FY Mar/2020 Full year
ChangeFY Mar/2020
Full year forecast
Contributing factors
Profit for the year 5.2 22.3 +17.1 20.0
Gross profit 148.0 116.8 -31.2 ↓Decrease in methanol and methionine prices↓Impact of incident at U.S. terminal business
Profit (Loss) from equity investments 14.3 11.5 -2.8
Dividend income 2.8 2.7 -0.1Selling, general and administrative expenses -105.0 -101.9 +3.1
Others -54.9 -6.8 +48.1↑Recorded insurance proceeds at a business in North America↑Absence of loss at U.S. terminal business included in FY Mar/2019↑Absence of loss associated with revision of Novus expansion project included
in FY Mar/2019Core operating cash flow 31.0 38.3 +7.3 40.0
Total assets 1,337.7 1,217.7 -120.0
-83.9
-29.2
3.5 12.8
31.0
38.3
25
Main investments and recyclingFY Mar/2020: -
Company name FY Mar/2019
FY Mar/2020 Change
ConsolidatedMMTX 7.2 1.6 -5.6
MITSUI & CO. PLASTICS 3.8 3.4 -0.4
Novus International -9.3 -2.2 +7.1
Mitsui AgriScience(EU/Americas) 1.3 2.4 +1.1
Equity-m
ethod Japan-Arabia Methanol Co. 2.8 1.3 -1.5
PAT and COCF in line with forecasts
Cash flow
Results
Results of main affiliated companies (Mitsui share)■Core operating CF■Investment CF(IN)■Investment CF(OUT)
(Unit: billion yen)
Chemicals
FY Mar/2019 FY Mar/2020

COPYRIGHT © MITSUI & CO., LTD. ALL RIGHTS RESERVED.
-9.7 -1.3
71.7
8.8
5.9
2.6
FY Mar/2019Full year
FY Mar/2020 Full year
ChangeFY Mar/2020
Full year forecast
Contributing factors
Profit for the year 9.9 4.7 -5.2 5.0
Gross profit 27.2 24.6 -2.6
Profit (Loss) from equity investments 16.2 13.1 -3.1
Dividend income 1.7 1.9 +0.2Selling, general and administrative expenses -27.8 -27.2 +0.6
Others -7.4 -7.7 -0.3 ↓Absence of sale of land by affiliated company included in FY Mar/2019
Core operating cash flow 5.9 2.6 -3.3 5.0
Total assets 606.6 539.6 -67.0
Main investments and recyclingFY Mar/2020: -
PAT and COCF mostly in line with forecasts
Company name FY Mar/2019
FY Mar/2020 Change
Consolidated Mitsui & Co. Steel 4.1 3.8 -0.3
Equity-method
NIPPON STEEL TRADING*1 6.9 - -
Game Changer Holdings 3.9 1.4 -2.5
Gestamp companies 2.3 2.4 +0.1
26
*1. Business results undisclosed as the earnings of listed companiesnot yet announced
Cash flow
Results
Results of main affiliated companies (Mitsui share)■Core operating CF■Investment CF(IN)■Investment CF(OUT)
(Unit: billion yen)
Iron & Steel Products
FY Mar/2019 FY Mar/2020

COPYRIGHT © MITSUI & CO., LTD. ALL RIGHTS RESERVED.
-286.6
-57.632.5
105.324.7
37.3
27
Main investments and recyclingFY Mar/2020:(IN)Partial sale of investment in Recruit Holdings +44.8
Sale of interest in Columbia Asia +23.8Sale of interest in Sogo Medical +19.5
(OUT)Investment in a Vietnamese shrimp producer and processor -16.9Sugar manufacturing business in Thailand -13.0
FY Mar/2019Full year
FY Mar/2020 Full year
ChangeFY Mar/2020
Full year forecast
Contributing factors
Profit for the year 36.3 32.0 -4.3 30.0
Gross profit 141.8 134.9 -6.9 ↓FVTPL valuation loss
Profit (Loss) from equity investments 26.4 35.0 +8.6 ↑Sale of interest in Columbia Asia
↑Increase in earnings from additional investment in IHH
Dividend income 5.1 4.2 -0.9Selling, general and administrative expenses -136.7 -139.3 -2.6
Others -0.3 -2.8 -2.5
↑Decrease in corporate income taxes due to partial sale of investment in Recruit Holdings
↑Sale of interest in Sogo Medical↓Absence of profit from reversal of provisions associated with withdrawal from
Multigrain included in FY Mar/2019↓Absence of gain on deemed sale of IHH included in FY Mar/2019↓Impairment loss on fixed assets at XINGU
Core operating cash flow 24.7 37.3 +12.6 30.0
Total assets 2,006.1 1,907.6 -98.5
Company name FY Mar/2019
FY Mar/2020 Change
Consolidated
Domestic food & retail management businesses 5.3 4.4 -0.9
Equity-method
Mitsui Sugar*1 2.1 - -
WILSEY FOODS 3.3 3.9 +0.6
IHH Healthcare 1.9 4.9 +3.0
PHC Holdings*1 - - -
AIM SERVICES 2.4 2.4 0.0*1. Business results undisclosed as the earnings of listed companies not yet
announced, or results not disclosed due to non-disclosure agreement
Cash flow
Results
Results of main affiliated companies (Mitsui share)■Core operating CF■Investment CF(IN)■Investment CF(OUT)
(Unit: billion yen)Lifestyle
FY Mar/2019 FY Mar/2020
PAT and COCF in line with forecasts

COPYRIGHT © MITSUI & CO., LTD. ALL RIGHTS RESERVED.
-96.5
-49.7
28.249.8
19.8
8.6
28
Main investments and recyclingFY Mar/2020: (IN)Sale of interest in logistics facilities
development business in China +18.3
FY Mar/2019Full year
FY Mar/2020 Full year
ChangeFY Mar/2020
Full year forecast
Contributing factors
Profit for the year 22.0 14.6 -7.4 25.0
Gross profit 78.6 60.1 -18.5 ↓FVTPL valuation loss
Profit (Loss) from equity investments 13.1 17.0 +3.9
Dividend income 3.1 3.3 +0.2Selling, general and administrative expenses -64.5 -64.5 0.0
Others -8.3 -1.3 +7.0↑Sale of interest in real estate business in Singapore↑Valuation gain related to put option of an investment↓Absence of gain on sale of warehouse in Japan included in FY Mar/ 2019
Core operating cash flow 19.8 8.6 -11.2 20.0
Total assets 971.8 1,198.3 +226.5
Company name FY Mar/2019
FY Mar/2020 Change
Consolidated
MITSUI KNOWLEDGE INDUSTRY 3.5 4.2 +0.7
Mitsui & Co. Global Logistics, Ltd. 2.3 2.9 +0.6
Mitsui Bussan Commodities 2.9 2.0 -0.9
Mitsui & Co. Asset Management Holdings 1.9 1.9 0.0
Mitsui & Co. Real Estate 2.6 1.5 -1.1
Equity-m
ethod
QVC Japan*1 5.3 5.4 +0.1
JA Mitsui Leasing 3.8 3.9 +0.1
SABRE INVESTMENTS*1 - - -
PAT and COCF both below forecasts due to FVTPL valuation loss
*1. Business results undisclosed as the earnings of listed companies not yetannounced, or results not disclosed due to non-disclosure agreement
Cash flow
Results
Results of main affiliated companies (Mitsui share)■Core operating CF■Investment CF(IN)■Investment CF(OUT)
(Unit: billion yen)
Innovation & Corporate Development
FY Mar/2019 FY Mar/2020

Related Documents