Wabtec 4 th Quarter 2020 Financial Results & Company Highlights February 18, 2021

Welcome message from author
This document is posted to help you gain knowledge. Please leave a comment to let me know what you think about it! Share it to your friends and learn new things together.
Transcript

Wabtec 4th Quarter 2020Financial Results & Company Highlights
February 18, 2021

2
Forward looking statements & non-GAAP financial information
This communication contains “forward-looking” statements as that term is defined in Section 27A of the Securities Act of 1933, as amended, and Section 21E of the Securities Exchange Act of 1934, as amended by the Private Securities Litigation Reform Act of 1995, including statements regarding the acquisition by Wabtec of GE Transportation (the “GE Transportation merger”), statements regarding Wabtec’s expectations about future sales and earnings and statements about the impact of evolving global conditions on Wabtec’s business. All statements, other than historical facts, including statements synergies from the GE Transportation merger; statements regarding Wabtec’s plans, objectives, expectations and intentions; and statements regarding macro-economic conditions and evolving production and demand conditions; and any assumptions underlying any of the foregoing, are forward-looking statements. Forward-looking statements concern future circumstances and results and other statements that are not historical facts and are sometimes identified by the words “may,” “will,” “should,” “potential,” “intend,” “expect,” “endeavor,” “seek,” “anticipate,” “estimate,” “overestimate,” “underestimate,” “believe,” “could,” “project,” “predict,” “continue,” “target” or other similar words or expressions. Forward-looking statements are based upon current plans, estimates and expectations that are subject to risks, uncertainties and assumptions. Should one or more of these risks or uncertainties materialize, or should underlying assumptions prove incorrect, actual results may vary materially from those indicated or anticipated by such forward-looking statements. The inclusion of such statements should not be regarded as a representation that such plans, estimates or expectations will be achieved. Important factors that could cause actual results to differ materially from such plans, estimates or expectations include, among others, (1) unexpected costs, charges or expenses resulting from the GE Transportation merger; (2) uncertainty of Wabtec’s expected financial performance; (3) failure to realize the anticipated benefits of the GE Transportation merger, including as a result of integrating GE Transportation into Wabtec; (4) Wabtec’s ability to implement its business strategy; (5) difficulties and delays in achieving revenue and cost synergies; (6) inability to retain and hire key personnel; (7) evolving legal, regulatory and tax regimes; (8) changes in general economic and/or industry specific conditions, including the impacts of tax and tariff programs, industry consolidation and changes in the financial condition or operating strategies of our customers; (9) changes in the expected timing of projects; (10) a decrease in freight or passenger rail traffic; (11) an increase in manufacturing costs; (12) actions by third parties, including government agencies; (13) the severity and duration of the evolving COVID-19 pandemic and the resulting impact on the global economy and, in particular, our customers, suppliers and end-markets; and (14) other risk factors as detailed from time to time in Wabtec’s reports filed with the SEC, including Wabtec’s annual report on Form 10-K, periodic quarterly reports on Form 10-Q, periodic current reports on Form 8-K and other documents filed with the SEC. The foregoing list of important factors is not exclusive. Any forward-looking statements speak only as of the date of this communication. Wabtec does not undertake any obligation to update any forward-looking statements, whether as a result of new information or development, future events or otherwise, except as required by law. Readers are cautioned not to place undue reliance on any of these forward-looking statements.
This presentation as well as Wabtec’s earnings release and 2021 financial guidance mention certain non-GAAP financial performance measures, including adjusted gross profit, adjusted operating expenses, adjusted income from operations, adjusted interest and other expense, adjusted operating margin, adjusted income tax expense, adjusted effective tax rate, adjusted earnings per diluted share, EBITDA and adjusted EBITDA, net debt and cash conversion rate. Wabtec defines EBITDA earnings before interest, taxes, depreciation and amortization. While Wabtec believes these are useful supplemental measures for investors, they are not presented in accordance with GAAP. Investors should not consider non-GAAP measures in isolation or as a substitute for net income, cash flows from operations, or any other items calculated in accordance with GAAP. In addition, the non-GAAP financial measures included in this presentation have inherent material limitations as performance measures because they add back certain expenses incurred by the company to GAAP financial measures, resulting in those expenses not being taken into account in the applicable non-GAAP financial measure. Because not all companies use identical calculations, Wabtec’s presentation of non-GAAP financial measures may not be comparable to other similarly titled measures of other companies. Included in this presentation are reconciliation tables that provide details about how adjusted results relate to GAAP results.

3
4Q and full-year 2020 highlights
$7.6B
SALES
15.1%
OPERATING MARGIN
ADJUSTED
(9.9% GAAP)
$784M
CASH FROM OPS
~90%
CASH CONVERSION
$3.79
EPS
ADJUSTED
($2.17 GAAP)
FULL-YEAR 2020 PERFORMANCE
Strong execution Delivered results in face of disruptive environment … global transportation markets recovering
Growth through technology & solutions World-class technology (FLXDrive, Zero-to-Zero) while leveraging installed base (key int’l loco & service agreements orders)
Strengthened financial positionStrong cost management; paid down $190M in debt; improvements in working capital; returned capital to shareholders
Aggressive cost actionsEBIT driven by cost controls, LEAN actions, execution on synergies and ~200 bps adj margin improvement in Transit
Delivering on integrationOn-track to deliver full run-rate of $250M in synergies in ‘21
$21.6B
TOTAL BACKLOG
(Including ~$220M in 1x costs)

4
4Q 2020 financial summary
SALES
2020
OPERATING INCOME
2020
EPS
2020 Adj2019 Adj(3) 2020
Adj.
2019 2020 Adj
2019 Adj(2)
$2.0B $161M $0.46
$2.4B $363M$283M
$1.23$0.98
15% Adj. Margin(1)
15.3%14.0%
(1) 4Q 2019 GAAP margin was 9.5% and 4Q 2020 GAAP operating margin was 8.0%.(2) 4Q 2019 GAAP operating income was $226 million.(3) 4Q 2019 GAAP EPS was $0.71
Focused execution as end markets recover

5
4Q 2020 Freight segment performance
PRODUCT LINE YoY
Equipment (32%) Timing of locomotive deliveries
Components (22%) Improving sequential aftermarket offset by lower NA OE railcar build
Services (4%) Improving YoY freight trends offset by high loco parkings; overhaul timing delayed
Digital Electronics (22%) Strong demand for distributed power products; lower PTC sales; order momentum
SALES
2020
OPERATING INCOME
2020
BACKLOG
4Q203Q202019 2020 Adj2019 Adj(2)
$1.3B$121M
$1.7B $314M$218M(3) $17.8B $17.9B(4)
18.8% 16.3%20%
(1) 4th quarter 2019 Freight segment margin was 14.3% and 4th quarter 2020 Freight segment margin was 9.0%. (2) 4th quarter 2019 Freight segment operating income was $239 million.(3) Freight segment income from operations was positively impacted by below market intangible amortization of $20 million. Freight segment income was adjusted by the following expenses: $32 million for restructuring and
transaction and $66 million for amortization expenses. (4) Foreign exchange rates had positive $100 million impact on the segment backlog.
Adj Margin(1)

6
4Q 2020 Transit segment performance
PRODUCT LINE YoY
OE 2% Sequential recovery from COVID disruption in OE projects
Aftermarket (6%) Aftermarket resilient despite COVID resurgence
SALES
2020
OPERATING INCOME
2020
BACKLOG
4Q203Q202019 2020 Adj2019 Adj(2)
$0.68B$57M$0.70B $55M
$77M(3)
$3.5B$3.7B(4)
7.9%
11.3%
2% 5%
(1) 4th quarter 2019 Transit segment margin was 5.6% and 4th quarter 2020 Transit segment margin was 8.3%. (2) 4th quarter 2019 Transit segment operating income was $39 million.(3) Transit Segment income from operations was adjusted by $15 million for restructuring expenses and $5 million for amortization expenses.(4) Foreign exchange rates had a positive $165 million impact on segment backlog.
Adj Margin(1)

7
Resilient business allows for execution on financial priorities
FOCUSED ON CASH CONVERSION
FY 2020FY 2019
$1,016M$784M $4.24B
$190M YoY
STRENGTHENED BALANCE SHEET
4Q 20204Q 2019
RETURNED CAPITAL TO SHAREHOLDERS
Total DebtCash from Ops
$82M $93M
$207M
$4.43B
~$220M1x (1)
costs
FY 2020FY 2019
Substantial cash generation …strong cash conversion & working capital management
Executing on synergy goals … on track to deliver $250M run-rate in ‘21
Solid financial position … paid down $190M in debt in ’20; paid down $723M since GET merger in Feb ‘19
First payment of tax matters agreement … paid GE ~$115M
Returning capital to shareholders … >35% of ’20 cash flow from operations paid in dividends & share repurchase
Strong financial position … executing on strategic plan
Share repurchase
Dividend
(1) One time cash outflows of ~$220M related to transaction, restructuring and litigation expenses in 2020.

8
2021 outlook and guidance
Equipment
Components
Services
Digital Electronics
Freight
Transit
Transit OE
Transit AM
• Uncertain outlook for new railcar builds … expected to be ~25K• Industrial end markets stabilizing … improving aftermarket
• Challenging NA loco market, somewhat offset by international deliveries• Strong Int’l pipeline … order momentum building
• Continued growth in modernizations & international aftermarket sales • Lower parkings … higher service intensity per loco as active fleet runs harder via PSR
• Constrained NA capex budgets• Leverage PTC installed base to increase efficiency; grow PTC internationally
• Continue to deliver on backlog• Supportive fiscal environment and stimulus expected to support Transit end markets
• Trains in operation increasing as economies recover … watching new COVID impacts• Increase transit services drives aftermarket
$7.6B to $7.9B
REVENUES
2021 GUIDANCE
$2.65 to $3.05
GAAP EPS
$3.90 to $4.30
ADJUSTED EPS
>90%
CASH CONVERSION(1)
(1) Cash from operations conversion % is defined as GAAP cash from operations divided by GAAP net income plus depreciation & amortization

9
ESG commitment and defined targets to drive progress
Innovate with purpose
Products . Services . Solutions . Reman.
We are committed to developing responsible and sustainable products that
minimize the impact on the planet.
Responsible operations
Safe operations . Climate . Resource efficiency
We are committed to providing safe work environments and products that enable
productive and efficient use of resources.
Empower people & communities
People . Community . Integrity
We are committed to a diverse & inclusive culture grounded in integrity, and focused
investing in our communities.
1st 100% battery-electric locomotive
10-30% fuel & emissions savings
30%
of net sales to be driven by Wabtec’s eco-efficient portfolio
By 2030 30%
of all GHG emissions intensity and energy intensity to be reduced
By 2030
13M gallons of rain water harvested
3T solar panels eliminated 3T of CO2
Marhowrah, India workforce from
30%
of workforce to be people of color; 25% to be female
By 2030
local community70%
workforce is female25%
100%By 2025, Hosur, India plant to be
100% energy self-sufficient

10
Solid foundation for growth and increased shareholder value
Leading in decarbonization and automation technology … leveraging installed base … profitable growth via new products
~6-7%
organic investment in technology as % of sales
Driving continuous operational improvement and margin expansion … delivering on synergies … advancing lean culture
$250MMtotal run-rate synergies
to be delivered
Generating strong cash flow with disciplined capital allocation>90%
cash from operations conversion
2021
Building stronger Wabtec with purpose-driven culture on sustainability and accountability

12
Appendix

13
Income statement
Appendix A ( 1 of 2)
2020 2019 2020 2019
Net sales 2,023.7$ 2,368.4$ 7,556.1$ 8,200.0$
Cost of sales (1,518.2) (1,693.5) (5,419.0) (5,922.0)
Gross profit 505.5 674.9 2,137.1 2,278.0
Gross profit as a % of Net Sales 25.0% 28.5% 28.3% 27.8%
Selling, general and administrative expenses (235.2) (323.7) (948.1) (1,166.6)
Engineering expenses (38.4) (59.6) (162.1) (209.9)
Amortization expense (70.8) (65.5) (282.4) (238.4)
Total operating expenses (344.4) (448.8) (1,392.6) (1,614.9)
Operating expenses as a % of Net Sales 17.0% 18.9% 18.4% 19.7%
Income from operations 161.1 226.1 744.5 663.1
Income from operations as a % of Net Sales 8.0% 9.5% 9.9% 8.1%
Interest expense, net (48.6) (58.3) (198.9) (219.1)
Other income (expense), net 5.8 6.9 11.6 2.8
Income before income taxes 118.3 174.7 557.2 446.8
Income tax expense (31.5) (37.7) (144.9) (120.3)
Effective tax rate 26.6% 21.6% 26.0% 26.9%
Net income 86.8 137.0 412.3 326.5
Less: Net loss (income) attributable to noncontrolling interest 1.1 (1.3) 2.1 0.2
Net income attributable to Wabtec shareholders 87.9$ 135.7$ 414.4$ 326.7$
Earnings Per Common Share
Basic
Net income attributable to Wabtec shareholders 0.46$ 0.71$ 2.18$ 1.91$
Diluted
Net income attributable to Wabtec shareholders 0.46$ 0.71$ 2.17$ 1.84$
Basic 189.2 191.1 189.9 170.5
Diluted 189.7 191.6 190.4 177.3
December 31, December 31,
WESTINGHOUSE AIR BRAKE TECHNOLOGIES CORPORATION
CONDENSED CONSOLIDATED STATEMENT OF INCOME
FOR THE THREE AND TWELVE MONTHS ENDED DECEMBER 31, 2020 AND 2019
(AMOUNTS IN MILLIONS EXCEPT PER SHARE DATA)
(UNAUDITED)
Three Months Ended Twelve Months Ended

14
Income statement(cont.)
Appendix A ( 2 of 2)
2020 2019 2020 2019
Segment Information
Freight Net Sales 1,339.3$ 1,667.1$ 5,082.3$ 5,441.4$
Freight Income from Operations 120.5$ 239.2$ 583.9$ 642.9$
Freight Operating Margin 9.0% 14.3% 11.5% 11.8%
Transit Net Sales 684.4$ 701.3$ 2,473.8$ 2,758.6$
Transit Income from Operations 56.8$ 39.0$ 229.7$ 214.4$
Transit Operating Margin 8.3% 5.6% 9.3% 7.8%
Backlog Information (Note: 12-month is a sub-set of total) December 31, 2020 September 30, 2020
Freight Total 17,887.1$ 17,840.5$
Transit Total 3,704.2 3,541.9
Wabtec Total 21,591.3$ 21,382.4$
Freight 12-Month 3,586.3$ 3,626.7$
Transit 12-Month 1,934.4 1,557.6
Wabtec 12-Month 5,520.7$ 5,184.3$
December 31, December 31,
WESTINGHOUSE AIR BRAKE TECHNOLOGIES CORPORATION
CONDENSED CONSOLIDATED STATEMENT OF INCOME
FOR THE THREE AND TWELVE MONTHS ENDED DECEMBER 31, 2020 AND 2019
(AMOUNTS IN MILLIONS EXCEPT PER SHARE DATA)
(UNAUDITED)
Three Months Ended Twelve Months Ended

15
Balance sheet
Appendix B
December 31, 2020 December 31, 2019
In millions
Cash and cash equivalents 598.7$ 604.2$
Receivables, net 1,412.5 1,663.9
Inventories 1,642.1 1,773.1
Current assets - other 226.5 150.9
Total current assets 3,879.8 4,192.1
Property, plant and equipment, net 1,601.6 1,655.8
Goodwill 8,485.2 8,360.6
Other intangibles, net 3,869.2 4,104.0
Other long term assets 618.7 631.7
Total assets 18,454.5$ 18,944.2$
Current liabilities 3,226.3$ 3,258.0$
Long-term debt 3,792.2 4,333.6
Long-term liabilities - other 1,283.3 1,359.0
Total liabilities 8,301.8 8,950.6
Shareholders' equity 10,122.3 9,956.5
Non-controlling interest 30.4 37.1
Total shareholders' equity 10,152.7 9,993.6
Total Liabilities and Shareholders' Equity 18,454.5$ 18,944.2$
WESTINGHOUSE AIR BRAKE TECHNOLOGIES CORPORATIONCONDENSED CONSOLIDATED BALANCE SHEETS
(UNAUDITED)

16
Cash flowAppendix C
2020 2019
In millions
Operating activities
Net income 412.3$ 326.5$
Non-cash expense 404.6 369.2
Receivables 315.0 (6.3)
Inventories 180.8 255.9
Accounts Payable (269.0) (144.3)
Other assets and liabilities (260.0) 214.5
Net cash provided by operating activities 783.7 1,015.5
Net cash used for investing activities (155.4) (3,177.8)
Net cash (used for) provided by financing activities (619.0) 461.5
Effect of changes in currency exchange rates (14.8) (37.3)
Decrease in cash (5.5) (1,738.1)
Cash, cash equivalents, and restricted cash, beginning of period 604.2 2,342.3
Cash and cash equivalents, end of period 598.7$ 604.2$
WESTINGHOUSE AIR BRAKE TECHNOLOGIES CORPORATION
CONDENSED CONSOLIDATED STATEMENTS OF CASH FLOWS
(UNAUDITED)
Twelve Months Ended December 31,
17
EPSand non-GAAP Reconciliation
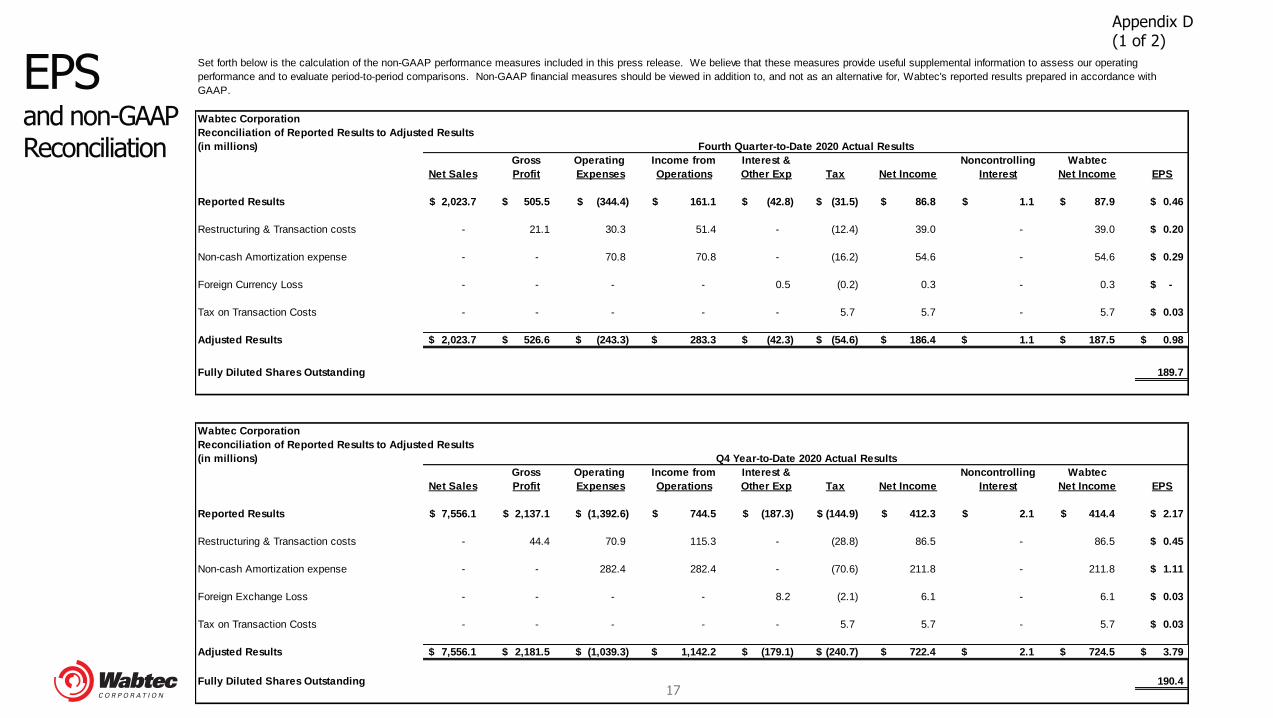
Appendix D(1 of 2)
Wabtec Corporation
Reconciliation of Reported Results to Adjusted Results
(in millions)
Gross Operating Income from Interest & Noncontrolling Wabtec
Net Sales Profit Expenses Operations Other Exp Tax Net Income Interest Net Income EPS
Reported Results 2,023.7$ 505.5$ (344.4)$ 161.1$ (42.8)$ (31.5)$ 86.8$ 1.1$ 87.9$ 0.46$
Restructuring & Transaction costs - 21.1 30.3 51.4 - (12.4) 39.0 - 39.0 0.20$
Non-cash Amortization expense - - 70.8 70.8 - (16.2) 54.6 - 54.6 0.29$
Foreign Currency Loss - - - - 0.5 (0.2) 0.3 - 0.3 -$
Tax on Transaction Costs - - - - - 5.7 5.7 - 5.7 0.03$
Adjusted Results 2,023.7$ 526.6$ (243.3)$ 283.3$ (42.3)$ (54.6)$ 186.4$ 1.1$ 187.5$ 0.98$
Fully Diluted Shares Outstanding 189.7
Wabtec Corporation
Reconciliation of Reported Results to Adjusted Results
(in millions)
Gross Operating Income from Interest & Noncontrolling Wabtec
Net Sales Profit Expenses Operations Other Exp Tax Net Income Interest Net Income EPS
Reported Results 7,556.1$ 2,137.1$ (1,392.6)$ 744.5$ (187.3)$ (144.9)$ 412.3$ 2.1$ 414.4$ 2.17$
Restructuring & Transaction costs - 44.4 70.9 115.3 - (28.8) 86.5 - 86.5 0.45$
Non-cash Amortization expense - - 282.4 282.4 - (70.6) 211.8 - 211.8 1.11$
Foreign Exchange Loss - - - - 8.2 (2.1) 6.1 - 6.1 0.03$
Tax on Transaction Costs - - - - - 5.7 5.7 - 5.7 0.03$
Adjusted Results 7,556.1$ 2,181.5$ (1,039.3)$ 1,142.2$ (179.1)$ (240.7)$ 722.4$ 2.1$ 724.5$ 3.79$
Fully Diluted Shares Outstanding 190.4
Set forth below is the calculation of the non-GAAP performance measures included in this press release. We believe that these measures provide useful supplemental information to assess our operating
performance and to evaluate period-to-period comparisons. Non-GAAP financial measures should be viewed in addition to, and not as an alternative for, Wabtec's reported results prepared in accordance with
GAAP.
Fourth Quarter-to-Date 2020 Actual Results
Q4 Year-to-Date 2020 Actual Results

18
EPSand non-GAAP Reconciliation
Appendix D(2 of 2)
Wabtec Corporation
Reconciliation of Reported Results to Adjusted Results
(in millions)
Gross Operating Income from Interest & Noncontrolling Wabtec
Net Sales Profit Expenses Operations Other Exp Tax Net Income Interest Net Income EPS
Reported Results 2,368.4$ 674.9$ (448.8)$ 226.1$ (51.4)$ (37.7)$ 137.0$ (1.3)$ 135.7$ 0.71$
Restructuring, Transaction, & Litigation costs - 9.9 61.1 71.0 3.5 (18.0) 56.5 - 56.5 0.29$
Non-cash Amortization expense - - 65.5 65.5 - (15.9) 49.6 - 49.6 0.26$
One-time PPA - - - - - - - - - -$
Foreign Exchange Loss - - - - (2.7) 0.7 (2.0) - (2.0) (0.01)$
Tax on Transaction Costs - - - - - (3.5) (3.5) - (3.5) (0.02)$
Adjusted Results 2,368.4$ 684.8$ (322.2)$ 362.6$ (50.7)$ (74.4)$ 237.6$ (1.3)$ 236.3$ 1.23$
Fully Diluted Shares Outstanding 191.6
Wabtec Corporation
Reconciliation of Reported Results to Adjusted Results
(in millions)
Gross Operating Income from Interest & Noncontrolling Wabtec
Net Sales Profit Expenses Operations Other Exp Tax Net Income Interest Net Income EPS
Reported Results 8,200.0$ 2,278.0$ (1,614.9)$ 663.1$ (216.3)$ (120.3)$ 326.5$ 0.2$ 326.7$ 1.84$
Restructuring, Transaction, & Litigation costs - 38.3 191.5 229.8 25.0 (61.6) 193.2 - 193.2 1.08$
Non-cash Amortization expense - - 238.4 238.4 - (57.7) 180.7 - 180.7 1.02$
One-time PPA - 185.0 - 185.0 - (44.8) 140.2 - 140.2 0.79$
Foreign Exchange Loss - - - - 13.5 (3.2) 10.3 - 10.3 0.06$
Tax on Transaction Costs - - - - - 12.5 12.5 - 12.5 0.07$
Adjusted Results 8,200.0$ 2,501.3$ (1,185.0)$ 1,316.3$ (177.8)$ (275.1)$ 863.4$ 0.2$ 863.6$ 4.86$
Fully Diluted Shares Outstanding 177.3
Set forth below is the calculation of the non-GAAP performance measures included in this press release. We believe that these measures provide useful supplemental information to assess our operating
performance and to evaluate period-to-period comparisons. Non-GAAP financial measures should be viewed in addition to, and not as an alternative for, Wabtec's reported results prepared in accordance with
GAAP.
Fourth Quarter-to-Date 2019 Actual Results
Q4 Year-to-Date 2019 Actual Results

19
EBITDA reconciliation
Appendix E
Wabtec Corporation
2020 Q4 EBITDA Reconciliation
(in millions)
Reported Income Other Income Depreciation & Restructuring & Adjusted
from Operations (Expense) Amortization Transaction Costs EBITDA
Consolidated Results $161.1 $5.8 $118.3 $285.2 $51.4 $336.6
Wabtec Corporation
2020 Q4 Year-to-Date EBITDA Reconciliation
(in millions)
Reported Income Other Income Depreciation & Restructuring & Adjusted
from Operations (Expense) Amortization Transaction Costs EBITDA
Consolidated Results $744.5 $11.6 $465.5 $1,221.6 $115.3 $1,336.9
Wabtec Corporation
2019 Q4 EBITDA Reconciliation
(in millions)
Reported Income Other Income Depreciation & Restructuring & Adjusted
from Operations (Expense) Amortization Transaction Costs EBITDA
Consolidated Results $226.1 $6.9 $110.8 $343.8 $71.0 $414.8
Wabtec Corporation
2019 Q4 Year-to-Date EBITDA Reconciliation
(in millions)
Reported Income Other Income Depreciation & Restructuring & Adjusted
from Operations (Expense) Amortization Transaction Costs EBITDA
Consolidated Results $663.1 $2.8 $396.2 $1,062.1 $414.8 $1,476.9
=
Set forth below is the calculation of the non-GAAP performance measures included in this press release. We believe that these measures provide useful supplemental
information to assess our operating performance and to evaluate period-to-period comparisons. Non-GAAP financial measures should be viewed in addition to, and not as
an alternative for, Wabtec's reported results prepared in accordance with GAAP.
+ + = EBITDA + =
+ + = EBITDA +
=
+ + = EBITDA + =
+ + = EBITDA +

20
Sales by product line
Appendix F
In millions 2020 2019
Freight Segment
Equipment 433.3$ 638.0$
Components 194.6 250.1
Digital Electronics 163.9 210.8
Services 547.5 568.2
Total Freight Segment 1,339.3 1,667.1
Transit Segment
Original Equipment Manufacturer 321.2$ 313.8$
Aftermarket 363.2 387.5
Total Transit Segment 684.4 701.3
In millions 2020 2019
Freight Segment
Equipment 1,531.5$ 1,699.7$
Components 818.7 1,073.5
Digital Electronics 664.0 677.1
Services 2,068.1 1,991.1
Total Freight Segment 5,082.3 5,441.4
Transit Segment
Original Equipment Manufacturer 1,138.6$ 1,286.6$
Aftermarket 1,335.2 1,472.0
Total Transit Segment 2,473.8 2,758.6
Twelve Months Ended December 31,
WESTINGHOUSE AIR BRAKE TECHNOLOGIES CORPORATION
SALES BY PRODUCT LINE
(UNAUDITED)
Three Months Ended December 31,

21
Segment reconciliation
Appendix G
In millions 2020 2019 2020 2019
Freight Segment Reported Income from Operations 120.5$ 239.2$ 583.9$ 642.9$
Freight Segment Reported Margin 9.0% 14.3% 11.5% 11.8%
One-time PPA - - - 185.0
Restructuring & Transaction costs 32.4 14.9 75.9 66.6
Non-cash Amortization expense 65.5 60.0 262.3 218.3
Freight Segment Adjusted Income from Operations 218.4$ 314.1$ 922.1$ 1,112.8$
Freight Segment Adjusted Margin 16.3% 18.8% 18.1% 20.5%
Transit Segment Reported Income from Operations 56.8$ 39.0$ 229.7$ 214.4$
Transit Segment Reported Margin 8.3% 5.6% 9.3% 7.8%
Restructuring & Transaction costs 15.0 10.7 28.3 18.0
Non-cash Amortization expense 5.3 5.5 20.1 20.1
Transit Segment Adjusted Income from Operations 77.1$ 55.2$ 278.1$ 252.5$
Transit Segment Adjusted Margin 11.3% 7.9% 11.2% 9.2%
WESTINGHOUSE AIR BRAKE TECHNOLOGIES CORPORATION
RECONCILIATION OF REPORTED RESULTS TO ADJUSTED RESULTS - BY SEGMENT
(UNAUDITED)
Three Months Ended December 31, Twelve Months Ended December 31,
Related Documents