Q3 2017 Financial report NGT

Welcome message from author
This document is posted to help you gain knowledge. Please leave a comment to let me know what you think about it! Share it to your friends and learn new things together.
Transcript

Q3 2017 Financial report
NGT

___________________________________________________________________________________________________ NextGenTel Holding ASA Q3 2017 Financial Report
27 October 2017
NextGenTel Holding ASA – 3rd
quarter 2017
Key figures
(Figures in NOK million)Q3
2017
Q3
2016
Revenues 317.4 338.9
Gross profit 131.5 158.1
Gross margin 41.4% 46.6%
EBITDA 35.9 56.3 Note: EBITDA adjusted for non-recurring items
Group financials Q3 2017 (2016 figures in
brackets)
Revenues in Q3 were NOK 317.4 million (338.9).
Gross profit was NOK 131.5 million – 41.4%
(158.1 – 46.6%). EBITDA adjusted for non-
recurring items was NOK 35.9 million – 11.3 %
(56.3 – 16.6%).
Q3 had an operating loss of NOK 7.8 million
(profit 13.2). Lower revenues and reduced gross
margin affects gross profit negatively. The new EU
regulation and data rollover have affected gross
profit for the mobile services negatively in Q3.
Opex is reduced by NOK 6.2 million from Q3
2016.
The Q3 2017 financial results include NOK 12.1
million in amortization cost related to business
combinations.
The regulatory issue related to the VULA product
from Telenor was resolved in favor of NextGenTel
on 25 October. The estimated positive effect from
a reduction in CoGS for the VULA product is not
included in the financial statements as of 30
September 2017. The positive effect on the Q3’17
result would be NOK 0.9 million. The positive
effect as of YTD 30 September 2017 would be
NOK 3.1 million and the accumulated positive
effect NOK 6.7 million (includes 2016).
Cash and cash equivalents were NOK 24.4 million
at 30 September 2017 (excluding a NOK 50
million overdraft facility).
EPS was NOK 0.32 negative in Q3 2017 and
equity ratio was 19.96% at 30 September.
*) Customer base = revenue generating units (RGUs)
Capital expenditures
Capital expenditures in Q3 2017 were NOK 18.5
million (29.6). For details, see notes 6 and 7 to the
financial statements. Capex/sales ratio was 5.8% in
Q3 (8.7%).
Financial debt
Total interest-bearing debt was NOK 237.3 million
(320.7) where NOK 175 million is bank loan and
NOK 62.3 is financial lease. Net interest-bearing debt
was NOK 212.9 million as of 30 September 2017
(262.9). See note 9 to the financial statements.
Related party transactions
There have been no transactions by related parties that
have had a material effect on the Group’s financial
position or results in the period.
Customer base development
The total customer base*)
in Norway was 260,000 at
the end of Q3 2017, a decrease from 267,000 at the
end of Q2. The consumer segment had a decrease of
5,800 and the business segment a decrease of 1,200.
The company has continued its activities towards the
housing cooperatives segment. In Q3, 6 new
cooperatives have signed an agreement with
NextGenTel representing 282 households (total
number of units is 122 and 6,091 households of which
4,372 are installed at the end of September).
The total number of subscribers on high-speed
Internet access is 44,000.
The consumer mobile subscriber base counted 38,100
subscribers and the corporate mobile subscriber base
counted 16,400 subscribers at the end of September.
The customer base in the international markets
declined by 4,800 customers in Q3, mainly driven by
reduction of white label customers in the Netherlands.
The total number of customers in the international
markets was 80,200 at the end of September.
1

___________________________________________________________________________________________________ NextGenTel Holding ASA Q3 2017 Financial Report
27 October 2017
Shareholder information
The total number of registered shares outstanding
at the end of Q3 2017 was 23,283,180 out of which
274,201 shares were owned by NextGenTel
Holding ASA.
The total number of shareholders was 564 and
26.2% of the shares were registered abroad. For
information about the top 20 shareholders, please
refer to http://nextgentelholding.com/Investor-
relations/Share-information/Top-20-shareholders
Total outstanding options at the end of Q3 2017
were 436,000 of which 259,000 have a dilutive
effect with a weighted average strike price of NOK
6.00.
Modernization of the copper network During the discussions in the copper forum,
Telenor has reduced the initial scope of the copper
modernization significantly and presented a scope
where they would only modernize the copper
network in areas where households are scattered
around (basically the outskirts of the copper
network) and they would only use vectorized
VDSL technology (thus less distributed
modernization, longer last mile and lower available
speed compared with more modern G-Fast
technology).
The copper forum has not been able to reach an
agreement about modernization of the network
because Telenor wanted one set of rules to apply
for their modernization and a separate set of rules
for other vendors. An effect of an agreement that
complies with Telenor demands would be that
Telenor could modernize the network where they
want and effectively stop modernization any place
else reducing the competition with their own fiber
roll out strategy. For NextGenTel, the result is that
the number of customers that would get a better
service has been reduced significantly.
The work in the broadband forum has given the
Norwegian authorities unique insights and it is
expected that the authorities will introduce a new
regulation of the copper market in 2017.
Reference:
https://www.nkom.no/aktuelt/nyheter/nkom-tar-
moderniseringen-av-kobbernettet-over-i-
reguleringsspor
Tax issue Reference is made to previous announcements related to
the tax issue regarding the taxation of dividends from
Switzerland (stock exchange notice and Q1 2017 report).
The company has received a final report from the tax
authorities implying a total tax claim of NOK 27.5
million excl interest. The total tax claim reflects a partial
deduction of taxes paid in Switzerland. It is still the
company’s view that no additional tax should be
imposed and the company will file a complaint to the tax
appeal board (“Skatteklagenemnda”) within the 6 weeks
deadline.
Cost reduction
As announced in August, the board has approved a
cost reduction plan which implies a reduction of
operating expenses by additional NOK 40 million
annually. The company is progressing according to
plan with full impact from January 2018. In addition,
the VULA fiber CoGS is reduced by approximately
12% (7,700 consumer customers).
Transformation of operations
The deployment of new business support systems
during the past months represents opportunities to
introduce robotics to increase effectiveness in
processes and routines. The first five processes that
use robotics are in production already and represent
cost savings. Within December, two more processes
will be taken over by robotics with additional cost
savings. So far the robotics has processed 400 hours
of production. The robotics team has qualified more
than 60 processes and will continue its work to reduce
the operational costs i 2018.
Key focus on B2B and structural alternatives for
B2C
The two new units, NextGenTel AS (B2C) and Fiber
Norge (B2B), presented in the Q2 report will be
managed as separate operational units under
NextGenTel Holding from 1 November. The process
has identified even more growth potential within B2B
than previously envisaged and the Board of Directors
has concluded to invest more resources to accelerate
our B2B offering.
Demonstrated with several new project wins
Strong demand and pipeline
The B2C business has a strong position within its
market, but operates in mature market segments. The
Board of Directors has concluded to explore structural
alternatives for the B2C operation and has initiated a
review that may result in a separate listing of the
consumer segment on Oslo Børs in 2018.
2
___________________________________________________________________________________________________ NextGenTel Holding ASA Q3 2017 Financial Report
27 October 2017
Oslo, 26 October 2017
Board of Directors
NextGenTel Holding ASA
Ellen Hanetho Lars B. Thoresen Aril Resen
(sign.) Chairman of the Board (sign.)
(sign.)
Kari Mette Toverud Espen Fjogstad Eirik Lunde
(sign.) (sign.) CEO
(sign.)
Vidar Skogedal Linn Anette Husøy
Employee repr. Employee repr.
(sign.) (sign.)
3
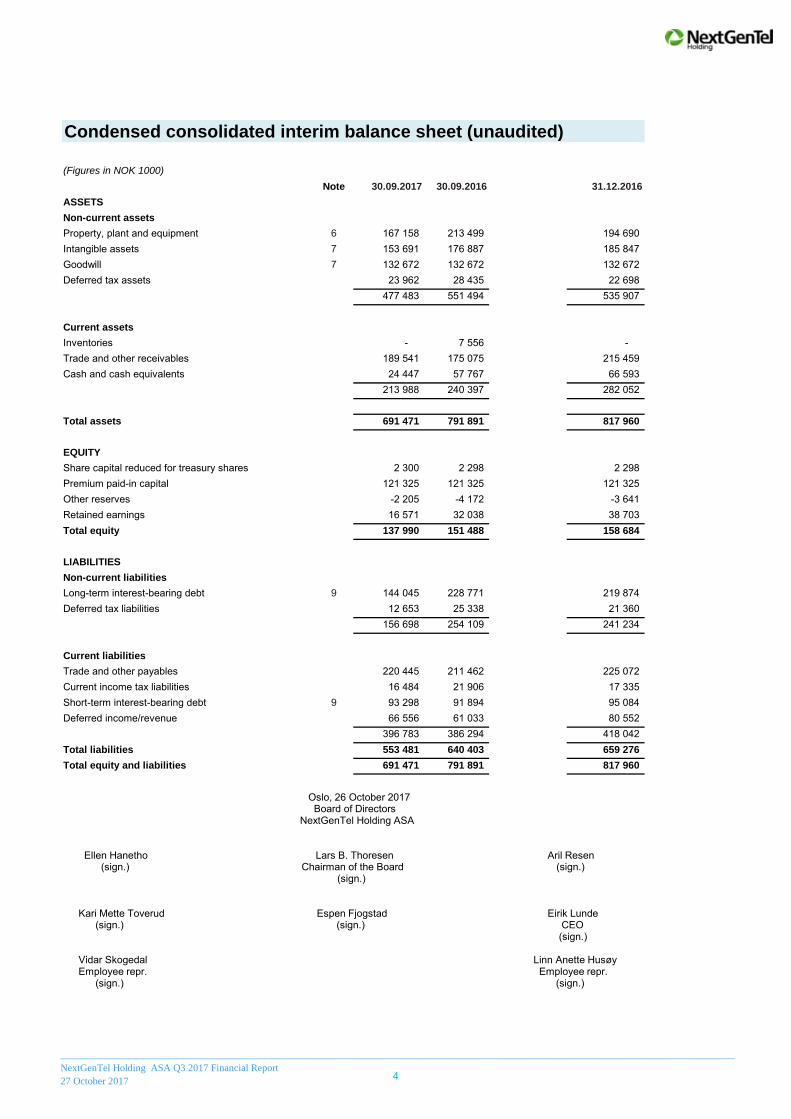
Condensed consolidated interim balance sheet (unaudited)
(Figures in NOK 1000)
Note 30.09.2017 30.09.2016 31.12.2016
ASSETS
Non-current assets
Property, plant and equipment 6 167 158 213 499 194 690 Intangible assets 7 153 691 176 887 185 847 Goodwill 7 132 672 132 672 132 672 Deferred tax assets 23 962 28 435 22 698
477 483 551 494 535 907
Current assets
Inventories - 7 556 - Trade and other receivables 189 541 175 075 215 459 Cash and cash equivalents 24 447 57 767 66 593
213 988 240 397 282 052
Total assets 691 471 791 891 817 960
EQUITY
Share capital reduced for treasury shares 2 300 2 298 2 298 Premium paid-in capital 121 325 121 325 121 325 Other reserves -2 205 -4 172 -3 641 Retained earnings 16 571 32 038 38 703 Total equity 137 990 151 488 158 684
LIABILITIES
Non-current liabilities
Long-term interest-bearing debt 9 144 045 228 771 219 874 Deferred tax liabilities 12 653 25 338 21 360
156 698 254 109 241 234
Current liabilities
Trade and other payables 220 445 211 462 225 072 Current income tax liabilities 16 484 21 906 17 335 Short-term interest-bearing debt 9 93 298 91 894 95 084 Deferred income/revenue 66 556 61 033 80 552
396 783 386 294 418 042 Total liabilities 553 481 640 403 659 276
Total equity and liabilities 691 471 791 891 817 960
Oslo, 26 October 2017 Board of Directors
NextGenTel Holding ASA
Ellen Hanetho Lars B. Thoresen Aril Resen (sign.) Chairman of the Board (sign.)
(sign.)
Kari Mette Toverud Espen Fjogstad Eirik Lunde (sign.) (sign.) CEO
(sign.)
Vidar Skogedal Linn Anette Husøy Employee repr. Employee repr.
(sign.) (sign.)
____________________________________________________________________________________________________________________________________
NextGenTel Holding ASA Q3 2017 Financial Report
27 October 20174

Condensed consolidated interim income statement (unaudited)
(Figures in NOK 1000)
Note Q3 2017 Q3 2016 Jan-Sep 2017 Jan-Sep 2016 Jan-Dec 2016
Total revenues 317 384 338 952 952 951 1 028 611 1 358 632
Cost of connection and traffic charges -185 859 -180 832 -538 602 -542 900 -718 559 Salaries and personnel costs -57 042 -61 323 -174 465 -185 576 -246 007 Selling and marketing costs -11 539 -12 075 -29 745 -38 135 -50 622 Other costs -27 057 -28 462 -84 034 -90 112 -117 669 Depreciation and amortization 6, 7 -43 707 -43 004 -132 902 -126 674 -170 526
Operating profit -7 820 13 257 -6 797 45 214 55 249
Finance 8 -2 222 -4 344 -8 988 -12 055 -13 372 Profit before income tax -10 042 8 913 -15 785 33 159 41 877
Income tax 2 597 -1 887 4 560 -7 489 -9 475
Profit -7 445 7 026 -11 225 25 670 32 402
Attributable to:
Equity holders of the parent company -7 445 7 026 -11 225 25 670 32 402
Other comprehensive income Q3 2017 Q3 2016 Jan-Sep 2017 Jan-Sep 2016 Jan-Dec 2016
Translation differences -383 -1 527 1 397 -2 615 -2 151 Other income and expenses during the period (after tax) -383 -1 527 1 397 -2 615 -2 151 Comprehensive profit for the period -7 828 5 499 -9 828 23 055 30 251
Profit attributable to:
Equity holders of the parent company -7 828 5 499 -9 828 23 055 30 251
Earnings per share
Earnings per share -0.32 0.31 -0.49 1.12 1.41Diluted earnings per share -0.32 0.30 -0.48 1.11 1.40
____________________________________________________________________________________________________________________________________
NextGenTel Holding ASA Q3 2017 Financial Report
27 October 20175

Condensed consolidated interim statement of changes in equity (unaudited)
(Figures in NOK 1000)
Share
capital
Treasury
shares
Premium paid-
in equity
Translation
differences
Retained
earnings Total equity
Equity as at 1 January 2016 2 328 -30 121 325 -1 490 6 301 128 433
Comprehensive income for the period
Profit for the period - - - - 32 402 32 402
Other income and expenses - Translation differences - - - -2 151 - -2 151Total comprehensive income for the period - - - -2 151 32 402 30 251
- Transactions with owners, recognized directly
against equity
- - - - - -
Contributions by and distributions to owners of
the Company
- - - - - -
Total contributions by and distributions to
owners of the Company
- - - - - -
Equity as at 31 December 2016 2 328 -30 121 325 -3 641 38 703 158 684
Equity as at 1 January 2017 2 328 -30 121 325 -3 641 38 703 158 684
Comprehensive income for the period
Profit for the period - - - - -11 225 -11 225Other income and expenses
Translation differences - - - 1 436 - 1 436Total other revenues and expenses - - - 1 436 - 1 436
Total comprehensive income for the period - - - 1 436 -11 225 -9 789
Transactions with owners, recognized directly
against equity
Contributions by and distributions to owners of
the Company
Dividends to owners - - - - -11 505 -11 505Share-based payment transactions - - - - - - Share options exercised - 3 - - 597 600 Total contributions by and distributions to owners of the Company
- 3 - - -10 908 -10 905
Equity as at 30 September 2017 2 328 -28 121 325 -2 205 16 571 137 990
_________________________________________________________________________________________________________________________________________
NextGenTel Holding ASA Q3 2017 Financial Report
27 October 20176

Condensed consolidated interim statement of cash flows (unaudited)
(Figures in NOK 1000)
Cash flows from operations Q3 2017 Q3 2016 Jan-Sep 2017 Jan-Sep 2016 Jan-Dec 2016
Profit/loss for the year before tax -10 042 8 913 -15 785 33 159 41 877 Taxes paid -970 -205 -6 171 -941 -5 703 Depreciation and amortization 43 707 43 004 132 902 126 674 170 526 Net change in current liabilities 14 145 -11 441 -10 342 -5 454 14 617 Net change in receivables 17 773 18 873 26 685 8 089 -21 777 Net cash flows from operations 64 613 59 143 127 289 161 527 200 011
Cash flows from investment activities
Investments in fixed assets -12 095 -18 659 -41 363 -38 051 -51 505 Investments in intangible assets -5 737 -6 008 -27 337 -22 819 -36 065 Net cash flows used in investment activities -17 832 -24 668 -68 700 -60 871 -87 570
Cash flows from financing activities
New financial debt 300 1 367 300 1 867 4 369 Repayment of debt -35 000 -36 366 -70 000 -74 871 -75 048
-6 876 -1 006 -20 596 -14 556 -20 766 Payment of dividend - - -11 505 - - Equity changes - - 600 - - Net cash flows used in financing activities -41 576 -36 006 -101 201 -87 561 -91 444
Change in cash and cash equivalents 5 205 -1 531 -42 612 13 095 20 997
19 423 60 965 66 593 47 401 47 401
Effect of exchange rate fluctuations on cash and cash equivalents
-182 -1 667 465 -2 729 -1 806
Cash and cash equivalents as at end of period 24 447 57 767 24 447 57 767 66 593
Cash and cash equivalents and credit facilities utilised as at beginning of period
Payment of financial lease obligations
_________________________________________________________________________________________________________________________________________
NextGenTel Holding ASA Q3 2017 Financial Report
27 October 20177

NextGenTel Holding ASA
Notes to the condensed consolidated interim financial statements (unaudited)
_________________________________________________________________________________________________ NextGenTel Holding ASA Q3 2017 Financial Report 27 October 2017
Note 1: Reporting entity
NextGenTel Holding ASA (the “Company”) is a company domiciled in Oslo, Norway. These September 2017 condensed
consolidated interim financial statements of NextGenTel Holding ASA and its subsidiaries (together “the Group”) are
for the nine months ended 30 September 2017.
The consolidated financial statements of the Group as at and for the year ended 31 December 2016 are available at
www.nextgentelholding.com/investor_relations.
Note 2: Statement of compliance
These condensed consolidated interim financial statements of NextGenTel Holding ASA Group have been prepared in
accordance with rules and regulations from Oslo Stock Exchange and International Financial Reporting Standard (IFRS)
IAS 34, Interim Financial Reporting. They do not include all of the information required for full annual financial
statements, and should be read in conjunction with the consolidated financial statements of the Group as at and for
the year ended 31 December 2016.
These condensed consolidated interim financial statements were approved by the Board of Directors on 26 October
2017.
Note 3: Significant accounting policies
These condensed consolidated interim financial statements have been prepared under the historical cost convention.
They have been prepared under the same accounting principles as those set out in the consolidated financial
statements of the Group as at and for the year ended 31 December 2016.
Note 4: Estimates
The preparation of interim financial statements requires management to make judgments, estimates and assumptions
that affect the application of accounting policies and the reported amounts of assets and liabilities, income and
expense. Actual results may differ from these estimates.
In preparing these condensed consolidated interim financial statements, the significant judgments made by
management in applying the Group’s accounting policies and the key sources of estimation uncertainty were the same
as those that applied to the consolidated financial statements as at and for the year ended 31 December 2016.
8
Geographical segments
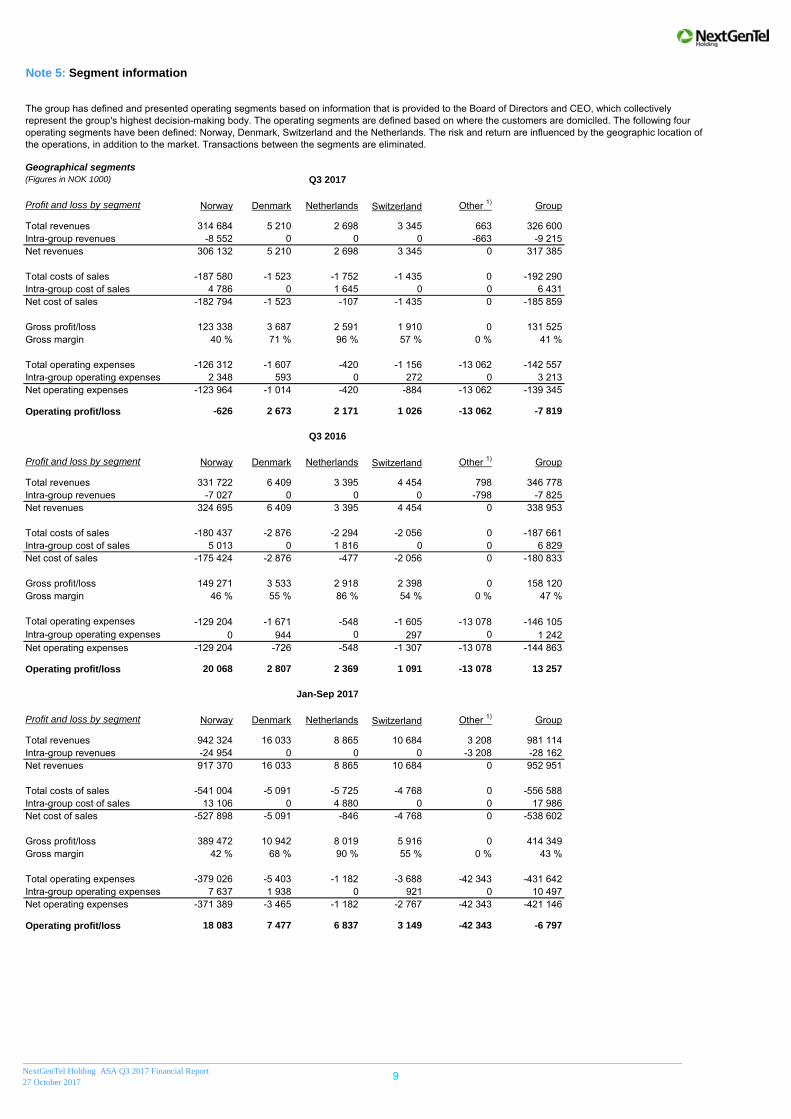
(Figures in NOK 1000) Q3 2017
Profit and loss by segment Norway Denmark Netherlands Switzerland Other 1) Group
Total revenues 314 684 5 210 2 698 3 345 663 326 600Intra-group revenues -8 552 0 0 0 -663 -9 215Net revenues 306 132 5 210 2 698 3 345 0 317 385
Total costs of sales -187 580 -1 523 -1 752 -1 435 0 -192 290Intra-group cost of sales 4 786 0 1 645 0 0 6 431Net cost of sales -182 794 -1 523 -107 -1 435 0 -185 859
Gross profit/loss 123 338 3 687 2 591 1 910 0 131 525Gross margin 40 % 71 % 96 % 57 % 0 % 41 %
Total operating expenses -126 312 -1 607 -420 -1 156 -13 062 -142 557Intra-group operating expenses 2 348 593 0 272 0 3 213Net operating expenses -123 964 -1 014 -420 -884 -13 062 -139 345
Operating profit/loss -626 2 673 2 171 1 026 -13 062 -7 819
Q3 2016
Profit and loss by segment Norway Denmark Netherlands Switzerland Other 1) Group
Total revenues 331 722 6 409 3 395 4 454 798 346 778Intra-group revenues -7 027 0 0 0 -798 -7 825Net revenues 324 695 6 409 3 395 4 454 0 338 953
Total costs of sales -180 437 -2 876 -2 294 -2 056 0 -187 661Intra-group cost of sales 5 013 0 1 816 0 0 6 829Net cost of sales -175 424 -2 876 -477 -2 056 0 -180 833
Gross profit/loss 149 271 3 533 2 918 2 398 0 158 120Gross margin 46 % 55 % 86 % 54 % 0 % 47 %
Total operating expenses -129 204 -1 671 -548 -1 605 -13 078 -146 105Intra-group operating expenses 0 944 0 297 0 1 242Net operating expenses -129 204 -726 -548 -1 307 -13 078 -144 863
Operating profit/loss 20 068 2 807 2 369 1 091 -13 078 13 257
Jan-Sep 2017
Profit and loss by segment Norway Denmark Netherlands Switzerland Other 1) Group
Total revenues 942 324 16 033 8 865 10 684 3 208 981 114Intra-group revenues -24 954 0 0 0 -3 208 -28 162Net revenues 917 370 16 033 8 865 10 684 0 952 951
Total costs of sales -541 004 -5 091 -5 725 -4 768 0 -556 588Intra-group cost of sales 13 106 0 4 880 0 0 17 986Net cost of sales -527 898 -5 091 -846 -4 768 0 -538 602
Gross profit/loss 389 472 10 942 8 019 5 916 0 414 349Gross margin 42 % 68 % 90 % 55 % 0 % 43 %
Total operating expenses -379 026 -5 403 -1 182 -3 688 -42 343 -431 642Intra-group operating expenses 7 637 1 938 0 921 0 10 497Net operating expenses -371 389 -3 465 -1 182 -2 767 -42 343 -421 146
Operating profit/loss 18 083 7 477 6 837 3 149 -42 343 -6 797
Note 5: Segment information
The group has defined and presented operating segments based on information that is provided to the Board of Directors and CEO, which collectively represent the group's highest decision-making body. The operating segments are defined based on where the customers are domiciled. The following four operating segments have been defined: Norway, Denmark, Switzerland and the Netherlands. The risk and return are influenced by the geographic location of the operations, in addition to the market. Transactions between the segments are eliminated.
_________________________________________________________________________________________________________________________________________________________
NextGenTel Holding ASA Q3 2017 Financial Report
27 October 20179
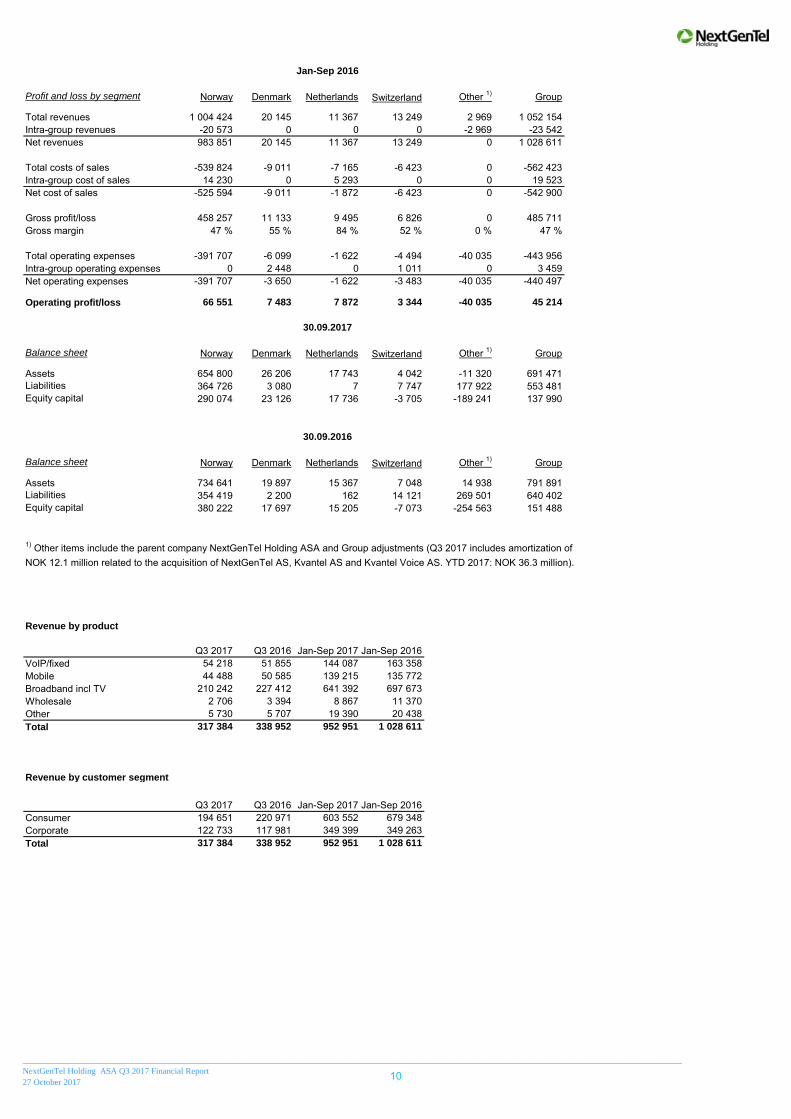
Jan-Sep 2016
Profit and loss by segment Norway Denmark Netherlands Switzerland Other 1) Group
Total revenues 1 004 424 20 145 11 367 13 249 2 969 1 052 154Intra-group revenues -20 573 0 0 0 -2 969 -23 542Net revenues 983 851 20 145 11 367 13 249 0 1 028 611
Total costs of sales -539 824 -9 011 -7 165 -6 423 0 -562 423Intra-group cost of sales 14 230 0 5 293 0 0 19 523Net cost of sales -525 594 -9 011 -1 872 -6 423 0 -542 900
Gross profit/loss 458 257 11 133 9 495 6 826 0 485 711Gross margin 47 % 55 % 84 % 52 % 0 % 47 %
Total operating expenses -391 707 -6 099 -1 622 -4 494 -40 035 -443 956Intra-group operating expenses 0 2 448 0 1 011 0 3 459Net operating expenses -391 707 -3 650 -1 622 -3 483 -40 035 -440 497
Operating profit/loss 66 551 7 483 7 872 3 344 -40 035 45 214
30.09.2017
Balance sheet Norway Denmark Netherlands Switzerland Other 1) Group
Assets 654 800 26 206 17 743 4 042 -11 320 691 471Liabilities 364 726 3 080 7 7 747 177 922 553 481Equity capital 290 074 23 126 17 736 -3 705 -189 241 137 990
30.09.2016
Balance sheet Norway Denmark Netherlands Switzerland Other 1) Group
Assets 734 641 19 897 15 367 7 048 14 938 791 891Liabilities 354 419 2 200 162 14 121 269 501 640 402Equity capital 380 222 17 697 15 205 -7 073 -254 563 151 488
1) Other items include the parent company NextGenTel Holding ASA and Group adjustments (Q3 2017 includes amortization of NOK 12.1 million related to the acquisition of NextGenTel AS, Kvantel AS and Kvantel Voice AS. YTD 2017: NOK 36.3 million).
Revenue by product
Q3 2017 Q3 2016 Jan-Sep 2017 Jan-Sep 2016VoIP/fixed 54 218 51 855 144 087 163 358Mobile 44 488 50 585 139 215 135 772Broadband incl TV 210 242 227 412 641 392 697 673Wholesale 2 706 3 394 8 867 11 370Other 5 730 5 707 19 390 20 438Total 317 384 338 952 952 951 1 028 611
Revenue by customer segment
Q3 2017 Q3 2016 Jan-Sep 2017 Jan-Sep 2016Consumer 194 651 220 971 603 552 679 348Corporate 122 733 117 981 349 399 349 263Total 317 384 338 952 952 951 1 028 611
_________________________________________________________________________________________________________________________________________________________
NextGenTel Holding ASA Q3 2017 Financial Report
27 October 201710

(Figures in NOK 1000)
Q3 2017 Q3 2016 Jan-Sep 2017 Jan-Sep 2016 Jan-Dec 2016
Equipment
Book value beg. of period 178 572 214 327 194 690 217 478 217 478 Additions 12 783 23 623 45 876 73 238 80 994 Depreciation -24 197 -24 452 -73 408 -77 217 -103 782 Property, plant and equipment 167 158 213 499 167 158 213 499 194 690
(Figures in NOK 1000)
Q3 2017 Q3 2016 Jan-Sep 2017 Jan-Sep 2016 Jan-Dec 2016
Intangible assets
Book value beg. of period 167 463 189 430 185 847 206 299 206 299 Additions 5 738 6 009 27 338 20 044 46 293 Amortization -19 510 -18 552 -59 494 -49 457 -66 745 Impairment loss - - - - - Book value end of period 153 691 176 887 153 691 176 887 185 847
Goodwill
Book value beg. of period 132 672 132 672 132 672 132 672 132 672 Book value end of period 132 672 132 672 132 672 132 672 132 672
Intangible assets and goodwill 286 363 309 559 286 363 309 559 318 519
Amortization of intangible assets include amortization of excess values related to the acquisition of NextGenTel AS, Kvantel AS and Kvantel Voice AS (Q3 17: NOK 12.1 million, YTD 17: NOK 36.3 million).
(Figures in NOK 1000)
Q3 2017 Q3 2016 Jan-Sep 2017 Jan-Sep 2016 Jan-Dec 2016
Interest income 306 275 932 781 1 039 Interest expense -2 758 -3 734 -8 924 -11 235 -13 306 Foreign currency gain/(loss) 16 -830 -696 -783 157 Other financial income/(expenses) 214 -55 -299 -818 -1 262 Net finance -2 222 -4 344 -8 988 -12 055 -13 372
(Figures in NOK 1000)
30.09.2017 30.09.2016 31.12.2016
Term loan bank 105 000 175 000 175 000 Long term financial lease 39 045 53 771 44 874 Total long-term debt 144 045 228 771 219 874
Current part of term loan bank 70 000 70 000 70 000 Short term financial lease 23 298 21 894 25 084 Total short-term debt 93 298 91 894 95 084
Total interest-bearing debt 237 343 320 665 314 958
Cash 24 447 57 767 66 593 Net interest-bearing debt 212 897 262 898 248 365
Note 9: Interest-bearing debt
Note 6: Property, plant and equipment
Note 7: Intangible assets and goodwill
Note 8: Finance
_________________________________________________________________________________________________________________________________________________________
NextGenTel Holding ASA Q3 2017 Financial Report
27 October 201711
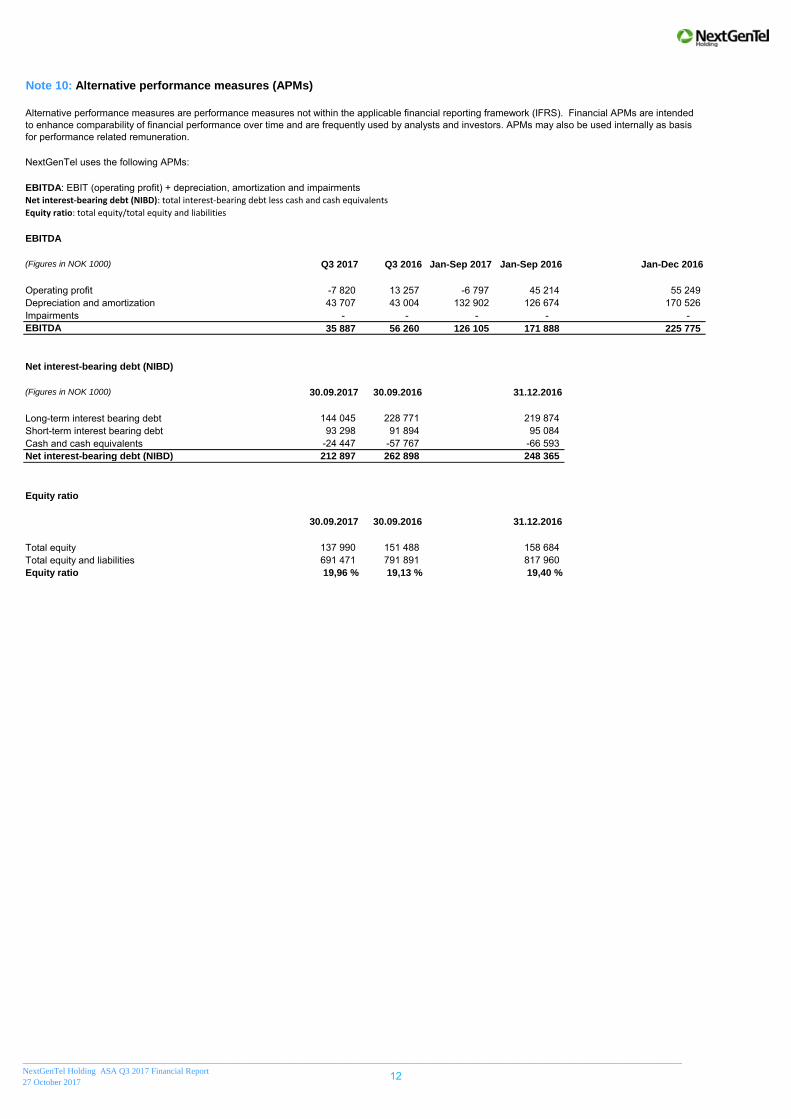
Net interest-bearing debt (NIBD): total interest-bearing debt less cash and cash equivalents
Equity ratio: total equity/total equity and liabilities
EBITDA
(Figures in NOK 1000) Q3 2017 Q3 2016 Jan-Sep 2017 Jan-Sep 2016 Jan-Dec 2016
Operating profit -7 820 13 257 -6 797 45 214 55 249 Depreciation and amortization 43 707 43 004 132 902 126 674 170 526 Impairments - - - - - EBITDA 35 887 56 260 126 105 171 888 225 775
Net interest-bearing debt (NIBD)
(Figures in NOK 1000) 30.09.2017 30.09.2016 31.12.2016
Long-term interest bearing debt 144 045 228 771 219 874 Short-term interest bearing debt 93 298 91 894 95 084 Cash and cash equivalents -24 447 -57 767 -66 593 Net interest-bearing debt (NIBD) 212 897 262 898 248 365
Equity ratio
30.09.2017 30.09.2016 31.12.2016
Total equity 137 990 151 488 158 684 Total equity and liabilities 691 471 791 891 817 960 Equity ratio 19,96 % 19,13 % 19,40 %
Note 10: Alternative performance measures (APMs)
Alternative performance measures are performance measures not within the applicable financial reporting framework (IFRS). Financial APMs are intended to enhance comparability of financial performance over time and are frequently used by analysts and investors. APMs may also be used internally as basis for performance related remuneration.
NextGenTel uses the following APMs:
EBITDA: EBIT (operating profit) + depreciation, amortization and impairments
_________________________________________________________________________________________________________________________________________________________
NextGenTel Holding ASA Q3 2017 Financial Report
27 October 201712

____________________________________________________________________________________________________________
NextGenTel Holding ASA Q3 2017 Financial Report
27 October 2017
Company Facts
NextGenTel Holding ASA
Harbitzalleen 2A
P.O. Box 54 Skøyen
0212 Oslo
Telephone: +47 2167 3500
Homepage: www.nextgentelholding.com
Company reg. number: 985 968 098
Founded: 12 August 2003
Board of Directors
Lars B. Thoresen (Chairman)
Aril Resen
Ellen Hanetho
Kari Mette Toverud
Espen Fjogstad
Vidar Skogedal (employee repr.)
Linn Anette Husøy (employee repr.)
Group Management
Eirik Lunde, Chief Executive Officer
Tom Nøttveit, Chief Financial Officer
Sven Ole Skrivervik, Chief Technology Officer
Roy Børsheim, Director Consumer
Ole Jacob Moldestad, Director Corporate
Investor Relations
Tom Nøttveit, Chief Financial Officer
Telephone: +47 4153 9714
Email address: [email protected]
Web: http://www.nextgentelholding.com
Financial Calendar
4th
quarter 2017: 14 February at 9:00
1st quarter 2018: 25 April at 09:00
2nd
quarter 2018: 15 August at 09:00
3rd
quarter 2018: 24 October at 09:00
Annual general meeting: 18 April at 15:00
Equity Research Coverage
Company Contact Phone
Indep Research LTD Toni Yordanov +44 (0)776 139 1953
Beringer Finance Erik Hjulström +47 9072 7556
13
Related Documents