SAAB MARFIN MBA Financial ratio analysis in BDK 1 Financial ratio analysis in

financial ratio analysis on BDK
Sep 13, 2014
financial ratio analysis on BDK
Welcome message from author
This document is posted to help you gain knowledge. Please leave a comment to let me know what you think about it! Share it to your friends and learn new things together.
Transcript

SAAB MARFIN MBA
Financial ratio analysis in BDK 1
Financial ratio analysis in
SAAB MARFIN MBA
Financial ratio analysis in BDK 2
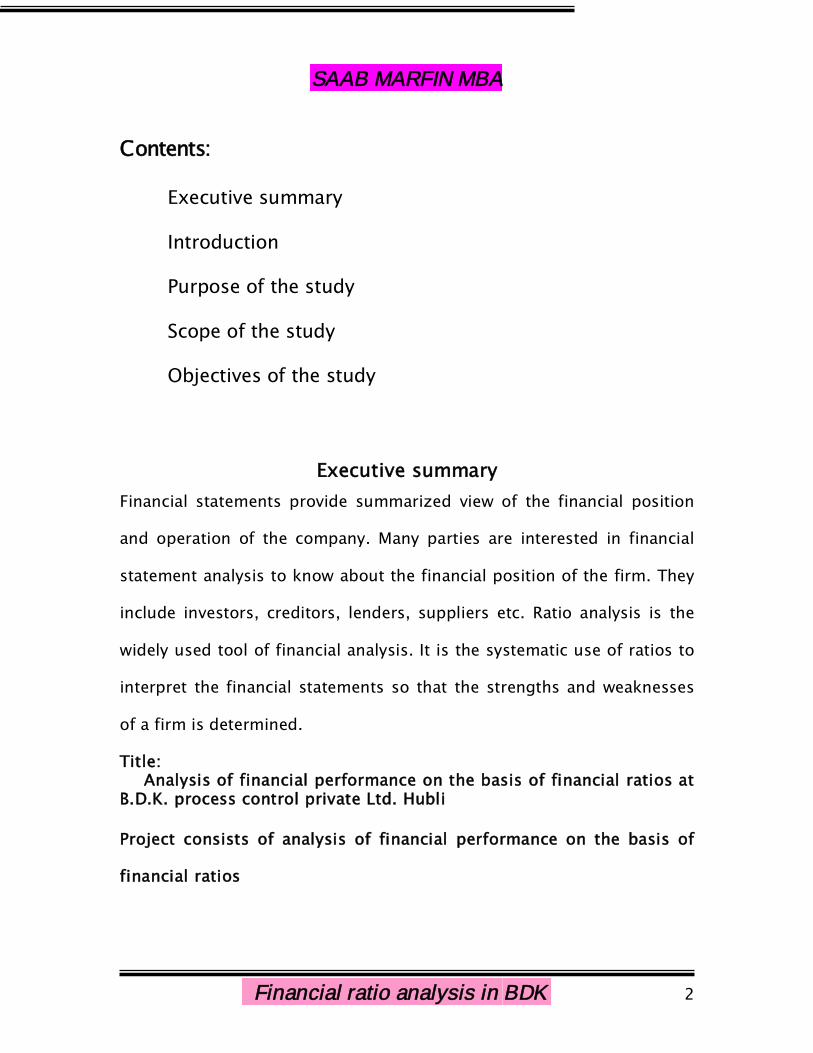
Contents:
Executive summary
Introduction
Purpose of the study
Scope of the study
Objectives of the study
Executive summaryFinancial statements provide summarized view of the financial position
and operation of the company. Many parties are interested in financial
statement analysis to know about the financial position of the firm. They
include investors, creditors, lenders, suppliers etc. Ratio analysis is the
widely used tool of financial analysis. It is the systematic use of ratios to
interpret the financial statements so that the strengths and weaknesses
of a firm is determined.
Title:Analysis of financial performance on the basis of financial ratios at
B.D.K. process control private Ltd. Hubli
Project consists of analysis of financial performance on the basis of
financial ratios

SAAB MARFIN MBA
Financial ratio analysis in BDK 3
The study will reveal the financial performance of the firm which enables
the management to know their financial strengths of the firm to make
their best use.
Study will also help to spot out financial weaknesses of the firm if
any and to take suitable corrective actions.
The other objectives of this study are also find out liquidity
position, profitability, efficiency of the B.D.K. Process Control Private Ltd.
For this purpose balance sheet of recent three years is taken and
analyzed with the help of various financial ratios.
Based on this analysis, observations, given personnel will betaking corrective actions to improve the performance.
OBJECTIVES OF THE STUDY
Main Objective is to study the different ratios used in B.D.K Process
Control Private Ltd.
To know the financial performance based on ratios.
To pinpoint the direction with which the organization is moving.
To know the financial position of the B.D.K. Process Control Private
Ltd.
To know the liquidity position of the B.D.K. Process Control Private
Ltd.

SAAB MARFIN MBA
Financial ratio analysis in BDK 4
To assess the long-term viability of the firm.
To know the efficiency in the management and utilisation of its
assets.
Findings:
The company is enjoying the profit during the period of study.
Liquidity position of the company is increasing.
The company is having more internal funds.
The debtor collection period is increasing.
The company is enjoying better credit period.
Suggestions:
The company has to reduce its investments in current assets.
The company has to maintain proper debt equity combination.
Company should improve its credit policy for the better
management of credit and to earn more profit.
ITRODUCTION
Ratio analysis:
Ratio analysis is a widely used tool of financial analysis. It is
defined as the systematic use of ratios to interpret the financial
statements so that the strengths and weaknesses of a firm as well as its

SAAB MARFIN MBA
Financial ratio analysis in BDK 5
historical performance and current financial can be determined. The
rationale of ratio analysis lies in fact that it makes related information
comparable. A single figure by itself has no meaning but when expressed
in terms of related figure, it yields significant inferences.
Meaning and definition
A Ratio is defined as “the indicated quotient of two mathematical
expressions” and “as the relationship between two or more things”.
In financial analysis, a ratio is used as benchmark for evaluating the
financial position and performance of a firm.
The term ratio refers to the numerical or quantitative relationship
between two items/variables.
This relationship can be expressed as:
1. Percentages
2. Fractions
3. Proportion of numbers
Basis for comparison
Comparison with related facts is, therefore, the basis of ratio analysis.
Four types of comparisons are involved
1. Trend analysis
SAAB MARFIN MBA
Financial ratio analysis in BDK 6
2. Inter-firm comparison
3. Comparison of items within a single year’s financial statement of
the firm
4. Comparison with standards or plans
Trends ratios involve a comparison of ratios of a firm over a time,
that is, present ratios are compared with past ratios for the same firm.
The inter-firm comparison involving comparison of ratios of firm
with those of others in the same line of business or for the industry as a
whole, reflects its performance in relation t its competitors.
Other types of comparison may relate to comparison of items
within a single year’ financial statement of a firm and comparison with
standards or plans.
Types of ratios (Purpose-Wise classification):
Ratios can be classified, for purposes of exposition, into three broad
groups
1. Profitability ratios.
2. Turnover (activity) ratios.
3. Financial ratios
1. Profitability Ratios
SAAB MARFIN MBA
Financial ratio analysis in BDK 7
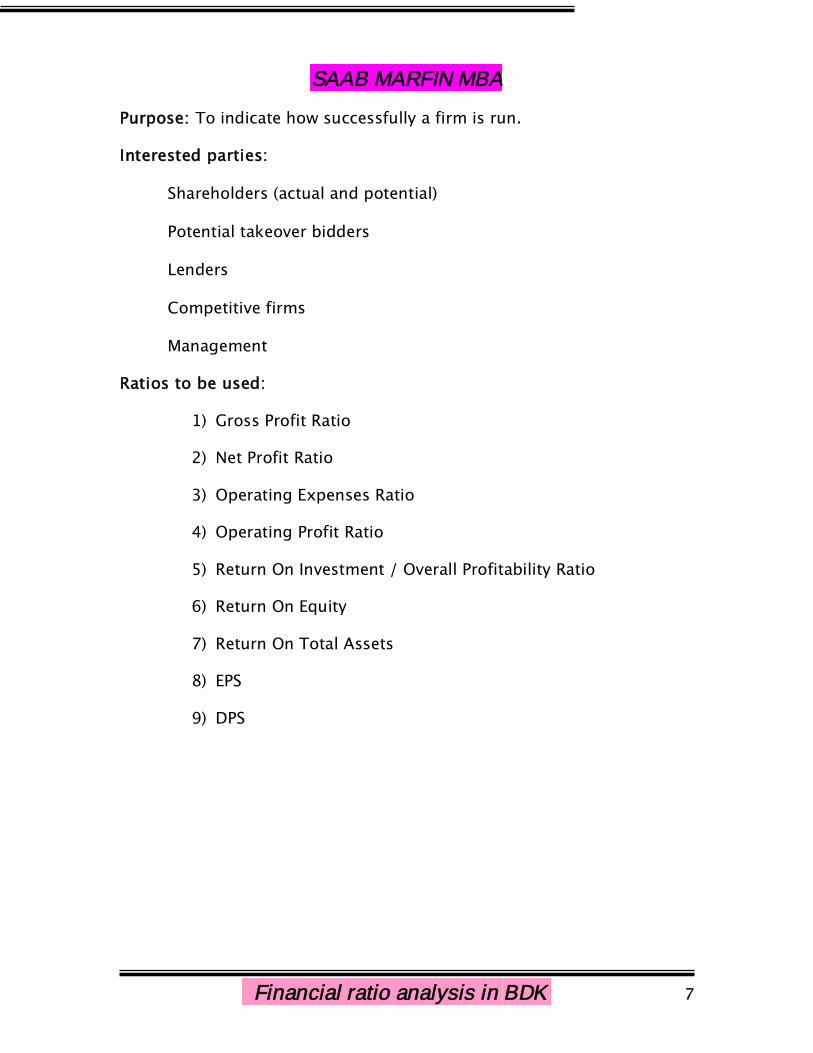
Purpose: To indicate how successfully a firm is run.
Interested parties:
Shareholders (actual and potential)
Potential takeover bidders
Lenders
Competitive firms
Management
Ratios to be used:
1) Gross Profit Ratio
2) Net Profit Ratio
3) Operating Expenses Ratio
4) Operating Profit Ratio
5) Return On Investment / Overall Profitability Ratio
6) Return On Equity
7) Return On Total Assets
8) EPS
9) DPS

SAAB MARFIN MBA
Financial ratio analysis in BDK 8
2.Turnover ratios
Purpose: To know the managerial efficiency, these ratios indicates
profitability, use of assets, capital structure analysis etc.
Interested parties:
Shareholders (actual and potential)
Potential takeover bidders
Management
Ratios to be used:
1. Inventory stock turnover Ratio
2. Debtors (Accounts Receivable) Turnover Ratios.
3. Creditors (Account Payable) Turnover Ratios
4. Fixed Assets turnover Ratio
5. Current Assets turnover Ratio
6. Working capital turnover Ratio
7. Total Assets turnover Ratio
8. Net Assets turnover Ratio
3. Financial Ratios
Purpose: These ratios indicate short term and long-term liquidity and
solvency of the firm. These ratios indicate the ability of the firm to survive
over a long period of time after meeting its commitment in the form of
interest and maturing debts.

SAAB MARFIN MBA
Financial ratio analysis in BDK 9
Interested parties:
Short-term & long-term creditors
Banks & Debenture holders
Shareholders
Management
Ratios to be used:
1) Financial Ratio:
Current Ratio
Quick / Acid test / Liquid Ratio.
Absolute liquid / Cash Ratio
2) Leverage Ratio:
Debt ratio
Debt equity Ratio
Proprietary Ratio
Interest coverage Ratio
IMPORTANCE AND LIMITATIONS OF RATIO ANALYSIS
IMPORTANCE
Liquidity Position: With the help of ratio analysis conclusions can be
drawn regarding the liquidity position of a firm. A firm can be said to
have the ability to meet its short-term liabilities if it has a sufficient liquid
funds to pay the interest on its short-maturing debt. This ability is
SAAB MARFIN MBA
Financial ratio analysis in BDK 10
reflected in the liquidity ratios of a firm. The liquidity ratios are
particularly useful in credit analysis by banks and other suppliers of
short-term loans.
Long-term Solvency: Ratio analysis is equally useful for assessing the
long-term financial viability of a firm. This aspect of the financial position
of a borrower is of concern to the long-term creditors, security analysis,
and the present and potential owners of the business. The long-term
solvency is measured by the leverage/capital structure and profitability
ratios, which focus on earning power and operating efficiency.
Operating Efficiency: Yet another dimension of the usefulness of ratio
analysis, relevant from the viewpoint of management, is that it throws
light on degree of efficiency in the management and utilization of its
assets. The various activity ratios measure this kind of operational
efficiency.
Overall profitability: The outside parties, which are interested in one
aspect of the financial position of a firm, the management is constantly
concerned about the overall profitability of the enterprise. That is, they
are concerned about the ability of the firm to meet its short-term as well
as long-term obligations to its creditors, to ensure a reasonable return to
its owners and secure optimum utilization of the assets of the firm.
Inter-firm Comparison: One of the popular techniques is to compare the
ratios of a firm with the industry average. It should be reasonably

SAAB MARFIN MBA
Financial ratio analysis in BDK 11
expected that the performance of a firm should be in broad conformity
with that of the industry to which it belongs. An inter-firm comparison
would demonstrate the relative position vis-à-vis its competitors.
Trend Analysis: It enables us to know whether the financial position of a
firm is improving or deteriorating over the years. This is made possible
by the use of trend analysis.
LIMITATIONS
If companies ignore the impact of inflation or price level changes in the
financial statements or if financial statements are based on historical
costs. Then it becomes limitation of ratio analysis. Another problem is it
depends on quality of financial statements. For example: if there is no
transparency / disclosure of real things in the statements it becomes
problem to analyst. But now days it doesn’t hold well. Because, every
company has to disclose it’s information according to accounting
standards, in the annual reports.
SAAB MARFIN MBA
Financial ratio analysis in BDK 12
Statement of the problem:
The company wants analysis of its financial performance and
compare its performance of past with the present performance with the
help of ratio analysis, in order to know the financial strengths of the firm
to make their best use and to be able to spot out financial weaknesses of
the firm.
Research problem:
To know the Financial Position of the company and its Liquidity
Performance through comparing three years financial performance by
applying different financial Ratios.
Purpose of the study:
The study will pinpoint the direction with which the organization is
moving.
The study will also help to know the operating performance of the
company.
The study will reveal the credit worthiness of an enterprise and
financial position of the firm.
SAAB MARFIN MBA
Financial ratio analysis in BDK 13
Scope of the study:
The scope of the study is conducted is only for organization level. It is
done through Balance Sheet of Company. For a period 2003-04, 2004-05,
2005-06
SAAB MARFIN MBA
Financial ratio analysis in BDK 14
Objectives of the study:
Main Objective is to study the different ratios used in B.D.K Process
Control Private Ltd.
To know the financial performance based on ratios.
To pinpoint the direction with which the organization is moving.
To know the financial position of the B.D.K. Process Control Private
Ltd.
To know the liquidity position of the B.D.K. Process Control Private
Ltd.
To assess the long-term viability of the firm.
To know the efficiency in the management and utilization of its
assets.

SAAB MARFIN MBA
Financial ratio analysis in BDK 15
Contents:
Organization Profile
Organization chart
Research design
Data collection methods
Measuring tools

SAAB MARFIN MBA
Financial ratio analysis in BDK 16
COMPANY PROFILEFORMATION OF THE COMPANY
Khimji’s first manufacturing plant, established in 1961, broke new
ground for providing a high-quality alternative to import of valves and
pumps, while assuring availability of spare parts and excellent services.
Keeping pace with industrial growth, the B.D.K Group founded in
1978 by Bharat B. Khimji, the (US $21 million Group has been building
on heritage of initiative and innovation at the service of industry,
offering- along with its ten associate companies, a wide spectrum of
Industrial valves and Industrial Process Pumps Designed for the needs of
chemical and Petrochemicals industries.
In the year 1980 it has merged into one company with name B.D.K
Group of companies, which has B.D.K Process control Pvt. Ltd. Company.
And in 1984 with name B.D.K Engineering Industries is commenced.
The company is located on 27 acres of land in Gokul road, Hubli.
B.D.K Process Control Pvt. Ltd. is manufacturing the products like
Diaphragm valves, Butterfly Valves, Plug valves, etc. B.D.K Engineering
Industries Ltd. is manufacturing products like Globe valves, Check valves,
Gate valves, Ball valves, etc.
The company is mainly catering industries like chemical process
industries, refineries, petrochemicals and fertilizer plants, oil corporation,

SAAB MARFIN MBA
Financial ratio analysis in BDK 17
thermal and nuclear power plants, pharmaceuticals, food and beverage
industries, water supply plant, mining industries, etc.
The company is selling its products in domestic as well as abroad market
through
B.D.K. Marketing Services Pvt. Ltd. All over India it has 10 branches
namely: Chennai, Mumbai, Culcutta, Delhi, Pune, Bangalore, Hydarabad,
Baroda, Luknow, Indore.
BOARD OF DIRECTORS
* Mr. Bharat Kimji.
(CEO & founder of B.D.K group of companies)
* Mr. Sachin Kimji
(Director Of Manufacturing)
* Mr. Binoy Khimji,
(Director - International Business.)
* Mr. K. Sundaram
(Corporate business)

SAAB MARFIN MBA
Financial ratio analysis in BDK 18
* Mr. M.B.Goudar
(Domestic sales)
* Mr. Srikant Kulkarni
(Head Exports)
ORGANIZATIONAL OBJECTIVES AND QULITY POLICY:
The name B.D.K is synonymous with quality. The objective of the
organization is well defined in the companies’ quality policy, which is as
under
Vision:
“To be the most admired company in the production of valves
industry.”
Mission:
“To design, to manufacture to market quality product at
competitive prices to the entire satisfaction of the customer and
market leadership.”
Quality policy:

SAAB MARFIN MBA
Financial ratio analysis in BDK 19
“The quality policy shall be to design to manufacture to market
quality products at competitive prices to the entire satisfaction of the
customer and to attain market leadership”
Organizational objectives:
To strive for excellence in quality of their products in national and
international market and to be recognized as leading players.
To develop necessary competence at al levels of operations and
improves the process, products and services to sustain quality
reputation.
To seek participation of employees at all levels of operation and to
form a motivated team where they treat each other with mutual
trust and respect.
To shoulder social responsibility by maintaining a safe, clean and
hygienic environment.
PRODUCTS OF B.D.K. GROUP OF COMPANIES
BDK Group from India manufactures and exports largest range of valves,
pumps and other chemical industry products for all process handling
needs
.

SAAB MARFIN MBA
Financial ratio analysis in BDK 20
Valves Others
Diaphragm PTEE lined pipe
Butterfly Actuators
Pfa lined Auto Filters
Gate
Globe
Check
Ball
Forged steel
Knife Edged Gate
Production capacity:
BDK has an annual production capacity of manufacturing
100,000 Diaphragm and Butterfly Valves;
10,000 Cast Steel Gate, Globe & Check Valves;
50,000 Plug Valves;
80,000 Ball Valves;
80,000 Forged Steel Gate, Globe & Check Valves;
SAAB MARFIN MBA
Financial ratio analysis in BDK 21
10,000 Special Purpose Valves
10,000 Custom-made Valves
5000 Process pumps.
BDK's speciality, along with a wide-ranging product line, is to
manufacture Special Valves in Exotic materials.
STRENGTH
At BDK, People are selected and developed as rigorously as components
in a complex piece of engineering - as in a way they are. Because it's
their individual performance that adds up to the superior functioning of
the entire organization and it's various activities (manufacturing, finance,
marketing, research / development and HRD). More than 800
well-qualified engineers, technicians and administrative personnel bring
their experience and skills to the requirements of the full developmental
life cycle. Continuous
updating ensures a spirit of constant learning at BDK, that skills and
knowledge are in tune with the time and more than equal to today's
demands.
NEW DEVELOPMENTS
SAAB MARFIN MBA
Financial ratio analysis in BDK 22
New Products
Innovation, Reinvention and Diversification are a continuous process at
BDK.
Be it a new product development or enhancement of older products, we
at BDK are constantly striving to give our customers maximum value for
their investment, widest product range and most complete solutions.
Over the last few years BDK has been introducing new products on a
regular basis, steam traps, strainers, air release valves and air filters to
name a few. We are on the constant look for innovative products that
complement the BDK Range. With our well-established network of sales
offices and leading industry clientele, we have been able to successfully
branch out and gain product acceptance for various ancillary products.
Travel Inn
From a traditional manufacturing company, BDK has diversified into the
Hotel Industry by introducing its first 36-room hotel on the outskirts of
HUBLI. Complete with open-air restaurant, bar, banquet facilities to
conference facilities Travel Inn provides the necessary amenities for both
the Business and Holiday traveler.
Pick 'N' Pay
The FMCG market is growing at an annual rate of 8% over the last 5 years
and it is estimated to keep growing over at the same pace for the next
decade. With a growing need for a one-stop shop convenience store, BDK
recently launched two of the largest super market stores in HUBLI. Under
SAAB MARFIN MBA
Financial ratio analysis in BDK 23
the brand name of PICK 'N' PAY, BDK has taken its first step in to FMCG
industry in India. The future plans are to franchise the PICK 'N' PAY brand
name to different parts of India and establish itself as a leader in the
super market industry.
Knownet
Multiple skills and competencies combine to realize technology-driven
business transformation. As organizations constantly strive to iterate
their business and IT strategies, Knownet’s well-honed capabilities and
methodologies for IT services complement our business consulting
services to define, optimize and align our clients' business strategy with
technology initiatives.
Knownet is one of the premier solution providers of India. Our business
interests vary into a wide gamut of activities ranging from Web Solutions,
ERP Solutions, E-business Applications, CRM solutions, and IT
Consultancy. Our portfolio of services has helped industry sectors like
Shipping, Entertainment, Pharma, Manufacturing Logistics and Financial
Institution.

SAAB MARFIN MBA
Financial ratio analysis in BDK 24
B.D.K. PROCESS CONTROL
PRIVATE LIMITED
B.D.K. process control Pvt. Ltd., commenced its business in 1980
it is the largest manufacturer of diaphragm, butterfly and plug valves in
the country and the market leaders. The company has grown steadily and
its actual production during the year 2004-2005 it was 84,247 units, and
it was raised to 92589 units during the year 2005-2006.
B.D.KPC has a documented quality system to meet the
requirements of ISO:9001/1994 to ensure that its orders processed,
products produced and services rendered meet the customer
requirements. The unit has already accelerated to ISO 9001/1994 quality
assurance standards by M/S. RWTUV.
Name : B.D.K.PC Pvt. Ltd.
Constitution : Pvt. Limited
Sales Head Quarters : Hubli
Registered office : Mumbai
Marketing Agents : B.D.K marketing services Pvt. Ltd.
Departments of B.D.K.PC Pvt. Ltd.:
B.D.K. Process Control Private Ltd. mainly has 7 departments. For
each department, duties, responsibilities and authorities are assigned
accordingly for the smooth running of all the activities.
SAAB MARFIN MBA
Financial ratio analysis in BDK 25
Different departments are listed below:
1. Time office
2. Sale Co-Ordination
3. Production Planning and Control
4. Design and Development
5. Materials and Stores
6. Accounts
7. Quality Assurance

SAAB MARFIN MBA
Financial ratio analysis in BDK 26
ORGANIZATION CHART
ORGANIZATION STRUCTURE
OF
ACCOUNTS DEPARTMENT
ExecutiveDirector
ASST.Finance Manager
Accounts Officer
AssistantAccountant
AssistantAccountant
Staff Staff Staff Staff
BDKGROUP OFCOMPANI
ES
BDKProcesscontrolPrivateLimited
BDKEngineering
IndustriesLimited
BDKMarketingServicesLimited
BDKSports
Foundation
BDKTravel InnAnd
Pick andPay
TimeOfficeDept.
QualityAssuranceDept.
Designand
DevelopmentDept.
MaterialDept.
AccountsDept.
Production PlanningAnd
ControlDept.
SalesCoordinati
onDept.

SAAB MARFIN MBA
Financial ratio analysis in BDK 27
DESIGHN OF THE STUDY
Title of the project:
“A study report on analysis of financial performance on the basis of
financial ratio at B.D.K. Process Control Private Ltd.”
Statement of the problem:
The company wants analysis of its financial performance and
compare its performance of past with the present performance with the
help of ratio analysis, in order to know the financial strengths of the firm
to make their best use and to be able to spot out financial weaknesses of
the firm.
Research problem:
To know the Financial Position of the company and its Liquidity
Performance through comparing three years financial performance by
applying different financial Ratios.

SAAB MARFIN MBA
Financial ratio analysis in BDK 28
Purpose of the study:
The study will pinpoint the direction with which the organization is
moving.
The study will also help to know the operating performance of the
company.
The study will reveal the credit worthiness of an enterprise and
financial position of the firm.
Objectives of the study:
Main Objective is to study the different ratios used in B.D.K Process
Control Private Ltd.
To know the financial performance based on ratios.
To pinpoint the direction with which the organization is moving.
To know the financial position of the B.D.K. Process Control Private
Ltd.
To know the liquidity position of the B.D.K. Process Control Private
Ltd.
To assess the long-term viability of the firm.
To know the efficiency in the management and utilization of its
assets.
Scope of the study:

SAAB MARFIN MBA
Financial ratio analysis in BDK 29
The scope of the study is conducted is only for organization level. It is
done through Balance Sheet of Company. For a period 2003-04, 2004-05,
2005-06.
Data collection method:
The information necessary for this survey is collected by tapping primary
& secondary source:
Primary sources: - Personal interviews with the officials of BDKPC Ltd.
Secondary sources: - 1) Annual reports of the BDKPC Ltd.
2) Related information from Internet.
3) Books and Publications.
Measuring tool:
Accounting Ratios.
Financial Statements of the Company
Limitations of the study:
SAAB MARFIN MBA
Financial ratio analysis in BDK 30
Researcher has taken only 3 years data of base for the analysis.
Since, time is shorter in nature, it lacks in complete evaluation of
the firm.
The study is largely depending on secondary data, like Profit and
Loss account, and Balance Sheet of the B.D.K. Process Control
Private Ltd. For the related years.

SAAB MARFIN MBA
Financial ratio analysis in BDK 31
Contents:
Result &discussion with Charts & graphs
Suggestions
Conclusion
SAAB MARFIN MBA
Financial ratio analysis in BDK 32
ANALYSIS
OF
PROFITABILITY RATIOS
OF THE
COMPANY
SAAB MARFIN MBA
Financial ratio analysis in BDK 33
1.Profitability Ratios:
Apart from the creditors, short-term and long-term, also
interested in the financial soundness of a firm are the owners and
management of the company itself. The management of the firm usually
eager to measure its operating efficiency. Similarly, the owners invest
their funds in the expectation of reasonable return. The operating
efficiency of a firm and its ability to ensure adequate return to its
shareholders depends ultimately on the profits earned by it. The
profitability of a firm can be measured by its profitability ratios.
Profitability ratios are:
1) Gross Profit Ratio
2) Net Profit Ratio
3) Operating Expenses Ratio
4) Operating Profit Ratio
5) Return On Investment / Overall Profitability Ratio
6) Return On Equity
7) Return On Total Assets
8) EPS
9) DPS
SAAB MARFIN MBA
Financial ratio analysis in BDK 34
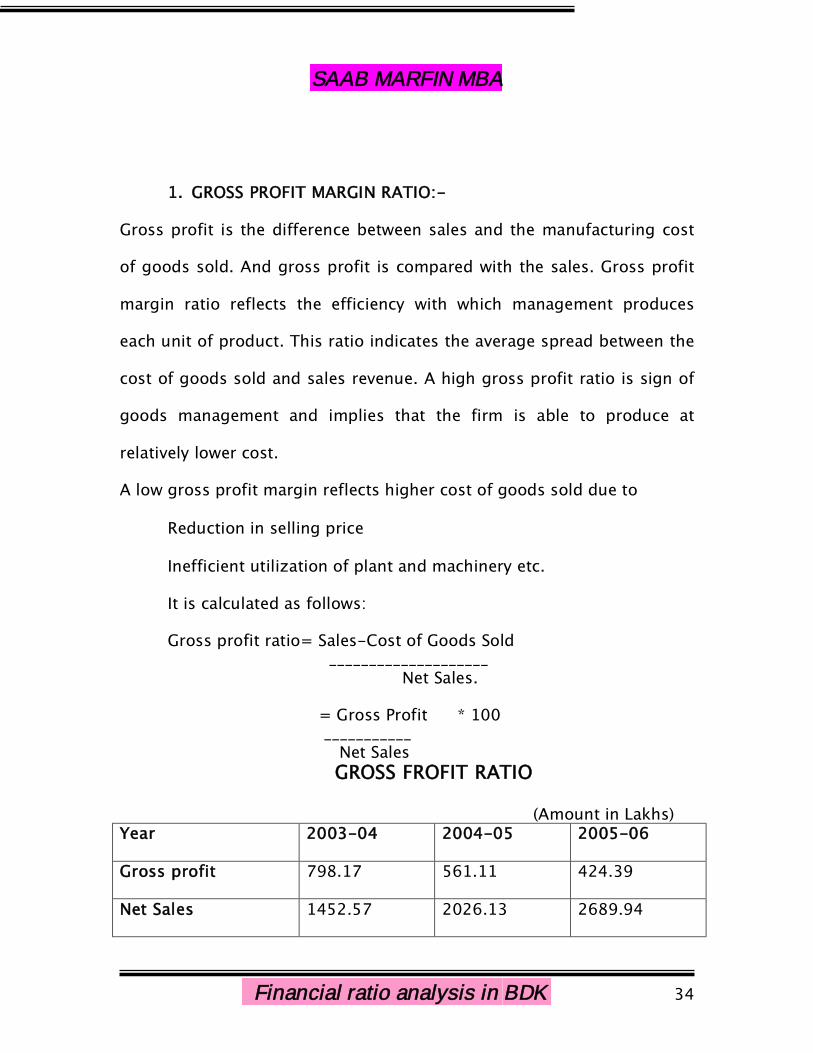
1. GROSS PROFIT MARGIN RATIO:-
Gross profit is the difference between sales and the manufacturing cost
of goods sold. And gross profit is compared with the sales. Gross profit
margin ratio reflects the efficiency with which management produces
each unit of product. This ratio indicates the average spread between the
cost of goods sold and sales revenue. A high gross profit ratio is sign of
goods management and implies that the firm is able to produce at
relatively lower cost.
A low gross profit margin reflects higher cost of goods sold due to
Reduction in selling price
Inefficient utilization of plant and machinery etc.
It is calculated as follows:
Gross profit ratio= Sales-Cost of Goods Sold____________________
Net Sales.
= Gross Profit * 100___________Net SalesGROSS FROFIT RATIO
(Amount in Lakhs)Year 2003-04 2004-05 2005-06
Gross profit 798.17 561.11 424.39
Net Sales 1452.57 2026.13 2689.94
SAAB MARFIN MBA
Financial ratio analysis in BDK 35
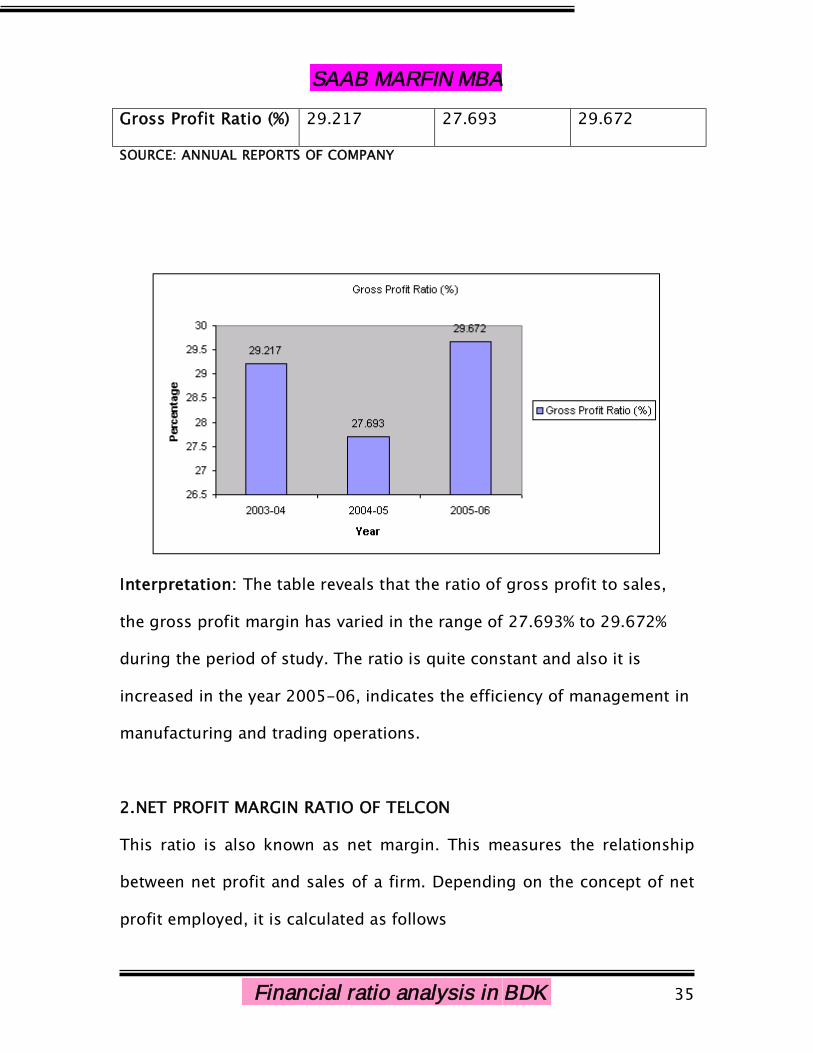
Gross Profit Ratio (%) 29.217 27.693 29.672
SOURCE: ANNUAL REPORTS OF COMPANY
Interpretation: The table reveals that the ratio of gross profit to sales,
the gross profit margin has varied in the range of 27.693% to 29.672%
during the period of study. The ratio is quite constant and also it is
increased in the year 2005-06, indicates the efficiency of management in
manufacturing and trading operations.
2.NET PROFIT MARGIN RATIO OF TELCON
This ratio is also known as net margin. This measures the relationship
between net profit and sales of a firm. Depending on the concept of net
profit employed, it is calculated as follows
SAAB MARFIN MBA
Financial ratio analysis in BDK 36
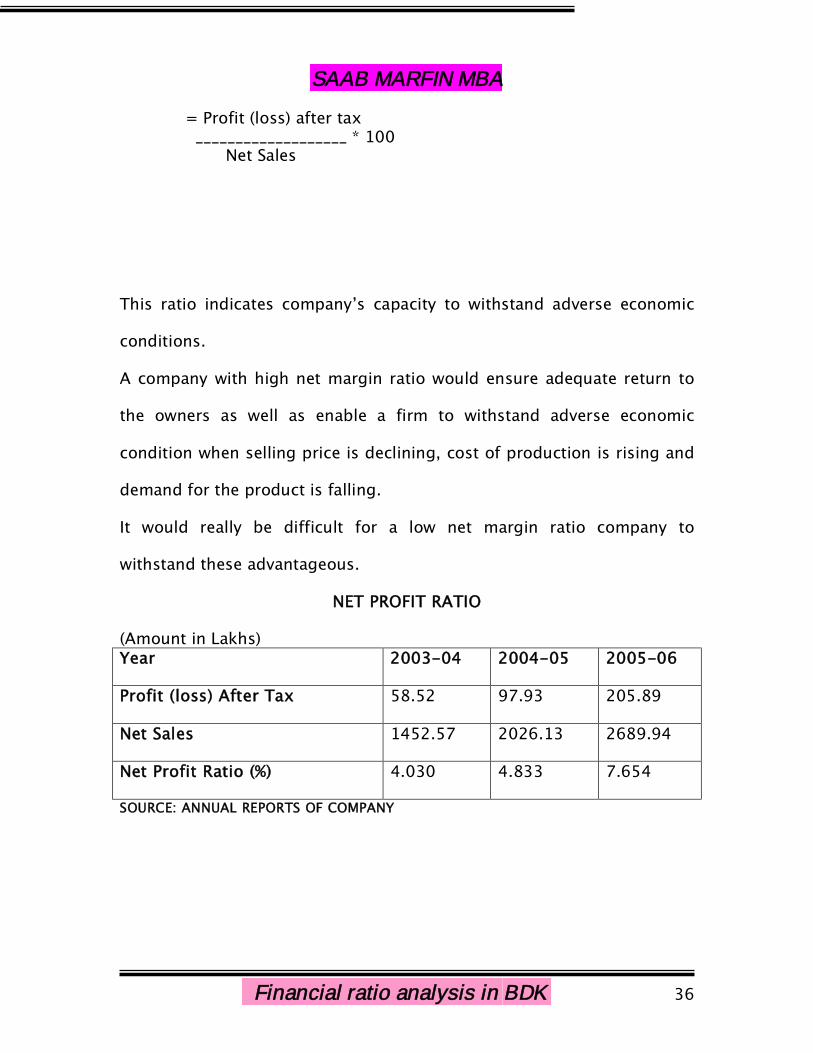
= Profit (loss) after tax___________________ * 100
Net Sales
This ratio indicates company’s capacity to withstand adverse economic
conditions.
A company with high net margin ratio would ensure adequate return to
the owners as well as enable a firm to withstand adverse economic
condition when selling price is declining, cost of production is rising and
demand for the product is falling.
It would really be difficult for a low net margin ratio company to
withstand these advantageous.
NET PROFIT RATIO
(Amount in Lakhs)Year 2003-04 2004-05 2005-06
Profit (loss) After Tax 58.52 97.93 205.89
Net Sales 1452.57 2026.13 2689.94
Net Profit Ratio (%) 4.030 4.833 7.654
SOURCE: ANNUAL REPORTS OF COMPANY
SAAB MARFIN MBA
Financial ratio analysis in BDK 37
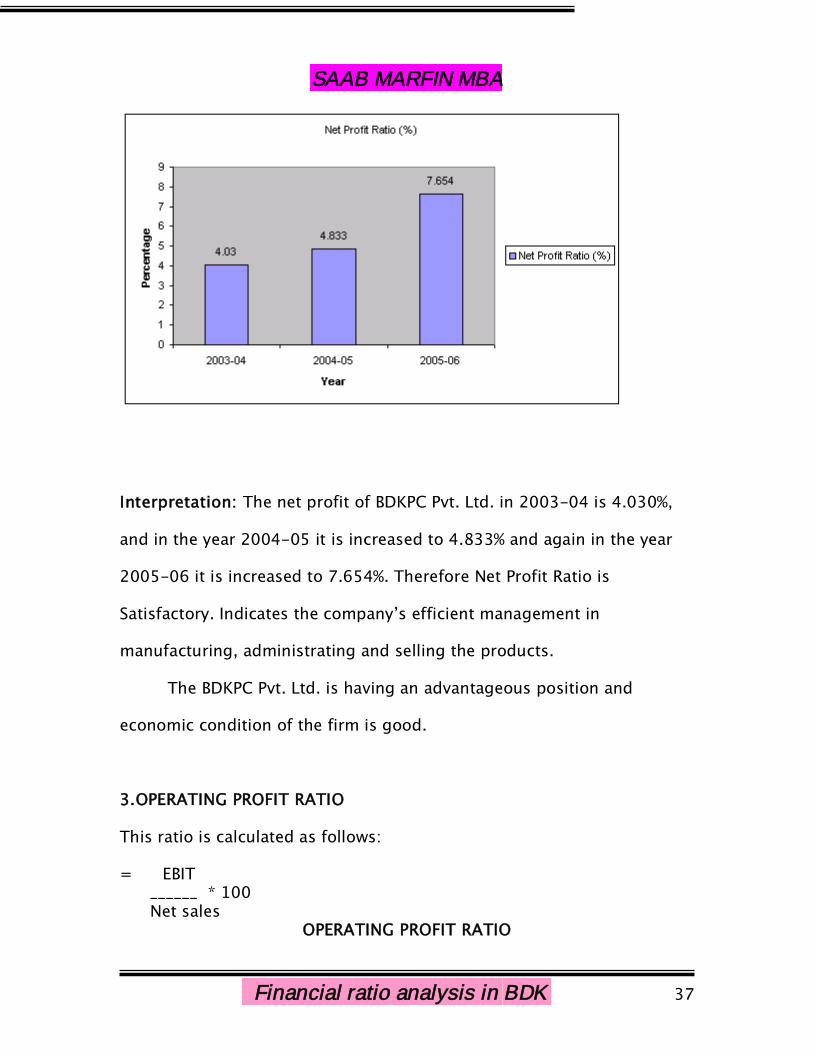
Interpretation: The net profit of BDKPC Pvt. Ltd. in 2003-04 is 4.030%,
and in the year 2004-05 it is increased to 4.833% and again in the year
2005-06 it is increased to 7.654%. Therefore Net Profit Ratio is
Satisfactory. Indicates the company’s efficient management in
manufacturing, administrating and selling the products.
The BDKPC Pvt. Ltd. is having an advantageous position and
economic condition of the firm is good.
3.OPERATING PROFIT RATIO
This ratio is calculated as follows:
= EBIT______ * 100Net sales
OPERATING PROFIT RATIO
SAAB MARFIN MBA
Financial ratio analysis in BDK 38
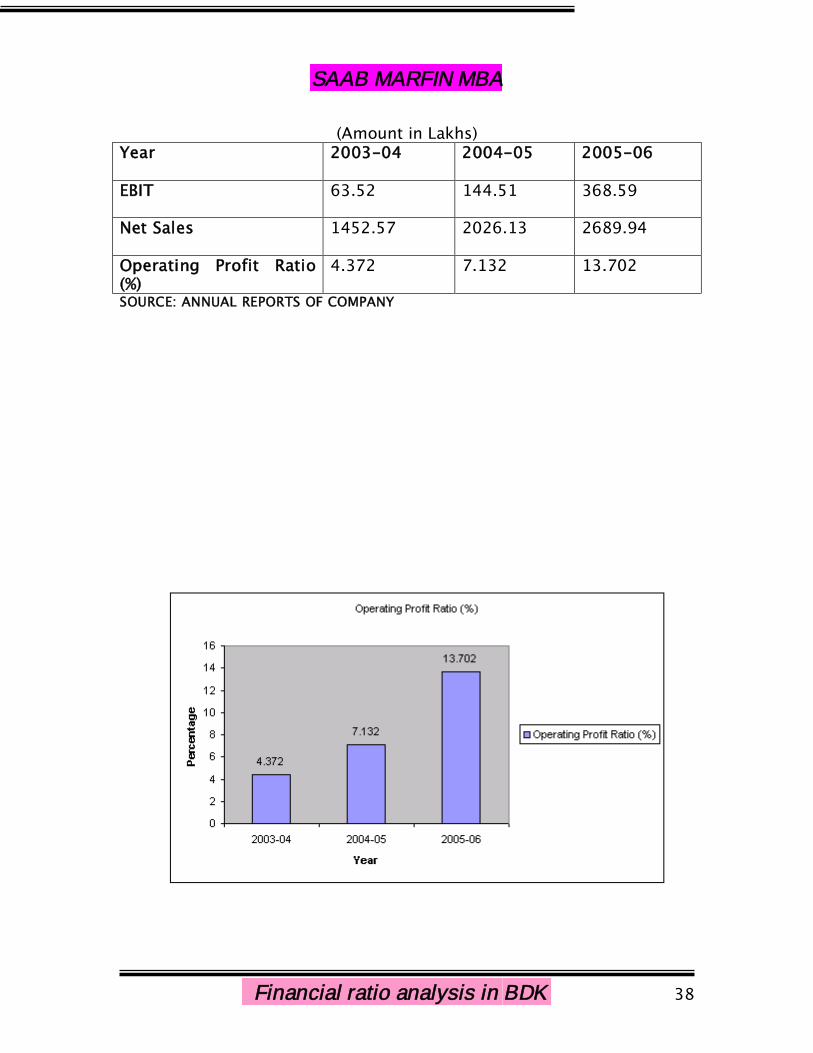
(Amount in Lakhs)Year 2003-04 2004-05 2005-06
EBIT 63.52 144.51 368.59
Net Sales 1452.57 2026.13 2689.94
Operating Profit Ratio(%)
4.372 7.132 13.702
SOURCE: ANNUAL REPORTS OF COMPANY

SAAB MARFIN MBA
Financial ratio analysis in BDK 39
Interpretation: This ratio of Operating Profit in BDKPC Pvt. Ltd., in the
year 2003-04 is 4.372% and it is increased in the year 2004-05 to
7.132% and further it is increased to 13.702% in the year 2005-06. The
ratio is increased for all the three subsequent years. This ratio indicates
the company’s operating performance is good in all the three years.
4. RETURN ON INVESTMENT (ROI):
It is also called as overall profitability ratio or Return on capital employed
(ROCE) Ratio. This ratio is the broadest measure of the overall
performance of business firm. It indicates the percentage of return on the
total capital employed in the business. The higher ratio, the more
efficient use of the capital employed. It is calculated on the bases of the
following:
ROI = Operating Profit OR PBIT_______________ * 100 ________________ * 100Capital employed Capital employed
RETURN ON INVESTMENT RATIO
(Amount in Lakhs)Year 2003-04 2004-05 2005-06
PBIT 63.52 144.51 368.59
Capital Employed 689.46 787.40 1185.00
Return On Investment Ratio 9.213 18.352 31.10
SAAB MARFIN MBA
Financial ratio analysis in BDK 40
(%)
SOURCE: ANNUAL REPORTS OF COMPANY
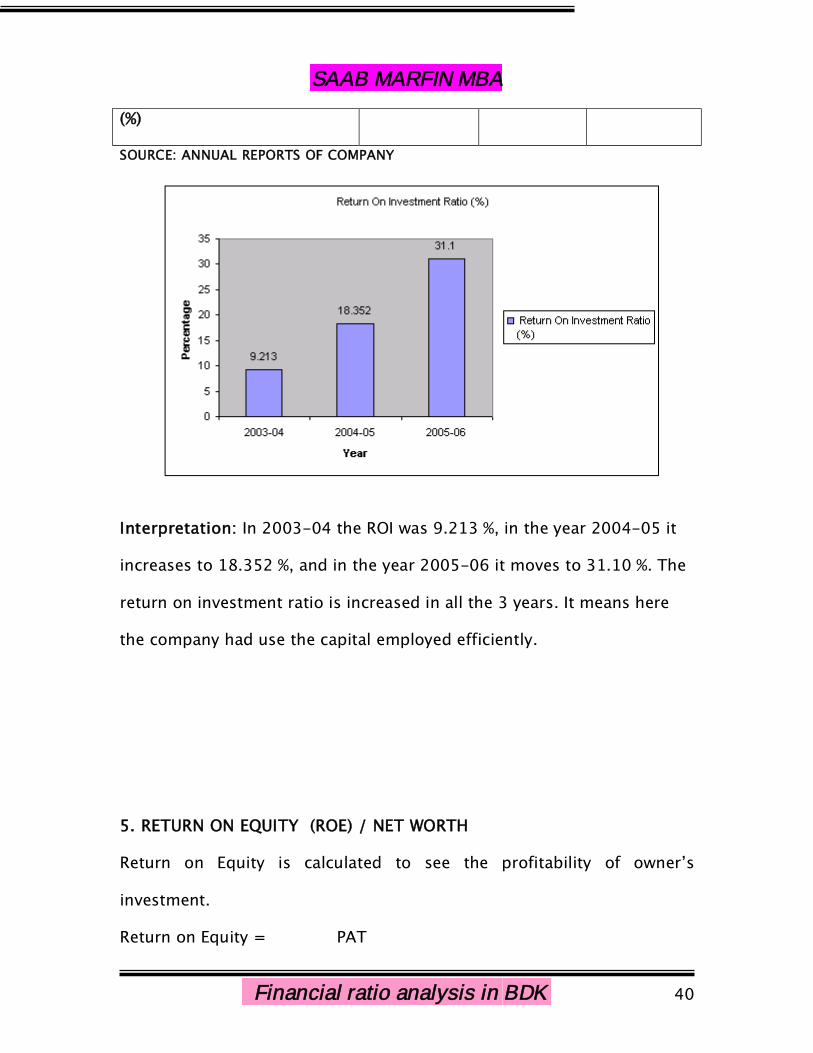
Interpretation: In 2003-04 the ROI was 9.213 %, in the year 2004-05 it
increases to 18.352 %, and in the year 2005-06 it moves to 31.10 %. The
return on investment ratio is increased in all the 3 years. It means here
the company had use the capital employed efficiently.
5. RETURN ON EQUITY (ROE) / NET WORTH
Return on Equity is calculated to see the profitability of owner’s
investment.
Return on Equity = PAT

SAAB MARFIN MBA
Financial ratio analysis in BDK 41
____________________________ * 100Shareholder’s Equity or Net worth
Return on Equity indicates how well the firm has used the resources of
owners. This ratio reflects the extent to which this objective has been
accomplished. This ratio is of great interest to the present as well as the
prospective shareholders and also of great concern to management,
which has the responsibility of maximizing the owner’s welfare.
RETURN ON EQUITY
(Amount in Lakhs)Year 2003-04 2004-05 2005-06
PAT 58.52 97.93 205.89
Net Worth 441.75 539.69 745.51
Return On Equity Ratio
(%)
13.247 18.145 27.617
SOURCE: ANNUAL REPORTS OF COMPANY

SAAB MARFIN MBA
Financial ratio analysis in BDK 42
Interpretation: In 2003-04 the return on investment was 13.247%. It
increases to 18.145% in the year 2004-05. And it further increases to
27.617%. It indicates that management has used the resources of owners
very effectively. Therefore in the year 2005-06 company incurred profit.
The ratio is high. In addition, there is substantial increase in all the 3
years.
6. RETURN ON TOTAL ASSETS (ROTA)
This ratio is compared to know the ‘Productivity of the total assets’.
There are two methods of computing Return on Total Assets
1. ROTA= PAT___________ * 100Total Assets
2. ROTA= PAT + Interest_______________ * 100Total Assets
SAAB MARFIN MBA
Financial ratio analysis in BDK 43
RETURN ON TOTAL ASSETS
(Amount in Lakhs)
Year 2003-04 2004-05 2005-06
PAT 58.52 97.93 205.89
Total Assets 1146.84 1174.41 1649.72
Return On Total Assets Ratio
(%)
5.102 8.338 12.480
SOURCE: ANNUAL REPORTS OF COMPANY
Interpretation: In 2003-04 the return on assets was 5.102 %. It increases
to 8.338 % in the year 2004-05. And it further increases to 12.480 %. It
indicates that management has used assets very effectively. Therefore in
SAAB MARFIN MBA
Financial ratio analysis in BDK 44
the year 2005-06 company incurred profit. The ratio is high. In addition,
there is substantial increase in all the 3 years.
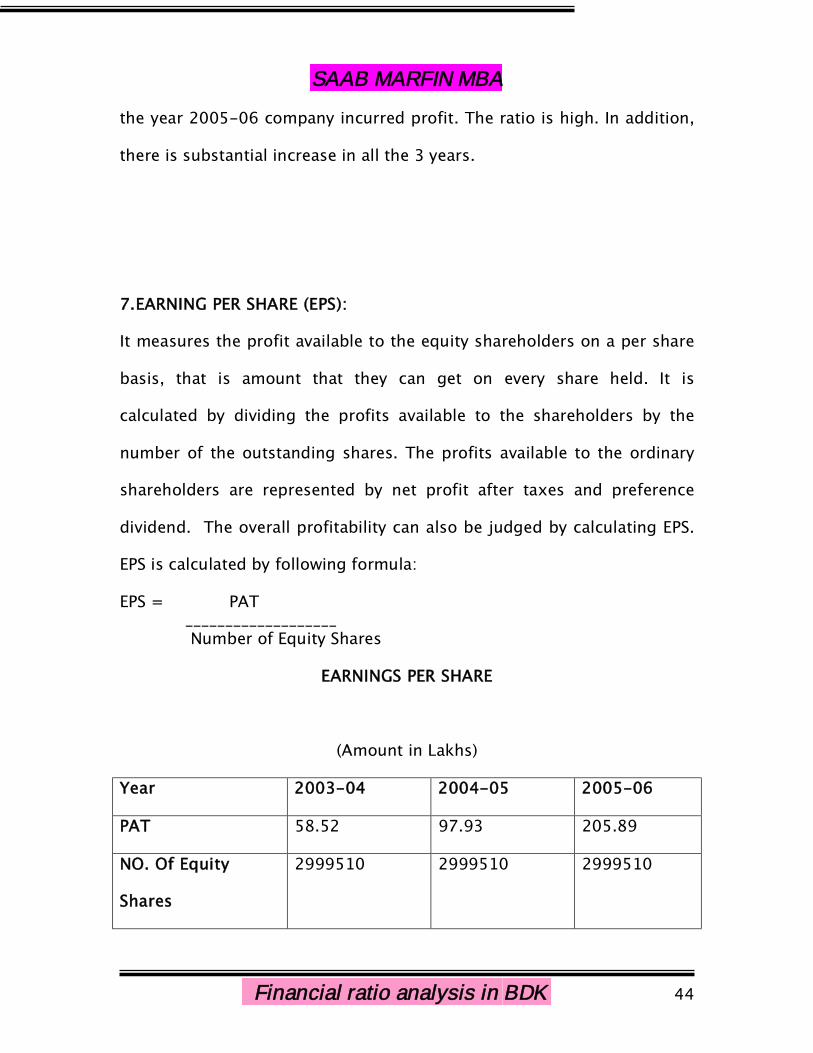
7.EARNING PER SHARE (EPS):
It measures the profit available to the equity shareholders on a per share
basis, that is amount that they can get on every share held. It is
calculated by dividing the profits available to the shareholders by the
number of the outstanding shares. The profits available to the ordinary
shareholders are represented by net profit after taxes and preference
dividend. The overall profitability can also be judged by calculating EPS.
EPS is calculated by following formula:
EPS = PAT___________________Number of Equity Shares
EARNINGS PER SHARE
(Amount in Lakhs)
Year 2003-04 2004-05 2005-06
PAT 58.52 97.93 205.89
NO. Of Equity
Shares
2999510 2999510 2999510

SAAB MARFIN MBA
Financial ratio analysis in BDK 45
Ratio 1.951 3.265 6.865
SOURCE: ANNUAL REPORTS OF COMPANY
Interpretation: EPS of Company in 2003-04 is Rs. 1.951, which increases
to Rs. 3.265 in the year 2004-05. And further it increases to Rs. 6.865 in
the year 2005-06 due to increase in profit, EPS is increased.
NOTES:
Net sales= Gross Sales –Excise
SAAB MARFIN MBA
Financial ratio analysis in BDK 46
COGS= (Op. stock +Purchases of products +Consumption of
Raw materials & components + consumption of stores spares,
tools + freight, transportation, port charges + Power and
fuel. ) – Closing Stock..
Gross Profit= Net Sales – COGS
Total Assets= Fixed Assets + Current Assets.
Net Worth= Capital + Reserves and surplus.
COGS= Cost Of Goods Sold
ANALYSIS
OF
TURNOVER RATIOS
OF THE
SAAB MARFIN MBA
Financial ratio analysis in BDK 47
COMPANY
TURNOVER / ACTIVITY RATIOS OF THE COMPANY
Introduction:
Activity ratios are employed to evaluate the efficiently with which the firm
manages and utilizes its assets. These ratios are also called as turnover
ratio. Therefore they indicate the speed with which assets are being
converted / turned over in to sales.
Thus an activity ratio involves relationship between sales and assets. A
proper balance between sales and assets generally reflects that assets are
managed well.
In other words, turnover ratio indicates the efficiency with which the
capital employed is rotated in the business.
Higher the ratio of rotation, the greater will be the profitability

SAAB MARFIN MBA
Financial ratio analysis in BDK 48
DIFFERENT TURNOVER RATIOS:
1) Inventory stock turnover Ratio
2) Debtors (Accounts Receivable) Turnover Ratios.
3) Creditors (Account Payable) Turnover Ratios.
4) Fixed Assets turnover Ratio
5) Current Assets turnover Ratio
1. INVENTORY / STOCK TURNOVER RATIO (ITR/STR).
It indicates the efficiency of firm in producing and selling its products.
High Ratio is good from the view point of liquidity and vice versa.
A low ratio would signify that inventory does not sell fast and stably in
the warehouse for a longtime.
It is calculated as follows:
Cost of Goods Sold OR Sales (If there is noopening stock)________________ __________Avg. Inventory Closing Stock
Hence Avg. Inventory = Opening Stock + Closing Stock____________________________
2
Avg. Inventory is calculated by taking stock levels of raw materials,
working process and finished goods at the beginning of year & at the end
of the year & that is divided by two
INVENTORY TURNOVER RATIO

SAAB MARFIN MBA
Financial ratio analysis in BDK 49
(Amount in Lakhs)
Year 2003-2004 2004-2005 2005-2006
COGS 1028.18 1465.02 1891.77
Average Inventory 282.01 237.09 224.34
Inventory Turnover Ratio 3.645 6.179 8.432
SOURCE: ANNUAL REPORTS OF COMPANY

SAAB MARFIN MBA
Financial ratio analysis in BDK 50
INVENTORY CONVERSION RATIO
Year 2003-04 2004-2005 2005-2006
No. of days in year 365 365 365
ITR 3.645 6.179 8.432
Days 100.137 59.071 43.284
SOURCE: ANNUAL REPORTS OF COMPANY
Interpretation:
The STR/ ITR are high in all three years. And Stock conversion is very fast
because company takes 101 days in 2003-04. It decreases in 2004-05 to
60 days. And in 2005-06 it is 44 days. It indicates that conversion ratio is
very fast. And the company’s utilization of inventories in generating sales
is good.
2. DEBTORS TURNOVER RATIO:
Debtors constitute an important constituent of current assets and
therefore the quality of debtors to great extent determines that firm’s
liquidity. There are two ratios. They are:
1) Debtors turnover Ratio
2) Debtors collection period Ratio
SAAB MARFIN MBA
Financial ratio analysis in BDK 51
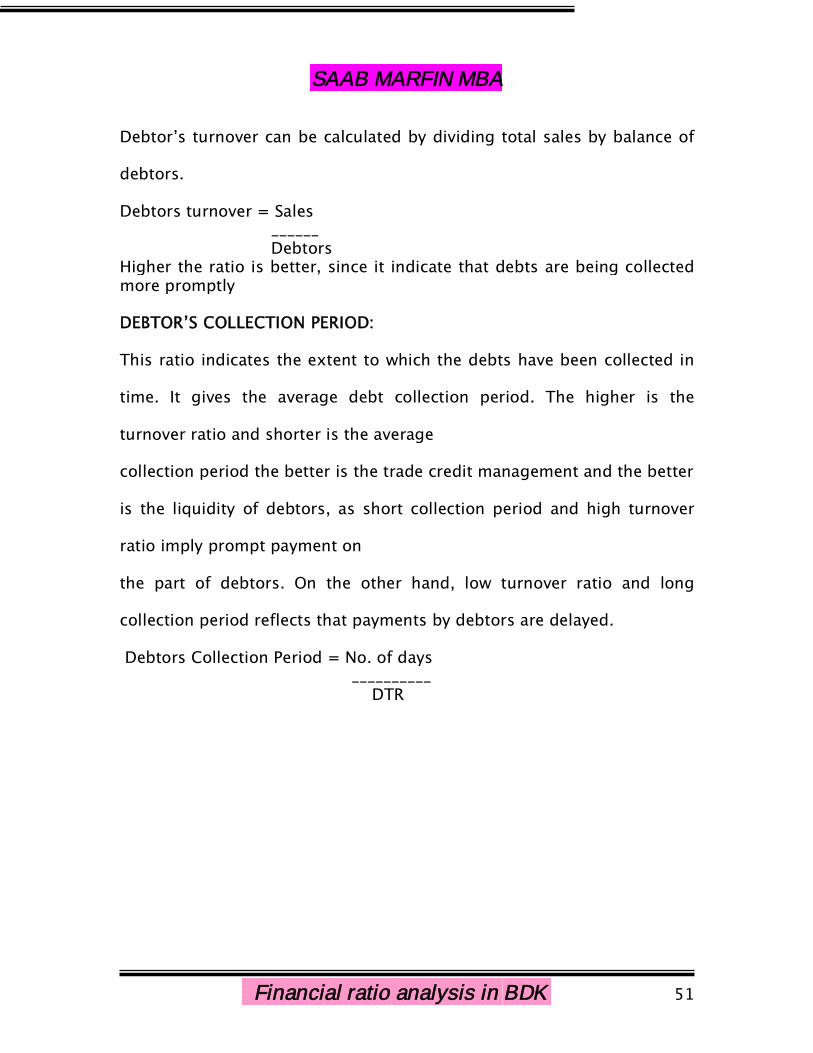
Debtor’s turnover can be calculated by dividing total sales by balance of
debtors.
Debtors turnover = Sales______Debtors
Higher the ratio is better, since it indicate that debts are being collectedmore promptly
DEBTOR’S COLLECTION PERIOD:
This ratio indicates the extent to which the debts have been collected in
time. It gives the average debt collection period. The higher is the
turnover ratio and shorter is the average
collection period the better is the trade credit management and the better
is the liquidity of debtors, as short collection period and high turnover
ratio imply prompt payment on
the part of debtors. On the other hand, low turnover ratio and long
collection period reflects that payments by debtors are delayed.
Debtors Collection Period = No. of days__________DTR

SAAB MARFIN MBA
Financial ratio analysis in BDK 52
DEBTOR’S TURNOVER RATIO
(Amount in Lakhs)
Year 2003-04 2004-2005 2005-2006
Net Sales 1452.57 2026.13 2689.94
Debtor’s 291.98 262.39 515.56
Debtors Turnover Ratio 4.974 7.721 5.2175
Debtors collection Period
(Days)
73.38 47.26 70.79
SOURCE: ANNUAL REPORTS OF COMPANY
Interpretation: The ratio is fluctuating between the range of 4.974 to
7.721. In the year 2003-04 ratio is 4.974 times which is increased to
7.721 times in the year 2004-05. But in the year 2005-06 ratio is
decreased to 5.2175. And hence the debtor’s collection period is 74 days

SAAB MARFIN MBA
Financial ratio analysis in BDK 53
in 2003-04, and decreased to 47 days. But in the year 2005-06 it again
increased to 71 days although it is satisfactory as compared to the
company’s credit policy.
3) CREDITOR’S TURNOVER RATIO:
It indicates the speed with which the payment for credit purchases is
made to creditors. This ratio is calculated as follows:
=Credit Purchases______________
Avg. creditor
It details regarding credit purchases, opening and closing A/c payable
have not been given, and the ratio may be calculated as follows:
= Total purchase_____________Creditors
CREDITORS TURNOVR RATIO
(Amount in Lakhs)
Year 2003-04 2004-05 2005-06
Total Purchases 956.61 1364.27 1808.25
Creditors 291.98 262.39 515.56
Creditors Turnover Ratio 3.276 5.199 3.507
Days 111.416 70.205 104.077
SOURCE: ANNUAL REPORTS OF COMPANY

SAAB MARFIN MBA
Financial ratio analysis in BDK 54
Interpretation: Credit paid after 112 days in the year 2003-04, which is
decreased to 71 days in the year 2004-05, again in the year 2005-06 it is
increased to 105 days. Which indicating they are enjoyed more credit
period in 2003-04 and 2005-06 as compared to the year 2004-05.
4) FIXED ASSETS TURNOVER RATIO
This ratio indicates the extent to which the investments in fixed assets
contributed towards sales. If compared with a previous period, it
indicates whether the investment in fixed assets has been judicious / not.

SAAB MARFIN MBA
Financial ratio analysis in BDK 55
The ratio is calculated as follows:
= Cost of Goods Sold_________________Net Fixed Assets
FIXED ASSETS TURNOVER RATIO
(Amounts in Lakhs)
Year 2003-04 2004-05 2005-06
COGS 1028.18 1465.02 1891.77
Fixed Assets 375.02 370.51 414.18
Fixed Assets Turnover Ratio 2.741 3.954 4.567
SOURCE: ANNUAL REPORTS OF COMPANY

SAAB MARFIN MBA
Financial ratio analysis in BDK 56
Interpretation: In all the three years the fixed assets turnover ratio is
increased. Which indicates that fixed assets are properly utilized i.e. there
is a better efficiency in utilization of fixed assets.
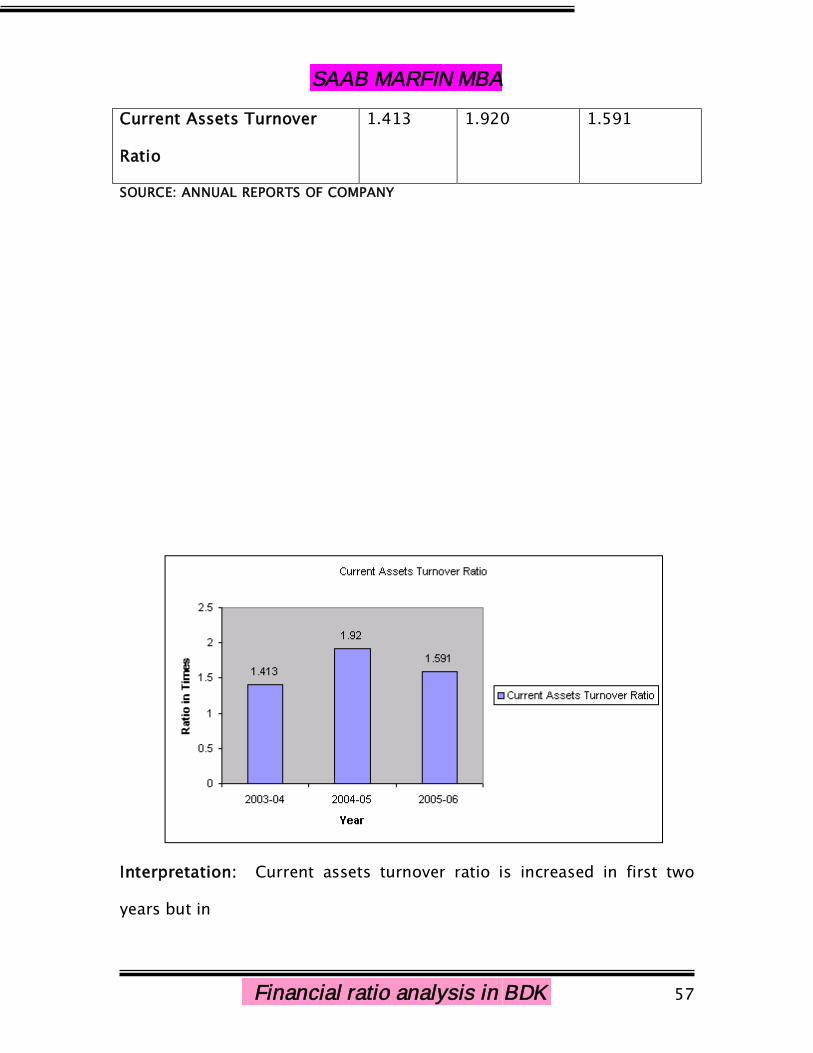
5) CURRENT ASSETS TURNOVER RATIO:
This ratio indicates the extent to which the investment in current assets
contributed towards sales. If the ratio is compared with a previous period,
it indicates whether the investment ion current assets has been judicious
or nor. The ratio is calculated by dividing the cost of goods sold to Avg.
current assets. The ratio is calculated as follows:
= Cost of Goods Sold__________________Current Assets
CURRENT ASSETS TURNOVER RATIO
(Amounts in Lakhs)
Year 2003-04 2004-05 2005-06
COGS 1028.18 1465.02 1891.77
Current Assets 727.32 762.73 1188.67
SAAB MARFIN MBA
Financial ratio analysis in BDK 57
Current Assets Turnover
Ratio
1.413 1.920 1.591
SOURCE: ANNUAL REPORTS OF COMPANY
Interpretation: Current assets turnover ratio is increased in first two
years but in
SAAB MARFIN MBA
Financial ratio analysis in BDK 58
2005-06 there is a slight decrease in the ratio due to the increase of
current assets. But it is more than one in all cases. It indicates that the
current assets are promptly invested towards making sales.
ANALYSIS
OF
SAAB MARFIN MBA
Financial ratio analysis in BDK 59
FINANCIAL RATIOS
OF THE
COMPANY
FINANCIAL RATIOS OF THE COMPANYIntroduction:
Financial ratios indicate about the financial position of the company. A
company is deemed to be financially sound, if it is in position to carry on
its business smoothly and meet all its obligations both long- term as well
as short- term without strain. Thus, company financial position has to be
judged from two angles long- term as well as short- term.
3) Financial Ratio:
SAAB MARFIN MBA
Financial ratio analysis in BDK 60
Current Ratio
Quick / Acid test / Liquid Ratio.
Absolute liquid / Cash Ratio
4) Leverage Ratio :
Debt ratio
Debt equity Ratio
Proprietary Ratio
LIQUIDITY RATIOLiquidity ratios may be defined as financial ratio, which thorough tight on
short term slovenly of firm.
Liquidity Ratio measures the ability of the firm to meet its current
obligations. Liquidity ratio needs establishing a relationship between cash
and other current assets to current obligations to provide quick measures
of liquidity. A firm should ensure that it doesn’t
suffer from lack of liquidity and also that it does not have excess liquidity.
Failure of a company to meet its obligations due to lack of sufficient
liquidity, will result in a poor creditworthiness, loss of creditor’s
confidence.
Liquidity is perquisite for the survival of firm. The short-term creditors of
firm are interested in short-term solvency / liquidity of firm. But liquidity
SAAB MARFIN MBA
Financial ratio analysis in BDK 61
implies from the viewpoint utilization of funds of the firm, that funds are
idle or they even very little.
So liquidity ratio measure ability of a firm to meet its short- term
obligations and reflect short- term financial strength / solvency of firm.
1) CURRENT RATIO:
This ratio is an indicator of firm’s commitment to meet its short- term
liabilities. Higher ratio, better the coverage, 2:1 ratio is treat as standard
ratio. This ratio is also called as solvency / working capital ratio.
The current ratio is the ratio of the current assets and current liabilities. It
is calculated by dividing current assets by current liabilities.
Current Ratio= Current assets
Current liabilities
The current ratio is a measure of short- term solvency of the company. It
indicates the rupee of current assets available for each rupee of current
liability. The higher the current ratio the larger the amount of rupees
available per rupee of current liability and the greater the safety of the
short- term creditors. This margin of safety to the creditors is essential
due to the unevenness of the flow of funds through current assets and
current account. The current liabilities can be settled by making the
payment whereas the current assets available to liquidate them are
subject to shrinkage of various reasons like

SAAB MARFIN MBA
Financial ratio analysis in BDK 62
obsolescence of inventory, bad debts, and unexpected losses and so on.
Thus current ratio represents the short- term liquidity “Buffer”.
CURRENT RATIO
(Amount in Lakhs)
Year 2003-04 2004-2005 2005-2006
Current Assets 727.32 762.73 1188.67
Current Liabilities 418.51 387.04 433.12
Current Ratio 1.737 1.970 2.744
SOURCE: ANNUAL REPORTS OF COMPANY
Interpretation: The ratio is quite good in first two years, when compared
with the conventional standard 2. But in the year 2005-06 current ratio is
high which indicates there will be an excess liquidity in the year 2005-06,
SAAB MARFIN MBA
Financial ratio analysis in BDK 63
which is quite dangerous hence company should minimize its
investments in current assets.
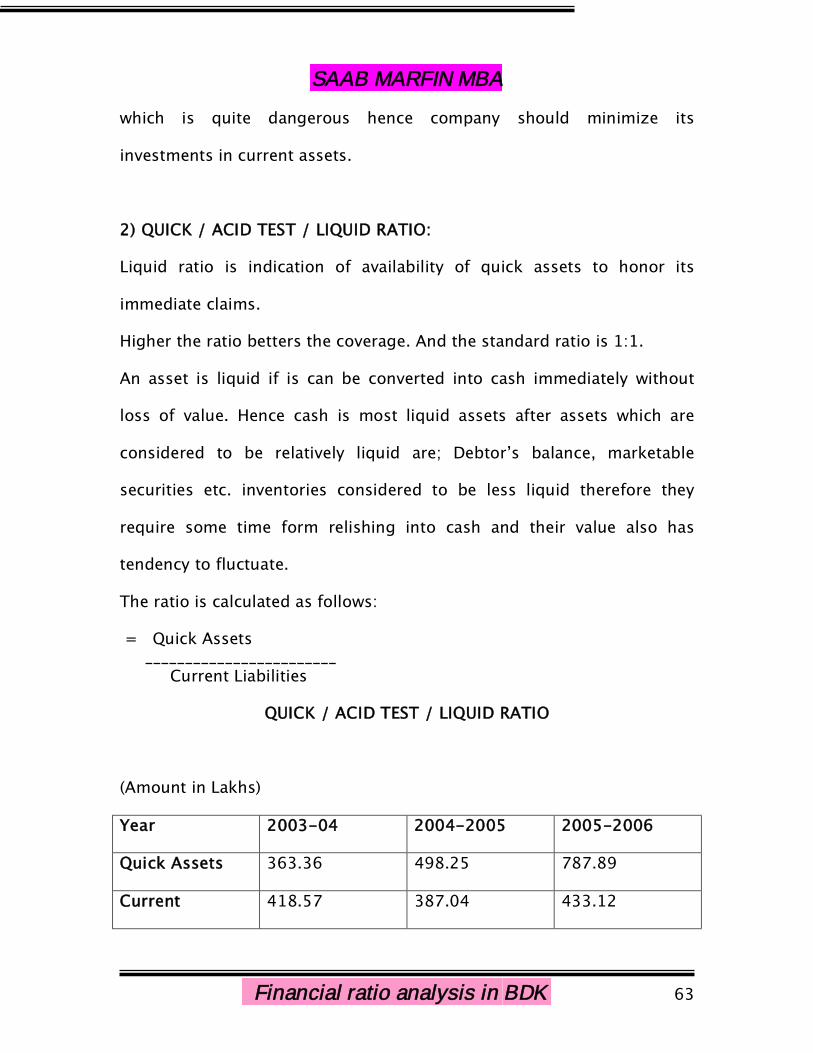
2) QUICK / ACID TEST / LIQUID RATIO:
Liquid ratio is indication of availability of quick assets to honor its
immediate claims.
Higher the ratio betters the coverage. And the standard ratio is 1:1.
An asset is liquid if is can be converted into cash immediately without
loss of value. Hence cash is most liquid assets after assets which are
considered to be relatively liquid are; Debtor’s balance, marketable
securities etc. inventories considered to be less liquid therefore they
require some time form relishing into cash and their value also has
tendency to fluctuate.
The ratio is calculated as follows:
= Quick Assets________________________Current Liabilities
QUICK / ACID TEST / LIQUID RATIO
(Amount in Lakhs)
Year 2003-04 2004-2005 2005-2006
Quick Assets 363.36 498.25 787.89
Current 418.57 387.04 433.12

SAAB MARFIN MBA
Financial ratio analysis in BDK 64
Liabilities
Quick Ratio .868 1.287 1.819
SOURCE: ANNUAL REPORTS OF COMPANY
Interpretation: The ratio is moderate in first two years when compared
with the conventional standard 1:1, which is quite satisfactory. But in the
year 2005-06 the ratio is increased and it is high indicates the company
has the excess liquidity which is dangerous.
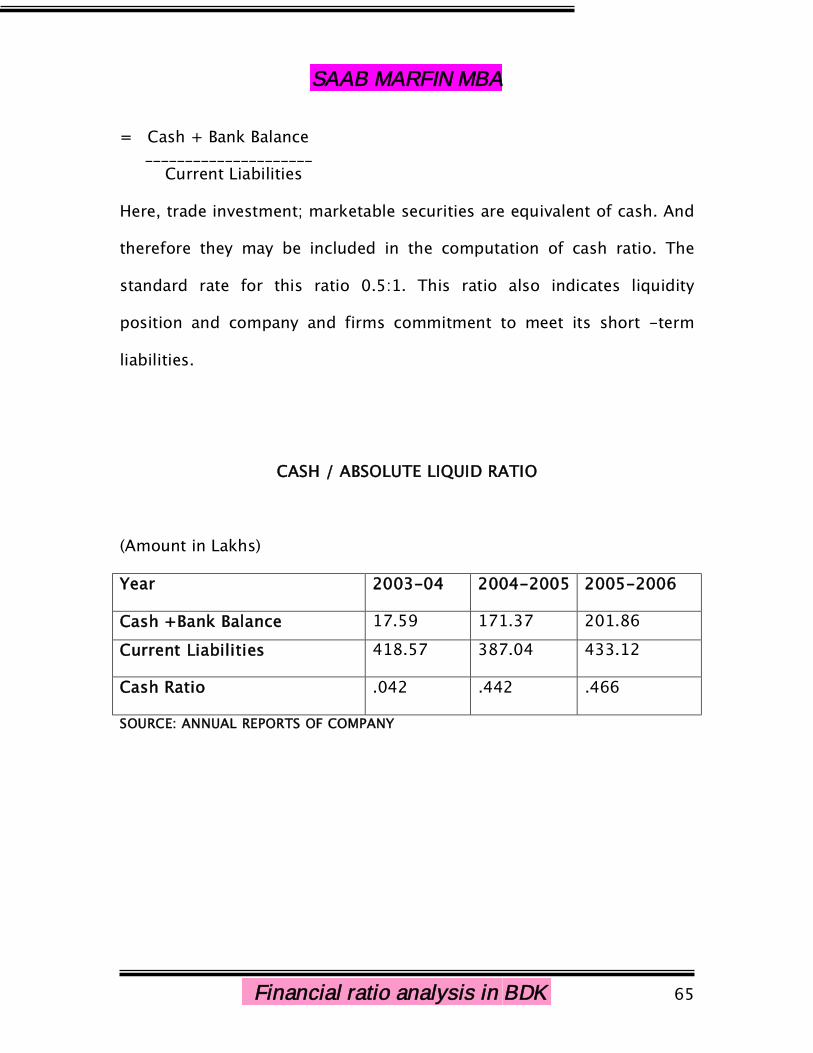
3) CASH / ABSOLUTE LIQUID RATIO:
It calculated as follows:
SAAB MARFIN MBA
Financial ratio analysis in BDK 65
= Cash + Bank Balance_____________________Current Liabilities
Here, trade investment; marketable securities are equivalent of cash. And
therefore they may be included in the computation of cash ratio. The
standard rate for this ratio 0.5:1. This ratio also indicates liquidity
position and company and firms commitment to meet its short -term
liabilities.
CASH / ABSOLUTE LIQUID RATIO
(Amount in Lakhs)
Year 2003-04 2004-2005 2005-2006
Cash +Bank Balance 17.59 171.37 201.86
Current Liabilities 418.57 387.04 433.12
Cash Ratio .042 .442 .466
SOURCE: ANNUAL REPORTS OF COMPANY
SAAB MARFIN MBA
Financial ratio analysis in BDK 66
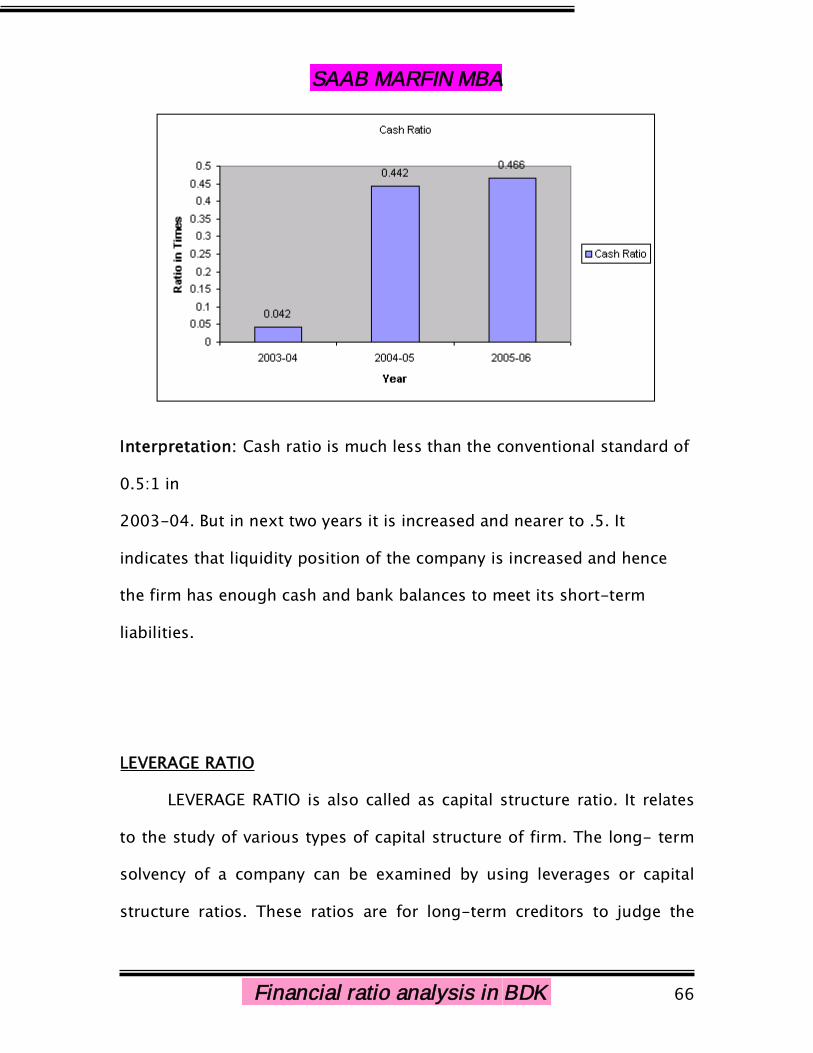
Interpretation: Cash ratio is much less than the conventional standard of
0.5:1 in
2003-04. But in next two years it is increased and nearer to .5. It
indicates that liquidity position of the company is increased and hence
the firm has enough cash and bank balances to meet its short-term
liabilities.
LEVERAGE RATIO
LEVERAGE RATIO is also called as capital structure ratio. It relates
to the study of various types of capital structure of firm. The long- term
solvency of a company can be examined by using leverages or capital
structure ratios. These ratios are for long-term creditors to judge the
SAAB MARFIN MBA
Financial ratio analysis in BDK 67
long-term financial strength of the company. The aspects that are mainly
considered for this are:
1. Ability to repay the principal when due and
2. Regular payment of the interest.
THE DIFFERENT LEVERAGE RATIO ARE:
1. Debt Ratio
2. Debt Equity Ratio
3. Proprietary Ratio
1) DEBT RATIO:
It expresses out side liabilities i.e. both long -term and short-term in
relation to total capitalization of firm.
It is calculated as follows:
= Total Debt______________
Total AssetsGenerally creditors will prefer low debt ratio, since lower the ratio, higher
the caution against creditors losses in the event of liquidation.
Conversely, owners may prefer high debt ratio either
To magnify earnings or
Because issuing new share means giving up some degree of control
But a high debt ratio may create problem with respect to future financing
since creditors may reluctant to lend the firm more money unless equity
base is increased.

SAAB MARFIN MBA
Financial ratio analysis in BDK 68
DEBT RATIO
(Amount in Lakhs)
Year 2003-04 2004-2005 2005-2006
Total Debt 291.98 262.39 515.56
Total Assets 1146.84 1174.41 1649.72
Debt Ratio .254 .223 .312
SOURCE: ANNUAL REPORTS OF COMPANY
Interpretation: Ratio is fluctuating in between the range of .223 to .312
during the period of study. In the year 2003-04 the ratio is .254 and it isdecreased to .223 in 2004-05. Again the ratio is increased to .312 in theyear 2005-06. Which indicates that lenders are financing one-third of
total assets and remaining two- third is financed by owners of
the firm, indicating that firm is more dependent on owners fund to meetits long-term liabilities.2) DEBT-EQUITY RATIO
SAAB MARFIN MBA
Financial ratio analysis in BDK 69
It measures the relation between debt and equity in the capital
structure of the firm. In other word, This ratio shows the relationship
between the borrowed capital and owner’s capital. This ratio shows
relative claim of the creditors and shareholders against the assets of the
company.
It is expressed as:
= Long-term Debt__________________Shareholders Equity
Generally higher the ratio greater is the possibility of increasing the
ROR to equity & vice versa.
A high debt equity ratio may be adopted to take advantage of
cheaper debt capital.
The ratio indicates the extent to which the firm depends upon out
side for its existence. The ratio provides margin of safety to the creditors.
It tells owners the extent to which they can gain benefits of maintaining
control with a limit investment.
DEBT-EQUITY RATIO
(Amount in Lakhs)

SAAB MARFIN MBA
Financial ratio analysis in BDK 70
Year 2003-04 2004-2005 2005-2006
Borrowings 286.60 247.71 439.49
Total Capital Employed 689.46 787.40 1185.00
Debt-Equity Ratio .415 .314 .370
SOURCE: ANNUAL REPORTS OF COMPANY
Interpretation: The ratio is fluctuating in between the range of .314 to .
415 during the period of study. Which indicates that the Company
depends more on internal sources than on external sources i.e. it
indicates that company depends upon insiders i.e. on shareholders fund
& and it also indicates that company is having sound financial position
.
3) PROPRITORY RATIO:
It establishes relationship between the propitiator or shareholders funds
& total tangible assets.

SAAB MARFIN MBA
Financial ratio analysis in BDK 71
It may be expressed as:
Proprietary Ratio=Proprietor’s FundsTotal Assets
The ratio indicates properties stake in total assets. Higher the ratio
lowers the risk and lower the ratio higher the risk. Debt –equity ratio &
current ratio affects the proprietary ratio.
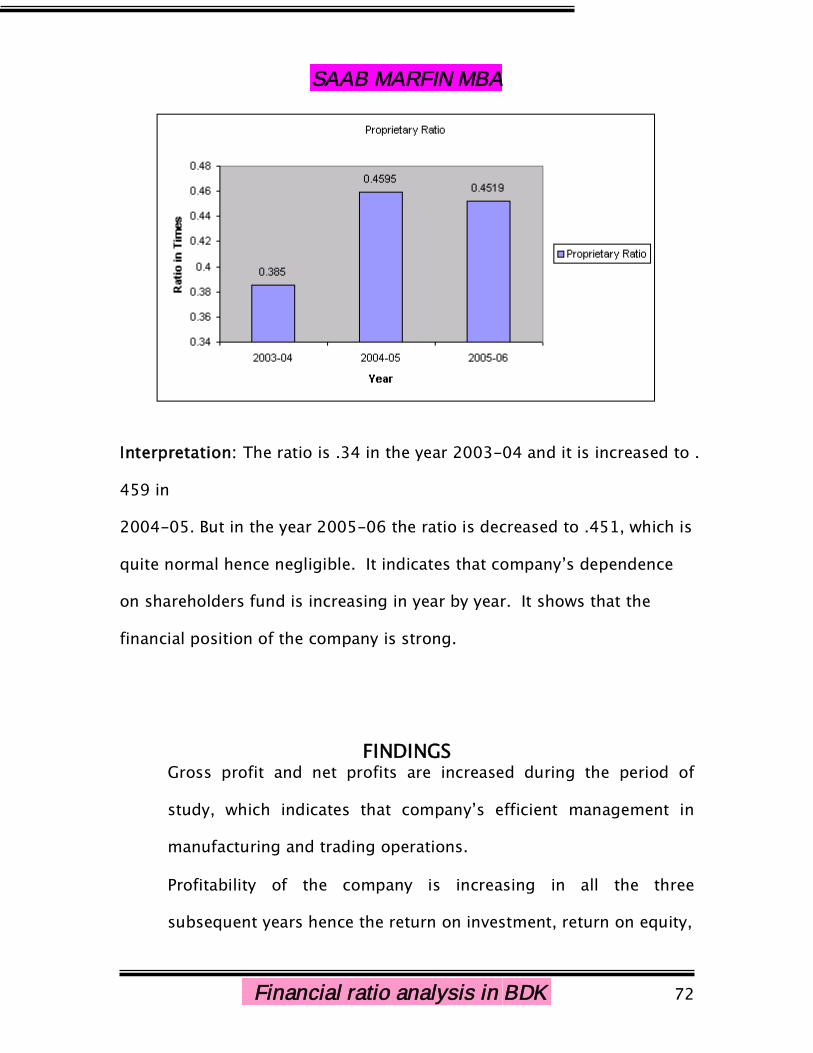
PROPRITORY RATIO
(Amount in Lakhs)
Year 2003-04 2004-2005 2005-2006
Shareholders funds 441.75 539.69 745.51
Total Assets 1146.84 1174.41 1649.72
Proprietary Ratio .385 .4595 .4519
SOURCE: ANNUAL REPORTS OF COMPANY
SAAB MARFIN MBA
Financial ratio analysis in BDK 72
Interpretation: The ratio is .34 in the year 2003-04 and it is increased to .
459 in
2004-05. But in the year 2005-06 the ratio is decreased to .451, which is
quite normal hence negligible. It indicates that company’s dependence
on shareholders fund is increasing in year by year. It shows that the
financial position of the company is strong.
FINDINGSGross profit and net profits are increased during the period of
study, which indicates that company’s efficient management in
manufacturing and trading operations.
Profitability of the company is increasing in all the three
subsequent years hence the return on investment, return on equity,

SAAB MARFIN MBA
Financial ratio analysis in BDK 73
return on assets and EPS is also increasing. Which indicates the
company’s efficient management, in utilization of its resources to
earn profit.
Inventory turnover ratio of B.D.K.PC is increasing year by year, and
hence the inventory conversation period is decreased in all the
three years. Which indicates the inventories are converted into sales
more rapidly during the period of study.
Debtor’s collection period is fluctuating in between 47 days to 71
days during the period of study. This period is quite satisfactory as
per the company’s credit policy.
Creditors Turnover Ratio is moderate and the creditors’ payment
period is also quite normal i.e. in the year 2005-06 creditors’
turnover ratio is 3.507% creditor payment period is 105 days. In
2005-06 firm enjoyed more credit period as compared to the year
2004-05.
In all the three years the fixed assets turnover ratio is increased.
Which indicates that fixed assets are properly utilized i.e. there is a
better efficiency in utilization of fixed assets.
Current assets turnover ratio is increased in first two years but in
2005-06 there is a slight decrease in the ratio due to the increase
of current assets.

SAAB MARFIN MBA
Financial ratio analysis in BDK 74
In 2003-04 and 2004-05 financial ratios are moderate in nature.
But in 2005-06 financial ratios are quite high i.e. current ratio is
2.744 and quick ratio is 1.819. In 2005-06 the liquidity position of
the firm is quite high due to increase in investments in current
assets.
Cash ratio is good as compared to the standard ratio, which
indicates the firm has enough cash and bank balances to meet its
short-term liabilities.
In 2005-06 the debt ratio is .312 and Debt-equity ratio is .37,
which indicates that lenders are financing one-third of total capital
and remaining two- third is financed by owners of the firm,
indicating that firm is more dependent on owners fund to meet its
long-term liabilities. Hence company is financially strong.
Proprietary ratio is fluctuating in between the range .358 to .459.
It indicates that company’s dependence on shareholders fund is
increased year by year. It shows that the financial position of the
company is increasing year by year.
.
SAAB MARFIN MBA
Financial ratio analysis in BDK 75
SUGGESTIONS
Since the B.D.K. Process Control Pvt. Ltd is earning the profit year
by year, this will attracts many investors. Hence the company
should concentrate on the expansion of the business and also they
should contribute towards the social overheads for the welfare of
the society.
Company instead of depending fully on internal funds, it can also
study the feasibility of borrowing funds from external sources, so it
can still expand its production capacity considering the demand.
Company should improve its credit policy for the better
management of credit and to earn more profit.
Liquidity position of the company is quite high; hence it should
decrease investments in current assets. Hence they have to modify
their credit policy to reduce debtors. And also they should think
about these short-term investments in others such as expansion of
the business.
SAAB MARFIN MBA
Financial ratio analysis in BDK 76
CONCLUSION
From the analysis of financial statements it is clear that B.D.K. Process
Control Pvt. Ltd. Have been incurring profit during the period of
study. Although company has to still increase its credit policy and also
decrease its investments in current assets. This will gives the new
opportunities to the company like expansion of the business. With all
these recommendations company can improve its profitability.
SAAB MARFIN MBA
Financial ratio analysis in BDK 77
SAAB MARFIN MBA
Financial ratio analysis in BDK 78
Contents:
Bibliography

SAAB MARFIN MBA
Financial ratio analysis in BDK 79
BIBILIOGRAPHY
I.M. Pandey – Financial Management. Vikas Publishing House Pvt.
Ltd.
M.Y. Khan and P. K. Jain – Financial Management. Tata Megraw
–Hill Publishing company Ltd. New Delhi.
Khan and Jain – Management and Accounting. Himalaya
publishing house Pvt. Ltd.
Web Site: www.bdkindia.com
Related Documents